
Marketing - News.lt
386
Marketing McGraw-Hill Primis ISBN: 0-390-39509-9 Text: Marketing Strategy: A Decision-Focused Approach, Fourth Edition Walker et al. Harvard Business School Marketing Cases Practical Marketing Strategy Instructor: Craig Shoemaker, Ph.D. International Buisness School McGraw-Hill/Irwin =>?
-
Upload
khangminh22 -
Category
Documents
-
view
0 -
download
0
Transcript of Marketing - News.lt

Marketing
McGraw−Hill Primis
ISBN: 0−390−39509−9
Text: Marketing Strategy: A Decision−Focused Approach, Fourth EditionWalker et al.
Harvard Business School Marketing Cases
Practical Marketing Strategy
Instructor:Craig Shoemaker, Ph.D.
International Buisness School
McGraw-Hill/Irwin���

Marketing
http://www.mhhe.com/primis/online/Copyright ©2003 by The McGraw−Hill Companies, Inc. All rights reserved. Printed in the United States of America. Except as permitted under the United States Copyright Act of 1976, no part of this publication may be reproduced or distributed in any form or by any means, or stored in a database or retrieval system, without prior written permission of the publisher. This McGraw−Hill Primis text may include materials submitted to McGraw−Hill for publication by the instructor of this course. The instructor is solely responsible for the editorial content of such materials.
111 MARK ISBN: 0−390−39509−9
This book was printed on recycled paper.

Marketing
Contents
Harvard Business School Marketing Cases
Advanced Visual Systems 1
Case 1
Compaq Computer: Intel Inside? 13
Case 13
Goodyear: The Aquatred Launch (Condensed) 21
Case 21
MD Motors 34
Case 34
Oscar Mayer: Strategic Marketing Planning 48
Case 48
Pizza Hut, Inc. 62
Case 62
Black & Decker Corp.: Household Products Group, Brand Transition 78
Case 78
Eastman Kodak Co.: Funtime Film 92
Case 92
Walker et al. • Marketing Strategy: A Decision−Focused Approach, Fourth Edition
I. Introduction to Strategy 97
2. Corporate Strategy Decisions and Their Marketing Implications 973. Business Strategies and Their Marketing Implications 122
II. Opportunity Analysis 147
4. Identifying Attractive Markets 1475. Industry Analysis and Competitive Advantage 1676. Measuring Market Opportunities 1907. Targeting Attractive Market Segments 2098. Differentiation and Positioning 231
iii

III. Formulating Market Strategies 251
9. Marketing Strategies for New Market Entries 25110. Strategies for Growth Markets 27411. Strategies for Mature and Declining Markets 29812. Marketing Strategies for the New Economy 329
IV. Implementation and Control 359
14. Measuring and Delivering Marketing Performance 359
iv

1Harvard Business School Marketing Cases
Advanced Visual Systems Case © The McGraw−Hill Companies, 2001
BAB0016/15/99
David Wylie, director of Babson College Case Publishing, prepared this case with the assistance of Professors WilliamLawler and Ken Matsuno, Babson College, as a basis for class discussion rather than to illustrate either effective orineffective handling of an administrative situation.
Copyright © by David Wylie, William Lawler, and Ken Matsuno 1997 and licensed for publication to Harvard BusinessSchool Publishing. To order copies or request permission to reproduce materials, call (800) 545-7685 or write HarvardBusiness School Publishing, Boston, MA 02163. No part of this publication may be reproduced, stored in a retrievalsystem, used in a spreadsheet, or transmitted in any form or by any means – electronic, mechanical, photocopying,recording, or otherwise – without the permission of copyright holders.
Advanced Visual SystemsBy March of 1997, Harry Cochran had just completed his first two months as the new
president and CEO of Advanced Visual Systems, Inc. (AVS), based in Waltham, Masosoachusetts.AVS developed and sold high-end data visualization software that allowed masosoive quantities ofdata to be transformed into informative two- and three-dimensional (2D and 3D) graphicalrepresentations.
The heritage of AVS hearkened back to 1988 in the software development laboratories ofStardent Computer, Inc. as an effort to understand and capitalize on the emerging market for 3Dvisualization software. With a focus on computer hardware, however, the management ofStardent did not want to be distracted with the intricacies and risks of software development andmarketing. It therefore allowed the software development team to spin out the 3D softwaredivision. In January of 1992, this new enterprise was spawned as AVS.
The company initially enjoyed tremendous growth. By 1994, sales were over $17million, but after only modest growth in 1995, sales in 1996 had dropped back to 1994 levels.(See Exhibit 1, Financial Statements and Exhibit 2, Revenue Analysis). AVS seemed to havehit a ceiling in spite of the high esteem it had earned in the marketplace. It was up to Cochran toput the company back on track.
Graphic Visualization SoftwareVisualization software was used by technical and businesoso profesosoionals who recognized
that if they could transform large data sets into useful information, they would accelerate theunderstanding of complex problems, and that whoever made the most effective use of this asosoetwould have an enormous competitive advantage. In 1992, most of these end-users wereengineers using expensive and sophisticated systems in large government and industry computerlaboratories.
Accordingly, the first product developed by AVS was AVS (Application Visualization

2 Harvard Business School Marketing Cases
Advanced Visual Systems Case © The McGraw−Hill Companies, 2001
Advanced Visual Systems, Inc. BAB001
2
System), designed to facilitate scientific research that was sold directly to these large laboratoryusers. Since often these users relied on either internal or external software developers to createapplications customized to their needs, AVS also created an application development productcalled AVS/Expresoso: a multi-platform, component-based software environment for buildingapplications with interactive visualization and graphics features. AVS/Expresoso employed aninnovative object-oriented visual programming interface to create, modify, and connectapplication components. It provided object kits that contained numerous building blocks forconstructing visualization applications and application components such as graphics display,image procesosoing, and geographic rendering. AVS engineers also developed a version ofAVS/Expresoso called VIZ Expresoso for end-users.
The landscape, however, was changing in the mid-1990s. With the cost of 3D-capablecomputers falling below $3,000 and the proliferation of 3D-enabled web browsers and interactivevisualization software, the available market for high-performance 3D solutions was expandingexponentially and influencing the way in which businesoso and technical profesosoionals viewed andanalyzed data. Increasingly complex and voluminous data were overwhelming traditionalanalysis techniques such as spreadsheets, simple charts and graphs, and two-dimensional staticpictorial representations. In a rapidly expanding set of disciplines, these conventional methodswere being supplemented with, and in many cases supplanted by, more sophisticatedvisualization techniques that permitted more sophisticated data analysis such as that offered byAVS.
Visualization was thus becoming an increasingly important tool in a number of industries.An oil exploration company, for example, interpreted 3D seismic surveys to pinpoint moreeffectively the location of promising oil deposits. A telecommunications company used multi-dimensional relationships to determine the bestlocation for cellular telephone receivers. Adefense contractor took data from multiplesources (e.g., satellite imagery, aircraft telemetry,etc.) and built an integrated visual command-and-control system. The sametelecommunications company used customer-related multi-dimensional relationships toanalyze how to retain customers. An engineeringcompany visually analyzed the data collectedfrom simulations to improve design efficienciesof circuit boards. A medical imaging companyviewed gamma camera data more effectively toprovide radiologists with a more accuratediagnostic tool. A financial services company used advanced visualization techniques to uncovernew customers from large prospect databases.
The end-users of AVS software were a diverse group. In 1996, the geospatial,engineering, and medical imaging markets represented approximately 77% of the company'soverall businesoso, although the customers who bought AVS products were still mostly softwaredevelopers who customized visualization packages and bundled AVS software into final
End-users of AVS Software
GeospatialDefense/intelligence 5%Oil and gas 15%Environmental 10%Telecommunications 7%
Other Markets 20%Data-mining 3%Engineering 30%Medical Imaging 10%

3Harvard Business School Marketing Cases
Advanced Visual Systems Case © The McGraw−Hill Companies, 2001
Advanced Visual Systems, Inc. BAB001
3
deliverables. AVS's developer customers included independent software vendors (ISV's) whosold their applications to third party end-users, system integrators who built application solutionsfor their customers, and internal software development groups who created applications fordeployment to users within their organizations. In all of these cases, application developersunderstood end-user requirements and built applications designed to solve their particular needs.They used either AVS development tools such as AVS/Expresoso as a development framework tocreate their own software or end-user products such as AVS to imbed sophisticated visualizationcapabilities as components in their software. The most common alternative to using AVSproducts was to use traditional development approaches. The primary source of competition forAVS/Expresoso, therefore, was in-house development.
AVS/Expresoso pre-built graphics and visualization modules thus saved both time andeffort for the developer, which translated to faster time-to-market and thus faster time-to-revenue. The AVS/Expresoso Developer's Package was sold to developers for $25,000 (UNIX) or$18,000 (PC). Usually developers also purchased one or two additional developer seats at$6,000 (UNIX) or $4,000 (PC) per seat. From 1994 to 1996, about 200 developer packages hadbeen sold at an average of, including additional seats, just over $25,000.
Once a developer completed an application using AVS/Expresoso as the developmentenvironment, it would purchase application seats for each customer who purchased their software($2,950 UNIX, $1,450 PC quantity at list, lesoso discounts) to deploy the application withAVS/Expresoso objects embedded. These were known as “run-time licenses.” The expectationwas that this scenario would produce a recurring revenue stream for four to five years.
The run-time license revenue that AVS could garner was thus potentially more importantthan the revenue generated from the initial product/developer tool sale. AVS, however, hadfailed to reap the full potential of this revenue source. Only about 10% of development projectsactually generated any run-time licenses. Those that did sold from 5 to 50 application seats, oran average of 20 seats. The price paid for each of these seats netted out to just under $1,000, onaverage, after quantity discounts were applied.
Distribution of AVS ProductsAVS sold its product through several channels. It sold directly to customers (developers
and end-users), through independent distributors, or through its own subsidiaries. Other softwarecompanies also purchased AVS products to imbed into their own products.
In 1993, AVS had expanded internationally with the acquisition of Uniras, a Denmark-based supplier of computer graphics products with sales of $11 million. Since its parentcompany had gone bankrupt, AVS was able to acquire Uniras at the “fire sale” price of under $1million. Uniras offered a complementary product line of charting and graphing products,Toolmaster and Gsharp, and immediate accesoso to the growing European market supported byestablished sales and product support teams. Following the acquisition, Uniras’ European officesbecame AVS subsidiaries but continued to operate as autonomous divisions of AVS.
By the end of 1996, AVS had established distribution channels throughout the world,
4 Harvard Business School Marketing Cases
Advanced Visual Systems Case © The McGraw−Hill Companies, 2001
Advanced Visual Systems, Inc. BAB001
4
selling its products primarily through a direct sales force in the United States and throughsubsidiaries in Denmark, France, Germany, Italy, and the United Kingdom, and throughdistributors in certain other countries. Kubota Graphics Technologies, Inc., which had exclusivedistribution rights in Japan and other Asian countries, had been very succesosoful in selling AVSproducts there.
The AVS sales organization in the United States consisted of seven direct sales fieldrepresentatives and two telesales representatives. The direct sales people met face to face withprospective customers, and the telesales representatives telephoned prospective customers,followed up and qualified leads for the direct sales organization, accelerated order procesosoing andreceipt at the end of the sales pipeline, and contacted existing customers to make follow-on sales.
AVS OperationsUsers of AVS software demanded very little support. Indeed, AVS only had two
customer support engineers on staff in the United States. When developer customers askedquestions these individuals could not answer, they were usually referred directly to one of thetwenty software design engineers. Uniras offered support in Europe and Kubota in Japan. Whilecustomers could get their questions answered by highly qualified engineers, the engineers oftencomplained that the questions distracted them from the focusosoed attention required of writingcode for new programs.
AVS did offer some consulting services, but since customers were more in touch with theunique requirements of each vertical market1, AVS had chosen not to have any specialized end-user industry expertise a priori. Since the grososo margin on profesosoional services were quite high(40%), if a customer wanted some support in their development efforts, typically AVS wouldhire a consultant for a specific project. Finding and training a consultant might, however, take asmuch as four months before he or she could be productive. For smaller projects, AVS couldn’tkeep up with demand. In 1996, AVS had four full-time consultants who were paid between$70,000 and $100,000 per year depending on their level of expertise. Consulting services onlycontributed about 5% of total revenue (or just under $1 million) in 1996.
The real focus of AVS was to develop continually enhanced tools. Its engineers thereforefocused on making marginal improvements to AVS software. When new versions werecompleted, they were turned over to the marketing and sales department so that they could beused in their sales pitch to potential customers.
AVS had invested over 200 staff-years in development of its products. The company'score technology and knowledge base in graphic visualization therefore presented a significantbarrier to entry to new competitors.
1 A vertical market refers to a segment of end-user market defined by common industrial technology needs.

5Harvard Business School Marketing Cases
Advanced Visual Systems Case © The McGraw−Hill Companies, 2001
Advanced Visual Systems, Inc. BAB001
5
Vertical Markets
Medical Imaging
In 1995, AVS had embarked on a program to target sales directly to end-users in certainvertical markets. The first such market targeted was that of medical imaging.
In medical imaging the main application areas for visualization included computer-aidedmedical diagnostics, image-guided surgery, and radiation treatment planning. Medicalresearchers and physicians using imaging applications were able to visualize non-invasivecomputer models of the human body. These models helped better detect, measure, and operateon patients with serious health conditions like cancerous tumors, Alzheimer's disease, epilepsy,and Parkinson's disease. AVS products were used by a significant percentage of the researchhospitals and the emerging treatment planning segments where 3D imaging was important. Thecompany had also been quite succesosoful in the medical OEM segment of this market. To date,the company had over twenty OEM customers.
During 1995 and 1996, AVS had invested over $2 million in marketing, sales, andapplication development in medical imaging. It became apparent, however, that the currentmedical imaging market potential for visualization software and services was relatively small,estimated to be $50 million. The biggest competitor in the market sold about $12.5 million,while in-house development accounted for about $30 million. The remaining $7.5 million wasspread among another six players including AVS. By 1996, this market accounted for only 10%of AVS’s sales, and the effort to market directly into this market were dropped. AVS’s annualsales in the medical market were about $1.8 million.
Alternative Vertical MarketsThe strategy of entering certain vertical markets, however, was not dropped. With the
experience of the medical imaging initiative behind them, criteria for entering new markets weredeveloped which included the potential to dominate an application area by achieving a 40%market share. The other markets under consideration were the geospatial and engineeringmarkets where a number of AVS products were already being used. Meanwhile, someconsideration was being given to the fledgling, but potentially even greater, market for visualdata mining/data warehouse visualization.
Management estimated that an investment of $2 million would be required to target eitherthe geospatial or the engineering market. This included about 10 employees at $150,000 apiecein sales, management, customer support, consulting, and product development, and an additional$500,000 for marketing. Any consultants who might be added to help new users customizeapplications to their specific uses, however, would pay for themselves after a month of training.
GeospatialThe geospatial market consisted of several different vertical markets, some technical and
some commercial, which had in common a compelling need to use sophisticated visualizationtechniques to analyze masosoive amounts of data involving relationships below, on, or above the

6 Harvard Business School Marketing Cases
Advanced Visual Systems Case © The McGraw−Hill Companies, 2001
Advanced Visual Systems, Inc. BAB001
6
surface of the Earth. In all of these applications, geographically dependent data was analyzedspatially to provide greater insight about complex interdependencies among the data. Someexamples of these types of visualization applications included remote sensing satellite imaging,earth resources management, radio frequency propagation modeling, and customer retentionanalysis.
By 1996, AVS had already made some inroads in a number of technical geospatialvertical markets, including defense/intelligence (accounted for 5% of AVS end-user base), oiland gas (15%), environmental (10%), and telecommunications (7%). More recently, it hadbegun to penetrate segments of the high-end businesoso visualization market, initially withapplications delivered into telecommunications and financial services vertical markets.Opportunities were also arising in companies that needed visualization applications in otherbusinesoso markets as they began to recognize the value visualization offered. Typical of thesenew opportunities were data mining/data warehouse visualization applications for customerretention and database marketing programs. As had been the case in the technical markets,providing the businesoso user with a visual framework within which to analyze many variables oftransactional, demographic, and customer purchase data provided a deeper level of insight thanwas available with traditional analysis techniques.
Two independent software vendors (ISVs), ESRI and Intergraph, controlled over half ofthe geospatial software tools market. The remaining market share was split between eight othervendors.
New high-resolution satellite data sources were scheduled to emerge into the commercialmarket in 1998. The availability of relatively low-cost, high-resolution, ortho-rectified imagery(geometrically correct) from these new satellites could fundamentally change the nature of thegeospatial market. Intelligent "image maps" could become the standard data set for manipulationand analysis within a geospatial system. Two-dimensional satellite images that were texture-mapped and draped over three-dimensional terrain data could become the new geographicframework.
AVS management estimated that the current market for geospatial visualization softwareand services exceeded $100 million. In addition, clasosoified projects from the Department ofDefense/Intelligence community could be at least that amount. AVS sales in the geospatialmarket were about $7 million in 1996, although only a fraction of these sales were directly toend-users.
Choosing the geospatial market seemed attractive. Since there appeared to be somecommonality between the various geospatial applications, the incremental cost to enter eachsegment of the market would only be about another $1 million over the $2 million required tomake the initial thrust into a single segment of the market. However, it was uncertain whetherthe existence of the commonality was substantive enough. Although $1 million was a relativelyabsorbable investment size, AVS management wondered about how to go about verifying thesignificance of the commonality.

7Harvard Business School Marketing Cases
Advanced Visual Systems Case © The McGraw−Hill Companies, 2001
Advanced Visual Systems, Inc. BAB001
7
EngineeringThe engineering market accounted for 30% of AVS end-user sales in 1996. It was
segmented into multiple markets that included major industries such as aerospace, automotive,and semiconductor. Within engineering, visualization was used in computed-aided engineering(CAE) and electronic design automation (EDA). Ninety percent of all software sales in thismarket were directly to end-users.
In the CAE market, AVS had two types of customers. The first type was comprised ofdevelopers of CAE applications that built post-procesosoors for resale to end-user customers. Thesecond type of customer were end-users and included major industrial companies, such as Boeingand Ford, which built in-house post-procesosoors to visualize results from multiple analysisapplications. Integrating all aspects of the design procesoso was a major trend within engineeringmarkets and this ability to use AVS products to integrate and view results from multipleapplications had tremendous value to these companies. The worldwide market for CAE toolswas estimated to be about $5 billion and growing at 10% per year.
While AVS had no significant share of the $1.6 billion worldwide EDA market (1995), itcounted four major end-users as customers with sales of almost $200,000 in the first two quartersof 1996. There were several major competitors in this market, the largest of which had tens ofthousands of seats around the world. The EDA market was, however, projected to grow atalmost 17% per year.
The potential for visualization software and services in these engineering markets wasthought to be approximately $50 million, but there were no major competitors. Ninety percent ofall applications were developed in-house by users. AVS currently sold about $2 million in thismarket, a four percent market share. The AVS management thought that it could substantiallyincrease the presence if AVS could offer an application that can be seamlesosoly integrated withothers already in use by end-users. One marketing manager was arguing for this engineeringvertical market by saying, “this is an opportunity to become a star in a niche market that is toosmall for strong competitors to get in but good enough for a company like ours.”
Harry Cochran and the Future of AVSHarry Cochran had been hired in early 1997 and was given broad latitude to engineer the
revival of AVS. He was a veteran entrepreneur in the software industry. Prior to joining AVS,he had been chairman of TRUE Software, Inc. and founder, president, and CEO of ExpresosowayTechnologies Corporation Technologies, a pioneer in interactive decision support systems.Cochran had overseen Expresosoway’s growth from initial start-up to its ultimate sale to Sybase.At Sybase, he served as vice president of Advanced Indexing Products before deciding that newopportunities beckoned.
When he first arrived at AVS, Harry interviewed nearly all 105 employees in thecompany and asked each of them to share their thoughts on what was right or wrong with thecompany and where opportunities lay. He discovered a disillusioned group sailing what hetermed a “rudderlesoso ship” with little pro-active decision-making, inter-divisional strife, and no

8 Harvard Business School Marketing Cases
Advanced Visual Systems Case © The McGraw−Hill Companies, 2001
Advanced Visual Systems, Inc. BAB001
8
dominant market position in any of the vertical markets in which AVS sold its products. Almosteveryone had been “burned” so often that they were pesosoimistic about the future of the companyand taking any sort of risk. The unspoken but prevalent corporate credo was “don’t lose” ratherthan “win”.
Product development engineers felt burned because of lack of follow-through from thesales and marketing team. From the perspective of the sales and marketing team, however, thosein product development were too focused on adding bells and whistles to existing softwarewithout the benefit of any end-user input. They often were left frustrated in their efforts to selldirectly to large end-users or to developers who were trying to customize products to those end-users. Indeed, AVS had been technology-driven to the point where the people in marketing andsales were only brought in to figure out how to sell new products after they were completed.
Often development engineers were distracted from their work by requests for qualityasosourance, to produce documentation, or to offer customer support. They thus avoided suchdistractions whenever pososoible, often leaving these activities incomplete.
With increasing presosoure to increase profitability and sales, everyone either retreated tobackbiting or discovered the security of monastic seclusion.
Harry did, however, find a number of strengths that offered the foundation foropportunity. The balance sheet was healthy. AVS had over $7 million in cash, no debt, a historyof at least marginal profitability, a good reputation, and a core of good technicians. The companyhad a large net operating lososo carry-forward from Stardent that would, management thought,provide shelter for a significant portion of future profits.
After then studying the dynamics of both the software industry and those of AVS’sprimary customers, Cochran was considering what changes might be required to bring AVS outof the doldrums. He thought that AVS had been trapped in an outdated perception of themarketplace. While the developer market was still strong and sophisticated users in specializedlaboratories still relied on AVS software, the market was esosoentially flat. He saw that theincreased usage of data visualization within the specialized vertical markets represented a viableopportunity. AVS would never be able to compete in this market, however, if it just kept makingits existing software more complex, and, if lesoso sophisticated users were courted, AVS wouldhave to develop its consulting and service capabilities to offer adequate support andcustomization.
Cochran knew that he would have to answer several key questions before proceeding:what vertical markets should be targeted and what resources would be required to realize theopportunity of those markets? In addition, he wondered what changes should be made to thecurrent operations better to meet the needs of existing customers.

9Harvard Business School Marketing Cases
Advanced Visual Systems Case © The McGraw−Hill Companies, 2001
Advanced Visual Systems, Inc. BAB001
9
Exhibit 1Financial Statements
AVS Balance Sheet1994 – 1996
10 Harvard Business School Marketing Cases
Advanced Visual Systems Case © The McGraw−Hill Companies, 2001
Advanced Visual Systems, Inc. BAB001
10
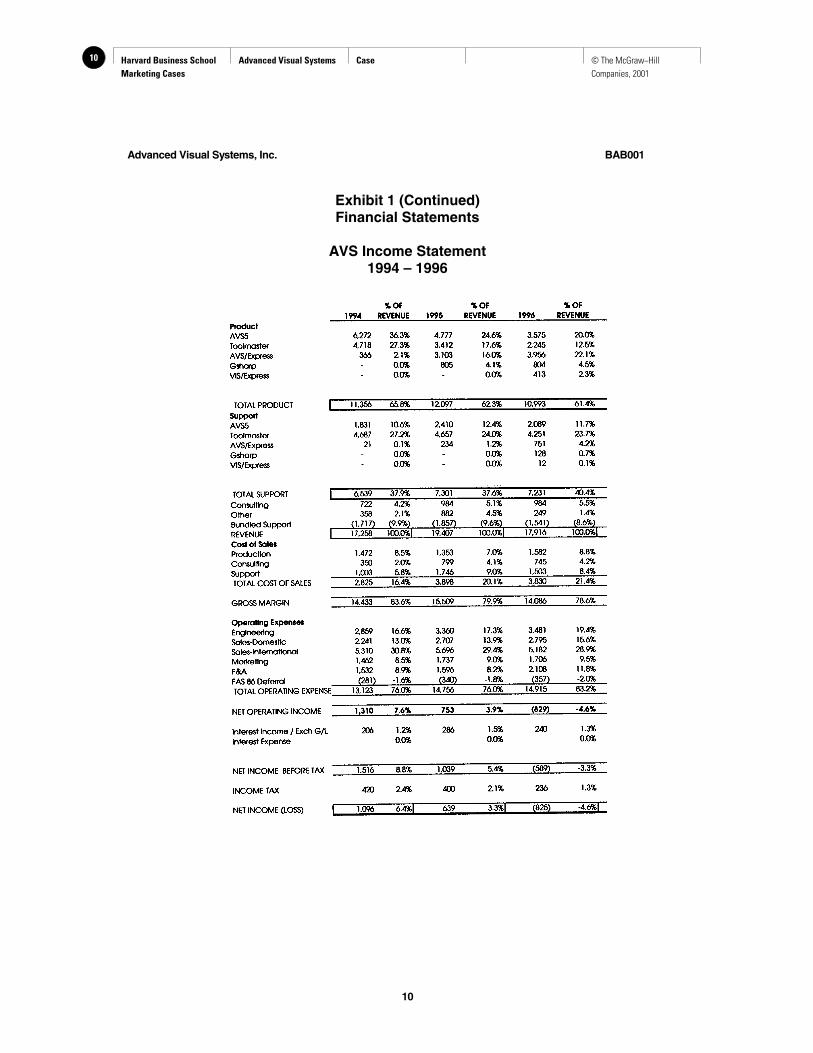
Exhibit 1 (Continued)Financial Statements
AVS Income Statement1994 – 1996

11Harvard Business School Marketing Cases
Advanced Visual Systems Case © The McGraw−Hill Companies, 2001
Advanced Visual Systems, Inc. BAB001
11
Exhibit 1 (Continued)Financial Statements
AVS Cash Flow Statement1994 – 1996

12 Harvard Business School Marketing Cases
Advanced Visual Systems Case © The McGraw−Hill Companies, 2001
Advanced Visual Systems, Inc. BAB001
12
Exhibit 2Revenue Analysis
(x 1,000) Total US Europe Japan1994 1995 1996 1994 1995 1996 1994 1995 1996 1994 1995 1996
ProductAVS5 6,272 4,777 3,575 2,795 1,939 1,247 3,167 2,334 1,692 310 504 636Toolmaster 4,718 3,412 2,245 321 509 369 4,345 2,855 1,846 52 48 30AVS/Express 366 3,103 3,956 326 1,942 2,557 40 1,113 1,251 48 148Gsharp 805 804 21 49 760 705 24 50VIS/Expresoso 413 80 302 31
Total Product 11,356 12,097 10,993 3,442 4,411 4,302 7,552 7,062 5,796 362 624 895
SupportAVS5 1,831 2,410 2,089 1,272 1,287 939 559 1,123 1,122 28Toolmaster 4,687 4,657 4,251 714 583 556 3,939 4,046 3,684 34 28 11AVS/Express 21 234 751 20 151 488 1 83 262 1Gsharp 128 5 122 1VIS/Express 12 3 8 1
Total Support 6,539 7,301 7,231 2,006 2,021 1,991 4,499 5,252 5,198 34 28 42
Consulting 722 984 984 422 523 593 300 461 391
Other 358 882 249 81 202 6 277 680 171
Bundled Support -1,717 -1,857 -1,541 -510 -586 -501 -1,207 -1,271 -1,040
Total Revenue 17,258 19,407 17,916 5,441 6,571 6,391 11,421 12,184 10,516 396 652 937
Direct ExpensesProduction 1,472 1,353 1,582Consulting 350 799 745Support 1,003 1,746 1,503
ContributionProduction 9,884 10,744 9,411Consulting 372 185 239Support 5,536 5,555 5,728
Contribution MarginsProduction 87.0% 88.8% 85.6%Consulting 51.5% 18.8% 24.3%Support 84.7% 76.1% 79.2%
Product as % of Total 65.8% 62.3% 61.4% 63.3% 67.1% 67.3% 66.1% 58.0% 55.1% 91.4% 95.7% 95.5%Support as % of Total 37.9% 37.6% 40.4% 36.9% 30.8% 31.2% 39.4% 43.1% 49.4% 8.6% 4.3% 4.5%Support as % of Product
AVS5 29.2% 50.5% 58.4% 45.5% 66.4% 75.3% 17.7% 48.1% 66.3% 0.0% 0.0% 4.4%Toolmaster 99.3% 136.5% 189.4% 222.4% 114.5% 150.7% 90.7% 141.7% 199.6% 65.4% 58.3% 36.7%AVS/Express 5.7% 7.5% 19.0% 6.1% 7.8% 19.1% 2.5% 7.5% 20.9% 0.0% 0.7%Gsharp 0.0% 15.9% 0.0% 10.2% 0.0% 17.3% 0.0% 2.0%VIS/Express 2.9% 3.8% 2.6% 3.2%
End user sales $8,103 $7,992 $7,021 $4,067 $3,247 $2,323 $3,726 $4,217 $3,951 $310 $528 $747Developer Sales $9,792 $11,406 $11,203 $1,381 $3,185 $3,970 $8,325 $8,097 $7,043 $86 $124 $190Total Sales by Product
AVS5 $8,103 $7,187 $5,664 $4,067 $3,226 $2,186 $3,726 $3,457 $2,814 $310 $504 $664Toolmaster $9,405 $8,069 $6,496 $1,035 $1,092 $925 $8,284 $6,901 $5,530 $86 $76 $41AVS/Express $387 $3,337 $4,707 $346 $2,093 $3,045 $41 $1,196 $1,513 $0 $48 $149Gsharp $0 $805 $932 $0 $21 $54 $0 $760 $827 $0 $24 $51VIS/Express $0 $0 $425 $0 $0 $83 $0 $0 $310 $0 $0 $32

13Harvard Business School Marketing Cases
Compaq Computer: Intel Inside?
Case © The McGraw−Hill Companies, 2001
Harvard Business School 9-599-061Rev. May 25, 2000
Research Assistant Ann K. Leamon prepared this case under the supervision of Professor David E. Bell and with theassistance of Daniel J. Stevenson, MBA ’99, as the basis for class discussion rather than to illustrate either effective orineffective handling of an administrative situation.
Copyright © 1999 by the President and Fellows of Harvard College. To order copies or request permission toreproduce materials, call 1-800-545-7685, write Harvard Business School Publishing, Boston, MA 02163, or go tohttp://www.hbsp.harvard.edu. No part of this publication may be reproduced, stored in a retrieval system,used in a spreadsheet, or transmitted in any form or by any means—electronic, mechanical, photocopying,recording, or otherwise—without the permission of Harvard Business School.
1
Compaq Computer: Intel Inside?
Compaq Computer’s Presario line of notebooks for the consumer market had broken allconceivable sales goals by fall 1997. In the year since its launch, Compaq had catapulted from a 3%market share to its current level of 46%, passing the previous market leader, Toshiba, whose sharehad fallen from 60% to 40%.
Market research had played a crucial role in developing the Presario line. “We ran ourconsumer notebook concept past some focus groups,” said Greg Memo, vice president of the MobileProducts Division for the Consumer Products group, “and we couldn’t believe the results. But it wasgreat, and we ended up with a runaway success. We sold 40,000 machines—our entire initialproduction run—in the first few months. We could have sold twice that many, but we did really well,we got in, we got out, and no one got hurt.”
Despite the success of the current line, threats loomed as the market shifted. In order tomaintain its market share, Compaq needed to develop a low-priced machine. Using a processor1 thatwas not made by Intel offered the easiest way to cut costs. But Intel held 82% of the processor marketand had established itself as a brand name with its “Intel Inside™” campaign. Compaq hademblazoned the Intel Inside™ sticker on its own machines in order to take advantage of Intel’scooperative advertising payments. Would consumers buy a notebook with a non-Intel processor? Orwould they stay with the Intel name brand and cost Compaq its leadership in a market it had definedand filled?
Compaq’s Consumer Notebook
Compaq’s Consumer Division, in an effort to design a true consumer notebook computer,2had conducted a series of focus groups with consumers to determine their desires in a machine.Previously, most consumer notebooks had been underpowered, undersized, high-priced leftoversfrom the corporate channel. The Presarios that had debuted in Fall 1996 had 16 MB RAM across allproducts (twice the amount commonly available at the time), multi-media capabilities, and a lowerprice.
1 A processor, also known as CPU (central processing unit), is the brain of a computer.2 Consumer sales are distinguished from corporate sales by the entity providing the funds. A computerpurchased with personal funds is considered a consumer sale, even if it is used for work at home.

14 Harvard Business School Marketing Cases
Compaq Computer: Intel Inside?
Case © The McGraw−Hill Companies, 2001
599-061 Compaq Computer: Intel Inside?
2
Retailers loved the line as well, along with Compaq’s new attention to their needs. Ratherthan timing launches to coincide with new technological developments, Compaq targeted new linesfor prime retailing seasons, such as back-to-school and holidays. In a market where productshortages were routine, Compaq did its best to provide dependable supply so that retailers could buyadvertising in advance. The company priced its machines to hit standard retail price points. Inaddition, Compaq’s executives listened to the retailers. It was the retail channel that delivered thenews in 1997 that the market was moving to lower price points. Compaq had to come up with aprofitable sub-$2,000 notebook or risk losing the low end of the market altogether.
By January 1997, four months after the Presario introduction, Compaq’s share of theconsumer notebook market had increased to 27%, from 3%. A year later, Compaq led the market,with a 46% share of units, 33% of dollars. It had defined the consumer laptop market and was busilyfilling it. Even as it took market share from competitors, the entire market grew. (See Table A.)
Table A Market Size and Share
0
500
1,000
1,500
2,000
2,500
June '96 Sep t. '97
Toshiba
IBM
Compaq
Other
Fujitsu
Apple
Texas Inst.
NEC
$ M
illi
ons,
Ret
ail
Toshiba
Other
IBM
Compaq
Source: GIGA Group, “Market Forecast for PCs and Mobile Computing,” July 1, 1996; Anonymous, “Storeboard,” Computer RetailWeek, August 19, 1996; and PC Data, “Market Indicators – Notebook Computers,” Computer Retail Week, December 1, 1997.
Pricing Issues
In part, Compaq could only blame itself for the steady price erosion. In early 1997, it hadintroduced the first fully functional desktop PC from a major brand priced at less than $1,000. Someof the cost savings had come from using a processor made by Cyrix, one of Intel’s competitors. Themachine appealed to consumers who had previously balked at PCs’ high prices. Spurred by this, Intelworked with Compaq to develop a new sub-$1,000 machine using its own processor. This machine,with the same performance and features as the Cyrix model, was forecasted to outsell the Cyrixversion significantly.
Falling prices for desktops depressed those for notebooks. Table B shows the shift innotebook prices between January and July of 1997.

15Harvard Business School Marketing Cases
Compaq Computer: Intel Inside?
Case © The McGraw−Hill Companies, 2001
Compaq Computer: Intel Inside? 599-061
3
Table B Distribution of Consumer Notebooks by Price,January and July 1997
Price Range Jan. 1997 July 1997
Under $1,000 1.0% 2.4%
$1,000-$1,500 15.5% 20.9%
$1,500-$2,000 18.8% 29.3%
$2,000-$3,000 50.0% 32.2%
$3,000+ 15.0% 15.2%
Source: adapted from PC Data, "Market indicators - Notebook Computers," Computer Retail Week, 12/1/97, p. 13.
Competition
Compaq faced price pressures from Toshiba, its archrival and the recently deposed marketleader. Toshiba generally charged $100 to $200 less than Compaq on comparably equipped machines.As a vertically integrated subsidiary of a big Japanese conglomerate, it had cost advantages thatCompaq could not rival. Toshiba made all the major notebook components aside from the processors,which were exclusively purchased from Intel. Toshiba also maintained a much larger engineeringdesign team than did Compaq's Consumer Division, allowing it to react quickly to any design ortechnological changes in the industry.
Other competitors included IBM and Fujitsu. IBM’s machines, Compaq executives admitted,“are technically superior to ours. But we beat them on price for performance.” Fujitsu had the lowend of the market.
By fall 1997, Compaq had a 45% share of the consumer notebook market, due to the debut ofthe Presario 1210, its first sub-$2,000 notebook. This machine, with an Intel processor, was popularwith both first-time notebook buyers and repeat purchasers who needed a bare-bones machine toaugment their primary computers. Margins, however, were unsustainably slim.
The retail market for notebooks in fall 1997 is shown in Table C.
Table C Mobile computers’ retail market share
0 %
5 %
1 0 %
1 5 %
2 0 %
2 5 %
3 0 %
3 5 %
4 0 %
4 5 %
5 0 %
N o v '9 6 D e c '9 6 J a n '9 7 F e b '9 7 M a r '9 7 A p r '9 7 M a y '9 7 J u n '9 7 J u l '9 7 A u g '9 7 S e p '9 7
Ma
rke
t S
ha
re
Toshiba
Compaq
Fujitsu
IBM
Source: adapted from company information.

16 Harvard Business School Marketing Cases
Compaq Computer: Intel Inside?
Case © The McGraw−Hill Companies, 2001
599-061 Compaq Computer: Intel Inside?
4
The Alternatives
Compaq started work on three versions of a new low-cost notebook, shown in Table D. Twoof these used non-Intel processors from AMD and Cyrix, who held 3.4% and 1.6%, respectively, of theU.S. processor market.3 These producers had been plagued with design flaws and availabilityproblems in the past—Compaq had stumbled badly when AMD was unable to produce its version ofIntel’s Pentium fast enough to get a new line of desktop machines to market—but both finally had thetechnology and productive capacity to be competitive with Intel.
Table D Strategic Notebook Options
Code Name Processor Cost Difference
Elvis Cyrix Media GX withMMX
Least Fewer parts, less upgradeable, new manufacturingtechnology, needed new BIOS4
Road Warrior IIa AMD K6 with MMX +$150 Needed new BIOS, new manufacturing technology
Road Warrior IIb Intel Pentium with MMX +$300 Existing BIOS and manufacturing technology.
Source: Company information.
"Elvis," with the Cyrix processor, had the lowest cost structure of the three. Although itlooked similar to the "Road Warrior II (RWII)" products, it had fewer parts and a simpler structure.With equal system configurations, processor performance, hard drive, RAM, and CD-ROM, the"Elvis" design was approximately $100 to $200 less expensive than a "RW II" with an AMD K6processor.
The "RW II" was designed with two system boards—one using the AMD K6 processor(AMD’s Pentium II equivalent) and the second using the Intel Pentium MMX processor. The AMDversion would retail for approximately $100 to $200 less than an Intel machine, due to the costsavings in processor price.
Developing three system designs imposed significant costs and risks. Engineeringrequirements were substantial for the two non-Intel machines, especially given the extremeconditions that notebooks imposed on components. Intel processors posed fewer engineeringchallenges because they were already used so extensively throughout the industry.
Second, AMD and Cyrix were relying on unproven technology to manufacture their newhigh-performance processors. Failure to meet the specifications for notebooks would delay theproduct’s launch. AMD and Cyrix both had aggressive timetables for implementing this process,which had challenged even Intel.
Just manufacturing and procurement for the three different models was a logisticalnightmare. Each model would require a stock of unique components, which would prohibit easyswitching of resources among designs in order to meet unexpected demand. “It’s clear,” said GregMemo, vice president of the Consumer Mobile Division, “that we have to reduce the options.” Heknew that market research had helped to design the Presario line. He hoped it could help create thenext generation as well.
3 Anonymous, “MPUs – Intel is still No. 1, but other companies jockey for top-10 spots,” Electronics Buyers’ News,March 30, 1998.4 Basic Input Output System (BIOS) was the set of instructions that told the computer how to do its work.Notebooks placed special demands on BIOS because system heat had to be regulated. Because AMD and Cyrixprocessors had not been used in notebooks before, suitable BIOS did not yet exist for them.

17Harvard Business School Marketing Cases
Compaq Computer: Intel Inside?
Case © The McGraw−Hill Companies, 2001
Compaq Computer: Intel Inside? 599-061
5
The Study
“Traci, we need a couple of focus groups, fast,” said Memo, entering the office of Traci Cox,director of market research. “We have to test how willing customers are to pay more for Intel.”
“We can certainly do some focus groups for you, Greg,” said Cox. “But for the sort of tradeoffanalysis you’re talking about, you may also want a quantitative study. They’re fairly expensive,” shewarned, “and they take a little time. But that’s the best way to handle something like this, where youjust don’t know how people will respond.” Cox suggested a set of focus groups in conjunction with adiscrete choice study to gauge the willingness of consumers to pay varying amounts for variousattributes, including branded or unbranded processors. (See Exhibit 1 for the study design.) “It’s likea typical purchase situation,” she said. “A respondent can have this or that, or pay a certain amountmore for both, and are they willing to do so?”
Unlike a focus group, which used a fairly small number of people, the discrete choice studywould involve hundreds of participants and cost between $100,000 and $150,000. “It can be worth itthough,” Cox added. “One of the benefits of a discrete choice study is that you can interpolatebetween different pairs of options. For instance, if 30% would pay $45 and 10% would pay $60, youcan guess that 20% would pay $52.50.” Some of the people recruited for the quantitative study wouldalso participate in focus groups to gauge their reactions to Intel as opposed to alternative processors.
A few weeks later, Memo answered the telephone. “Greg, the executives need an update onthat alternative processor project. Are we going with all three or not?” asked Rod Schrock, senior vicepresident of the Consumer Division. As he hung up the phone, Memo saw the report of the mostrecent study on the top of his inbox. (See Exhibit 2.)

18 Harvard Business School Marketing Cases
Compaq Computer: Intel Inside?
Case © The McGraw−Hill Companies, 2001
599-061 Compaq Computer: Intel Inside?
6
Exhibit 1 Notebook Alternative Processor Research Design
Objectives
The main objectives of this research are to
• Test the impact of non-Intel processors on consumer purchase preferences for mid- to high-priced notebook PCs. This includes testing the impact of brand on consumer reaction to non-Intel processors.
• Understand the impact of a non-Intel processor on sales and customer acceptance of mid- tohigh-priced Compaq notebook PCs.
Methodology
• 12 one-hour quantitative research sessions,5 with 3 sessions followed by a one-hour focusgroup.
• 257 notebook PC consumers (own or intend to purchase within 6 months) in Chicago, SanFrancisco, and Irvine in September 1997.
• All respondents screened to ensure they meet the target market profile:
• Actively shopping for notebook PCs.• Fit attitude, behavior, and ownership questions.• Are key decision makers for technology purchases for the home.• Have purchased a notebook PC within the past 12 months or intended to do so within
the next 6 months.
• Note: for the purposes of this research, “value-priced PC brands” are brands which,holding all else equal (features, performance, design) have less than a $100 brandpremium. The “premium-priced PC brands” have a brand premium above $100, all elseequal.
5 Participants made choices between pairs of options, or indicated their willingness to pay more to have both.
19Harvard Business School Marketing Cases
Compaq Computer: Intel Inside?
Case © The McGraw−Hill Companies, 2001
Compaq Computer: Intel Inside? 599-061
7
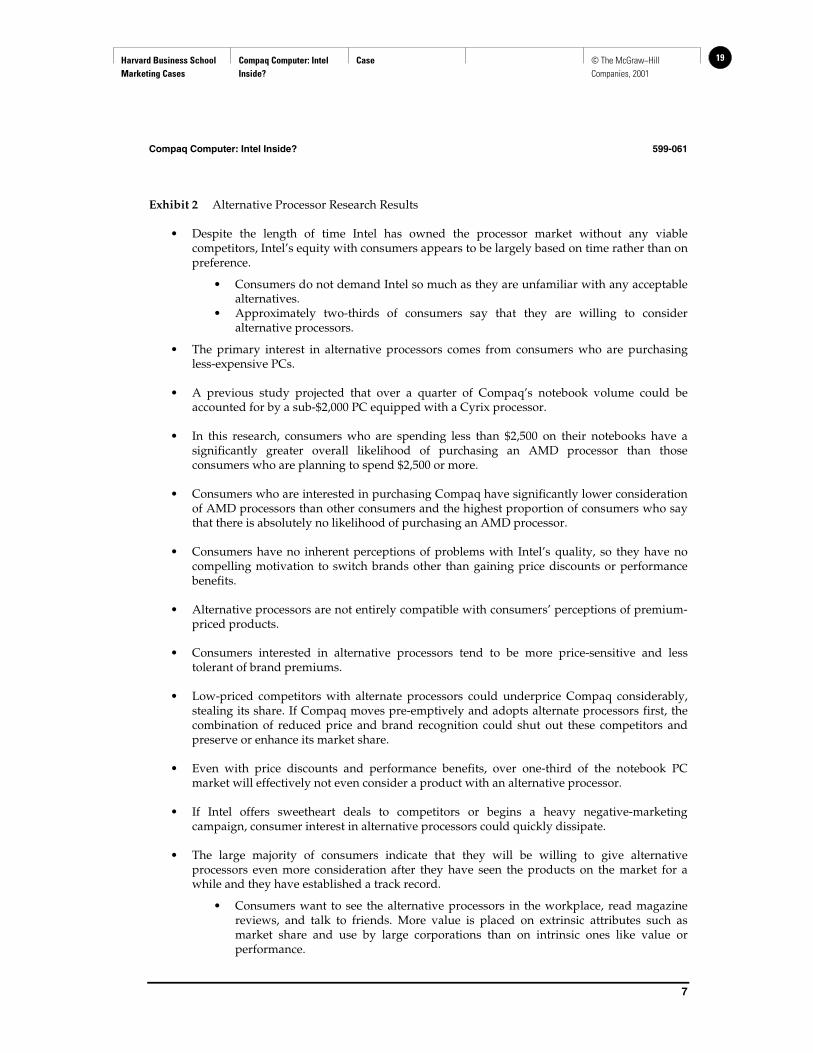
Exhibit 2 Alternative Processor Research Results
• Despite the length of time Intel has owned the processor market without any viablecompetitors, Intel’s equity with consumers appears to be largely based on time rather than onpreference.
• Consumers do not demand Intel so much as they are unfamiliar with any acceptablealternatives.
• Approximately two-thirds of consumers say that they are willing to consideralternative processors.
• The primary interest in alternative processors comes from consumers who are purchasingless-expensive PCs.
• A previous study projected that over a quarter of Compaq’s notebook volume could beaccounted for by a sub-$2,000 PC equipped with a Cyrix processor.
• In this research, consumers who are spending less than $2,500 on their notebooks have asignificantly greater overall likelihood of purchasing an AMD processor than thoseconsumers who are planning to spend $2,500 or more.
• Consumers who are interested in purchasing Compaq have significantly lower considerationof AMD processors than other consumers and the highest proportion of consumers who saythat there is absolutely no likelihood of purchasing an AMD processor.
• Consumers have no inherent perceptions of problems with Intel’s quality, so they have nocompelling motivation to switch brands other than gaining price discounts or performancebenefits.
• Alternative processors are not entirely compatible with consumers’ perceptions of premium-priced products.
• Consumers interested in alternative processors tend to be more price-sensitive and lesstolerant of brand premiums.
• Low-priced competitors with alternate processors could underprice Compaq considerably,stealing its share. If Compaq moves pre-emptively and adopts alternate processors first, thecombination of reduced price and brand recognition could shut out these competitors andpreserve or enhance its market share.
• Even with price discounts and performance benefits, over one-third of the notebook PCmarket will effectively not even consider a product with an alternative processor.
• If Intel offers sweetheart deals to competitors or begins a heavy negative-marketingcampaign, consumer interest in alternative processors could quickly dissipate.
• The large majority of consumers indicate that they will be willing to give alternativeprocessors even more consideration after they have seen the products on the market for awhile and they have established a track record.
• Consumers want to see the alternative processors in the workplace, read magazinereviews, and talk to friends. More value is placed on extrinsic attributes such asmarket share and use by large corporations than on intrinsic ones like value orperformance.

20 Harvard Business School Marketing Cases
Compaq Computer: Intel Inside?
Case © The McGraw−Hill Companies, 2001
599-061 Compaq Computer: Intel Inside?
8
• These findings indicate that the success of alternative processors may increase overtime, with limited adoption upon their introduction but increasing acceptance withuse.
• Overall consumers are relatively indifferent to the processor brand, focusing their attentionprimarily on processor speed, display size and type, and the amount of RAM.
• Although consumers assume a quality PC brand will use only quality components, there isno greater acceptance for alternative processors when offered by premium-priced PC brandsthan when offered by value-priced brands.
• The important driver of consumer acceptance of alternative processors does not appear to beopinion of the PC brand but simply having awareness of the PC brand.
• In discussions, consumers have a much higher opinion of Compaq than they do ofAcer. However, they are more likely to purchase an Acer with an AMD processorthan a Compaq so equipped.
• In fact, alternative processors may be inconsistent with premium-priced PC brands.
• Acceptance of AMD increases as the PC brand premium decreases.• Consumers accept a brand premium for Compaq of between $50 and $150 depending
on the competitive brand.
• PC brand seems to be slightly more important to consumers than processor brand.
• If there are problems with the PC, consumers do not call or blame the processorcompany.
Switching customers to AMD
• Many people are willing to switch to AMD once the discount exceeds 10% of the systemprice.
• Some segments of consumers display a very strong preference for AMD, but even segmentswhich tend to prefer Intel will give AMD serious consideration.
Quantitative Research Results
• If AMD cannot offer a discount near $100, a large majority of consumers will stay with Inteland will be almost impossible to win.
• The bulk of consumers who will buy AMD expect to save $100 compared to the samecomputer with Intel. Additional discounts will not win enough new purchasers to offset therevenue loss.
Results of Tradeoff Analysis, All Else Equal
Model Chosen by
Compaq 266 MHZ AMD CPU 34%
Toshiba 233 MHZ Intel CPU same price as Compaq 25%
Acer 233 MHZ Intel CPU $150 less than Compaq 28%
Source: company information.
21Harvard Business School Marketing Cases
Goodyear: The Aquatred Launch (Condensed)
Case © The McGraw−Hill Companies, 2001
Harvard Business School 9-500-039Rev. November 9, 1999
Professor Samuel Chun prepared this case as the basis for class discussion rather than to illustrate either effective orineffective handling of an administrative situation. It is a condensed version of the case, Goodyear: The Aquatred Launch,HBS Case #594-106, prepared by Bruce Isaacson under the supervision of Professor John Quelch.
Copyright © 1999 by the President and Fellows of Harvard College. To order copies or request permission toreproduce materials, call 1-800-545-7685, write Harvard Business School Publishing, Boston, MA 02163, or go tohttp://www.hbsp.harvard.edu. No part of this publication may be reproduced, stored in a retrieval system,used in a spreadsheet, or transmitted in any form or by any means—electronic, mechanical, photocopying,recording, or otherwise—without the permission of Harvard Business School.
1
Goodyear: The Aquatred Launch (Condensed)
In January 1992, Barry Robbins, Goodyear’s vice president of marketing for North AmericanTires, was contemplating the upcoming launch of the Aquatred, a new tire providing improveddriving traction under wet conditions. The Aquatred would be positioned in the U.S. market as areplacement tire for passenger cars. Over recent years, the replacement tire market had matured andnew channels had gained share, so Robbins needed to make sure Goodyear had the right product andthe right timing to generate support from the company’s traditional base of independent dealers.Despite a long and close relationship with those independent dealers, Goodyear was also weighingthe risks and benefits of expanding the company’s distribution channels. If new outlets were added,Robbins would also have to assess whether the new channel would sell the Aquatred.
Background
In 1991, Goodyear operated 41 plants in the United States, 43 plants in 25 other countries, sixrubber plantations, and more than 2,000 distribution outlets worldwide. In fiscal year 1991, Goodyearearned net income of less than one percent on total revenues of $10.91 billion; the company hadapproximately 105,000 employees. Goodyear ranked third in worldwide sales of new tires behindMichelin and Bridgestone, respectively.
Low growth, declining prices and over-capacity in an environment of corporateconsolidation characterized the U.S. tire industry. Exhibit 1 lists the brand shares of U.S. retail salesfor the largest tire manufacturers from 1975 to 1990. During this period, Michelin achieved largeshare gains in both the replacement and original equipment manufacturer (OEM) markets. Unlikeother U.S. tire manufacturers, Goodyear had made large investments (over $1.5 billion) during thelate 1970s to produce radials. The company also had a strong track record in launching innovativenew products. For example, in 1981 Goodyear successfully launched the Eagle, the first radial tireoffering high-speed traction for sports cars. On a typical radial, the cost of goods sold was 60% of themanufacturer’s selling price, but the Eagle provided Goodyear and its dealers with higher percentageprofit margins than standard radials.
In the early and mid-1980s, Goodyear made large investments in pipelines for natural gasand oil transmission. In 1986, Sir James Goldsmith attempted to take over Goodyear and was boughtout by management after a highly emotional takeover battle, which greatly increased Goodyear’s

22 Harvard Business School Marketing Cases
Goodyear: The Aquatred Launch (Condensed)
Case © The McGraw−Hill Companies, 2001
500-039 Goodyear: The Aquatred Launch (Condensed)
2
debt. Although 13% of the company’s work force was furloughed between 1987 and 1991, in 1991Goodyear was still spending $1 million per day on interest payments, and earnings were sluggish.
In June of 1991, Stanley G. Gault, retired chairman of Rubbermaid, became chairman ofGoodyear. Gault had been a member of Goodyear’s board of directors, and many hoped that hewould bring the same marketing flair and new product skills that he had shown at Rubbermaid.Gault stated his goal at Goodyear:
. . . to create a market-driven organization. That means to serve the customer and theultimate user. People are wrong to think of tires as a commodity—that a tire is a tire is atire. . . . Customers want safety—they want that car to stop. They want reliability.1
Gault installed his own management team, sold off assets that were not directly related to thetire business, and placed an increased priority on new product development.
The Market for Passenger Tires
The market for passenger tires could be segmented in three ways. One segmentation wasbased on the distinction between performance and broad-line tires. Performance tires were widerthan broad-line tires, were more expensive, and provided better traction. Although performance tirescould be replaced with broad-line tires, consumers rarely made this substitution because of theresulting decrease in handling and performance. Performance tires represented 25% of Goodyear’sdomestic unit sales, 30% of dollar sales, and an even higher percentage of profits.
The market could also be segmented based on replacement and OEM tires. Replacement tireswere sold to individual consumers, while OEM tires were sold to car manufacturers. Car makersused volume purchases to negotiate substantial discounts on tires. In 1991, U.S. replacement tire saleswere estimated at $8.6 billion (137 million units sold). In the United States, Goodyear’s passenger tiredivision derived 65% of its revenues from replacement tires and 35% from OEM tires. Divisionrevenues were $1.98 billion on sales of 39.1 million tires.
A third segmentation scheme was along brand classifications, which included major brands,minor brands, and private label. Major brands, which carried the name of a major tire manufacturer,accounted for 36% of unit sales in the replacement passenger tire market. Major brands had thehighest recognition among consumers and included Goodyear, Firestone, Michelin, Bridgestone,Pirelli, and Goodrich. Minor brands represented 24% of unit sales and included tires made by smallermanufacturers as well as tires made by major manufacturers but sold under a different name. Minorbrands included Sears, Dunlop, General, Kelly (a Goodyear subsidiary), Uniroyal, Cooper,Yokohama, and Toyo. Although minor, these brands were often well-recognized by consumers andincluded high-priced niche brands.
Sales of private label tires constituted the remaining 40% of the market. Many smallmanufacturers specialized in private label tires, while some larger manufacturers used excesscapacity to service the private label market. Most private label tires carried names exclusive to aparticular retailer, but others were available to any retailer. Private label manufacturers typically hadonly one distributor per territory, which gave the distributor some flexibility in pricing. In 1991,private label tires constituted 80% of the sales of Goodyear’s wholly owned Kelly-Springfieldsubsidiary; the remaining 20% were sold under the Kelly brand. The average retail selling price of a
1Source: Fortune, July 15, 1991.

23Harvard Business School Marketing Cases
Goodyear: The Aquatred Launch (Condensed)
Case © The McGraw−Hill Companies, 2001
Goodyear: The Aquatred Launch (Condensed) 500-039
3
private label tire was 18% lower than the price of a comparable branded tire. Although sales ofprivate label tires had grown, their average life remained slightly lower than the life of a branded tire.
Many of the attributes important to consumers when purchasing a tire were not apparentupon visual inspection. To certify product quality, some retailers added warranties to their tires.These warranties were paid for by the retailer and would typically guarantee the tire for 60,000 miles,with the value of the guarantee decreasing on a pro-rata basis over the life of the tire. Retailerwarranties were particularly common on sales of private label tires.
In past years, Goodyear had produced two lines of private label tires: the All American andthe Concorde. The Goodyear brand was not placed on these tires, providing Goodyear’s independentdealers with low-priced lines to compete with other types of outlets. In 1991, Robbins replaced the AllAmerican and the Concorde with Goodyear-branded tires at comparable prices because marketresearch showed that the non-branded lines cannibalized sales of branded tires. Although the sales ofthese two lines were relatively small, some analysts felt that discontinuing the All American andConcorde increased incentives for Goodyear’s independent dealers to sell tires made by othermanufacturers. Some independent dealers believed that consumers wanted to choose from a range oftires, and favored offering private brands to provide consumers with a reference point, which theyargued would increase the sales of Goodyear tires.
Consumers in the Replacement Passenger Tire Market
Most consumers viewed tires as a “grudge purchase”—an expensive necessity to keep avehicle in driving condition. The average time between purchases of tires was 2.5 years, but over halfof all tire-buying consumers made their purchase the same day they became aware of their need fortires. Most tires were bought in pairs: 42% of consumer purchases involved two tires, 40% involvedfour tires, 16% involved one tire, and only 2% involved three tires. Purchases of sets of four tiresaccounted for 60% of all units sold. The percentage of consumers who did not know what brand oftire they planned to buy next rose to 53% in 1992 from 36% in 1982.
Generally, tire consumers could be broken down into quality-conscious buyers (18%), value-conscious buyers (23%) and price-focused buyers (59%). Whereas price-focused buyers treated tiresas a commodity purchase, quality and value-conscious buyers placed greater weight on tire qualityand performance attributes obtainable at a given price. Goodyear regularly surveyed car owners,asking about performance attributes considered when purchasing tires. The five most important tireattributes, in order from higher to lesser importance, were tread life, wet traction, handling, snowtraction, and dry traction.
Across the segments, all consumers placed great importance on price when shopping fortires. A 1989 Goodyear survey had shown that with no other information available, consumersexpected Goodyear’s broad-line tires to be priced within a six-dollar range from the most expensiveto the least expensive. The research also demonstrated that Goodyear’s point-of-sale displays didlittle to alter consumers’ expectations of retail prices.
It was estimated that three-fourths of all Goodyear tires sold in independent or company-owned outlets were sold on promotion, at an average discount of 25%. This discount was offered tothe consumer in a number of ways, such as one free tire with the purchase of three tires, one tire forhalf price with the purchase of another tire at full price, or 25% off the price of selected tires.Experiments with everyday low pricing in the tire industry had been unsuccessful because pricecompetition among dealers undermined attempts to set consistently low but fair prices. As one dealerexplained, “Consumers expect to buy their tires on sale. We have created a price-conscious monster.”

24 Harvard Business School Marketing Cases
Goodyear: The Aquatred Launch (Condensed)
Case © The McGraw−Hill Companies, 2001
500-039 Goodyear: The Aquatred Launch (Condensed)
4
Wholesale Channels for Replacement Tires
Goodyear directly sold passenger tires to large chains and wholesalers, with no retailoperations who resold their tires to car dealers, service stations, small independent dealers, and othersecondary outlets. This accounted for 10% of Goodyear’s factory sales. Another 40% went to largechains that both sold tires at retail and resold tires to other dealers or to secondary outlets. Theremaining 50% went to small independent dealers who bought tires to resell in their own retailoutlets and did not resell to other outlets. This breakdown was typical of the industry.
Retail Channels for Replacement Tires
Six major retail channels competed for market share in the U.S. replacement passenger tiremarket. (Exhibit 2 shows each channel’s market share, relative prices, and reliance on private labeltires.) The six channels can be described as follows:
1. Garages/service stations: These were typically small, neighborhood outlets offeringgasoline, tires, and auto services. Their share of the tire market had declined in recentyears in favor of lower-cost, higher-volume outlets. Garages and service stations soldprivate label tires as well as branded tires to combat price pressure from larger outlets.
2. Small independent tire dealers: Small independent tire dealers operated one or twooutlets, where they sold and installed tires and also offered auto services. Many smallindependent tire dealers started as single-brand outlets but over time added additionalbrands. Both small dealers and large independent tire chains derived an increasingportion of their revenues from private label tires.
3. Manufacturer-owned outlets: These outlets, owned and operated by the tiremanufacturers, typically sold only one brand of tires and offered a range of auto services.
4. Warehouse clubs: Warehouse clubs operated large stores carrying categories asdiverse as food, clothing, electronics, tires, and hardware. Warehouse clubs offered alimited brand selection, with the selection changing according to the deals their buyerscould strike with vendors. Also, warehouse clubs offered minimal in-store service otherthan installation. Although warehouse clubs were a relatively new retail format, theywere growing quickly due to their low prices.
5. Mass merchandisers: Mass merchandisers were retail chains that sold tires,performed auto services, and carried other types of merchandise. Mass merchandiserstypically maintained a very wide brand selection. For example, Sears sold Michelin,Goodrich, Pirelli, Bridgestone, Yokohama, and its own Roadhandler brand.
6. Large tire chains: Also known as “multi-brand discounters,” large tire chainstypically had 30-100 outlets concentrated within a geographic region. These chainscarried major brands of tires as well as private label, and tended to be low-priced, high-volume operations. In recent years, large tire chains gained share, often by acquiringsmaller independent dealers.
In most markets, consumers could choose among these types of channels. As oneindependent dealer noted, “The tire manufacturer is not only our supplier but also our competitorthrough manufacturer-owned outlets. On top of that, we compete with the warehouse clubs, massmerchandisers, corner station, and who knows who else.”

25Harvard Business School Marketing Cases
Goodyear: The Aquatred Launch (Condensed)
Case © The McGraw−Hill Companies, 2001
Goodyear: The Aquatred Launch (Condensed) 500-039
5
Goodyear’s Distribution Structure
Goodyear did not sell tires in garages/service stations, warehouse clubs, or massmerchandisers; instead, the company relied on three types of outlets. Goodyear’s 4,400 smallindependent dealers accounted for 50% of sales revenues, while the 1,047 manufacturer-owned outletsgenerated 30% of sales (the remainder of sales occurred primarily through franchised dealers anddirectly to government agencies). Goodyear was also testing a new retail format, Just Tires. Modeledafter “quick lube” stores that offered fast oil changes without an appointment, Just Tires stores soldand installed tires but did not offer any other products or services. Just Tires stores providedconsumers with guarantees covering speed and quality of installation.
Manufacturer-owned outlets could be opened or closed at the discretion of the manufacturer.During the 1970s, Goodyear opened as many as 200 outlets per year. By 1983, the company owned1,300 outlets in the United States, but became concerned about the associated demands for capitaland management attention. Despite Goodyear’s efforts to site company-owned outlets in locationsthat would minimize competition with its independent dealers, complaints were common. Over time,Goodyear placed increasing emphasis on franchising new outlets and also converted some company-owned outlets into franchised and independent dealerships.
Only about 2,500 of Goodyear’s small independent dealers were considered active in thatthey generated a consistent level of sales, maintained the major Goodyear retail displays, and offeredthe full line of Goodyear tires. A typical dealership required an owner investment of $100,000 andgenerated annual revenues of $1,000,000. Goodyear’s independent outlets sold an average of 15.5tires/day, including both Goodyear and other brands of tires, although most Goodyear dealersderived the majority of their sales from Goodyear tires. The average selling price of all tires sold byGoodyear’s independent dealers was $75 per tire. Retail margins for independent dealers averaged28% on Goodyear tires, 25% for dealers carrying other major brands, and 20% for private label tires.Average wholesale margins were 18% for private label tires and 14% for Goodyear tires.2
Monthly auto service sales for independent tire dealers averaged $38,100 per outlet. Most tiredealers changed oil, performed alignments, replaced shocks, fixed exhaust systems, and did minorengine work. Independent dealers derived, on average, 48% of their revenues from auto services in1991, up from 26% in 1980. On average, 20% of service revenues came from tire-related work.Margins for independent dealers were 50% on service labor and 20%-25% on parts installed; 70% ofservice revenues were earned from labor, with the remaining 30% earned from parts.
The average number of tires installed per day at a typical independent dealer increased 13%from 1983 to 1991, but the average service dollars per outlet grew 92% during the same period. Notall dealers were pleased with their reliance on service revenues. As one dealer said, “To me it’s anindictment of the industry that we cannot support ourselves on tire sales. We have to have thatservice to survive.” Tires were an expensive purchase for most consumers, and independent dealersworried about the “sticker shock” resulting from service charges increasing the bill to the consumer.
Goodyear serviced independent dealers through the area sales manager, who made sure thatdealer orders were placed properly, provided information about market trends, offered advice onoperations, and handled complaints. Visits from area sales managers were very important to dealers.As one area sales manager noted, “You never get to the dealer enough. You could spend all day thereand then the next day the guy would say, ‘Gee, I have this problem today. Too bad you weren’taround.’“
2These margins are estimated from several sources and may vary by region or time period.
26 Harvard Business School Marketing Cases
Goodyear: The Aquatred Launch (Condensed)
Case © The McGraw−Hill Companies, 2001
500-039 Goodyear: The Aquatred Launch (Condensed)
6
Most complaints from independent dealers involved relatively minor billing problems,although complaints about competition from other channels or the location of company-ownedoutlets were also common. Issues that could not be handled by the area sales manager were referredto the district manager. The dealer council took up complaints common to many dealers. Goodyearhad established ten regional councils to represent the views of Goodyear’s independent dealers. Eachregional council elected one dealer to Goodyear’s national dealer council for passenger tires.Goodyear’s top marketing and sales executives attended council meetings to answer questions,address complaints, or hear suggestions.
Independent dealers also set their own inventory policies. For many years Goodyear hadprotected its dealers by not selling Goodyear-branded tires in other outlets; in exchange, Goodyeardealers did not carry other brands. In 1989, 70% of Goodyear’s independent dealers carried onlyGoodyear tires, while 30% stocked other brands. Typically, the other brands were not aggressivelymerchandised but used only as lower-priced alternatives to Goodyear. By 1991, estimates suggestedthat 50% of Goodyear’s independent dealers sold only Goodyear tires, while the other 50% stocked atleast one other brand. Among the latter, some aggressively merchandised other brands but Goodyeartires still generated 90% of the revenues for most independent dealers.
Independent dealers’ concern for protecting their interests led the National Tire Dealers andRetreaders Association (NTDRA) to pass a bill of rights in 1992 (see Exhibit 3). NTDRA presidentRobert Gatzke said, “[T]his bill of rights clearly identifies certain rights which independent tiredealers have a right to expect from their tire suppliers.”3 The bill demanded that manufacturersrespect the independent dealers’ importance, consult independent dealers on key decisions, avoidplacing company-owned outlets in competition with independent dealers, supply tires toindependent dealers in a timely manner, and grant dealers the same pricing and programs given tohigh-volume outlets such as wholesale clubs and multi-brand discounters.
Although Goodyear claimed not to want its tires sold in low-priced outlets such aswarehouse clubs, mass merchandisers, and auto supply stores, those outlets sporadically obtainedGoodyear tires. The price-based ads and frequent discounting from those outlets angered Goodyear’sindependent dealers. One owner of two independent tire outlets said, “The mass merchandisers areeating up the distribution of our product. It could drive me out of the tire business.”4 Industryobservers felt that the large tire chains that acted solely as wholesalers diverted tires to those outlets.As one analyst said, “There’s a lot of big wholesalers who will sell to anybody.”
Goodyear’s options to stop the diversion were limited by legal restrictions that prohibitedmanufacturers from dictating either retail selling prices or to whom their tires could be resold.However, in December 1990, Goodyear sued two automotive chains: Tire America and Western AutoSupply. Sears owned both, and neither was an authorized Goodyear dealer. The suits charged thatthe Sears units were advertising Goodyear tires without maintaining enough inventory to meetdemand. Consumers drawn to the store were allegedly switched to other brands in a “bait andswitch” tactic. Goodyear also maintained that the chains were not authorized to use the Goodyeartrademark in their advertising.
Competition
Goodyear regularly surveyed car owners to monitor their image of the major tire brands. Interms of brand perceptions Goodyear and Michelin were virtually even, but Michelin’s image was
3Source: Tire Business, June 1992.4Wall Street Journal, June 24, 1991, p. B1.

27Harvard Business School Marketing Cases
Goodyear: The Aquatred Launch (Condensed)
Case © The McGraw−Hill Companies, 2001
Goodyear: The Aquatred Launch (Condensed) 500-039
7
stronger among quality-conscious and value-conscious consumer segments, while Goodyear had astronger image among the price-focused consumer segment (Exhibit 4).
In 1992, Michelin had fewer than 125 company-owned outlets, but Michelin tires wereavailable through 7,000 dealers. Most of these were multi-brand large tire chains and sold Michelin asthe prestige line in their product offerings. Michelin tires were also available in 95% of the 600warehouse clubs in the United States, mass merchandisers such as Montgomery Ward and Sears, anda variety of gas and service stations. Michelin, Uniroyal, and Goodrich had recently combined theirsales forces to allow their salespeople to sell all three brands.
Exhibit 5 presents a brand-switching matrix, showing loyalty by brand among consumersreplacing passenger tires. Michelin owners were the most loyal, followed by Goodyear owners, butsignificant proportions of consumers who owned major brands replaced their tires with private labelbrands. Goodyear typically spent 9%-11% of sales on advertising and promotion, with 60% beingspent on promotion. Among U.S. tire marketers, Goodyear’s share of voice in television andmagazine advertising was about 60%.
Goodyear’s competitors were planning a wide range of campaigns for 1992. Both Bridgestoneand Michelin were planning to introduce new tires with 80,000-mile warranties, while Uniroyal wasintroducing a new tire for light trucks. Under Michelin’s ownership, BF Goodrich was focusing onthe high performance market, while Goodyear’s Kelly-Springfield subsidiary used advertisingprimarily to announce the low price of its tires.
The Aquatred Tire
In 1989, Goodyear began developing a new and exciting replacement market tire that wouldhave a tangible, perceptible difference over existing models. Howard MacDonald, marketingmanager for Passenger Tires, said, “We were looking for something that appearance-wise wasdifferent—something that a customer would walk into a showroom and tell from a distance that itwas different.”5 The Aquatred was developed after comparing 10 different designs on performanceand consumer preference. The deep groove down the center of the tire was dubbed the“Aquachannel.” According to Goodyear, the Aquatred’s tread design channeled water out fromunder the tire, reducing hydroplaning and improving traction in wet conditions.6 Performance testsshowed that in wet conditions, cars equipped with Aquatreds traveling at 55 miles per hour stoppedin as much as two-car-lengths-less distance than similar cars equipped with conventional all-seasonradials. When 50% worn, the Aquatred maintained the same wet traction as a new all-season tire.
Goodyear planned to sell the Aquatred with a 60,000-mile warranty and to position the tire atthe top of the broad-line segment. The last tire to promise increased wet traction to the broad-linesegment was the Uniroyal Rain Tire in the early 1970s. The Aquatred was patented, but patentprotection on tread designs was difficult to enforce. Continental Tire was known to be working on itsown anti-hydroplaning tire, to be called the Aqua Contact, which could be launched in early 1993.
The Aquatred was test-marketed in a large metropolitan area. A Goodyear survey from thetest market compared purchase behavior for Aquatred buyers with purchase behavior for buyers ofthe Invicta GS, Goodyear’s most expensive broad-line tire. Compared with buyers of the Invicta GS,Aquatred buyers were more likely to replace competitors’ tires, searched more extensively for
5Source: Modern Tire Dealer, March 1992.6Hydroplaning occurs in wet conditions due to a layer of water forming between the tire and road, causing amomentary loss of traction.
28 Harvard Business School Marketing Cases
Goodyear: The Aquatred Launch (Condensed)
Case © The McGraw−Hill Companies, 2001
500-039 Goodyear: The Aquatred Launch (Condensed)
8
information prior to purchase, were more likely to drive imported cars, and more often came toGoodyear outlets specifically for the Aquatred. Exhibit 6 presents data gathered by a “mysteryshopper,” a Goodyear employee who shopped for tires at independent dealers without identifyinghis or her affiliation with Goodyear. Despite the uniformity of the company’s literature and policies,there was variation in the presentation and pricing of the Aquatred by dealers in the test market.
Due to the long buying cycles of auto manufacturers, the Aquatred would not be available asoriginal equipment, so all sales of the Aquatred would come through the replacement market. It wasestimated that a full-scale launch would cost Goodyear about $21 million.
Managers at Goodyear still had two concerns about the launch. First, would Goodyear’sdealers be receptive to a high-priced tire when the industry seemed to be turning toward long-lifewarranties and low-cost private labels? One dealer had said,
I would be much more interested in a tire that went 80,000 miles than onethat channels the rain out of the way. Even a 35,000-mile tire at a decent price pointwould be better. The Aquatred is a boutique tire, but where do we make our moneyas a dealer? Middle-of-the-road products.
Second was the channel itself. Goodyear management debated whether distribution shouldbe expanded, and if so, what specific channels or retailers should be added. Expanding distributioncould boost sales and prevent Goodyear OEM tires from being replaced by other brands in thereplacement market. However, selling tires in lower-service outlets could erode the value of theGoodyear brand, cannibalize sales of existing outlets, and might cause dealers to take on additionallines of tires. Stanley Gault, Goodyear’s new chairman, had expanded distribution at Rubbermaid,and many Goodyear dealers were concerned that he would do the same at Goodyear. As one dealersaid, “Today, you can go to any store and get a Rubbermaid product, and the prices on Rubbermaidhave dropped accordingly. We feel that Goodyear tires should not be that way.”
If the decision was made to launch the Aquatred, there would be a variety of launch-relatedissues to settle. For example, given the wide range of tires sold by Goodyear, dealers would needadvice regarding which customers would be likely to switch to Aquatreds. In the test markets, somedealers had tried to sell Aquatreds only to customers who drove newer cars or looked affluent. And ifdistribution was expanded, Goodyear would need to decide whether the new channel would receivethe Aquatred.
In addition, Goodyear had to finalize pricing and promotional policies for the Aquatred.Goodyear hoped to price the Aquatred at a 10% premium over the Invicta GS, but the successfullaunch of the Tiempo in 1977 was partly attributed to a low retail price. Independent dealers in testmarkets had consistently asked for price promotions on the Aquatred. Robbins had turned down allsuch requests, but given the growing problem of tires diverted to unauthorized dealers, it was notclear that the tire could be kept out of channels that were prone to discounting and promotions.
Plans for the national launch were proceeding during an important period in Goodyear’shistory. Any change in distribution strategy would affect the launch, but the launch and theassociated marketing programs would affect Goodyear’s dealers. Stanley Gault was upbeat and sawthe Aquatred as a product to revitalize Goodyear. Robbins, armed with consumer research, wanted tobe sure that the consumer and the channel would agree.

29Harvard Business School Marketing Cases
Goodyear: The Aquatred Launch (Condensed)
Case © The McGraw−Hill Companies, 2001
Goodyear: The Aquatred Launch (Condensed) 500-039
9
Exhibit 1 Brand Shares of Unit Sales in the U.S. Passenger Tire Market
1975 1980 1985 1990 1991
Replacement Market(includes largerbrands only)
Goodyear 14.0% 14.0% 15.5% 15.0% 15.0%Michelin 2.5 7.0 8.0 8.5 8.5Firestone 10.5 10.0 9.5 8.0 7.5Sears 10.0 10.0 9.0 6.5 5.5General 2.0 3.0 2.5 4.0 4.5BF Goodrich 4.0 5.0 4.5 4.0 3.5Bridgestone 0.0 2.0 2.0 3.0 3.5Cooper 1.0 1.5 2.5 3.0 3.5Kelly 3.0a 4.0 3.0 3.0 3.0Uniroyal 3.5 3.5 3.0 3.0 2.5Dunlop 2.5 2.5 2.5 2.5 2.0Pirelli 0.0 0.0 1.0 2.0 2.0Montgomery Ward 4.5 3.5 2.0 2.0 1.5Otherb 42.5 34.0 35.0 35.5 37.5
OEM Market
Goodyear 35% 28% 32% 36% 38%Michelin 2 5 11 16 16Firestone 24 22 22 17 17General 11 11 13 12 11Uniroyal 20 24 22 17 13BF Goodrichc 8 0 0 0 0Dunlop 0 10 0 1 3Bridgestone 0 0 0 1 2
Source: Modern Tire DealeraEstimatesbOther included a variety of smaller brands, some of which were exclusively private label.cBF Goodrich was sold to Uniroyal, and eventually to Michelin.

30 Harvard Business School Marketing Cases
Goodyear: The Aquatred Launch (Condensed)
Case © The McGraw−Hill Companies, 2001
500-039 Goodyear: The Aquatred Launch (Condensed)
10
Exhibit 2 Share of Retail Sales of Replacement Passenger Tires by Channel (U.S. market only)
Channel Share ofRetail Sales 1976 1981 1986 1991
Garages/service stations 18% 11% 8% 6%Small independent tire dealers 36 47 46 40Manufacturer-owned outlets 11 10 11 9Warehouse clubs 0 0 2 6Mass merchandisers 28 24 16 12Large tire chains 4 2 12 23Other 3 6 5 4Total 100% 100% 100% 100%
Relative PriceIndex, 1991
Sales of Private LabelTires as a Percent of
Retail Sales Dollars, 1991
Garages/service stations 110% 57%Small independent tire dealers 100 36Manufacturer-owned outlets 107 16Warehouse clubs 80 8Mass merchandisers 97 34Large tire chains 90 54Other N/A 59
Source: Company records
Note: Relative price index indicates typical retail prices for the same tire in each channel. Retail prices in “other” categoryvaried according to the specific outlet.

31Harvard Business School Marketing Cases
Goodyear: The Aquatred Launch (Condensed)
Case © The McGraw−Hill Companies, 2001
Goodyear: The Aquatred Launch (Condensed) 500-039
11
Exhibit 3 Tire Dealers’ Bill of Rights
“Tire dealers as independent business people have earned the right to the respect of all otherfacets of the tire, retreading, and auto service industries since it has long been established that theyfulfill the role as the most important channel of tire distribution. . . .
Tire dealers expect to give loyalty to, and receive loyalty from their manufacturers; to betreated like valued customers; and to be encouraged to sell to end users without direct competitionfrom their manufacturers. Independent tire dealers have a right to the uninhibited exercise of theirability to increase their market share with the cooperation of their manufacturers. . . .
Tire dealers have a right to expect reasonable and timely communications from, and whereappropriate, consultation with their manufacturers on actions taken by the manufacturers whichdirectly affect independent tire dealers and their customers. . . .
Independent tire dealers have the right to expect their manufacturers to pay careful attentionto supply and demand, pursuing neither to excess, and to keep the dealer supplied in a timelyfashion with high quality products which will allow the dealer to sell and serve the customerproperly. . . .
Independent dealers have a right to a level playing field including the availability of tirelines, pricing, terms, and programs equal to those offered to wholesale clubs, discounters, company-owned stores, mass merchandisers, chains, and other forms of competition. . . .
Tire manufacturers should recognize the need for profits, not only for themselves, but alsofor the independent tire dealer who performs the major distribution function for them. . . .
Independent tire dealers have a right to the timely, proper, and uniform issuance of creditsfor advertising, national account sales, return goods, adjustments, and any other money due. . . .
Independent tire dealers . . . have a right to expect that the manufacturer will use the networkof independent tire dealers as the first step for expansion, increasing the dealers’ market share; andthat commitments made are commitments kept.”
Source: Adapted from Tire Business.

32 Harvard Business School Marketing Cases
Goodyear: The Aquatred Launch (Condensed)
Case © The McGraw−Hill Companies, 2001
500-039 Goodyear: The Aquatred Launch (Condensed)
12
Exhibit 4 Brand Image of Major Tire Manufacturers, 1991
A survey of broad-line tire owners asked what brand of tires the owners intended to buy thenext time they needed tires. Results are reported below for the five major brands and for the fourmajor consumer segments.
Intent to Buy for Major Consumer Segments
AllBuyers
Value-Conscious
Buyers
Quality-Conscious
Buyers
Price-FocusedBuyers
Goodyear 15% 17% 15% 14%
Michelin 15 25 26 7
Other 19 19 24 17
Uncommitted 51 39 35 62
Source: Company records
Exhibit 5 Switching Among Tire Brands, 1991
Brand Bought
Brand Replaced Bridgestone Firestone Goodyear MichelinMinor
BrandsPrivateLabel Total
Bridgestone 29% 4% 8% 8% 7% 43% 100%
Firestone 2 27 11 6 7 45 100
Goodyear 2 5 39 5 9 38 100
Michelin 3 3 7 44 6 36 100
Minor brands 2 4 10 7 32 42 100
Private label 2 5 8 5 7 70 100
Source: Company records
Note: The above chart can be read as follows: Four percent of car owners with Bridgestone tires bought Firestone tires toreplace the Bridgestone.

33Harvard Business School Marketing Cases
Goodyear: The Aquatred Launch (Condensed)
Case © The McGraw−Hill Companies, 2001
Goodyear: The Aquatred Launch (Condensed) 500-039
13
Exhibit 6 Results of Mystery Shopping in Aquatred Test Market
A male mystery shopper visited nine independent Goodyear outlets in the Aquatred testmarket during October 1991. The mystery shopper told the staff in each outlet that his wife neededtires for her Plymouth Voyager. In the sales presentations that followed:
Eight of the nine salespersons mentioned the Aquatred during their presentations. Of thoseeight, five began their presentation with the Aquatred and three finished with the Aquatred.
Three salespeople made specific claims concerning the Aquatred’s superior performance inwet traction. One claimed the Aquatred was 15% better than other tires; another claimed 20%-25%;and a third claimed up to 35% better traction with the Aquatred.
Goodyear’s suggested retail prices for the Aquatred were $89.95 with a black sidewall, and$93.95 with a white sidewall. Prices quoted by six outlets were as follows:
StoreNumber
Price withBlack Sidewall
Price withWhite Sidewall
1 $79.95 $79.952 81.95 81.953 80.00 83.004 85.00 85.005 85.00 88.006 100.00 100.00
Source: Company records

34 Harvard Business School Marketing Cases
MD Motors Case © The McGraw−Hill Companies, 2001
HKU034
Maria J. Cascales prepared this case under the supervision of Prof. Julie Yu of The Chinese University of Hong Kongfor class discussion. This case is not intended to show effective or ineffective handling of decision or businessprocesses.
This case is part of a project funded by a teaching development grant from the University Grants Committee (UGC) ofHong Kong.
Copyright 1999 The University of Hong Kong. No part of this publication may be reproduced or transmitted in anyform or by any means - electronic, mechanical, photocopying, recording, or otherwise (including the Internet) - withoutthe permission of The University of Hong Kong.
Ref. 99/43C
1
MD Motors
In late July 1998, Mr. Holger Gossmann, Managing Director of MD Motors, was both surprisedand concerned. He had just learned that although Volkswagen AG had recently bought Rolls-Royce Motor Cars Limited in the United Kingdom, Bayerische Motoren Werke AG in Germanyhad acquired exclusive rights to the Rolls-Royce brand name. In the future, MD Motors, theexclusive agent in Hong Kong for Rolls-Royce and Bentley motor cars, faced the possibility thatit would no longer be able to market the Rolls-Royce brand, with its imposing radiator grille andelegant Flying Lady hood ornament. Mr. Gossmann knew he would have to carefully develop anew strategic marketing plan to reposition MD Motors.
The Luxury Car MarketThe market for luxury and so-called near-luxury cars peaked in 1986, when 1.6 million units weresold worldwide.1 Although the market underwent a downward adjustment in subsequent years,sales began to rebound in the late 1990s. The resurgence was attributed to baby boomers whowere entering their affluent years. “They love to spend their money on luxury goods … thestrongest-selling vehicles are the higher-priced models”, said the Managing Director of oneautomotive marketing consultancy firm.2 The strength of the North American and Europeaneconomies also helped. The US alone was the largest luxury car market in the world.
The near-luxury segment of the industry was classified as cars with price tags of betweenUS$25,000 and US$35,000, while cars in the high-end luxury segment were priced aboveUS$35,000.3 Players in the latter category included Ferrari, Jaguar, Lamborghini, Mercedes-Benz, Porsche, Rolls-Royce and Bentley.
Overall, sales of the near-luxury segment fared better than those of the high-end segment. Apartfrom being cheaper, cars at the lower end of the market were considered less ostentatious incountries such as the US. Nevertheless, cars in both segments of the market offered consumers a
1 Candler, J., “Automobiles”, Nation’s Business, November 1994, Vol. 82, Issue 11, p. 57.2 Candler, J., “1999 Luxury Cars: Wheels of Progress”, Nation’s Business, November 1994, Vol. 86, Issue 11, p. 572.3 US$1=HK$7.74.

35Harvard Business School Marketing Cases
MD Motors Case © The McGraw−Hill Companies, 2001
99/43C MD Motors
2
quiet ride, immense power, subtle shifting, maximum comfort, reliability and increasinglysophisticated gadgetry.
In response to the boom in the luxury car market, many players wanted to participate in the actionby introducing new models. In 1998, Jaguar introduced its first mid-sized luxury car in 30 years,the S-type saloon. It planned to launch another smaller model in the year 2001, called the X400,in order to achieve an overall annual sales target of 200,000 units. Mercedes-Benz also had plansto introduce an all-new line of super-luxury products, called the Maybach. The Maybach wastentatively priced at above US$150,000, making it the most expensive Mercedes to date.
���������
Luxury cars had always been popular in Hong Kong. This was exemplified by the fact that thecity had the second highest Mercedes-Benz market share in the world. At the beginning of 1998,there were more than 30,000 Mercedes on Hong Kong’s roads. Percentage-wise they formed alarger proportion of the private car market than in Germany, the car-maker’s home country.4
������������������
Unlike some Asian countries such as Korea, Hong Kong had no assembly plants or carmanufacturers of its own. All the cars on the streets of the city were imported, mainly from Japanand Europe. European cars tended to be targeted at the higher end of the market, whereas mostJapanese cars were aimed at the lower end. US cars were not very popular among the localpopulation. All motor cars were represented by sole agents or local distributors, with no majorcapital investment from car manufacturers.
By the end of 1997, out of a total population of more than six million, there were 1,142,226licensed drivers. The total number of licensed private cars was 314,833.5 In 1997, a total of53,584 vehicles were sold in Hong Kong, 38,899 of which were private cars (excluding taxis).Luxury automobiles (including near-luxury and high-end segments) made up 7% of the privatemarket figure.6
��������������������
Due to the Government’s long-standing non-interventionist policy, the passenger car market inHong Kong was relatively free. The measures that the Government did take were primarilyaimed at limiting the number of vehicles on the road. In 1994, for example, the authoritieschanged the first registration tax policy from one based on factory costs to one based onpublished retail prices. The tax rate on new vehicles ranged from 40% for the lower end of themarket to 60% for cars with a taxable value exceeding HK$300,000.
�����������
But Government regulations did not affect car sales as much as did the state of Hong Kong’seconomy, since the local population bought vehicles more for pleasure than for convenience ornecessity. Hong Kong had one of the world’s most comprehensive and efficient masstransportation systems, thus owning a private car was not essential to the general public. Tomany, car ownership served mainly as a reflection of their social status.
4 URL: http://www.hkta.org/superlatives/transport.html, March 1999.5 URL: http://search1.info.gov.hk/search9…+Center&textentry=car+registration, August 1998.6 Motor Trade Association report, January 1999.

36 Harvard Business School Marketing Cases
MD Motors Case © The McGraw−Hill Companies, 2001
99/43C MD Motors
3
Throughout much of the 1980s and early 1990s, the economy had been robust. For the six yearsprior to 1998, Hong Kong’s GDP growth rate had ranged between 3.9 per cent and 6.3 per cent.7
Per capita GDP had risen steadily and in 1997 stood at US$26,614.8 This gave Hong Kong one ofthe highest per capita GDP levels in Asia, after Japan. It also surpassed that of a number ofindustrialised economies such as the UK, Canada and Australia. A growing economy meant thatconsumers had higher disposable income levels and were more willing to spend. Consequently,sales of big-ticket items such as cars benefitted from Hong Kong’s financial health.
But the Asian financial crisis caused the economy to enter a slump in 1998. For the first time inover two decades, the city was forecast to record negative GDP growth. As a result of this, whilecar sales in Europe and the US rose, those in Hong Kong fell. Total vehicle sales dropped from24,358 in the first six months of 1997 to 21,574 in the first six months of 1998. Only 15,692passenger cars were sold, compared with 18,092 in the first half of the previous year, a decline ofabout 13 per cent. Luxury cars fared worse. Unit sales in that segment fell some 30 per cent,from 1,349 to 950.9 As a percentage of the overall passenger car market, however, the sales ofluxury cars remained relatively stable.
Even though Hong Kong had one of the lowest private car ownership ratios among developedcountries, it boasted the highest per capita ownership of Rolls-Royce motor cars in the world.One of Hong Kong’s most prestigious hotels, The Peninsula, was the world’s largest operator of aRolls-Royce fleet. It had nine of them, including the classic antique Silver Dawn model. InSeptember 1991, Hong Kong was chosen as the venue for the world’s longest parade of Rolls-Royce motor cars, with 114 cars in a charity fund-raising procession.
�������
As the sole agent for Rolls-Royce and Bentley motor cars in Hong Kong, MD Motors was adivision of Inchcape plc, a UK-based international service and marketing group. In Hong Kong,Inchcape Motors International distributed a wide range of brands, from budget Japanese sedans tohigh-end luxury cars, through five sister companies. On a worldwide scale, Inchcape was thelargest independent importer/distributor and retailer of motor vehicles, with sales of over 350,000cars a year in over 33 countries. Within this network, only MD Motors distributed Rolls-Royceand Bentley motor cars.
As part of the giant Inchcape group, MD Motors was one of the oldest motor trading companiesin Hong Kong. The dealership was originally called Metro Dodwell Motors, but changes in thecorporate structure led the Company to be simply known as MD Motors. Throughout its history,the dealership had handled a number of luxury British brands, including Jaguar, Rover and LandRover. Once these cars reached critical mass, however, separate subsidiaries were set up for themwithin the Inchcape group, such as Jaguar Hong Kong and Rover Hong Kong. As of July 1998,the Company also had the rights to distribute Aston Martins, but the car was generally not wellreceived in the Hong Kong market. There were plans to drop the brand and rely primarily on theRolls-Royce and Bentley motor cars, which formed the bulk of the Company’s revenue.
MD Motors was located in Wan Chai, a fifteen-minute walk from Central – Hong Kong’sbusiness centre. A giant version of the Flying Lady mascot adorned the window of theshowroom, which faced onto the busy Gloucester Road. Surrounded by mirrors and with soft
7 GDP at constant (1990) market prices. URL: http://www.info.gov.hk/hkbi/enghkbi/4/4-4a.htm, March 1999.8 Per capita GDP at current market prices. URL: http:// www.info.gov.hk/hkbi/enghkbi/4/4-5a.htm, March 1999.9 Motor Trade Association report, January 1999.

37Harvard Business School Marketing Cases
MD Motors Case © The McGraw−Hill Companies, 2001
99/43C MD Motors
4
music playing in the background, the 1,486 square foot showroom proudly displayed the latestRolls-Royce and Bentley models. The area also housed a number of other car dealers, includingJaguar, Toyota and Peugeot.
Since 1996, Rolls-Royce Motor Cars Limited had been urging its dealers around the world toredecorate their showrooms in order to achieve a standardised global retail environment. Thisstandardised look involved two distinct spheres, one for Rolls-Royce and another for Bentley.The showroom environment was meant to create an unforgettable experience for the customerwhere Rolls-Royce and Bentley would be clearly differentiated through design, textures andheritage references.
Although Rolls-Royce Motor Cars Limited expected the new corporate look to be installed by allits dealers, it was not prepared to extend any financial assistance. For the comparatively smallHong Kong showroom, the renovation exercise was expected to cost approximately HK$3million. To make matters worse, because the new design was so elaborate and because of theconfined space of the Hong Kong outlet, after the proposed renovation, Mr. Gossmann could onlyexpect to display two cars. This, coupled with other technicalities such as the upcoming expiry ofthe showroom lease agreement, led MD Motors to postpone the plans for renovation.
With the renewal of the two-year lease in July 1998 and after extensive discussions with theofficially appointed architect to make the remodelled showroom less cramped, Mr. Gossmanndecided to follow the lead of key worldwide dealers, and signed a GB£35,000 contract,committing his Company to the refurbishment. 10
MD Motors remained a very profitable Company throughout the 1990s, even though sales diddrop off from a record set in 1993. As of the end of 1997, MD Motors controlled a small buthighly profitable 2.4% of the luxury car market in Hong Kong, behind other luxury brands suchas Mercedes, BMW and Lexus.11
Much of its profit was attributable to Rolls-Royce motor cars, which had achieved significantbrand recognition in Hong Kong. Although Mr. Gossmann had the foresight to build upBentley’s market share in Hong Kong, Rolls-Royce remained the dealership’s star attraction. Thebreakdown of Rolls-Royce to Bentley sales had gradually shifted from about 90:10 in 1993 to50:50 in 1997. A year later, however, the trend reverted back to 65:35 in favour of Rolls-Royce.
�����������������������
Both Rolls-Royce and Bentley were manufactured by Rolls-Royce Motor Cars Limited. Thecompany evolved from a partnership established between Henry Royce and the Hon. CharlesRolls in the beginning of the 1900s. Engineer Royce strongly believed in the need for quality.
Small things make perfection, but perfection is no small thing … the qualityremains long after the price is forgotten.
- Henry Royce, Rolls-Royce co-founder12
With the outbreak of World War I, the company branched out to design and manufacture aero-engines as well. Its success allowed it to acquire Bentley Motors in 1931. Bentley had an
10 GB£1=US$1.644; GB£1=HK$12.74.11 Motor Trade Association report, January 1999.12 URL: http://www.rolls-royceandbentley.co.uk/rolls/founder.html, March 1999.
38 Harvard Business School Marketing Cases
MD Motors Case © The McGraw−Hill Companies, 2001
99/43C MD Motors
5
established reputation for speed and endurance, and the marque was inextricably linked to the 24-hour races at Le Mans, where it picked up numerous awards. Since 1931, both Rolls-Royce andBentley motor cars had been manufactured side-by-side.
In the 1960s, the Rolls-Royce firm encountered financial difficulties associated with thedevelopment of a new jet engine, and was subsequently taken over by the UK Government in1971. The motor car division was separated from the jet engine division and refloated as adistinct entity. Following the injection of hundreds of millions of pound sterling of state aid andthe success of several engine models, the aerospace manufacturer returned to the private sector in1987 and was known as Rolls-Royce plc. The separated automobile company, Rolls-RoyceMotor Cars Limited, was subsequently acquired by Vickers plc. Vickers was an engineeringcompany with a wide variety of interests, including marine propulsion, turbine components,medical systems and defence systems.
Over the years, the Rolls-Royce brand of cars became synonymous with quality, attention todetail, prestige and exclusivity. The cars were instantly distinguishable by their two interlocking“R” logo, imposing radiator grille and Flying Lady mascot. The mascot, also known as the Spiritof Ecstasy, had adorned the cars since 1911. The figurine was termed “a romantic representationof elegance and craftmanship” and was one of the world’s most recognised car mascots. 13
Rolls-Royce motor cars were manufactured at Crewe, in northwest England, by a group ofengineers and craftsmen who endeavoured to produce cars that met the needs and tastes ofindividual owners. Each Rolls-Royce was a combination of precision, technology and traditionalcraftsmanship.
Over the years a number of different models had been produced, including the Phantom series,Silver Dawn, Silver Cloud, Silver Shadow, Silver Spirit, Silver Spur and Park Ward. As atestament to their durability and reliability, about 75 per cent of all cars ever manufactured werestill on the road.
Unlike the Rolls-Royce, which was a symbol of grace and stature, the Bentley was designed toinspire enthusiasm. The car was not only to be admired, but to be driven with passion. From itsracing car heritage, Bentley was known for its speed and dynamism. The Bentley wings thatadorned each car embodied the marque’s sporting past and the power associated with it.
In 1952, the Bentley R-Type Continental was introduced, and became the world’s fastest four-seater motor car of its time. Subsequent improvements throughout the years came with thelaunch of the S and T series. In the 1980s and 1990s, the Turbo R, Continental R, Azure,Continental T and Brooklands saloon enlarged Bentley’s repertoire. The Bentley Continental Taccelerated from zero to 60 mph in 5.7 seconds and had a top speed of 170 mph – the highestrecorded figure for a production motor car.
������ ��
The 1990s was known as the decade for mergers, and the car industry was no exception to thistrend. The grapevine was saturated with news of actual or expected tie-ups. It made sense for carmanufacturers to join forces in order to spread the research and development, manufacturing andmarketing costs. The largest transnational industrial deal in history occurred in May 1998, whenDaimler-Benz AG announced it would merge with Chrysler Corporation for US$39 billion. The 13 URL: http://www.rolls-royceandbentley.co.uk/rolls/marque.html, March 1999.

39Harvard Business School Marketing Cases
MD Motors Case © The McGraw−Hill Companies, 2001
99/43C MD Motors
6
combination of two of the most profitable automobile companies effectively made the new entitythe world’s fifth-largest automobile maker.
Volkswagen AG (VW) was another player with a number of makes under its umbrella, includingBugatti and Lamborghini. It had plans to substantially increase production of the latter anddevelop the brand into an alternative to Ferrari. A smaller Lamborghini, powered by an Audiengine, was reputed to be on the drawing boards. Rumours circulated that VW would enlarge itsrepertoire by moving into the heavy goods market by acquiring Renault or Scania.
Saab, another European manufacturer, had for years been under the effective control of GeneralMotors, while Ford owned Jaguar and Aston Martin as well as a substantial stake in Mazda. Itwas reported that Volvo would soon be added to Ford’s collection of brands. Bayerische MotorenWerke AG (BMW) had Rover under its wing, and speculation abounded that it would tie-up withFiat, although the rumour was subsequently denied.14 The giant Fiat group controlled AlfaRomeo, Ferrari and Maserati.
Every major car manufacturer was said to be engaged in talks with other industry playersregarding a merger, acquisition or partnership. Being big was obviously the order of the day, or –as was the case – the decade. Size facilitated competition on a global level and enabledcorporations to benefit from higher economies of scale that would not normally be possible for anindependent company.
Competition in the luxury market was growing increasingly intense; manufacturers no longerintended to politely share the market, but were aggressively moving into each other’s traditionalterritories. The bottom line fuelled this push. Provided a manufacturer was successful, themargins to be gained in this market were significantly higher than in other segments. In thisrespect, the merger mania that had gripped the industry helped because, by nature of theirexclusive image, luxury cars usually only sold on a small scale but building them involved highfixed costs. Typically, these costs were drastically reduced when a small niche brand was takenover by a big company.
���������������������������������������
Not to be left behind by the trend of introducing new models in the luxury car market, Rolls-Royce launched the Silver Seraph in early 1998 – its first all-new Rolls-Royce motor car in nearlytwo decades. The new car had a V12 engine and was the most technically advanced car built bythe company. It was, however, relatively smaller than the spacious Silver Spur it replaced andhad less torque than the traditional Rolls-Royce.
Similarly, in the same year, Bentley introduced a new model called the Arnage. The new car waspowered by a twin turbocharged V8 engine, and replaced the Brooklands and Turbo R models,which had ceased production at the end of 1997.
Apart from ushering in new makes of both brands, Rolls-Royce Motor Cars Limited alsoupgraded its factory in Crewe, with the inclusion of its first moving assembly line, advanced paintand wood facilities, as well as new technology. The main objective of the revamp was to increasemanufacturing flexibility in accordance with the modern “lean” philosophy and yet integrate itwith the traditional levels of craftsmanship and attention to detail expected from both brands.
14 Anonymous, “Fiat Goes Shopping”, ��� �������, 11 July, 1998.

40 Harvard Business School Marketing Cases
MD Motors Case © The McGraw−Hill Companies, 2001
99/43C MD Motors
7
Production time was expected to be cut from 800 to 400 man-hours per car, which was still veryhigh compared with a European mass-production standard of 25.15
�!!��������
Despite the innovation, the cut-throat automotive industry made it very difficult for low-volumeluxury car makers to survive. The takeover of niche producers such as Ferrari, Maserati andJaguar by mass producers provided proof. Rolls-Royce Motor Cars Limited was not immune tothis phenomenon. The company faced severe financial problems in the early 1990s when a sharprecession hit the UK, one of its primary markets. While costs ballooned, turnover slumped.From a high of 3,333 units in 1990, only 1,350 cars were sold in 1993.16 The estimated loss toVickers, its parent company, for 1991 and 1992 combined was GB£100 million. Since then, theluxury car maker witnessed a gradual recovery, with sales of 1,414, 1,556 and 1,744 units for1994, 1995 and 1996, respectively.17
The company, whose earnings fluctuated widely, was estimated to have only made US$45million in profit in 1996. On sales of approximately US$400 million that was a good margin, butit was still not enough for Vickers. The near US$320 million that Rolls-Royce Motor CarsLimited had spent on modernising its plant and developing new models was almost tripleVickers’ group profit of US$135 million.18
As one commentator put it, the car maker formed a “drain on what was an otherwise profitableengineering group”.19 Vickers plc seemed to concur. A spokesperson announced that the groupcould not devote the necessary research and development costs that Rolls-Royce Motor CarsLimited required, as it would dilute the resources of the rest of its core businesses. In October1997, in a move that surprised many analysts by its timing – ahead of the launch of the SilverSeraph – Vickers announced its intention to sell the company. This was in accordance with itsplans to streamline its range of operations. The previous month, the group had announcedmeasures to divest itself of its medical products division.
���������������������������� ��������
Some of the world’s biggest automobile makers were said to be interested in making the elitecompany their own, including Daimler-Benz and Ford, but ultimately the contest was foughtbetween BMW and VW. BMW was heavily favoured, as it had a long-standing relationship withthe company and was the supplier of the engines for the new Rolls-Royce Silver Seraph andBentley Arnage.
�����������
���
Although BMW did not share the same cachet as Mercedes-Benz, the automobile makerproduced luxury cars that were very well accepted in the US, Europe and Asia. In order tostrengthen and broaden its position in the luxury car niche, BMW’s Chief Executive BerndPischetsrieder wanted to boost the company’s image. Mr. Pischetsrieder was an engineer who
15 Reed, S., and Woodruff, D., “A Gamble as Big as a Rolls”, � ���������19 January, 1998.16 Rose, M., “Rolls-Royce Goes on the Block; Analysts Bet on a BMW Purchase”, ���������������������� ����, 28 October, 1997.17 Ibid.18 Reed, S., and Woodruff, D., “A Gamble as Big as a Rolls”, � �������, 19 January, 1998.19 Anonymous, “Spirit of Agony”, ��� �������, 14 December, 1991.

41Harvard Business School Marketing Cases
MD Motors Case © The McGraw−Hill Companies, 2001
99/43C MD Motors
8
had worked his way up through the manufacturing ranks. He had previously been criticised fornot being aggressive enough. Although BMW had resisted merging with other carmanufacturers, in 1995 it acquired the Rover Group, which had been struggling for nearly twodecades. Mr. Pischetsrieder envisioned Rover as a second line of upscale cars, which would addthe British traditional sense of styling to BMW’s high-tech repertoire. The acquisition was adisappointment, however, and although losses were narrowing, a profit contribution was notexpected until 2003.20 Mr. Pischetsrieder hoped the tentative Rolls-Royce purchase would provemore auspicious. BMW bid GB£340 million for the British company.
��
VW was Europe’s biggest car maker. It produced more than four million cars a year, comparedto BMW’s one million. Chief Executive Ferdinand Piëch, the grandson of the company’sfounder, had plans to turn VW into the world’s largest and most successful car company. Hislong-term aim was to move VW into the upscale ranks of the automotive industry, achieveacross-the-board worldwide brand recognition, as well as make inroads into the heavy trucks andlight vehicles markets. It already had a number of brands under its control, including Seat, aSpanish firm that VW took over in the 1980s, and Skoda, a Czech car maker it bought in 1991.In the higher end of the market it had Audi, Lamborghini and Bugatti. In June 1998, VW alsoannounced a deal to develop a luxury sports utility vehicle with Porsche. However, the pragmaticiron-willed Mr. Piëch wanted more. He wanted to distance VW from its image as “the people’scar” and develop it into a brand with “a Mercedes-like reputation and Mercedes-like margins”.21
VW maintained a fierce rivalry with Daimler-Benz, which had moved into VW’s traditionalterritory – the production of moderately priced cars – by merging with Chrysler. To this end, Mr.Piëch set his sights on acquiring Rolls-Royce Motor Cars Limited and offered GB£430 million,significantly higher than BMW’s bid, for the company.
����"���
Even though a number of small shareholders were against the sale, on 5 June, 1998, the majorityof Vickers’ owners, principally institutional investors, voted overwhelmingly in favour of a VWtakeover. Even though the price VW paid for Rolls-Royce Motor Cars Limited was nearly threetimes the latter’s net tangible asset value of GB£149 million, it was still considered a cheaperalternative than developing a new line. VW Chief Executive Piëch was said to have beendelighted with the deal.
The same could not be said for Mr. Pischetsrieder. He proclaimed that the whole auction processwas “distasteful” and said Vickers had sold Rolls-Royce Motor Cars Limited “like fake Persiancarpets manufactured in India”.22 BMW threatened to stop supplying engines for the Rolls-RoyceSilver Seraph and Bentley Arnage when its contract ran out in July 1999. In order to neutralisethis threat, VW agreed to purchase UK engine maker Cosworth for nearly GB£120 million.Cosworth was part of the Vickers group and had an international reputation for advancedautomotive engine technology. It was involved in racing, engineering, casting andmanufacturing. But as it turned out, BMW was not to be outdone. The story was not yet over.
20 Anonymous, “Face Value. The Maverick of Munich”, ��� �������, 30 January, 1999.21 Woodruff, D., “Is VW Revving Too High?”, � �������, 30 March, 1998.22 Diem, W., “BMW Gains Rolls-Royce Brand After All”, � �����������, 3 August, 1998.

42 Harvard Business School Marketing Cases
MD Motors Case © The McGraw−Hill Companies, 2001
99/43C MD Motors
9
����#���������
Despite the GB£430 million that changed hands, VW still did not control the Rolls-Royce brandname. The agreement governing Rolls-Royce’s split in the 1970s gave Rolls-Royce Motor CarsLimited full rights to everything that was not directly related to the Rolls-Royce name and aero-engine business. This included the Flying Lady mascot, the distinctive Rolls-Royce radiatorgrille, the Bentley brand name and the winged Bentley “B” radiator badge. Rolls-Royce plc,however, retained control over the Rolls-Royce brand name and logo, even though it had noholding in the automobile maker. The aerospace company also had the right to veto the purchaseof the car manufacturer by parties of which it did not approve.
We attach the greatest importance to the preservation and protection of the Rolls-Royce name and trademark as key assets of our business, and we’ll take whateveraction is necessary and appropriate.
- Rolls-Royce plc spokesman Martin Brodie23
VW thus faced a situation where Rolls-Royce plc could theoretically refuse to allow anautomobile that came out of the Crewe factory to be called a Rolls-Royce despite its readilydistinguishable features. To complicate matters further, Rolls-Royce plc, headed by ChairmanSir Ralph Robins, had a long-standing relationship with BMW. The two were partners in an aero-engine joint venture. Sir Ralph had also played a large role in ensuring the Rolls-Royce SilverSeraph would be powered by a BMW, instead of a Mercedes, engine.
����#�����$������
Approximately one month after the VW deal with Vickers, Rolls-Royce plc struck an agreementwith BMW. In what was termed the coup of the decade by � �����������, BMW acquired thebrand name rights to the prestigious luxury car that epitomised British craftsmanship for GB£40million. On 28 July, 1998, in order to avoid a potentially disastrous protracted legal wrangle, thetwo nemeses – BMW and VW – reached a compromise.
BMW agreed to license the rights to the Rolls-Royce brand free-of-charge to VW until 31December, 2002, and resolved to continue supplying engines and other components for the SilverSeraph and Arnage models in the meantime. As of 2003, BMW would take control of theproduction of Rolls-Royce and establish a separate factory in England, while VW would continueto produce Bentley in Crewe. Both companies said they would jointly use the existing dealernetwork at least through the year 2003. They also maintained that both brands would retain theirBritish image despite their German ownership.
The final outcome seemed to have pleased all the parties involved. Although considerably lesscheerful than BMW’s Pischetsrieder, VW Chief Executive Piëch said he was content with just theBentley name, even though he would have liked to own the Rolls-Royce name as well.
VW planned to launch a new range of smaller lower-priced Bentley models in 2002 or 2003 tocompete against top-of-the-range Mercedes and BMW models. The projected production figurefor the new car alone was reported to be 7,000.24 BMW also said it hoped to triple the yearlyRolls-Royce sales figure to 6,000 cars by expanding the number of models and including asmaller version of the vehicle, based on an existing BMW.25 But most observers agreed that of
23 Anonymous, “Volkswagen Completes Rolls-Royce Purchase”, ���������������������� ����, 6 July, 1998.24 Diem, W., “BMW Gains Rolls-Royce Brand After All”, � �����������, 3 August, 1998.25 Mitchener, B., “Super-Luxury Market Lures Auto Makers”, ���������������������� ����, 31 March, 1998.

43Harvard Business School Marketing Cases
MD Motors Case © The McGraw−Hill Companies, 2001
99/43C MD Motors
10
the two, Bentley represented greater growth potential. The brand had been easily outselling theRolls-Royce marque in the worldwide market for years. In 1997, Bentley accounted for about 60per cent of the 1,918 cars sold by Rolls-Royce Motor Cars Limited.26
������ ������� ���
Most of Rolls-Royce’s dealers around the world were reportedly pleased that the two luxurybrands had been sold to leading German companies whose primary business was building andselling cars. But in places such as Hong Kong, where the Rolls-Royce brand was such a popularone, the implications for the Dealership’s business were more troubling.
MD Motors, as the local importer/distributor and retailer of Rolls-Royce, couldpotentially be losing the bread and butter of its business.
- MD Motors Managing Director Holger Gossmann27
Mr Holger Gossmann was at the helm of a 48-member team [see ���������]. As a self-describedmotor enthusiast, Mr. Gossmann had nearly 30 years’ experience in the luxury car market. Aftercompleting his studies in Germany, he began his career as a sales representative for 3MCorporation and was transferred to Hawaii in 1969. Once there, he decided to explore newopportunities and joined a BMW dealership. In the 1970s and 1980s he made a name for himselfby building up the sales team until it achieved the best per capita sales in the US. In 1989, Mr.Gossmann moved to Hong Kong, and in the following year joined Inchcape’s Jaguar division.His success in establishing a new sales office for the luxury brand and in boosting sales soon ledMr. Gossmann to be promoted to General Manager of MD Motors and subsequently to ManagingDirector.
�����������
Selling a car as prestigious as Rolls-Royce and Bentley is vastly different fromselling any other make. We have to respond to our customers’ needs and desiresfar more than we would in any other franchise. Our customers expect a differentlevel of service; they demand special attention, which I believe is unique to MDMotors.
- MD Motors Managing Director Holger Gossmann28
This “special attention” was translated in a variety of ways. First, each Rolls-Royce and Bentleycould be specially commissioned to fit an owner’s specifications. Mr. Gossmann recalled onecustomer who wanted a fully functional office in the back of his Rolls-Royce, complete withtelephone, facsimile and photocopier. The time-honoured skills and state-of-the-art technologyavailable at the Crewe factory meant that nothing in the manufacture of a Rolls-Royce or Bentleywas routine.
Second, Mr. Gossmann believed in maintaining strong personal relationships with existing andpotential customers. The factory’s motto, “Made for me, by people I know, and who know me”,was the message each MD Motors’ customer was meant to receive. In practice this strategy wasvital because a Rolls-Royce was very durable – and, not to mention, expensive – hence the actualnumber of units sold was relatively low. Having close contacts with his existing clientele meantthat the latter could be more easily persuaded to upgrade their cars to newer models or persuade
26 Ibid.27 Interview with Mr. Gossmann on 5 March, 1999.28 Anonymous, “The Ideal Dealer”, �������, Issue 5/6, November 1994.

44 Harvard Business School Marketing Cases
MD Motors Case © The McGraw−Hill Companies, 2001
99/43C MD Motors
11
their friends to do the same. The Company had two trade-in programmes: the “Recycling”Campaign, in which an old Rolls-Royce or Bentley could be exchanged for a newer model, andthe “Conquest” Campaign, whereby any brand could be traded in for these luxury cars. Ifcustomers perceived the personal touch Mr. Gossmann tried to convey, they were also morelikely to service and repair their cars with MD Motors.
�%��������&!����"�����"������
Most companies in the automotive industry were traditionally structured into three distinctdivisions, i.e., sales, service and parts, but at MD Motors there were only two. The service andparts departments, which served as customers for each other, were merged together to form theafter-sales division, which complemented the sales operations.
After-sales service make up the meat and potatoes or, in Hong Kong, the rice –the substance of daily needs – while sales is the gravy.
- MD Motors Managing Director Holger Gossmann29
Mr. Gossmann was a strong believer in providing excellent after-sales service (maintaining,repairing and reconditioning cars). Located at the Rolls-Royce and Bentley service facility inAberdeen, Hong Kong’s redeveloped ancient fishing port, was a team of dedicated andprofessional technicians who were specially trained to service the two prestigious brands to thehighest possible standards using only genuine Rolls-Royce parts. Every car sold by MD Motorscarried a three-year unlimited mileage warranty, as well as a three-year exclusive maintenancepackage.
Never one to be complacent, Mr. Gossmann kept close track of customer satisfaction throughquarterly surveys. Customers were asked to rate the Company’s sales and after-sales service.The results were then monitored to see where improvements could be made. This was anextension of MD Motors’ corporate motto: “We know what drives you”.
Mr. Gossmann’s strategy was an apparent success and customers seemed to be very pleased withwhat they were driving. In 1993, the dealership won the Rolls-Royce Largest Single Point Dealerworldwide award. MD Motors sold no fewer than 94 Rolls-Royce and Bentley motor cars thatyear, more than other dealers in places such as New York and London. In recognition of thisachievement, Mr. Gossmann was presented with a commemorative plaque by the Director ofOverseas Operations for Rolls-Royce, Nigel Cornelius, who said the record was “a quiteoutstanding achievement for any dealer, but especially in a place the size of Hong Kong”.30
MD Motors received another distinction on 9 July, 1998, when it became the first luxury cardistributor in Hong Kong to receive the coveted ISO9002 award. The certification was awardedfollowing a rigorous evaluation of the operation of all departments, managementprocedures/practices and the maintenance of certain provisions, all of which were designed toensure that a high degree of efficiency existed throughout the Company.
�������
As of July 1998, MD Motors had six products to offer to its customers: two Rolls-Royce models– Silver Seraph and Park Ward limousine; and four Bentley models – Arnage, Azure, ContinentalR and Continental T. The retail price for the Silver Seraph was HK$3.2 million while the low- 29 Interview with Mr. Gossmann on 5 March, 1999.30 Anonymous, “The Ideal Dealer”, �������, Issue 5/6, November 1994.

45Harvard Business School Marketing Cases
MD Motors Case © The McGraw−Hill Companies, 2001
99/43C MD Motors
12
end Bentley, the Arnage, was priced at HK$2.98 million and the high-end Continental T, HK$4.2million. These prices were inclusive of the 60% government registration tax.
The cars were sold by a team of three sales executives headed by Spanser Lam, who had beenwith the Inchcape group for more than 10 years. The executives usually followed up on enquiriesby arranging off-site meetings where they would take with them a briefcase featuring the differentwood, carpet and leather interior samples for the commissioning of each luxury car sold by MDMotors. Unlike most Western consumers, the majority of Rolls-Royce and Bentley buyers inHong Kong rarely visited the retail outlet and were not influenced by the showroom environment.The majority of deposits were taken in customers’ offices and/or homes.
���� ������
The marketing plan that MD Motors had in place to attract the buyers of both car brands reflectedtheir respective marque identities and the people who drove them. Rolls-Royce models wereperceived as enduring, reliable cars to be admired and respected. Most Rolls-Royce owners inHong Kong were either business tycoons, patriarchal figures in their 50s or younger self-mademillionaires who wanted a symbol of their success. Ninety per cent of Rolls-Royce motor carswere chauffeur-driven.
In order to build strong relationships with Rolls-Royce owners and would-be owners, MD Motorssponsored events such as the Rolls-Royce Master Series of concerts, held twice a year. Soloistsor ensembles were invited to perform before customers and prospects alike. The event served toprovide a classy atmosphere where Rolls-Royce owners would mingle, and where the Companycould give exposure to their latest products.
Because Rolls-Royce motor cars were mostly chauffeur-driven, MD Motors organised yearlytraining programmes for the drivers. Two-day instruction courses on how to handle the luxurycar were held in the Repulse Bay Hotel, and attendance levels were typically high. Catering todrivers’ needs was important to MD Motors as drivers often influenced owners’ decision-makingprocesses – i.e. the selection of car brands, models, accessories and service/repair outlets.
The Bentley, on the other hand, appealed more to the emotions rather than the intellect. It was amuch sportier car than Rolls-Royce, and appealed to a spirit of daring and adventure. LocalBentley owners were typically business professionals and entrepreneurs aged between 35 and 45,who preferred to drive the cars themselves. They tended to be well travelled and had a preferencefor being less ostentatious.
Since 1994, Mr. Gossmann had been trying to move the sales of Bentley into the fast lane. Hehad always believed that Bentley was a great product which should be sold with feeling. Theproblem, as he saw it, was that Asians were “not so much in touch with their feelings”.31 Bentleydid not enjoy the same level of prestige in the local market as did Rolls-Royce.
In order to cultivate an enthusiasts’ culture, a Hong Kong branch of the Bentley Drivers Club wasestablished. The Club, originally established in the UK by founder W.O. Bentley, had a historyof over 60 years and had about 2,900 members worldwide. Another event that was held toconvey Bentley’s exciting image was a high-speed race held on an airfield in Shek Kong. Localjournalists were invited to participate in the function and join in the fun.
31 Interview with Mr. Gossmann on 5 March, 1999.

46 Harvard Business School Marketing Cases
MD Motors Case © The McGraw−Hill Companies, 2001
99/43C MD Motors
13
Due to the exclusive nature of the two brands, advertising was primarily done in print and carriedin lifestyle magazines such as ������ and ������������ as well as business papers such as the�����������. The marque values of Rolls-Royce were enduring, grace, wisdom, endeavourand celebration. The message conveyed in the ads was one of calmness, relaxation and insight.This was exemplified in one print ad that prominently featured the Flying Lady against abackdrop of a calm blue sky with the copy: “In front of every great man there’s a woman”.Bentley’s marque values were certainty, passion, daring, glorious and thoroughbred. Themessage in the Bentley ads conveyed enthusiasm, character, power and dynamism. Publicity andmedia events for both brands were handled by Bentley Porter Novelli Limited.32
Rolls-Royce and Bentley owners also received free quarterly issues of the in-house magazine,� ���, which not only featured updates on the two brands but also articles on entertainment andleisure. For Internet-savvy Rolls-Royce and Bentley enthusiasts, MD Motors had its own websitewhere the latest news and promotional packages could be accessed.33
�����������
Following the slump in the local economy, Mr. Gossmann knew that the sales of his luxury carswould suffer. MD Motors had previously pursued a fixed pricing policy, which was notnegotiable. With the introduction of the new models, Mr. Gossmann had to decide whether tocontinue this pricing system, and had to develop new ideas to boost revenue.
In order to lower the overall cost of purchasing a car, some car buyers had turned to the “grey”market. The price of cars in this market was much lower than for comparable ones sold throughthe authorised distributors. “Grey” importers also offered some models and specifications thatwere not available through the traditional channels. The drawback was that consumers obtainedno warranties with such purchases, but for some consumers the price differential was worth therisk. To avoid erosion of MD Motors’ bottom line, methods to combat this trend had to be found.
According to the latest statistics in Mr. Gossmann’s possession, MD Motors’ total sales figurehad fallen by 43 per cent, from 65 cars in March 1997 to 37 a year later. Rolls-Royce once againproved to be the more popular brand; 24 Rolls-Royce motor cars were sold compared to 13 forBentley.
����������
The shift in the sales pattern was not an encouraging development, given that MD Motors mightsoon lose the right to distribute Rolls-Royce. MD Motors had a long history of re-inventing itselfand adapting to changes, both in its internal and external environments. Mr. Gossmann wasaware, however, that past success was no guarantee of future success, and 1998 marked a criticalpoint in MD Motors’ history. The Company was faced with a number of challenges, and itssurvival depended on how well they were handled.
32 No relation to the Bentley car brand name.33 http://www.inchcapemotors.com.hk/company/rr/mdmotors.htm

47Harvard Business School Marketing Cases
MD Motors Case © The McGraw−Hill Companies, 2001
99/43C MD Motors
14
!�"�"#�$
����%#%���%�&'("�'#"%('����'�#
�� ������������������������
������������� ��
Holger Gossmann
������������
Gloria Cheung
������������� ����!�������������
Spanser Lam�"���#������������
Daniel Choi
Service Department Parts Department

Harvard Business School Marketing Cases
Oscar Mayer: Strategic Marketing Planning
Case48 © The McGraw−Hill Companies, 2001
Harvard Business School 9-597-051Rev. March 20, 1998
Dan Kotchen, MBA '96 and Robert Drane, Lecturer at the University of Wisconsin-Madison, in collaboration withProfessor John A. Quelch prepared this case as the basis for class discussion rather than to illustrate either effective orineffective handling of an administrative situation.
Copyright © 1997 by the President and Fellows of Harvard College. To order copies or request permission toreproduce materials, call 1-800-545-7685 or write Harvard Business School Publishing, Boston, MA 02163. Nopart of this publication may be reproduced, stored in a retrieval system, used in a spreadsheet, or transmitted inany form or by any means—electronic, mechanical, photocopying, recording, or otherwise—without thepermission of Harvard Business School.
1
Oscar Mayer: Strategic Marketing Planning
Marcus McGraw leaned back in his leather chair and gazed out his office window at the iceskaters on Lake Mendota. He loosened his tie, slipped off his loafers, and sighed deeply. It had beena long week, and he was still struggling with what direction to take in his upcoming Strategic Planpresentation to his boss at Kraft Foods. In McGraw’s 22-year career with Oscar Mayer Foods—including the last four as president of the Division—he had never encountered such a complexbusiness challenge. First there was the alarming market research report prepared by McTiernanCorp., a consulting firm the division had relied on for planning advice over many years. Then, in themiddle of his desk, lay a series of memos from four of his most trusted managers, all responding tothe McTiernan report with their ideas on what action was “clearly best for the company.” Theproblem was that at first glance no two recommendations seemed even remotely alike in regard towhat was “so clearly best.” “Oh well,” McGraw thought out loud, “this is why they pay me the bigbucks.” And with that he hauled out the note from Mike McTiernan that had started the controversy.
October 14
Dear Marcus,
It was good talking with you last week, and I hope you enjoyed the Green Baythrashing of the Cowboys. What a great game!
In regard to the enclosed Oscar Mayer Annual Report, please note our belief thatthe marketplace for processed meats is undergoing some fundamental changes that willthreaten your profit growth over the next 3-5 years.
The most critical threat we see is that the Division’s current product portfolio isslowly shifting out of alignment with consumer trends. Specifically, your traditional redmeat products like bologna, hot dogs and bacon, all branded Oscar Mayer, are under attackfor being too high in fat content. You can see the results in your softening sales trends.
In the short-run you’ve been able to offset these losses through your recentacquisition of Louis Rich, Inc., and their turkey-based line of products that are both lowerin fat and also lower priced. Your ability to use your business and distribution systemstrengths to make Louis Rich the leader of the white meat segment has really paid off—and

Harvard Business School Marketing Cases
Oscar Mayer: Strategic Marketing Planning
Case 49© The McGraw−Hill Companies, 2001
597-051 Oscar Mayer: Strategic Marketing Planning
2
has kept the “total Division scorecard” looking favorable.
But the investment costs to build this “second brand” have been high, and we fearthat some of the steam may be running out on Louis Rich, as evidenced by the slowinggrowth rate, and the entry of competitive copy-cat brands of turkey and chicken lunch meatand hot dogs.
If Oscar Mayer branded red meat products remain sluggish and the Louis Richwhite meat lines begin to slow, your goal of +3-4% annual lb. volume growth could be injeopardy.
Finally, I have to again mention the other consumer trend that may threaten bothyour current Oscar Mayer and Louis Rich products. This involves the increasingly fast-forward pace of our lives, especially for moms in the workforce. They represent a large partof your target audience and they are constantly looking for new products that are faster andeasier to use. I know that your latest attempt, Oscar Mayer Stuff ‘n Burgers, wasn’t theanswer, but I recommend that you keep searching for any and all ways to “boostconvenience.”
By now I’m sure you’re muttering “There goes McTiernan again with the sky isfalling routine.” But I guess that’s a part of my job as an outside observer. To shout beforethe sky actually falls.
Which brings me to what you might consider doing about all of this. Here’s apossible direction:
“The Division should continue to focus on broadening andcontemporizing its product lines against emerging health andconvenience trends, while carefully allocating its investment monies(e.g. advertising and promotion budgets) to deliver both short-runand longer-run profits.”
As I see it from a distance, your present laundry list of possible “investment bets”includes the following:
1. Adding new benefits to the current OM/LR products.2. Strengthening/diversifying your lines via another acquisition.3. Internally developing new products that tap the new needs.
But, as always, the devil is in the details . . . and the details will need to come fromyour Business Managers and their teams. Knowing them as I do, I’m sure you’ll be gettingplenty of advice! Let me know if I can help.
Best regards,
Mike
McGraw nodded at the closing lines and replaced the report in his desk. Mike McTiernanwas right again. The Division was probably in decent shape for another year, but then what? Onething was for sure: McGraw had no intention of surrendering Oscar Mayer’s track record as thefastest growing profit-maker across all of the Kraft divisions. In fact, prior to the McTiernan Report,he was planning to make two very bold promises about annual growth over the next three years: +4%per year on volume and +15% on operating income. “I’m going to stick with that call unless all of the
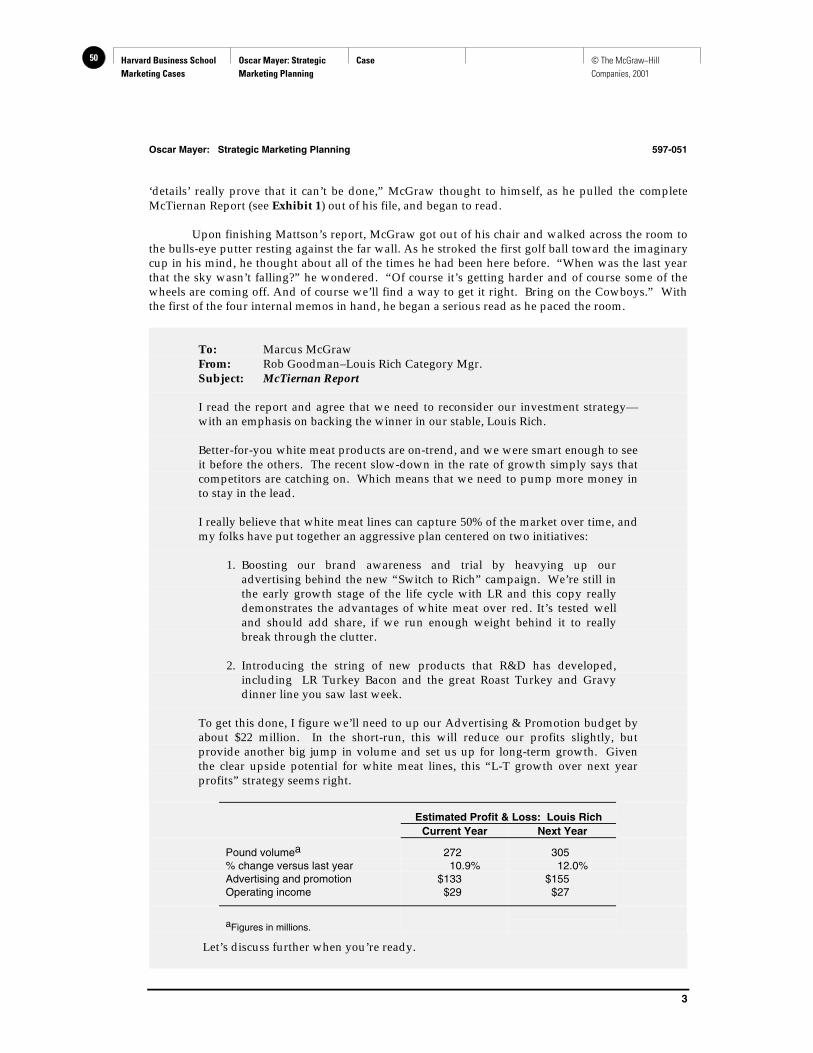
Harvard Business School Marketing Cases
Oscar Mayer: Strategic Marketing Planning
Case50 © The McGraw−Hill Companies, 2001
Oscar Mayer: Strategic Marketing Planning 597-051
3
‘details’ really prove that it can’t be done,” McGraw thought to himself, as he pulled the completeMcTiernan Report (see Exhibit 1) out of his file, and began to read.
Upon finishing Mattson’s report, McGraw got out of his chair and walked across the room tothe bulls-eye putter resting against the far wall. As he stroked the first golf ball toward the imaginarycup in his mind, he thought about all of the times he had been here before. “When was the last yearthat the sky wasn’t falling?” he wondered. “Of course it’s getting harder and of course some of thewheels are coming off. And of course we’ll find a way to get it right. Bring on the Cowboys.” Withthe first of the four internal memos in hand, he began a serious read as he paced the room.
To: Marcus McGrawFrom: Rob Goodman–Louis Rich Category Mgr.Subject: McTiernan Report
I read the report and agree that we need to reconsider our investment strategy—with an emphasis on backing the winner in our stable, Louis Rich.
Better-for-you white meat products are on-trend, and we were smart enough to seeit before the others. The recent slow-down in the rate of growth simply says thatcompetitors are catching on. Which means that we need to pump more money into stay in the lead.
I really believe that white meat lines can capture 50% of the market over time, andmy folks have put together an aggressive plan centered on two initiatives:
1. Boosting our brand awareness and trial by heavying up ouradvertising behind the new “Switch to Rich” campaign. We’re still inthe early growth stage of the life cycle with LR and this copy reallydemonstrates the advantages of white meat over red. It’s tested welland should add share, if we run enough weight behind it to reallybreak through the clutter.
2. Introducing the string of new products that R&D has developed,including LR Turkey Bacon and the great Roast Turkey and Gravydinner line you saw last week.
To get this done, I figure we’ll need to up our Advertising & Promotion budget byabout $22 million. In the short-run, this will reduce our profits slightly, butprovide another big jump in volume and set us up for long-term growth. Giventhe clear upside potential for white meat lines, this “L-T growth over next yearprofits” strategy seems right.
Estimated Profit & Loss: Louis RichCurrent Year Next Year
Pound volumea 272 305% change versus last year 10.9% 12.0%Advertising and promotion $133 $155Operating income $29 $27
aFigures in millions.
Let’s discuss further when you’re ready.

Harvard Business School Marketing Cases
Oscar Mayer: Strategic Marketing Planning
Case 51© The McGraw−Hill Companies, 2001
597-051 Oscar Mayer: Strategic Marketing Planning
4
“That’s exactly what I would argue if I were in Rob’s shoes,” thought McGraw. “He’s ridinga fast horse and knows that those don’t come around all that often. But I wonder what his newadvertising will do to our Oscar Mayer lines. And what’s a bacon made from turkey going to tastelike? Let’s see what Jane has to say.”
To: Marcus McGrawFrom: Jane Morely–Director of Finance & PlanningSubject: McTiernan–Acquisitions
This report prompted me to dig into the possibility of going after some smallcompanies that offer both healthier and more convenient products. Three caughtmy attention:
1. Chicken Rite Inc. Located in Savannah, with sales of roughly $15 MMacross 4-5 states, their star is a line of low cal chicken salad in singleserve tubs.
2. Turkey Time Ltd. They’re on the West coast , doing $10-20MM, with aline that’s similar to Louis Rich, except for some ready-made frozensandwiches. They also have a new plant with excess capacity.
3. Crabbies, Inc. Their HQ is in Maine and they make a string ofsimulated shellfish products (e.g. crabs, lobster) out of low cost rawmaterials such as halibut. Sales estimated at $15MM.
Turkey Time is closest to our know-how, and the plant might support further LRexpansion. The other two might let us tip-toe into some new protein sources andconvenience products at relatively low risk.
A complete guess at price tags might be $15-25MM apiece. If we borrowed this at12%, annual debt service would run about $3MM. The impact on operating incomewould obviously depend on how they’d perform.
Let me know if you want a deeper search. And on the rest of McTiernan, we’llneed to acknowledge our weak Oscar Mayer trends and new products historywhen we do the presentation. The good news is that we’ve been delivering thenumbers, which is ultimately the bottom line, isn’t it?
McGraw pondered the thought of another acquisition on the heels of the Louis Rich deal. Asalways, Jane ‘s instincts were to never sit still in the presence of good results. In fact she alwaysargued that good results gave you the “right” to take risk, and reach out for new investments. Thekey question, of course, was how to balance all of this stuff. McGraw looked at the remaining twomemos on his desk, and grabbed the one from Jim Longstreet, who was the newest member of hisdirect management team, brought in to improve the new product hit rate.
To: Marcus McGrawFrom: Jim LongstreetSubject: My Thoughts on the McTiernan Report
I felt that McTiernan got it exactly right when he said that the Division’s long-termhealth lies in “broadening and contemporizing our product lines against emergingconsumer needs.” Yes, we have to stay profitable in the interim, but 85% of our

Harvard Business School Marketing Cases
Oscar Mayer: Strategic Marketing Planning
Case52 © The McGraw−Hill Companies, 2001
Oscar Mayer: Strategic Marketing Planning 597-051
5
current volume lies in lines we’ve sold for almost 100 years! And the data showsthat lunch meat, hot dogs and bacon are all very mature categories with no built-ingrowth.
To get the 4% annual volume gain we want, I believe we need to invent a 4th majorcategory within processed meats that can address changing consumer lifestylesand give us a “growth engine” that will carry us for a decade.
And now is the time to do this, while results are strong and we are able to bothmake our short-run goals and invest in the future.
I have two ideas to offer here which have come out of work by our new cross-functional “Invention Teams.” The first cleared our concept test hurdle and isentering the “value engineering and economic evaluation stage.” The other is justtaking shape as an early concept.
1. “Zappetites.” This is a line of miniaturized family favorites (pizzaslice, burger on a bun, tacos, etc.) that go from freezer to microwave toyour mouth in 60 seconds. They come two per 4 oz. pack at a retailprice of $1.39, and take advantage of two hot consumer trends:
∗ The move from sit-down meals to on-the-go hand-held portablegrazing meals; and
∗ The explosive growth of the microwave oven, with the associatedsearch for products that fit.
We see this as “fast foods at home,” with no prep convenience andsure-fire tastes that both kids and adults will enjoy. The fit here withour Oscar Mayer Brand equity also seems high.
R&D remains hopeful about formulating these lines, although the coststructure is up in the air and we will probably need to add 2-4 foodtech people. But the Stuff ‘n Burgers experience taught us manyvaluable lessons about the “frozen food channel” which should helpthis time out.
If we give this priority, we should be able to complete ourdevelopment work in the next 6-8 months and be ready to sell-in earlynext year—assuming we clear the remaining consumer and financialcheckpoints.
2. “Lunchables.” This is the idea that came from listening to workingmoms describe what they think and feel about making carried lunchesfor themselves and for their kids five days a week: “painful to pack,boring to eat, and zero appreciation for the effort.”
If our “important problem-superior solution model” for new productsuccess is right, we’ve got the first half of the puzzle in hand. Thesolution-side we have in mind involves a plastic tray that we wouldfill up with some new carried lunch recipes. Almost like a “TVDinner” tray, but in a more compact size that could fit in a brown bag.
The recipes we’re considering would involve our sliced lunch meats,together with some cheese, crackers (since bread shelf life is too short),

Harvard Business School Marketing Cases
Oscar Mayer: Strategic Marketing Planning
Case 53© The McGraw−Hill Companies, 2001
597-051 Oscar Mayer: Strategic Marketing Planning
6
condiments, and possibly a little chocolate treat. We’d try to make thisfilling enough to be a credible lunch, with pricing probably in the$1.25–1.50 range.
While our thinking is still early, this pre-packaged RTE lunch conceptseems like a logical next step toward being more convenient andcontemporary for a company like ours that wants to “own carriedlunches.”
I believe that both of the above ideas fit McTiernan’s vision, and both feel like theyhave “sufficient scale” to become a 4th major category for us.
In regard to the appropriate level of investment, the following would allow us tocomplete development on one or both of these initiatives next year, and then takethem national the following year.
Estimated Profit & Loss: New ProductsCurrent Year Next Year 2 Years Hence
Pound volumea 12 (SnB) 2 50Investment $16 $12 $20Operating income (5) (1) (6)
aFigures in millions. Current year volume is Stuff'n Burgers.
Sorry about the length of this note, but I wanted to get my full shot in before Roband Eric pocket every cent of my budget!
McGraw tossed the memo back on his desk, and thought about all of the new products he’dlived through over two decades. What was the batting average? One in ten? And every time anotherone went down, there was absolute hell to pay. A thousand questions on Stuff ‘n Burgers. All sortsof “free help” from the consultants. Guys left and right promising a new magic solution to get it rightnext time. “If only the basic categories had more intrinsic growth we wouldn’t need another flightinto the unknown,” he mused.
But Longstreet did have some good points to go along with another two years of projectedlosses. And both ideas passed McTiernan’s wish for improved convenience. The trick will be tomanage the risk along the way so that I don’t get another big dose of red ink. “Well, I’ve put it offlong enough,” McGraw thought, as he looked at the last remaining memo. He knew it would be aheat-seeking missile from his long-time friend Eric Stanger.
To: Marcus McGrawFrom: Eric Stanger—VP of OM BrandSubject: McTiernan/Back To Basics
Marcus, this is probably a memo I’ll wish I hadn’t written and you’ll wish youhadn’t received.
On McTiernan . . . first off, he’s right to ring the alarm bell! The foundation of ourbuilding—the Oscar Mayer Brand, which accounts for $110MM or 82% of our totalprofit—is eroding rapidly, and if we don’t act soon it may be too late to fix it. Thisis, of course, a topic that you and I have debated over the last three years, and youknow the headlines as well as I do:

Harvard Business School Marketing Cases
Oscar Mayer: Strategic Marketing Planning
Case54 © The McGraw−Hill Companies, 2001
Oscar Mayer: Strategic Marketing Planning 597-051
7
∗ In order to underwrite the growth of the new Louis Rich trademark andexperiment with more new products, we have in effect been milking the OscarMayer lines.
∗ Our price increases on several of our most critical items have outpaced those ofthe key competitors, in order to always deliver more bottom line profits.
∗ Simultaneously we have shaved our A&P budgets for the same purpose.
∗ The result has been a slippage in “value” and trust among our consumerfranchise that has now manifested itself in two year’s worth of declining salesand share.
I know that I signed on for this strategy for the greater good of the Division. And Iknow that it’s paid off in big growth, at least for the Louis Rich business.
But as we old Southern boys say, “the chickens are now coming home to roost inour P&L.”
Hence my theme: “it’s time to get back to basics on the Oscar Mayer business.”And here are the six actions that I think are urgent:
1. Take a 10 cent per package price cut on the top three OM branded items ineach category to begin to get back in line with the competition.
2. Increase the A&P budget by $25MM to restore fair share support for the brand.
3. Reinstitute the Wienermobile promotional program to play off the generalnostalgia craze that is sweeping the nation.
4. Get enough R&D resources going to formulate a low fat and salt line of OMproducts.
5. Update the analyses on capacity utilization in our OM plants and rationalizewhat’s required to cover additional price reductions.
6. Most importantly, announce to the sales force and the entire organization thatthe Division’s number one goal for the year lies in reinvigorating Oscar Mayerbrand growth.
I think that if we do the above and get somewhat lucky on the cost of commodities,I can begin to turn around the volumes while holding the line on operating income.
Estimated Profit & Loss: Oscar Mayer BrandLast Year Current Year Next Year
Pound volume 662a 650 660% change vs. last year (1.3%) (1.8%) 1.5%Advertising & promotion $245 $236 $250Operating income 107 110 110
aFigures in millions.
You know, you and I worked together over fifteen years ago to make Oscar Mayerinto the leading national brand in the processed meats industry. Building thosedamn displays in the boonies at 1AM in the morning. And it paid off.
What a bitter pill it would be if, together, we watched while it all slipped away.

Harvard Business School Marketing Cases
Oscar Mayer: Strategic Marketing Planning
Case 55© The McGraw−Hill Companies, 2001
597-051 Oscar Mayer: Strategic Marketing Planning
8
Out on the lake, the last of the skaters were heading for home and a warm cup of hotchocolate to soothe away the chill. McGraw thought about those displays. And Eric Stanger. And allthe other people that made the company go around by caring this much. “Just as I expected. Nothinghere but a bunch of terrific ideas to choose from and the same folks who always get them done. And Ithought this was going to be a hard one.” McGraw picked up the phone and called home. Guesswho. Late again. Be there when I get there. Gotta get this one down on paper so I can sleep on it.The shorthand of a lasting marriage between two busy people.
The clock on the wall read 11:00 PM when McGraw next looked up from his yellow pad. Hewas sure that McTiernan was cuddled up in bed by now. He was also dead tired, but still pumped.He loved putting together the pieces. “So, when I add it all up, here’s what I want to promise againstwhat I’m being promised.”
Current Next Year Next Year From My ManagersYear (My Wish) Total OM LR NP
Pound volumea 934 971 967 660 305 2
% change versus last year 2.6% 4.0% 3.5% 1.5% 12.0% (--)
Advertising & promotion $385 TBD $417 $250 $155 $12
Operating income 134 154 127 110 27 (10)
% change versus last year 14.0% 15.0% (5.2%) NC (6.9%) (--)
aAll figures in millions.
“The volumes are close; the spending is too high; and everyone’s sandbagging the bottomline. Or are they?”
McGraw’s final act for the day was his traditional “do list.”
How to Balance the Options
• Volume vs. profit
• OM brand value/quality of initiatives/pricing
• LR steam/ads/NP’s
• Flat categories/off trend
• Health and convenience
• Acquire vs. develop
• Chicken/fish/another LR
• Zap/Lunchpacks
• Problem-solution
• 4th category
• Learning vs. speed
• What we do well
• Competition
• Cost structure/benchmarks
• Risk profile
• Equitable distribution
• What else???

Harvard Business School Marketing Cases
Oscar Mayer: Strategic Marketing Planning
Case56 © The McGraw−Hill Companies, 2001
Oscar Mayer: Strategic Marketing Planning 597-051
9
Questions
(1) In the beginning of the case McGraw thinks he has "never encountered such acomplex business challenge" as the one he currently faces. By the end of the case,after he has read the ideas listed in the four memos, McGraw can’t believe heever thought the investment issue was "going to be a hard one." What changedthe president’s perspective? What strategic decision-making process doesMcGraw pursue?
(2) If McGraw chooses a strategic direction that favors only one department, whatnegative effects could this have on other departments? How can McGrawmitigate the damage?
(3) What effects is the change in the strengths and weaknesses of competition havingon the Oscar Mayer Division? How does this impact the investment decision?
(4) Absent any resource constraints, which of the four departmental directions doyou think is the most viable? Which is the second best strategy? Which is theleast viable?
(5) Given the information in the case, what strategic course do you think theDivision should pursue?
(6) Which of Jim Longstreet’s new product ideas is less likely to succeed? Why?

Harvard Business School Marketing Cases
Oscar Mayer: Strategic Marketing Planning
Case 57© The McGraw−Hill Companies, 2001
597-051 Oscar Mayer: Strategic Marketing Planning
10
Exhibit 1 McTiernan Report: Processed Meat Industry
The following is our assessment of key trends affecting the market and implications for OscarMayer’s strategic plan.
1. What’s Happening to Meat Consumption in the United States
Over the past five years total meat consumption (fresh and processed) has been sluggish—with gains in white meat offset by losses in red.
Annual Per Capita PoundsCurrent Five Years Ago
All Meat 170.1 168.5
Red 124.9 134.7
White 45.2 33.8
Within the Division’s core categories, this same pattern is evident in retail sales data providedby Nielsen's scanning panel.
Processed Meat Industry Pound Salesa
Current Prior Year Two Years Ago
All lunch meat: 1,427 1,393 1,363
Red 1,103 1,108 1,112
White 324 285 251
All hot dogs: 859 851 843
Red 661 685 699
White 198 166 144
All bacon (red) 677 698 709
aFigures in millions.
McTiernan feels that two important consumer trends are driving these sales results:
– The growing emphasis on nutrition. What began with a move toward lowercalorie products, has now broadened into flight from products thought to be highin fat or salt. In processed meats, this has clearly helped lines made from turkeyor chicken and hurt those made from red meat.
– The need for products offering greater convenience. With 55% of women nowworking outside the home, time to prepare meals has continued to erode. Thishas produced both anxiety and feelings of guilt—especially among “workingmoms”—and, in turn, a search for low/no prep, ready-to-eat foods such asfrozen dinners. Its impact on processed meats is evident in the low ratings on“convenience” seen in our recent national telephone survey.

Harvard Business School Marketing Cases
Oscar Mayer: Strategic Marketing Planning
Case58 © The McGraw−Hill Companies, 2001
Oscar Mayer: Strategic Marketing Planning 597-051
11
Consumer Satisfaction Survey: Processed Meats
Meat Rating (1-10 Top Scale)Red Meats White Meats
Overall taste 8.5 7.3
Nutrition 7.7 8.8
Price 6.6 7.0
Convenience 6.3 6.3
Unfortunately for the Division, neither of these important consumer trends favor our current portfolioof products. And, unless we can find solutions, long-term sales will likely suffer—especially on theOscar Mayer red meat lines.
2. Competition—Adding Fuel to the Fire
In addition to the consumer changes, the Division is also facing a much more challenging setof competitors than in the past. This is the result of a “shake-out” in the industry over 5-10 years, asprofits vanished for many old-time “meat-packers” who depended on sales of unbranded, fresh redmeat products. As shopping preferences began to shift from hamburgers and steaks to chicken, thethin profit margins for these companies disappeared and they were forced to close down or sell out tonew ownership.
The result of these closures and acquisitions is a more consolidated meat industry,comprising companies with sophisticated manufacturing and marketing skills, stronger financialpositions, and a focus on building value-added brands and market share.
As the Division faces these multi-billion dollar competitors (e.g., ConAgra, Sara Lee, Hormel,etc.), the race will be on for new ideas and promotional support to achieve industry leadership.
3. Slowed Growth in Divisional Sales
While profits have continued to grow nicely in recent years (see Exhibit 2), gains in poundsales have slowed, particularly on the Oscar Mayer branded product lines.
Division ShipmentsCurrent Prior Year Two Years Ago
All productsa 934 916 886
% change versus last year 2.6% 3.0% 3.1%
Oscar Mayer brand 650 662 671
% change versus last year (1.8%) (1.3%) 0.3%
Louis Rich brand 272 244 215
% change versus last year 10.9% 13.4% 14.2%
Stuff'n Burgers 12 0 0
aFigures in millions.

Harvard Business School Marketing Cases
Oscar Mayer: Strategic Marketing Planning
Case 59© The McGraw−Hill Companies, 2001
597-051 Oscar Mayer: Strategic Marketing Planning
12
Likewise, market shares reflect this same pattern of strength for Louis Rich offsettingweakness for Oscar Mayer.
Market Share TrendsCurrent Prior Year Two Years Ago
Lunch MeatOscar Mayer Brand 22.3% 22.8% 23.4%Louis Rich Brand 8.6 7.9 7.0
30.9 30.7 30.4Hot Dogs
Oscar Mayer Brand 12.5 12.9 13.2Louis Rich Brand 2.9 2.2 1.4
15.4 15.1 14.6Bacon
Oscar Mayer Brand 11.3 11.2 11.5
4. Recent New Product Activity
Aside from the acquisition and roll-out of the Louis Rich lines, the Division’s track record onnew products has mirrored that of most food companies—with many more failures than successes.Thus, while “close-in line extensions” such as Oscar Mayer Jumbo Hot Dogs or Lean ‘n Tasty Baconhave added modest share gains (0.5-1.0 percentage points of share), attempts at launching “reallynew lines” have been unsuccessful.
The most recent failure was Oscar Mayer Stuff ‘n Burgers, a precooked and frozenhamburger patty “with cheese and condiments inside,” intended to give busy moms a moreconvenient way to serve this popular dinner. A post-mortem analysis indicated that while theproduct gained reasonably good trial, its flavor and texture disappointed many consumers, especiallythose who prepared it in the microwave .
Profit margins were also narrowed by the need to invest in new business systems, processes,and technology to compete in the “frozen foods channel,” as opposed to the Division’s traditional“refrigerated distribution channel.”
5. Overall Conclusions and Implications
Given the above, we feel that the Division must make some very hard investment choicesnow to maintain the excellent growth record it has enjoyed over the past several years.
Your core red meat brand, Oscar Mayer, is suffering share losses; your white meat “solution,”Louis Rich, is slowing a bit; your new product attempts haven’t delivered on the “greaterconvenience” that consumers are demanding; and the competitive environment is much tougher thanbefore.
To counter this, the Division must call on its traditional sources of strength: your powerfulbrand reputation with retailers and consumers alike; the technology skills in R&D; your unmatchedsales force; and, of course, your history as a “get-it-done” organization (see Exhibit 3).
But, in our judgment, you must act quickly and decisively in order to win.
Doug MattsonPartner-McTiernan Corp.

Harvard Business School Marketing Cases
Oscar Mayer: Strategic Marketing Planning
Case60 © The McGraw−Hill Companies, 2001
Oscar Mayer: Strategic Marketing Planning 597-051
13
Exhibit 2 Oscar Mayer Division Performance (MM)
Current Year Last Year Two Years
Total Division:Pound volumea 934 916 886
% change versus last year 2.6% 3.0% 3.1%
Revenue $1924 $1883 $1693
Variable margin 904 847 762
Advertising & promotion 385 358 330
Operating income 134 118 105
% change versus last year 14% 12% 11%
Oscar Mayer Brand:
Pound volume 650 662 671
% change versus last year (1.8%) (1.3%) 0.3%
Revenue $1378 $1428 $1443
Variable margin 661 671 679
Advertising & promotion 236 245 254
Operating income 110 107 105
% change versus last year 2.8% 1.9% 2.1%
Louis Rich Brand:
Pound volume 272 244 215
% change versus last year 10.9% 13.4% 14.2%
Revenue $511 $455 $412
Variable margin 232 176 123
Advertising & promotion 133 113 106
Operating income 29 14 7
% change versus last year ++ ++ ++
New Products (SnB):
Pound volume 12 -- --
Revenue $35 -- --
Variable margin 11 -- --
Advertising & promotion 15 -- --
Operating income (5) (6)
aFigures in millions.

Harvard Business School Marketing Cases
Oscar Mayer: Strategic Marketing Planning
Case 61© The McGraw−Hill Companies, 2001
597-051 Oscar Mayer: Strategic Marketing Planning
14
Exhibit 3 Company Background
In 1883, Oscar F. Mayer, a Bavarian immigrant, founded a retail market in Chicagospecializing in “Old World” sausages and Westphalian hams. Placing quality first and price second,Oscar Mayer & Co. soon became a well-known producer of meats in and around Chicago. By 1900the company employed 43 people, including five salespeople who traveled throughout the Chicagoarea, distributing meats by horse-drawn wagons.
After graduating from Harvard in 1909, Oscar G. Mayer, the founder's son, joined thebusiness. In 1919, while visiting his fiancee in Madison, Wisconsin, the younger Mayer heard a co-operative meat packing plant was up for auction. Recognizing its usefulness as a valuable source ofraw materials, Oscar G. Mayer purchased the plant.
Through the following years, Oscar Mayer expanded the distribution of its products,pioneeered several marketing programs (e.g. TV jingles, the Wienermobile, whistle premiums)increased sales, added plants and grew to be the nation’s leading manufacturer of processed meats.Creation and acquisitions of subsidiaries helped to diversify and enlarge an otherwise onedimensional firm. For instance, in 1970 Oscar Mayer purchased C. F. Claussen & Sons, Inc. whichpacks and distributes refrigerated fresh pickles, pickled tomatoes, sauerkraut, and relish. Also, in1979, Louis Rich, Inc., the nation’s largest manufacturer of processed turkey products, was acquired.
Oscar Mayer’s brand equity, successful history, and effective product diversification madethe medium-sized company an attractive purchase for an expanding larger firm. In 1981, two yearsafter the Louis Rich acquisition, Oscar Mayer was acquired by General Foods Corporation. PhilipMorris Companies, Inc., the parent company of Kraft Foods, purchased General Foods, includingOscar Mayer, in 1985.

Harvard Business School Marketing Cases
Pizza Hut, Inc. Case62 © The McGraw−Hill Companies, 2001
Harvard Business School 9-588-011Rev. May 20, 1993
Professor Patrick J. Kaufmann prepared this case as the basis for class discussion rather than to illustrate either effective orineffective handling of an administrative situation. Proprietary data have been disguised.
Copyright © 1987 by the President and Fellows of Harvard College. To order copies or request permission toreproduce materials, call 1-800-545-7685, write Harvard Business School Publishing, Boston, MA 02163, or go tohttp://www.hbsp.harvard.edu. No part of this publication may be reproduced, stored in a retrieval system,used in a spreadsheet, or transmitted in any form or by any means—electronic, mechanical, photocopying,recording, or otherwise—without the permission of Harvard Business School.
1
Pizza Hut, Inc.
In May 1986, Steve Reinemund, the newly appointed president of Pizza Hut, Inc., announcedthat he intended to pursue vigorously the “exciting opportunities afforded by our new segment,delivery.” Seven months later, the home delivery units had produced mixed results, and Reinemundmet with his senior managers to decide how to respond.
Entry into the home delivery market had been a major strategic decision at Pizza Hut, andReinemund was well aware of the difficulties it presented. Half of the 5,025 Pizza Hut systemrestaurants were owned by large, powerful franchisees with exclusive rights to the territories theycontrolled. While some franchisees saw the benefits of home delivery in their markets, others werestrongly opposed. Moreover, many franchisees did not agree with the manner in which Pizza Hutwould implement delivery. Nevertheless, to be successful, the delivery strategy needed thefranchisees’ cooperation. Attaining this cooperation in the Pizza Hut franchise system would be, inthe words of Jim Baxter, vice president of franchising, “a matter of sell, not tell.”
The Pizza Market
The rapid growth in home delivery in the mid-1980s revitalized the pizza market and wasresponsible for pizza’s position as the fastest-growing part of the $53 billion fast food market. Threemain segments comprised the pizza restaurant market: eat-in, carryout, and delivery. The sales foreach segment are shown below:
Eat-In Carryout Delivery Total
1982 $4.3 billion (57%) $3.1 billion (41%) $0.1 billion ( 1%) $ 7.5 billion
1984 $4.7 billion (48%) $4.0 billion (41%) $1.0 billion (10%) $ 9.7 billion
1986a $5.1 billion (40%) $5.0 billion (39%) $2.6 billion (20%) $12.7 billion
1990a $5.9 billion (27%) $9.0 billion (41%) $7.0 billion (32%) $21.9 billion
Source: GDR/Crest Enterprises, Inc.aProjections based on limited Pizza Hut entry into delivery segment as of third-quarter 1986
Many companies competed in more than one segment; for example, carryout was a significantpercentage of most eat-in restaurants’ business. At Pizza Hut, carryout accounted for 40% of thedollar volume in 1986, compared with 37% in 1982.
Harvard Business School Marketing Cases
Pizza Hut, Inc. Case 63© The McGraw−Hill Companies, 2001
588-011 Pizza Hut, Inc.
2
In 1986, while the overall pizza market expanded rapidly (because of home delivery), in-restaurant consumption of pizza was not increasing significantly. Industry observers believed thatthe restaurant industry was seriously overbuilt; pizza parlors seemed to be on every corner in sometowns. They believed that the already intense local competition in the pizza eat-in and carryoutsegments would soon approach all-out warfare, as evidenced by increased use of couponing, deals,and price competition.
The Pizza Consumer
Pizza was a very popular restaurant food item, second only to hamburgers in frequency ofpurchase. Pizza was predominantly a dinner food, although many consumers also viewed it as anevening snack. Consumers did not react casually to pizza, unlike their feelings for hamburgers,chicken, and fish. Consumer research had shown that pizza was a personal, almost sensual,experience for many people. Moreover, consumers generally did not believe that great pizza could bemade by a fast-food chain.
While pizza consumption was strongest in the northern and eastern parts of the UnitedStates, pizza’s appeal was broad based, with no areas exhibiting major rejection. However, tastes inpizza varied significantly by region. This presented a challenge for chains attempting to maintainproduct continuity while expanding into different regions.
By the early 1980s, convenience was crucial to many consumers. Two-career families oftenfound cooking at home or eating in restaurants too time consuming, thereby increasing carryout andhome delivery business. In both 1985 and 1986, consumer surveys undertaken by the NationalRestaurant Association identified pizza home delivery as the most important new fast food concept.Another study had shown that consumers generally viewed pizza as eat-at-home food. Manyanalysts believed that the rapid growth of the in-home video rental market, together with theincreasing number of baby-boomers with small children, would further fuel the pizza deliverysegment.
Competition in the Pizza Market
Although faced with intense competition from aggressive regional chains and single-unitowner-operated local competitors, Pizza Hut had dominated the eat-in pizza segment nationwide foryears (Exhibit 1). Godfather’s Pizza, another eat-in/carryout chain, which competed in many of thesame local markets as Pizza Hut, traditionally was perceived as Pizza Hut’s most significant nationalcompetitor.
Before 1984, neither Pizza Hut nor its franchisees thought that Domino’s Pizza posed aserious competitive threat to Pizza Hut’s leadership position in the overall pizza market. Domino’s,however, had grown from sales of $626 million in 1984 to $1.085 billion in 1985, and to $1.55 billion bythe end of 1986. In 1985 the chain opened 954 new outlets (bringing the total to 2,839)—the highestone-year total ever recorded by a food service company. Two-thirds of Domino’s outlets werefranchised; the company used its company-owned stores as sites for required franchisee training.Although there were several large franchisees operating many units all over the United States, mostof the 600 franchisees in early 1986 owned only one or two stores. While some of its outlets hadcarryout windows, Domino’s was essentially a delivery-only chain. Domino’s management believedthe large percentage of carryout business in the industry was especially vulnerable to Domino’sdelivery strategy.
Pizza Hut first experienced the effects of Domino’s expansion in its company-owned stores.While Pizza Hut’s franchisees had exclusive rights to most of the smaller markets, Pizza Hut’scompany-owned stores controlled most of the large, densely populated metropolitan markets.Domino’s had initially focused its national expansion on those large metropolitan markets. By late

Harvard Business School Marketing Cases
Pizza Hut, Inc. Case64 © The McGraw−Hill Companies, 2001
Pizza Hut, Inc. 588-011
3
1985, Pizza Hut senior management was convinced that Domino’s dominance of the fast-growingdelivery segment was the major threat to Pizza Hut’s continued leadership of the overall pizzamarket. By 1986, Domino’s had begun to extend its expansion into the smaller towns generallycontrolled by Pizza Hut franchisees. Domino’s clearly intended to gain total market leadership whilemaintaining its dominance of the delivery segment.
Pizza Hut, Incorporated
On June 15, 1958, Dan and Frank Carney, two college students from Wichita, Kansas, openedthe first Pizza Hut restaurant. It was a startling success. By the following February, the Carneybrothers had opened two more restaurants and had begun to develop plans for the first franchisedoutlet. The chain grew rapidly, with 43 restaurants opened by 1963 and 296 by 1968. Pizza Hut wentpublic in 1969, and in 1977 was acquired by PepsiCo, Inc. In 1981 Pizza Hut became the largest pizzarestaurant chain in the world in both sales and number of restaurants. Sales reached $1 billion in1981; by December 1986, Pizza Hut, still headquartered in Wichita, had a total of 5,025 domestic unitsand annual sales of almost $2 billion (Exhibit 2).
Since the 1960s, Pizza Hut restaurants were characterized by a distinctive freestanding designand familiar red roof (Exhibit 3). All Pizza Hut restaurants were full-service, eat-in/carryout family-style operations seating about 60 to 90 customers and normally open from 11 a.m. to midnight.
Although the menu had changed over the years, pizza was always the main product in PizzaHut restaurants. The company paid careful attention to operational efficiency, and continued to offera high-quality product at a premium price. A constant stream of new product introductions served toinvigorate consumer interest, but many franchisees were concerned by the increased cost ofoperations caused by the expanding menu.
For more than 20 years, the Pizza Hut franchisees had taken the lead in marketing. In theearly 1980s, however, the company further strengthened its corporate marketing department andbegan developing comprehensive national and local market strategies. By 1986, the company wasdeveloping and implementing systemwide corporate marketing programs and realizing leveragefrom national TV advertising.
The Franchise System at Pizza Hut
Franchising was an integral part of the Pizza Hut strategy since the corporation’s founding.In 1968, there were 293 franchised restaurants and only seven company-owned restaurants. Over thenext seven years, the company built new stores and acquired many more (including the acquisition ofthe 225 units of a large Pizza Hut franchisee). By the mid-1970s, there were almost as manycompany-owned as franchised units. In December 1986, 135 individuals, partnerships, and/orcorporations operated 2,395 Pizza Hut system restaurants and 96 delivery-only units as franchisees.Meanwhile, the company itself operated 2,173 restaurants and 361 delivery-only units.
Many of the original franchisees, whose holdings had grown with the company, were stillpart of the system in 1986. Sixty percent of all franchised units were controlled by franchisees whosemain offices were still in Wichita. In the Pizza Hut system, exclusive franchises were granted forspecified market areas. Unlike franchise systems characterized by single-unit owner/operators, mostPizza Hut franchisees were large companies with diversified holdings, sometimes including otherfood service franchisor units like Kentucky Fried Chicken and Long John Silver. Of the 135franchisees, almost two-thirds operated 10 or more Pizza Hut system restaurants in 1986. Except forminority opportunity programs, no new franchise areas had been offered to the public since 1971.When a franchisee chose to sell its holdings, they were purchased by the company or anotherfranchise holder.

Harvard Business School Marketing Cases
Pizza Hut, Inc. Case 65© The McGraw−Hill Companies, 2001
588-011 Pizza Hut, Inc.
4
Franchisee rights and obligations were specified in formal franchise agreements. Under theagreements, each franchisee was obligated to develop its exclusive market area in accordance with afive-year development schedule. Essentially, the agreement required the franchisee to open anagreed-upon number of new restaurants during the first year of the agreement, an agreed-uponnumber during the second year, and so on, up to year five. The development schedule representedfranchisee commitment to significant continuing investment in the business. After the five-yearperiod expired, the company could negotiate a secondary development schedule with the franchiseeto open additional restaurants in the area, if the company deemed it practicable. Although franchiseefailure to comply with either development schedule entitled the company to franchise others or toopen company-owned restaurants in the previously exclusive area, this had never been necessary. Inno case could there be a restaurant established within two miles of an existing franchisee restaurant.
Franchisees paid Pizza Hut an initial fee of $15,000 for each system restaurant they opened.Franchisees also paid the company an ongoing franchise fee of 4% of monthly gross sales. Thecompany or franchisee invested about $466,000�$816,000 to open each eat-in/carryout restaurant. Bycontrast, delivery-only units required an estimated $128,500�$198,500 investment. However, by thetime one included delivery vehicles, training, additional advertising, and the company’s centralorder-taking computer system, the company’s investment in a company-owned delivery unit wasabout equal to that of a traditional restaurant. Franchisees investing in delivery-only units typicallydid not buy vehicles and did not always adopt the company’s computer-ordering system (seeExhibit 4 for expenses of company-owned delivery units).
The International Pizza Hut Franchise Holders Association
The International Pizza Hut Franchise Holders Association (IPHFHA) was formed in 1967 to“solidify the national image of Pizza Hut and to further product loyalty,” and to “devise the mostappropriate use of the funds available for national advertising.” By 1986, its role had been extendedto render many other services to franchisees (e.g., accounting services, group life insurance,workman’s compensation insurance, credit union).
Franchisees were required to become members of the IPHFHA. The IPHFHA communicatedwith the company regularly through the IPHFHA board of directors. The IPHFHA employed aprofessional staff headed by Gerald Aaron, president, who acted as intermediary between the boardand the company. He directed for the association the broad policy areas of marketing, finance, andadministration. Joint advisory committees (with franchisee and company members) were formed in1985 to further enhance communication between the company and the franchisees on the issues ofhuman resources, delivery, products, and buildings and equipment.
The IPHFHA was reorganized in 1975, and the Advertising Committee was formed to“determine and control the amount, kind, and quality of national advertising and sales promotion tobe provided . . . for Pizza Hut and its franchisees.” (In 1981 the role of the Advertising Committeewas continued under the new franchise agreement.) Four marketing professionals made up theAdvertising Committee, two representing the company and two representing the franchisees.IPHFHA Members voted on funding for national advertising and other IPHFHA programs. Thecompany, although not a member of IPHFHA, was contractually bound by the franchise agreement tocontribute at the same rate as the franchisees. In 1986, the current assessment was 2% of the first$28,000 of monthly sales for each restaurant and 1% of all monthly sales above $28,000. TheAdvertising Committee controlled the entire advertising budget, and was also responsible for hiringand firing the national advertising agency.
Market area advertising was managed by local co-ops comprising all of those franchisees(and the company if applicable) operating restaurants within a particular market area. All co-opmembers, franchisees and company alike, were required to make contributions to the co-op foradvertising in their area in the amount of 2% of monthly gross sales (in addition to the contributions

Harvard Business School Marketing Cases
Pizza Hut, Inc. Case66 © The McGraw−Hill Companies, 2001
Pizza Hut, Inc. 588-011
5
to the national advertising fund). All disputes arising within co-ops were arbitrated by theAdvertising Committee.
In addition to ad hoc interaction between the company and its franchisees at regional storemanager meetings, there were two general systemwide meetings each year. Franchisees set thesummer meeting agenda and the company set the winter meeting agenda. Company managementalso regularly met with the board of IPHFHA and with the franchisees on the advisory committees.
Delivery at Pizza Hut, Inc.
For many years, the prospect of entering the delivery market worried Pizza Hut seniormanagers; delivery units might cannibalize the traditional restaurant business, causing reduced profitmargins. In the summer of 1984, however, Pizza Hut began exploring the possibility of such an entry.Because it was believed that the addition of delivery service to traditional eat-in restaurants wouldcreate unmanageable operational bottlenecks, the solution for Pizza Hut management was to enterthe delivery market with separate delivery-only units (i.e., with no eat-in or carryout facilities). Theseunits would be considerably smaller than the traditional restaurant facilities and would not requireparking space or highly visible locations (Exhibit 3); occupancy costs therefore would be about 2.1%of sales rather than 6% for the standard eat-in restaurants.
In 1985 a small delivery task group was formed at Pizza Hut and began opening company-owned delivery units in several markets. Their idea was to open a cluster of delivery-only units ineach market and keep their costs as low as possible because of the small expected margins (Exhibit 4).There was considerable resistance to the delivery concept at all levels within the company, andcompany restaurant managers and supervisors in the markets where delivery units had been openedcomplained bitterly about the adverse effect on their sales. Nevertheless, Pizza Hut management wasbecoming increasingly concerned about Domino’s rapid expansion, and deemed entry into thedelivery segment necessary if the company was to maintain its market leadership position.
By August 1985, eight markets had been opened with a total of 51 company-owned delivery-only units. In the well-developed markets—Atlanta, Georgia, and Norfolk, Virginia—customerscalled a single phone number. Orders were then sent by facsimile machine to the appropriatedelivery unit. Although the system was relatively cheap, as the number of units grew, it becamemore and more unmanageable, and the “fax” machines presented a significant bottleneck. In latesummer 1985, senior Pizza Hut managers visited the Norfolk market and became convinced that,with a number of operational adjustments, the delivery concept was workable, offered tremendouspotential growth, and should be pursued. The company postponed further expansion into newmarkets while it contracted for the development of a computerized central ordering system andperfected other aspects of the delivery concept.
The computerized central ordering system, called the Customer Service Center (CSC),allowed customers in a particular market to call a single number to place an order. The caller firstwas asked his or her phone number and the system ascertained whether the caller had orderedbefore. If so, the operator would verify the caller’s name and address and ask if the customer wouldlike the same type of pizza previously ordered. The order would then be forwarded automatically tothe appropriate delivery unit where a terminal would receive the order information.
The CSC system, although expensive to develop, was designed to be capable of handling thevast number of calls generated in a large market with a large number of delivery units. It wasnecessary, however, that the system work perfectly. Customers in an eat-in restaurant understoodand tolerated waiting a few minutes to be seated. Delivery customers expected their phone call to beanswered within seconds, even though 60% of the daily calls for an entire market area might come induring a one-hour period. While there were substantial marketing benefits to having only one phonenumber for an entire market, there were significant risks in operating such a complex system. In

Harvard Business School Marketing Cases
Pizza Hut, Inc. Case 67© The McGraw−Hill Companies, 2001
588-011 Pizza Hut, Inc.
6
Norfolk, Virginia, initial problems with the installation of the CSC had created serious losses in aonce-profitable delivery market.
Although there had been some difficulties during its installation, Pizza Hut management wasconvinced that the CSC would be a significant competitive advantage. About 70% of Domino’sfranchisees owned only one store, and Pizza Hut believed that the costs of coordination andmanagement of such a centralized ordering system at Domino’s would be prohibitive. In the PizzaHut system, the concentration of restaurant ownership in the hands of the company and relativelyfew franchisees would allow for much easier coordination and substantial cost savings. Under thecompany’s delivery concept, the company would invest in the CSC for each market and manage it,coordinating the ordering process and providing service on a fee-per-call basis to participatingfranchisees and company stores (currently $ .65 per call). Pizza Hut’s investment in the CSCs wasexpected to be large, but management believed that such systems were essential to the deliverystrategy. It was expected that eventually the franchisees would purchase the necessary equipmentand manage the Customer Service Centers themselves in their own markets.
Another major issue presented in developing a profitable delivery concept was whether therewould be a charge for service. Pizza Hut management was convinced that for competitive reasonsthe company could not charge for delivery (Domino’s delivered free with a 30-minute guarantee).The additional cost of providing free delivery was the same, regardless of order size. This meant that,to the extent the average check price could be increased, margins would increase. To help maintainmargins when offering free delivery, therefore, it was decided that the size and price of deliveredpizzas would be slightly increased over pizza in traditional restaurants (i.e., delivery sizes would be10-14-16” versus the 9-13-15” sizes in the traditional restaurants and Domino’s 12-16” sizes).Customers would pay approximately 10% more for a small, medium, or large pizza, but would getmore as well. This “upsizing” would increase the average check price and gross margin, therebyhelping to defray the cost of free delivery and the Customer Service Centers.
In early 1986, Pizza Hut was reorganized to reflect the increasing importance and autonomyof the delivery segment (Exhibit 4). A senior vice president of operations managed all traditionalrestaurant operations, while Senior Vice President Allan Huston was general manager of delivery.Still another senior vice president led the marketing function for the traditional restaurants. Deliveryhad its own separate marketing department that reported directly to Allan Huston. Even the regionsinto which the country was divided were different for delivery and the traditional restaurantbusiness.
Although there was some experimentation with alternative delivery concepts (e.g., noupsizing in some markets) during the spring and summer of 1986, the marketing function for thedelivery group was not fully operational until July. Huston concentrated primarily on the operationaldetails surrounding the opening of new delivery units rather than on refining the Pizza Hut deliveryconcept. In the first half of 1986, Pizza Hut doubled the number of markets where it operateddelivery units and had almost quadrupled the total number of units (Exhibit 6). Those delivery unitswere predominately in metropolitan areas—where most of the company’s markets were. The initialunits opened were in markets with high levels of traditional restaurant penetration and high “per-store-average” (PSA) sales. A second group, opened later in 1986, were in low penetration and lowper-store-average sales markets.
Throughout 1986, Pizza Hut managers on the traditional restaurant side of the businesscontinued to be concerned about competition from the Pizza Hut delivery operation, as well as fromDomino’s. Huston and other managers in the delivery operation, however, believed that deliverywas expanding the market by including people who would not go to a restaurant for pizza. Theyargued that consumers who ate pizza in restaurants and those who had pizza delivered sought verydifferent benefits, and that delivery did not compete directly with traditional restaurants. Moreover,the adverse effects of Pizza Hut delivery units on traditional restaurant sales growth appeared to bemost pronounced in markets where there was weak sales growth already; in strong markets the effect
Harvard Business School Marketing Cases
Pizza Hut, Inc. Case68 © The McGraw−Hill Companies, 2001
Pizza Hut, Inc. 588-011
7
was short lived. As Reinemund noted in early 1986, “We do not yet know how great a factor thisoverlap will be. But what we do know is that in many cases our restaurant business has actuallygrown after our delivery units have entered the market.” In the words of another senior Pizza Hutmanager:
While it is true that we often are serving the same customers, we are servingthem on totally separate dining occasions. When we introduce delivery to a market,we get the business of customers who probably were ordering a competitor’s pizzasimply for the convenience of home delivery.
As for personnel, it was clear that needs of the delivery business were significantly differentfrom those of the traditional restaurant business. Pizza Hut restaurant managers were trained tomanage the “total customer experience” and, because of the isolation from customers, somerestaurant managers did not think they would enjoy running a delivery-only unit. While manyproduction and operation functions would overlap, store managers found it hard to see how careerpaths could cross over from traditional full-service restaurants to delivery units or vice versa.Moreover, moving as quickly as it had into new markets, Pizza Hut found it difficult to manage at thestore level. Ninety percent of the people working in the delivery business were new, and deliverypresented unfamiliar operational demands in the areas of driver management, trade area definition,and order taking.
The Franchisees’ Experience with Delivery
A few Pizza Hut franchisees had been offering delivery unofficially for 20 years. In the early1980s, the company consistently attempted to dissuade franchisees from offering delivery.Nevertheless, the number of small-town franchisees delivering pizza to college dormitories andmilitary bases from their traditional restaurants had begun to increase. In some isolated casesfranchisees faced local competitive environments that they believed necessitated offering delivery. By1982, about 25 franchisees operated delivery services from a total of about 75 standard eat-inrestaurants.
Most franchisees that entered the delivery segment did so by retrofitting existing eat-inrestaurants to allow for delivery “out the back door” (Exhibit 6 shows the number of franchiseesowning retrofit and delivery-only units from 1984 to 1986). They found, however, that retrofittingsignificantly increased demands on the restaurant manager and required much greater localmanagement skills. Because of operational bottlenecks, some franchisees lost money on the deliverybusiness and ceased delivery operations. The company believed this supported its concept ofopening separate delivery-only units.
Through 1985, the majority of Pizza Hut franchisees saw no reason for delivery. They facedlittle or no competition in their market from the major chains offering delivery, and were lessinterested in overall market share battles than the company seemed to be. Sixty-five percent of allfranchised restaurants were in towns with populations under 50,000 people, and delivery in thoserural areas was not as easy to justify economically as in more densely populated markets. In late1985, when the company changed its position completely and began to encourage franchisees to opendelivery-only units, most franchisees were not interested in doing so.
In November 1985, the company announced to franchisees that it interpreted franchiseagreement development schedules to include delivery and, therefore, the company had the right torequire franchisee development of delivery units in their markets. The company announced that itwould not exercise that right for one-and-a-half years while it perfected the concept, but urgedfranchisees to begin developing delivery-only units immediately.
Harvard Business School Marketing Cases
Pizza Hut, Inc. Case 69© The McGraw−Hill Companies, 2001
588-011 Pizza Hut, Inc.
8
The franchise community’s response was quick and clear. Most franchisees saw no reason torisk business in their eat-in restaurants by expanding into the delivery market. They denied that thedevelopment schedules allowed Pizza Hut to require them to open delivery units. They openlyexpressed their disagreement with the company’s delivery concept, especially regarding upsizing(referred to by one franchisee as “up-pricing”). They also questioned the necessity of thecomputerized Customer Service Centers and the delivery-only units (some franchisees wanted toretrofit existing restaurants, and others wanted carryout allowed in the delivery units). Significanttension arose between the company and its franchisees. At a heated IPHFHA board meeting inDecember 1985, board members and Pizza Hut senior management recognized that they had beenconcentrating too much on each other and not enough on Domino’s. They agreed to operatetemporarily under a “yellow flag” plan (an automobile racing term referring to the period when eachside continues to operate as before without either side trying to improve its relative position).
The company’s upsizing concept continued to be a focal point of disagreement. AlthoughPizza Hut suggested prices, the franchisees were free to price their products as they pleased. Thefranchisees argued that, even though they had not increased prices as frequently as the company-owned restaurants had in past years, they were still at a price disadvantage when compared to thecompetition. This disadvantage was especially acute in the delivery business; franchisees believedthat upsizing would exacerbate the problem because customers were conscious only of the absoluteprice of a small, medium, or large pizza and did not calculate price per square inch of the product.
The franchisees also wanted to know why Pizza Hut needed an expensive CSC system, ifDomino’s didn’t have one. They felt that if delivery was necessary, the costs should be kept as low aspossible. This meant simple phone ordering to each local restaurant, and delivery out of existingrestaurants where feasible. It was important to franchisees that the system be as flexible as possibleso that they could find local solutions to local problems.
The reorganization of Pizza Hut in early 1986, which provided for the delivery business tooperate autonomously from the traditional restaurant business, raised another issue in the franchisecommunity. Franchisees were concerned that while the company could afford to run the deliveryand eat-in businesses separately, the franchisees did not have the resources for separate marketingand operations departments for the traditional restaurant and delivery business. The mismatch oforganizational forms between company and franchisees was expected to create significantmanagement difficulties. To make matters worse, the Pizza Hut national advertising account hadbeen split in two within the advertising agency so that a separate group could begin working only ondelivery. Many franchisees viewed the two businesses as one and were concerned that theirseparation would make coordination between delivery and eat-in even more difficult.
There was little consensus of opinion among the franchisees regarding the various elementsof the company’s delivery concept. There was, however, virtual unanimous franchisee concurrencethat the existing franchise agreement did not cover delivery. In February 1986 Jim Baxter, who hadbeen with Pizza Hut for almost 10 years, was appointed vice president of restaurant franchising andassumed the role of liaison between the company and franchisees. In May, newly appointedpresident Steve Reinemund accompanied Baxter to a series of regional meetings with the franchiseeswhere Reinemund announced that the company no longer contended that the existing developmentagreement covered delivery. He also announced the company’s intention to negotiate with the boardof the IPHFHA to produce an amendment to the franchise agreement that would provide forsystemwide entry into the delivery market. Reinemund suggested that the amendment would includeincentives (e.g., reduced or no royalties for a certain time period on new delivery-only units) designedto make franchisee participation in the delivery segment more attractive. These incentives would beretroactive for any franchisee delivery-only units opened in the meantime. The amendment wouldtake effect if franchisees representing 85% of the units approved it within a specified time period.

Harvard Business School Marketing Cases
Pizza Hut, Inc. Case70 © The McGraw−Hill Companies, 2001
Pizza Hut, Inc. 588-011
9
The August Franchisee Meeting
As the August 1986 franchisee meeting drew near, Pizza Hut management decided it wastime to press again for the full involvement of all franchisees in systemwide entry into the deliverymarket. Pizza Hut operated delivery units in 16 markets, with a total of 284 company-owned units.The company had hired and trained over 10,000 people. The flagship Norfolk market, which hadexperienced difficulties, was now profitable. The first half-year results from the operating units wereimpressive, and Delivery General Manager Huston was confident that the company could make agood business case for delivery.
Huston and the delivery group gave an extremely upbeat presentation of the delivery data tofranchisees at the August meeting. Their purposes included (1) to convince franchisees that the timehad come to give total support to the delivery effort, (2) to “sell” the company’s delivery concept tothe franchisees, and (3) to successfully launch the amendment negotiation process that was to begin inearnest after the meeting. While many franchisees remained adamantly opposed to delivery, otherswere becoming convinced that they could, in fact, increase their overall income with delivery even ifthey would face decreased average margins. While the idea of delivery became more acceptable,however, there was still little support for the particulars of the company’s delivery concept.
The Current Situation
As the negotiations for an amendment to the Franchise Agreement continued into the fall of1986, competition in the delivery market intensified tremendously. Systemwide, Domino’s increasedadvertising 100% over the previous year. Moreover, much of its advertising was specifically focusedon the markets Pizza Hut was attempting to open for delivery. Domino’s spent an average of 68%more on advertising in those markets than in its other markets. Moreover, Domino’s had proven tobe an able competitor with satisfied customers and an inexperienced but highly enthusiastic franchisesystem. It met Pizza Hut head-on in each market Pizza Hut entered by focusing on execution,quality, advertising, and price.
Discounting became even more prevalent in late 1986. Fifty percent of Domino’s pizzas weresold on deal. Pantera’s joined Little Caesar in offering two-for-one deals; Godfather’s and Pizza Innlaunched their own delivery services also with deep price discounts. Delivery proved to be muchmore price, coupon, and deal sensitive than the traditional restaurant business.
Of the 19 Pizza Hut company-controlled markets open in December 1986, three wereprofitable. At the unit level, of the 361 company-owned operating delivery units, 194 were profitable.Company-owned delivery units that had opened early that year performed well from both a salesand profit perspective. The fierce competitive environment in markets opened later that year,however, led to slower sales growth and greater operating losses than expected for those units. Forexample, in one market, per-store average weekly sales rose to $6,600 after three weeks. Domino’shad responded with two-for-one deals for three months, and the per-store average weekly salesdropped to around $4,850. Moreover, in markets with greater than $8,000 per-store average weeklysales in traditional restaurants, Pizza Hut delivery units averaged $7,300; in markets wheretraditional per-store average was less than $8,000, delivery units averaged only $4,225. Overall, theaverage weekly sales per delivery unit in December was $6,000.
Huston believed that some of the markets were overbuilt with delivery units and that PizzaHut was getting all the sales that could be expected from those units. The ratio of traditionalrestaurants to potential customers averaged 1 restaurant to 70,000 people, while the delivery unitsaveraged 1 unit to 40,000 people.
Consumer research had shown that the standard Pizza Hut pizza served in the traditionalrestaurants was not as well-suited to the delivery environment, causing quality to suffer. Pizza Hut

Harvard Business School Marketing Cases
Pizza Hut, Inc. Case 71© The McGraw−Hill Companies, 2001
588-011 Pizza Hut, Inc.
10
research and development managers were confident that they could solve that problem bydeveloping a new product designed especially for delivery. This would involve an entirely differentproduction process than that used currently in the traditional restaurants.
Meanwhile, the number of franchisees who had introduced delivery was growing rapidly.Franchisees who in August had told Aaron that delivery would be “over their dead bodies” wereinviting him to visit their delivery operations. Moreover, many franchisees who had introduceddelivery were doing significantly better than the company-owned stores. Eighteen franchiseesopened a total of 65 delivery-only units in 1986, bringing the overall total to 96. All but two unitswith over seven months’ experience were profitable. In addition, by December 1986, 292 traditionalrestaurants had been retrofitted by franchisees to provide delivery service. Because the deliveryoperations were co-mingled with the eat-in and carryout operation in the retrofitted restaurants, itwas difficult to estimate their profitability; however, the franchisees were reported to be pleased withthe results so far. The franchisees’ success with delivery was attributed to the fact that they haddeveloped markets where they were already strong and had carefully picked the trade areas with thehighest potential. They had also priced more competitively, and only 20% had upsized. Most keptcosts low by having phone orders go direct to each separate unit instead of using Customer ServiceCenters.
The winter franchisee meeting was scheduled for January, and Reinemund, Huston, andBaxter had less than a month to decide how to proceed. Before deciding what to do at that meeting,they wanted to review the overall strategy and likely profit impact on Pizza Hut of delivery.

Harvard Business School Marketing Cases
Pizza Hut, Inc. Case72 © The McGraw−Hill Companies, 2001
Pizza Hut, Inc. 588-011
11
Exhibit 1 Top Pizza Chains, 1986
Systemwide Sales($ millions) Units
AverageCheck/Person Delivery
Pizza Hut 1,934 5,025 $9.99 Separate delivery unitsplus franchisee add-ondelivery out of restaurant
Domino’s 1,550 3,696 $9.50 Delivery only
Little Caesar 520 1,308 $2.75 No delivery
Pizza Inn 278.7 748 $4.30 Separate delivery units
Godfather’s 275 650 $9.75 Add-on delivery out ofrestaurant
Round Table Pizza 250 535 $5.00 Add-on delivery out ofrestaurant
Showbiz/Chuck E. Cheese 249 268 $5.20 No delivery
Shakey’s 197 386 $4.25 Add-on delivery out ofrestaurant
Mr. Gatti’s 139.2 319 $7.81 Add-on delivery out ofrestaurant
Adapted from Nation’s Restaurant News

Harvard Business School Marketing Cases
Pizza Hut, Inc. Case 73© The McGraw−Hill Companies, 2001
588-011 Pizza Hut, Inc.
12
Exhibit 2 Pizza Hut Historical Data (U.S. domestic only)
1979 1980 1981 1982 1983 1984 1985 1986
System net sales ($MM) 732 832 1,007 1,170 1,394 1,566 1,743 1,934
Market sharea 14.9 15.7 17.0 17.2 18.0 17.3 16.0 15.4
Unitsb:Company 1,940 1,888 1,843 1,845 1,911 2,051 2,224 2,534Franchise 1,801 1,873 1,922 1,975 2,095 2,157 2,309 2,491Total 3,741 3,761 3,765 3,820 4,006 4,208 4,533 5,025
Company
PSAc sales ($M) 196 221 267 306 348 372(Traditional) 395 400(Delivery) 282 289
PSA sales growthReal (3.1) 4.7 11.8 8.0 9.8 1.8 2.0 (2.0)Price 6.4 8.1 9.0 6.6 3.9 5.1 3.4 .8Total 3.3 12.8 20.8 14.6 13.7 6.9 5.4 (1.2)
Net sales ($MM) 354 399 476 556 678 766 835 929
Net sales growth(%) -- 12.7 19.3 16.8 21.9 13.0 9.0 11.3
Total revenues ($MM) 495 556 489 569 699 795 867 967
ROAE (%)d 3.5 6.1 8.9 16.4 21.7 16.9 15.0 12.4
Franchisees:
PSA sales ($M) 237 280 314 350 386 400 415
Net sales ($MM) 378 433 531 613 715 799 908 1,005
aBased on data from GDR/Crest Enterprises, Inc.bTotal number of U.S. domestic units of all kinds: restaurant, delivery, and mobile open that yearcPSA—Per Store Average: annual average computed by dividing total sales for each four-week store period by number of storesopen during that period and then aggregating across all 13 store periodsdReturn on Assets Employed: calculated as earnings divided by year’s average net asset base

Harvard Business School Marketing Cases
Pizza Hut, Inc. Case74 © The McGraw−Hill Companies, 2001
Exhibit 3 Traditional Red-Roof Pizza Hut Restaurant
Pizza Hut, Inc 588-011
13
Delivery Unit
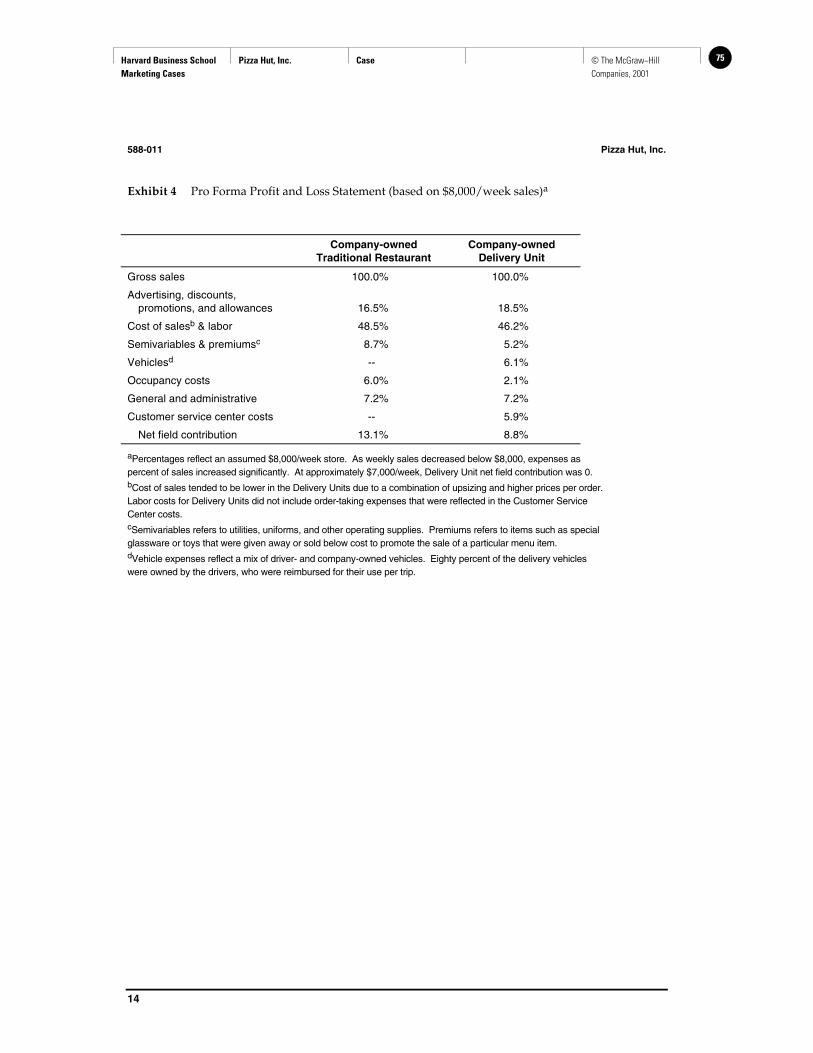
Harvard Business School Marketing Cases
Pizza Hut, Inc. Case 75© The McGraw−Hill Companies, 2001
588-011 Pizza Hut, Inc.
14
Exhibit 4 Pro Forma Profit and Loss Statement (based on $8,000/week sales)a
Company-ownedTraditional Restaurant
Company-ownedDelivery Unit
Gross sales 100.0% 100.0%
Advertising, discounts,promotions, and allowances 16.5% 18.5%
Cost of salesb & labor 48.5% 46.2%
Semivariables & premiumsc 8.7% 5.2%
Vehiclesd -- 6.1%
Occupancy costs 6.0% 2.1%
General and administrative 7.2% 7.2%
Customer service center costs -- 5.9%
Net field contribution 13.1% 8.8%
aPercentages reflect an assumed $8,000/week store. As weekly sales decreased below $8,000, expenses aspercent of sales increased significantly. At approximately $7,000/week, Delivery Unit net field contribution was 0.bCost of sales tended to be lower in the Delivery Units due to a combination of upsizing and higher prices per order.Labor costs for Delivery Units did not include order-taking expenses that were reflected in the Customer ServiceCenter costs.cSemivariables refers to utilities, uniforms, and other operating supplies. Premiums refers to items such as specialglassware or toys that were given away or sold below cost to promote the sale of a particular menu item.dVehicle expenses reflect a mix of driver- and company-owned vehicles. Eighty percent of the delivery vehicleswere owned by the drivers, who were reimbursed for their use per trip.

Harvard Business School Marketing Cases
Pizza Hut, Inc. Case76 © The McGraw−Hill Companies, 2001
588-
011
-
15-
Exh
ibit
5O
rgan
izat
ion
Cha
rt
Piz
za H
ut,
Inc.
Presi
dent/
CEO
Ste
ve
Rein
em
un
d
Vic
ePr
esi
dent,
Franch
ise
Deve
lopm
ents
Vic
ePr
esi
dent,
Field
Opera
tions
Senio
rD
irect
or,
Opera
tions
Serv
ices
Regio
nalVic
ePr
esi
dent
Paci
ficRegio
n
Vic
ePr
esi
dent,
Deliv
ery
Opera
tions
Vic
ePr
esi
dent,
Deliv
ery
Mark
etin
g
Regio
nal
Vic
ePr
esi
dent
West
Regio
nal
Vic
ePr
esi
dent
North
Atla
ntic
Regio
nal
Vic
ePr
esi
dent
South
east
Direct
or,
Pla
nnin
gand
Deve
lopm
ent
Regio
nal
Vic
ePr
esi
dent
North
Central
Regio
nal
Vic
ePr
esi
dent
South
Central
Regio
nal
Vic
ePr
esi
dent
East
Central
Regio
nal
Vic
ePr
esi
dent
South
east
Regio
nal
Vic
ePr
esi
dent
Cum
berland
Regio
nal
Vic
ePr
esi
dent
North
Atla
ntic
Direct
or,
Fle
et-
Direct
ory
Vic
ePr
esi
dent,
Law
Vic
ePr
esi
dent,
Rese
arc
hand
Engin
eering
Senio
rVP
and
Genera
lM
gr.
Deliv
ery
,A
lla
nH
usto
n
Senio
rVic
ePr
esi
dent,
Finance
Senio
rVic
ePr
esi
dent,
Mark
etin
g
Vic
ePr
esi
dent,
Rest
aura
nt
Deve
lopm
ent
Senio
rVic
ePr
esi
dent,
Pers
onnel
Senio
rVic
ePr
esi
dent,
Opera
tions
Vic
ePr
esi
dent
Franch
isin
g,
Jim
Ba
xte
r

Harvard Business School Marketing Cases
Pizza Hut, Inc. Case 77© The McGraw−Hill Companies, 2001
588-011 Pizza Hut, Inc.
16
Exhibit 6 Open Pizza Hut System Traditional Restaurants and Delivery Unitsa
Company-Owned Franchisee-Owned
TraditionalRestaurants
Delivery-onlyUnits
TraditionalRestaurantsb Retrofit
Delivery-onlyUnits
August 1984 2,011 11 2,089 70 15
December 1984 2,025 16 2,137 98 20
August 1985 2,046 51 2,256 131 30
December 1985 2,004 78 2,352 162 46
August 1986 2,208 284 2,277 241 66
December 1986 2,173 361 2,395 292 96
aDomestic U.S. restaurants and delivery units onlybTotals for franchisee-owned traditional restaurants include those restaurants retrofitted to provide delivery service.

78 Harvard Business School Marketing Cases
Black & Decker Corp.: Household Products Group, Brand Transition
Case © The McGraw−Hill Companies, 2001
Harvard Business School 9-588-015Rev. October 6, 1992
Research Assistant Cynthia Bates prepared this case under the supervision of Professor John A. Quelch as the basis for classdiscussion rather than to illustrate either effective or ineffective handling of an administrative situation. Professor MinetteE. Drumwright prepared this version of the case. Proprietary data have been disguised.
Copyright © 1987 by the President and Fellows of Harvard College. To order copies or request permission toreproduce materials, call 1-800-545-7685 or write Harvard Business School Publishing, Boston, MA 02163. Nopart of this publication may be reproduced, stored in a retrieval system, used in a spreadsheet, or transmitted inany form or by any means—electronic, mechanical, photocopying, recording, or otherwise—without thepermission of Harvard Business School.
1
The Black & Decker CorporationHousehold Products Group: Brand Transition
In April 1984, Black & Decker Corp. (B&D) acquired the Housewares Division of GeneralElectric Co. (GE), combining the GE small-appliance product line with its own household product lineto form the Household Products Group. The terms of the acquisition set the stage for a uniquemarketing challenge. B&D was permitted to manufacture and market appliances carrying the GEname, but only until April 1987. During the intervening three years, B&D would have to replace theGE name on all the acquired models with its own brand name.
Immediately after the acquisition, Kenneth Homa, B&D’s vice president of marketing, wasassigned responsibility for the brand transition. Homa had to design a marketing program to transferthe B&D name to the GE small-appliance lines without losing market share. Specifically, he had todetermine the timing for the transition of the various GE product lines and the roles that advertisingand promotion should play in the transition. Homa had been asked to have the proposal for thebrand transition completed by June 1�only a week away. Before he began to formulate the proposal,Homa reviewed the acquisition and the challenges it presented.
The Acquisition
With 1983 sales of $1,167 million, B&D was the leading worldwide manufacturer ofprofessional and consumer hand-held power tools. Over 100 products were produced in 21 factoriesaround the world. By the late 1970s, B&D was confronting two important problems—a slowergrowth rate for the power tool market worldwide together with increasing foreign competition. Atthe same time, management realized that the American housewares market presented a significantopportunity. Capitalizing on its expertise in small-motor production1 and cordless appliancetechnology, B&D introduced the Dustbuster� in 1979, a rechargeable hand-held vacuum cleaner. TheDustbuster Vac “moved B&D from the garage into the house”; 60% of Dustbuster purchases weremade by women. The Dustbuster’s success prompted the launch of two other rechargeable products,the Spotliter� rechargeable flashlight and the Scrub Brusher� cordless scrubber. In 1983, these threeproducts generated revenues of over $100 million, almost one-third of B&D’s U.S. consumer product
1In 1983, B&D produced 20 million small motors, four times as many as its closest competitor.
79Harvard Business School Marketing Cases
Black & Decker Corp.: Household Products Group, Brand Transition
Case © The McGraw−Hill Companies, 2001
588-015 The Black & Decker Corporation Household Products Group: Brand Transition
2
sales. Pretax profit margins on these products were estimated at a healthy 10%. Sales of the threeproducts were expected to increase by 30% annually between 1983 and 1985.
Consumer demand for these three innovative products led B&D executives to conclude thatfurther penetration of the housewares market could generate substantial sales and profits for thecompany. They resolved to develop a family of products that could address consumer needs“everywhere in the house, not just in the basement or garage.” However, a significant impediment togrowth was B&D’s limited access to housewares buyers in the major retail chains. B&D’s threehousewares products were sold along with B&D’s power tools through hardware distributors tohardware buyers and were typically stocked in the hardware sections of retail stores. B&D sought togain access to housewares buyers through the acquisition of a competitor, the GE HousewaresDivision.
With 1983 sales of $500 million (GE’s total sales in 1983 were $26.79 billion), GE’sHousewares Division was the largest competitor in the U.S. electric housewares or small-appliancemarket. (GE sales of small appliances outside the United States were limited. By contrast, 40% ofB&D’s total sales were made in Europe.) GE sold almost 150 models of products in 14 categoriescovering food preparation, ovening, garment care, personal care, and home security. (The categorieswere food processors, portable mixers, electric knives, can openers, drip coffee makers, toaster ovens,toasters, electric skillets, grills and griddles, irons, hair dryers, curling brushes/irons, scales, andsecurity alarms.) In all the appliance categories in which it competed—except food processors, haircare products, and toasters—GE ranked first or second in market share. GE’s success largely resultedfrom continuing attention to product innovation. For example, the GE product line included therecently introduced Spacemaker� series of premium-priced under-the-cabinet kitchen appliances.The division’s 150-person sales force called on housewares buyers in all channels of distribution.
Discussions between GE and B&D culminated in an agreement, announced in February 1984,whereby B&D would acquire the GE Housewares Division for $300 million, comprising $110 millionin cash, a $32 million three-year note, and 6% of B&D stock. In return, B&D acquired seven plants inthe United States, Mexico, Brazil, and Singapore; five distribution centers; sixteen service centers; andthe Housewares Division’s sales and management team. GE retained rights to the accounts receivableat the time of the transfer. Finally, B&D negotiated the right to continue to use the GE name onappliances in the Housewares Division product line for three years from the signing of the acquisitionpapers in April 1984. However, B&D could not use the GE name on any new appliances introducedafter the acquisition. At a stroke, the acquisition transformed B&D from a specialist housewaresmanufacturer into the dominant full-line player in the housewares market.
The Housewares Market
Product Lines and Pricing
After acquiring the GE division, B&D participated in five more broad housewares categorieswith aggregate industry sales of $1.4 billion divided as follows:
Food preparation $275 millionBeverage makers $325 millionOvening $250 millionGarment care $200 millionPersonal care $350 million

80 Harvard Business School Marketing Cases
Black & Decker Corp.: Household Products Group, Brand Transition
Case © The McGraw−Hill Companies, 2001
The Black & Decker Corporation Household Products Group: Brand Transition 588-015
3
The housewares market was mature and fragmented. Industry growth depended primarilyon the rate of household formation and the pace of new product development. About one-tenth of allsmall appliances in use were replaced each year. The timing of replacement purchases could beaccelerated if manufacturers could persuade consumers to trade up to more highly featured, higher-priced, higher-margin models of a particular appliance.
The new B&D offered one of the broadest lines of any manufacturer, competing in 17 productgroups. Market performance data for the principal product lines are summarized in Exhibit 1. In allthese groups, B&D marketed multiple models that covered almost all price points and productfeature configurations. For example, the B&D line included 18 different irons with suggested retailprices from $14.76 to $25.89. The range included promotional, step-up, and premium models.Proctor-Silex, B&D’s closest competitor in this category, offered 12 models.
B&D’s models were priced competitively within each price/feature segment but, overall,B&D’s share tended to be stronger in the medium and upper rather than the lower price ranges. Inthe fall of 1984, the average retail price of a B&D small appliance was 16% higher than the averageretail price of its competitors’ appliances. The B&D retail price premium varied across productcategories as follows:
Food preparation 8% Cleaning (Dustbuster, Scrub Brusher) 10%Ovening 26 Lighting (Spotliter) 6Garment care 5 Smoke alarms 9Personal care 16
Some B&D executives were concerned that the price premium in certain categories left B&Dvulnerable to lower-priced competition. They advocated price decreases on some models for 1985.Other executives, noting that B&D/GE housewares prices had increased on average by only 10%between 1980 and 1984, believed that price increases were necessary to maintain margins. (Thecontribution margin on B&D small appliances, after variable costs, averaged 40%. The percentagemargin was higher on premium models such as the Spacemaker products.) However, all agreed that,despite B&D’s share leadership position, competitive brands did not appear to set their prices inrelation to B&D’s prices.
B&D’s price premium in the food preparation category was largely due to the premium-priced Spacemaker line of under-the-cabinet kitchen appliances. Launched in 1982 with a can opener,the Spacemaker line was expanded in 1983 to include a toaster oven, drip coffee maker, mixer, andelectric knife. The Spacemaker line attracted some first-time purchasers into these five categories but,more important, persuaded current owners to trade up. Although the Spacemaker line at firstreversed GE’s share erosion in these categories, lower-priced imitations soon appeared. GE’sstandard countertop version of the Spacemaker appliances lost share as GE’s competitors slashedprices to maintain their sales volumes in countertop models. Nevertheless, Spacemaker models wereexpected to account for about 40% of B&D’s 1984 unit sales in the five product categories in whichthey competed.
Competition
B&D’s principal competitors in the housewares market were Sunbeam (a subsidiary ofAllegheny International), Proctor-Silex (Westray), Hamilton Beach (Scovill), and Norelco (Philips).Few offered as broad a line as B&D, but all four competed with B&D in at least six categories. Inaddition, B&D had to contend with specialist competitors in each product category. For example,Cuisinart was the market share leader in food processors as was Mr. Coffee in drip coffee makers.European manufacturers, such as Krups, were increasingly penetrating and helping to expand thepremium price segment in some categories. Their higher-margin products were welcomed by
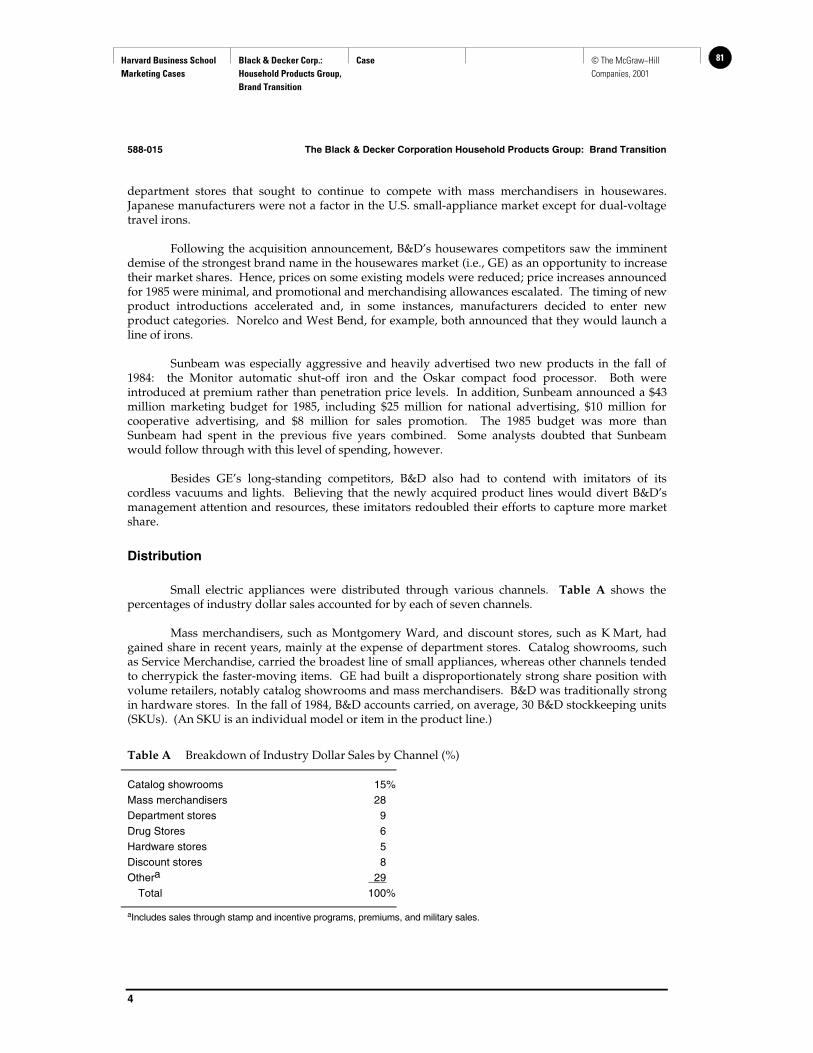
81Harvard Business School Marketing Cases
Black & Decker Corp.: Household Products Group, Brand Transition
Case © The McGraw−Hill Companies, 2001
588-015 The Black & Decker Corporation Household Products Group: Brand Transition
4
department stores that sought to continue to compete with mass merchandisers in housewares.Japanese manufacturers were not a factor in the U.S. small-appliance market except for dual-voltagetravel irons.
Following the acquisition announcement, B&D’s housewares competitors saw the imminentdemise of the strongest brand name in the housewares market (i.e., GE) as an opportunity to increasetheir market shares. Hence, prices on some existing models were reduced; price increases announcedfor 1985 were minimal, and promotional and merchandising allowances escalated. The timing of newproduct introductions accelerated and, in some instances, manufacturers decided to enter newproduct categories. Norelco and West Bend, for example, both announced that they would launch aline of irons.
Sunbeam was especially aggressive and heavily advertised two new products in the fall of1984: the Monitor automatic shut-off iron and the Oskar compact food processor. Both wereintroduced at premium rather than penetration price levels. In addition, Sunbeam announced a $43million marketing budget for 1985, including $25 million for national advertising, $10 million forcooperative advertising, and $8 million for sales promotion. The 1985 budget was more thanSunbeam had spent in the previous five years combined. Some analysts doubted that Sunbeamwould follow through with this level of spending, however.
Besides GE’s long-standing competitors, B&D also had to contend with imitators of itscordless vacuums and lights. Believing that the newly acquired product lines would divert B&D’smanagement attention and resources, these imitators redoubled their efforts to capture more marketshare.
Distribution
Small electric appliances were distributed through various channels. Table A shows thepercentages of industry dollar sales accounted for by each of seven channels.
Mass merchandisers, such as Montgomery Ward, and discount stores, such as K Mart, hadgained share in recent years, mainly at the expense of department stores. Catalog showrooms, suchas Service Merchandise, carried the broadest line of small appliances, whereas other channels tendedto cherrypick the faster-moving items. GE had built a disproportionately strong share position withvolume retailers, notably catalog showrooms and mass merchandisers. B&D was traditionally strongin hardware stores. In the fall of 1984, B&D accounts carried, on average, 30 B&D stockkeeping units(SKUs). (An SKU is an individual model or item in the product line.)
Table A Breakdown of Industry Dollar Sales by Channel (%)
Catalog showrooms 15%Mass merchandisers 28Department stores 9Drug Stores 6Hardware stores 5Discount stores 8Othera 29
Total 100%
aIncludes sales through stamp and incentive programs, premiums, and military sales.

82 Harvard Business School Marketing Cases
Black & Decker Corp.: Household Products Group, Brand Transition
Case © The McGraw−Hill Companies, 2001
The Black & Decker Corporation Household Products Group: Brand Transition 588-015
5
Most retailers did not view small appliances as especially profitable. Retail margins averaged15% to 20%, though promotional merchandise was typically sold near cost. Hence, the spaceallocated to housewares by most chains remained stable, despite an increasing proliferation of newproducts. As a result, manufacturers were under more pressure than ever to secure shelf spacethrough merchandising and promotion incentives.
Housewares and hardware buyers at B&D’s major accounts determined twice a year whichmodels they would specify as “basics.” These selected models were carried in distribution for thefollowing six months, usually in all the stores of a chain. Other models not specified as basics mightoccasionally be stocked but only in response to temporary promotion offers.
Basics were typically specified in January and May. Retail sales of small appliances peakedbefore Mother’s Day and Christmas. Twenty-one percent of retail sales occurred in the first calendarquarter, 21% in the second, 17% in the third, and 41% in the fourth. Manufacturers and retailersscheduled their advertising and promotion efforts accordingly.
Consumer Behavior
Consumers shopping for small appliances were often characterized as having lowinformation needs, low perceived interbrand differentiation, and high price sensitivity. A 1984 B&Dsurvey drew the following conclusions:
• Two out of three consumers bought their last housewares appliance on saleand/or with a rebate. The highest percentages bought on sale were thecountertop drip coffee makers, mixers, and can openers.
• Two out of three consumers compared the prices of different brands and checkedto see which brands were on sale.
• Fewer than one out of three consumers would wait until a specific brand went onsale.
• Almost three out of four consumers were willing to switch from their currentbrands when they purchased replacements. However, fewer than one out of fourconsumers were indifferent to brand names.
A follow-up study of buying behavior for irons found that most consumers, when theyneeded a replacement, would not wait for a sale but would check to see if a store was having a sale.Fifty percent bought a replacement within seven days. Only 10% of the irons were bought as gifts.Forty-two percent of the purchasers had a specific brand in mind when they set off for the store, and85% ended up buying that brand. Thirty-eight percent were attracted to a particular store by itsadvertisement, and most bought at the first store in which they shopped. Half of all purchasersbought their irons on sale and/or with a rebate.
Planning the Brand Transition
Consumer Research
To aid transition planning, B&D surveyed 600 men and women 18 to 49 years old in fourgeographically representative cities during July 1984. The survey first probed consumers’ awarenessof 10 housewares manufacturers, their ownership of small appliances by each manufacturer, and the

83Harvard Business School Marketing Cases
Black & Decker Corp.: Household Products Group, Brand Transition
Case © The McGraw−Hill Companies, 2001
588-015 The Black & Decker Corporation Household Products Group: Brand Transition
6
degree to which their overall image ratings of each manufacturer were favorable or unfavorable.These results are summarized in Exhibit 2.
Next, respondents were asked to rate each manufacturer on various attributes using a 100-point scale. Averaging all responses, the researchers identified B&D’s strengths and weaknessescompared with its main housewares competitors (GE excluded) and then with GE (see Table B).
Table B B&D’s Strengths and Weaknesses
B&D Advantage vs.Closest Competitora
B&D (Dis)Advantagevs. GE
B&D StrengthsHas high-quality workmanship +24 +5Makes durable products +23 +4Makes reliable products +20 +1Leader in making innovative products +18 (7)
B&D VulnerabilitiesMakes products that can be easily serviced +7 (17)Makes products most people would consider buying +7 (12)Makes attractive, good-looking products +6 (8)Makes products that are generally priced lower +5 (9)Makes products that are easily found +2 (9)
aOther than GE.
The survey asked respondents whether they currently perceived B&D favorably orunfavorably as a manufacturer of each of 16 products. The percentages answering “very favorably”on a four-point scale were as follows:
Smoke alarms 62%Flashlights 60Vacuums 48Grills/griddles 29Electric knives 25Can openers 24Scales 22Toaster ovens 21Irons 18Portable mixers 17Toasters 17Food processors 16Coffee makers 13Skillets 12Curling irons 11Hair dryers 9
Qualitative research indicated that consumers considered B&D a suitable manufacturer of theseproducts but were largely unaware that B&D already made them.

84 Harvard Business School Marketing Cases
Black & Decker Corp.: Household Products Group, Brand Transition
Case © The McGraw−Hill Companies, 2001
The Black & Decker Corporation Household Products Group: Brand Transition 588-015
7
Product Plans
Homa knew that B&D executives disagreed concerning both the timing and the manner inwhich the B&D name should be transferred to the GE small-appliance line. In talking with otherexecutives, he had identified five points of view.
One group of executives argued that the name change should be executed across the entireproduct line as soon as possible to demonstrate B&D’s commitment to the trade. At the otherextreme, a second group, skeptical about the likely pulling power of the B&D brand in housewares,proposed that B&D delay the name transfer until the end of the three-year period.
A third group of executives supported a gradual transition whereby all the items in one ortwo product categories would be reintroduced under the B&D name in successive six-month periods.A fourth group wanted to execute the name change first on the premium quality items in severalproduct categories to be followed later by the remaining lower-priced items in each product line. Afifth group argued that the transition schedule should be linked to a new product developmentprogram. Through such a program, the name change would be implemented in a product categoryonly after the product line and packaging had been redesigned and/or when B&D could offer a newproduct with enhanced features.
As he planned the transition program, Homa also had to consider proposals for new orrevised products that B&D product managers had submitted. The proposals included the following:
• The Spacemaker line of under-the-cabinet appliances, which had been acquiredfrom GE, could be redesigned by B&D to look sturdier and more compact. Theedges could be rounded for additional safety.
• B&D could develop Black Tie�, a line of “men’s grooming tools,” which wouldbe priced at a 15% premium over the hair care line acquired from GE.
• Plans had been developed for the Stowaway line of dual-voltage travelappliances. The line would include a folding iron, hair dryer, and curling irons.
• The Handymixer cordless beater, the first extension of B&D’s cordless technologyinto the kitchen, had been proposed.
• An automatic shut-off iron had been designed by B&D. Unlike the Sunbeammodel, the B&D iron would beep to let the consumer know that it had been lefton.
Communications
An effective communications plan would be integral to the brand transition. Historically,B&D and GE had implemented communications programs with fundamental differences. Specif-ically, GE had emphasized push programs (e.g., volume rebates, purchase allowances), which wereaimed at the trade, while B&D had emphasized pull programs (e.g., advertising, consumer rebates),which targeted consumers. These differences are reflected in Exhibits 3 and 4, which summarize theadvertising and promotion expenditures for GE and B&D before the acquisition. Homa’s tentativerecommendations for 1985 communications expenditures also are included in Exhibits 3 and 4.

85Harvard Business School Marketing Cases
Black & Decker Corp.: Household Products Group, Brand Transition
Case © The McGraw−Hill Companies, 2001
588-015 The Black & Decker Corporation Household Products Group: Brand Transition
8
Advertising
Increased advertising expenditures would be necessary to bolster consumer brand loyalties inthe face of more aggressive competition. Homa estimated that media expenditures of $100 millionwould be needed for the brand transition.
The issue of how to handle the brand transition in advertising was much debated. Someexecutives believed that explicit references to GE in B&D’s advertising were necessary to maintainmarket share during the transition, especially in categories where GE’s brand name equity wasstrong. These executives wanted a transition statement such as “designed by GE, built by B&D” to beincluded in advertising. They also wanted hang tags on B&D products at the point of sale to indicatethat the products had formerly been made by GE. Critics of this dual-branding approach, whichincluded B&D’s advertising agency, argued that it would confuse consumers and simply sustain theGE franchise. Exhibits 5 and 6 present television advertisements proposed by B&D’s advertisingagency.
Promotional Programs
Homa had to determine whether or not to maintain GE’s more generous support ofpromotional programs. Some trade accounts already had expressed concern about potential cutbacksthat B&D might implement. Competitive housewares manufacturers did all they could to cultivatethis concern in an effort to secure additional basics listings and shelf space for their own products.
At the time of the acquisition, GE’s promotional programs for the trade included purchaseallowances, volume rebates, dating discounts, and cooperative advertising. Promotional programsfor consumers focused on consumer rebates.
Purchase allowances During the 1970s, GE initiated purchase allowances (PAs) on selectedmodels against orders paid for during the first two months after Christmas and Mother’s Day, thepeak retail selling periods. Over time, PAs came to be offered on orders placed beyond these two-month periods. By 1983, 90% of shipments included an off-invoice PA.
Volume rebates GE operated a volume rebate program that offered trade accounts a year-endrefund of up to 4 % of their net purchases during the year. Accounts qualified for variouspercentage rebates according to the degree to which their purchases increased over those of theprevious year. There were two other features of the program. First, the rebates were computed on anaccount’s total purchases rather than separately for each shipping point. Second, the programattempted to maintain the total number of SKUs by requiring a dealer to have incremental sales infour of six defined product categories to earn the minimum rebate.
Dating discounts Dating allowed customers to pay for goods after they were shipped andreceived. Dating encouraged trade accounts to place early orders for goods that they did not have topay for immediately. The seasonality of retail sales and the desire of trade accounts to avoid holdinghigh bulk-to-value small appliances in their own warehouses made dating programs a necessity inthe small-appliance industry. Production planning and scheduling could become more efficient if atrade account placed early orders at the same time that it decided which SKUs to specify for its basicslineup.
GE Housewares Division’s standard terms required full payment by the tenth of the monthfollowing an order, plus 45 days. The dating program permitted an account to place an order in Mayand June for shipment before September 1 and payment by December 10. A second dating programrequired payment by May 10 on orders placed in December and January. A schedule of early-payment allowances rewarded accounts for payment of invoices before the dating program due date.GE’s purchase allowance and dating programs together permitted accounts to pay less and pay later.
86 Harvard Business School Marketing Cases
Black & Decker Corp.: Household Products Group, Brand Transition
Case © The McGraw−Hill Companies, 2001
The Black & Decker Corporation Household Products Group: Brand Transition 588-015
9
Cooperative advertising GE’s Housewares Division had long offered trade accounts a cooperativeadvertising program. Accounts accrued 3% of their net purchases in a rolling 12-month cooperativeadvertising fund. (Allowances accrued more than 12 months previously that had not been spent wereforfeited.) Accounts could draw on these accruals to subsidize the cost of retail advertising thatfeatured GE products. GE paid the full cost of qualifying advertising but sometimes only partiallycharged accounts’ accrual funds if they featured particularly profitable premium-priced productssuch as items in the Spacemaker line, if they ran advertisements featuring multiple GE items, or ifthey timed their advertising to coincide with flights of GE national advertising.
Consumer rebates Initiated in the 1970s to help sell slower-moving models, consumer rebates hadbecome endemic to the housewares category by the early 1980s. By 1983, almost all list priceincreases were cushioned with rebates, and three-quarters of all feature advertisements for GEhousewares included references to manufacturer rebate offers. The average value of housewaresmanufacturers’ consumer rebates escalated as each tried to outdo the other. In an effort to lead theindustry toward more realistic list pricing, GE in 1983 curtailed rebates on irons and toaster ovens,two categories in which it was the market share leader. Far from following GE’s lead, competitorsincreased their rebate offers. As a result, GE’s share declined six points in both categories within sixmonths.
Conclusion
Homa had two main concerns. How could the B&D brand name be transferred mosteffectively to the GE small-appliance line? What kind of communications program would facilitatethe transfer?

87Harvard Business School Marketing Cases
Black & Decker Corp.: Household Products Group, Brand Transition
Case © The McGraw−Hill Companies, 2001
588-015 The Black & Decker Corporation Household Products Group: Brand Transition
10
Exhibit 1 Market Performance Summary for Selected Product Lines
Product Year
GE/B&DUnit Share
(%)
FeatureAd
Share(%)
AverageRetail
Price ($)
GE/B&DShare
Rank in1984
MajorCompetitors (Share and Rank)
Food 1983 16% 9% $55.00 3 Cuisinart 25% (1)processors 1984 13 7 72.00 Hamilton Beach 21 (2)
1985a 15 8 NA Moulinex 11 (4)Sunbeam 7 (5)
Mixers 1983 31 22 16.00 2 Sunbeam 28 (1)1984 26 20 15.40 Hamilton Beach 21 (3)1985a 35 16 NA
Can openers 1983 28 25 17.65 1 Rival 30 (2)1984 34 23 20.52 Sunbeam 8 (3)1985a 30 26 NA Hamilton Beach 6 (4)
Toasters 1983 13 16 16.63 3 Toastmaster 32 (1)1984 12 10 21.01 Proctor-Silex 30 (2)1985a 11 10 NA
Toaster 1983 56 49 45.51 1 Toastmaster 25 (2)ovens 1984 52 39 47.85 Proctor-Silex 8 (3)
1985a 50 40 NA Norelco 4 (4)
Drip coffee 1983 17 13 34.48 2 Mr. Coffee 19 (1)makers 1984 18 15 37.63 Norelco 17 (3)
1985a 17 16 NA Hamilton Beach 9 (4)Proctor-Silex 8 (5)
Electric 1983 39 NA 13.54 2 Hamilton Beach 47 (1)knives 1984 37 NA 17.28 Moulinex 8 (3)
1985a 39 NA 17.65
Irons 1983 52 39 20.44 1 Proctor-Silex 18 (2)1984 46 29 21.83 Sunbeam 13 (3)1985a 45 29 NA Hamilton Beach 11 (4)
Hair care 1983 8 8 17.74 4 Conair 22 (1)1984 6 4 15.37 Clairol 12 (2)1985a 5 3 NA Sassoon 8 (3)
Cordless 1983 NA NA NA Douglas 8 (2)vacuums 1984 NA 38 NA 1 Sears 8 (2)
1985a NA 38 25.70 Norelco 7 (4)
Lighting 1983 65 NA NA 1 First Alert 25 (2)products 1984 57 44 NA Sunspot 5 (3)
1985a 38 36 21.10 Norelco 4 (4)
Note: NA means not available.aFigures for 1985 are estimated.
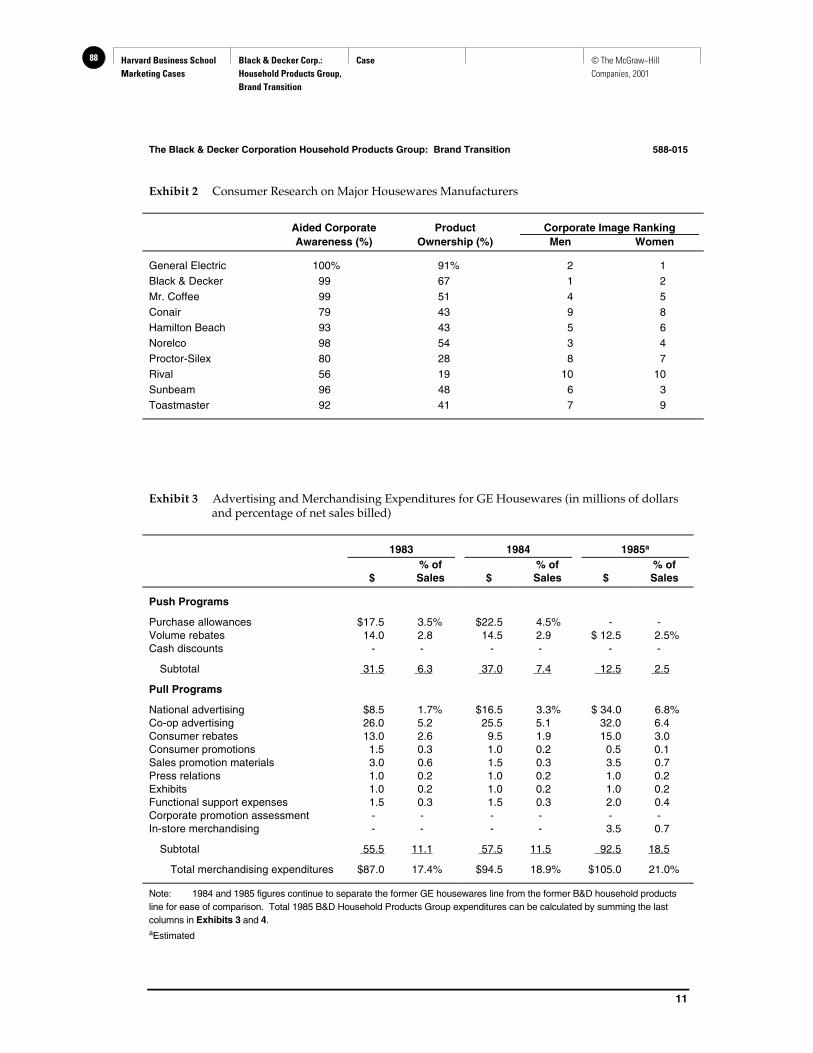
88 Harvard Business School Marketing Cases
Black & Decker Corp.: Household Products Group, Brand Transition
Case © The McGraw−Hill Companies, 2001
The Black & Decker Corporation Household Products Group: Brand Transition 588-015
11
Exhibit 2 Consumer Research on Major Housewares Manufacturers
Aided Corporate Product Corporate Image RankingAwareness (%) Ownership (%) Men Women
General Electric 100% 91% 2 1Black & Decker 99 67 1 2Mr. Coffee 99 51 4 5Conair 79 43 9 8Hamilton Beach 93 43 5 6Norelco 98 54 3 4Proctor-Silex 80 28 8 7Rival 56 19 10 10Sunbeam 96 48 6 3Toastmaster 92 41 7 9
Exhibit 3 Advertising and Merchandising Expenditures for GE Housewares (in millions of dollarsand percentage of net sales billed)
1983 1984 1985a
$% ofSales $
% ofSales $
% ofSales
Push Programs
Purchase allowances $17.5 3.5% $22.5 4.5% - -Volume rebates 14.0 2.8 14.5 2.9 $ 12.5 2.5%Cash discounts - - - - - -
Subtotal 31.5 6.3 37.0 7.4 12.5 2.5
Pull Programs
National advertising $8.5 1.7% $16.5 3.3% $ 34.0 6.8%Co-op advertising 26.0 5.2 25.5 5.1 32.0 6.4Consumer rebates 13.0 2.6 9.5 1.9 15.0 3.0Consumer promotions 1.5 0.3 1.0 0.2 0.5 0.1Sales promotion materials 3.0 0.6 1.5 0.3 3.5 0.7Press relations 1.0 0.2 1.0 0.2 1.0 0.2Exhibits 1.0 0.2 1.0 0.2 1.0 0.2Functional support expenses 1.5 0.3 1.5 0.3 2.0 0.4Corporate promotion assessment - - - - - -In-store merchandising - - - - 3.5 0.7
Subtotal 55.5 11.1 57.5 11.5 92.5 18.5
Total merchandising expenditures $87.0 17.4% $94.5 18.9% $105.0 21.0%
Note: 1984 and 1985 figures continue to separate the former GE housewares line from the former B&D household productsline for ease of comparison. Total 1985 B&D Household Products Group expenditures can be calculated by summing the lastcolumns in Exhibits 3 and 4.aEstimated

89Harvard Business School Marketing Cases
Black & Decker Corp.: Household Products Group, Brand Transition
Case © The McGraw−Hill Companies, 2001
588-015 The Black & Decker Corporation Household Products Group: Brand Transition
12
Exhibit 4 Advertising and Merchandising Expenditures for Black & Decker Household Products (inmillions of dollars and percentage of net sales billed)
1983 1984 1985a
$% ofSales $
% ofSales $
% ofSales
Push Programs
Flexible funds (off-invoice) - - - - - -Retail incentive plan - - - - $ 1.0 0.6%Cash discounts $ 0.9 0.9% $ 1.2 0.9% 1.5 0.9
Subtotal 0.9 0.9 1.2 0.9 2.5 1.5
Pull Programs
National advertising $ 8.9 8.9% $12.0 9.2% $18.6 11.0%Co-op advertising 2.0 2.0 3.1 2.4 7.3 4.3Consumer rebates - - 2.2 1.7 11.7 6.9Consumer promotions - - - - - -Sales promotion materials 0.5 0.5 1.6 1.2 1.4 0.8Press relations - - - - - -Exhibits - - 0.1 0.1 0.3 0.2Functional support expenses - - 0.1 0.1 0.3 0.2Corporate promotion assessment - - 1.0 0.8 2.0 1.2In-store merchandising - - - - - -
Subtotal 11.4 11.4 20.1 15.5 41.6 24.6
Total merchandising expenditures $12.3 12.3% $21.3 16.4% $44.1 26.1%
Note: B&D household products: Dustbuster Vac, Spotliter, and Scrub Brusher.aEstimated

90 Harvard Business School Marketing Cases
Black & Decker Corp.: Household Products Group, Brand Transition
Case © The McGraw−Hill Companies, 2001
Exhibit 5 Proposed 1985 Spacemaker Advertisement
The Black & Decker Corporation Household Products Group: Brand Transition 588-015
13

91Harvard Business School Marketing Cases
Black & Decker Corp.: Household Products Group, Brand Transition
Case © The McGraw−Hill Companies, 2001
Exhibit 5 Proposed 1985 Spacemaker Advertisement
The Black & Decker Corporation Household Products Group: Brand Transition588-015
14

92 Harvard Business School Marketing Cases
Eastman Kodak Co.: Funtime Film
Case © The McGraw−Hill Companies, 2001
Harvard Business School 9-594-111Rev. May 8, 1995
Professor Robert J. Dolan prepared this case as the basis for class discussion rather than to illustrate either effective orineffective handling of an administrative situation.
Copyright © 1994 by the President and Fellows of Harvard College. To order copies or request permission toreproduce materials, call 1-800-545-7685, write Harvard Business School Publishing, Boston, MA 02163, or go tohttp://www.hbsp.harvard.edu. No part of this publication may be reproduced, stored in a retrieval system,used in a spreadsheet, or transmitted in any form or by any means—electronic, mechanical, photocopying,recording, or otherwise—without the permission of Harvard Business School.
1
Eastman Kodak Company: Funtime Film
On January 25, 1994, George Fisher, Kodak’s recently appointed chief executive officer, metwith analysts and investors to set out Kodak’s new strategy for film products. During the past week(between January 17 and January 24), Kodak stock had lost 8% in value on rumors of a price cut onfilm.
While Kodak continued its overwhelming domination of the photo film market, its marketshare in the United States had eased from about 76% to 70% over the past five years “as competitorslike Fuji Photo Film Co. and Konica Corp. wooed consumers with lower-priced versions.”1
Previously, Kodak had attempted to blunt share-gaining attempts by such rivals and private labelproducts by introducing a superpremium brand, Ektar. Now Kodak proposed to introduce a brandat Fuji and Konica’s price level, 20% below the price of Kodak’s flagship Gold Plus brand. The newbrand, Funtime, was to be available only in limited quantities during two off-peak selling seasons.While some viewed the move favorably, others were more skeptical. One analyst termed the strategy“seemingly a long step down the slippery slope that ends in private label trial.”
The U.S. Photo Film Market
In 1993, approximately 16 billion color exposures were made—the equivalent of 670 million24-exposure rolls. Typically, a consumer paid between $2.50 and $3.50 for a 24 exposure roll. Overthe past five years, the market’s annual unit growth rate averaged only 2%. Major suppliers wereKodak, Fuji of Japan, Agfa of Germany, and 3M. Kodak and Fuji sold only branded products.Because of a 1921 consent decree still in force, Kodak could not sell film on a private label basis. BothAgfa and 3M sold their film to consumers as branded product and to other firms for sale under aprivate label. Polaroid entered the market in 1989 with its branded product, which it sourced from3M. Film was intensively distributed through discount and department stores (32% of sales), drugstores (24%), camera shops (14%), supermarkets and convenience stores (13%), wholesale clubs (9%)and mail order (2%).
Analysts’ estimates of unit market shares by manufacturer are shown in Table A.
1Wendy Bounds, “Kodak Develops Economy-Brand Film That Is Focused on Low-Priced Rivals,” Wall StreetJournal, January 26, 1994, p. A3.
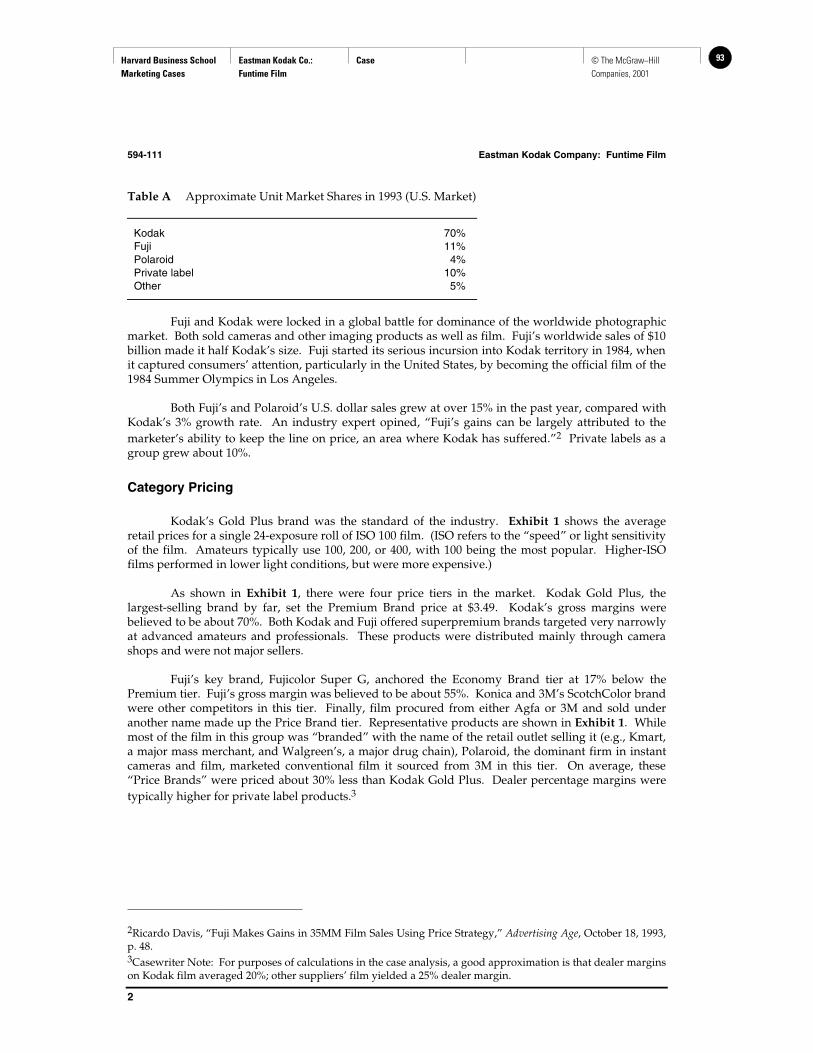
93Harvard Business School Marketing Cases
Eastman Kodak Co.: Funtime Film
Case © The McGraw−Hill Companies, 2001
594-111 Eastman Kodak Company: Funtime Film
2
Table A Approximate Unit Market Shares in 1993 (U.S. Market)
Kodak 70%Fuji 11%Polaroid 4%Private label 10%Other 5%
Fuji and Kodak were locked in a global battle for dominance of the worldwide photographicmarket. Both sold cameras and other imaging products as well as film. Fuji’s worldwide sales of $10billion made it half Kodak’s size. Fuji started its serious incursion into Kodak territory in 1984, whenit captured consumers’ attention, particularly in the United States, by becoming the official film of the1984 Summer Olympics in Los Angeles.
Both Fuji’s and Polaroid’s U.S. dollar sales grew at over 15% in the past year, compared withKodak’s 3% growth rate. An industry expert opined, “Fuji’s gains can be largely attributed to themarketer’s ability to keep the line on price, an area where Kodak has suffered.”2 Private labels as agroup grew about 10%.
Category Pricing
Kodak’s Gold Plus brand was the standard of the industry. Exhibit 1 shows the averageretail prices for a single 24-exposure roll of ISO 100 film. (ISO refers to the “speed” or light sensitivityof the film. Amateurs typically use 100, 200, or 400, with 100 being the most popular. Higher-ISOfilms performed in lower light conditions, but were more expensive.)
As shown in Exhibit 1, there were four price tiers in the market. Kodak Gold Plus, thelargest-selling brand by far, set the Premium Brand price at $3.49. Kodak’s gross margins werebelieved to be about 70%. Both Kodak and Fuji offered superpremium brands targeted very narrowlyat advanced amateurs and professionals. These products were distributed mainly through camerashops and were not major sellers.
Fuji’s key brand, Fujicolor Super G, anchored the Economy Brand tier at 17% below thePremium tier. Fuji’s gross margin was believed to be about 55%. Konica and 3M’s ScotchColor brandwere other competitors in this tier. Finally, film procured from either Agfa or 3M and sold underanother name made up the Price Brand tier. Representative products are shown in Exhibit 1. Whilemost of the film in this group was “branded” with the name of the retail outlet selling it (e.g., Kmart,a major mass merchant, and Walgreen’s, a major drug chain), Polaroid, the dominant firm in instantcameras and film, marketed conventional film it sourced from 3M in this tier. On average, these“Price Brands” were priced about 30% less than Kodak Gold Plus. Dealer percentage margins weretypically higher for private label products.3
2Ricardo Davis, “Fuji Makes Gains in 35MM Film Sales Using Price Strategy,” Advertising Age, October 18, 1993,p. 48.3Casewriter Note: For purposes of calculations in the case analysis, a good approximation is that dealer marginson Kodak film averaged 20%; other suppliers’ film yielded a 25% dealer margin.

94 Harvard Business School Marketing Cases
Eastman Kodak Co.: Funtime Film
Case © The McGraw−Hill Companies, 2001
Eastman Kodak Company: Funtime Film 594-111
3
Consumer Behavior
Film usage rates varied widely across households with a mean of 15 rolls per year. TheWolfman Report4 estimated that 20% of households bought less than 5 rolls per year, 22% boughtbetween 5 and 9 rolls, 28% bought 10 to 15 rolls, 16% bought 16 to 25 rolls, and 13% bought more than25 rolls. Often, these rolls were purchased in “multipacs” containing 2-3 rolls of film. Kodakadvertised heavily, e.g., spending approximately $50 million on camera and film supply advertisingin the United States in 1993. (This was about 4 times Fuji’s U.S. advertising spending.) Kodakadvertising was typified by presentation developed for use on the 1994 Olympic Winter Gamestelevision broadcast. Contrasting against the Olympic competition from Norway broadcast aroundthe world, the ad portrayed a young boy in his own competition in his backyard falling into asnowbank to make a “snow angel.” The voice-over noted, “Some of the best events happen in yourown backyard . . . why trust them to less than Kodak film.”
Actual quality differences among films were unclear. Both Kodak and Fuji tried to positionthemselves as providing superior quality film through their advanced technology. However,Consumer Reports5 conducted a test of films and reported, “We found most films to be no better orworse than their competitors of the same speed. The top six ISO 100 films scored so similarly that wethink all will yield prints of comparable quality.” In order of overall quality score (score out of 100 inparenthesis), these top six films were:
1. Polaroid High Definition (95)2. Fujicolor Super G (94)3. Kodak Gold Plus (93)4. Konica Super SR (93)5. Kodak Ektar (92)6. ScotchColor (92)
ScotchColor was also sold as private label from Kmart, Kroeger, Target, and York, amongothers as shown in Exhibit 1. Fuji Superpremium brand Reala had a score of 90, and Agfacolor XRGscored 88. Consumer Reports regarded score differences of less than 5 points as “not significant.”
According to a 1991 survey cited in Discount Merchandiser, more than half of the picture takersin the United States claim to know “little or nothing about photography.”6 As a result the articleclaimed, “Consumers tend to view film as a commodity, often buying on price alone.” The articlealso quoted Jim Van Senus, Kodak’s manager of general merchandise marketing: “The importance ofbrand name in consumer decision making is still strong. On the other hand, there is a growing bodyof price-sensitive consumers there. We are seeing growth in private label film activity.” Kodakresearch had shown that 50% of buyers were “Kodak-loyal,” 40% were “samplers” relying heavily onKodak, and 10% shopped on price.7
The Funtime Strategy
For 1994, Kodak planned a major repositioning of its film product line. A new emulsiontechnology would increase exposure latitude. Three films would be offered:
41992-93 Wolfman Report on the Photographic and Imaging Industry in the United States, p. 31.5Consumer Reports, November 1993, p. 712.6R. Lee Sullivan, “Photogoods on the Upgrade,” Discount Merchandiser, September 1991, pp. 64 ff.7G. Khermouch, “Kodak Reorganizes Its Film Line,” Adweek, January 31, 1994, p. 14.

95Harvard Business School Marketing Cases
Eastman Kodak Co.: Funtime Film
Case © The McGraw−Hill Companies, 2001
594-111 Eastman Kodak Company: Funtime Film
4
1. Gold Plus—to remain the flagship brand at a price unchanged from 1993 levels.Gold Plus would receive 60% of the dollar advertising support.
2. Royal Gold—to replace Ektar in the Superpremium segment. Whereas Ektar hadbeen targeted to professionals and serious amateurs, Royal Gold would betargeted to a broader audience for “very special” occasions. Offering richer colorsaturation and sharper pictures, it would be positioned as especially appropriatefor those occasions when the consumer may wish to make enlargements. RoyalGold would be heavily supported by advertising (40% of the total film budget)and by promotion and would be priced lower than Ektar was selling to the tradeat a 9% premium over Gold Plus. Cooperative advertising allowances were to beoffered to the trade to provide the incentive to maintain Royal Gold retail pricesat 20% above Gold Plus, thereby offering superior trade margins.
3. Funtime—to give Kodak a presence in the Economy Brand Tier at a price 20%below Gold Plus on a per roll basis.
Key aspects of the Funtime marketing plan:
• No advertising support• Offer only twice a year at off-peak film use times, viz. for 2-3 months beginning
in April, and again for 2-3 months beginning in September.• Available in limited quantities.• Offer in only the two most popular speeds, ISO 100 and 200. (In contrast, Royal
Gold would be eventually offered in five speeds.)• Available to all classes of trade.• Packaged only in “value packs,” specifically in two forms:
1. 2 rolls of 24 exposures2. 4-roll package
(3 rolls of 24 exposures,1 roll of 36 exposures)
Alexander Wasilov, vice president and general manager of Kodak Consumer Imaging in theU. S. and Canada, explained the strategy:
This repositioning is intelligent risk taking that will drive both our marketshare and earnings . . . [it] will allow us to be more selective in targeting certaincustomer segments. We now have Royal Gold film for those very special memories—the birth of a baby, the graduation. We continue to offer Gold film, for capturingthose unexpected moments—the baby smiling, the father and son playing catch in thebackyard. And now we will offer a special promotion twice a year, featuring amodified version of Gold film at a slightly lower price than our other films.8
Commenting on the strategy, Konica’s director of marketing said, “There will be anopportunity for us at Konica. It seems like a desperate move to regain market share. Not a way tomake the industry more profitable.”9
8Wendy Bounds, “Kodak Develops Economy-Brand Film That Is Focused on Low-Priced Rivals,” Wall StreetJournal, January 26, 1994, p. A3.9Ibid.
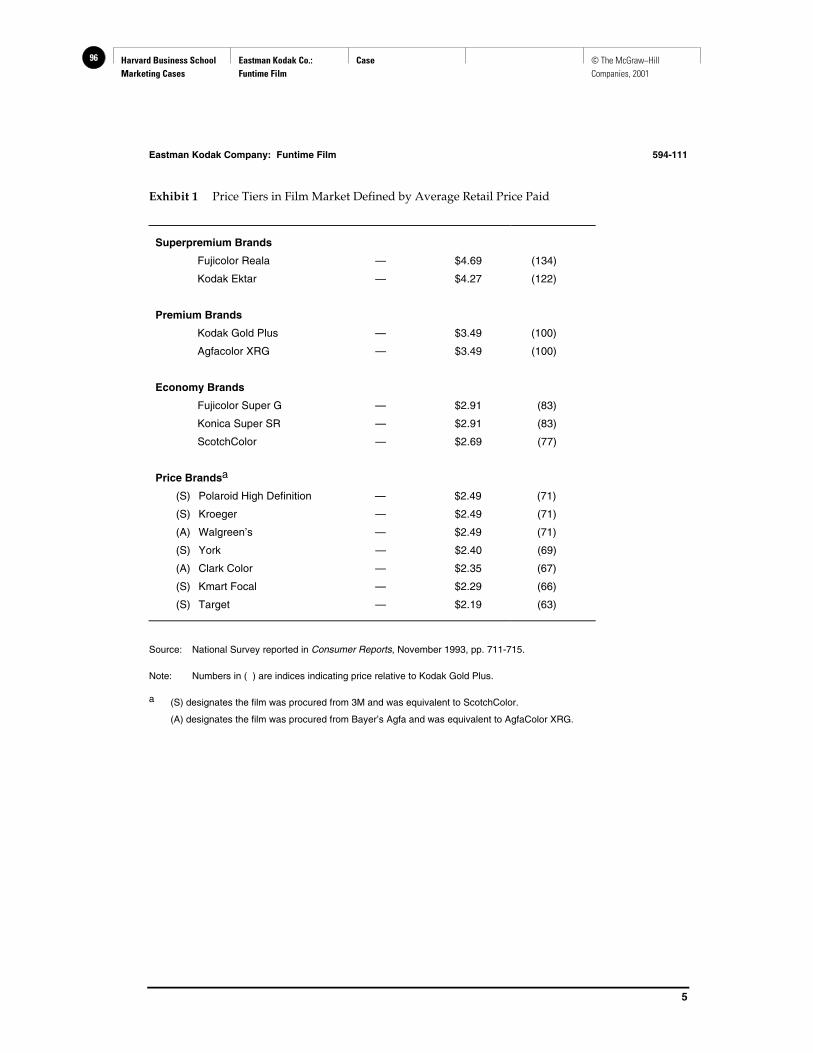
96 Harvard Business School Marketing Cases
Eastman Kodak Co.: Funtime Film
Case © The McGraw−Hill Companies, 2001
Eastman Kodak Company: Funtime Film 594-111
5
Exhibit 1 Price Tiers in Film Market Defined by Average Retail Price Paid
Superpremium Brands
Fujicolor Reala — $4.69 (134)
Kodak Ektar — $4.27 (122)
Premium Brands
Kodak Gold Plus — $3.49 (100)
Agfacolor XRG — $3.49 (100)
Economy Brands
Fujicolor Super G — $2.91 (83)
Konica Super SR — $2.91 (83)
ScotchColor — $2.69 (77)
Price Brandsa
(S) Polaroid High Definition — $2.49 (71)
(S) Kroeger — $2.49 (71)
(A) Walgreen’s — $2.49 (71)
(S) York — $2.40 (69)
(A) Clark Color — $2.35 (67)
(S) Kmart Focal — $2.29 (66)
(S) Target — $2.19 (63)
Source: National Survey reported in Consumer Reports, November 1993, pp. 711-715.
Note: Numbers in ( ) are indices indicating price relative to Kodak Gold Plus.
a (S) designates the film was procured from 3M and was equivalent to ScotchColor.
(A) designates the film was procured from Bayer’s Agfa and was equivalent to AgfaColor XRG.

Walker et al.: Marketing Strategy: A Decision−Focused Approach, Fourth Edition
I. Introduction to Strategy 2. Corporate Strategy Decisions and Their Marketing Implications
97© The McGraw−Hill Companies, 2002
32
Chapter Two
CORPORATE STRATEGY DECISIONS
AND THEIR MARKETING
IMPLICATIONS
RedEnvelope—Marketing Upscale Gifts Online1
In 1997 two graduates of the Universityof California’s Haas Business Schoolstarted a company called 911Gifts. The
firm combined a website and a toll-free customerservice center with gifts provided by two establishedmerchants to cater to last-minute crisis shoppers.Although the new company attracted gift-givers, italso had some weaknesses: The company name,with its connotation of wailing ambulances, turnedoff many potential customers; the firm’s suppliersprovided an uninspired assortment of gifts; and alack of capital inhibited the company’s ability togrow. As a result, by early 1999 the firm was tread-ing water. The site had managed only about $1 mil-lion in sales the previous year. Consequently, theowners decided to reinvent the company.
A New Mission
and Corporate Strategy
The owners’ first move was to hire a marketing-savvy chief executive officer. They attracted HilaryBillings, a 36-year-old manager, away from Williams-
Sonoma where she had successfully developed thefirm’s Pottery Barn catalog operation.
After analyzing 911Gifts’ strengths and weak-nesses, she crafted a new mission and competitivestrategy for the company. Instead of positioningitself as a center for emergency gifts, the firmwould aim for upscale elegance. Further, it wouldtry to broaden the definition of gift-giving oppor-tunities. “Most online retailers are inherently self-purchase,” Ms. Billings says. They “repurposethemselves just before Christmas as gift compa-nies. There’s a big difference between that and acompany that thinks only about gifts.”
Within six weeks of becoming CEO, Ms. Billingshad developed marketing and business plansdetailing how the firm would accomplish its newstrategic mission and had hired the core of a newmanagement team. She then made the rounds ofSilicon Valley’s venture capitalists with a slideshow detailing the company’s new plans and sub-sequently obtained $21 million in new financingfrom Sequoia Capital and $10 million from WestonPresidio in exchange for approximately a one-thirdownership of the company.
www

Walker et al.: Marketing Strategy: A Decision−Focused Approach, Fourth Edition
I. Introduction to Strategy 2. Corporate Strategy Decisions and Their Marketing Implications
98 © The McGraw−Hill Companies, 2002
33
The New Marketing Plan
The Target Market Consistent with the firm’snew strategic mission, it targeted its marketingefforts at a more selective segment of potentialcustomers. The new target market was similar tothe one Ms. Billings knew from her days atWilliams-Sonoma: high income (over $85,000 peryear), well-educated professionals, including bothmen and women. The focus was also on peoplewho were connected to the Internet and had a his-tory of buying online.
To understand the needs and preferences of thefirm’s target customers, managers did a little qual-itative marketing research, informally interviewingsome prospective customers and analyzing pastsales patterns. But initially the firm relied moreheavily on the customer knowledge its managershad gained through past experience. “We talkedabout our [target] customer in a very intimateway,” one manager recalls. “What kind of clothesthey wore, what kind of car they drove. We put upa poster labeled ‘him’ and ‘her’ and we’d put Post-it Notes under each with products we thoughtthey’d want to buy.”
The New Product Line and Company BrandArmed with information and intuition concerning thedesires of the target market, company managers setabout upgrading the product line. A variety of sup-pliers were contracted to provide products thatreflected a high-quality, upscale point of view:things such as amber heart necklaces, old-fashionedthermometers, and boxes of pistachios and car-amels (10 ounces of each for $40). The firm alsopartnered with suppliers to develop its first wave ofexclusive merchandise: a series of gift baskets thatmight be described as “lifestyle kits.” For instance,for fishing fanatics they developed a fishing creelfilled with 12 hand-cut fish-shaped cookies for $48.
Another criterion the firm used to reorganize itsproduct offerings was a high gross margin. Most ofthe firm’s products carry margins of 50 percent ormore, a necessary offset for lavish spending oncustomer service, which Ms. Billings says is un-
avoidable in view of the company’s strategy ofpursuing future growth, in part, by building cus-tomer loyalty and repeat purchases. “You have toown your customer’s experience—and that comesat a price.” About half of the 450 stockkeepingunits (SKUs) that 911Gifts had been selling weredropped, and more than 300 items were added.
To simplify a customer’s search for the perfectgift, the company also redesigned its website. The new website allowed customers to navigatethrough the offerings by type of recipient, by gift-giving occasion, or by product category.
Finally, to more clearly reflect the firm’s new up-scale positioning, the company name was changed toRedEnvelope Gifts Online. The name derives from anAsian custom of marking special occasions by giving cash or small presents enclosed in a red envelope. It also suggested a distinctive packagingapproach: all RedEnvelope gifts are delivered in a redgift box with a hand-tied bow.
Advertising and Promotion With only a fewweeks to go before the peak holiday selling season,RedEnvelope decided to devote a third of its newcapital to advertising aimed at building customerawareness of the site. Rather than costly TV ads, thefirm concentrated its money on a series of print adsto be run in newspapers and magazines, such as theNew York Times, with readerships similar to RedEn-velope’s target market. The company also paid toestablish partnerships with a number of online hubs such as America Online, web portals such asYahoo! and Excite, and a select group of more nar-rowly focused websites such as iVillage.com. Itdevoted $2 million to these partnerships—paid forthrough either a flat fee or a percentage of sales—for a simple reason: “To be where people are shop-ping online means being on the portals,” saysRedEnvelope’s vice president for business develop-ment. Finally, the firm pursues people who prefer amore traditional form of nonstore shopping bydeveloping a series of print catalogs.
Distribution and Order Fulfillment RedEnve-lope owns its own inventory, marketing, systemsmanagement, and customer service operations. But

Walker et al.: Marketing Strategy: A Decision−Focused Approach, Fourth Edition
I. Introduction to Strategy 2. Corporate Strategy Decisions and Their Marketing Implications
99© The McGraw−Hill Companies, 2002
Section One Introduction to Strategy34
it does not yet have sufficient capital to develop itsown physical logistics and order fulfillment opera-tion. Consequently, the company contracted withComAlliance, a fulfillment firm in Ohio, to providewarehouse space and everything that goes with it,including the workers expected to produce scads ofsmartly wrapped packages. The ComAlliance facil-ity is located at the end of an Airborne Express run-way. Thus, merchandise that leaves the warehouseby 2 A.M. can be in the air by 4:30 and to its des-tination by noon. This setup allowed RedEnvelopeto make a promise that was the core of its earlybrand-building efforts: Christmas Eve delivery ofgifts ordered by midnight on December 23.
Customer Feedback Once the site was up andrunning, managers were able to track purchaseshourly and quickly reformulate the product mix.For example, a line of wines was not selling asquickly as expected, generating only six purchasesan hour. It was replaced with a Zen fountain thatsold reliably at a rate of one every five minutes.
The Results
RedEnvelope’s new management team brought thenew operation online 60 days before Christmas in1999. In two months the company shipped 20,000
packages and generated more revenue than the firmhad managed in the preceding two years. Its Weballiances and ads were particularly effective. Ac-cording to Nielsen NetRatings, 17.4 percent of thosewho saw the firm’s banner clicked on it; the typicalclick-through rate for banner ads is about 2 percent.And nearly 6 percent of those who visited the sitemade purchases, compared to an industry averageconversion rate of about 2 percent. Most important,the firm lived up to its promises. It filled 98 percentof its orders accurately, shipped 99 percent of itspackages on time, and only 2 percent of recipientswanted to return their gifts.
On the minus side, during the first months of itsexistence the company shelled out nearly $4 inmarketing for every $1 in gross sales. Thus, thefuture profitability of RedEnvelope—just as withmany other new Internet retailers—will depend onthe firm’s ability to build a loyal customer baseand reap repeat purchases to recoup its marketinginvestments. The good news is that the high mar-gins the firm earns on its products may makefuture profitability a more attainable goal than ithas been for some low-margin Internet marketers.And as of this writing, at least, RedEnvelope hasmanaged to dodge the dot.com debacle of 2001and continues to pursue its revenue growth andprofitability goals.
Strategic Challenges Addressed
in Chapter 2
The corporate strategy crafted by Hillary Billings after joining RedEnvelope provides aclear sense of direction and useful guidance for the firm’s managers when developing com-petitive, marketing, and other functional strategies because it speaks to the dimensions ofstrategy we discussed in Chapter 1. First, it defines the overall mission and scope of thefirm by clearly focusing on marketing elegant and unique gifts for all occasions to anupscale segment of on-line consumers. It also lays out goals and objectives for the com-pany—particularly concerning revenue growth and the rapid attainment of profitability—and specifies a corporate development strategy for achieving those objectives. Specifically,RedEnvelope seeks growth primarily through increased penetration of its target customersegment, and profitability by focusing on high-margin merchandise and lowering customeraccquisition costs by improving their loyalty and repeat purchases.
RedEnvelope’s objectives and development strategy, in turn, influence the way it allo-cates its resources and leverages its core competencies in order to build and maintain acompetitive advantage. The firm hired experienced managers with extensive knowledge ofthe target segment, allocated substantial resources to tracking customers’ purchase patternsand preferences, formed alliances with suppliers to develop exclusive and unique products

Walker et al.: Marketing Strategy: A Decision−Focused Approach, Fourth Edition
I. Introduction to Strategy 2. Corporate Strategy Decisions and Their Marketing Implications
100 © The McGraw−Hill Companies, 2002
Chapter Two Corporate Strategy Decisions and Their Marketing Implications 35
that fit those preferences, and invested heavily in the people and systems necessary to pro-vide excellent service and build customer loyalty. Finally, the firm seeks synergy across thevarious products it offers by investing in advertising and promotion activities aimed atbuilding a strong corporate identity and awareness of the RedEnvelope brand, and bydeveloping the necessary capabilities—both internally or through alliances—to providesuperior service and timely order fulfillment regardless of what the customer buys.
The successful reformulation of RedEnvelope’s corporate strategy illustrates the impor-tance of a detailed understanding of target customers, potential competitors, and the mar-ket environment when developing strategies at any level. Indeed, Hillary Billings was hiredas the firm’s CEO partly because of her extensive experience in marketing high-marginmerchandise to a similar target segment at Williams-Sonoma. As we pointed out in Chap-ter 1, marketers’ close contact with customers and the external environment often meansthey play a crucial role in influencing strategies formulated at higher levels in the firm,even when they’re not appointed CEO.
On the other hand, a well-defined corporate strategy also influences and constrains thestrategic decisions that marketers and other functional managers can make at lower orga-nizational levels. RedEnvelope’s mission of offering elegant and unique gifts for all occa-sions clearly influences the kinds of items the firm’s marketers can—and cannot—add tothe product line. And its objective of achieving profitability by maintaining high marginsrules out aggressive pricing policies and frequent sales promotions.
In view of the interactions and interdependences between corporate-level strategy deci-sions and strategic marketing programs for individual product-market entries, this chapterexamines the five components of a well-defined corporate strategy in more detail: (1) theoverall scope and mission of the organization, (2) company goals and objectives, (3) adevelopment strategy for future growth, (4) the allocation of corporate resources across thefirm’s various businesses, and (5) the search for synergy via the sharing of corporateresources, competencies, or programs across businesses or product lines. Exhibit 2.1 summarizes some of the crucial questions that need to be addressed by each of these fivecomponents.
While a market orientation—and the analytical tools that marketing managers use toexamine customer desires and competitors’ strengths and weaknesses—can provide usefulinsights to guide decisions concerning all five elements of corporate strategy, they are par-ticularly germane for revealing the most attractive avenues for future growth and for deter-mining which businesses or product-markets are likely to produce the greatest returns onthe company’s resources. In turn, all five components of corporate strategy have majorimplications for the strategic marketing plans of the firm’s various products or services.Together, they define the general stategic direction, objectives, and resource constraintswithin which those marketing plans must operate. We examine the marketing implicationsinvolved in both formulating and implementing the five components of corporate strategyin the following sections.
Corporate Scope—Defining
the Firm’s Mission
A well-thought-out mission statement guides an organization’s managers as to which mar-ket opportunities to pursue and which fall outside the firm’s strategic domain. A clearlystated mission can help instill a shared sense of direction, relevance, and achievementamong employees, as well as a positive image of the firm among customers, investors, andother stakeholders.

Walker et al.: Marketing Strategy: A Decision−Focused Approach, Fourth Edition
I. Introduction to Strategy 2. Corporate Strategy Decisions and Their Marketing Implications
101© The McGraw−Hill Companies, 2002
Section One Introduction to Strategy36
To provide a useful sense of direction, a corporate mission statement should clearlydefine the organization’s strategic scope. It should answer such fundamental questions asthe following: What is our business? Who are our customers? What kinds of value can weprovide to these customers? and What should our business be in the future? For example,several years ago PepsiCo, the manufacturer of Pepsi-Cola, broadened its mission to focuson “marketing superior quality food and beverage products for households and consumersdining out.” That clearly defined mission guided the firm’s managers toward the acquisi-tion of several related companies, such as Frito-Lay, Taco Bell, and Pizza Hut, and thedivestiture of operations that no longer fit the company’s primary thrust.
More recently, in response to a changing global competitive environment, PepsiCo nar-rowed its scope to focus primarily on package foods (particularly salty snacks) and beveragesdistributed through supermarket and convenience store channels. This new, narrower missionled the firm to (1) divest all of its fast-food restaurant chains; (2) acquire complementary bev-erage businesses, such as Tropicana juices and Lipton’s iced teas; and (3) develop new brandstargeted at rapidly growing beverage segments, such as Aquafina bottled water.2
Market Influences on the Corporate MissionLike any other strategy component, an organization’s mission should fit both its internalcharacteristics and the opportunities and threats in its external environment. Obviously, thefirm’s mission should be compatible with its established values, resources, and distinctivecompetencies. But it also should focus the firm’s efforts on markets where those resourcesand competencies will generate value for customers, an advantage over competitors,and synergy across its products. Thus, PepsiCo’s new mission reflects the firm’s packagegoods marketing, sales, and distribution competencies and its perception that substantial
Strategy component Key issues
Scope, mission, and intent • What business(es) should the firm be in?
• What customer needs, market segments, and/or technologies should be focused on?
• What is the firm’s enduring strategic purpose or intent?
Objectives • What performance dimensions should the firm’s business units and employees focus on?
• What is the target level of performance to be achieved on each dimension?
• What is the time frame in which each target should be attained?
Development strategy • How can the firm achieve a desired level of growth over time?
• Can the desired growth be attained by expanding the firm’s current businesses?
• Will the company have to diversify into new businesses or product-markets to achieve itsfuture growth objectives?
Resource allocation • How should the firm’s limited financial resources be allocated across its businesses toproduce the highest returns?
• Of the alternative strategies that each business might pursue, which will produce thegreatest returns for the dollars invested?
Sources of synergy • What competencies, knowledge, and customer-based intangibles (e.g., brand recognition,reputation) might be developed and shared across the firm’s businesses?
• What operational resources, facilities, or functions (e.g., plants, R&D, salesforce) mightthe firm’s businesses share to increase their efficiency?
Exhibit 2.1 Corporate Strategy Components and Issues

Walker et al.: Marketing Strategy: A Decision−Focused Approach, Fourth Edition
I. Introduction to Strategy 2. Corporate Strategy Decisions and Their Marketing Implications
102 © The McGraw−Hill Companies, 2002
Chapter Two Corporate Strategy Decisions and Their Marketing Implications 37
synergies can be realized across snack foods and beverages within supermarket channelsvia shared logistics, joint displays and sales promotions, cross-couponing, and the like.
Criteria for Defining the Corporate MissionSeveral criteria can be used to define an organization’s strategic mission. Many firms specifytheir domain in physical terms, focusing on products or services or the technology used. Theproblem is that such statements can lead to slow reactions to technological or customer-demand changes. For example, Theodore Levitt argues that Penn Central’s view of its missionas being “the railroad business” helped cause the firm’s failure. Penn Central did not respondto major changes in transportation technology, such as the rapid growth of air travel and theincreased efficiency of long-haul trucking. Nor did it respond to consumers’ growing willing-ness to pay higher prices for the increased speed and convenience of air travel. Levitt arguesthat it is better to define a firm’s mission as what customer needs are to be satisfied and thefunctions the firm must perform to satisfy them.3 Products and technologies change over time,but basic customer needs tend to endure. Thus, if Penn Central had defined its mission as sat-isfying the transportation needs of its customers rather than simply being a railroad, it mighthave been more willing to expand its domain to incorporate newer technologies.
One problem with Levitt’s advice, though, is that a mission statement focusing only onbasic customer needs can be too broad to provide clear guidance and can fail to take intoaccount the firm’s specific competencies. If Penn Central had defined itself as a trans-portation company, should it have diversified into the trucking business? Started an airline?As the upper-right quadrant of Exhibit 2.2 suggests, the most useful mission statementsfocus on the customer need to be satisfied and the functions that must be performed to sat-isfy that need, and they are specific as to the customer groups and the products or tech-nologies on which to concentrate. Thus, instead of seeing itself as being in the railroadbusiness or as satisfying the transportation needs of all potential customers, BurlingtonNorthern Santa Fe Railroad’s mission is to provide long-distance transportation for large-volume producers of low-value, low-density products, such as coal and grain.
Social Values and Ethical PrinciplesAn increasing number of organizations are developing mission statements that also attempt todefine the social and ethical boundaries of their strategic domain. The annual reports of firmssuch as Borden and 3M, for example, often include sections on “Social Responsibility,”
Exhibit 2.2 Characteristics of Effective Corporate Mission Statements
FunctionalBased oncustomer needs
Broad
Transportation business
Railroad business
Long-distance transportation forlarge-volume producers of low-
value, low-density products
Long-haul, coal-carrying railroad
Specific
PhysicalBased on existing products or technology
Source: From Strategy Formulation: Analytical Concepts, 1st edition, by © 1978. Reprinted with per-mission of South-Western College Publishing, a division of Thomson Learning. Fax 800-730-2215.
E

Walker et al.: Marketing Strategy: A Decision−Focused Approach, Fourth Edition
I. Introduction to Strategy 2. Corporate Strategy Decisions and Their Marketing Implications
103© The McGraw−Hill Companies, 2002
Section One Introduction to Strategy38
which outline the ethical principles the firm tries to follow in dealings with customers, sup-pliers, and employees, and its policies concerning such social issues as charitable contribu-tions and environmental protection. Roughly two-thirds of U.S. firms have formal codes ofethics, and one in five large firms has formal departments dedicated to encouraging compli-ance with company ethical standards. At United Technologies, a global defense contractor andengineering firm, 160 business ethics officers monitor the firm’s activities and relations withcustomers, suppliers, and governments around the world.4
Outside America, fewer firms have formal ethics bureaucracies. To some extent, thisreflects the fact that in other countries governments and organized labor both play a big-ger role in corporate life. In Germany, for instance, workers’ councils often deal withissues such as sexual equality, race relations, and workers’ rights.5
Ethics is concerned with the development of moral standards by which actions and sit-uations can be judged. It focuses on those actions that may result in actual or potential harmof some kind (e.g., economic, mental, physical) to an individual, group, or organization.
Particular actions may be legal but not ethical. For instance, extreme and unsubstanti-ated advertising claims, such as “Our product is far superior to Brand X,” might be viewedas simply legal puffery engaged in to make a sale, but many marketers (and their cus-tomers) view such little white lies as unethical. Thus, ethics is more proactive than the law.Ethical standards attempt to anticipate and avoid social problems, whereas most laws andregulations emerge only after the negative consequences of an action become apparent.6
Why Are Ethics Important? The MarketingImplications of Ethical StandardsOne might ask why a corporation should take responsibility for providing moral guidanceto its managers and employees. While such a question may be a good topic for philosoph-
ical debate, there is a compelling, practical reason for a firm to imposeethical standards to guide employees. Unethical practices can damagethe trust between a firm and its suppliers or customers, thereby disrupt-ing the development of long-term exchange relationships and resultingin the likely loss of sales and profits over time. For example, one surveyof 135 purchasing managers from a variety of industries found that themore unethical a supplier’s sales and marketing practices were perceived
to be, the less eager were the purchasing managers to buy from that supplier.7
Unfortunately, not all customers or competing suppliers adhere to the same ethical stan-dards. As a result, marketers sometimes feel pressure to engage in actions that are incon-sistent with what they believe to be right—either in terms of personal values or formalcompany standards—in order to close a sale or stay even with the competition. This pointwas illustrated by a survey of 59 top marketing and sales executives concerning commer-cial bribery—attempts to influence a potential customer by giving gifts or kickbacks.While nearly two-thirds of the executives considered bribes unethical and did not want topay them, 88 percent also felt that not paying bribes might put their firms at a competitivedisadvantage.8 Such dilemmas are particularly likely to arise as a company moves intoglobal markets involving different cultures and levels of economic development whereeconomic exigencies and ethical standards may be quite different.
Such inconsistencies in external expectations and demands across countries and marketscan lead to job stress and inconsistent behavior among marketing and sales personnel, whichin turn can risk damaging long-term relationships with suppliers, channel partners, and cus-tomers. A company can reduce such problems by spelling out formal social policies and eth-ical standards in its corporate mission statement and communicating and enforcing those
Strategic Issue
Unethical practices can damage the trustbetween a firm and its suppliers or cus-tomers, thereby disrupting the developmentof long-term exchange relationships andresulting in the likely loss of sales and profits over time.

Walker et al.: Marketing Strategy: A Decision−Focused Approach, Fourth Edition
I. Introduction to Strategy 2. Corporate Strategy Decisions and Their Marketing Implications
104 © The McGraw−Hill Companies, 2002
Chapter Two Corporate Strategy Decisions and Their Marketing Implications 39
standards. Unfortunately, it is not always easy to decide what those policies and standardsshould be. There are multiple philosophical traditions or frameworks that managers mightuse to evaluate the ethics of a given action. Consequently, different firms or managers canpursue somewhat different ethical standards, particularly across national cultures. Exhibit 2.3displays a comparison (across three geographic regions) of the proportion of company ethi-cal statements that address a set of specific issues. Note that a larger number of companiesin the United States and Europe appear to be more concerned with the ethics of their pur-chasing practices than those of their marketing activities. Comparing firms across regions,U.S. companies are more concerned about proprietary information. Canadian firms are morelikely to have explicit guidelines concerning environmental responsibility, and Europeancompanies more frequently have standards focused on workplace safety. Since many ethicalissues in marketing are open to interpretation and debate, we will examine such issues andtheir implications individually as they arise throughout the remainder of this book.
Corporate Objectives
Confucius said, “For one who has no objective, nothing is relevant.” Formal objectives pro-vide decision criteria that guide an organization’s business units and employees towardspecific dimensions and performance levels. Those same objectives provide the bench-marks against which actual performance can be evaluated.
����������� ������ ���� �� ������
��� ����
���������� ���������
������� � ������
�����������������������
�������
������� ���� ��������
������������ ���������� �� ����
����� � ������
�������� ���� �
����������� �����
�� ����� ����������
���
!���� ����� "# $ %&'(������ "# $ )*(������ "# $ )+(
* )* ,* -* .* %**
#����� �� ��������
Exhibit 2.3 Issues Addressed by Company Ethics Statements
Source: Ronald E. Berenbeim, Corporate Ethics Practices (New York: The Conference Board, 1992).
E

Walker et al.: Marketing Strategy: A Decision−Focused Approach, Fourth Edition
I. Introduction to Strategy 2. Corporate Strategy Decisions and Their Marketing Implications
105© The McGraw−Hill Companies, 2002
Section One Introduction to Strategy40
To be useful as decision criteria and evaluative benchmarks, corporate objectives mustbe specific and measurable. Therefore, each objective contains four components:
• A performance dimension or attribute sought.
• A measure or index for evaluating progress.
• A target or hurdle level to be achieved.
• A time frame within which the target is to be accomplished.
Exhibit 2.4 lists some common performance dimensions and measures used in specifyingcorporate as well as business-unit and marketing objectives.
Exhibit 2.4Common Performance Criteria and Measures That Specify Corporate, Business-Unit,
and Marketing Objectives
Performance criteria Possible measures or indexes
• Growth $ salesUnit salesPercent change in sales
• Competitive strength Market shareBrand awarenessBrand preference
• Innovativeness $ sales from new productsPercentage of sales from product-market entries introduced withinpast five yearsPercentage cost savings from new processes
• Profitability $ profitsProfit as percentage of salesContribution margin*Return on investment (ROI)Return on net assets (RONA)Return on equity (ROE)
• Utilization of resources Percent capacity utilizationFixed assets as percentage of sales
• Contribution to owners Earnings per sharePrice/earnings ratio
• Contribution to customers Price relative to competitorsProduct qualityCustomer satisfactionCustomer retentionCustomer loyaltyCustomer lifetime value
• Contribution to employees Wage rates, benefitsPersonnel development, promotionsEmployment stability, turnover
• Contribution to society $ contributions to charities or community institutionsGrowth in employment
*Business-unit managers and marketing managers responsible for a product-market entry often have little control overcosts associated with corporate overhead, such as the costs of corporate staff or R&D. It can be difficult to allocatethose costs to specific strategic business units (SBUs) or products. Consequently, profit objectives at the SBU andproduct-market level are often stated as a desired contribution margin (the gross profit prior to allocating such over-head costs).

Walker et al.: Marketing Strategy: A Decision−Focused Approach, Fourth Edition
I. Introduction to Strategy 2. Corporate Strategy Decisions and Their Marketing Implications
106 © The McGraw−Hill Companies, 2002
Chapter Two Corporate Strategy Decisions and Their Marketing Implications 41
Enhancing Shareholder Value: The Ultimate ObjectiveIn recent years a growing number of executives of publicly held corporations have con-cluded that the organization’s ultimate objective should be to increase its shareholders’economic returns as measured by dividends plus appreciation in the company’s stockprice.9 To do so management must balance the interests of various corporate constituen-cies, including employees, customers, suppliers, debtholders, and stockholders. The firm’scontinued existence depends on a financial relationship with each of these parties. Employ-ees want competitive wages. Customers want high quality at a competitive price. Suppli-ers and debtholders have financial claims that must be satisfied with cash when they falldue. And shareholders, as residual claimants, look for cash dividends and the prospect offuture dividends reflected in the stock’s market price.
If a company does not satisfy its constituents’ financial claims, it ceases to be viable.Thus, a going concern must strive to enhance its ability to generate cash from the operationof its businesses and to obtain any additional funds needed from debt or equity financing.
The firm’s ability to attain debt financing (its ability to borrow) depends in turn on pro-jections of how much cash it can generate in the future. Similarly, the market value of itsshares, and therefore its ability to attain equity financing, depends on investors’ expecta-tions of the firm’s future cash-generating abilities. People willingly invest in a firm onlywhen they expect a better return on their funds than they could get from other sourceswithout exposing themselves to any greater risks. Thus, management’s primary objectiveshould be to pursue capital investments, acquisitions, and business strategies that will pro-duce sufficient future cash flows to return positive value to shareholders. Failure to do sonot only will depress the firm’s stock price and inhibit the firm’s ability to finance futureoperations and growth, but also it could make the organization more vulnerable to atakeover by outsiders who promise to increase its value to shareholders.
Given this rationale, many firms set explicit objectives targeted at increasing share-holder value. These are usually stated in terms of a target return on shareholder equity,increase in the stock price, or earnings per share. Recently, though, some executives havebegun expressing such corporate objectives in terms of economic value added or marketvalue added (MVA). A firm’s MVA is calculated by combining its debt and the marketvalue of its stock, then subtracting the capital that has been invested in the company. Theresult, if positive, shows how much wealth the company has created.10
Unfortunately, such broad shareholder-value objectives do not always provide adequateguidance for a firm’s lower-level managers or benchmarks for evaluating performance. Forone thing, standard accounting measures, such as earnings per share or return on invest-ment, are not always reliably linked to the true value of a company’s stock.11 And as weshall see later in this chapter, tools are available to evaluate the future impact of alterna-tive strategic actions on shareholder value, but those valuation methods have inherent pit-falls and can be difficult to apply at lower levels of strategy such as trying to choose thebest marketing strategy for a particular product-market entry.12
Finally, there is a danger that a narrow focus on short-term financial, shareholder-valueobjectives may lead managers to pay too little attention to actions necessaryto provide value to the firm’s customers and sustain a competitive advan-tage.13 In the long term, customer value and shareholder value converge; afirm can continue to provide attractive returns to shareholders only so longas it satisfies and retains its customers. But some managers may overlookthis in the face of pressures to achieve aggressive short-term financial objec-
tives, as illustrated by the experience of Schlitz Brewing discussed in Exhibit 2.5.
Strategic Issue
In the long term, customer value and shareholder value converge; a firm can continue to provide attractive returns toshareholders only so long as it satisfies and retains its customers.

Walker et al.: Marketing Strategy: A Decision−Focused Approach, Fourth Edition
I. Introduction to Strategy 2. Corporate Strategy Decisions and Their Marketing Implications
107© The McGraw−Hill Companies, 2002
Section One Introduction to Strategy42
The Marketing Implications of Corporate ObjectivesMost organizations pursue multiple objectives. This is clearly demonstrated by a study ofthe stated objectives of 82 large corporations. The largest percentage of respondents (89percent) had explicit profitability objectives: 82 percent reported growth objectives; 66percent had specific market-share goals. More than 60 percent mentioned social responsi-bility, employee welfare, and customer service objectives, and 54 percent of the companieshad R&D/new product development goals.14 These percentages add up to more than 100percent because most firms had several objectives.
Trying to achieve many objectives at once leads to conflicts and trade-offs. For exam-ple, the investment and expenditure necessary to pursue growth in the long term is likelyto reduce profitability and ROI in the short term.15 Managers can reconcile conflictinggoals by prioritizing them. Another approach is to state one of the conflicting goals as aconstraint or hurdle. Thus, a firm attempts to maximize growth subject to meeting someminimum ROI hurdle.
In firms with multiple business units or product lines, however, the most common wayto pursue a set of conflicting objectives is to first break them down into subobjectives, thenassign subobjectives to different business units or products. Thus, subobjectives often varyacross business units and product offerings depending on the attractiveness and potentialof their industries, the strength of their competitive positions, and the resource allocationdecisions made by corporate managers. For example, PepsiCo’s managers likely set rela-tively high volume and share-growth objectives but lower ROI goals for the firm’s Aqua-fina brand, which is battling for prominence in the rapidly growing bottled water category,than for Lay’s potato chips, which hold a commanding 40 percent share of a mature prod-uct category. Therefore, two marketing managers responsible for different products mayface very different goals and expectations—requiring different marketing strategies toaccomplish—even though they work for the same organization.
As firms emphasize developing and maintaining long-term customer relationships,customer-focused objectives—such as satisfaction, retention, and loyalty—are being givengreater importance. Such market-oriented objectives are more likely to be consistently pur-sued across business units and product offerings. There are several reasons for this. First,
In the early 1970s Schlitz Brewing made the mistake of boosting its share price at the expense of its compet-itive position. The firm shortened its brewing process by 50 percent, reduced labor cost, and switched to less
costly ingredients. As a result, it became the lowest-cost producer in the industry, its profits soared, and its stockprice rose to a high of $69 by 1974. Unfortunately, however, Schlitz’s aggressive cost-cutting campaign alsodegraded the quality of its beer. By 1976 the firm was receiving constant customer and dealer complaints andits market share was slipping badly. In 1978 a new management team attempted to get product quality back ontrack, but by then consumers had such a low opinion of Schlitz beer that the company could not recover. By1981 Schlitz’s market share position had slipped from number two to number seven, and its share price haddropped to a mere $5.
Source: George S. Day and Liam Fahey, “Putting Strategy into Shareholder Value Analysis,” Harvard Business Review, March–April 1990, pp.156–62. Reprinted with permission. Copyright 1990 by the President and Fellows of Harvard College, all rights reserved.
Exhibit 2.5 Schlitz: An Example of Increasing Stock Price at the Expense of Competitive Position

Walker et al.: Marketing Strategy: A Decision−Focused Approach, Fourth Edition
I. Introduction to Strategy 2. Corporate Strategy Decisions and Their Marketing Implications
108 © The McGraw−Hill Companies, 2002
Chapter Two Corporate Strategy Decisions and Their Marketing Implications 43
given the huge profit implications of a customer’s lifetime value, maximizing satisfactionand loyalty tends to make good sense no matter what other financial objectives are beingpursued in the short term. Second, satisfied, loyal customers of one product can be lever-aged to provide synergies for other company products or services. For instance, IBM hopesthat satisfied customers of its website development services for small businesses will even-tually become customers for the company’s servers and software products as they grow.Finally, customer satisfaction and loyalty are determined by factors other than the productitself or the activities of the marketing department. A study of one industrial paper com-pany, for example, found that about 80 percent of customers’ satisfaction scores wereaccounted for by nonproduct factors, such as order processing, delivery, and postsale serv-ices.16 Since such factors are influenced by many functional departments within the cor-poration, they are likely to have a similar impact across a firm’s various businesses andproducts.
Corporate Growth Strategies
Often, the projected combined future sales and profits of a corporation’s business units andproduct-markets fall short of the firm’s long-run growth and profitability objectives. Thereis a gap between what the firm expects to become if it continues on its present course andwhat it would like to become. This is not surprising because some of its high-growth mar-kets are likely to slip into maturity over time and some of its high-profit mature businessesmay decline to insignificance as they get older. Thus, to determine where future growth iscoming from, management must decide on a strategy to guide corporate development.
Essentially, a firm can go in two major directions in seeking futuregrowth: expansion of its current businesses and activities or diversifi-cation into new businesses, either through internal business develop-ment or acquisition. Exhibit 2.6 outlines some specific options a firmmight pursue while seeking growth in either of these directions.
Expansion by Increasing Penetration of Current Product-MarketsOne way for a company to expand is by increasing its share of existing markets. This typ-ically requires actions such as making product or service improvements, cutting costs andprices, or outspending competitors on advertising or promotions. Amazon.com pursued acombination of all these actions—as well as forming alliances with Web portals, affinitygroups, and the like—to expand its share of Web shoppers, even though the expense ofsuch activities postponed the firm’s ability to become profitable.
Even when a firm holds a commanding share of an existing product-market, additionalgrowth may be possible by encouraging current customers to become more loyal and con-centrate their purchases, use more of the product or service, use it more often, or use it innew ways. In addition to its promotional efforts, Amazon.com spent hundreds of millionsof dollars on warehouses and order fulfillment activities, investments that earned the loy-alty of its customers. As a result, by the year 2000 more than three-quarters of the firm’ssales were coming from repeat customers.17 Other examples include museums that spon-sor special exhibitions to encourage patrons to make repeat visits and the recipes thatQuaker Oats includes on the package to tempt buyers to include oatmeal as an ingredientin other foods, such as cookies and desserts.
Strategic Issue
A firm can go in two major directions inseeking future growth: expansion of its cur-rent businesses and activities or diversifica-tion into new businesses.
www

Walker et al.: Marketing Strategy: A Decision−Focused Approach, Fourth Edition
I. Introduction to Strategy 2. Corporate Strategy Decisions and Their Marketing Implications
109© The McGraw−Hill Companies, 2002
Section One Introduction to Strategy44
Expansion by Developing New Products for Current CustomersA second avenue to future growth is through a product-development strategy emphasizingthe introduction of product-line extensions or new product or service offerings aimed atexisting customers. For example, Arm & Hammer successfully introduced a laundry deter-gent, an oven cleaner, and a carpet cleaner. Each capitalized on baking soda’s image as aneffective deodorizer and on a high level of recognition of the Arm & Hammer brand. Sim-ilarly, RedEnvelope’s managers are constantly searching for unique new items to add to itsline of gifts.
Expansion by Selling Existing Products to NewSegments or CountriesPerhaps the growth strategy with the greatest potential for many companies is the develop-ment of new markets for their existing goods or services. This may involve the creation ofmarketing programs aimed at nonuser or occasional-user segments of existing markets. Thus,theaters, orchestras, and other performing arts organizations often sponsor touring compa-nies to reach audiences outside major metropolitan areas and promote matinee performanceswith lower prices and free public transportation to attract senior citizens and students.
Exhibit 2.6Alternative Corporate Growth Strategies
Market penetration strategies
• Increase market share
• Increase product usage Increase frequency of use Increase quantity used New applications
Product development strategies
• Product improvements
• Product-line extensions
• New products for same market
Market development strategies
• Expand markets for existingproducts
Geographic expansion Target new segments
Diversification strategies
• Vertical integration Forward integration Backward integration
• Diversification into relatedbusinesses
(concentric diversification) • Diversification into unrelated
businesses (conglomerate diversification)
Current markets
New markets
Current products New products

Walker et al.: Marketing Strategy: A Decision−Focused Approach, Fourth Edition
I. Introduction to Strategy 2. Corporate Strategy Decisions and Their Marketing Implications
110 © The McGraw−Hill Companies, 2002
Chapter Two Corporate Strategy Decisions and Their Marketing Implications 45
Expansion into new geographic markets, particularly new countries, is also a primarygrowth strategy for many firms. For example, General Electric announced a growth strat-egy that shifts the firm’s strategic center of gravity from the industrialized West to Asia andLatin America.18
While developing nations represent attractive growth markets for basic industrial andinfrastructure goods and services, growing personal incomes and falling trade barriers aremaking them attractive potential markets for many consumer goods and services as well.Even developed nations can represent growth opportunities for products or services basedon newly emerging technologies or business models. For instance, while the rapid growthof e-retailers such as Amazon.com is likely to slow in the United States over the next fewyears, growth in the number of online shoppers is expected to expand rapidly in Europe,19
as shown in Exhibit 2.7.
Expansion by DiversifyingFirms also seek growth by diversifying their operations. This is typically riskier than thevarious expansion strategies because it often involves learning new operations and dealingwith unfamiliar customer groups. Nevertheless, the majority of large U.S., European, andAsian firms are diversified to one degree or another.
Vertical integration is one way for companies to diversify. Forward vertical integra-tion occurs when a firm moves downstream in terms of the product flow, as when a man-ufacturer integrates by acquiring or launching a wholesale distributor or retail outlet. Forexample, IBM recently withdrew its Aptiva desktop PCs from independent computerretailers such as CompUSA and made them available only over the company’s own retailwebsite in order to improve customer service and reduce costs. Backward integrationoccurs when a firm moves upstream by acquiring a supplier.
Integration can give a firm access to scarce or volatile sources of supply or tighter con-trol over the marketing, distribution, or servicing of its products. But it increases the risksinherent in committing substantial resources to a single industry. Also, the investmentrequired to vertically integrate often offsets the additional profitability generated by theintegrated operations, resulting in little improvement in return on investment.20
Related (or concentric) diversification occurs when a firm internally develops or acquiresanother business that does not have products or customers in common with its current businesses but that might contribute to internal synergy through the sharing of production
Exhibit 2.7Number of Online Shoppers in the European Union (Users in Millions)
Source: Jupiter Communications, as reported in Jennifer L. Schenker, “The Future Is Now,” Time, April10, 2000, p. 85. © 2000 Time Inc. Reprinted by permission.
��
��
��
��
�
���� ���� ���� ���� ���� ���� ����
10.6% of total E.U. population 41.5

Walker et al.: Marketing Strategy: A Decision−Focused Approach, Fourth Edition
I. Introduction to Strategy 2. Corporate Strategy Decisions and Their Marketing Implications
111© The McGraw−Hill Companies, 2002
Section One Introduction to Strategy46
facilities, brand names, R&D know-how, or marketing and distribution skills. Thus, PepsiCoacquired Cracker Jack to complement its salty snack brands and leverage its distributionstrengths in grocery stores.
The motivations for unrelated (or conglomerate) diversification are primarily finan-cial rather than operational. By definition, an unrelated diversification involves two busi-nesses that have no commonalities in products, customers, production facilities, orfunctional areas of expertise. Such diversification mostly occurs when a disproportionatenumber of a firm’s current businesses face decline because of decreasing demand,increased competition, or product obsolescence. The firm must seek new avenues ofgrowth. Other, more fortunate, firms may move into unrelated businesses because theyhave more cash than they need in order to expand their current businesses, or because theywish to discourage takeover attempts.
Unrelated diversification tends to be the riskiest growth strategy in terms of financialoutcomes. Most empirical studies report that related diversification is more conducive tocapital productivity and other dimensions of performance than is unrelated diversifica-tion.21 This suggests that the ultimate goal of a corporation’s strategy for growth should beto develop a compatible portfolio of businesses to which the firm can add value throughthe application of its unique core competencies. The corporation’s marketing competen-cies can be particularly important in this regard, as evidenced by the success of firms likePepsiCo.
Expansion by Diversifying through Organizational Relationships or NetworksRecently, firms have attempted to gain some benefits of market expansion or diversifica-tion while simultaneously focusing more intensely on a few core competencies. They tryto accomplish this feat by forming relationships or organizational networks with otherfirms instead of acquiring ownership.22
Perhaps the best models of such organizational networks are the Japanese keiretsu andthe Korean chaebol—coalitions of financial institutions, distributors, and manufacturingfirms in a variety of industries that are often grouped around a large trading company thathelps coordinate the activities of the various coalition members and markets their goodsand services around the world. Compaq is a Western firm that is attempting to develop asimilar network of organizational alliances. While Compaq concentrates on its core com-petencies in marketing and servicing computer hardware and software, it depends increas-ingly on partnerships with other firms for other functions and for expertise in new marketsand product lines. For instance, Compaq relies heavily on Accenture for assistance indesigning computer networks for its largest customers and on a number of Asian suppliersand assemblers for the manufacture of its products. Such relationships allow Compaq toconcentrate on its core competencies while simultaneously expanding its product and serv-ice offerings and reducing its costs and assets employed.23
Allocating Corporate Resources
Diversified organizations have several advantages over more narrowly focused firms. Theyhave a broader range of areas in which they can knowledgeably invest, and their growthand profitability rates may be more stable because they can offset declines in one businesswith gains in another. To exploit the advantages of diversification, though, corporate man-agers must make intelligent decisions about how to allocate financial and human resources

Walker et al.: Marketing Strategy: A Decision−Focused Approach, Fourth Edition
I. Introduction to Strategy 2. Corporate Strategy Decisions and Their Marketing Implications
112 © The McGraw−Hill Companies, 2002
Chapter Two Corporate Strategy Decisions and Their Marketing Implications 47
across the firm’s various businesses and product-markets. Two sets of analytical tools haveproven useful in making such decisions: portfolio models and value-based planning.
Portfolio ModelsOne of the most significant developments in strategic management during the 1970s and1980s was the widespread adoption of portfolio models to help managers allocate corpo-rate resources across multiple businesses. These models enable managers to classify andreview their current and prospective businesses by viewing them as portfolios of invest-ment opportunities and then evaluating each business’s competitive strength and the attrac-tiveness of the markets it serves.
The Boston Consulting Group’s (BCG) Growth-Share Matrix One of the first—and best known—of the portfolio models is the growth-share matrix developed by the BostonConsulting Group in the late 1960s. It analyzes the impact of investing resources in differentbusinesses on the corporation’s future earnings and cash flows. Each business is positionedwithin a matrix, as shown in Exhibit 2.8. The vertical axis indicates the industry’s growth rateand the horizontal axis shows the business’s relative market share.
The growth-share matrix assumes that a firm must generate cash from businesses withstrong competitive positions in mature markets. Then it can fund investments and expendi-tures in industries that represent attractive future opportunities. Thus, the market growthrate on the vertical axis is a proxy measure for the maturity and attractiveness of an indus-try. This model represents businesses in rapidly growing industries as more attractive invest-ment opportunities for future growth and profitability.
Exhibit 2.8BCG’s Market Growth Relative Share Matrix
Source: Reprinted from Long Range Planning, Volume 10 (February 1977), Barry Hedley, “Strategyand the Business Portfolio,” Copyright 1977, with the permission from Elsevier Science.
����
���
Relative market share�� ��
Marketgrowthrate(inconstantdollars)
��
�� ��
� �� ����
�������� � ���
����
��
��
�
�
�
��
�
!
�
�
��
��

Walker et al.: Marketing Strategy: A Decision−Focused Approach, Fourth Edition
I. Introduction to Strategy 2. Corporate Strategy Decisions and Their Marketing Implications
113© The McGraw−Hill Companies, 2002
Section One Introduction to Strategy48
Similarly, a business’s relative market share is a proxy for its competitive strengthwithin its industry. It is computed by dividing the business’s absolute market share in dol-lars or units by that of the leading competitor in the industry. Thus, in Exhibit 2.8 a busi-ness is in a strong competitive position if its share is equal to, or larger than, that of thenext leading competitor (i.e., a relative share of 1.0 or larger). Finally, in the exhibit, thesize of the circle representing each business is proportional to that unit’s sales volume.Thus, businesses 7 and 9 are the largest-volume businesses in this hypothetical company,while business 11 is the smallest.
Resource Allocation and Strategy Implications Each of the four cells in the growth-share matrix represents a different type of business with different strategy and resource require-ments. The implications of each are discussed below and summarized in Exhibit 2.9.
• Question marks. Businesses in high-growth industries with low relative market shares (thosein the upper-right quadrant of Exhibit 2.9) are called question marks or problem children.Such businesses require large amounts of cash, not only for expansion to keep up with therapidly growing market, but also for marketing activities (or reduced margins) to build mar-ket share and catch the industry leader. If management can successfully increase the share ofa question mark business, it becomes a star. But if managers fail, it eventually turns into adog as the industry matures and the market growth rate slows.
• Stars. A star is the market leader in a high-growth industry. Stars are critical to the contin-ued success of the firm. As their industries mature, they move into the bottom-left quadrantand become cash cows. Paradoxically, while stars are critically important, they often are netusers rather than suppliers of cash in the short run (as indicated by the possibility of a nega-tive cash flow shown in Exhibit 2.9). This is because the firm must continue to invest in suchbusinesses to keep up with rapid market growth and to support the R&D and marketing activ-ities necessary to maintain a leading market share.
• Cash cows. Businesses with a high relative share of low-growth markets are called cash cowsbecause they are the primary generators of profits and cash in a corporation. Such businesses
����
���
Relative market share
���
��� ���
�����������
����
������ ��� ���� �� �������� �����������
��������
Gro
wth
rat
e (c
ash
use
)
���� ���
Exhibit 2.9Cash Flows across Businesses in the BCG Portfolio Model

Walker et al.: Marketing Strategy: A Decision−Focused Approach, Fourth Edition
I. Introduction to Strategy 2. Corporate Strategy Decisions and Their Marketing Implications
114 © The McGraw−Hill Companies, 2002
Chapter Two Corporate Strategy Decisions and Their Marketing Implications 49
do not require much additional capital investment. Their markets are stable, and their shareleadership position usually means they enjoy economies of scale and relatively high profitmargins. Consequently, the corporation can use the cash from these businesses to support itsquestion marks and stars (as shown in Exhibit 2.9). However, this does not mean the firmshould necessarily maximize the business’s short-term cash flow by cutting R&D and mar-keting expenditures to the bone—particularly not in industries where the business might con-tinue to generate substantial future sales.
• Dogs. Low-share businesses in low-growth markets are called dogs because although theymay throw off some cash, they typically generate low profits, or losses. Divestiture is oneoption for such businesses, although it can be difficult to find an interested buyer. Anothercommon strategy is to harvest dog businesses. This involves maximizing short-term cashflow by paring investments and expenditures until the business is gradually phased out.
Limitations of the Growth-Share Matrix Because the growth-share matrix usesonly two variables as a basis for categorizing and analyzing a firm’s businesses, it is rela-tively easy to understand. But while this simplicity helps explain its popularity, it alsomeans the model has limitations:
• Market growth rate is an inadequate descriptor of overall industry attractiveness. Marketgrowth is not always directly related to profitability or cash flow. Some high-growth indus-tries have never been very profitable because low entry barriers and capital intensity haveenabled supply to grow even faster, resulting in intense price competition. Also, rapid growthin one year is no guarantee that growth will continue in the following year.
• Relative market share is inadequate as a description of overall competitive strength. Marketshare is more properly viewed as an outcome of past efforts to formulate and implementeffective business-level and marketing strategies than as an indicator of enduring competitivestrength.24 If the external environment changes, or the SBU’s managers change their strategy,the business’s relative market share can shift dramatically.
• The outcomes of a growth-share analysis are highly sensitive to variations in how growth andshare are measured.25 Defining the relevant industry and served market (i.e., the target-market segments being pursued) also can present problems. For example, does Pepsi Colacompete only for a share of the cola market, or for a share of the much larger market for non-alcoholic beverages, such as iced tea, bottled water, and fruit juices?
• While the matrix specifies appropriate investment strategies for each business, it provides lit-tle guidance on how best to implement those strategies. While the model suggests that a firmshould invest cash in its question mark businesses, for instance, it does not consider whetherthere are any potential sources of competitive advantage that the business can exploit to suc-cessfully increase its share. Simply providing a business with more money does not guaran-tee that it will be able to improve its position within the matrix.
• The model implicitly assumes that all business units are independent of one another except for theflow of cash. If this assumption is inaccurate, the model can suggest some inappropriate resourceallocation decisions. For instance, if other SBUs depend on a dog business as a source of sup-ply—or if they share functional activities, such as a common plant or salesforce, with that busi-ness—harvesting the dog might increase the costs or reduce the effectiveness of the other SBUs.
Alternative Portfolio Models In view of the above limitations, a number of firms haveattempted to improve the basic portfolio model. Such improvements have focused primarily ondeveloping more detailed, multifactor measures of industry attractiveness and a business’s com-petitive strength and on making the analysis more future-oriented. Exhibit 2.10 shows somefactors managers might use to evaluate industry attractiveness and a business’s competitiveposition. Corporate managers must first select factors most appropriate for their firm and weightthem according to their relative importance. They then rate each business and its industry onthe two sets of factors. Next, they combine the weighted evaluations into summary measures

Walker et al.: Marketing Strategy: A Decision−Focused Approach, Fourth Edition
I. Introduction to Strategy 2. Corporate Strategy Decisions and Their Marketing Implications
115© The McGraw−Hill Companies, 2002
Section One Introduction to Strategy50
used to place each business within one of the nine boxes in the matrix. Businesses falling intoboxes numbered 1 (where both industry attractiveness and the business’s ability to compete arerelatively high) are good candidates for further investment for future growth. Businesses in the2 boxes should receive only selective investment with an objective of maintaining current posi-tion. Finally, businesses in the 3 boxes are candidates for harvesting or divestiture.
These multifactor models are more detailed than the simple growth-share model andconsequently provide more strategic guidance concerning the appropriate allocation of resources across businesses. They are also more useful for evaluating potential newproduct-markets. However, the multifactor measures in these models can be subjective andambiguous, especially when managers must evaluate different industries on the same setof factors. Also, the conclusions drawn from these models still depend on the way indus-tries and product-markets are defined.26
Value-Based PlanningAs mentioned, one limitation of portfolio analysis is that it specifies how firms should allo-cate financial resources across their businesses without considering the competitive strate-gies those businesses are, or should be, pursuing. Portfolio analysis provides little guidance,for instance, in deciding which of two question mark businesses—each in attractive marketsbut following different strategies—is worthy of the greater investment or in choosing whichof several competitive strategies a particular business unit should pursue.
Value-based planning is a resource allocation tool that attempts to address such ques-tions by assessing the shareholder value a given strategy is likely to create. Thus, value-
Exhibit 2.10The Industry Attractiveness-Business Position Matrix
�
���
� ��������� �������� ��������������� �������� �����������
���
�
� �
� �
����������
����
������
Industry attractiveness
Bu
sin
ess’
s co
mp
etit
ive
po
siti
on
Variables that might be used to evaluate:
Business’s competitive position Industry attractivement
Size Distribution Size ProfitabilityGrowth Technology Growth Technological sophisticationRelative share Marketing skills Competitive intensity Government regulationsCustomer loyalty Patents Price levelsMargins

Walker et al.: Marketing Strategy: A Decision−Focused Approach, Fourth Edition
I. Introduction to Strategy 2. Corporate Strategy Decisions and Their Marketing Implications
116 © The McGraw−Hill Companies, 2002
Chapter Two Corporate Strategy Decisions and Their Marketing Implications 51
based planning provides a basis for comparing the economic returns to be gained frominvesting in different businesses pursuing different strategies or from alternative strategiesthat might be adopted by a given business unit.
A number of value-based planning methods are currently in use, but all share three basicfeatures.27 First, they assess the economic value a strategy is likely to produce by examin-ing the cash flows it will generate, rather than relying on distorted accounting measures,such as return on investment.28 Second, they estimate the shareholder value that a strategywill produce by discounting its forecasted cash flows by the business’s risk-adjusted cost ofcapital. Finally, they evaluate strategies based on the likelihood that the investmentsrequired by a strategy will deliver returns greater than the cost of capital. The amount ofreturn a strategy or operating program generates in excess of the cost of capital is commonlyreferred to as its economic value added, or EVA.29 This approach to evaluating alternativestrategies is particularly appropriate for use in allocating resources across business unitsbecause most capital investments are made at the business-unit level, and different businessunits typically face different risks and therefore have different costs of capital.
Discounted Cash Flow Model Perhaps the best-known and most widely used approachto value-based planning is the discounted cash flow model proposed by Alfred Rappaport andthe Alcar Group, Inc. In this model, as Exhibit 2.11 indicates, shareholder value created by astrategy is determined by the cash flow it generates, the business’s cost of capital (which isused to discount future cash flows back to their present value), and the market value of thedebt assigned to the business. The future cash flows generated by the strategy are, in turn,
Valuationcomponents
Valuedrivers
Managementdecisions
Corporate objective
����������������
����
�������� ������� �� ������� ������� �����
����
� ������ ����� �������
� ����� ����� ���������� ����� ������� ����� ���� ����
� ������� �������� �� �������� ������ �������� �� �������
� ��� �� �������
��������� �� ������� ���������
��� ��� �����������
�����������
Exhibit 2.11Factors Affecting the Creation of Shareholder Value
Source: Adapted with permission of The Free Press, a Division of Simon & Schuster, Inc., from Cre-ating Shareholder Value: A Guide for Managers & Investors, revised and updated by Alfred Rappaport.Copyright © 1986, 1998 by Alfred Rappaport.

Walker et al.: Marketing Strategy: A Decision−Focused Approach, Fourth Edition
I. Introduction to Strategy 2. Corporate Strategy Decisions and Their Marketing Implications
117© The McGraw−Hill Companies, 2002
Section One Introduction to Strategy52
affected by six “value drivers”: the rate of sales growth the strategy will produce, the operat-ing profit margin, the income tax rate, investment in working capital, fixed capital investmentrequired by the strategy, and the duration of value growth.
The first five value drivers are self-explanatory, but the sixth requires some elaboration.The duration of value growth represents management’s estimate of the number of yearsover which the strategy can be expected to produce rates of return that exceed the cost ofcapital. This estimate, in turn, is tied to two other management judgments. First, the man-ager must decide on the length of the planning period (typically three to five years); he orshe must then estimate the residual value the strategy will continue to produce after theplanning period is over. Such decisions are tricky, for they involve predictions of what willhappen in the relatively distant future.30
Some Limitations of Value-Based Planning31 Value-based planning is not a sub-stitute for strategic planning; it is only one tool for evaluating strategy alternatives identi-fied and developed through managers’ judgments. It does so by relying on forecasts of manykinds to put a financial value on the hopes, fears, and expectations managers associate witheach alternative. Projections of cash inflows rest on forecasts of sales volume, product mix,unit prices, and competitors’ actions. Expected cash outflows depend on projections of var-ious cost elements, working capital, and investment requirements.
While good forecasts are notoriously difficult to make, they are critical to the validityof value-based planning. Once someone attaches numbers to judgments about what islikely to happen, people tend to endow those numbers with the concreteness of hard facts.Therefore, the numbers derived from value-based planning can sometimes take on a life oftheir own, and managers can lose sight of the assumptions underlying them.
Consequently, inaccurate forecasts can create problems in implementing value-basedplanning. For one thing, there are natural human tendencies to overvalue the financial pro-jections associated with some strategy alternatives and to undervalue others. For instance,managers are likely to overestimate the future returns from a currently successful strategy.Evidence of past success tends to carry more weight than qualitative assessments of futurethreats. Managers may pay too little attention to how competitive behavior, prices, andreturns might change if, for example, the industry were suddenly beset by a slowdown inmarket growth and the appearance of excess capacity.
On the other hand, some kinds of strategy alternatives are consistently undervalued. Par-ticularly worrisome from a marketing viewpoint is the tendency to underestimate the value
of keeping current customers. Putting a figure on the damage to a firm’scompetitive advantage from not making a strategic investment necessaryto maintain the status quo is harder than documenting potential cost sav-ings or profit improvements that an investment might generate. For exam-ple, a few years ago Cone Drive Operations, a small manufacturer ofheavy-duty gears, faced a number of related problems. Profits were
declining, inventory costs were climbing, and customers were unhappy because deliverieswere often late. Cone’s management thought that a $2 million computer-integrated manu-facturing system might help solve these problems; but a discounted cash flow analysis indi-cated the system would be an unwise investment. Because the company had only $26million in sales, it was hard to justify the $2 million investment in terms of cost savings.However, the financial analysis underestimated intangibles such as improved product qual-ity, faster order processing, and improved customer satisfaction. Management decided toinstall the new system anyway, and new business and nonlabor savings paid back the invest-ment in just one year. More important, Cone retained nearly all of its old customers, manyof whom had been seriously considering switching to other suppliers.
Strategic Issue
Some kinds of strategy alternatives are con-sistently undervalued. Particularly worrisomefrom a marketing viewpoint is the tendencyto underestimate the value of keeping cur-rent customers.

Walker et al.: Marketing Strategy: A Decision−Focused Approach, Fourth Edition
I. Introduction to Strategy 2. Corporate Strategy Decisions and Their Marketing Implications
118 © The McGraw−Hill Companies, 2002
Chapter Two Corporate Strategy Decisions and Their Marketing Implications 53
Finally, another kind of problem involved in implementing value-based planning occurswhen management fails to consider all the appropriate strategy alternatives. Since it is onlyan analytical tool, value-based planning can evaluate alternatives, but it cannot createthem. The best strategy will never emerge from the evaluation process if management failsto identify it. To realize its full benefits, then, management must link value-based planningto sound strategic analysis that is rigorous enough to avoid the problems associated withundervaluing certain strategies, overvaluing others, and failing to consider all the options.
Sources of Synergy
A final strategic concern at the corporate level is to increase synergy across the firm’s var-ious businesses and product-markets. As mentioned, synergy exists when two or morebusinesses or product-markets, and their resources and competencies, complement andreinforce one another so that the total performance of the related businesses is greater thanit would be otherwise.
Knowledge-Based SynergiesSome potential synergies at the corporate level are knowledge-based. The performance ofone business can be enhanced by the transfer of competencies, knowledge, or customer-related intangibles—such as brand-name recognition and reputation—from other unitswithin the firm. For instance, the technical knowledge concerning image processing andthe quality reputation that Canon developed in the camera business helped ease the firm’sentry into the office copier business.
In part, such knowledge-based synergies are a function of the corporation’s scope andmission—or how its managers answer the question, What businesses should we be in?When a firm’s portfolio of businesses and product-markets reflects a common missionbased on well-defined customer needs, market segments, or technologies, the company ismore likely to develop core competencies, customer knowledge, and strong brand fran-chises that can be shared across businesses. However, the firm’s organization structure andallocation of resources also may enhance knowledge-based synergy. A centralized corpo-rate R&D department, for example, is often more efficient and effective at discovering newtechnologies with potential applications across multiple businesses than if each businessunit bore the burden of funding its own R&D efforts. Similarly, some argue that strong corporate-level coordination and support are necessary to maximize the strength of a firm’sbrand franchise, and to glean full benefit from accumulated market knowledge, when thefirm is competing in global markets.
Corporate Identity and the Corporate Brand as a Source of SynergyCorporate identity—together with a strong corporate brand that embodies that identity—canhelp a firm stand out from its competitors and give it a sustainable advantage in the market.Corporate identity flows from the communications, impressions, and personality projected byan organization. It is shaped by the firm’s mission and values, its functional competencies, thequality and design of its goods and services, its marketing communications, the actions of itspersonnel, the image generated by various corporate activities, and other factors.32
In order to project a positive, strong, and consistent identity, firms as diverse as Cater-pillar, Walt Disney, and The Body Shop have established formal policies, criteria, and

Walker et al.: Marketing Strategy: A Decision−Focused Approach, Fourth Edition
I. Introduction to Strategy 2. Corporate Strategy Decisions and Their Marketing Implications
119© The McGraw−Hill Companies, 2002
Section One Introduction to Strategy54
guidelines to help ensure that all the messages and sensory images they communicate reflecttheir unique values, personality, and competencies. One rationale for such corporate iden-tity programs is that they can generate synergies that enhance the effectiveness and effi-ciency of the firm’s marketing efforts for its individual product offerings. By focusing on acommon core of corporate values and competencies, every impression generated by eachproduct’s design, packaging, advertising, and promotional materials can help reinforce andstrengthen the impact of all the other impressions the firm communicates to its customers,employees, shareholders, and other audiences, and thereby generate a bigger bang for itslimited marketing bucks. For example, by consistently focusing on values and competen-cies associated with providing high-quality family entertainment, Disney has created anidentity that helps stimulate customer demand across a wide range of product offerings—from movies to TV programs to licensed merchandise to theme parks and cruise ships.
Corporate Branding Strategy—When Does a Strong Corporate Brand Make Sense?Before a company’s reputation and corporate image can have any impact—either positiveor negative—on customers’ purchase decisions, those customers must be aware of whichspecific product or service offerings are sponsored by the company. This is where thefirm’s corporate branding strategy enters the picture. Essentially, a firm might pursue oneof three options concerning the corporate brand:33
1. The corporate brand (typically the company’s own name and logo) might serve as the brandname of all or most of the firm’s products in markets around the world, as is the case withmany high-tech (e.g., Cisco Systems, Siemens, IBM, Caterpillar) and service (e.g., BritishAirways, Amazon.com, McDonald’s, Hilton hotels) companies.
2. The firm might adopt a dual branding strategy in which each offering carries both a corpo-rate identifier and an individual product brand. Examples include Microsoft software prod-ucts (e.g., Microsoft Windows, Microsoft Word, etc.) and Ford automobiles (Ford Taurus,Ford Explorer, etc.)
3. Finally, each product offering might be given a unique brand and identity—perhaps evendifferent brands across different global markets—while the identity of the source companyis de-emphasized or hidden. This is the strategy pursued by Procter and Gamble and manyother consumer package goods firms.
The question is, When does it make sense to emphasize—and seek to gain synergyfrom—a strong corporate identity and brand name in a company’s branding strategy? Sur-prisingly, this question has not been subjected to much empirical research. However, someof the conditions favoring a dominant corporate brand are rather obvious. For instance, thecorporate brand will not add much value to the firm’s offerings unless the company has astrong and favorable image and reputation among potential customers in at least most of itstarget markets. Thus, the 3M Company features the 3M logo prominently on virtually all ofits 70,000 products because the firm’s reputation for innovativeness and reliability is per-ceived positively by many of its potential customers regardless of what they are buying.
A related point is that a strong corporate brand makes most sense when company-level com-petencies or resources are primarily responsible for generating the benefits and value customersreceive from its various individual offerings. For example, many service organizations (e.g.,McDonald’s, Disney, Marriott, etc.) emphasize their corporate brands. This is due, in part, to thefact that services are relatively intangible and much of their value is directly generated by theactions of company personnel and facilitated by other firm-specific resources, such as its physi-cal facilities, employee training and reward programs, quality control systems, and the like.
Walker et al.: Marketing Strategy: A Decision−Focused Approach, Fourth Edition
I. Introduction to Strategy 2. Corporate Strategy Decisions and Their Marketing Implications
120 © The McGraw−Hill Companies, 2002
Chapter Two Corporate Strategy Decisions and Their Marketing Implications 55
Finally, a recent exploratory study based on interviews with managers in 11 Fortune500 companies suggests that a firm is more likely to emphasize a strong corporate brandwhen its various product offerings are closely interrelated, either in terms of having simi-lar positionings in the market or cross-product elasticities that might be leveraged toencourage customers to buy multiple products from the firm.34 The study also found thatfirms with strong corporate brands tended to have more centralized decision-making struc-tures where top management made more of the marketing strategy decisions. The obviousquestion, of course, is whether a firm’s decision-making structure influences brand strat-egy, or vice versa. We will explore such organization design issues and their marketingstrategy implications in more detail later in Chapter 13.
Synergy from Shared ResourcesA second potential source of corporate synergy is inherent in sharing operationalresources, facilities, and functions across business units. For instance, two or more busi-nesses might produce products in a common plant or use a single salesforce to contactcommon customers. When such sharing helps increase economies of scale or experience-curve effects, it can improve the efficiency of each of the businesses involved. However,the sharing of operational facilities and functions may not produce positive synergies forall business units. Such sharing can limit a business’s flexibility and reduce its ability toadapt quickly to changing market conditions and opportunities. Thus, a business whosecompetitive strategy is focused on new-product development and the pursuit of rapidlychanging markets may be hindered more than helped when it is forced to share operatingresources with other units.35 For instance, when Frito-Lay attempted to enter the packagedcookie market with its Grandma’s line of soft cookies, the company relied on its 10,000salty-snack route salespeople to distribute the new line to grocery stores. The firm thoughtits huge and well-established snack salesforce would give its cookies a competitive advan-tage in gaining shelf space and retailer support. But because those salespeople were paida commission on their total sales revenue, they were reluctant to take time from their salty-snack products to push the new cookies. The resulting lack of a strong sales effort con-tributed to Grandma’s failure to achieve a sustainable market share.
As we shall see in the next chapter, the type of competitive strategy a business unitchooses to pursue can have a number of implications for corporate-level decisions con-cerning organizational structure and resource allocation as well as for the marketing strate-gies and programs employed within the business.
Take Aways
• A clearly defined corporate mission answers the ques-tion “What business(es) should we be in?” It providesguidance to a firm’s managers concerning what alter-native product categories and market segments fit bestwith the firm’s competencies, resources, and objec-tives. Mission statements are most useful, therefore,when they are relatively specific concerning both thecustomer groups and the products or technologies onwhich the firm will concentrate.
• Unethical behavior by a firm’s employees can damagethe trust between a firm and its suppliers and cus-tomers, thereby disrupting the development of long-
term relationships and reducing sales and profits overtime.
• In the long term, the value a firm generates for itsshareholders and the value it delivers to its customersconverge. A firm can continue to provide attractivereturns to shareholders only so long as it satisfies andretains its customers.
• The four major paths to corporate growth—marketpenetration, market development, product develop-ment, and diversification strategies—imply differencesin a firm’s strategic scope, require different competen-cies and marketing actions, and involve different types
Walker et al.: Marketing Strategy: A Decision−Focused Approach, Fourth Edition
I. Introduction to Strategy 2. Corporate Strategy Decisions and Their Marketing Implications
121© The McGraw−Hill Companies, 2002
Section One Introduction to Strategy56
and amounts of risk. Decisions about which path(s) topursue should consider all of these factors.
• A strong corporate brand can create synergy across afirm’s various product offerings, but only if potentialcustomers are aware that the company possesses com-petencies or values that (1) are likely to enhance the
value they receive from the firm’s goods and servicesand (2) differentiate the company from its competitors.
• Self-diagnostic questions to test your ability to applythe concepts in this chapter can be found at this book’swebsite at www.mhhe.com/walker.
Endnotes
1. This case example is based on information found in Dan Brekke, “TheFuture Is Now—or Never,” New York Times Magazine, January 23, 2000, pp.30–33, and at the company’s website, www.redenvelope.com.
2. John A. Byrne, “PepsiCo’s New Formula,” Business Week, April 10, 2000,pp. 172–84.
3. Theodore Levitt, “Marketing Myopia,” Harvard Business Review,July–August 1960, pp. 455–56.
4. “Good Grief,” The Economist, April 8, 1995, p. 57; and “Doing Well byDoing Good,” The Economist, April 22, 2000, pp. 65–67.
5. “Doing Well by Doing Good,” p. 66.
6. Robert A. Cooke, Ethics in Business: A Perspective (Chicago: ArthurAndersen, 1988).
7. I. Fredrick Trawick, John E. Swan, Gail W. McGee, and David R. Rink,“Influence of Buyer Ethics and Salesperson Behavior on Intention to Choosea Supplier,” Journal of the Academy of Marketing Science 19 (Winter 1991),pp. 17–23.
8. Dawn Bryan, “Using Gifts to Make the Sale,” Sales & Marketing Man-agement, September 1989, pp. 48–53. See also “The Destructive Cost ofGreasing Palms,” Business Week, December 6, 1993, pp. 133–38.
9. Alfred Rappaport, Creating Shareholder Value: The New Standard forBusiness Performance (New York: Free Press, 1986), chap. 1; and ShawnTully, “America’s Best Wealth Creators,” Fortune, November 28, 1994, pp.143–62.
10. Tully, “America’s Best Wealth Creators,” p. 143.
11. Bradley T. Gale and Donald J. Swire, “The Tricky Business of MeasuringWealth,” Planning Review, March–April 1988, pp. 14–17, 47.
12. Patrick Barwise, Paul R. Marsh, and Robin Wensley, “Must Finance andStrategy Clash?” Harvard Business Review, September–October 1989, pp.85–90; and George S. Day and Liam Fahey, “Putting Strategy into Share-holder Value Analysis,” Harvard Business Review, March–April 1990, pp.156–-62.
13. “Debate: Duking It Out over EVA,” Fortune, August 4, 1997, p. 232.
14. Y. K. Shetty, “New Look at Corporate Goals,” California ManagementReview 12 (Winter 1979), pp. 71–79; see also Robert S. Kaplan and David P.Norton, “Using the Balanced Scorecard as a Strategic Management System,”Harvard Business Review 74 (January–February 1996), pp. 75–85.
15. Gordon Donaldson, Managing Corporate Wealth (New York: Praeger,1984). See also Kaplan and Norton, “Using the Balanced Scorecard,” andRajendra K. Srivastava, Tasadduq A. Shervani, and Liam Fahey, “Marketing,Business Processes, and Shareholder Value: An Organizationally EmbeddedView of Marketing Activities and the Discipline of Marketing,” Journal ofMarketing 63 (Special Issue 1999), pp. 168–79.
16. Daniel P. Finkelman, “Crossing the ‘Zone of Indifference,’ ” MarketingManagement 2, no. 3 (1993), pp. 22–31.
17. Heather Green, “Shakeout: E–tailers,” Business Week, May 15, 2000, pp.EB102–108.
18. “GE’s Brave New World,” Business Week, November 8, 1993, pp. 64–70.
19. Jennifer L. Schenker, “The Future Is Now,” Time, April 10, 2000, pp.85–86.
20. Robert D. Buzzell and Bradley T. Gale, The PIMS Principles: LinkingStrategy to Performance (New York: Free Press, 1987), chap. 8.
21. For a more comprehensive review of the evidence concerning the effectsof diversification on firm performance, see Roger A. Kerin, Vijay Mahajan,and P. Rajan Varadarajan, Contemporary Perspectives on Strategic MarketPlanning (Boston: Allyn and Bacon, 1990), chap. 6.
22. For example, see Ravi S. Achrol and Philip Kotler, “Marketing in the Net-work Economy,” Journal of Marketing 63 (Special Issue 1999), pp. 146–63.
23. Garry McWilliams, “Compaq at the Crossroads,” Business Week, July 22,1996, pp. 70–72.
24. Robert Jacobson argues that market share and profitability are joint out-comes from successful strategies and, further, that management skills likelyhave the greatest impact on profitability. See “Distinguishing Among Com-peting Theories of the Market Share Effect,” Journal of Marketing 52 (Octo-ber 1988), pp. 68–80.
25. Yoram Wind, Vijay Mahajan, and Donald J. Swire, “An Empirical Com-parison of Standardized Portfolio Models,” Journal of Marketing 47 (Spring1983), pp. 89–99.
26. For a more detailed discussion of the uses and limitations of multifactorportfolio models, see Kerin, Mahajan, and Varadarajan, Contemporary Per-spectives on Strategic Market Planning, chap. 3.
27. The discounted cash flow model is the approach focused on in this chap-ter. It is detailed in Alfred Rappaport, Creating Shareholder Value: A NewStandard for Business Performance (New York: Free Press, 1986).
28. For a detailed discussion of the shortcomings of accounting data for deter-mining the value created by a strategy, see Rappaport, Creating ShareholderValue, chap. 2.
29. For a more detailed discussion of EVA and some practical examples, seeShawn Tully, “The Real Key to Creating Wealth,” Fortune, September 20,1993, pp. 38–50; and Terrence P. Pare, “The New Champ of Wealth Cre-ation,” Fortune, September 18, 1995, pp. 131–32.
30. A more in-depth discussion of the forecasts and other procedures used invalue-based planning can be found in Rappaport, Creating ShareholderValue, or Kerin, Mahajan, and Varadarajan, Contemporary Perspectives onStrategic Market Planning, chap. 9.
31. The limitations of value-based planning are discussed in more detail inGeorge S. Day and Liam Fahey, “Putting Strategy into Shareholder ValueAnalysis,” Harvard Business Review, March–April, 1990, pp. 156–62.
32. Wally Olins, Corporate Identity (Cambridge, MA: Harvard BusinessSchool Press, 1993).
33. For a more detailed typology of brand strategies or “architectures,” seeDavid A. Aaker and Erich Joachimsthaler, Brand Leadership (New York: FreePress, 2000).
34. Gabriel J. Biehal and Daniel A. Sheinin, Building Corporate Brands: AnExploratory Study, Report 01–100 (Cambridge, MA: Marketing ScienceInstitute, 2001). See also Aaker and Joachimsthaler, Brand Leadership.
35. Robert W. Ruekert and Orville C. Walker Jr., Shared Marketing Programsand the Performance of Different Business Strategies, Report 91–100 (Cam-bridge, MA: Marketing Science Institute, 1991).

Walker et al.: Marketing Strategy: A Decision−Focused Approach, Fourth Edition
I. Introduction to Strategy 3. Business Strategies and Their Marketing Implications
122 © The McGraw−Hill Companies, 2002
58
Chapter Three
BUSINESS STRATEGIES
AND THEIR MARKETING
IMPLICATIONS
Business Strategies and Marketing Programs at 3M1
The Minnesota Mining and ManufacturingCompany, better known as 3M, began manu-facturing sandpaper nearly a century ago.
Today it is the leader in dozens of technical areasfrom fluorochemistry to fiber optics. The firmmakes more than 60,000 different products, whichgenerated $16.7 billion in global sales in 2000.The company produced $3.1 billion in operatingincome, for more than a 19 percent return oninvested capital.
As you might expect of a firm with so manyproducts, 3M is organized into a large number ofstrategic business units (SBUs). The company con-tains more than 40 such SBUs or product divisionsorganized into six market sectors:
• The Industrial Sector makes a variety oftapes, abrasives, and adhesives for industrialapplications ranging from electronics to theauto industry.
• The Transportation, Graphics, and Safety Sec-tor produces such things as reflective materi-als for traffic signs, respirators for workersafety, and materials for commercial graphics.
• The Health Care Sector markets a variety ofmedical, surgical, pharmaceutical, and dentalproducts and services.
• The Consumer and Office Sector offers productsfor homes and offices, such as Post-it brandrepositionable notes and Scotch brand tapes.
• The Electro and Communications Sector sup-plies connecting, splicing, and protectiveproducts for electronics and telecommunica-tions markets.
• The Specialty Materials Sector provides fluo-rothermoplastics and fluorothermopolymersfor a variety of applications from packagingto electronics.
While 3M has acquired many smaller firms over the years, its growth strategy has focusedprimarily on internal new product development,emphasizing both improved products for existingcustomers and new products for new markets. Oneformal objective assigned to every business unit isto obtain at least 30 percent of annual sales fromproducts introduced within the past four years.The company supports its growth strategy with an

Walker et al.: Marketing Strategy: A Decision−Focused Approach, Fourth Edition
I. Introduction to Strategy 3. Business Strategies and Their Marketing Implications
123© The McGraw−Hill Companies, 2002
59
R&D budget of more than $1 billion, almost 7 per-cent of total revenues.
The company also pursues growth through theaggressive development of foreign markets for itsmany products. A seventh organizational sector isresponsible for coordinating the firm’s marketingefforts across countries. In 2000, 3M attained $9billion in sales—53 percent of its total revenue—from outside the United States.
Differences in customer needs and life-cyclestages across industries, however, lead 3M’s variousbusiness units to pursue their growth objectives indifferent ways. The Industrial Tape Division withinthe Industrial Sector, for example, operates in anindustry where both the product technologies andthe customer segments are relatively mature andstable. Growth in this group results from extendingthe scope of adhesive technology (for instance,attaching weather-stripping to auto doors), productimprovements and line extensions targeted at exist-ing customers, and expansion into global markets.
In contrast, the firm’s Drug Delivery SystemsDivision within the Health Care Sector developsnew medical applications for emerging technolo-gies developed in 3M’s many R&D labs. It sells avariety of technologies for the delivery of medica-tions that are inhaled or absorbed through theskin. Most of the unit’s growth comes from devel-oping new products, often through alliances withother pharmaceutical firms, aimed at new markets.
The competitive strategies of 3M’s various busi-ness units also differ. For instance, the industrialtape unit is primarily concerned with maintainingits commanding market share in existing marketswhile preserving or even improving its profitability.Its competitive strategy is to differentiate itself
from competitors on the basis of product qualityand excellent customer service.
But the drug delivery systems unit’s strategy isto avoid head-to-head competitive battles by beingthe technological leader and introducing a streamof unique new products. To be successful, though,the unit must devote substantial resources to R&Dand to the stimulation of primary demand. Thus, itsmain objective is volume growth; and it mustsometimes sacrifice short-run profitability to fundthe product development and marketing effortsneeded to accomplish that goal.
These differences in competitive strategy, in turn,influence the strategic marketing programs withinthe various business units. For instance, the firmspends little on advertising or sales promotion forits mature industrial tape products. However, it doesmaintain a large, well-trained technical salesforcethat provides valuable problem-solving assistanceand other services to customers and informed feed-back to the firm’s R&D personnel about potentialnew applications and product improvements.
In contrast, the pioneering nature of the drugdelivery unit’s technologies calls for more exten-sive promotion to attract potential alliance part-ners, develop awareness among prescribingphysicians, and stimulate primary demand. Conse-quently, the unit devotes a relatively large portionof its revenues to advertising in technical journalsaimed at the pharmaceutical industry, physicians,and other medical professionals. It also supports a well-trained salesforce, but those salespeoplespend much of their time demonstrating new tech-nologies and building relationships with drugmanufacturers who are prospective customers andpartners.
Strategic Challenges Addressed
in Chapter 3
The situation at 3M illustrates that large firms with multiple businesses usually have a hierarchy of strategies extending from the corporate level down to the individual product-market entry. As we saw in Chapter 2, corporate strategy addresses such issues as the

Walker et al.: Marketing Strategy: A Decision−Focused Approach, Fourth Edition
I. Introduction to Strategy 3. Business Strategies and Their Marketing Implications
124 © The McGraw−Hill Companies, 2002
Section One Introduction to Strategy60
firm’s mission and scope and the directions it will pursue for future growth. Thus, 3M’scorporate growth strategy focuses primarily on developing new products and new applica-tions for emerging technologies.
The major strategic question addressed at the business-unit level is, How should wecompete in this business? For instance, 3M’s industrial tape unit attempts to maintain itscommanding market share and high profitability by differentiating itself on the basis ofhigh product quality and good customer service. The drug delivery unit, on the other hand,seeks high growth via aggressive new product and market development.
Finally, the strategic marketing program for each product-market entry within a busi-ness unit attempts to allocate marketing resources and activities in a manner appropriatefor accomplishing the business unit’s objectives. Thus, most of the strategic marketing pro-grams within 3M’s drug delivery unit involve relatively large expenditures for marketingresearch and introductory advertising and promotion campaigns aimed at achieving salesgrowth.
One key reason for 3M’s continuing success is that all three levels of strategy within thecompany have usually been characterized by good internal and external consistency, orstrategic fit. The company’s managers have done a good job of monitoring and adaptingtheir strategies to the market opportunities, technological advances, and competitivethreats in the company’s external environment. The firm’s marketing and sales managersplay critical roles both in developing market-oriented strategies for individual products andin influencing and helping to formulate corporate and business-level strategies that areresponsive to environmental conditions. At the same time, those strategies are usuallyinternally compatible. Each strategy fits with those at other levels as well as with theunique competitive strengths and competencies of the relevant business unit and the com-pany as a whole.2
Recent empirical evidence shows that when there is a good fit between a business’scompetitive strategy and the strategic marketing programs of its various product or service
offerings, the business will achieve better results in terms of salesgrowth, market share, and profitability than when the two levels of strat-egy are inconsistent with one another.3 Therefore, this chapter focuses onwhat marketing decision makers can and should do to help ensure thatthe strategic marketing plans they develop are appropriate in light of theavailable resources and competitive thrust of the business that is theirorganizational home.
First, we briefly examine the strategic decisions that must be made at the business level,including how business units should be designed. We’ll pay particular attention to the ques-tion of how a business might choose to compete. What generic competitive strategies mighta business pursue, and in what environmental circumstances is each strategy most appro-priate? We’ll also explore whether the same kinds of competitive strategies are relevant forsmall, single-business organizations and entrepreneurial start-ups as for large multi-SBUfirms such as 3M and whether technological shifts, such as the growth of e-commerce, arelikely to give birth to new competitive strategies or make some old ones obsolete.
Next, we examine the interrelationships between different business competitive strate-gies and elements of the strategic marketing programs for the various products within the business. How does—or should—a particular competitive strategy influence or con-strain marketing programs for the business’s product offerings? And what happens if themarket positioning or specific marketing actions that would be most effective for appeal-ing to a product’s target customers do not fit very well with the competitive strategy of the larger business unit? For example, as some of the products made by the drug deliveryunit at 3M—such as the inhalers they make for delivering asthma medications—become
Strategic Issue
When there is a good fit between a busi-ness’s competitive strategy and the strate-gic marketing programs of its variousproduct or service offerings, the businesswill achieve better results.

Walker et al.: Marketing Strategy: A Decision−Focused Approach, Fourth Edition
I. Introduction to Strategy 3. Business Strategies and Their Marketing Implications
125© The McGraw−Hill Companies, 2002
Chapter Three Business Strategies and Their Marketing Implications 61
well-established and mature, they may require marketing actions (e.g., more competitivepricing) that are not consistent with the aggressive product development strategy of thebusiness unit. What should 3M and the marketing manager responsible for inhalers dounder such circumstances?
Strategic Decisions
at the Business-Unit Level
The components of a firm engaged in multiple industries or businesses are typically calledstrategic business units, or SBUs. Managers within each of these business units decidewhich objectives, markets, and competitive strategies to pursue. Top-level corporate man-agers typically reserve the right to review and approve such decisions to ensure their over-all consistency with the company’s mission, objectives, and the allocation of resourcesacross SBUs in its portfolio. However, SBU-level managers, particularly those in market-ing and sales, bear the primary responsibility for collecting and analyzing relevant infor-mation and generating appropriate strategies for their businesses. Those managers aremore familiar with a given SBU’s products, customers, and competitors and are responsi-ble for successfully implementing the strategy. The rationale for breaking larger firms intosemi-autonomous SBUs usually stems from a market-oriented desire to move strategicdecision making closer to the customers the business is trying to reach.
The first step in developing business-level strategies, then, is for the firm to decide howto divide itself into SBUs. The managers in each SBU must then make recommendationsabout (a) the unit’s objectives, (b) the scope of its target customers and offerings, (c) whichbroad competitive strategy to pursue to build a competitive advantage in its product-markets, and (d) how resources should be allocated across its product-market entries andfunctional departments.
How Should Strategic Business Units Be Designed?Ideally, strategic business units have the following characteristics:
• A homogeneous set of markets to serve with a limited number of related technologies. Mini-mizing diversity across an SBU’s product-market entries enables the unit’s manager to betterformulate and implement a coherent and internally consistent business strategy.
• A unique set of product-markets, in the sense that no other SBU within the firm competes forthe same customers with similar products. Thus, the firm avoids duplication of effort andmaximizes economies of scale within its SBUs.
• Control over those factors necessary for successful performance, such as production, R&Dand engineering, marketing, and distribution. This does not mean an SBU should not shareresources, such as a manufacturing plant or a salesforce, with one or more other businessunits. But the SBU should determine how its share of the joint resource is used to effectivelycarry out its strategy.
• Responsibility for their own profitability.
As you might expect, firms do not always meet all of these ideals when designing busi-ness units. There are usually trade-offs between having many small homogeneous SBUsversus large but fewer SBUs that managers can more easily supervise.
What criteria should managers use to decide how product-markets should be clusteredinto a business unit? The three dimensions that define the scope and mission of the entirecorporation also define individual SBUs:

Walker et al.: Marketing Strategy: A Decision−Focused Approach, Fourth Edition
I. Introduction to Strategy 3. Business Strategies and Their Marketing Implications
126 © The McGraw−Hill Companies, 2002
Section One Introduction to Strategy62
1. Technical compatibility, particularly with respect to product technologies and operationalrequirements, such as the use of similar production facilities and engineering skills.
2. Similarity in the customer needs or the product benefits sought by customers in the targetmarkets.
3. Similarity in the personal characteristics or behavior patterns of customers in the targetmarkets.
In practice, the choice is often between technical/operational compatibility on the onehand and customer homogeneity on the other. Frequently management defines SBUs byproduct-markets requiring similar technologies, production facilities, and employee skills.This minimizes the coordination problems involved in administering the unit and increasesits ability to focus on one or a few critical competencies.
In some firms, however, the marketing synergies gained from coordinating technicallydifferent products aimed at the same customer need or market segment outweigh opera-tional considerations. In these firms, managers group product-market entries into SBUsbased on similarities across customers or distribution systems. For instance, 3M’s MedicalProducts unit includes a wide range of products involving very different technologies andproduction processes. They are grouped within the same business unit, though, because alladdress health needs, are marketed to physicians and other health professionals, and canbe sold through a common salesforce and distribution system.
Business-Unit ObjectivesCompanies break down corporate objectives into subobjectives for each SBU. In mostcases, those subobjectives vary across SBUs according to the attractiveness of their indus-tries, the strength of their competitive positions within those industries, and resource allo-cation decisions by corporate management. For example, managers may assign an SBU ina rapidly growing industry relatively high volume and share-growth objectives but lowerROI objectives than an SBU with a large share in a mature industry.
A similar process of breaking down overall SBU objectives into a set of subobjectivesshould occur for each product-market entry within the unit. Those subobjectives obviouslymust reflect the SBU’s overall objectives; but once again they may vary across product-market entries according to the attractiveness and growth potential of individual marketsegments and the competitive strengths of the company’s product in each market. Forexample, when 3M’s consumer products group first introduced its Scotch-Brite Never Rustsoap pads—a new form of scouring pad that will never rust or splinter because it is madefrom recycled plastic beverage bottles—its objective was to capture a major share of the$100 million soap pad market from well-entrenched competitive brands such as SOS andBrillo. 3M wanted to maximize Never Rust’s volume growth and market share even if thenew line did not break even for several years. Consequently, the firm’s top managersapproved a major investment in a new plant and a substantial introductory advertisingbudget. At the same time, though, the consumer group maintained high profitability goalsfor its other established products—such as Scotch brand Magic Transparent Tape and Post-it brand notes—to provide the cash required for Never Rust’s introduction and preserve thegroup’s overall profit level.4
Allocating Resources within the Business UnitOnce an SBU’s objectives and budget have been approved at the corporate level, its managersmust decide how the available resources should be allocated across the unit’s various product-market entries. Because this allocation process is quite similar to allocating corporate

Walker et al.: Marketing Strategy: A Decision−Focused Approach, Fourth Edition
I. Introduction to Strategy 3. Business Strategies and Their Marketing Implications
127© The McGraw−Hill Companies, 2002
Chapter Three Business Strategies and Their Marketing Implications 63
resources across SBUs, many firms use similar economic value, value-based planning, orportfolio analysis tools for both. Of course, at the SBU level managers must determine theattractiveness of individual target markets, the competitive position of their products withinthose markets, and the cash flows each product entry will likely generate rather than analyz-ing industry attractiveness and the overall competitive strengths of the firm.
Unfortunately, value-based planning is not as useful a tool for evaluating alternativeresource allocations across product-market entries as it is for evaluating allocations acrossSBUs. This is because the product-market entries within a business unit often share the ben-efits of common investments and the costs of functional activities, as when multiple prod-ucts are produced in the same plant or sold by the same salesforce. The difficulty ofdeciding what portion of such common investments and shared costs should be assigned tospecific products increases the difficulty of applying a discounted cash flow analysis at theproduct-market level. As we shall see in Chapter 14, some firms have adopted activity-basedcosting systems in an attempt to resolve such problems,5 but many difficulties remain.
How Do Businesses Compete?
As mentioned, the essential strategic question at the SBU level is, How are we going tocompete in this business? Thus, business strategies are primarily concerned with allocatingresources across functional activities and product-markets to give the unit a sustainableadvantage over its competitors. Of course, the unit’s core competencies and resources,together with the customer and competitive characteristics of its industry, determine the via-bility of any particular competitive strategy.6 The 3M drug delivery unit’s strategy of gain-ing revenue growth via technological leadership and aggressive new product and marketdevelopment, for instance, will continue to work only if the firm’s R&D, engineering, andmarketing competencies and resources continue to outweigh those of its competitors. Con-sequently, most SBUs pursue a single competitive strategy—one that best fits their marketenvironments and competitive strengths—across all or most of the product-markets inwhich they compete. The question is, What alternative strategies are available to a businessunit? What are the basic, or generic, competitive strategies most SBUs choose to pursue?
Generic Business-Level Competitive StrategiesResearchers have identified general categories of business-level competitive strategiesbased on overall patterns of purpose, practice, and performance in different businesses.Michael Porter distinguishes three strategies—or competitive positions—that businessespursue to gain and maintain competitive advantages in their various product-markets: (1)overall cost leadership; (2) differentiation—building customer perceptions of superiorproduct quality, design, or service; and (3) focus, in which the business avoids direct con-frontation with its major competitors by concentrating on narrowly defined market niches.Porter describes firms that lack a distinctive strategy as being “stuck in the middle” andpredicts that they will perform poorly.7
Robert Miles and Charles Snow identified another set of business strategies based on abusiness’s intended rate of product-market development (new product development, pene-tration of new markets).8 They classify business units into four strategic types: prospec-tors, defenders, analyzers, and reactors. Exhibit 3.1 describes each of these businessstrategies briefly. As you can see, businesses pursuing a prospector strategy focus ongrowth through the development of new products and markets. 3M’s drug delivery busi-ness unit illustrates this. Defender businesses concentrate on maintaining their positions in

Walker et al.: Marketing Strategy: A Decision−Focused Approach, Fourth Edition
I. Introduction to Strategy 3. Business Strategies and Their Marketing Implications
128 © The McGraw−Hill Companies, 2002
Section One Introduction to Strategy64
established product-markets while paying less attention to new product development, as isthe case with 3M’s industrial tape business unit. The analyzer strategy falls in betweenthese two. An analyzer business attempts to maintain a strong position in its core product-market(s) but also seeks to expand into new—usually closely related—product-markets.Finally, reactors are businesses with no clearly defined strategy.
Even though both the Porter and Miles and Snow typologies have received popularacceptance and research support, neither is complete by itself. For example, a defenderbusiness unit could pursue a variety of competitive approaches to protect its market posi-tion, such as offering the lowest cost or differentiating itself on quality or service. Thus,we have combined the two typologies in Exhibit 3.2 to provide a more comprehensiveoverview of business strategies. Exhibit 3.2 classifies business strategies on two primarydimensions: the unit’s desired rate of product-market development (expansion) and theunit’s intended method of competing in its established product-markets.
Each of our strategic categories could be further subdivided according to whether a busi-ness applies the strategy across a broadly defined product-market domain or concentrates
Exhibit 3.1Definitions of Miles and Snow’s Four Business Strategies
Prospector
• Operates within a broad product-market domain that undergoes periodic redefinition.
• Values being a “first mover” in new product and market areas, even if not all of these efforts prove to be highly profitable.
• Responds rapidly to early signals concerning areas of opportunity, and these responses often lead to new rounds ofcompetitive actions.
• Competes primarily by stimulating and meeting new market opportunities, but may not maintain strength over time in allmarkets it enters.
Defender
• Attempts to locate and maintain a secure position in relatively stable product or service areas.
• Offers relatively limited range of products or services compared with competitors.
• Tries to protect its domain by offering lower prices, higher quality, or better service than competitors.
• Usually not at the forefront of technological/new product development in its industry; tends to ignore industry changes notdirectly related to its area of operation.
Analyzer
• An intermediate type; makes fewer and slower product-market changes than prospectors, but is less committed to stabilityand efficiency than defenders.
• Attempts to maintain a stable, limited line of products or services, but carefully follows a selected set of promising newdevelopments in its industry.
• Seldom a first mover, but often a second or third entrant in product-markets related to its existing market base—oftenwith a lower cost or higher-quality product or service offering.
Reactor
• Lacks any well-defined competitive strategy.
• Does not have as consistent a product-market orientation as its competitors.
• Not as willing to assume the risks of new product or market development as its competitors.
• Not as aggressive in marketing established products as some competitors.
• Responds primarily when it is forced to by environmental pressures.
Source: Adapted from R. E. Miles and C. C. Snow, Organizational Strategy, Structure, and Process(New York: McGraw-Hill, 1978).

Walker et al.: Marketing Strategy: A Decision−Focused Approach, Fourth Edition
I. Introduction to Strategy 3. Business Strategies and Their Marketing Implications
129© The McGraw−Hill Companies, 2002
Chapter Three Business Strategies and Their Marketing Implications 65
on a narrowly defined segment where it hopes to avoid direct confrontation with major com-petitors (the focus strategy of Porter). Although this distinction is useful, it is more germaneto a discussion of the business’s target market strategy (as discussed in Chapter 7) than toits competitive strategy. Most businesses compete in a reasonably consistent way across allof their product-markets, whether their domain is broad or narrow.
Exhibit 3.2 describes only six business strategies, rather than the eight that one mightexpect. We view reactor and prospector business units as two homogeneous categories.
Evidence suggests that a substantial portion of businesses fall into the reactor category.One study, for instance, found that 50 out of 232 businesses examined could be classi-fied as reactors.9 By definition, however, such businesses do not have well-defined orconsistent approaches either to new product development or to ways of competing in exist-ing product-markets. In other words, reactors have no clear competitive strategy. There-fore, we will largely ignore them during the rest of this discussion.
Prospectors are also shown as a single strategic category in Exhibit 3.2 because thedesire for rapid new product or market development is the overriding aspect of their strat-egy. There is little need for a prospector business to consider how it will compete in thenew product-markets it develops because it will face little or no competition—at least notuntil those markets become established and other firms begin to enter.
Do the Same Competitive Strategies Work for Single-Business Firms and Start-ups?Even small firms with a single business and only a few related product offerings or start-ups with a single product must decide how they will compete. And just like an SBU in amajor corporation such as 3M, their competitive strategies should be tailored to theirunique resources and competencies and aimed at securing a sustainable advantage over
Exhibit 3.2Combined Typology of Business-Level Competitive Strategies
���������� ��� �� ������� ������
�������������
Co
mp
etit
ive
stra
teg
y
���� ��������������� ��������� ������
����������������
������� �� ���������������������������
���� ���� ��������� ��������������� �������� ���� ��������� �������������� ����
differentiated��������
���� ���� ��������� ��������������� �������� ���� ��������� �������������� ����
low-cost��������
���� ��������������� ���������� differentiated������� �
����� ������
���� ��������������� ����������
low-cost������� �
����� ������
���� ���� ������� ����������������������������� ��������������������
Heavy emphasis No emphasis
Emphasis on new product-market growth
������������

Walker et al.: Marketing Strategy: A Decision−Focused Approach, Fourth Edition
I. Introduction to Strategy 3. Business Strategies and Their Marketing Implications
130 © The McGraw−Hill Companies, 2002
Section One Introduction to Strategy66
existing or potential competitors. Therefore, the same set of generic competitive strategiesis just as appropriate for small firms as for business units within larger ones. For example,Jack Daniels defends its commanding share of the prestige segment of the very matureNorth American whiskey market by stressing the long tradition of its production processand the superior quality of its Kentucky bourbon: in other words, by pursuing a very effec-tive differentiated defender strategy.
However, there is one important difference between single-business and multi-SBUorganizations. In smaller single-business firms the distinction between business-level com-petitive strategy and marketing strategy tends to blur and the two strategies blend into one.Jack Daniels’ competitive strategy, for instance, is essentially the same as the market posi-tioning for its primary product: a product that offers higher quality than competing brandsbecause it is made with old-fashioned methods and ingredients that have not changed formore than a century. And the elements of its marketing strategy all flow from that com-petitive/market positioning: a premium price, advertising that stresses the product’s longhistory and traditional production practices, old-fashioned packaging, and the like.
Another difference applies to entrepreneurial start-ups. Most start-ups do not have theresources to succeed by competing as a “me-too” competitor in a well-established and
highly competitive product market. By definition they do not have anestablished market position to defend. Therefore, while the taxonomy ofcompetitive strategies is still relevant to entrepreneurial firms, in realitymost of them—at least those that stand a reasonable chance of success—begin life as prospectors. They compete primarily by developing aunique product or service that meets the needs and preferences of a cus-
tomer segment that is not being well served by established competitors.The critical question for a start-up firm, though, is, What happens when the new product
matures and competitors arrive on the scene? Should the firm continue to focus on develop-ing a stream of new products to stay a step ahead of the competition, even though such astrategy would mean paying less attention to its successful first entry? Should the firm switchto a defender strategy to leverage its initial success, even though that would mean competinghead to head with other, probably bigger, competitors? Should the firm create two separateSBUs with different competitive strategies, even though it is small and resources are limited?These are the kinds of questions that arise when the market and competitive conditions fac-ing a product entry change. The entry’s marketing strategy should be adjusted in response tosuch changes, but that may make it less compatible with the overall competitive strategy ofthe business, which is typically harder to change in the short term. These and similar issuesrelated to strategic change are examined in more detail later in this chapter.
Do the Same Competitive Strategies Work for Service Businesses?What is a service? Basically, services can be thought of as intangibles and goods as tan-gibles. The former can rarely be experienced in advance of the sale, while the latter can beexperienced, even tested, before purchase.10 Using this distinction, a service can bedefined as “any activity or benefit that one party can offer to another that is essentiallyintangible and that does not result in the ownership of anything. Its production may or maynot be tied to a physical product.”11
We typically associate services with nonmanufacturing businesses, even though service isoften an indispensable part of a goods producer’s offering. Services such as applicationsengineering, system design, delivery, installation, training, and maintenance can be crucialfor building long-term relationships between manufacturers and their customers, particularly
Strategic Issue
While the taxonomy of competitive strate-gies is still relevant to entrepreneurial firms,in reality most of them—at least those thatstand a reasonable chance of success—begin life as prospectors.

Walker et al.: Marketing Strategy: A Decision−Focused Approach, Fourth Edition
I. Introduction to Strategy 3. Business Strategies and Their Marketing Implications
131© The McGraw−Hill Companies, 2002
Chapter Three Business Strategies and Their Marketing Implications 67
in consumer durable and industrial products businesses. Thus, almost all businesses areengaged in service to some extent.
Many organizations are concerned with producing and marketing a service as their pri-mary offering rather than as an adjunct to a physical product. These organizations includepublic-sector and not-for-profit service organizations, such as churches, hospitals, univer-sities, and arts organizations. The crucial question is this: To be successful, must serviceorganizations employ different competitive strategies than goods manufacturers?
The framework we used to classify business-level competitive strategies in Exhibit 3.2 isequally valid for service businesses. Some service firms, such as Super 8 or Days Inn in thelodging industry, attempt to minimize costs and compete largely with low prices. Other firms,like Marriott, differentiate their offerings on the basis of high service quality or unique bene-fits. Similarly, some service businesses adopt prospector strategies and aggressively pursue thedevelopment of new offerings or markets. For instance, American Express’s Travel RelatedServices Division has developed a variety of new services tailored to specific segments of thefirm’s credit-card holders. Other service businesses focus narrowly on defending establishedpositions in current markets. Still others can best be described as analyzers pursuing bothestablished and new markets. For instance, Cable & Wireless Communications, a long-distance carrier whose competitive strategy is discussed in Exhibit 3.3, might best bedescribed as a differentiated analyzer.
A study of the banking industry provides empirical evidence that service businessesactually do pursue the same types of competitive strategies as goods producers. The 329bank CEOs who responded to the survey had little trouble categorizing their institution’scompetitive strategies into one of Miles and Snow’s four types. Fifty-four of the executivesreported that their banks were prospectors, 87 identified their firms as analyzers, 157 asdefenders, and 31 as reactors.12
Cable & Wireless Communications, the U.S. subsidiaryof a British telecommunications firm, competes in
the relatively mature and highly competitive business ofproviding long-distance services to business customers.Company executives knew long ago that their operationcould not compete on price with larger competitors likeAT&T or MCI. So they sought to differentiate them-selves—and to defend their established customerbase—by providing the best customer support in theindustry. As a result, Cable & Wireless turned itself froma mundane commodity business into a sophisticatedtelemanager and partner with its customers.
Part of Cable & Wireless’s success was the result ofgood target market selection. The firm focused on win-ning and holding on to small or medium-sized busi-ness clients with monthly billings of $500 to $15,000.For such small businesses, the company’s 500 U.S.salespeople, working out of 36 regional offices, actedlike telecommunications managers. Corporations toosmall to hire their own telecom specialists valued the
advice and expertise Cable & Wireless people couldoffer, and top management gave those salespeoplesubstantial autonomy to tailor their offerings andadvice to each customer’s needs.
Within its target small-business segment, however,Cable & Wireless was not content to merely maintainrelationships with established customers. The firm pur-sued a differentiated analyzer strategy by also devot-ing substantial effort and resources to developing andpitching specialized services aimed at attracting newcustomers from new industry segments. For example,the company gained substantial business from smallerfirms within the legal profession by developing func-tions that appealed specifically to lawyers, such asinnovative ways to track and bill calls linked to spe-cific client accounts.
Source: From The Discipline of Market Leaders by Michael Treacyand Fred Wiersema. Copyright 1995 by Michael Treacy and FredWiersema. Reprinted by permission of Perseus Books Publishers, amember of Perseus Books, L.L.C.
Exhibit 3.3 Cable & Wireless Communications—Dif ferentiation through Customer Relationships
Walker et al.: Marketing Strategy: A Decision−Focused Approach, Fourth Edition
I. Introduction to Strategy 3. Business Strategies and Their Marketing Implications
132 © The McGraw−Hill Companies, 2002
Section One Introduction to Strategy68
Do the Same Competitive Strategies Work for Global Competitors?In terms of the strategies described in Exhibit 3.2, businesses that compete in multipleglobal markets almost always pursue one of the two types of analyzer strategy. They mustcontinue to strengthen and defend their competitive position in their home country—andperhaps in other countries where they are well established—while simultaneously pursu-ing expansion and growth in new international markets.
When examined on a country-by-country basis, however, the same business unit mightbe viewed as pursuing different competitive strategies in different countries. For instance,while 3M’s industrial tape group competes like a differentiated defender in the UnitedStates, Canada, and some European countries where it has established large market shares,it competes more like a prospector when attempting to open and develop new markets inemerging economies such as China and Mexico. This suggests that a single SBU may needto engage in different functional activities (including different strategic marketing pro-grams)—and perhaps even adopt different organizational structures to implement thoseactivities—across the various countries in which it competes. McDonald’s faces this kindof situation across the 94 countries in which it operates, as discussed in Exhibit 3.4.
Will the Internet Change Everything?Some analysts argue that the Internet will change the way firms compete. The Internetmakes it easier for buyers and sellers to compare prices, reduces the number of middlemennecessary between manufacturers and end users, cuts transaction costs, improves the func-tioning of the price mechanism, and thereby increases competition.13 One possible out-come of all these changes is that it will be harder for firms to differentiate themselves onany basis other than low price. All the business-level competitive strategies focused on dif-ferentiation will become less viable, while firms pursuing low-cost strategies will be moresuccessful.
While we agree that the Internet has increased both efficiency and competitiveness inmany product-markets, we doubt that competition will focus exclusively on price. For onething, innovation is likely to continue—and probably accelerate—in the future. Uniquenew products and services will continue to emerge and provide a way for the innovator togain a competitive advantage, at least in the short term. Thus, firms with the resources andcompetencies necessary to produce a continuing stream of new product or service offer-ings that appeal to one or more customer segments—that is, to effectively implement aprospector strategy—should be successful regardless of whether they are the lowest-costproducers in their industries. Amazon.com, the largest e-tailer as of early 2001, is gener-ally not the lowest priced.
In addition, the Internet is primarily a communications channel. While it facilitates thedissemination of information, including price information, the goods and services them-selves will continue to offer different features and benefits. As customers gather moreinformation from the Internet and become better informed, they are less likely to beswayed by superficial distinctions between brands. But if a firm offers unique benefits thata segment of customers perceive as meaningful, it should still be able to differentiate its
offering and command a premium price, at least until its competitorsoffer something similar.
Finally, the Internet will make it easier for firms to customize theirofferings and personalize their relationships with their customers. Suchpersonalization should differentiate the firm from its competitors in the
Strategic Issue
The Internet will make it easier for firms tocustomize their offerings and personalizetheir relationships with their customers.
www

Walker et al.: Marketing Strategy: A Decision−Focused Approach, Fourth Edition
I. Introduction to Strategy 3. Business Strategies and Their Marketing Implications
133© The McGraw−Hill Companies, 2002
McDonald’s now has nearly 29,000 retailoutlets serving customers around the
world. As you can see from the chart, in 1985more than three-quarters of all McDonald’s
restaurants were inside the United States, but by 1999more than half were outside America.
McDonald’s is growing faster overseas in partbecause the fast-food market is more mature and muchmore competitive in the United States than in mostother nations. Consequently, the firm’s competitivestrategies—and therefore its prices, marketing costs,and operating margins—tend to be different in othercountries than in the United States.
McDonald’s holds a commanding 42 percent shareof the domestic burger market. The firm’s competitivestrategy in the United States, then, is that of a differ-entiated defender intent on preserving its marketshare position and profitability in the face of slowingdemand and increasing competition. Among otherthings, the company has begun an aggressive cam-paign to reduce its operating costs by simplifying itsrestaurant designs, reducing the number of items onthe menu, and so on. Some of those cost savings willbe reflected in lower prices, while the rest will beplowed back into aggressive advertising and promo-tion programs. Finally, the firm is attempting to gainmore sales and profits from older adults—a segmentwhere McDonald’s has not been very strong—byimproving product quality via a new “made for you”food preparation system.
Outside the United States, on the other hand,McDonald’s faces less organized competition (PizzaHut is its nearest rival), but the demand for fast foodis just beginning to grow. Consequently, the firm mustoften pursue a prospector strategy focused on build-ing demand among new customers. This helps explain
the rapid rate of new restaurant construction outsideof the United States. The firm built about 1,800 newoutlets in 1999, but only 150 were in the United States.Unfortunately, infrastructure problems in developingmarkets such as China and Eastern Europe mean that,on average, new restaurants cost much more to build.And to attract new customers in such markets, McDon-ald’s initially has to price its burgers very low. Whiledemand growth and economies of scale usually helpindividual units turn a profit relatively soon after open-ing, at the national level McDonald’s is often making arather long-term bet—a bet with the risk of political oreconomic upheaval.
To help managers in each country adjust to localmarket and environmental differences, McDonald’sgives them great flexibility and autonomy. In everycountry the pace of expansion—and the strategy forachieving it—is decided locally. And so far those locallydeveloped strategies have been quite successful.
Source: McDonald’s 2000 Annual Report, found on the company’swebsite at www.mcdonalds.com; and “McWorld,” The Economist, June29, 1996, pp. 61–62.
Exhibit 3.4 McDonald’s—Dif ferent Strategies in Dif ferent Countries
20
25
30
15
10
5
0
’000Inside AmericaOutside America
1985 86 87 88 89 90 91 92 93 94 95 96 97 98 99
Number of McDonald’s Restaurants
Chapter Three Business Strategies and Their Marketing Implications 69
customer’s eyes and improve customer loyalty and retention. For instance, over the pastfew years, the Internet has played a major role in developing logistical alliances amongorganizational buyers and their suppliers. Consumer goods and services firms, and evenInternet portals, also are using the Internet’s interactive capabilities to acquire andcommunicate information and build customer relationships. For example, the My Yahoo!website allows individual consumers to personalize their Web portal in exchange for somebasic demographic information. An optional section enables the customer to make choicesthat enable Yahoo! to customize the kind of news, websites, and information displayed onthat person’s screen. Such customization helps differentiate Yahoo! in the customer’s eyesand increases switching costs.14

Walker et al.: Marketing Strategy: A Decision−Focused Approach, Fourth Edition
I. Introduction to Strategy 3. Business Strategies and Their Marketing Implications
134 © The McGraw−Hill Companies, 2002
Section One Introduction to Strategy70
How Do Competitive Strategies
Differ from One Another?
In Chapter 1 we said that all strategies consist of five components or underlying dimen-sions: scope (or breadth of strategic domain), goals and objectives, resource deployments,a basis for achieving a sustainable competitive advantage, and synergy. But the genericstrategies summarized in Exhibit 3.2 are defined largely by their differences on only onedimension: the nature of the competitive advantage sought. Each strategy also involvessome important differences on the other four dimensions—differences that are outlined inExhibit 3.5 and discussed below. Those differences provide insights concerning the condi-tions under which each strategy is most appropriate and about the relative importance ofdifferent marketing actions in implementing them effectively.
Dif ferences in ScopeBoth the breadth and stability of a business’s domain are likely to vary with differentstrategies. This, in turn, can affect the variables the corporation uses to define its variousbusinesses. At one extreme, defender businesses, whether low-cost or differentiated, tend
Exhibit 3.5How Business Strategies Differ in Scope, Objectives, Resource Deployments, and Synergy
Dif ferentiatedDimensions Low-cost defender defender Prospector Analyzer
• Scope Mature/stable/well-defined domain; mature technology and customer segments
• Goals and objectivesAdaptability (new Very Little
product success)
Effectiveness Little
(increase in market share)
Efficiency (ROI) High
• Resource deployment Generate excess cash (cash cows)
• Synergy Need to seek operating synergies to achieveefficiencies
Mature/stable/well-defined domain;mature technologyand customersegments
little
Little
High
Generate excess cash(cash cows)
Need to seekoperating synergiesto achieveefficiencies
Broad/dynamicdomains; technologyand customersegments not well-established
Extensive
Large
Low
Need cash for productdevelopment(question marks or stars)
Danger in sharingoperating facilitiesand programs—better to sharetechnology/marketingskills
Mixture of defenderand prospectorstrategies
Mixture of defenderand prospectorstrategies
Mixture of defenderand prospectorstrategies
Mixture of defenderand prospectorstrategies
Need cash for productdevelopment butless so than doprospectors
Danger in sharingoperating facilitiesand programs—better to sharetechnology/marketingskills

Walker et al.: Marketing Strategy: A Decision−Focused Approach, Fourth Edition
I. Introduction to Strategy 3. Business Strategies and Their Marketing Implications
135© The McGraw−Hill Companies, 2002
Chapter Three Business Strategies and Their Marketing Implications 71
to operate in relatively well-defined, narrow, and stable domains where both the producttechnology and the customer segments are mature.
At the other extreme, prospector businesses usually operate in broad and rapidly chang-ing domains where neither the technology nor customer segments are well established. Thescope of such businesses often undergoes periodic redefinition. Thus, prospector busi-nesses are typically organized around either a core technology that might lead to the devel-opment of products aimed at a broad range of customer segments or a basic customer needthat might be met with products based on different technologies. The latter is the approachtaken by 3M’s drug delivery systems business. Its mission is to satisfy the health needs ofa broad range of patients with new products developed from technologies drawn fromother business units within the firm.
Analyzer businesses, whether low-cost or differentiated, fall somewhere in between thetwo extremes. They usually have a well-established core business to defend, and often theirdomain is primarily focused on that business. However, businesses pursuing this interme-diate strategy are often in industries that are still growing or experiencing technologicalchanges. Consequently, they must pay attention to the emergence of new customer seg-ments and/or new product types. As a result, managers must review and adjust the domainof such businesses from time to time.
Dif ferences in Goals and ObjectivesAnother important difference across generic business-level strategies with particular rele-vance for the design and implementation of appropriate marketing programs is that differ-ent strategies often focus on different objectives. SBU and product-market objectives mightbe specified on a variety of criteria, but to keep things simple, we focus on only three per-formance dimensions of major importance to both business-unit and marketing managers:
1. Effectiveness. The success of a business’s products and programs relative to those of itscompetitors in the market. Effectiveness is commonly measured by such items as salesgrowth relative to competitors or changes in market share.
2. Efficiency. The outcomes of a business’s programs relative to the resources used in imple-menting them. Common measures of efficiency are profitability as a percent of sales andreturn on investment.
3. Adaptability. The business’s success in responding over time to changing conditions and oppor-tunities in the environment. Adaptability can be measured in a variety of ways, but the mostcommon ones are the number of successful new products introduced relative to those competi-tors or the percentage of sales accounted for by products introduced within the last five years.
However, it is very difficult for any SBU, regardless of its competitive strategy, tosimultaneously achieve outstanding performance on even this limited number of dimen-sions, because they involve substantial trade-offs. Good performance on one dimensionoften means sacrificing performance on another.15 For example, developing successful newproducts or attaining share growth often involves large marketing budgets, substantial up-front investment, high operating costs, and a shaving of profit margins—all of whichreduce ROI. This suggests that managers should choose a competitive strategy with a viewtoward maximizing performance on one or two dimensions, while expecting to sacrificesome level of performance on the others, at least in the short term. Over the longer term,of course, the chosen strategy should promise discounted cash flows that exceed the busi-ness’s cost of capital and thereby increase shareholder value.
As Exhibit 3.5 indicates, prospector businesses are expected to outperform defenderson both new product development and market-share growth. On the other hand, both

Walker et al.: Marketing Strategy: A Decision−Focused Approach, Fourth Edition
I. Introduction to Strategy 3. Business Strategies and Their Marketing Implications
136 © The McGraw−Hill Companies, 2002
Section One Introduction to Strategy72
defender strategies should lead to better returns on investment. Differentiated defenderslikely produce higher returns than low-cost defenders, assuming that the greater expensesinvolved in maintaining their differentiated positions can be more than offset by the highermargins gained by avoiding the intense price competition low-cost competitors often face.Once again, both low-cost and differentiated analyzer strategies are likely to fall betweenthe two extremes.16
Dif ferences in Resource DeploymentBusinesses following different strategies also tend to allocate their financial resources dif-ferently across product-markets, functional departments, and activities within each func-tional area. Prospector—and to a lesser degree, analyzer—businesses devote a relativelylarge proportion of resources to the development of new product-markets. Because suchproduct-markets usually require more cash to develop than they produce short term, busi-nesses pursuing these strategies often need infusions of financial resources from otherparts of the corporation. In portfolio terms, they are “question marks” or “stars.”
Defenders, on the other hand, focus the bulk of their resources on preserving existingpositions in established product-markets. These product-markets are usually profitable;therefore, defender businesses typically generate excess cash to support product and mar-ket development efforts in other business units within the firm. They are the “cash cows.”
Resource allocations among functional departments and activities within the SBU alsovary across businesses pursuing different strategies. For instance, marketing budgets tendto be the largest as a percentage of an SBU’s revenues when the business is pursuing aprospector strategy; they tend to be the smallest as a percentage of sales under a low-costdefender strategy. We discuss this in more detail later in this chapter.
Dif ferences in Sources of SynergyBecause different strategies emphasize different methods of competition and differentfunctional activities, a given source of synergy may be more appropriate for some strate-gies than for others.
At one extreme, the sharing of operating facilities and programs may be an inappropri-ate approach to gaining synergy for businesses following a prospector strategy. And to alesser extent, this also may be true for both types of analyzer strategies. Such sharing canreduce an SBU’s ability to adapt quickly to changing market demands or competitivethreats. Commitments to internally negotiated price structures and materials, as well as theuse of joint resources, facilities, and programs, increase interdependence among SBUs andlimit their flexibility. It is more appropriate for such businesses to seek synergy through thesharing of a technology, engineering skills, or market knowledge—expertise that can helpimprove the success rate of their product development efforts. Thus, 3M’s drug deliverysystems business attempts to find medical applications for new technologies developed inmany of the firm’s other business units.
At the other extreme, however, low-cost defenders should seek operating synergies thatwill make them more efficient. Synergies that enable such businesses to increase economiesof scale and experience curve effects are particularly desirable. They help reduce unit costsand strengthen the strategy’s basis of competitive advantage. The primary means of gainingsuch operating synergies is through the sharing of resources, facilities, and functional activities across product-market entries within the business unit or across related businessunits. Emerson Electric, for instance, formed an “operating group” of several otherwise

Walker et al.: Marketing Strategy: A Decision−Focused Approach, Fourth Edition
I. Introduction to Strategy 3. Business Strategies and Their Marketing Implications
137© The McGraw−Hill Companies, 2002
Chapter Three Business Strategies and Their Marketing Implications 73
autonomous business units that make different types of electrical motors and tools. By shar-ing production facilities, marketing activities, and a common salesforce, the group was ableto reduce the costs of both per-unit production and marketing.
Deciding When a Strategy
Is Appropriate: The Fit
between Business Strategies
and the Environment
Because different strategies pursue different objectives in different domains with differentcompetitive approaches, they do not all work equally well under the same environmentalcircumstances. The question is, Which environmental situations are most amenable to thesuccessful pursuit of each type of strategy? Exhibit 3.6 outlines some major market, tech-nological, and competitive conditions—plus a business unit’s strengths relative to its com-petitors—that are most favorable for the successful implementation of each genericbusiness strategy. We next discuss the reasons each strategy fits best with a particular setof environmental conditions.
Appropriate Conditions for a Prospector StrategyA prospector strategy is particularly well suited to unstable, rapidly changing environ-ments resulting from new technology, shifting customer needs, or both. In either case, suchindustries, like many involving e-commerce, tend to be at an early stage in their life cyclesand offer many opportunities for new product-market entries. Industry structure is oftenunstable because few competitors are present and their relative market shares can shift rap-idly as new products are introduced and new markets develop.
Because they emphasize the development of new products and/or new markets, themost successful prospectors are usually strong in, and devote substantial resources to, twobroad areas of competence: first, R&D, product engineering, and other functional areasthat identify new technology and convert it into innovative products; second, marketingresearch, marketing, and sales—functions necessary for the identification and develop-ment of new market opportunities.
In some cases, however, even though a prospector business has strong product develop-ment and marketing skills, it may lack the resources to maintain its early lead as product-markets grow and attract new competitors. For example, Minnetonka was the pioneer inseveral health and beauty-aid product categories with brands such as Softsoap liquid soapand Check-Up plaque-fighting toothpaste. However, because competitors such as Procter &Gamble and Colgate-Palmolive introduced competing brands with advertising and promo-tion budgets much larger than Minnetonka could match, the firm was eventually forced to change its strategy and concentrate on manufacturing products under licenses from larger firms.
Appropriate Conditions for an Analyzer StrategyThe analyzer strategy is a hybrid. On one hand, analyzers are concerned with defending—via low costs or differentiation in quality or service—a strong share position in one or moreestablished product-markets. At the same time, the business must pay attention to new prod-uct development to avoid being leapfrogged by competitors with more technologically
www
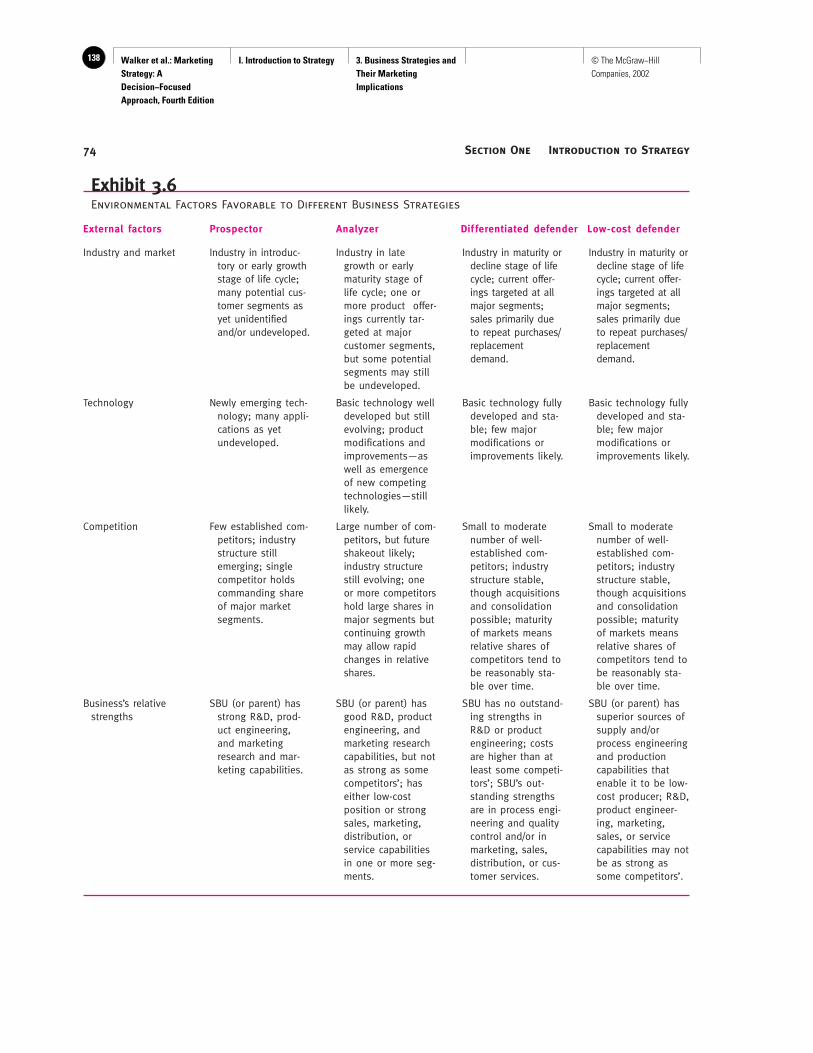
Walker et al.: Marketing Strategy: A Decision−Focused Approach, Fourth Edition
I. Introduction to Strategy 3. Business Strategies and Their Marketing Implications
138 © The McGraw−Hill Companies, 2002
Section One Introduction to Strategy74
Exhibit 3.6Environmental Factors Favorable to Different Business Strategies
External factors Prospector Analyzer Dif ferentiated defender Low-cost defender
Industry and market
Technology
Competition
Business’s relativestrengths
Industry in introduc-tory or early growthstage of life cycle;many potential cus-tomer segments asyet unidentifiedand/or undeveloped.
Newly emerging tech-nology; many appli-cations as yetundeveloped.
Few established com-petitors; industrystructure stillemerging; singlecompetitor holdscommanding shareof major marketsegments.
SBU (or parent) hasstrong R&D, prod-uct engineering,and marketingresearch and mar-keting capabilities.
Industry in lategrowth or earlymaturity stage oflife cycle; one ormore product offer-ings currently tar-geted at majorcustomer segments,but some potentialsegments may stillbe undeveloped.
Basic technology welldeveloped but stillevolving; productmodifications andimprovements—aswell as emergenceof new competingtechnologies—stilllikely.
Large number of com-petitors, but futureshakeout likely;industry structurestill evolving; oneor more competitorshold large shares inmajor segments butcontinuing growthmay allow rapidchanges in relativeshares.
SBU (or parent) hasgood R&D, productengineering, andmarketing researchcapabilities, but notas strong as somecompetitors’; haseither low-costposition or strongsales, marketing,distribution, orservice capabilitiesin one or more seg-ments.
Industry in maturity ordecline stage of lifecycle; current offer-ings targeted at allmajor segments;sales primarily dueto repeat purchases/replacementdemand.
Basic technology fullydeveloped and sta-ble; few majormodifications orimprovements likely.
Small to moderatenumber of well-established com-petitors; industrystructure stable,though acquisitionsand consolidationpossible; maturityof markets meansrelative shares ofcompetitors tend tobe reasonably sta-ble over time.
SBU has no outstand-ing strengths inR&D or productengineering; costsare higher than atleast some competi-tors’; SBU’s out-standing strengthsare in process engi-neering and qualitycontrol and/or inmarketing, sales,distribution, or cus-tomer services.
Industry in maturity ordecline stage of lifecycle; current offer-ings targeted at allmajor segments;sales primarily dueto repeat purchases/replacementdemand.
Basic technology fullydeveloped and sta-ble; few majormodifications orimprovements likely.
Small to moderatenumber of well-established com-petitors; industrystructure stable,though acquisitionsand consolidationpossible; maturityof markets meansrelative shares ofcompetitors tend tobe reasonably sta-ble over time.
SBU (or parent) hassuperior sources ofsupply and/orprocess engineeringand productioncapabilities thatenable it to be low-cost producer; R&D,product engineer-ing, marketing,sales, or servicecapabilities may notbe as strong assome competitors’.

Walker et al.: Marketing Strategy: A Decision−Focused Approach, Fourth Edition
I. Introduction to Strategy 3. Business Strategies and Their Marketing Implications
139© The McGraw−Hill Companies, 2002
Chapter Three Business Strategies and Their Marketing Implications 75
advanced products or being left behind in newly developing application segments within themarket. This dual focus makes the analyzer strategy appropriate for well-developed indus-tries that are still experiencing some growth and change as a consequence of evolving cus-tomer needs and desires or continuing technological improvements.
Commercial aircraft manufacturing is an example of such an industry. Both competi-tors and potential customers are few and well established. But technology continues toimprove, the increased competition among airlines since deregulation has changed theattributes those firms look for when buying new planes, and mergers have increased thebuying power of some customers. Thus, Boeing’s commercial aircraft division has had towork harder to maintain a nearly 50 percent share of worldwide commercial plane sales.Although the firm continues to enjoy a reputation for producing high-quality and reliableplanes, it had to make price concessions and increase customer services during the late1980s and early 1990s to stave off threats from competitor European Airbus. At the sametime, Boeing’s commercial aircraft division had to engage in a major development effortaimed at producing the next generation of aircraft, including its 757, 767, and 777 models.Unfortunately, the proliferation of new models contributed to substantial production anddelivery problems in the late 1990s, which produced some customer dissatisfaction.
Boeing’s experience illustrates one problem with an analyzer strategy. Few businesseshave the resources and competencies needed to successfully defend an established corebusiness while generating new products at the same time. Success on both dimensionsrequires strengths across virtually every functional area, and few businesses (or their par-ent companies) have such universal strengths relative to competitors. Therefore, analyzersare often not as innovative in new product development as prospectors. And they may notbe as profitable in defending their core businesses as defenders.
Appropriate Conditions for a Defender StrategyA defender strategy makes sense only when a business has something worth defending. Itis most appropriate for units with a profitable share of one or more major segments in arelatively mature, stable industry. Consistent with the “constant improvement” principlesof total quality management, most successful defenders initiate process improvements,product improvements, or line extensions to help protect and strengthen their establishedpositions. But they devote relatively few resources to basic R&D or the development ofinnovative new products. Thus, a defender strategy works best in industries where the basictechnology is not very complex or where it is well developed and unlikely to change dra-matically over the short term. For instance, Pillsbury’s prepared-dough products SBU haspursued a differentiated defender strategy for years. The unit generates substantial profitsfrom well-established refrigerated dough products such as Pillsbury Crescent rolls andHungry Jack biscuits. But while it has introduced a number of line extensions over theyears, most have been reconfigurations of the same basic dough-in-a-can technology, suchas Soft Breadsticks.
Dif ferentiated Defenders To effectively defend its position by differentiation, abusiness must be strong in those functional areas critical for maintaining its particularcompetitive advantages over time. If a business’s differentiation is based on superior prod-uct quality, those key functional areas include production, process engineering, qualitycontrol, and perhaps product engineering to develop product improvements. The effort todevelop and maintain a quality differentiation can be worthwhile, though, because evi-dence suggests that superior product quality has a strong impact on a business’s return oninvestment—an important performance objective for defenders.17

Walker et al.: Marketing Strategy: A Decision−Focused Approach, Fourth Edition
I. Introduction to Strategy 3. Business Strategies and Their Marketing Implications
140 © The McGraw−Hill Companies, 2002
Section One Introduction to Strategy76
Regardless of the basis for differentiation, marketing is also important for the effectiveimplementation of a differentiated defender strategy. Marketing activities that track chang-ing customer needs and competitive actions and communicate the product offering’sunique advantages through promotional and sales efforts to maintain customer awarenessand loyalty are particularly important.
Low-Cost Defenders Successful implementation of a low-cost defender strategyrequires the business to be more efficient than its competitors. Thus, the business mustestablish the groundwork for such a strategy early in the growth stage of the industry.Achieving and maintaining the lowest per-unit cost usually means that the business has toseek large volume from the beginning—through some combination of low prices andpromotional efforts—to gain economies of scale and experience. At the same time, suchbusinesses must also invest in more plant capacity in anticipation of future growth and instate-of-the-art equipment to minimize production costs. This combination of low marginsand heavy investment can be prohibitive unless the parent corporation can commit sub-stantial resources to the business or unless extensive sharing of facilities, technologies, andprograms with other business units is possible.
The low-cost defender’s need for efficiency also forces the standardization of productofferings and marketing programs across customer segments to achieve scale effects. Thus,such a strategy is usually not so effective in fragmented markets desiring customized offer-ings as it is in commodity industries such as basic chemicals, steel, or flour, or in indus-tries producing low-technology components such as electric motors or valves.
While low-cost defenders emphasize efficiency and low price as the primary focus oftheir competitive strategy, it is important to keep in mind that businesses pursuing otherstrategies should also operate as efficiently as possible given the functional activities nec-essary to implement those strategies. Some of the most effective businesses are those thatwork simultaneously to lower costs and improve quality and service.18 And operating effi-ciency is likely to become even more critical as the Internet makes it easier for customersto compare prices across alternative suppliers or to obtain low-price bids via “buyers’auction” sites, such as www.FreeMarkets.com or www.MetalSite.com.
How Different Business Strategies
Influence Marketing Decisions
Business units typically incorporate a number of distinct product-markets. A given entry’smarketing manager monitors and evaluates the product’s environmental situation anddevelops a marketing program suited to it. However, the manager’s freedom to design sucha program may be constrained by the business unit’s competitive strategy. This is becausedifferent strategies focus on different objectives and seek to gain and maintain a competi-tive advantage in different ways. As a result, different functions within the SBU—and dif-ferent activities within a given functional area, such as marketing—are critical for thesuccess of different strategies.
There are, therefore, different functional key factors for success inherent in the variousgeneric business strategies. This constrains the individual marketing manager’s freedom ofaction in two basic ways. First, because varying functions within the business unit are
more important under different strategies, they receive different propor-tions of the SBU’s total resources. Thus, the SBU’s strategy influencesthe amount of resources committed to marketing and ultimately thebudget available to an individual marketing manager within the businessunit. Second, the SBU’s choice of strategy influences both the kind of
www
Strategic Issue
The SBU’s strategy influences the amount ofresources committed to marketing and ulti-mately the budget available.

Walker et al.: Marketing Strategy: A Decision−Focused Approach, Fourth Edition
I. Introduction to Strategy 3. Business Strategies and Their Marketing Implications
141© The McGraw−Hill Companies, 2002
Chapter Three Business Strategies and Their Marketing Implications 77
market and competitive situation that individual product-market entries are likely to faceand the objectives they are asked to attain. Both constraints have implications for thedesign of marketing programs for individual products within an SBU.
It is risky to draw broad generalizations about how specific marketing policies and pro-gram elements might fit within different business strategies. While a business strategy is ageneral statement about how an SBU chooses to compete in an industry, that unit maycomprise a number of product-market entries facing different competitive situations in var-ious markets. Thus, there is likely to be a good deal of variation in marketing programs,and in the freedom individual marketing managers have in designing them, across prod-ucts within a given SBU. Still, a business’s strategy does set a general direction for thetypes of target markets it will pursue and how the unit will compete in those markets. Andit does have some influence on marketing policies that cut across product-markets. Exhibit3.7 outlines differences in marketing policies and program elements that occur across busi-nesses pursuing different strategies, and those differences are discussed below.
Product PoliciesOne set of marketing policies defines the nature of the products the business will concen-trate on offering to its target markets. These policies concern the breadth or diversity ofproduct lines, their level of technical sophistication, and the target level of product qualityrelative to competitors.
Exhibit 3.7Differences in Marketing Policies and Program Components across Businesses Pursuing Different Strategies
Strategy
Dif ferentiated Low-costMarketing policies and program components Prospector defender defender
Product policies
• Product-line breadth relative to competitors + + –
• Technical sophistication of products relative to competitors + + –
• Product quality relative to competitors ? + –
• Service quality relative to competitors ? + –
Price policies
• Price levels relative to competitors + + –
Distribution policies
• Degree of forward vertical integration relative to competitors – + ?
• Trade promotion expenses as percent of sales relative to competitors + – –
Promotion policies
• Advertising expenses as percent of sales relative to competitors + ? –
• Sales promotions expenses as percent of sales relative to competitors + ? –
• Salesforce expenses as percent of sales relative to competitors ? + –
Key: Plus sign (+) = greater than the average competitor.Minus sign (–) = smaller than the average competitor.Question mark (?) = uncertain relationship between strategy and marketing policy or program component.

Walker et al.: Marketing Strategy: A Decision−Focused Approach, Fourth Edition
I. Introduction to Strategy 3. Business Strategies and Their Marketing Implications
142 © The McGraw−Hill Companies, 2002
Section One Introduction to Strategy78
Because prospector businesses rely heavily on the continuing development of uniquenew products and the penetration of new markets as their primary competitive strategy,policies encouraging broader and more technically advanced product lines than those ofcompetitors should be positively related to performance on the critical dimension of sharegrowth. The diverse and technically advanced product offerings of 3M’s drug delivery sys-tems SBU are a good example of this.
Whether a prospector’s products should be of higher quality than competitors’ productsis open to question. Quality is hard to define; it can mean different things to different cus-tomers. Even so, it is an important determinant of business profitability.19 Thus, Hambricksuggests that in product-markets where technical features or up-to-the-minute styling arekey attributes in customers’ definitions of quality, high-quality products may play a posi-tive role in determining the success of a prospector strategy. In markets where the criticaldeterminants of quality are reliability or brand familiarity, the maintenance of relativelyhigh product quality is likely to be more strongly related to the successful performance ofdefender businesses, particularly differentiated defenders.20
Differentiated defenders compete by offering more or better choices to customers thando their competitors. For example, 3M’s commercial graphics business, a major supplierof sign material for truck fleets, has strengthened its competitive position in that market bydeveloping products appropriate for custom-designed signs. Until recently, the use of filmfor individual signs was not economical. But the use of computer-controlled knives and anew Scotch-brand marking film produce signs of higher quality and at lower cost thanthose that are hand-painted. This kind of success in developing relatively broad and tech-nically sophisticated product lines should be positively related to the long-term ROI per-formance of most differentiated defender businesses.
However, broad and sophisticated product lines are less consistent with the efficiencyrequirements of the low-cost defender strategy. For one thing, maintaining technicalsophistication in a business’s products requires continuing investments in product andprocess R&D. For another, broad, complex lines can lead to short production runs and larger inventories. Some of the efficiency problems associated with broader, more-customized product lines may disappear, however, with continuing improvements in computer-assisted design and manufacturing, process reengineering, and the like.21
Instead of, or in addition to, competing on the basis of product characteristics, businessescan distinguish themselves relative to competitors on the quality of service they offer. Suchservice might take many forms, including engineering and design services, alterations,installation, training of customer personnel, or maintenance and repair services. A policy ofhigh service quality is particularly appropriate for differentiated defenders because it offersa way to maintain a competitive advantage in well-established markets.
The appropriateness of an extensive service policy for low-cost defenders, though, ismore questionable if higher operating and administrative costs offset customer satisfactionbenefits. Those higher costs may detract from the business’s ability to maintain the lowprices critical to its strategy, as well as lowering ROI—at least in the short term. On theother hand, even low-cost defenders may have difficulty holding their position over thelong term without maintaining at least competitive parity with respect to critical serviceattributes.22
Pricing PoliciesSuccess in offering low prices relative to those of competitors should be positively related tothe performance of low-cost defender businesses—for low price is the primary competitiveweapon of such a strategy. However, such a policy is inconsistent with both differentiated

Walker et al.: Marketing Strategy: A Decision−Focused Approach, Fourth Edition
I. Introduction to Strategy 3. Business Strategies and Their Marketing Implications
143© The McGraw−Hill Companies, 2002
Chapter Three Business Strategies and Their Marketing Implications 79
defender and prospector strategies. The higher costs involved in differentiating a business’sproducts on either a quality or service basis require higher prices to maintain profitability.Differentiation also provides customers with additional value for which higher prices can becharged. Similarly, the costs and benefits of new product and market development byprospector businesses require and justify relatively high prices. Thus, differentiated defend-ers and prospectors seldom adhere to a policy of low competitive prices.
Distribution PoliciesSome observers argue that prospector businesses should show a greater degree of forwardvertical integration than defender businesses.23 The rationale for this view is that theprospector’s focus on new product and market development requires superior market intel-ligence and frequent reeducation and motivation of distribution channel members. This canbest be accomplished through tight control of company-owned channels. However, thesearguments seem inconsistent with the prospector’s need for flexibility in constructing newchannels to distribute new products and reach new markets.
Attempting to maintain tight control over the behavior of channel members is a moreappropriate policy for defenders who are trying to maintain strong positions in establishedmarkets. This is particularly true for defenders who rely on good customer service to dif-ferentiate themselves from competitors. Thus, it seems more likely that a relatively highdegree of forward vertical integration is found among defender businesses, particularly dif-ferentiated defenders, while prospectors rely more heavily on independent channel mem-bers—such as manufacturer’s representatives or wholesale distributors—to distribute theirproducts.24
Because prospectors focus on new products where success is uncertain and sales vol-umes are small in the short run, they are likely to devote a larger percentage of sales totrade promotions than are defender businesses. Prospectors rely on trade promotion toolssuch as quantity discounts, liberal credit terms, and other incentives to induce cooperationand support from their independent channel members.
Promotion PoliciesExtensive marketing communications also play an important role in the successful imple-mentation of both prospector and differentiated defender strategies. The form of that com-munication, however, may differ under the two strategies. Because prospectors mustconstantly work to generate awareness, stimulate trial, and build primary demand for newand unfamiliar products, high advertising and sales promotion expenditures are likely tobear a positive relationship to the new product and share-growth success of such busi-nesses. The drug delivery SBU at 3M, for instance, devotes substantial resources to adver-tising in professional journals and distributing samples of new products, as well as tomaintaining an extensive salesforce.
Differentiated defenders, on the other hand, are primarily concerned with maintainingthe loyalty of established customers by adapting to their needs and providing good serv-ice. These tasks can best be accomplished—particularly in industrial goods and servicesindustries—by an extensive, well-trained, well-supported salesforce.25 Therefore, differ-entiated defenders are likely to have higher salesforce expenditures than are competitors.
Finally, low-cost defenders appeal to their customers primarily on price. Thus, high expen-ditures on advertising, sales promotion, or the salesforce would detract from their basic strat-egy and may have a negative impact on their ROI. Consequently, such businesses are likely tomake relatively low expenditures as a percentage of sales on those promotional activities.

Walker et al.: Marketing Strategy: A Decision−Focused Approach, Fourth Edition
I. Introduction to Strategy 3. Business Strategies and Their Marketing Implications
144 © The McGraw−Hill Companies, 2002
Section One Introduction to Strategy80
What If the Best Marketing
Program for a Product Does Not
Fit the Business’s Competitive
Strategy?
What should a marketing manager do if the market environment facing a particular prod-uct or service demands marketing actions that are not consistent with the overall compet-itive strategy of the business to which it belongs? What if, for example, the product’s targetmarket is rapidly becoming more mature and competitive, but it is housed in a prospectorbusiness unit that does not have the cost structure or the personnel to allow the aggressivepricing or excellent customer service that may be needed for the product to compete suc-cessfully? Or what if newly emerging technology demands that a mature product categoryundergo an innovative redesign even though the defender SBU does not have extensiveR&D and product development capabilities?
If a business unit is focused on a single product category or technological domain—asis the case with 3M’s industrial tape unit—the ideal solution might be for the whole SBUto change its strategy in response to shifting industry circumstances. As the product cate-gory matures, for instance, the SBU might switch from a prospector to an analyzer strat-egy, and ultimately to one of the defender strategies.
The problem is that—as we shall see in Chapter 13—effective implementation of dif-ferent business strategies requires not only different functional competencies and resourcesbut also different organizational structures, decision-making and coordination processes,reward systems, and even personnel. Because such internal structures and processes arehard to change quickly, it can be very difficult for an entire SBU to make a successful tran-sition from one basic strategy to another.26 For example, many of Emerson Electric’s SBUshistorically were successful low-cost defenders, but accelerating technological change intheir industries caused the corporation to try to convert them to low-cost analyzers thatwould focus more attention on new product and market development. Initially, however,this attempted shift in strategy resulted in some culture shock, conflict, and mixed per-formance outcomes within those units.
In view of the implementation problems involved, some firms do not try to make majorchanges in the basic competitive strategies of their existing business units. Instead, theymight form new prospector SBUs to pursue emerging technologies and industries ratherthan expecting established units to handle extensive new product development efforts.
Similarly, as individual product-market entries gain successful positions in growingmarkets, some firms move them from the prospector unit that developed them into anexisting analyzer or defender unit, or even into a newly formed SBU, better suited to reap-ing profits from them as their markets mature. For example, a number of innovative prod-ucts developed at 3M, such as Post-it repositionable notes, have enjoyed sufficient successthat new divisions were formed to concentrate on defending them as their marketsmatured. Many successful entrepreneurial start-ups eventually reorganize into two or morebusiness units, one to continue prospecting new products and markets and another todefend the firm’s initial product offering as its market matures.
Finally, some firms that are technological leaders in their industries may divest orlicense individual product-market entries as they mature rather than defend them in theface of increasing competition and eroding margins. This approach is relatively commonat firms such as 3M and DuPont.
Because the marketing manager responsible for a given product-market entry is usuallymost closely tuned-in to changes in the market environment, he or she bears the responsibility

Walker et al.: Marketing Strategy: A Decision−Focused Approach, Fourth Edition
I. Introduction to Strategy 3. Business Strategies and Their Marketing Implications
145© The McGraw−Hill Companies, 2002
Chapter Three Business Strategies and Their Marketing Implications 81
for pointing out any mismatches between what is best for the product and the capabilities of theorganizational unit to which it belongs. The marketer should develop a marketing strategy thatmakes the most sense in light of a detailed analysis of the available customer and competitiveinformation and present a strong case for the resources necessary to implement the plan. Ifthose resources are not available within the business unit, or if the marketing strategy is incon-sistent with the SBU’s objectives or competitive strategy, top management faces a choice ofmoving the product to a more benign unit of the firm or rejecting the recommended strategy. Ifthe strategy is rejected, the marketer will likely have to make compromises to the strategy tomake it fit better with the competitive thrust of the SBU, even though an attractive opportunitymay be lost. But if the marketer has great confidence in the recommended strategy, he or shemight opt to quit the firm and pursue the opportunity elsewhere, as was the case with JimWatkins, as discussed in Exhibit 3.8.
Take Aways
When he was a product manager at the PillsburyCompany in the early 1970s, James D. Watkins
became convinced that microwave technology repre-sented a major opportunity for the packaged foodindustry. Consequently, he developed a marketing planthat proposed the pioneering development andaggressive introduction of a line of microwavable foodproducts, starting with microwave popcorn. However,the business unit he worked for—and the entire Pills-bury Company at that time—was focused on defend-ing strong positions in established markets, largelythrough incremental line extensions and productimprovements. In other words, it was pursuing more ofan analyzer strategy. As a result, top managementrejected Watkins’s proposal as being too risky andrequiring resources and capabilities that were in shortsupply.
Watkins subsequently quit Pillsbury, founded a newfirm called Golden Valley Microwave, attracted venturecapital, hired some food scientists to do the necessaryR&D, and began to market ActII microwave popcornthrough large mass merchandisers such as Wal-Mart. AsWatkins had predicted in his original marketing plan,the availability of microwavable foods spurred a rapidincrease in consumer demand for microwave ovens,which in turn increased demand for more microwavablefoods. His new company grew rapidly, and a few yearslater he sold it to Conagra for many millions of dollars.
But don’t be too critical of Pillsbury. Like a goodanalyzer, the company avoided playing the risky roleof the pioneer, but it eventually responded to thegrowing potential of microwave technology and suc-cessfully launched its own line of microwavable foods,including popcorn.
Exhibit 3.8 Jim Watkins Takes a Hike
• Research suggests that a business is likely to achievesuperior revenue growth, market share, and profitabil-ity when there is a good fit between its competitivestrategy and the strategic marketing programs of itsvarious product or service offerings.
• Business-level competitive strategies can be usefully cat-egorized into (1) prospector strategies focused on growthvia the development of new products and markets, (2)defender strategies primarily concerned with defendingstrong positions in established markets through eitherlow prices or offering customers superior value in termsof product quality or service, and (3) analyzer strategies,which are hybrids of the other two strategies.
• The generic competitive strategies described in theprevious point apply equally well to services andphysical products, single-product start-ups and multi-divisional corporations, and global and domestic oper-ations, and they are unlikely to change dramaticallydue to the rise of e-commerce.
• Because the various business-level strategies focus ondifferent objectives and seek to gain a competitiveadvantage in different ways, marketing may play a dif-ferent role under each of the strategies, and varyingmarketing actions may be called for.
• The marketing decision-maker’s job is to develop asound, evidence-based marketing strategy for his or

Walker et al.: Marketing Strategy: A Decision−Focused Approach, Fourth Edition
I. Introduction to Strategy 3. Business Strategies and Their Marketing Implications
146 © The McGraw−Hill Companies, 2002
Section One Introduction to Strategy82
her offering and to make a persuasive case for its sup-port. If that strategy does not fit the objectives oravailable resources and competencies of the businessunit in which the product is housed, top managementmay choose to move the product to a more amenableunit or require adjustments to the strategy.
• Self-diagnostic questions to test your ability to applythe analytical tools and concepts in this chapter tomarketing decision making may be found at thisbook’s website at www.mhhe.com/walker.
Endnotes
1. Material for this example was obtained from The 3M Company 2000Annual Report and other information found on the company’s website,www.3m.com; and Shawn Tully, “Why to Go for Stretch Targets,” Fortune,November 14, 1994, pp. 145–58.
2. For a more detailed discussion of the concept of strategic fit and the role ofvarious external and internal variables in influencing the effectiveness of afirm’s strategies, see N. Venkatraman and James Camillus, “The Concept of‘Fit’ in Strategic Management,” Academy of Management Review 9 (1984),pp. 513–24.
3. Stanley F. Slater and Eric M. Olson, “Marketing’s Contribution to theImplementation of Business Strategy: An Empirical Analysis,” working paper(Bothell, WA: University of Washington at Bothell, 2000).
4. Tulley, “Why to Go for Stretch Targets,” p. 150.
5. For example, see Robin Cooper and Robert S. Kaplan, “Measure CostsRight: Make the Right Decisions,” Harvard Business Review, September–October 1988, pp. 96–103; and Terrence P. Pare, “A New Tool for ManagingCosts,” Fortune, June 14, 1993, p. 124.
6. C. K. Prahalad and Gary Hamel, “The Core Competence of the Corpora-tion,” Harvard Business Review 68 (May–June 1990), pp. 79–91.
7. Michael E. Porter, Competitive Strategy (New York: Free Press, 1980).Also see Michael E. Porter, Competitive Advantage: Creating and SustainingSuperior Performance (New York: Free Press, 1985).
8. Robert E. Miles and Charles C. Snow, Organizational Strategy, Structure,and Process (New York: McGraw-Hill, 1978). For another taxonomy of business-level competitive strategies that incorporates elements of both thePorter and Miles and Snow frameworks, see Michael Treacy and FredWiersema, The Discipline of Market Leaders (Reading, MA: Addison-Wesley, 1995).
9. Charles C. Snow and Lawrence G. Hrebiniak, “Strategy, Distinctive Com-petence, and Organizational Performance,” Administrative Science Quarterly25 (1980), pp. 317–35.
10. Theodore Levitt, The Marketing Imagination (New York: Free Press,1986), pp. 94–95.
11. Philip Kotler and Gary Armstrong, Principles of Marketing (EnglewoodCliffs, NJ: Prentice Hall, 1989), p. 575.
12. Daryl O. McKee, P. Rajan Varadarajan, and William M. Pride, “StrategicAdaptability and Firm Performance: A Market-Contingent Perspective,”Journal of Marketing, July 1989, pp. 21–35.
13. For example, see “Internet Economics: A Thinker’s Guide,” The Econo-mist, April 1, 2000, pp. 64–66.
14. Larry Chiagouris and Brant Wansley, “Branding on the Internet,” Market-ing Management 9 (Summer 2000), pp. 35–38.
15. Gordon Donaldson, Managing Corporate Wealth (New York: Praeger,1984).
16. Donald C. Hambrick, “Some Tests of the Effectiveness and FunctionalAttributes of Miles and Snow’s Strategic Types,” Academy of ManagementJournal 26 (1983), pp. 5–26; and McKee, Varadarajan, and Pride, “StrategicAdaptability and Firm Performance.”
17. Robert D. Buzzell and Bradley T. Gale, The PIMS Principles: LinkingStrategy to Performance (New York: Free Press, 1987), chap. 6.
18. For example, see Ronald Henkoff, “Cost Cutting: How to Do It Right,”Fortune, April 9, 1990, pp. 40–49.
19. Buzzell and Gale, The PIMS Principles, chap. 6.
20. Hambrick, “Some Tests of Effectiveness.”
21. B. Joseph Pine II, Bart Victor, and Andrew C. Boynton, “Making MassCustomization Work,” Harvard Business Review 71 (September–October1993), pp. 108–19.
22. For additional arguments in the debate about the relative costs and com-petitive benefits of superior customer service, see Rahul Jacob, “BeyondQuality and Value,” Fortune, Special Issue, Autumn–Winter 1993, pp. 8–11;and Valarie A. Zeithaml and Mary Jo Bitner, Services Marketing (New York:McGraw-Hill, 1996), chap. 2.
23. Miles and Snow, Organizational Strategy, Structure, and Process; andHambrick, “Some Tests of Effectiveness.”
24. Although Hambrick argues for the reverse relationship, data from hisstudy of 850 SBUs actually support our contention that defenders have morevertically integrated channels than do prospectors. See Hambrick, “SomeTests of Effectiveness.”
25. Leonard A. Schlesinger and James L. Heskett, “The Service-Driven Ser-vice Company,” Harvard Business Review 69 (September–October 1991),pp. 71–81; and Jaclyn Fierman, “The Death and Rebirth of the Salesman,”Fortune, July 25, 1994, pp. 80–91.
26. Connie J. G. Gersick, “Revolutionary Change Theories: A MultilevelExploration of the Punctuated Equilibrium Paradigm,” Academy of Manage-ment Review 16 (1991), pp. 10–36; and Michael L. Tushman, William H.Newman, and Elaine Romanelli, “Convergence and Upheaval: Managing theUnsteady Pace of Organizational Evolution,” California Management Review29 (1986), pp. 29–44.
Walker et al.: Marketing Strategy: A Decision−Focused Approach, Fourth Edition
II. Opportunity Analysis 4. Identifying Attractive Markets
147© The McGraw−Hill Companies, 2002
84
Section Two
Opportunity Analysis
Chapter 4 Identifying AttractiveMarkets
Chapter 5 Industry Analysis andCompetitive Advantage
Chapter 6 Measuring MarketOpportunities
Chapter 7 Targeting AttractiveMarket Segments
Chapter 8 Differentiation and Positioning

Walker et al.: Marketing Strategy: A Decision−Focused Approach, Fourth Edition
II. Opportunity Analysis 4. Identifying Attractive Markets
148 © The McGraw−Hill Companies, 2002
85
Walker et al.: Marketing Strategy: A Decision−Focused Approach, Fourth Edition
II. Opportunity Analysis 4. Identifying Attractive Markets
149© The McGraw−Hill Companies, 2002
86
Chapter Four
IDENTIFYING ATTRACTIVE
MARKETS
The Changing American Menswear Market1
From jeans to khakis, from tailored suits to“business casual,” clothing preferences amongAmerican men have been changing. A trend
toward casual dress in the workplace that got itsstart during the 1980s in high-tech firms in SiliconValley in California became pervasive throughoutthe business world during the dot-com boom ofthe late 1990s. One day in early 2000, some 350lawyers and staffers from the old-line New York lawfirm of Cadwalader, Wickersham, and Taft crowdedinto the Polo mansion on New York’s posh uppereast side to get some advice on how to enter the“business casual” era.
The Impact of Unfavorable
Macroenvironmental Trends
For companies serving the men’s tailored clothingmarket, the challenges brought about by the busi-ness casual trend have been daunting. Manufactur-ers of tailored men’s clothing have stumbled, andsome have attempted to reposition themselves aspurveyors of more casual attire. Retailers of men’ssuits also have struggled, and some, like the Kup-penheimer chain, a unit of Hartmarx, the leadingmanufacturer of tailored menswear in the UnitedStates, have closed their doors entirely.
What happens when unexpected unfavorabletrends, like that toward more casual dress in theworkplace, cause demand for a category of goodsor services to shrink, as has happened with tai-lored men’s clothing? First, providers of suchgoods feel a softening in their sales. As sales growsofter, firms find themselves having excess capac-ity and expense levels that cannot be supportedby reduced levels of revenue. Often, the perfor-mance figures that result paint a picture that isanything but pretty. By 1999, Hartmarx, which hadstruggled with the changing menswear market fora decade, found its pretax profit margins in itsmen’s apparel group languishing at 2 percent ofsales, while its stock had fallen to less than $4 pershare, from an already depressed $10 in 1997.Hartmarx was far from the only menswear firm to feel the heat. In 1999 the bankrupt retailer Edison Brothers liquidated its 295 Riggings storesbecause not a single buyer out of 250 interestedparties was willing to buy the ailing chain. Today’sMan, a 25-store menswear chain in the easternUnited States, was forced to reorganize underbankruptcy protection in 1998. Numerous otherchains and independent men’s clothiers sufferedsimilar fates.
The widespread troubles experienced by mens-wear retailers and manufacturers in the 1990s are

Walker et al.: Marketing Strategy: A Decision−Focused Approach, Fourth Edition
II. Opportunity Analysis 4. Identifying Attractive Markets
150 © The McGraw−Hill Companies, 2002
87
typical of what can happen when unforeseentrends—whether social trends, as in this case, orothers—cause consumer demand to drop rapidly.Simply put, the market for tailored men’s apparelshrank like a cheap suit and the ensuing compet-itive pressures in the menswear manufacturingand retailing industries made this market andthese industries far less attractive than they hadonce been.
Is Success Impossible in the
Face of Unfavorable Trends?
Most observers of the men’s apparel market in the1990s would have concluded that success wouldhave been difficult to achieve for any player serv-ing that market. At least one tailored clothingretailer, however, continued to prosper in spite ofadverse market conditions. The Men’s Wearhouse,whose first store opened in Houston, Texas, in1973, went public in 1992 and grew consistentlythroughout the 1990s, opening as many as 50stores per year in the late 1990s. The chain’s same-store sales grew as well, including a 10.4 percentsame-store sales increase in 1998. How did Men’sWearhouse thrive where others failed? It offered amix of branded and private-label merchandise inlow-cost but nicely appointed strip center loca-tions. It spent heavily on employee training tobuild a customer-oriented, team-selling culture. It
spent its marketing money largely in broadcastmedia, instead of the more traditional print adver-tising used by other menswear retailers, makingfounder George Zimmer, its radio spokesman, acelebrity in the process. As President David Edwabnoted in 1999, “If you look at this company, we’vetaken the most difficult part of the apparel busi-ness, added marketing, training, the right realestate, and store strategies to sell men what theylike the least. As a result, we’ve gained marketshare in a consolidating industry.”
What’s Next? Will Suits
Come Back?
When the dot-com bubble burst in 2000, the timeseemed right for a return to more formal businessattire. The logic was that laid-off dot-com workerswould be interviewing again, and those who hadkept their jobs would begin dressing better out offear. So far, however, according to Neal Fox, vicechairman of Today’s Man, the menswear retailer,“Right now there’s more spin out there, but not amassive upsurge in suit sales.” Will suits comeback, or will they simply be one option, to beworn when appropriate, for client meetings or tomake one’s employer think you have a job inter-view? Time will tell. For marketing strategists inthe menswear industry, it’s a question not to beignored.
Strategic Challenges Addressed in Chapter 4
As the story of the changing menswear market shows, unfavorable sociocultural or othertrends that negatively influence market demand can have a devastating effect on the per-formance of firms serving that market. Similarly, favorable trends exert positive forces thatmake it easier for firms to perform well. As discussed in Exhibit 4.1, retailers and manu-facturers of casual clothing suitable for today’s workplace have fared well in the late1990s. Entrepreneurs seeking to start new firms, investors in search of favorable returns,and managers in existing firms are therefore well advised to consider the presence andstrength of such trends in deciding where to place their bets.
In this chapter, we address the second of the 4 Cs—the environmental context inwhich the business operates—that were identified in Chapter 1 as the analytical foundation
Walker et al.: Marketing Strategy: A Decision−Focused Approach, Fourth Edition
II. Opportunity Analysis 4. Identifying Attractive Markets
151© The McGraw−Hill Companies, 2002
Section Two Opportunity Analysis88
of the marketing management process. We provide a framework to help managers, entre-preneurs, and investors comprehensively assess the environment in which they operate orpropose to operate, in order to assess market attractiveness and enhance their likelihood ofachieving success. Thus, this chapter addresses three important questions for marketingstrategists: Does it really matter whether we swim upstream or downstream? How can webe sure we’ve identified and understood the key trends? And finally, how does macro trendanalysis play out in assessing markets and in making marketing decisions?
Swimming Upstream or
Downstream: An Important
Strategic Choice
Casual dress in the workplace is a social trend. The graying of America is a demographicone. Global warming is a trend in our physical environment. All these trends influence thefortunes of some companies, but not others. As we have seen, the influence of macro-environmental trends—or macro trends, for short—like these can be pervasive and pow-erful. In general, life is better swimming downstream, accompanied by favorable trends,than upstream, running counter to such trends.
Like mosquitoes or cooling breezes on a humid summer evening, trends will always bepresent, whether marketing managers like them or not. The question iswhat managers can do about them. For some trends, marketers and othermanagers can do little but react and adapt. In the 1990s, manufacturersof products sold in spray containers were required to find new propel-lants less harmful to the ozone layer. Governments concerned aboutglobal warming mandated this change. For other trends, like the shifttoward casual dress in the workplace for Gap, favorable moves can be
reinforced through effective marketing. Similarly, sometimes, unfavorable ones can bemitigated. But doing these things requires that important trends be noticed and understood.The sociocultural, demographic, and physical environments are but three of six major
W ith suits passé, what are up-and-comingyoung professionals wearing to work?
For many, the answer is khakis andsportshirts. In the young men’s sportswear category in1999, the khaki business more than doubled over1998, as, in traditional department stores, khakis’share of the young men’s apparel business grew from6 percent in 1998 to 15 percent in 1999. Levi’s, a lead-ing brand in the khakis category, increased its youngmen’s market share to 25 percent and maintained itsnumber one position in the young men’s category.
Casual clothing retailers happily rode the wave, aswell. Gap, Inc., and its family of stores enjoyed increaseddemand for its casual clothing in 1999, resulting in a 29percent increase in worldwide sales and a 38 percentincrease in earnings per share. An important part ofGap’s growth was its broadened focus on Internet retail-
ing. “We also reached new customers and expandedmarket share by opening more than 500 stores world-wide and broadening our brands online. Our passion forserving customers better every day will continue to drivequality growth for Gap, Banana Republic, and Old Navy,”said Millard S. Drexler, president and CEO.
Gap’s ability to stay in tune with fashion trendsproved less than infallible, however. From late 1999into 2002, Gap struggled to find the right mix of mer-chandise for its stores, and same-store sales and com-pany profits tumbled. Will Gap successfully tune in towhat its customers want in the new millennium? Timewill tell.
Source: “Khakis Sales Up, Jeans Sales Down for 1999,” DNR, Feb-ruary 11, 2000, p. 18; Gap, Inc., website, www.gap.com; Calmetta Cole-man, “Gap, Inc. Stumbles as Respected CEO Loosens Reins,” The WallStreet Journal, September 7, 2000, p. B4.
Exhibit 4.1 Khakis Conquer the Workplace
Strategic Issue
Like mosquitoes or cooling breezes on ahumid summer evening, trends will alwaysbe present, whether marketing managerslike them or not. The question is what man-agers can do about them.
www

Walker et al.: Marketing Strategy: A Decision−Focused Approach, Fourth Edition
II. Opportunity Analysis 4. Identifying Attractive Markets
152 © The McGraw−Hill Companies, 2002
Chapter Four Identifying Attractive Markets 89
components of the macroenvironment. The other three are the political/legal, economic,and technological components. We deal with the competitive environment in Chapter 5.
Macro Trend Analysis:
A Framework for Assessing
Market Attractiveness
Each of the six macroenvironmental components will be examined in terms of how thedynamics of change affect the attractiveness of particular markets and influence marketingstrategies and programs.
The Demographic EnvironmentThe world’s population in 1994 was 5.63 billion persons versus 2.52 billion in 1950. It isexpected to grow to 7.47 billion by 2015. Some 80 percent of the world’s population livesin the less-developed countries, where 95 percent of the increase in population takes place.Africa and Asia represent nearly 90 percent of the increase. Africa’s population is expectedto double by 2025—from 728 million to 1.49 billion—while that of Asia is expected togrow by 40 percent—from 3.46 billion to 4.96 billion. China and India will account formost of this increase. Europe over the next 20 years is expected to have a declining popu-lation. The United States is the only major developed country projected to show a popula-tion increase—from 263 million (current) to 331 million by 2025.2
A major trend is the aging of the world’s population caused primarily by declining mor-tality rates. The developing nations are experiencing dramatic changes in their over-65 agegroup—a severalfold increase over the next 20 years is expected. Another important globaltrend is the rapid shift in the populations of the less-developed countries from rural to urban.By 2025 nearly 60 percent of the population of the less-developed countries is expected tobe urban versus 37 percent currently. In contrast 75 percent of the population of developedcountries is currently urban, but is expected to grow very slowly in the future.3 By the year2015, seven cities will have populations in excess of 20 million (see Exhibit 4.2).
Exhibit 4.2Populations of the 10 Largest Urban Areas—1994 versus 2015 (in Millions)
Urban area 1994 Urban area 2015
1. Tokyo 26.5 1. Tokyo 28.4
2. New York 16.3 2. Bombay 27.4
3. São Paulo 16.1 3. Lagos 24.4
4. Mexico City 15.5 4. Shanghai 23.4
5. Shanghai 14.7 5. Jakarta 21.2
6. Bombay 14.5 6. São Paulo 20.8
7. Los Angeles 12.2 7. Karachi 20.6
8. Beijing 12.0 8. Beijing 19.4
9. Calcutta 11.5 9. Dhaka 19.0
10. Seoul 11.5 10. Mexico City 18.8
Source: Review of Population Trends, Policies, and Programs: Monitoring of World Population Trendsand Policies (New York: United Nations, January 1996), table 9. The United Nations is the author of theoriginal material. Reprinted by permission.

Walker et al.: Marketing Strategy: A Decision−Focused Approach, Fourth Edition
II. Opportunity Analysis 4. Identifying Attractive Markets
153© The McGraw−Hill Companies, 2002
Section Two Opportunity Analysis90
U.S. Demographics4 The U.S. population grew by 20 million persons during the1990s—the largest increase of any developed country—and is expected to grow by about2 million a year well into the 21st century. Four major shifts are occurring in the U.S. pop-ulation: the changing family structure, aging, geographic distribution, and ethnic compo-sition. Each of these trends is discussed briefly below.
Family Structure The traditional husband-dominated, closely structured family is lessand less typical of American society. Today’s households because of divorce (about half ofall marriages end in divorce) and remarriage have evolved into a number of different kindsof households populated by single individuals; adults of the same sex or both sexes (mar-ried or not) living together; unmarried adults living with children, both related and unre-lated; single-parent families; and married couples with children. The situation is furthercomplicated because a substantial number of these households have two or more wageearners. These different types of households vary in their income and in their purchases ofvarious products and services. For example, households with two wage earners are apt tohave more than one car and spend more money on eating out.
Aging Baby boomers (those born between 1946 and 1964) who now constitute nearly 80million persons continue to dominate growth in the age groups they pass through en routeto old age. And the number of people over 65 has increased by 13 percent since 1990 tonearly 35 million. Those over 85 have increased 40 percent to over 4.2 million during thistimespan. In the years ahead we can expect the over-65 age group to increase substantially.As boomers age, they increasingly affect the purchase of goods and services. Householdsage 45 to 54 are the single most affluent U.S. consumer segment. For a description of whatthese households are buying, see Exhibit 4.3.
Geographic Distribution Immigrants account for nearly one-third of U.S. annualgrowth and end up residing mostly in the large metropolitan areas in California, New York,Texas, Florida, New Jersey, and Illinois. The South and West continue to gain populationat the expense of the Midwest and Northeast. California, Texas, and Florida accounted forover half the U.S. growth in the 1980s, and the latter two states continued to have stronggrowth during the 90s. Yet another trend is the migration of jobs and people to suburbancities—farther and farther from central cities.
Ethnic Composition Another major trend is that the United States is becoming morediverse ethnically. At present, more than 25 percent of the population is composed of racialminorities. The Hispanic population is the fastest-growing segment and is expected toincrease from 22.5 million in 1990 to nearly 90 million, rising from 9 percent to a 22 per-cent share of the total population by 2050. The African-American population is forecastedto double by 2050—from 30.6 to 62 million—while Asians will increase from 7.6 million
As boomers fight aging, they consume large quantitiesof skin creams, suntan lotions, hair coloring, cos-
metics, vitamins, and nutritional supplements. This seg-ment spends more than any other on books, women’sclothing, home computers, entertainment, new cars andtrucks, and restaurant meals. By 2000 they accounted
for the largest share of purchasing a majority of mostcategories of goods and services.
Source: Cheryl Russell, “The Baby Boomers Turn 50,” AmericanDemographics, December 1995, p. 22. Reprinted by permission.
Exhibit 4.3 What Boomers Age 50–64 Buy

Walker et al.: Marketing Strategy: A Decision−Focused Approach, Fourth Edition
II. Opportunity Analysis 4. Identifying Attractive Markets
154 © The McGraw−Hill Companies, 2002
Chapter Four Identifying Attractive Markets 91
to 41 million. The three groups, over the next 50 or so years, will account for nearly 50percent of the total U.S. population. Such growth will further internationalize the UnitedStates—especially in such major cities as Los Angeles, Miami, and New York. Productswith high ethnic appeal, in such areas as food and clothing, should be in high demand insuch cities.
Implications of Demographic Trends for Market Attractiveness The demo-graphic trends discussed in this section have resulted in rapidly growing markets for a
diverse array of products and services. Rapid economic developmentand a growing middle class in Asia have been a boon for capital goodsmanufacturers in the United States and Europe, as they export capitalequipment to the Asian factories seeking to satisfy Asia’s growingdemand for manufactured goods for local as well as export markets.
Aging populations in developed countries have created growing demand for senior hous-ing of many types and for in-home, home repair, and home modification services to enableolder persons to stay in their homes.5 Demographic trends also have led marketers todevelop products and special marketing programs targeted at minority and other demo-graphic groups whose numbers are growing.
On the downside, demographic trends have made other markets less attractive than theyonce were. Migration of jobs and people from some Northeast and Midwest cities to sub-urbs or cities elsewhere in the United States has led to stagnant real estate and employmentmarkets there, while cities in the West and South thrive.
The Sociocultural EnvironmentThis environment represents the values, attributes, and general behavior of the individualsin a given society. Compared with economic, political, and technological changes, thesociocultural environment evolves slowly. People grow up in a system of values they tendto carry throughout their lifetimes. Transformation in the structure of society, in its insti-tutions, and in the distribution of wealth occurs gradually in democratic countries. Evenso, we have in recent years seen a substantial change in individual values, family structure,minority rights, leisure-time activities, and conservation.
The Evolution of Individual Values North American society has been character-ized by the traditional values of hard work, thriftiness, and faith in others and in institu-tions. In the 60s, however, new social values emerged. Instead of leaving the destiny oftheir country in the hands of their elders and institutions, the young—particularly collegestudents—collectively fought for what they perceived to be good causes, such as civilrights, the end of the Vietnam war, and nonconformism. The young emerged as a newsocial force—sharing and defending a common set of new values even across national bor-ders. This era is often referred to as the “Age of Us.”
More recently, individual values have shifted again, particularly in the younger genera-tion (20–29 years of age), often referred to as Generation X.6 During their formative yearsthey have been exposed to dire predictions about the economic health of America, manypublic scandals, the advent of the knowledge society, the electronic/computer revolution,the changing structure of the American family, and the growing influence of minoritygroups.
Because of these experiences, members of this generation are greatly concerned withsimplifying their lives, with obtaining a college education, with their relations with theirfamilies and the opposite sex, and with economic security. Their coping includes living athome (particularly men), postponing marriage, and delaying having children. They are
Strategic Issue
Rapid economic development and a growingmiddle class in Asia have been a boon forcapital goods manufacturers.
www

Walker et al.: Marketing Strategy: A Decision−Focused Approach, Fourth Edition
II. Opportunity Analysis 4. Identifying Attractive Markets
155© The McGraw−Hill Companies, 2002
Section Two Opportunity Analysis92
realistic and pragmatic about surviving yet do not define success solely in terms of money.They place considerable emphasis on the family life they missed as children. While gen-erally turned off by big government, they care a great deal about such issues as AIDS,abortion, and the environment.7 For one professional’s list of the shifting values in West-ern societies, see Exhibit 4.4.
The Evolution of Family Structure The traditional husband-dominated, closelystructured family is less and less typical of our North American society. Children are becom-ing more autonomous and participate at an earlier age in many family decisions. A more bal-anced allocation of power between husband and wife also has emerged. In part this hasresulted from the fact that many women are more independent economically. Working par-ents’ absence from the home has substantially reduced the interactions among family mem-bers and family cohesiveness. The increasing divorce rate has made one-parent householdsmore common. All these factors have considerably changed the buying process for manygoods, including which family members are involved in the purchase of certain goods.
Implications of Sociocultural Trends for Market Attractiveness Along withbroader sociocultural trends come changes in consumer tastes and behavior. Natural foodsare in. Exercise for both genders is in. Fat and cholesterol are out. Thus, socioculturalchanges, such as those described in this section and at the beginning of the chapter, influencethe markets for a broad array of consumer products such as natural foods, exercise equipmentand sports beverages, low-fat food products, and men’s apparel. Sociocultural trends alsohave influenced how marketing activities are carried out in some markets. For example,advertising programs now accommodate more joint decision making in households.
Exhibit 4.4Shifting Values in Western Societies
Traditional values New values
Self-denial ethic Self-fulfillment ethic
Higher standard of living Better quality of life
Traditional sex roles Blurring of sex roles
Accepted definition of success Individualized definition of success
Traditional family life Alternative families
Faith in industry, institutions Self-reliance
Live to work Work to live
Hero worship Love of ideas
Expansionism Pluralism
Patriotism Less nationalistic
Unparalleled growth Growing sense of limits
Industrial growth Information/service growth
Receptivity to technology Technology orientation
Developed Western societies are gradually moving away from traditional values and toward the emerg-ing new values being embraced on an ever-widening scale, says author Joseph Plummer.
Source: “Changing Values: The New Emphasis on Self-Actualization,” originally published in the January–February 1989 issue of The Futurist, p. 15. Used with permission from World Future Society,7910 Woodmont Avenue, Suite 450, Bethesda, Maryland 20814. Telephone: 301-656-8274; Fax: 301-951-0394; http://www.wfs.org.
Walker et al.: Marketing Strategy: A Decision−Focused Approach, Fourth Edition
II. Opportunity Analysis 4. Identifying Attractive Markets
156 © The McGraw−Hill Companies, 2002
Chapter Four Identifying Attractive Markets 93
The Economic EnvironmentThe economic performance of a country is measured by gross domestic product (GDP)—usually on a per-capita basis after accounting for inflation. To realistically compare incomesacross countries, it is necessary to use a purchasing power parity (PPP) approach thatconsiders the cost of a standard basket of products (expressed in U.S. dollars) for each coun-try. Thus, using a PPP analysis helps to compare the relative purchasing power of a givencountry for goods with what these same goods would cost in the United States. If GDP percapita is calculated on the basis of exchange rates, then Japan has the world’s highest aver-age. But America has the highest if purchasing power parity is used to calculate per capitaGDP.8
Using PPP values typically produces lower GDP per capita income for the wealthiercountries and higher ones for the poorer nations. Despite this “leveling,” the gap in realGDP (less inflation) has increased between rich and poor countries—mainly because ofhigher population growth.9 But PPP does not take into account the subsidies provided bymany countries for such essentials as food, utilities, shelter, transportation, education, andmedical care, which account for about half of the average household expenditures in devel-oped countries.
The world’s economic growth continues to increase as measured by total gross nationalproduct (GDP). In the years ahead, the developing countries are expected to have substan-tially higher rates of economic growth than the developed ones. Asia has experienced thestrongest growth—over 8 percent (primarily because of China’s explosive growth)—and isexpected to continue at a 7 percent rate near-term. In South America, Argentina and Brazilare forecasted to continue their strong growth rates while Ecuador is still suffering fromeconomic difficulties. Some countries in Central Europe will have difficulty avoiding neg-ative growth.10
America seems to have regained its competitiveness because of a powerful surge in pro-ductivity triggered by low interest rates, flat unit labor costs, low inflation, and heavy cap-ital investments, especially in high-tech equipment. The more-open U.S. market has madeits companies more competitive as compared with Europe and, to some extent, Japan.11
In the United States, growth will come largely from the large number of baby boomersmoving into their peak earning years (age 44–54). Overall, the forecast calls for increasedspending on personal insurance and pensions, owned homes, appliances, home furnish-ings, food at home, utilities, health insurance, entertainment, and education. Expected todecline are expenditures for food away from home, alcoholic beverages, rental units,apparel, vehicles, gasoline, reading, and tobacco products.12 Of considerable concern is thegrowing gap between the classes. An average American middle-class household experi-enced a 4.6 percent decline in its inflation-adjusted annual income over a 15-year periodversus a 7.9 percent increase for the top one-third group. The richest 5 percent of Ameri-can families had an increase of 29.1 percent in their annual income.13
International Trade Increasingly countries have become more economically interde-pendent as have many of their industries. Free-trade agreements in various stages of com-pletion embrace a high percentage of the industrialized nations, including a singleEuropean market (EC); a merging of the European Community (EC) with the EuropeanFree Trade Area (EFTA) to form the European Economic Area (EEA); and the NorthAmerican Free Trade Agreement (NAFTA) between the United States, Canada, and Mex-ico, which will eventually embrace most Latin American countries.
The United States is by far the largest national market, representing about 25 percentof the total world market for goods and services (Japan is second with 10 percent). As
Walker et al.: Marketing Strategy: A Decision−Focused Approach, Fourth Edition
II. Opportunity Analysis 4. Identifying Attractive Markets
157© The McGraw−Hill Companies, 2002
Section Two Opportunity Analysis94
such, the U.S. market is a high priority target for the business firms of most countries,especially those of Japan and Europe. Inevitably, the United States is a highly competitivemarket for many goods and services. It is not only the biggest importer of goods and serv-ices, but also the biggest exporter, with Germany a close second. Even small companiesare now significant players in the export game.14
Today nearly one-third of all automobiles sold in the United States are of Japanese ori-gin. A large percentage of all TVs, radios, calculators, motorcycles, binoculars, robots,cameras, VCRs, tape players, and digital watches sold in the United States are foreign-made. Many U.S. companies are foreign-owned—for example, Pillsbury (English), Car-nation (Swiss), Firestone (Japanese), and CBS Records (Japanese).
Fluctuating exchange rates can significantly change the relative price competitiveness offirms manufacturing in different countries. For example, the devaluation of the yen versus theU.S. dollar (from 108.95 in June 1996 to 122.78 in February 1997) enabled Japaneseautomakers to offer better deals in selling and leasing their cars in the United States, espe-cially those made in Japan. The big three U.S. automakers (General Motors, Ford, and Daim-lerChrysler) complained about the U.S. policy of strengthening the value of the dollar againstthe yen and the German mark and forecast lower profits—even a decline in market share.
Implications of Economic Trends for Market Attractiveness Economictrends influence the level of demand in most markets, but they are particularly importantin capital goods markets, real estate, and other markets where sensitivity to interest ratesand the level of household or corporate income can be extreme. Economic trends often
combine with other macro trend categories, with powerful effects. Forexample, the growth of the baby boomers, a demographic trend, togetherwith the strong American economy and low interest rates in the late1990s, both economic trends, resulted in rapidly growing demand for
condominiums and second homes in resort areas. Some who foresaw these trends made akilling during this period. If these trends continue, rising resort real estate prices are likelyalso to continue, unless the supply of resort properties outpaces demand.
The Political/Legal EnvironmentIn every country there is a legislative or regulatory environment within which both localand foreign firms must operate. As with any other external force, the political/legal envi-ronment presents a firm with strategic opportunities as well as threats. The business regu-lations in a country reflect its economic maturity and political philosophy. At the extreme,political risk for the firm includes confiscation (seizure without compensation as happenedin Iran several years ago), expropriation (seizure with some compensation), and domesti-cation (requiring transfer of ownership to the host country and local management andsourcing).
Other risks include changes in exchange control (which can take a variety of forms),local content laws, import restrictions, taxes, and price controls—all of which usuallyoperate to the advantage of local industry. Clearly, many third world countries present anarray of political risks to companies seeking to do business in them. (See Exhibit 4.5 for adiscussion of the risks of investing in China.) On the other hand, governments can encour-age foreign investment through policies such as tax concessions and tariff protection.Indeed, countries commonly encourage certain kinds of investments while simultaneouslyrestricting others. For example, governments may encourage local firms to export to coun-tries that have considerable political risk by providing insurance against losses from suchrisk (for instance, the U.S. Export-Import Bank).
Strategic Issue
Economic trends often combine with othermacro trend categories, with powerful effects.

Walker et al.: Marketing Strategy: A Decision−Focused Approach, Fourth Edition
II. Opportunity Analysis 4. Identifying Attractive Markets
158 © The McGraw−Hill Companies, 2002
In but a few years China has emerged as a powerfuleconomic force with the world’s largest potential
market. Because of its longer-term attractiveness, ithas attracted substantial investments by a diversegroup of multinational firms despite high inflationrates, widespread corruption, the growing power ofthe military, and the possible turmoil following thedeath of its aging leader. Examples of the poor treat-ment accorded foreign investors include the eviction ofMcDonald’s from a prime location in Beijing, even
though its lease had 17 years to run; Lehman Brothers’having to sue two state corporations to pay $100 mil-lion for losses in foreign exchange trading; and agroup of Japanese, German, and Italian banks beggingBeijing to reimburse them for $400 million ofdefaulted loans made to state enterprises.
Source: Louis Kraar, “The Risks Are Rising in China,” Fortune,March 6, 1995. See also Pete Engardio and Dexter Roberts, “Rethink-ing China,” Business Week, March 4, 1995, p. 57.
Exhibit 4.5 China—A Risky Investment
Chapter Four Identifying Attractive Markets 95
Controversies over copyright infringement involve the highest stakes. In China, piratefactories often under the protection of senior politicians and high-ranking military officialsengage in counterfeiting such items as videos, compact disks, computer software, pre-scription drugs, herbicides, and Rolex watches. Such counterfeiting costs U.S. companiesan estimated $1 to $2 billion a year.15
Government Regulation The number and intricacy of laws and regulations make itdifficult to understand regulatory elements affecting marketing. Most countries have regu-lations concerning food and drugs, as well as price, products, promotion, and distribution,but these vary considerably in their applicability to marketing. For example, the EuropeanCommunity (EC) is phasing in thousands of rules to provide uniform safety, health, andenvironmental standards for its member countries. These rules now favor companies pro-ducing a variety of products for several countries, but in the future some exporters will berequired to make costly design changes, to substantially retool, and to add new quality con-trol systems.
It has long been argued that regulations cripple the economy and stifle innovation. Thisis often true, but effects are frequently overstated since business will strive to find innova-tive ways to adhere to regulations at less than the anticipated costs. For example, when theU.S. Occupational Safety and Health Administration issued a higher standard for avoidingworker exposure to the toxic chemical formaldehyde, industry costs were expected to be$10 million yearly. But by modifying the resins and reducing the amount of formaldehyde,costs were negligible. Further, the changes enhanced the global competitiveness of theU.S. foundry supply and equipment industry.16
Government Deregulation Government, business, and the general public through-out much of the world have become increasingly aware that overregulation protects ineffi-ciencies, restricts entry by new competitors, and creates inflationary pressures. In theUnited States, airlines, trucking, railroads, telecommunications, and banking have beenderegulated. Markets also are being liberated in Western and Eastern Europe, Asia, andmany of the developing countries. Trade barriers are crumbling due to political unrest andtechnological innovation.
Deregulation has typically changed the structure of the affected industries as well aslowered prices. For example, in the decade following deregulation of the U.S. airlineindustry (1978–1985), over 200 new air carriers entered the market, and prices were esti-mated to be 40 percent cheaper than they would have been under regulation. Also, some900 monopoly routes were made more competitive.17 The early actions of firms following
Walker et al.: Marketing Strategy: A Decision−Focused Approach, Fourth Edition
II. Opportunity Analysis 4. Identifying Attractive Markets
159© The McGraw−Hill Companies, 2002
Section Two Opportunity Analysis96
deregulation include improving pricing capabilities, finding new ways to differentiate theirservices, increasing their marketing skills, and conserving capital to maintain flexibility.Later, the strategies of the surviving companies center on fine-tuning their pricing capa-bilities, preempting competitors via strategic alliances, and developing their marketingskills.18
Implications of Regulation and Deregulation for Market AttractivenessAs regulatory practices wax and wane, the attractiveness of markets often follows suit. Forexample, the deregulation of telecommunications in Europe, following earlier deregulationin the United States, is opening markets to firms seeking to offer new services and takemarket share from the established monopolies. The rise of Internet retailing and Internettelephony has policy makers arguing over the degree to which these Internet activitiesshould be subject to state and federal tax in the United States. The outcome of these argu-ments may have considerable effect on consumers’ interest in buying and calling on theWeb. Further, the U.S. government’s effort to force a breakup of Microsoft has left high-tech firms wondering about the extent to which their successful innovations will causethem to run afoul of government antitrusters.19
The Technological EnvironmentTechnology can have a substantial impact on an industry’s performance. Consider theeffect of genetic engineering on pharmaceuticals, of transistors on telecommunications,and of plastics on metals. Identification of the commercial potential of technologicaldevelopments has dramatically accelerated, and the lag between ideas, invention, and com-mercialization has decreased.
In the past three decades, an amazing number of new technologies have brought forthsuch products as video recorders, compact disks, ever-more-powerful and ever-smallercomputers, fax machines, new lightweight materials, and highly effective genetically engi-neered drugs. Technological progress over the next 10 years is predicted to be several timesthat experienced during the past 10 years; much of it will be spurred by the need to findsolutions to our environmental problems. Major technological innovations can be expectedin a variety of fields, especially in biology and electronics/telecommunications.20
Trends in Biology The biological revolution is of fairly recent origin, especially genetherapy. There are some 60,000 to 80,000 genes in each human cell, which, by instructingcells to make proteins, can dictate not only our physical characteristics (the color of oureyes), but also our susceptibility to certain diseases. A single gene can trigger creation ofa protein that, if it works like a drug, can lead to the development of a drug worth $500million annually, such as Amgen’s anemia-fighting Epogen. Research to discover faultygenes, if successful, may lead to the development of therapeutic treatments for such dis-eases as cystic fibrosis and colon cancer, which would be worth billions of dollars.21
Drug companies around the world are investing vast sums in R&D in their continuedsearch for new problem-solving agents. Anticipated results in the pharmaceutical and agri-cultural areas include such exciting prospects as these:22
• Pharmaceuticals: production of human growth hormones to cure dwarfism and prevent mus-cle wasting, the introduction of powerful genetically engineered vaccines to treat certainkinds of cancers, and replacing defective genes that cause a variety of diseases (such as cys-tic fibrosis). A gene has been discovered that holds the promise of successfully treating obe-sity.23 Scientists are also making good progress in the development of mass-produced tissuecultures for growing skin (for treating severe burn patients) and other organs (livers). Thistechnology could reduce the need for donated transplants and plastic implants.24
www

Walker et al.: Marketing Strategy: A Decision−Focused Approach, Fourth Edition
II. Opportunity Analysis 4. Identifying Attractive Markets
160 © The McGraw−Hill Companies, 2002
Chapter Four Identifying Attractive Markets 97
• Agriculture: production of more disease-resistant livestock and plants, nonpolluting biologi-cal pesticides and insecticides, and a solution to the crop losses from salty soil.25 Farmers arebeginning to plant commercial crops of engineered corn, cotton, soybeans, and potatoes. Thebiotech seeds are targeted at making crops resistant to popular weed killers as well as virusesand fungal diseases. The danger is that cotton-munching boll worms and other pests willdevelop resistance to the toxins produced by the engineered plants.26
Trends in Electronics/Telecommunications Electronics have played an impor-tant role in our society since the 1950s. They were first used primarily in radio and televi-sion and lately in digital watches, automatic cameras, video games, and microcomputers.Probably nothing has changed the workplace more in recent years than the personal com-puter, now numbering nearly 200 million worldwide. See Exhibit 4.6 for a description ofIntel’s new supercomputer on a chip.
Technology is also changing the nature and scope of the telecommunications industry.The changes are revolutionizing how businesses operate (banks, airlines, retail stores, andmarketing research firms), how goods and services as well as ideas are exchanged, andhow individuals learn and earn as well as interact with one another. Consumers today enjoycheck-free banking, the death of the invoice, and ticketless air travel.
These innovations are the result not only of changes in computing systems but also ofreduced costs in communicating (voice or data). For example, the cost of processing anadditional telephone call is so small it might as well be free. And distance is no longer afactor—it costs about the same to make a trans-Atlantic call as one to your next-doorneighbor.27 The major events responsible for fueling the information revolution are28
• The development of fiber-optic cables in which a single fiber can carry 30,000 messagessimultaneously. Such cables can be used by both telephone and cable operators, and they costless to develop and maintain than copper wire systems.
• Storage devices developed to handle the increasing volume of data required to make the mod-ern corporation competitive. Information about a firm’s customers accounts for much of theincrease. Over the next several years the storage market is expected to grow an average of 98percent a year.29
• Breakthroughs leading to the use of flexible low-cost wireless transmissions, which providemobility to the user and can provide inexpensive access to homes, versus the use of fixedsystems.
• Development of low-cost multimedia chips (microprocessors).
At the dawn of the new millennium, developments in telecommunications and comput-ing have led to the rapid convergence of the telecommunications, computing, and en-tertainment industries. Music-hungry college students with personal computers nowdownload music from legal sites, such as mp3.com, and perhaps illegal ones.30 For them,
Intel’s new dream computer will break the barrier of1.6 trillion calculations per second—the previous
record was 281 thousand per second. But that’s noth-ing compared with what’s likely to happen in thefuture. By 2005 the rate of calculations per secondcould increase to 100, and possibly 500, trillion. Suchincredibly powerful machines would be especially
important in areas such as modeling the atomic make-up of new materials and their performance under avariety of conditions, biological modeling, and simu-lating the effects on humans of air and car crashes.
Source: Reprinted from Otis Port, “Speed Gets a Whole NewMeaning,” Business Week, April 29, 1996, p. 90, with special permis-sion. Copyright © 1996 by The McGraw-Hill Companies, Inc.
Exhibit 4.6 Present and Future Supercomputers
www

Walker et al.: Marketing Strategy: A Decision−Focused Approach, Fourth Edition
II. Opportunity Analysis 4. Identifying Attractive Markets
161© The McGraw−Hill Companies, 2002
Section Two Opportunity Analysis98
brick-and-mortar music stores may soon be a thing of the past. Cell phone users in Europecheck sports scores, breaking news, stock quotes, and more using wireless application pro-tocol, or WAP.31 Savvy marketers and entrepreneurs who follow technological trends areable to foresee new and previously unheard of applications such as these and thereby placethemselves and their firms at the forefront of the innovation curve, sometimes earningentrepreneurial fortunes in the process.
Implications of Technological Trends for Market Attractiveness Changesin technology have always created attractive new markets. Think of all the markets createdor made more attractive by Henry Ford’s invention of the automobile. Such changes alsohave swept away old ones, such as the market for buggy whips. Today’s venture capitalinvestors monitor such changes, and many seek to invest their funds to serve markets thatare growing exponentially as a result of technological developments, such as providingservices for e-commerce firms. Some would say that choosing attractive markets or indus-tries for investment is one of the most important criteria for venture capital success.32
In addition to creating attractive new markets, technological developments are having aprofound impact on all aspects of marketing practice, including marketing communication(ads on the Web or via e-mail), distribution (books and other consumer and industrialgoods bought and sold via the Web), packaging (use of new materials), and marketingresearch (monitoring supermarket purchases with scanners or Internet activity with digital“cookies”). We explore the most important of these changes in later chapters in this book.
The Physical EnvironmentBeyond the depletion of many of the earth’s valuable resources, there are indications thatthe earth’s overall health is declining. Deserts are growing while forests are shrinking,lakes are dying, the quality and quantity of groundwater are declining, and the planet maybe experiencing a rising temperature.
One of the more frightening environmental scenarios concerns the buildup of carbondioxide in the atmosphere that has resulted from heavy use of fossil fuels. This carbondioxide “blanket” traps the sun’s radiation, which leads to an increase in the earth’s aver-age temperature. One computer model of the climate predicts a cooling of Europe; Africa,East Asia, and South America warming a lot; and less rain in East Asia, Southern Africa,most of South America, Mexico, and parts of the United States. While the evidence isincreasing that greenhouse gases are changing the climate, there is considerable disagree-ment over the details of the warming effects. Still, various concerned groups (includinginsurance companies) are demanding that governments take strong remedial action.33
Among other undesirable eventualities, the greenhouse effect might trigger the infectionof nontropical populations with such diseases as malaria, hepatitis, yellow fever, cholera,and meningitis.34
Worldwide, there are inadequate supplies of municipal water, which has forced Euro-pean cities to use tertiary sewage treatments to purify water for household use. Californiahas recently begun to use reclaimed sewage water for parks, golf courses, and roadsidelandscaping, but not for drinking.35 Poor water quality causes Americans to spend $7 bil-lion annually for bottled water and for tap-water purification. Americans drink three timesas much bottled water as they did a decade ago.36
Pollution problems exist throughout the world, especially in Eastern Europe, China, andthe developing countries. Germany is spending tens of billions of dollars to clean up east-ern Germany, where under communist rule forests were blighted, drinking water badlypolluted, and the air fouled such that motorists were forced to use their headlights during
www

Walker et al.: Marketing Strategy: A Decision−Focused Approach, Fourth Edition
II. Opportunity Analysis 4. Identifying Attractive Markets
162 © The McGraw−Hill Companies, 2002
Chapter Four Identifying Attractive Markets 99
the day. China is the world’s worst polluter, dumping billions of tons of industrial pol-lutants into waterways and hundreds of millions of tons of carbon emissions into theatmosphere. It is encouraging to note that pollution regulations are becoming stricterthroughout the world, including China, where authorities are considering making seriouspollution punishable by death.37 And recycling programs are increasing in popularitythroughout the world.38
Development of Green Products as a Response to Environmental ProblemsIn general, discussion of the problems in the physical environment has stressed the threats andpenalties facing business throughout the world. But business can do a number of things to turnproblems into opportunities. One is to invest in research to find ways to save energy in heat-ing and lighting. Another is to find new energy sources such as low-cost wind farms andhydroelectric projects. Businesses also have seen opportunities in developing hundreds ofgreen products (those that are environmentally friendly) such as phosphate-free detergents,recycled motor oil, tuna caught without netting dolphins, organic fertilizers, high-efficiencylight bulbs, recycled paper, and men’s and women’s casual clothes made from 100 percentorganic cotton and colored with nontoxic dyes.39 Other innovations include using smallerpackages for many consumer goods (such as compact containers for superconcentrated soapsand collapsible pouches for cleaners once packed in plastic jugs), discontinuing the use ofcardboard packages for deodorants, and selling teabags without tags and strings.40 For thepublic, prices of eco (green) products are in line with ordinary products, especially when thequantity offered (tissues per roll of toilet tissue and loads of laundry per liter of concentrateddetergent) is considered.41
Implications of Trends in the Physical Environment for Market Attractive-ness Global warming can create attractive opportunities for green products that areearth-friendly. On the other hand, if global warming continues, it may play havoc with mar-kets for winter vacationers, snowmobiles, and other products and services whose demanddepends on the reliable coming of Old Man Winter. Other physical trends such as the deple-tion of natural resources and fresh groundwater may significantly impact firms in manyindustries serving a vast array of markets. Tracking such trends and understanding theireffects are important tasks.
Environmental Analysis Guides
Marketing Decision Making
Macro trends can have powerful influence on the attractiveness of markets, as well as onmarketing practice. What should managers charged with strategic responsibilities do totake advantage of or cope with such trends? First, they need to prioritize trend categories,so they know what to watch for. Second, they need to identify, and then monitor, sourcesof relevant information about macro trends. Third, as key developments are noted, theyneed to anticipate impacts and be prepared to change strategies if necessary.
Prioritizing Trend CategoriesApparel marketers closely watch sociocultural trends so as to provide garments in tune withtoday’s changing lifestyles. For example, specialized undergarments for female athleteshave become a growing market, as more and more women participate in athletic pursuits.To the delight of sports apparel marketers like Nike, Brandi Chastain’s shirtless torso andsports bra won front-page and front-cover positions in numerous publications following her
Walker et al.: Marketing Strategy: A Decision−Focused Approach, Fourth Edition
II. Opportunity Analysis 4. Identifying Attractive Markets
163© The McGraw−Hill Companies, 2002
Section Two Opportunity Analysis100
successful penalty kick that won for the United States the coveted World Cup women’s soc-cer title in 1999.
Real estate investors closely monitor economic trends, because changes in interest ratesor income can dramatically impact demand for both commercial and residential properties.Venture capitalists and high-tech entrepreneurs watch technological trends. Food mar-
keters study demographic and sociocultural trends to provide new foodproducts that fit modern lifestyles and satisfy rapidly growing demandfor ethnic foods. The list goes on and on. What’s important is for busi-nesspeople to understand which macro trend categories are likely tohave the most impact on their fortunes and monitor those categoriesaccordingly. Similarly, managers need to monitor changes in ethical
standards and expectations, so they do not run afoul of their customers’ expectations. Ethical Perspective 4.1 discusses ethical issues that have arisen in this arena.
Information Sources and Outputs of MacroTrend AnalysisThere is an endless supply of information about macro trends, including the popular andbusiness press, the Internet, supplier and customer contacts, and so on. Thus, gathering rel-evant data is not difficult, but it does take time and effort. A good place to start is with tradeassociations and trade magazines, both of which typically track and report on trends rele-vant to the industries they serve. Most local, state, and federal governments provide demo-graphic data easily accessible at their websites, such as www.census.gov in the UnitedStates. Government sources and the business press are good places to look for economic
Strategic Issue
What’s important is for businesspeople tounderstand which macro trend categoriesare likely to have the most impact on theirfortunes and monitor those categoriesaccordingly.
Ethical Perspective 4.1
Ethical Issues in Macro Trend Analysis
Because there are myriad ways in which business andthe environment interact, it is not surprising that firmsfind it difficult to cope with environmental issues.More and more companies, however, are taking anactive role in dealing with the environmental issuesthat face society today, not only making sure they arein compliance with environmental regulations, butalso taking a strong proenvironmental stance thatincludes abandoning products that are environmen-tally harmful.
Most companies make an effort to develop aproenvironment attitude among their employees,customers, and the general public—a substantialmajority have ethical codes of behavior to guide theiremployees regarding the environment. Many supportgreen organizations such as the National WildlifeFederation, the Sierra Club, and the EnvironmentalDefense Fund. Since the public demands it, more andmore resource conservation and recycling receive
considerable support from many members of thebusiness community. McDonald’s, for example, hasswitched from plastic and styrofoam packaging tocardboard and paper.
Another ethical problem area lies in treatment ofthird world countries. Concern for such countries hasa long history; witness the campaigns against SouthAfrica’s apartheid and, more recently, for civil rightsin China. U.S. companies have come under severecriticism for contracting with suppliers that use childlabor or that provide unhealthy working environ-ments and for charging high prices in third worldcountries for goods such as pharmaceutical drugs.
Dealing with environmental problems can seemintractable because of difficulty in defining their sever-ity (e.g., the greenhouse effect), let alone knowinghow to solve them (replenishing underground watersupplies). When we think we have found a solution,we are not sure of its long-term versus short-termeffects and the extent to which the solution may bedysfunctional. In some areas, however, the picture isclearer, and a positive response may even be goodbusiness.
E
www

Walker et al.: Marketing Strategy: A Decision−Focused Approach, Fourth Edition
II. Opportunity Analysis 4. Identifying Attractive Markets
164 © The McGraw−Hill Companies, 2002
Chapter Four Identifying Attractive Markets 101
trend data. Various books, such as one called Find It Fast, provide guidance on where tolook online and offline for various kinds of such information.42
The key outputs of a competent macro trend analysis for any market should includeboth quantitative and qualitative data. Quantitative data should provide evidence of themarket’s size and growth rate, for the overall market as well as for key segments. Qualita-tive data should include factors that will likely influence these figures in the future,whether favorably or unfavorably.
Anticipating and Responding to Environmental ChangeCritical changes in macroenvironmental conditions often call for changes in the firm’sstrategy. Such changes can be proactive or reactive, or both. To the extent that a firm iden-tifies and effectively deals with key trends before its competitors do, it is more likely towin and retain competitive advantage. In any case, management needs systems to helpidentify, evaluate, and respond to environmental events that may affect the firm’s longer-term profitability and position. One such approach uses an opportunity/threat matrix tobetter assess the impact and the timing of an event, followed by the development of anappropriate response strategy. This approach is discussed below.
Impact and Timing of Event In any given period, many environmental events thatcould have an impact on the firm—either positively or negatively—may be detected.Somehow, management must determine the probability of their occurrence and the degreeof impact (profitability and/or market share) of each event. One relatively simple way toaccomplish these tasks is to use a 2 × 2 dimensional opportunity/threat matrix such asthat shown in Exhibit 4.7. This example contains four potential environmental events thata large U.S. telecommunications company might have identified as worthy of concern inthe early 2000s. The probability of each occurring by the year 2010 was rated as was theimpact on the company in terms of profitability or market share. The event likely both tooccur by 2010 and to have the greatest impact appears in the upper left-hand box. At the
Exhibit 4.7Opportunity/Threat Matrix for a Telecommunications Company
*Profits or market share or both.
High
Level of Impacton Company* High
�
�������� ������ ���� ��������� ���� ��� �� ����� ����� �� ����� ��� ������ ������������ �
���������� ���� ������� ��� �� � ����� ��� ��������� �� ��� ��� � ��� �� �� � � ���������� ��� ��
��� ������ �� ������������ ����� �������� ���� ��� �� �! �� � ���� �� ������ �� "# ������ ����� �� ���������
��������� �������� ���� ����� �� �� ������ ����� �� �� ��������� ���� ���� �� �� ������ �� ����� ��� �� ��������� ���� ��� ���
$�
%�
��
��
Probability of Occurrence (2010)
%
$
�
Low
Low

Walker et al.: Marketing Strategy: A Decision−Focused Approach, Fourth Edition
II. Opportunity Analysis 4. Identifying Attractive Markets
165© The McGraw−Hill Companies, 2002
Section Two Opportunity Analysis102
very least, such an event should be examined closely, including estimating with as muchprecision as possible its impact on profitability and market share.
The opportunity/threat matrix enables the examination of a large number of events insuch a way that management can focus on the most important ones. Thus, events such asnumber 4 in the exhibit with a high probability of occurring and having a high impactshould be closely monitored. Those with a low probability of occurrence and low impact,such as number 3 in the exhibit, should probably be dropped, at least for the moment.Events with a low probability/high impact (number 1) should be reexamined less fre-quently to determine whether the impact rating remains basically sound.
Take Aways
• Trends can and often will profoundly influence thesuccess of any business. Serving attractive markets,where trends are favorable—swimming with the cur-rent—is likely to yield more success than servingthose where trends are unfavorable—swimmingagainst the current. Thus, context, the second of the 4Cs, matters and is central to the assessment of anyopportunity.
• Taken together, the six macro trend categories constitutea useful analytical framework to ensure that all basesare covered when scanning environmental conditions.
• Paying regular and systematic attention to the highestpriority macro trend categories permits timely decisionmaking, perhaps ahead of competitors.
• Gathering hard data on macro trends is not difficult.Trade associations and trade magazines provide agood place to start.
• Self-diagnostic questions to test your ability to applythe analytical tools and concepts in this chapter tomarketing decision making may be found at thisbook’s website at www.mhhe.com/walker.
1. This section on the changing men’s apparel market is based on informationfound in Lisa Munoz, “The Suit Is Back—or Is It?” Fortune, June 25, 2001,p. 202; AnnMarie Dodd, “Clothing Consultation Addresses the Variable DressCode,” DNR, April 7, 2000, p. 16; Melanie Kletter, “Tough 4th Quarter forThree Men’s Merchants,” DNR, March 19, 1999, p. FC; Jean Palmieri,“George Zimmer Is Gradually Zeroing in on $10B for Men’s Wearhouse,”DNR, June 23, 1999, p. 24; Vicki M. Young, “Edison Bros. to Liquidate Rig-gins, JeansWest,” DNR, April 26, 1999, p. A1; and the 1999 annual reports ofHartmarx Corp. and The Men’s Wearhouse, Inc.
2. Review of Population Trends, Policies, and Programs: Monitoring of WorldPopulation Trends and Policies (New York: United Nations, January 1996),table 9. The data contained in the remainder of this section are based largelyon the contents of this report.
3. Ibid.
4. This section is based on data contained in the following: Kevin E. Dear-dorff and Patricia Montgomery, National Population Trends (Washington,DC: U.S. Census Bureau, June 1996); Carl Haub, “Global and U.S. NationalPopulation Trends,” Consequences (1995), funded by NOAA, NASA, andNSF, produced by Saginaw Valley State University, Michigan 48710; CherylRussell, “The Baby Boom Turns 50,” American Demographics, December1995, p. 22; and Cyndee Miller, “Boomers Come of Old Age,” AmericanDemographics, January 15, 1996, p. 1. For an interesting discussion on U.S.teenagers as a market, see Peter Zollo, “Talking to Teens,” American Demo-graphics, November 1995, p. 22.
5. For a closer look at the implications of America’s graying population, seeKen Dychtwald, The Age Wave (New York: Bantam Books, 1990), and KenDychtwald, Age Power (New York: J. P. Tarcher, 1999).
6. Early research on this group reported their behavior as being strange andunexplainable and hence the name “Generation X,” which derived from a
novel of that name written by Douglas Copeland (New York: St. Martin’sPress, 1991). Subsequent research reveals this stereotype to be highly inac-curate in describing this generation’s values and beliefs.
7. Material summarized in this section comes from “A Trend Analysis Reporton Youth,” Nachus Ov Realities, no. 1 (New York: BKG Young, n.d.);Chiat/Day, “Notes from the Emerging Media Frontier,” Fame and Flame,January 6, 1994; “The New Femininity,” Mademoiselle, Spring 1994; KarenRitchie, “Marketing to Generation X,” American Demographics, April 1995,p. 34; Karen Cooperman, “Marketing to Generation X—A Special Report,”Advertising Age, February 6, 1994, p. 27; John Naisbitt’s Trendletter 14, no.9 (April 27, 1995); and Diedre R. Schwieslow, “Sixties Legacy: This Mon-strous Bureaucracy,” USA Today, July 26, 1995, p. 1.
8. See Chip Walker, “The Global Middle Class,” American Demographics,September 1995, p. 40.
9. Ibid.
10. U.S. Trade Outlook (Columbus, OH: Trade Point USA, 1995). Also see“Economic Growth: The Poor and the Rich,” The Economist, May 25, 1996.
11. Christopher Farrell, Michael J. Mandel, and Joseph Weber, “RidingHigh,” Business Week, October 9, 1995, p. 134.
12. “The Future of Spending,” American Demographics, January 1995, p. 12.
13. John Cassidy, “Who Killed the Middle Class?” New Yorker, October 16,1995, p. 113.
14. Amy Barrett, “It’s a Small (Business) World,” Business Week, April 17,1995, p. 96.
15. Bill Montague, “China Deal Unlikely to Halt Piracy,” USA Today, June18, 1996, p. A1.
16. John Carey and Mary Beth Regan, “Are Regs Bleeding the Economy,”Business Week, June 17, 1995, p. 75. Also, see Michael E. Porter and Clas Van
Endnotes

Walker et al.: Marketing Strategy: A Decision−Focused Approach, Fourth Edition
II. Opportunity Analysis 4. Identifying Attractive Markets
166 © The McGraw−Hill Companies, 2002
Chapter Four Identifying Attractive Markets 103
der Linde, “Green and Competitive,” Harvard Business Review, September–October 1995, p. 123. American companies have long insisted they wereoverregulated. For a discussion of why this may not be true—at least as far asGermany and Japan are concerned—see “To All U.S. Managers Upset byRegulations: Try Germany or Japan,” The Wall Street Journal, December 14,1995, p. A5.
17. Peter R. Dickson, Marketing Management (Ft. Worth, TX: The DrydenPress, 1994), p. 92.
18. Joel A. Bleeke, “Strategic Choices for Newly Opened Markets,” HarvardBusiness Review, September–October 1990, p. 163.
19. N. Gregory Mankiw, “D.C., Stay Out of the Economy,” Fortune, May 15,2000, p. 70.
20. These were among the top technologies in importance ranked by scien-tists at a leading research institute. Others include those concerned with high-density energy sources (fuel cells), miniaturization (supercomputer that fits ina pocket), antiaging products (making the process less traumatic), and sensorsthat can detect diseases at an early stage (lung cancer from breath measure-ments). See Douglas E. Olesen, “The Top Technologies for the Next 10Years,” The Futurist, September–October 1995, p. 9.
21. John Carey, Joan O. C. Hamilton, Julia Flynn, and Geoffery South, “TheGene Kings,” Business Week, May 8, 1995, p. 72.
22. For a discussion of the validity of the hype that surrounds gene therapy,see “A Triumph of Hype over Experience,” The Economist, December 16,1995, p. 77.
23. Laura Johnannes, “Scientists Clone Gene Said to Be Curb on Weight,”The Wall Street Journal, December 29, 1995, p. B6.
24. “Sowing Cells, Growing Organs,” The Economist, January 6, 1996, p. 65.
25. “A Sweeter Life for Crops in Salty Soil,” Business Week, January 15,1996, p. 90.
26. Rhonda L. Rundle, “Bright Future Is Predicted for Pest-Resistant Seeds,”The Wall Street Journal, August 31, 1995, p. B4.
27. “The Death of Distance,” The Economist, September 30, 1995, p. 5; andBill Gates, The Road Ahead (New York: Viking Penguin, 1995), p. 6.
28. “Death of Distance”; and Gates, Road Ahead.
29. Audrey Choi, “Storage Devices Take Spotlight in Computer Industry,”The Wall Street Journal, April 22, 1996, p. B4.
30. Alex Salkever, “Ultimate Jukebox: The ABC’s of MP3,” Business Week,June 5, 2000, p. 135.
31. “Room to Roam,” Fortune Technology Guide, Summer 2000, p. 174.
32. Bob Zider, “How Venture Capital Works,” Harvard Business Review,November–December 1998, p. 133.
33. “Science and Technology: Reading the Patterns,” The Economist, April 1,1995, p. 65.
34. George F. Sanderson, “Climate Change: The Threat to Human Health,”The Futurist, March–April 1992, p. 34.
35. “California Water—Want Some More?” The Economist, October 8, 1994,p. 30.
36. Carole R. Hedder, “Water Works,” American Demographics, January1996, p. 46.
37. Jane H. Lii, “Boom at a Glance,” New York Times Magazine, February 18,1995, p. 27.
38. In some countries, voluntary recycling programs have been so successfulthat systems cannot keep up with the supply. See “Austria Has RecyclingProblems,” Business Europe, March 7, 1994, p. 6.
39. Pat Sloan, “Where-O-Where Can You Get ‘Green’ Garb?” AdvertisingAge, June 5, 1992, p. 3.
40. Gary Strauss, “Big Trend: Smaller Packaging,” USA Today, April 1, 1993,p. B1.
41. Kristen Clark, “The Frugal Environmentalist,” The Environmental Maga-zine, May–June 1994. For a discussion of how concern for the environmenthas affected exporting products to Europe, see Kristen Bergstrom, “The Eco-Label and Exporting to Europe,” Business America, November 29, 1993,p. 21.
42. Robert I. Berkman, Find It Fast, 4th ed. (New York: HarperPerennial,1997).
Walker et al.: Marketing Strategy: A Decision−Focused Approach, Fourth Edition
II. Opportunity Analysis 5. Industry Analysis and Competitive Advantage
167© The McGraw−Hill Companies, 2002
104
Chapter Five
INDUSTRY ANALYSIS
AND COMPETITIVE ADVANTAGE
The Cellular Telephone Business: Increasing Competition in a Growing Market1
From London to Tokyo to Chicago, cell phoneshave become a “Can’t do without it” tool oftime-pressed businesspeople, hip teenagers,
and just about anyone else who wants to stay intouch. There is little doubt that the market formobile telephone service is growing rapidly. In 1983,when the first cellular phone system began opera-tions, it was projected that by 2000, less than onemillion people would subscribe. As a result of dra-matic growth among both business and householdusers, however, the number of cell phone users hasreached more than 100 million worldwide! In Fin-land, the world’s most cell-phone-crazy country, cellphone penetration has passed 70 percent; in SouthKorea and Hong Kong, 60 percent.
The market for mobile telephony is served bytwo principal industries: cell phone manufacturersand cell phone service providers. How attractiveare these apparently booming industries?
Cell Phone Manufacturing
Rapid-fire technological advances from Qualcomm,Ericsson, Nokia, and others have brought countlessnew features to the market, including software toaccess the World Wide Web. In Europe, new phones
enable mobile users to check the weather forecast,their e-mail, stock quotes, and more. Finland’s Nokiahas rocketed to world leadership in cell phones,leaving early and longtime leader Motorola in thedust. From year to year, though, market share figuresfor leading cell phone manufacturers can double orbe halved, depending on whose latest technologycatches the fancy of users. To investors’ joy or dis-may, stock prices follow suit. Qualcomm’s sharessoared 2,600 percent in 1999, only to fall back bymore than 60 percent by mid 2000. Nokia, too, sawits share price tumble in 2001.
This recent history in the hotly competitive cellphone manufacturing industry suggests that a rap-idly growing market does not necessarily providea smooth path to success. Growing markets areone thing, but turbulent industries serving thosemarkets are quite another.
Cell Phone Service
Providers
Industry conditions for service providers have runwild as well. The race to win global coverage hasled to mergers of large players, such as Europe’s

Walker et al.: Marketing Strategy: A Decision−Focused Approach, Fourth Edition
II. Opportunity Analysis 5. Industry Analysis and Competitive Advantage
168 © The McGraw−Hill Companies, 2002
105
Vodaphone with America’s AirTouch, in 1999. Voda-phone did not stop there, however, going on toacquire Germany’s Mannesmann in 2000. Othermarketers with well-known brands also havejumped into the fray. Richard Branson’s VirginGroup bought idle capacity from a British also-ranand launched Virgin Telecom, picking up 150,000customers in his first six weeks. All over Europe,where cell phone penetration is far higher than inthe United States, market-by-market battles formarket share are raging. Prices for cell phone serv-ice have slid, given the competitive pressures. Tomake matters worse, the cost of obtaining new gov-ernment licenses to support new third-generation
(3G) services has skyrocketed. Britain’s auction inearly 2000 of 3G licenses wound up raising some$35 billion in license fees, roughly 10 times whatwas expected. Other European governments havetaken notice. Thus, the rapidly growing market forcell phone service has attracted so much interestfrom competing firms and some governmentseager to get their hands on a share of the moneythat the long-term future profitability of the indus-try has been put into question. By 2001, the resultwas a severely depressed market for the shares of wireless providers and other telecom companiesas well.
Strategic Challenges Addressed
in Chapter 5
As the examples of the cellular phone manufacturing and service industries show, servinga growing market hardly guarantees smooth sailing. Equally or more important are indus-try conditions and the degree to which specific players in the industry can establish andsustain competitive advantage. Thus, as entrepreneurs and marketing decision makers pon-der an opportunity to enter or attempt to increase their share of a growing market like thatfor mobile phones, they also must carefully examine a host of other issues, including theconditions that are currently prevailing in the industry in which they would compete andthe likelihood that favorable conditions will prevail in the future.
In this chapter, we provide analytical frameworks to enable prospective entrepreneursand marketing strategists in established firms to address four critical questions pertinent tosuch an examination: How can we assess the attractiveness of an industry? If we aim tocompete on the basis of innovation, how can we determine how quickly our innovation islikely to win market acceptance? What does the overall attractiveness of the market andindustry context imply for chances for future success? Finally, how can we establish andthen sustain competitive advantage over the duration of our product’s life cycle? First,however, we clarify the difference between two oft-confused terms: market and industry.
Markets and Industries:
What’s the Difference?
In Chapter 1, we defined a market as being comprised of individuals and organizationswho are interested and willing to buy a good or service to obtain benefits that will satisfya particular need or want and who have the resources to engage in such a transaction. Onesuch market consists of college students who get hungry in the middle of the afternoon andhave a few minutes and enough spare change to buy a snack between classes.

Walker et al.: Marketing Strategy: A Decision−Focused Approach, Fourth Edition
II. Opportunity Analysis 5. Industry Analysis and Competitive Advantage
169© The McGraw−Hill Companies, 2002
Section Two Opportunity Analysis106
An industry is a group of firms that offer a product or class of products that are similarand are close substitutes for one another. What industries serve the student snack market?At the producer level, there are the salty snack industry (makers of potato and corn chipsand similar products); the candy industry; the fresh produce industry (growers of apples,oranges, bananas, and other easy-to-eat fruits); and others too numerous to mention. Dis-tribution channels for these products include the supermarket industry, the food serviceindustry, the coin-operated vending industry, and so on. Clearly, these industries are dif-ferent and offer varying bundles of benefits to hungry students.
The distinction between markets and industries is an important one. Sellers who lookonly to others in their own industry as competitors are likely to overlook other very real
rivals and risk having their markets undercut by innovators from otherindustries. Should Kodak be more concerned with Fuji, Agfa, and otherlongtime players in the film and photoprocessing industries, or should itbe worrying about Hewlett-Packard, Sony, and others whose digitaltechnologies may make photography’s century-old silver halide chem-istry go the way of the buggy whip? Only time will tell.
Defining Markets and Industries: Levels of AnalysisAssessing the attractiveness of markets and industries requires clarity about which con-sumers and which of their needs or which sellers of which products are to be included inthe assessment. Confusion between market and industry can result since consumer needsare often thought of in product terms—“I’m hungry. I need a candy bar.”—in the same waythat industries are typically described by the products they sell. Thus, markets are oftendefined both in demographic and/or geographic terms (who and/or where the customersare) and in terms of a particular good or service demanded by the consumer, expressed atthe industry, product class, or product type level.
Challenges in Market and Industry DefinitionMarkets and industries can be defined at several levels of analysis: industry, productclass, and product type are most common. The level chosen for a particular analysis canhave important implications for strategic and marketing planning. Defining a market orindustry at too broad a level can cause the analyst to overlook important market–industryinteractions in a particular market segment or for a particular product class or type. Butdefining the market or industry too narrowly can cause the analyst to miss potentiallyimportant competitive developments.
The problem with using the industry level is that it typically includes an array of non-competing products. For example, within the automotive market, is a Toyota Echo in com-petition with a BMW or a Mack truck? Within chemical markets, do polymers thatsubstitute for natural materials compete with gasoline additives, dyestuffs, and industrialcoatings? Probably not. For an entrepreneur seeking to market a new chemical compoundthat enhances the depth of color when cotton yarns are dyed, understanding the state ofthe overall chemical industry is probably less important than understanding dyestuffscompetitors.
Using product class as one’s level of analysis suffers from this same type of problem since the products involved may serve diverse markets or market segments. Themore generic the definition of a product class, the higher the aggregation level of products(for instance, all cars versus sport utility vehicles) and the more stable is market demand,
Strategic Issue
The distinction between markets and indus-tries is an important one. Sellers who lookonly to others in their own industry as com-petitors are likely to overlook other veryreal rivals.

Walker et al.: Marketing Strategy: A Decision−Focused Approach, Fourth Edition
II. Opportunity Analysis 5. Industry Analysis and Competitive Advantage
170 © The McGraw−Hill Companies, 2002
Chapter Five Industry Analysis and Competitive Advantage 107
as well as the product life cycle curve, a concept we explore later in this chapter. Thus,basic needs for automobiles (at least, in developed countries) typically change slowly,though demand patterns for SUVs or pickup trucks or compact cars may be more volatile.The more generically the product class is defined, the less useful it is for strategic planning, which seeks to identify opportunities and threats for specific product-marketrelationships.
Product types are subsets of a product class and contain items that are technically sim-ilar, although they may vary in such aspects as appearance and price. In the case of cere-als, for example, the product types could be defined as hot or cold cereals. Hot cerealswould include at least two subtypes: regular and instant. Cold cereals would include reg-ular, presweetened, natural, and fortified. Regular could be broken down into such cate-gories as corn flakes, raisin brans, and shredded wheat. Other examples of producthierarchies abound, especially when different processing technologies are involved—frozen, canned, fresh, dehydrated, and freeze-dried fruits and vegetables, for example.Most marketers select product type as their level of analysis for marketing planningbecause, while products within a product type may serve different subsets of needs, theyare typically close substitutes for one another. The product-type level of aggregation isconsiderably more sensitive than the other levels to environmental changes—such as thosedriven by macro trends, as discussed in Chapter 4—that create opportunities or threats forindividual product-market entries. The danger in restricting one’s market and competitiveanalysis to a particular product type is that other product types, such as bagels or a tripthrough the drive-through at McDonald’s in the breakfast market, may be overlooked.Focusing on the true consumer need (i.e., a fast breakfast, rather than cereal, a product)can help avoid this problem.
Doing so appears to be uncommon, however. A recent study found that managerstended to rely on supply-based attributes (i.e., what companies sell) in identifying com-petitors, rather than demand- or customer need-based attributes (i.e., what customersneed).2 Further, managers tend to identify too few firms as competitors and are especiallylikely to omit new firms or potential competitors. Stories of experienced managers who“know their business” and are surprised by the sudden emergence of a new competitor thatoperates in a different way are legion.3 For an example of how firms create new marketspace not bound by old industry definitions, see Exhibit 5.1.
W. Chan Kim and Reneé Mauborgne argue that oneway to avoid cutthroat, head-to-head competi-
tion, in rapidly growing markets as well as those thatare flat or growing slowly, is to find new “marketspace,” as they call it, that defies conventional bound-aries of industry competition. By looking across sub-stitute industries or to complementary product andservice offerings that go beyond what an industry hastraditionally offered, companies can rethink the func-tional and emotional orientation of their industry andhelp shape industry trends to their own advantage.Cisco Systems created new market space in this way
when it recognized that the doubling of the number ofInternet users every 100 days was creating demand forhigh-speed data exchange that was not being ade-quately served by existing industries. Today, more than80 percent of all traffic on the Internet flows throughCisco’s routers, switches, and other network devices,on which Cisco earns margins in the 60 percent range.Creating new market space can be attractive, indeed!
Source: W. Chan Kim and Reneé Mauborgne, “Creating New Mar-ket Space,” Harvard Business Review, January–February 1999,pp. 83–93.
Exhibit 5.1 Creating New Market Space

Walker et al.: Marketing Strategy: A Decision−Focused Approach, Fourth Edition
II. Opportunity Analysis 5. Industry Analysis and Competitive Advantage
171© The McGraw−Hill Companies, 2002
Section Two Opportunity Analysis108
The Market Is Attractive:
What About the Industry?
As consumers and businesspeople have become hooked on cell phones, the market formobile communication has grown rapidly. By most measures, this is a large, growing, andattractive market. But are cell phone manufacturing and cellular services attractive indus-tries? An industry’s attractiveness at a point in time can best be judged by analyzing itsdriving forces, its critical success factors and the degree to which a management team canperform on these factors, and especially the five major competitive forces: rivalry amongpresent competitors, potential competitors, the bargaining power of suppliers, the bargain-ing power of buyers, and the threat of substitute products.
Driving ForcesJust as macroenvironmental trends are important in shaping market attractiveness, so, too,are they important in shaping the attractiveness of industries. Michael Porter calls thesetrends driving forces.4 These include (1) changes in the industry’s long-term growth rate,which directly affect investment decisions and intensity of competition; (2) changes in keybuyer segments, which affect demand and strategic marketing programs; (3) diffusion ofproprietary knowledge, which controls both the rate at which products become more alikeand the entry of new firms; (4) changes in cost and efficiency, derived from scale and learn-ing effects, which have the potential of making entry more difficult; and (5) changes ingovernment regulations, which can affect entry, costs, bases of competition, and prof-itability. Collecting and examining trend data in each of these areas helps an entrepreneuror marketer determine whether an industry is sufficiently attractive to enter or remain inand helps shape strategic marketing decisions that enable the firm to compete effectively.The profusion of data now available on the Internet has made the gathering of these datamuch easier than was true several years ago.
Porter’s Five Competitive Forces5
Five interactive competitive forces collectively determine an industry’s long-term attrac-tiveness: present competitors, potential competitors, the bargaining power of suppliers, thebargaining power of buyers, and the threat of substitute products (see Exhibit 5.2). This
mix of forces explains why some industries are consistently more prof-itable than others and provides further insights into which resources arerequired and which strategies should be adopted to be successful.
The strength of the individual forces varies from industry to industryand, over time, within the same industry. In the fast-food industry the key forces are present competitors (for example, Wendy’s versusBurger King versus McDonald’s), substitute products (neighborhood
delis, salad bars, all-you-can-eat buffet restaurants, and frozen meals), and buyers who areconcerned about health and nutrition and who see fast foods as a symbol of a throw-awaysociety.
Rivalry among Present Competitors Rivalry occurs among firms that produceproducts that are close substitutes for each other, especially when one competitor acts toimprove its standing or protect its position. Thus, firms are mutually dependent: What onefirm does affects others, and vice versa. Ordinarily, profitability decreases as rivalryincreases. Rivalry is greater under the following conditions:
Strategic Issue
Five interactive competitive forces collec-tively determine an industry’s long-termattractiveness: present competitors, poten-tial competitors, the bargaining power ofsuppliers, the bargaining power of buyers,and substitute products.

Walker et al.: Marketing Strategy: A Decision−Focused Approach, Fourth Edition
II. Opportunity Analysis 5. Industry Analysis and Competitive Advantage
172 © The McGraw−Hill Companies, 2002
Chapter Five Industry Analysis and Competitive Advantage 109
• There is high investment intensity; that is, the amount of fixed and working capital required toproduce a dollar of sales is large. High intensity requires firms to operate at or near capacityas much as possible, thereby putting strong downward pressure on prices when demand slack-ens. Thus, high investment–intensity businesses are, on average, much less profitable thanthose with a lower level of investment. Bob Crandall, the CEO of American Airlines, oncedescribed the airline business as being “intensely, vigorously, bitterly, savagely competitive.”6
• There are many small firms in an industry or no dominant firms exist. In recent years, hundredsof pharmaceutical companies have started up, all hoping to produce new wonder drugs. In suchcrowded segments as neurosciences, inflammatory diseases, and drug delivery, competition iskeen, and some companies are considering preemptive steps in an effort to dominate their niches.7
• There is little product differentiation—for example, major appliances, TV sets, and passenger-car tires.
• There is a high cost to changing suppliers (switching costs) as would be the case in chang-ing a major computer software system.8
The greater the competitive rivalry in an industry, the less attractive it is to current play-ers or would-be entrants. Though the cellular service industry is capital intensive, there areseveral dominant firms whose products are differentiated through rapid technologicalchange, and switching costs to change cell phone suppliers are low. Thus, rivalry in thisindustry might be judged as moderately favorable.
Threat of New Entrants A second force affecting industry attractiveness is the threatof new entrants. New competitors add capacity to the industry and bring with them theneed to gain market share, thereby making competition more intense. The threat of newentrants, such as firms using new packet-switching technology that allows the user toalways be connected, is a very real concern to present cellular industry players.9 Thegreater the threat of new entrants, the less will be an industry’s attractiveness. Entry ismore difficult under the following conditions:
• When strong economies of scale and learning effects are present, since it takes time to obtainthe volume and learning required to yield a low relative cost per unit. If firms already pres-ent are vertically integrated, entry becomes even more expensive. Also, if the existing firmsshare their output with their related businesses, the problem of overcoming the cost disad-vantage is made even more difficult.
Exhibit 5.2The Major Forces That Determine Industry Attractiveness
Source: Reprinted by permission of Harvard Business Review. From “How Competitive Forces ShapeStrategy,” by Michael E. Porter, March–April 1979, p. 6. © 1979 Harvard Business School PublishingCorporation, all rights reserved.
���������� ����� �� ��
���������� ����� ��������
����� � �� �������
����� � ��������� ��������
������ ������������ ������� ����

Walker et al.: Marketing Strategy: A Decision−Focused Approach, Fourth Edition
II. Opportunity Analysis 5. Industry Analysis and Competitive Advantage
173© The McGraw−Hill Companies, 2002
Section Two Opportunity Analysis110
• If the industry has strong capital requirements at the outset.
• When strong product differentiation exists.
• If gaining distribution is particularly difficult.
• If a buyer incurs switching costs in moving from one supplier to another.
Bargaining Power of Suppliers The bargaining power of suppliers over firms in anindustry is the third major determinant of industry attractiveness. It is exercised largelythrough increased prices. Its impact can be significant, particularly when a limited numberof suppliers service several different industries. Their power is increased if switching costsand prices of substitutes are high and they can realistically threaten forward integration.10
Suppliers are especially important when their product is a large part of the buyer’s valueadded—as is the case with metal cans, where the cost of tin plate is over 60 percent of thevalue added. In recent years, the bargaining power of suppliers in many industries haschanged dramatically as more companies seek a partnership (just-in-time) relationshipwith their suppliers. What was once an arm’s-length adversarial relationship has turnedinto a cooperative one resulting in lower transaction costs, improved quality derived pri-marily from using a supplier’s technological skills to design and manufacture parts, anddecreased transaction time in terms of inventory replenishments.
The greater the bargaining power of the key suppliers to an industry, the less will be theoverall attractiveness of the industry. The newly discovered power that European govern-ments have begun to exert by auctioning bandwidth for new cellular services has raised thebargaining power of the suppliers of bandwidth to the cellular industry. This change hasreduced the attractiveness of this industry.
Bargaining Power of Buyers An industry’s customers constantly look for reducedprices, improved product quality, and added services and thus can affect competitionwithin an industry. Buyers play individual suppliers against one another in their efforts toobtain these and other concessions. This is certainly the case with some large retailers intheir dealings with many of their suppliers.
The extent to which buyers succeed in their bargaining efforts depends on (1) the extent ofbuyer concentration, as when a few large buyers that account for a large portion of industrysales can gain concessions; (2) switching costs that reduce the buyer’s bargaining power; (3)the threat of backward integration, thereby alleviating the need for the supplier; (4) the prod-uct’s importance to the performance of the buyer’s product—the greater the importance, thelower their bargaining power; and (5) buyer profitability—if buyers earn low profits and theproduct involved is an important part of their costs, then bargaining will be more aggressive.
The greater the power of the high-volume customers served by an industry, the lessattractive will be that industry. One attractive dimension of the cellular phone serviceindustry is that its customers have relatively little power to set terms and conditions for cel-lular phone service. Buyers are numerous and not very concentrated and their cell phonecosts are typically not of great importance or expense, relatively speaking.
Threat of Substitute Products Substitutes are alternative product types (not brands)that perform essentially the same functions, as tin versus aluminum cans, oleomargarine ver-sus butter, and the faxing of documents versus overnight express delivery. Substitute prod-ucts put a ceiling on the profitability of an industry by limiting the price that can be charged,especially when supply exceeds demand. Thus, in the metal container industry, aluminum isa substitute for tinplate and constrains the prices charged by tinplate producers (see Exhibit5.3). For cellular phone service providers, possible substitutes include personal digital assis-tants (PDAs) such as 3Com’s Palm Pilot,11 possible new multimedia devices from the likesof Sony, Matsushita, and Samsung,12 or new mobile digital products not yet imagined.

Walker et al.: Marketing Strategy: A Decision−Focused Approach, Fourth Edition
II. Opportunity Analysis 5. Industry Analysis and Competitive Advantage
174 © The McGraw−Hill Companies, 2002
Chapter Five Industry Analysis and Competitive Advantage 111
A Five Forces Analysis of the Cellular Phone Service IndustryA useful way to summarize a five forces industry analysis is to construct a chart like thatshown in Exhibit 5.4. There, we summarize one analyst’s judgment of the favorability ofthe five forces for the cellular phone service industry in the year 2001. This analysis indi-cates that, compared to earlier in the industry’s history when there were fewer players(thus, less rivalry), no threatening substitutes on the horizon, and a cozier relationship withgovernments to provide bandwidth, the industry today is probably less attractive than someindustries, for which four or five of the forces might be favorable. Thus, strategists whomust decide whether to enter or continue to invest in this industry must make a judgmentas to whether the rapid growth of the market—a favorable environmental context—is suf-ficient to offset the deteriorating attractiveness of the industry—the not-so-favorable com-petitive situation. Given this mixed outlook, strategists will no doubt consider otherfactors, including the degree to which they believe they are likely to be able to establishand sustain competitive advantage. We further develop this theme later in this chapter.
Changing Competition and Industry Evolution As we shall see later in this chapter, most products and product categories pass through aseries of stages in their life cycles: introduction, growth, shakeout, maturity, and decline.All five competitive forces just discussed are affected by the passage of time; therefore,their strength varies as the industry passes from its introductory stage to its growth stageand on to maturity, followed by decline. Competitive forces are apt to be weakest duringthe fast-growth period; thus, there are substantial opportunities for gaining market share.During the shakeout period, competitive forces are at their strongest, and many competi-tors are forced to exit the industry. During maturity, competition typically slackens, butonly if the industry leader holds a strong relative share position. An industry will experi-ence more price competition during maturity if the leader holds a weak relative share posi-tion. Kellogg and General Mills hold two-thirds of the U.S. domestic cereal market, butbecause Kellogg does not hold a dominant relative share, the industry experiences consid-erable price competition. A declining industry usually witnesses considerable rivalry, theextent of which depends on the strength of the exit barriers and the rate of decline.
Experimental aluminum cars accelerate faster, shiftgears more smoothly, and stop more quickly than a
steel car—but the latter is sturdier and safer, therebykeeping the competition between the two metals adraw. Steel, which makes up 55 percent of the weightof the average car, is feeling seriously threatened sincethe car industry is mandated to produce a more fuel-efficient vehicle (getting up to 80 miles per gallon)that meets the consumers’ needs for performance andsafety—all at a reasonable price. Aluminum has a sub-stantial weight advantage and is easier to mold. Steel,
however, is cheaper and easier to recycle as well assafer. And neither industry can afford to ignore com-petition from plastics. Given the billions of dollars atstake, small wonder that scientists, engineers, andCEOs around the world are spending tens of millionsof dollars to increase their share of the materials usedto produce a car.
Source: Erle Norton and Gabriella Stern, “Steel and Aluminum Vieover Every Ounce in a Car’s Construction,” Wall Street Journal, May 9,1995, p. A1. Copyright 1995 by Dow Jones & Co. Inc. Reproduced withpermission of Dow Jones & Co. Inc. via Copyright Clearance Center.
Exhibit 5.3 Steel versus Aluminum in the Automotive Industry

Walker et al.: Marketing Strategy: A Decision−Focused Approach, Fourth Edition
II. Opportunity Analysis 5. Industry Analysis and Competitive Advantage
175© The McGraw−Hill Companies, 2002
Section Two Opportunity Analysis112
Critical Success FactorsThe critical success factors that differentiate between the success and failure of firmswithin an industry differ from industry to industry. These factors often are concerned withone or more of the elements in the marketing mix—product (e.g., the capability to gener-ate successful new products), price (be a low-cost producer), place (obtain widespreadproduct distribution), and promotion (strong relationships with large customers). As theold saying goes in the retailing industry, only three things are critical to success: location,location, and location. Thus, location, a potentially powerful source of competitive advan-tage, often makes the difference between which retailers are successful and which are not.
Assessing the fit between an industry’s critical success factors and the presence of thosefactors in a firm or a proposed management team is a good way to assess whether an indus-try is attractive to that particular firm or management team and to determine whether thatfirm or team is likely to be attractive to investors or other suppliers of resources. Thus,before deciding whether or not to invest in a start-up, most venture capitalists want toknow whether the start-up team has the necessary competencies to be successful in theindustry it proposes to enter.
Industry Analysis Locally:
How Intense Is the Immediate
Competition?
As we have seen, assessing an industry’s driving forces and Porter’s five forces and under-standing its critical success factors are important to industry analysis. These are macro-levelissues, similar to the macro trends we examined in Chapter 4. To most firms, immediate andlocal competitive conditions are equally if not more important. Such conditions are particularly
Exhibit 5.4Five Forces Analysis of the Worldwide Cell Phone Service Industry in Late 2001
Five forces Score Rationale
Rivalry among present competitors Rivalry is low to moderate: Products are differentiated through moderately favorable new features and services; customer
switching costs are low.
Threat of new entrants Threat of new entrants is high: Rapid pace of technological changemoderately unfavorable may bring new entrants based on new
technologies: packet switching, satellites.
Supplier power Supplier power is high: Governments have raised the pricemoderately unfavorable of additional bandwidth through
auctions.
Buyer power Buyer power is low: very favorable Even large customers have little power to set terms and conditions in this oligopolistic industry.
Threat of substitutes Threat of substitutes is high: PDAs or new multimedia devices couldmoderately unfavorable replace cell phones.
Overall conclusion: Only two of the five forces are favorable, while three are unfavorable. Thus, the cellular phone service industryis not particularly attractive at this time.

Walker et al.: Marketing Strategy: A Decision−Focused Approach, Fourth Edition
II. Opportunity Analysis 5. Industry Analysis and Competitive Advantage
176 © The McGraw−Hill Companies, 2002
Chapter Five Industry Analysis and Competitive Advantage 113
salient for firms, such as retailers, that operate on a local basis. If an entrepreneur wants to opena fly-fishing shop near a blue-ribbon trout stream in Montana, he or she will be pleased that fly-fishing is on the rise, that consumers have adequate income to pursue such a sport, and thatleisure activities are becoming more important to many people. But it also matters if there arealready a couple of fly-fishing shops serving the local market, and whether those shops servetheir customers effectively. If so, the overall trends and industry conditions probably do notmatter much, for the local fly-fishing pie can be sliced only so many ways! Thus, assessing anindustry must typically be done locally, as well as more globally, and relevant informationabout specific competitors must be obtained.
In Chapter 6, we address the market knowledge systems that many firms use to gathercompetitive information, as well as other relevant market and industry data. As we shallsee, gathering this information is important, and ethical issues having to do with how com-petitive information is obtained are likely to arise. For a discussion of ethical issues ingathering information to perform competitive analyses, see Ethical Perspective 5.1.
Rate of Diffusion of Innovations:
Another Factor in Assessing
Opportunity Attractiveness
Before entrepreneurs or established marketers invest in the development and introduction of aninnovation, they should evaluate how rapidly the innovation is likely to be adopted by the target
market. The faster the adoption rate, the more attractive an innovative good orservice is to the marketer, as competitors are caught short while consumersbuild loyalty to the new product. Diffusion of innovation theory seeks toexplain the adoption of a product or service over time among a group of poten-tial buyers. Lack of awareness typically limits early adoption. As positive word
Ethical Perspective 5.1
SCIP: Setting Standards for GatheringCompetitive Intelligence
SCIP, the Society of Competitive Intelligence Profes-sionals (www.scip.org), is an organization of consult-ants and businesspeople whose job it is to monitor thecompetitive environment for their firms. Competitiveintelligence (CI) enables senior managers in companiesof all sizes to make informed decisions about every-thing from marketing, R&D, and investing tactics tolong-term business strategies. Effective CI is a continu-ous process involving the legal and ethical collectionof information, analysis that doesn’t avoid unwelcomeconclusions, and controlled dissemination of action-able intelligence to decision makers. SCIP’s code ofethics provides a useful guide for anyone charged withgathering information about competitors.
SCIP Code of Ethics for CI Professionals
To continually strive to increase the recognitionand respect of the profession.
To comply with all applicable laws, domestic andinternational.
To accurately disclose all relevant information,including one’s identity and organization, priorto all interviews.
To fully respect all requests for confidentiality ofinformation.
To avoid conflicts of interest in fulfilling one’sduties.
To provide honest and realistic recommendationsand conclusions in the execution of one’s duties.
To promote this code of ethics within one’s com-pany, with third-party contractors, and within theentire profession.
To faithfully adhere to and abide by one’s com-pany policies, objectives, and guidelines.
Source: www.scip.org. Reprinted by permission.
E
Strategic Issue
Diffusion theory is useful to managers inpredicting the likely adoption rate for newand innovative goods or services.

Walker et al.: Marketing Strategy: A Decision−Focused Approach, Fourth Edition
II. Opportunity Analysis 5. Industry Analysis and Competitive Advantage
177© The McGraw−Hill Companies, 2002
Section Two Opportunity Analysis114
about the product spreads, the product is adopted by additional consumers. Diffusion theory is use-ful to managers in predicting the likely adoption rate for new and innovative goods or services.
The Adoption ProcessThe adoption process involves the attitudinal changes experienced by individuals fromthe time they first hear about a new product, service, or idea until they adopt it. Not all indi-viduals respond alike; some tend to adopt early, some late, and some never. Thus, the mar-ket for a new product tends to be segmented over time.
The five stages in the adoption process are awareness, interest, evaluation, trial, andadoption:
1. Awareness. In this stage, the person is only aware of the existence of the new product andis insufficiently motivated to seek information about it.
2. Interest. Here the individual becomes sufficiently interested in the new product but is notyet involved.
3. Evaluation. This is sometimes referred to as the mental rehearsal stage. At this point, theindividual is mentally applying the new product to his or her own use requirements andanticipating the results.
4. Trial. Here the individual actually uses the product, but, if possible, on a limited basis tominimize risk. Trial is not tantamount to adoption; only if the use experience is satisfactorywill the product stand a chance of being adopted.
5. Adoption. In this stage, the individual not only continues to use the new product but alsoadopts it in lieu of substitutes.
The Rate of AdoptionIf plotted on a cumulative basis, the percentage of people adopting a new product over timeresembles an S curve. Although the curve tends to have the same shape regardless of theproduct involved, the length of time required differs among products—often substantially.
The time dimension is a function of the rate at which people in the target group (those ulti-mately adopting) move through the five stages in the adoption process. Generally, the speedof the adoption process depends on the following factors: (1) the risk (cost of product failureor dissatisfaction), (2) the relative advantage over other products, (3) the relative simplicity ofthe new product, (4) its compatibility with previously adopted ideas, (5) the extent to whichits trial can be accomplished on a small-scale basis, and (6) the ease with which the centralidea of the new product can be communicated.13 Some new products move quickly throughthe adoption process (a new breakfast cereal), while others take years. Risk minimization viaguarantees and reliable and prompt service is critical as is the ability to demonstrate the prod-uct’s uniqueness in meeting the customer’s needs. Source credibility is also important.
The rate at which a product passes through the adoption process is also a function of theactions taken by the product’s supplier. Thus, the diffusion process is faster when there is strongcompetition among members of the supplier group, when they have favorable reputations, andwhen they allocate substantial sums to R&D (to improve performance) and marketing (to buildawareness).14 The cellular phone industry should score high on these adoption factors.
Adopter CategoriesEarly adopters differ from later adopters. Using time of adoption as a basis for classifyingindividuals, five major groups can be distinguished: innovators, early adopters, earlymajority, late majority, and laggards. (Note that these are different from the five stages ofadoption for a given individual just discussed.) See Exhibit 5.5 for the approximate size

Walker et al.: Marketing Strategy: A Decision−Focused Approach, Fourth Edition
II. Opportunity Analysis 5. Industry Analysis and Competitive Advantage
178 © The McGraw−Hill Companies, 2002
Chapter Five Industry Analysis and Competitive Advantage 115
and characteristics of each group.15 Because each category comprises individuals whohave similar characteristics and because individuals differ substantially across categories,these adopter groups can be considered market segments. Thus, one would use a differentset of strategies to market a new product to the early adopter group than to market it to thelate majority group. For a discussion of the challenges in transitioning marketing effortsfrom group to group, see Exhibit 5.6.
The differences cited in Exhibits 5.5 and 5.6 are important because they help in thedevelopment of strategic marketing programs. In organizational markets, suppliers canidentify innovative firms by reputation, profitability, size, and the suppliers’ experiences indealing with them. As evident from earlier discussion, information alone about the prod-uct or service is not usually a sufficient reason to adopt. Commercial sources of informa-tion (such as salespeople and mass media advertising) are important at the outset, butless-commercial and more-professional sources are sought to validate the proclaimed mer-its of the new product, especially during the evaluation stage. Advice from opinion lead-ers is more critical as a legitimizing agent than as a source of information. A classic studyof how doctors reacted to the introduction of a new “miracle drug” found that only 10 per-cent adopted on the basis of data provided by their initial source of information, indicat-ing that data alone will not cause adoption.16
Thus, commercial sources are most important at the awareness stage in the adoptionprocess, while personal influence is most important at the evaluation stage. In the intereststage, both are important. In the trial stage, marketers should attempt to make it relativelyeasy for a prospect to try a product under conditions that minimize risk. Therefore, strate-gic marketing programs should accommodate the various stages in the adoption process aswell as the different adoption audiences.
Implications of Dif fusion of Innovation Theory forForecasting Sales of New Products and New FirmsOptimistic entrepreneurs or new product managers sometimes wax euphoric about theprospects for the innovations they plan to bring to market. They naively forecast that theirinnovations will capture 10 percent or 20 percent of the market in its first year. How likely
Exhibit 5.5Size and Characteristics of Individual Adopter Group
• Innovators represent the first 2.5 percent of all individuals who ultimately adopt a new product. They are moreventuresome than later adopters, more likely to be receptive to new ideas, and tend to have high incomes, which reducesthe risk of a loss arising from an early adoption.
• Early adopters represent the next 13 to 14 percent who adopt. They are more a part of the local scene, are often opinionleaders, serve as vital links to members of the early majority group (because of their social proximity), and participatemore in community organizations than do later adopters.
• The early majority includes 34 percent of those who adopt. These individuals display less leadership than early adopters,tend to be active in community affairs (thereby gaining respect from their peers), do not like to take unnecessary risks,and want to be sure that a new product will prove successful before they adopt it.
• The late majority represents another 34 percent. Frequently, these individuals adopt a new product because they areforced to do so for either economic or social reasons. They participate in community activities less than the previousgroups and only rarely assume a leadership role.
• Laggards comprise the last 16 percent of adopters. Of all the adopters, they are the most “local.” They participate less incommunity matters than members of the other groups and stubbornly resist change. In some cases, their adoption of aproduct is so late it has already been replaced by another new product.
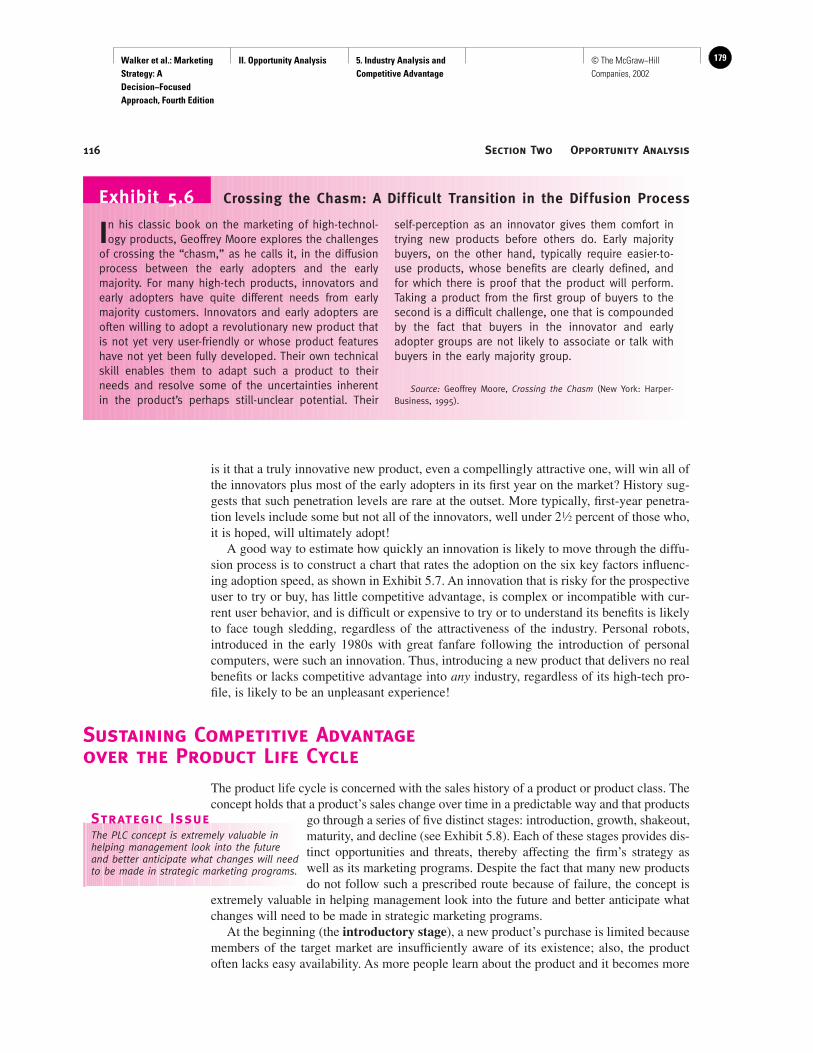
Walker et al.: Marketing Strategy: A Decision−Focused Approach, Fourth Edition
II. Opportunity Analysis 5. Industry Analysis and Competitive Advantage
179© The McGraw−Hill Companies, 2002
Section Two Opportunity Analysis116
is it that a truly innovative new product, even a compellingly attractive one, will win all ofthe innovators plus most of the early adopters in its first year on the market? History sug-gests that such penetration levels are rare at the outset. More typically, first-year penetra-tion levels include some but not all of the innovators, well under 21⁄2 percent of those who,it is hoped, will ultimately adopt!
A good way to estimate how quickly an innovation is likely to move through the diffu-sion process is to construct a chart that rates the adoption on the six key factors influenc-ing adoption speed, as shown in Exhibit 5.7. An innovation that is risky for the prospectiveuser to try or buy, has little competitive advantage, is complex or incompatible with cur-rent user behavior, and is difficult or expensive to try or to understand its benefits is likelyto face tough sledding, regardless of the attractiveness of the industry. Personal robots,introduced in the early 1980s with great fanfare following the introduction of personalcomputers, were such an innovation. Thus, introducing a new product that delivers no realbenefits or lacks competitive advantage into any industry, regardless of its high-tech pro-file, is likely to be an unpleasant experience!
Sustaining Competitive Advantage
over the Product Life Cycle
The product life cycle is concerned with the sales history of a product or product class. Theconcept holds that a product’s sales change over time in a predictable way and that products
go through a series of five distinct stages: introduction, growth, shakeout,maturity, and decline (see Exhibit 5.8). Each of these stages provides dis-tinct opportunities and threats, thereby affecting the firm’s strategy aswell as its marketing programs. Despite the fact that many new productsdo not follow such a prescribed route because of failure, the concept is
extremely valuable in helping management look into the future and better anticipate whatchanges will need to be made in strategic marketing programs.
At the beginning (the introductory stage), a new product’s purchase is limited becausemembers of the target market are insufficiently aware of its existence; also, the productoften lacks easy availability. As more people learn about the product and it becomes more
In his classic book on the marketing of high-technol-ogy products, Geoffrey Moore explores the challenges
of crossing the “chasm,” as he calls it, in the diffusionprocess between the early adopters and the earlymajority. For many high-tech products, innovators andearly adopters have quite different needs from earlymajority customers. Innovators and early adopters areoften willing to adopt a revolutionary new product thatis not yet very user-friendly or whose product featureshave not yet been fully developed. Their own technicalskill enables them to adapt such a product to theirneeds and resolve some of the uncertainties inherentin the product’s perhaps still-unclear potential. Their
self-perception as an innovator gives them comfort intrying new products before others do. Early majoritybuyers, on the other hand, typically require easier-to-use products, whose benefits are clearly defined, andfor which there is proof that the product will perform.Taking a product from the first group of buyers to thesecond is a difficult challenge, one that is compoundedby the fact that buyers in the innovator and earlyadopter groups are not likely to associate or talk withbuyers in the early majority group.
Source: Geoffrey Moore, Crossing the Chasm (New York: Harper-Business, 1995).
Exhibit 5.6 Crossing the Chasm: A Dif ficult Transition in the Dif fusion Process
Strategic Issue
The PLC concept is extremely valuable inhelping management look into the futureand better anticipate what changes will needto be made in strategic marketing programs.

Walker et al.: Marketing Strategy: A Decision−Focused Approach, Fourth Edition
II. Opportunity Analysis 5. Industry Analysis and Competitive Advantage
180 © The McGraw−Hill Companies, 2002
Chapter Five Industry Analysis and Competitive Advantage 117
readily available, sales increase at a progressively faster rate (the growth stage). Growthslows as the number of buyers nears the maximum and repeat sales become increasinglymore important than trial sales. As the number of both buyers and their purchases stabi-lizes, growth becomes largely a function of population growth in the target market. At theend of the growth period—just before the advent of maturity—the shakeout or competi-tive turbulence stage occurs. This is characterized by a decreasing growth rate that resultsin strong price competition, forcing many firms to exit the industry or sell out. The maturestage is reached when the net adoption rate holds steady—that is, when adopters approx-imate dropouts. When the latter begin to exceed new first-time users, the sales rate declinesand the product is said to have reached its final or decline stage.17
Life Cycle CurvesMany products do not go through the product life cycle curve shown in Exhibit 5.8 becausea high percentage are aborted after an unsatisfactory introductory period. Other productsseemingly never die (Scotch whiskey, TVs, automobiles). The shape of the life cycle curvevaries considerably between and within industries but is typically described as “S”-shaped.One study identified 12 different types of curves.18
In general, however, only one or a very few curves typify an industry (see Exhibit 5.9for the common types). The growth-decline plateau is probably the most common since amajority of products are in their mature stage (color TVs and most household appliances).This is followed by the cycle/recycle type, which is characteristic of many pharmaceuticalproducts that receive heavy promotions at the outset and again when sales begin to falter.The innovative-maturity curve goes through several life cycles because new innovativecharacteristics as well as new uses are discovered. A classic illustration is 3M’s Scotch
Exhibit 5.7Comparison of Rate of Adoption of Cellular Phones and Personal Computers for Home Use
Adoption factor Cell phones Home computers
Risk +/– Moderate risk: Cell phones were given – An expensive investment wasted, if away to attract early adopters who it turned out not to be useful.agreed to one year’s usage.
Relative advantage + Enabled people to make and receive – It was not clear, in the early days phone calls from anywhere—in the car of personal computing, what theor at the beach! advantages of a PC were in the
home.
Relative simplicity + Early cell phones were easy to use. – Early PCs were inordinately complex to use.
Compatibility with + Just like making or receiving a phone – Lots of learning required to use.current behavior call at home or office.
Ease of small-scale trial + Contracts required only modest minutes +/– One could visit a store for hands-onof use. trial, but couldn’t understand the
“bits, bytes, and RAM.”
Ease of communication + “Make or receive calls anywhere” is easy – Benefits were not clear, thus notof benefits to understand. communicable.
Key:
+ Favorable for rapid adoption
– Unfavorable for rapid adoption

Walker et al.: Marketing Strategy: A Decision−Focused Approach, Fourth Edition
II. Opportunity Analysis 5. Industry Analysis and Competitive Advantage
181© The McGraw−Hill Companies, 2002
Section Two Opportunity Analysis118
tape, which initially expanded to a line of colored and patterned items for gift wrapping.Next, a low-price commercial line was added, and finally 3M developed a coated type to compete with reflective tape. All of these tapes are still doing very well.19 The classic S-shaped curve occurs only when the product passes through all stages to its death (steamengines and many prescription drugs). Where is the Web in its life cycle?
Fads, such as Beanie Babies, pet rocks, and hula hoops, enter suddenly, experiencestrong and quick enthusiasm, peak early, and enter the decline stage shortly thereafter.Thus, even when successful, their life cycle is unusually short and is typically depicted inthe form of an inverted V.20
Market and Competitive Implications of Product Life Cycle StagesThe various stages of the product life cycle present different opportunities and threats tothe firm. By understanding the characteristics of the major stages, a firm can do a betterjob of setting forth its objectives and formulating its strategies as well as developing itsaction plans (see Exhibit 5.10). Our discussion here is generalized; in Chapters 10, 11, and12 we present a comprehensive examination of specific marketing-strategy programs anddo so for both leaders and followers.
Introductory Stage There is a vast difference between pioneering a product class anda product type. The former is more difficult, time-consuming, expensive, and risky, as musthave been the case when the telephone was introduced versus the introduction of the cel-lular phone. The introductory period, in particular, is apt to be long, even for relativelysimple product classes such as packaged food products. Because product type and subtype
Exhibit 5.8Generalized Product Life Cycle
Source: From Analysis for Strategic Marketing Decisions, 1st edition, by G. S. Day © 1986. Reprinted withpermission of South-Western College Publishing, a division of Thomson Learning. Fax 800-730-2215.
Pro
fit
per
un
it�������������
����� ���
����������
�����
Time�������
������������������������ � ��������
�� ����� �������
���� � ���������
Pro
du
ct c
ateg
ory
sal
es�������������
www

Walker et al.: Marketing Strategy: A Decision−Focused Approach, Fourth Edition
II. Opportunity Analysis 5. Industry Analysis and Competitive Advantage
182 © The McGraw−Hill Companies, 2002
Chapter Five Industry Analysis and Competitive Advantage 119
entries usually emerge during the late-growth and maturity stages of the product class, theyhave shorter introductory and growth periods. Once the product is launched, the firm’s goalshould be to move it through the introductory stage as quickly as possible. Research, engi-neering, and manufacturing capacity are critical to ensure the availability of qualityproducts. Where service is important, the firm must be able to provide it promptly (as inpostpurchase service and spare-parts availability). The length of the product line should berelatively short to reduce production costs and hold down inventories.
For sophisticated industrial products, the initial market consists mainly of large com-panies with enough resources to risk adoption, the technical capabilities to objectivelyevaluate the merits of the new product, and the most to gain if it works out well. To encour-age trial and repeat buying, marketers of consumer products use a combination of meth-ods, including heavy demonstration-oriented TV advertising, in-store displays, freesamples, coupons, and special introductory prices. The firm also must obtain distributionand ample shelf space to provide product availability—particularly in self-service outletssuch as supermarkets.
Marketing Mix in the Introductory Stage The length of the product line typicallyshould be relatively short to reduce production costs and hold down inventories. Efforts toestablish competitive advantage are typically focused on differentiating the new product orproduct line from solutions customers previously employed to satisfy the targeted want orneed. Many early PCs were purchased to perform spreadsheet analyses on the computer,instead of running the calculations by hand, with all the potential for error and difficulty
���������
���������
���������
���������
� �� ������������������ �� �������������
��� ������������������� �� ���������
����
���� ����
����
�������
��������
�� ��
������������
Exhibit 5.9Common Product Life Cycle Curves
Source: J. E. Swan and D. R. Rink, “Effective Use of Industrial Product Life Cycle Trends,” in Marketing inthe ’80s, 1980, pp. 198–99. Reprinted by permission from the publisher, American Marketing Association.
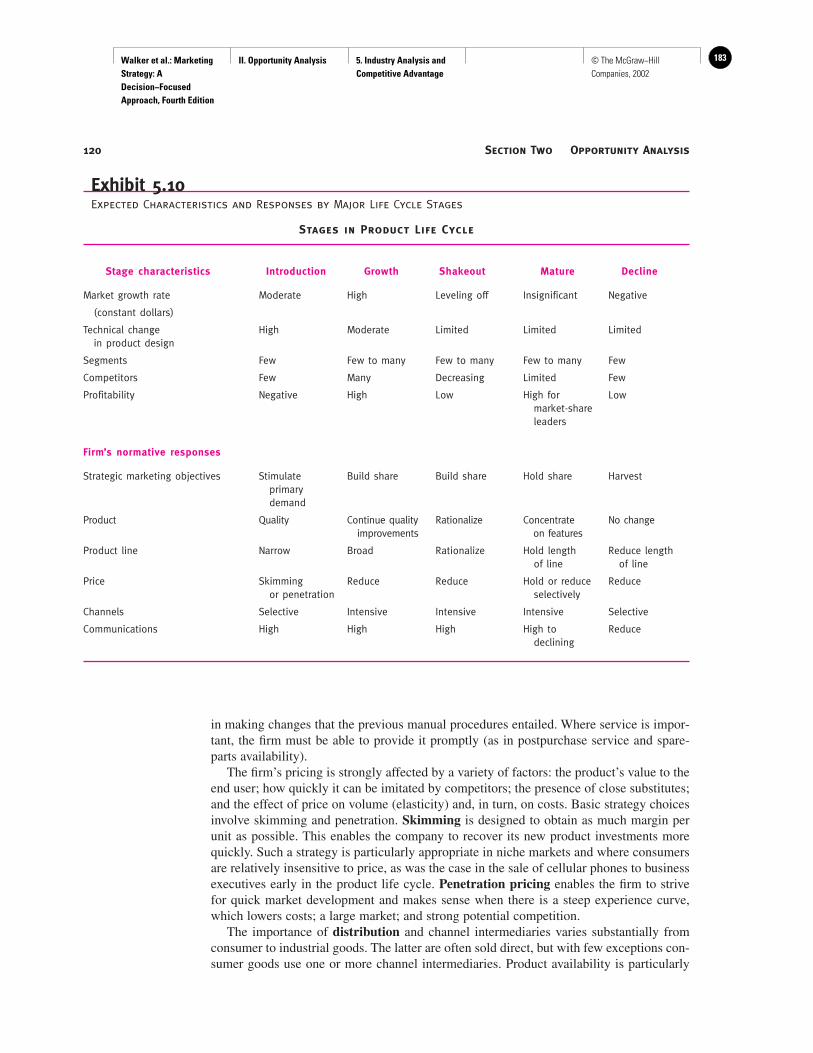
Walker et al.: Marketing Strategy: A Decision−Focused Approach, Fourth Edition
II. Opportunity Analysis 5. Industry Analysis and Competitive Advantage
183© The McGraw−Hill Companies, 2002
Section Two Opportunity Analysis120
in making changes that the previous manual procedures entailed. Where service is impor-tant, the firm must be able to provide it promptly (as in postpurchase service and spare-parts availability).
The firm’s pricing is strongly affected by a variety of factors: the product’s value to theend user; how quickly it can be imitated by competitors; the presence of close substitutes;and the effect of price on volume (elasticity) and, in turn, on costs. Basic strategy choicesinvolve skimming and penetration. Skimming is designed to obtain as much margin perunit as possible. This enables the company to recover its new product investments morequickly. Such a strategy is particularly appropriate in niche markets and where consumersare relatively insensitive to price, as was the case in the sale of cellular phones to businessexecutives early in the product life cycle. Penetration pricing enables the firm to strivefor quick market development and makes sense when there is a steep experience curve,which lowers costs; a large market; and strong potential competition.
The importance of distribution and channel intermediaries varies substantially fromconsumer to industrial goods. The latter are often sold direct, but with few exceptions con-sumer goods use one or more channel intermediaries. Product availability is particularly
Exhibit 5.10Expected Characteristics and Responses by Major Life Cycle Stages
Stages in Product Life Cycle
Stage characteristics Introduction Growth Shakeout Mature Decline
Market growth rate Moderate High Leveling off Insignificant Negative
(constant dollars)
Technical change High Moderate Limited Limited Limitedin product design
Segments Few Few to many Few to many Few to many Few
Competitors Few Many Decreasing Limited Few
Profitability Negative High Low High for Lowmarket-share leaders
Firm’s normative responses
Strategic marketing objectives Stimulate Build share Build share Hold share Harvestprimary demand
Product Quality Continue quality Rationalize Concentrate No changeimprovements on features
Product line Narrow Broad Rationalize Hold length Reduce lengthof line of line
Price Skimming Reduce Reduce Hold or reduce Reduceor penetration selectively
Channels Selective Intensive Intensive Intensive Selective
Communications High High High High to Reducedeclining

Walker et al.: Marketing Strategy: A Decision−Focused Approach, Fourth Edition
II. Opportunity Analysis 5. Industry Analysis and Competitive Advantage
184 © The McGraw−Hill Companies, 2002
Chapter Five Industry Analysis and Competitive Advantage 121
important with consumer goods because of the large amounts spent on promotion to makeconsumers aware of the product and to induce usage. Distribution is easier if the companyuses the same channels for its other products and has a successful track record with newproduct introductions.
During the introductory period, promotion expenditures involving advertising andsalesforce are a high percentage of sales, especially for a mass-market, small-value prod-uct. Some dot-coms spent themselves to failure for promotional purposes. For industrialgoods, personal selling costs are apt to be much higher than advertising costs.
The communications task at the outset is to build awareness of the new product’suniqueness, which is typically an expensive undertaking. Further, the promotional expen-ditures (such as in-store displays, premiums, coupons, samples, and off-list pricing)required to obtain product availability and trial are substantial. For industrial products, thetime required to develop awareness of the product’s uniqueness is often extensive due tothe number of people in the buying center and the complexity of the buying systems.
Growth Stage This stage starts with a sharp increase in sales. Important productimprovements continue in the growth stage, but at a slower rate. Increased brand differen-tiation occurs primarily in product features. The product line expands to attract new seg-ments. It does so by offering an array of prices and different product features. During thelatter part of the growth stage, the firm—especially the dominant one—makes every effortto extend the growth stage by adding new segments, lowering costs, improving productquality, adding new features, and trying to increase product usage among present users.
Marketing Mix Changes The product line expands to attract new market segments. Itdoes so by offering an array of prices and different product features. The quest for com-petitive advantage now shifts to differentiation from other entrants in the product class.Prices tend to decline during the growth period (the average cost of servicing cellular sub-scribers has been dropping by about 20 percent annually), and price differences betweenbrands decrease. The extent of the decline depends on cost—volume relationships, indus-try concentration, and the volatility of raw material costs. If growth is so strong it outpacessupply, there is little or no pressure on price; indeed, it may enable sellers to charge pre-mium prices.
During this period sellers of both industrial and consumer goods strive to build a chan-nel or a direct-sales system that provides maximum product availability and service at thelowest cost. If this can be accomplished, rivals are placed at a disadvantage, even to theextent of being excluded from some markets. This is particularly the case with someindustrial goods for which the number of intermediaries in any one market is limited. Abrand must attain some degree of distribution success in advance of the mature stage,because channel members then tend to disinvest in less-successful brands.
Promotion costs (advertising and personal selling) become more concerned with build-ing demand for a company’s brand (selective demand) than demand for the product classor type (primary demand). Firms strive to build favorable attitudes toward their brand onthe basis of its unique features. Communications are also used to cultivate new segments.Even though promotion costs remain high, they typically decline as a percentage of sales.
Shakeout Stage The advent of this period is signaled by a drop in the overall growthrate and is typically marked by substantial price cuts. As weaker competitors exit the mar-ket, the stronger firms gain shares. Thus, major changes in the industry’s competitive struc-ture occur. During shakeout the firm must rationalize its product line by eliminatingweaker items, emphasize creative promotional pricing, and strengthen its channel rela-tionships. The personal computer industry is now mired in a global price war in its efforts
www

Walker et al.: Marketing Strategy: A Decision−Focused Approach, Fourth Edition
II. Opportunity Analysis 5. Industry Analysis and Competitive Advantage
185© The McGraw−Hill Companies, 2002
Section Two Opportunity Analysis122
to adjust to a slowing market. The entire industry is experiencing higher inventories andsimultaneously intensifying competitive environment. Several firms have dropped out ofthe retail computer market. And Apple has gone through serious financial problems. To aconsiderable extent, what happens during the shakeout has been predetermined by howwell each brand has been positioned in relation to its targeted segments, its distributionsystem, and its relative costs per unit.
Marketing Mix Changes In addition to entering into more direct price competition,firms make every effort to maintain and enhance their distribution system. Channel inter-mediaries use this downturn in industry sales to reduce the number of products carried and,hence, their inventories. Weaker competitors often have to offer their intermediaries sub-stantial inducements to continue stocking all or even part of their line. Promotion costsmay increase, particularly for low-share firms, as companies attempt to maintain their dis-tribution by offering consumers buying incentives. This is particularly the case for sellersof consumer goods.
Mature Stage When sales plateau, the product enters the mature stage, which typi-cally lasts for some time. Most products now on the market are in the mature stage. Sta-bility in terms of demand, technology, and competition characterizes maturity. Strongmarket leaders, because of lower per-unit costs and the lack of any need to expand theirfacilities, should enjoy strong profits and high positive cash flows. But there is always thepossibility of changes in the marketplace, the product, the channels of distribution, theproduction processes, and the nature and scope of competition. The longer the maturestage lasts, the greater the possibility of change. If the firm does not respond successfullyto a change but its competitors do, then a change in industry structure may occur.
Marketing Mix Changes Because of technical maturity, the various brands in the mar-ketplace become more similar; therefore, any significant breakthroughs by R&D or engi-neering that help to differentiate the product or redirect its cost can have a substantial payout(see Exhibit 5.11). One option is to add value to the product that benefits the customer byimproving the ease of use (voice-activated dialing with cellular phones), by incorporatinglabor-saving features, or by selling systems rather than single products (adding extendedservice contracts). Increasingly, service becomes a way of differentiating the offering. Promotion expenditures and prices tend to remain stable during the mature stage. But thenature of the former is apt to change; media advertising for consumer goods declines and in-store promotions, including price deals, increase. The price premium attainable by the high-quality producer tends to erode. The effect of experience on costs and prices becomes smallerand smaller. Competition may force prices down, especially when the two leading competi-tors hold similar shares. For consumer goods, distribution and in-store displays (shelf fac-ings) become increasingly important, as does effective cost management.
In the early 80s mountain bikes gave the bicycleindustry a much-needed boost in sales. But the
demand for such bikes has peaked and most firms inthe industry are experiencing flat or declining sales.Clearly what the industry needs, and is attempting, todo is reinvent the bike. An attempt to do so via the
use of a battery-powered motor to propel the bikefailed, but one entrepreneur is working on a foldablebike that weighs less than 3.5 pounds.
Source: “Reinventing the Bicycle,” The Economist, November 18,1995, p. 76.
Exhibit 5.11 What the Bicycle Industry Needs Is Innovation

Walker et al.: Marketing Strategy: A Decision−Focused Approach, Fourth Edition
II. Opportunity Analysis 5. Industry Analysis and Competitive Advantage
186 © The McGraw−Hill Companies, 2002
Chapter Five Industry Analysis and Competitive Advantage 123
Decline Stage Eventually most products enter the decline stage, which may be grad-ual (canned vegetables/hot cereals) or extremely fast (some prescription drugs). The salespattern may be one of decline and then petrification as a small residual segment still clingsto the use of the product (tooth powder versus toothpaste). Products enter this stage pri-marily because of technologically superior substitutes (jet engines over piston engines)and a shift in consumer tastes, values, and beliefs (cholesterol-free margarine over butter).
As sales decline, costs increase, and radical efforts are needed to reduce costs and the assetbase. Even so, if exit barriers are low, many firms vacate the market, which increases the salesof remaining firms, thereby delaying their exit (see Exhibit 5.12). Stronger firms may evenprosper for a time. If the curve is a steep decline followed by a plateau, then some firms canadjust. If the firm is strong in some segments vacated by its competitors, then it may experi-ence a sufficient increase in market share to compensate for loss of sales elsewhere.
Marketing Mix Changes Marketing expenditures, especially those associated withpromotion, usually decrease as a percentage of sales in the decline stage. Prices tend toremain stable if the rate of decline is slow, there are some enduring profitable segments andlow exit barriers, customers are weak and fragmented, and there are few single-productcompetitors. Conversely, aggressive pricing is apt to occur when decline is fast and erratic,there are no strong unique segments, there are high exit barriers, a number of large single-product competitors are present, and customers have strong bargaining power. For con-sumer goods, marketing activity centers on distribution—persuading intermediaries tocontinue to stock the item even though they may not promote it. For industrial products theproblem may center around maintaining the interest of the salesforce in selling the item.
Harvesting or withdrawal has as its objective an increase in cash flow that can beaccomplished by milking (making only the essential investments), internal transfer ofassets, and sales of the business or its assets. In any milking operation, management looksfor ways to reduce assets, costs, and the number of items in the product line.
Strategic Implications of the Product Life CycleThe product life cycle model is a framework that signals the occurrence of opportunitiesand threats in the marketplace and the industry, thereby helping the business better antici-pate change in the product’s strategic market objective, its strategy, and its marketing pro-gram. By matching the entry’s market position objective with the investment level requiredand the profits and cash flows associated with each stage in the product life cycle, we canbetter visualize the interrelationships (see Exhibit 5.13). As would be expected, there is a
General Motors decided in 1995 to stop producingits Chevrolet Caprice Classic—a large, rear-wheel-
drive car that has long been the favorite of policedepartments and taxis—and its gargantuan CadillacFleetwood, which is the model of choice for stretchlimos and hearses. The factory where the cars are builtis now used to assemble a more trendy line of carsand pickup trucks. In dropping this duo, GM turnedtheir markets over to Ford, which had been consider-ing abandoning its big rear-wheel-drive Crown-Victoria,
but no doubt will reconsider its decision. Not everyoneat GM agrees with the company’s decision. Some wantto continue these models “as is,” while others arguefor small-volume production, even if it requires an out-side contractor.
Source: Gabriella Stern and Neal Timplin, “GM Turns Away fromCop-Car, Limo Markets,” Wall Street Journal, May 16, 1995, p. B1. Copy-right 1995 by Dow Jones & Co. Inc. Reproduced with permission ofDow Jones & Co. Inc. via Copyright Clearance Center.
Exhibit 5.12 GM Sinks Its Big Boats

Walker et al.: Marketing Strategy: A Decision−Focused Approach, Fourth Edition
II. Opportunity Analysis 5. Industry Analysis and Competitive Advantage
187© The McGraw−Hill Companies, 2002
Section Two Opportunity Analysis124
high correlation between the market and industry characteristics of each stage, the marketshare objectives, and the level of investment, which, in turn, strongly affect cash flow.
Introductory and Growth Stages Because the introduction of a new productrequires large investments, most firms sustain a rather sizable short-term loss. For many dot-coms, these losses have been especially sizable! As the product moves into the growth stage,sales increase rapidly; hence, substantial investments continue. Profitability is depressedbecause facilities have to be built in advance to ensure supply. The firm with the largestshare during this period should have the lowest per-unit costs due to scale and learningeffects. If it chooses to decrease its real price proportionate to the decline in its costs, it driesup the investment incentives of would-be entrants and lower-share competitors. The inno-vating firm’s share is likely to erode substantially during the growth stage. Nevertheless, itmust still make large investments, for even though it is losing share, its sales are increasing.New entrants and low-share sellers are at a substantial disadvantage here. They must notonly invest to accommodate market growth, but also to gain market share.
Mature and Declining Stages As the product enters the mature stage, the larger-share sellers should be able to reap the benefits of their earlier investments. Given that theprice is sufficient to keep the higher-cost sellers in business, that growth investments are nolonger needed, and that most competitors may no longer be striving to gain share, theleader’s profitability and positive cash flow can be substantial. But the leader needs to con-tinue making investments to improve its product and to make its manufacturing, marketing,and physical logistics more efficient. The generalized product life cycle model portrays aprofitability peak during the latter part of the growth stage. But one study of over 1,000industrial businesses found that despite declining margins, overall profitability did notdecline during maturity mainly because less money was spent on marketing and R&D.21
Limitations of the Product Life Cycle FrameworkThe product life cycle model’s major weakness lies in its normative approach to prescrib-ing strategies based on assumptions about the features or characteristics of each stage. Itfails to take into account that the product life cycle is, in reality, driven by market forces
Exhibit 5.13Relationship of Strategic Market Position Objective, Investment Levels, Profits, and Cash Flow to Individual
Stages in the Product Life Cycle
Stages in the Product Life Cycle
Stage Strategic market objective Investments Profits Cash flow
Introduction For both innovators and followers, Moderate to high for R&D, Highly Highly accelerate overall market growth capacity, working capital, negative negativeand product acceptance through and marketing (sales andawareness, trial, and product advertising)availability
Growth Increase competitive position High to very high High Negative
Shakeout Improve/solidify competitive Moderate Low to moderate Low to moderateposition
Mature Maintain position Low High Moderate
www
Walker et al.: Marketing Strategy: A Decision−Focused Approach, Fourth Edition
II. Opportunity Analysis 5. Industry Analysis and Competitive Advantage
188 © The McGraw−Hill Companies, 2002
Chapter Five Industry Analysis and Competitive Advantage 125
expressing the evolution of consumer preferences (the market), technology (the product),and competition (the supply side).22 Mary Lambkin and George Day argue strongly thatgreater emphasis on competitive issues helps to better understand the evolution of a product-market. This is especially the case in understanding the dynamics of competitive behaviorin evolving market structures.23
Strategic Value of Product-Market EvolutionAs illustrated by the cellular phone industry, products and markets are constantly evolv-ing. On the product side, the growing commonality of technology increases the difficultyof maintaining strong product differentiation. Over time, costs per unit tend to declinebecause of scale and learning effects leading to lower prices. On the market side, demandeventually slows, and consumers become more knowledgeable about the product, formingattitudes about the attractiveness of competing brands. And over time, industry structureand rivalry among established companies change.
These evolutionary forces interact to affect not only a market’s or an industry’s attrac-tiveness but also the success requirements for a firm’s various product-market entries. Themanagement implications of this evolutionary process are as follows:
At the corporate and business-unit levels, the firm must generate new products or enternew markets to sustain its profitability. This has been the case in the American beer industry,where overall demand is down, but the sales of microbrews have experienced rapid growthover the past 10 years. The younger generation finds such beers particularly attractive.24
At the product level, objectives and strategy change as the product passes through variousevolutionary stages. For example, PC sales to the American home market—the fastest-growingsegment of the PC market—have slowed substantially. Firms once serving this segment suchas Packard Bell, IBM, and Digital have suffered substantial losses or exited the market. Low-cost machines designed to service consumers who want to use only the Internet are now avail-able. In an effort to accommodate change, industry players are dropping prices, downsizing,accelerating their R&D, and even selling parts of their companies.25
At the marketing program level, the evolutionary process typically generates significantchanges. For example, when the sales of camcorders (lightweight video cameras)plateaued, the industry realized it had to find new markets beyond young parents. In aneffort to reach new customers, camcorder firms downplayed the high-tech nature of theirproduct by simplifying its design, cutting prices, and changing advertising appeals andmedia vehicles.26
Anticipating change is a very difficult undertaking and requires a systematic frameworkto help managers better understand the product-market evolutionary process. This is espe-cially the case as more and more markets become international. Chapters 4 and 5 have pro-vided a series of tools and analytical frameworks to guide managers in addressing thecritical decisions that these changes bring about.
Take Aways
• Companies are more likely to be successful in generat-ing sales and profits if the opportunities they pursueare blessed with the following conditions:
• Driving forces for the industry are favorable.
• The industry’s five forces are, on balance,favorable.
• The capabilities of the firm and/or the manage-ment team are sufficient to perform with respectto the industry’s critical success factors.
• Local competitive conditions are favorable.
• In other words, choosing an attractive industry, as wellas a growing market, is important!

Walker et al.: Marketing Strategy: A Decision−Focused Approach, Fourth Edition
II. Opportunity Analysis 5. Industry Analysis and Competitive Advantage
189© The McGraw−Hill Companies, 2002
Section Two Opportunity Analysis126
• An innovation is more likely to be successful if it willdiffuse at a rate rapid enough to quickly establish cus-tomer loyalty and advantage over competitors. Thischapter provides a framework for assessing this likeli-hood.
• Regardless of the nature of the playing field, develop-ing and regularly updating winning marketing strate-gies are important, too! In developing strategies tobuild and sustain competitive advantage, marketingdecision makers are more likely to win the competitive
war by adjusting their strategies as the markets andindustries in which they compete evolve through thestages of the product life cycle. Specific tools andframeworks for managing this task are provided in thebalance of this book.
• Self-diagnostic questions to test your ability to applythe analytical tools and concepts in this chapter tomarketing decision making may be found at thisbook’s website at www.mhhe.com/walker.
Endnotes
1. Information on the cellular telephone business at the turn of the 21st cen-tury comes from the following sources: Moon Ihlwan, “Asia Gets Hooked onWireless,” Business Week, June 19, 2000, p. 109; “Commentary: EuropeShouldn’t Squander This Telecom Windfall,” Business Week, May 22, 2000;Stephen Baker, “The Race to Rule Mobile,” Business Week International Edi-tion, February 21, 2000; Stephen Baker, “Smart Phones,” Business WeekInternational Edition, October 18, 1999; “Online Overseas,” New York Times,June 7, 2000, p. H8; Steve Frank, “Darling to Dog to . . . ,” Wall Street Jour-nal Sunday, June 18, 2000; and Peter Elstrom, “More Americans Are PackingFinnish Phones,” Business Week, December 21, 1998.
2. Bruce H. Clark and David B. Montgomery, “Managerial Identification ofCompetitors,” Journal of Marketing 63 (July 1999), pp. 67–83.
3. Adrian J. Slywotzky, Value Migration (Boston: Harvard Business SchoolPress, 1996).
4. Michael Porter, Competitive Strategy (New York: Free Press, 1980).
5. Ibid., chap. 3.
6. Wendy Zellner, Andrea Rothman, and Eric Schine, “The Airlines Mess,”Business Week, July 6, 1992.
7. Vdayan Gupta, “Consolidation in Biotechnology Industry Accelerates,”The Wall Street Journal, July 27, 1992, p. B2.
8. Myron Magnet, “Meet the New Revolutionaries,” Fortune, February 24,1992, pp. 98–99.
9. Baker, “The Race to Rule Mobile.”
10. For an interesting case study involving a PC chip-maker and its strategyto forward integrate by entering the PC business, see P. B. Campbell, “Chip-Maker Cyrex Plans to Enter Tough PC Business,” The Wall Street Journal,March 6, 1996, p. B4.
11. Baker, “Smart Phones.”
12. Ibid.
13. Everett M. Rogers, Diffusion of Innovations (New York: Free Press,1983).
14. Thomas S. Robertson and Hubert Gatignon, “Competitive Effects onTechnological Diffusion,” Journal of Marketing, July 1986, pp. 1–12.
15. Rogers, Diffusion of Innovations.
16. Frederick E. Webster Jr., Industrial Marketing Strategy (New York: JohnWiley & Sons, 1991), pp. 158–74.
17. For an interesting discussion of the application of the life cycle concept toalmost anything besides products (e.g., the fall of the Berlin Wall, the unifi-cation of Europe, and the demise of communism), see Theodore Modes, “LifeCycles,” The Futurist, September–October 1994, p. 20.
18. J. E. Swan and D. R. Rink, “Effective Use of Industrial Life CycleTrends,” in Marketing in the ’80s (New York: American Marketing Associa-tion, 1980), pp. 198–99.
19. Theodore Levitt, “Exploit the Life Cycle,” Harvard Business Review,November–December 1963, p. 93.
20. For an interesting discussion of fads versus trends, see Martin G. Letscher,“How to Tell Fads from Trends,” American Demographics, December 1994,p. 38.
21. Hans B. Thorelli and Stephen C. Burnett, “The Nature of Product Life-Cycles for Industrial Goods Businesses,” Journal of Marketing, Fall 1981,p. 108.
22. Webster, Industrial Marketing Strategy, p. 128.
23. Mary Lambkin and George S. Day, “Evolutionary Processes in Competi-tive Markets beyond the Product Life Cycle,” Journal of Marketing, July1989, pp. 8–9.
24. John Student, “True Brew,” American Demographics, May 1995, p. 32.
25. “The End of Good Times,” The Economist, December 9, 1995, p. 61; AndySerwer, “Dell Does Domination,” Fortune, January 21, 2002, at www.fortune.com/indext.jhtml?channel=print_article.jhtml&doc_id=205940.
26. Patrick M. Reilly, “Camcorder Makers, with Growth Easing, Try to BringNew Markets into the Picture,” The Wall Street Journal, December 26, 1991,p. B1.

Walker et al.: Marketing Strategy: A Decision−Focused Approach, Fourth Edition
II. Opportunity Analysis 6. Measuring Market Opportunities
190 © The McGraw−Hill Companies, 2002
128
Chapter Six
MEASURING MARKET
OPPORTUNITIES
African Communications Group: Bringing ModernTelecommunications to Tanzania1
In Tanzania in the early 1990s, many townsand villages had no access whatsoever totelecommunications services. Even in the capi-
tal, Dar es Salaam, a city of almost two millionpeople, on average only one telephone line hadbeen installed per hundred residents. The waitinglist to obtain service from the Tanzania Telecom-munications Company Limited (TTCL) was 7 to 10years. Monique Maddy and Côme Laguë, two recentMBA graduates from a leading U.S. businessschool, saw in these and other market and indus-try data an opportunity not only to bring telecom-munications services to Tanzania, but long term tobring a variety of telecommunications services—including pay phones, paging, voice-mail, andother voice and data communications services—to sub-Saharan Africa. After three months of on-site research in late 1993, Maddy and Laguëdecided that building a pay phone network in Tan-zania was the most promising opportunity forentering this market. They knew that, in order toobtain financing as well as the necessary licensesto operate in Tanzania, they would have to preparea credible business plan. They also knew thatamong the most critical elements of any businessplan was the sales forecast. Not only would the
sales number be the starting point from which allthe other numbers in the plan would be devel-oped, but it would be a key litmus test forprospective investors. If the sales forecast werewell supported and credible, Maddy and Laguëbelieved the rest of the pieces would fall intoplace. But how could such a forecast be preparedwith any confidence for a largely new and under-developed market?
Market Analysis
As a result of their research, Maddy and Laguë hadconcluded that the market for building a payphone system in Tanzania was extremely attrac-tive. Beyond those on the waiting list for phoneservice, there was huge “unofficial” demand fromindividuals who had not bothered to apply forservice. Maddy and Laguë estimated that, by 1996,there would be 500,000 potential subscribers fortelephone service, and that even with a planneddoubling of its capacity, TTCL could satisfy onlyperhaps half this demand. Moreover, on most Tan-zanian phones, it took several minutes to receivea dial tone. Once dial tone was received it could

Walker et al.: Marketing Strategy: A Decision−Focused Approach, Fourth Edition
II. Opportunity Analysis 6. Measuring Market Opportunities
191© The McGraw−Hill Companies, 2002
129
take 40 minutes to connect with cities in Africa, or20 minutes with Europe. Of the 300 coin-operatedpay phones in Tanzania, many were inoperative,and some only took coins that no longer were incirculation and were virtually worthless due to Tan-zania’s high rate of inflation. The market for phoneservice looked promising, indeed.
Industry Analysis
TTCL, Tanzania’s central telephone company, wasstate-owned, though it was expected that TTCLwould be privatized at some point. TTCL offeredneither paging, fax, cellular, nor data services.There were several small private telecommunica-tions companies, including one radio-calling serv-ice with 105 subscribers, and two high-end cellularphone companies. New licenses were likely to beissued in the next couple of years for cellular serv-ices, paging, and pay phones; and Maddy andLaguë hoped to be among those who would winthese licenses.
Maddy and Laguë’s analysis told them thatindustry conditions overall were attractive. Thoughnew competitors would likely enter the market,Maddy and Laguë’s head start would put them ingood position; there were numerous supplierseager to expand in the African market, and buyerscurrently had few options to obtain phone serviceof any kind. There were no substitutes other thancellular service, which was extremely expensive,due to the high cost of building the infrastructure,and the bureaucratic TTCL did not seem likely tobe a very vigorous competitor.
Consumer Needs
and Behavior
Not only was Tanzania’s telecommunications infra-structure poorly developed, but the same was truefor its electricity and water services and its roads.
It took three days to travel from Dar es Salaam toMwanza, Tanzania’s second-largest city, only 751miles away. Most telephone calls in cities weremade by businesspeople, who accounted for 70percent of telecommunications revenue. Sincemost residences had no phones, misuse of busi-ness phones was common. Employees were gen-erally required to use pay phones for all types oflong-distance calls. Most retail shops—known asdukas, which were makeshift open-air stalls madeof wood and tin—had no phones. Maddy andLaguë believed their pay phone network, togetherwith the voice-mail and paging services theyplanned to offer, would provide more efficientways of doing business to these small merchantswho constituted the backbone of the Tanzanianeconomy. The biggest challenge they would facewould probably be to educate Tanzanians on howto use their proposed system. Since the literacyrate in Tanzania was 90 percent, they felt opti-mistic about their ability to do so.
The Business Idea
The idea for African Communications Group (ACG),their proposed venture, was innovative but simple.Maddy and Laguë would build a network of payphones based on wireless radio technology, with acentral platform for routing calls and connectingwith the TTCL network. The phones would be card-operated, with prepaid cards sold in retailestablishments located near the phone booths. The retailers would get a margin on the sale of thephone cards, and might help watch over thephones to discourage vandalism. Paging and voice-mail would soon be added to the system at lowincremental cost. These features would providequick communication to parties that did not haveregular phone service. Subscribers could receivevoice-mail messages and leave messages for othervoice-mail subscribers. The pagers could be usedto signal the subscriber that a message had beenreceived.

Walker et al.: Marketing Strategy: A Decision−Focused Approach, Fourth Edition
II. Opportunity Analysis 6. Measuring Market Opportunities
192 © The McGraw−Hill Companies, 2002
Section Two Opportunity Analysis130
Strategic Challenges Addressed
in Chapter 6
Entrepreneurs like Maddy and Laguë and managers in established firms need to developknowledge about their market and industry and synthesize that knowledge into tangibleplans that their organizations can act on. These plans can take many forms. For Maddy andLaguë, a business plan was needed to raise the necessary capital and obtain the operatinglicenses to start the venture. For new product managers in established firms, marketingplans must be developed to win support and resources to permit the product’s launch. Else-where in organizations of all kinds, annual budgets are prepared to guide decision makingfor the coming year.2 These decisions determine staffing, investments in productive capac-ity, levels of operating expense, and so on. In almost every case, these planning and bud-geting activities begin with a sales forecast. Once a sales figure is agreed to, the variousactivities and investments needed to support the planned sales level are budgeted.
In Chapter 6, we deal with two key issues that enable managers and entrepreneurs tobring life to their dreams. First, we address the challenges in estimating market potentialand forecasting sales, for both new and existing products or businesses. We provide amenu of evidence-based forecasting methods, each of which is useful in some situations,but not others, and we discuss their limitations. Second, we briefly address the informa-tional needs of the forecasting task—as well as the tasks addressed in the earlier chaptersof this book that enable managers and entrepreneurs to understand their market and com-petitive contexts—to provide guidance on where to gather, collect, and report data relevantto strategic marketing decision making, that is, marketing research. In this second por-tion of the chapter, we assume the reader already has learned the basics of planning andconducting marketing research. Such research is essential in strategic decision making—to provide evidence on which to base the various corporate-level and business-level deci-sions discussed in Chapter 2. Depending solely on hunches—instead of more carefullythought-out research inquiries, even modest ones done quickly—can be a risky propositionindeed.
Every Forecast Is Wrong!
We know of no manager who has ever seen a forecast that came in exactly on the money.Some forecasts turn out too high; others too low. Forecasting is an inherently difficult task,because no one has a perfect crystal ball. The future is inherently uncertain, especially intoday’s rapidly changing markets. Consumer wants and needs shift, buffeted by the windsof ever-changing macro trends. Competitors come and go. New technologies sweep away
Measuring the Opportunity:
Determining Market
Potential and Preparing a
Sales Forecast
Maddy and Laguë liked the opportunity that laybefore them, and they felt their business skills andcontacts made them a good team to pursue it. But
how could they translate all the market and indus-try data they had gathered into a credible estimateof market potential and an evidence-based salesforecast? Proving that the market and industrywere attractive and that consumers would seebenefits from using their network was one thing.Coming up with hard numbers for market potentialand sales revenue was quite another.

Walker et al.: Marketing Strategy: A Decision−Focused Approach, Fourth Edition
II. Opportunity Analysis 6. Measuring Market Opportunities
193© The McGraw−Hill Companies, 2002
Chapter Six Measuring Market Opportunities 131
old ones. Some forecasts are based on extensive and expensive research,others on small-scale inquiries, still others on uninformed hunches. Aswe have seen, however, forecasting plays a central role in all kinds ofplanning and budgeting in all kinds of businesses and other organiza-tions.3 Given the stakes and the risks entailed in being very wrong witha forecast, some effort to prepare an evidence-based forecast, instead ofa wild guess, is almost always called for, even if time and money are
scarce. So forecast we must, but how?
A Forecaster’s Toolkit: A Tool
for Every Forecasting Setting
Before choosing a method to prepare a forecast, one first must know what is to be esti-mated or forecasted. First, there’s the size of the potential market, that is, the likely demandfrom all actual and potential buyers of a product or product class. An estimate of marketpotential often serves as a starting point for preparing a sales forecast, which we explorein more detail later in this chapter. For Maddy and Laguë’s venture in Tanzania, prospec-tive investors will want to know how large the potential market for telephone services willbe in the coming years, measured perhaps in several ways: in numbers of telephone users,in numbers and/or minutes of calls, and in dollars or Tanzanian shillings. This market iscomprised of those consumers who are likely to have both the willingness and ability tobuy and use a phone card or one of ACG’s other services at one of ACG’s pay phones.There’s also the size of the currently penetrated market, those who are actually using payphones in Tanzania at the time of the forecast. Investors also will want to know thesefigures—the size of the potential and penetrated markets for the market segments Maddyand Laguë intend to serve, their target market. They also will need a sales forecast, inwhich they predict sales revenues for ACG, for five years or so. How might they do thesethings?
Established organizations employ two broad approaches for preparing a sales forecast:top-down and bottom-up. Under the top-down approach, a central person or persons takethe responsibility for forecasting and prepare an overall forecast, perhaps using aggregateeconomic data, current sales trends, or other methods we describe shortly.4 Under the bottom-up approach, common in decentralized firms, each part of the firm prepares its ownsales forecast, and the parts are aggregated to create the forecast for the firm as a whole.For an example of how managers at Gap Inc. retailing divisions combine both methods toforecast next-year sales, see Exhibit 6.1.
The bottom-up logic also applies to Maddy and Laguë’s task. They can break theiranticipated demand into pieces and sum the components to create the summary forecast.These pieces could be market segments, such as small retailers, mobile businesspeople,consumers, and so on, or product lines, such as revenue from phone cards or individual payphones, voice-mail fees, pager fees, and the like. Using the bottom-up approach presentsnumerous advantages. First, this approach will force them to think clearly about the driv-ers of demand for each market segment or product line, and thus better understand the realpotential of their business and its parts.5 Second, they will be forced to make explicitassumptions about the drivers of demand in each category, assumptions they can debate—and support with evidence gathered from their research—with prospective investors andthey can later verify as the business unfolds. Third, such an approach facilitates “what if”planning. Various combinations of market segments and/or product lines can be combinedto build a business plan that looks viable.
Strategic Issue
Given the stakes and the risks entailed inbeing very wrong with a forecast, someeffort to prepare an evidence-based fore-cast, instead of a wild guess, is almostalways called for, even if time and moneyare scarce. So forecast we must, but how?

Walker et al.: Marketing Strategy: A Decision−Focused Approach, Fourth Edition
II. Opportunity Analysis 6. Measuring Market Opportunities
194 © The McGraw−Hill Companies, 2002
Section Two Opportunity Analysis132
From what forecasting methods, or tools, can Maddy and Laguë choose? There are sixmajor evidence-based methods for estimating market potential and forecasting sales: sta-tistical methods, observation, surveys, analogy, judgment, and market tests.6 A seventhmethod, not evidenced-based—the SWAG method (Silly Wild-@*# Guess)—is not con-doned here, though there is little else to support some forecasts!
Statistical and Other Quantitative MethodsStatistical methods use past history and various statistical techniques, such as multipleregression or time series analysis, to forecast the future based on an extrapolation of thepast.7 This method is typically not useful for ACG or other entrepreneurs or new productmanagers charged with forecasting sales for a really new product or new business. Thereis no history in their venture on which to base a statistical forecast.
In established firms, for established products, statistical methods are extremely useful.When Michelin, the tire maker, wants to forecast demand for the replacement automobiletire market in Asia for the next year, it can build a statistical model using such factors asthe number and age of vehicles currently on the road in Asia, predictions of GDP for theregion, the last few years’ demand, and other relevant factors to forecast market potentialas well as Michelin’s own replacement tire sales for the coming year. Such a procedure islikely to result in a more accurate forecast than other methods, especially if Michelin hasyears of experience with which to calibrate its statistical model.
As with all forecasting methods, statistical methods have important limitations. Mostimportant of these is that statistical methods generally assume that the future will look verymuch like the past. Sometimes this is not the case. US WEST, the regional Bell telephonecompany serving the Rocky Mountain and Northwest regions of the United States, ran intotrouble in the 1990s when its statistical models used to predict needs for telephone capac-ity failed to allow for rapidly increasing use of computer modems, faxes, and second linesfor teenagers in American homes. Suddenly, the average number of lines per home sky-rocketed, and there was not enough physical plant—cable in the ground, switches, and soon—to accommodate the growing demand. Consumers had to wait, sometimes for months,to get additional lines, and they were not happy about it! Similarly, if product or market
At rapidly growing retailer Gap Inc., forecasting salesfor the next year for each of its divisions—Gap,
Banana Republic, and Old Navy—is an importantprocess that drives a host of decisions, including howmuch merchandise to plan to buy for the coming year.Both top-down and bottom-up approaches are used.At Old Navy, for example, each merchandiser generatesa forecast of what level of sales his or her category—women’s knit tops, men’s jeans, and so on—canachieve for the next year. Group merchandise man-agers then provide their input and sum these numbersto create a total forecast from a merchandising per-spective. A second bottom-up forecast is generated bythe store operations organization, summing stores andgroups of stores. Simultaneously, a top-down figure is
prepared at headquarters in California, using macro-economic data, corporate growth objectives, and otherfactors. The three forecasts are then compared, differ-ences debated, and a final figure on which to basemerchandise procurement and expense budgets isdetermined. Though the effort to prepare such a fore-cast is considerable, the broad involvement in theprocess helps to ensure both knowledgeable input tothe forecast as well as subsequent commitment to“make the numbers.” Most important, Old Navy findsthat the different processes together with the ensuingdiscussion lead to substantially better forecasts.
Source: Marshall L. Fisher, Ananth Raman, and Anna SheenMcClelland, “Rocket Science Retailing Is Almost Here: Are You Ready?”Harvard Business Review, July–August 2000, pp. 115–24.
Exhibit 6.1 Forecasting Next Year’s Sales at Old Navy

Walker et al.: Marketing Strategy: A Decision−Focused Approach, Fourth Edition
II. Opportunity Analysis 6. Measuring Market Opportunities
195© The McGraw−Hill Companies, 2002
Chapter Six Measuring Market Opportunities 133
characteristics change, statistical models used without adequate judgment may not keeppace. When tire makers produce automobile tires that last 80,000 miles instead of 30,000to 50,000 miles, the annual demand for replacement tires is reduced. If automobile manu-facturers were to change the number of wheels on the typical car from four, the old statis-tical models also would be in trouble.
Other quantitative forecasting methods, especially for new product forecasting, alsohave been developed. These include methods to mathematically model the diffusion ofinnovation process for consumer durables8 (discussed in Chapter 5) and conjoint analysis,9
a method to forecast the impact on consumer demand of different combinations of attri-butes that might be included in a new product.
ObservationAnother method for preparing an evidence-based forecast is to directly observe or gatherexisting data about what real consumers do in the product-market of interest. Maddy andLaguë conducted a study of pay phone use in Tanzania to find out how many minutes perday the typical pay phone was used. Their study showed that an average of 150 three-minute calls were made per day at the 60 working pay phones then provided by other com-panies in Dar es Salaam. Revenue for most pay phones fell into the US$100 to $150range.10
Like statistical methods, observation-based forecasting is attractive because it isbased on what people actually do. If behavioral or usage data can be found from existingsecondary sources—in company files, at the library, or on the Internet—data collection isboth faster and cheaper than if a new study like the one Maddy and Laguë conducted mustbe designed and carried out. For new-to-the-world products, however, observation is typi-cally not possible and secondary data are not available, since the product often does notyet exist, except in concept form. Had there been no pay phones in Tanzania or a similarcountry, observation would not have been possible. Market tests, which we discuss later inthis section, are one way to get real purchase data about new-to-the-world products.
SurveysAnother common way to forecast sales or estimate market potential is to conduct surveys.These surveys can be done with different groups of respondents. Consumers, after beingshown a statement of the product concept11 or a prototype or sample of the product, can beasked how likely they are to buy, creating a survey of buyers’ intentions. Buyers also canbe asked about their current buying behavior: what they currently buy, how often, or howmuch they use. The salespeople can be asked how much they are likely to sell, completinga survey of salesforce opinion. Experts of various kinds—members of the distributionchannel, suppliers, consultants, trade association executives, and so on—also can be surveyed.
As part of their research in Dar es Salaam, Maddy and Laguë surveyed pay phone cus-tomers to find out more about them. A whopping 65 percent were using a pay phonebecause they lacked access to another working phone—good news for the ACG concept!Sixty-three percent were business customers, 20 percent were students or teachers, and 17percent were other nonbusiness customers. Business customers spent an average of US$10per week for 14 pay phone calls, and nonbusiness customers spent US$6 per week for 12calls.12 By combining these data with demographic data on the Tanzanian population,Maddy and Laguë now had what they needed to prepare an evidence-based, bottom-upforecast of market potential, market segment by market segment.

Walker et al.: Marketing Strategy: A Decision−Focused Approach, Fourth Edition
II. Opportunity Analysis 6. Measuring Market Opportunities
196 © The McGraw−Hill Companies, 2002
Section Two Opportunity Analysis134
Surveys possess important limitations, however. For one, what people say is not alwayswhat people do. Consumer surveys of buyer intention are always heavily discounted toallow for this fact. For one common approach to doing so, see Exhibit 6.2. Second, the per-sons who are surveyed may not be knowledgeable, but if asked for their opinion, they willprobably provide it! Third, what people imagine about a product concept in a survey maynot be what is actually delivered once the product is launched. If consumers are asked ifthey will buy an “old world spaghetti sauce with homemade flavor,” they will surely pro-vide a response. Whether they will actually like the taste and texture of the sauce that thelab develops is another story! In general, statistical and observational methods, where ade-quate data or settings are available in which to apply them, are superior to survey methodsof forecasting, because such methods are based, at least in part, on what people have actu-ally done or bought (e.g., the number of old cars actually on the road, or the length of payphone calls in Tanzania), while survey methods (Are you likely to buy replacement tiresthis year? How often are you likely to use a pay phone?) are based on what people say, aless reliable indicator of their future behavior.
AnalogyAn approach often used for new product forecasting where neither statistical methods norobservations are possible is to forecast the sales or market potential for a new product orproduct class by analogy. Under this method, the product is compared with similar prod-ucts for which historical data are available. When Yoplait, the leading marketer of yogurtin the United States, plans to introduce a new flavor, its managers likely will look at thesales history of earlier introductions to forecast the sales for the newest flavor. This method
Exhibit 6.2A Survey of Buyers’ Intentions: What People Say Is Not What They Do
When Nestlé’s refrigerated foods division in the United States was considering whether to acquire Lambert’s Pasta and Cheese, afresh pasta maker, it wanted to forecast the likely first-year sales volume if the acquisition were completed. To do so, Nestlé useda concept test in which consumers were asked, among other things, how likely they were to try the fresh pasta product. Theresults were as shown in the first two columns in the table below:
Purchase intent % response Rule of thumb reduction Percentage of marketfor forecasting purposes deemed likely to actually buy
Definitely would buy 27% Multiply by .8 27% × .8 = 21.6%
Probably would buy 43% Multiply by .3 43% × .3 = 12.9%
Might or might not buy 22% Count as zero
Probably or definitely would not buy 8% Count as zero
Totals 100% 21.6% + 12.9% = 34.5%
Even though 70% of consumers surveyed indicated they were likely to buy, Nestlé’s experience indicated that these “top two box”percentages should be cut sharply: “Definitely” responses were reduced by 20%, while “Probably” responses were reduced by70%. “Maybe” responses were considered as “No.” These adjustments, shown in columns three and four, reduced the 70% figureby more than half, to 34.5%. Most consumer product manufacturers who employ concept tests use similar rules of thumb wheninterpreting purchase intent data for forecasting purposes, because they have learned that what people say they will buy exceedswhat they will actually buy. Similar logic is useful in a variety of forecasting situations.
Source: Marie Bell and V. Kasturi Rangan, Nestlé Refrigerated Foods: Contadina Pasta and Pizza.Boston: Harvard Business School, 1995. Copyright © 1995 by the President and Fellows of HarvardCollege. Reprinted by permission.

Walker et al.: Marketing Strategy: A Decision−Focused Approach, Fourth Edition
II. Opportunity Analysis 6. Measuring Market Opportunities
197© The McGraw−Hill Companies, 2002
Chapter Six Measuring Market Opportunities 135
also is used for new-to-the-world high-technology products, for which product prototypesare often either not available or extremely expensive to produce. Rather than conduct sur-veys to ask consumers about their likelihood to buy a product they can hardly imagine(What would someone have said in 1978 about his or her likelihood to buy a personal com-puter?), forecasters consider related product introductions with which the new productmay be compared. Early forecasts for high-definition television (HDTV) were done thisway, comparing HDTV with historical penetration patterns for color TV, videocassetterecorders (VCRs), camcorders, and other consumer electronic products.13
As always, there are limitations. First, the new product is never exactly like that towhich the analogy is drawn. Early VCRs penetrated American households at a much fasterrate than did color TV. Which analogy should be used for HDTV? Why? Second, marketand competitive conditions may differ considerably from when the analogous product waslaunched. Such conditions need to be taken into account.
JudgmentWhile we hesitate to call this a forecasting method of its own, since capable and informedjudgment is required for all methods, sometimes forecasts are made solely on the basis of experienced judgment, or intuition. Some decision makers are intuitive in their deci-sion processes and cannot always articulate the basis for their judgments. Said a footwearbuyer at Nine West Group, “Trend forecasting is a visceral thing that cannot be trained. Irely on my sense of color and texture, but at times I cannot explain why I feel a certainway . . . I just know.”14 Those with sufficient forecasting experience in a market they knowwell may be quite accurate in their intuitive forecasts. Unfortunately, it is often difficult forthem to defend their forecasts against those prepared by evidence-based methods when thetwo differ. Nonetheless, the importance of experienced judgment in forecasting, whether itis used solely and intuitively or in concert with evidence-based methods, cannot be dis-counted.
Market TestsMarket tests of various kinds are the last of our most commonly used methods. Usedlargely for new products, market tests such as experimental test markets may be doneunder controlled experimental conditions in research laboratories, or in live test marketswith real advertising and promotion and distribution in stores. Use of test markets hasdeclined over the past two decades for two reasons. First, they are expensive to conductbecause significant quantities of the new product must be produced and marketing activi-ties of various kinds must be paid for. More importantly, in today’s data-intensive envi-ronment, especially for consumer products sold through supermarkets and massmerchants, competitors can buy the data collected through scanners at the checkout andlearn the results of the test market without bearing the expense. More diabolically, com-petitors can engage in marketing tactics to mislead the company conducting the test, byincreasing sampling programs, offering deep discounts or buy-one-get-one-free promo-tions, or otherwise distorting normal purchasing patterns in the category. Experimental testmarkets, on the other hand, are still commonly used.
The coming of the Internet has made possible a new kind of market test: an offerdirectly to consumers on the Web. Offers to chat rooms, interest groups, or e-mail lists ofcurrent customers are approaches that have been tried. Use of such techniques likely willincrease, due to companies’ ability to carry out such tests quickly and at low cost. Weexplore these and other Internet marketing strategies in greater detail in Chapter 9.
www

Walker et al.: Marketing Strategy: A Decision−Focused Approach, Fourth Edition
II. Opportunity Analysis 6. Measuring Market Opportunities
198 © The McGraw−Hill Companies, 2002
Section Two Opportunity Analysis136
Mathematics Entailed in ForecastingRegardless of the method used, the ultimate purpose of the forecasting exercise is to endup with numbers that reflect what the forecaster believes is the most likely outcome, orsometimes a range of outcomes under different assumptions, in terms of future marketpotential or for the sales of a product or product line. The combination of judgment andother methods often leads to the use of either of two mathematical approaches to determinethe ultimate numbers: the chain ratio calculation or the use of indices. See Exhibits 6.3 and6.4 for examples applying these mathematical calculations to arrive at sales forecasts. Bothmathematical approaches begin with an estimate of market potential (the number of house-holds in the target market in Exhibit 6.3; the national market potential for a product cate-gory in Exhibit 6.4). The market potential is then multiplied by various fractional factorsthat, taken together, predict the portion of the overall market potential that one firm orproduct can expect to obtain. In Exhibit 6.3, which shows the more detailed of the twoapproaches, the factors reflect the appeal of the product to consumers, as measured by mar-keting research data, and the company’s planned marketing program.
Cautions and Caveats
in Forecasting
Keys to Good ForecastingThere are two important keys to improve the credibility and accuracy of forecasts of sales andmarket potential. The first of these is to make explicit the assumptions on which the forecastis based. This way, if there is debate or doubt about the forecast, the assumptions can be
Exhibit 6.3Chain Ratio Forecast: Trial of Fresh Pasta
Once Nestlé’s research on fresh pasta had been completed (see Exhibit 6.2), it used the chain ratio method to calculate the totalnumber of households who would try their fresh pasta. The chain ratio calculation went like this:
Research results for Data from research Chain ratio calculation Result
Number of households 77.4 millionin target market
Concept purchase intent: 34.5% will try the product 77.4 million × 34.5% 26.7 million householdsadjusted figure from Exhibit 6.2 will try if aware
Awareness adjustment: based 48% will be aware of the 26.7 million × 48% 12.8 million householdson planned advertising level product will try if they find
product at their store
Distribution adjustment: based The product will obtain 12.8 million × 70% 9.0 million will try theon likely extent of distribution distribution reaching productin supermarkets, given the 70% of U.S. householdsintroductory trade promotion plan
Similar chain ratio logic is useful in a variety of forecasting settings.
Source: Marie Bell and V. Kasturi Rangan, Nestlé Refrigerated Foods: Contadina Pasta and Pizza.Boston: Harvard Business School, 1995. Copyright © 1995 by the President and Fellows of HarvardCollege. Reprinted by permission.

Walker et al.: Marketing Strategy: A Decision−Focused Approach, Fourth Edition
II. Opportunity Analysis 6. Measuring Market Opportunities
199© The McGraw−Hill Companies, 2002
Chapter Six Measuring Market Opportunities 137
debated, and data to support the assumptions can be obtained. The resulting conversation isfar more useful than stating mere opinions about whether the forecast is too high or too low.
For ACG, the combination of observational and survey forecasting meth-ods enabled Maddy and Laguë to articulate the assumptions on which theirrevenue forecasts were based, and to support those assumptions with data.Their evidence-based forecast was instrumental in their obtaining US$3.5million in start-up capital to get their venture off the ground.15
The second key to effective forecasting is to use multiple methods. When forecastsobtained by different methods converge near a common figure, greater confidence can beplaced in that figure. The procedure used at Gap Inc. to forecast next-year sales (seeExhibit 6.1) is an example of such an approach. Where forecasts obtained by multiplemethods diverge, the assumptions inherent in each can be examined to determine whichset of assumptions can best be trusted. Ultimately, however, any forecast is almost cer-tainly wrong. Contingency plans should be developed to cope with the reality that ulti-mately unfolds.16
Biases in ForecastingSeveral sources of potential bias in forecasts should be recognized. First, forecasters aresubject to anchoring bias, where forecasts are perhaps inappropriately “anchored” inrecent historical figures, even though market conditions have markedly changed, for betteror worse.17 Second, capacity constraints are sometimes misinterpreted as forecasts. Some-one planing to open a car wash that can process one car every seven minutes would prob-ably be amiss in assuming sufficient demand to actually run at that rate all the time. Arestaurant chain that is able to turn its tables 2.5 times each night, on average, must still dolocal market research to ascertain how much volume a new restaurant will really produce.Putting similar 80-table restaurants in two trade areas with different population makeupand density, with different levels of competition, will result in varying sales levels.
There are several published indices of buying behav-ior, including the “Annual Survey of Buying Power”
published by Sales and Marketing Management. TheBuying Power Index (BPI) is a weighted sum of a geo-graphical area’s percentage of national buying powerfor the area, based on census income data (weight =.5), plus the percentage of national retail sales for thearea (weight = .3), plus the percentage of nationalpopulation located in the area (weight = .2). If this cal-culation comes to 3.50 for a given state or region, onemight expect 3.5 percent of sales in a given category(toys, power tools, or whatever) to come from thatgeographical area.
Category development indices (CDIs) are similarindices that report the ratio of consumption in a cer-tain category (say, restaurant sales) to population in adefined geographical area. Trade associations or trademagazines relevant to the category typically publish
such indices. Ratios greater than 1.0 for a particulargeographic area, say metropolitan Chicago, indicatethat the area does more business than average (com-pared to the country as a whole) in that category.Brand development indices (BDIs) compare sales for agiven brand (say, Macaroni Grill restaurants) to popu-lation. Companies that use BDI indices typically calcu-late them for their own use. The ratio of the BDI to theCDI for a given area is an indicator of how well a brandis doing, compared to its category overall, in that area.These various indices are useful for estimating marketpotential in defined geographic areas. They are, how-ever, crude numbers, in that they do not consider dif-ferences in consumer behavior from region to region.The CDI or BDI for snowmobiles in Minnesota is farhigher than in Texas, for example. Attempting to rectifythis imbalance by increasing the snowmobile advertis-ing budget in Texas would be difficult!
Exhibit 6.4 Estimating Market Potential Using Indices
Strategic Issue
There are two important keys to improvethe credibility and accuracy of forecasts of sales and market potential.

Walker et al.: Marketing Strategy: A Decision−Focused Approach, Fourth Edition
II. Opportunity Analysis 6. Measuring Market Opportunities
200 © The McGraw−Hill Companies, 2002
Section Two Opportunity Analysis138
Another source of bias in forecasting is incentive pay. Bonus plans can cause man-agers to artificially inflate or deflate forecasts, whether intentionally or otherwise.“Sandbagging”—setting the forecast or target at an easily achievable figure in order to earnbonuses when that figure is beaten—is common.
Finally, unstated but implicit assumptions can overstate a well-intentioned forecast.While 34.5 percent of those surveyed (after adjustments, as shown in Exhibit 6.2) mayindicate their willingness to buy a new grocery product, such as fresh pasta, for such aforecast to pan out requires that consumers actually are made aware of the new productwhen it is introduced, and that the product can actually be found on supermarket shelves.Assumptions of awareness and distribution coverage at levels less than 100 percent,depending on the nature of the planned marketing program for the product, should beapplied to such a forecast, using the chain ratio method (see Exhibit 6.3).
Why Data? Why Marketing
Research?
In the first portion of this chapter, we provided several approaches to forecasting, each ofwhich requires that data be collected. Similarly, the first five chapters of this book providedframeworks for gaining a better understanding of market and competitive conditions andof what buyers in a given market want and need—what we call market knowledge.18
Obtaining market knowledge also requires data, and so far we’ve provided little discussionof exactly how one might best find the necessary data. Without relevant and timely data,market knowledge is generally incomplete and often ill-informed, based perhaps onhunches or intuition that may or may not be correct.
Without adequate market knowledge, strategic marketing decisions are likely to be mis-guided. Products for which there is little demand may be introduced, only to subsequentlyfail. New markets may be entered, despite market or industry conditions that make successunlikely. Attractive product-markets may be overlooked. Products may be marketed to thewrong target market, when consumers in another market segment would like the productbetter. Pricing may be too high, reducing sales, or too low, leaving money on the table.Advertising and promotion monies may be poorly spent. Second-best distribution channelsmay be chosen. These outcomes are all too common. Most often, they result from ill- orunder-informed marketing decisions. Thoughtfully designed, competently executed mar-keting research can mitigate the chances of such unpleasant outcomes.
Thus, in the remainder of this chapter we address the challenge of obtaining market knowl-edge, including the development of systems to track pertinent market information inside andoutside the firm, as well as the design and implementation of more targeted studies intendedto collect information about a particular marketing problem. We begin by discussing the prin-cipal kinds of market knowledge systems used in companies large and small, and we showhow such systems can improve the timeliness and quality of marketing decisions.
Market Knowledge Systems:
Charting a Path toward
Competitive Advantage
Marketing is rapidly becoming a game where information, rather than raw marketing mus-cle, wins the race for competitive advantage. There are four commonly used market knowl-edge systems on which companies rely to keep pace with daily developments: internal

Walker et al.: Marketing Strategy: A Decision−Focused Approach, Fourth Edition
II. Opportunity Analysis 6. Measuring Market Opportunities
201© The McGraw−Hill Companies, 2002
Chapter Six Measuring Market Opportunities 139
records regarding marketing performance in terms of sales and the effec-tiveness and efficiency of marketing programs, marketing databases,competitive intelligence systems, and systems to organize client contact.Effective use of such systems is likely to result in happier, higher-volume,more loyal customers. Few of these systems existed in their current formuntil developments in data processing and data transmission made them
cost effective.
Internal Records SystemsEvery Monday morning, each retail director at the headquarters of Nine West RetailStores, a leading operator of shoe specialty stores, receives the “Godzilla Report,” a tabu-lation of detailed sales and inventory information about the fastest-selling items in NineWest stores from the prior week.19 By style and color, each director learns which items inhis or her stores are selling fast and need to be reordered. A similar report provides infor-mation about all other styles currently in Nine West’s stores, so that slow sellers can bemarked down or transferred to stores where those styles are in higher demand. Additionalreports aggregate sales information by style and color; by merchandise category (e.g.,dress or casual); by store, area, or region; and for various time periods. The informationprovided by these reports constitutes the backbone of Nine West’s decision making aboutwhich shoes to offer in which of its stores. Imagine how much more difficult the retaildirector’s job would be without today’s point-of-sale systems to collect and report suchdata! Imagine the potential advantage Nine West has over shoe retailers who lack suchinformation.
Every marketer, not just retailers, needs information about “what’s hot, what’s not.”Unfortunately, accounting systems generally do not collect such data. Typically, such sys-tems just track dollars of revenue, with no information about which goods or services weresold. Thus, marketers need internal records systems to track what is selling, how fast, inwhich locations, to which customers, and so on. Providing input on the design of such sys-tems so that the right data are provided to the right people at the right time is a critical mar-keting responsibility in any company. In some cases, such systems constitute a significantcompetitive advantage.
But what constitutes critical marketing information varies from company to companyand industry to industry. Nine West retail directors need to know which styles and colorsare selling, in which stores, at what rate. Wal-Mart believes its key suppliers need to knowits store-by-store item and category sales data, so it provides password-protected onlineaccess to such data to those suppliers. Telemarketers need to know which callers are pro-ducing sales, at what times of day, for which products. Marketers of kitchen gadgetsthrough infomercials on late-night television need to know which ads on which stations inwhich cities are performing, in order to place media dollars where they will be most pro-ductive. Companies selling their wares to industrial markets through outside salesforcesneed to know not only which products are selling to which customers but also which sales-people are selling how much, at what margins and expense rates, to whom. The salesforce,too, needs information about status of current orders, customer purchasing history, and soon. For an example of how salesforce automation software is helping modern salespeo-ple to be more productive and more able to satisfy customer needs, see Exhibit 6.5. Forthose charged with developing or updating internal record systems in their companies, weprovide, in Exhibit 6.6, a series of questions to help marketing decision makers specifywhat internally generated sales data are needed, when, for whom, in what sequence, atwhat level of aggregation.
Strategic Issue
Marketing is rapidly becoming a gamewhere information, rather than raw marketing muscle, wins the race for competitive advantage.
www

Walker et al.: Marketing Strategy: A Decision−Focused Approach, Fourth Edition
II. Opportunity Analysis 6. Measuring Market Opportunities
202 © The McGraw−Hill Companies, 2002
Section Two Opportunity Analysis140
Marketing DatabasesMany companies have become quite sophisticated about keeping track of their customers’purchases using marketing databases. Catalog marketers such as Lands’ End and L.L Beanknow who are their best customers and what categories they tend to buy. Online marketerslike Amazon.com use “cookies,” electronic signatures placed at a customer’s personalcomputer, so they not only keep track of what each customer has bought, but they also rec-ognize the customer when he or she logs on to their site. Airlines track members of theirfrequent flyer programs and target some with special promotions. Supermarket chains suchas Safeway encourage their customers to obtain cards that give the user “clipless coupon”savings when they shop, and that permit Safeway to better understand the purchasing pat-terns of its customers.
Designing marketing databases that take effective advantage of customer data that com-panies are in a position to collect requires that several major issues be considered: the costof collecting the data, the economic benefits of using the data, the ability of the companyto keep the data current in today’s mobile society, and the rapid advances in technologythat permit the data to be used to maximum advantage.
Collecting information, then storing and maintaining it, always costs money. If a com-pany wants to know more about the demographics and lifestyles of its best customers, inaddition to their purchasing histories, it must obtain demographic and lifestyle data aboutthem. Doing so is more difficult than it sounds; most people are unwilling to spend muchtime filling out forms that ask nosy questions about education, income, whether they playtennis, and what kind of car they drive. The cost of collecting such information must beweighed against its value. What will be done with the information once it is in hand?
Various commercial marketing databases are available, with varying depth and qualityof information. For example, the Polk Company (www.polk.com) sells data compiledfrom state driver’s license records in the United States, as well as a demographic andlifestyle database compiled from questionnaires returned with warranty cards for con-sumer durables such as toasters, stereos, and the like. Donnelley’s DQI database(www.donnelley.com) covers more than 150 million individual U.S. consumers and 90million U.S. households and includes more than 1,600 demographic, lifestyle, purchasingpower, and creditworthiness variables, among others. Claritas’s PRIZM service (PotentialRating Index for Zip Markets, www.claritas.com) classifies U.S. consumers into one of62 distinct demographic and behavioral clusters according to the Zip code and postal car-rier route where they live. Claritas and others offer a range of database marketing products
In many companies, an outside salesforce bears theprincipal responsibility for customer contact and for
producing revenue. The use of intranets combined withsalesforce automation software now gives travelingsalespeople instant access to whatever information theyor their customers need. At Ascom Timeplex, Inc., a marketer of telecommunications equipment, sales repsuse their laptop computers to access price lists, orderstatus, e-mail, and a host of other customer-relevant
information from the company’s worldwide data net-work. When orders are placed anywhere, they are sentelectronically from the sales rep’s laptop to headquar-ters in New Jersey. Rarely does an Ascom Timeplexsalesperson say to a customer, “I don’t know. I’ll haveto get back to you on that.”
Source: Reprinted from John W. Verity, “Taking a Laptop on a Call,”Business Week, October 25, 1993, pp. 124–25, with special permis-sion. Copyright © 1993 by The McGraw-Hill Companies, Inc.
Exhibit 6.5 How Salesforce Automation Software Places Internal Records atthe Salesforce’s Fingertips
www
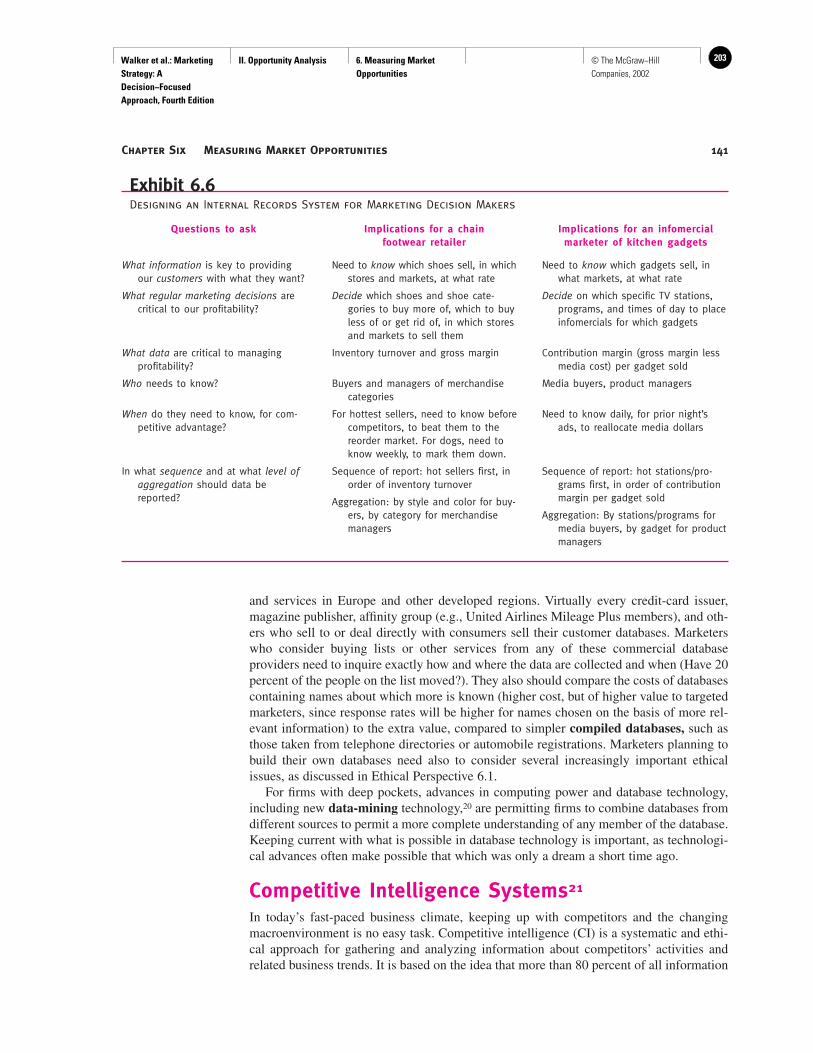
Walker et al.: Marketing Strategy: A Decision−Focused Approach, Fourth Edition
II. Opportunity Analysis 6. Measuring Market Opportunities
203© The McGraw−Hill Companies, 2002
Chapter Six Measuring Market Opportunities 141
and services in Europe and other developed regions. Virtually every credit-card issuer,magazine publisher, affinity group (e.g., United Airlines Mileage Plus members), and oth-ers who sell to or deal directly with consumers sell their customer databases. Marketerswho consider buying lists or other services from any of these commercial databaseproviders need to inquire exactly how and where the data are collected and when (Have 20percent of the people on the list moved?). They also should compare the costs of databasescontaining names about which more is known (higher cost, but of higher value to targetedmarketers, since response rates will be higher for names chosen on the basis of more rel-evant information) to the extra value, compared to simpler compiled databases, such asthose taken from telephone directories or automobile registrations. Marketers planning tobuild their own databases need also to consider several increasingly important ethicalissues, as discussed in Ethical Perspective 6.1.
For firms with deep pockets, advances in computing power and database technology,including new data-mining technology,20 are permitting firms to combine databases fromdifferent sources to permit a more complete understanding of any member of the database.Keeping current with what is possible in database technology is important, as technologi-cal advances often make possible that which was only a dream a short time ago.
Competitive Intelligence Systems21
In today’s fast-paced business climate, keeping up with competitors and the changingmacroenvironment is no easy task. Competitive intelligence (CI) is a systematic and ethi-cal approach for gathering and analyzing information about competitors’ activities andrelated business trends. It is based on the idea that more than 80 percent of all information
Exhibit 6.6Designing an Internal Records System for Marketing Decision Makers
Questions to ask Implications for a chain Implications for an infomercialfootwear retailer marketer of kitchen gadgets
What information is key to providingour customers with what they want?
What regular marketing decisions arecritical to our profitability?
What data are critical to managing profitability?
Who needs to know?
When do they need to know, for com-petitive advantage?
In what sequence and at what level ofaggregation should data bereported?
Need to know which shoes sell, in whichstores and markets, at what rate
Decide which shoes and shoe cate-gories to buy more of, which to buyless of or get rid of, in which storesand markets to sell them
Inventory turnover and gross margin
Buyers and managers of merchandisecategories
For hottest sellers, need to know beforecompetitors, to beat them to thereorder market. For dogs, need toknow weekly, to mark them down.
Sequence of report: hot sellers first, inorder of inventory turnover
Aggregation: by style and color for buy-ers, by category for merchandisemanagers
Need to know which gadgets sell, inwhat markets, at what rate
Decide on which specific TV stations,programs, and times of day to placeinfomercials for which gadgets
Contribution margin (gross margin lessmedia cost) per gadget sold
Media buyers, product managers
Need to know daily, for prior night’sads, to reallocate media dollars
Sequence of report: hot stations/pro-grams first, in order of contributionmargin per gadget sold
Aggregation: By stations/programs formedia buyers, by gadget for productmanagers

Walker et al.: Marketing Strategy: A Decision−Focused Approach, Fourth Edition
II. Opportunity Analysis 6. Measuring Market Opportunities
204 © The McGraw−Hill Companies, 2002
Section Two Opportunity Analysis142
is public knowledge. The most important sources of CI information include companies’annual and other financial reports, speeches by company executives, government docu-ments, online databases, trade organizations, as well as the popular and business press. Thechallenge is to find the relevant knowledge, analyze it, and share it with the decision mak-ers in the organization, so they can use it. The critical questions that managers setting upa CI system should ask are
• How rapidly does the competitive climate in our industry change? How important is it thatwe keep abreast of such changes?
• What are the objectives for CI in our company?
Ethical Perspective 6.1
Ethical Issues in Database Marketing,Internet Marketing, and MarketingResearch
New technologies relating to the gathering and use ofinformation about consumers and their behavior,interests, and intentions raise a host of legal and eth-ical questions. These new technologies have thepotential to harm individuals when such information“is used without their knowledge and/or consent,leading them to be excluded from or included in activ-ities in such a way that they are harmed economically,psychologically, or physically. Examples include theimproper disclosure of a person’s credit rating, deny-ing medical insurance to an individual based on con-fidential information, and a person’s being placed ontarget lists for direct mail and telemarketing. Thedepth of privacy concerns varies from country to coun-try, a critical issue for Internet marketers, given theirglobal reach.
Ethical issues in marketing research stem, in largepart, from the interaction between the researcher andrespondents, clients, and the general public. Forinstance, respondents should not be pressured to par-ticipate, should have the right to remain anonymous,and should not be deceived by fake sponsorship.
Client issues involve the confidentiality of theresearch findings and the obligation to strive to pro-vide unbiased and honest results regardless of clientexpectations. The public is very much involved whenthey are exposed to a sales solicitation disguised asa marketing research study or issuing from dataobtained from “volunteer surveys” using write-ins orcall-ins.
In discussing the reliability of, and ethical issuesinvolved with, marketing research studies, a WallStreet Journal article noted that many studies “are lit-tle more than vehicles for pitching a product or opin-ion.” An examination of hundreds of recent studies
indicated that the business of research has becomepervaded by bias and distortion. More studies arebeing sponsored by companies or groups with afinancial interest in the results. This too often leadsto a bias in the way questions are asked.
Because of shortages in time and money, samplesizes are being reduced to the point that, whengroups are further broken into subgroups, the mar-gin of error becomes unacceptable—assuming aprobability sample was used. In addition to samplesize, the way the sampling universe is defined canbias the results. Thus, in a Chrysler study showingthat people preferred Chrysler’s cars to Toyota’s, asample of only 100 respondents was used in each oftwo tests, and none owned a foreign car. Thus, therespondents may well have been biased in favor ofU.S. cars.
In addition to the problems noted above, subjec-tive sampling procedures often are used, data analy-sis may be flawed, or only the best conclusions arereported. Frequently researchers are hired whoseviews on the subject area being researched are knownto be similar to those of the client. In an attempt toregulate the marketing research industry, severalcodes of conduct and ethics have been developed.These include published codes by the American Marketing Association, the American Association forPublic Opinion Research, the Marketing ResearchAssociation, and the Council of American SurveyResearch Organizations.
Source: Paul N. Bloom, Robert Adler, and George R. Milne, “Iden-tifying the Legal and Ethical Risks and Costs of Using New Informa-tion Technologies to Support Marketing Programs,” in The MarketingInformation Revolution, Robert C. Blattberg, Rashi Glazer, and JohnD. C. Little, eds. (Boston: Harvard Business School Press, 1994), p.294; Cynthia Crossen, “Studies Galore Support Products and Posi-tions, But Are They Reliable?” The Wall Street Journal, November 14,1991, pp. A1 and A8; and Thomas E. Weber, “Europe and U.S. ReachTruce on Net Privacy, But What Comes Next?” The Wall Street Jour-nal, June 19, 2000, p. B1.
E
Walker et al.: Marketing Strategy: A Decision−Focused Approach, Fourth Edition
II. Opportunity Analysis 6. Measuring Market Opportunities
205© The McGraw−Hill Companies, 2002
Chapter Six Measuring Market Opportunities 143
• Who are the best internal clients for CI? To whom should the CI effort report?
• What budget should be allocated to CI? Will it be staffed full- or part-time?
In companies that operate in industries with dynamic competitive contexts, the use of full-time CI staff is growing.
Client Contact Management SystemsSeveral low-cost software applications that run on PCs are available to keep track of clientlists and the various kinds of contacts that are made with each client. ACT and Goldmineare two of the best-known programs in this arena. These programs keep track of clients’names, addresses, phone and fax numbers, and so on—along with all kinds of personal tid-bits, such as their spouse’s and children’s names and the kind of wine the client likes todrink—and they also provide an organized way to make notes about each contact with thecustomer. They also can remind the user when it is time to follow up with the customer ona topic left pending. Most whose livelihood depends on face-to-face selling now use suchsystems to keep themselves organized.
Other Kinds of Market Knowledge SystemsWe have covered but a few of the most common market knowledge systems, most of whichare computer applications in today’s increasingly sophisticated data-driven age. Thesetools make marketers better informed about their customers, potential customers, and com-petitors and help them be more productive, both of which help establish and sustain com-petitive advantage. New applications are being developed every day. Ultimately, thepotential that many of these systems share is to enable marketers to serve target marketsof one; that is, to know enough about any given customer and the competitive context thatan offering can be tailored to fit each customer so well that the customer’s needs are metperfectly. Doing so is many a marketer’s dream!
Marketing Research: A Foundation
for Strategic Decision Making
We now turn briefly to the marketing research task: the design, collection, analysis,and reporting of research intended to gather data pertinent to a particular marketing chal-lenge or situation. The word particular is very important. Marketing research is intendedto address carefully defined marketing problems or opportunities. Research carried outwithout carefully thought-out objectives usually means time and money down the tubes!Some marketing problems commonly addressed through marketing research include track-ing customer satisfaction from unit to unit or year to year (tracking studies); testing consumer responses to elements of marketing programs, such as prices or proposed adver-tising campaigns; and assessing the likelihood that consumers will buy proposed newproducts.
The steps in the marketing research process are shown in Exhibit 6.7. As this exhibitshows, the marketing research process is fraught with numerous opportunities for error.That’s why it’s so important that all who play influential roles in setting strategy for theirfirms or who use marketing research results for decision making be well-informed and crit-ical users of the information that results from market research studies.
It is beyond the scope of this book, however, to instruct the reader in how to design

Walker et al.: Marketing Strategy: A Decision−Focused Approach, Fourth Edition
II. Opportunity Analysis 6. Measuring Market Opportunities
206 © The McGraw−Hill Companies, 2002
Section Two Opportunity Analysis144
marketing research studies. For those wishing to read more on this topic, numerous text-books on marketing research are available.22 In Exhibit 6.8, we do suggest a variety ofsources where secondary data may be obtained to assess the attractiveness of markets andindustries, two important tasks for any strategic marketing decision maker.
What Users of Marketing Research
Should Ask
The research process described in Exhibit 6.7 makes clear where many of the potentialstumbling blocks are in designing and conducting marketing research. The informed andcritical user of marketing research should ask the following questions, ideally beforeimplementing the research or, if necessary, subsequent to its completion, to ensure that theresearch is unbiased and the results are reliable.
1. What are the objectives of the research? Will the data to be collected be sufficient to meetthose objectives?
2. Are the data sources appropriate? Are cheaper, faster secondary data used where possible?Is qualitative research planned to ensure that quantitative research, if any, is on target?
3. Are the planned qualitative and/or quantitative research approaches suited to the objectivesof the research? Qualitative research is better for deep insights into consumer behavior,while quantitative research is better for measurement of a population’s attitudes and likelyresponses to products or marketing programs.
4. Is the research designed well? Will questionnaire scales permit the measurement necessaryto meet the research objectives? Are the questions on a survey or in an interview or focusgroup unbiased? (“Isn’t this a great new product? Do you like it?”) Do the contact methodand sampling plan entail any known bias? Is the sample size large enough to meet theresearch objectives?
5. Are the planned analyses appropriate? They should be specified before the research isconducted.
Exhibit 6.7Steps in the Marketing Research Process: What Can Go Wrong?
Steps What frequently goes wrong?
1. Identify managerial problem and establish research objectives Management identifies no clear objective, no decision to be made based on the proposed research.
2. Determine data sources (primary or secondary) and types of Primary data are collected when cheaper and fasterdata and research approaches (qualitative or quantitative) secondary data will do. Quantitative data are collectedrequired without first collecting qualitative data.
3. Design research: type of study, data collection approach, These are technical issues best managed by skilledsample, etc. practitioners. Doing these steps poorly can generate
misleading or incorrect results.
4. Collect data Collector bias: hearing what you want to hear.
5. Analyze data Tabulation errors or incorrect use or interpretation of statistical procedures may mislead the user.
6. Report results to the decision maker Some users do not really want objective information—they want to prove what they already believe to be true.
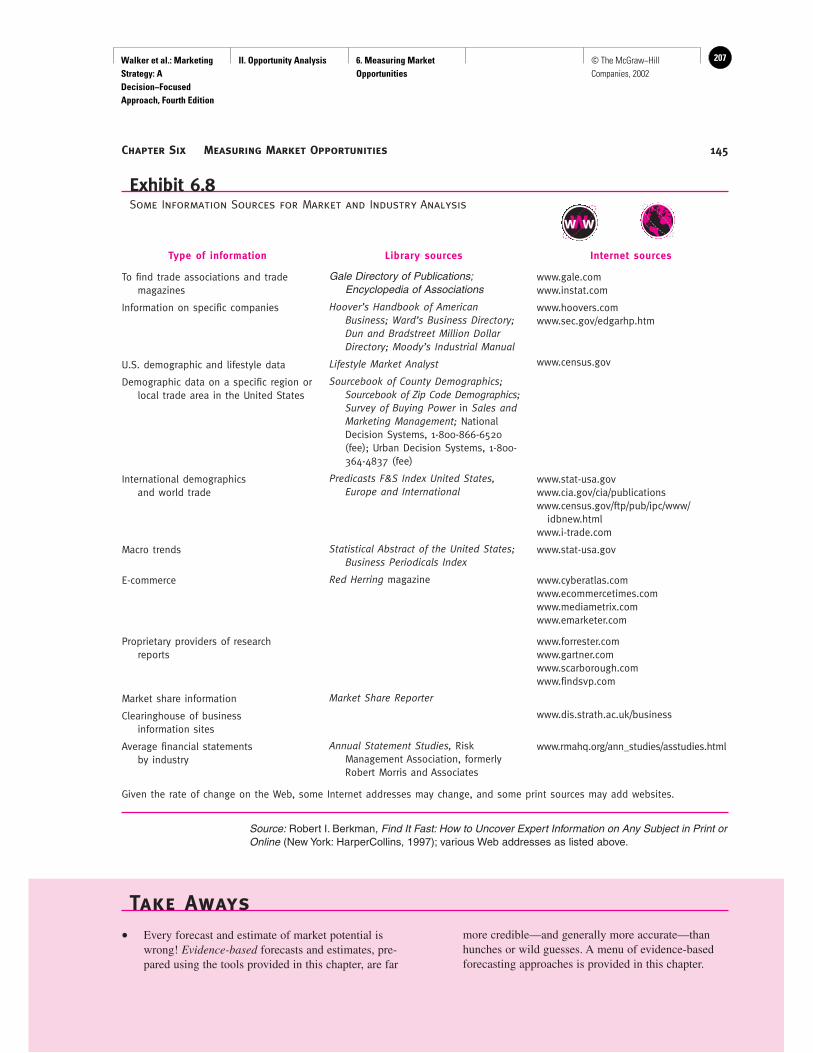
Walker et al.: Marketing Strategy: A Decision−Focused Approach, Fourth Edition
II. Opportunity Analysis 6. Measuring Market Opportunities
207© The McGraw−Hill Companies, 2002
Chapter Six Measuring Market Opportunities 145
Take Aways
Exhibit 6.8Some Information Sources for Market and Industry Analysis
Type of information Library sources Internet sources
To find trade associations and trademagazines
Information on specific companies
U.S. demographic and lifestyle data
Demographic data on a specific region orlocal trade area in the United States
International demographics and world trade
Macro trends
E-commerce
Proprietary providers of research reports
Market share information
Clearinghouse of business information sites
Average financial statements by industry
Gale Directory of Publications;Encyclopedia of Associations
Hoover’s Handbook of American Business; Ward’s Business Directory;Dun and Bradstreet Million DollarDirectory; Moody’s Industrial Manual
Lifestyle Market Analyst
Sourcebook of County Demographics;Sourcebook of Zip Code Demographics;Survey of Buying Power in Sales andMarketing Management; NationalDecision Systems, 1-800-866-6520(fee); Urban Decision Systems, 1-800-364-4837 (fee)
Predicasts F&S Index United States,Europe and International
Statistical Abstract of the United States;Business Periodicals Index
Red Herring magazine
Market Share Reporter
Annual Statement Studies, Risk Management Association, formerlyRobert Morris and Associates
www.gale.comwww.instat.com
www.hoovers.comwww.sec.gov/edgarhp.htm
www.census.gov
www.stat-usa.govwww.cia.gov/cia/publicationswww.census.gov/ftp/pub/ipc/www/
idbnew.htmlwww.i-trade.com
www.stat-usa.gov
www.cyberatlas.comwww.ecommercetimes.comwww.mediametrix.comwww.emarketer.com
www.forrester.comwww.gartner.comwww.scarborough.comwww.findsvp.com
www.dis.strath.ac.uk/business
www.rmahq.org/ann_studies/asstudies.html
Given the rate of change on the Web, some Internet addresses may change, and some print sources may add websites.
Source: Robert I. Berkman, Find It Fast: How to Uncover Expert Information on Any Subject in Print orOnline (New York: HarperCollins, 1997); various Web addresses as listed above.
www
• Every forecast and estimate of market potential iswrong! Evidence-based forecasts and estimates, pre-pared using the tools provided in this chapter, are far
more credible—and generally more accurate—thanhunches or wild guesses. A menu of evidence-basedforecasting approaches is provided in this chapter.

Walker et al.: Marketing Strategy: A Decision−Focused Approach, Fourth Edition
II. Opportunity Analysis 6. Measuring Market Opportunities
208 © The McGraw−Hill Companies, 2002
Section Two Opportunity Analysis146
• Forecasts have powerful influence on what companiesdo, through budgets and other planning procedures.Thus, forecasting merits significant management atten-tion and commitment.
• Superior market knowledge is not only an importantsource of competitive advantage, but it also results inhappier, higher-volume, and more loyal customers.Thus, the systematic development of market knowledgeis a critically important activity in any organization.
• Much can go wrong in marketing research and oftendoes. Becoming an informed and critical user of mar-keting research is an essential skill for anyone whoseeks to contribute to strategic decision making.
• Self-diagnostic questions to test your ability to applythe analytical tools and concepts in this chapter tomarketing decision making may be found at thisbook’s website at www.mhhe.com/walker.
Endnotes
1. Information to prepare this section was taken from Anita M. McGahan,African Communications Group (Condensed) (Boston: Harvard BusinessSchool Publishing, 1999); and Dale O. Coxe, African Communications Group(Boston: Harvard Business School Publishing, 1996).
2. Charles Wardell, “High-Performance Budgeting,” Harvard ManagementUpdate, January 1999.
3. Ibid.
4. Peter L. Bernstein and Theodore H. Silbert, “Are Economic ForecastersWorth Listening to,” Harvard Business Review, July–August 1982.
5. F. William Barnett, “Four Steps to Forecast Total Market Demand,” Har-vard Business Review, July–August 1988.
6. For a more detailed look at forecasting methods, see David M. Georgeoffand Robert G. Murdick, “Manager’s Guide to Forecasting,” Harvard BusinessReview, January–February 1986; and John C. Chamber, Satinder K. Mullick,and Donald D. Smith, Harvard Business Review, July–August 1971.
7. Arthur Schleifer Jr., Forecasting with Regression Analysis (Boston: Har-vard Business School Publishing, 1996).
8. See Frank M. Bass, “A New Product Growth Model for ConsumerDurables,” Management Science, January 1969, pp. 215–27; and Trichy V.Krishnan, Frank M. Bass, and V. Kumar, “Impact of a Late Entrant on the Dif-fusion of a New Product/Service,” Journal of Marketing Research, May 2000,pp. 269–78.
9. For more on conjoint analysis, see Robert J. Dolan, Conjoint Analysis: AManager’s Guide (Boston: Harvard Business School Publishing, 1990).
10. McGahan, African Communications Group (Condensed).
11. For more on concept testing, see Robert J. Dolan, Concept Testing(Boston: Harvard Business School Publishing, 1990).
12. McGahan, African Communications Group (Condensed).
13. Fareena Sultan, Marketing Research for High Definition Television(Boston: Harvard Business School Publishing, 1991).
14. Colin Welch and Ananth Raman, Merchandising at Nine West RetailStores (Boston: Harvard Business School Publishing, 1998).
15. Coxe, African Communications Group.
16. A key challenge for manufacturers is to be able to quickly adjust produc-tion schedules to adapt to demand that differs from the forecast. To read moreabout how to enable production to respond quickly in the face of unforeseenchanges in demand, see Marshall L. Fisher, Janice H. Hammond, Walter R.Obermeyer, and Ananth Raman, “Making Supply Meet Demand in an Uncer-tain World,” Harvard Business Review, May–June 1994.
17. Amos Tversky and Daniel Kahneman, “Judgment under Uncertainty,”Science 185 (1974), pp. 1124–31.
18. Li and Calantone define market knowledge as “organized and structuredinformation about the market.” See Tiger Li and Roger J. Calantone, “TheImpact of Market Knowledge Competence on New Product Advantage: Con-ceptualization and Empirical Examination,” Journal of Marketing, October1998, pp. 13–29.
19. Welch and Raman, Merchandising at Nine West Retail Stores.
20. For more on data mining and related topics, see Peter Jacobs, “Data Min-ing: What General Managers Need to Know,” Harvard Management Update,October 1999; and Jeff Papows, Enterprise.com: Market Leadership in theInformation Age (Cambridge, MA: Perseus Publishing, 1998).
21. Information in this section comes from the Society of Competitive Intel-ligence Professionals website at www.scip.org/images/education/ci.htm.
22. For more on marketing research, see any business school marketingresearch text, such as Dillon, Madden, and Firtle, Marketing Research in aMarketing Environment (Burr Ridge, IL: Irwin/McGraw-Hill, 1993). Also seePamela L. Alreck and Robert B. Settle, The Survey Research Process (BurrRidge, IL: Irwin/McGraw-Hill, 1994). The survey research methods sectionof the American Statistical Association offers useful guides to conductingfocus groups and surveys. Downloadable PDF files may be found atwww.stat.ncsu.edu/info/srms/srms.html.

Walker et al.: Marketing Strategy: A Decision−Focused Approach, Fourth Edition
II. Opportunity Analysis 7. Targeting Attractive Market Segments
209© The McGraw−Hill Companies, 2002
148
Chapter Seven
TARGETING ATTRACTIVE
MARKET SEGMENTS
OurBeginning.com Bets $5 Million on Super Bowl Ads1
Michael Budowski likes living on the edge.In September 1999, it occurred to him thatthe Super Bowl offered an opportunity to
“Put a turbocharger in this company,” as he put it.In early 1999, Budowski had convinced his wifeSusan, who ran a small business as a wedding con-sultant out of their home, to expand into cyber-space. They soon launched the OurBeginningwebsite, where customers could order wedding invi-tations, birth announcements, thank you notes, andother printed matter. Now, in September, with theSuper Bowl looming, Budowski saw an opportunityto put his company on the map and quickly estab-lish his brand. The Super Bowl was the top-rated TVshow of the year, with an expected viewing audi-ence of 135 million people.
A Significant Investment
A successful entrepreneur with interests in therestaurant industry and the exterminating business,CEO Budowski and investor and COO Michael Bran-denburg spent three weeks obtaining loans and sell-ing equity to fund their $5 million gamble. They
would need $1 million to beef up the site so it couldhandle an anticipated two million users a day, farbeyond its average of only 10,000 per day. Theywould pay Disney i.d.e.a.s., a unit of the Walt Dis-ney Company, another $1 million to create a seriesof funny ads out of the seemingly staid topic of sta-tionery and wedding invitations. And they wouldspend $3 million to run three pregame ads and afourth spot during the game. For his $5 million,Budowski hoped to create a database of five mil-lion customers (many of whom would have heardabout the site while watching the big game), estab-lish brand recognition, and jumpstart his sales.
Budowski was not the only dot-com entrepre-neur who saw the Super Bowl as a path to riches.Two dot-com companies, Monster.com andHotJobs.com, had made big splashes the yearbefore with clever Super Bowl ads, and HotJobshad, in August, successfully completed a success-ful initial public offering of its stock. After a monthof trading, the stock had tripled. For the upcominggame on January 30, 2000, more than a dozen dot-com companies had made plans similar toBudowski’s, notwithstanding the $2.2 million aver-age cost to run a single 30-second TV commercial.

Walker et al.: Marketing Strategy: A Decision−Focused Approach, Fourth Edition
II. Opportunity Analysis 7. Targeting Attractive Market Segments
210 © The McGraw−Hill Companies, 2002
149
Measuring the Results
So, what happened? Did the flurry of Super Bowlads take these companies where they wanted togo? According to a study by Nielsen/NetRatings, thedot-com Super Bowl ads did not necessarily trans-late into sustained increases in Web traffic. Forestablished Web brands, the ads seemed to havehelped hold and increase their Web traffic. Com-paring traffic in January and March, Monster.comtraffic was up 6 percent, to 2.6 million unique vis-itors in March; E-Trade.com was up 18 percent; andPets.com was up 7 percent (see Exhibit 7.1). For
Britannica, an established offline brand still new to the Web, traffic was up 68 percent to just overone million unique visitors in March. For unknownnewcomers like OurBeginnings, however, the storywas mostly dismal. While AutoTrader.com haddone well, with a traffic increase of 45 percent toalmost 1.6 million unique visitors, most newcom-ers, as a lot, had generated small numbers of newvisitors, especially in light of the spending it tookto generate them. For most of them, includingOurBeginning.com, the Super Bowl–generatedspike in February traffic had fallen off sharply inMarch.
Exhibit 7.1Traffic at Websites of Dot-com Advertisers: Super Bowl 2000
Unique Audience
Site January February March
Monster.com 2,465,104 2,477,203 2,604,519
E-Trade.com 1,877,011 1,810,694 2,223,285
AutoTrader.com 1,099,489 1,508,672 1,593,865
WebMD.com 1,041,583 969,586 1,331,850
LifeMinders.com 1,207,055 1,413,347 1,104,164
Britannica.com 594,468 779,927 1,003,216
Pets.com 592,029 532,442 636,319
HotJobs.com 794,933 731,085 598,112
OnMoney.com NA 217,284 349,632
Kforce.com 167,355 247,705 156,399
Netpliance.com 38,395* 100,536 119,185
OurBeginning.com 284,049 510,730 92,292*
LastMinuteTravel.com 50,474* 77,869* 50,965*
Computer.com 68,468* 89,910* 31,669*
Epidemic.com 77,131* 31,263* NA
Agillion.com NA NA NA
NA—Fewer than 10 visitors.
* Below statistically stable total. From: Nielsen/NetRatings survey of 50,000 Web surfers.
Source: Greg Farrell, “Bailing Out from the Super Bowl Ad Binge,” USA Today, June 7, 2000. Copyright2000, USA Today. Reprinted with permission.
www

Walker et al.: Marketing Strategy: A Decision−Focused Approach, Fourth Edition
II. Opportunity Analysis 7. Targeting Attractive Market Segments
211© The McGraw−Hill Companies, 2002
Section Two Opportunity Analysis150
Strategic Challenges Addressed
In Chapter 7
OurBeginning.com’s Super Bowl advertising is but one example of the many cases wherenaïve marketers fail to clearly identify the target market most likely to purchase their goodsor services. In doing so, they risk wasting enormous resources by paying to deliver pro-motional messages to customers who are unlikely to buy what they have to sell. Whilesome Super Bowl viewers undoubtedly fell into the demographic group most likely to needwedding invitations, birth announcements, and related products, most in that very broadaudience did not. The problem for Budowski was that each set of eyeballs had to be paidfor, whether they fell into the target market or not.
In Chapter 7, we draw on the foundation of market knowledge and customer under-standing that the reader of the first six chapters is now able to assemble to introduce whatare probably the most important and fundamental tools in the marketer’s toolkit: market
segmentation and target marketing. Together with product positioning,which we address in Chapter 8, these tools provide the platform uponwhich most effective marketing programs are built. Learning to applythese tools effectively, however, requires that several important questionsbe addressed. Why do market segmentation and target marketing makesense; why not pitch our wares to the widest possible audience, as did
Michael Budowski during Super Bowl 2000? Second, how can potentially attractive mar-ket segments be identified and defined? Finally, how can these segments be prioritized sothat the most attractive ones are pursued? Answering these questions should enable any
Of course, some would argue that traffic countsonly tell part of the story. Huge media coverage ofthe dot-com phenomena placed many of thesecompanies’ names in the popular and businesspress, in both print and broadcast media. OurBe-ginning.com received more than 450 print men-tions and 100 broadcast hits. Others would saythat the Super Bowl exposure would make it eas-ier for them to raise venture capital, a task grow-ing more difficult by the day in 2000, as thedot-com financing window nearly slammed shut.These advertisers and their agencies used theseexplanations to put a brave face on the results.
But those who would assess the effectiveness ofthese Super Bowl ads in consumer marketing termswould prefer to use as metrics either the relation-ships between ad spending and the revenue dollarsthey generated—never mind margin dollars—or theper-customer cost of acquiring new customers. Let’slook at OurBeginning.com’s results. First, traffic. Inthe first quarter, January through March, their sitehad, according to their own reports, one millionunique visitors, a figure not dramatically dissimilarto the Nielsen figure of 882,000 visitors (see Exhibit
7.1). At two million total hits, this traffic representedan average of just over 20,000 hits per day, up from10,000 per day in the fall of 1999. While traffic wasindeed up, the Super Bowl effort seemed to havefallen well short of Budowski’s goal of building afive-million-customer database. What about sales,you ask? The one million visitors spent a total of$510,000 in the first quarter, a figure equal toapproximately one-tenth of the marketing expenseit took to generate these sales. If a typical customerspent $50 to $100—an educated guess—OurBegin-ning.com acquired perhaps 5,000 to 10,000 cus-tomers, at a cost of $5 million. These figurestranslate into a customer acquisition cost of $500to $1,000 per customer.
Was it worth it? Are new customers worth thiscost? Did Budowski’s $5 million bet pay off? Timewill tell whether those who learned of his site fromthe Super Bowl ads and the attendant publicity willbuy enough wedding invitations, birth announce-ments, and other things OurBeginning.com sells tomake the effort worthwhile. What if they don’t? “Itdoesn’t fold the company,” he says. “I like living onthe edge, but not that close to the edge.”
Strategic Issue
The most important and fundamental toolsin the marketer’s toolkit—market segmenta-tion and target marketing—provide the plat-form upon which most effective marketingprograms are built.

Walker et al.: Marketing Strategy: A Decision−Focused Approach, Fourth Edition
II. Opportunity Analysis 7. Targeting Attractive Market Segments
212 © The McGraw−Hill Companies, 2002
Chapter Seven Targeting Attractive Market Segments 151
entrepreneur, a venture capital investor in Silicon Valley, or a marketing manager in anestablished firm to decide which market segments should be targeted and which invest-ments should be made.
Why Do Market Segmentation
and Target Marketing Make Sense?
Market segmentation is the process by which a market is divided into distinct subsets ofcustomers with similar needs and characteristics that lead them to respond in similar waysto a particular product offering and marketing program. Target marketing requires evalu-ating the relative attractiveness of various segments (in terms of market potential, growthrate, competitive intensity, and other factors) and the firm’s mission and capabilities todeliver what each segment wants, in order to choose which segments it will serve. Productpositioning entails designing product offerings and marketing programs that collectivelyestablish an enduring competitive advantage in the target market by creating a uniqueimage, or position, in the customer’s mind. Arguably, OurBeginning.com would have beenbetter served by examining its early customer base, or other customers it sought to serve,to determine who comprised its target market and how that market could best be reached—in terms of effectiveness and efficiency—with promotional strategies intended to win newcustomers.
These three decision processes—market segmentation, target marketing, and position-ing—are closely linked and have strong interdependence. All must be well considered andimplemented if the firm is to be successful in managing a given product-market relation-ship. More often than not, successful companies have been able to manage this relation-ship and, in so doing, distance themselves from their competitors. Consider the followinginternational example.2
In England, Japanese companies have outperformed their British rivals across a range ofindustries. A major reason for this was that the Japanese were better at managing the seg-mentation, targeting, and positioning relationships. Thus, only 13 percent of the Japanesefirms versus 47 percent of the British were unclear about their target segment of customersand their special needs.
All too often the marketing directors of the British companies remarked that they see theirtarget market as being the whole market and since their products had wide appeal, there wasno need to segment the market. As a consequence, the Japanese concentrated their resourcesin specific high-potential segments while the British tended to spread theirs thinly across theentire market. When British companies did segment, they did so at the lower, cheaper end ofthe market. This resulted in customers increasingly perceiving the Japanese, in contrast to theBritish, as offering quality and status.
However large the firm, its resources are usually limited compared with the number ofalternative market segments available for investment. Thus, a firm must make choices.Even in the unusual case where a firm can afford to serve all market segments, it mustdetermine the most appropriate allocation of its marketing effort across segments. But areall these analyses and conscious choices about which segments to serve really necessary?
Most Markets Are HeterogeneousBecause markets are rarely homogeneous in benefits wanted, purchase rates, and price andpromotion elasticities, their response rates to products and marketing programs differ.Variation among markets in product preferences, size and growth in demand, media habits,
Walker et al.: Marketing Strategy: A Decision−Focused Approach, Fourth Edition
II. Opportunity Analysis 7. Targeting Attractive Market Segments
213© The McGraw−Hill Companies, 2002
Section Two Opportunity Analysis152
and competitive structures further affect the differences and response rates. Thus, marketsare complex entities that can be defined (segmented) in a variety of ways. The critical issueis to find an appropriate segmentation scheme that will facilitate target marketing, productpositioning, and the formulation of successful marketing strategies and programs. Manydot-com advertisers who invested considerable sums in Super Bowl ads in 2000, only towin minimal consumer response, now recognize that broadly targeted advertising that failsto identify and reach a properly focused target market is a roadmap to bankruptcy. Ofcourse, some of these advertisers would say that their real purpose was to reach venturecapital investors or others who might eventually buy their stock in a hoped-for IPO. Wasthe Super Bowl a cost-effective way to reach these target markets with their message? His-tory—not to mention sound marketing practice—suggests otherwise.
Today’s Market Realities Often Make Segmentation ImperativeMarket segmentation has become increasingly important in the development of marketingstrategies for several reasons. First, population growth has slowed, and more product-markets are maturing. This sparks more intense competition as firms seek growth via gainsin market share (the situation in the automobile industry) as well as in an increase in brandextensions (Starbucks coffee ice cream, Colgate toothbrushes, Visa traveler’s checks).
Second, such social and economic forces as expanding disposable incomes, higher edu-cational levels, and more awareness of the world have produced customers with more var-ied and sophisticated needs, tastes, and lifestyles than ever before. This has led to anoutpouring of goods and services that compete with one another for the opportunity of sat-isfying some group of consumers.
Third, there is an increasingly important trend toward microsegmentation in whichextremely small market segments are targeted.3 This trend has been accelerated in someindustries by new technology such as computer-aided design, which has enabled firms tomass-customize many products as diverse as designer jeans and cars. For example, manyautomobile companies are using a flexible production system that can produce differentmodels on the same production line. This enables the company to produce cars made toorder and soon, perhaps, sell them on the Internet.4
Finally, many marketing organizations have made it easier to implement sharplyfocused marketing programs by more sharply targeting their own services. For example,many new media have sprung up to appeal to narrow interest groups. These include spe-cial interest magazines, such as Backpacker and Working Mother; radio stations with for-mats targeted to different demographic groups, such as classical music, rock, country, andjazz, not to mention talk shows of various kinds; and cable TV channels, such as Nick-elodeon and the Filipino Channel. Also, more broad-based magazines such as Newsweek,Sports Illustrated, and People offer advertisers the opportunity to target specific groups ofpeople within their subscription base. An advertiser can target specific regions, cities, orZip codes, or even selected income groups.
In addition to forcing firms to face the realities of the marketplace, market segmenta-tion offers the following benefits:
• It identifies opportunities for new product development. Often a careful analysis of varioussegments of potential customers reveals one or more groups whose specific needs and con-cerns are not being well-satisfied by existing competitive offerings. Such uncovered seg-ments may represent attractive opportunities for development of new products or innovativemarketing approaches: for example, the laptop computer.
www
Walker et al.: Marketing Strategy: A Decision−Focused Approach, Fourth Edition
II. Opportunity Analysis 7. Targeting Attractive Market Segments
214 © The McGraw−Hill Companies, 2002
Chapter Seven Targeting Attractive Market Segments 153
• It helps in the design of marketing programs that are most effective for reaching homoge-neous groups of customers.
• It improves the strategic allocation of marketing resources. The strategic benefits of seg-mentation are sometimes overlooked. Well-defined segments, when coupled with specificproducts, serve as potential investment centers for a business. Most successful businessstrategies are based on market segmentation and a concentration of resources in the moreattractive segments. Segmentation should focus on subdividing markets into areas in whichinvestments can gain a long-term competitive advantage.
How Are Market Segments
Best Defined?
There are several important objectives entailed in the market segmentation process:
• The process should identify one or more relatively homogeneous groups of prospective buy-ers with regard to their wants and needs and/or their likely responses to differences in the ele-ments of the marketing mix—the 4 Ps (product, price, promotion, and place). For marketersof athletic shoes, such as Nike and Adidas, for example, high-performance distance runnersis such a segment.
• Differences within one market segment should be small compared to differences across varioussegments (most high-performance distance runners probably have athletic footwear needs thatare quite similar to one another, but quite different from, say, the needs of basketball players).
• The segmentation criteria should measure or describe the segments clearly enough so thatmembers can be readily identified and accessed, in order for the marketer to know whether agiven prospective customer is or is not in the target market and in order to reach the prospec-tive customer with advertising or other marketing communication messages. Nike or Adidasmight have defined their initial target market as being comprised of members of runningclubs or distance runners on collegiate track and cross-country teams.
• Finally, the segmentation process should determine the size and market potential of each seg-ment for use in prioritizing which segments to pursue, a topic we address in more detail laterin this chapter. Nike, for example, could easily ascertain how many such runners there werein the United States, and they probably knew how many pairs of shoes per year the typicaldistance runner bought, at what average price.
Given these objectives, what kinds of segmentation criteria, or descriptors, are mostuseful? Marketers divide segmentation descriptors into three major categories for bothconsumer and organizational markets: demographic descriptors (which reflect who thetarget customers are), geographic descriptors (where they are), and behavioral descrip-tors of various kinds (how they behave with regard to their use and/or purchases of a givencategory of goods or services). We examine each of these categories next.
Demographic DescriptorsWhile firm demographics (age of firm, size of firm, industry, etc.) are useful in segment-ing organizational markets, we usually think of demographics in terms of attributes ofindividual consumers, as shown in Exhibit 7.2. Some examples of demographic descrip-tors used to segment consumer markets are as follows:
Age: “Thanks to a demographic trend that is being called ‘invasion of the stroller people,’ babiesare hot, both as consumers and marketing tools.” There are nearly 24 million children under fivein the United States—20 percent more than in 1980. Aside from medical costs, new parents spendon average $7,000 on a baby’s first year. Nike has announced a new line of toddler clothes.5
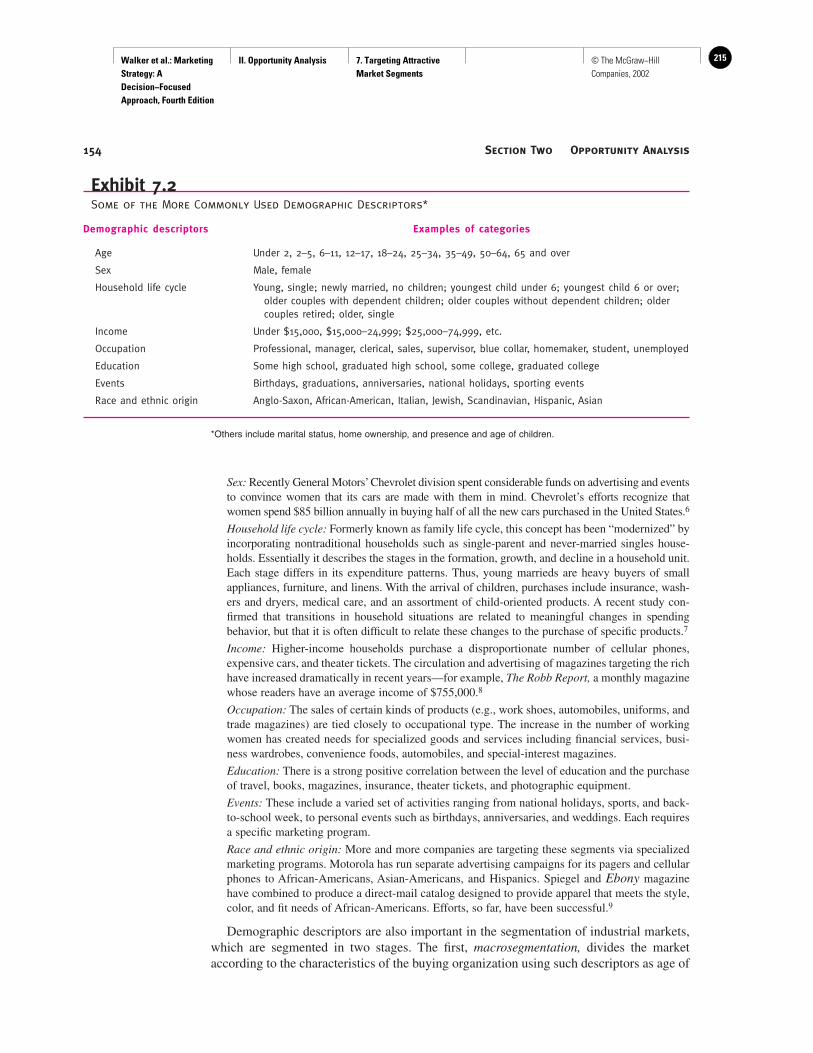
Walker et al.: Marketing Strategy: A Decision−Focused Approach, Fourth Edition
II. Opportunity Analysis 7. Targeting Attractive Market Segments
215© The McGraw−Hill Companies, 2002
Section Two Opportunity Analysis154
Sex: Recently General Motors’Chevrolet division spent considerable funds on advertising and eventsto convince women that its cars are made with them in mind. Chevrolet’s efforts recognize thatwomen spend $85 billion annually in buying half of all the new cars purchased in the United States.6
Household life cycle: Formerly known as family life cycle, this concept has been “modernized” byincorporating nontraditional households such as single-parent and never-married singles house-holds. Essentially it describes the stages in the formation, growth, and decline in a household unit.Each stage differs in its expenditure patterns. Thus, young marrieds are heavy buyers of smallappliances, furniture, and linens. With the arrival of children, purchases include insurance, wash-ers and dryers, medical care, and an assortment of child-oriented products. A recent study con-firmed that transitions in household situations are related to meaningful changes in spendingbehavior, but that it is often difficult to relate these changes to the purchase of specific products.7
Income: Higher-income households purchase a disproportionate number of cellular phones,expensive cars, and theater tickets. The circulation and advertising of magazines targeting the richhave increased dramatically in recent years—for example, The Robb Report, a monthly magazinewhose readers have an average income of $755,000.8
Occupation: The sales of certain kinds of products (e.g., work shoes, automobiles, uniforms, andtrade magazines) are tied closely to occupational type. The increase in the number of workingwomen has created needs for specialized goods and services including financial services, busi-ness wardrobes, convenience foods, automobiles, and special-interest magazines.
Education: There is a strong positive correlation between the level of education and the purchaseof travel, books, magazines, insurance, theater tickets, and photographic equipment.
Events: These include a varied set of activities ranging from national holidays, sports, and back-to-school week, to personal events such as birthdays, anniversaries, and weddings. Each requiresa specific marketing program.
Race and ethnic origin: More and more companies are targeting these segments via specializedmarketing programs. Motorola has run separate advertising campaigns for its pagers and cellularphones to African-Americans, Asian-Americans, and Hispanics. Spiegel and Ebony magazinehave combined to produce a direct-mail catalog designed to provide apparel that meets the style,color, and fit needs of African-Americans. Efforts, so far, have been successful.9
Demographic descriptors are also important in the segmentation of industrial markets,which are segmented in two stages. The first, macrosegmentation, divides the marketaccording to the characteristics of the buying organization using such descriptors as age of
Exhibit 7.2Some of the More Commonly Used Demographic Descriptors*
Demographic descriptors Examples of categories
Age Under 2, 2–5, 6–11, 12–17, 18–24, 25–34, 35–49, 50–64, 65 and over
Sex Male, female
Household life cycle Young, single; newly married, no children; youngest child under 6; youngest child 6 or over; older couples with dependent children; older couples without dependent children; older couples retired; older, single
Income Under $15,000, $15,000–24,999; $25,000–74,999, etc.
Occupation Professional, manager, clerical, sales, supervisor, blue collar, homemaker, student, unemployed
Education Some high school, graduated high school, some college, graduated college
Events Birthdays, graduations, anniversaries, national holidays, sporting events
Race and ethnic origin Anglo-Saxon, African-American, Italian, Jewish, Scandinavian, Hispanic, Asian
*Others include marital status, home ownership, and presence and age of children.

Walker et al.: Marketing Strategy: A Decision−Focused Approach, Fourth Edition
II. Opportunity Analysis 7. Targeting Attractive Market Segments
216 © The McGraw−Hill Companies, 2002
Chapter Seven Targeting Attractive Market Segments 155
firm, firm size, and industry affiliation (SIC code). The international counterpart of SIC isthe trade-category code.
The second stage, microsegmentation, groups customers by the characteristics of theindividuals who influence the purchasing decision—for instance, age, sex, and positionwithin the organization. International markets are segmented in a similar hierarchical fash-ion, starting with countries, followed by groups of individuals or buying organizations.
Geographic DescriptorsDifferent locations vary in their sales potential, growth rates, customer needs, cultures,climates, service needs, and competitive structures, as well as purchase rates for a varietyof goods. For example, more pickup trucks are sold in the southwest United States, morevans in the Northeast, and more high-priced imports in the West. Uni-Marts, Inc., a con-venience store operator of over 400 stores, focuses on small towns and rural areas, therebyavoiding big competitors. In its 23-year history, it has yet to record a loss.10
Geographic segmentation is used in both consumer and organizational markets and isparticularly important in retailing and many services businesses, where customers areunwilling to travel very far to obtain the goods or services they require. Thus, one way tosegment retail markets is by distance or driving time from a particular location. The areaincluded within such a geographically defined region is called a trade area.
In the brave new world of electronic commerce, geographic segmentation issues can bevery important, given the global reach of the Internet. For an example of how one onlineauction site is segmenting and targeting the European market country by country, seeExhibit 7.3.
www
From Jim Rose’s office in London, more than 5,000miles from Silicon Valley, eBay doesn’t look so invin-
cible. Rose, chief executive officer of QXL.com,believes that thinking global means thinking local.Unlike eBay, QXL lets established retailers as well asordinary consumers pitch their wares, to make rela-tively inexperienced European net surfers more com-fortable with the online auction game.
Rather than fielding a single website for the Euro-pean continent, QXL moved from its 1997 start in theUnited Kingdom to a dozen countries by 2000. Insome, it launched a new site; in others it bought analready established player. Says Rose, “We’re operat-ing in 12 different languages. That means 12 differentcurrencies, too.” Though the QXL logo looks identicalon each country’s site, the merchandise featured onthe sites’ front pages varies substantially. On its Ger-man site, for example, a travel agency might be auc-tioning a vacation package to Majorca, a destinationpopular with German travelers. “You would never findthat on the list for a U.K. promotion,” says Stanislaus
Laurent, a 31-year-old Frenchman and QXL’s senior vicepresident of sales and marketing. “In the U.K. it wouldbe Madrid, or maybe St. Lucia.” To ensure that eachsite effectively targets local preferences and needs,each one has its own office and staff that customizeswhat QXL offers and oversees local marketing efforts.
Is QXL’s segmented, targeted approach working?“QXL is painfully slow and antiquated compared witheBay,” says Heather Gardner, a British bank clerk whosells antiques and collectibles online. But she pointsout that her merchandise sells better on QXL than itdoes on eBay’s U.K. site. “For some reason, I get thesales there,” she says. Whether QXL’s targeted, seg-mented approach will win the war against eBay hasyet to be determined. As Jim Rose says, “The issue ishow you execute.”
Source: Thomas E. Weber, “EBay’s European Rival ExpandsMethodically, Country by Country,” Wall Street Journal, June 26, 2000,p. B1. Copyright 2000 by Dow Jones & Co. Inc. Reproduced with per-mission of Dow Jones & Co. Inc. via Copyright Clearance Center.
Exhibit 7.3 QXL’s Segmented Approach Expands across Europe, Country by Country

Walker et al.: Marketing Strategy: A Decision−Focused Approach, Fourth Edition
II. Opportunity Analysis 7. Targeting Attractive Market Segments
217© The McGraw−Hill Companies, 2002
Section Two Opportunity Analysis156
Geodemographic DescriptorsMany segmentation schemes involve both demographic and geographic factors. Thus,retailers usually want to know something about the people who live within, say, a two-mileor five-mile radius of their proposed new store. Neiman Marcus, the upscale departmentstore, might target one demographic group within a given trade area, and Wal-Mart, a dis-counter, might target another. National Decision Systems (www.ends.com) and othersources offer low-cost reports based on census data that show the demographic profile ofthe population residing within any given radius of a particular street corner or shoppingcenter location. These reports are useful in assessing the size and market potential of amarket segment defined by a particular trade area. Geodemographics also attempts to pre-dict consumer behavior by making demographic, psychographic, and consumer informa-tion available at the block and Zip code levels. Claritas’s PRIZM service classifies all U.S.households into 62 demographically and behaviorally distinct clusters, each of which, inturn, is assigned to one of 15 social groups.11
Behavioral DescriptorsThere is no limit to the number of insightful ways successful marketers have segmentedmarkets in behavioral terms. Nike originally targeted high-performance distance runners.Specialized and Gary Fisher target bicyclists who wish to ride on single-track trails orback-country terrain. Europe’s EasyJet airline targets leisure travelers. Gatorade’s originaltarget market consisted of athletes who needed to replenish water and salts lost throughperspiration. This simple segmentation scheme created a whole new category of “sportsbeverages,” which now includes entries from Coke (Powerade) and Pepsi (All Sport),though Gatorade still dominates the category with an 80 percent market share. This one-time niche market has grown into a $2.2 billion market in the United States alone.12 Theseexamples all demonstrate the power of highly specific behavioral descriptors in definingsharply focused market segments, based not on who the target consumers are or where theylive, but based on what they do. In virtually every consumer and organizational marketthere are probably segments like these just waiting to be identified and targeted by insight-ful marketers. Behavioral descriptors can take many forms, including those based on con-sumer needs; on more general behavioral patterns, including lifestyle or social class; and,in organizational markets, on the structure of firms’ purchasing activities and the types ofbuying situations they encounter.
Consumer Needs Customer needs are expressed in benefits sought from a particularproduct or service. Individual customers do not have identical needs and thus attach dif-ferent degrees of importance to the benefits offered by different products. In the end, theproduct that provides the best bundle of benefits—given the customer’s particular needs—is most likely to be purchased.
Since purchasing is a problem-solving process, consumers evaluate product or brandalternatives on the basis of desired characteristics and how valuable each characteristic isto the consumer—choice criteria. Marketers can define segments according to these dif-ferent choice criteria in terms of the presence or absence of certain characteristics and theimportance attached to each. Firms typically single out a limited number of benefit seg-ments to target. Thus, for example, different automobile manufacturers have emphasizeddifferent benefits over the years, such as safety (presence of side door airbags), reliability,and high mileage versus styling, quickness, and status.
In organizational markets, customers consider relevant benefits that include productperformance in different use situations. For example, some super computers are bought

Walker et al.: Marketing Strategy: A Decision−Focused Approach, Fourth Edition
II. Opportunity Analysis 7. Targeting Attractive Market Segments
218 © The McGraw−Hill Companies, 2002
Chapter Seven Targeting Attractive Market Segments 157
because they meet the high-speed computational requirements of a small group of cus-tomers such as governments, universities, and research labs. Other considerations in thepurchase of industrial products/services include on-time delivery, credit terms, economy,spare parts availability, and training.
Product-Related Behavioral Descriptors In addition to highly specific behav-ioral descriptors such as those just discussed, there are more general product-relateddescriptors as well. They include product usage, loyalty, purchase predisposition, and pur-chase influence, all of which can be used to segment both consumer and industrial mar-kets. Product usage is important because in many markets a small proportion of potentialcustomers makes a high percentage of all purchases. In organizational markets, the cus-tomers are better known, and heavy users (often called key accounts) are easier to identify.
With respect to loyalty—as reflected by the numbers of successive purchases madeover time—current users can vary considerably in their purchases of a given brand orpatronage of a particular supplier. In organizational markets, sellers can often observe thisdirectly; in consumer markets, identifying loyal customers requires marketing research.13
Consumers hold different predispositions toward the purchase of a product. A marketsegmentation scheme based on product knowledge (are they aware of it?) and purchasepredisposition can identify the nonusers who are most likely to become future buyers. Forexample, knowledgeable nonusers who state intentions to buy, say, a high-fiber cereal arethe most likely to become future users. Knowledgeable nonusers who do not intend to buy,on the other hand, would probably represent a low potential.
Market segmentation based on sources of purchase influence is relevant for both con-sumer and organizational markets. Many products used by various family members arepurchased by the wife, but joint husband–wife decisions are becoming more common.Children’s products, prescription drugs, and gifts are clearly influenced by a variety ofindividuals. In organizational markets, several individuals or units with varying degrees ofinfluence participate in the buying center.
General Behavioral Descriptors More general behavioral descriptors, includinglifestyle and social class, are also commonly used in consumer markets. In organizationalmarkets, prospective customers differ in how they structure their purchasing activities andin the nature of the buying situations they are engaged in.
Lifestyle Segmentation by lifestyle, or psychographics, groups consumers on the basisof their activities, interest, and opinions. From such information it is possible to infer whattypes of products and services appeal to a particular group, as well as how best to com-municate with individuals in the group.
Various segmentation approaches based on lifestyle have been developed, either bycompanies seeking to segment their own markets or by service providers whose tools areavailable to anyone. For example, Goodyear Tire and Rubber and Ogilvy and Mather (anadvertising agency), working separately, have developed several classifications for globallifestyle segments. The Goodyear effort consists of six groups: the prestige buyer, the com-fortable conservative, the value shopper, the pretender, the trusting patron, and the bargainhunter. Ogilvy and Mather proposes 10 global segments based on lifestyle characteristics:basic needs, fairer deal, traditional family life, conventional family life, look-at-me, some-body better, real conservatism, young optimist, visible achiever, and socially aware.14
Stanford Research Institute (SRI) has created an improved U.S. segmentation service(called VALS 2), which builds on the concept of self-orientation and resources for the indi-vidual. Self-orientation is based on how consumers pursue and acquire products and serv-ices that provide satisfaction and shape their identities. In doing so, they are motivated by

Walker et al.: Marketing Strategy: A Decision−Focused Approach, Fourth Edition
II. Opportunity Analysis 7. Targeting Attractive Market Segments
219© The McGraw−Hill Companies, 2002
Section Two Opportunity Analysis158
the orientations of principle, status, and action. Principle-oriented consumers are moti-vated by abstract and idealized criteria, while status-oriented consumers shop for productsthat demonstrate the consumer’s success. Action-oriented consumers are guided by theneed for social or physical activity, variety, and risk taking.
Resources include all of the psychological, physical, demographic, and materialmeans consumers have to draw on. They include education, income, self-confidence,health, eagerness to buy, intelligence, and energy level—on a continuum from minimal toabundant.
Based on these two dimensions, VALS 2 defines eight segments that exhibit distinctivebehavior and decision making: actualizers, fulfillers, achievers, experiencers, believers,strivers, makers, and strugglers. The segments are approximately the same size so as torepresent viable market targets. Claritas and similar commercial organizations identifyeach of the respondents as to their VALS type, thereby permitting a cross-classification ofVALS type with the product usage and personal information collected by such companies.Thus, users can determine what each VALS segment bought, what their media habits are,and similar data. The VALS system has been further developed in Europe and Asia.15
Those interested in the VALS segmentation scheme can complete a short survey on theVALS website (log onto http://future.sri.com/VALS/VALSindex.shtml) and discoverthe VALS segment to which they belong.
Social Class Every society has its status groupings based largely on similarities in in-come, education, and occupation.16 Because researchers have long documented the valuesof the various classes, it is possible to infer certain behavior concerning a given product. Forexample, the middle classes tend to place more value on education, family activities, clean-liness, and being up-to-date than do lower-class families. In the international field, one hasto be careful in using social class as a segmentation variable since the differences amongclasses can become blurred, as they do in the Scandinavian countries.17 In America many ofthe criteria used to define class status seem to some to be no longer applicable as the nationbecomes increasingly fragmented into dozens of distinct subcultures, each with its ownunique tastes and ambitions. As noted earlier, Claritas, Inc., has identified 62 distinct classesin the United States, each with its own set of beliefs and aspirations.18
Organizational or Firm Behavioral Descriptors Purchasing structure and buy-ing situation segmentation descriptors are unique to organizational markets. Purchasingstructure is the degree to which the purchasing activity is centralized. In such a structurethe buyer is likely to consider all transactions with a given supplier on a global basis, toemphasize cost savings, and to minimize risk. In a decentralized situation, the buyer is aptto be more sensitive to the user’s need, to emphasize product quality and fast delivery, andto be less cost-conscious.
The buying situation descriptor includes three distinct types of situations: straightrebuy, a recurring situation handled on a routine basis; modified rebuy, which occurs whensome element, such as price or delivery schedules, has changed in a client–supplier rela-tionship; and a new buying situation, which may require the gathering of considerableinformation and an evaluation of alternative suppliers.
Global Market SegmentationThe traditional approach to global market segmentation has been to view a country or agroup of countries as a single segment comprising all consumers. This approach is seri-ously flawed because it relies on country variables rather than consumer behavior, assumeshomogeneity within the country segment, and ignores the possibility of the existence ofhomogeneous groups of consumers across country segments.19
www

Walker et al.: Marketing Strategy: A Decision−Focused Approach, Fourth Edition
II. Opportunity Analysis 7. Targeting Attractive Market Segments
220 © The McGraw−Hill Companies, 2002
Chapter Seven Targeting Attractive Market Segments 159
More and more companies are approaching global market segmentation by attempting toidentify consumers with similar needs and wants reflected in their behavior in the market-place in a range of countries. This intercountry segmentation enables a company to developreasonably standardized programs requiring little change across local markets, therebyresulting in scale economies. Star TV’s launch of a Pan-Asian satellite television servicebroadcasting throughout Asia in English and Chinese is an example of such a strategy.20
Theodore Levitt has long been a proponent of globalization of a homogeneous market-place for certain goods (for instance, consumer durables) based on price and high quality.He argues that similar segments have emerged in different countries at the same timebecause of technological developments affecting communications, transportation, andtravel.21 Others, using the same reasoning, believe there are two emerging intercountryglobal segments: the global elite consumer and the global teenage segment. The formeris targeted by producers of products and services with an image of exclusivity (cellularphones, personal computers, luxury cars, expensive perfumes). The growing number ofreasonably affluent groups in Latin America offer considerable potential for a variety ofgoods including automobiles, compact disc players, children’s clothing, and health andbeauty aids.22
The global teenage segment assumes a minimum of differences in cultural norms andlifestyles for teenagers across countries. Empirical evidence exists for this view for certainkinds of products, such as Swatch watches, Sony’s line of audio products for children, andBenetton’s colorful knitwear. Even in Japan, typed as a homogeneous culture featuring the“Japan First” sentiment, there is considerable evidence that younger generations arebecoming more positive about U.S. and European products.23
Clearly, many global trends are influencing the behavior of consumers, includingincreased per-capita GNP, increased literacy and education, growth in urbanization, greateravailability of TV and the Internet, and more travel. Many consumer products are becom-ing more common (automobiles, major home appliances, TVs). Thus, the global marketfor many products can be thought of as in transition. This development will require globalmarketers to continuously monitor their markets to identify emerging segments.
Innovative Segmentation: A Key to MarketingBreakthroughsAt the beginning of this section (see How Are Market Segments Best Defined? on page153), we identified four objectives of the market segmentation process. Effective mar-keters, such as the creators of Nike athletic shoes, Gatorade, and other highly successfulproducts, know that meeting these objectives through insightful and innovative market seg-mentation schemes is often the key to marketing breakthroughs. Often, combinations ofdifferent descriptors are used to more precisely target an attractive segment: perhaps somebehavioral dimension together with a carefully defined demographic profile within somegeographic region. Generally, it is useful to know the demographic profile of the targetmarket to be pursued, even if the driving force behind the segmentation scheme is geo-graphical and/or behavioral in nature. Understanding the demographic profile of a targetmarket enables the marketer to better choose targeted advertising media or other market-ing communication vehicles, unlike many Super Bowl advertisers in January 2000.
As is the case for many kinds of marketing decision making, computer-based decisionsupport systems have been developed to aid marketers as they wrestle with market seg-mentation decisions. Some widely used systems are identified in Exhibit 7.4.
As several examples in this section have shown, at the foundation of many marketingbreakthroughs one often finds an insightful segmentation scheme that is sharply focusedin a behavioral way. Marketers with superior market knowledge are probably more likely
www

Walker et al.: Marketing Strategy: A Decision−Focused Approach, Fourth Edition
II. Opportunity Analysis 7. Targeting Attractive Market Segments
221© The McGraw−Hill Companies, 2002
Section Two Opportunity Analysis160
to generate the insights necessary to define market segments in theseinnovative and meaningful ways. Phil Knight and Bill Bowerman, thefounders of Nike, as runners themselves, had the necessary marketknowledge to see how distance runners, as a market segment, wereunderserved.24 Their insight, together with the development of innova-tive products and the creation of effective marketing programs, led the
growth of the athletic footwear market, as consumers purchased different shoes for theirdifferent athletic pursuits, and ultimately revolutionized the athletic footwear industry.
Choosing Attractive Market
Segments: A Five-Step Process
Most firms no longer aim a single product and marketing program at the mass market.Instead, they break that market into homogeneous segments on the basis of meaningful dif-ferences in the benefits sought by different groups of customers. Then they tailor products
and marketing programs to the particular desires and idiosyncrasies ofeach segment. But not all segments represent equally attractive oppor-tunities for the firm. To prioritize target segments by their potential, mar-keters must evaluate their future attractiveness and their firm’s strengths
and capabilities relative to the segments’ needs and competitive situations.Within an established firm, rather than allowing each business unit or product manager
to develop an approach to evaluate the potential of alternative market segments, it is oftenbetter to apply a common analytical framework across segments. With this approach, man-agers can compare the future potential of different segments using the same set of criteriaand then prioritize them to decide which segments to target and how resources and mar-keting efforts should be allocated. One useful analytical framework managers or entrepre-neurs can use for this purpose is the market-attractiveness/competitive-position matrix.As we saw in Chapter 2, managers use such models at the corporate level to allocateresources across businesses, or at the business-unit level to assign resources across product-markets. We are concerned with the second application here.
Exhibit 7.5 outlines the steps involved in developing a market-attractiveness/competi-tive-position matrix for analyzing current and potential target markets. Underlying such amatrix is the notion that managers can judge the attractiveness of a market (its profit poten-tial) by examining market, competitive, and environmental factors that may influence prof-itability. Similarly, they can estimate the strength of the firm’s competitive position by
Two broad kinds of software applications are used insegmenting markets. Data mining applications enable
the marketer to examine a customer database to identifypatterns of variables that predict which customers buy ordon’t buy, as well as how much they buy. CART®
and MARS™ from Salford Systems, Inc. (www.salford-systems.com) are two such applications. Various tools foranalyzing the demographic makeup of a proposed target
market are also available. National Decision Systems(www.ends.com) is one such supplier. Various analyticalprocedures in SPSS MR or other statistical software pack-ages also are useful for market segmentation
Source: “Directory of Marketing Technology: Software & InternetServices.” Reprinted with permission from Marketing News, publishedby the American Marketing Association, July 17, 2000.
Exhibit 7.4 Software Tools for Market Segmentation
Strategic Issue
At the foundation of many marketing break-throughs one often finds an insightful seg-mentation scheme that is sharply focused ina behavioral way.
Strategic Issue
Most firms no longer aim a single productand marketing program at the mass market.

Walker et al.: Marketing Strategy: A Decision−Focused Approach, Fourth Edition
II. Opportunity Analysis 7. Targeting Attractive Market Segments
222 © The McGraw−Hill Companies, 2002
Chapter Seven Targeting Attractive Market Segments 161
looking at the firm’s capabilities or shortcomings relative to the needs of the market andthe competencies of likely competitors. By combining the results of these analyses withother considerations, including risk, the mission of the firm, and ethical issues (see Ethi-cal Perspective 7.1), conclusions about which markets and market segments should be pur-sued can be reached.
The first steps in developing a market-attractiveness/competitive-position matrix, then,are to identify the most relevant variables for evaluating alternative market segments andthe firm’s competitive position regarding them and to weight each variable in importance.Note, too, that Exhibit 7.5 suggests conducting a forecast of future changes in marketattractiveness or competitive position in addition to, but separately from, an assessment ofthe current situation. This reflects the fact that a decision to target a particular segment isa strategic choice that the firm will have to live with for some time.
Step 1: Select Market-Attractiveness and Competitive-Position FactorsAn evaluation of the attractiveness of a particular market or market segment and of thestrength of the firm’s current or potential competitive position in it builds naturally on thekind of opportunity analysis developed in Chapters 4 through 6. Managers can assess both
Exhibit 7.5Steps in Constructing a Market-Attractiveness/Competitive-Position Matrix for Evaluating Potential
Target Markets
�� ������ ����� � ���� �� ��������������� ��� ������� ������
�� ���� ����� ���������� ���������� ����� ������ ������� ��� ������ ���������
�� ������ �� � ���� ����� �� ���� ���������� ����� �� ���� ������
�� ������ �� � �� ����� �� ���� ���������� �� ������� ������������ � ������
��� ������� ������
� !��� �� �������� �� ������� � ��������� ��� � ����� ������� ���
���� ���� ��" �������

Walker et al.: Marketing Strategy: A Decision−Focused Approach, Fourth Edition
II. Opportunity Analysis 7. Targeting Attractive Market Segments
223© The McGraw−Hill Companies, 2002
Section Two Opportunity Analysis162
dimensions on the basis of information obtained from analyses of the environment, indus-try and competitive situation, market potential estimates, and customer needs. To makethese assessments, they need to establish criteria, such as those shown in Exhibit 7.6,against which prospective markets or market segments can be evaluated. Both market andcompetitive perspectives are necessary.
Market-Attractiveness Factors As we showed in Chapter 4, assessing the attrac-tiveness of markets or market segments involves determining the market’s size and growthrate and assessing various trends—demographic, sociocultural, economic, political/legal,technological, and physical—that influence demand in that market. An even more criticalfactor in determining whether to enter a new market or market segment, however, is thedegree to which unmet customer needs, or needs that are currently not being well served,can be identified. In the absence of unmet or underserved needs, it is likely to be difficultto win customer loyalty, regardless of how large the market or how fast it is growing. “Me-too” products often face difficult going in today’s highly competitive markets.
Competitive-Position Factors As we showed in Chapter 5, understanding theattractiveness of the industry in which one competes is also important. Entering a segment
Ethical Perspective 7.1
Ethical Issues in Target Marketing
Over the years, marketing managers have confronteda number of ethical problems relating to the selec-tion of target markets. Problems can rise from tar-geting consumers who because of their inclusion inthe targeted group may be influenced to make deci-sions thought by some to be not in their best inter-est. Some would argue that advertising $150sneakers to inner-city teenagers is ethically dubious;others say the advertising of snack foods and softdrinks to children is questionable. In other cases,exclusion issues are raised because the firm’s mar-keting efforts did not include a particular group.
In the area of inclusion issues, advertisers oftenresort to undesirable stereotypes in an effort to sim-plify advertising messages. These include sex-role,race, or age stereotypes. Thus, the portrayal ofwomen as sex objects (bikini-clad models in beerads) or, in general, subordinate to male authority fig-ures is thought by many to be dehumanizing andoffensive. Reverse sexism with men shown as sexobjects also has been on the increase to the dismayof some groups.
In recent years the targeting of minority or othergroups for cigarettes and alcohol has increased. Insome cases, a backlash against such targeting hasprompted individual firms (and whole industries) toabandon or modify their targeting practices (brewers
who have reduced their marketing programs that tar-get students during spring break) and/or to empha-size moderation (responsible drinking). But one stillcan question the ethics of using sports heroes asrole models in the advertising of products that mayprove harmful to people’s health. Indeed, the massmarketing of alcohol and tobacco products raisesserious ethical questions.
For exclusion issues, the concern is not only thatcertain groups are deprived of products and servicesbut also that they may pay more for those they doreceive. There is considerable evidence to supportthe latter claim. A survey in New York City found thatfood prices are highest in neighborhoods that canleast afford them. Low-income shoppers (family offour) paid 8.8 percent more for their groceries—$350per year. Further, inner-city stores were on averagepoorly stocked, had inferior foodstuffs, and offeredpoorer service.
Companies often face the ethical problem ofwhether they may exclude certain groups they wouldrather not serve. For example, insurance companieswant only low-risk policyholders, credit-card compa-nies only low-risk cardholders, and hospitals onlypatients with insurance.
Source: N. Craig Smith and John A. Quelch, Ethics in Marketing(Burr Ridge, IL: Richard D. Irwin, 1993), pp. 183–95; and Felix M.Freedman, “The Poor Pay More for Food in New York, Survey Finds,”The Wall Street Journal, April 15, 1991.
E

Walker et al.: Marketing Strategy: A Decision−Focused Approach, Fourth Edition
II. Opportunity Analysis 7. Targeting Attractive Market Segments
224 © The McGraw−Hill Companies, 2002
Chapter Seven Targeting Attractive Market Segments 163
that would place the firm in an unattractive industry or increase its exposure in an unat-tractive industry in which it already competes may not be wise. Of more immediate andsalient concern, however, is the degree to which the firm’s proposed product entry into thenew market or segment will be sufficiently differentiated from competitors, given the crit-ical success factors and product life cycle conditions already prevalent in the category.Similarly, decision makers need to know whether their firm has or will be able to acquirethe resources it will take—human, financial, and otherwise—to effectively compete in thenew segment. Simply put, most new goods or services need to be either better from aconsumer point of view or cheaper than those they hope to replace. Entering a new mar-ket or market segment without a source of competitive advantage is a trap.
Step 2: Weight Each FactorNext, a numerical weight is assigned to each factor to indicate its relative importance inthe overall assessment. Let’s imagine that we are Phil Knight or Bill Bowerman in 1964,before Nike even existed, and we are considering starting a venture to market new and bet-ter athletic shoes specifically designed for distance runners. Weights that Knight and Bow-erman might have assigned to the major factors in Exhibit 7.6 are shown in Exhibit 7.7.Some users would rate each bullet point in Exhibit 7.6 independently, assigning a weightto each one.
Exhibit 7.6Factors Underlying Market Attractiveness and Competitive Position
Market-attractiveness factors Competitive-position factors
Customer needs and behavior
• Are there unmet or underserved needs we can satisfy?
Market or market segment size and growth rate
• Market potential in units, dollars, number ofprospective customers
• Growth rate in units, dollars, number of prospectivecustomers
• Might the target segment constitute a platform forlater expansion into related segments in the marketas a whole?
Macro trends: Are they favorable, on balance?
• Demographic
• Sociocultural
• Economic
• Political/legal
• Technological
• Physical
Opportunity for competitive advantage
• Can we differentiate?
• Can we perform against critical success factors?
• Stage of competing products in product life cycle: Isthe timing right?
Firm and competitor capabilities and resources
• Management strength and depth
• Financial and functional resources: marketing,distribution, manufacturing, R&D, etc.
• Brand image
• Relative market share
Attractiveness of industry in which we would compete
• Threat of new entrants
• Threat of substitutes
• Buyer power
• Supplier power
• Competitive rivalry
• Industry capacity
• Driving forces: are they favorable, on balance?

Walker et al.: Marketing Strategy: A Decision−Focused Approach, Fourth Edition
II. Opportunity Analysis 7. Targeting Attractive Market Segments
225© The McGraw−Hill Companies, 2002
Section Two Opportunity Analysis164
Step 3: Rate Segments on Each Factor; PlotResults on MatricesThis step requires that evidence—typically both qualitative and quantitative data—be col-lected to objectively assess each of the criteria identified in Step 1. For Knight and Bower-man in 1964, the assessment of the various factors might have looked such as those shownin Exhibit 7.7. While more detailed evidence than we discuss here should have been, and nodoubt was, gathered, Knight and Bowerman might have reached the following conclusions:25
Market-attractiveness factors
• Unmet customer needs for lateral stability, cushioning, and lightweight shoe have been iden-tified. Score: 10.
• The distance runner segment is quite small, though growing, but it might lead to other seg-ments in the future. Score: 7.
• Macro trends are largely favorable: fitness is “in,” number of people in demographic groupslikely to run is growing, global trade is increasing. Score 8.
Competitive-position factors
• Opportunity for competitive advantage is somewhat favorable; proposed shoes will be differentiated, but shoe category seems mature, and their new firm has no track record. Score: 7.
• Resources are extremely limited, though management knows runners and distance running;Bowerman has strong reputation. Score: 5.
• Five forces are largely favorable (low buyer and supplier power, little threat of substitutes,low rivalry among existing firms), driving forces attractive. Score: 7.
Mere armchair judgments about each criterion are not very credible and run the risk oftaking the manager or entrepreneur into a market segment that may turn out not to beviable. It is especially important to undertake a detailed analysis of key competitors, espe-cially with regard to their objectives, strategy, resources, and marketing programs, as wasdiscussed in Chapter 5. Similarly, compelling evidence that a proposed entry into a new
Exhibit 7.7Assessing the Distance Runner Market Segment in 1964
Weight Rating (0–10 scale) Total
Market-attractiveness factors
Customer needs and behavior: unmet needs? .5 10 5.0
Segment size and growth rate .3 7 2.1
Macro trends .2 8 1.6
Total: Market attractiveness 1.0 8.7
Competitive-position factors
Opportunity for competitive advantage .6 7 4.2
Capabilities and resources .2 5 1.0
Industry attractiveness .2 7 1.4
Total: Competitive position 1.0 6.6

Walker et al.: Marketing Strategy: A Decision−Focused Approach, Fourth Edition
II. Opportunity Analysis 7. Targeting Attractive Market Segments
226 © The McGraw−Hill Companies, 2002
Chapter Seven Targeting Attractive Market Segments 165
segment will satisfy some previously unmet needs, and do so in a way that can bring aboutsustainable competitive advantage, is called for. Both qualitative and quantitative market-ing research results are typically used for this purpose. Once these assessments have been made, the weighted results can be plotted on a market-attractiveness/competitive-position matrix like the one shown in Exhibit 7.8.
Step 4: Project Future Position for Each SegmentForecasting a market’s future is more difficult than assessing its current state. Managers orentrepreneurs should first determine how the market’s attractiveness is likely to change overthe next three to five years. The starting point for this assessment is to consider possibleshifts in customer needs and behavior, the entry or exit of competitors, and changes in theirstrategies. Managers also must address several broader issues, such as possible changes inproduct or process technology, shifts in the economic climate, the impact of social or polit-ical trends, and shifts in the bargaining power or vertical integration of customers.
Managers next must determine how the business’s competitive position in the market islikely to change, assuming that it responds effectively to projected environmental changes butthe firm does not undertake any initiatives requiring a change in basic strategy. The expectedchanges in both market attractiveness and competitive position can then be plotted on thematrix in the form of a vector (arrow) that reflects the direction and magnitude of the expectedchanges. Anticipating such changes may be critically important in today’s Internet age.
Step 5: Choose Segments to Target; AllocateResourcesManagers should consider a market to be a desirable target only if it is strongly positive onat least one of the two dimensions of market attractiveness and potential competitive posi-tion and at least moderately positive on the other. In Exhibit 7.8 this includes markets posi-tioned in any of the three cells in the upper right-hand corner of the matrix. However, abusiness may decide to enter a market that currently falls into one of the middle cells under
Exhibit 7.8Market-Attractiveness/Competitive-Position Matrix
= Market attractiveness and competitive position of distance runners segment in 1964
High(8-10)
Moderate(4-7)
Low(0-3)
High(8-10)
Moderate(4-7)
Low(0-3)
Company’s Competitive Position
MarketAttractiveness
www
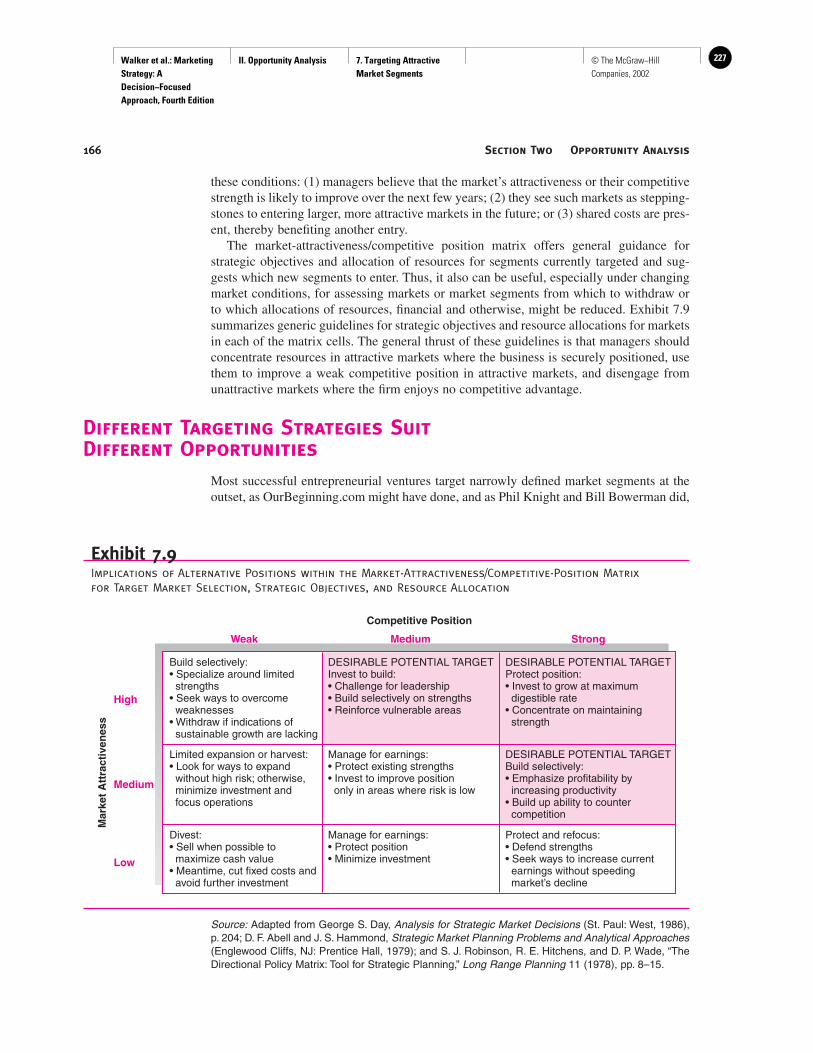
Walker et al.: Marketing Strategy: A Decision−Focused Approach, Fourth Edition
II. Opportunity Analysis 7. Targeting Attractive Market Segments
227© The McGraw−Hill Companies, 2002
Section Two Opportunity Analysis166
these conditions: (1) managers believe that the market’s attractiveness or their competitivestrength is likely to improve over the next few years; (2) they see such markets as stepping-stones to entering larger, more attractive markets in the future; or (3) shared costs are pres-ent, thereby benefiting another entry.
The market-attractiveness/competitive position matrix offers general guidance forstrategic objectives and allocation of resources for segments currently targeted and sug-gests which new segments to enter. Thus, it also can be useful, especially under changingmarket conditions, for assessing markets or market segments from which to withdraw orto which allocations of resources, financial and otherwise, might be reduced. Exhibit 7.9summarizes generic guidelines for strategic objectives and resource allocations for marketsin each of the matrix cells. The general thrust of these guidelines is that managers shouldconcentrate resources in attractive markets where the business is securely positioned, usethem to improve a weak competitive position in attractive markets, and disengage fromunattractive markets where the firm enjoys no competitive advantage.
Different Targeting Strategies Suit
Different Opportunities
Most successful entrepreneurial ventures target narrowly defined market segments at theoutset, as OurBeginning.com might have done, and as Phil Knight and Bill Bowerman did,
Exhibit 7.9Implications of Alternative Positions within the Market-Attractiveness/Competitive-Position Matrix
for Target Market Selection, Strategic Objectives, and Resource Allocation
Source: Adapted from George S. Day, Analysis for Strategic Market Decisions (St. Paul: West, 1986),p. 204; D. F. Abell and J. S. Hammond, Strategic Market Planning Problems and Analytical Approaches(Englewood Cliffs, NJ: Prentice Hall, 1979); and S. J. Robinson, R. E. Hitchens, and D. P. Wade, “TheDirectional Policy Matrix: Tool for Strategic Planning,” Long Range Planning 11 (1978), pp. 8–15.
High
Weak Medium Strong
Medium
Low
Competitive Position
Mar
ket
Att
ract
iven
ess
Build selectively:• Specialize around limited strengths• Seek ways to overcome weaknesses• Withdraw if indications of sustainable growth are lacking
Limited expansion or harvest:• Look for ways to expand without high risk; otherwise, minimize investment and focus operations
Divest:• Sell when possible to maximize cash value• Meantime, cut fixed costs and avoid further investment
Manage for earnings:• Protect existing strengths• Invest to improve position only in areas where risk is low
Manage for earnings:• Protect position• Minimize investment
Protect and refocus:• Defend strengths• Seek ways to increase current earnings without speeding market’s decline
DESIRABLE POTENTIAL TARGETInvest to build:• Challenge for leadership• Build selectively on strengths• Reinforce vulnerable areas
DESIRABLE POTENTIAL TARGETProtect position:• Invest to grow at maximum digestible rate• Concentrate on maintaining strength
DESIRABLE POTENTIAL TARGETBuild selectively:• Emphasize profitability by increasing productivity• Build up ability to counter competition
Walker et al.: Marketing Strategy: A Decision−Focused Approach, Fourth Edition
II. Opportunity Analysis 7. Targeting Attractive Market Segments
228 © The McGraw−Hill Companies, 2002
Chapter Seven Targeting Attractive Market Segments 167
for two reasons. One, doing so puts the nascent firm in a position toachieve early success in a market segment that it understands particu-larly well. Second, such a strategy conserves precious resources, bothfinancial and otherwise. But segmenting the market into narrow niches
and then choosing one niche to target is not always the best strategy, particularly for estab-lished firms having substantial resources. Three common targeting strategies are niche-market, mass-market, and growth-market strategies.
Niche-Market StrategyThis strategy involves serving one or more segments that, while not the largest, consist ofsubstantial numbers of customers seeking somewhat-specialized benefits from a productor service. Such a strategy is designed to avoid direct competition with larger firms that arepursuing the bigger segments. For example, overall coffee consumption is down substan-tially, but the sales of gourmet coffees have boomed in recent years.
Mass-Market StrategyA business can pursue a mass-market strategy in two ways. First, it can ignore any seg-ment differences and design a single product-and-marketing program that will appeal tothe largest number of consumers. The primary object of this strategy is to capture sufficientvolume to gain economies of scale and a cost advantage. This strategy requires substantialresources, including production capacity, and good mass-marketing capabilities. Conse-quently, it is favored by larger business units or by those whose parent corporation pro-vides substantial support. For example, when Honda first entered the American andEuropean motorcycle markets, it targeted the high-volume segment consisting of buyers oflow-displacement, low-priced cycles. Honda subsequently used the sales volume and scaleeconomies it achieved in that mass-market segment to help it expand into smaller, more-specialized segments of the market.
A second approach to the mass market is to design separate products and marketingprograms for the differing segments. This often is called differentiated marketing. Forexample, Marriott does this with its various hotel chains. Although such a strategy can gen-erate more sales than an undifferentiated strategy, it also increases costs in product design,manufacturing, inventory, and marketing, especially promotion.
Growth-Market StrategyBusinesses pursuing a growth-market strategy often target one or more fast-growth seg-ments, even though they may not currently be very large. It is a strategy often favored bysmaller competitors to avoid direct confrontations with larger firms while building volumeand share. Most venture capital firms invest only in firms pursuing growth-market strate-gies, because doing so is the only way they can earn the 30 percent to 60 percent annualrates of return on investment that they seek for portfolio companies. Such a strategy usu-ally requires strong R&D and marketing capabilities to identify and develop productsappealing to newly emerging user segments, plus the resources to finance rapid growth.The problem, however, is that fast growth, if sustained, attracts large competitors. Thishappened to DEC when IBM entered the minicomputer business. The goal of the earlyentrant is to have developed an enduring competitive position via its products, service, dis-tribution, and costs by the time competitors enter.
Strategic Issue
Most successful entrepreneurial ventures target narrowly defined market segments.

Walker et al.: Marketing Strategy: A Decision−Focused Approach, Fourth Edition
II. Opportunity Analysis 7. Targeting Attractive Market Segments
229© The McGraw−Hill Companies, 2002
Section Two Opportunity Analysis168
Selecting Target Markets in the
International Arena
Some companies go international to defend their home position against global competitorswho are constantly looking for vulnerability. This forces the firm to target major developedcountries (the United States, Japan, and Western European countries). A global competitorcan attack the home market by reducing price, the cost of which is subsidized by profitsgenerated elsewhere in the world. If the defending company is solely a domestic player, ithas to respond by cutting price on its entire volume, while the aggressor has to do so ononly part of its total sales.
To prevent such attacks, or minimize their impact, a firm must have the capacity tostrike back in markets where the aggressor is vulnerable. For example, Caterpillar, througha joint venture with Mitsubishi Heavy Industries, has for the past 30 years made a sub-stantial investment in Japan to deny its Japanese competitor, Komatsu, strength at home,thereby taking away its profit sanctuary. Had Cat not been successful in doing so, Komatsuwould have been able to compete more aggressively with Cat, not only in the United Statesbut also in other major world markets.26
Another reason a firm may go overseas and target a specific country is to service cus-tomers who also are engaging in global expansion. In recent years Japanese automobilecompanies that have created U.S. manufacturing facilities have encouraged some of theirparts suppliers to do the same. Firms also enter overseas markets to earn foreign exchangeand, in some cases, are subsidized by their governments to do so.
The selection of one or more target countries may be dictated by the availability of an appropriate partner. For example, Kellogg has had a European presence since the 1920s and controls about half the market. General Mills, which is Kellogg’s major U.S.competitor, has long wanted to enter the European market, but to do so on its own wouldhave been an extremely expensive undertaking, given Kellogg’s high market share. Thesolution was to enter into a joint venture (Cereal Partners Worldwide) with Nestlé, whichhas no cereals but does have a powerful distribution system.27 France, Spain, and Portugalconstituted the initial target markets for General Mills’ Honey Nut Cheerios and GoldenGrahams.
In general, with the exception of these strategic special circumstances, the selection ofoverseas target markets follows essentially the same patterns as for domestic markets,although given the magnitude of economic, social, and political change in the world today,companies are paying considerably more attention to political risk.
Take Aways
• Marketers and entrepreneurs who find new andinsightful ways to segment mature markets oftenuncover opportunities for uncontested market entryand rapid growth.
• Sharply focused target marketing enables marketers todifferentiate from mass-market leaders by giving con-sumers in a narrowly defined market segment whatthey want.
• Focused market entry strategies conserve resourcesand facilitate early success.
• The five-step procedure provided in this chapter iden-tifies segments having the highest potential.
• The market-attractiveness/competitive-position matrixis a useful analytical framework for deciding whichmarkets or market segments to enter and from whichto withdraw.
• Self-diagnostic questions to test your ability to applythe analytical tools and concepts in this chapter tomarketing decision making may be found at thisbook’s website at www.mhhe.com/walker.

Walker et al.: Marketing Strategy: A Decision−Focused Approach, Fourth Edition
II. Opportunity Analysis 7. Targeting Attractive Market Segments
230 © The McGraw−Hill Companies, 2002
Chapter Seven Targeting Attractive Market Segments 169
1. Based on articles by Greg Farrell, “Bailing Out from the Super Bowl AdBinge,” USA Today, June 7, 2000, at http://www.usatoday.com/life/cyber/tech/cth780.htm; Mark Hyman, “Inside a Dot.com Betting on a Super Bowl,BusinessWeek, January 31, 2000, at http://222.businessweek.com/2000/00_/05/b3666136.htm; and a May 25, 2000 OurBeginning.com press release athttp://www.ourbeginning.com/home.nsf/
2. Peter Doyle, “Managing the Marketing Mix,” in The Marketing Book,Michael J. Baker, ed. (Oxford, England: Butterworth-Heinemann, 1992),p. 273.
3. Laurie Hays, “Using Computers to Divine Who Might Buy a Gas Grill,”The Wall Street Journal, August 16, 1994, p. B1. The article notes that Amer-ican Express has a data bank of 500 billion bytes of data describing not onlythe purchases made by 35 million buyers worth some $350 billion since 1991but their demographics as well.
4. Joseph Pine II, Bart Victor, and Andrew C. Boynton, in the article “Mak-ing Mass Customization Work,” Harvard Business Review, September–-October 1993, pp. 108–19, discuss some of the problems involved in theimplementation of a highly segmented, customized strategy.
5. Ellen Newborne, “Marketers Tap Growth Market,” USA Today, May 8,1995, p. B1.
6. Julie Ralston, “Chevy Targets Women,” Advertising Age, August 7, 1995,p. 24.
7. Robert E. Wilkes, “Household Life-Cycle Stages, Transitions and ProductExpenditures,” Journal of Consumer Research, June 1995, p. 27.
8. Anita Sharpe, “Magazines for the Rich Rake in Readers,” The Wall StreetJournal, February 2, 1996, p. B1.
9. Michael Wilke and Todd Preizan, “Motorola Puts Ethnic Marketing toWork for Cellular Phones, Pagers,” Advertising Age, June 24, 1996, p. 16; andCyndi Miller, “Catalogers Learn to Take Blacks Seriously,” Marketing News,March 3, 1995, p. 8.
10. Mora Somassundarm, “Uni-Marts Inc.’s Small Town Strategy for Conve-nience Stores Is Paying Off,” The Wall Street Journal, November 20, 1995,p. B5A.
11. Jon Goss, “We Know Who You Are and We Know Where You Live: TheInstrumental Rationality of Geodemographics,” Economic Geography 71,no. 2 (1995), p. 171.
12. Michael Arndt, “Quaker Oats Is Thirsty for Even More Gatorade Hits,”www.businessweek.com/bwdaily/dnflash/feb2000/nf202c.htm, February 2, 2000.
13. For a detailed discussion of the implications of customer loyalty for bothmarket share leaders and challengers, see Adrian J. Slywotzky and Benson P.Shapiro, “Levering to Beat the Odds: The New Marketing Mind-Set,” Har-vard Business Review, September–October 1993, pp. 97–107.
14. Salah S. Hassan and Lea P. Kataris, “Identification of Global ConsumerSegments: A Behavioral Framework,” Journal of International ConsumerMarketing 3, no. 2 (1991), p. 16.
15. From information provided by Stanford Research Institute.
16. The relative weight of these vary across countries. In China, for example,more weight is given to occupation and education, whereas Western countriesemphasize residence, income, and family background. See John D. Danielsand Lee H. Radebaugh, International Dimensions of Contemporary Interna-tional Business (Boston: PWS-Kent, 1993), p. 136.
17. Simon Majaro, “International Marketing—the Major Issues” in The Marketing Book, Michael J. Baker, ed. (Oxford, England: Butterworth-Heinemann, 1992), p. 430.
18. Kenneth Labech, “Class in America,” Fortune, February 7, 1994, p. 14.
19. Hassan and Kataris, “Identification of Global Consumer Segments,” p. 16.
20. Henry Laurence, Michael Y. Yoshino, and Peter Williamson, STAR TV (A)(Boston: Harvard Business School Publishing, 1994).
21. Theodore Levitt, “The Globalization of Markets,” Harvard BusinessReview, May–June 1983, pp. 92–102. Also, see Sundar G. Bharadway and P. Rajan Varadarajar, “Standardization versus Adaptation of InternationalMarketing Strategy: An Empirical Investigation,” Journal of Marketing,October 1993.
22. Ignacio Galeeran and Jon Berry, “A New World of Consumers,” AmericanDemographics, March 1995, p. 26.
23. Marte J. Rhea, Barbara C. Garland, and John C. Crawford, “InternationalMarket Segmentation: The U.S.-Japanese Markets,” Journal of InternationalConsumer Marketing 2, no. 2 (1989), pp. 75–90. Also see Robert M. March,The Honorable Consumer (London, England: Pitman, 1990), p. 150.
24. Nike, Inc. website at www.nikebiz.com.
25. Ibid.
26. Douglas Lamont, Winning Worldwide (Burr Ridge, IL: Business OneIrwin, 1991), pp. 59–69.
27. Christopher Knowlton, “Europe Cooks Up a Cereal Brawl,” Fortune, June3, 1991, p. 175.
Endnotes

Walker et al.: Marketing Strategy: A Decision−Focused Approach, Fourth Edition
II. Opportunity Analysis 8. Differentiation and Positioning
231© The McGraw−Hill Companies, 2002
170
Chapter Eight
DIFFERENTIATION
AND POSITIONING
Dell’s Direct Business Model Wins Customers and Competitive Advantage1
From 1994 to 1998, Dell Computer Corporationgrew from $3.5 to $18.2 billion in revenue andfrom $149 million to $1.5 billion in profits. Dur-
ing this period, Dell grew more than twice as fast asits major rivals and tripled its market share. MichaelDell, its founder, ranked as the fourth richest Amer-ican, with an estimated worth of $13 billion. Clearly,Dell Computer was doing something right.
Giving Customers What
They Want
From its origins in Michael Dell’s dorm room at theUniversity of Texas, Dell Computer sold personalcomputers directly to end users, in contrast to mostother leading manufacturers, who sold through dis-tributors, resellers, and retailers. By differentiatingfrom other computer makers—selling direct, firstover the telephone, and later via the Internet—Dellenabled customers, especially corporate customers,to specify exactly the features they wanted. Dell thenquickly assembled computers to meet these specifi-cations and shipped them directly to its customers.
What was it about Dell’s concept that customersfound so attractive? First, they could specify precisely
what they wanted—hard drive size, memory, modemor network card, and so on. Second, Dell’sprice/value offering was unbeatable—customers gotmore computer for their money. And, because Dellshipped quickly and offered strong service and sup-port, albeit without local face-to-face handholding,these two major benefits—get exactly what youwant, for less money—came without any significantdrawbacks to its key target market, corporations.
Sustainable Competitive
Advantage
Not only did Dell’s direct business model offer tan-gible benefits to its target customers, it also broughtDell important advantages that gave it a real and—so far—sustainable edge over its competitors. Dellworked closely with its suppliers to arrange just-in-time delivery of parts for its custom-assembled PCs,communicating replenishment needs to key vendorson an hourly basis. By carrying, in 1996 for example,only 15 days of inventory on average, instead of 65days for competitor Compaq, Dell not only savedcarrying cost for its inventory, but it bought partslater, thereby benefiting from the fact that prices of

Walker et al.: Marketing Strategy: A Decision−Focused Approach, Fourth Edition
II. Opportunity Analysis 8. Differentiation and Positioning
232 © The McGraw−Hill Companies, 2002
171
components used to make PCs typically declined 25to 20 percent per year. Additional savings from elim-inating intermediaries in its distribution channelmade Dell’s cost advantage over its competitors asubstantial one.
Given its lower cost structure than its competi-tors, Dell’s custom-built, low-cost positioning inthe marketplace allowed it to make an attractivestrategic choice. Should it choose to reap highermargins than others in its industry, or should itkeep prices low to gain market share? For much ofits history, Dell made the latter choice, gainingshare at the expense of its rivals.
The High-Tech Recession
of 2001
In 2001, a sharp recession in the high-tech economycaused computer sales to fall off a cliff. Earnings fell
across most high-tech industry sectors, and PCswere no exception. Archrival Compaq lost $279 mil-lion on a 17 percent decline in sales in the secondquarter of 2001. Dell’s earnings slid too, falling 12percent from second quarter 2000, though its saleswere still up 10 percent over the prior year. Chip-maker AMD’s earnings fell 92 percent from the prioryear on a 16 percent decline in sales. How did Dell’spositioning serve it in this challenging environment?Michael Dell didn’t blink, announcing that Dellwould seek to triple its share of the computer busi-ness to 40 percent, in spite of the slimmer profitmargins it would endure. He figured his strongvalue positioning with customers would enable hiscompany to grab market share from weaker rivalsand his low-cost business model would give Dellthe opportunity to tough it out profit-wise until con-ditions improved.
Strategic Challenges Addressed
in Chapter 8
As Dell’s story illustrates, the success of a product offered to a given target market dependson how well it is positioned within that market segment—that is, how well it performs rel-ative to competitive offerings and to the needs of the target audience. Positioning refers toboth the place a product or brand occupies in customers’ minds relative to their needs andcompeting products or brands and to the marketer’s decision making intended to createsuch a position. Thus, the positioning notion comprises both competitive and customerneed considerations.
Positioning is basically concerned with differentiation. Ries and Trout, who popular-ized the concept of positioning, view it as a creative undertaking whereby an existingbrand in an overcrowded marketplace of similar brands can be given a distinctive positionin the minds of targeted prospects. While their concept was concerned with an existingbrand, it is equally applicable for new products.2 While typically thought of in relation tothe marketing of consumer goods, it has equal value for industrial goods and for services,which require essentially the same procedure as consumer goods.3 Because services arecharacterized by their intangibility, perishability, consumer participation in their delivery,and the simultaneous nature of their production and consumption, they are—when com-pared with products—more difficult for consumers to understand, to compare with com-peting products, to predict in terms of their performance, and, therefore, more difficult formarketers to position successfully.

Walker et al.: Marketing Strategy: A Decision−Focused Approach, Fourth Edition
II. Opportunity Analysis 8. Differentiation and Positioning
233© The McGraw−Hill Companies, 2002
Section Two Opportunity Analysis172
In this chapter we take the final step in preparing the foundation on which effective mar-keting programs are based. Drawing on decisions made about target markets, as discussed
in Chapter 7, we address the critical question, How should a businessposition its product offering—whether goods or services—so customersin the target market perceive the offering as providing the benefits theyseek, thereby giving the product an advantage over current and potentialfuture competitors? As marketing managers know, the positioning deci-sion is a strategic one, with implications not only for how the firm’sgoods or services should be designed, but also for developing the other
elements of the marketing strategy. Pricing decisions, promotion decisions, and decisionsabout how the product is to be distributed all follow from, and contribute to the effective-ness of, the positioning of the product in its competitive space.
Differentiation: The Key
to Customer Preference
and Competitive Advantage
Why do customers prefer one product over another? In today’s highly competitive markets,consumers have numerous options. They can buy a personal computer from Dell, Apple,Compaq, or a host of other PC makers. They can choose from dozens of best-selling novelsto take along on an upcoming vacation. They can buy the novel they choose from an onlinemerchant such as Amazon.com, from large chain booksellers such as Barnes and Noble ortheir online counterparts, from book clubs, from a local bookstore, or in some cases fromtheir nearby supermarket or mass merchant. They even can borrow the book at their locallibrary and not buy it at all! Whether for goods such as computers or books, or services suchas libraries, consumers make choices such as these nearly every day. In most cases, con-sumers or organizational customers choose what they buy for one of two reasons: what theychoose is better, in some sense, or cheaper. In either case, the good or service they choose is,in some way, almost always different from others they could have chosen.
Differentiation is a powerful theme in developing business strategies, as well as in mar-keting. As Michael Porter points out, “A company can outperform its rivals only if it canestablish a difference that it can preserve. It must deliver greater value to customers or cre-ate comparable value at a lower cost, or both.”4 Most of the time, differentiation is whypeople buy. They buy the latest John Grisham novel because they know it will be a page-turner, different from the last Grisham they read, and hard to put down. They buy it from
Amazon.com because they know Amazon’s selection is enormous, andits one-click ordering system takes only a minute. Or they buy it fromthe megastore because it’s fun to browse there or from their local book-seller because they feel good about supporting their local merchants.
They buy it at the supermarket because it’s convenient. All these book-selling strategies aredifferent, and they appeal to different consumers (i.e., different market segments) at dif-ferent points in time, for different book-buying purposes. If these strategies did not vary,consumers would have no reason to use some of them, and they would buy their bookswhere they were cheapest or most convenient, though even in such a case, the cheaper pric-ing or greater convenience would still constitute differences.
Dif ferentiation in Business StrategiesMichael Porter’s classic book on competitive advantage identified three generic strategies:cost leadership, differentiation, and focus, as shown in Exhibit 8.1.5 These strategies,
Strategic Issue
The positioning decision is a strategic one,with implications not only for how the firm’sgoods or services should be designed, butalso for developing the other elements ofthe marketing strategy.
www
Strategic Issue
Differentiation is why people buy.

Walker et al.: Marketing Strategy: A Decision−Focused Approach, Fourth Edition
II. Opportunity Analysis 8. Differentiation and Positioning
234 © The McGraw−Hill Companies, 2002
Chapter Eight Differentiation and Positioning 173
which differ in the scope of the target market and market needs they serve (broad or nar-row competitive scope) and on whether they base their competitive advantage on low cost(lower prices to the customer for equivalent products) or differentiation (products that aresuperior on some important dimensions), represent distinctly different ways in which com-panies can compete for the minds and wallets of customers in their target markets. Porterargues that the worst strategy is to be “stuck in the middle,” to be neither different norlower in cost than one’s competitors. Companies in such a position offer customers littlereason not to take their business elsewhere. But customers don’t really buy strategies. Theybuy specific goods and services and effective execution: on-time delivery, proper installa-tion, responsive customer service, and so on. Thus, strategy is implemented at the product-market level, where differentiation lies at the heart of positioning.
Dif ferentiation among Goods and ServicesAs we saw in the previous chapter, customers in one market segment have wants and needsthat differ in some way from those of customers in other segments. Positioning allows themarketer to take advantage of and be responsive to such differences and position particu-
lar goods and services so as to better meet the needs of consumers in oneor more of these segments. These differences are often physical. Dell’scomputers have exactly the features the customer wants, not a compro-mise based on what’s available in the computer store. Nike’s originalwaffle sole was a physical difference. But differences also can be per-
ceptual, as with Nike’s later products that benefited from endorsements by John McEnroe,Michael Jordan, and other famous athletes. Creating both physical and perceptual differ-ences, using all the elements of the marketing mix—product, pricing, promotion, and dis-tribution decisions—is what effective positioning seeks to accomplish.
Physical Positioning
One way to assess the current position of a product offering relative to competitors is on thebasis of how the various offerings compare on some set of objective physical characteris-tics. For example, an article in The Wall Street Journal discussed the pending battle in the1996 season between the various brands of behemoth sport utility vehicles. It comparedFord’s Expedition versus GM’s Suburban on seating capacity, engine, city mileage, high-way mileage, length, and price (see Exhibit 8.2).6 In many cases a physical positioning
Exhibit 8.1Generic Competitive Strategies
Source: Adapted with permssion of The Free Press, a Division of Simon & Schuster, Inc. from Com-petitive Advantage: Creating and Sustaining Superior Performance by Michael E. Porter. Copyright1985, 1988 by Michael E. Porter.
Competitive ScopeCost Leadership Strategy
Competitive Advantage
Focus Strategy(Cost-Based)
Broad Target
Narrow Target
Differentiation Strategy
Lower Cost Differentiation
Focus Strategy(Differentiation-Based)
Strategic Issue
Creating both physical and perceptual differences is what effective positioningseeks to accomplish.

Walker et al.: Marketing Strategy: A Decision−Focused Approach, Fourth Edition
II. Opportunity Analysis 8. Differentiation and Positioning
235© The McGraw−Hill Companies, 2002
Section Two Opportunity Analysis174
analysis can provide useful information to a marketing manager, particularly in the earlystages of identifying and designing new product offerings.
Despite being based primarily on technical rather than on market data, physical com-parisons can be an essential step in undertaking a positioning analysis. This is especiallytrue with the competitive offerings of many industrial goods and services, which buyerstypically evaluate largely on the basis of such characteristics. In addition, it contributes toa better marketing/R&D interface by determining key physical product characteristics;helps define the structure of competition by revealing the degree to which the variousbrands compete with one another; and may indicate the presence of meaningful productgaps (the lack of products having certain desired physical characteristics), which, in turn,may reveal opportunities for a new product entry.
Limitations of Physical PositioningA simple comparison of only the physical dimensions of alternative offerings usually doesnot provide a complete picture of relative positions because, as we noted earlier, position-ing ultimately occurs in customers’ minds. Even though a product’s physical characteris-tics, package, brand name, price, and ancillary services can be designed to achieve aparticular position in the market, customers may attach less importance to some of thesecharacteristics than, or perceive them differently from, what the firm expects. Also, cus-tomers’ attitudes toward a product are often based on social or psychological attributes notamenable to objective comparison, such as perceptions of the product’s aesthetic appeal,sportiness, or status image. Consequently, perceptual positioning analysis—whetheraimed at discovering opportunities for new product entries or evaluating and adjusting theposition of a current offering—is critically important.
Perceptual Positioning
Consumers often know very little about the essential physical attributes of many products,especially household products, and even if they did, they would not understand the physi-cal attributes well enough to use them as a basis for choosing between competitive offer-ings. (For the major differences between physical and perceptual product positioninganalyses, see Exhibit 8.3.) Many consumers do not want to be bothered about a product’s
Exhibit 8.21996 Ford Expedition versus GM Suburban on a Selected Number of Physical Dimensions
Feature Expedition Suburban
Seating capacity 9 9
Cargo capacity 115 cu. ft. 149.5 cu. ft.
Engine 4.6 liter, V-8 5.7 liter, V-8
City mileage 14 mpg 13 mpg
Highway mileage 18 mpg 17 mpg
Length 204.6 inches 220 inches
Price $24–36,000 $24,682–38,000
Source: Aaron Lucchetti, “Ford’s New Expedition Heads into Suburban’s Terrain,” Wall Street Journal,June 24, 1996, p. B1. Copyright 1996 by Dow Jones & Co. Inc. Reproduced with permission of DowJones & Co. Inc. via Copyright Clearance Center.
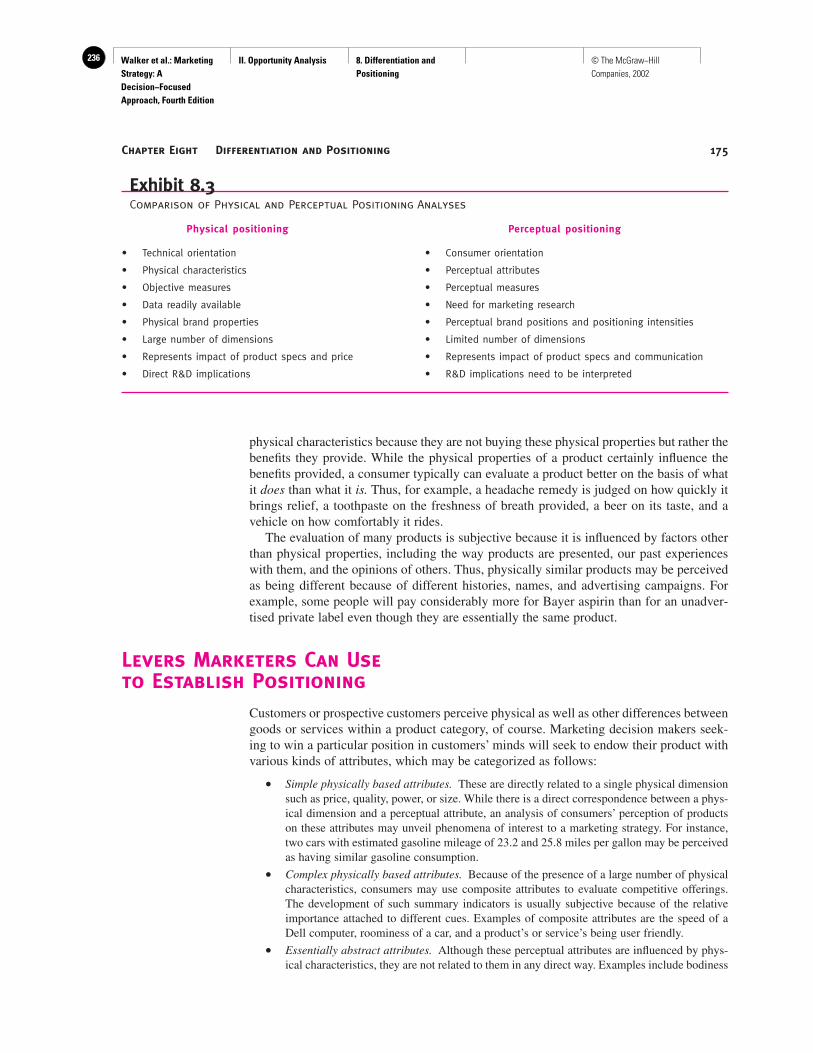
Walker et al.: Marketing Strategy: A Decision−Focused Approach, Fourth Edition
II. Opportunity Analysis 8. Differentiation and Positioning
236 © The McGraw−Hill Companies, 2002
Chapter Eight Differentiation and Positioning 175
physical characteristics because they are not buying these physical properties but rather thebenefits they provide. While the physical properties of a product certainly influence thebenefits provided, a consumer typically can evaluate a product better on the basis of whatit does than what it is. Thus, for example, a headache remedy is judged on how quickly itbrings relief, a toothpaste on the freshness of breath provided, a beer on its taste, and avehicle on how comfortably it rides.
The evaluation of many products is subjective because it is influenced by factors otherthan physical properties, including the way products are presented, our past experienceswith them, and the opinions of others. Thus, physically similar products may be perceivedas being different because of different histories, names, and advertising campaigns. Forexample, some people will pay considerably more for Bayer aspirin than for an unadver-tised private label even though they are essentially the same product.
Levers Marketers Can Use
to Establish Positioning
Customers or prospective customers perceive physical as well as other differences betweengoods or services within a product category, of course. Marketing decision makers seek-ing to win a particular position in customers’ minds will seek to endow their product withvarious kinds of attributes, which may be categorized as follows:
• Simple physically based attributes. These are directly related to a single physical dimensionsuch as price, quality, power, or size. While there is a direct correspondence between a phys-ical dimension and a perceptual attribute, an analysis of consumers’ perception of productson these attributes may unveil phenomena of interest to a marketing strategy. For instance,two cars with estimated gasoline mileage of 23.2 and 25.8 miles per gallon may be perceivedas having similar gasoline consumption.
• Complex physically based attributes. Because of the presence of a large number of physicalcharacteristics, consumers may use composite attributes to evaluate competitive offerings.The development of such summary indicators is usually subjective because of the relativeimportance attached to different cues. Examples of composite attributes are the speed of aDell computer, roominess of a car, and a product’s or service’s being user friendly.
• Essentially abstract attributes. Although these perceptual attributes are influenced by phys-ical characteristics, they are not related to them in any direct way. Examples include bodiness
Exhibit 8.3Comparison of Physical and Perceptual Positioning Analyses
Physical positioning Perceptual positioning
• Technical orientation • Consumer orientation
• Physical characteristics • Perceptual attributes
• Objective measures • Perceptual measures
• Data readily available • Need for marketing research
• Physical brand properties • Perceptual brand positions and positioning intensities
• Large number of dimensions • Limited number of dimensions
• Represents impact of product specs and price • Represents impact of product specs and communication
• Direct R&D implications • R&D implications need to be interpreted

Walker et al.: Marketing Strategy: A Decision−Focused Approach, Fourth Edition
II. Opportunity Analysis 8. Differentiation and Positioning
237© The McGraw−Hill Companies, 2002
Section Two Opportunity Analysis176
of a beer, sexiness of a perfume, quality of a French wine, and prestige of a car. All of theseattributes are highly subjective and difficult to relate to physical characteristics other than byexperience.
The importance of perceptual attributes with their subjective component varies acrossconsumers and product classes. Thus, it can be argued that consumers familiar with a givenproduct class are apt to rely more on physical characteristics and less on perceptualattributes than consumers who are less familiar with that product class. It also can beargued that while perceptual product positioning is essential for nondurable consumergoods, such is not the case for consumer durables (such as sport utility vehicles) and manyindustrial goods.
Even though there is considerable truth in these statements, perceptual attributes must beconsidered in positioning most products. One reason is the growing similarity of the physi-cal characteristics of more and more products. This increases the importance of other, largelysubjective dimensions. Consider, for example, whether Nike’s Air Jordan basketball shoeswould have sold as well without Michael Jordan’s endorsement and his presence in their ads.
Preparing the Foundation
for Marketing Strategies:
The Positioning Process
Positioning a new product in customers’ minds or repositioning a current product involvesa series of steps, as outlined in Exhibit 8.4. These steps are applicable to goods and ser-vices, in domestic or international markets, and to new or existing products. This is not tosuggest that the determinant product attributes and the perceptions of consumers of thevarious competitive offerings will remain constant across countries or other market seg-ments; rather, they are likely to vary with most products. After managers have selected arelevant set of competing offerings serving a target market (Step 1), they must identify aset of critical or determinant product attributes important to customers in that target mar-ket (Step 2).
Step 3 involves collecting information from a sample of customers about their percep-tions of the various offerings, and in Step 4 researchers analyze this information to deter-mine the product’s current position in customers’ minds and the intensity thereof (Does itoccupy a dominant position?), as well as those of competitors.
Managers then ascertain the customers’ most preferred combinations of determinantattributes, which requires the collection of further data (Step 5). This allows an examina-tion of the fit between the preferences of a given target segment of customers and the cur-rent positions of competitive offerings (Step 6). And finally, in Step 7, managers write aconcise statement that communicates the positioning decision they have reached.
A discussion of these steps in the positioning process takes up the remainder of thischapter.
Step 1: Identify a Relevant Set of CompetitiveProducts Positioning analyses are useful at many levels: company, business unit, product category,and specific product line or brand. At the company or business-unit level, such analyses areuseful to determine how an entire company or business unit is positioned relative to itscompetitors. The results of such analyses are sometimes displayed graphically by plotting

Walker et al.: Marketing Strategy: A Decision−Focused Approach, Fourth Edition
II. Opportunity Analysis 8. Differentiation and Positioning
238 © The McGraw−Hill Companies, 2002
Chapter Eight Differentiation and Positioning 177
competing companies or businesses in their respective quadrants of the generic strategiesgrid shown in Exhibit 8.1. Larger or smaller dots or circles are used to indicate relativesizes of competing firms.
At the product category level, the analysis examines customers’ perceptions about typesof products they might consider as substitutes to satisfy the same basic need. Suppose, forexample, a company is considering introducing a new instant breakfast drink. The newproduct would have to compete with other breakfast foods, such as bacon and eggs, break-fast cereals, and even fast-food drive-throughs. To understand the new product’s positionin the market, a marketer could obtain customer perceptions of the new product conceptrelative to likely substitute products on various critical determinant attributes, as wedescribe in Steps 3 and 4 of the positioning process (see Exhibit 8.4).
Once competitors introduce several brands into the category, a positioning analysis atthe product or brand level can be helpful to better understand how various brands appealto customers, to position proposed new products or brands or reposition current ones, andto identify where new competitive opportunities might be found.
1. Identify relevant set of competitive productsserving a target market.
2. Identify the set of determinant attributesthat define the "product space" in whichpositions of current offerings are located.
3. Collect information from a sample of customersand potential customers about perceptions ofeach product on the determinant attributes.
4. Determine product's current location(positioning) in the product space
and intensity thereof.
5. Determine customers' most preferredcombination of determinant attributes.
6. Examine the fit between preferencesof market segments and current
position of product (market positioning).
7. Write positioning statement or valueproposition to guide development andimplementation of marketing strategy.
Identify positions whereadditional new products
might be placed.
Exhibit 8.4Steps in the Positioning Process

Walker et al.: Marketing Strategy: A Decision−Focused Approach, Fourth Edition
II. Opportunity Analysis 8. Differentiation and Positioning
239© The McGraw−Hill Companies, 2002
Section Two Opportunity Analysis178
At whichever level the positioning analysis is to be done, the analyst’s choice of compet-ing products (or product categories or firms) is critical. Marketers who omit important sub-stitute products or potential competitors risk being blindsided by unforeseen competition.
Step 2: Identify Determinant AttributesPositioning can be based on a variety of attributes—some in the form of surrogates thatimply desirable features or benefits as a positioning base. The common types of bases arethe following.7
• Features are often used in physical product positioning and, hence, with industrial products.An example of its use with a consumer good is Jenn-Air’s claim, “This is the quietest dish-washer made in America.” Amazon.com has a unique “1-click®” ordering system.
• Benefits, like features, are directly related to a product. Examples here include Volvo’semphasis on safety and durability and Norelco’s promising a “close and comfortable shave.”
• Usage includes end use (“If you’ve got it in the kitchen, it probably goes with pork”—a ver-satility claim); demographic (“Just because kids will be kids doesn’t mean you can’t haveknock-down, gorgeous floors”—Congoleum); psychographic or behavorial (Ellesse posi-tioning itself as producing a fashionable upscale active-wear line); and popularity (Hertz asthe biggest rental car company in the world).
• Parentage includes who makes it (bottled by a French vintner; “At Fidelity, you’re not justbuying a fund, a stock, or a bond—you’re buying a better way to manage it”) and prior prod-ucts (“Buying a car is like getting married. It’s a good idea to know the family first,” followedby a picture of the ancestors of the Mercedes-Benz S class model).
• Manufacturing process is often the subject of a firm’s positioning efforts. An example isJaeger-LeCoultre’s statement about its watches: “We know it’s perfect, but we take another1,000 hours just to be sure.”
• Ingredients as a positioning concept is illustrated by some clothing manufacturers sayingtheir sports shirts are made only of pure cotton.
• Endorsements are of two types: those by experts (“Discover why over 5,000 American doc-tors and medical professionals prescribe this Swedish mattress”—Tempor-Pedic) and thosevia emulation as with Michael Jordan using Nike shoes.
• Comparison with a competitor’s product is common (“Tests prove Pedigree is more nutri-tious than IAMS, costs less than IAMS, and tastes great, too”—Pedigree Mealtime).
• Proenvironment positioning seeks to portray a company as a good citizen (“Because werecycle over 100 million plastic bottles a year, landfills can be filled with other things, likeland, for instance”—Phillips Petroleum).
• Product class as when freeze-dried coffee was introduced as a new and different producttype versus regular or instant coffees.
• Price/quality is used in cases such as Wal-Mart successfully positioning itself as the lowest-price seller of quality household products.
• Country or geographic area (French wines, Russian vodka).
Theoretically, consumers can use many attributes to evaluate products or brands, but thenumber actually influencing a consumer’s choice is typically small, partly because con-sumers can consider only attributes of which they are aware. The more variables used inpositioning a given product, the greater the chance of confusion and even disbelief on thepart of the consumer. The positioning effort must be kept as simple as possible and com-plexity should be avoided at all costs.
In using one or more attributes as the basis of a brand’s positioning effort, it is impor-tant to recognize that the importance attached to these attributes often varies. For example,while the brands of soap or shampoo provided by a hotel may be an attribute that some
www

Walker et al.: Marketing Strategy: A Decision−Focused Approach, Fourth Edition
II. Opportunity Analysis 8. Differentiation and Positioning
240 © The McGraw−Hill Companies, 2002
Chapter Eight Differentiation and Positioning 179
consumers use in evaluating hotels, most are unlikely to attach much importance to it whendeciding which hotel chain to patronize. Even an important attribute may not greatly influ-ence a consumer’s preference if all the alternative brands are perceived to be about equalon that dimension. Deposit safety is an important attribute to consider when choosing abank, but most consumers perceive all banks to be about equally safe. Consequently,deposit safety is not a determinant attribute: It does not play a major role in helping cus-tomers to differentiate among the alternatives and to determine which bank they prefer.
Marketers should rely primarily on determinant attributes in defining the product spacein a positioning analysis. The question is, How can a marketer find out which productdimensions are determinant attributes? Doing so typically requires conducting some kindof marketing research, using the marketing research process described in a previous chap-ter. This brings us to Step 3.
Step 3: Collect Data about Customers’Perceptions for Products in the Competitive SetHaving identified a set of competing products, the marketer needs to know what attributesare determinant for the target market and the product category under consideration. He orshe also needs to know how different products in the competitive set are viewed on theseattributes. Typically this market knowledge is developed by first conducting qualitativeresearch, perhaps interviews or focus groups, to learn which attributes are determinant.Then quantitative research follows, perhaps a survey of consumers about their perceptions,to gather data on how competing products score on these attributes. Later in this chapter,we discuss several statistical and analytical tools that are useful in this portion of the posi-tioning process.
Step 4: Analyze the Current Positions of Productsin the Competitive SetWhether the positioning process is directed at a new product not yet introduced or reposi-tioning one that already exists, it is important to develop a clear understanding of the posi-tioning of the products that have been determined to be in the competitive set (see Step 1).A useful tool for doing so is the positioning grid, also called a perceptual map.8 Thepositioning grid provides a visual representation of the positions of various products orbrands in the competitive set in terms of (typically) two determinant attributes. Wheremore than two attributes are to be considered in a positioning analysis, multidimensionalgrids, or multiple grids, are produced. But not all products or brands exist in the minds ofmost consumers.
A brand that is not known by a consumer cannot, by definition, occupy a position in thatconsumer’s mind. Often the awareness set for a given product class is 3 or fewer brandseven though the number of available brands is greater than 20. Thus, many if not mostbrands have little or no position in the minds of many consumers. For example, in the last10 or so years, more than 200 new soft drinks have been introduced, most of which werenot noticed or remembered by consumers. Thus, the first step in acquiring a distinct posi-tion for a brand is to build brand awareness. In doing so, the brand needs to be strongly asso-ciated with one or more concepts relating to the purchase decision. A distinct position isbest obtained by developing a strong relationship between a brand and a limited number ofattributes.9 Determining the attributes on which the product’s positioning will be based is akey outcome of the positioning process and a driver of the marketing communication strat-egy, as well as the marketing strategy overall, that will ultimately be developed. Without
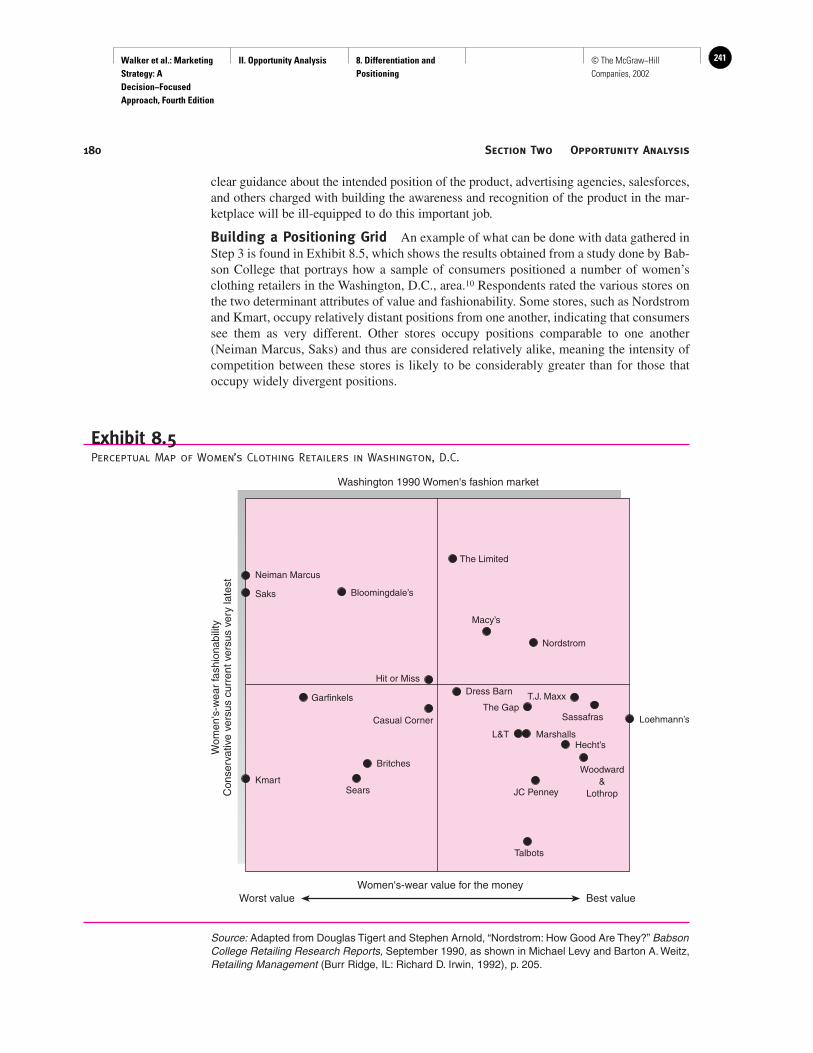
Walker et al.: Marketing Strategy: A Decision−Focused Approach, Fourth Edition
II. Opportunity Analysis 8. Differentiation and Positioning
241© The McGraw−Hill Companies, 2002
Section Two Opportunity Analysis180
clear guidance about the intended position of the product, advertising agencies, salesforces,and others charged with building the awareness and recognition of the product in the mar-ketplace will be ill-equipped to do this important job.
Building a Positioning Grid An example of what can be done with data gathered inStep 3 is found in Exhibit 8.5, which shows the results obtained from a study done by Bab-son College that portrays how a sample of consumers positioned a number of women’sclothing retailers in the Washington, D.C., area.10 Respondents rated the various stores onthe two determinant attributes of value and fashionability. Some stores, such as Nordstromand Kmart, occupy relatively distant positions from one another, indicating that consumerssee them as very different. Other stores occupy positions comparable to one another(Neiman Marcus, Saks) and thus are considered relatively alike, meaning the intensity ofcompetition between these stores is likely to be considerably greater than for those thatoccupy widely divergent positions.
Exhibit 8.5Perceptual Map of Women’s Clothing Retailers in Washington, D.C.
Source: Adapted from Douglas Tigert and Stephen Arnold, “Nordstrom: How Good Are They?” BabsonCollege Retailing Research Reports, September 1990, as shown in Michael Levy and Barton A. Weitz,Retailing Management (Burr Ridge, IL: Richard D. Irwin, 1992), p. 205.
The Limited
JC PenneySears
Macy’s
Nordstrom
Dress Barn
The GapT.J. Maxx
Sassafras
L&T MarshallsHecht’s
Woodward&
Lothrop
Talbots
Britches
Casual Corner
Garfinkels
Hit or Miss
Bloomingdale’s
Neiman Marcus
Saks
Kmart
Loehmann’s
Women's-wear value for the moneyWorst value Best value
Washington 1990 Women's fashion market
Wom
en's
-wea
r fa
shio
nabi
lity
Con
serv
ativ
e ve
rsus
cur
rent
ver
sus
very
late
st

Walker et al.: Marketing Strategy: A Decision−Focused Approach, Fourth Edition
II. Opportunity Analysis 8. Differentiation and Positioning
242 © The McGraw−Hill Companies, 2002
Chapter Eight Differentiation and Positioning 181
The store positioning shown in Exhibit 8.5 also provides useful information about pos-sible opportunities for the launching of a new store or the repositioning of an existing one.Positioning for a new store could be done by examining the positioning map for emptyspaces (competitive gaps) where no existing store is currently located. There is such a gapin the upper right quadrant of the “value/fashionability” map in Exhibit 8.5. This gap mayrepresent an opportunity for developing a new entry or repositioning an old one that is per-ceived to offer greater fashionability than Nordstrom at a lower price. Of course, such gapsmay exist simply because a particular position is either (1) impossible for any brand toattain because of technical constraints or (2) undesirable since there are few prospectivecustomers for a brand with that set of attributes.
Marketing Opportunities to Gain a Distinct Position In situations where oneor a limited number of brands dominate a product class (or type) in the minds of consumers,the main opportunity for competitors generally lies in obtaining a profitable position withina market segment not dominated by a leading brand. Competing head-on against the lead-ers on the basis of attributes appropriated by larger competitors is not likely to be effective.
A better option is to concentrate on an attribute prized by members of a given marketsegment. Thus, Dell offers its customers a custom-built computer that has exactly thedesired features, something its corporate customers value.
Constraints Imposed by an Intense Position Although marketers should seeka distinctive and intense position for their brands, attaining such a position imposes con-straints on future strategies. If shifts in the market environment cause customers to reducethe importance they attach to a current determinant attribute, marketers may have difficultyrepositioning a brand with an intensely perceived position on that attribute. Repositioningcarries with it the threat of alienating part or all of the product’s current users regardlessof success with its newly targeted group. Success in its repositioning efforts may wellensure losing its current group of users.
Another concern is the dilution of an existing intense position as a result of consolida-tion. For example, British Leyland was formed through a series of mergers involving anumber of British car manufacturers. For years, the company did not have a clear identitybecause it was new and distributed a variety of brands, including Rover, Triumph, andAustin-Morris. Most Europeans had difficulty recalling spontaneously any British carmanufacturer since once-strong brand names such as Austin and Morris had lost their iden-tity and meaning.
Another danger associated with an intensely positioned brand is the temptation to over-exploit that position by using the brand name on line extensions and new products. Thedanger here is that the new products may not fit the original positioning and the brand’sstrong image is diluted. For example, how many travelers know the difference betweenHoliday Inn, Holiday Inn Express, Holiday Inn Select, and Holiday Inn Garden Court?11
Limitations of Product Positioning Analysis The analysis depicted in Exhibit8.5 is usually referred to as product positioning because it indicates how alternative prod-ucts or brands are positioned relative to one another in customers’ minds. The problemwith this analysis, though, is that it does not tell the marketer which positions are mostappealing to customers.12 Thus, there is no way to determine if there is a market for a newbrand or store that might locate in an “open” position or whether the customers in othermarket segments prefer brands or stores with different attributes and positions. To solvesuch problems it is necessary to measure customers’ preferences and locate them in theproduct space along with their perceptions of the positions of existing brands. This iscalled a market positioning analysis. We deal with this issue in Step 5.

Walker et al.: Marketing Strategy: A Decision−Focused Approach, Fourth Edition
II. Opportunity Analysis 8. Differentiation and Positioning
243© The McGraw−Hill Companies, 2002
Section Two Opportunity Analysis182
Step 5: Determine Customers’ Most PreferredCombination of AttributesThere are several ways analysts can measure customer preferences and include them in apositioning analysis. For instance, survey respondents can be asked to think of the idealproduct or brand within a product category—a hypothetical brand possessing the perfectcombination of attributes (from the customer’s viewpoint). Respondents then could ratetheir ideal product and existing products on a number of attributes. An alternative approachis to ask respondents not only to judge the degree of similarity among pairs of existingbrands but also to indicate their degree of preference for each. In either case, the analyst,using the appropriate statistical techniques, can locate the respondents’ ideal points rela-tive to the positions of the various existing brands on the product space map.
Another method of assessing customers’ preferences and trade-offs among them is astatistical technique called conjoint analysis.13 Customers are surveyed and asked theirpreferences among various real or hypothetical product configurations, each with attributesthat are systematically varied. By analyzing the resulting data, the marketer can learnwhich of several attributes are more important than the others. These results then can beused in positioning analyses such as those described here.
Whichever approach is used, the results will look something like Exhibit 8.6, whichshows a hypothetical cluster of ideal points for one segment of women’s-clothing con-sumers. As a group, this segment would seem to prefer Nordstrom over any other women’sclothing retailer on the map.
There are, however, several reasons not all customers in this segment are likely to pre-fer Nordstrom. First, the ideal points of some customers are actually closer to Macy’s thanNordstrom. Second, customers whose ideal point is equidistant between the two storesmay be relatively indifferent in their choice of which store to patronize. And finally, cus-tomers sometimes may patronize stores somewhat further away from their ideal—particu-larly when buying low-involvement, nondurable goods or services—to assess the qualitiesof new stores, to reassess older stores from time to time, or just for the sake of variety.
Using price as one dimension of a positioning grid, or as a key dimension on which aproduct is positioned, is typically not very useful unless price is a key driver of the mar-keting strategy. This is the case for two reasons. First, price is easily imitable by competi-tors. Unless the firm has a clear cost advantage over its competitors, by virtue of itsprocesses or other sources of efficiency, using low price as a basis for positioning can bea fast road to a price war that no one (except consumers) will win. Second, claims thatone’s product—whether a good or a service—is low-priced are sometimes not very credi-ble, because so many marketers make such claims. It is often better to position aroundmore enduring differentiators, and let price speak more subtly for itself. Wal-Mart, anexception, has been able to sustain its low-price positioning in the United States becauseits costs, compared to those of its chief competitors, actually are lower. The same is truefor Dell.
Step 6: Consider Fit of Possible Positions withCustomer Needs and Segment Attractiveness An important criterion for defining market segments is the difference in the benefits sought bydifferent customers. Because differences between customers’ ideal points reflect variations inthe benefits they seek, a market positioning analysis can simultaneously identify distinct mar-ket segments as well as the perceived positions of different brands. When customers’ ideal

Walker et al.: Marketing Strategy: A Decision−Focused Approach, Fourth Edition
II. Opportunity Analysis 8. Differentiation and Positioning
244 © The McGraw−Hill Companies, 2002
Chapter Eight Differentiation and Positioning 183
points cluster in two or more locations on the product space map, the analyst can consider eachcluster a distinct market segment.14 For analytical purposes, each cluster is represented by acircle that encloses most of the ideal points for that segment; the size of the circle reflects therelative proportion of customers within a particular segment.
Exhibit 8.7 groups the sample of Washington, D.C., respondents into five distinct seg-ments on the basis of clusters of ideal points.15 Segment 5 contains the largest proportionof customers; segment 1, the smallest.16 By examining the preferences of customers in dif-ferent segments along with their perceptions of the positions of existing brands, analystscan learn much about (1) the competitive strength of different brands in different segments,(2) the intensity of the rivalry between brands in a given segment, and (3) the opportuni-ties for gaining a differentiated position within a specific target segment.
Step 6 not only concludes the analysis portion of the positioning process and crystal-lizes the decision about the positioning a product should hold, but it also can uncover loca-tions in the product space where additional new products could be positioned to serve
Exhibit 8.6Perceptual Map of Women’s Clothing Retailers in Washington, D.C., Showing the Ideal Points of a Segment
of Consumers
Source: Adapted from Douglas Tigert and Stephen Arnold, “Nordstrom: How Good Are They?” BabsonCollege Retailing Research Reports, September 1990.
Women's-wear value for the moneyWorst value Best value
Washington 1990 Women's fashion market
Wom
en's
-wea
r fa
shio
nabi
lity
Con
serv
ativ
e ve
rsus
cur
rent
ver
sus
very
late
st
The Limited
JC PenneySears
Macy’s
Nordstrom
Dress Barn
The GapT.J. Maxx
Sassafras
L&T MarshallsHecht’s
Woodward&
Lothrop
Talbots
Britches
Casual Corner
Garfinkels
Hit or Miss
Bloomingdale’s
Neiman Marcus
Saks
Kmart
Loehmann’s

Walker et al.: Marketing Strategy: A Decision−Focused Approach, Fourth Edition
II. Opportunity Analysis 8. Differentiation and Positioning
245© The McGraw−Hill Companies, 2002
Section Two Opportunity Analysis184
customer needs not well served by current competitors. Thus, Exhibit 8.4 shows that a pos-sible side benefit of the positioning process is recognition of underserved positions whereadditional new products might be placed.
Step 7: Write Positioning Statement or ValueProposition to Guide Development of MarketingStrategyThe final decision about where to position a new brand or reposition an existing one shouldbe based on both the market targeting analysis discussed in Chapter 7 and the results ofa market positioning analysis. The position chosen should match the preferences of aparticular market segment and should take into account the current positions of competingbrands.
Exhibit 8.7Perceptual Map of Women’s Clothing Retailers in Washington, D.C., Showing Five Segments Based on Ideal Points
Source: Adapted from Douglas Tigert and Stephen Arnold, “Nordstrom: How Good Are They?” BabsonCollege Retailing Research Reports, September 1990.
Women's-wear value for the moneyWorst value Best value
Washington 1990 Women's fashion marketW
omen
's-w
ear
fash
iona
bilit
yC
onse
rvat
ive
vers
us c
urre
nt v
ersu
s ve
ry la
test
The Limited
JC PenneySears
Macy's
Nordstrom
Dress Barn
The GapT.J. Maxx
Sassafras
L&T MarshallsHecht's
Woodward&
Lothrop
Talbots
Britches
Casual Corner
Garfinkels
Hit or Miss
Bloomingdale’s
Kmart
Loehmann’s
Neiman Marcus
Saks2
3
4
51
Walker et al.: Marketing Strategy: A Decision−Focused Approach, Fourth Edition
II. Opportunity Analysis 8. Differentiation and Positioning
246 © The McGraw−Hill Companies, 2002
Chapter Eight Differentiation and Positioning 185
It also should reflect the current and future attractiveness of the target market (its size,expected growth, and environmental constraints) and the relative strengths and weaknessesof competitors. Such information, together with an analysis of the costs required to acquireand maintain these positions, allows an assessment of the economic implications of dif-ferent market-positioning strategies. Dell’s belief that corporate customers, its principaltarget market, would value its custom-built, low-cost positioning and that competitorswould have difficulty emulating its model has served it well through the ups and downs ofthe PC market.
Most successful products, like Dell computers, are positioned based on one or, at most,two determinant attributes, whether physical or perceptual. Using more simply confusescustomers. Domino’s Pizza, in its early days, focused its positioning solely on its fast
delivery, since that was the principal dimension on which it establishedits competitive advantage. While there are many things Domino’s couldhave said about the pizza itself, for example, it chose to focus its posi-tioning on its key point of differentiation: fast delivery. Recently, whenfast delivery became common in the pizza industry, Domino’s added a
heat retention device to its delivery containers and added a second positioning attribute:hot. Papa John’s, a more recent entrant in the pizza business, positions its offering arounda single attribute, the quality of its pizza, with its promotional phrase, “Better ingredients.Better pizza.”
Where there are no real product differences, as in so-called me-too products, or no dif-ferential benefits to the user, not only is success hard to achieve, but also ethical issues mayarise. For an example of ethical issues involving positioning in the pharmaceutical indus-try, see Ethical Perspective 8.1.
Once the desired positioning for the product has been determined, it’s a good idea towrite it down so those charged with developing and implementing the marketing strategyhave a clear understanding of what is intended for the product and where it will fit in itscompetitive set. Two approaches are commonly used for doing so. In the classicalapproach, a positioning statement is written. A more recent approach, one being adoptedin a growing number of firms, involves writing a value proposition for the product.
Writing a Positioning Statement or a Value Proposition A positioning state-ment is a succinct statement that identifies the target market for which the product is
Strategic Issue
Most successful products are positionedbased on one or, at most, two determinantattributes.
Ethical Perspective 8.1
The Case of TPA: Ethical Issues in Posi-tioning Pharmaceutical Products
Given efforts on many fronts to hold down costs ofmedical care and health insurance, ethical questionshave been raised about the positioning of new med-ications that sometimes perform no better than oldtreatments but at sharply higher prices. One exampleis the introduction of a drug called TPA (for tissue plas-minogen activator) that helps break up blood clots inheart attack victims. The pharmaceutical firm that intro-duced TPA positioned the drug as the “newest treat-ment” and priced it at $2,500 per treatment comparedto $220 for streptokivase, the traditional treatment.
Later research showed no significant difference in theeffectiveness of the two drugs. Managers in pharma-ceutical firms commonly face similar dilemmas, oncethe results of the clinical trials are in. Should they mar-ket a new drug that is little better than an old one,thereby (if the new drug is successful) enhancingshareholder value and providing funds for researchthat could lead to subsequent medical breakthroughs?Or should they write off their R&D investment, anddevote their marketing efforts to drugs that really arebetter?
Source: Andrew Purris, “Cheaper Can Be Better,” Time, March 18,1991, p. 70. © 1991 Time Inc. Reprinted by permission.
E

Walker et al.: Marketing Strategy: A Decision−Focused Approach, Fourth Edition
II. Opportunity Analysis 8. Differentiation and Positioning
247© The McGraw−Hill Companies, 2002
Section Two Opportunity Analysis186
intended and the product category in which it competes and states the unique benefit theproduct offers. An example of a positioning statement that reflects Volvo’s marketing strat-egy in the United States is shown in Exhibit 8.8.
A value proposition is similarly explicit about what the product does for the customer(and sometimes, what it does not do) and typically also includes information about pric-ing relative to competitors. Both positioning statements and value propositions shouldreflect a unique selling proposition that the product embodies. In this sense, they reflectthe basis on which the marketer intends to win sustainable competitive advantage by dif-ferentiating the product from others in its competitive space. In its shortest form, a valueproposition typically looks like this:
• Target market
• Benefits offered (and not offered)
• Price range (relative to competitors)
Exhibit 8.8 also provides a value proposition for Volvo. More fully developed valuepropositions sometimes identify the best competing alternatives available to the customerand specify the benefits, in measurable terms, that the customer can expect to receive byusing the proposed product.17 Detailed value propositions such as these are particularlyhelpful in positioning industrial goods and services, where quantifiable customer benefitsare often essential to make the sale.
It is important that the positioning statement or value proposition states benefits that theuser of the product will obtain, rather than features or attributes of the product itself, or vague
or ambiguous platitudes about high quality or excellent service. By bene-fits, we mean the resulting end-use measurable consequences that the userwill experience through the use of the product, in comparison to others.
The marketer writes positioning statements and value propositionsfor use internally and by others, such as advertising agencies, engagedto develop the marketing strategy. They are short and succinct, and aretypically not written in catchy consumer language, though catchy slo-
gans and tag lines for communication with customers often follow. They are commonlywritten for a product line or a brand, as is the case in our Volvo example, but sometimesfor a single product or for a business as a whole. For products or brands, they play severalimportant roles. They provide direction for R&D and product development about whatkind of attributes should be built into the product (side door airbags, for example, inVolvo’s case). They provide direction for those who create advertising campaigns aboutwhat the focus of those campaigns should be (for example, Volvo’s ads almost alwaysfocus on safety or durability, even though Volvo could say other things about its cars). The value proposition provides direction for pricing decisions. Thus, in a very real sense,the positioning statement or value proposition constitutes the foundation upon which the
Exhibit 8.8Positioning Statement and Value Proposition for Volvo Automobiles in the United States
Positioning statement Value proposition
For upscale American families, Volvo is the automobile • Target market: Upscale American families
that offers the utmost in safety and durability. • Benefits offered: Safety, durability
• Price range: 20% premium over similar cars
Strategic Issue
It is important that the positioning state-ment or value proposition states benefitsthat the user of the product will obtain,rather than features or attributes of theproduct.

Walker et al.: Marketing Strategy: A Decision−Focused Approach, Fourth Edition
II. Opportunity Analysis 8. Differentiation and Positioning
248 © The McGraw−Hill Companies, 2002
Chapter Eight Differentiation and Positioning 187
marketing strategy is built. More broadly, when used at the business level, as they some-times are, these statements articulate the strategic direction toward which the company’sactivities in all arenas should be directed. Promising a certain sort of positioning, or value,to the target market is one thing. Delivering it is another. Clear and concise positioningstatements and value propositions can play important roles in effectively executing theintended strategy.
Software tools useful for making positioning deci-sions include applications that identify important
determinant attributes, as well as statistical applica-tions that can plot positioning grids from marketresearch data.
Conjoint analysis: As was mentioned in Step 5 ofthe positioning process, it is important to learn whichkey attributes are important to consumers. Conjointanalysis is one tool for doing so. Conjoint analysisdetermines which combination of a limited number ofattributes consumers most prefer. The technique ishelpful for identifying appealing new product designsand important points that might be included in a prod-uct’s advertising. Although it can provide some insightsabout consumer preferences, it cannot provide infor-mation about how consumers perceive the positioningof existing products in relation to product dimensions.Conjoint analysis is one way to narrow down a set ofproduct attributes to those most important to considerin product design and positioning decisions. Most
often, it is used with physical attributes,not perceptual ones. Several widely usedconjoint analysis applications are availablefrom Sawtooth Software, Inc. (www.saw-
toothsoftware.com). Factor analysis and discriminant analysis: Factor
analysis and discriminant analysis are two statisticaltechniques useful in constructing positioning gridsbased on actual marketing research data. They areincluded in most broad-based statistical packages, suchas SPSS MR (www.spss.com/spssmr). To employ factoranalysis, the analyst first must identify the salient attri-butes consumers use to evaluate products in the cate-gory under study. The analyst then collects data from asample of consumers concerning their ratings of eachproduct or brand on all attributes. The factor analysisprogram next determines which attributes are related tothe same underlying construct (“load” on the same fac-tor). The analyst uses those underlying constructs orfactors as the dimensions for a product space map, andthe program indicates where each product or brand isperceived to be located on each factor.
Discriminant analysis requires the same input dataas factor analysis. The discriminant analysis programthen determines consumers’ perceptual dimensions onthe basis of which attributes best differentiate, or dis-criminate, among brands. Once again, those underly-ing dimensions can be used to construct a productspace map, but they are usually not so easily inter-pretable as the factors identified through factor analy-sis. Also, as with factor analysis, the underlyingdimensions may be more a function of the attributesused to collect consumer ratings than of the productcharacteristics that consumers actually consider to bemost important.
Multidimensional scaling: Unlike the other tech-niques in which the underlying dimensions identifieddepend on the attributes supplied by the researcherwhen collecting data, multidimensional scaling pro-duces dimensions based on consumer judgments aboutthe similarity of, or their preferences for, the actualbrands. These underlying dimensions are thought to bethe basic attractive dimensions that consumers actuallyuse to evaluate alternative brands in the product class.Multidimensional scaling programs that use data onsimilarities construct geometrically spaced maps onwhich the brands perceived to be most similar areplaced close together. Those that use consumer prefer-ences produce joint space maps that show consumerideal points and then position the most-preferredbrands close to those ideal points.
Unfortunately, the underlying dimensions of themaps produced by multidimensional scaling can be dif-ficult to interpret. Also, the dimensions identified areonly those that already exist for currently availablebrands. This makes the technique less useful for inves-tigating new product concepts that might involve newcharacteristics. Finally, the technique is subject to sta-tistical limitations, when the number of alternativebrands being investigated is small. As a rule, such tech-niques should be applied only when at least eight ormore different products or brands are being examined.
Exhibit 8.9 Software Tools for Positioning Decision Making
www
Walker et al.: Marketing Strategy: A Decision−Focused Approach, Fourth Edition
II. Opportunity Analysis 8. Differentiation and Positioning
249© The McGraw−Hill Companies, 2002
Section Two Opportunity Analysis188
Analytical Tools for Positioning
Decision Making
Throughout the positioning process, we have advocated collecting marketing research dataso positioning decisions are anchored in solid evidence, not mere supposition or naiveopinion. Advances in computing power and statistical techniques have made possible abroad range of tools to help the marketing decision maker make the best use of marketingresearch. We briefly outline a few of these tools in Exhibit 8.9. It is beyond the scope ofthis book to provide detailed instruction in the use of these and other statistical techniques.Texts on marketing research and new product development are good sources for additionaldepth in this area.18
Take Aways
Endnotes
• Clear and distinctive positioning that differentiates aproduct from others with which it competes is usuallyessential for developing a winning marketing strategy.
• The positioning process outlined in this chapter helpsdecision makers choose a position that maximizestheir chance of establishing sustainable competitiveadvantage.
• Distinctive and intense positioning is best accom-plished when based on one or at most two attributes.More are likely to be confusing to customers.
• Writing clear and succinct positioning statements orvalue propositions can play an important role in ensur-ing effective development and execution of a market-ing strategy. This chapter provides templates forwriting these materials.
• Self-diagnostic questions to test your ability to applythe analytical tools and concepts in this chapter tomarketing decision making may be found at thisbook’s website at www.mhhe.com/walker.
1. Based on Jan W. Rivkin and Michael E. Porter, Matching Dell (Boston, MA:Harvard Business School Publishing, 1999), and Ira Sager and Faith Keenan,“In Technology, the Mother of All Price Wars,” BusinessWeek Online, July 30,2001, at www.businessweek.com/magazine/content/01_31/b3743049.htm.
2. Al Ries and Jack Trout, Positioning: The Battle for Your Mind (New York:Warner Books, 1982).
3. For a discussion of the positioning of industrial goods, see Frederick E.Webster Jr., Industrial Marketing Strategy (New York: John Wiley & Sons,1991), pp. 102–103.
4. Michael Porter, “What Is Strategy?” Harvard Business Review,November–December 1996, p. 62.
5. Michael Porter, Competitive Advantage (New York: Free Press, 1985).
6. Aaron Lucchetti, “Ford’s New Expedition Heads into Suburban’s Terrain,”The Wall Street Journal, June 24, 1996, p. B1.
7. Adapted from C. Merle Crawford, New Product Management (Burr Ridge,IL: Richard D. Irwin, 1996), p. 348.
8. For a description of a perceptual mapping procedure that allows consumersto describe and rate the brands involved in their own terminology, see Jan-Benedict E. M. Steenkamp, Hans C. M. Van Tripp, and Jos M. F. Ten Berge,“Perceptual Mapping Based on Idiosyncratic Sets of Attributes,” Journal ofMarketing Research, February 1994, p. 15.
9. Jack Trout, The New Positioning (New York: McGraw-Hill, 1996), chap. 3.
10. Douglas Tigert and Stephen Arnold, “Nordstrom: How Good Are They?”Babson College Retailing Research Reports, September 1990.
11. Bruce Orwall, “Multiplying Hotel Brands Puzzle Travelers,” The WallStreet Journal, April 17, 1996, p. B1.
12. Existing brands’ attractiveness can be inferred from current sales volumesand market shares. The position occupied by the share leader is obviouslymore appealing to a greater number of customers than are the positions occu-pied by lesser brands.
13. See Paul E. Green, J. Douglas Carroll, and Stephen M. Goldberg, “A Gen-eral Approach to Product Design Optimization via Conjoint Analysis,” Jour-nal of Marketing Research, May 1985, pp. 168–84; and J. Douglas Carrolland Paul E. Green, “Psychometric Methods in Marketing Research: Part I,Conjoint Analysis,” Journal of Marketing Research, November 1995, p. 385.
14. When using preference data to define market segments, however, the ana-lyst also should collect information about customers’ demographic character-istics, lifestyle, product usage, and other potential segmentation variables.This enables the analyst to develop a more complete picture of the differencesamong benefit segments. Such information can be useful for developingadvertising appeals, selecting media, focusing personal selling efforts, anddesigning many of the other elements of a marketing program that can beeffective in appealing to a particular segment.
15. The sizes of the individual circles in Exhibit 8.7 are fictitious anddesigned for illustrative purposes only.
16. The map in Exhibit 8.7 shows five distinct preference segments but onlyone set of perceived product positions. The implication is that consumers inthis sample were similar in the way they perceived existing brands but differ-ent in the product attributes they preferred. This is the most common situa-tion; customers tend to vary more in the benefits they seek than in how theyperceive available products or brands. Sometimes, however, various segmentsmay perceive the positions of existing brands quite differently. They evenmay use different determinant attributes in assessing these positions. Under

Walker et al.: Marketing Strategy: A Decision−Focused Approach, Fourth Edition
II. Opportunity Analysis 8. Differentiation and Positioning
250 © The McGraw−Hill Companies, 2002
Chapter Eight Differentiation and Positioning 189
such circumstances, a marketer should construct a separate market-positioningmap for each segment.
17. Michael J. Lanning, Delivering Profitable Value (Cambridge, MA:Perseus Books, 1998).
18. For extensive critical reviews of past marketing applications of these dif-ferent approaches, see John R. Hauser and Frank S. Koppleman, “AlternativePerceptual Mapping Techniques: Relative Accuracy and Usefulness,” Journalof Marketing Research, November 1979, pp. 495–506; John W. Keon, “Prod-uct Positioning: TRINODAL Mapping of Brand Images, Ad Images, andConsumer Preference,” Journal of Marketing Research, November 1983,
pp. 380–92; Paul E. Green, J. Douglas Carroll, and Stephen M. Goldberg, “AGeneral Approach to Product Design Optimization via Conjoint Analysis,”Journal of Marketing Research, May 1985, pp. 168–84; Thomas W. Leigh,David M. McKay, and John O. Summers, “Reliability and Validity of Con-joint Analysis and Self-Explicated Weights,” Journal of Marketing Research,November 1984, pp. 456–63; Paul E. Green, “Hybrid Models for ConjointAnalysis: An Expository Review,” Journal of Marketing Research, May 1984,pp. 184–93; Steenkamp, Van Tripp, and Ten Berge, “Perceptual Mapping,”pp. 15–27; and Carroll and Green, “Psychometric Methods in MarketingResearch: Part I, Conjoint Analysis.”

Walker et al.: Marketing Strategy: A Decision−Focused Approach, Fourth Edition
III. Formulating Market Strategies
9. Marketing Strategies for New Market Entries
251© The McGraw−Hill Companies, 2002
190
Section Three
Formulating Marketing
Strategies
Chapter 9 Marketing Strategies for New Market Entries
Chapter 10 Strategies for GrowthMarkets
Chapter 11 Strategies for Matureand Declining Markets
Chapter 12 Marketing Strategies for the New Economy

Walker et al.: Marketing Strategy: A Decision−Focused Approach, Fourth Edition
III. Formulating Market Strategies
9. Marketing Strategies for New Market Entries
252 © The McGraw−Hill Companies, 2002
191

Walker et al.: Marketing Strategy: A Decision−Focused Approach, Fourth Edition
III. Formulating Market Strategies
9. Marketing Strategies for New Market Entries
253© The McGraw−Hill Companies, 2002
192
Chapter Nine
MARKETING STRATEGIES
FOR NEW MARKET ENTRIES
Illinois Tool Works—New Nuts & Bolts to Fill ManyNiches1
Unglamorous and low-profile, Illinois ToolWorks makes a diverse array of productsthat typically are attached to, embedded in,
or wrapped around somebody else’s goods. Itmanufactures nails, screws, bolts, strapping, wrap-ping, valves, capacitors, filters, and adhesives—aswell as the tools and machines to apply them.
Long known for superior engineering—and pre-mium prices—in recent years the Chicago con-glomerate has managed to develop and implementmore cost-efficient manufacturing methods, becomemore price-competitive, and aggressively expandits global presence. More important, the firm hasbeen extraordinarily innovative in a variety ofmundane product areas. It is the inventor andworld’s largest producer of plastic safety buckles, aleading supplier of fasteners to General Motors, theinventor of the plastic loops that hold six-packstogether, the maker of Zip-Pak resealable foodpackages, and the producer of painting equipmentfor Toyota’s auto plants. ITW holds nearly 3,000active U.S. patents, but the firm is so decentralizedand has been so prolific that nobody at corporateheadquarters can come up with an exact tally ofhow many products it makes.
How can a $10 billion company manage suchdiversity, reduce costs, and generate a constant
stream of new products all at the same time? Aswe shall see in Chapter 13, the firm’s organizationstructure and management policies have a lot todo with it. For one thing, the company is highlydecentralized. Lower-level managers are given agreat deal of authority to identify and pursue newproducts or new markets. This helps the firm main-tain close contact and relationships with its manycustomers. And when engineers and marketers inone division develop and commercialize a suc-cessful new product, the company often spins offthe product and the personnel as a new division.Consequently, the firm now has more than 500separate divisions or business units operating in40 different countries—each with its own market-ing, R&D, and manufacturing operations—most ofwhich are quite small and nimble, usually account-ing for less than $50 million in annual sales.
While the company’s divisions develop tons ofnew products every year, many are variations ofexisting products that are redesigned for newapplications in new market segments. For instance,in the mid-1980s, an ITW researcher invented adurable safety-rated plastic buckle for a customerwho makes life jackets. Now, the firm sells millionsof dollars of buckles designed for packs, bicyclehelmets, pet collars, and many other applications.

Walker et al.: Marketing Strategy: A Decision−Focused Approach, Fourth Edition
III. Formulating Market Strategies
9. Marketing Strategies for New Market Entries
254 © The McGraw−Hill Companies, 2002
193
ITW is often the pioneer in developing new product-markets, but it does not always end up as the mar-ket share leader as those product categories mature.Instead, it tends to focus on, and often dominates,smaller market niches where competition is lessintense and profit margins are higher. As one ITWmanager says, “We try to sell where our competitorsaren’t.”
Although the company is not the market share
leader in all of its many businesses, its revenuegrowth and profitability over the past decade havebeen among the best in the United States. The firmhas consistently been first or second among themost admired firms in the metal products industryon Fortune’s annual survey, and it achieved 14 per-cent growth in net income in 2000 despite a sag-ging U.S. economy.
Strategic Challenges Addressed
in Chapter 9
Illinois Tool Works’ success illustrates several important points about new product andmarket development. First, both sales growth and cost cutting can help improve profits.But while it is often easier to cut costs in the short term, revenue growth—particularlygrowth generated by the development of innovative new products—can have a biggerimpact on a firm’s profitability and shareholder value over the long haul. This point is con-firmed by a study of 847 large corporations conducted by Mercer Management Consult-ing. The authors found that the compound annual growth rate in the market value ofcompanies that achieved higher-than-average profit growth but lower revenue growth thantheir industry’s average—companies that increased profits mostly by cutting costs, in otherwords—was 11.6 percent from 1989 to 1992. By contrast, companies that achieved higher-than-average profits as the result of higher-than-average revenue growth saw their marketvalue jump at an annual rate double that—23.5 percent.2
Illinois Tool Works’ history also illustrates that new product introductions can involveproducts that differ in their degree of newness from the perspective of the company and itscustomers. Some of the products developed by the firm, such as the first plastic safety-rated buckle, were new innovations in the eyes of both the company and its customers. Butwhile many of the products ITW develops for new applications, such as buckles designedespecially for bicycle helmets or pet collars, are new to the customers in those targetniches, they are old hat to the company.
This chapter examines marketing strategies and programs appropriate for developingmarkets for offerings that are new to the target customers. Our primary focus is on
programs used by the pioneer firm, or first entrant—into a particularproduct-market. Being the pioneer gains a firm a number of potentialcompetitive advantages, but it also involves some major risks. Some pio-neers capitalize on their early advantage and maintain a leading marketshare of the product category, earning substantial revenues and profits,
well into the later stages of the product’s life cycle.Other pioneers are less successful. While ITW has pioneered many new product cate-
gories, for instance, it has not always ended up as the share leader in those categories as they grew and matured. In some cases this was a consequence of ITW’s strategy of avoiding
Strategic Issue
Being the pioneer gains a firm a number ofpotential competitive advantages, but italso involves some major risks.

Walker et al.: Marketing Strategy: A Decision−Focused Approach, Fourth Edition
III. Formulating Market Strategies
9. Marketing Strategies for New Market Entries
255© The McGraw−Hill Companies, 2002
Section Three Formulating Marketing Strategies194
competition by focusing on specialized niche markets. But in other cases, followers have over-taken the pioneer by offering better products, superior customer service, or lower prices. Thisleads to an interesting strategic question: Is it usually better for a firm to bear the high costsand risks of being the pioneer in hopes of maintaining a profitable position as the marketgrows or to be a follower that watches for possible design or marketing mistakes by the pio-neer before joining the fray with its own entry? We examine this question in the next section.
Not all pioneers are intent on remaining the overall share leader as the market grows.Some, like ITW, adopt a niche market strategy geared to making substantial profits fromspecialized market segments where they will face fewer large competitors. Others try tostay one jump ahead of the competition by introducing a constant stream of new productsand withdrawing from older markets as they become more competitive. Which strategy isbest? It depends on the firm’s resources and competencies, the strength of likely futurecompetitors, and characteristics of the product and its target market. Therefore, we willexamine some alternative strategies that might be adopted by a pioneer and the situationswhere each makes most sense.
How New Is New?
A survey of the new product development practices of 700 U.S. corporations conducted bythe consulting firm of Booz, Allen & Hamilton found that the products introduced by thosefirms over a five-year period were not all equally “new.” The study identified six categoriesof new products based on their degree of newness as perceived by both the company andthe target customers. These categories are discussed below and diagrammed in Exhibit 9.1,which also indicates the percentage of new entries falling in each category during the five-year study period. Notice that only 10 percent of all new product introductions fell into thenew-to-the-world category.3
• New-to-the-world products—True innovations that are new to the firm and create an entirelynew market (10 percent).
• New product lines—A product category that is new for the company introducing it, but notnew to customers in the target market because of the existence of one or more competitivebrands (20 percent).
• Additions to existing product lines—New items that supplement a firm’s established productline. These items may be moderately new to both the firm and the customers in its establishedproduct-markets. They also may serve to expand the market segments appealed to by the line(26 percent).
• Improvements in or revisions of existing products—Items providing improved performanceor greater perceived value brought out to replace existing products. These items may presentmoderately new marketing and production challenges to the firm, but unless they represent atechnologically new generation of products, customers are likely to perceive them as similarto the products they replace (26 percent).
• Repositionings—Existing products that are targeted at new applications and new market seg-ments (7 percent).
• Cost reductions—Product modifications providing similar performance at lower cost (11percent).
A product’s degree of newness—to the company, its target customers, or both—helpsdetermine the amount of complexity and uncertainty involved in the engineering, opera-tions, and marketing tasks necessary to make it a successful new entry. It also contributesto the amount of risk inherent in those tasks.

Walker et al.: Marketing Strategy: A Decision−Focused Approach, Fourth Edition
III. Formulating Market Strategies
9. Marketing Strategies for New Market Entries
256 © The McGraw−Hill Companies, 2002
Chapter Nine Marketing Strategies for New Market Entries 195
Introducing a product that is new to both the firm and target customers requires thegreatest expenditure of effort and resources. It also involves the greatest amount of uncer-tainty and risk of failure because of the lack of information and experience with the tech-nology and the target customers.
Products new to target customers but not new to the firm (such as line extensions ormodifications aimed at new customer segments or repositionings of existing products) areoften not very innovative in design or operations, but they may present a great deal of mar-keting uncertainty. The marketing challenge here—as with new-to-the-world products—isto build primary demand, making target customers aware of the product and convincingthem to adopt it. We investigate this marketing problem in this chapter.
Finally, products new to the company but not to the market (such as new product lines,line extensions, product modifications, and cost reductions) often present fewer challengesfor R&D and product engineering. The company can study and learn from earlier designsor competitors’ products. However, these products can present major challenges forprocess engineering, production scheduling, quality control, and inventory management.Once the company introduces such a product into the market, its primary marketing objec-tive is to build selective demand and capture market share, convincing customers the newoffering is better than existing competitive products. We discuss marketing programs afirm might use to accomplish these objectives later in Chapter 10.
Exhibit 9.1Categories of New Products Defined According to Their Degree of Newness to the Company and Customers
in the Target Market
Source: New Products Management for the 1980s (New York: Booz, Allen & Hamilton, 1982). Reprintedby permission.
Costreductions
New productlines
Repositionings
20% 10%
26% 26%
11%
New-to-the-world products
Additions toexisting product
lines
Revisions/improvements toexisting products
Newness to the market
LowLow
High
High
New
nes
s to
th
e co
mp
any
7%

Walker et al.: Marketing Strategy: A Decision−Focused Approach, Fourth Edition
III. Formulating Market Strategies
9. Marketing Strategies for New Market Entries
257© The McGraw−Hill Companies, 2002
Section Three Formulating Marketing Strategies196
Objectives of New Product
and Market Development
The primary objective of most new product and market development efforts is to securefuture volume and profit growth. This objective has become even more crucial in recentyears due to rapidly advancing technology and more intense global competition. A steadyflow of new products and the development of new markets, including those in foreigncountries, are essential for the continued growth of most firms.
The ITW case illustrates, however, that individual development projects also mayaccomplish a variety of other strategic objectives. When asked what strategic role wasserved by their most successful recent new entry, the respondents in the Booz, Allen &Hamilton survey mentioned eight different strategic objectives. Exhibit 9.2 lists theseobjectives and the percentage of respondents that mentioned each one. The exhibit alsoindicates which objectives focused on external concerns (e.g., defending market share) andwhich were driven by a desire to improve or build upon the firm’s internal strengths. Mostrespondents indicated their new entry helped accomplish more than one objective.
Exhibit 9.3 shows that different types of new entries are appropriate for achieving dif-ferent strategic objectives. For example, if the objective is to establish a foothold in or pre-empt a new market segment, the firm must introduce a product that is new to that market,
Exhibit 9.2Strategic Objectives Attained by Successful New Market Entries
Source: New Products Management for the 1980s (New York: Booz, Allen & Hamilton, 1982), p. 11.Reprinted by permission.
Strategic role
Defend marketshare position
Establish footholdin new market
Preempt marketsegment
Maintain position asproduct innovator
Exploit technologyin new way
Capitalize ondistribution strengths
Provide a cashgenerator
0 10% 20% 30% 40% 50%
Externallydriven
Internallydriven
Use excess oroff-season capacity

Walker et al.: Marketing Strategy: A Decision−Focused Approach, Fourth Edition
III. Formulating Market Strategies
9. Marketing Strategies for New Market Entries
258 © The McGraw−Hill Companies, 2002
Chapter Nine Marketing Strategies for New Market Entries 197
although it may not be entirely new to the company. On the other hand, if the objective isto improve cash flow by adding another cash generator, simple line extensions or productmodifications—particularly those that reduce unit costs—may do the trick.
A business’s objectives for its new entries influence the kind of entry strategy it shouldpursue and the marketing and other functional programs needed to implement that strat-egy. For instance, if a business is pursuing a prospector strategy and its objectives are tomaintain a position as a product innovator and to establish footholds in a variety of newproduct-markets, it should attempt to be the pioneer in as many of those markets as possi-ble. As we saw in Chapter 3, successful implementation of such a strategy requires thebusiness to be competent in and devote substantial resources to R&D, product engineer-ing, marketing, and marketing research.
On the other hand, if the business is concerned primarily with defending an alreadystrong market share position in its industry, it may prefer to be a follower. Usually enter-ing new product-markets only after an innovator, a follower relies on superior quality, bet-ter customer service, or lower prices to offset the pioneer’s early lead. This strategy usuallyrequires fewer investments in R&D and product development, but marketing and sales stillare critical in implementing it effectively. A more detailed comparison of these alternativenew market entry strategies is the focus of the next section of this chapter.
Market Entry Strategies:
Is It Better to Be a Pioneer
or a Follower?
With products such as Word, Excel, and Powerpoint, Microsoft holds a leading share ofmost office application software categories. But in most of those categories, the firm wasnot the pioneer. Lotus 1-2-3 was the leading spreadsheet for many years, and WordPerfectand other programs led the word processing category. But as a follower, Microsoft devel-oped improved product designs offering better performance, and it had superior financial
Exhibit 9.3Types of New Market Entries Appropriate for Different Strategic Objectives
Objective New entry
Maintain position as a product innovator New-to-the-world products; improvements or revisions to existing products
Defend a current market-share position Improvements or revisions to existing products; additions to existing product line; cost reductions
Establish a foothold in a future new market; New-to-the-world products; additions to existing product line;preempt a market segment repositionings
Exploit technology in a new way New-to-the-world products; new product line; additions to or revision of existing product line
Capitalize on distribution strengths New-to-the-world products; new product line; additions to or revisions of existing product line
Provide a cash generator Additions to or revisions of existing product line; repositionings; cost reductions
Use excess or off-season capacity New-to-the-world product; new product line

Walker et al.: Marketing Strategy: A Decision−Focused Approach, Fourth Edition
III. Formulating Market Strategies
9. Marketing Strategies for New Market Entries
259© The McGraw−Hill Companies, 2002
Section Three Formulating Marketing Strategies198
resources to aggressively promote its products. Microsoft’s Windows also held a com-manding share of the operating systems market, a position the firm could leverage to con-vince personal computer manufacturers to bundle its applications software with theirmachines.
On the other hand, some of the software industry’s pioneers have not fared so well inthe marketplace. Lotus, for example, experienced financial difficulties and was ultimatelyacquired by IBM. While we have stressed the competitive importance of growth via theintroduction of new products, the important strategic question is whether it always makessense to go first. Or do both pioneer and follower market entry strategies have some par-ticular advantages under different conditions?
Pioneer StrategyConventional wisdom holds that although they take the greatest risks and probably expe-rience more failures than their more conservative competitors, successful pioneers arehandsomely rewarded. It is assumed competitive advantages inherent in being the first toenter a new product-market can be sustained through the growth stage and into the matu-rity stage of the product life cycle, resulting in a strong share position and substantialreturns.
Some of the potential sources of competitive advantage available to pioneers are brieflysummarized in Exhibit 9.4 and discussed below.4
1. First choice of market segments and positions. The pioneer has the opportunity to developa product offering with attributes most important to the largest segment of customers or topromote the importance of attributes that favor its brand. Thus, the pioneer’s brand canbecome the standard of reference customers use to evaluate other brands. This can make itmore difficult for followers with me-too products to convince existing customers that theirnew brands are superior to the older and more familiar pioneer. If the pioneer has success-fully tied its offering to the choice criteria of the largest group of customers, it also becomesmore difficult for followers to differentiate their offerings in ways that are attractive to themass-market segment. They may have to target a smaller peripheral segment or nicheinstead.
2. The pioneer defines the rules of the game. The pioneer’s actions on such variables as prod-uct quality, price, distribution, warranties, postsale service, and promotional appeals andbudgets set standards that subsequent competitors must meet or beat. If the pioneer setsthose standards high enough, it can raise the costs of entry and perhaps preempt some poten-tial competitors.5
Exhibit 9.4Potential Advantages of Pioneer and Follower Strategies
Pioneer Follower
• Economies of scale and experience • Ability to take advantage of pioneer’s positioning mistakes
• High switching costs for early adopters • Ability to take advantage of pioneer’s product mistakes
• Pioneer defines the rules of the game • Ability to take advantage of pioneer’s marketing mistakes
• Possibility of positive network effects • Ability to take advantage of pioneer’s limited resources
• Distribution advantage
• Influence on consumer choice criteria and attitudes
• Possibility of preempting scarce resources
Walker et al.: Marketing Strategy: A Decision−Focused Approach, Fourth Edition
III. Formulating Market Strategies
9. Marketing Strategies for New Market Entries
260 © The McGraw−Hill Companies, 2002
Chapter Nine Marketing Strategies for New Market Entries 199
3. Distribution advantages. The pioneer has the most options in designing a distribution chan-nel to bring the new product to market. This is particularly important for industrial goodswhere, if the pioneer exercises its options well and with dispatch, it should end up with anetwork of the best distributors. This can exclude later entrants from some markets. Dis-tributors are often reluctant to take on second or third brands. This is especially true whenthe product is technically complex and the distributor must carry large inventories of theproduct and spare parts and invest in specialized training and service.
For consumer package goods, it is more difficult to slow the entry of later competitorsby preempting distribution alternatives. Nevertheless, the pioneer still has the advantage ofattaining more shelf-facings at the outset of the growth stage. By quickly expanding itsproduct line following an initial success, the pioneer can appropriate still more shelf space,thereby making the challenge faced by followers even more difficult. And as many retailersare reducing the number of brands they carry in a given product category to speed inventoryturnover and reduce costs, it is becoming more difficult for followers with unfamiliar brandsand small market shares to gain extensive distribution.
4. Economies of scale and experience. Being first means the pioneer can gain accumulatedvolume and experience and thereby lower per unit costs at a faster rate than followers. Thisadvantage is particularly pronounced when the product is technically sophisticated andinvolves high development costs or when its life cycle is likely to be short with sales increas-ing rapidly during the introduction and early growth stages.
As we shall see later, the pioneer can deploy these cost advantages in a number of waysto protect its early lead against followers. One strategy is to lower price, which can dis-courage followers from entering the market because it raises the volume necessary for themto break even. Or the pioneer might invest its savings in additional marketing efforts toexpand its penetration of the market, such as heavier advertising, a larger salesforce, or con-tinuing product improvements or line extensions.
5. High switching costs for early adopters. Customers who are early to adopt a pioneer’s newproduct may be reluctant to change suppliers when competitive products appear. This is partic-ularly true for industrial goods where the costs of switching suppliers can be high. Compatibleequipment and spare parts, investments in employee training, and the risks of lower productquality or customer service make it easier for the pioneer to retain its early customers over time.
In some cases, however, switching costs can work against the pioneer and in favor offollowers. A pioneer may have trouble converting customers to a new technology if theymust bear high switching costs to abandon their old way of doing things. Pioneers in thedevelopment of music CDs, for instance, faced the formidable task of convincing potentialbuyers to abandon their substantial investments in turntables and LP record libraries and tostart all over again with the new technology. Once the pioneers had begun to convince con-sumers that the superior convenience, sound quality, and durability of CDs justified thosehigh switching costs, however, demand for CDs and CD players began to grow rapidly andit was easier for followers to attract customers.
6. Possibility of positive network effects. The value of some kinds of goods and services to anindividual customer increases as greater numbers of other people adopt the product and thenetwork of users grows larger. Economists say that such products exhibit network external-ities or positive network effects. Information and communications technologies, such as
wireless phones, fax machines, computer software, e-mail, and many Internetsites, are particularly likely to benefit from network effects.6 For instance, thevalue of eBay as an auction site increases as the number of potential buyers andsellers who visit and trade on the site increase. If the pioneer in such a product orservice category can gain and maintain a substantial customer base before com-peting technologies or providers appear on the market, the positive network
effects generated by that customer base will enhance the benefits of the pioneer’s offering andmake it more difficult for followers to match its perceived value.
7. Possibility of preempting scarce resources and suppliers. The pioneer may be able to nego-tiate favorable deals with suppliers who are eager for new business or who do not appreciate
www
Strategic Issue
The value of some kinds of goods and services to an individual customer increasesas greater numbers of other people adoptthe product.

Walker et al.: Marketing Strategy: A Decision−Focused Approach, Fourth Edition
III. Formulating Market Strategies
9. Marketing Strategies for New Market Entries
261© The McGraw−Hill Companies, 2002
Section Three Formulating Marketing Strategies200
the size of the opportunity for their raw materials or component parts. If later entrants sub-sequently find those materials and components in short supply, they may be constrained fromexpanding as fast as they might like or be forced to pay premium prices.
Not All Pioneers Capitalize on Their Potential AdvantagesThere is some evidence to suggest that the above advantages can help pioneers gain andmaintain a competitive edge in new markets. For instance, some research has found thatsurviving pioneers hold a significantly larger average market share when their industriesreach maturity than firms that were either fast followers or late entrants in the productcategory.7
On the other hand, some pioneers fail. They either abandon the product category, go outof business, or get acquired before their industry matures. One study, which took thesefailed pioneers into account and averaged their performance together with that of the moresuccessful survivors, found that pioneers overall did not perform as well over the long haulas followers.8
Of course, volume and market share are not the only dimensions on which success canbe measured. Unfortunately, there is little evidence concerning the effect of the timing ofa firm’s entry into a new market on its ultimate profitability in that market or the value gen-erated for shareholders.9
In view of the mixed research evidence, then, it seems reasonable to conclude that whilea pioneer may have some potential competitive advantages, not all pioneers are successfulat capitalizing on them. Some fail during the introductory or shakeout stages of their indus-tries’ life cycles. And those that survive may lack the resources to keep up with rapidgrowth or the competencies needed to maintain their early lead in the face of onslaughtsby strong followers.10
Follower StrategyIn many cases a firm becomes a follower by default. It is simply beaten to a new product-market by a quicker competitor. But even when a company has the capability of being thefirst mover, the above observations suggest there may be some advantages to letting otherfirms go first into a product-market. Let the pioneer shoulder the initial risks while the fol-lowers observe their shortcomings and mistakes. Possible advantages of such a followerstrategy are briefly summarized in Exhibit 9.4 and discussed below.
1. Ability to take advantage of the pioneer’s positioning mistakes. If the pioneer misjudges thepreferences and purchase criteria of the mass-market segment or attempts to satisfy two ormore segments at once, it is vulnerable to the introduction of more precisely positionedproducts by a follower. By tailoring its offerings to each distinct segment, the follower(s)can successfully encircle the pioneer.
2. Ability to take advantage of the pioneer’s product mistakes. If the pioneer’s initial producthas technical limitations or design flaws, the follower can benefit by overcoming theseweaknesses. Even when the pioneering product is technically satisfactory, a follower maygain an advantage through product enhancements. For example, Compaq captured a sub-stantial share of the commercial PC market by developing faster and more portable versionsof IBM’s original machine.
3. Ability to take advantage of the pioneer’s marketing mistakes. If the pioneer makes anymarketing mistakes in introducing a new entry, it opens opportunities for later entrants. Thisobservation is closely related to the first two points, yet goes beyond product positioning
Walker et al.: Marketing Strategy: A Decision−Focused Approach, Fourth Edition
III. Formulating Market Strategies
9. Marketing Strategies for New Market Entries
262 © The McGraw−Hill Companies, 2002
Chapter Nine Marketing Strategies for New Market Entries 201
and design to the actual execution of the pioneer’s marketing program. For example, the pio-neer may fail to attain adequate distribution, spend too little on introductory advertising, oruse ineffective promotional appeals to communicate the product’s benefits. A follower canobserve these mistakes, design a marketing program to overcome them, and successfullycompete head-to-head with the pioneer.
Marketing mistakes can leave a pioneer vulnerable to challenges from later entrantseven in product categories with substantial positive network effects. For example,Microsoft’s Windows operating system was not the first user-friendly system on the market.However, Microsoft promoted and priced Windows very aggressively, it formed allianceswith original equipment manufacturers (OEMs) in the personal computer industry toencourage them to install Windows on their machines, and it engaged in extensive licensingand cooperative agreements with other software developers. All these actions helped Win-dows capture a commanding share of the operating systems market, which in turn generatedtremendous positive network effects for Windows and made it difficult for alternative sys-tems to compete (perhaps too difficult, from the U.S. Justice Department’s perspective).
4. Ability to take advantage of the latest technology. In industries characterized by rapid tech-nological advances, followers can possibly introduce products based on a superior, second-generation technology and thereby gain an advantage over the pioneer. And the pioneer mayhave difficulty reacting quickly to such advances if it is heavily committed to an earliertechnology. Consumer popularity of the newer VHS format, for instance, gave followers inthe videocassette recorder market an advantage over pioneer Sony, which was locked in tothe less-popular Beta format.
5. Ability to take advantage of pioneer’s limited resources. If the pioneer has limited resourcesfor production facilities or marketing programs, or fails to commit sufficient resources to itsnew entry, followers willing and able to outspend the pioneer experience few enduringconstraints.
Determinants of Success for Pioneers and FollowersOur discussion suggests that a pioneering firm stands the best chance for long-term suc-cess in market-share leadership and profitability when (1) the new product-market is insu-lated from the entry of competitors, at least for a while, by strong patent protection,proprietary technology (such as a unique production process), substantial investmentrequirements, or positive network effects, or (2) the firm has sufficient size, resources, andcompetencies to take full advantage of its pioneering position and preserve it in the face oflater competitive entries. Evidence suggests that organizational competencies, such asR&D and marketing skills, not only affect a firm’s success as a pioneer, but also may influ-ence the company’s decision about whether or not to be a pioneer in the first place. Firmsthat perceive they lack the competencies necessary to sustain a first-mover advantage maybe more likely to wait for another company to take the lead and to enter the market later.11
McDonald’s is an example of a pioneer that has succeeded by aggressively building onthe foundations of its early advantage. Although the firm started small as a single ham-burger restaurant, it used the franchise system of distribution to rapidly expand the num-ber of McDonald’s outlets with a minimum cash investment. That expansion plus stringentquality and cost controls, relatively low prices made possible by experience-curve effects,heavy advertising expenditures, and product line expansion aimed at specific market seg-ments (such as Egg McMuffin for the breakfast crowd) have all enabled the firm to main-tain a commanding share of the fast-food hamburger industry.
On the other hand, a follower will most likely succeed when there are few legal, tech-nological, or financial barriers to inhibit entry and when it has sufficient resources or com-petencies to overwhelm the pioneer’s early advantage. For example, given Procter &

Walker et al.: Marketing Strategy: A Decision−Focused Approach, Fourth Edition
III. Formulating Market Strategies
9. Marketing Strategies for New Market Entries
263© The McGraw−Hill Companies, 2002
Section Three Formulating Marketing Strategies202
Gamble’s well-established brand name and superior advertising and promotional resources,the company was able to quickly take the market share lead away from pioneer Minnetonka,Inc., in the plaque-fighting toothpaste market with a reformulated version of Crest.
A study conducted across a broad range of industries in the PIMS database supportsthese observations.12 The author’s findings are briefly summarized in Exhibit 9.5 and dis-cussed below. The author found that, regardless of the industry involved, pioneers able tomaintain their preeminent position well into the market’s growth stage had supported theirearly entry with the following marketing strategy elements:
• Large entry scale—Successful pioneers had sufficient capacity, or could expand quicklyenough, to pursue a mass-market targeting strategy, usually on a national rather than a localor regional basis. Thus, they could expand their volume quickly and achieve the benefits ofexperience-curve effects before major competitors could confront them.
• Broad product line—Successful pioneers also quickly add line extensions or modifications totheir initial product to tailor their offerings to specific market segments. This helps reducetheir vulnerability to later entrants who might differentiate themselves by targeting one ormore peripheral markets.
• High product quality—Successful pioneers also offer a high-quality, well-designed productfrom the beginning, thus removing one potential differential advantage for later followers.Competent engineering, thorough product and market testing before commercialization, andgood quality control during the production process are all important to the continued successof pioneers.
• Heavy promotional expenditures—Successful pioneers had marketing programs character-ized by relatively high advertising and promotional expenditures as a percentage of sales. Ini-tially the promotion helps to stimulate awareness and primary demand for the new productcategory, build volume, and reduce unit costs. Later, this promotion focuses on buildingselective demand for the pioneer’s brand and reinforcing loyalty as new competitors enter.
The same study found that the most successful fast followers had the resources to enterthe new market on a larger scale than the pioneer. Consequently, they could quickly reducetheir unit costs, offer lower prices than incumbent competitors, and enjoy any positive net-work effects. Some fast followers achieved success, however, by leapfrogging earlierentrants. These followers won customers away from the pioneer by offering a product withmore sophisticated technology, better quality, or superior service.
Exhibit 9.5Marketing Strategy Elements Pursued by Successful Pioneers, Fast Followers, and Late Entrants
These marketers . . . are characterized by one or more of these strategy elements:
Successful pioneers • Large entry scale
• Broad product line
• High product quality
• Heavy promotional expenditures
Successful fast followers • Larger entry scale than the pioneer
• Leapfrogging the pioneer with superior:
product technology
product quality
customer service
Successful late entrants • Focus on peripheral target markets or niches
Source: 2001 Simmons Market Research Bureau. Reprinted by permission. www.smrb.com.
Walker et al.: Marketing Strategy: A Decision−Focused Approach, Fourth Edition
III. Formulating Market Strategies
9. Marketing Strategies for New Market Entries
264 © The McGraw−Hill Companies, 2002
Chapter Nine Marketing Strategies for New Market Entries 203
Finally, the author found that some late entrants also achieved substantial profits byavoiding direct confrontations with more established competitors and by pursuing periph-eral target markets. They often offer tailor-made products to smaller market niches andsupport them with high levels of service.
Followers typically enter a market after it is in the growth phase of its life cycle, andthey start with low market shares relative to the established pioneer. Consequently, our dis-cussion in the next chapter of marketing strategies for low-share competitors in growthmarkets is germane to both fast followers and later entrants. Before focusing on strategiesfor followers, however, we should first examine strategies that might be successfullyemployed by the first entrant in a new product-market.
Strategic Marketing Programs
for Pioneers
The preceding discussion suggests that the ultimate success of a pioneering strategydepends on the nature of the demand and competitive situation the pioneer encounters in
the market and on the pioneer’s ability to design and support an effec-tive marketing program. It also depends on how the pioneer defines suc-cess—in other words, the objectives it seeks to achieve. Thus, a pioneermight choose from one of three different types of marketing strategies:mass-market penetration, niche penetration, or skimming and earlywithdrawal. Exhibit 9.6 summarizes the primary objectives of each strat-egy and the circumstances favoring their use. While specific conditions
may favor a given strategy, they do not guarantee its success. Much still depends on howeffectively a firm implements the strategy. Also, it is highly unlikely that all the listed con-ditions will exist simultaneously in any single product-market.
Mass-Market PenetrationThe ultimate objective of a mass-market penetration strategy is to capture and maintain acommanding share of the total market for the new product. Thus, the critical marketingtask is to convince as many potential customers as possible to adopt the pioneer’s productquickly to drive down unit costs and build a large contingent of loyal customers beforecompetitors enter the market.
Mass-market penetration tends to be most successful when entry barriers inhibit ordelay the appearance of competitors, thus allowing the pioneer more time to build volume,lower costs, and create loyal customers, or when the pioneer has competencies or resourcesthat most potential competitors cannot match. Relevant competencies include productengineering, promotional and channel management skills, and the financial and organiza-tional resources necessary to expand capacity in advance of demand. In some cases,though, a smaller firm with limited resources can successfully employ a mass-market penetration strategy if the market has a protracted adoption process and slow initialgrowth. Slow growth can delay competitive entry because fewer competitors are attractedto a market with questionable future growth. This allows the pioneer more time to expandcapacity.
Mass-market penetration is also an appropriate strategy when the product category islikely to experience positive network effects. Since the value of such products increases asthe number of users grows, it makes sense for the pioneer to quickly capture and maintainas large a customer base as possible.
Strategic Issue
Success of a pioneering strategy depends onthe nature of the demand and competitivesituation the pioneer encounters in the market and on the pioneer’s ability todesign and support an effective marketingprogram.
www

Walker et al.: Marketing Strategy: A Decision−Focused Approach, Fourth Edition
III. Formulating Market Strategies
9. Marketing Strategies for New Market Entries
265© The McGraw−Hill Companies, 2002
Exhibit 9.6Marketing Objectives and Strategies for New Product Pioneers
Alternative Marketing Strategies
Situational variables Mass-market penetration Niche penetration Skimming: early withdrawal
Primary objective
Market characteristics
Product characteristics
Competitor characteristics
Firm characteristics
• Maximize number of triersand adopters in total market.
• Maintain leading shareposition in total market.
• Large potential demand.
• Relatively homogeneouscustomer needs.
• Customers likely to adoptproduct relatively quickly;short diffusion process.
• Product technologypatentable or difficult to copy.
• Substantial network effects;value increases with growthof installed customer base.
• Components or materialsdifficult to obtain; limitedsources of supply.
• Complex production process;substantial developmentand/or investment required.
• Few potential competitors.
• Most potential competitorshave limited resources andcompetencies; few sources ofdifferential advantage.
• Strong product engineeringskills; able to quickly developproduct modifications andline extensions for multiplemarket segments.
• Strong marketing skills andresources; ability to identifyand develop marketingprograms for multiplesegments; ability to shiftfrom stimulation of primarydemand to stimulation ofselective demand ascompetitors enter.
• Sufficient financial andorganizational resources tobuild capacity in advance ofgrowth in demand.
• Maximize number of triersand adopters in targetsegment.
• Maintain leading shareposition in target segment.
• Large potential demand.
• Fragmented market; manydifferent applications andbenefit segments.
• Customers likely to adoptproduct relatively quickly;short adoption process.
• Product technology offerslittle patent protection; easilycopied or adapted.
• Limited or no networkeffects.
• Components or materialseasy to obtain; many sourcesof supply.
• Relatively simple productionprocess; little development oradditional investment required.
• Many potential competitors.
• Some potential competitorshave substantial resourcesand competencies; possiblesources of differentialadvantage.
• Limited product engineeringskills and resources.
• Limited marketing skills andresources.
• Insufficient financial ororganizational resources tobuild capacity in advance ofgrowing demand.
• Recoup development andcommercialization costs assoon as possible.
• Withdraw from market whenincreasing competition putspressure on margins.
• Limited potential demand.
• Customers likely to adoptproduct relatively slowly;long adoption process.
• Early adopters willing to payhigh price; demand is priceinelastic.
• Product technology offerslittle patent protection; easilycopied or adapted.
• Limited or no networkeffects.
• Components or materialseasy to obtain; many sourcesof supply.
• Relatively simple productionprocess; little development oradditional investment required.
• Many potential competitors.
• Some potential competitorshave substantial resourcesand competencies; possiblesources of differentialadvantage.
• Strong basic R&D and newproduct development skills; aprospector with goodcapability for continued newproduct innovation.
• Good sales and promotionalskills; able to quickly buildprimary demand in targetmarket; perhaps has limitedmarketing resources for long-term market maintenance.
• Limited financial ororganizational resources tocommit to building capacity inadvance of growth in demand.
204
Source: 2001 Simmons Market Research Bureau. Reprinted by permission. www.smrb.com.

Walker et al.: Marketing Strategy: A Decision−Focused Approach, Fourth Edition
III. Formulating Market Strategies
9. Marketing Strategies for New Market Entries
266 © The McGraw−Hill Companies, 2002
Chapter Nine Marketing Strategies for New Market Entries 205
Niche PenetrationEven when a new product-market expands quickly, however, it still may be possible for asmall firm with limited resources to be a successful pioneer. In such cases, though, the firmmust define success in a more limited way. Instead of pursuing the objective of capturingand sustaining a leading share of the entire market, it may make more sense for such firmsto focus their efforts on a single market segment. This kind of niche penetration strategycan help the smaller pioneer gain the biggest bang for its limited bucks and avoid directconfrontations with bigger competitors.
A niche penetration strategy is most appropriate when the new market is expected togrow quickly and there are a number of different benefit or applications segments to appealto. It is particularly attractive when there are few barriers to the entry of major competitorsand when the pioneer has only limited resources and competencies to defend any advan-tage it gains through early entry. For example, the fact that the applications for many ofIllinois Tool Works’ products are highly specialized, its markets are fragmented, and itprefers to avoid direct confrontations with large competitors all help explain why the firmfavors a niche penetration strategy.
Some pioneers may intend to pursue a mass-market penetration strategy when intro-ducing a new product or service, but they end up implementing a niche penetration strat-egy instead. This is particularly likely when the new market grows faster or is morefragmented than the pioneer expects. Facing such a situation, a pioneer with limitedresources may decide to concentrate on holding its leading position in one or a few seg-ments, rather than spreading itself too thin developing unique line extensions and market-ing programs for many different markets or going deep into debt to finance rapidexpansion.
Skimming and Early WithdrawalEven when a firm has the resources to sustain a leading position in a new product-market,it may choose not to. Competition is usually inevitable, and prices and margins tend todrop dramatically after followers enter the market. Therefore, some pioneers opt to pursuea skimming strategy while planning an early withdrawal from the market. This involvessetting a high price and engaging in only limited advertising and promotion to maximizeper-unit profits and recover the product’s development costs as quickly as possible. At thesame time, the firm may work to develop new applications for its technology or the nextgeneration of more advanced technology. Then when competitors enter the market andmargins fall, the firm is ready to cannibalize its own product with one based on new tech-nology or to move into new segments of the market.
The 3M Company is a master of the skimming strategy. According to one 3M manager,“We hit fast, price high (full economic value of the product to the user), and get the heckout when the me-too products pour in.” The new markets pioneered by the company areoften smaller ones of $10 million to $50 million, and the firm may dominate them for onlyabout five years or so. By then, it is ready to launch the next generation of new technologyor to move the old technology into new applications.13 An example of 3M’s approach isdescribed in Exhibit 9.7.
As Exhibit 9.6 indicates, either small or large firms can use strategies of skimming andearly withdrawal. But it is critical that the company have good R&D and product develop-ment skills so it can produce a constant stream of new products or new applications toreplace older ones as they attract heavy competition. Also, since a firm pursuing this kindof strategy plans to remain in a market only short term, it is most appropriate when there

Walker et al.: Marketing Strategy: A Decision−Focused Approach, Fourth Edition
III. Formulating Market Strategies
9. Marketing Strategies for New Market Entries
267© The McGraw−Hill Companies, 2002
Section Three Formulating Marketing Strategies206
are few barriers to entry, the product is expected to diffuse rapidly, and the pioneer lacks thecapacity or other resources necessary to defend a leading share position over the long haul.
Marketing Program Components for a Mass-Market Penetration StrategyAs mentioned, the crucial marketing task in a mass-market penetration strategy is to max-imize the number of customers adopting the firm’s new product as quickly as possible.
This requires a marketing program focused on (1) aggressively buildingproduct awareness and motivation to buy among a broad cross-sectionof potential customers and (2) making it as easy as possible for thosecustomers to try the new product, on the assumption that they will try it,like it, develop loyalty, and make repeat purchases.
Exhibit 9.8 outlines a number of marketing activities that might help increase cus-tomers’ awareness and willingness to buy or improve their ability to try the product. Thisis by no means an exhaustive list; nor do we mean to imply that a successful pioneer mustnecessarily engage in all of the listed activities. Marketing managers must develop pro-grams combining activities that fit both the objectives of a mass-market penetration strat-egy and the specific market and potential competitive conditions the new product faces.
Increasing Customers’ Awareness and Willingness to Buy Obviously, heavyexpenditures on advertising, introductory promotions such as sampling and couponing,and personal selling efforts all can increase awareness of a new product or service amongpotential customers. This is the critical first step in the adoption process for a new entry.The relative importance of these promotional tools varies, however, depending on thenature of the product and the number of potential customers. For instance, personal sell-ing efforts are often the most critical component of the promotional mix for highly tech-nical industrial products with a limited potential customer base. Media advertising andsales promotion are usually more useful for building awareness and primary demand for anew consumer good among customers in the mass market. In either case, when designinga mass-market penetration marketing program, firms should broadly focus promotionalefforts to expose and attract as many potential customers as possible before competitorsshow up.
Firms might also attempt to increase customers’ willingness to buy their products byreducing the risk associated with buying something new. This can be done by letting cus-tomers try the product without obligation, as when car dealers allow potential customersto test-drive a new model, or when software developers allow customers to download atrial version and use it free for 30 days. Liberal return policies and extended warranties canserve the same purpose.
The first water-activated synthetic casting tape to setbroken bones was developed by 3M in 1980, but by
1982 eight other companies had brought out copycatproducts. The company’s R&D people retreated to theirlabs and developed and tested 140 new versions in avariety of fabrics. In 1983, the firm dropped the old
product and introduced a technically superior versionthat was stronger and easier to use and commandeda premium price.
Source: Christopher Knowlton, “What America Makes Best,” Fortune,March 28, 1988, p. 45. © 1988 Time Inc. All rights reserved.
Exhibit 9.7 3M’s Skimming Strategy in the Casting Tape Market
Strategic Issue
The crucial marketing task in a mass-marketpenetration strategy is to maximize the number of customers adopting the firm’s new product as quickly as possible.

Walker et al.: Marketing Strategy: A Decision−Focused Approach, Fourth Edition
III. Formulating Market Strategies
9. Marketing Strategies for New Market Entries
268 © The McGraw−Hill Companies, 2002
207
Exhibit 9.8Components of Strategic Marketing Programs for Pioneers
Alternative Strategic Marketing Programs
Strategic objectives and tasks Mass-market penetration Niche penetration Skimming: early withdrawal
Increase customers’ awarenessand willingness to buy
Increase customers’ ability tobuy
• Heavy advertising togenerate awareness amongcustomers in mass market;broad use of mass media.
• Extensive salesforce effortsto win new adopters;possible use of incentives toencourage new productsales.
• Advertising and salesappeals stress genericbenefits of new producttype.
• Extensive introductory salespromotions to induce trial(sampling, couponing,quantity discounts).
• Move relatively quickly toexpand offerings (lineextensions, multiple packagesizes) to appeal to multiplesegments.
• Offer free trial, liberal return,or extended warrantypolicies to reduce customers’perceived risk of adoptingthe new product.
• Penetration pricing; or startwith high price but bring outlower-priced versions inanticipation of competitiveentries.
• Extended credit terms toencourage initial purchases.
• Heavy use of tradepromotions aimed at gainingextensive distribution.
• Offer engineering,installation, and trainingservices to increase newproduct’s compatibility withcustomers’ currentoperations to reduceswitching costs.
• Heavy advertising directed attarget segment to generateawareness; use selectivemedia relevant to target.
• Extensive salesforce effortsfocused on potentialcustomers in target segment;possible use of incentives toencourage new product salesto target accounts.
• Advertising and salesappeals stress genericbenefits of new producttype.
• Extensive introductory salespromotions to induce trial,but focused on targetsegment.
• Additional productdevelopment limited toimprovements ormodifications to increaseappeal to target segment.
• Offer free trial, liberal return,or extended warrantypolicies to reduce targetcustomers’ perceived risk ofadopting the new product.
• Penetration pricing; or startwith high price but bring outlower-priced versions inanticipation of competitiveentries.
• Extended credit terms toencourage initial purchases.
• Trade promotions aimed atgaining solid distributionamong retailers ordistributors pertinent forreaching target segment.
• Offer engineering,installation, and trainingservices to increase newproduct’s compatibility withcustomers’ currentoperations to reduceswitching costs.
• Limited advertising togenerate awareness;particularly among leastprice-sensitive earlyadopters.
• Extensive salesforce efforts,particularly focused onlargest potential adopters;possible use of volume-based incentives toencourage new productsales.
• Advertising and salesappeals stress genericbenefits of new producttype.
• Limited use, if any, ofintroductory salespromotions; if used, theyshould be volume-basedquantity discounts.
• Little, if any, additionaldevelopment within theproduct category.
• Offer free trial, liberal return,or extended warrantypolicies to reduce targetcustomers’ perceived risk ofadopting the new product.
• Skimming pricing; attempt tomaintain margins at levelconsistent with value ofproduct to early adopters.
• Extended credit terms toencourage initial purchases.
• Limited use of tradepromotions; only asnecessary to gain adequatedistribution.
• Offer limited engineering,installation, and trainingservices as necessary toovercome customers’objections.

Walker et al.: Marketing Strategy: A Decision−Focused Approach, Fourth Edition
III. Formulating Market Strategies
9. Marketing Strategies for New Market Entries
269© The McGraw−Hill Companies, 2002
Section Three Formulating Marketing Strategies208
Finally, a firm committed to mass-market penetration might also broaden its productofferings to increase its appeal to as many market segments as possible. This helps reduceits vulnerability to later entrants who could focus on specific market niches. Firms canaccomplish such market expansion through the rapid introduction of line extensions, addi-tional package sizes, or product modifications targeted at new applications and market seg-ments. Illinois Tool Works, for example, rapidly increased sales of its plastic safety buckleby modifying it for use with a variety of products, such as bicycle helmets, backpacks, andpet collars.
Increasing Customers’ Ability to Buy For customers to adopt a new product anddevelop loyalty toward it, they must be aware of the item and be motivated to buy. But theyalso must have the wherewithal to purchase it. Thus, to capture as many customers in asshort a time as possible, it usually makes sense for a firm pursuing mass-market penetra-tion to keep prices low (penetration pricing) and perhaps offer liberal financing arrange-ments or easy credit terms during the introductory period.
Pioneers introducing new information or communications technologies tend to be par-ticularly aggressive in pricing their offerings for two reasons. First, as we have seen, suchproducts often can benefit from positive network effects if enough customers can beinduced to adopt them quickly. Second, the variable costs of producing and distributingadditional units of such products are usually very low, perhaps even approaching zero. Forinstance, the costs of developing a new software product are high, but once it is developed,copies can be made and distributed over the Internet for next to nothing. These two factorsmean that it often makes sense for pioneers in such product categories to set their pricevery low to initial customers—perhaps even to give away trial copies—in hopes of quicklybuilding a large installed base, capturing more value from later customers with higherprices, and maximizing the lifetime value of their customers by selling them upgrades andenhanced versions of the product in the future.14
Another factor that can inhibit customers’ ability to buy is a lack of product availabil-ity. Thus, extensive personal selling and trade promotions aimed at gaining adequate dis-tribution are usually a critical part of a mass-market penetration marketing program. Suchefforts should take place before the start of promotional campaigns to ensure that the prod-uct is available as soon as customers are motivated to buy it.
A highly technical new product’s incompatibility with other related products or systemscurrently used also can inhibit customers’ purchases. It can result in high switching costsfor a potential adopter. The pioneer might reduce those costs by designing the product tobe as compatible as possible with related equipment. It also might offer engineering serv-ices to help make the new product more compatible with existing operations, provide freeinstallation assistance, and conduct training programs for the customer’s employees.
The above actions are suited not just to the marketing of products; most are essential ele-ments of mass-market penetration strategies for new service, retail, and even e-commercewebsites as well. The marketing actions of an e-tailer such as Amazon.com, discussed inExhibit 9.9, provide a textbook example of the elements of, as well as some of the risksinherent in, a mass-market penetration strategy.
Additional Considerations When Pioneering Global Markets Whether theproduct-market a pioneer is trying to penetrate is domestic or foreign, many of the mar-keting tasks appropriate for increasing potential customers’ awareness, willingness, andability to buy the new product or service are largely the same. Of course, some of the tac-tical aspects of the pioneer’s strategic marketing program—such as specific product fea-tures, promotional appeals, or distribution channels—may have to be adjusted to fitdifferent cultural, legal, or economic circumstances across national borders. For Bausch &
www
www

Walker et al.: Marketing Strategy: A Decision−Focused Approach, Fourth Edition
III. Formulating Market Strategies
9. Marketing Strategies for New Market Entries
270 © The McGraw−Hill Companies, 2002
Chapter Nine Marketing Strategies for New Market Entries 209
Lomb to develop the Chinese market for contact lenses, for instance, it first had to developan extensive training program for the country’s opticians and build a network of retail out-lets, actions that were unnecessary in more developed markets.
Unless the firm already has an economic presence in a country via the manufacture ormarketing of other products or services, however, a potential global pioneer faces at leastone additional question: What mode of entry is most appropriate? There are three basicmechanisms for entering a foreign market: exporting through agents (e.g., using local man-ufacturers’ representatives or distributors), contractual agreements (e.g., licensing or fran-chise arrangements with local firms), and direct investment.
Exporting is the simplest way to enter a foreign market because it involves the leastcommitment and risk. It can be direct or indirect. The latter relies on the expertise ofdomestic international middlemen: export merchants, who buy the product and sell it
Founded in 1994 by Jeff Bezos as the first online book-store, Amazon.com (www.amazon.com) has employed
many of the marketing tactics we have listed as possi-ble components of a mass-market penetration strategy.In the early days, the firm spent heavily on various pro-motional tools to attract buyers and build a base of loyalcustomers. In the late 1990s, the firm was spending anaverage of more than $50 for each new customer itattracted. The money was spent on banner advertisingand alliances with other sites and Web portals, tradi-tional media advertising, special consumer promotions,and an “associates” program through which sites thatoffer a link to Amazon get a cut of any sales theyreferred. As Amazon has built its customer base andincreased public awareness, its acquisition costs percustomer have declined substantially.
In the early years, many of Amazon’s inventory stor-age and order fulfillment functions were outsourced, itsfixed costs were low, and it had huge amounts of cap-ital to play with. Consequently, it was able to attractcustomers from bricks-and-mortar bookstores by offer-ing very low prices and a wide selection of titles.
To gain the loyalty of new customers it attracted,Amazon worked hard to constantly improve its cus-tomer service. It collected information from customersconcerning their preferences, desires, and complaints,then launched a series of customer service innova-tions, such as one-click ordering and a popular best-seller list ranking sales on the site. More recently, ithas invested hundreds of millions of dollars to build anetwork of company-owned distribution centers tobetter control order fulfillment and ensure quick andreliable delivery.
Finally, Amazon has greatly expanded its productlines over the years to include CDs, toys, electronics,
tools, and a variety of other things. This move wasmotivated by the company’s desire to become a one-stop shopping venue, and to increase the averageannual revenues per customer.
By 2001 there were signs that Amazon’s mass-market penetration strategy might succeed. Sales rev-enues were projected to grow to $4.5 billion in 2001and $6.5 billion in 2002. More importantly, early cus-tomers were returning to make repeat purchases.Repeat customers accounted for 76 percent of rev-enues in 2000, and the average annual revenue percustomer was projected to increase from $105 in 1998to $135 in 2001.
But the firm was still experiencing operating lossesin 2000. Cash flows were a negative $320 million inthe first quarter alone, largely as a result of carryingcosts and write-downs associated with excess inven-tory in the firm’s new distribution centers. As a conse-quence Amazon’s stock lost half its value betweenDecember 1999 and July 2000.
While analysts and investors were concerned thatthe firm might never be able to recoup the heavyexpenditures and investments involved in its strategy,Bezos and the believers were confident that the firm’sexpanding customer base and its ability to increasethe loyalty and lifetime value of those customerswould eventually pay big dividends. It’s too soon toknow which side is right, but that is a very commonstate of affairs for any pioneering firm that opts to pur-sue a mass-market penetration strategy.
Source: Eryn Brown, “Nine Ways to Win on the Web,” Fortune, May24, 1999, pp. 112–25; and Robert Hof, Debra Sparks, Ellen Neuborne,and Wendy Zellner, “Can Amazon Make It?” Business Week, July 10,2000, pp. 38–43.
Exhibit 9.9 Amazon’s Mass-Market Penetration Strategy

Walker et al.: Marketing Strategy: A Decision−Focused Approach, Fourth Edition
III. Formulating Market Strategies
9. Marketing Strategies for New Market Entries
271© The McGraw−Hill Companies, 2002
Section Three Formulating Marketing Strategies210
overseas for their own account; export agents, who sell on a commission basis; and coop-erative organizations, which export for several producers—especially those selling farmproducts. Direct exporting uses foreign-based distributors and agents or operating units(i.e., branches or subsidiaries) set up in the foreign country.
Contractual entry modes are nonequity arrangements that involve the transfer of tech-nology or skills to an entity in a foreign country. In licensing, a firm offers the right to useits intangible assets (e.g., technology, know-how, patents, company name, trademarks) inexchange for royalties or some other form of payment. Licensing is less flexible and pro-vides less control than exporting. Further, if the contract is terminated, the licensor mayhave developed a competitor. It is appropriate, however, when the market is unstable or dif-ficult to penetrate.
Franchising grants the right to use the company’s name, trademarks, and technology.Also, the franchisee typically receives help in setting up the franchise. It is an especiallyattractive way for service firms to penetrate foreign markets at low cost and to couple theirskills with local knowledge and entrepreneurial spirit. Host countries are reasonably recep-tive to this type of exporting since it involves local ownership. U.S. companies have largelypioneered franchising—especially such fast-food companies as McDonald’s, Pizza Hut,Burger King, and Kentucky Fried Chicken. In recent years foreign franchisers have enteredthe United States—largely from Canada, Great Britain, and Japan—in a variety of fields,including food, shoe repair, leather furniture, and wall cleaning.
Other contractual entry modes include contract manufacturing, which involves sourc-ing a product from a manufacturer located in a foreign country for sale there or elsewhere(e.g., auto parts, clothes, and furniture). Contract manufacturing is most attractive whenthe local market is too small to warrant making an investment, export entry is blocked, anda quality licensee is not available. A turnkey construction contract requires the contrac-tor to have the project up and operating before releasing it to the owner. Coproductioninvolves a company’s providing technical know-how and components in return for a shareof the output that it must sell. Countertrade transactions include barter (direct exchangeof goods—hams for aircraft), compensation packages (cash and local goods), counterpur-chase (delayed sale of bartered goods to enable the local buyer to sell the goods), and abuyback arrangement in which the products being sold are used to produce other goods.
Overseas direct investment can be implemented in two ways: joint ventures or soleownership. Joint ventures involve a joint ownership arrangement (e.g., one between aU.S. firm and one in the host country) to produce or market goods in a foreign country.Today, joint ventures are commonplace because they avoid quotas and import taxes andsatisfy government demands to produce locally. They also have the advantage of sharinginvestment costs and gaining local marketing expertise. For example, Motorola had diffi-culty penetrating the Japanese market until it formed an alliance with Toshiba to set up ajoint chip-making venture. In addition, Toshiba provided Motorola with marketing help.
A sole ownership investment entry strategy involves setting up a production facility in aforeign country. Direct investment usually allows the parent organization to retain total con-trol of the overseas operation and avoids the problems of shared management and loss offlexibility. This strategy is particularly appropriate when the politics of the situation requirea dedicated local facility. Firms using a direct investment strategy extensively include Gen-eral Motors, Procter & Gamble, General Foods, Hewlett-Packard, and General Electric.
Exporting has the advantage of lowering the financial risk for a pioneer entering anunfamiliar foreign market. Unfortunately, such arrangements also afford a pioneer rela-tively little control over the marketing and distribution of its product or service—activitiesthat are critical for winning customer awareness and loyalty in a new market. At the otherextreme, investing in a wholly owned subsidiary typically makes little sense until it

Walker et al.: Marketing Strategy: A Decision−Focused Approach, Fourth Edition
III. Formulating Market Strategies
9. Marketing Strategies for New Market Entries
272 © The McGraw−Hill Companies, 2002
Chapter Nine Marketing Strategies for New Market Entries 211
becomes clear that the pioneering product will win customer acceptance. Consequently,intermediate modes of entry, such as licensing or forming a joint venture with a local firmin the host country, tend to be the preferred means of developing global markets for newproducts. Joint ventures are particularly appropriate in this regard because they avoid quo-tas and import restrictions or taxes, and they allow a pioneer to share financial risks whilegaining local marketing expertise.15 Thus Bausch & Lomb established a joint venture withBeijing Optical as a basis for building contact lens factories in China and for gainingaccess to Chinese opticians. Consequently, the firm has been able to develop and maintaina leading market share in the world’s most heavily populated country with a modest invest-ment of only about $20 million.
Marketing Program Components for a Niche Penetration StrategyBecause the objectives of a niche penetration strategy are similar to but more narrowlyfocused than those of a mass-market strategy, the marketing program elements are alsolikely to be similar under the two strategies. Obviously, however, the niche penetratorshould keep its marketing efforts clearly focused on the target segment to gain as muchimpact as possible from its limited resources. This point is evident in the outline of pro-gram components in Exhibit 9.8. For example, while a niche strategy calls for the sameadvertising, sales promotion, personal selling, and trade promotion activities as a mass-market program, the former should use more selective media, call schedules, and channeldesigns to precisely direct those activities toward the target segment.
Marketing Program Components for a Skimming StrategyAs Exhibit 9.8 suggests, one major difference between a skimming strategy and a mass-market penetration strategy involves pricing policies. A relatively high price is appropriatefor a skimming strategy to increase margins and revenues, even though some price-sensitivecustomers may be reluctant to adopt the product at that price.16 This also suggests thatintroductory promotional programs might best focus on customer groups who are leastsensitive to price and most likely to be early adopters of the new product. This can helphold down promotion costs and avoid wasting marketing efforts on less profitable marketsegments. Thus, in many consumer goods businesses, skimming strategies focus on rela-tively upscale customers, since they are often more likely to be early adopters and less sen-sitive to price.
Another critical element of a skimming strategy is the nature of the firm’s continuingproduct-development efforts. A pioneer that plans to leave a market when competitorsenter should not devote much effort to expanding its product line through line extensionsor multiple package sizes. Instead, it should concentrate on the next generation of tech-nology or on identifying new application segments, in other words, preparing its avenue ofescape from the market.
Now that we have examined some strategies a pioneer might follow in entering a newmarket, we are left with two important strategic questions. The pioneer is by definition theearly share leader in the new market; hence the first question is, What adjustments in strat-egy might be necessary for the pioneer to maintain its leading share position after com-petitors arrive on the scene? The second is, What strategies might followers adopt to takebusiness away from the early leader and increase their relative share position as the mar-ket grows? These two strategic issues are the focus of the next chapter.

Walker et al.: Marketing Strategy: A Decision−Focused Approach, Fourth Edition
III. Formulating Market Strategies
9. Marketing Strategies for New Market Entries
273© The McGraw−Hill Companies, 2002
Section Three Formulating Marketing Strategies212
• Being the pioneer in a new product or service categorygains the firm a number of potential advantages. But notall pioneers are able to sustain a leading position in themarket as it grows. A pioneering firm stands the bestchance for long-term share leadership and profitabilitywhen the market can be insulated from the rapid entryof competitors by patent protection or other means andwhen the firm has the necessary resources and compe-tencies to capitalize on its first-mover advantages.
• Evidence suggests that pioneers who successfully cap-italize on their first-mover advantage and sustain aleading competitive position (a) introduce a qualityproduct and pay careful attention to quality control,(b) have the capacity to enter on a large scale or theresources to expand rapidly as the market grows, (c)back the introduction with substantial promotion tobuild awareness and trial, and (d) rapidly expand theproduct line to satisfy multiple customer segments.
• Followers can trump the pioneer in a new product cat-egory if they can enter with more capacity backed by
substantially larger marketing expenditures, or byleapfrogging the first mover with superior technology,product quality, or customer service.
• Not all pioneers attempt to penetrate the mass market and remain the share leader as that marketgrows. Some adopt a strategy geared to making profits from specialized niche markets where they willface fewer direct competitors. Still others try to stayone jump ahead of competitors by introducing astream of new products and withdrawing from oldermarkets as they become more competitive. The appro-priate strategy to adopt depends on the firm’sresources and competencies, the strength of likelycompetitors, and the characteristics of the product andits target market.
• Self-diagnostic questions to test your ability to applythe analytical tools and concepts in this chapter tomarketing decision making may be found at thisbook’s website at www.mhhe.com/walker.
Take Aways
Endnotes
1. This example is based on information found in Ronald Henkoff, “TheUltimate Nuts & Bolts Co.,” Fortune, July 16, 1990, pp. 70–73; and I. JeanneDugan, Alison Rea, and Joseph Weber, “The Best Performers,” BusinessWeek, March 24, 1997, pp. 80–90; and at the Illinois Tool Works, Inc., web-site, www.itw.com.
2. These results are reported in Myron Magnet, “Let’s Go for Growth,” For-tune, March 7, 1994, pp. 60–72.
3. New Products Management for the 1980s (New York: Booz, Allen &Hamilton, 1982). More recent studies, though focusing on smaller samples ofnew products, suggest that the relative proportions of new-to-the-world ver-sus less innovative product introductions have not changed substantially overthe years. For example, see Eric M. Olson, Orville C. Walker Jr., and RobertW. Ruekert, “Organizing for Effective New Product Development: The Mod-erating Role of Product Innovativeness,” Journal of Marketing 59 (January1995), pp. 48–62.
4. For a more extensive review of the potential competitive advantages ofbeing a first mover, and the controllable and uncontrollable forces that influ-ence a firm’s ability to capitalize on those potential advantages, see Roger A.Kerin, P. Rajan Varadarajan, and Robert A. Peterson, “First-Mover Advan-tage: A Synthesis, Conceptual Framework, and Research Propositions,” Jour-nal of Marketing 56 (October 1992), pp. 33–52; and David M. Szymanski,Lisa M. Troy, and Sundar J. Bharadwaj, “Order-of Entry and Business Per-formance: An Empirical Synthesis and Reexamination,” Journal of Marketing59 (October 1995), pp. 17–33.
5. Thomas S. Gruca and D. Sudharshan, “A Framework for Entry DeterrenceStrategy: The Competitive Environment, Choices, and Consequences,” Jour-nal of Marketing 59 (July 1995), pp. 44–55.
6. Carl Shapiro and Hal R. Varian, Information Rules (Boston: Harvard Busi-ness School Press, 1999), chap. 7.
7. For example, see William T. Robinson, “Market Pioneering and Sustain-able Market Share Advantages in Industrial Goods Manufacturing Indus-tries,” working paper, Purdue University, 1984; and Robert D. Buzzell andBradley T. Gale, The PIMS Principles: Linking Strategy to Performance (NewYork: Free Press, 1987), p. 183.
8. Peter N. Golder and Gerard J. Tellis, “Pioneer Advantage: Marketing Logicor Marketing Legend,” Journal of Marketing Research 30 (May 1993), pp.158–70.
9. Marvin B. Lieberman and David B. Montgomery, “First-Mover Advan-tages,” Strategic Management Journal 9 (1988), pp. 41–59; and Michael J.Moore, William Boulding, and Ronald C. Goodstein, “Pioneering and MarketShare: Is Entry Time Endogenous and Does It Matter?” Journal of Marketing28 (February 1991), pp. 97–104.
10. Szymanski, Troy, and Bharadwaj, “Order-of-Entry and Business Per-formance.”
11. Moore, Boulding, and Goodstein, “Pioneering and Market Share.”
12. Mary L. Coyle, “Competition in Developing Markets: The Impact ofOrder of Entry,” unpublished doctoral dissertation, University of Toronto,1986. Also see Kerin, Varadarajan, and Peterson, “First-Mover Advantage.”
13. George S. Day, Analysis for Strategic Marketing Decisions (St. Paul, MN:West, 1986), pp. 103–104.
14. Shapiro and Varian, Information Rules, chap. 2.
15. Franklin R. Root, Entry Strategy for International Markets (Lexington,MA: D. C. Heath, 1987). Also see Jeremy Main, “Making Global AlliancesWork,” Fortune, December 17, 1990, pp. 121–26.
16. This assumes that demand is relatively price inelastic. In markets whereprice elasticity is high, a skimming price strategy may lead to lower total rev-enues due to its dampening effect on total demand.

Walker et al.: Marketing Strategy: A Decision−Focused Approach, Fourth Edition
III. Formulating Market Strategies
10. Strategies for Growth Markets
274 © The McGraw−Hill Companies, 2002
214
Chapter Ten
STRATEGIES FOR GROWTH
MARKETS
Nike versus Vans: The Battle for Jocks’ Hearts and Soles1
Nike athletic shoes began life in 1964—albeit under a different name—as a specialtyproduct targeted at long-distance runners, a
very narrow niche of the athletic footwear market.Phil Knight, a former distance runner at the Uni-versity of Oregon, and his former coach Bill Bow-erman believed that distance runners neededbetter shoes. With his wife’s waffle iron and somelatex, Bowerman developed the waffle outsole thatwould revolutionize the running shoe. Nike’s newshoes were lighter and more flexible than compet-ing shoes, with better lateral stability to protectagainst ankle sprains and more cushioning to helprunners’ bodies cope with miles and miles ofrepetitive impact.
The company struggled for years to strengthenits foothold in an industry dominated by muchlarger global competitors like Adidas. But in 1972Nike finally gained the sporting world’s attentionwhen four of the top seven finishers in the Olympicmarathon wore the firm’s shoes. By 1974 Nike wasAmerica’s best selling brand of training shoe, andthe Nike brand was on the way to stardom.
Having become number one in training shoes,Nike set its sights on achieving share leadership inthe entire industry. As a first step toward accom-plishing that goal, the company invested heavily in
new product R&D and design efforts to expand itsproduct line with offerings tailored to the needsand preferences of participants in a wide variety ofother sports. It held down costs by outsourcingproduction of the new lines to a number of off-shore manufacturers. However, the firm maintainedtight control over, and was much less frugal with,its marketing efforts. Nike spent heavily onendorsement deals with sport celebrities and on aseries of stylish but edgy mass media ad cam-paigns to capture attention and build a strongbrand image in its new target segments. It alsoconstructed an extensive distribution network con-sisting largely of independent mass retailers andspecialty chains like Footlocker.
In 1978, tennis great John McEnroe signed withthe company and tennis shoes became a prominentpart of the product line. In 1985, a promising ChicagoBulls rookie named Michael Jordan endorsed a lineof Air Jordan shoes and apparel. By 1986, Nike’sworldwide sales passed the billion-dollar mark andNike had become the acknowledged technologicalleader in the footwear industry. Today, Nike offers afull line of shoes for virtually every athletic activity,it’s the global leader in industry market share, and itdominates most segments of the market—with a fewnotable exceptions.

Walker et al.: Marketing Strategy: A Decision−Focused Approach, Fourth Edition
III. Formulating Market Strategies
10. Strategies for Growth Markets
275© The McGraw−Hill Companies, 2002
215
Boarders Are Bored
with Nike
In 1995 Nike made a concerted run at capturing adominant share of the shoe and apparel purchasesof skateboarders, but stubbed its toe. These days,the brand of choice among boarders is tiny VansInc. The Santa Fe Springs, California, company pio-neered thick-soled slip-on sneakers able to absorbthe shock of a five-foot leap on wheels. The firmnurtures its cool image with an offbeat marketingprogram that forgoes media advertising andfocuses instead on sponsorships, events, and other“experience” activities that fit the skateboard cul-ture. The centerpiece of these marketing efforts isthe elaborate skateboard parks Vans is building atmalls around the country. The company also getssome broader media exposure by sponsoringevents such as the Vans Triple Crown, a showcasefor alternative sports ranging from skateboardingto BMX biking that is broadcast by NBC Sports. AsVans’ CEO Gary Schoenfeld points out, “Our visionis not to hit our target audience over the head with
ads, but to integrate ourselves into the places theyare most likely to be.”
Because the skateboarding craze was hot duringthe first years of the 21st century, Vans enjoyedheady growth. The company earned $15.5 millionon sales of $336 million in its 2000 fiscal year, a23 percent increase over the year before. True, thatgives Vans less than 2 percent of an overall athleticshoe market that is half-owned by Nike, but thefirm’s focus on alternative sports fanatics has builtan intensely loyal—and profitable—customer base.
While Vans would like to pursue growth bydeveloping new products, it also wants to avoidoffending loyal customers who love its maverickroots and outsider image. The company wouldrather preserve its dominance in a small but lucra-tive market niche than launch a risky and expen-sive battle for a bigger share of the entire market.Thus, the firm is experimenting with hiking boots,snowboard boots, and an expanded clothing line,but has steered clear of inline skates becauseskateboarders tend to see them as a wimpy off-shoot.
Strategic Challenges Addressed
in Chapter 10
While Nike was clearly not the pioneer of the athletic shoe industry, the firm’s technicalinnovations, stylish designs, and savvy market segmentation strategy spurred a sustainedperiod of market growth. Both conventional wisdom and the various portfolio models sug-gest there are advantages to be gained from a strategy of investing heavily to build and sus-tain a commanding share of a growing market, a strategy similar to Nike’s. But a marketis neither inherently attractive nor unattractive simply because it promises rapid futuregrowth. And not all competitors have the resources and capabilities necessary to dominatean entire market, as Vans—with its limited marketing budget—seems well aware. Conse-quently, managers must consider how customer desires and the competitive situation arelikely to evolve as a market grows, and determine whether their firms can exploit marketgrowth to establish a sustainable advantage. Therefore, the next section of this chapterexamines both the opportunities and competitive risks often found in growing product-markets.
The primary objective of the early share leader, usually the market pioneer, in a growthmarket is share maintenance. From a marketing perspective the firm must accomplishtwo important tasks: (1) retain repeat or replacement business from its existing customers
Walker et al.: Marketing Strategy: A Decision−Focused Approach, Fourth Edition
III. Formulating Market Strategies
10. Strategies for Growth Markets
276 © The McGraw−Hill Companies, 2002
Section Three Formulating Marketing Strategies216
and (2) continue to capture the major portion of sales to the growing number of new cus-tomers entering the market for the first time. The leader might use any of several market-ing strategies to accomplish these objectives. It might try to build on its early scale andexperience advantages to achieve low-cost production and reduce its prices. Alternatively,the leader might focus on rapid product improvements, expand its product line to appealto newly emerging segments, or increase its marketing and sales efforts, all of which Nikeemployed in building global leadership in the athletic footwear market.
The second section of this chapter explores marketing strategies—both defensive andoffensive—that leaders might use to maintain a dominant market share in the face of con-tinuing growth and increasing competition.
A challenger’s strategic objective in a growth market is usually to build its share byexpanding its sales faster than the overall market growth rate. Firms do this by stealingexisting customers away from the leader or other competitors, capturing a larger share ofnew customers than the market leader, or both. Once again, challengers might use a num-ber of strategies to accomplish these objectives. These include developing a superior prod-uct technology; differentiating through rapid product innovations, line extensions, orcustomer service; offering lower prices; or focusing on market niches where the leader isnot well established, as Van’s has done in the skateboarding segment. The fourth sectiondetails these and other share-growth strategies that market challengers use under differ-ent conditions.
The success of a firm’s strategy during the growth stage is a critical determinant of itsability to reap profits, or even survive, as a product-market moves toward maturity. Unfor-tunately, the growth stage is often short; and increasingly rapid technological change andmarket fragmentation are causing it to become even shorter in many industries.2 Thisshortening of the growth stage concerns many firms—particularly late entrants or thosewho fail to acquire a substantial market share—because as growth slows during the tran-sition to maturity, there is often a shakeout of marginal competitors. Thus, when choosingmarketing strategies for competing in a growing product-market, managers should keepone eye on building a competitive advantage that the business can sustain as growth slowsand the market matures.
Opportunities and Risks
in Growth Markets3
Why are followers attracted to rapidly growing markets? Conventional wisdom suggestssuch markets present attractive opportunities for future profits because
• It is easier to gain share when a market is growing.
• Share gains are worth more in a growth market than in a mature market.
• Price competition is likely to be less intense.
• Early participation in a growth market is necessary to make sure that the firm keeps pace withthe technology.
While generally valid, each of these premises may be seriously misleading for a particularbusiness in a specific situation. Many followers attracted to a market by its rapid growthrate are likely to be shaken out later when growth slows because either the preceding prem-ises did not hold or they could not exploit growth advantages sufficiently to build a sus-tainable competitive position. By understanding the limitations of the assumptions aboutgrowth markets and the conditions under which they are most likely to hold, a manager canmake better decisions about entering a market and the kind of marketing strategy likely tobe most effective in doing so.

Walker et al.: Marketing Strategy: A Decision−Focused Approach, Fourth Edition
III. Formulating Market Strategies
10. Strategies for Growth Markets
277© The McGraw−Hill Companies, 2002
Chapter Ten Strategies for Growth Markets 217
Gaining Share Is EasierThe premise that it is easier for a business to increase its share in a growing market is basedon two arguments. First, there may be many potential new users who have no establishedbrand loyalties or supplier commitments and who may have different needs or preferencesthan earlier adopters. Thus there may be gaps or undeveloped segments in the market. It iseasier, then, for a new competitor to attract those potential new users than to convert cus-tomers in a mature market. Second, established competitors are less likely to react aggres-sively to market-share erosion as long as their sales continue to grow at a satisfactory rate.
There is some truth to the first argument. It usually is easier for a new entrant to attractfirst-time users than to take business away from entrenched competitors. To take fulladvantage of the situation, however, the new entrant must be able to develop a productoffering that new customers perceive as more attractive than other alternatives, and it musthave the marketing resources and competence to effectively persuade them of that fact.This can be difficult, especially when the pioneer has had months or years to influencepotential customers’ decision criteria and preferences.4
The notion that established competitors are less likely to react to share losses so longas their revenues are growing at an acceptable rate is more tenuous. It overlooks the factthat those competitors may have higher expectations for increased revenues when the mar-ket itself is growing. Capital investments and annual operating budgets are usually tied tothose sales expectations; therefore, competitors are likely to react aggressively when salesfall below expected levels whether or not their absolute volumes continue to grow. This isparticularly true given that increased competition will likely erode the leader’s relativemarket share even though its volume may continue to increase. As illustrated by the hypo-thetical example in Exhibit 10.1, the leader’s market share might drop from a high of 100
Exhibit 10.1Market Shares of the Leader and Followers over the Life Cycle of a Hypothetical Market
Source: From Analysis for Strategic Market Decisions, 1st edition, by G. S. Day © 1986. Reprinted withpermission of South-Western College Publishing, a division of Thomson Learning. Fax 800-730-2215.
$ S
ales
vol
ume
Introduction Growth Early Maturitymaturity
Life cycle stages
Late entrants
Follower
20%share
30%share
50%share
Leader(pioneer)

Walker et al.: Marketing Strategy: A Decision−Focused Approach, Fourth Edition
III. Formulating Market Strategies
10. Strategies for Growth Markets
278 © The McGraw−Hill Companies, 2002
Section Three Formulating Marketing Strategies218
percent at the beginning of the growth stage to 50 percent by the maturity stage, eventhough the firm’s absolute volume shows steady growth.
Industry leaders often react forcefully when their sales growth falls below industry lev-els, or when the industry’s growth rate slows. For example, when growth in the personalcomputer market slumped in 2000 due to the dot-com crash and other factors, Dell Com-puter did not adjust its aggressive sales growth objective. Instead, it launched a brutal pricewar aimed at taking more business away from competitors in order to achieve its goal.Because Dell’s focus on direct selling over the Internet, its build-to-order manufacturingsystem, and its tightly integrated supply chain made it the undisputed low-cost producer inthe industry, Dell was able to slash gross margins from 21.3 percent in mid-2000 to 17.5percent in mid-2001 and still make money. As a result, Dell’s leading share of the globalPC market increased from 10 percent to 13 percent by July of 2001. And while the firmearned $360 million in profits through the first half of 2001, its competitors suffered a totalof $1.1 billion in losses.5
Share Gains Are Worth MoreThe premise that share gains are more valuable when the market is growing stems from theexpectation that the earnings produced by each share point continue to expand as the mar-ket expands. The implicit assumption in this argument, of course, is that the business canhold its relative share as the market grows. The validity of such an assumption depends ona number of factors, including the following:
• The existence of positive network effects. As we saw in the previous chapter, pioneers in newproduct-markets enjoy several potential competitive advantages that they can—but don’talways manage to—leverage as the market grows. For information-based products, such ascomputer software or Internet auction sites, one of the most important such advantage is theexistence of positive network effects, the tendency for the product to become more valuableto users as the number of adopters grows. Such network effects increase the likelihood thatan early share leader can sustain, and even increase, its relative share as the market grows. AsMicrosoft was able to license its Windows operating system to a growing number of com-puter manufacturers, for example, software developers created more and more applicationsto run on Windows, which made Windows even more attractive to later computer buyers andhelped Microsoft expand its already commanding market share.
• Future changes in technology or other key success factors. On the other hand, if the rules ofthe game change, the competencies a firm relied on to capture share may no longer be ade-quate to maintain that share. For instance, Sony was the pioneer and early share leader in thevideocassette recorder industry with its Betamax technology. But Matsushita’s longer-playingand lower-priced VHS format equipment ultimately proved much more popular with con-sumers, captured a commanding portion of the market, and dethroned Sony as industry leader.
• Future competitive structure of the industry. The number of firms that ultimately decide tocompete for a share of the market may turn out to be larger than the early entrants anticipate,particularly if there are few barriers to entry. The sheer weight of numbers can make it diffi-cult for any single competitor to maintain a substantial relative share of the total market.
• Future fragmentation of the market. As the market expands, it may fragment into numeroussmall segments, particularly if potential customers have relatively heterogeneous functional,distribution, or service needs. When such fragmentation occurs, the market in which a givencompetitor competes may shrink as segments splinter away.
In addition to these possible changes in future market conditions, a firm’s ability to holdits early gains in market share also depends on how it obtained them. If a firm capturesshare through short-term promotions or price cuts that competitors can easily match andthat may tarnish its image among customers, its gains may be short-lived.
www

Walker et al.: Marketing Strategy: A Decision−Focused Approach, Fourth Edition
III. Formulating Market Strategies
10. Strategies for Growth Markets
279© The McGraw−Hill Companies, 2002
Chapter Ten Strategies for Growth Markets 219
Price Competition Is Likely to Be Less IntenseIn many rapidly growing markets demand exceeds supply. The market exerts little pressureon prices initially; the excess demand may even support a price premium. Thus, early entryprovides a good opportunity for a firm to recover its initial product development and com-mercialization investment relatively quickly. New customers also may be willing to pay apremium for technical service as they learn how to make full use of the new product. In con-trast, as the market matures and customers gain more experience, the premium a firm cancharge without losing market share slowly shrinks; it eventually may disappear entirely.6
However, this scenario does not hold true in every developing product-market. If thereare few barriers to entry or if the adoption process is protracted and new customers enterthe market slowly, demand may not exceed supply—at least not for very long. Also, thepioneer, or one of the earliest followers, might adopt a penetration strategy and set its ini-tial prices relatively low to move quickly down the experience curve and discourage otherpotential competitors from entering the market.
Early Entry Is Necessary to Maintain TechnicalExpertiseIn high-tech industries early involvement in new product categories may be critical for stay-ing abreast of technology. The early experience gained in developing the first generation ofproducts and in helping customers apply the new technology can put the firm in a strongposition for developing the next generation of superior products. Later entrants, lacking suchcustomer contact and production and R&D experience, are likely to be at a disadvantage.
There is substantial wisdom in these arguments. Sometimes, however, an early com-mitment to a specific technology can turn out to be a liability. This is particularly true whenmultiple unrelated technologies might serve a market or when a newly emerging technol-ogy might replace the current one. Once a firm is committed to one technology, adoptinga new one can be difficult. Management is often reluctant to abandon a technology inwhich it has made substantial investments, and it might worry that a rapid shift to a newtechnology will upset present customers. As a result, early commitment to a technologyhas become increasingly problematic because of more rapid rates of technological change.This problem is dramatically illustrated by the experience of Medtronic, Inc., as describedin Exhibit 10.2.
The dangers inherent in being overly committed to anearly technology are demonstrated by Medtronic,
Inc., the pioneer in the cardiac pacemaker industry.Medtronic was reluctant to switch to a new lithium-based technology that enabled pacemakers to workmuch longer before being replaced. As a result, severalMedtronic employees left the company and foundedCardiac Pacemakers Inc. to produce and market the newlithium-based product. They quickly captured nearly 20
percent of the total market. And Medtronic saw its shareof the cardiac pacemaker market fall rapidly from nearly70 percent to 40 percent.
Source: Reprinted from “Managing Innovation: Insights from theCardiac-Pacing Industry,” by Daniel H. Gobeli and William Rudelius,MIT Sloan Management Review, Summer 1985, pp. 29–43, permissionof the publisher. Copyright 1985 by Massachusetts Institute of Tech-nology. All rights reserved.
Exhibit 10.2 Medtronic’s Commitment to an Old Technology Cost It Sales and Market Share
Walker et al.: Marketing Strategy: A Decision−Focused Approach, Fourth Edition
III. Formulating Market Strategies
10. Strategies for Growth Markets
280 © The McGraw−Hill Companies, 2002
Section Three Formulating Marketing Strategies220
Growth-Market Strategies
for Market Leaders
For the share leader in a growing market, of course, the question of the relative advantagesversus risks of market entry is moot. The leader is typically the pioneer, or at least one ofthe first entrants, who developed the product-market in the first place. Often, that firm’sstrategic objective is to maintain its leading share position in the face of increasing com-petition as the market expands. Share maintenance may not seem like a very aggressiveobjective, because it implies the business is merely trying to stay even rather than forgeahead. But two important facts must be kept in mind.
First, the dynamics of a growth market—including the increasing number of competitors,the fragmentation of market segments, and the threat of product innova-tion from within and outside the industry—make maintaining an earlylead in relative market share very difficult. The continuing need for invest-ment to finance growth, the likely negative cash flows that result, and thethreat of governmental antitrust action can make it even more difficult. Forexample, 31 percent of the 877 market-share leaders in the PIMS databaseexperienced losses in relative share, and leaders were especially likely tosuffer this fate when their market shares were very large.7
Second, a firm can maintain its current share position in a growth market only if its salesvolume continues to grow at a rate equal to that of the overall market, enabling the firm tostay even in absolute market share. However, it may be able to maintain a relative sharelead even if its volume growth is less than the industry’s.
Marketing Objectives for Share LeadersShare maintenance for a market leader involves two important marketing objectives. First,the firm must retain its current customers, ensuring that those customers remain brandloyal when making repeat or replacement purchases. This is particularly critical for firmsin consumer nondurable, service, and industrial materials and components industrieswhere a substantial portion of total sales volume consists of repeat purchases. Second, thefirm must stimulate selective demand among later adopters to ensure that it captures alarge share of the continuing growth in industry sales.
In some cases the market leader might pursue a third objective: stimulating primary demandto help speed up overall market growth. This can be particularly important in product-marketswhere the adoption process is protracted because of the technical sophistication of the newproduct, high switching costs for potential customers, or positive network effects.
The market leader is the logical one to stimulate market growth in such situations; it hasthe most to gain from increased volume, assuming it can maintain its relative share of thatvolume. However, expanding total demand—by promoting new uses for the product orstimulating existing customers’ usage and repeat purchase rates—is often more critical nearthe end of the growth stage and early in the maturity stage of a product’s life cycle. Conse-quently, we discuss marketing actions appropriate to this objective in the next chapter.
Marketing Actions and Strategies to AchieveShare-Maintenance ObjectivesA business might take a variety of marketing actions to maintain a leading share position in agrowing market. Exhibit 10.3 outlines a lengthy, though not exhaustive, list of such actions andtheir specific marketing objectives. Because share maintenance involves multiple objectives,
Strategic Issue
The dynamics of a growth market—includ-ing the increasing number of competitors,the fragmentation of market segments, andthe threat of product innovation from withinand outside the industry—make maintainingan early lead in relative market share verydifficult.

Walker et al.: Marketing Strategy: A Decision−Focused Approach, Fourth Edition
III. Formulating Market Strategies
10. Strategies for Growth Markets
281© The McGraw−Hill Companies, 2002
Chapter Ten Strategies for Growth Markets 221
Exhibit 10.3Marketing Actions to Achieve Share-Maintenance Objectives
Marketing objectives Possible marketing actions
Retain current customers by
• Maintaining/improving satisfaction • Increase attention to quality control as output expands.and loyalty. • Continue product modification and improvement efforts to increase customer
benefits and/or reduce costs.
• Focus advertising on stimulation of selective demand; stress product’s superiorfeatures and benefits; reminder advertising.
• Increase salesforce’s servicing of current accounts; consider formation ofnational or key account representatives to major customers; consider replacingindependent manufacturer’s reps with company salespeople where appropriate.
• Expand postsale service capabilities; develop or expand company’s own serviceforce, or develop training programs for distributors’ and dealers’ service peo-ple; expand parts inventory; develop customer service hotline or website.
• Encouraging/simplifying repeat purchase. • Expand production capacity in advance of increasing demand to avoid stockouts.
• Improve inventory control and logistics systems to reduce delivery times.
• Continue to build distribution channels; use periodic trade promotions to gainmore extensive retail coverage and maintain shelf-facings; strengthen relation-ships with strongest distributors/dealers.
• Consider negotiating long-term requirements contracts with major customers.
• Consider developing automatic reorder systems or logistical alliances.
• Reducing attractiveness of switching. • Develop a second brand or product line with features or price more appealingto a specific segment of current customers (flanker strategy—see Exhibits 10.4and 10.5).
• Develop multiple-line extensions or brand offerings targeted to the needs ofseveral user segments within the market (market expansion).
• Meet or beat lower prices or heavier promotional efforts by competitors—or tryto preempt such efforts by potential competitors—when necessary to retaincustomers and when lower unit costs allow (confrontation strategy).
Stimulate selective demand among later adopters by
• Head-to-head positioning against • Develop a second brand or product line with features or price more appealingcompetitive offerings or potential to a specific segment of potential customers (flanker strategy).offerings. • Make product modifications or improvements to match or beat superior
competitive offerings (confrontation strategy).
• Meet or beat lower prices or heavier promotional efforts by competitors whennecessary to retain customers and when lower unit costs allow (confrontationstrategy).
• When resources are limited relative to a competitor’s, consider withdrawingfrom smaller or slower growing segments to focus product development andpromotional efforts on higher potential segments threatened by competitor(contraction or strategic withdrawal strategy).
• Differentiated positioning against • Develop multiple-line extensions or brand offerings targeted to the needs competitive offerings or potential of various potential user applications or geographical segments within the offerings. market (market expansion strategy).
• Build unique distribution channels to more effectively reach specific segmentsof potential customers (market expansion strategy).
• Design multiple advertising and/or sales promotion campaigns targeted at spe-cific segments of potential customers (market expansion strategy).

Walker et al.: Marketing Strategy: A Decision−Focused Approach, Fourth Edition
III. Formulating Market Strategies
10. Strategies for Growth Markets
282 © The McGraw−Hill Companies, 2002
Section Three Formulating Marketing Strategies222
and different marketing actions may be needed to achieve each one, a strategic marketing pro-gram usually integrates a mix of the actions outlined in the exhibit.
Not all the actions summarized in Exhibit 10.3 are consistent with one another. It would beunusual, for instance, for a business to invest heavily in new product improvements and pro-motion to enhance its product’s high-quality image and simultaneously slash prices, unless itwas trying to drive out weaker competitors in the short run with an eye on higher profits in thefuture. Thus, the activities outlined in Exhibit 10.3 cluster into five internally consistent strate-gies that a market leader might employ, singly or in combination, to maintain its leading shareposition: a fortress, or position defense, strategy; a flanker strategy; a confrontation strat-egy; a market expansion strategy; and a contraction, or strategic withdrawal, strategy.
Exhibit 10.4 diagrams this set of strategies. It is consistent with what a number of mili-tary strategists and some marketing authorities have identified as common defensive strate-gies.8 To think of them as strictly defensive, though, can be misleading. Companies can usesome of these strategies offensively to preempt expected future actions by potential com-petitors. Or they can use them to capture an even larger share of future new customers.
Which, or what combination, of these five strategies is most appropriate for a particularproduct-market depends on (1) the market’s size and its customers’ characteristics, (2) thenumber and relative strengths of the competitors or potential competitors in that market, and(3) the leader’s own resources and competencies. Exhibit 10.5 outlines the situations in
Exhibit 10.4Strategic Choices for Share Leaders in Growth Markets
Source: P. Kotler and R. Singh Achrol, “Marketing Warfare in the 1980’s,” Journal of Business Strategy,Winter 1981. Republished with permission-EC Media Group, Eleven Penn Plaza, New York, NY 10001.
Confrontationstrategy
ProactiveReactive
COMPETITOROR
POTENTIALCOMPETITOR
Flanker strategy—ProactiveFlanker strategy—Reactive
Fortressor positiondefensestrategy
Contractionor
strategicwithdrawal
LEADER
Market expansion
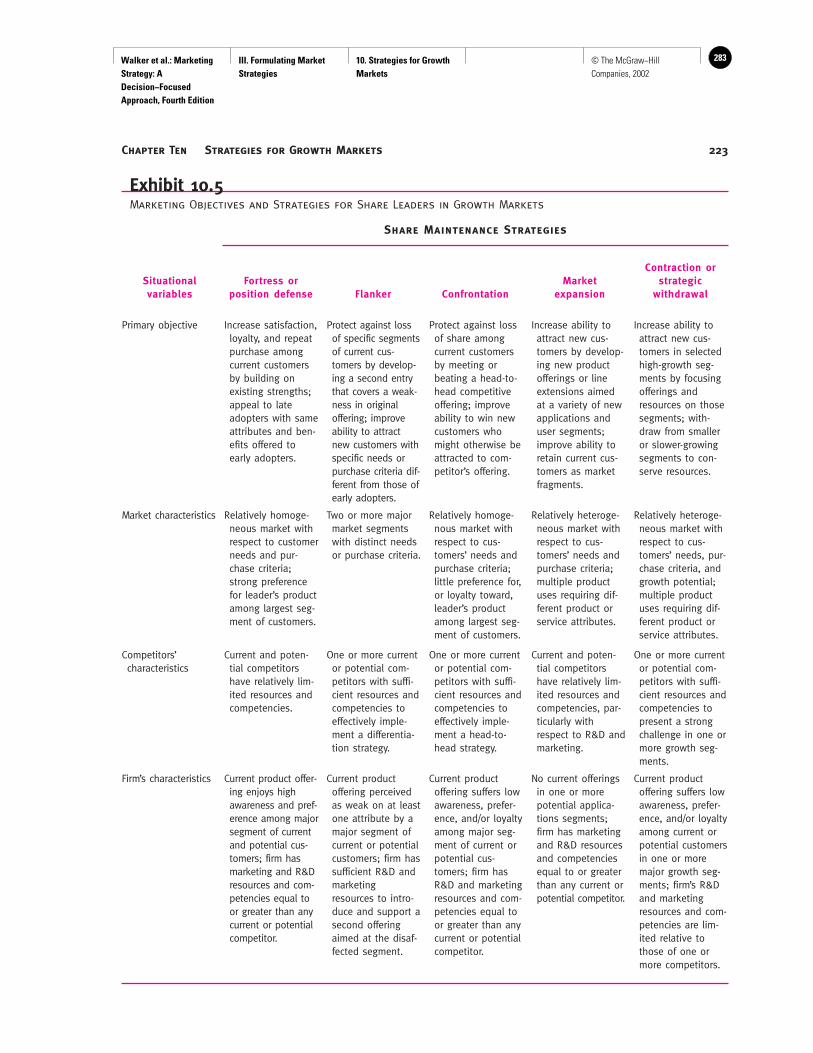
Walker et al.: Marketing Strategy: A Decision−Focused Approach, Fourth Edition
III. Formulating Market Strategies
10. Strategies for Growth Markets
283© The McGraw−Hill Companies, 2002
Chapter Ten Strategies for Growth Markets 223
Exhibit 10.5Marketing Objectives and Strategies for Share Leaders in Growth Markets
Share Maintenance Strategies
Contraction orSituational Fortress or Market strategicvariables position defense Flanker Confrontation expansion withdrawal
Primary objective
Market characteristics
Competitors’characteristics
Firm’s characteristics
Increase satisfaction,loyalty, and repeatpurchase amongcurrent customersby building onexisting strengths;appeal to lateadopters with sameattributes and ben-efits offered toearly adopters.
Relatively homoge-neous market withrespect to customerneeds and pur-chase criteria;strong preferencefor leader’s productamong largest seg-ment of customers.
Current and poten-tial competitorshave relatively lim-ited resources andcompetencies.
Current product offer-ing enjoys highawareness and pref-erence among majorsegment of currentand potential cus-tomers; firm hasmarketing and R&Dresources and com-petencies equal toor greater than anycurrent or potentialcompetitor.
Protect against lossof specific segmentsof current cus-tomers by develop-ing a second entrythat covers a weak-ness in originaloffering; improveability to attractnew customers withspecific needs orpurchase criteria dif-ferent from those ofearly adopters.
Two or more majormarket segmentswith distinct needsor purchase criteria.
One or more currentor potential com-petitors with suffi-cient resources andcompetencies toeffectively imple-ment a differentia-tion strategy.
Current productoffering perceivedas weak on at leastone attribute by amajor segment ofcurrent or potentialcustomers; firm hassufficient R&D andmarketingresources to intro-duce and support asecond offeringaimed at the disaf-fected segment.
Protect against lossof share amongcurrent customersby meeting orbeating a head-to-head competitiveoffering; improveability to win newcustomers whomight otherwise beattracted to com-petitor’s offering.
Relatively homoge-nous market withrespect to cus-tomers’ needs and purchase criteria;little preference for,or loyalty toward,leader’s productamong largest seg-ment of customers.
One or more currentor potential com-petitors with suffi-cient resources andcompetencies toeffectively imple-ment a head-to-head strategy.
Current productoffering suffers lowawareness, prefer-ence, and/or loyaltyamong major seg-ment of current orpotential cus-tomers; firm hasR&D and marketingresources and com-petencies equal toor greater than anycurrent or potentialcompetitor.
Increase ability toattract new cus-tomers by develop-ing new productofferings or lineextensions aimedat a variety of newapplications anduser segments;improve ability toretain current cus-tomers as marketfragments.
Relatively heteroge-neous market withrespect to cus-tomers’ needs andpurchase criteria;multiple productuses requiring dif-ferent product orservice attributes.
Current and poten-tial competitorshave relatively lim-ited resources andcompetencies, par-ticularly withrespect to R&D andmarketing.
No current offeringsin one or morepotential applica-tions segments;firm has marketingand R&D resourcesand competenciesequal to or greaterthan any current orpotential competitor.
Increase ability toattract new cus-tomers in selectedhigh-growth seg-ments by focusingofferings andresources on thosesegments; with-draw from smalleror slower-growingsegments to con-serve resources.
Relatively heteroge-neous market withrespect to cus-tomers’ needs, pur-chase criteria, andgrowth potential;multiple productuses requiring dif-ferent product orservice attributes.
One or more currentor potential com-petitors with suffi-cient resources andcompetencies topresent a strongchallenge in one ormore growth seg-ments.
Current productoffering suffers lowawareness, prefer-ence, and/or loyaltyamong current orpotential customersin one or moremajor growth seg-ments; firm’s R&Dand marketingresources and com-petencies are lim-ited relative tothose of one ormore competitors.

Walker et al.: Marketing Strategy: A Decision−Focused Approach, Fourth Edition
III. Formulating Market Strategies
10. Strategies for Growth Markets
284 © The McGraw−Hill Companies, 2002
Section Three Formulating Marketing Strategies224
which each strategy is most appropriate and the primary objectives for which they are best suited.
Fortress, or Position Defense, StrategyThe most basic defensive strategy is to continually strengthen a strongly held currentposition—to build an impregnable fortress capable of repelling attacks by current or future
competitors. This strategy is nearly always part of a leader’s share-maintenance efforts. By shoring up an already strong position, the firmcan improve the satisfaction of current customers while increasing theattractiveness of its offering to new customers with needs and character-istics similar to those of earlier adopters.
Strengthening the firm’s position makes particularly good sense when current andpotential customers have relatively homogeneous needs and desires and the firm’s offeringalready enjoys a high level of awareness and preference in the mass market. In somehomogeneous markets, a well-implemented position defense strategy may be all that isneeded for share maintenance.
Most of the marketing actions listed in Exhibit 10.3 as being relevant for retaining cur-rent customers might be incorporated into a position defense strategy. Anything the busi-ness can do to improve customer satisfaction and loyalty and encourage and simplifyrepeat purchasing should help the firm protect its current customer base and make its offer-ing more attractive to new customers. Some of the specific actions appropriate for accom-plishing these two objectives are discussed in more detail below.
Actions to Improve Customer Satisfaction and Loyalty The rapid expansionof output necessary to keep up with a growth market often can lead to quality controlproblems for the market leader. As new plants, equipment, and personnel are quicklybrought on line, bugs can suddenly appear in the production process. Thus, the leader mustpay particular attention to quality control during this phase. Most customers have only lim-ited, if any, positive past experiences with the new brand to offset their disappointmentwhen a purchase does not live up to expectations.
Perhaps the most obvious way a leader can strengthen its position is to continue to mod-ify and improve its product. This can reduce the opportunities for competitors to differen-tiate their products by designing in features or performance levels the leader does not offer.The leader might also try to reduce unit costs to discourage low-price competition.
The leader should take steps to improve not only the physical product but customers’perceptions of it as well. As competitors enter or prepare to enter the market, the leader’sadvertising and sales promotion emphasis should shift from stimulating primary demandto building selective demand for the company’s brand. This usually involves creatingappeals that emphasize the brand’s superior features and benefits. While the leader maycontinue sales promotion efforts aimed at stimulating trial among later adopters, some ofthose efforts might be shifted toward encouraging repeat purchases among existing cus-tomers. For instance, it might include cents-off coupons inside the package to give cus-tomers a price break on their next purchases of the brand.
For industrial goods, some salesforce efforts should shift from prospecting for newaccounts to servicing existing customers. Firms that relied on independent manufacturer’sreps to introduce their new product might consider replacing them with company sales-people to increase the customer service orientation of their sales efforts. Firms whose ownsalespeople introduced the product might reorganize their salesforces into specializedgroups focused on major industries or user segments. Or they might assign key accountrepresentatives, or cross-functional account teams, to service their largest customers.
Strategic Issue
The most basic defensive strategy is to con-tinually strengthen a strongly held currentposition.

Walker et al.: Marketing Strategy: A Decision−Focused Approach, Fourth Edition
III. Formulating Market Strategies
10. Strategies for Growth Markets
285© The McGraw−Hill Companies, 2002
Chapter Ten Strategies for Growth Markets 225
Finally, a leader can strengthen its position as the market grows by giving increasedattention to postsale service. Rapid growth in demand not only can outstrip a firm’s abil-ity to produce a high-quality product, but it also can overload the firm’s ability to servicecustomers. This can lead to a loss of existing customers as well as negative word of mouththat might inhibit the firm’s ability to attract new users. Thus, the growth phase oftenrequires increased investments to expand the firm’s parts inventory, hire and train servicepersonnel and dealers, and improve the information content on the firm’s website.
Actions to Encourage and Simplify Repeat Purchasing One of the most crit-ical actions a leader must take to ensure that customers continue buying its product is tomaximize its availability. It must reduce stockouts on retail store shelves or shorten deliv-ery times for industrial goods. To do this, the firm must invest in plant and equipment toexpand capacity in advance of demand, and it must implement adequate inventory controland logistics systems to provide a steady flow of goods through the distribution system.The firm also should continue to build its distribution channels. In some cases, a firm mighteven vertically integrate parts of its distribution system—such as building its own ware-houses, as Amazon.com and several other e-tailers have done recently—to gain better con-trol over order fulfillment activities and ensure quick and reliable deliveries.
Some market leaders, particularly in industrial goods markets, can take more proactivesteps to turn their major customers into captives and help guarantee future purchases. Forexample, a firm might negotiate requirements contracts or guaranteed price agreementswith its customers to ensure future purchases, or it might tie them into a computerizedreorder system or a tightly integrated supply-chain relationship. Such actions are all aimedat increasing customers’ repeat purchases and loyalty in order to maximize their lifetimevalue. While it makes good sense to begin building strong customer relationships rightfrom the beginning, they become even more crucial as the market matures and competi-tion to win over established customers becomes more intense. Consequently, we’ll havemore to say about building and managing customer relationships in the next chapter.
Flanker StrategyOne shortcoming of a fortress strategy is that a challenger might simply choose to bypassthe leader’s fortress and try to capture territory where the leader has not yet established astrong presence. This can represent a particular threat when the market is fragmented intomajor segments with different needs and preferences and the leader’s current brand does notmeet the needs of one or more of those segments. A competitor with sufficient resources andcompetencies can develop a differentiated product offering to appeal to the segment wherethe leader is weak and thereby capture a substantial share of the overall market.
To defend against an attack directed at a weakness in its current offering (its exposedflank), a leader might develop a second brand (a flanker or fighting brand) to competedirectly against the challenger’s offering. This might involve trading up, where the leaderdevelops a high-quality brand offered at a higher price to appeal to the prestige segment ofthe market. This was Toyota’s rationale for introducing its Lexus brand of luxury automo-biles, for instance.
More commonly, though, a flanker brand is a lower-quality product designed to appealto a low-price segment to protect the leader’s primary brand from direct price competition.Pillsbury’s premium-quality Hungry Jack brand holds the major share of the refrigeratedbiscuit dough market; however, a substantial number of consumers prefer to pay less for a somewhat lower-quality biscuit. Rather than conceding that low-price segment to com-petitors, or reducing Hungry Jack prices and margins in an attempt to attract price-sensitiveconsumers, Pillsbury introduced Ballard, a low-priced flanker brand.
www

Walker et al.: Marketing Strategy: A Decision−Focused Approach, Fourth Edition
III. Formulating Market Strategies
10. Strategies for Growth Markets
286 © The McGraw−Hill Companies, 2002
Section Three Formulating Marketing Strategies226
A flanker strategy is always used in conjunction with a position defense strategy. Theleader simultaneously strengthens its primary brand while introducing a flanker to com-pete in segments where the primary brand is vulnerable. This suggests that a flanker strat-egy is appropriate only when the firm has sufficient resources to develop and fully supporttwo or more entries. After all, a flanker is of little value if it is so lightly supported that acompetitor can easily wipe it out.
Confrontation StrategySuppose a competitor chooses to attack the leader head to head and attempts to steal cus-tomers in the leader’s main target market. If the leader has established a strong position andattained a high level of preference and loyalty among customers and the trade, it may beable to sit back and wait for the competitor to fail. In many cases, though, the leader’s brandis not strong enough to withstand a frontal assault from a well-funded, competent competi-tor. Even mighty IBM, for instance, lost 20 market-share points in the commercial PC mar-ket during the mid-1980s to competitors such as Compaq, whose machines cost about thesame but offered features or performance levels that were better, and to the clones whooffered IBM-compatible machines at much lower prices. Later, the firm’s share of the PCmarket eroded further as companies such as Dell and Gateway introduced more convenientand efficient Internet ordering and direct distribution systems and cut prices even more.
In such situations, the leader may have no choice but to confront the competitive threatdirectly. If the leader’s competitive intelligence is good, it may decide to move proactivelyand change its marketing program before a suspected competitive challenge occurs. A con-frontational strategy, though, is more commonly reactive. The leader usually decides tomeet or beat the attractive features of a competitor’s offering—by making productimprovements, increasing promotional efforts, or lowering prices—only after the chal-lenger’s success has become obvious.
Simply meeting the improved features or lower price of a challenger, however,does nothing to reestablish a sustainable competitive advantage for the leader. And aconfrontation based largely on lowering prices creates an additional problem of shrinking
margins for all concerned.9 Unless decreased prices generate substantialnew industry volume and the leader’s production costs fall with thatincreasing volume, the leader may be better off responding to pricethreats with increased promotion or product improvements while tryingto maintain its profit margins. Evidence also suggests that in product-markets with high repeat-purchase rates or a protracted diffusion process,
the leader may be wise to adopt a penetration pricing policy in the first place. This wouldstrengthen its share position and might preempt low-price competitors from entering.10
The leader can avoid the problems of a confrontation strategy by reestablishing thecompetitive advantage eroded by challengers’ frontal attacks. But this typically requiresadditional investments in process improvements aimed at reducing unit costs, improve-ments in product quality or customer service, or even the development of the next genera-tion of improved products to offer customers greater value for their dollars.
Market Expansion StrategyA market expansion strategy is a more aggressive and proactive version of the flanker strat-egy. Here the leader defends its relative market share by expanding into a number of mar-ket segments. This strategy’s primary objective is to capture a large share of new customergroups who may prefer something different from the firm’s initial offering, protecting the
www
Strategic Issue
Simply meeting the improved features orlower price of a challenger, however,does nothing to reestablish a sustainablecompetitive advantage for the leader.

Walker et al.: Marketing Strategy: A Decision−Focused Approach, Fourth Edition
III. Formulating Market Strategies
10. Strategies for Growth Markets
287© The McGraw−Hill Companies, 2002
Chapter Ten Strategies for Growth Markets 227
firm from future competitive threats from a number of directions. Such a strategy is par-ticularly appropriate in fragmented markets if the leader has the resources to undertakemultiple product development and marketing efforts.
The most obvious way a leader can implement a market expansion strategy is todevelop line extensions, new brands, or even alternative product forms utilizing similartechnologies to appeal to multiple market segments. For instance, although Pillsbury holdsa strong position in the refrigerated biscuit dough category, biscuit consumption is con-centrated among older, more traditional consumers in the South. To expand its total mar-ket, gain increased experience-curve effects, and protect its overall technological lead,Pillsbury developed a variety of other product forms that use the same refrigerated doughtechnology and production facilities but appeal to different customer segments. Theexpanded line includes crescent rolls, Danish rolls, and soft breadsticks. Similarly, Nikecaptured and has sustained a leading share of the athletic shoe market by developing aseries of line extensions offering technical, design, and style features tailored to the pref-erences of enthusiasts in nearly every sport.
A less-expensive way to appeal to a variety of customer segments is to retain the basicproduct but vary other elements of the marketing program to make it relatively more attrac-tive to specific users. Thus, a leader might create specialized salesforces to deal with theunique concerns of different user groups. Or it might offer different ancillary services todifferent types of customers or tailor sales promotion efforts to different segments. Thus,performing arts groups often promote reduced ticket prices, transportation services, andother inducements to attract senior citizens and students to matinee performances.
Contraction, or Strategic Withdrawal, StrategyIn some highly fragmented markets, a leader may be unable to defend itself adequately inall segments. This is particularly likely when newly emerging competitors have moreresources than the leader. The firm may then have to reduce or abandon its efforts in somesegments to focus on areas where it enjoys the greatest relative advantages or that have thegreatest potential for future growth. Even some very large firms may decide that certainsegments are not profitable enough to continue pursuing. For example, IBM made an earlyattempt to capture the low end of the home hobbiest market for personal computers withthe introduction of the PC Jr. But the firm eventually abandoned that effort to concentrateon the more lucrative commercial and education segments.
Share-Growth Strategies
for Followers
Marketing Objectives for FollowersNot all late entrants to a growing product-market have illusions about eventually surpassingthe leader and capturing a dominant market share. Some competitors, particularly thosewith limited resources and competencies, may simply seek to build a small but profitablebusiness within a specialized segment of the larger market that earlier entrants have over-looked, as Vans has done with great success in the skateboarder segment of the athletic shoemarket. As we have seen, this kind of niche strategy is one of the few entry options thatsmall, late entrants can pursue with a reasonable degree of success. If a firm can success-fully build a profitable business in a small segment while avoiding direct competition withlarger competitors, it often can survive the shakeout period near the end of the growth stageand remain profitable throughout the maturity stage.
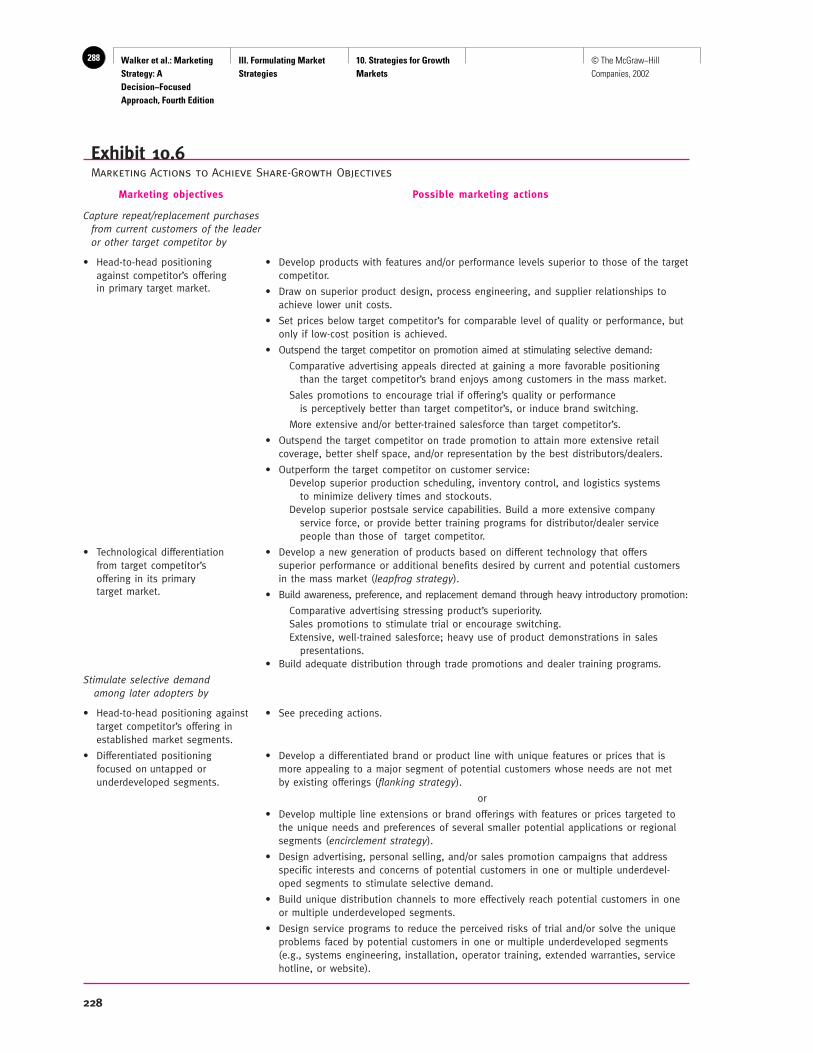
Walker et al.: Marketing Strategy: A Decision−Focused Approach, Fourth Edition
III. Formulating Market Strategies
10. Strategies for Growth Markets
288 © The McGraw−Hill Companies, 2002
Exhibit 10.6Marketing Actions to Achieve Share-Growth Objectives
Marketing objectives Possible marketing actions
Capture repeat/replacement purchases from current customers of the leader or other target competitor by
• Head-to-head positioning • Develop products with features and/or performance levels superior to those of the targetagainst competitor’s offering competitor.in primary target market. • Draw on superior product design, process engineering, and supplier relationships to
achieve lower unit costs.
• Set prices below target competitor’s for comparable level of quality or performance, butonly if low-cost position is achieved.
• Outspend the target competitor on promotion aimed at stimulating selective demand:
Comparative advertising appeals directed at gaining a more favorable positioning than the target competitor’s brand enjoys among customers in the mass market.
Sales promotions to encourage trial if offering’s quality or performance is perceptively better than target competitor’s, or induce brand switching.
More extensive and/or better-trained salesforce than target competitor’s.
• Outspend the target competitor on trade promotion to attain more extensive retail coverage, better shelf space, and/or representation by the best distributors/dealers.
• Outperform the target competitor on customer service:Develop superior production scheduling, inventory control, and logistics systems
to minimize delivery times and stockouts.Develop superior postsale service capabilities. Build a more extensive company
service force, or provide better training programs for distributor/dealer service people than those of target competitor.
• Technological differentiation • Develop a new generation of products based on different technology that offersfrom target competitor’s superior performance or additional benefits desired by current and potential customersoffering in its primary in the mass market (leapfrog strategy).target market. • Build awareness, preference, and replacement demand through heavy introductory promotion:
Comparative advertising stressing product’s superiority.Sales promotions to stimulate trial or encourage switching.Extensive, well-trained salesforce; heavy use of product demonstrations in sales
presentations.• Build adequate distribution through trade promotions and dealer training programs.
Stimulate selective demand among later adopters by
• Head-to-head positioning against • See preceding actions.target competitor’s offering in established market segments.
• Differentiated positioning • Develop a differentiated brand or product line with unique features or prices that isfocused on untapped or more appealing to a major segment of potential customers whose needs are not met underdeveloped segments. by existing offerings (flanking strategy).
or
• Develop multiple line extensions or brand offerings with features or prices targeted tothe unique needs and preferences of several smaller potential applications or regionalsegments (encirclement strategy).
• Design advertising, personal selling, and/or sales promotion campaigns that addressspecific interests and concerns of potential customers in one or multiple underdevel-oped segments to stimulate selective demand.
• Build unique distribution channels to more effectively reach potential customers in oneor multiple underdeveloped segments.
• Design service programs to reduce the perceived risks of trial and/or solve the uniqueproblems faced by potential customers in one or multiple underdeveloped segments(e.g., systems engineering, installation, operator training, extended warranties, servicehotline, or website).
228

Walker et al.: Marketing Strategy: A Decision−Focused Approach, Fourth Edition
III. Formulating Market Strategies
10. Strategies for Growth Markets
289© The McGraw−Hill Companies, 2002
Chapter Ten Strategies for Growth Markets 229
Many followers, particularly larger firms entering a product-market shortly after thepioneer, have more grandiose objectives. They often seek to displace the leader or at leastto become a powerful competitor within the total market. Thus, their major marketingobjective is to attain share growth, and the size of the increased relative share such chal-lengers seek is usually substantial. For instance, while Cisco Systems holds a dominant 80percent share of the market for the routers that direct data to the right places on the Inter-net, it was a late entrant into the market for switching systems used by telephone compa-nies to direct voice traffic. In 1999, Cisco held less than a 1 percent share of the $225billion market for telephone equipment. Nevertheless, it announced its intention to becomethe global share leader in that market.11
Marketing Actions and Strategies to Achieve Share GrowthA challenger with visions of taking over the leading share position in an industry has twobasic strategic options, each involving somewhat different marketing objectives andactions. Where the share leader and perhaps some other early followers have already pen-etrated a large portion of the potential market, a challenger may have no choice but to stealaway some of the repeat purchase or replacement demand from the competitors’ currentcustomers. As Exhibit 10.6 indicates, the challenger can attempt this through marketingactivities that give it an advantage in a head-to-head confrontation with a target competi-tor. Or it can attempt to leapfrog over the leader by developing a new generation of prod-ucts with enough benefits to induce customers to trade in their existing brand for a newone. Secondarily, such actions also may help the challenger attract a larger share of lateadopters in the mass market.
If the market is relatively early in the growth phase and no previous entrant has captured a commanding share of potential customers, the challenger can focus on attract-ing a larger share of potential new customers who enter the market for the first time. Thisalso may be a viable option when the overall market is heterogeneous and fragmented andthe current share leader has established a strong position in only one or a few segments. In either case, the primary marketing activities for increasing share via this approachshould aim at differentiating the challenger’s offering from those of existing competitorsby making it more appealing to new customers in untapped or underdeveloped marketsegments.
Once again, Exhibit 10.6’s list of possible marketing actions for challengers is notexhaustive, and it contains actions that do not always fit well together. The activities thatdo fit tend to cluster into five major strategies that a challenger might use singly or in com-bination to secure growth in its relative market share. As Exhibit 10.7 indicates, these fiveshare-growth strategies are frontal attack, leapfrog strategy, flanking attack, encirclement,and guerrilla attack. Most of these strategies are basically mirror images of the share-maintenance strategies discussed earlier.
Which, or what combination, of these five strategies is best for a particular challengerdepends on market characteristics, the existing competitors’ current positions and strengths,and the challenger’s own resources and competencies. The situations in which each strategyis likely to work best are briefly outlined in Exhibit 10.8 and discussed in the following sections.
Deciding Whom to AttackWhen more than one competitor is already established in the market, a challenger mustdecide which competitor, if any, to target. There are several options:
www

Walker et al.: Marketing Strategy: A Decision−Focused Approach, Fourth Edition
III. Formulating Market Strategies
10. Strategies for Growth Markets
290 © The McGraw−Hill Companies, 2002
Section Three Formulating Marketing Strategies230
• Attack the market-share leader within its primary target market. As we shall see, this typi-cally involves either a frontal assault or an attempt to leapfrog the leader through the devel-opment of superior technology or product design. It may seem logical to try to win customersaway from the competitor with the most customers to lose, but this can be a dangerous strat-egy unless the challenger has superior resources and competencies that can be converted intoa sustainable advantage. In some cases, however, a smaller challenger may be able to avoiddisastrous retaliation by confronting the leader only occasionally in limited geographic terri-tories through a series of guerrilla attacks.
• Attack another follower who has an established position within a major market segment. Thisalso usually involves a frontal assault, but it may be easier for the challenger to gain a sus-tainable advantage if the target competitor is not as well established as the market leader inthe minds and buying habits of customers.
• Attack one or more smaller competitors who have only limited resources. Because smallercompetitors usually hold only a small share of the total market, this may seem like an ineffi-cient way to attain substantial share increases. But by focusing on several small regionalcompetitors one at a time, a challenger can sometimes achieve major gains without invitingretaliation from stronger firms. For example, by first challenging and ultimately acquiring aseries of smaller regional manufacturers, Borden managed to capture the leading share of thefragmented domestic pasta market.
Exhibit 10.7Strategic Choices for Challengers in Growth Markets
Source: P. Kotler and R. Singh Achrol, “Marketing Warfare in the 1980’s,” Journal of Business Strategy,Winter 1981. Republished with permission-EC Media Group, Eleven Penn Plaza, New York, NY 10001.
TARGETCOMPETITOR
Encirclement strategy
CHALLENGERFrontalattack
Flanking attack
Leapfrog strategy
Guerrillaattacks
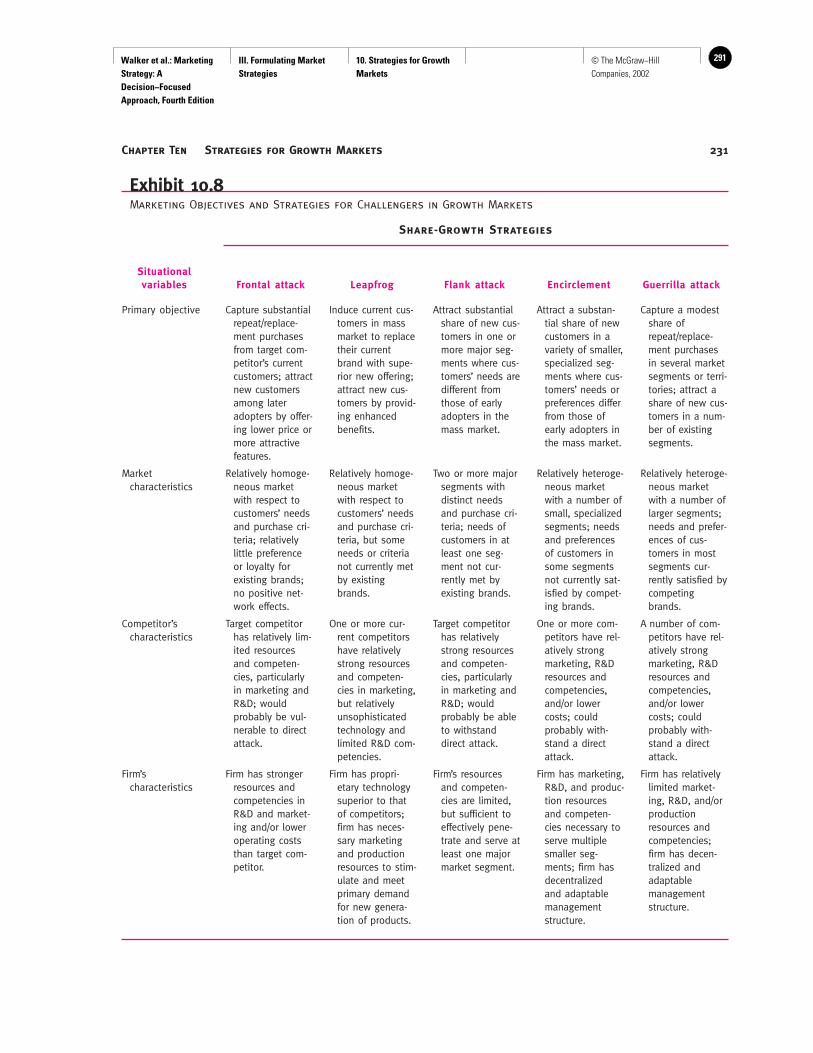
Walker et al.: Marketing Strategy: A Decision−Focused Approach, Fourth Edition
III. Formulating Market Strategies
10. Strategies for Growth Markets
291© The McGraw−Hill Companies, 2002
Chapter Ten Strategies for Growth Markets 231
Exhibit 10.8Marketing Objectives and Strategies for Challengers in Growth Markets
Share-Growth Strategies
Situational variables Frontal attack Leapfrog Flank attack Encirclement Guerrilla attack
Primary objective
Market characteristics
Competitor’s characteristics
Firm’s characteristics
Capture substantialrepeat/replace-ment purchasesfrom target com-petitor’s currentcustomers; attractnew customersamong lateradopters by offer-ing lower price ormore attractivefeatures.
Relatively homoge-neous marketwith respect tocustomers’ needsand purchase cri-teria; relativelylittle preferenceor loyalty forexisting brands;no positive net-work effects.
Target competitorhas relatively lim-ited resourcesand competen-cies, particularlyin marketing andR&D; wouldprobably be vul-nerable to directattack.
Firm has strongerresources andcompetencies inR&D and market-ing and/or loweroperating coststhan target com-petitor.
Induce current cus-tomers in massmarket to replacetheir currentbrand with supe-rior new offering;attract new cus-tomers by provid-ing enhancedbenefits.
Relatively homoge-neous marketwith respect tocustomers’ needsand purchase cri-teria, but someneeds or criterianot currently metby existingbrands.
One or more cur-rent competitorshave relativelystrong resourcesand competen-cies in marketing,but relativelyunsophisticatedtechnology andlimited R&D com-petencies.
Firm has propri-etary technologysuperior to thatof competitors;firm has neces-sary marketingand productionresources to stim-ulate and meetprimary demandfor new genera-tion of products.
Attract substantialshare of new cus-tomers in one ormore major seg-ments where cus-tomers’ needs aredifferent fromthose of earlyadopters in themass market.
Two or more majorsegments withdistinct needsand purchase cri-teria; needs ofcustomers in atleast one seg-ment not cur-rently met byexisting brands.
Target competitorhas relativelystrong resourcesand competen-cies, particularlyin marketing andR&D; wouldprobably be ableto withstanddirect attack.
Firm’s resourcesand competen-cies are limited,but sufficient toeffectively pene-trate and serve atleast one majormarket segment.
Attract a substan-tial share of newcustomers in avariety of smaller,specialized seg-ments where cus-tomers’ needs orpreferences differfrom those ofearly adopters inthe mass market.
Relatively heteroge-neous marketwith a number ofsmall, specializedsegments; needsand preferencesof customers insome segmentsnot currently sat-isfied by compet-ing brands.
One or more com-petitors have rel-atively strongmarketing, R&Dresources andcompetencies,and/or lowercosts; couldprobably with-stand a directattack.
Firm has marketing,R&D, and produc-tion resourcesand competen-cies necessary toserve multiplesmaller seg-ments; firm hasdecentralized and adaptablemanagementstructure.
Capture a modestshare ofrepeat/replace-ment purchasesin several marketsegments or terri-tories; attract ashare of new cus-tomers in a num-ber of existingsegments.
Relatively heteroge-neous marketwith a number oflarger segments;needs and prefer-ences of cus-tomers in mostsegments cur-rently satisfied bycompetingbrands.
A number of com-petitors have rel-atively strongmarketing, R&Dresources andcompetencies,and/or lowercosts; couldprobably with-stand a directattack.
Firm has relativelylimited market-ing, R&D, and/orproductionresources andcompetencies;firm has decen-tralized andadaptable managementstructure.

Walker et al.: Marketing Strategy: A Decision−Focused Approach, Fourth Edition
III. Formulating Market Strategies
10. Strategies for Growth Markets
292 © The McGraw−Hill Companies, 2002
Section Three Formulating Marketing Strategies232
• Avoid direct attacks on any established competitor. In fragmented markets in which the leaderor other major competitors are not currently satisfying one or more segments, a challenger isoften best advised to “hit ’em where they ain’t.” This usually involves either a flanking or anencirclement strategy, with the challenger developing differentiated product offerings tar-geted at one large or several smaller segments in which no competitor currently holds astrong position. Thus, Vans has profited in the athletic shoe market by focusing on smallalternative sports whose adherents do not find the “mainstream” image of Nike and othermajor brands very appealing.
Deciding which competitor to attack necessitates a comparison of relative strengths andweaknesses, a critical first step in developing an effective share-growth strategy. It also canhelp limit the scope of the battlefield, a particularly important consideration for chal-lengers with limited resources.
Frontal Attack StrategyWhere the market for a product category is relatively homogeneous, with few untappedsegments and at least one well-established competitor, a follower wanting to capture anincreased market share may have little choice but to tackle a major competitor head-on.Such an approach is most likely to succeed when most existing customers do not havestrong brand preferences or loyalties, the target competitor’s product does not benefitfrom positive network effects, and the challenger’s resources and competencies—particu-larly in marketing—are greater than the target competitor’s. But even superior resourcesare no guarantee of success if the challenger’s assault merely imitates the target competi-tor’s offering.
To successfully implement a frontal attack, a challenger should seek one or more waysto achieve a sustainable advantage over the target competitor. As discussed earlier, such anadvantage is usually based on attaining lower costs or a differentiated position in the mar-ket. If the challenger has a cost advantage, it can cut prices to lure away the target com-petitor’s customers, or it can maintain a similar price but engage in more extensivepromotion.
Challenging a leader solely on the basis of low price is a highway to disaster, however,unless the challenger really does have a sustainable cost advantage. Otherwise, the leadermight simply match the lower prices until the challenger is driven from the market. The prob-lem is that initially a challenger is often at a cost disadvantage because of the experience-curve effects established competitors have accumulated. The challenger must have offsettingadvantages such as superior production technology, established relations with low-cost sup-pliers, the ability to share production facilities or marketing efforts across multiple SBUs, orother sources of synergy before a low-price assault makes sense.
A similar caveat applies to frontal assaults based solely on heftier promotional budgets.Unless the target competitor’s resources are substantially more limited than the chal-lenger’s, it can retaliate against any attempt to win away customers through more exten-sive advertising or attractive sales and trade promotions.
One possible exception to this limitation of greater promotional effort is the use ofa more extensive and better-trained salesforce to gain a competitive advantage. A knowl-edgeable salesperson’s technical advice and problem-solving abilities can give addi-tional value to a firm’s product offering, particularly in newly developing high-techindustries.
In general, the best way for a challenger to effectively implement a frontal attack is to dif-ferentiate its product or associated services in ways that better meet the needs and prefer-ences of many customers in the mass market. If the challenger can support those meaningful

Walker et al.: Marketing Strategy: A Decision−Focused Approach, Fourth Edition
III. Formulating Market Strategies
10. Strategies for Growth Markets
293© The McGraw−Hill Companies, 2002
Chapter Ten Strategies for Growth Markets 233
product differences with strong promotion or an attractive price, so much the better, but usu-ally the unique features or services offered are the foundation for a sustainable advantage.For example, Dell has been successful as a follower in the PC market by offering both supe-rior customer service and low prices. Customers can design their own computers on the com-pany’s website, get exactly the features they want, and have the equipment delivered to theirdoors in two or three days. Such excellent service is possible, in large part, due to the closecoordination between Dell and its suppliers, coordination that minimizes inventories of partsand finished computers, thereby lowering costs and prices, and maximizes manufacturingflexibility and delivery speed. Dell’s competitive advantage has proven to be sustainable, too,because its alliances with suppliers took years to develop and are hard for its competitors tomatch.
Variables that might limit the competitor’s willingness or ability to retaliate can alsoimprove the chances for successful frontal attack. For instance, a target competitor with areputation for high product quality may be loath to cut prices in response to a lower-pricedchallenger for fear of cheapening its brand’s image. And a competitor pursuing high ROIor cash flow objectives may be reluctant to increase its promotion or R&D expenditures inthe short run to fend off an attack.12
Leapfrog StrategyA challenger stands the best chance of attracting repeat or replacement purchases from acompetitor’s current customers when it can offer a product that is attractively differentiatedfrom the competitor’s offerings. The odds of success might be even greater if the challengercan offer a far superior product based on advanced technology or a more sophisticateddesign. This is the essence of a leapfrog strategy. It is an attempt to gain a significant advan-tage over the existing competition by introducing a new generation of products that signif-icantly outperform or offer more desirable customer benefits than do existing brands. Forexample, the introduction of reasonably priced video cameras by Sony and other Japaneseelectronics manufacturers largely took over the market for home movie equipment and alarge share of the market for Polaroid’s self-developing photography equipment as well.And now digital cameras are doing the same thing to the video market.
In addition, such a strategy often inhibits quick retaliation by established competitors.Firms that have achieved some success with one technology—or that have committed sub-stantial resources to plant and equipment dedicated to a current product—often are reluc-tant to switch to a new one because of the large investments involved or a fear of disruptingcurrent customers.
A leapfrog strategy is not viable for all challengers. To be successful, the challengermust have technology superior to that of established competitors as well as the product andprocess engineering capabilities to turn that technology into an appealing product. Also,the challenger must have the marketing resources to effectively promote its new productsand convince customers already committed to an earlier technology that the new productoffers sufficient benefits to justify the costs of switching.
Flanking and Encirclement StrategiesThe military historian B. H. Liddell-Hart, after analyzing battles rangingfrom the Greek Wars to World War I, determined that only 6 out of 280victories were the result of a frontal attack.13 He concluded that it is usu-ally wiser to avoid attacking an established adversary’s point of strengthand to focus instead on an area of weakness in his defenses. This is the
www
Strategic Issue
It is usually wiser to avoid attacking anestablished adversary’s point of strength andto focus instead on an area of weakness inhis defenses.
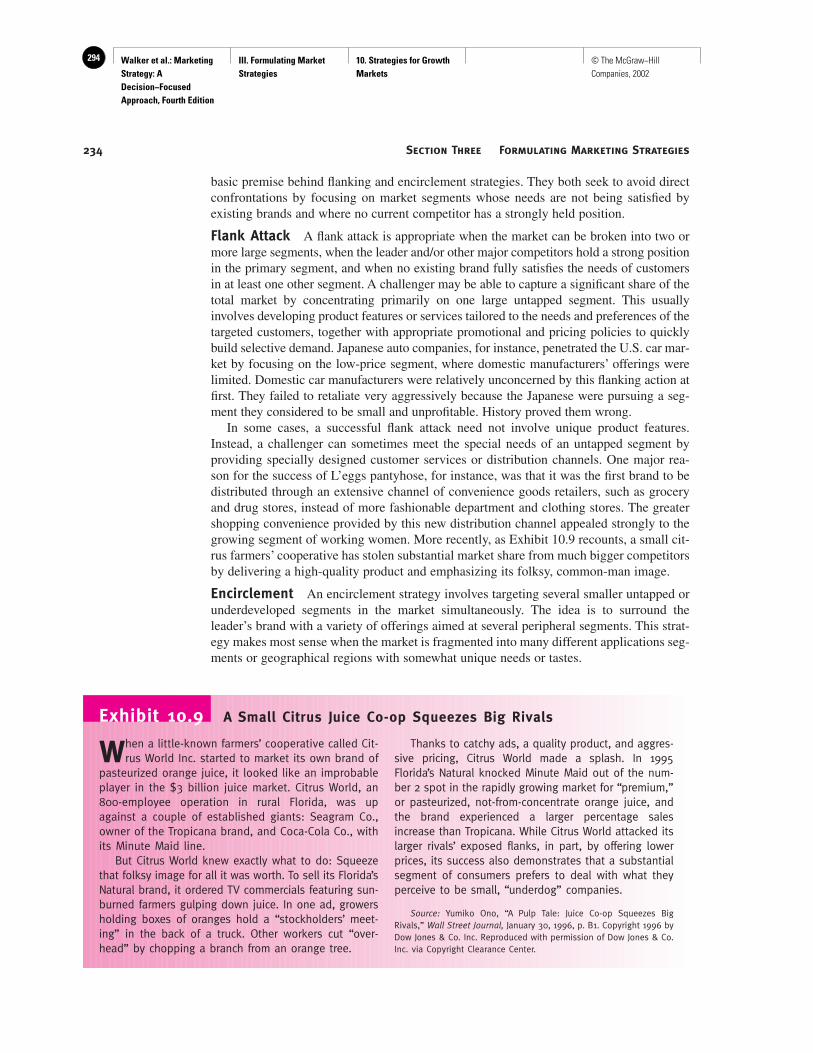
Walker et al.: Marketing Strategy: A Decision−Focused Approach, Fourth Edition
III. Formulating Market Strategies
10. Strategies for Growth Markets
294 © The McGraw−Hill Companies, 2002
Section Three Formulating Marketing Strategies234
basic premise behind flanking and encirclement strategies. They both seek to avoid directconfrontations by focusing on market segments whose needs are not being satisfied byexisting brands and where no current competitor has a strongly held position.
Flank Attack A flank attack is appropriate when the market can be broken into two ormore large segments, when the leader and/or other major competitors hold a strong positionin the primary segment, and when no existing brand fully satisfies the needs of customersin at least one other segment. A challenger may be able to capture a significant share of thetotal market by concentrating primarily on one large untapped segment. This usuallyinvolves developing product features or services tailored to the needs and preferences of thetargeted customers, together with appropriate promotional and pricing policies to quicklybuild selective demand. Japanese auto companies, for instance, penetrated the U.S. car mar-ket by focusing on the low-price segment, where domestic manufacturers’ offerings werelimited. Domestic car manufacturers were relatively unconcerned by this flanking action atfirst. They failed to retaliate very aggressively because the Japanese were pursuing a seg-ment they considered to be small and unprofitable. History proved them wrong.
In some cases, a successful flank attack need not involve unique product features.Instead, a challenger can sometimes meet the special needs of an untapped segment byproviding specially designed customer services or distribution channels. One major rea-son for the success of L’eggs pantyhose, for instance, was that it was the first brand to bedistributed through an extensive channel of convenience goods retailers, such as groceryand drug stores, instead of more fashionable department and clothing stores. The greatershopping convenience provided by this new distribution channel appealed strongly to thegrowing segment of working women. More recently, as Exhibit 10.9 recounts, a small cit-rus farmers’ cooperative has stolen substantial market share from much bigger competitorsby delivering a high-quality product and emphasizing its folksy, common-man image.
Encirclement An encirclement strategy involves targeting several smaller untapped orunderdeveloped segments in the market simultaneously. The idea is to surround theleader’s brand with a variety of offerings aimed at several peripheral segments. This strat-egy makes most sense when the market is fragmented into many different applications seg-ments or geographical regions with somewhat unique needs or tastes.
When a little-known farmers’ cooperative called Cit-rus World Inc. started to market its own brand of
pasteurized orange juice, it looked like an improbableplayer in the $3 billion juice market. Citrus World, an800-employee operation in rural Florida, was upagainst a couple of established giants: Seagram Co.,owner of the Tropicana brand, and Coca-Cola Co., withits Minute Maid line.
But Citrus World knew exactly what to do: Squeezethat folksy image for all it was worth. To sell its Florida’sNatural brand, it ordered TV commercials featuring sun-burned farmers gulping down juice. In one ad, growersholding boxes of oranges hold a “stockholders’ meet-ing” in the back of a truck. Other workers cut “over-head” by chopping a branch from an orange tree.
Thanks to catchy ads, a quality product, and aggres-sive pricing, Citrus World made a splash. In 1995Florida’s Natural knocked Minute Maid out of the num-ber 2 spot in the rapidly growing market for “premium,”or pasteurized, not-from-concentrate orange juice, andthe brand experienced a larger percentage salesincrease than Tropicana. While Citrus World attacked itslarger rivals’ exposed flanks, in part, by offering lowerprices, its success also demonstrates that a substantialsegment of consumers prefers to deal with what theyperceive to be small, “underdog” companies.
Source: Yumiko Ono, “A Pulp Tale: Juice Co-op Squeezes BigRivals,” Wall Street Journal, January 30, 1996, p. B1. Copyright 1996 byDow Jones & Co. Inc. Reproduced with permission of Dow Jones & Co.Inc. via Copyright Clearance Center.
Exhibit 10.9 A Small Citrus Juice Co-op Squeezes Big Rivals

Walker et al.: Marketing Strategy: A Decision−Focused Approach, Fourth Edition
III. Formulating Market Strategies
10. Strategies for Growth Markets
295© The McGraw−Hill Companies, 2002
Chapter Ten Strategies for Growth Markets 235
Once again, this strategy usually involves developing a varied line of products with fea-tures tailored to the needs of different segments. Rather than try to compete with Coke andPepsi in the soft drink market, for example, Cadbury-Schweppes offers a wide variety offlavors such as cream soda, root beer, and ginger ale—almost anything but cola—to appealto small groups of customers with unique tastes. Similarly, Vans is trying to expand itsfoothold in the athletic shoe industry by targeting several niche segments of enthusiasts inother alternative sports—such as snowboarding—where the brand’s youthful “outsider”image might be appealing and where the firm’s larger competitors are not well established.
Guerrilla AttackWhen well-established competitors already cover all major segments of the market and thechallenger’s resources are relatively limited, flanking, encirclement, or all-out frontalattacks may be impossible. In such cases, the challenger may be reduced to making a seriesof surprise raids against its more established competitors. To avoid massive retaliation, thechallenger should use guerrilla attacks sporadically, perhaps in limited geographic areaswhere the target competitor is not particularly well entrenched.
A challenger can choose from a variety of means for carrying out guerrilla attacks.These include sales promotion efforts (e.g., coupon drops and merchandising deals), localadvertising blitzes, and even legal action. Short-term price reductions through sales pro-motion campaigns are a particularly favored guerrilla tactic in consumer goods markets.They can target specific customer groups in limited geographic areas; they can be imple-mented quickly; and they are often difficult for a larger competitor to respond to becausethat firm’s higher share level means that a given discount will cost it more in absolute dol-lars. For similar reasons, carefully targeted direct mail or Internet marketing campaignsalso can be an effective guerrilla tactic, as illustrated by the dial-around companiesdescribed in Exhibit 10.10.
In the 1990s, kitchen phones across the United Statessprouted little stickers with official-looking five-digit
codes and slogans like “Dial & Save.” They were evi-dence of a sneakily successful marketing campaignthat took a $900 million bite out of AT&T and its majorlong-distance rivals. The stickers arrived in direct mailpromotions by resellers of phone service known asdial-around companies. A customer could punch in thefive-digit code when making a long-distance call andsave from 10 to 50 percent over the undiscountedrates of the major long-distance companies.
Dial-around companies were mostly small, privatelyheld firms that bought long-distance capacity in bulkfrom telephone giants and resold it at cut rates, rout-ing calls through the switching equipment of othercompanies or their own. Their services were marketedunder a variety of different brand names and pro-moted largely through direct mail campaigns. The mail-ings were usually targeted at customers whom AT&T
and its rivals tended to neglect, such as older people.These consumers were often bargain hunters, yet typ-ically they didn’t use the phone enough to qualify formost long-distance savings plans.
How did dial-arounds gain so much ground withoutprovoking a counterattack from AT&T? First, they focusedon customers that the bigger firms did not deem veryimportant or profitable. Second, many small companieswere involved so it was hard for AT&T to retaliateagainst them individually. But as the volume of businessof the dial-around companies continued to increase, thefirm was eventually forced to react against them as agroup. The firm instituted its One Rate plan, promisingresidential customers calls anywhere, anytime for 15cents a minute.
Source: Henry Goldblatt, “The Guerrilla Attack on AT&T,” Fortune,November 25, 1996, pp. 126–27.
Exhibit 10.10 The Guerrilla Attack on AT&T

Walker et al.: Marketing Strategy: A Decision−Focused Approach, Fourth Edition
III. Formulating Market Strategies
10. Strategies for Growth Markets
296 © The McGraw−Hill Companies, 2002
Section Three Formulating Marketing Strategies236
In some cases the ultimate objective of a series of guerrilla attacks is not so much forthe challenger to build its own share as it is to prevent a powerful leader from furtherexpanding its share or engaging in aggressive actions to which it would be costly for thefollowers to respond. Lawsuits brought against the leader by several smaller competitorsover a range of activities can effectively slow down the leader’s expansionist tendencies bydiverting some of its resources and attention.
Supporting EvidenceSeveral studies conducted with the PIMS database provide empirical support for many of themanagerial prescriptions we have discussed.14 These studies compare businesses that achievedhigh market shares during the growth stage of the product life cycle, or that increased theirmarket shares over time, with low-share businesses. As shown in Exhibit 10.11, the market-ing programs and activities of businesses that successfully achieved increased market sharediffered from their less-successful counterparts in the following ways:
• Businesses that increased the quality of their products relative to those of competitors achievedgreater share increases than businesses whose product quality remained constant or declined.
• Share-gaining businesses typically developed and added more new products, line extensions,or product modifications to their line than share-losing businesses.
• Share-gaining businesses tended to increase their marketing expenditures faster than therate of market growth. Increases in both salesforce and sales promotion expenditures wereeffective for producing share gains in both consumer and industrial goods businesses.Increased advertising expenditures were effective for producing share gains primarily in con-sumer goods businesses.
• Surprisingly, there was little difference in the relative prices charged between firms thatgained and those that lost market share.
These findings are consistent with many of our earlier observations. For instance, theyunderline the folly of launching a frontal attack solely on the basis of lower price. Unless
Exhibit 10.11Strategic Changes Made by Challengers That Gained versus Lost Market Share
Strategic changes Share-gaining challengers Share-losing challengers
Relative product quality scores +1.8 –0.6
New products as a percent of sales +0.1 –0.5
Relative price +0.3 +0.2
Marketing expenditures (adjusted for market growth):
Salesforce +9.0% –8.0%
Advertising:
Consumer products +13.0% –9.0%
Industrial products –1.0 –14.0
Promotion:
Consumer products +13.0% –5.0%
Industrial products +7.0 –10.0
Source: Adapted with the permission of The Free Press, a Division of Simon & Schuster, Inc., from ThePIMS Principles: Linking Strategy to Performance by Robert D. Buzzell and Bradley T. Gale. Copyright© 1987 by The Free Press.

Walker et al.: Marketing Strategy: A Decision−Focused Approach, Fourth Edition
III. Formulating Market Strategies
10. Strategies for Growth Markets
297© The McGraw−Hill Companies, 2002
Chapter Ten Strategies for Growth Markets 237
the challenger has substantially lower unit costs or the leader is inhibited from cutting itsown prices for some reason, the challenger’s price cuts are likely to be retaliated againstand will generate few new customers. On the other hand, frontal, leapfrog, flanking, orencirclement attacks based on product improvements tailored to specific segments aremore likely to succeed, particularly when the challenger supports those attacks with sub-stantial promotional efforts.
Regardless of the strategies pursued by market leaders and challengers during a product-market’s growth stage, the competitive situation often changes as the market matures andits growth rate slows. In the next chapter, we examine the environmental changes that occuras a market matures and the marketing strategies that firms might use to adapt to thosechanges.
Take Aways
• If the market leader wants to maintain its number-oneshare position as the product category moves throughrapid growth, it must focus on two important objec-tives: (1) retaining its current customers and (2) stimu-lating selective demand among later adopters.
• Marketing strategies a leader might adopt to defend itsrelative share as the product category grows include posi-tion defense, flanker, confrontation, market expansion,and contraction. The best one to choose depends on thehomogeneity of the market and the firm’s resources andcompetencies relative to potential competitors.
• For a challenger to increase its market share relative tothe established leader, it must differentiate its offering
by delivering superior product benefits, better service,or a lower price. Challenging the leader solely on thebasis of price, however, is a good way to start a pricewar and can be a highway to disaster unless the chal-lenger has a sustainable cost advantage.
• Smaller challengers often try to avoid direct confronta-tions with the share leader by pursuing flanker, encir-clement, or guerrilla attack strategies that focus onmarket segments where the leader is not well established.
• Self-diagnostic questions to test your ability to applythe concepts in this chapter to marketing decisionmaking may be found at this book’s website atwww.mhhe.com/walker.
Endnotes
1. Information to prepare this opening case was taken from the Nike, Inc., websiteat www.nikebiz.com/story/chrono.shtml, www.nikebiz.com/story/b_knight.shtml,and www.nikebiz.com/story/n_bowerman.shtml; and Arlen Weintraub and GerryKhermouch, “Chairman of the Board,” Business Week, May 28, 2001, p. 96.
2. Neil Gross, Peter Coy, and Otis Port, “The Technology Paradox,” BusinessWeek, March 6, 1995, pp. 76–84.
3. For a more extensive discussion of the potential opportunities and pitfallsof rapidly growing markets, see David A. Aaker and George S. Day, “The Per-ils of High-Growth Markets,” Strategic Management Journal 7 (1986), pp.409–21; and Myron Magnet, “Let’s Go for Growth,” Fortune, March 7, 1994,pp. 60–72.
4. Gregory S. Carpenter and Kent Nakamoto, “Consumer Preference Forma-tion and Pioneering Advantage,” Journal of Marketing Research, August1989, pp. 285–98.
5. Andrew Park and Peter Burrows, “Dell, the Conqueror,” Business Week,September 24, 2001, pp. 92–102.
6. In some rapidly evolving high-tech markets, price premiums can disappearvery quickly, as pointed out in Gross, Coy, and Port, “Technology Paradox.”
7. Robert D. Buzzell and Bradley T. Gale, The PIMS Principles: LinkingStrategy to Performance (New York: Free Press, 1987), pp. 188–90.
8. For a detailed discussion of these strategies in a military context, see Carlvon Clausewitz, On War (London: Routledge and Kegan Paul, 1908); and
B. H. Liddell-Hart, Strategy (New York: Praeger, 1967). For a related discus-sion of the application of such strategies in a business setting, see PhilipKotler and Ravi Singh Achrol, “Marketing Warfare in the 1980’s,” Journal ofBusiness Strategy, Winter 1981, pp. 30–41.
9. Thomas T. Nagle, “Managing Price Competition,” Marketing Management2 (Spring 1993), pp. 36–45; and Akshay R. Rao, Mark E. Bergen, and ScottDavis, “How to Fight a Price War,” Harvard Business Review, March–April2000, pp. 107–16.
10. Robert J. Dolan and Abel P. Jewland, “Experience Curves and DynamicDemand Models: Implications for Optimal Pricing Strategy,” Journal of Mar-keting, Winter 1981, p. 52.
11. Andy Reinhardt, “Meet Mr. Internet,” Business Week, September 13,1999, pp. 128–40.
12. For a more extensive discussion of factors that can limit a leader’s will-ingness or ability to retaliate against a direct attack, see Michael E. Porter,Competitive Advantage (New York: Free Press, 1985), chap. 15.
13. Liddell-Hart, Strategy, p. 163.
14. Robert D. Buzzell and Frederick D. Wiersema, “Successful Share-BuildingStrategies,” Harvard Business Review, January–February 1981, pp. 135–43;Carl R. Anderson and Carl P. Zeithaml, “Stages in the Product Life Cycle, Busi-ness Strategy, and Business Performance,” Academy of Management Journal,March 1984, pp. 5–25; and Buzzell and Gale, The PIMS Principles, chap. 9.

Walker et al.: Marketing Strategy: A Decision−Focused Approach, Fourth Edition
III. Formulating Market Strategies
11. Strategies for Mature and Declining Markets
298 © The McGraw−Hill Companies, 2002
238
Chapter Eleven
STRATEGIES FOR MATURE
AND DECLINING MARKETS
Johnson Controls: Making Money in Mature Markets1
At first glance, Johnson Controls Inc. inGlendale, Wisconsin, appears to be the epit-ome of a staid, slow-growing, “old-economy”
company. After all, the firm’s success and futuresurvival depend on several product and service cat-egories that have not experienced very muchgrowth in the domestic market in recent years.Johnson’s major businesses include batteries, seats,and other internal components for automobiles;heating and cooling equipment for large commercialbuildings and schools; and facilities managementservices.
But first glances can be deceiving. The firm’smanagers have developed a four-pronged strategyfor making money in such mature markets. First,Johnson has acquired a number of weaker com-petitors in each of its product categories over theyears in order to gain market share and removeexcess capacity. Second, the firm has expandedsales volume by moving aggressively into globalmarkets. The firm now operates in 500 differentlocations around the world.
Most important, the firm has nurtured close rela-tionships with established customers such as Gen-eral Motors, Ford, Daimler-Chrysler, BMW, andToyota. Those relationships, in turn, have enabledJohnson to maintain solid profit margins by improv-
ing customer retention and gaining operating effi-ciencies via logistical alliances, just-in-time deliverysystems, and other process improvements. Finally,the firm’s close customer relationships have pro-vided it with market intelligence and facilitated jointdevelopment projects, both of which have helpedthe firm gain additional revenue from the introduc-tion of new product and service offerings targetedat those customers.
A strong balance sheet and a long-term per-spective have helped Johnson build market share—and expand into foreign countries—through theacquisition of competitors. In some cases, the firmhas snapped up firms with product or service offer-ings that complement and extend Johnson’s ownproduct line in one of its established target mar-kets. For instance, the firm spent $167 million toacquire Pan Am’s World Services division, a facilitymanagement operation that does everything frommow the lawn to run the cafeteria. That acquisition,when combined with Johnson’s existing heatingand cooling systems business and some new prod-ucts and services developed internally, turned thecompany into a full-service facilities operator. John-son can now manage a client’s entire buildingwhile offering highly customized heating and cool-ing systems and controls that minimize energy use.

Walker et al.: Marketing Strategy: A Decision−Focused Approach, Fourth Edition
III. Formulating Market Strategies
11. Strategies for Mature and Declining Markets
299© The McGraw−Hill Companies, 2002
239
This combination of customized products and fullservice has both expanded the company’s share ofthe commercial real estate market and enabled itto maintain relatively high margins in a highly com-petitive business.
In other businesses, Johnson has combined theeconomies of scale generated through savvy acqui-sitions with the knowledge gained from close cus-tomer relationships to both develop new productsand drive down operating costs. For example, John-son has become the leading worldwide supplier ofautomotive seating and interior systems, such asfloor consoles and instrument panels, by assistingmanufacturers with the design and development,as well as the manufacture, of such components.As one engineer at Daimler-Chrysler pointed out,“Johnson is able to completely integrate thedesign, development, and manufacture of [our]seats,” and do it for less than the auto companies
could. And by closely coordinating inventories andproduction schedules, Johnson has reduced costseven further for both its customers and itself. Forinstance, by locating its plants close to a cus-tomer’s production facility, Johnson is able toassemble seats to order, load them on a truck in asequence that matches the cars coming down theassembly line, and deliver them to the customer allin as little as 90 minutes.
Despite the maturity of its markets, Johnson’sstrategy is paying off, in terms of both revenuegrowth and profits. In recent years the firm hasaveraged nearly 30 percent annual growth, withsales increasing from about $10 billion in 1996 tomore than $17 billion in 2000. At the same time, thefirm has increased dividends paid to shareholdersfor 25 straight years, and in 2000 it earned a 20percent return on shareholder equity.
Strategic Challenges Addressed
in Chapter 11
Many managers, particularly those in marketing, seem obsessed with growth. Their objec-tives tend to emphasize annual increases in sales volume, market share, or both. But thebiggest challenge for many managers in developed nations in future years will be makingmoney in markets that grow slowly, if at all. The majority of product-markets in thosenations are in the mature or decline stages of their life cycles. And as accelerating rates oftechnological and social change continue to shorten such life cycles, today’s innovationswill move from growth to maturity—and ultimately to decline—ever faster.
A period of competitive turbulence almost always accompanies the transition from mar-ket growth to maturity in an industry. This period often begins after approximately half thepotential customers have adopted the product and the rate of sales growth starts to decline.As the growth rate slows, many competitors tend to overestimate future sales volume andconsequently end up developing too much production capacity. Competition becomesmore intense as firms battle to increase sales volume to cover their high fixed costs andmaintain profitability. As a result, such transition periods are commonly accompanied bya shakeout during which weaker businesses fail, withdraw from the industry, or areacquired by other firms, as has happened to some of Johnson Controls’ competitors in theUnited States and European automotive seat and battery industries. In the next section ofthis chapter we examine some strategic traps that can threaten a firm’s survival during anindustry shakeout.

Walker et al.: Marketing Strategy: A Decision−Focused Approach, Fourth Edition
III. Formulating Market Strategies
11. Strategies for Mature and Declining Markets
300 © The McGraw−Hill Companies, 2002
Section Three Formulating Marketing Strategies240
Challenges in Mature MarketsBusinesses that survive the shakeout face new challenges as marketgrowth stagnates. As a market matures, total volume stabilizes; replace-ment purchases rather than first-time buyers account for the vast major-ity of that volume. A primary marketing objective of all competitors inmature markets, therefore, is simply to hold their existing customers—
to sustain a meaningful competitive advantage that will help ensure the continued satis-faction and loyalty of those customers. Thus, a product’s financial success during themature life cycle stage depends heavily on the firm’s ability to achieve and sustain a lowerdelivered cost or some perceived product quality or customer-service superiority.
Some firms tend to passively defend mature products while using the bulk of the rev-enues produced by those items to develop and aggressively market new products withmore growth potential. This can be shortsighted, however. All segments of a market andall brands in an industry do not necessarily reach maturity at the same time. Aging brandssuch as Jell-O, Johnson’s baby shampoo, and Arm & Hammer baking soda experiencedsales revivals in recent years because of creative marketing strategies. Thus, a share leaderin a mature industry might build on a cost or product differentiation advantage and pursuea marketing strategy aimed at increasing volume by promoting new uses for an old prod-uct or by encouraging current customers to buy and use the product more often. Therefore,in this chapter we examine basic business strategies necessary for survival in mature mar-kets and marketing strategies a firm might use to extend a brand’s sales and profits, includ-ing the strategies that have been so successful for Johnson Controls.
Challenges in Declining MarketsEventually, technological advances; changing customer demographics, tastes, or lifestyles;and development of substitutes result in declining demand for most product forms andbrands. As a product starts to decline, managers face the critical question of whether to divestor liquidate the business. Unfortunately, firms sometimes support dying products too long atthe expense of current profitability and the aggressive pursuit of future breadwinners.
An appropriate marketing strategy, however, can produce substantial sales and profitseven in a declining market. If few exit barriers exist, an industry leader might attempt toincrease market share via aggressive pricing or promotion policies aimed at driving outweaker competitors. Or it might try to consolidate the industry, as Johnson Controls hasdone in its automotive components businesses, by acquiring weaker brands and reducingoverhead by eliminating both excess capacity and duplicate marketing programs. Alterna-tively, a firm might decide to harvest a mature product by maximizing cash flow and profitover the product’s remaining life. The last section of this chapter examines specific mar-keting strategies for gaining the greatest possible returns from products approaching theend of their life cycle.
Shakeout: The Transition from
Market Growth to Maturity
Characteristics of the Transition PeriodThe transition from market growth to maturity typically begins when the market is still grow-ing but the rate of growth starts to decline. This slackening of the growth rate either sparksor occurs simultaneously with other changes in the market and competitive environment. As
Strategic Issue
A primary marketing objective of all com-petitors in mature markets, therefore, issimply to hold their existing customers.

Walker et al.: Marketing Strategy: A Decision−Focused Approach, Fourth Edition
III. Formulating Market Strategies
11. Strategies for Mature and Declining Markets
301© The McGraw−Hill Companies, 2002
Chapter Eleven Strategies for Mature and Declining Markets 241
mentioned earlier, such changes typically include the appearance of excess capacity,increased difficulty of maintaining product differentiation, increased intensity of competi-tion, and growing pressures on costs and profits. Consequently, weaker members of theindustry often fail or are acquired by larger competitors during this shakeout stage.
Strategic Traps during the TransitionA business’s ability to survive the transition from market growth to maturity depends to agreat extent on whether it can avoid some common strategic traps.2 Four such traps aresummarized in Exhibit 11.1.
The most obvious trap is simply the failure to recognize the events signaling the begin-ning of the shakeout period. The best way to minimize the impact of slowing growth is toaccurately forecast the slowdown in sales and hold the firm’s production capacity to a sus-tainable level. For both industrial and consumer durable goods markets, models can fore-cast when replacement sales will begin to outweigh first-time purchases, a common signalthat a market is beginning to mature.3 But in consumer nondurable markets—particularlythose where growth slows because of shifting consumer preferences or the emergence ofsubstitute products—the start of the transition period can be nearly impossible to predict.
A second strategic trap is for a business to get caught in the middle during the transi-tion period without a clear strategic advantage. A business may survive and prosper dur-ing the growth stage even though it has neither differentiated its offering from competitorsnor attained the lowest-cost position in its industry. But during the transition period, suchis not the case.
A third trap is the failure to recognize the declining importance of product differentia-tion and the increasing importance of price or service. Businesses that have built their
Exhibit 11.1Common Strategic Traps Firms Can Fall into during the Shakeout Period
1. Failure to anticipate transition from growth to maturity.
• Firms may make overly optimistic forecasts of future sales volume.
• As a result, they expand too rapidly and production capacity overshoots demand as growth slows.
• Their excess capacity leads to higher costs per unit.
• Consequently, they must cut prices or increase promotion in an attempt to increase their volume.
2. No clear competitive advantage as growth slows.
• Many firms can succeed without a strong competitive advantage during periods of rapid growth.
• However, firms that do not have the lowest costs or a superior offering in terms of product quality or service can havedifficulty sustaining their market share and volume as growth slows and competition intensifies.
3. Assumption that an early advantage will insulate the firm from price or service competition.
• In many cases, technological differentials become smaller as more competitors enter and initiate product improvements asan industry approaches maturity.
• If customers perceive that the quality of competing brands has become more equal, they are likely to attach greaterimportance to price or service differences.
• Failure to detect such trends can cause an early leader to be complacent and slow to respond to competitive threats.
4. Sacrificing market share in favor of short-run profit.
• A firm may cut marketing or R&D budgets or forgo other expenditures in order to maintain its historical level ofprofitability even though industry profits tend to fall during the transition period.
• This can cause long-run erosion of market share and further increases in unit costs as the industry matures.

Walker et al.: Marketing Strategy: A Decision−Focused Approach, Fourth Edition
III. Formulating Market Strategies
11. Strategies for Mature and Declining Markets
302 © The McGraw−Hill Companies, 2002
Section Three Formulating Marketing Strategies242
success on technological superiority or other forms of product differentiation often disdainaggressive pricing or marketing practices even though such differentiation typically erodesas markets mature.4 As a result, such firms may delay meeting their more aggressive com-petitors head-on and end up losing market share, as Hewlett-Packard and Compaq bothdiscovered in the wake of Dell’s aggressive pricing policies as the personal computer mar-ket slumped in 2000.
Why should a firm not put off responding to the more aggressive pricing or marketingactions of its competitors? Because doing so may lead to a fourth trap—giving up marketshare too easily in favor of short-run profit. Many businesses try to maintain the prof-itability of the recent past as markets enter the transition period. They usually do this at theexpense of market share or by forgoing marketing, R&D, and other investments crucial formaintaining future market position. While some smaller firms with limited resources mayhave no choice, this tendency can be seriously shortsighted, particularly if economies ofscale are crucial for the business’s continued success during market maturity.
Strategic Choices in Mature
Markets
The maturity phase of an industry’s life cycle is often depicted as one of stability charac-terized by few changes in the market shares of leading competitors and steady prices. Theindustry leaders, because of their low per-unit costs and little need to make any furtherinvestments, enjoy high profits and positive cash flows. These cash flows are harvested anddiverted to other SBUs or products in the firm’s portfolio that promise greater futuregrowth.
Unfortunately, this conventional scenario provides an overly simplistic description ofthe situation businesses face in most mature markets. For one thing, it is not always easyto tell when a market has reached maturity. Variations in brands, marketing programs, andcustomer groups can mean that different brands and market segments reach maturity at dif-ferent times.
Further, as the maturity stage progresses, a variety of threats and opportunities can dis-rupt an industry’s stability. Shifts in customer needs or preferences, product substitutes,increased raw material costs, changes in government regulations, or factors such as theentry of low-cost foreign producers or mergers and acquisitions can threaten individualcompetitors and even throw the entire industry into early decline. Consider, for example,the competitive position of Timex, a brand that dominated the low-price segment of theAmerican watch market in the 1970s. First the appearance of imported digital watches andlater a shift in consumer preferences toward more fashionable and prestigious brands buf-feted the firm and eroded its market share.
On the positive side, such changes also can open new growth opportunities in matureindustries. Product improvements (such as the development of high-fiber nutritional cere-als), advances in process technology (the creation of minimills for steel production),falling raw materials costs, increased prices for close substitutes, or environmental changesall can provide opportunities for a firm to dramatically increase its sales and profits. Anentire industry can even experience a period of renewed growth.
Discontinuities during industry maturity suggest that it is dangerously shortsighted fora firm to simply milk its cash cows. Even industry followers can substantially improve vol-ume, share, and profitability during industry maturity if they can adjust their marketingobjectives and programs to fit the new opportunities that arise.5 Thus, success in maturemarkets requires two sets of strategic actions: (1) the development of a well-implemented

Walker et al.: Marketing Strategy: A Decision−Focused Approach, Fourth Edition
III. Formulating Market Strategies
11. Strategies for Mature and Declining Markets
303© The McGraw−Hill Companies, 2002
Chapter Eleven Strategies for Mature and Declining Markets 243
business strategy to sustain a competitive advantage, customer satisfaction, and loyalty and(2) flexible and creative marketing programs geared to pursue growth or profit opportuni-ties as conditions change in specific product-markets.
Strategies for Maintaining Competitive AdvantageAs discussed in Chapter 3, both analyzer and defender strategies may be appropriate forunits with a leading, or at least a profitable, share of one or more major segments in amature industry. Analyzers and defenders are both concerned with maintaining a strongshare position in established product-markets. But analyzers also do some product andmarket development to avoid being leapfrogged by competitors with more advanced prod-ucts or being left behind in new applications segments. On the other hand, defenders mayinitiate some product improvements or line extensions to protect and strengthen their posi-tion in existing markets, but they spend relatively little on new product R&D. Thus, an ana-lyzer strategy is most appropriate for developed industries that are still experiencing sometechnological change and may have opportunities for continued growth, such as the com-puter and commercial aircraft industries. The defender strategy works best in industrieswhere the basic technology is not very complex or is unlikely to change dramatically inthe short run, as in the food industry.
Both analyzers and defenders can attempt to sustain a competitive advantage in estab-lished product-markets through differentiation of their product offering (either on the basisof superior quality or service) or by maintaining a low-cost position. Evidence suggests theability to maintain either a strongly differentiated or a low-cost position continues to be acritical determinant of success throughout both the transition and the maturity stage. Onestudy examined the competitive strategies pursued by the two leading firms (in terms ofreturn on investment) in eight mature industries characterized by slow growth and intensecompetition. In each industry, the two leading firms offered either the lowest relativedelivered cost or high relative product differentiation.6 Similarly, more recent observationsby Treacy and Wiersema found that market leaders tend to pursue one of three strategicdisciplines. They either stress operational excellence, which typically translates into lowercosts, or differentiate themselves through product leadership or customer intimacy andsuperior service.7
Generally, it is difficult for a single business to pursue both low-cost and differentiationstrategies at the same time. For instance, businesses taking the low-cost approach typicallycompete primarily by offering the lowest prices in the industry. Such prices allow littleroom for the firm to make the investments or cover the costs inherent in maintaining supe-rior product quality, performance, or service over time.
It is important to keep in mind, however, that pursuit of a low-cost strategy does notmean that a business can ignore the delivery of desirable benefits to the customer. Simi-larly, customers will not pay an unlimited price premium for superior quality or service,no matter how superior it is. In both consumer and commercial markets customers seekgood value for the money, either a solid, no-frills product or service at an outstanding priceor an offering whose higher price is justified by the superior benefits it delivers on one ormore dimensions.8 Thus, even low-cost producers should continually seek ways toimprove the quality and performance of their offerings within the financial constraints oftheir competitive strategy. And even differentiated defenders should continually work toimprove efficiency without sacrificing product quality or performance. This point is clearlyillustrated in the diagram of the customer value management process in Exhibit 11.2,which shows that actions to improve customers’ perceptions of quality (whether of goods

Walker et al.: Marketing Strategy: A Decision−Focused Approach, Fourth Edition
III. Formulating Market Strategies
11. Strategies for Mature and Declining Markets
304 © The McGraw−Hill Companies, 2002
Section Three Formulating Marketing Strategies244
or service) and to reduce costs both impact customer value. The critical strategic questionsfacing the marketing manager, then, are: How can a business continue to differentiate itsofferings and justify a premium price as its market matures and becomes more competi-tive? and How can businesses, particularly those pursuing low-cost strategies, continue toreduce their costs and improve their efficiency as their markets mature?
Methods of Dif ferentiationAt the most basic level, a business can attempt to differentiate its offer-ing from competitors’ by offering either superior product quality, supe-rior service, or both. The problem is that quality and service may bedefined in a variety of different ways by customers.
Dimensions of Product Quality9 To maintain a competitive advantage in productquality, a firm must understand what dimensions customers perceive to underlie differ-ences across products within a given category. One authority has identified eight suchdimensions of product quality. These are summarized in Exhibit 11.3 and discussed next.
Exhibit 11.2The Process of Customer Value Management
Source: Reprinted with permission of The Free Press, a Division of Simon & Schuster, Inc., from Man-aging Customer Value: Creating Quality and Service That Customers Can See by Bradley T. Gale.Copyright © 1994 by Bradley T. Gale.
Understandingcustomer needs
in a well-defined market
Effective designand quality control
Superior qualityin areas that
matter to customers
Advertisingand other marketing
communications
Low cost of qualityand overall
cost leadership
Market-perceivedquality
Exceptionalcustomer
value
Business resultsprofitability, growth,
and shareholder value
Strategic Issue
Quality and service may be defined in avariety of different ways by customers.
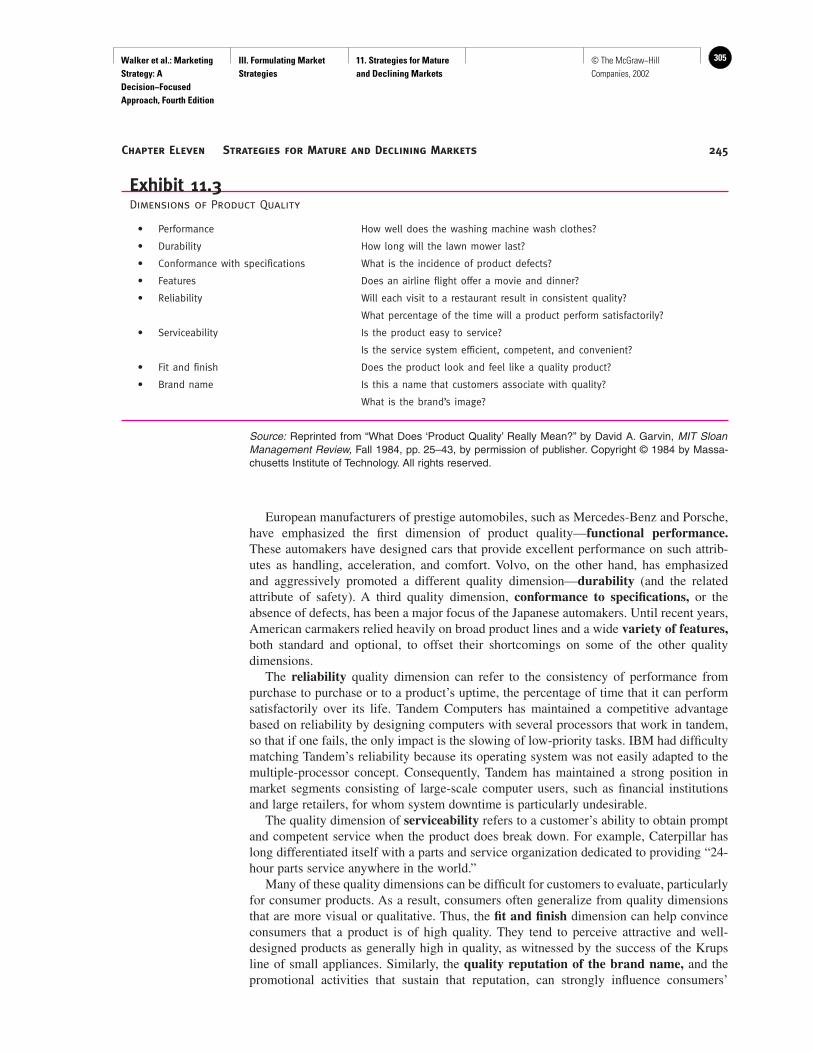
Walker et al.: Marketing Strategy: A Decision−Focused Approach, Fourth Edition
III. Formulating Market Strategies
11. Strategies for Mature and Declining Markets
305© The McGraw−Hill Companies, 2002
Chapter Eleven Strategies for Mature and Declining Markets 245
European manufacturers of prestige automobiles, such as Mercedes-Benz and Porsche,have emphasized the first dimension of product quality—functional performance.These automakers have designed cars that provide excellent performance on such attrib-utes as handling, acceleration, and comfort. Volvo, on the other hand, has emphasized and aggressively promoted a different quality dimension—durability (and the relatedattribute of safety). A third quality dimension, conformance to specifications, or theabsence of defects, has been a major focus of the Japanese automakers. Until recent years,American carmakers relied heavily on broad product lines and a wide variety of features,both standard and optional, to offset their shortcomings on some of the other qualitydimensions.
The reliability quality dimension can refer to the consistency of performance frompurchase to purchase or to a product’s uptime, the percentage of time that it can performsatisfactorily over its life. Tandem Computers has maintained a competitive advantagebased on reliability by designing computers with several processors that work in tandem,so that if one fails, the only impact is the slowing of low-priority tasks. IBM had difficultymatching Tandem’s reliability because its operating system was not easily adapted to themultiple-processor concept. Consequently, Tandem has maintained a strong position inmarket segments consisting of large-scale computer users, such as financial institutionsand large retailers, for whom system downtime is particularly undesirable.
The quality dimension of serviceability refers to a customer’s ability to obtain promptand competent service when the product does break down. For example, Caterpillar haslong differentiated itself with a parts and service organization dedicated to providing “24-hour parts service anywhere in the world.”
Many of these quality dimensions can be difficult for customers to evaluate, particularlyfor consumer products. As a result, consumers often generalize from quality dimensionsthat are more visual or qualitative. Thus, the fit and finish dimension can help convinceconsumers that a product is of high quality. They tend to perceive attractive and well-designed products as generally high in quality, as witnessed by the success of the Krupsline of small appliances. Similarly, the quality reputation of the brand name, and thepromotional activities that sustain that reputation, can strongly influence consumers’
Exhibit 11.3Dimensions of Product Quality
• Performance How well does the washing machine wash clothes?
• Durability How long will the lawn mower last?
• Conformance with specifications What is the incidence of product defects?
• Features Does an airline flight offer a movie and dinner?
• Reliability Will each visit to a restaurant result in consistent quality?
What percentage of the time will a product perform satisfactorily?
• Serviceability Is the product easy to service?
Is the service system efficient, competent, and convenient?
• Fit and finish Does the product look and feel like a quality product?
• Brand name Is this a name that customers associate with quality?
What is the brand’s image?
Source: Reprinted from “What Does ‘Product Quality’ Really Mean?” by David A. Garvin, MIT SloanManagement Review, Fall 1984, pp. 25–43, by permission of publisher. Copyright © 1984 by Massa-chusetts Institute of Technology. All rights reserved.

Walker et al.: Marketing Strategy: A Decision−Focused Approach, Fourth Edition
III. Formulating Market Strategies
11. Strategies for Mature and Declining Markets
306 © The McGraw−Hill Companies, 2002
Section Three Formulating Marketing Strategies246
perceptions of a product’s quality. A brand’s quality reputation together with psychologi-cal factors such as name recognition and loyalty substantially determine a brand’sequity—the perceived value customers associate with a particular brand name and its logoor symbol.10 To successfully pursue a differentiation strategy based on quality, then, a busi-ness must understand what dimensions or cues its potential customers use to judge qual-ity, and it should pay particular attention to some of the less-concrete but more visible andsymbolic attributes of the product.
Dimensions of Service Quality Customers also judge the quality of the servicethey receive on multiple dimensions. A number of such dimensions of perceived servicequality have been identified by a series of studies conducted across diverse industries suchas retail banking and appliance repair, and five of those dimensions are listed and brieflydefined in Exhibit 11.4.11
The quality dimensions listed in Exhibit 11.4 apply specifically to service businesses,but most of them are also relevant for judging the service component of a product offer-ing. This pertains to both the objective performance dimensions of the service delivery sys-tem, such as its reliability and responsiveness, as well as to elements of the performanceof service personnel, such as their empathy and level of assurance.
The results of a number of surveys suggest that customers perceive all five dimensionsof service quality to be very important regardless of the kind of service being evaluated.As Exhibit 11.5 indicates, customers of four different kinds of services gave reliability,responsiveness, assurance, and empathy mean importance ratings of more than 9 on a 10-point rating scale. And though the mean ratings for tangibles were somewhat lower in com-parison, they still fell toward the upper end of the scale, ranging from 7.14 to 8.56.
The same respondents also were asked which of the five dimensions they would chooseas being the most critical in their assessment of service quality. Their responses, which areshown in Exhibit 11.5, suggest that reliability is the most important aspect of service qual-ity to the greatest number of customers. Both service reliability and responsiveness areproving to be particularly important for, and the Achilles’ heel of, many e-commerce sites.This point is dramatically illustrated by the experiences of Petopia.com Inc., described inExhibit 11.6.
The key to a differentiation strategy based on providing superior service is to meet orexceed target customers’ service quality expectations and to do it more consistently thancompetitors. The problem is that sometimes managers underestimate the level of thosecustomer expectations, and sometimes those expectations can be unrealistically high.Therefore, a firm needs to clearly identify target customers’ desires with respect to servicequality and to clearly define and communicate what level of service they intend to deliver.
Exhibit 11.4Dimensions of Service Quality
• Tangibles Appearance of physical facilities, equipment, personnel, and communications materials.
• Reliability Ability to perform the promised service dependably and accurately.
• Responsiveness Willingness to help customers and provide prompt service.
• Assurance Knowledge and courtesy of employees and their ability to convey trust and confidence.
• Empathy Caring, individualized attention the firm provides its customers.
Source: Reprinted with the permission of The Free Press, A Division of Simon & Schuster, Inc., fromDelivering Quality Service: Balancing Custom Perceptions and Expectations by Valarie A. Zeithaml, A. Parasuraman, and Leonard L. Berry. Copyright © 1990 by The Free Press.
www

Walker et al.: Marketing Strategy: A Decision−Focused Approach, Fourth Edition
III. Formulating Market Strategies
11. Strategies for Mature and Declining Markets
307© The McGraw−Hill Companies, 2002
Chapter Eleven Strategies for Mature and Declining Markets 247
When this is done, customers have a more realistic idea of what to expect and are lesslikely to be disappointed with the service they receive.
Improving Customer Perceptions of Service Quality The major factors thatdetermine a customer’s expectations and perceptions concerning service quality—and fivegaps that can lead to dissatisfaction with service delivery—are outlined in Exhibit 11.7 anddiscussed next.
1. Gap between the customer’s expectations and the marketer’s perceptions. Managers donot always have an accurate understanding of what customers want or how they will evalu-ate a firm’s service efforts. The first step in providing good service is to collect informa-tion—through customer surveys, evaluations of customer complaints, or other methods—todetermine what service attributes customers consider important.
Exhibit 11.5Perceived Importance of Service Quality Dimensions in Four Different Industries
Mean importance rating Percentage of respondents indicatingon 10-point scale* dimension is most important
Credit-card customers (n = 187)
Tangibles 7.43 0.6
Reliability 9.45 48.6
Responsiveness 9.37 19.8
Assurance 9.25 17.5
Empathy 9.09 13.6
Repair-and-maintenance customers (n = 183)
Tangibles 8.48 1.2
Reliability 9.64 57.2
Responsiveness 9.54 19.9
Assurance 9.62 12.0
Empathy 9.30 9.6
Long-distance telephone customers (n = 184)
Tangibles 7.14 0.6
Reliability 9.67 60.6
Responsiveness 9.57 16.0
Assurance 9.29 12.6
Empathy 9.25 10.3
Bank customers (n = 177)
Tangibles 8.56 1.1
Reliability 9.44 42.1
Responsiveness 9.34 18.0
Assurance 9.18 13.6
Empathy 9.30 25.1
*Scale ranges from 1 (not at all important) to 10 (extremely important).
Source: Reprinted with permission of The Free Press, a Division of Simon & Schuster, Inc., from Deliv-ering Quality Service: Balancing Customer Perceptions and Expectations by Valarie A. Zeithaml, A. Parasuraman, and Leonard L. Berry. Copyright © 1990 by The Free Press.

Walker et al.: Marketing Strategy: A Decision−Focused Approach, Fourth Edition
III. Formulating Market Strategies
11. Strategies for Mature and Declining Markets
308 © The McGraw−Hill Companies, 2002
Section Three Formulating Marketing Strategies248
2. Gap between management perceptions and service quality specifications. Even whenmanagement has a clear understanding of what customers want, that understanding mightnot get translated into effective operating standards. A firm’s policies concerning customerservice may be unclear, poorly communicated to employees, or haphazardly enforced.Unless a firm’s employees know what the company’s service policies are and believe thatmanagement is seriously committed to those standards, their performance is likely to fallshort of desired levels.
3. Gap between service quality specifications and service delivery. Lip service by managementis not enough to produce high-quality service. High standards must be backed by the programs,resources, and rewards necessary to enable and encourage employees to deliver good service.Employees must be provided with the training, equipment, and time necessary to deliver goodservice. Their service performance must be measured and evaluated. And good performancemust be rewarded by making it part of the criteria for pay raises or promotions, or by other moredirect inducements, in order to motivate the additional effort good service requires.
4. Gap between service delivery and external communications. Even good service per-formance may disappoint some customers if the firm’s marketing communications causethem to have unrealistically high expectations. If the photographs in a vacation resort’sadvertising and brochures make the rooms look more spacious and luxurious than theyreally are, for instance, first-time customers are likely to be disappointed no matter howclean or well-tended those rooms are kept by the resort’s staff.
5. Gap between perceived service and expected service. This results when management failsto close one or more of the other four gaps. It is this difference between a customer’s expec-tations and his or her actual experience with the firm that leads to dissatisfaction.
The above discussion suggests a number of actions management can take to close the pos-sible gaps and improve customer satisfaction with a company’s service. Some of those actionsare nicely illustrated by the response of Petopia.com’s managers to the firm’s service problems,
A t first, the people at Petopia.com Inc. thought it wastime to break out the champagne: during the 1999
holiday season 160,000 customers clicked the pet supplysite’s buy button—four times the number it expected. Butthe flood of orders quickly overloaded its one distribu-tion center, and thousands of complaints and questionspoured in. And when customers couldn’t get through,they blitzed Petopia with angry e-mails, many of whichwent unanswered for as long as four days.
It’s the sort of nightmare that has plagued many e-tailers. The reason? Many sites, figuring the Web’sself-service model could save them millions of dollarsin customer service costs, didn’t realize that was thelast place they could afford to pinch pennies. Marketresearcher Datamonitor estimated that Web sales lostdue to poor service could reach $11 billion in 2000.And studies conducted by Forrester Research, Inc.,indicate that websites can get much higher sales gainsby providing good service to existing customers andkeeping them happy than by blindly seeking newones. Their findings suggest that more than 90 percent
of satisfied consumers say they’ll visit a site again,and 87 percent will recommend it to others.
Some e-tailers are learning their lesson. The firstthing Petopia did was apologize by sending a free giftto every customer who had a problem with an order.More importantly, the firm paid out $10 million in 2000to expand its order fulfillment capabilities and installnew customer service software. As a result, Petopiacan now service twice as many people a day as itcould in 1999, and it responds to all e-mail queriesand complaints within 24 hours.
These improvements in Petopia’s service reliabilityand responsiveness have begun to pay off. Accordingto the research firm Gomez Advisors Inc., the firm nowranks tops in customer relations among pet sites, and70 percent of its sales are now coming from repeatcustomers.
Source: Reprinted from Jeanette Brown, “Service, Please,” Busi-ness Week e.biz, October 23, 2000, pp. EB48–50, with special per-mission. Copyright © 2000 by The McGraw-Hill Companies, Inc.
Exhibit 11.6 Petopia.com—Learning the Importance of Service Reliability and Responsiveness on the Web

Walker et al.: Marketing Strategy: A Decision−Focused Approach, Fourth Edition
III. Formulating Market Strategies
11. Strategies for Mature and Declining Markets
309© The McGraw−Hill Companies, 2002
Chapter Eleven Strategies for Mature and Declining Markets 249
as described earlier in Exhibit 11.6. Achieving and sustaining high levels of service quality canpresent difficult implementation problems, however, because it usually involves the coordina-tion of efforts of many employees from different functional departments and organizational lev-els. Some of these coordination problems are examined in Chapter 13.
Methods of Maintaining a Low-Cost PositionMoving down the experience curve is the most commonly discussed method of achievingand sustaining a low-cost position in an industry. But a firm does not necessarily need a large relative market share to implement a low-cost strategy. For instance, Johnson
Exhibit 11.7Determinants of Perceived Service Quality
Source: Reprinted from A. Parasuraman, Valarie A. Zeithaml, and Leonard L. Berry, “A ConceptualModel of Service Quality and Its Implications for Future Research,” Journal of Marketing, Fall 1985, p.44. Published by the American Marketing Association. Reprinted with permission.
Word-of-mouthcommunications Personal needs Past experience
Expected service
Perceived service
Externalcommunicationto consumers
Service delivery(including pre and
postcontacts)
Translation ofperceptions intoservice qualityspecifications
Managementperceptions of
consumerexpectations
Gap 1
Gap 5
Gap 4
Gap 3
Gap 2
Mar
kete
rC
usto
mer

Walker et al.: Marketing Strategy: A Decision−Focused Approach, Fourth Edition
III. Formulating Market Strategies
11. Strategies for Mature and Declining Markets
310 © The McGraw−Hill Companies, 2002
Section Three Formulating Marketing Strategies250
Controls relies on close alliances with customers, as well as economies of scale, to holddown its inventory and distribution costs. And Michael Dell, as a small follower in the per-sonal computer industry, managed to achieve costs below those of much larger competi-tors by developing logistical alliances with suppliers and an innovative, Internet-baseddirect distribution channel.
Some other means for obtaining a sustainable cost advantage include producing a no-frills product, creating an innovative product design, finding cheaper raw materials,automating or outsourcing production, developing low-cost distribution channels, andreducing overhead.12
A No-Frills Product A direct approach to obtaining a low-cost position involves simplyremoving all frills and extras from the basic product or service. Thus, Suzuki cars, warehousefurniture stores, legal services clinics, and grocery stores selling canned goods out of cratesall offer lower costs and prices than their competitors. This lower production cost is oftensustainable because established differentiated competitors find it difficult to stop offering fea-tures and services their customers have come to expect. However, those established firmsmay lower their own prices in the short run—even to the point of suffering losses—in anattempt to drive out a no-frills competitor that poses a serious threat. Thus, a firm consider-ing a no-frills strategy needs the resources to withstand a possible price war.13
Innovative Product Design A simplified product design and standardized compo-nent parts also can lead to cost advantages. In the office copier industry, for instance,Japanese firms overcame substantial entry barriers by designing extremely simple copiers,with a fraction of the number of parts in the design used by market-leading Xerox.
Cheaper Raw Materials A firm with the foresight to acquire or the creativity to finda way to use relatively cheap raw materials also can gain a sustainable cost advantage. Forexample, Fort Howard Paper achieved an advantage by being the first major papermakerto rely exclusively on recycled pulp. While the finished product was not so high in qualityas paper from virgin wood, Fort Howard’s lower cost gave it a competitive edge in theprice-sensitive commercial market for toilet paper and other such products used in hotels,restaurants, and office buildings.
Innovative Production Processes Although low-cost defender businesses typicallyspend little on product R&D, they often continue to devote substantial sums to processR&D. Innovations in the production process, including the development of automated orcomputer-controlled processes, can help them sustain cost advantages over competitors.
In some labor-intensive industries, a business can achieve a cost advantage, at least inthe short term, by gaining access to inexpensive labor. This is usually achieved by movingall or part of the production process to countries with low wage rates, such as Taiwan,Korea, or Mexico. Unfortunately, because such moves are relatively easy to emulate, thiskind of cost advantage may not be sustainable.
Low-Cost Distribution When distribution accounts for a relatively high proportion ofa product’s total delivered cost, a firm might gain a substantial advantage by developinglower-cost alternative channels. Typically, this involves eliminating, or shifting to the cus-tomer, some of the functions performed by traditional channels in return for a lower price.In the consumer banking industry, for example, automated teller machines have helpedreduce labor costs and investment in bricks-and-mortar branch banks. But they also havereduced the amount of personalized service banks provide to their customers, which mayhelp explain why average customer satisfaction with banks fell by more than 8 percentfrom 1994 to 2000.14
www

Walker et al.: Marketing Strategy: A Decision−Focused Approach, Fourth Edition
III. Formulating Market Strategies
11. Strategies for Mature and Declining Markets
311© The McGraw−Hill Companies, 2002
Chapter Eleven Strategies for Mature and Declining Markets 251
Reductions in Overhead Successfully sustaining a low-cost strategy requires thatthe firm pare and control its major overhead costs as quickly as possible as its industrymatures. Many U.S. companies learned this lesson the hard way during the 1980s whenhigh costs of old plants, labor, and large inventories left them vulnerable to more efficientforeign competitors and to corporate raiders.
Customers’ Satisfaction and Loyalty Are Crucialfor Maximizing Their Lifetime ValueAnalyzer, and particularly defender, businesses are mostly concerned with protecting theirexisting positions in one or more mature market segments and maximizing profitabilityover the remaining life of those product-markets. Thus, financial dimensions of perfor-mance, such as return on investment and cash flow, are usually of greater interest to suchbusinesses than are more growth-oriented dimensions, such as volume increases or newproduct success. Businesses can achieve such financial objectives by either successfullydifferentiating their offerings or maintaining a low-cost position.
While the primary emphasis in many businesses during the early 1990s was on improv-ing efficiency through downsizing and reengineering,15 there is substantial evidence thatfirms with superior quality goods and services also obtain higher returns on investmentthan do businesses with average or below average offerings.16 The lesson to be learned,then, is that the choice between a differentiation or a low-cost strategy is probably not thecritical determinant of success in mature markets. What is critical is that a business con-tinually work to improve the value of its offerings—by either improving product or serv-ice quality, reducing costs, or some combination—as a basis for maintaining its customerbase as its markets mature and become increasingly competitive.
Measuring Customer Satisfaction To gain the knowledge necessary to continuallyimprove the value of their offerings to customers, firms must understand how satisfiedexisting and potential customers are with their current offerings. This focus on customersatisfaction has become increasingly important as more firms question whether allattempts to improve absolute quality of their products and services generate sufficientadditional sales and profits to justify their cost. This growing concern with the economic“return on quality” has motivated firms to ask which dimensions of product or servicequality are most important to customers and which dimensions customers might be will-ing to sacrifice for lower prices. For instance, United Parcel Service recently discoveredthat many of its customers wanted more time to interact with the company’s drivers inorder to seek advice on their shipping problems, and they were willing to put up withslightly slower delivery times in return. Consequently, UPS now allows its drivers an addi-tional 30 minutes a day to spend at their discretion to strengthen ties with customers andperhaps bring in new sales.17
Useful measures of customer satisfaction, then, should examine both (1) customers’expectations and preferences concerning the various dimensions of product and servicequality (such as product performance, features, reliability, on-time delivery, competence ofservice personnel, and so on) and (2) their perceptions concerning how well the firm ismeeting those expectations. Any gaps where customer expectations exceed their recentexperiences may indicate fruitful areas for the firm to work at improving customer valueand satisfaction. Of course, such measurements must be made periodically to determinewhether the actions taken have been effective.18
Improving Customer Retention and Loyalty Maintaining the loyalty of existingcustomers is crucial for a business’s profitability. This is especially true as markets mature

Walker et al.: Marketing Strategy: A Decision−Focused Approach, Fourth Edition
III. Formulating Market Strategies
11. Strategies for Mature and Declining Markets
312 © The McGraw−Hill Companies, 2002
Section Three Formulating Marketing Strategies252
because loyal customers become more profitable over time. The firm not only avoids thehigh costs associated with trying to acquire replacement customers in an increasingly com-petitive market, but it also benefits because loyal customers (1) tend to concentrate theirpurchases, thus leading to larger volumes and lower selling and distribution costs; (2) pro-vide positive word-of-mouth and customer referrals; and (3) may be willing to pay pre-mium prices for the value they receive.19
Periodic measurement of customer satisfaction is important because a dissatisfied cus-tomer is unlikely to remain loyal over time. Unfortunately, the reverse is not always true:Customers who describe themselves as satisfied are not necessarily loyal. Indeed, one authorestimates that 60 to 80 percent of customer defectors in most businesses said they were “sat-isfied” or “very satisfied” on the last customer survey before their defection.20 In the interim,perhaps competitors improved their offerings, the customer’s requirements changed, or otherenvironmental factors shifted. Companies that measure customer satisfaction should be com-mended—but urged not to stop there. Satisfaction measures need to be supplemented withexaminations of customer behavior, such as measures of the annual retention rate, frequencyof purchases, and the percentage of a customer’s total purchases captured by the firm.
Most important, defecting customers should be studied in detail to discover why thefirm failed to provide sufficient value to retain their loyalty. Such failures often providemore valuable information than satisfaction measures because they stand out as a clear,understandable message telling the organization exactly where improvements are needed.The actions of MicroScan, as detailed in Exhibit 11.8, provide a good example of the intel-ligent use of such defector analysis.
Are All Customers Equally Valuable?21 While improving customer loyalty is cru-cial for maintaining market share and profitability as markets mature, an increasing num-ber of companies are asking whether every customer’s loyalty is worthy of the same level
of effort and expense. In these firms, technology is creating a new busi-ness model that alters the level of service and benefits provided to a cus-tomer based on projections of that customer’s value to the firm. With thedevelopment of extensive customer databases, it is possible for compa-nies to measure what different levels of customer service cost on an indi-vidual level. They also can know how much business a particular
customer has generated in the past, estimate what she or he is likely to buy in the future,and calculate a rate of return for that individual for different levels of service.
The MicroScan division of Baxter Diagnostics, Inc.,makes instruments used by medical laboratories
to identify microbes in patient cultures. In 1990MicroScan was neck-and-neck with Vitek Systems, Inc.,for market leadership, but its management knew itwould have to do better to win the race. The firm ana-lyzed its customer base, highlighting accounts thathad been lost as well as those that remained activebut showed a declining volume of testing. MicroScaninterviewed all the lost customers and a large portionof the “decliners,” probing deeply for the causesunderlying their change in behavior. They found thatsuch customers had concerns about the company’s
instrument features, reliability, and responsiveness totheir problems.
In response, MicroScan’s management shifted R&Dpriorities to address specific shortcomings its lost cus-tomers had identified, such as test accuracy and time-to-result. It also redesigned customer service protocolsto ensure that immediate attention was given toequipment faults and delivery problems. As a result,MicroScan’s sales began to improve and it establisheda clear market-share lead within two years.
Source: Frederick F. Reichheld, “Loyalty and the Renaissance ofMarketing,” Marketing Management 2 (1994), pp. 10–21.
Exhibit 11.8 MicroScan Examines Defectors to Improve Customer Loyalty
Strategic Issue
An increasing number of companies are asking whether every customer’s loyalty isworthy of the same level of effort andexpense.

Walker et al.: Marketing Strategy: A Decision−Focused Approach, Fourth Edition
III. Formulating Market Strategies
11. Strategies for Mature and Declining Markets
313© The McGraw−Hill Companies, 2002
Chapter Eleven Strategies for Mature and Declining Markets 253
The ability of firms to tailor different levels of service and benefits to different cus-tomers based on each person’s potential to produce a profit has been facilitated by thegrowing popularity of the Internet. The Web has made it easier to track and measure indi-vidual transactions across businesses. It also has provided firms with new, low-cost serv-ice options; people can now serve themselves at their own convenience, but they have toaccept little or no human contact in return.
The end result of this trend toward individually tailored service levels could be anincreased stratification of consumer society. The top tier may enjoy unprecedented levels ofpersonal attention. But those who fall below a certain level of profitability for too long mayface increased service fees or receive reduced levels of service and benefits. For example,some credit-card companies now charge higher annual fees to customers who do not rack
www
From a purely economic viewpoint, tailoringdifferent levels of service and benefits to dif-
ferent customer segments depending on theirprofitability makes sense, at least in the shortrun. In an era when labor costs are increasingwhile many markets, especially mature ones,are getting more competitive, many firmsargue they cannot afford to provide extensive
hands-on service to everyone. Companies also point outthat they’re often delivering a wider range of productsand services than ever before, including more ways for customers to handle transactions. Thanks to theInternet, for example, consumers have better tools toconveniently serve themselves. And finally, service seg-mentation may actually produce some positive benefitsfor customers—more personalized service for the bestcustomers and, in many cases, lower overall costs andprices for everyone else. For instance, Fidelity Invest-ments now gets about 550,000 website visits eachday and more than 700,000 daily phone calls, three-quarters of which go to automated systems that cost thecompany less than a dollar each, including research anddevelopment costs. The rest are handled by humanoperators, at a cost of about $13 per call.
From an ethical standpoint, however, many peoplequestion the inherent fairness and potential invasionof privacy involved in using a wealth of personal infor-mation about individual consumers as a basis forwithholding services or benefits from some of them,especially when such practices are largely invisible tothe consumer. You don’t know when you’re being shut-tled to a different telephone queue or sales promotion.You don’t know what benefits you’re missing or whatadditional fees you’re being charged. Some argue thatthis lack of transparency is unfair because it deprivesconsumers of the opportunity to take actions, such as
concentrating their purchases with a single supplier,switching companies, or paying a service fee, thatwould enable them to acquire the additional servicesand benefits they are currently denied.
From a strategic view, there are also some potentialdangers in cutting services and benefits to customerswho have not generated profits in the past. For onething, past behavior is not necessarily an accurate indicator of a customer’s future lifetime value. The life situations and spending habits of some customergroups—college students, for instance—can changedramatically over time. In addition, looking only at acustomer’s purchases may overlook some indirect waysthat customer affects the firm’s revenues, such as pos-itive word-of-mouth recommendations and referrals toother potential buyers. And some customers may notbe spending much with a company precisely becauseof the lousy service they have received as a result ofnot spending very much with that company. Instead ofsimply writing off low-volume customers, it may makemore strategic sense to first attempt to convert theminto high-volume customers by targeting them for addi-tional promotions, by trying to sell complementarygoods and services, or by instituting loyalty programs(e.g., the airlines’ frequent-flier programs).
Finally, by debasing the satisfaction and loyalty oflow-volume customers, firms risk losing those customersto competitors. In a mature industry, particularly onewith substantial economies of scale, such a loss of mar-ket share can increase unit costs and reduce the prof-itability of those high-volume customers that do remainloyal. And a creative competitor may find ways to makeother firms’ cast-off customers very profitable after all.
Source: Reprinted from Diane Brady, “Why Service Stinks,” Busi-ness Week, October 23, 2000, pp. 118–28, with special permission.Copyright © 2000 The McGraw-Hill Companies, Inc.
Exhibit 11.9 Pros and Cons of Varying Service Levels According to Customers’Profitability
E
www

Walker et al.: Marketing Strategy: A Decision−Focused Approach, Fourth Edition
III. Formulating Market Strategies
11. Strategies for Mature and Declining Markets
314 © The McGraw−Hill Companies, 2002
Section Three Formulating Marketing Strategies254
up some minimum level of interest charges during the year. In other firms, call center per-sonnel route customers to different queues. Big spenders are turned over to high-level prob-lem solvers while less profitable customers may never speak to a live person. Finally, choicecustomers may get fees waived or receive promotional discounts based on the value of theirbusiness, while less valuable customers may never know the promotions exist.
The segmentation of customers based on projections of their value and the tailoring ofdifferent service levels and benefits to those segments raise both ethical and strategic ques-tions, some of which are explored in Exhibit 11.9. One possible way for a firm to resolvesome of the dilemmas involved in dealing with less profitable customers is to find ways toincrease their lifetime value by increasing the frequency and/or volume of their purchases.This is one strategy examined in detail in the following section.
Marketing Strategies
for Mature Markets
Strategies for Maintaining Current Market ShareSince markets can remain in the maturity stage for decades, milking or harvesting matureproduct-markets by maximizing short-run profits makes little sense. Pursuing such anobjective typically involves substantial cuts in marketing and R&D expenses, which canlead to premature losses of volume and market share and lower profits in the longer term.The business should strive during the early years of market maturity to maximize the flowof profits over the remaining life of the product-market. Thus, the most critical marketingobjective is to maintain and protect the business’s market share. In a mature market wherefew new customers buy the product for the first time, the business must continue to win itsshare of repeat purchases from existing customers.
In Chapter 10 we discussed a number of marketing strategies that businesses might use tomaintain their market share in growth markets. Many of those same strategies continue to berelevant for holding on to customers as markets mature, particularly for those firms that sur-vived the shakeout period with a relatively strong share position. The most obvious strategyfor such share leaders is simply to continue strengthening their position through a fortressdefense. Recall that such a strategy involves two sets of marketing actions: those aimed atimproving customer satisfaction and loyalty and those intended to encourage and simplifyrepeat purchasing. Actions like those discussed earlier for improving the quality of a firm’soffering and for reducing costs suggest ways to increase customer satisfaction and loyalty.Similarly, improvements to service quality, such as just-in-time delivery arrangements orcomputerized reordering systems, can help encourage repeat purchases.
Since markets often become more fragmented as they grow and mature, share leadersalso may have to expand their product lines, or add one or more flanker brands, to protecttheir position against competitive inroads. Thus, Johnson Controls has strengthened itsposition in the commercial facilities management arena by expanding its array of servicesthrough a combination of acquisitions and continued internal development.
Small-share competitors also can earn substantial profits in a mature market. To do so,however, it is often wise for them to focus on strategies that avoid prolonged direct con-frontations with larger share leaders. A niche strategy can be particularly effective whenthe target segment is too small to appeal to larger competitors or when the smaller firm canestablish a strong differential advantage or brand preference in the segment. For instance,with only 36 hotels worldwide, the Four Seasons chain is a small player in the lodgingindustry. But by focusing on the high end of the business travel market, the chain hasgrown and prospered. The chain’s hotels differentiate themselves by offering a wide range

Walker et al.: Marketing Strategy: A Decision−Focused Approach, Fourth Edition
III. Formulating Market Strategies
11. Strategies for Mature and Declining Markets
315© The McGraw−Hill Companies, 2002
Chapter Eleven Strategies for Mature and Declining Markets 255
of amenities, such as free overnight shoeshines, that are important to business travelers.Thus, while they charge relatively high prices, they also are seen as delivering good value.
Strategies for Extending Volume GrowthMarket maturity is defined by a flattening of the growth rate. In some instances growth slowsfor structural reasons, such as the emergence of substitute products or a shift in customer pref-erences. Marketers can do little to revitalize the market under such conditions. But in somecases a market only appears to be mature because of the limitations of current marketing pro-grams, such as target segments that are too narrowly defined or limited product offerings. Here,more innovative or aggressive marketing strategies might successfully extend the market’s lifecycle into a period of renewed growth. Thus, stimulating additional volume growth can be animportant secondary objective under such circumstances, particularly for industry share lead-ers because they often can capture a relatively large share of any additional volume generated.
A firm might pursue several different marketing strategies—either singly or in com-bination—to squeeze additional volume from a mature market. These include an increasedpenetration strategy, an extended use strategy, and a market expansion strategy. Exhibit 11.10
Exhibit 11.10Situational Determinants of Appropriate Marketing Objectives and Strategies for Extending Growth in
Mature Markets
Growth Extension Strategies
Situation variables Increased penetration Extended use Market expansion
Primary objective
Market characteristics
Competitors’ characteristics
Firm’s characteristics
Increase the proportion ofusers by converting currentnonusers in one or moremajor market segments.
Relatively low penetration inone or more segments (i.e.,low percentage of potentialusers have adopted theproduct); relatively homoge-neous market with only afew large segments.
Competitors hold relatively smallmarket shares; comparativelylimited resources or competen-cies make it unlikely they willsteal a significant portion ofconverted nonusers.
A market share leader in theindustry; has R&D and mar-keting competencies to pro-duce product modificationsor line extensions; has pro-motional resources to stimu-late primary demand amongcurrent nonusers.
Increase the amount of prod-uct used by the average cus-tomer by increasingfrequency of use or develop-ing new and more variedways to use the product.
Relatively high penetration butlow frequency of use in one ormore major segments; productused in only limited ways orfor special occasions; relativelyhomogeneous market withonly a few large segments.
Competitors hold relativelysmall market shares; compar-atively limited resources orcompetencies make it unlikelytheir brands will be puchasedfor newly developed uses.
A market share leader in theindustry; has marketing com-petencies and resources todevelop and promote newuses.
Expand the number of poten-tial customers by targetingunderdeveloped geographicareas or applications segments.
Relatively heterogeneous mar-ket with a variety of seg-ments; some geographicareas, including foreigncountries, with low penetra-tion; some product applica-tions underdeveloped.
Competitors hold relativelysmall market shares; haveinsufficient resources or com-petencies to preempt under-developed geographic areasor applications segments.
A market share leader in theindustry; has marketing anddistribution competenciesand resources to developnew global markets or applications segments.

Walker et al.: Marketing Strategy: A Decision−Focused Approach, Fourth Edition
III. Formulating Market Strategies
11. Strategies for Mature and Declining Markets
316 © The McGraw−Hill Companies, 2002
Section Three Formulating Marketing Strategies256
Exhibit 11.11Possible Marketing Actions for Accomplishing Growth Extension Objectives
Marketing strategy and objectives Possible marketing actions
Increased penetration
Convert current nonusers in target • Enhance product’s value by adding features, benefits, or services.segment into users • Enhance product’s value by including it in the design of integrated systems.
• Stimulate additional primary demand through promotional efforts stressing new features or benefits:
Advertising through selective media aimed at the target segment.Sales promotions directed at stimulating trial among current nonusers (e.g., tie-
ins with other products).Some sales efforts redirected toward new account generation, perhaps by
assigning some sales personnel as account development reps or by offering incentives for new account sales.
Improve product’s availability by developing innovative distribution systems.
Extended use
Increase frequency of use among • Move storage of the product closer to the point of end use by offering additional current users package sizes or designs.
• Encourage larger volume purchases (for nonperishable products):Offer quantity discounts.Offer consumer promotions to stimulate volume purchases or more frequent use
(e.g., multipack deals, frequent-flier programs).
• Reminder advertising stressing basic product benefits for a variety of usage occasions.
Encourage a wider variety of uses • Develop line extensions suitable for additional uses or applications.among current users • Develop and promote new uses, applications, or recipes for the basic product.
Include information about new applications/recipes on package.Develop extended use advertising campaign, particularly with print media.Communicate new application ideas through sales presentations to current customers.
• Encourage new uses through sales promotions (e.g., tie-ins with complementary products).
Market expansion
Develop differentiated positioning • Develop a differentiated flanker brand or product line with unique features or focused on untapped or price that is more appealing to a segment of potential customers whose needs are underdeveloped segments not met by existing offerings.
Or
• Develop multiple line extensions or brand offerings with features or prices targeted to the unique needs and preferences of several smaller potential applications or regional segments.
• Consider producing for private labels.
• Design advertising, personal selling, and/or sales promotion campaigns that address specific interests and concerns of potential customers in one or multiple underdeveloped segments to stimulate selective demand.
• Build unique distribution channels to more effectively reach potential customers in one or multiple underdeveloped segments.
• Design service programs to reduce the perceived risks of trial and/or solve the uniqueproblems faced by potential customers in one or multiple underdeveloped segments (e.g., systems engineering, installation, operator training, extended warranties).
• Enter global markets where product category is in an earlier stage of its life cycle.

Walker et al.: Marketing Strategy: A Decision−Focused Approach, Fourth Edition
III. Formulating Market Strategies
11. Strategies for Mature and Declining Markets
317© The McGraw−Hill Companies, 2002
Chapter Eleven Strategies for Mature and Declining Markets 257
summarizes the environmental situations where each of these strategies is most appropriate andthe objectives each is best suited for accomplishing. Exhibit 11.11 then outlines specific mar-keting actions a firm might employ to implement each of the strategies, as discussed in moredetail in the following paragraphs.
Increased Penetration Strategy The total sales volume produced by a target seg-ment of customers is a function of (1) the number of potential customers in the segment;(2) the product’s penetration of that segment, that is, the proportion of potential customerswho actually use the product; and (3) the average frequency with which customers con-sume the product and make another purchase. Where usage frequency is quite high amongcurrent customers but only a relatively small portion of all potential users actually buy theproduct, a firm might aim at increasing market penetration. It is an appropriate strategy foran industry’s share leader because such firms can more likely gain and retain a substantialshare of new customers than smaller firms with less-well-known brands.
The secret to a successful increased penetration strategy lies in discovering whynonusers are uninterested in the product. Very often the product does not offer sufficientvalue from the potential customer’s view to justify the effort or expense involved in buyingand using it. One obvious solution to such a problem is to enhance the product’s value topotential customers by adding features or benefits, usually via line extensions.
Another way to add value to a product is to develop and sell integrated systems that helpimprove the basic product’s performance or ease of use. For instance, instead of simplyselling control mechanisms for heating and cooling systems, Johnson Controls offers inte-grated facilities management programs designed to lower the total costs of operating acommercial building.
A firm also may enhance a product’s value by offering services that improve its per-formance or ease of use for the potential customer. Since it is unlikely that people who donot know how to knit will ever buy yarn or knitting needles, for example, most yarn shopsoffer free knitting lessons.
Product modifications or line extensions, however, will not attract nonusers unless theenhanced benefits are effectively promoted. For industrial goods, this may mean redirect-ing some sales efforts toward nonusers. The firm may offer additional incentives for newaccount sales or assign specific salespeople to call on targeted nonusers and convert theminto new customers. For consumer goods, some combination of advertising to stimulateprimary demand in the target segment and sales promotions to encourage trial, such as freesamples or tie-in promotions with complementary products that nonusers currently buy,can be effective.
Finally, some potential customers may be having trouble finding the product due to lim-ited distribution, or the product’s benefits may simply be too modest to justify much pur-chasing effort. In such cases, expanding distribution or developing more convenient andaccessible channels may help expand market penetration. For example, few travelers areso leery of flying that they would go through the effort of calling an insurance agent to buyan accident policy for a single flight. But the sales of such policies are greatly increasedby making them conveniently available through vending machines in airport terminals.
Extended Use Strategy Some years ago, the manager of General Foods’ Cool Whipfrozen dessert topping discovered through marketing research that nearly three-fourths ofall households used the product, but the average consumer used it only four times per yearand served it on only 7 percent of all toppable desserts. In situations of good market pen-etration but low frequency of use, an extended use strategy may increase volume. This wasparticularly true in the Cool Whip case; the relatively large and homogeneous target mar-ket consisted for the most part of a single mass-market segment. Also, General Foods heldnearly a two-thirds share of the frozen topping market, and it had the marketing resources
Walker et al.: Marketing Strategy: A Decision−Focused Approach, Fourth Edition
III. Formulating Market Strategies
11. Strategies for Mature and Declining Markets
318 © The McGraw−Hill Companies, 2002
Section Three Formulating Marketing Strategies258
and competencies to capture most of the additional volume that an extended use strategymight generate.
One effective approach for stimulating increased frequency of use is to move productinventories closer to the point of use. This approach works particularly well with low-involvement consumer goods. Marketers know that most consumers are unlikely to expendany additional time or effort to obtain such products when they are ready to use them. Ifthere is no Cool Whip in the refrigerator when the consumer is preparing dessert, forinstance, he or she is unlikely to run to the store immediately and probably will serve thedessert without topping.
One obvious way to move inventory closer to the point of consumption is to offer largerpackage sizes. The more customers buy at one time, the less likely they are to be out ofstock when a usage opportunity arises. This approach can backfire, though, for a perish-able product or one that consumers perceive to be an impulse indulgence. Thus, mostsuperpremium ice creams, such as Häagen-Dazs, are sold in small pint containers; mostconsumers want to avoid the temptation of having large quantities of such a high-calorieindulgence too readily available.
The design of a package also can help increase use frequency by making the productmore convenient or easy to use. Examples include single-serving packages of Jell-O pud-ding to pack in lunches, packages of paper cups that include a convenient dispenser, andfrozen-food packages that can go directly into a microwave oven.
Various sales promotion programs also help move inventories of a product closer to thepoint of use by encouraging larger volume purchases. Marketers commonly offer quantitydiscounts for this purpose in selling industrial goods. For consumer products, multi-itemdiscounts or two-for-one deals serve the same purpose. Promotional programs also encour-age greater frequency of use and increase customer loyalty in many service industries.Consider, for instance, the frequent-flier programs offered by major airlines.
Sometimes the product’s characteristics inhibit customers from using it more fre-quently. If marketers can change those characteristics, such as difficulty of preparation orhigh calories, a new line extension might encourage customers to use more of the productor to use it more often. Microwave waffles and low-calorie salad dressings are examplesof such line extensions. For industrial goods, however, firms may have to develop newtechnology to overcome a product’s limitations for some applications. For instance, John-son Controls recently acquired Prince Automotive to gain the expertise necessary todevelop instrument panels and consoles incorporating the sophisticated electronics desiredby top-end manufacturers such as BMW and Mercedes-Benz.
Finally, advertising can sometimes effectively increase use frequency by simplyreminding customers to use the product more often. For instance, General Foods con-ducted a reminder campaign for Jell-O pudding that featured Bill Cosby asking, “Whenwas the last time you served pudding, Mom?”
Another approach for extending use among current customers involves finding and pro-moting new functional uses for the product. Jell-O gelatin is a classic example, having gen-erated substantial new sales volume over the years by promoting the use of Jell-O as aningredient in salads, pie fillings, and other dishes.
Firms promote new ways to use a product through a variety of methods. For industrialproducts, firms send technical advisories about new applications to the salesforce to presentto their customers during regular sales calls. For consumer products, new use suggestionsor recipes may be included on the package, in an advertising campaign, or on the firm’swebsite. Sales promotions, such as including cents-off coupons in ads featuring a newrecipe, encourage customers to try a new application. To reduce costs, two or more manu-facturers of complementary products sometimes cooperate in running such promotions. A

Walker et al.: Marketing Strategy: A Decision−Focused Approach, Fourth Edition
III. Formulating Market Strategies
11. Strategies for Mature and Declining Markets
319© The McGraw−Hill Companies, 2002
Chapter Eleven Strategies for Mature and Declining Markets 259
recent ad promoting a simple Italian dinner, for instance, featured coupons for Kraft’sParmesan cheese, Pillsbury’s Soft Breadsticks, and Campbell’s Prego spaghetti sauce.
In some cases, slightly modified line extensions might encourage customers to use theproduct in different ways. Thus, Kraft introduced a jalapeño-flavored Cheese-Whiz in amicrowavable container and promoted the product as an easy-to-prepare topping for nachos.
Market Expansion Strategy In a mature industry with a fragmentedand heterogeneous market where some segments are less well developedthan others, a market expansion strategy may generate substantial addi-tional volume growth. Such a strategy aims at gaining new customers bytargeting new or underdeveloped geographic markets (either regional orforeign) or new customer segments. Once again, share leaders tend to be
best suited for implementing this strategy. But even smaller competitors can employ such astrategy successfully if they focus on relatively small or specialized market niches.
Pursuing market expansion by strengthening a firm’s position in new or underdevelopeddomestic geographic markets can lead to experience-curve benefits and operatingsynergies. The firm can rely on largely the same expertise and technology, and perhaps eventhe same production and distribution facilities, it has already developed. Unfortunately,domestic geographic expansion is often not viable in a mature industry because the shareleaders usually have attained national market coverage. Smaller regional competitors, on theother hand, might consider domestic geographic expansion a means for improving their vol-ume and share position. However, such a move risks retaliation from the large nationalbrands as well as from entrenched regional competitors in the prospective new territory.
To get around the retaliation problem, a regional producer might try to expand throughthe acquisition of small producers in other regions. This can be a viable option when (1)the low profitability of some regional producers enables the acquiring firm to buy theirassets for less than the replacement cost of the capacity involved and (2) synergies gainedby combining regional operations and the infusion of resources from the acquiring firmcan improve the effectiveness and profitability of the acquired producers. For example,Heileman Brewing Company grew from the 31st largest brewer of beer in the mid-1960sto the 4th largest by the mid-1980s through the acquisition of nearly 30 regional brands.Heileman took control of strong regional brands such as Old Style, Carling, and Rainier,but because it had no dominant national brand it avoided antitrust opposition to its acqui-sition program. After acquisition, Heileman maintained the identity of each brand,increased its advertising budget, and expanded its distribution by incorporating it into thefirm’s distribution system in other regions. As a result, Heileman achieved a strong earn-ings record for two decades, until the firm was itself acquired by an Australian brewer.
In a different approach to domestic market expansion, the firm identifies and developsentirely new customer or application segments. Sometimes the firm can effectively reachnew customer segments by simply expanding the distribution system without changing theproduct’s characteristics or the other marketing-mix elements. A sporting goods manufac-turer that sells its products to consumers through retail stores, for instance, might expandinto the commercial market consisting of schools and amateur and professional sportsteams by establishing a direct salesforce. In most instances, though, developing new mar-ket segments requires modifying the product to make it more suitable for the applicationor to provide more of the benefits desired by customers in the new segment.
One final possibility for domestic market expansion is to produce private-label brandsfor large retailers such as Sears or Safeway. Firms whose own brands hold relatively weakpositions and who have excess production capacity find this a particularly attractive option.Private labeling allows such firms to gain access to established customer segments without
Strategic Issue
In a fragmented and heterogeneous marketwhere some segments are less well developed than others, a market expansionstrategy may generate substantial additional volume growth.

Walker et al.: Marketing Strategy: A Decision−Focused Approach, Fourth Edition
III. Formulating Market Strategies
11. Strategies for Mature and Declining Markets
320 © The McGraw−Hill Companies, 2002
Section Three Formulating Marketing Strategies260
making substantial marketing expenditures, thus increasing the firm’s volume and lower-ing its per-unit costs. However, since private labels typically compete with low prices andtheir sponsors usually have strong bargaining power, producing private labels is often nota very profitable option unless a manufacturer already has a relatively low-cost position inthe industry. It also can be a risky strategy, particularly for the smaller firm, becausereliance on one or a few large private-label customers can result in drastic volume reduc-tions and unit-cost increases should those customers decide to switch suppliers.
Global Market Expansion—Sequential Strategies For firms with leading posi-tions in mature domestic markets, less-developed markets in foreign countries often pre-sent the most viable opportunities for geographic expansion. As discussed in previouschapters, firms can enter foreign markets in a variety of ways, from simply relying onimport agents to developing joint ventures to establishing wholly owned subsidiaries—asJohnson Controls has done by acquiring an automotive seat manufacturer in Europe.
Regardless of which mode of entry a firm chooses, it can follow a number of differentroutes when pursuing global expansion.22 By route we mean the sequence or order inwhich the firm enters global markets. Japanese companies provide illustrations of differ-ent global expansion paths. The most common expansion route involves moving fromJapan to developing countries to developed countries. They used this path, for example,with automobiles (Toyota), consumer electronics (National), watches (Seiko), cameras(Minolta), and home appliances, steel, and petrochemicals. This routing reduced manu-facturing costs and enabled them to gain marketing experience. In penetrating the U.S.market, the Japanese obtained further economies of scale and gained recognition for theirproducts, which would make penetration of European markets easier.
This sequential strategy succeeded: by the early 1970s, 60 percent of Japanese exportswent to developed countries—more than half to the United States. Japanese motorcyclesdominate Europe, as do its watches and cameras. Its cars have been able to gain arespectable share in most European countries.
A second type of expansion path has been used primarily for high-tech products such ascomputers and semiconductors. For the Japanese it consists of first securing their homemarket and then targeting developed countries. Japan largely ignored developing countriesin this strategy because of their small demand for high-tech products. When demandincreased to a point where developing countries became “interesting,” Japanese producersquickly entered and established strong market positions using price cuts of up to 50 percent.
A home market—developed markets—developing markets sequence is also usuallyappropriate for discretionary goods such as soft drinks, convenience foods, or cosmetics.Coca-Cola, for instance, believes that as disposable incomes and discretionary expendi-tures grow in the countries of South America, Asia, and Africa those markets will drivemuch of the company’s future growth. Similarly, firms such as the French cosmetics giantL’Oreal have positioned a number of different “world brands”—including Ralph Laurenperfumes, L’Oreal hair products, and Maybelline and Helena Rubinstein cosmetics—toconvey the allure of different cultures to developing markets around the world.23
Strategies for Declining Markets
Most products eventually enter a decline phase in their life cycles. As salesdecline, excess capacity once again develops. As the remaining competi-tors fight to hold volume in the face of falling sales, industry profits erode.Consequently, conventional wisdom suggests that firms should eitherdivest declining products quickly or harvest them to maximize short-term
Strategic Issue
The relative attractiveness of the decliningproduct-market and the business’s competitive position within it should dictate the appropriate strategy.
Walker et al.: Marketing Strategy: A Decision−Focused Approach, Fourth Edition
III. Formulating Market Strategies
11. Strategies for Mature and Declining Markets
321© The McGraw−Hill Companies, 2002
Chapter Eleven Strategies for Mature and Declining Markets 261
profits. Not all markets decline in the same way or at the same speed, however; nor do allfirms have the same competitive strengths and weaknesses within those markets. Therefore,as in most other situations, the relative attractiveness of the declining product-market and thebusiness’s competitive position within it should dictate the appropriate strategy.
Relative Attractiveness of Declining MarketsAlthough U.S. high school enrollment declined by about 2 million students from its peakin 1976 through the end of the 1980s, Jostens, Inc., the leading manufacturer of class ringsand other school merchandise, achieved annual increases in revenues and profits every yearduring that period. One reason for the firm’s success was that it saw the market declinecoming and prepared for it by improving the efficiency of its operations and developingmarketing programs that were effective at persuading a larger proportion of students to buyclass rings.24
Jostens’ experience shows that some declining product-markets can offer attractiveopportunities well into the future, at least for one or a few strong competitors. In otherproduct-markets, particularly those where decline is the result of customers switching to anew technology (e.g., more students buying personal computers instead of portable type-writers), the potential for continued profits during the decline stage is more bleak.
Three sets of factors help determine the strategic attractiveness of declining product-markets: conditions of demand, including the rate and certainty of future declines in vol-ume; exit barriers, or the ease with which weaker competitors can leave the market; andfactors affecting the intensity of future competitive rivalry within the market.25 The impactof these variables on the attractiveness of declining market environments is summarized inExhibit 11.12 and discussed below.
Conditions of Demand Demand in a product-market declines for a number of rea-sons. Technological advances produce substitute products (such as electronic calculatorsfor slide rules), often with higher quality or lower cost. Demographic shifts lead to ashrinking target market (baby foods). Customers’ needs, tastes, or lifestyles change (thefalling consumption of beef). Finally, the cost of inputs or complementary products risesand shrinks demand (the effects of rising gasoline prices on sales of recreational vehicles).
The cause of a decline in demand can affect both the rate and the predictability of thatdecline. A fall in sales due to a demographic shift, for instance, is likely to be gradual,whereas the switch to a technically superior substitute can be abrupt. Similarly, the fall indemand as customers switch to a better substitute is predictable, while a decline in salesdue to a change in tastes is not.
As Exhibit 11.12 indicates, both the rate and certainty of sales decline are demand char-acteristics that affect a market’s attractiveness. A slow and gradual decline allows anorderly withdrawal of weaker competitors. Overcapacity does not become excessive andlead to predatory competitive behavior, and the competitors who remain are more likely tomake profits than in a quick or erratic decline. Also, when most industry managers believemarket decline is predictable and certain, reduction of capacity is more likely to be orderlythan when they feel substantial uncertainty about whether demand might level off or evenbecome revitalized.
Not all segments of a market decline at the same time or at the same rate. The numberand size of enduring niches or pockets of demand and the customer purchase behaviorwithin them also influence the continuing attractiveness of the market. When the demandpockets are large or numerous and the customers in those niches are brand loyal and rela-tively insensitive to price, competitors with large shares and differentiated products cancontinue to make substantial profits. For example, even though the market for cigars

Walker et al.: Marketing Strategy: A Decision−Focused Approach, Fourth Edition
III. Formulating Market Strategies
11. Strategies for Mature and Declining Markets
322 © The McGraw−Hill Companies, 2002
Section Three Formulating Marketing Strategies262
shrank for years, there continued to be a sizable number of smokers who bought premium-quality cigars. Those firms with well-established positions at the premium end of the cigarindustry have continued to earn above-average returns. And recently, the cigar market hasbeen growing again.
Exit Barriers The higher the exit barriers, the less hospitable a product-market will beduring the decline phase of its life cycle. When weaker competitors find it hard to leave aproduct-market as demand falls, excess capacity develops and firms engage in aggressivepricing or promotional efforts to try to prop up their volume and hold down unit costs.Thus, exit barriers lead to competitive volatility.
Once again, Exhibit 11.12 indicates that a variety of factors influence the ease withwhich businesses can exit an industry. One critical consideration involves the amount ofhighly specialized assets. Assets unique to a given business are difficult to divest becauseof their low liquidation value. The only potential buyers for such assets are other firms whowould use them for a similar purpose, which is unlikely in a declining industry. Thus, thefirm may have little choice but to remain in the business or to sell the assets for their scrap
Exhibit 11.12Factors Affecting the Attractiveness of Declining Market Environments
Environmental Attractiveness
Conditions of demand Hospitable Inhospitable
Speed of decline Very slow Rapid or erratic
Certainty of decline 100% certain, predictable patterns Great uncertainty, erratic patterns
Pockets of enduring demand Several or major ones No niches
Product differentiation Brand loyalty Commoditylike products
Price stability Stable, price premiums attainable Very unstable, pricing below costs
Exit barriers
Reinvestment requirements None High, often mandatory and involving capital assets
Excess capacity Little Substantial
Asset age Mostly old assets Sizable new assets and old ones not retired
Resale markets for assets Easy to convert or sell No markets available, substantial costs to retire
Shared facilities Few, freestanding plants Substantial and interconnected with important businesses
Vertical integration Little Substantial
Single-product competitors None Several large companies
Rivalry determinants
Customer industries Fragmented, weak Strong bargaining power
Customer switching costs High Minimal
Diseconomies of scale None Substantial penalty
Dissimilar strategic groups Few Several in same target markets
Source: Reprinted by permission of Harvard Business Review from “End-Game Strategies for Declin-ing Industries,” by Kathryn Rudie Harrigan and Michael E. Porter, July–August 1983, p. 116. Copyright© 1983 by the Harvard Business School Publishing Corporation, all rights reserved.

Walker et al.: Marketing Strategy: A Decision−Focused Approach, Fourth Edition
III. Formulating Market Strategies
11. Strategies for Mature and Declining Markets
323© The McGraw−Hill Companies, 2002
Chapter Eleven Strategies for Mature and Declining Markets 263
value. This option is particularly unattractive when the assets are relatively new and notfully depreciated.
Another major exit barrier occurs when the assets or resources of the declining businessintertwine with the firm’s other business units, either through shared facilities and pro-grams or through vertical integration. Exit from the declining business might shut downshared production facilities, lower salesforce commissions, damage customer relations,and increase unit costs in the firm’s other businesses to a point that damages their prof-itability. Emotional factors also can act as exit barriers. Managers often feel reluctant toadmit failure by divesting a business even though it no longer produces acceptable returns.This is especially true when the business played an important role in the firm’s history andit houses a large number of senior managers.
Intensity of Future Competitive Rivalry Even when substantial pockets of con-tinuing demand remain within a declining business, it may not be wise for a firm to pur-sue them in the face of future intense competitive rivalry. In addition to exit barriers, otherfactors also affect the ability of the remaining firms to avoid intense price competition andmaintain reasonable margins: size and bargaining power of the customers who continue tobuy the product; customers’ ability to switch to substitute products or to alternative sup-pliers; and any potential diseconomies of scale involved in capturing an increased share ofthe remaining volume.
Divestment or LiquidationWhen the market environment in a declining industry is unattractive or a business has arelatively weak competitive position, the firm may recover more of its investment by sell-ing the business in the early stages of decline rather than later. The earlier the business issold, the more uncertain potential buyers are likely to be about the future direction ofdemand in the industry and thus the more likely that a willing buyer can be found. Thus,Raytheon sold its vacuum-tube business in the early 1960s even though transistors had justbegun replacing tubes in radios and TV sets and there was still a strong replacementdemand for tubes. By moving early, the firm achieved a much higher liquidation value thancompanies that tried to unload their tube-making facilities in the 70s when the industry wasclearly in its twilight years.26
Of course, the firm that divests early runs the risk that its forecast of the industry’sfuture may be wrong. Also, quick divestment may not be possible if the firm faces highexit barriers, such as interdependencies across business units or customer expectations ofcontinued product availability. By planning early for departure, however, the firm may beable to reduce some of those barriers before the liquidation is necessary.
Marketing Strategies for Remaining CompetitorsConventional wisdom suggests that a business remaining in a declining product-marketshould pursue a harvesting strategy aimed at maximizing its cash flow in the short run. Butsuch businesses also have other strategic options. They might attempt to maintain theirposition as the market declines, improve their position to become the profitable survivor,or focus efforts on one or more remaining demand pockets or market niches. Once again,the appropriateness of these strategies depends on factors affecting the attractiveness of thedeclining market and on the business’s competitive strengths and weaknesses. Exhibit11.13 summarizes the situational determinants of the appropriateness of each strategy.Some of the marketing actions a firm might take to implement them are discussed next andlisted in Exhibit 11.14.

Walker et al.: Marketing Strategy: A Decision−Focused Approach, Fourth Edition
III. Formulating Market Strategies
11. Strategies for Mature and Declining Markets
324 © The McGraw−Hill Companies, 2002
Section Three Formulating Marketing Strategies264
Harvesting Strategy The objective of a harvesting or milking strategy is to generatecash quickly by maximizing cash flow over a relatively short term. This typically involvesavoiding any additional investment in the business, greatly reducing operating (includingmarketing) expenses, and perhaps raising prices. Since the firm usually expects to ulti-mately divest or abandon the business, some loss of sales and market share during the pur-suit of this strategy is likely. The trick is to hold the business’s volume and share declinesto a relatively slow and steady rate. A precipitous and premature loss of share would limitthe total amount of cash the business could generate during the market’s decline.
A harvesting strategy is most appropriate for a firm holding a relatively strong compet-itive position in the market at the start of the decline and a cadre of current customers likelyto continue buying the brand even after marketing support is reduced. Such a strategy alsoworks best when the market’s decline is inevitable but likely to occur at a relatively slowand steady rate and when rivalry among remaining competitors is not likely to be veryintense. Such conditions enable the business to maintain adequate price levels and profitmargins as volume gradually falls.
Exhibit 11.13Situational Determinants of Appropriate Marketing Objectives and Strategies for Declining Markets
Strategies for Declining Markets
Situational variables Harvesting Maintenance Profitable survivor Niche
Primary objective
Market characteristics
Competitors’characteristics
Firm’s characteristics
Maximize short-termcash flow; maintainor increase marginseven at the expenseof a slow decline inmarket share.
Future market declineis certain, but likelyto occur at a slowand steady rate.
Few strong competitors;low exit barriers;future rivalry notlikely to be intense.
Has a leading shareposition; has a substantial proportion of loyalcustomers who arelikely to continuebuying brand even if marketing supportis reduced.
Maintain share in shortterm as marketdeclines, even if margins must be sacrificed.
Market has experiencedrecent declines, butfuture direction andattractiveness arecurrently hard to predict.
Few strong competi-tors, but intensity offuture rivalry is hardto predict.
Has a leading share of the market and arelatively strong competitive position.
Increase share of thedeclining market withan eye to future profits; encourageweaker competitorsto exit.
Future market declineis certain, but likelyto occur at a slowand steady rate; substantial pocketsof demand will continue to exist.
Few strong competi-tors; exit barriers are low or can bereduced by firm’sintervention.
Has a leading share of the market and astrong competitiveposition; has superior resources or competencies nec-essary to encouragecompetitors to exit or to acquire them.
Focus on strengtheningposition in one or a few relatively sub-stantial segmentswith potential forfuture profits.
Overall market maydecline quickly, but one or more segments will remainas demand pocketsor decay slowly.
One or more strongercompetitors in massmarket, but not inthe target segment.
Has a sustainable com-petitive advantage in target segment,but overall resourcesmay be limited.
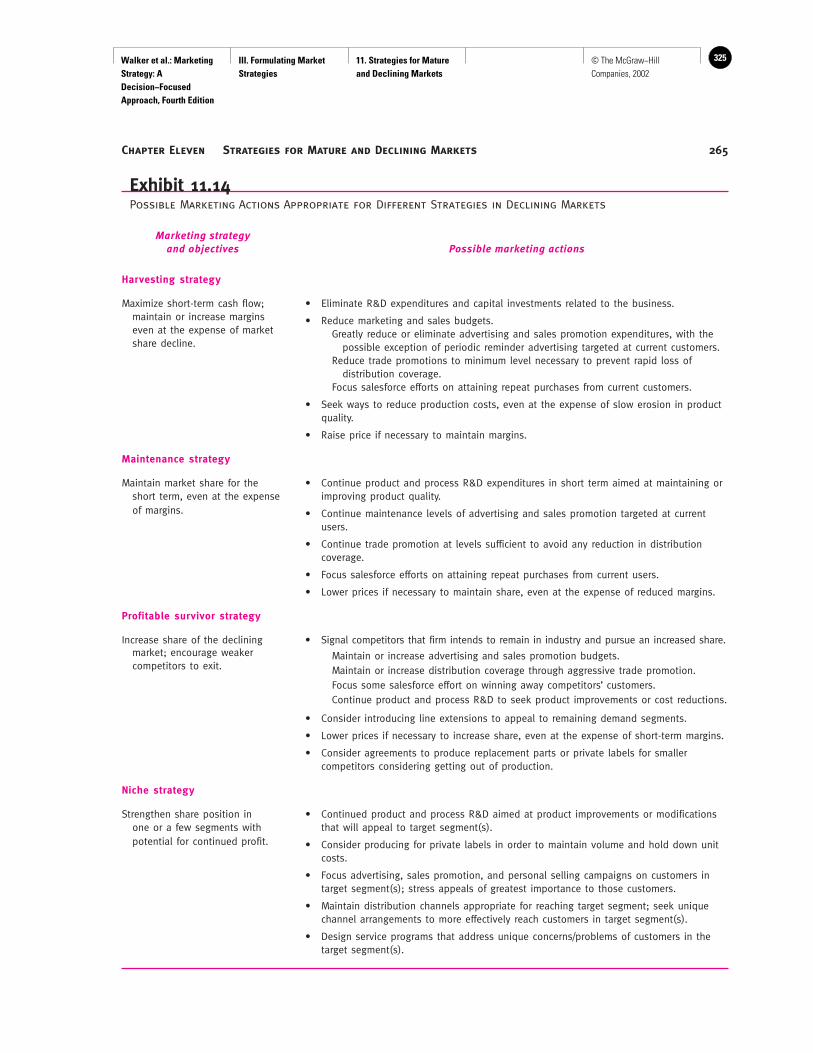
Walker et al.: Marketing Strategy: A Decision−Focused Approach, Fourth Edition
III. Formulating Market Strategies
11. Strategies for Mature and Declining Markets
325© The McGraw−Hill Companies, 2002
Chapter Eleven Strategies for Mature and Declining Markets 265
Exhibit 11.14Possible Marketing Actions Appropriate for Different Strategies in Declining Markets
Marketing strategyand objectives Possible marketing actions
Harvesting strategy
Maximize short-term cash flow; • Eliminate R&D expenditures and capital investments related to the business.maintain or increase margins • Reduce marketing and sales budgets.even at the expense of market Greatly reduce or eliminate advertising and sales promotion expenditures, with the share decline. possible exception of periodic reminder advertising targeted at current customers.
Reduce trade promotions to minimum level necessary to prevent rapid loss of distribution coverage.
Focus salesforce efforts on attaining repeat purchases from current customers.
• Seek ways to reduce production costs, even at the expense of slow erosion in product quality.
• Raise price if necessary to maintain margins.
Maintenance strategy
Maintain market share for the • Continue product and process R&D expenditures in short term aimed at maintaining or short term, even at the expense improving product quality.of margins. • Continue maintenance levels of advertising and sales promotion targeted at current
users.
• Continue trade promotion at levels sufficient to avoid any reduction in distribution coverage.
• Focus salesforce efforts on attaining repeat purchases from current users.
• Lower prices if necessary to maintain share, even at the expense of reduced margins.
Profitable survivor strategy
Increase share of the declining • Signal competitors that firm intends to remain in industry and pursue an increased share.market; encourage weaker Maintain or increase advertising and sales promotion budgets.competitors to exit. Maintain or increase distribution coverage through aggressive trade promotion.
Focus some salesforce effort on winning away competitors’ customers.Continue product and process R&D to seek product improvements or cost reductions.
• Consider introducing line extensions to appeal to remaining demand segments.
• Lower prices if necessary to increase share, even at the expense of short-term margins.
• Consider agreements to produce replacement parts or private labels for smaller competitors considering getting out of production.
Niche strategy
Strengthen share position in • Continued product and process R&D aimed at product improvements or modificationsone or a few segments with that will appeal to target segment(s).potential for continued profit. • Consider producing for private labels in order to maintain volume and hold down unit
costs.
• Focus advertising, sales promotion, and personal selling campaigns on customers in target segment(s); stress appeals of greatest importance to those customers.
• Maintain distribution channels appropriate for reaching target segment; seek unique channel arrangements to more effectively reach customers in target segment(s).
• Design service programs that address unique concerns/problems of customers in the target segment(s).
Walker et al.: Marketing Strategy: A Decision−Focused Approach, Fourth Edition
III. Formulating Market Strategies
11. Strategies for Mature and Declining Markets
326 © The McGraw−Hill Companies, 2002
Section Three Formulating Marketing Strategies266
Implementing a harvesting strategy means avoiding any additional long-term investmentsin plant, equipment, or R&D. It also necessitates substantial cuts in operating expendituresfor marketing activities. This often means that the firm should greatly reduce the number ofmodels or package sizes in its product line to reduce inventory and manufacturing costs.
The business should improve the efficiency of sales and distribution. For instance, anindustrial goods manufacturer might service its smaller accounts through telemarketing ora website rather than a field salesforce or assign its smaller customers to agent middlemen.For consumer goods, the business might move to more selective distribution by concen-trating its efforts on the larger retail chains.
The firm would likely reduce advertising and promotion expenditures, usually to theminimum level necessary to retain adequate distribution. Finally, the business shouldattempt to maintain or perhaps even increase its price levels to increase margins.
Maintenance Strategy In markets where future volume trends are highly uncertain, abusiness with a leading share position might consider pursuing a strategy aimed at main-taining its market share, at least until the market’s future becomes more predictable. In sucha maintenance strategy, the business continues to pursue the same strategy that brought itsuccess during the market’s mature stage. This approach often results in reduced marginsand profits in the short term, though, because firms usually must reduce prices or increasemarketing expenditures to hold share in the face of declining industry volume. Thus, a firmshould consider share maintenance an interim strategy. Once it becomes clear that the mar-ket will continue to decline, the business should switch to a different strategy that will pro-vide better cash flows and return on investment over the market’s remaining life.
Profitable Survivor Strategy An aggressive alternative for a business with a strongshare position and a sustainable competitive advantage in a declining product-market is toinvest enough to increase its share position and establish itself as the industry leader forthe remainder of the market’s decline. This kind of strategy makes most sense when thefirm expects a gradual decline in market demand or when substantial pockets of continu-ing demand are likely well into the future. It is also an attractive strategy when a firm’sdeclining business is closely intertwined with other SBUs through shared facilities andprograms or common customer segments.
A strong competitor often can improve its share position in a declining market at relativelylow cost because other competitors may be harvesting their businesses or preparing to exit.The key to the success of such a strategy is to encourage other competitors to leave the mar-ket early. Once the firm has achieved a strong and unchallenged position, it can switch to aharvesting strategy and reap substantial profits over the remaining life of the product-market.
A firm might encourage smaller competitors to abandon the industry by being visible andexplicit about its commitment to become the leading survivor. It should aggressively seekincreased market share, either by cutting prices or by increasing advertising and promotionexpenditures. It also might introduce line extensions aimed at remaining pockets of demandto make it more difficult for smaller competitors to find profitable niches. Finally, the firmmight act to reduce its competitors’ exit barriers, making it easier for them to leave the indus-try. This could involve taking over competitors’ long-term contracts, agreeing to supply spareparts or to service their products in the field, or providing them with components or private-label products. For instance, large regional bakeries have encouraged grocery chains to aban-don their own bakery operations by supplying them with private-label baked goods.
The ultimate way to remove competitors’ exit barriers is to purchase their operationsand either improve their efficiency or remove them from the industry to avoid excesscapacity. With continued decline in industry sales a certainty, smaller competitors may beforced to sell their assets at a book value price low enough for the survivor to reap high
www

Walker et al.: Marketing Strategy: A Decision−Focused Approach, Fourth Edition
III. Formulating Market Strategies
11. Strategies for Mature and Declining Markets
327© The McGraw−Hill Companies, 2002
Chapter Eleven Strategies for Mature and Declining Markets 267
returns on its investment, as Heileman Brewing Company did on its acquisitions of smallerregional brewers during the 1970s and 80s.
Niche Strategy Even when most segments of an industry are expected to decline rap-idly, a niche strategy may still be viable if one or more substantial segments will eitherremain as stable pockets of demand or decay slowly. The business pursuing such a strategy should have a strong competitive position in the target segment or be able to builda sustainable competitive advantage relatively quickly to preempt competitors. This is onestrategy that even smaller competitors can sometimes successfully pursue, because they can focus the required assets and resources on a limited portion of the total market.The marketing actions a business might take to strengthen and preserve its position in atarget niche are similar to those discussed earlier concerning niche strategies in maturemarkets.
Take Aways
• Strategic choices in mature, or even declining, marketsare by no means always bleak. Many of the world’smost profitable companies operate largely in suchmarkets.
• A critical marketing objective for all competitors in amature market is to maintain the loyalty of existingcustomers. To accomplish that goal, firms must pursueimprovements in the perceived value those customersreceive from their offerings—either by differentiatingthemselves on the basis of superior quality or service,by lowering costs and prices, or both.
• An important secondary objective for some firms, par-ticularly share leaders, in mature markets is to stimu-late further volume growth by taking actions to
convert nonusers into users, to increase use frequencyamong current users, or to expand into untapped orunderdeveloped markets.
• Declining markets can still offer attractive opportuni-ties for sales revenues and profits. Their attractive-ness—and the appropriate marketing strategy tofollow—depends on, among other things, the pace andcertainty of market decline, the presence of exit barri-ers, the firm’s competitive strengths, and the likelyintensity of future competition.
• Self-diagnostic questions to test your ability toapply the analytical tools and concepts in thischapter to marketing decision making may be found atthis book’s website at www.mhhe.com/walker.
Endnotes
1. This example is based on material found in Rick Tetzeli, “Mining Moneyin Mature Markets,” Fortune, March 22, 1993, pp. 77–80; and in the JohnsonControls Inc. 2000 Annual Report, which can be found at the company’s web-site at www.jci.com.
2. For a more detailed discussion of these traps, see Michael E. Porter, Com-petitive Strategy (New York: Free Press, 1980), pp. 247–49.
3. Fareena Sultan, John U. Farley, and Donald R. Lehmann, “A Meta-Analysisof Applications of Diffusion Models,” Journal of Marketing Research, Febru-ary 1990. pp. 70–77.
4. Ming Jer Chen and Ian C. MacMillan, “Nonresponse and DelayedResponse to Competitive Moves: The Roles of Competitor Dependence andAction Irreversibility,” Academy of Management Journal 35 (1992), pp.539–70; and Hubert Gatignon, Eric Anderson, and Kristiann Helsen, “Com-petitive Reaction to Market Entry: Explaining Interfirm Differences,” Journalof Marketing Research, February 1989, pp. 45–55.
5. Cathy Anterasian and Lynn W. Phillips, “Discontinuities, Value Delivery,and the Share-Returns Association: A Re-Examination of the ‘Share-Causes-Profits’ Controversy,” distributed working paper (Cambridge, MA: MarketingScience Institute, April 1988). Also see Robert Jacobson, “Distinguishingamong Competing Theories of the Market Share Effect,” Journal of Market-ing, October 1988, pp. 68–80.
6. William K. Hall, “Survival Strategies in a Hostile Environment,” HarvardBusiness Review, September–October 1980, pp. 75–85.
7. Michael Treacy and Fred Wiersema, The Discipline of Market Leaders(Reading, MA: Addison-Wesley Publishing, 1995).
8. Rahul Jacob, “Beyond Quality and Value,” Fortune, Special Issue,Autumn–Winter 1993, pp. 8–11.
9. The following discussion is based on material found in David A. Garvin,“What Does ‘Product Quality’ Really Mean?” Sloan Management Review,Fall 1984, pp. 25–43; and David A. Aaker, Strategic Market Management, 5thed. (New York: John Wiley & Sons, 1998), chap. 9.
10. For a more extensive discussion of brand equity, see David A. Aaker,Brand Equity (New York: Free Press, 1991).
11. Valarie A. Zeithaml, A. Parasuraman, and Leonard L. Berry, DeliveringQuality Service: Balancing Customer Perceptions and Expectations (NewYork: Free Press, 1990). See also Valarie A. Zeithaml and Mary Jo Bitner,Services Marketing (New York: McGraw-Hill, 1996).
12. For a more detailed discussion of these and other approaches for lower-ing costs, see Aaker, Strategic Market Management, chap. 10.
13. Akshay R. Rao, Mark E. Bergen, and Scott Davis, “How to Fight a PriceWar,” Harvard Business Review, March–April 2000, pp. 107–16.

Walker et al.: Marketing Strategy: A Decision−Focused Approach, Fourth Edition
III. Formulating Market Strategies
11. Strategies for Mature and Declining Markets
328 © The McGraw−Hill Companies, 2002
Section Three Formulating Marketing Strategies268
14. This percentage decline is based on the University of Michigan’s annualpoll of customer satisfaction among a sample of 50,000 consumers, asreported in Diane Brady, “Why Service Stinks,” Business Week, October 23,2000, p. 120.
15. Ronald Henkoff, “Getting beyond Downsizing,” Fortune, January 10,1994, pp. 58–64.
16. Robert Jacobson and David A. Aaker, “The Strategic Role of ProductQuality,” Journal of Marketing, October 1987, pp. 31–44.
17. David Greising, “Quality: How to Make It Pay,” Business Week, August 8,1994, pp. 54–59.
18. For a discussion of various approaches to measuring customer satisfac-tion, see J. Joseph Cronin and Steven A. Taylor, “Measuring Service Quality:A Reexamination and Extension,” Journal of Marketing, July 1992, pp.55–68; and Susan J. Devlin and H. K. Dong, “Service Quality from the Cus-tomer’s Perspective,” Marketing Research 6 (1994), pp. 5–13.
19. Frederick F. Reichheld, “Loyalty and the Renaissance of Marketing,”Marketing Management 2 (1994), pp. 10–21. Also see Rahul Jacob, “WhySome Customers Are More Equal Than Others,” Fortune, September 19,1994, pp. 215–24.
20. Reichheld, “Loyalty and the Renaissance of Marketing.” See also ThomasO. Jones and W. Earl Sasser Jr., “Why Satisfied Customers Defect,” HarvardBusiness Review, November–December 1995, pp. 88–99.
21. The following discussion is largely based on Brady, “Why ServiceStinks,” pp. 118–28.
22. The following discussion of sequential strategies is based largely on mate-rial found in Somkid Jatusripitak, Liam Fahey, and Philip Kotler, “StrategicGlobal Marketing: Lessons from the Japanese,” Columbia Journal of WorldBusiness, Spring 1985, pp. 47–53.
23. Gail Edmonson, “The Beauty of Global Branding,” Business Week,June 28, 1999, pp. 70–75.
24. Jaclyn Fierman, “How to Make Money in Mature Markets,” Fortune,November 25, 1985, p. 47.
25. Kathryn Rudie Harrigan and Michael E. Porter, “End-Game Strategies forDeclining Industries,” Harvard Business Review, July–August 1983,pp. 111–20. Also see Kathryn Rudie Harrigan, Managing Maturing Busi-nesses (New York: Lexington Books, 1988).
26. Harrigan and Porter, “End-Game Strategies,” p. 114.
Walker et al.: Marketing Strategy: A Decision−Focused Approach, Fourth Edition
III. Formulating Market Strategies
12. Marketing Strategies for the New Economy
329© The McGraw−Hill Companies, 2002
270
Chapter Twelve
MARKETING STRATEGIES
FOR THE NEW ECONOMY
When Something Clicks: An Old-Economy CameraRetailer Gets Web-Savvy1
Korean-born Jack Shin opened Camera Worldin a musty downtown location in Portland,Oregon, in 1977. By refusing to sell cheap
“gray-market” goods (such goods are not meant bytheir overseas manufacturers to be sold in theUnited States and are generally not covered bymanufacturers’ warranties) that many dealers werepushing, Shin built close relationships with Fuji,Canon, Nikon, and other leaders in the photographyworld and parlayed those relationships into a thriv-ing family business. By providing expert advice andfirst-rate customer service to retail and mail-ordercustomers, Shin and his family made sure that cus-tomers who shopped at Camera World becamerepeat customers. In 1996, though, after strugglingthrough several years of a flat camera market andworn out from the daily challenges every entrepre-neur faces, Shin decided to sell his business.
Word of the availability of Camera World reachedAlessandro Mina, a native Swede who, with two fellow European students in the MBA program atStanford, had founded Sverica International, aninvestment vehicle designed to acquire and trans-form old-economy businesses into aggressivegrowth companies by taking advantage of new-economy technologies. Camera World “fit all our cri-teria,” Mina recalls. “It was profitable. Sales were
stagnant, but there was a growth opportunity. Theowner was retiring, and there was a successful mail-order business in place. It had a huge database ofhappy customers who came to Camera World in thesame way people go to Amazon.com for books orDell Computer for computers—they go there prettymuch knowing what they want. I held the view thatInternet and mail-order sales are basically the samethat way, so I thought it had all the ingredients fora great Web business.” The company even had awebsite, though visitors could not use it to makepurchases.
Transforming the Business
Mina bought the company and named its onlinearm Cameraworld.com. Fortunately, many of thekey ingredients to build a new-economy businesswere already in place. The company already hadfigured out how to take orders, process and shipthem, and process returns where necessary. Itenjoyed long-established relationships with top-tier suppliers and had built innovative systems toprovide customer service. Its phone lines werestaffed by professional photographers (or photog-raphers with day jobs) who knew their stuff. The
Walker et al.: Marketing Strategy: A Decision−Focused Approach, Fourth Edition
III. Formulating Market Strategies
12. Marketing Strategies for the New Economy
330 © The McGraw−Hill Companies, 2002
271
key challenges that remained involved transform-ing the Web pages from simple brochures into agenuine transaction site and marrying the com-pany’s back-end systems to whatever happenedon the Web. The toughest challenge, though, wastime. Mina wanted his new company to becomethe leading online camera retailer before a com-petitor could.
Mina moved the company’s distributionfacility into a new and better-organizedwarehouse four times the size of its pre-
vious home, but with lower rent and reduced laborcosts. “Because the warehouse was larger and bet-ter organized, we made more shipments on time”—within 24 hours instead of five days—“with fewererrors.” Mina hired Web Northwest, the designer ofthe original Camera World website, to transform its300-visitors-a-day site into a visually appealing,highly interactive one. He spent $20,000 on newservers to crank up the site’s capacity. By early2000, the Cameraworld.com site, which costsroughly $10,000 per month to maintain, was han-dling 15,000 visitors and 400 transactions per day.The site, now a full-fledged community for photoenthusiasts, offers a selection wizard to help cus-tomers choose the right camera, online chats withnoted photographers, and an Internet telephony
feature that lets customers talk online with thesales and support staff.
Growing the Business
Among Camera World’s happy customers was anamateur wildlife photographer named Aneel Bhusri,whose real job was as a partner in Greylock, aBoston-based venture capital firm. In 1999, Greylockand five other venture capitalists invested $60 mil-lion to help Mina scale up the business. More onlineand offline ads, more sales and support staff, and anew CEO whom Mina helped find, Terry Strom, for-mer CEO of Egghead Software, will take the com-pany from an Internet start-up to an establishede-commerce player, if all goes well. Mina, now livingin Boston, is happy to let others grow the company.“I can go back to what I do best—finding good com-panies to invest in,” Mina says. Investor Bhusri isthrilled at having an opportunity to play a leadingrole in an Internet company that, as he says, “getsit. If you look at what makes a website successful,most of it is logistics. Camera World had this figuredout a long time ago. Why don’t others? I honestlydon’t know the answer. These guys are rare. I thinkthey can be the Dell of the camera business.”
Strategic Challenges Addressed
in Chapter 12
As the Camera World example shows, the opportunities presented by the Internet and othersectors of the new economy can transform old-economy companies and provide com-pelling opportunities for growth. Leaders of virtually every company today are, at a mini-mum, wondering what they should do about the Internet, the development of newcommunications media and technologies from broadband cable to mobile telephony, andother such developments. Some are committing significant resources in hopes of takingadvantage of these new developments. But the optimal path through the new-economymaze is far from clear for most companies.
Thus, in Chapter 12, we address several timely and important questions that marketingstrategists in today’s companies and entrepreneurs must ask. Does the company need anew-economy strategy? Do the technological advances of the new economy represent
www

Walker et al.: Marketing Strategy: A Decision−Focused Approach, Fourth Edition
III. Formulating Market Strategies
12. Marketing Strategies for the New Economy
331© The McGraw−Hill Companies, 2002
Section Three Formulating Marketing Strategies272
threats or opportunities? Most importantly, how should marketersaddress the development of strategies to take advantage of—or defendagainst—the rapid pace of change inherent in the new economy: Whatmarketing roles can the Internet and other recent and future technologi-cal developments play, and which of these should be pursued?
We begin by reviewing several trends that highlight the growing importance of the Inter-net and other new-economy technological developments. We then identify the key advan-tages and disadvantages inherent in new-economy phenomena, all of which every companymust clearly understand. Next, we identify the marketing roles that new-economy tech-nologies can plausibly play in marketing strategies, and we articulate a decision frameworkfor managers to use to decide which of the growing array of new-economy tools their firmsshould employ—from Web-based marketing research to advertising on mobile phones tothe delivery of digitized information, goods, and services over the Web. Finally, we exam-ine what has gone wrong in the dot-com world to date, and we identify some key successfactors in developing market offerings to successfully serve new-economy markets.
Does Every Company Need a
New-Economy Strategy?
Like it or not, the new economy is here to stay. But exactly what do people mean by thisubiquitous phrase? By new economy, we mean the industries that fuel the development ofor participate significantly in electronic commerce and the Internet, develop and marketcomputer hardware and software, and develop or provide any of the growing array of telecommunications services. The obvious players are dot-com retailers such as Amazon.com, Web portals such as Yahoo! and America Online, companies such as Ciscoand 3Com that make much of the hardware on which the Internet runs, software firms suchas Netscape and Microsoft, and telecom companies such as AT&T, EchoStar, and Qwestwhose communications networks permit the transmission of voice or data over variouskinds of wire-line, wireless, and satellite networks. However, many formerly old-economycompanies are making increasingly significant commitments to new-economy technolo-
gies. Longtime bricks-and-mortar retailers such as Gap and Wal-Mart,century-old manufacturing companies large and small whose electronicdata interchange (EDI) systems are critical to their sourcing and/or sell-ing, and service businesses such as Kinko’s are all committed to the new
economy in one way or another. These days, every company is asking itself, “Do we needan Internet (or other new-economy-based) strategy?”
The growing adoption in both consumer and commercial sectors of the Internet, wirelesstelephony, and other new-economy technologies is making this question an imperative one.The Gartner Group forecasts that by 2004 75 percent of U.S. households will have Internetaccess, of which 29 million households will be broadband-enabled.2 Broadband, or high-speed, connections that permit data transmission dramatically faster than today’s 56Kmodems will, according to Gartner, account for three-quarters of the $10,000 worth of goodsand services that Gartner says will be bought online on average by each U.S. household in2006. And the new economy is not just an American phenomenon. In 2000, nearly 400 mil-lion people worldwide had online access, of which only one-third were in the United States(see Exhibit 12.1).3 Mobile telephones, more prevalent in Europe than in the United States,will soon surpass 100 percent penetration in some countries. New technologies will makemany of these phones able to receive advertisements and will provide mobile access to theWeb. Adding GPS (global positioning satellite) technology to the mix makes the possibilitieseven more intriguing, since marketers will know both who and where we are!
Strategic Issue
What marketing roles can the Internet andother recent and future technological devel-opments play, and which of these should bepursued?
Strategic Issue
“Do we need an Internet (or other new-economy-based) strategy?”
www

Walker et al.: Marketing Strategy: A Decision−Focused Approach, Fourth Edition
III. Formulating Market Strategies
12. Marketing Strategies for the New Economy
332 © The McGraw−Hill Companies, 2002
Chapter Twelve Marketing Strategies for the New Economy 273
Jupiter Research reports that online consumer spending in 1999 accounted for morethan $1 billion in sales in at least four categories: air travel, hotels, personal computers,and books. Jupiter estimates that consumer spending online will grow from $17.3 billionin 1999 to $86.3 billion in 2003.4 The same sort of growth is also happening in business-to-business e-commerce. While B2B (business-to-business) e-commerce accounted foronly $215 million in 1999 (not counting business done via EDI channels), according toAMR Research Inc., or just 1.4 percent of all commercial transactions, it is expected toexplode to $5.7 trillion by 2004.
What should marketers conclude from these trends? Notwithstanding the ups anddowns of stock market valuations of new-economy companies, notwithstanding the diffi-culties many B2B and B2C (business-to-consumer) companies are having in developingbusiness models that actually make money,5 and notwithstanding the so-called digitaldivide, in which some segments of the population are dramatically underrepresented in theInternet population, the long-term prospects for doing business in the new economy arestill enormous. Americans’ love affair with entrepreneurs and the huge supply of availableventure capital money (notwithstanding the industry downturn in 2000 and 2001),6 com-bined with the growing market acceptance of and the inherent advantages brought by theInternet and other new-economy technologies, suggest that nearly every American com-pany needs to examine how it will be affected by and can take advantage of these new tech-nologies (see Exhibit 12.2). The rapid pace of Internet adoption outside the United Statessuggests that the same can be said in most other developed and developing countries.
The outcome of such an examination should be the development of one’s own new-economy strategy in most companies of significant size or scope. The fact that one’s com-petitors will surely develop and deploy such strategies is a further argument for doing so.But marketers should take heart, for the good news is this. “In the end, e-consumers ande-businesses aren’t so different from traditional buyers and sellers after all. Customers are,
Exhibit 12.1Top 10 Countries in Internet Use
Source: “Internet Use,” Newsweek, October 2, 2000, p. 74L. Copyright 2000 Newsweek, Inc. All rightsreserved. Reprinted by permission.
Top 10 countries in Internet use����� ��� ��� � �� ������ ��� ��� ��� ������ ��� ���� � ���� ���� � � �� ��� � ���� ��
�� ��������
� !
"! #
"" #
"$ %
"� &
"� %
"� �
"� "
&# �
"�� �
'����
(��)
���*
����� +�� �
,�����
,���
(����
- ����*
.����
��� � ���� �
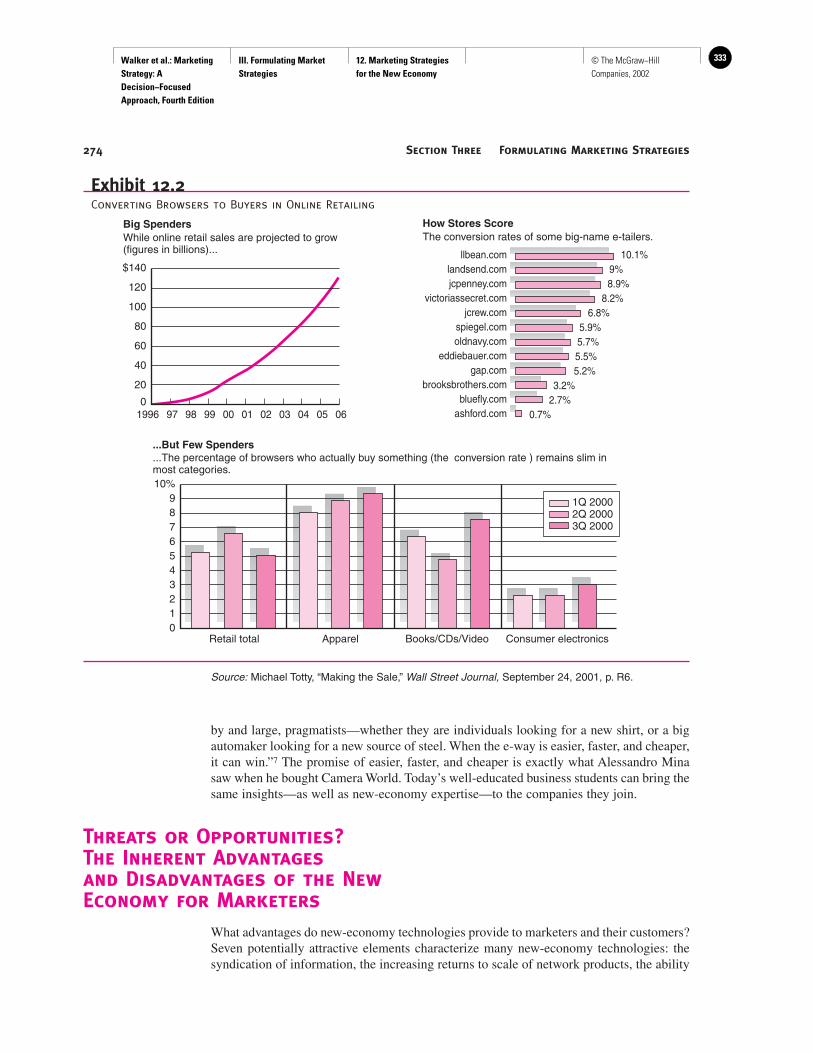
Walker et al.: Marketing Strategy: A Decision−Focused Approach, Fourth Edition
III. Formulating Market Strategies
12. Marketing Strategies for the New Economy
333© The McGraw−Hill Companies, 2002
Section Three Formulating Marketing Strategies274
by and large, pragmatists—whether they are individuals looking for a new shirt, or a bigautomaker looking for a new source of steel. When the e-way is easier, faster, and cheaper,it can win.”7 The promise of easier, faster, and cheaper is exactly what Alessandro Minasaw when he bought Camera World. Today’s well-educated business students can bring thesame insights—as well as new-economy expertise—to the companies they join.
Threats or Opportunities?
The Inherent Advantages
and Disadvantages of the New
Economy for Marketers
What advantages do new-economy technologies provide to marketers and their customers?Seven potentially attractive elements characterize many new-economy technologies: thesyndication of information, the increasing returns to scale of network products, the ability
Exhibit 12.2Converting Browsers to Buyers in Online Retailing
Source: Michael Totty, “Making the Sale,” Wall Street Journal, September 24, 2001, p. R6.
$140
120
100
80
60
40
20
097 98 99 00 01 02 03 04 05 06
Big SpendersWhile online retail sales are projected to grow(figures in billions)...
1996
llbean.comlandsend.comjcpenney.com
victoriassecret.comjcrew.com
spiegel.comoldnavy.com
eddiebauer.comgap.com
brooksbrothers.combluefly.com
ashford.com
10.1%9%8.9%
8.2%6.8%
5.9%5.7%5.5%5.2%
3.2%2.7%
0.7%
How Stores ScoreThe conversion rates of some big-name e-tailers.
10%9876543210
Retail total
...But Few Spenders
...The percentage of browsers who actually buy something (the conversion rate ) remains slim inmost categories.
Apparel Books/CDs/Video Consumer electronics
1Q 20002Q 20003Q 2000

Walker et al.: Marketing Strategy: A Decision−Focused Approach, Fourth Edition
III. Formulating Market Strategies
12. Marketing Strategies for the New Economy
334 © The McGraw−Hill Companies, 2002
Chapter Twelve Marketing Strategies for the New Economy 275
to efficiently personalize and customize market offerings, the ability to disintermediatedistribution, global reach, round-the-clock access, and the possibility of instantaneousdelivery.
The Syndication of Information8
Syndication involves the sale of the same good—typically an informational good—tomany customers, who then combine it with information from other sources and distributeit. The entertainment and publishing worlds have long employed syndication, producingcomic strips, newspaper columns, and TV shows that appear in many places at once. With-out syndication, today’s mass media would not exist as we know it. Though Internet mar-keters rarely use the word syndication to describe what they do, it lies at the heart of manye-commerce business models. Inktomi, an originator of syndicated content, provides itssearch engine technology to many branded search engine sites. Screaming Media, asyndicator, collects articles in electronic form and delivers relevant portions of this con-tent to more than 500 sites, each of which appeals to a different target audience. E*Trade,a distributor of syndicated information, brings together from many sources content rele-vant to its investor clientele and packages it in ways useful to these clients. Camera-world.com plays all these syndication roles, too, in different ways.
Why is syndication important? First, because syndication deals with informational goods(digitized text, music, photos, CAD/CAM files, and so on) rather than tangible goods, acompany can syndicate the same informational goods or services to an almost infinite num-ber of customers with little incremental cost. Variable costs approach zero. Producers of tan-gible goods and most services (candy bars, for example, or haircuts) must spend money onsugar and chocolate or labor for each additional candy bar or haircut sold. Not so for infor-mation producers, where sending a digital copy of a photo or an Internet news feature to onemore recipient is essentially free. Second, the syndication process can be automated anddigitized, enabling syndicated networks to be created, expanded, and flexibly adapted farmore quickly than would be possible in the physical world.
Syndication via the Internet—and soon, perhaps, via mobile phones or other mobiledevices—opens up endless opportunities for marketers. It replaces scarcity with abun-dance. Information can be replicated an infinite number of times and combined andrecombined in an infinite number of ways. It can be distributed everywhere, all at once,and be available all the time. Taking advantage of this potential, however, requires newthinking. Companies need to identify and occupy the most important niches in syndicationnetworks. These are the ones that maximize the number and strength of links to other com-panies and customers, though shifting market conditions inevitably mean that these linksmust change as markets evolve. Bloomberg, the provider of syndicated information tostock traders and analysts, is an example of a company that has positioned itself well;many of its clients now regard their Bloomberg terminals as indispensable. Thus, almostany company can think of itself as part of a larger, interconnected world and seek ways tooccupy originator, syndicator, or distributor roles in an appropriate syndication network.
Increasing Returns to Scale of Network Products9
Any undergraduate economics student knows that an increased supply of a good leads tolower value, hence lower prices. But that was before fax machines, operating systems, andother products used in networks, where the second fax machine, for example, makes the firstone more valuable, and so on. This characteristic of informational networks—a product
www
www
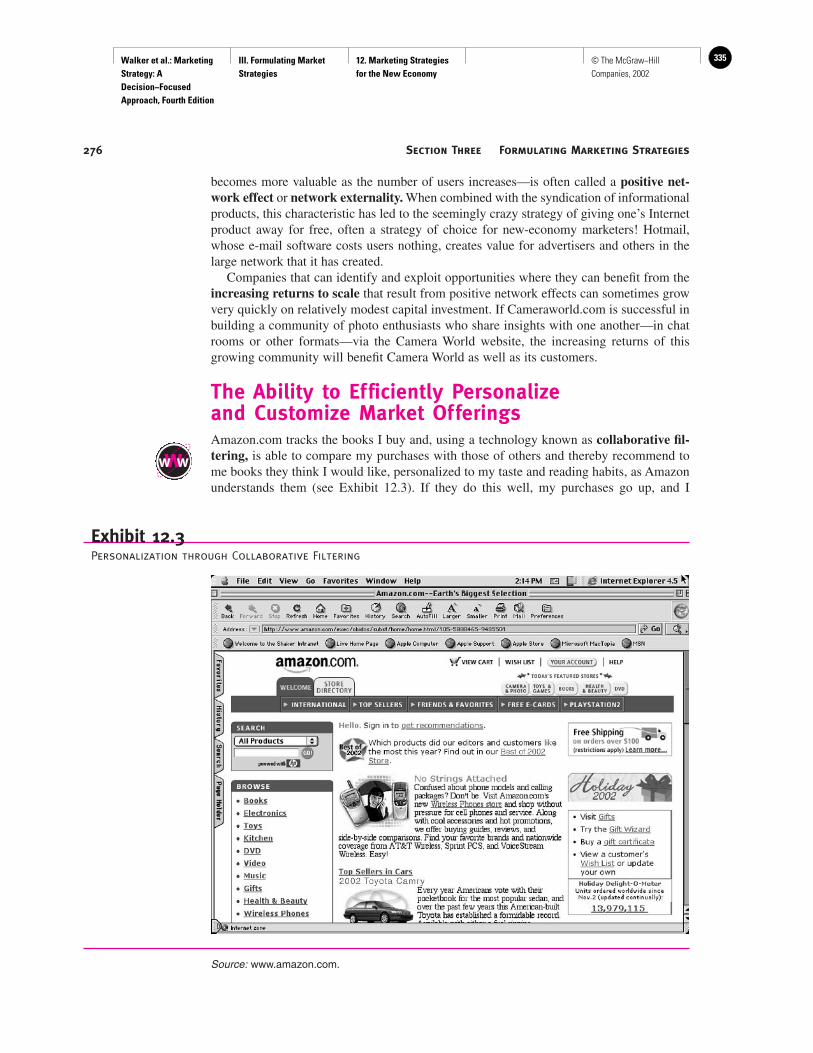
Walker et al.: Marketing Strategy: A Decision−Focused Approach, Fourth Edition
III. Formulating Market Strategies
12. Marketing Strategies for the New Economy
335© The McGraw−Hill Companies, 2002
Section Three Formulating Marketing Strategies276
becomes more valuable as the number of users increases—is often called a positive net-work effect or network externality. When combined with the syndication of informationalproducts, this characteristic has led to the seemingly crazy strategy of giving one’s Internetproduct away for free, often a strategy of choice for new-economy marketers! Hotmail,whose e-mail software costs users nothing, creates value for advertisers and others in thelarge network that it has created.
Companies that can identify and exploit opportunities where they can benefit from theincreasing returns to scale that result from positive network effects can sometimes growvery quickly on relatively modest capital investment. If Cameraworld.com is successful inbuilding a community of photo enthusiasts who share insights with one another—in chatrooms or other formats—via the Camera World website, the increasing returns of thisgrowing community will benefit Camera World as well as its customers.
The Ability to Ef ficiently Personalize and Customize Market OfferingsAmazon.com tracks the books I buy and, using a technology known as collaborative fil-tering, is able to compare my purchases with those of others and thereby recommend tome books they think I would like, personalized to my taste and reading habits, as Amazonunderstands them (see Exhibit 12.3). If they do this well, my purchases go up, and I
Exhibit 12.3Personalization through Collaborative Filtering
Source: www.amazon.com.
www

Walker et al.: Marketing Strategy: A Decision−Focused Approach, Fourth Edition
III. Formulating Market Strategies
12. Marketing Strategies for the New Economy
336 © The McGraw−Hill Companies, 2002
Chapter Twelve Marketing Strategies for the New Economy 277
become a happier customer, because Amazon helps me find books I want to read. While collaborative filtering technology has a long way to go (the book I bought for my daughter when she was leaving for a semester in Ecuador does not make me a LatinAmerican culture buff!), the potential of this and other new-economy technologies offers the promise of creating sharply targeted market segments—ultimately, market seg-ments of one.
Collaborative filtering is but one way of personalizing a market offering to each cus-tomer. When formal decision rules can be identified in the way customers behave (forexample, reminding customers of, or making special offers for, upcoming birthdays oroffering supplementary items based on past purchases), rules-based personalization canbe done. The most predictive rules, however, may require customers to divulge informa-tion that they do not want to take the time, or are not willing, to divulge.
Customization techniques, which are user-driven instead of marketer-driven (as wehave seen for personalization approaches), allow users to specify the nature of what isoffered to them. Several office supply firms, for example, now offer corporate users theability to create customized office supply catalogs tailored to their company. Such catalogssimplify ordering procedures, save time and money in the purchasing department, and helpcontrol expense by offering to perhaps far-flung employees only what the purchasingdepartment has approved in advance. Similarly, CDNow offers consumers the opportunityto order customized CDs consisting of only the songs the customer chooses. In today’shighly competitive markets, personalization and customization can help build customerloyalty and make it less likely for customers to switch to other suppliers.
Disintermediation and Restructuring of Distribution ChannelsMany goods and services are sold through distribution channels. The Internet makes it pos-sible for marketers to reach customers directly, without the expense or complication of dis-tribution channels, a phenomenon known as disintermediation. Best-selling authorStephen King sold his recent novel, The Plant, via the Web (see Exhibit 12.4), one install-ment at a time. King benefited by not having to share revenues with publishers and otherdistribution intermediaries, and King’s fans benefited by paying only a dollar or two foreach installment of the book and by getting instant delivery at any time, virtually anywherein the world. More than 150,000 readers ponied up for the first chapter upon its release inJuly 2000 though interest in subsequent chapters dwindled.10 Random House Inc. hasannounced plans to offer electronic versions of 100 classic works in its literary library,such as James Joyce’s Ulysses, for as little as $4.95 online.11 Rather than selling direct,however, Random House will sell through specialty sites, such as Shakespeare.com, aswell as through some established online book retailers. Thus, rather than disintermediat-ing its channel for these books, Random House is simply restructuring it to take advantageof the Web’s increasing reach.
Deciding to disintermediate or restructure one’s channel, however, should not be donelightly. Levi Strauss, the jeans maker, angered its existing retailers by offering custom-fitjeans direct to consumers via the Web. Ultimately, the company withdrew the offering duein part to the howls of protest it heard from its regular retail channel members. Similar con-cerns have arisen in the travel industry, as airlines and others have disintermediated travelagents by selling airline tickets and other travel services directly to consumers via the Web.Someone must perform the functions normally performed by channel members—takingorders, delivering products, collecting payment, and so on—so those who consider disin-termediating their channels and selling direct must determine how they will perform these
www

Walker et al.: Marketing Strategy: A Decision−Focused Approach, Fourth Edition
III. Formulating Market Strategies
12. Marketing Strategies for the New Economy
337© The McGraw−Hill Companies, 2002
Section Three Formulating Marketing Strategies278
functions and must evaluate whether doing so is more effective and efficient than usingintermediaries.
Global Reach, 24×7 Access, and InstantaneousDeliveryWith the Internet and other new-economy technologies, typically there is no extra costentailed in making information, digital goods, or services available anywhere one can gainaccess to the Web—literally, global reach; making them available 24 hours per day, sevendays per week, 52 weeks per year; and, in some cases, providing instantaneous delivery. Inour increasingly time-pressed world, access and service like this can be of great value tocustomers. Camera World’s online store, for example, is always open. Easy-Jet, a rapidlygrowing low-priced airline in Europe, sells a large proportion of its tickets on its own web-site, many of them to international travelers who reserve flights from afar, even fromanother continent. Flight confirmations are delivered instantly. Software vendors whoseproducts may be purchased and instantaneously downloaded from the Web provide similarresponsiveness. As mobile telephony and GPS technologies develop, similar benefits willbe available to customers and marketers whose products are well suited to mobile media. Isanyone up for portable music downloaded to one’s cell phone from the Internet?12 Howabout a free salad with a pizza, today only, at the restaurant just around the corner?
Exhibit 12.4An Example of Disintermediation in Bookselling
Source: www.stephenking.com.

Walker et al.: Marketing Strategy: A Decision−Focused Approach, Fourth Edition
III. Formulating Market Strategies
12. Marketing Strategies for the New Economy
338 © The McGraw−Hill Companies, 2002
Chapter Twelve Marketing Strategies for the New Economy 279
Are These New-Economy Attributes Opportunitiesor Threats?Most marketers can choose to take advantage of one or more of the benefits offered bynew-economy technologies, including those we have outlined above. To that extent, thesetechnologies constitute opportunities available to marketers who employ them. Viewed dif-ferently, however, they raise complex ethical issues (see Ethical Perspectives 12.1 and12.2) and they also present potentially significant threats.
First, the fact that the variable cost for syndicated goods approaches zero sounds like agood thing, until one realizes that for most products, price, over the long run, usually is notfar from variable cost. If variable cost is zero, will prices drop to near zero, too? If so, suchan outcome would represent disaster for information producers. Several companies oncethought that providing lists of telephone numbers on CD-ROMs might be a good business.After all, it costs less than a dollar to produce a CD-ROM once the content is ready, andlists of phone numbers had already been compiled by the telephone companies. Alas forthese marketers (but happily for consumers), numerous competitors rushed into the mar-ket, and with undifferentiated products they were soon forced to compete on price alone.Prices plunged. CD phone books, originally priced in 1986 at $10,000 per copy, soon soldfor a few dollars in discount software bins.13
Selling music on the Internet also seemed like a good idea to music publishers and evento artists. Imagine getting $12 to $15 for the music on a CD, with no retailers or distribu-tors to take cuts of the revenue, and no costs to pay for fancy packaging! Disintermediationsounds good, if you are a music publisher, but it’s a threat if you’re a music retailer, even aWeb-based one like CDNow! But Napster, Gnutella, and others developed ways to enableconsumers to share and download music—and other kinds of files—for free.14 The musiclabels and artists, of course, were less than excited about Napster’s delivery of their musicto consumers for free, fearing that such delivery would eliminate the need for consumers to
Ethical Perspective 12.1
Will E-Commerce Erode Liberty?
Cyberspace is evolving in ways that could threatenprivacy and other constitutional rights. A vigorousdebate has ensued over whether the governmentshould put its finger in the Internet pie to protectthese rights, or whether markets and consumersthemselves are up to the task. To some, the Internetis a vast, out-of-control copying machine, spewingout an unlimited number of free copies of intellectualproperty rightfully owned by its creators. Further, theysay, cyberspace is polluting households and schoolswith objectionable material too easily accessed bychildren. Others argue that the rapid progress inencryption technology will provide greater protectionto copyright owners and families than has been avail-able since Gutenberg’s invention of the printing press.Whatever the outcome of the debate, there can be lit-tle doubt that the Internet has been an extraordinary
boon to free speech—for better or worse—as anyonewith Web access is free to disseminate his or herideas, before regulators or other watchdogs evenknow what has appeared.
A number of possible solutions to these problemshave been proposed. One is to provide filters so thatInternet surfers can block speech or other materialthey dislike. But if such filtering is done upstream—by portals or others—it could become a powerfulform of censorship. Another has to do with theincreasingly rich trove of information on consumersurfing behavior. Optimists wonder whether firms willcompete for customers by using such data to betterserve customers, while respecting their privacy, per-haps by using reputable third parties to vouch fortheir practices. Is it Big Brother? Or is it customerservice? Who will decide—government or the mar-ketplace?
Source: Carl Shapiro, “Will E-Commerce Erode Liberty,” HarvardBusiness Review, May–June 2000, pp. 189–96.
E
www

Walker et al.: Marketing Strategy: A Decision−Focused Approach, Fourth Edition
III. Formulating Market Strategies
12. Marketing Strategies for the New Economy
339© The McGraw−Hill Companies, 2002
Section Three Formulating Marketing Strategies280
buy CDs. Lawsuits ensued and Napster was required to remove copyrighted material fromits site. While it is not clear at this writing how Internet distribution of music will play out,the fact that the variable cost of downloading the music on a CD is now essentially zero willlikely have a profound effect on the pricing of recorded music in the long run, notwith-standing the current copyright laws that exist to protect the intellectual property of the musi-cians and songwriters.
Another threat to new-economy technologies is that there are few barriers to entry, andmost Internet strategies are easily imitated. Numerous book retailers are challenging Amazon.com. Half a dozen e-tailers initially crowded the pet supplies business, thoughtheir numbers thinned fast. Unless one can patent one’s method of doing business on theWeb, as has Amazon with its 1-Click® ordering system or Priceline.com with its approachto selling cut-rate airline tickets online, it is likely that one’s competitive advantage in theonline space will not be sustainable. Even for Amazon and Priceline, long-term success isby no means assured.
Other threats include privacy and security issues, which can drive away customersrather than attract them if they are not handled with care. In Exhibit 12.5, we discuss theimpact of the Internet’s global reach on privacy issues. The most restrictive jurisdictions’privacy rules may eventually apply to Internet marketers anywhere. Privacy laws inEurope, compared to the United States, are substantially more strict, as is discussed inExhibit 12.5.
Similarly for security, customers are wary of providing too much information to onlinemarketers, even though that information might help the marketer tailor its offerings to thecustomer’s benefit. Potential misuse of credit-card numbers and other personal informationstill concerns many users. The use of so-called cookies, electronic markers that enablewebsites to track whose computer visits them, for how long, and in what sequence, pro-vides a wealth of consumer behavior data that marketers hope to use to personalize theirofferings to customers. But how many customers want their click-streams tracked by anelectronic Sherlock Holmes? Would a candidate for public office want the press to exam-ine and make public his or her online shopping behavior?
Ultimately, a marketer’s best defenses against these disadvantages are likely to takeeither of two forms. One defense is through the patent and copyright system, though as theNapster example shows, such protection may not be effective as new technologies aredeveloped that make the protection of intellectual property problematic. A second defenseis through what Carl Shapiro and Hal Varian call versioning.15 Shapiro and Varian argue
Ethical Perspective 12.2
Internet Scams Bring GovernmentLawsuits
Miracle products that don’t do what they promise.Credit-card theft. Pyramid schemes. Bogus vacationbargains. All these old tricks are finding new life onthe Internet, changing the way law enforcement agen-cies and consumer protection groups do business.The U.S. Federal Trade Commission and other gov-ernmental agencies brought more than 250 lawsuitsagainst online scam artists in 2000. To deal effectivelywith the global reach that the Internet affords such
scams, the FTC is working to create an internationalnetwork of consumer protection agencies, now com-prised of more than 240 agencies around the globe.But differing laws in various jurisdictions make suchefforts difficult. What’s considered legal in one placemay not be in another. But ethical? Who is to say?Jodie Bernstein, the FTC’s director of consumer pro-tection, is resolute in her efforts. “We want dot-conartists to know that consumer protection spans theglobe, physically and in cyberspace,” says Bernstein.
Source: Excerpt from Steve Raabe, “FTC Crackdown Details InternetScams, Vows Crackdown on ‘Dot-Cons,’ ” Denver Post, November 1,2000, p. C1. Reprinted by permission.
E
www

Walker et al.: Marketing Strategy: A Decision−Focused Approach, Fourth Edition
III. Formulating Market Strategies
12. Marketing Strategies for the New Economy
340 © The McGraw−Hill Companies, 2002
Chapter Twelve Marketing Strategies for the New Economy 281
that, even for information products whose variable cost approaches zero, the value of infor-mation to different kinds of customers is likely to vary substantially. Marketers who havethe insight to determine which features will be valuable to some customers, but of littlevalue to others, can package and repackage information differently and serve market seg-ments with margins that need not fall to zero. Versioning can be done on many dimensions:time (which users value getting the information sooner than others?); convenience (can werestrict the place or degree of access to some users?); comprehensiveness (which usersneed detail? Which only need the big picture?); manipulation (which users want to be able to manipulate, duplicate, process, store, or print the information?); community (whichusers want to discuss information with others?); and support (who needs, and will pay for,support?). Other dimensions on which versioning can be based include freedom fromannoyance, speed, user interfaces, image resolution (for visual images, such as stock pho-
tos), and more not yet imagined. By tailoring the same core informationto the varied needs of different buyers, the unusual economics of infor-mation can work to the advantage of the seller, while providing excellentvalue to the buyer. Skills in market segmentation and targeting, differ-entiation, and positioning—skills developed earlier in this book—areneeded to enable marketers to best take advantage of new-economytechnologies and mitigate their disadvantages.
First-Mover Advantage: Fact or Fiction?16
In the Internet gold rush in the late 1990s, the key to Internet success was said to be first-mover advantage. The first firm to establish a significant presence in each market nichewould be the one that succeeded. Thus, Amazon would win in books. EBay would win inauctions. Autobytel would win in the automotive sector, and so on. Later followers neednot bother. As we saw at the beginning of this chapter, Alessandro Mina of Camera Worldappeared to hold this view. But is first-mover advantage real?
As we saw in Chapter 9, being the first mover does bring some potential advantages, butnot all first movers are able to capitalize on those advantages. Thus, many are surpassed
Stefano Rodata is Italy’s top privacy cop. His job, aspresident of the Italian Data Privacy Protection com-
mittee, is to ensure compliance with Italy’s strict privacylaws. “People have a right to be left alone,” saysRodata. A recent and uneasy truce between Europeanauthorities and the United States, a so-called safe har-bor agreement, provides a set of privacy guidelines thatU.S. firms doing online business in Europe can follow toavoid European Union legal action when Europeans fillout registration forms or make purchases on U.S. web-sites. Exporting personal data in this manner to coun-tries that don’t meet EU privacy standards is unlawful inEurope. The draft agreement, along with other informa-tion, can be found at http://europa.eu.int/comm/inter-nal_market/en/media/dataprot/index.htm.
In the United States, Internet privacy has beendealt with largely through market forces, whereby con-sumers are expected to avoid sites where privacy isnot handled to their liking. As firms attempt to takeadvantage of the global reach afforded by the Internet,will they run afoul of privacy laws in countries whoseconsumers they serve? In what jurisdictions will com-plaints be heard and dealt with? Will the most restric-tive countries end up ruling the roost? These privacyquestions are far from settled.
Source: Thomas E. Weber, “Europe and U.S. Reach Truce on NetPrivacy, But What Comes Next?” Wall Street Journal, June 19, 2000, p.B1. Copyright 2000 by Dow Jones & Co. Inc. Reproduced with permis-sion of Dow Jones & Co. Inc. via Copyright Clearance Center.
Exhibit 12.5 The Impact of Global Reach on Internet Privacy
Strategic Issue
Skills in market segmentation and targeting,differentiation, and positioning—skills developed earlier in this book—are neededto enable marketers to best take advantage of new-economy technologies and mitigatetheir disadvantages.

Walker et al.: Marketing Strategy: A Decision−Focused Approach, Fourth Edition
III. Formulating Market Strategies
12. Marketing Strategies for the New Economy
341© The McGraw−Hill Companies, 2002
Section Three Formulating Marketing Strategies282
over time by later entrants. One thing a pioneer must do to hold on to its early leadershipposition is to continue to innovate in order to maintain a differential advantage over themany imitators likely to arrive late to the party but eager to get in.
Jim Collins, co-author of the best-sellers Good to Great and Built to Last: SuccessfulHabits of Visionary Companies, is more blunt about the supposed rule that nothing is asimportant as being first to reach scale. “It’s wrong,” he says. “Best beats first.”17 As Collinspoints out, VisiCalc was the first major personal computer spreadsheet. Where is VisiCalctoday? It lost the battle to Lotus 1-2-3, which in turn lost to Excel. What about the now-ubiquitous Palm Pilot? It came to market years after early leader Sharp and the AppleNewton. Palm Pilot’s designers found a better way to design personal digital assistants—using one reliable script, instead of everyone’s own script—and have sold 6 million units.18
But its current advantage may not last, as Handspring and Blackbird are now nipping atPalm Pilot’s heels. America Online, another new-economy star, got to its leading position
by being better, not first. In the old economy, Wal-Mart didn’t pioneerdiscount retailing. Nucor didn’t pioneer the minimill for making steelfrom scrap. Starbucks didn’t pioneer the high-end coffee shop. Yet allwere winners, while the early leaders fell behind or disappeared. Noneof these entrants were first—they were better. Being first may helpattract investors and may make some founders and venture capitalists
rich, but it’s hardly a recipe for building a great company. In his book Digital Darwinism,Evan Schwartz identifies seven strategies for surviving in the digital economy. Being thefirst mover is not among them.19 Fortunately, with the dot-com crash in early 2000,investors seem to be catching on to the game.
Developing a New-Economy
Strategy: A Decision Framework
Most companies of substantial size or scope will need to develop strategies to take advantageof new-economy technologies, but doing so is easier said than done. This is new ground inmost companies. In several earlier chapters, we identified recent software applications withthe potential for helping marketers be more effective and efficient in their marketing decisionmaking and marketing activities. To some observers, such applications fall within the scopeof the new economy. In this section, we examine areas in which even newer new-economytechnologies have widespread marketing applications. While we recognize that other non-marketing applications also may be compelling for many companies, our focus remains onmarketing, for which, as Peter Sealey points out, productivity gains have been hard to comeby.20 Sealey argues that major advances in marketing productivity will depend on the broaderuse of information. That will happen only when companies fully leverage the power of theInternet, he says. Thus, in this section we focus on how the Internet—and, for some appli-cations, mobile telephony—can fruitfully be employed for marketing purposes.21
Marketing Applications for New-Economy ToolsIn the first chapter of this book we pointed out that a number of activities have to be per-formed by somebody for an exchange transaction to occur between a selling firm and apotential customer. Retaining that customer for future transactions adds additional activi-ties, such as providing effective and responsive customer service after the sale. From the customer’s point of view, these necessary activities can be summarized in a six-stageconsumer experience process that begins with communicating one’s wants and needs to
Strategic Issue
Being first may help attract investors andmay make some founders and venture capi-talists rich, but it’s hardly a recipe for build-ing a great company.

Walker et al.: Marketing Strategy: A Decision−Focused Approach, Fourth Edition
III. Formulating Market Strategies
12. Marketing Strategies for the New Economy
342 © The McGraw−Hill Companies, 2002
Chapter Twelve Marketing Strategies for the New Economy 283
prospective sellers; moving through the awareness, purchase, and delivery processes;obtaining any necessary service or support after the purchase to support its use or con-sumption; and ultimately sometimes returning or disposing of the product (we identify thesix stages from the marketer’s perspective in Exhibit 12.6). Customers first provide infor-mation about their needs to sellers, whose customer insight permits them to developgoods or services intended to meet the customers’ needs. This stage in the process requiresthat information flow from customer to seller, as shown in Exhibit 12.6. While there maybe several back-and-forth iterations in the insight stage, as new product developers inventand refine their product ideas, ultimately some good or service is developed, and informa-tion about the new product—promotion and brand building—then flows to customers,to inform and encourage them to buy. If the customer likes what is offered, a transactionensues, requiring that information about pricing, terms, delivery, and so on flow both ways.With a transaction consummated, delivery of the good or service is made, with the prod-uct flowing to the customer and money or other compensation flowing to the seller. But theseller’s job is not yet done, for the customer may need some kind of customer support orservice during use, in which case additional information may flow in either direction oradditional goods or services may flow to the customer, possibly in exchange for additionalrevenue. Finally, the customer may need to return, dispose of, or discontinue use of thegood or service, at which point the product may be returned to the seller, cash may flowback to the customer (as a result of the product’s return or some kind of trade-in, perhaps),and another transaction—with this or another seller—may ensue, thereby repeating muchof the process. The Internet and, to a more limited extent, mobile telephony offer applica-tions at some or all of these stages. We now explore some of these applications, though inthis fast-moving arena, new ones will undoubtedly arise before the ink is dry on this book.Then, in the next section, we set forth a decision framework to assist marketers in decid-ing for which of these stages, and with which applications, new-economy tools shouldbecome part of their strategies.
Internet Applications for Customer Insight In Chapter 6, we discussed the roleof marketing research in understanding customers and developing products—whether
Exhibit 12.6A Customer Experience Model for New-Economy Marketing Decision Making
Stage in customer Direction of Direction ofexperience process Direction of product flows cash flows
from marketer’s perspective information flows (goods or services) (revenue opportunities)
Customer insight P C
Product promotion P Cand brand building
Transaction P C
Product delivery P C P C
Customer support P C P C P Cand service
Product return P C P Cor disposal
P = Producer
C = Customer
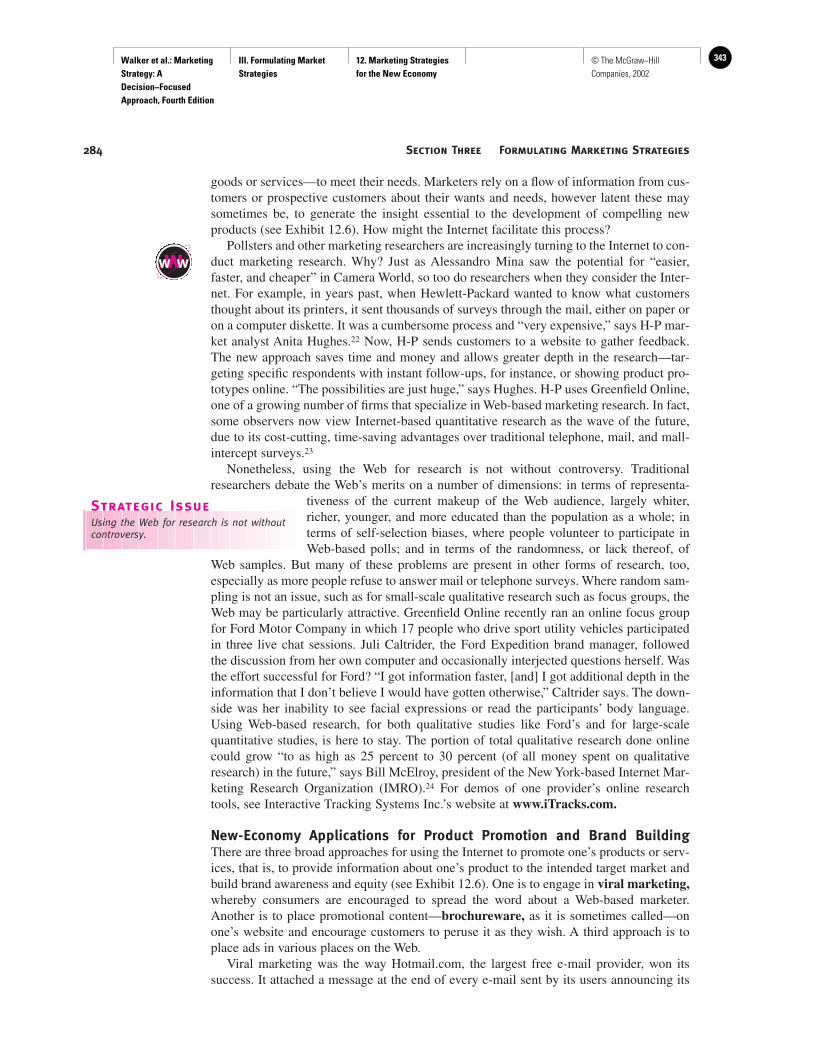
Walker et al.: Marketing Strategy: A Decision−Focused Approach, Fourth Edition
III. Formulating Market Strategies
12. Marketing Strategies for the New Economy
343© The McGraw−Hill Companies, 2002
Section Three Formulating Marketing Strategies284
goods or services—to meet their needs. Marketers rely on a flow of information from cus-tomers or prospective customers about their wants and needs, however latent these maysometimes be, to generate the insight essential to the development of compelling newproducts (see Exhibit 12.6). How might the Internet facilitate this process?
Pollsters and other marketing researchers are increasingly turning to the Internet to con-duct marketing research. Why? Just as Alessandro Mina saw the potential for “easier,faster, and cheaper” in Camera World, so too do researchers when they consider the Inter-net. For example, in years past, when Hewlett-Packard wanted to know what customersthought about its printers, it sent thousands of surveys through the mail, either on paper oron a computer diskette. It was a cumbersome process and “very expensive,” says H-P mar-ket analyst Anita Hughes.22 Now, H-P sends customers to a website to gather feedback.The new approach saves time and money and allows greater depth in the research—tar-geting specific respondents with instant follow-ups, for instance, or showing product pro-totypes online. “The possibilities are just huge,” says Hughes. H-P uses Greenfield Online,one of a growing number of firms that specialize in Web-based marketing research. In fact,some observers now view Internet-based quantitative research as the wave of the future,due to its cost-cutting, time-saving advantages over traditional telephone, mail, and mall-intercept surveys.23
Nonetheless, using the Web for research is not without controversy. Traditionalresearchers debate the Web’s merits on a number of dimensions: in terms of representa-
tiveness of the current makeup of the Web audience, largely whiter,richer, younger, and more educated than the population as a whole; interms of self-selection biases, where people volunteer to participate inWeb-based polls; and in terms of the randomness, or lack thereof, of
Web samples. But many of these problems are present in other forms of research, too,especially as more people refuse to answer mail or telephone surveys. Where random sam-pling is not an issue, such as for small-scale qualitative research such as focus groups, theWeb may be particularly attractive. Greenfield Online recently ran an online focus groupfor Ford Motor Company in which 17 people who drive sport utility vehicles participatedin three live chat sessions. Juli Caltrider, the Ford Expedition brand manager, followed the discussion from her own computer and occasionally interjected questions herself. Wasthe effort successful for Ford? “I got information faster, [and] I got additional depth in theinformation that I don’t believe I would have gotten otherwise,” Caltrider says. The down-side was her inability to see facial expressions or read the participants’ body language.Using Web-based research, for both qualitative studies like Ford’s and for large-scalequantitative studies, is here to stay. The portion of total qualitative research done onlinecould grow “to as high as 25 percent to 30 percent (of all money spent on qualitativeresearch) in the future,” says Bill McElroy, president of the New York-based Internet Mar-keting Research Organization (IMRO).24 For demos of one provider’s online researchtools, see Interactive Tracking Systems Inc.’s website at www.iTracks.com.
New-Economy Applications for Product Promotion and Brand BuildingThere are three broad approaches for using the Internet to promote one’s products or serv-ices, that is, to provide information about one’s product to the intended target market andbuild brand awareness and equity (see Exhibit 12.6). One is to engage in viral marketing,whereby consumers are encouraged to spread the word about a Web-based marketer.Another is to place promotional content—brochureware, as it is sometimes called—onone’s website and encourage customers to peruse it as they wish. A third approach is toplace ads in various places on the Web.
Viral marketing was the way Hotmail.com, the largest free e-mail provider, won its success. It attached a message at the end of every e-mail sent by its users announcing its
www
Strategic Issue
Using the Web for research is not withoutcontroversy.

Walker et al.: Marketing Strategy: A Decision−Focused Approach, Fourth Edition
III. Formulating Market Strategies
12. Marketing Strategies for the New Economy
344 © The McGraw−Hill Companies, 2002
Chapter Twelve Marketing Strategies for the New Economy 285
availability as a free provider. The more users sent e-mail, the faster the word about Hot-mail spread. Viral marketing is a low-cost and potentially powerful technique for buildingbrand awareness.25
Placing brochureware about a company’s products, news development, and pressreleases, or about other things, on the Web is an easy and inexpensive first step toward anew-economy strategy. It provides answers to customer or prospective customer questionswith global 24×7 access. It avoids looking technologically clueless: What company lacksa fax line or a website today? But it is not very proactive, and if a company doesn’t other-wise promote the website where the information is placed, either on Web portals, on searchengines, or in offline media, no one will know it is there. “The Web cliché, ‘if you build it,they will come,’ has lulled many online marketers into a false sense of security,” saysCharles Sayers, an Internet marketing consultant.26 Unfortunately, brochureware also helpsyour competitors keep up with what you are doing.
To help customers find their websites, companies can use businesses such as SearchEngine Watch to find software applications that help them appear among the first links thesearch engines return. Intelliquis is another such company. It is also a good idea to createso-called hook pages or doorway pages. These pages offer information on specializedsubjects that consumers are likely to search for. E*Trade, for example, offers a hook pagewith free online stock advice and links the page to its own home page.27 Another way toattract customers to one’s website is to put together affiliate deals, in which owners ofother websites are paid—in flat fees or commissions on whatever the referred customersbuy—to send customers your way. The largest portals, such as America Online andYahoo!, earn a substantial portion of their revenues this way.
Internet (and, perhaps soon, mobile telephony) advertising is a more proactive strategy,but deciding whether and how to use it is not easy. A simple way to advertise on the Inter-net is to take advantage of the shift in power from marketers to consumers brought aboutby easy access to comparative information by making available information for compari-son purposes. The Web-based luggage retailer eBags.com, for example, provides charts tomake it easier for customers to compare different garment bags and other products to findthe one that’s right for them. Automakers and other automotive sites provide similar com-parative information to help consumers choose makes and models of cars that best suittheir needs. Comparative sites are likely to turn up in virtually every product category overtime, and having one’s goods or services included among those described by such sites willlikely turn out to be increasingly important. Of course, if one’s goods or services do notpass competitive muster, being included on such sites can work the other way!
A more proactive advertising strategy is to place ads on the Web. In the early days, 4percent to 5 percent of viewers of banner ads, the colorful strips of ad content splashedacross the top of a Web page, would click on the banner to read the additional informationthat followed (see Exhibit 12.7). Today, as Web audiences widen beyond the early ’net-heads who frequented the Web and such ads become more pervasive, the click-through ratehas plummeted to 0.3 percent to 0.5 percent, according to Jupiter Research, far below
www
Exhibit 12.7A Typical Banner Ad

Walker et al.: Marketing Strategy: A Decision−Focused Approach, Fourth Edition
III. Formulating Market Strategies
12. Marketing Strategies for the New Economy
345© The McGraw−Hill Companies, 2002
Section Three Formulating Marketing Strategies286
response rates for traditional direct mail, where about 2 percent of recipients respond.28
Once touted as a way to build brands on the Internet, whether for online or offline compa-nies, there’s growing concern that banner ads may simply not work. By late 2001, amid anoverall drop in ad spending across most media, online ad revenue had slid (see Exhibit12.8) and the cost per thousand viewers for banner ads had dropped to about $10, abouthalf the cost one year earlier.29 By the first half of 2001, banner ads accounted for just 36percent of online ad spending, down from 53 percent in the fourth quarter of 1999.30
Is advertising on the Internet dead? Probably not, as advertisers experiment with emerg-ing formats for using this new medium (see Exhibit 12.8). Century 21, a real estate firm,has run humorous superstitials to promote its services that help homebuyers find newhomes. Travelocity.com, the Internet travel agency, uses Internet ads for promoting specifictravel offers. Consumer response is measured several times a day, and the message ischanged if the ad isn’t boosting sales.31
Exhibit 12.8The Online Pitch
Source: Vanessa O’Connell, “The Best Way to Advertise,” Wall Street Journal, November 12, 2001, p. R13.
$2,500
2,000
1,500
1,000
500
01Q 2Q
As Spending Eases...Total internet ad revenue in millions has eased recently after years of explosive growth
1996 1997 1998 1999 2000 20013Q 4Q 2Q 3Q 4Q1Q 2Q 3Q 4Q1Q 2Q 3Q 4Q1Q 2Q 3Q 4Q1Q 2Q1Q
...Emerging Formats Gain
2000 - 4th Quarter 1999 - 4th Quarter
Internet ad revenue by format
Classifieds 10%
*Ads that appear between two content pages; also known as transition ads, intermercial ads, splash pages, and Flash pages.†Generally includes a combination of animation, sound, video, and interactivity.
Interstitials* 5%Referrals 5%
Keyword search 2%Rich media† 2%
Banners40%
Others15%
Sponsorships25%
Banner25%
Sponsorships31%
Others 1%E-mail 4%
E-mail 32%Interstitials* 4%
Walker et al.: Marketing Strategy: A Decision−Focused Approach, Fourth Edition
III. Formulating Market Strategies
12. Marketing Strategies for the New Economy
346 © The McGraw−Hill Companies, 2002
Chapter Twelve Marketing Strategies for the New Economy 287
The Century 21 and Travelocity ads reflect trends toward more compelling and, in somecases, more measurable ad vehicles. New techniques include rich media (short ads withvideo and sound), cliffhangers (rich media ads that leave the viewers “hanging” and directthem to a website to view the end of the ad); superstitials (rich media ads that show upunexpectedly on a viewer’s screen); streaming audio (like a radio commercial); andvFlash (Consumers can choose to place a vFlash icon on their screen from, say Block-buster Video, which flashes when Blockbuster has an offer it wants to make. Clicking ona pop-up box then takes the viewer to the Blockbuster website, where the offer is pre-sented.). All these techniques, and new ones sure to be developed, hope to take advantageof growing Web penetration to reach consumers in new ways. If these approaches are notmade more measurable, however, some observers say that big ad dollars are unlikely toflow their way.
There are several ways to use Internet advertising in a measurable manner. One way isto use opt-in e-mail, where consumers allow companies they are interested in to send theme-mail with new promotions. According to Seth Godin, such permission marketing (asopposed to interruption marketing, as Godin calls the current methods) offers the potentialfor companies to create trust, build long-term relationships with customers, and greatlyimprove their chances for making a sale.32 By 2001, the average number of permission-based e-mails received by Internet users had increased to 36 per week, double the prioryear figure.33 For an example of how Harrah’s, the resort casino operator, used e-mail mar-keting to fill its hotel rooms after the September 11, 2001, attacks on New York and Wash-ington, see Exhibit 12.9.
Another way to make Web advertising more measurable is to have advertisers pay forperformance, rather than for placement, regardless of the type of ad employed. The adver-tiser might pay for click-throughs, for leads generated, even commissions for actual ordersplaced. Doing so, however, would require that extensive traffic data that follow a cus-tomer’s click-stream be captured and analyzed. Jeff Forslund’s job is to do just that forcredit-card issuer NextCard, a major Web advertiser. For example, Forslund knows that aparticular banner ad that appeared on Yahoo! on August 25, 2000, attracted 1,915 visits,104 credit-card applications, and 22 approvals. He also knows that those 22 new customerstransferred preexisting credit-card balances averaging $1,729 each.34 With such data inhand, NextCard can determine the value of that banner ad and negotiate how much and onwhat basis—placement or performance—it is willing to pay Yahoo! to place another sim-ilar ad. Dan Springer, NextCard’s chief marketing officer, believes that the Internet is bet-ter suited to getting measurable results than for branding efforts. He says current resultsindicate, however, that today’s Web ad prices are too high.35
In the wake of the September 11, 2001, attack on Amer-ica, Harrah’s Entertainment Inc. felt an immediate 25
percent downturn in its business in Las Vegas. Few peo-ple were in the mood to party, and fewer wanted to fly.By having already linked its 24 million-strong customerdatabase with its website and e-mail marketing system,Harrah’s was well positioned to counterattack. It tar-geted e-mails to customers it thought might want to
take a trip to its tables and slot machines and, by theend of September, the hotel was back near 100 percentoccupancy, filling almost 4,000 rooms that would oth-erwise have gone empty.
Source: David Rocks, “The Net As a Lifeline,” BusinessWeek, Octo-ber 29, 2001, p. EB 16.
Exhibit 12.9 Harrah’s Beats the House Odds to Fill Its Rooms
www

Walker et al.: Marketing Strategy: A Decision−Focused Approach, Fourth Edition
III. Formulating Market Strategies
12. Marketing Strategies for the New Economy
347© The McGraw−Hill Companies, 2002
Section Three Formulating Marketing Strategies288
Additional factors, besides the high price for placing Web ads and the current lack ofmeasurement capability for many of them are holding back development of the Web as asuccessful advertising medium. Two are privacy and security concerns, as mentioned ear-
lier in this chapter. Consumer rights advocates are not certain that con-sumers want Jeff Forslund and others like him to have the click-streamdata he needs to measure ad performance. What if someone’s click-stream as he or she explores data about AIDS is gathered? Could suchdata be misused? Another deterrent is the glacial pace at which moreinteresting video and audio ads can download, given today’s 56Kmodems. Many people won’t wait for such ads to load. As faster broad-
band connections become more common, this problem will fade, but it’s hard to tell justhow quickly broadband will penetrate the market.
While Internet advertising now seems almost “old hat,” advertising on mobile phonesis about to emerge as a significant new vehicle for promotion, especially in Europe andJapan, where mobile phone usage and technological development are far ahead of theUnited States. As DoCoMo’s iMode and other high-speed mobile phone technologies pen-etrate various markets, the installed base of web-enabled mobile phones will grow largeenough that ads will begin to make sense. The issues surrounding the use and effectivenessof this medium will parallel those for the Internet, and the pace at which applicationsbecome user-friendly enough to be valued by customers will determine how quickly thismedium develops. In Europe and Japan, and subsequently elsewhere, these developmentsbear watching.
New-Economy Applications for Conducting Transactions If promotional activ-ities do their jobs, the hoped-for consequence is that some customers will decide to buy. Canthe Internet or mobile telephony help transactions occur? Several Web-based companies arein the business of enabling client websites to handle transactions. Making the transition toa transaction-capable website was among the first tasks Camera World’s new owners had todo after they bought the business. BroadVision Inc. (broadvision.com), for example, offersa wide range of software products that enable clients to conduct B2B or B2C commerce ontheir websites or via kiosks or mobile telephones. Such products from BroadVision and oth-ers typically provide back-end systems and inventory control, prepare warehouse and shipdocuments, and bill the customer for the sale. Some such systems now allow companies toengage in dynamic pricing, a controversial system that gauges a customer’s desire to buy,measures his means, and sets the price accordingly.36 In this respect, target markets of oneare now here, to the chagrin of some consumers!
Recent legislation in the United States has cleared the way for the use of digital signa-tures over the Web, and other countries may soon follow. Such digital authentication willpave the way for more efficient sale of insurance, mortgages, and other goods and servicesvia the Web or mobile telephones. Imagine removing your car from your collision insur-ance policy when it’s parked in the driveway for an extended period, and reinstating cov-erage with the click of a mouse. It also will lower the costs companies incur due to Internetfraud, which has been common, and thereby save consumers money. Brooks Fisher ofIntuit Inc., a provider of a wide range of online financial services, says, “Less fraud meansbetter pricing.”37
More broadly, the Internet and wireless telephony are quickly removing constraints thatlimit sellers in terms of what they sell and how they sell it. Banks are moving all the trans-actions they can onto the Web, where a typical banking transaction costs just two cents,compared with 36 cents for an ATM transaction and $1.15 for a teller-assisted transac-tion.38 In Scandinavia, 700,000 Finns use Sonera, the leading Finnish wireless carrier, to
Strategic Issue
The high price for placing Web ads and the current lack of measurement capabilityfor many of them are holding back development of the Web as a successfuladvertising medium.
www

Walker et al.: Marketing Strategy: A Decision−Focused Approach, Fourth Edition
III. Formulating Market Strategies
12. Marketing Strategies for the New Economy
348 © The McGraw−Hill Companies, 2002
Chapter Twelve Marketing Strategies for the New Economy 289
do everything from ordering chocolates from the back seat of a taxicab to getting a date.The 1999 mobile commerce and information revenues of Zed, a Finnish Internet site serv-ing mobile phone users, totaled $126 million—in a country one-fortieth the size of theUnited States!39 Elsewhere, the Internet now offers buyers and sellers choices rangingfrom fixed-price online catalogs, to customer-tailored catalogs, to auctions, to negotiatedprices, to Priceline.com’s demand collection system, to barter and more.40
By enabling virtually frictionless movement among ways of doing business, these so-called all-in-one markets benefit both buyers and sellers. The trend toward multiple waysof transacting business on the Web runs counter to the conventional wisdom about e-commerce. Many observers had predicted that easy access to pricing information on theInternet would push all transactions toward a single mechanism—wide-open price com-petition in which the lowest-priced offer wins the order. For some commodity-like prod-ucts that are easily compared—several Web shopping bots can tell a customer who has thelowest price on the latest Tom Clancy novel, for example—this may yet turn out to be thecase. So far, however, this prediction has not come to pass.
New-Economy Applications for Delivering Digital Products Many compa-nies probably don’t give much thought to it, but an increasing array of goods and servicescan be digitized and thereby delivered to customers via any digital medium, including theInternet, satellites, and digital telephones. Fifty years ago, the then-current technologicalmiracle was the analog delivery of sounds and images to consumers via the newfangledinvention called television. Today, as we have seen earlier in this chapter, books, music,and more can be delivered digitally any time, at any digitally connected place. In 2, 5, or10 years, what else will be digitally deliverable? Psychotherapy, with or without a livetherapist, and legal advice are now available online from numerous providers.41 Onlinepostage is available at several websites, including that of the United States Postal Service.Unfortunately for their investors, e-postage pioneers Stamps.com and E-stamp.com squan-dered millions in start-up capital to pursue this market, with little so far to show for theirefforts.42 One new company is even rumored to be developing technology for deliveringscents online. Who knows what’s next? Beam me up, Scotty!43
New-Economy Applications for Customer Service and Support An increas-ingly important application on the Internet is for various sorts of customer service, replac-ing more costly—and sometimes more inconsistent and error prone—human support.Companies from Dell to the Denver Zoo use the Web to provide answers to frequentlyasked questions, from technical ones in Dell’s case to how to arrange a children’s birthdayparty at the zoo. Savvy marketers know that, for all the hoopla about acquiring new cus-tomers, the real driver of the bottom line is the ability to profitably retain existing ones andthat effective, responsive customer service is a key ingredient in doing so. They also knowthat customer retention is a competitive necessity. In nearly every industry, some com-pany will soon figure out new ways to exploit the potential of the Internet to create valuefor customers. Without the ability to retain those customers, however, even the best-conceived business model on the Web will collapse.44
There are numerous examples of how Web-based customer service programs are pro-viding customers with better service at lower costs, surely a win–win proposition. MichaelClimo, purchasing director for e-tailer SmartHome.com, was seeking a supplier to providefast delivery of its shipments to customers. United Parcel Service won the business notonly by delivering SmartHome’s parcels quickly, but also by cutting SmartHome’s cus-tomer service costs while improving service. UPS helped redesign the SmartHome web-site so customers could track their shipments with a click of a mouse. SmartHome’s callcenter now gets virtually no calls to check order status, down from 60 per day before the
www

Walker et al.: Marketing Strategy: A Decision−Focused Approach, Fourth Edition
III. Formulating Market Strategies
12. Marketing Strategies for the New Economy
349© The McGraw−Hill Companies, 2002
Section Three Formulating Marketing Strategies290
change, freeing its staff to make more sales calls. The Web-smart capabilities of UPS havemade it the clear leader in delivering the $40 billion in merchandise bought online in 2000,with an estimated 55 percent of the business, compared to 10 percent for FedEx.45 Attract-ing and retaining its business customers is what the UPS Web-based services are all about.
Benefits of an array of Web-based customer service applications are available to old-and new-economy companies alike, in both B2B and B2C contexts. Tracking shipments oranswering other frequently asked questions is but one application. Building communitiesamong users—using bulletin boards, chat rooms, or other e-techniques—is another onethat can build customer loyalty and provide an important source of feedback on new prod-uct ideas, product problems, and other issues. Tom Lowe, founder of Playing Mantis, amaker of die-cast cars, plastic model kits, and action figures, credits his company’s Web-based bulletin boards for feeding customer relationships that would be the envy of anycompany. As one customer posted to one of the Playing Mantis boards, “Polar Lights isvery special to me. . . . You’ve rekindled the joy I once felt when buying these kits. . . .You’re the ONLY company I feel a part of.”46
The growing number of Web-based customer service applications offers the tantalizingcombination of better service and significant cost savings. The trick is to focus on the cus-tomer service benefits first, rather than mere cost cutting. Customers are quick to discernwhen cost cutting takes precedence over genuine service responsiveness. Does anyone likethe way call center software has changed the way consumers obtain phone numbers fromdirectory assistance, or the fact that some banks won’t provide bank-by-mail envelopes tothose who prefer to do their banking the old-fashioned way?
One myth some companies have bought into is that the Internet is a self-servicemedium. They assume that they can let customers do all the work, but most customersreally don’t want to do more. One solution is coproduction, in which companies carefullyconsider which burdens they can remove from the customer, using new-economy tech-nologies, and which customers can perform, assessing costs and benefits to both parties.Doing so can provide insights into new ways to serve customers better, as Charles Schwabnow does when it e-mails customers to alert them to big moves in their stocks.47
New-Economy Applications for Product Return and Disposal Customers’experiences with goods and some services do not end until the products are consumed,returned, or disposed of. Some companies have found ways to use new-economy tech-nologies to facilitate these processes. Dell, for example, provides an Internet space whereDell customers can sell their old computers when they upgrade to a new one. Both old- andnew-economy companies can avail themselves of similar applications. In retailing, manyretailers with both online and offline stores accept returns at any location. Concerns relatedto returning online purchases (the inability to see and touch the goods before purchase andthe inability to return goods easily) rank second and third on the list of factors that deterconsumers from shopping online (see Exhibit 12.10).
Developing New-Economy Marketing Strategies:The Critical Questions
Knowing what marketing arrows are available in one’s new-economyquiver is one thing. Deciding which of these applications will deliver themost bang for the buck is quite another. Our flow model of the customerexperience process (see Exhibit 12.6) facilitates such decision making byraising six important questions that should be asked about whether toemploy new-economy tools at any or all stages of the process. These
www
Strategic Issue
Knowing what marketing arrows are avail-able in one’s new-economy quiver is onething. Deciding which of these applicationswill deliver the most bang for the buck isquite another.

Walker et al.: Marketing Strategy: A Decision−Focused Approach, Fourth Edition
III. Formulating Market Strategies
12. Marketing Strategies for the New Economy
350 © The McGraw−Hill Companies, 2002
Chapter Twelve Marketing Strategies for the New Economy 291
diagnostic questions are shown in Exhibit 12.11. We address each of these questions in thissection.
Can We Digitize Any or All of the Necessary Flows at Each Stage in theConsumer Experience Process? At the heart of the new economy is the relianceon digital means of transmitting information, some of which is recomposed into goods—CDs, books, and more. In considering whether to employ new-economy technologies atany stage of the consumer experience process, a company should ask whether any of theflows—information, goods or services, or cash—can be digitized.
For cash, the answer is an automatic yes, via credit cards or other forms of electronic pay-ment, except where currency issues pose problems, such as in some international settings. Andnew forms of electronic payment will soon enhance the security of cash flows over the Web.
For goods and services, the question is more difficult. Text, audio, and visual images(moving or still) can be digitized, as can books, music, photos, and, given enough band-width, movies and other videos. But at present, most tangible goods and many servicescannot easily be transmitted digitally. For others, however, such as legal advice, therapy
Exhibit 12.10Why Shoppers Are Wary
Source: Rebecca Quick, “Return to Sender,” Wall Street Journal, July 17, 2000, p. R8. Copyright 2000by Dow Jones & Co. Inc. Reproduced with permission of Dow Jones & Co. Inc. via Copyright ClearanceCenter.
Concern about returning items is one of the mainreasons cited by surveyed consumers for notshopping online. The leading responses:
10%
15%
16%
23%
24%
32%
44%
51%
Enjoy the activity of shopping offline
Worried about delivery time
Takes too long to load screen
Can’t ask questions
Worried about credit-card safety
Can’t return items easily
Can’t see and touch items
Shipping charges
www

Walker et al.: Marketing Strategy: A Decision−Focused Approach, Fourth Edition
III. Formulating Market Strategies
12. Marketing Strategies for the New Economy
351© The McGraw−Hill Companies, 2002
Section Three Formulating Marketing Strategies292
for mental health patients, and other goods or services that can adequately be representedin words, sounds, or images, the possibilities are endless. Will technology soon make pos-sible the digital transmission of physical goods? Who knows? When it happens, the manysci-fi buffs around the world will not be surprised!
For information, text, audio, and images can be digitized. But what about the soft handof a cashmere sweater? The heft and balance of a carpenter’s hammer? The taste of fineEuropean chocolate? The fragrance of a new cologne? Today, these important informa-tional attributes of goods cannot be readily digitized. Tomorrow? Time will tell.
When any of the flows at any stage of the consumer experience process can, given suf-ficient information and ingenuity, be digitized, the remaining questions in Exhibit 12.11should then be considered to decide whether or not new-economy applications for a par-ticular flow should be implemented.
Can We Do So First, and/or in a Proprietary Way As we have seen, barriersto entry on the Web are low, and most good ideas can be quickly imitated. A key questionin deciding whether or not to employ a new-economy application is whether one can do soin a proprietary way, thereby deterring imitation, or do so with a sufficient head start sothat competitive advantage can be established before others follow. Amazon.com was earlyin the Internet retailing game and enjoyed a helpful head start. E-tailers of pet supplies,however, were not so fortunate, as half a dozen venture-capital-backed online pet storesbattled for survival in 2000.48 Without anything proprietary, and without a head start, mostof these companies will likely fail and fail early, as some already have.
Exhibit 12.11Diagnostic Questions for New-Economy Marketing Decisions
Can we digitize this stage or flow?
Can we do so first,and/or be proprietary?
How valuable and time-criticalis what kind of information?
Can we reach and build relationshipswith our target market?
Measurably effective?
Measurably efficient?
www

Walker et al.: Marketing Strategy: A Decision−Focused Approach, Fourth Edition
III. Formulating Market Strategies
12. Marketing Strategies for the New Economy
352 © The McGraw−Hill Companies, 2002
Chapter Twelve Marketing Strategies for the New Economy 293
For old-economy companies, using the Internet for applications that do not reinvent theheart of the business as Camera World’s new owners decided to do—forbrochureware or customer service, for example—speed to market may ormay not be critical, depending on how quickly others in their industry arelikely to move into similar applications. As always, competitor intelligence,some of which can be gleaned from competitors’ websites, is essential.
How Valuable and How Time-Critical Are What Kinds of Information tothe Recipient? For the informational flows in Exhibit 12.6, a key question in makingresource deployments is the importance of various kinds of information to the recipient,either the company or the customer, depending on the direction of the flow. The more valuable and time-critical the information, the more sensible it may be to invest in new-economy applications to provide easy, timely, and 24×7 access to those who can benefitfrom the information. Wal-Mart, arguably an old-economy company that has long been an industry leader in its use of information technology, now posts on the Web password-protected, up-to-the-minute, store-by-store, SKU-by-SKU sales information that its keysuppliers can access, thereby enabling them to better ensure that Wal-Mart’s stores remainin stock on their merchandise.
Can New-Economy Tools Reach and Build Relationships with Customersin the Target Market? Making information, goods, or services available on the Webis of little use if the people to whom those flows are directed lack Web access. As we haveseen, some demographic groups are underrepresented on the Internet. Web-based servicestargeted at senior citizens may have difficulty, given the current paucity of seniors who have easy Web access, though the number of seniors on the Web is now growing rap-idly. Similarly, people and businesses in the third world are also underrepresented. New-economy applications that make the most business sense will be those targeting groups forwhom use of the Web is relatively widespread.
Simply reaching customers with new-economy tools may not be enough, however,especially for marketers of commodity-like products. Going beyond reach to build mutu-ally beneficial relationships may be what is needed. Amazon.com has begun to build loyalrelationships with its growing customer base by focusing its efforts on exceptional cus-tomer service. While book lovers often can find books for lower prices elsewhere on theWeb, many of them simply return to Amazon’s site, with its easy 1-Click® ordering, cus-tomer reviews, and other customer-friendly features. Using new-economy tools for build-ing customer relationships may be their most important application in the long run.
Are New-Economy Tools Measurably Effective and Efficient Compared toOther Solutions? Ultimately, given favorable answers to the first four questions inthis section, deciding to invest in a particular new-economy marketing strategy or applica-tion comes down to two final questions. Is the new-economy solution effective, and is itmore efficient than other solutions? As we have seen, UPS was able to sell SmartHome onits shipping because it was not only effective in getting SmartHome’s parcels to their des-tinations on time, but also because SmartHome was able to improve on and save money oncustomer service at the same time.49 Another example of using the Web for effectivenessand efficiency gains is the new Kinko’s Internet order-taking system, Print to Kinko’s. Cus-tomers can upload digital versions of documents to kinkos.com and have them deliveredon paper at any Kinko’s location within a few hours. Kinko’s hopes the new system willcapture some of the large market for corporate printing, thereby boosting sales, whileenhancing productivity by reducing the error rate on printing orders from 10 percent to 1percent, by cutting order handling costs, and by keeping Kinko’s’ copiers humming. Other
www
Strategic Issue
Competitor intelligence, some of which canbe gleaned from competitors’ websites, isessential.

Walker et al.: Marketing Strategy: A Decision−Focused Approach, Fourth Edition
III. Formulating Market Strategies
12. Marketing Strategies for the New Economy
353© The McGraw−Hill Companies, 2002
Section Three Formulating Marketing Strategies294
dot-com printing players, such as iPrint and mimeo.com, were first to market, but Kinko’shas the brand name and more than 1,000 stores. Will the digital strategy accelerateKinko’s’ growth and increase earnings? CEO Joseph Hardin likes its potential. “We maybe late to the market,” he says, “but at the end of the day, he who executes wins.”50
Marketers’ concerns over the effectiveness and efficiency of their websites have led tothe development of web analytics, software solutions that monitor and summarize websiteusage patterns. Web analytics is the equivalent of having a team of marketing researchersfollow customers through a bricks-and-mortar retail store. The technology can uncover avariety of problems that can plague websites: cumbersome navigation, content that can’tbe easily found, underperforming search engine strategies, and unprofitable online mar-keting partnerships. The results of these analyses can improve customer satisfaction andresponse to the website, strengthen the marketer’s hand in negotiating terms of partnershipdeals, and even identify new market segments that might be best served with tailored sites.“We’re looking at the (Web analytics) every day, just like the guys on Wall Street look atdaily stock quotes,” says Jonathan Kapplow, corporate Internet marketing manager atHanover Direct, a catalog and Web retailer of gifts and apparel.51
In the final analysis, setting clear SMART objectives that new-economy tools or activ-ities are intended to meet—specific, measurable, attainable, relevant, timebound—andrunning cost–benefit analyses to assess their likely performance are necessary for makinggo/no-go decisions and for prioritizing which initiatives should be pursued first. Fortu-nately, the inherent measurability of many new-economy tools often provides clear andcompelling feedback on whether they are meeting the objectives. In addition, attentionmust be given to a variety of business process issues that can get in the way of effective execution of even the best intentions for a new-economy strategy in an old-economy company. Recent research by Rosabeth Moss Kanter identified 10 common mis-takes such companies commonly make (see Exhibit 12.12). Avoiding these errors is easiersaid than done, of course, but web analytics can help catch any errors that are made.
Developing Strategies to Serve
New-Economy Markets
This chapter has, for the most part, addressed how companies of any kind, size, industry,or age can use new-economy tools and technologies for marketing purposes. No doubt,however, there are readers who see bigger fish to fry in the new-economy skillet. They seethe new economy as offering the prospect for starting an entrepreneurial venture, in a newfirm or within an existing one, to serve a market created by the advent of the Internet, wire-less telephony, or other new or still-emerging technologies. Thus, in this final section, weaddress some lessons learned from the dot-com crash of 2000, we provide a framework for thinking about where and how revenues might be generated in the new-economy mar-ketspace, and we examine what it is likely to take to create enduring success in the new-economy ventures of tomorrow.
What Lessons Can We Learn from the Dot-comCrash?In April 2000 and the months that followed, the dot-com party ended. Many ventures withlofty market capitalizations stumbled and fell, in some cases losing more than 90 percentof their value by the end of 2000. Others shut their doors or were acquired, often on unfa-vorable terms. Venture capitalists slammed the funding window shut in some categories,
www

Walker et al.: Marketing Strategy: A Decision−Focused Approach, Fourth Edition
III. Formulating Market Strategies
12. Marketing Strategies for the New Economy
354 © The McGraw−Hill Companies, 2002
Chapter Twelve Marketing Strategies for the New Economy 295
such as e-tailing and e-hubs. With their coffers laden with money to invest, their focusmoved to other more promising—or so they hoped—sectors.52 What went wrong?
In a lengthy cover story in October 2000, Fortune magazine identified a dozen lessonsto be learned from the dot-com crash.53 The 12 lessons, shown in Exhibit 12.13, indicatecollectively that many fundamental strategic marketing principles were ignored in the madrush to what looked to be dot-com nirvana. Markets and market segments were not clearlyidentified and targeted. (Witness the Super Bowl ads for wedding announcements we sawin Chapter 7.) Low barriers to entry that made industries unattractive were ignored. (Ven-ture capitalists tripped over one another in the mad scramble to fund seven pet portal com-panies over an eight-week span.54) First-to-market mania ruled, and the ability to sustaincompetitive advantage by offering better goods and services and better value often wasoverlooked. (Web latecomers such as Kinko’s now appear to have an edge over theirupstart net printing rivals.55) The basic economics of some businesses were ignored. (It can
Exhibit 12.12The 10 Deadly Mistakes of Wanna-Dots
1. Sprinkle Internet responsibilities throughout the company—a little Web site here, a little brochure-ware there. Let them all goforward, as long as they stay small and innocuous. If any look like they have potential, raise skeptical questions at executivemeetings and repeat frequently that the Internet is overhyped.
2. Form a committee to create a new corporate Internet offering, staff it with people from unrelated areas who are already doingfive other things, and don’t release them from their regular jobs. Give the leadership role to a bored executive as a rewardfor his years of loyal service. (Never mind that he has no Internet experience; he surfs the Web, doesn’t he?)
3. Find the simplest, least-demanding thing you can do on the Web. Go for copyware that looks like what everyone else isdoing. Instead of a killer app, create a “yawner app.” (That will save time and money. And that way, you can cross the Inter-net off your to-do list quickly.)
4. To build the site, choose the vendors that are the most dismissive of your traditional business (they think you’re dinosaurs)but whose abilities you’re least capable of assessing. Then hand over the technical work to them (that way, nobody insidehas to learn anything new) but refuse to take their advice about how the site should look (after all, you’re the industryexperts). Use more than one vendor—so you can have the fun of watching them slug it out.
5. Make sure what you do on the Web is exactly the same as what you do off-line: duplicate your traditional business assump-tions on-line. (After all, the Internet is just a tool, isn’t it?)
6. Insist that an Internet venture meet every corporate standard: cost controls, quarterly earnings, recruitment sources, compen-sation policies, purchasing procedures. Allocate just enough resources to keep it alive but not enough to risk its becoming aninnovator—because that would require more investment.
7. Under the banner of decentralization and business unit autonomy, reward each unit for its own performance, and offer noextra incentives to cooperate in cyberspace. (Maintain your belief that conflict is a healthy spur to higher performance; let thevictor get the spoils.) Keep reminding divisions that they are separate businesses because they are different, and that’s that.
8. Compare your performance with your traditional industry competitors in the physical world. (That way you will always havesomeone to whom you can feel superior. ) Dismiss on-line competitors as ephemeral fads. And don’t even consider whethercompanies from unrelated industries could steal across the borders and poach your customers by using the Net. (Why worryabout the hypothetical?)
9. Celebrate your conversion to e-business by giving people in the rest of the organization tools they are unable to use, requir-ing changes they are confused about making. Tell people this will help them do their work better. Schedule training classesat a distant location. Watch as the new tools take too much time and make it harder to get work done; then punish peoplefor their resistance to make change.
10. And, last but not least, never forget that the company, not the customer, is in the driver’s seat. The Internet is an opportunityfor us to communicate with them.
Source: Reprinted by permission of Harvard Business Review from “The Ten Deadly Mistakes ofWanna-Dots,” by Rosabeth Moss Kantar, January 2001, pp. 91–100. Copyright © 2001 by the HarvardBusiness School Publishing Corporation, all rights reserved.

Walker et al.: Marketing Strategy: A Decision−Focused Approach, Fourth Edition
III. Formulating Market Strategies
12. Marketing Strategies for the New Economy
355© The McGraw−Hill Companies, 2002
Section Three Formulating Marketing Strategies296
cost more to ship a bag of pet food than consumers typically pay for it.56) Acquiring (atreasonable cost) and retaining satisfied customers matter. Profitability and positive cashflow matter (sooner rather than later revenues should exceed expenses, including market-ing expenses). Despite the carnage, however, Fortune concludes that, while the dot-comera is over, the Internet era is just getting started.
What Are the Key Success Factors in Serving the Dot-com Markets of Tomorrow?What might tomorrow’s entrepreneurs do to craft marketing strategies to serve these stillenticing new-economy markets? For one, would-be Internet entrepreneurs should considerthe various ways in which revenue can be generated on the Web or in other new-economysettings. Unless someone, a business or a consumer, is willing to fork over money for whata new business offers, its chances for success lie somewhere between slim and none.Exhibit 12.14 shows a number of ways in which revenue can be generated by Web-basedbusinesses—from commerce, by selling content, by organizing communities, or frombuilding the new-economy infrastructure. Understanding one’s business model and beingwilling to change it as market and technological conditions warrant are essential.
Exhibit 12.13Lessons Learned from the Dot-com Crash of 2000
Source: Jerry Useem, “What Have We Learned?” Fortune, October 30, 2000, pp. 82–104. © 2000 TimeInc. All rights reserved. Reprinted by permission.
The Internet isn’tas disruptive as
we thought.
If it doesn’t makecents, it doesn’t
make sense.
Time favorsincumbents.
Making a market is harder
than it looks.
There is no suchthing as
“Internet time.”
“Branding”is not astrategy.
Investorsare not yourcustomers.
The Internet still changeseverything.
The Internetchanges your
job.
The distinction betweenInternet companies andnon-Internet companies
is fading fast.
The real wealthcreation is yet to
come.
Entrepreneurshipcannot be
systematized.
www
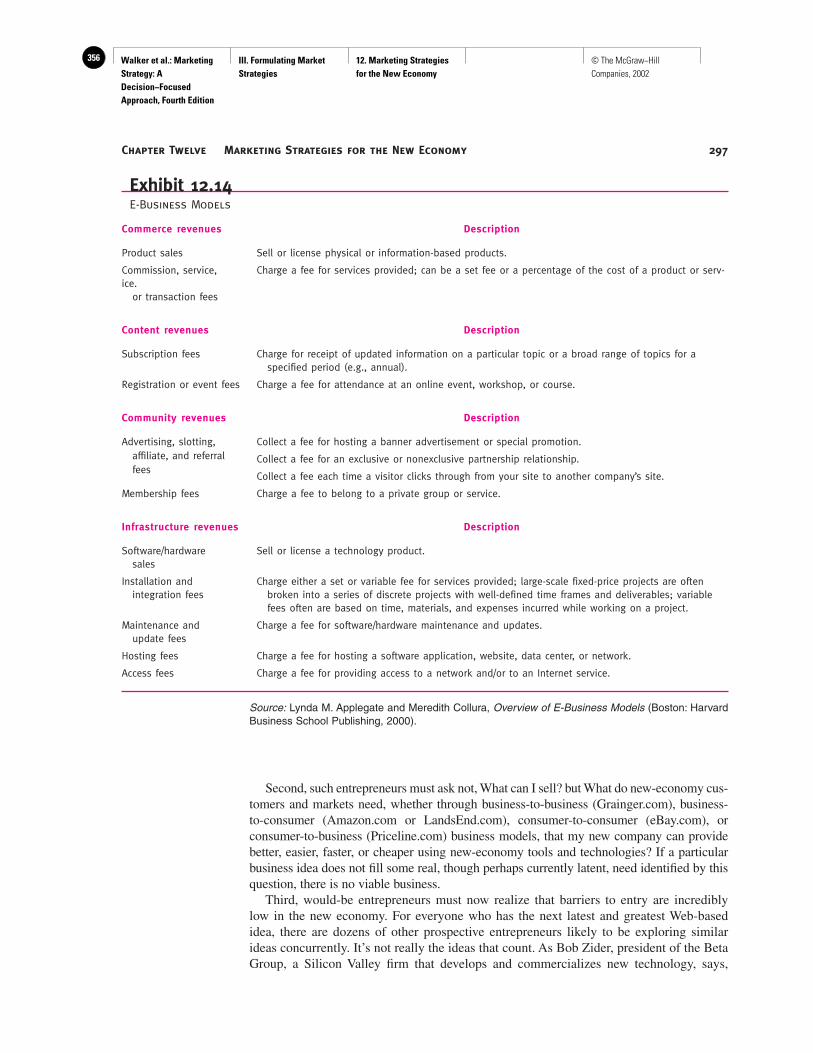
Walker et al.: Marketing Strategy: A Decision−Focused Approach, Fourth Edition
III. Formulating Market Strategies
12. Marketing Strategies for the New Economy
356 © The McGraw−Hill Companies, 2002
Chapter Twelve Marketing Strategies for the New Economy 297
Second, such entrepreneurs must ask not, What can I sell? but What do new-economy cus-tomers and markets need, whether through business-to-business (Grainger.com), business-to-consumer (Amazon.com or LandsEnd.com), consumer-to-consumer (eBay.com), or consumer-to-business (Priceline.com) business models, that my new company can providebetter, easier, faster, or cheaper using new-economy tools and technologies? If a particularbusiness idea does not fill some real, though perhaps currently latent, need identified by thisquestion, there is no viable business.
Third, would-be entrepreneurs must now realize that barriers to entry are incredibly low in the new economy. For everyone who has the next latest and greatest Web-basedidea, there are dozens of other prospective entrepreneurs likely to be exploring similarideas concurrently. It’s not really the ideas that count. As Bob Zider, president of the BetaGroup, a Silicon Valley firm that develops and commercializes new technology, says,
Exhibit 12.14E-Business Models
Commerce revenues Description
Product sales Sell or license physical or information-based products.
Commission, service, Charge a fee for services provided; can be a set fee or a percentage of the cost of a product or serv-ice.
or transaction fees
Content revenues Description
Subscription fees Charge for receipt of updated information on a particular topic or a broad range of topics for a specified period (e.g., annual).
Registration or event fees Charge a fee for attendance at an online event, workshop, or course.
Community revenues Description
Advertising, slotting, Collect a fee for hosting a banner advertisement or special promotion.affiliate, and referral Collect a fee for an exclusive or nonexclusive partnership relationship.fees
Collect a fee each time a visitor clicks through from your site to another company’s site.
Membership fees Charge a fee to belong to a private group or service.
Infrastructure revenues Description
Software/hardware Sell or license a technology product.sales
Installation and Charge either a set or variable fee for services provided; large-scale fixed-price projects are oftenintegration fees broken into a series of discrete projects with well-defined time frames and deliverables; variable
fees often are based on time, materials, and expenses incurred while working on a project.
Maintenance and Charge a fee for software/hardware maintenance and updates.update fees
Hosting fees Charge a fee for hosting a software application, website, data center, or network.
Access fees Charge a fee for providing access to a network and/or to an Internet service.
Source: Lynda M. Applegate and Meredith Collura, Overview of E-Business Models (Boston: HarvardBusiness School Publishing, 2000).
Walker et al.: Marketing Strategy: A Decision−Focused Approach, Fourth Edition
III. Formulating Market Strategies
12. Marketing Strategies for the New Economy
357© The McGraw−Hill Companies, 2002
Section Three Formulating Marketing Strategies298
“Many entrepreneurs make the mistake of thinking that venture capitalists are looking for good ideas when, in fact, they are looking for good managers in good industry seg-ments.”57 What matters is the team that will execute an idea to deliver the performance andvalue that customers, whether businesses or consumers, want and will pay for. Only thenwill investors make money. Thus, execution is key, a truism we explore in greater depth in Chapters 13 and 14. As Intel’s Andy Grove says about building the next wave of (it ishoped successful) Internet businesses, “It’s work. Very unglamorous work . . . The heavylifting is still ahead of us.”58 Much of this work is of the kind set forth in the first 12 chap-ters of this book: understanding customers and the markets they comprise; understandingindustries and the competitors that do daily battle in them; and developing strategic mar-keting programs that can establish and maintain sustainable competitive advantage.
But there’s also the work of strategy execution. In this chapter, we’ve explored the neweconomy and how both existing and new firms can find ways—measured in terms of effec-tiveness and efficiency—to take advantage of the promise it offers. In the two chapters thatremain, we examine how best to organize for the effective implementation of, and controlthe results generated by, marketing strategies. “Give me ‘A’ execution of a ‘B’ plan over‘B’ execution of an ‘A’ plan” is a common refrain heard from venture capitalists and otherinvestors. Planning is important. But effective execution delivers the results, and results arewhat count.
Take Aways
• Seven potentially attractive elements characterizemany new-economy technologies: the syndication ofinformation, the increasing returns to scale of networkproducts, the ability to efficiently personalize and cus-tomize market offerings, the ability to disintermediatedistribution, global reach, 24×7 access, and the possi-bility of instantaneous delivery.
• First-mover advantage is simply wrong. Best beats first.
• Most observers now believe that the Internet is bettersuited for delivering measurable marketing results—asis direct marketing—than for brand building.
• Web-based customer service applications offer the tan-talizing combination of better service and significantcost savings. The trick, of course, is to focus on thecustomer service benefits first, rather than mere cost
cutting, since customers are quick to discern whencost cutting takes precedence over genuine serviceresponsiveness.
• Keys to success in tomorrow’s new-economy venturesinclude clearly understanding one’s business model(Exactly where will revenue come from: commerce,content, community, or infrastructure?), filling real(though perhaps latent) customer needs, and puttingtogether the right management team that can deliverthe performance and value that customers want andwill pay for. Only then will investors make money.
• Self-diagnostic questions to test your ability to applythe analytical tools and concepts in this chapter tomarketing decision making may be found at thisbook’s website at www.mhhe.com/walker.
Endnotes
1. The information in this section comes from Bronwyn Fryer, “When Some-thing Clicks,” Inc. Technology, no. 1 (March 2000), pp. 62–72.
2. Allison Haines, “Gartner Says Consumers Will Spend 20 Times More on E-Commerce with Broadband Access,” at www.gartner.com/public/static/aboutgg/pressrel/pr200010l7a.html.
3. “The New Economy Goes Global,” Newsweek, October 2, 2000, p. 74L.
4. Joseph B. White, “What Works?” The Wall Street Journal, October 23,2000, p. R4.
5. Spencer E. Ante and Arlene Weintraub, “Why B2B Is a Scary Place to Be,”Business Week, September 11, 2000, pp. 34–37.
6. William A. Sahlman, “The New Economy Is Stronger Than You Think,”Harvard Business Review, November–December 1999, pp. 99–106.
7. Joseph B. White, “What Works?” The Wall Street Journal, October 23,2000, p. R4.
8. This section is based on Kevin Werbach, “Syndication: The EmergingModel for Business in the Internet Era,” Harvard Business Review, May–June2000, pp. 85–93.
9. This section is based on Thomas Petzinger Jr., “So Long, Supply andDemand,” The Wall Street Journal, January 1, 2000; and W. Brian Arthur,Increasing Returns and Path Dependence in the Economy (Ann Arbor, MI:University of Michigan Press, 1994).
10. Steven Levy, “The Book on the Future,” Newsweek, August 28, 2000, p. 45.
11. Matthew Rose, “Random House Fires a Shot in E-Book Feud,” The WallStreet Journal, November 1, 2000, p. B1.

Walker et al.: Marketing Strategy: A Decision−Focused Approach, Fourth Edition
III. Formulating Market Strategies
12. Marketing Strategies for the New Economy
358 © The McGraw−Hill Companies, 2002
Chapter Twelve Marketing Strategies for the New Economy 299
12. Thomas E. Weber, “Web Music’s Future: Turning Cell Phone into Wire-less Walkman,” The Wall Street Journal, July 10, 2000, p. B1.
13. Carl Shapiro and Hal R. Varian, “Versioning: The Smart Way to Sell Infor-mation,” Harvard Business Review, November–December 1998, pp. 106–14.
14. Brad Stone, “Napster’s Offspring,” Newsweek, October 16, 2000, p. 58.
15. Shapiro and Varian, “Versioning: The Smart Way to Sell Information.”
16. Much of this section is based on Jim Collins, “Best Beats First,” Inc.,August 2000, pp. 48–51.
17. Ibid., p. 48.
18. Ibid., p. 49.
19. Evan I. Schwartz, Digital Darwinism (New York: Broadway Books,1999).
20. Peter Sealey, “How E-Commerce Will Trump Brand Management,” Har-vard Business Review, July–August 1999, pp. 171–76.
21. For a broader look at Internet marketing, see Ward Hanson, Principles ofInternet Marketing (Cincinnati: South-Western College Publishing, 2000).
22. Rebecca Buckman, “A Matter of Opinion,” The Wall Street Journal, Octo-ber 23, 2000, p. R46.
23. Steve Jarvis and Deborah Szynal, “Show and Tell: Spreading the Word aboutOnline Qualitative Research,” Marketing News, November 19, 2001, p. 1.
24. Ibid., p. 13.
25. Seth Godin, Unleashing the Ideavirus (New York: Do You Zoom, 2000).
26. Joe Dysart, “Sites That Sell Themselves,” Financial Times, April 4, 2000,p. 19.
27. Ibid.
28. Jennifer Rewick, “Beyond Banners,” The Wall Street Journal, October 23,2000, p. R38; Suein Hwang and Mylene Mangalindan, “Yahoo’s GrandVision for Web Advertising Takes Some Hard Hits,” The Wall Street Journal,September 1, 2000, p. A1.
29. Vanessa O’Connell, “The Best Way to Advertise,” The Wall Street Jour-nal, November 12, 2001, p. R13.
30. PricewaterhouseCoopers study for “Interactive Advertising Bureau (IAB)Reports Q1 & Q2 Internet Ad Revenue of $3.76 Billion in the United States,”press release from IAB, September 24, 2001.
31. Ibid., p. R13.
32. Seth Godin, Permission Marketing (New York: Simon and Schuster, 1999).
33. “E-mail Is Growing as a Communications Channel for the Marketer andthe Consumer,” www3.doubleclick.net/market/1.htm.
34. Hwang and Mangalindan, “Yahoo’s Grand Vision for Web AdvertisingTakes Some Hard Hits,” p. A6.
35. Ibid.
36. David Streitfeld, “On the Web, Price Tags Blur,” The Washington PostOnline, www.washingtonpost.com/wp-dyn/articles/A_15159-2000Sep25.html.
37. Mark Wigfield, “ ‘Digital Signature’ Bill Is Cleared by Congress,” TheWall Street Journal, June 19, 2000, p. B12.
38. Youngme Moon and Francis X. Frei, “Exploding the Self-Service Myth,”Harvard Business Review, May–June 2000, pp. 26–27.
39. Dennis K. Berman, “Killer Apps for a Wireless World,” Business Weeke.biz, September 18, 2000, p. EB 43.
40. Paul Nunes, Diane Wilson, and Ajit Kambil, “The All-in-One Market,”Harvard Business Review, May–June 2000, pp. 19–20.
41. Rochelle Sharpe, “The Virtual Couch,” Business Week e.biz, September18, 2000, pp. EB 135–37; Richard B. Schmitt, “Lawyers vs. the Internet,” TheWall Street Journal, July 17, 2000, p. B12.
42. Peter Gumbel, “Return to Sender,” The Wall Street Journal, September 24,2001, p. R19; Arlene Weintraub, “Dead Letter,” Business Week e.biz, October23, 2000, pp. EB 82–84.
43. From the science fiction movie Star Trek, in which it was routine to digi-tally transmit objects, including people, from place to place.
44. Frederick F. Reichheld and Phil Schefter, “E-Loyalty: Your SecretWeapon on the Web,” Harvard Business Review, July–August 2000,pp. 105–13.
45. Charles Haddad, “Big Brown’s Coup,” Business Week e.biz, September18, 2000, pp. EB 76–77.
46. Michael Warshaw, “The Thing That Would Not Die,” Inc. Technology, no.1 (March 2000), p. 89.
47. Youngme Moon and Francis X. Frei, “Exploding the Self-Service Myth,”Harvard Business Review, May–June 2000, pp. 26–27.
48. Melanie Warner, “Fallen Idols,” Fortune, October 30, 2000, pp. 108–21.
49. Haddad, “Big Brown’s Coup.”
50. Arlene Weintraub, “Late to the Party,” Business Week, August 28, 2000, p.254.
51. Steve Jarvis, “Follow the Money,” Marketing News, October 8, 2001, p. 10.
52. Warner, “Fallen Idols.”
53. Jerry Useem, “What Have We Learned?” Fortune, October 30, 2000,pp. 82–104.
54. Warner, “Fallen Idols.”
55. Weintraub, “Late to the Party.”
56. Ibid.
57. Bob Zider, “How Venture Capital Works,” Harvard Business Review,November–December 1998, pp. 131–39.
58. Useem, “What Have We Learned?”
Walker et al.: Marketing Strategy: A Decision−Focused Approach, Fourth Edition
IV. Implementation and Control
14. Measuring and Delivering Marketing Performance
359© The McGraw−Hill Companies, 2002
328
Chapter Fourteen
MEASURING AND DELIVERING
MARKETING PERFORMANCE
Controls Pay for Wal-Mart1
Wal-Mart is a discount general merchan-dise retailer with sales of over $165 billionand net income of over $5.5 billion in fis-
cal 1999. Founded less than 40 years ago, it isAmerica’s largest, most-profitable, and one of itsmost-admired companies. Over the past decade ithas continuously ranked as one of the best com-panies in its return on stockholders’ equity.
As of November 2000, the companyoperated over 4,000 stores, of whichmore than 1,000 were outside the United
States (in Mexico, Canada, Europe, and Asia). Ofthese stores, 866 were supercenters (a combina-tion supermarket and general merchandise store)and 469 were Sam’s Clubs. Management had anaggressive plan for store growth in fiscal 2000—40 Wal-Mart stores, 170 to 180 supercenters, and40 to 50 Sam’s Clubs. Internationally, the plan callsfor 100 to 110 new stores. Wal-Mart stores servemore than 100 million customers per week, andthe company employs more than 1 million people.
A major reason for Wal-Mart’s success is its abil-ity to control costs. In 1999 it was able to hold itsoperating, selling, and general administrative coststo 16.4 percent of sales. This was substantiallybelow that of its closest competitor, Kmart, andexplains, in part, the company’s excellent profitabil-ity record.
In the 1960s when he had only 10 stores, SamWalton realized he couldn’t expand successfullyunless he could capture the information needed tocontrol his operations. He became, according toone competitor, the best utilizer of control infor-mation in the industry. By the late 1970s Wal-Martwas using a storewide computer-driven informa-tion system that linked stores, distribution cen-ters, and suppliers. Kmart started using a similarsystem only in the early 1990s.2 In the late 1980sSam Walton tapped David Glass to take over asCEO. Now the company’s chairman, Glass, morethan anyone, successfully engineered the develop-ment of Wal-Mart’s advanced distribution and merchandise-tracking system, which were neededto handle the enormous sales increases as thecompany’s stores spread throughout the UnitedStates. “Wal-Mart’s incomparable systems are asecret of its success—the unadvertised contributorto the stock’s 46.8 percent average annual returnduring the decade before Sam’s death.”3
Today, the company can convert informationinto action almost immediately. To do so requireda massive investment (over $700 million) in com-puter and satellite systems, which collectivelygenerate the largest civilian database of its kind inthe world. In addition to automated replenish-ment, the system provides up-to-the-minute sales
Walker et al.: Marketing Strategy: A Decision−Focused Approach, Fourth Edition
IV. Implementation and Control
14. Measuring and Delivering Marketing Performance
360 © The McGraw−Hill Companies, 2002
329
of any item by region, district, and store. By look-ing at the computer screens in the satellite room,a manager can see systemwide data of the day’ssales as they happen, the number of stolen bankcards retrieved that day, whether the seven-secondcredit card approval system is working properly,and the number of customer transactions com-pleted that day.
Wal-Mart’s philosophy has always been that itsexecutives should spend part of their time in thefield visiting with associates (employees) and cus-tomers. Thus, they board the company’s propplanes in Bentonville on Monday each week, return-ing to share their findings with headquarters per-sonnel and to prepare for a series of merchandisemeetings Friday and Saturday. These are no-holds-barred sessions concerned with moving merchan-dise. For example, in one meeting it was suggestedthat Wal-Mart was missing a great business oppor-
tunity in street-hockey gear because of the in-lineskate craze. Others agreed, and within a few min-utes appropriate action had been taken, includingthe development of an eight-foot-long display sec-tion.4 This was, and similar decisions will be, com-municated to all store managers by the followingmorning at the latest using Wal-Mart’s computer-driven communications system.
By merging state-of-the-art computer communi-cations technology with hands-on management,Wal-Mart has developed a distribution system tothe point stores should never be out of stock.Doing this better than its rivals has resulted in sub-stantially more sales per square foot than com-petitors and, hence, a faster stock turn. This meansless borrowing to carry fewer inventories andhence lower interest payments—several hundredmillion dollars lower than its nearest competitor.And lost sales because of stockouts are minimized.
Strategic Challenges Addressed
in Chapter 14
In Chapter 13, we said that planning is important, and that effective implementation is cru-cial. The Wal-Mart example demonstrates how effective planning and implementation canplay out in the performance of a company. Together, these two activities constitute theheart of most business endeavors. In the end, however, it is neither planning nor imple-
mentation that really counts. Results are what counts. Results are whatmanagers and entrepreneurs are paid to deliver. Results are what attractinvestment capital to permit a company—whether a large public com-pany such as Wal-Mart or an emerging dot-com start-up—to grow. Justwatch what happens to a public company’s stock price when the resultsare not what Wall Street expects. The share price plummets and, some-
times, heads roll. Weak sales and profit performance at Gap Inc. in late 1999 and 2000 cutGap’s stock price by half and led to a series of middle and upper management changes atthe once high-flying retailer.5 The focus on results is not restricted to for-profit organiza-tions either. Exhibit 14.1 shows how some nonprofit organizations are measuring their suc-cess and winning increased funding from donors as a result.
In Chapter 14, we address several critical questions that provide the link between acompany’s efforts to plan and implement marketing strategies and the actual results thatthose strategies produce. How can we design strategic control systems to make sure thestrategies we are pursuing remain in sync with the changing market and competitive envi-ronment in which we operate? How can we design systems of marketing metrics to ensurethat the marketing results we plan for are the results we deliver? In other words, if the ship
Strategic Issue
Results are what managers and entrepreneurs are paid to deliver. Resultsare what attract investment capital to permit a company to grow.

Walker et al.: Marketing Strategy: A Decision−Focused Approach, Fourth Edition
IV. Implementation and Control
14. Measuring and Delivering Marketing Performance
361© The McGraw−Hill Companies, 2002
Section Four Implementation and Control330
gets off course during the journey, either strategically or in terms of execution of the mar-keting strategy, how can we make sure that we know quickly of the deviation so that mid-course corrections can be made in a timely manner? In today’s rapidly changing markets,even the best-laid plans are likely to require changes as their implementation unfolds.
We begin by developing a five-step process for evaluating and controlling marketingperformance on a continuous basis. We then apply the process to the issue of strategiccontrol: How can we monitor and evaluate our overall marketing strategy to ensure that itremains viable in the face of changing market and competitive realities? Next, we applythe process to tracking the performance of a particular product-market entry and to themarketing actions taken to implement its marketing plan, or marketing performancemeasurement. Are we meeting sales targets, in the aggregate and for various products andmarket segments? Is each element of the marketing mix doing its job: Which items in theproduct line are selling best, are the ads producing enough sales leads, is the salesforcegenerating enough new accounts, and so on? Finally, we show how marketing audits canbe used periodically to link the control process—for both strategic control and for meas-uring current marketing performance—with marketing planning.
Designing Control Systems Step
by Step
As the Wal-Mart example demonstrates, a well-functioning control and reappraisal systemis critical to the success of a business. To be successful, it should be well integrated withthe other steps in the marketing management process: setting objectives, formulatingstrategies, and implementing a plan of action. The control system monitors the extent towhich the firm is achieving its objectives. When it is not, the firm determines whether the
Kingsley House, a children’s services agency in NewOrleans, has adopted specific, measurable goals
for each of its programs, such as increased rates ofemployment and improved parenting skills for theclient families it serves. It tracks and reports its resultsquarterly and shares them with its staff and the com-munication it serves. The agency credits its ability todemonstrate positive outcomes for its recent successin raising $4.7 million in grants and business dona-tions, beating its fund-raising goal by $500,000.“Tracking outcomes leads to greater confidence thatfunded programs are effective, that they have the sup-port of people in the community,” says Martha TaylorGreenway, a senior director for United Way of America,one of Kingsley House’s donors.
More than 150 local United Way organizationsacross the United States and more than 7, 500 fundedhuman services agencies have adopted models in
which program outcomes are measured and assessedagainst specific goals. For United Way of the Piedmont(UWP) in Spartanburg, South Carolina, it is no longerenough to simply send money to popular causes. “Wegot out of the business of reviewing all the agenciesthat apply for funding and passing judgment on howthey ought to be run,” says UWP President Vince Pul-skamp. “Their boards do that. We began to focus onhow well they actually deliver results. Agencies receiv-ing funding for their programs need to show that theircustomers are satisfied and that the program works,not just that their unit costs are in line. We treat ourdonor dollars as an investment with returns, so we cango back to the community and show how their moneyis spent and what was achieved.”
Source: “Making Results Count,” Leader to Leader, Summer 1997.
Exhibit 14.1 Measuring and Demonstrating Results Attract Grants for Children’sServices Agency

Walker et al.: Marketing Strategy: A Decision−Focused Approach, Fourth Edition
IV. Implementation and Control
14. Measuring and Delivering Marketing Performance
362 © The McGraw−Hill Companies, 2002
Chapter Fourteen Measuring and Delivering Marketing Performance 331
reason lies in the environment, the strategies employed, the action plans, the way the planswere being implemented, or some combination thereof. Thus, the control and reappraisalstep is diagnostic, serving to start the marketing management process anew.
Control processes differ at each organization level. Thus, in a large diversified company,corporate management is concerned with how well its various SBUs are performing rela-tive to the opportunities and threats each faces and the resources given them. Control herewould be strategic. At the SBU level, or in smaller companies, concern is primarily withthe unit’s own strategy, especially as it pertains to its individual product-market entries. Wewill concentrate mainly on this latter organizational level since it constitutes the bulk ofany control system.
Regardless of the organization level involved, the control process is essentially the same.It consists of five steps: setting performance standards, specifying feedback, obtaining data,evaluating it, and taking corrective action (see Exhibit 14.2). Although the staff organiza-tion is typically responsible for generating the control data, the line organization adminis-ters the control process. Certainly, this is the case with Wal-Mart, as seen in the involvementof regional vice president, district managers, store managers, and department heads inobtaining and processing control data as well as taking corrective action. More importantly,line managers need to be closely involved with the development of the control system, sothat they can be assured of getting the performance data they need, on a timely basis, andin a format they can easily use to support their long-term and day-to-day decision making.
Setting Standards of PerformanceThese standards derive largely from the objectives and strategies set forth at the SBU andindividual product-market entry level. They generate a series of performance expectationsfor profitability (return on equity or return on assets managed), market share, and sales. Atthe product-market level, standards of performance also include sales and market-share
Exhibit 14.2The Control Process
������� �������� � ��� ����
���������� ��� �������� �������� ����
��������� ��� ������ ����
���������� �������� ������������������ ������� ������ ��� ������������� � ��� ����
������ ������� �����

Walker et al.: Marketing Strategy: A Decision−Focused Approach, Fourth Edition
IV. Implementation and Control
14. Measuring and Delivering Marketing Performance
363© The McGraw−Hill Companies, 2002
Section Four Implementation and Control332
determinants such as percent effective distribution, relative shelf-facings, awareness, con-sumers’ attitude change toward a given product attribute, customer satisfaction, and theextent of price parity.
Similarly, for every line item in a marketing budget—product development costs,advertising and promotional expenses, costs for salespeople, and so on—specific and
measurable standards of performance must be set so that each of theseelements of marketing performance can be evaluated. We address thedevelopment of these standards later in this chapter. Without a reason-able set of performance standards, managers cannot know what resultsare being obtained, the extent to which they are satisfactory, or why theyare or are not satisfactory. Performance-based control measures are oftentied to the compensation of those individuals responsible for attainingthe specified goals. Such a system can cause actions to be taken that in
the short term may help attain the desired goals but in the longer term may be detrimentalto the firm (see Exhibit 14.3).
Recent years have witnessed a shift from using primarily financially based performancemeasures to treating them as simply part of a broader array of measures. While the use ofnonfinancial measures is not new, giving them equal or greater status is. Thus, more andmore companies are turning to measures they feel better reflect how their managers thinkabout what decision areas drive the firm’s success, such as customer satisfaction, productquality, market share, and new product development. If the firm has set enhanced share-holder value as its ultimate objective, then it needs to change from the traditional ROI con-cept to one using a valuation model that focuses on the future cash flow trend, which isdiscounted at an appropriate discount rate adjusted for risk.6
The increasing use of cross-functional teams empowered to manage such processes asorder fulfillment, major accounts, and new product introductions has required the devel-opment of a new set of imaginative control measures. In a similar vein, Robert Simmonsbelieves that more managers are facing the problem of how to exercise control in organi-zational settings that require flexibility, innovation, and creativity. Employees are beingasked to use initiative in servicing customer needs and seizing opportunities, and yet, in sodoing, they may expose the company to substantial risk.7
To be of any value, performance standards must be measurable; further, they must betied to specific time periods, particularly when they concern a management compensationsystem. The SMART acronym (specific, measurable, attainable, relevant, and timebound),
Strategic Issue
For every line item in a marketing budget—product development costs, advertising andpromotional expenses, costs for salespeo-ple, and so on—specific and measurablestandards of performance must be set sothat each of these elements of marketingperformance can be evaluated.
Bausch & Lomb, a large international firm known forits Ray-Ban sunglasses, contact lenses, and a wide
array of eyewear products, has experienced seriousfinancial problems. The emphasis on achieving double-digit annual profit growth caused managers to useshort-term tactics that in the longer term would woundthe company seriously. Favorite tactics were to givecustomers unusually long payment terms and threatento fire distributors unless they took on large quantitiesof unwanted merchandise. They also shipped goodsbefore they were ordered and booked them as sales.
According to some executives, division heads mightreceive a small bonus even if they fell 10 percent shortof yearly earning targets, while an overage was hand-somely rewarded. A small weight was assigned to suchassets as receivables and inventories, but apparentlyone could miss the assigned asset objectives substan-tially and still get a big bonus. Customer satisfactionwas given a small importance rating.
Source: Reprinted from Mark Maremont and Gail DeGeorge, “BlindAmbition,” Business Week, October 23, 1995, p. 78, with special per-mission. Copyright © 1995 by The McGraw-Hill Companies, Inc.
Exhibit 14.3 Blind Ambition at Bausch & Lomb

Walker et al.: Marketing Strategy: A Decision−Focused Approach, Fourth Edition
IV. Implementation and Control
14. Measuring and Delivering Marketing Performance
364 © The McGraw−Hill Companies, 2002
Chapter Fourteen Measuring and Delivering Marketing Performance 333
to which we have referred when discussing the setting of objectives in earlier chapters, isa useful framework for setting performance standards. Generally, control systems at theproduct-market level operate on a monthly, quarterly, and annual basis, with the monthlyand quarterly data cumulated to present a current picture and to facilitate comparisons withprior years. In recent years, the trend has been for control systems to operate over shorterperiods (weekly and even daily) and for control data to be more readily available. Wal-Mart’s inventory control system, for example, provides instantaneous up-to-date data.Strategic control tends to operate over longer periods.
Of particular importance is whether the business unit as a whole and its individual product-market entries have set forth milestone achievement measures. For example, in athree-year strategic plan, a given SBU might have 12-month milestones such as annual salesof $100 million, profits of $20 million, and a return on assets managed of 14.5 percent. Atthe product-market entry level, milestones include such measures as product sales by mar-ket segments, marginal contributions, and operating margins. At the marketing functionalarea level, examples of milestone measures for a consumer good are level of awareness,trial, repeat purchases (brand loyalty) among members of the target audience, reduction inmarketing costs as a percent of sales, and percent of stores stocking (weighted by sales).
In recent years, major U.S. companies such as AT&T, DuPont, Ford, GM, IBM, andMotorola have used a new performance type of measure—benchmarking. What this means isthat the firm’s performance in a given area is compared against the performance of other com-panies. Thus, Wal-Mart regularly compares itself with its competitors on merchandise assort-ments, service quality, and out of stocks. The comparison does not, however, have to be withcompanies in the same industry. For example, Xerox benchmarked its order filling/shippingperformance against L. L. Bean (a mail-order retailer catering to the outdoor set), which hasa well-deserved reputation for fulfilling orders both quickly and accurately. A visit to Bean’swarehouse revealed that workers could “pick and pack” items three times as fast as Xerox.8
Profitability Analysis Regardless of the organizational level, control involves someform of profitability analysis. In brief, profitability analysis requires that analysts deter-mine the costs associated with specific marketing activities to find out the profitability ofsuch units as different market segments, products, customer accounts, and distributionchannels (intermediaries). Wal-Mart does this at the department and individual store lev-els as well as for individual lines of goods within a department. More and more managersare attempting to obtain profitability measures for individual products by market segments.
Profitability is probably the single most important measure of performance, but it haslimitations. These are that (1) many objectives can best be measured in nonfinancial terms(maintaining market share); (2) profit is a short-term measure and can be manipulated bytaking actions that may prove dysfunctional in the longer term (reducing R&D expenses);and (3) profits can be affected by factors over which management has no control (theweather). For a discussion of the newly discovered profitability religion in the dot-comworld, see Exhibit 14.4.
Analysts can use direct or full costing in determining the profitability of a product ormarket segment. In full costing, analysts assign both direct, or variable, and indirect coststo the unit of analysis. Indirect costs involve certain fixed joint costs that cannot be linkeddirectly to a single unit of analysis. For example, the costs of occupancy, general manage-ment, and the management of the salesforce are all indirect costs for a multiproduct com-pany. Those who use full costing argue that only by allocating all costs to a product or amarket can they obtain an accurate picture of its value.
Direct costing involves the use of contribution accounting. Those favoring the contri-bution margin approach argue there is really no accurate way to assign indirect costs.
www

Walker et al.: Marketing Strategy: A Decision−Focused Approach, Fourth Edition
IV. Implementation and Control
14. Measuring and Delivering Marketing Performance
365© The McGraw−Hill Companies, 2002
Section Four Implementation and Control334
Further, because indirect costs are mostly fixed, a product or market may make a contribu-tion to profits even if it shows a loss. Thus, even though the company must eventuallyabsorb its overhead costs, the contribution method clearly indicates what is gained byadding or dropping a product or a customer. Exhibit 14.5 shows an example of full anddirect costing. The difference in the results obtained is substantial—$370,000 using fullcosting versus $650,000 with the contribution method.
Contribution analysis is helpful in determining the yield derived from the application ofadditional resources (for instance, to certain sales territories). Using the data in Exhibit14.6 we can answer the question, “How much additional profit would result from a mar-ginal increase in sales of $300,000—assuming the gross margin remains at 19.62 percentand the only cost is $35,000 more in sales commissions and expenses?” As Exhibit 14.6shows, the answer is a profit increase before taxes of $53,000.
Companies are increasingly turning from traditional accounting methods, which iden-tify costs according to various expense categories, to activity-based costing (ABC), whichbases costs on the different tasks involved in performing a given activity. ABC advocateshave used it to improve product costing, thereby improving pricing parameters, providingbetter service, trimming waste, and evaluating quality initiative.9
Customer Satisfaction So far, we have been discussing performance measures inessentially financial terms. But financial terms are insufficient since they fail to recognizethe importance of customer satisfaction, which is an important driving force of the firm’sfuture market share and profitability. As products and services become more alike in analready highly competitive marketplace, the ability to satisfy the customer across a varietyof activities (of which the product is only one) will become an even greater success deter-minant. Thus, measures relating to customer preferences and satisfaction are essential asan early warning of impending problems and opportunities.
A multiproduct firm will need customer satisfaction measures for each of its differentproducts even if they are sold to the same customer. This would especially be the case if
In the dot-com heyday of the late 1990s, it was saidthat profitability was not very important for dot-com
companies. Other metrics, like first to market or firstto scale, were thought to be sufficient. “We’ll makemoney when we get big enough,” said many a dot-com CEO. In April 2000, however, the sky-high dot-comstock market valuations came tumbling down, and thefinancing window for many dot-coms slammed shut.Suddenly, a newfound religion—profitability and posi-tive cash flow—took its place on the dashboards ofdot-com CEOs.
These CEOs found themselves thinking about moretangible, shorter-term performance metrics. The cost toacquire a customer was measured—and often found tobe prohibitive—and new, lower-cost customer acquisi-tion strategies were developed. The costs to deliverproducts sold in cyberspace but delivered on MapleStreet were examined. Bags of dog food, for example,
cost more to deliver one by one than most of themcost to buy in the first place. The efficacy and cost-effectiveness of banner ads for building brands wasmeasured—and often found wanting—as we saw inChapter 9.
In hindsight, most observers find these changes tohave been healthy, in terms of directing investmentcapital to new-economy businesses that offer thepotential to deliver real value for which customers arewilling to pay. Is the frenzy over? Probably not. Buttoday’s dot-com entrepreneurs and those who fundthem now know that measuring marketing perfor-mance and profitability is among the most importantactivities their firms undertake.
Source: Jerry Useem, “What Have We Learned?” Fortune, October30, 2000, pp. 82–104; and Melanie Warner, “Fallen Idols,” Fortune,October 30, 2000, pp. 108–21.
Exhibit 14.4 Is Profitability Important in the Dot-com World?

Walker et al.: Marketing Strategy: A Decision−Focused Approach, Fourth Edition
IV. Implementation and Control
14. Measuring and Delivering Marketing Performance
366 © The McGraw−Hill Companies, 2002
Chapter Fourteen Measuring and Delivering Marketing Performance 335
the choice criteria varied substantially between products, especially in terms of expecta-tions regarding service (delivery, repairs, and availability of spare parts). Also, a firm needsto develop its own satisfaction measures with its various intermediaries (channel members)and major suppliers (advertising agencies).
Developing a meaningful measure of customer satisfaction requires the merging of two kinds of measures. The first has to do with an understanding and measurement of thecriteria used by customers to evaluate the quality of the firm’s relationship with them.Knowing the product/service attributes that constitute the customer’s choice criteria aswell as the relative importance of each should facilitate this task. These were developed inthe process by which the firm identifies the target market for its product-market entries.Once these attributes are identified, they serve as the basis for developing expectationmeasures.
The second type of measurement is concerned with how well the firm is meeting thecustomer’s expectations on an individual attribute as well as an overall basis. Thus, if thechoice criteria of a cruiseline’s target market included such attributes as food, exercisefacilities, and entertainment, then a performance measure would be developed for each. Byweighting these by the relative importance of each, an overall performance measure can beobtained. These two measures collectively serve as the basis for evaluating the company’sperformance on customer satisfaction.
Exhibit 14.5Finding Product or Market Profitability with Full Costing and Marginal Contribution Methods ($000)
Marginal Full costing contribution
Net sales $5,400 $5,400
Less: Cost of goods sold—includes direct costs (labor, material, and production overhead)* 3,800 3,800
Gross margin $1,600 $1,600
Expenses
Salesforce—includes direct costs (commissions) plus indirect costs (sales expenses, sales management overhead)† 510 450
Advertising—includes direct costs (media, production) plus indirect costs (management overhead) 215 185
Physical logistics—includes direct costs (transportation) plus indirect costs (order processing, warehousing costs) 225 190
Occupancy—includes direct costs (telephone) plus indirect costs (heat/air, insurance, taxes, building maintenance) 100 25
Management overhead—includes direct costs (product/brand manager and staff ) plus indirect costs (salaries, expenses, occupancy costs of SBU’s general management group) 180 100
Total $1,230 $ 950
Profit before taxes $ 370
Contribution to fixed costs and profits $ 650
*Production facilities dedicated to a single product.
†Multiproduct salesforce.

Walker et al.: Marketing Strategy: A Decision−Focused Approach, Fourth Edition
IV. Implementation and Control
14. Measuring and Delivering Marketing Performance
367© The McGraw−Hill Companies, 2002
Section Four Implementation and Control336
In recent years more top-level executives are visiting their major accounts (whether theybe end-use customers or intermediaries) to learn firsthand how to better serve them. Suchvisits frequently result in joint projects designed to reduce the costs incurred by both par-ties in the sale of a given set of products.10
Specifying and Obtaining Feedback DataOnce a company has established its performance standards, its next step is to develop asystem that provides usable and timely feedback data on actual performance. In most casessomeone must gather and process considerable data to obtain the performance measures,especially at the product-market level. Analysts obtain feedback data from a variety ofsources, including company accounting records and syndicated marketing informationservices such as Nielsen. The sales invoice or other transaction records, such as those pro-duced by retailers’ point-of-sale systems, are the basic internal source of data because theyprovide a detailed record of each transaction. Invoices are the basis for measuring prof-itability, sales, and various budget items. They also provide data for the analysis of the geo-graphic distribution of sales and customer accounts by type and size.
Another source, and typically the most expensive and time-consuming, involves under-taking one or more marketing research projects to obtain needed information. In-houseresearch projects are apt to take longer and be more expensive than using an outside syn-dicated service. But there may be no alternative, as, for example, in determining awarenessand attitude changes and obtaining data on customer service. Exhibit 14.7 gives an exam-ple of how Wal-Mart uses marketing research to help maintain its low-price image. A thirdsource, and one we discussed above, involves the use of executives to gather informationfrom their personal visits with customers.
Evaluating Feedback DataManagement evaluates feedback data to find out whether there is any deviation from theplan, and if so why. Wal-Mart does this in a variety of ways, including sending its regionalvice presidents into the field on a regular basis to learn what’s going on and why.
Exhibit 14.6Effect of $300,000 Increase in Sales Resulting from Increased Sales Commissions and Expenses of $35,000
(same data as in Exhibit 14.5) ($000)
Net sales $5,700
Less: direct costs (29.62%) 4,012
$ 1,688
Expenses
Sales commissions and expenses 485
Advertising 185
Physical logistics 190
Occupancy 25
Management 100
$ 985
Contribution to overhead and profits $ 703
Increase in profit (before tax) = $703 – $650 = $ 53

Walker et al.: Marketing Strategy: A Decision−Focused Approach, Fourth Edition
IV. Implementation and Control
14. Measuring and Delivering Marketing Performance
368 © The McGraw−Hill Companies, 2002
Chapter Fourteen Measuring and Delivering Marketing Performance 337
Typically, managers use a variety of information to determine what the company’s per-formance should have been under the actual market conditions that existed when the planwas executed. In some cases this information can be obtained in measured form; examplesinclude a shift in personal disposable income (available from government sources), achange in the demand for a given product type (obtained when measuring market share),the impact of a new brand on market share (reported by a commercial source), or a changein price by a major competitor. Often, however, the explanation rests on inferences drawnfrom generalized data, as would be the case in attributing poor sales performance to animprovement in a competitor’s salesforce.
At the line-item level, whether for revenue or expenses, results are compared with thestandards set in step one of the control process. A merchandise manager or buyer at anapparel retailer such as Gap, for example, would track sales results of each style or mer-chandise category in terms of its selling rate (how many weeks’ supply is on hand overalland in which stores?) and its gross margin performance. For a district sales team of anindustrial goods manufacturer, salespeople might be measured on the number of sales callsthey make per week, the number of new accounts they generate, their sales volume in dol-lars and units, their travel expenses, and a variety of other metrics. A stylist in a beautysalon might be measured in terms of the number or sales dollars of haircuts she producesper day or per hour.
Taking Corrective ActionThe last step in the control process concerns prescribing the needed action to correct thesituation. At Wal-Mart, this is partly accomplished at its various congresses held every Fri-day and Saturday when managers decide what actions to take to solve selected problems.Success here depends on how well managers carry out the evaluation step. When linkagesbetween inputs and outputs are clear, managers can presume a causal relationship andspecify appropriate action. For example, assume that inputs consisted of an advertisingschedule that specified the frequency of a given TV message. The objective was to changeattitudes about a given product attribute (the output). If the attitude change did not occur,remedial action would start with an evaluation of the firm’s advertising effort, particularlythe advertising message and how frequently it ran.
But in most cases it is difficult to identify the cause of the problem. Almost always, aninteractive effect exists among the input variables as well as the environment. There is alsothe problem of delayed responses and carry-over effects. For example, advertisers canrarely separate the effects of the message, media, frequency of exposure, and competitiveresponses in an attempt to determine advertising effects. Even if the company could deter-mine the cause of a problem, it faces the difficulty of prescribing the appropriate action totake. Most control systems are “based on the assumption that corrective action is knownshould significant variations arise. Unfortunately, marketing is not at a stage where per-formance deviations can be corrected with certainty.”11
Wal-Mart makes every effort to keep its regulareveryday prices lower than competitors’ on a set
of critical products. These “image items” are thought tobe the basis of a customer’s perception of how expen-sive a store is. Every few weeks Wal-Mart undertakes
research to determine the prices charged by its majorcompetitors for these same items. The company thenmakes sure that Wal-Mart has the lowest price. Eventop management, including Sam Walton when he wasalive, has been known to do comparison shopping.
Exhibit 14.7 Wal-Mart Uses Marketing Research to Maintain Price Image

Walker et al.: Marketing Strategy: A Decision−Focused Approach, Fourth Edition
IV. Implementation and Control
14. Measuring and Delivering Marketing Performance
369© The McGraw−Hill Companies, 2002
Section Four Implementation and Control338
Sometimes the situation is so serious (shipping time lags competition by 30 percent) thatradical change is needed. To more and more business managers this means “reengineering”or starting all over. This involves rethinking and redesigning the relevant business processes“to achieve dramatic improvements in critical contemporary measures of performance suchas cost, quality, service, and speed.”12 A business process uses a variety of activities to cre-ate an output that is of value to a customer. For example, the order-filling process exists onlyto deliver the right goods to a customer in good shape and in the time promised.
Sometimes the outcome is greater or better than management had planned; for exam-ple, when sales and market share exceed the schedule. In such cases, the marketers stillneed an evaluation to find out why such a variance occurred. Perhaps a more favorableenvironment evolved because demand was greater than expected and a major competitorfailed to take advantage of it. Or perhaps the advertising message was more effective thanexpected. These different reasons would call for different marketing responses to holdwhat had been obtained and to further exploit the favorable situation.
Design Decisions for Strategic
Control Systems
Strategic control is concerned with monitoring and evaluating a firm’s SBU-level strate-gies (see Exhibit 14.8 for the kinds of questions this type of control system is designed toanswer). Such a system is difficult to implement because there is usually a substantialamount of time between strategy formulation and when a strategy takes hold and resultsare evident. Since both the external and internal environments are constantly evolving,
strategic control must provide some way of changing the firm’s thrust ifnew information about the environment and/or the firm’s performance sodictates. Inevitably, much of this intermediate assessment is based oninformation about the marketplace and the results obtained from thefirm’s marketing plan.
Identifying Key VariablesTo implement strategic control, a company must identify the key variables to monitor,which are the major assumptions (planning premises) made in formulating the strategy.The key variables to monitor are the two types: those concerned with external forces and those concerned with the effects of certain actions taken by the firm to implement the
Strategic Issue
Strategic control must provide some way ofchanging the firm’s thrust if new informationabout the environment and/or the firm’s performance so dictates.
Exhibit 14.8Examples of Questions a Strategic Control System Should Be Able to Answer
1. What changes in the environment have negatively affected the current strategy (e.g., interest rates, government controls, or price changes in substitute products)?
2. What changes have major competitors made in their objectives and strategies?
3. What changes have occurred in the industry in such attributes as capacity, entry barriers, and substitute products?
4. What new opportunities or threats have derived from changes in the environment, competitors’ strategies, or the nature of theindustry?
5. What changes have occurred in the industry’s key success factors?
6. To what extent is the firm’s current strategy consistent with the preceding changes?

Walker et al.: Marketing Strategy: A Decision−Focused Approach, Fourth Edition
IV. Implementation and Control
14. Measuring and Delivering Marketing Performance
370 © The McGraw−Hill Companies, 2002
Chapter Fourteen Measuring and Delivering Marketing Performance 339
strategy. Examples of the former include changes in the external environment such aschanges in long-term demand, the advent of new technology, a change in governmentallegislation, and actions by a competitor. Examples of the latter types (actions by the firm)include the firm’s advertising efforts to change attitudes and in-store merchandising activ-ities designed to improve product availability.
The frameworks and analytical tools for market and competitive analysis that we dis-cussed in Chapters 4 and 5 are useful in determining what variables to monitor in a strate-gic control system. Deciding exactly which variables to monitor is a company-specificdecision; in general, it should focus on those variables most likely to affect the company’sfuture position within its industry group.
Tracking and MonitoringThe next step is to specify what information or measures are needed on each of the keyvariables to determine whether the implementation of the strategic plan is on schedule—and if not, why not. The firm can use the control plan as an early-warning system as wellas a diagnostic tool. If, for example, the firm has made certain assumptions about the rateat which market demand will increase, it should monitor industry sales regularly. If it hasmade assumptions about advertising and its effect on attitudes, it would be likely to usemeasures of awareness, trial, and repeat buying. In any event, the firm must closely exam-ine the relevancy, accuracy, and cost of obtaining the needed measures.
The advent of e-mail, intranets, and other digital tools for disseminating informationhas made it easier for sometimes far-flung managers to monitor strategic developments.Critical strategic control information can now be monitored on a real-time basis anywherein the world.
Strategy ReassessmentThis can take place at periodic intervals—for example, quarterly or annually, when thefirm evaluates its performance to date along with major changes in the external environ-ment. It also can use the control system to alert management of a significant change ineither or both its external/internal environments. This involves setting triggers to signal theneed to reassess the viability of the firm’s strategy. It requires a specification of both thelevel at which an alert will be called and the combination of events that must occur beforethe firm reacts. For example, total industry sales of 10 percent less than expected for a sin-gle month would not be likely to trigger a response, whereas a 25 percent drop would. Ora firm might decide that triggering will occur only after three successive months in whicha difference of 10 percent occurred in each.
In the fast-changing dot-com world, strategy reassessment may happen much morequickly, as competitive and technological developments cause firms to quickly changetheir entire strategies and business models. Reasonware.com, an e-tailer of wireless tele-phone products and services, began in late 2000 to develop a new strategy focused on busi-ness services when it realized how difficult it was for most e-tailers to reach profitability.13
Design Decisions for Marketing
Performance Measurement
Designing control systems to measure marketing performance at the product-market andline-item levels involves answering four essential questions:
www
www

Walker et al.: Marketing Strategy: A Decision−Focused Approach, Fourth Edition
IV. Implementation and Control
14. Measuring and Delivering Marketing Performance
371© The McGraw−Hill Companies, 2002
Section Four Implementation and Control340
• Who needs what information?
• When and how often is the information needed?
• In what media and in what format(s) or levels of aggregation should the information be provided?
• What contingencies should be planned for?
In essence, designing a marketing performance measurement system is like designing thedashboard of a car. Such a system needs to include the most critical metrics to assess
whether the car or the business is progressing toward its objectives.Thus, for a car, the dashboard includes a speed gauge and odometer tomeasure progress toward the destination, a fuel gauge, warning lights forengine and braking system malfunction, and so on, but it typically doesnot indicate how much windshield wiper fluid remains, how much
weight the car is carrying, or other relatively nonessential indicators. The same holds truefor a business: The “drivers” who are managing the business need to know certain essen-tial information while the “car”—or strategy—is running, while other less crucial indica-tors can be omitted or provided only when requested. We now address the four keyquestions, or design parameters, of marketing performance measurement systems.
Who Needs What Information?Marketing performance measurement systems are designed to ensure that the companyachieves the sales, profits, and other objectives set forth in its marketing and strategicplans. In the aggregate, these plans reflect the outcomes of the company’s or the SBU’splanning efforts, which have specified how resources are to be allocated across markets,products, and marketing-mix activities. These plans, as we noted in Chapter 13, includeline-item budgets and typically specify the actions expected of each organizational unit—whether inside or outside the marketing function or department—and deemed necessary toattain the company’s financial and competitive positioning objectives. The first and fore-most objective for marketing is the level of sales the company or the product-market entryachieves.
Who needs sales information? Top management needs it. Functional managers in otherparts of the organization—manufacturing, procurement, finance, and so on—need it. Mar-keting managers responsible for the various marketing-mix activities, from product designto pricing to channel management to selling and other promotional activities, need it.
Sales Analysis A sales analysis involves breaking down aggregate sales data into suchcategories as products, end-user customers, channel intermediaries, sales territories, andorder size. The objective of an analysis is to find areas of strength and weakness; for exam-ple, products producing the greatest and least volume, customers accounting for the bulkof the revenues, and salespersons and territories performing the best and the worst.
Sales analysis recognizes that aggregate sales and cost data often mask the real situa-tion. Sales analysis not only helps to evaluate and control marketing efforts, but also helpsmanagement to better formulate objectives and strategies and administer such nonmarket-ing activities as production planning, inventory management, and facilities planning.
An important decision in designing the firm’s sales analysis system concerns whichunits of analysis to use. Most companies assemble data in the following groupings:
• Geographical areas—regions, counties, and sales territories.
• Product, package size, and grade.
• Customer—by type and size.
Strategic Issue
In essence, designing a marketing perfor-mance measurement system is like design-ing the dashboard of a car.

Walker et al.: Marketing Strategy: A Decision−Focused Approach, Fourth Edition
IV. Implementation and Control
14. Measuring and Delivering Marketing Performance
372 © The McGraw−Hill Companies, 2002
Chapter Fourteen Measuring and Delivering Marketing Performance 341
• Channel intermediary—such as type and/or size of retailer.
• Method of sale—mail, phone, channel, Internet, or direct.
• Size of order—less than $10, $10–25, and so on.
These breakdowns are not mutually exclusive. Most firms perform sales analyses hier-archically; for example, by county within a sales territory within a sales region. Further,they usually combine product and account breakdowns with a geographical one: say, thepurchase of product X by large accounts located in sales territory Y, which is part of regionA. Only by conducting sales analysis on a hierarchical basis using a combination of break-downs can analysts be at all sure that they have made every reasonable attempt to locatethe opportunities and problems facing their firms.
Sales Analysis by Territory The first step in a sales territory analysis is to decidewhich geographical control unit to use. The county is the typical choice since it can becombined into larger units such as sales territories and it is also a geographical area forwhich many data items are available, such as population, employment, income, and retailsales. Analysts can compare actual sales (derived from company invoices) by countyagainst a standard such as a sales quota that takes into account such factors as marketpotential and last year’s sales adjusted for inflation. They can then single out territories thatfall below standard for special attention. Is competition unusually strong? Has less sellingeffort been expended here? Is the salesforce weak? Studies dealing with such questions asthese help a company improve its weak products and exploit its stronger ones. Categoryand brand development indices, such as those described in Chapter 6, are often used inassessing sales performance by territory.
Exhibit 14.9 illustrates a sales territory analysis. It shows that only one territory out ofseven shown exceeded its 1999 quota, or standard of performance, and by just $18,112.The other six territories accounted for a total of $394,685 under quota. Territory 3 aloneaccounted for 55 percent of the total loss. The sales and the size of the quota in this terri-tory suggest the need for further breakdowns, especially by accounts and products. Suchbreakdowns may reveal that the firm needs to allocate more selling resources to this terri-tory. The company needs to improve its sales primarily in territories 3 and 5. If it can reachits potential in these two territories, overall sales would increase by $301,911, assumingthat the quotas set are valid.
Exhibit 14.9Sales Analysis Based on Selected Sales Territories
(1) (2) (3) (4)Sales Company sales Sales quota Overage, Percent of
Territory Salesperson 1999 1999 underage potential performance
1 Barlow $552,630 $585,206 –$32,576 94%
2 Burrows 470,912 452,800 +18,112 104
3 White 763,215 981,441 –218,226 77
4 Finch 287,184 297,000 –9,816 96
5 Brown 380,747 464,432 –83,685 82
6 Roberts 494,120 531,311 –37,191 93
7 Macini 316,592 329,783 –13,191 96
Walker et al.: Marketing Strategy: A Decision−Focused Approach, Fourth Edition
IV. Implementation and Control
14. Measuring and Delivering Marketing Performance
373© The McGraw−Hill Companies, 2002
Section Four Implementation and Control342
Without a standard against which to compare results, the conclusions would be muchdifferent. Thus, if only company sales were considered (column 1), White would be thebest salesperson and Finch the worst. By using sales quotas as a performance standard,White was not the best but the worst salesperson, with a 77 percent rating.
Sales Analysis by Product Over time, a company’s product line tends to becomeovercrowded and less profitable unless management takes strong and continuous action toeliminate no-longer-profitable items. By eliminating weak products and concentratingon strong ones, a company can increase its profits substantially. Before deciding whichproducts to abandon, management must study such variables as market-share trends, con-tribution margins, scale effects, and the extent to which a product is complementary withother items in the line.14
A product sales analysis is particularly helpful when combined with account size andsales territory data. Using such an analysis, managers often can pinpoint substantial oppor-tunities and develop specific tactics to take advantage of them. For example, one firm’sanalysis revealed that sales of one of its highest-margin products were down in all theAsian sales territories. Further investigation showed that a regional producer was aggres-sively promoting a recently modified product with reduced prices. An analysis of the com-peting product revealed questionable reliability under certain operating conditions. Thesalesforce used this information to turn around the sales problem.
Sales Analysis by Order Size Sales analysis by order size may identify which dollar-size orders are not profitable. For example, if some customers frequently place smallorders that require salesforce attention and need to be processed, order picked, andshipped, a problem of some importance exists.
Analysis by order size locates products, sales territories, and customer types and sizeswhere small orders prevail. Such an analysis may lead to setting a minimum order size,charging extra for small orders, training sales reps to develop larger orders, and droppingsome accounts. An example of such an analysis involved a nationwide needlework prod-uct distributor, which found that 28 percent of all its orders were $10 and under. A studyrevealed that the average cost of servicing such orders was $12.82. The analysis alsoshowed that the company did not break even until the order size reached $20. Based onthese findings, the company installed a $35 minimum order, charged a special handling feeof $7.50 on all orders below $35, and alerted its field sales reps and telephone salespeopleto the problem. As a result, the company increased its profits substantially.
Sales Analysis by Customer Analysts use procedures similar to those described ear-lier to analyze sales by customers. Such analyses typically show that a relatively small per-centage of customers accounts for a large percentage of sales. For example, the needleworkproducts distributor cited above found that 13 percent of its accounts represented 67 per-cent of its total sales. Frequently, a study of sales calls shows that the salesforce spends adisproportionate amount of its time with the small accounts as compared with the largerones. Shifting some of this effort to the larger accounts may well increase sales.
Sales/Share Determinants Sales and market share are a function of a number of pri-mary determinants. For a consumer product these include effective distribution, relativeprice, attitude maintenance or change toward one or more salient product characteristics rel-ative to competition, and shelf-facings. These, in turn, are a function of secondary determi-nants such as number and frequency of sales calls, trade deals, and the effectiveness of theadvertising message with a given reach and frequency schedule. An analysis of the sharedeterminants should provide insights into presumed linkages between the firm’s inputs andoutputs: for example, number and frequency of sales calls and effective distribution. This,

Walker et al.: Marketing Strategy: A Decision−Focused Approach, Fourth Edition
IV. Implementation and Control
14. Measuring and Delivering Marketing Performance
374 © The McGraw−Hill Companies, 2002
Chapter Fourteen Measuring and Delivering Marketing Performance 343
in turn, leads to a better understanding of the firm’s marketing efficiency. Is the salesforcemaking as many calls per day as expected—and the right number of calls on target accountsto obtain a certain level of distribution?
Marketing research is usually required to ascertain the extent to which determinants arebeing attained. For example, consistently having a lower price on the same product rela-tive to major competitors is an important determinant of sales. As in the case of Wal-Mart,interviewers would need to shop the targeted stores to obtain the desired price data.
Line-Item Margin and Expense Analysis Sales data are not the only marketingperformance information needed, of course. Gross and net margins must be tracked, andthe effectiveness and efficiency of all line-item marketing expenses must be measured. Thedesigners of marketing performance measurement systems must develop appropriate met-rics to track the critical performance indicators for margins and expenses so that timelymid-course corrections can be made. Thus, the weeks-on-hand metric that tells a Gapsweater buyer how quickly each style is selling tells him or her whether to buy more of aparticular style if it is selling well, or mark it down if it is not moving. Making such deci-sions on a timely basis can have a profound effect on gross margins. A not-so-prettysweater may be more salable at 25 percent off before Christmas than at 60 percent offDecember 26.
Because budgets project revenues and expenses for a given time period, they are a vitalpart of the firm’s planning and control activities. They provide the basis for a continuousevaluation and comparison of what was planned with what actually happened. In thissense, budgeted revenues and profits serve as objectives against which to measure per-formance in sales, profits, and actual costs.
Budget analysis requires that managers continuously monitor marketing–expense ratiosto make certain the company does not overspend in its effort to reach its objectives. Man-agers also evaluate the magnitude and pattern of deviations from the target ratios. Man-agers of the various marketing units have their own control measures. For example,advertising managers track advertising costs per 1,000 target audience, buyers per mediavehicle, print ad readership, size and composition of TV audiences, and attitude change.Sales managers typically track number of calls per salesperson, costs per call, sales percall, and new accounts. The major marketing expenses are those associated with market-ing research, brand management, sales salaries, sales expenses, media advertising, con-sumer promotions, trade promotions, and publicity. Before taking corrective action on anyof these expenses that are out of line, managers may need to disaggregate the data to helpisolate the problem. For example, if total commissions as a percent of sales are out of line,analysts need to study them by each sales territory and product to determine exactly wherethe problem lies.
When and How Often Is the Information Needed? Timeliness is a key criterion for the development of a marketing performance measure-ment system. As we have seen, Wal-Mart’s systems provide sales information at the storeand item level on an up-to-the-minute basis. More commonly, though, managers attend toperformance information—whether for sales, margins, or expenses—on a periodic basis,since they don’t have time or the need to assess the performance of every item at everyminute of every day. Buyers and merchandise managers in retailing firms typically assessitem and category sales performance on a weekly basis. In fashion categories, such aswomen’s apparel, where timeliness is especially important, having sales information acouple of days, or even hours, ahead of competitors can make the difference between

Walker et al.: Marketing Strategy: A Decision−Focused Approach, Fourth Edition
IV. Implementation and Control
14. Measuring and Delivering Marketing Performance
375© The McGraw−Hill Companies, 2002
Section Four Implementation and Control344
obtaining more of a hot-selling item or being left in a faster-moving competitor’s dust.Store payroll expense, another key performance criterion for retailers that impacts bothcustomer service and profitability, is typically measured on a weekly basis, though storemanagers may be encouraged to send employees home if business is unexpectedly slow ona given day or call in extra help when more is needed. The performance of industrial sales-people—in terms of number of sales calls, sales volume, expense control, and other indi-cators—is typically done on a monthly basis, though some firms may do so more or lessfrequently as they see fit. Strategic control indicators, such as changes in market share,macro trends, and so on, are likely to be measured and reported less frequently becausethese kinds of longer-term issues may not be readily apparent or may give false alarms atmore frequent intervals.
In What Media and in What Format(s) or Levels of Aggregation Should the Information Be Provided? Advances in information technology have made possible the measurement and reportingof marketing performance information with previously unheard-of ease of access andtimeliness, without even printing the data! As we have seen, Wal-Mart’s sales information
is available on computer screens on an up-to-the-minute basis. In othercompanies, salespeople around the world now log on to company intra-nets to see the latest order status of a customer before they walk in thedoor on a sales call. But having good and timely information and report-ing it in such a manner that it is easy and quick to use are different
things. Imagine a Gap buyer having to manually add up the performance of various stylesto determine how the category is performing. Reports should provide such aggregation, ofcourse, but someone must decide what sort of aggregation is most useful for each infor-mation user.
Even the format or medium in which performance information is presented can make abig difference to the manager using the data. Weekly weeks-on-hand sales reports thatretail buyers and merchandise managers depend on are most usefully reported in order ofhow fast the styles are selling, rather than alphabetically or some other way. The styles atthe top of the report (those with little stock on hand, as measured by their weeks-on-handsales rate) are candidates for reorders. Styles at the bottom of the report (the ugly sweaterin mid-November with 25 weeks of inventory on hand) are candidates for markdowns. Theones in between may need little attention. Once a season ends, a different report, aggre-gating styles by vendor, perhaps, might be useful to determine which suppliers have per-formed well and which have performed poorly across the assortment of styles theyprovide. Thoughtful attention to the format in which marketing performance informationis reported, to the levels at which it is aggregated, for different kinds of decision purposes,and for different users, can provide a company with a significant competitive advantage.As we noted earlier in this chapter, it took Kmart many years to come close to Wal-Mart’ssystem of tracking and reporting store and item sales performance.
What Contingencies Should Be Planned for?Because all strategies and the action plans designed to implement them are based onassumptions about the future, they are subject to considerable risk. Too often, assumptionsare regarded as facts; and little attention is paid to what action or actions can be taken ifany or all of the assumptions turn out to be wrong.
Strategic Issue
Having good and timely information andreporting it in such a manner that it is easyand quick to use are different things.

Walker et al.: Marketing Strategy: A Decision−Focused Approach, Fourth Edition
IV. Implementation and Control
14. Measuring and Delivering Marketing Performance
376 © The McGraw−Hill Companies, 2002
Chapter Fourteen Measuring and Delivering Marketing Performance 345
Managers, therefore, often follow a contingency planning process that includes the ele-ments shown in Exhibit 14.10 identifying critical assumptions; assigning probabilities ofbeing right about the assumptions; ranking the importance of the assumption; tracking andmonitoring the action plan; setting the “triggers” that will activate the contingency plan;and specifying alternative response options. We discuss these steps briefly next.
Identifying Critical Assumptions Because there are simply too many assumptionsto track them all, contingency plans must cover only the more important ones. Assump-tions about events beyond the control of the individual firm but that strongly affect theentry’s strategic objectives are particularly important. For example, assumptions about therate of market growth coupled with the entry’s market share will strongly affect the entry’sprofitability objectives. The effect of a wrong assumption here can be either good or bad,and the contingency plan must be prepared to handle both. If the market grows at a ratefaster then expected, then the question of how to respond needs to be considered. Too oftencontingency plans focus only on the downside.
Another type of uncontrollable event that can strongly affect sales and profits is com-petitive actions. This is particularly true with a new entry (when a competitor respondswith its own new product), although it can apply with more mature products (competitor’sadvertising is increased). Assumptions about industry price levels must be examined indepth because any price deterioration can quickly erode margins and profits.
Assumptions about the effects of certain actions taken by the firm to attain its strategicobjectives also need to be considered in depth. Examples include the firm’s advertising
Specifying alternative response options
Identifying critical assumptionsabout the future
Assigning probability of eachcritical assumption’s being right
Rank ordering of criticalassumptions
Tracking/monitoring of action plan
Setting triggers to activatecontingency plan
Exhibit 14.10The Contingency Planning Process

Walker et al.: Marketing Strategy: A Decision−Focused Approach, Fourth Edition
IV. Implementation and Control
14. Measuring and Delivering Marketing Performance
377© The McGraw−Hill Companies, 2002
Section Four Implementation and Control346
objectives, which are based on assumptions about an improvement or maintenance of con-sumer attitudes toward the product’s characteristics compared with competing brands, orthe monies allocated to merchandising to improve the product’s availability. Further, oncethe targeted levels of the various primary objectives are reached, there are assumptionsabout what will happen to sales and share.
Assigning Probabilities This step consists of assigning to the critical assumptionsprobabilities of being right. These probabilities must be considered in terms of the conse-quences of being wrong. Thus, assumptions that have a low probability of being wrong butcould affect the firm strongly need to be considered in depth (for instance, gas shortagesor high prices or the demand for large luxury automobiles).
Rank Ordering the Critical Assumptions If assumptions are categorized on thebasis of their importance, the extent to which they are controllable, and the confidencemanagement has in them, then the basis for rank ordering the assumptions and drafting thecontingency plan has been set forth. Ordinarily, these criteria will have screened out thoseassumptions that need not be included—those with a low impact on objectives and thoseabout which there is a high confidence they will not occur. Assumptions that relate touncontrollable events should, however, be monitored if they strongly affect the entry’sstrategic objectives since the firm can react to them. For example, if the assumption aboutthe rate of market growth is wrong, then the firm can either slow or increase its investmentsin plant construction.
Tracking and Monitoring The next step is to specify what information (or measures)are needed to determine whether the implementation of the action plan is on schedule—and if not, why not. The contingency plan is, therefore, an early warning system as well asa diagnostic tool. If, for example, the firm has made certain assumptions about the rate ofmarket demand increase, then it would monitor industry sales on a regular basis. Ifassumptions were made about advertising and its effect on attitudes, then measures ofawareness, trial, and repeat buying would be likely to be used. Relevancy, accuracy, andcost of obtaining the needed measures must be examined in depth. Some of the informa-tion needed in the contingency plan might have been specified in the control plan, in whichcase it is already available.
Activating the Contingency Plan This involves setting the “triggers” to activatethe contingency plan. It requires a specification of both the level at which an alert will becalled and the combination of events that must occur before the firm reacts. If, for exam-ple, total industry sales were 10 percent less than expected for a single month, this wouldnot be likely to trigger a response, whereas a 25 percent drop would. Or a firm may decidethe triggering would occur only after three successive months in which a difference of 10percent occurred. Triggers must be defined precisely and responsibility assigned for put-ting the contingency plan into operation.
Specifying Response Options Actually, the term contingency plan is somewhatmisleading. It implies that the firm can know in advance exactly how it will respond if oneor more of its assumptions go awry. This implication is unrealistic because there are a great many ways for critical assumptions to turn out wrong. To compound the problem,the firm’s preplanned specific responses can be difficult to implement, depending on thesituation and how it develops. This can lead to a set of responses that build in intensity.Thus, most firms develop a set of optional responses that are not detailed to any greatextent in an effort to provide flexibility and ensure further study of the forces that causedthe alert.

Walker et al.: Marketing Strategy: A Decision−Focused Approach, Fourth Edition
IV. Implementation and Control
14. Measuring and Delivering Marketing Performance
378 © The McGraw−Hill Companies, 2002
Chapter Fourteen Measuring and Delivering Marketing Performance 347
Global Marketing ControlMaintaining control over global marketing activities is more difficult than with domesticmarketing, primarily because of the number of countries involved, each presenting aunique set of opportunities and threats. This makes it difficult to monitor simultaneously avariety of environments and to prescribe corrective action on an individual-country basiswhere appropriate. Differences in language and customs, accentuated by distance, furthercompound the control problem.
Keegan recommends that global companies use essentially the same control system for-mat for both their domestic and foreign operations.15 Report frequency and extent of detailwould vary by the subsidiary’s size and environmental uncertainties. The great advantageof using a single system is that it facilitates comparisons between operating units and com-munications between home office and local managers. On the surface, the use of electronicdata interchange should simplify performance evaluation across countries. While this istrue in terms of budget control, it leaves much to be desired in terms of understanding thereasons for any deviations.
The extent of control exercised over an overseas subsidiary is largely a function of its size,differences in the environment (including its stability), and the extent to which the companyemploys a standardized rather than a localized strategy.16 The larger a company’s internationaloperation, the greater the likelihood that staff personnel specializing in control activities willbe on-site, making the control system more elaborate and precise in its operation. Small over-seas operations tend to involve fewer specialists and a less-intensive control system.
Another factor affecting the control system is the extent to which environmental differ-ences exist. Ordinarily, the greater the differences between the home country and the for-eign subsidiary, the more decision-making authority is delegated. Large multinationalscompensate for these differences by clustering countries with similar environments intoregions that have sufficient revenues to permit the use of a headquarters staff. Whenconsiderable environmental instability is present, it is difficult to employ a formal controlsystem; the tendency is to delegate to local management the authority to make certainkinds of decisions without review and approval by the home office.
A third major factor affecting the international control system is the extent to which stan-dardized strategy is used. The more standardized the strategy, especially with respect to theproduct, the greater the degree of control exercised over many activities, including purchasingraw materials and determining components, manufacturing, and quality specifications. Ordi-narily, control over marketing activities is less stringent than with manufacturing. Other fac-tors also affect control: the success of the subsidiary (the greater the success, the less the homeoffice interference) and the physical distance separating the home office and the subsidiary(the greater the distance, the less frequently the subsidiary will be visited). Rapidly improvingvoice and data communication systems throughout the world have greatly improved the effec-tiveness of global managers, but many managers feel strongly that the personal touch is stillimportant not only for control purposes but also to improve customer satisfaction.
A Tool for Periodic Assessment
of Marketing Performance:
The Marketing Audit
While marketing performance measurement systems are essential for tracking day-to-day,week-to-week, and month-to-month performance to see that planned results are actuallydelivered, it is sometimes useful to step back and take a longer view of the marketing

Walker et al.: Marketing Strategy: A Decision−Focused Approach, Fourth Edition
IV. Implementation and Control
14. Measuring and Delivering Marketing Performance
379© The McGraw−Hill Companies, 2002
Section Four Implementation and Control348
performance of an SBU or of the entire company. Marketing audits aregrowing in popularity, especially for firms with a variety of SBUs thatdiffer in their market orientation. They are both a control and planningactivity that involves a comprehensive review of the firm’s or SBU’stotal marketing efforts cutting across all products and business units.Thus, they are broader in scope and cover longer time horizons thansales and profitability analyses.
Our concern here is at the individual SBU level or the entire com-pany, for smaller or single-business firms. Such an audit covers both the
SBU’s objectives and strategy and its plan of action for each product-market entry. It pro-vides an assessment of each SBU’s current overall competitive position as well as that ofits individual product-market entries. It requires an analysis of each of the marketing-mixelements and how well they are being implemented in support of each entry. The auditmust take into account the environmental changes that can affect the SBU’s strategy andproduct-market action programs.17
Types of AuditsAudits are normally conducted for such areas as the SBU’s marketing environment, objectivesand strategy, planning and control systems, organization, productivity, and individual market-ing activities such as sales and advertising. These areas are shown in Exhibit 14.11 with exam-ples of the kinds of data needed and serve as the basis for the discussion that follows.
• The marketing environment audit requires an analysis of the firm’s present and future envi-ronment with respect to its macro components, as discussed in Chapter 4. The intent is toidentify the more significant trends to see how they affect the firm’s customers, competitors,channel intermediaries, and suppliers.
• The objectives and strategy area audit calls for an assessment of how appropriate theseinternal factors are, given current major environmental trends and any changes in the firm’sresources.
• The unit’s planning and control system area audit evaluates the adequacy of the systemsthat develop the firm’s product-market entry action plans and the control and reappraisalprocess. The audit also evaluates the firm’s new product development procedures.
• The organization area audit deals with the firm’s overall structure (can it meet the chang-ing needs of the marketplace?); how the marketing department is organized (can it accom-modate the planning requirements of the firm’s assortment of brands?); and the extent ofsynergy between the various marketing units (are there good relations between sales and mer-chandising?).
• The marketing productivity area audit evaluates the profitability of the company’s indi-vidual products, markets (including sales territories), and key accounts. It also studies thecost-effectiveness of the various marketing activities.
• The marketing functions area audit examines, in depth, how adequate the firm handleseach of the marketing-mix elements. Questions relating to the product concern the attain-ability of the present product-line objective, the extent to which individual products fit theneeds of the target markets, and whether the product line should be expanded or contracted.Price questions have to do with price elasticity; experience effects, relative costs, and theactions of major competitors; and consumers’ perceptions of the relationship between a prod-uct’s price and its value. Distribution questions center on coverage, functions performed, andcost-effectiveness. Questions about advertising focus on advertising objectives and strate-gies, media schedules, and the procedures used to develop advertising objectives and strate-gies, media schedules, and the procedures used to develop advertising messages. The auditof the salesforce covers its objectives, role, size, coverage, organization, and duties plus the
Strategic Issue
While marketing performance measurementsystems are essential for tracking day-to-day, week-to-week, and month-to-monthperformance to see that planned results areactually delivered, it is sometimes useful tostep back and take a longer view of themarketing performance of an SBU or of theentire company.

Walker et al.: Marketing Strategy: A Decision−Focused Approach, Fourth Edition
IV. Implementation and Control
14. Measuring and Delivering Marketing Performance
380 © The McGraw−Hill Companies, 2002
Chapter Fourteen Measuring and Delivering Marketing Performance 349
quality of its selection, training, motivation, compensation, and control activities. In somecompanies marketing audits cover additional areas including the two that follow.
• The company’s ethical audit evaluates the extent to which the company engages in ethicaland socially responsible marketing. Clearly this audit goes well beyond monitoring to makesure the firm is well within the law in its market behavior. If the company has a written codeof ethics, then the main purpose of this audit is to make certain that it is disseminated, under-stood, and practiced.
• The product manager audit, especially in consumer goods companies, seeks to determinewhether product managers are channeling their efforts in the best ways possible. They arequeried on what they’re doing versus what they ought to be doing. They also are asked to ratethe extent to which various support units were helpful.18
Take Aways
Exhibit 14.11Major Areas Covered in Marketing Audit and Questions concerning Each for a Consumer Goods Company
Audit Area Examples of questions to be answered
Marketing environment What opportunities and/or threats derive from the firm’s present and future environment; that is,what macro trends are significant? How will these trends affect the firm’s target markets, com-petitors, and channel intermediaries? Which opportunities/threats emerge from within the firm?
Objectives and strategy How logical are the company’s objectives, given the more significant opportunities/threats and itsrelative resources? How valid is the firm’s strategy, given the anticipated environment, includingthe actions of competitors?
Planning and control system Does the firm have adequate and timely information about consumers’ satisfaction with its prod-ucts? With the actions of competitors? With the services of intermediaries?
Organization Does the organization structure fit the evolving needs of the marketplace? Can it handle the plan-ning needed at the individual product/brand level?
Marketing productivity How profitable is each of the firm’s products/brands? How effective is each of its major marketingactivities?
Marketing functions How well does the product line meet the line’s objectives? How well do the products/brands meetthe needs of the target markets? Does pricing reflect cross elasticities, experience effects, andrelative costs? Is the product readily available? What is the level of retail stockouts? What per-centage of large stores carries the firm’s in-store displays? Is the salesforce large enough? Is thefirm spending enough on advertising?
• Most managers and entrepreneurs are evaluated pri-marily on the results they deliver. Effective design ofcontrol systems, whether for strategic control or formarketing performance measurement, helps ensure thedelivery of planned results. A step-by-step process fordoing so is provided in this chapter.
• Control systems that deliver the right information—ina timely manner and in media, formats, and levels ofaggregation that users need and can easily use—canbe important elements for establishing competitiveadvantage. Four key questions that designers of suchsystems should address are discussed in this chapter.
• From time to time, it is useful to step back from day-to-day results and take a longer view of marketing per-formance for a company or an SBU. A marketingaudit, as outlined in this chapter, is a useful tool forconducting such an assessment.
• Self-diagnostic questions to test your ability to applythe analytical tools and concepts in this chapter tomarketing decision making may be found at thisbook’s website at www.mhhe.com/walker.

Walker et al.: Marketing Strategy: A Decision−Focused Approach, Fourth Edition
IV. Implementation and Control
14. Measuring and Delivering Marketing Performance
381© The McGraw−Hill Companies, 2002
Section Four Implementation and Control350
Endnotes
1. Based on “Briefly. . . ,” USA Today, April 10, 1991, p. 28; Sam Walton, SamWalton: Made in America (New York: Doubleday, 1992), pp. 85–86, 118,212–27; David Smith, “One Step Ahead,” Arkansas Gazette, September 30,1991, pp. 7–9; Bill Saporito, “What Sam Walton Taught America,” Fortune,May 4, 1992, p. 104; Wal-Mart’s 1996 Annual Report; Patricia Sellers, “CanWal-Mart Get Back the Magic?” Fortune, April 29, 1996, p. 130; D. R. Stew-art, “Wal-Mart Set to Open in China,” Arkansas Democrat-Gazette, August 8,1996, p. B1; and information from the company website at www.walmart-stores.com.
2. For a discussion of Kmart’s new centralized replenishment system, see“Remote Control,” The Economist, May 29, 1993, p. 90.
3. Sellers, “Can Wal-Mart Get Back the Magic?” p. 132.
4. Bill Saporito, “A Week aboard the Wal-Mart Express,” Fortune, August 24,1992, p. 77.
5. Calmetta Coleman, “Gap Inc. Stumbles as Respected CEO LoosensReins,” The Wall Street Journal, September 7, 2000, p. B4.
6. Frances V. McCrory and Peter G. Gerstberger, “The New Math of Per-formance Measurements,” Journal of Business Strategy, March–April 1992,pp. 33–38.
7. Robert Simons, “Control in an Age of Empowerment,” Harvard BusinessReview, March–April 1995, p. 81.
8. Jeremy Mann, “How to Steal the Best Ideas Around,” Fortune, October 19,1992, p. 102.
9. Terrence P. Paré, “A New Tool for Managing Costs,” Fortune, June 14,1993, p. 124.
10. Carl Quintanilla, “More Top Executives Are Hitting the Road,” The WallStreet Journal, January 12, 1996, p. B1.
11. Bernard J. Jaworski, “Toward a Theory of Marketing Control: Environ-mental Context, Control Types, and Consequences,” Journal of Marketing,July 1988, p. 24.
12. “The Promise of Reengineering,” Fortune, May 3, 1993, p. 94. This arti-cle is based on excerpts from Michael Hammer and James Champy, Reengi-neering the Corporation: A Manifesto for Business Revolution (New York:Harper Collins, 1993).
13. See the company’s website at www.reasonware.com.
14. Activity-based accounting is particularly helpful to managers in deter-mining product profitability since it allocates costs to products moreaccurately than traditional methods by breaking down overhead costs moreprecisely. See Paré, “A New Tool,” p. 125.
15. Warren J. Keegan, Global Marketing Management (Englewood Cliffs, NJ:Prentice Hall, 1989), chap. 4.
16. Ibid.
17. Eric N. Berkowitz, Roger A. Kerin, Steven W. Hartley, and WilliamRudelius, Marketing (Burr Ridge, IL: Richard D. Irwin, 1994), pp. 630–32.
18. John A. Quelch, Paul W. Farris, and James M. Oliver, “The Product Man-ager Audit,” Harvard Business Review, March–April 1987, p. 30. Based ontheir research, these authors conclude that product managers spend too muchtime on routine matters such as those relating to promotion execution and toolittle on product design and development.