Non-linear real exchange rate effects in the UK labour market
Upload
khangminh22Category
view
2download
0
Saimaa University of Applied Sciences Faculty of Business Administration, Lappeenranta Degree Programme in International Business
Kristina Ivanova Market Potential Analysis of Finland and the UK Business case – “Sidebar Business Proposition” Case company: Orion Automotive
Thesis 2015
2
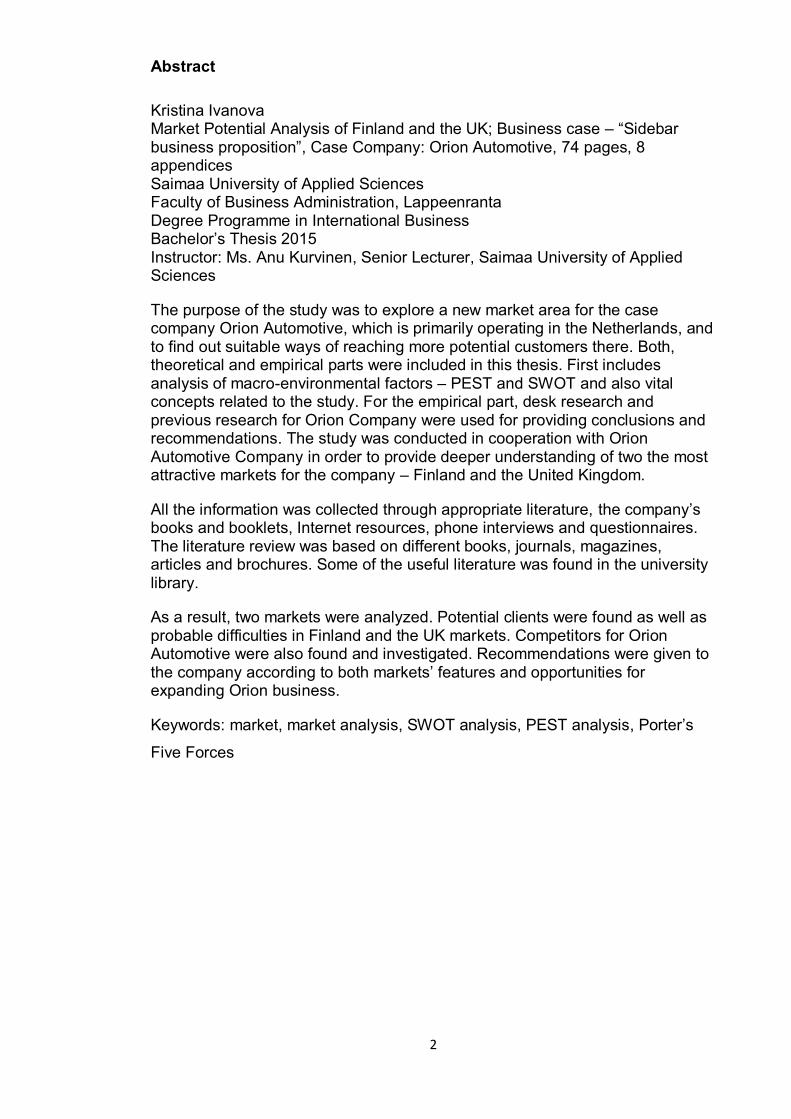
Abstract
Kristina Ivanova Market Potential Analysis of Finland and the UK; Business case – “Sidebar business proposition”, Case Company: Orion Automotive, 74 pages, 8 appendices Saimaa University of Applied Sciences Faculty of Business Administration, Lappeenranta Degree Programme in International Business Bachelor’s Thesis 2015 Instructor: Ms. Anu Kurvinen, Senior Lecturer, Saimaa University of Applied Sciences
The purpose of the study was to explore a new market area for the case company Orion Automotive, which is primarily operating in the Netherlands, and to find out suitable ways of reaching more potential customers there. Both, theoretical and empirical parts were included in this thesis. First includes analysis of macro-environmental factors – PEST and SWOT and also vital concepts related to the study. For the empirical part, desk research and previous research for Orion Company were used for providing conclusions and recommendations. The study was conducted in cooperation with Orion Automotive Company in order to provide deeper understanding of two the most attractive markets for the company – Finland and the United Kingdom.
All the information was collected through appropriate literature, the company’s books and booklets, Internet resources, phone interviews and questionnaires. The literature review was based on different books, journals, magazines, articles and brochures. Some of the useful literature was found in the university library.
As a result, two markets were analyzed. Potential clients were found as well as probable difficulties in Finland and the UK markets. Competitors for Orion Automotive were also found and investigated. Recommendations were given to the company according to both markets’ features and opportunities for expanding Orion business.
Keywords: market, market analysis, SWOT analysis, PEST analysis, Porter’s
Five Forces
3
Table of Contents
1. Introduction and Problem Definition ............................................................. 5 1.1 Previous Research ................................................................................. 6
1.1.1 Short Overview of the Dutch market ................................................ 7 1.1.2 Short Overview of the German market ............................................ 7
1.2 Research Methodology and Limitations ................................................. 8 1.2.1 Research Question .......................................................................... 8 1.2.2 Research Method and Data Analysis .............................................. 9 1.2.3 Questionnaire Design .................................................................... 11 1.2.4 Sampling Approach ....................................................................... 12 1.2.5 Method of Data Analysis ............................................................... 14 1.2.6 Limitations ..................................................................................... 14
2 Theoretical Background.............................................................................. 16 2.1 Market .................................................................................................. 16 2.2 Market Analysis.................................................................................... 17 2.3 Market Size .......................................................................................... 18 2.4 Market Growth Rate ............................................................................. 18 2.5 Market Profitability ............................................................................... 19 2.6 Distribution Channels ........................................................................... 20 2.7 Market Trends ...................................................................................... 20 2.8 PEST Analysis ..................................................................................... 20 2.9 SWOT Analysis .................................................................................... 21 2.10 Market Research.................................................................................. 22
3. Market Potential Research ......................................................................... 24 3.1 Market Research in Finland ................................................................. 24
3.1.1 General Overview of Finland ......................................................... 24 3.1.2 Market Growth Rate ...................................................................... 28 3.1.3 Market Profitability and Porter’s Five Forces Analysis ................... 29 3.1.4 SWOT Analysis ............................................................................. 30 3.1.5 PEST Analysis............................................................................... 32 3.1.6 Road Transport ............................................................................. 36 3.1.7 Industries in Finland where vans are a core part of the business .. 37 3.1.8 Alternative Damage Prevention Methods ...................................... 39 3.1.9 Competition ................................................................................... 40 3.1.10 Distribution of Potential Customers in Finland ............................... 41
3.2 Market Research in the United Kingdom ............................................. 42 3.2.1 General Overview of the UK .......................................................... 42 3.2.2 Market Growth Rate ...................................................................... 44 3.2.3 Market Profitability and Porter’s Five Forces Analysis ................... 44 3.2.4 Industries in the UK where vans are used ..................................... 46 3.2.5 Usage and Popularity of the sidebars in the UK ............................ 46 3.2.6 Competitors in the UK ................................................................... 47 3.2.7 Damage Prevention Methods in the UK ........................................ 48 3.2.8 Distribution of Potential Customers in the UK................................ 49
4. Summary and Discussion ........................................................................... 50 4.1 Discussion of Findings ......................................................................... 50
4.1.1 Finland .......................................................................................... 50 4.1.2 The United Kingdom ...................................................................... 53
4.2 Recommendations to Orion Automotive .............................................. 55 Figures .............................................................................................................. 59 Tables ............................................................................................................... 60 References........................................................................................................ 61
4
Appendices
Appendix 1. Vans in register by make 31.12.2013 (Top 50).
Appendix 2. Vans in register by municipality and vehicle group 1-03/2015 and 1-03/2014.
Appendix 3. Areas where more accidents are happened (by the Department for Transport 2012).
Appendix 4. Junction types that caused more accidents (by the Department for Transport 2012).
Appendix 5. Driving maneuvres that lead to accidents (by the Department for Transport 2012).
Appendix 6. Drivers in reported accidents by gender, number injured, road user type and age (by the Department for Transport 2012).
Appendix 7. Questionnaire for Finnish companies.
Appendix 8. Interview questions for UK companies.
5
1. Introduction and Problem Definition
Orion Automotive, a sidebar specialist, is a Dutch operating company in the field
of stainless steel sidebars for vans and SUV’s and various car accessories like
push bars, roll bars, step back, window protectors, roof racks, etc. to the
worldwide market. Orion’s products are mostly manufactured In-house, likewise,
it sources OEM quality products worldwide for the Automotive Industry.
With a changing economy resulting in an increasing level of competition and an
increasing amount of substitution goods, Orion’s company owner decided to
undertake action to reach more potential customers on the two markets via
collaborating with the student - Kristina Ivanova, educated in International
Business, faculty of Business Administration to analyze the sidebar market and
its market potential in two mostly attractive countries.
Acknowledgeable in the current state of business is the lack of knowledge on
certain European potential markets. Decided is to perform research focusing on
the Finnish and United Kingdom market. To find out more about the customers
and the markets Orion can operate in, a deep understanding is needed of these
markets and customers. In this way, the company can use their resources more
efficiently in the automotive field.
The central problem is stated as followed:
‘Lack of knowledge is noticeable on potential customer markets, as well on
perceptions and motivations of current clients to invest in sidebars.’
The aim of the thesis is to provide the market potential analysis and to find out
what kind of companies are the most appropriate potential customers Orion
should focus in the Finnish and UK market. Thereby, in order to gain
competitive advantage, being aware of the customer’s market, needs,
perceptions and motivations that drive Orion’s customers to use sidebar adds
value in having a better understanding of how to approach potential customers
by defining each country specific factors.
The research method in this business case is majorly based on desk research
and partially field research through performing investigations on the internet in
articles, statistics, figures, reports, questionnaires and telephone interviews.
The outcomes of the preliminary research helped extensively in setting out
6
examinations in a reliable and suitable way into this main intrinsic case study.
The outcomes of this principal research are important for the growth, stability
and continuity of company Orion Automotive.
The first chapter explains the research methodology, research question, data
analysis and limitations of the work. Also, the first chapter consists of how the
previous research about the Dutch and the German markets was done. Then,
the theoretical part is described in details. After that, the student presented how
the research was done about Finland and the United Kingdom and suggested
recommendations for the Orion Company about these two markets. The last
chapter describes the conclusions that lead to the final advice product for the
company. In the supplementary parts, a list of sources and bibliography used
during the research is provided.
1.1 Previous Research
In the previous research, the Dutch and German markets were analyzed
by Ivanova et al. (2014), in order to have a better understanding of Orion
Automotive market and customers’ attitude towards sidebars. The research
period began February 2014 and ended June 2014. The research consisted of
field research with companies across the Netherlands and desk research of the
German market.
On the introductory research stage, a face- to-face and phone interviews were
made with the 10 companies around the Netherlands, including the current
customers of Orion Company, potential customer, formal customer and
insurances.
The face-to-face interviews provided deep insight on the automotive industry
and usage of sidebars on the vans by different companies. Deep insight
information is gained about the advantages and disadvantages of sidebars, the
market, its customers and the product itself.
After analysing the data from the preliminary research, a well-structured
questionnaire was produced for the main research. The questionnaire was
written in three different languages (Dutch, English and German) for sending to
companies in two different markets: the Netherlands, Germany. The main aim
of the questionnaire was to gather important information about various
7
companies that use vans for their business: large, medium and small size, and
to find out what kind of fleet the companies have, what damage prevention tools
they use and how the companies protect their vans for longer use. In addition, it
was a vital point to ask the companies’ opinion about sidebars, its price,
usefulness and effectiveness on the vans. A lot of Dutch companies agreed that
sidebars protect vehicles from the small side and back damages, German
companies gave just the opinion that sidebars can be the good protection tool.
Also, a desk research was used to find important information about markets and
companies for interviews. Relevant facts and figures were found on the
websites of the related industries, associations, companies and government
departments, as well as online news, magazines and journal.
1.1.1 Short Overview of the Dutch market
For the Dutch market conducted by Ivanova et al. (2014), the research is
focused on companies that use vans as a core part of their business. Transport
and delivery companies would benefit the most from using sidebars as they are
in higher exposure to suffer small damages to the sides of the vehicle. Other
potential customers would be construction companies since the usage of vans
is a big part of their daily operations. These potential customers are located in
large and dense cities like Amsterdam, Rotterdam, ‘s-Gravehage,
Haarlemmermeer and Utrecht. It is suggested that Orion should promote their
products particularly in the months or prior to the months when more vans are
registered. It is observed that more vans are registered in January, March and
October. This cycle has repeated over the years. In order to convince the
potential customers, Orion should distinguish itself from other competitors in
terms of price, quality, shipping cost, mounting time, payment methods etc.
1.1.2 Short Overview of the German market
According to the market study made by Ivanova (2014), the German market is
not easy to reach due to the language barrier. It would be difficult to have a
smooth conversation with the German companies. Despite the limitations, the
list of potential customers in Germany can be suggested.
The industries that use vans as a core part of their business are mainly the
courier express service, delivery and logistic service and taxi companies. The
8
22 potential customers are mostly located in Berlin, Düsseldorf (Ruhr district)
and Frankfurt. The top 5 potential customers are recommended mainly based
on the number of vans that the company possesses. They are the Deutsche
Post DHL, TNT - The People Network, DPD - Dynamic Parcel Distribution,
Citius Express GMBH and City Funk Berlin.
There are no exact or clear competitors found from the online desk research,
but substitutes of sidebars do exist. In order to prevent accidents and damage
on vans, German people are more likely to rely on drivers training and drivers’
information system instead of sidebars.
1.2 Research Methodology and Limitations
This chapter covers the research question and methodology, questionnaire
design, sampling approach, method of data analysis and the limitations
occurred during the research. Basically, the purpose of this chapter is to set out
details of the research approach and to explain the framed path that leads to a
solution for the research problem.
1.2.1 Research Question
The aim of the study is to conduct the research on the Finnish and the UK
markets, to investigate the market potential there and try to find as many
potential clients as possible for the Orion Company. Finally, there should be an
advice to the company whether each market is reachable or not and whether
business could be expanded and prosper better.
To give a better understanding of the issues, the researcher will compare
Finnish and British markets with the Dutch and German markets to analyze
where the conditions for business are the most suitable, where it is ease to do
business and where it is the most profitable to operate for the Orion Automotive.
The general subject matter is to expand business in other European markets,
especially Finland and the United Kingdom, so the researcher will have to
investigate several research questions:
What kind of market potential does the sidebar market have in two
attractive countries?
9
What is the target market for the Orion Automotive company?
1.2.2 Research Method and Data Analysis
Online market research is the process by which the Internet is used to gather
data to evaluate how well a product or service is selling to consumers. The
information provided by a careful market analysis conducted online can also
identify popular trends that can assist a company in creating a strategy that will
get better results. When used properly, online market research can be an
effective tool that a company can use to experience higher revenues.
In addition, to identify potential areas for growth, online market research can
help a company to learn more about its target consumers. The information
gathered from doing an online market research study is helpful to track this type
of behavior.
The preliminary phase includes qualitative research and quantitative research.
First, qualitative research is used in the form of phone interviews with the UK
companies in order to get more information and insight about the industry.
Secondly, quantitative research is used in the form of emails.
Moreover, the preliminary phase will provide insights on the business case with
the view to find out what kind of research, interview participants and research
questions need to be implemented in this study. In addition, it will bring forth
insights in such a way that knowledge on the market, client and product will be
received.
Online market research is the process by which the Internet is used to gather
data to evaluate how well a product or service is selling to consumers. The
information provided by a careful market analysis conducted online can also
identify popular trends that can assist a company in creating a strategy that will
get better results. When used properly, online market research can be an
effective tool that a company can use to experience higher revenues.
In this intrinsic case study for Orion, secondary data is used to perform desk
research. Online market research is implemented in order to receive insights on
the potential sidebar market in Finland and the United Kingdom. Secondary
data is in fact information that has been previously gathered for some purposes

10
other than the current research project. The data is available free and can be
easily delivered electronically by computer. Gathering such information from
primary research would be very expensive and time consuming.
The secondary data searched on the internet is carefully analyzed and
organized by highlighting articles and statistics. Later on, this data is
implemented and revised into the report. To each part of information a source is
added. Finally, for each potential market conclusions and recommendations are
provided based on the desk research performed.
11
1.2.3 Questionnaire Design
The (categorized) questionnaire consists of three phases:
1. The introduction phase
-Introduction of the researcher and the topic which is needed to be discussed
-Topics and objectives of the questionnaire
-Name of the person who filled in the questionnaire and name of the company
2. The discussion phase
-Questions related to the company exactly, its size, company type, number of
vans, etc.
-Topic questions about sidebars and damage prevention, 10 questions.
3. Evaluation phase
-Summarizing the information
-Asking the most important questions for Orion Company
12
1.2.4 Sampling Approach
The steps of the sampling process will be examined below:
Step 1: Define the population of interest
The population of interest is the total group of people that the researcher wishes
to interview during the preliminary research. The population of interest can be
divided into three groups: potential customers, formal customers and
insurances. In addition, car repair shops can be interviewed as well if it is
possible.
Step 2: Determine whether to sample or census
Looking at the timescale, it is impossible to have a lot of interviews during the
research. A sample method will be used in order to get information for every
interview category.
Step 3: Select the sampling frame
The sampling frame of the interviewed company will be small. There are a lot of
potential customers, formal customers and insurances in both markets.
Therefore at minimum one company in each category should be interviewed in
order to gain a deeper insight into the market, customers and the product itself.
Step 4: Choose a sampling method
The non-probability sampling method is chosen. This method can be executed
more quickly and easily than the probability method. The most important targets
can be interviewed in order to fulfil the preliminary research. Out of the four
different non-probability methods, judgments sampling is chosen. The
researcher consciously selects companies for a sample that considers the most
appropriate for the preliminary research.
Step 5: Determine sample size
There is not a lot of time during the preliminary research, therefore precision
against time and cost consideration in the data collection process should be
determined. First, qualitative research and quantitative research will be done

13
during the preliminary research. Furthermore more quantitative and desk
research will be done for the final report.
Step 6: Implement the sampling procedure
When the sampling procedure and the sample size are selected, the selection
of the interviews and the interviews can be performed. In cooperation with
Orion, interviewees will be chosen. After the interviews a short feedback
session with the interviewee will be done in order to improve the interviewer’s
skills.
14
1.2.5 Method of Data Analysis
LeCompte and Schensul (1999) define analysis as the process a researcher
uses to reduce data to a story and its interpretation. Data analysis is the
process of reducing large amounts of collected data to make sense of them.
They describe data analysis as including inscription, description, and
transcription.
During qualitative research organization data and interpretation of data are
really important aspects. In this case, telephone calls to companies need to be
recorded if possible and answers from questionnaire on Finnish language
should be translated into English as the whole thesis is done in English
language.
Organization
The transcripts should be in order by date and category. It will be easier for the
researcher to read through the written transcripts in order to get a good
understanding of the gathered information.
The researcher will create summaries of phone interviews and questionnaire
results and make the list of the most important facts that could be beneficial for
Orion Company.
Interpretation
The identification of what is gained during the questionnaire is a really important
aspect. The researcher should determine what messages the respondents are
trying to communicate during the questionnaire. This is really important in order
to determine the research findings, research objectives and the final results.
1.2.6 Limitations
For some research questions there will be no available source of data, for
instance in the previous research about German market, it was difficult to find
data for the potential market in the English language. In this case, it can also be
a language barrier or no information related sidebars and vans’ industry.
Next is the ‘suitable data’ problem. It can occur that there will be a very
interesting data found, but it is not related to the project’s case.

15
In addition, the problem can occur when there is no control over the accuracy of
the secondary data. In this case it is different statistics or data from several
countries that is collected in various ways, using different methods.
Lastly, comparability is often a problem when integrating and examining data
from different sources. This is particularly in this case where information is
being collected from a number of different countries. Difference occurs in
reliability of the information, frequency of the studies, measurement units, and
difference in circumstances.
16
2 Theoretical Background
The theoretical background of this thesis covers the main aspects related to the
market: market definition in general, market analysis, market research as well
as PEST and SWOT analyses which help to identify the situation in the country
from different corners and to find out the strong and weak sides of a company
which would like to enter a new market.
2.1 Market
In the book Principles of Marketing by Kotler P. & Armstrong G. (2010), the
concepts of exchange and relationships lead to the concept of a market. Market
is the set of all actual and potential buyers of a product or service. These buyers
share a particular need or want that can be satisfied through exchange
relationships.
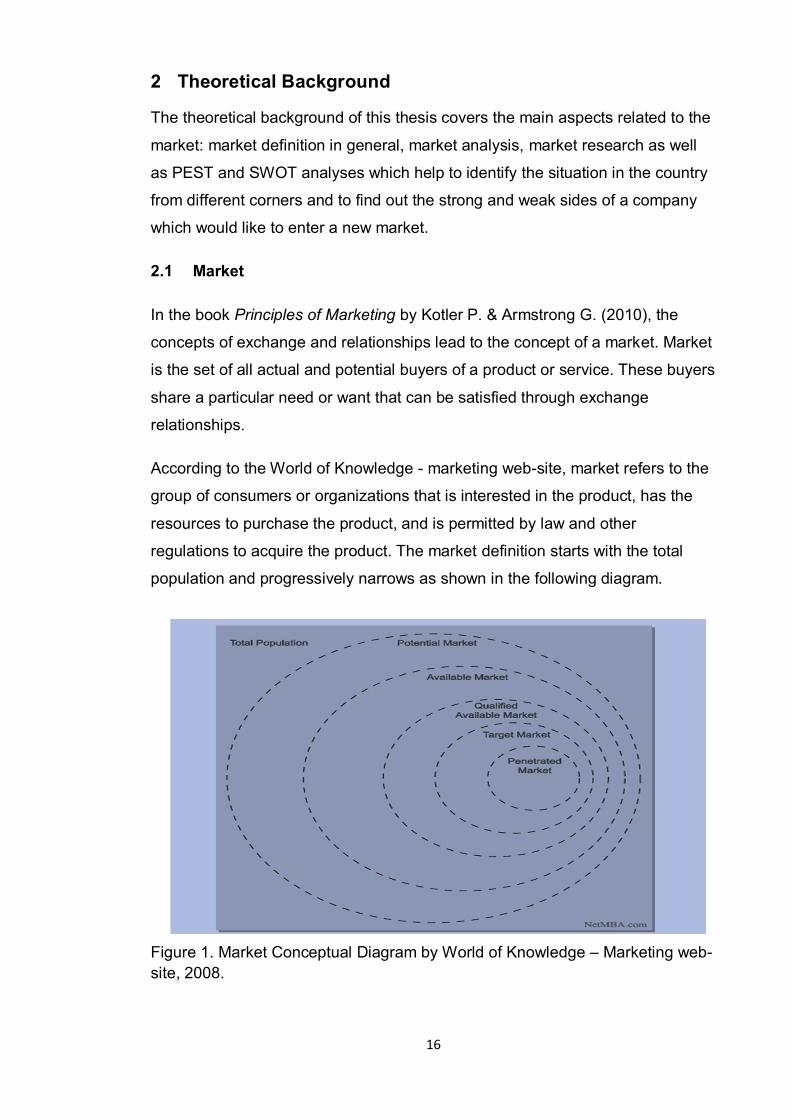
According to the World of Knowledge - marketing web-site, market refers to the
group of consumers or organizations that is interested in the product, has the
resources to purchase the product, and is permitted by law and other
regulations to acquire the product. The market definition starts with the total
population and progressively narrows as shown in the following diagram.
Figure 1. Market Conceptual Diagram by World of Knowledge – Marketing web-site, 2008.
17
There is total population and other forms that are used to describe the market
based on the level of narrowing:
Total population
Potential market – those in the total population who have interest in
acquiring the product.
Available market – those in the total population who have enough money
to buy the product.
Qualified available market – those in the available markets who legally
are permitted to buy the product.
Target market – the segment of the qualified market that the company
has decided to serve.
Penetrated market – those in the target market who have purchased the
product.
2.2 Market Analysis
Market analysis includes studies about the development and the dynamics of a
certain market within a speсial industry, in this case automotive industry of
Finland and the UK will be analyzed. Moreover, market analysis consists of
macro-environmental factors such as SWOT and PEST analysis. With the help
of these two analyses, the company can define the strong and weak sides of a
Finnish market and choose the most appropriate strategy to enter it.
Market analysis is the understanding of how the market works and what
customers’ want is vital. Market analysis can help to identify where to focus the
efforts and how to maintain a competitive edge.
David A. Aaker outlined the following dimensions of a market analysis:
Market size (current and future)
Market growth rate
Market profitability
18
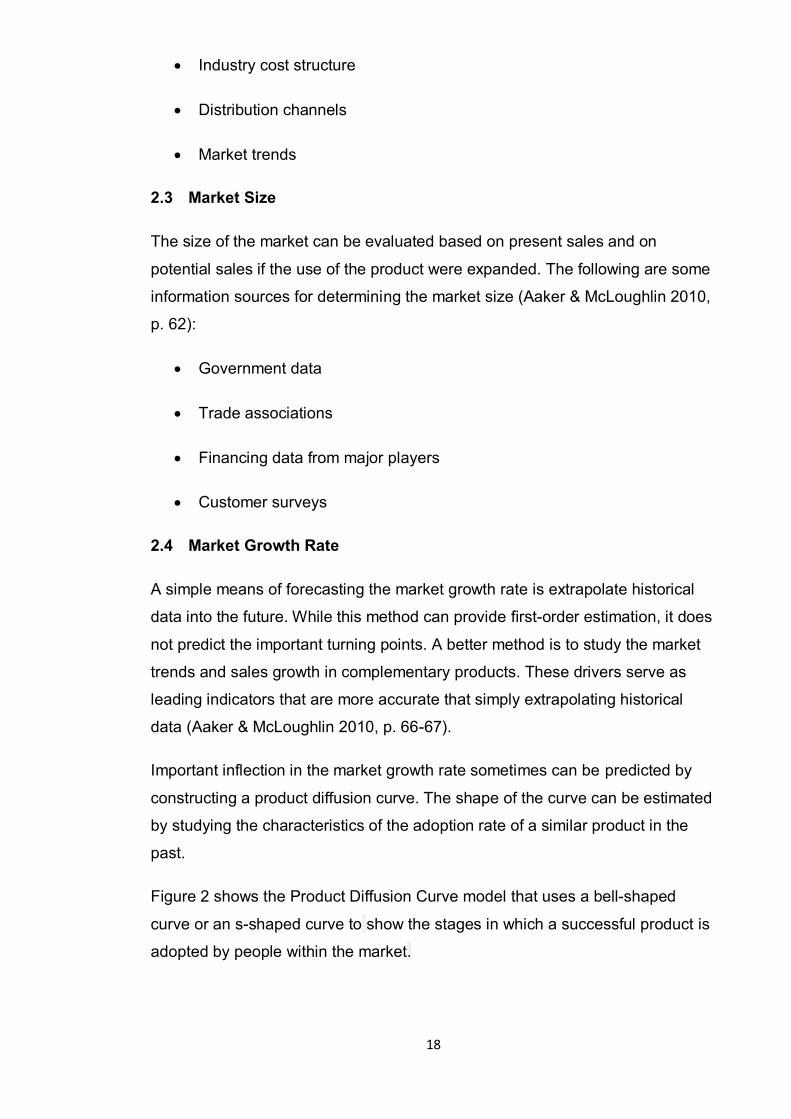
Industry cost structure
Distribution channels
Market trends
2.3 Market Size
The size of the market can be evaluated based on present sales and on
potential sales if the use of the product were expanded. The following are some
information sources for determining the market size (Aaker & McLoughlin 2010,
p. 62):
Government data
Trade associations
Financing data from major players
Customer surveys
2.4 Market Growth Rate
A simple means of forecasting the market growth rate is extrapolate historical
data into the future. While this method can provide first-order estimation, it does
not predict the important turning points. A better method is to study the market
trends and sales growth in complementary products. These drivers serve as
leading indicators that are more accurate that simply extrapolating historical
data (Aaker & McLoughlin 2010, p. 66-67).
Important inflection in the market growth rate sometimes can be predicted by
constructing a product diffusion curve. The shape of the curve can be estimated
by studying the characteristics of the adoption rate of a similar product in the
past.
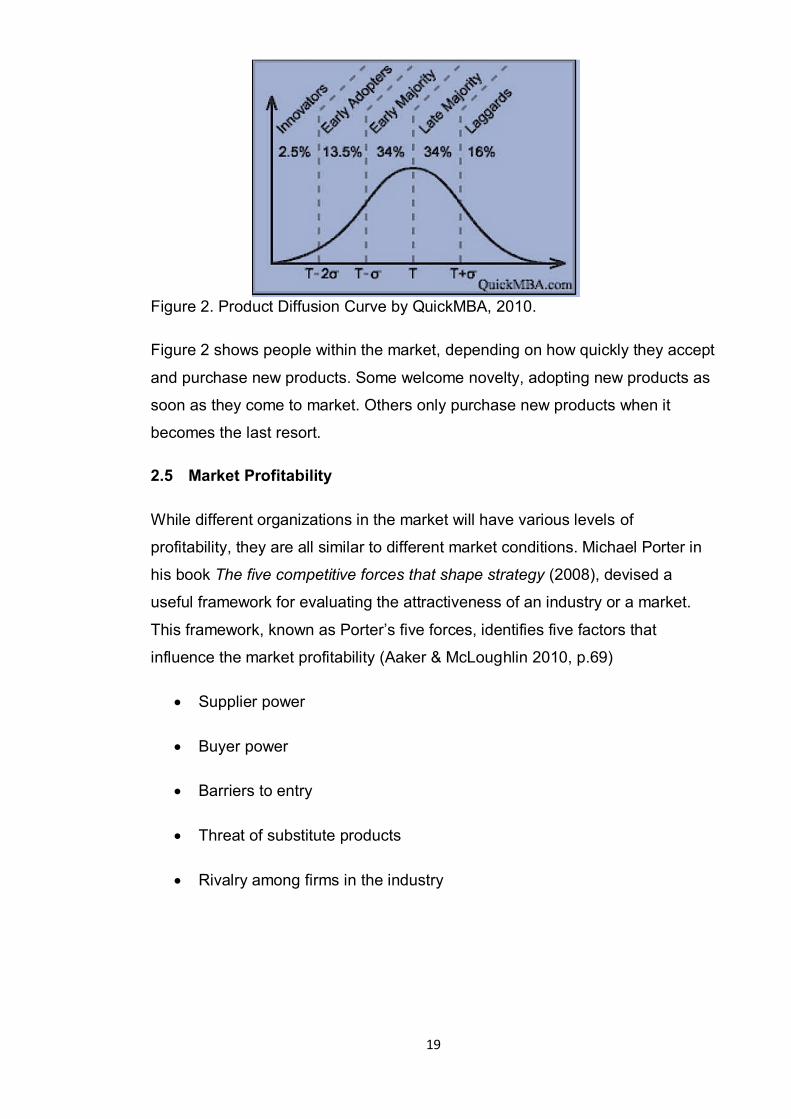
Figure 2 shows the Product Diffusion Curve model that uses a bell-shaped
curve or an s-shaped curve to show the stages in which a successful product is
adopted by people within the market.
19
Figure 2. Product Diffusion Curve by QuickMBA, 2010.
Figure 2 shows people within the market, depending on how quickly they accept
and purchase new products. Some welcome novelty, adopting new products as
soon as they come to market. Others only purchase new products when it
becomes the last resort.
2.5 Market Profitability
While different organizations in the market will have various levels of
profitability, they are all similar to different market conditions. Michael Porter in
his book The five competitive forces that shape strategy (2008), devised a
useful framework for evaluating the attractiveness of an industry or a market.
This framework, known as Porter’s five forces, identifies five factors that
influence the market profitability (Aaker & McLoughlin 2010, p.69)
Supplier power
Buyer power
Barriers to entry
Threat of substitute products
Rivalry among firms in the industry
20
2.6 Distribution Channels
A channel of distribution or trade channel is defined as the path or route along
which goods move from producers or manufacturers to ultimate consumers or
industrial users.
According to Aaker and McLoughlin (2010, p.71), the following aspects of the
distribution system are useful in a market analysis:
Existing distribution channels - could be described by how direct they are
to the customer.
Trends and the emerging channels - new channels can offer the
opportunity to develop a competitive advantage on the market.
Channel power structure – applies when a product having little brand
equity, retailers have negotiating power over manufacturers and can
capture more margin.
2.7 Market Trends
Changes in the market are important because they often are the source of new
opportunities and threats. The relevant trends are industry-dependent, but some
examples include changes in price sensitivity, demand for variety, and level of
emphasis on service and support. Regional trends may also be relevant (Aaker
& McLoughlin 2010, p. 71).
2.8 PEST Analysis
PEST analysis is an analysis of the external macro-environment that affects
companies. It is a simple but very important and widely-used tool which helps to
understand the big picture of the Political, Economic, Socio-cultural and
Technical environment.
Many macro-environmental factors are country-specific and PEST analysis has
to be performed in order to have better understanding of a certain country
situation (NetMBA Internet Center).
Political Analysis includes analyzing vastly the following factors: political
stability, risk of military invasion, legal framework for contract enforcement,
21
trade regulations and tariffs, anti-trust laws, pricing regulations and industrial
safety regulations.
Economic Analysis consists of the type of economic system in the country,
government intervention in the free market, comparative advantages of host
country, exchange rates and stability of a host country currency, efficiency of
financial markets, economic growth rate, inflation rate and interest rate.
Social Analysis contains such important factors like demographics, culture,
class structure, education, entrepreneurial spirit, attitudes (health,
environmental consciousness, etc.) and leisure interests.
Technological Analysis covers the following aspects: recent technological
developments, technology’s impact on product offering, impact on cost
structure, impact on value chain structure and rate of technological diffusion.
In fact, it is vital for companies to take into consideration the most appropriate
factors that can affect the industry to operate in.
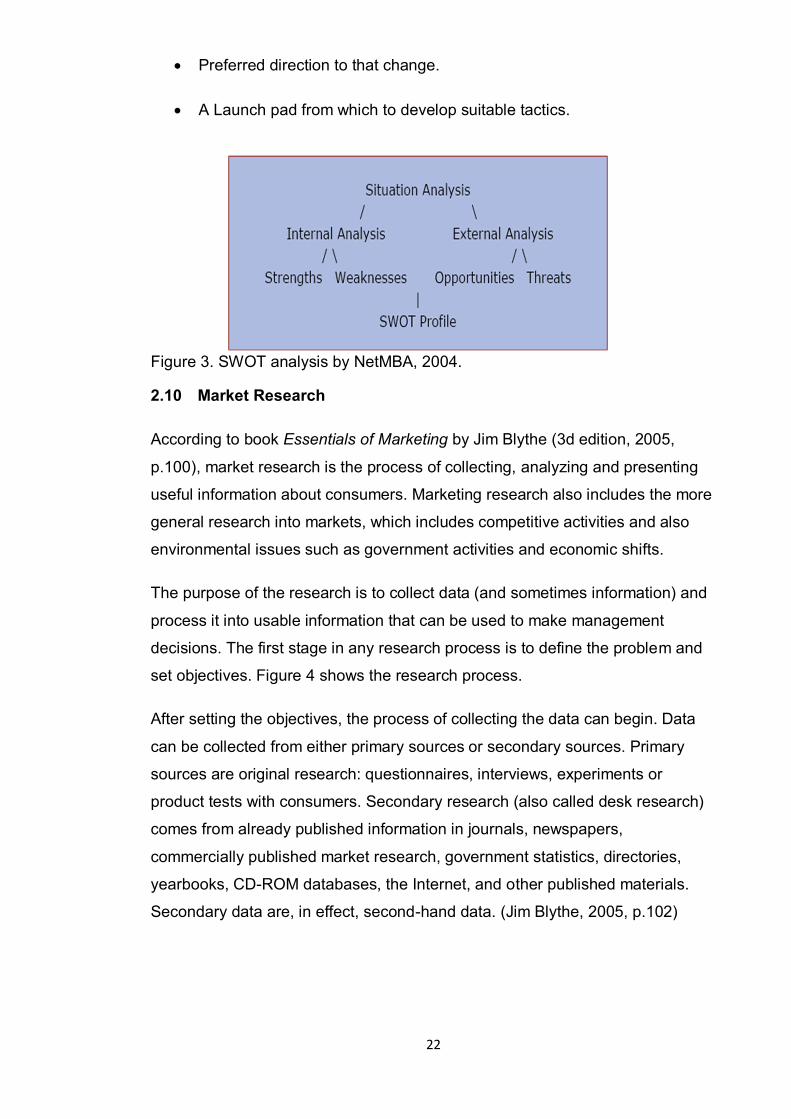
2.9 SWOT Analysis
SWOT analysis, an acronym of Strengths, Weaknesses, Opportunities and
Threats, is a simple framework for generating alternatives from a situation
analysis. The analysis takes account of internal resources and capabilities
(strengths and weaknesses) and external factors (opportunities and threats). It
is a general technique that can be applied to diverse activities and it is
particularly appropriate during the early stages of planning a specific task or
project (Internet Center NetMBA).
SWOT analysis can provide:
A framework for identifying and analyzing multiple factors.
A platform for assessing core capabilities and competences.
22
Preferred direction to that change.
A Launch pad from which to develop suitable tactics.
Figure 3. SWOT analysis by NetMBA, 2004.
2.10 Market Research
According to book Essentials of Marketing by Jim Blythe (3d edition, 2005,
p.100), market research is the process of collecting, analyzing and presenting
useful information about consumers. Marketing research also includes the more
general research into markets, which includes competitive activities and also
environmental issues such as government activities and economic shifts.
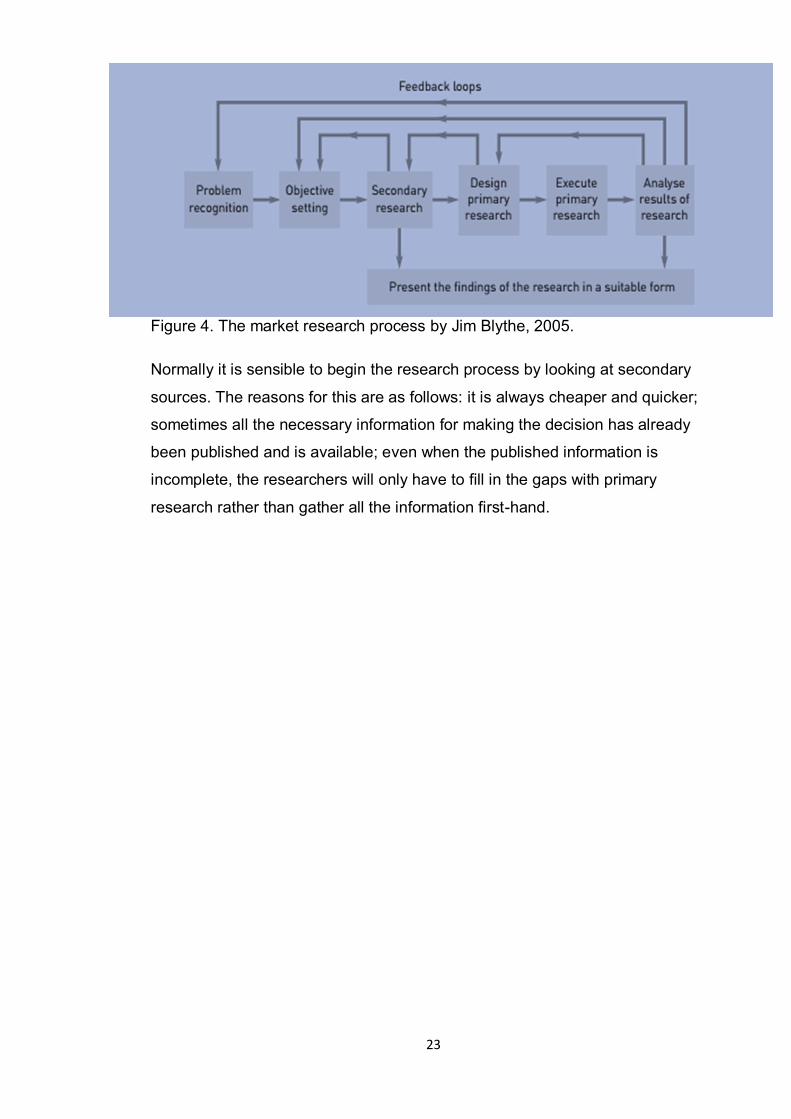
The purpose of the research is to collect data (and sometimes information) and
process it into usable information that can be used to make management
decisions. The first stage in any research process is to define the problem and
set objectives. Figure 4 shows the research process.
After setting the objectives, the process of collecting the data can begin. Data
can be collected from either primary sources or secondary sources. Primary
sources are original research: questionnaires, interviews, experiments or
product tests with consumers. Secondary research (also called desk research)
comes from already published information in journals, newspapers,
commercially published market research, government statistics, directories,
yearbooks, CD-ROM databases, the Internet, and other published materials.
Secondary data are, in effect, second-hand data. (Jim Blythe, 2005, p.102)
23
Figure 4. The market research process by Jim Blythe, 2005.
Normally it is sensible to begin the research process by looking at secondary
sources. The reasons for this are as follows: it is always cheaper and quicker;
sometimes all the necessary information for making the decision has already
been published and is available; even when the published information is
incomplete, the researchers will only have to fill in the gaps with primary
research rather than gather all the information first-hand.
24
3. Market Potential Research
3.1 Market Research in Finland
3.1.1 General Overview of Finland
The Finnish road network is approximately 454,000 kilometers long in total. It
includes around 350,000 kilometers of private and forest roads and 26,000
kilometers of municipal streets. In total, the Finnish Transport Agency is
responsible for approximately 78,000 kilometers of highway.
Highways and main roads comprise more than 13,000 kilometers, 700
kilometers of which are motorways. Most of the total road length of 64,900
kilometers consists of local and connecting roads. However, these represent
just over a third of all traffic. Half of the roads are low-volume roads.
Approximately 65 per cent of roads, or some 50,000 kilometers, are paved.
With respect to the low-volume road network, approximately 41,000 kilometers
of road are in the lowest maintenance category. This totals more than half of the
total road network. It is impossible to maintain all roads in such condition that,
during the most challenging weather conditions, no problems will occur
anywhere in the road network.
In Finland, there are 20 per cent of dirt roads or forest roads where it could be
gravel, grit or crushed stones. So, it means that it is possible to get small
damages on both sides of the vehicle or at the back of it often by the more
rebounds from stones or gravel.
According to statistics, there are about 3 million cars in Finland which are used
annually around the whole country. Motorization rate is very high in Finland - 14
out of 183. Currently in this small country there are about 5 million vehicles,
while the entire population of the country at the same time is 5.4 million people.
Vehicles are “hot products” in Finland. In August 2012, Finland took the third
place in the European Union in terms of growth in car sales. Finnish people
mostly prefer German and Japanese cars and also all-wheel drive cars because
the weather conditions have become harsher in the country in recent years.
25
At the end of 2014, the Finnish vehicle register contained 6,014,610 vehicles, of
which 5,043,523 were in traffic use. The total number of registered vehicles
grew by 2.6 per cent and the number of vehicles in traffic use went up by 1.0
per cent compared with the situation at the end of 2013. There are
approximately 3,1 million passenger cars registered in the country, and only 2.6
million of them are exploited which means that about 1.9 million cars have the
status of freight or specialized cars like ambulances, police cars and special
buses.
To have a better understanding of the Finnish potential market and the possible
opportunities different aspects will be taken into account such as number of
registered vans, new van make registration or road network.
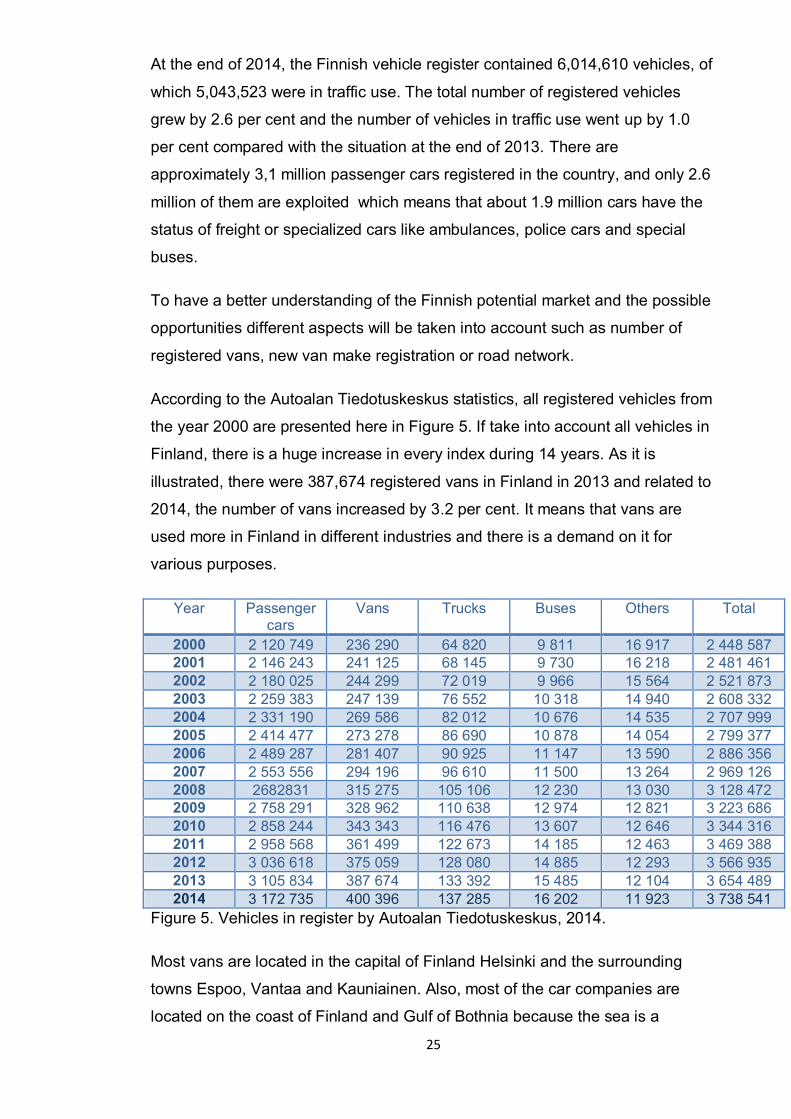
According to the Autoalan Tiedotuskeskus statistics, all registered vehicles from
the year 2000 are presented here in Figure 5. If take into account all vehicles in
Finland, there is a huge increase in every index during 14 years. As it is
illustrated, there were 387,674 registered vans in Finland in 2013 and related to
2014, the number of vans increased by 3.2 per cent. It means that vans are
used more in Finland in different industries and there is a demand on it for
various purposes.
Year Passenger cars
Vans Trucks Buses Others Total
2000 2 120 749 236 290 64 820 9 811 16 917 2 448 587 2001 2 146 243 241 125 68 145 9 730 16 218 2 481 461 2002 2 180 025 244 299 72 019 9 966 15 564 2 521 873 2003 2 259 383 247 139 76 552 10 318 14 940 2 608 332 2004 2 331 190 269 586 82 012 10 676 14 535 2 707 999 2005 2 414 477 273 278 86 690 10 878 14 054 2 799 377 2006 2 489 287 281 407 90 925 11 147 13 590 2 886 356 2007 2 553 556 294 196 96 610 11 500 13 264 2 969 126 2008 2682831 315 275 105 106 12 230 13 030 3 128 472 2009 2 758 291 328 962 110 638 12 974 12 821 3 223 686 2010 2 858 244 343 343 116 476 13 607 12 646 3 344 316 2011 2 958 568 361 499 122 673 14 185 12 463 3 469 388 2012 3 036 618 375 059 128 080 14 885 12 293 3 566 935 2013 3 105 834 387 674 133 392 15 485 12 104 3 654 489 2014 3 172 735 400 396 137 285 16 202 11 923 3 738 541
Figure 5. Vehicles in register by Autoalan Tiedotuskeskus, 2014.
Most vans are located in the capital of Finland Helsinki and the surrounding
towns Espoo, Vantaa and Kauniainen. Also, most of the car companies are
located on the coast of Finland and Gulf of Bothnia because the sea is a
26
continuation of the assembly line for the Finnish industry. There is a port in
Kotka, so there are a lot of small and medium companies that use vans for
deliveries of goods to different Finnish cities.
In fact, the damages that sidebars prevent are the damages related to parking
and maneuvering and this usually occurs in urban areas, within cities, where
traffic is intense. The kinds of companies that operate in this context are
transport companies for both people and goods, such as taxi companies and
courier companies. These transport and delivery companies would benefit the
most of the use of sidebars since these are in constant exposure to suffer small
damages to the sides of the vehicle.
There is the latest statistics on the top fifty van makes registered in Finland in
2013, excluding Aland (Appendix 1). There are five the most popular van makes
inside the country: the 1st place goes to Toyota (92,301), the 2nd place is
occupied by Volkswagen (73,041), the 3rd place is taken by Ford (47,040), the
4th place goes to Mercedes- Benz (31,899) and Nissan make took the 5th place
in Finland (24,716). In comparison to 2012, there is a slight increase in demand
of these five the most popular vans makes. Mercedes-Benz and Volkswagen
vans are bought more than other three van makes in 2013.
Therefore Orion should have more of these models in their inventory to avoid
delays. Moreover, Orion can use this table to see the number of other van
makes in top of 50 and understand what people prefer more and what other
kinds of vehicles increased or decreased in demand.
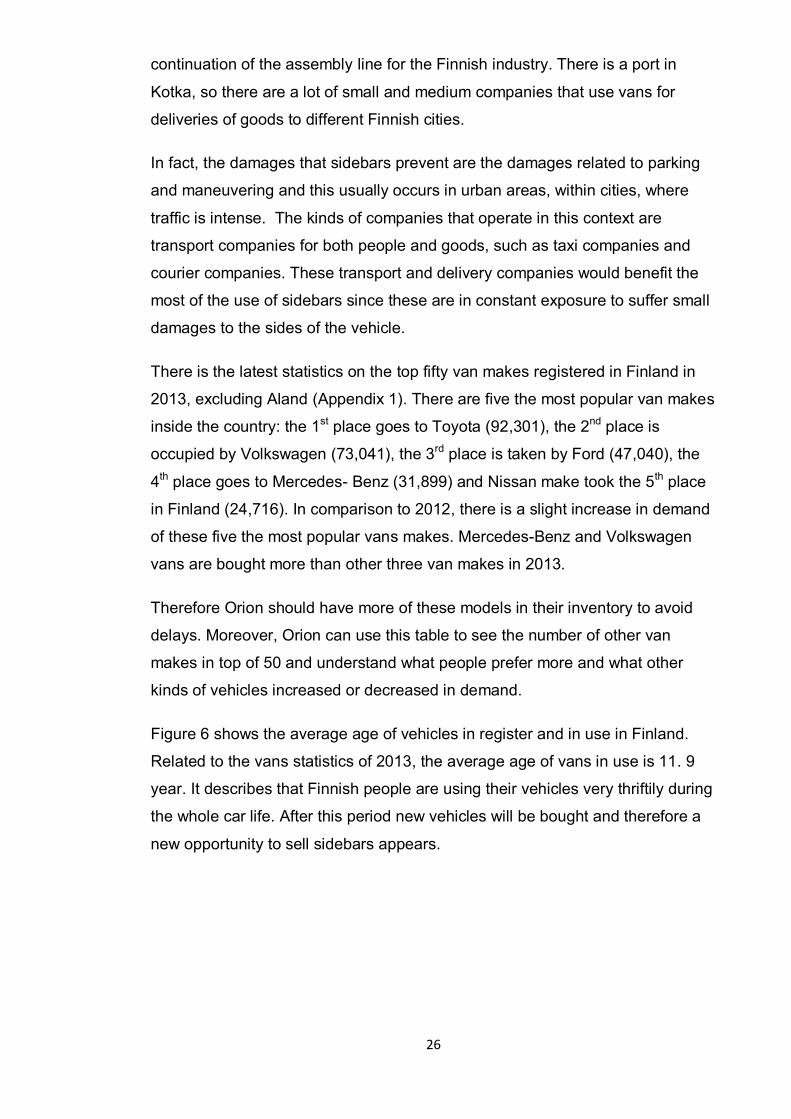
Figure 6 shows the average age of vehicles in register and in use in Finland.
Related to the vans statistics of 2013, the average age of vans in use is 11. 9
year. It describes that Finnish people are using their vehicles very thriftily during
the whole car life. After this period new vehicles will be bought and therefore a
new opportunity to sell sidebars appears.
27
In register In use Passenger cars 13,1 11,2 Vans 14,3 11,9 Trucks 13,8 12,1 Buses 14 11,6 Figure 6. Average age of vehicle in use 31.12.2013 by Statistics Finland, 2013.
Sidebars are damage prevention accessories and thus are usually installed by
the purchase of a new van in order to avoid damages or the new investment.
Therefore it is interesting to know when Orion should approach companies in
order to convince them to install sidebars on the new vans.
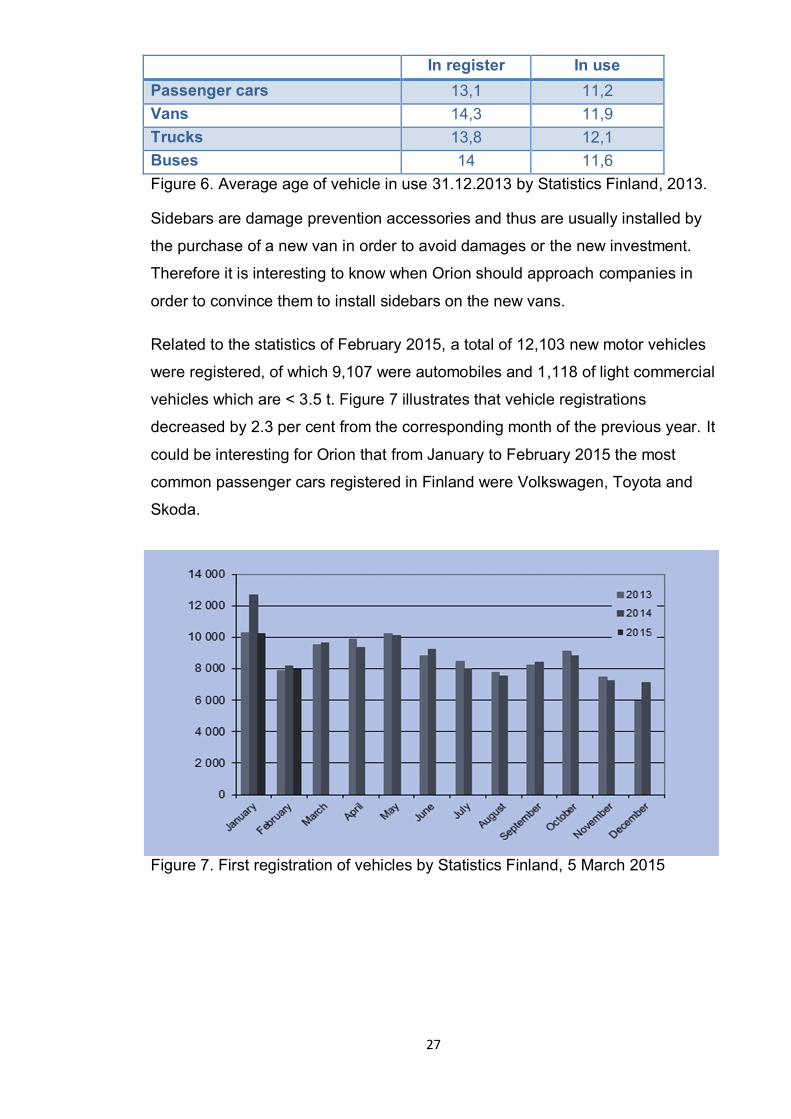
Related to the statistics of February 2015, a total of 12,103 new motor vehicles
were registered, of which 9,107 were automobiles and 1,118 of light commercial
vehicles which are < 3.5 t. Figure 7 illustrates that vehicle registrations
decreased by 2.3 per cent from the corresponding month of the previous year. It
could be interesting for Orion that from January to February 2015 the most
common passenger cars registered in Finland were Volkswagen, Toyota and
Skoda.
Figure 7. First registration of vehicles by Statistics Finland, 5 March 2015
28
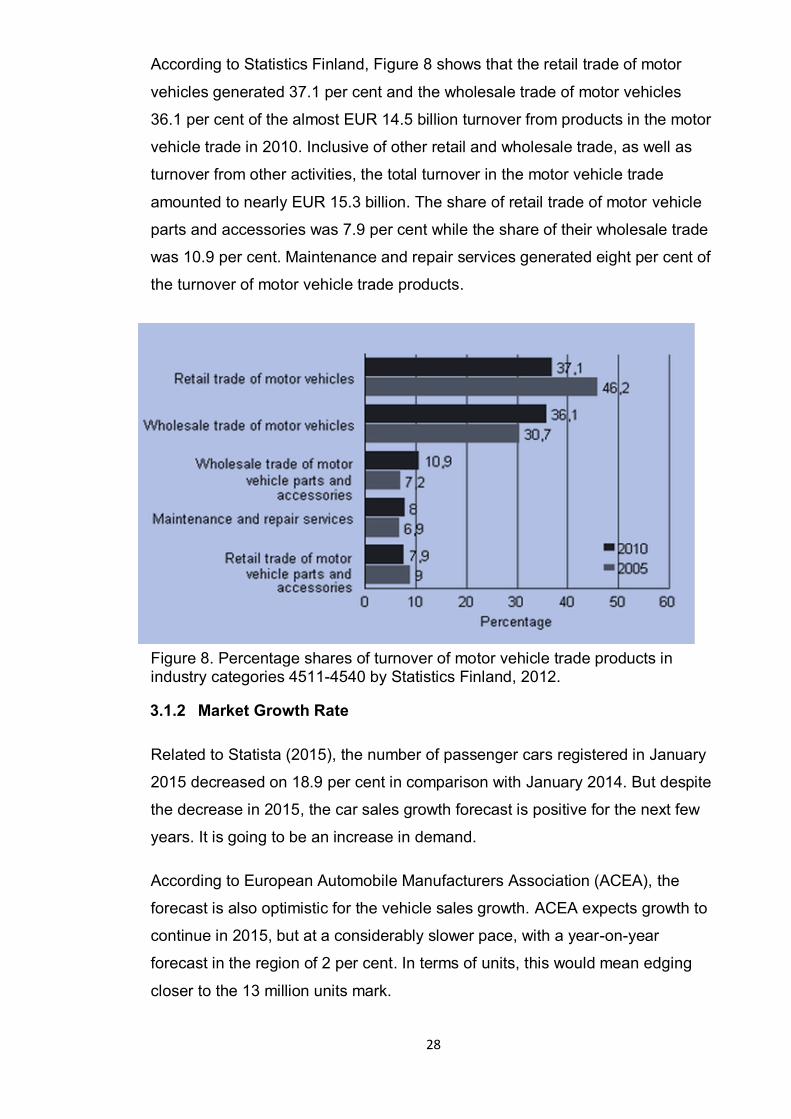
According to Statistics Finland, Figure 8 shows that the retail trade of motor
vehicles generated 37.1 per cent and the wholesale trade of motor vehicles
36.1 per cent of the almost EUR 14.5 billion turnover from products in the motor
vehicle trade in 2010. Inclusive of other retail and wholesale trade, as well as
turnover from other activities, the total turnover in the motor vehicle trade
amounted to nearly EUR 15.3 billion. The share of retail trade of motor vehicle
parts and accessories was 7.9 per cent while the share of their wholesale trade
was 10.9 per cent. Maintenance and repair services generated eight per cent of
the turnover of motor vehicle trade products.
Figure 8. Percentage shares of turnover of motor vehicle trade products in industry categories 4511-4540 by Statistics Finland, 2012.
3.1.2 Market Growth Rate
Related to Statista (2015), the number of passenger cars registered in January
2015 decreased on 18.9 per cent in comparison with January 2014. But despite
the decrease in 2015, the car sales growth forecast is positive for the next few
years. It is going to be an increase in demand.
According to European Automobile Manufacturers Association (ACEA), the
forecast is also optimistic for the vehicle sales growth. ACEA expects growth to
continue in 2015, but at a considerably slower pace, with a year-on-year
forecast in the region of 2 per cent. In terms of units, this would mean edging
closer to the 13 million units mark.
29
3.1.3 Market Profitability and Porter’s Five Forces Analysis
Finnish Automotive Industry is well developed nowadays and still continuing
growing. Global passenger demand is on the rise both in mature and emerging
markets, where the population is becoming increasingly affluent and mobile.
Despite the growing number of bicycles, motorcycles, coaches, trains, planes,
the automobile is still the most popular form of passenger travel. Thanks to the
car’s popularity, the automotive industry has made a strong comeback from the
2008 financial crisis (by Statista 2015). Porter’s Five Forces Analysis can help a
new company that would like to enter a new market, to understand the industry
struсture and to make an effective decision.
Supplier power
In Finnish Automotive Industry there are a lot of suppliers, unlimited number of
volume of deliveries and some of them do not have stated relations with clients
and it puts those companies in a difficult situation. So, it would be wise to admit
that suppliers have a moderate bargaining power over consumers
Buyer power
In the Finnish market, it is not easy for customers to drive the prices down
because they purchase the products in small amounts or rarely in big amounts,
so it means that the buyer power is low. Also, as it was mentioned earlier,
customers buy good quality sidebars from the other companies in Finland that
have the USA sidebars. Furthermore, Finnish people are sensitive to the price;
it can affect the business of the company. It is possible to state that in Finland
customers do have a strong bargaining power over the companies.
Competitive Rivalry
Related to competitors, there are not so many of them in Finland but they all
suggest good quality car accessories and sidebars which can be an obstacle for
Orion to enter the market. But, with high quality of stainless steel materials and
the TUV certification Orion Company can have a little power on the Finnish
market among other competitors. If these two factors are not enough to
compete with other companies, Orion should think about the investments to be
more unique in the Finnish market.
30
Threat of Substitution
It was already mentioned in the thesis that there are other preventative tools for
the vehicles that could be substitution products and are quite often used by
Finnish customers: backup cameras and sensors. Nowadays, these helpful
tools can be installed on the factory to a new vehicle or be installed in car repair
shops. Of course, there are a lot of car repair shops in Finland that provide this
kind of service. So, as sidebars are another damage prevention tool, it can be
installed directly to the vehicle like protection or it can be an additional tool for
protection with sensors or backup cameras. In any case, sidebars are useful
damage prevention tools.
Threat of New Entry
As Finland is a member of the European Union, potential companies from other
EU countries can also try to enter the Finnish market and make some difficulties
for Orion Automotive. Product requirements are equal for all the members of the
EU, so it can be a high attraction for new players.
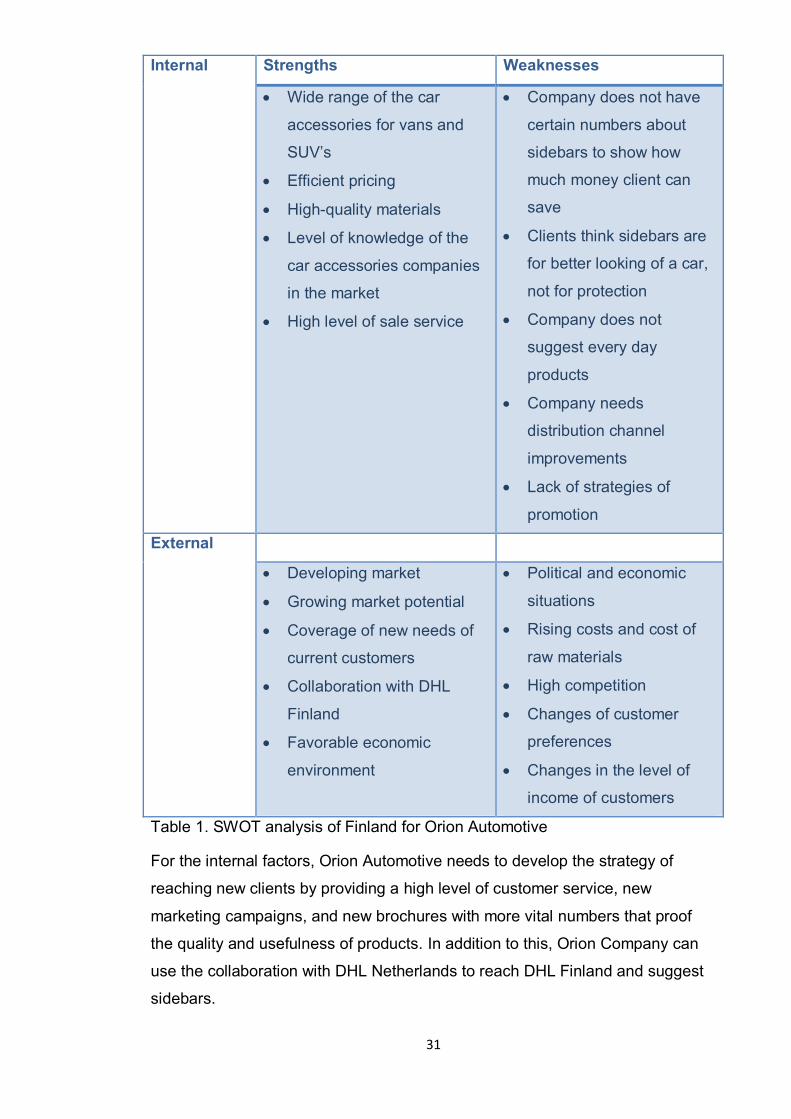
3.1.4 SWOT Analysis
By providing a SWOT analysis for Orion Automotive, it can be easier to highlight
the positive factors that can help the company to develop itself on the market
and the negative factors such as obstacles and difficulties that can occur during
the entering to a new market.
31
Internal Strengths Weaknesses
Wide range of the car
accessories for vans and
SUV’s
Efficient pricing
High-quality materials
Level of knowledge of the
car accessories companies
in the market
High level of sale service
Company does not have
certain numbers about
sidebars to show how
much money client can
save
Clients think sidebars are
for better looking of a car,
not for protection
Company does not
suggest every day
products
Company needs
distribution channel
improvements
Lack of strategies of
promotion
External Opportunities Threats
Developing market
Growing market potential
Coverage of new needs of
current customers
Collaboration with DHL
Finland
Favorable economic
environment
Political and economic
situations
Rising costs and cost of
raw materials
High competition
Changes of customer
preferences
Changes in the level of
income of customers
Table 1. SWOT analysis of Finland for Orion Automotive
For the internal factors, Orion Automotive needs to develop the strategy of
reaching new clients by providing a high level of customer service, new
marketing campaigns, and new brochures with more vital numbers that proof
the quality and usefulness of products. In addition to this, Orion Company can
use the collaboration with DHL Netherlands to reach DHL Finland and suggest
sidebars.

32
In Finland, people always take into account every important detail of a product,
especially the price, quality of material and the necessity of a product. So, Orion
Company should think carefully about these points and brand awareness to
reach new customers.
3.1.5 PEST Analysis
In this PEST analysis the macro-environmental factor of Finland will be covered.
It is needed for better understanding the whole picture of the country by
explaining the environment where Orion would like to expand its business.
Political factors
Finland is a parliamentary democracy with a multi-party political system. The
President is the head of state, while the Prime Minister is the head of
government. The powers of the Executive, Legislative and Judicial Branches
are set out in the Constitution adopted in 1919.
Member of EU
Finnish EU membership seems to have fulfilled most of its promises and most
of the fears have not materialized. There is a very broad consensus among
Finnish economists and policymakers that the stability of the economy is now
much better than it used to be in the past, and that the policy trade-offs are
much more favorable now. It is, of course, difficult to say, what exactly is due to
the EU membership and what is due to other favorable trends and factors. The
past eleven years have been good times for Finland. The economic
development has been strong and also relatively stable despite of the large
swings in the global economy. In this sense EMU has improved the resilience of
the Finnish economy. Finland’s EU experience is widely seen as a highly
positive process.
33
Regulation and Restriction on the International Trade
Membership of Finland in the World Trade Organization is a deterrent to any
radical changes, so global changes are not expected in few years. Related to
the Finnish Automotive industry, there will be no major changes.
Economic factors
Inflation Rate
According to the Statistics of Finland, the average of the inflation rate has been
5.04 percent from 1961 until 2015. The highest indicator of 19.31 percent was
reached in January 1975 and the lowest record was 1.54 per cent in October
2009. The inflation rate in Finland was recorded at 0.10 percent in March of
2015.
Gross National Product in Finland increased to 46,649 EUR Million in the fourth
quarter of 2014 from 46,056 EUR Million in the third quarter of 2014. In 1990 -
2014, the average of Gross National Product in Finland has been 33,193,65
EUR Million. The highest record was 46,649 EUR Million in the fourth quarter of
2014 and the lowest record was 22,765 EUR Million in the first quarter of 1993.
Related to Finnish Tax Administration, the Corporate Tax Rate in Finland
stands at 20 per cent. Corporate Tax Rate in Finland averaged 26.65 percent
from 1995 until 2014, reaching an all-time high of 29 per cent in 2000 and a
record low of 20 per cent in 2014.
Evidently, the lowest point of the fall of the economy has already passed, and
starting from 2015, it will increase the pace of recovery and growth of economic
indicators. It is possible to predict the steady growth in demand for services
over the next 3-5 years. That is why, entry into the market at the moment and
the gradual expansion of its presence is beneficial.
Currency
The Euro has appeared in Finland since 1999. Finland, as a member of the EU
and WTO promotes free movement and investment of the capital. One of the
main directions of the Finnish government's economic policy is to provide the
right conditions to maintain investment and entrepreneurial activity in the
34
country. One of the main directions of the Finnish government's economic policy
is to provide the right conditions to maintain investment and entrepreneurial
activity in the country. Since the beginning of the 1990s, Finland abolished
exchange controls, which allows companies and entrepreneurs to export the
capital from the country for investment activities abroad freely.
Import of Goods
By Statistics of Finland, Finnish principal imports are food stuffs, petroleum and
petroleum products, chemicals, transport equipment, iron and steel, machinery,
textile yarn and fabrics and grains. Its main import partners are Germany,
Russia, Sweden, the Netherlands and China. Imports in Finland increased to
4,355 EUR Million in February 2015 from 4,190 EUR Million in January 2015.
Imports in Finland averaged 2,337 EUR Million from 1975 until 2015, reaching
an all-time high of 5,877,90 EUR Million in March of 2011 and a record low of
311,30 EUR Million in April 1976.
According to preliminary data, Finland's foreign trade turnover of goods and
services was 81.8 per cent compared to the GDP of the state, reaching 158,2
billion in 2013. In 2013, the economy of Finland functioned complicated by the
macroeconomic environment, which has a negative impact on the dynamics of
foreign trade and is reducing economic growth. Nowadays, Finnish economy is
going to focus on its development to establish own production and reduce the
number of exported products.
Socio-cultural factors
Environmentally-friendly Products
In Finland, the development of "clean technologies" is considered as one of the
most strategic, forward-looking and popular areas of innovation. Finland is a
leader in the field of eco-innovation and shows a higher rate of growth in the
sector of “clean technologies” in comparison with the world.

35
In the development of the economy the forest sector plays an important role and
will play in future, taking into account the fact that at the moment it accounts for
more than half of the projects related to the bio economy. Furthermore, the
development of this sector will promote the formation of new forms of cross-
border cooperation. In addition to the forest sector, a chemical industry,
construction, energy, the production of food and the service sector will play the
vital role.
Technological factors
Finland enters the first group of countries to develop technological innovations.
The primary scientific research areas in Finland are the forest industry, the
metal industry and the information and communication technology (ICT)
industry. Other areas of research expertise include: Biotechnology, food and
agriculture, nanotechnology, Nano science and materials and new production
technologies.
In addition, the general fields of health research, the environment and business
feature highly on the list defined by the Science and Technology Policy Council
of Finland. The Finnish science system is divided into nine clusters, each with
their own specific focus areas:
1)The information and communications cluster; 2)The metal cluster; 3)The
forest cluster; 4)The well-being cluster; 5)The chemical and bio cluster; 6)The
environmental cluster; 7)The energy cluster; 8)The real estate and construction
cluster; 9)The food cluster.
The Finnish innovation and research system framework consists of four
operational levels:
Level 1 consists of the Finnish government, supported by the Research
and Innovation Council. This advisory body is responsible for the
strategic development and co-ordination of Finnish science and
technology policy, and the national innovation system as a whole.
Level 2 consists of the ministries.
Level 3 includes the R&D funding agencies. These include the Academy
of Finland and Tekes, the Finnish Funding Agency for Technology and
36
Innovation. At this level, research priorities are set, funding decisions
(excluding the allocation between ministries) are made and co-operation
is facilitated.
At Level 4 there are the organizations that conduct research: universities,
public research institutes, private research organizations and business
enterprises.
3.1.6 Road Transport
It is also interesting for Orion Company to know the situation on the crossing
board of Finland. International border crossing points on the land border
between Finland and Russia are located in Imatra, Kuusamo, Niirala, Nuijamaa,
Rajajooseppi, Salla, Vaalimaa, Vainikkala and Vartius.
The border crossings between Finland and Sweden are located in Aavasaksa,
Muonio, Ropinsalmi, Karesuvanto, Pello, Saarikoski, Kolari, Pätikkä and Tornio.
The border crossings between Finland and Norway are concentrated in
Karigasniemi, Nuorgam, Kilpisjärvi, Näätämö and Utsjoki.
In addition to this, Finland has a lot of ports inside the country such as: Eckerö,
Hamina, Helsinki, Kaskinen, Oulu, Porvoo, Lappeenranta, Turku, and many
others. This factor shows that there is a high turnover of goods for import and
export in Finland. Mostly, trucks or vans are used to carry goods from ports to
the final destination and also to cross the border. So, vans are very popular
means of delivery transport of various goods in Finland.
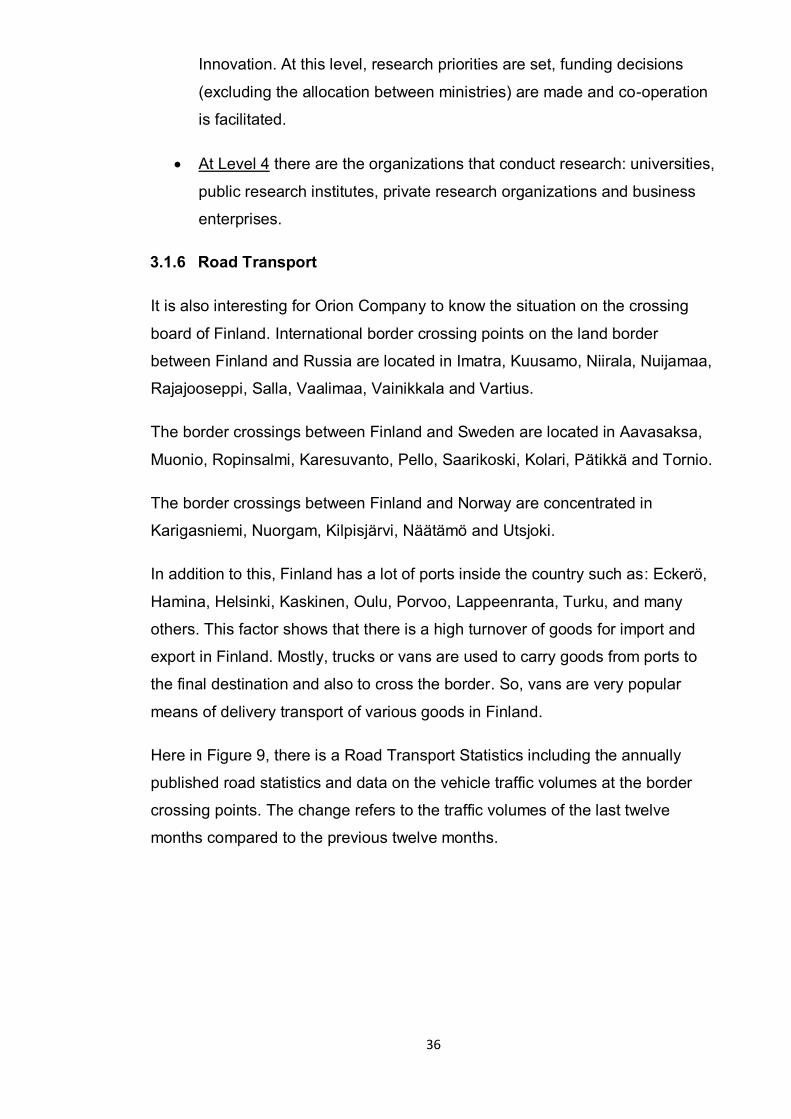
Here in Figure 9, there is a Road Transport Statistics including the annually
published road statistics and data on the vehicle traffic volumes at the border
crossing points. The change refers to the traffic volumes of the last twelve
months compared to the previous twelve months.
37
Figure 9. 12 month change on main roads in the whole country (%) by the Road
Transport Statistics, 2015.
3.1.7 Industries in Finland where vans are a core part of the business
Closed or delivery vans are well suited to transport small objects. They can be
used flexibly, such as for periodic distribution of materials and goods.
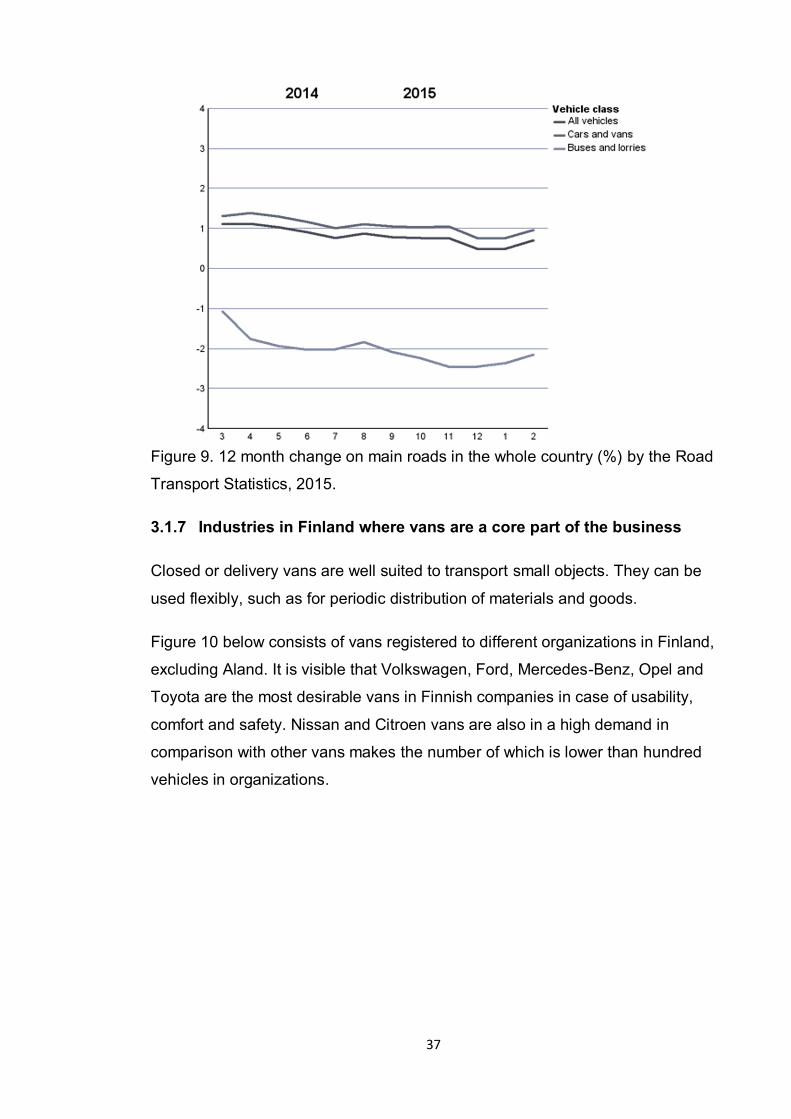
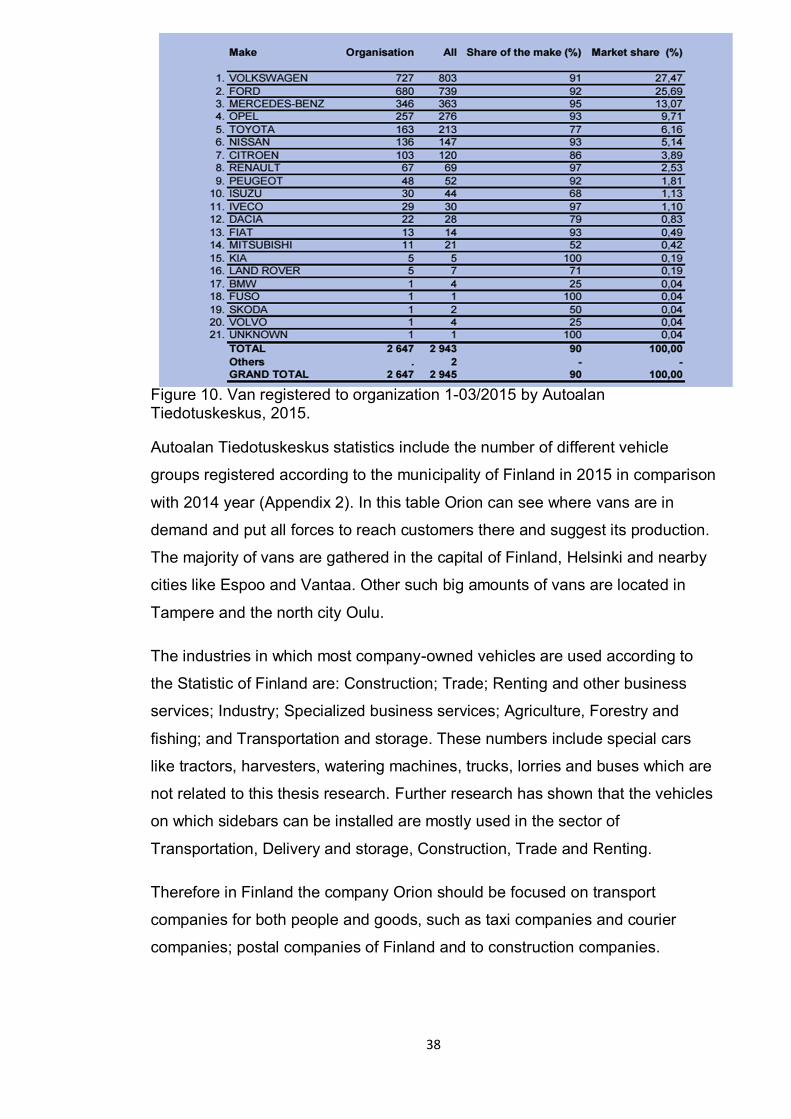
Figure 10 below consists of vans registered to different organizations in Finland,
excluding Aland. It is visible that Volkswagen, Ford, Mercedes-Benz, Opel and
Toyota are the most desirable vans in Finnish companies in case of usability,
comfort and safety. Nissan and Citroen vans are also in a high demand in
comparison with other vans makes the number of which is lower than hundred
vehicles in organizations.
38
Figure 10. Van registered to organization 1-03/2015 by Autoalan Tiedotuskeskus, 2015.
Autoalan Tiedotuskeskus statistics include the number of different vehicle
groups registered according to the municipality of Finland in 2015 in comparison
with 2014 year (Appendix 2). In this table Orion can see where vans are in
demand and put all forces to reach customers there and suggest its production.
The majority of vans are gathered in the capital of Finland, Helsinki and nearby
cities like Espoo and Vantaa. Other such big amounts of vans are located in
Tampere and the north city Oulu.
The industries in which most company-owned vehicles are used according to
the Statistic of Finland are: Construction; Trade; Renting and other business
services; Industry; Specialized business services; Agriculture, Forestry and
fishing; and Transportation and storage. These numbers include special cars
like tractors, harvesters, watering machines, trucks, lorries and buses which are
not related to this thesis research. Further research has shown that the vehicles
on which sidebars can be installed are mostly used in the sector of
Transportation, Delivery and storage, Construction, Trade and Renting.
Therefore in Finland the company Orion should be focused on transport
companies for both people and goods, such as taxi companies and courier
companies; postal companies of Finland and to construction companies.
39
3.1.8 Alternative Damage Prevention Methods
Sidebars can to some extent prevent damages on the vehicles. There are also
other preventive things like back up cameras, sensors and driver trainings that
can affect the vehicle damage.
One method that not only prevents from small damages but also from bigger is
driver trainings courses. During these practical lessons the driver will be taught
how to perform in certain conditions, driving safer and more cost efficiently.
This method does not focus on the vehicle but on the person, making the
company invest in an asset that at some point can leave the organization. This
method is not something that shows results immediately since the course takes
several sessions to be effective. Another important factor to take into account is
the price; the drivers will have to spend a lot of hours following the course which
increases the price of the already expensive course itself.
A backup camera is another prevention tool. This tool as the sidebars has to be
installed in each vehicle. It is a special type of video camera that is produced
specifically for the purpose of being attached to the rear of a vehicle to aid in
backing up, and to alleviate the rear blind spot. Backup cameras are
alternatively known as 'reversing cameras' or 'rear view cameras'. It is
specifically designed to avoid a backup collision. This tool prevents a similar
kind of damage sidebars do. The difference is that this tool prevents the
damage from happening, making it easier to maneuver the vehicle and on the
contrary sidebars minimize the damage once it happened. If a collision occurs
having the camera the damage is going to be as bad as without the camera. On
the other hand if a vehicle with sidebars hits an obstacle the damage will be
considerably less.
40
3.1.9 Competition
In Finland sidebars and push bars are frequently-used accessories for vehicles.
It is visible on the streets in cities and roads around the country. They are
exactly used by Police, Ambulances and Post vans. Also, a lot of delivery
companies and farmer vehicles are equipped with sidebars because they
always use forest roads to get to the needed place. The stainless steel bars can
be installed on vans or SUV for two reasons: damage prevention or aesthetics
reason. In Finland sidebars are most commonly installed for damage prevention
or protection of the vehicles and not for their appearance. It means that Finnish
people always think about the safety of the vans as they need to drive long
distances every day to deliver people, goods, materials, parcels and other.
These are the competitors for Orion Automotive in Finland. Auto-Kilta has a big
variety of vans accessories, also sidebars for Mercedes-Benz, Volvo and Ford
makes. Ruukki company which is located in Helsinki has a huge list of stainless
steel accessories for van: angle bars, round bars, flat bars, square flat bars, etc.
These both companies do active marketing by showing the movie about the
company, its time of delivery and the way of working. Moreover, companies
have tables with the size of products, materials and delivery conditions and
certificates and EC-declarations. These competitors do not only use the own
web shop to sell the product but they use dealers.
The prices of the sidebars in the different web shops are difficult to compare.
This is because it is not always clear what the final price is going to be, some do
not include VAT in the first price they show and others do not include the
shipping costs or the installation cost. For the customer the price is not the only
aspect that matters: quality, return policy, payment methods and mounting time
are also very important. This is an opportunity for Orion, to clearly provide this
information so that the customer gets exactly what he expects.
41
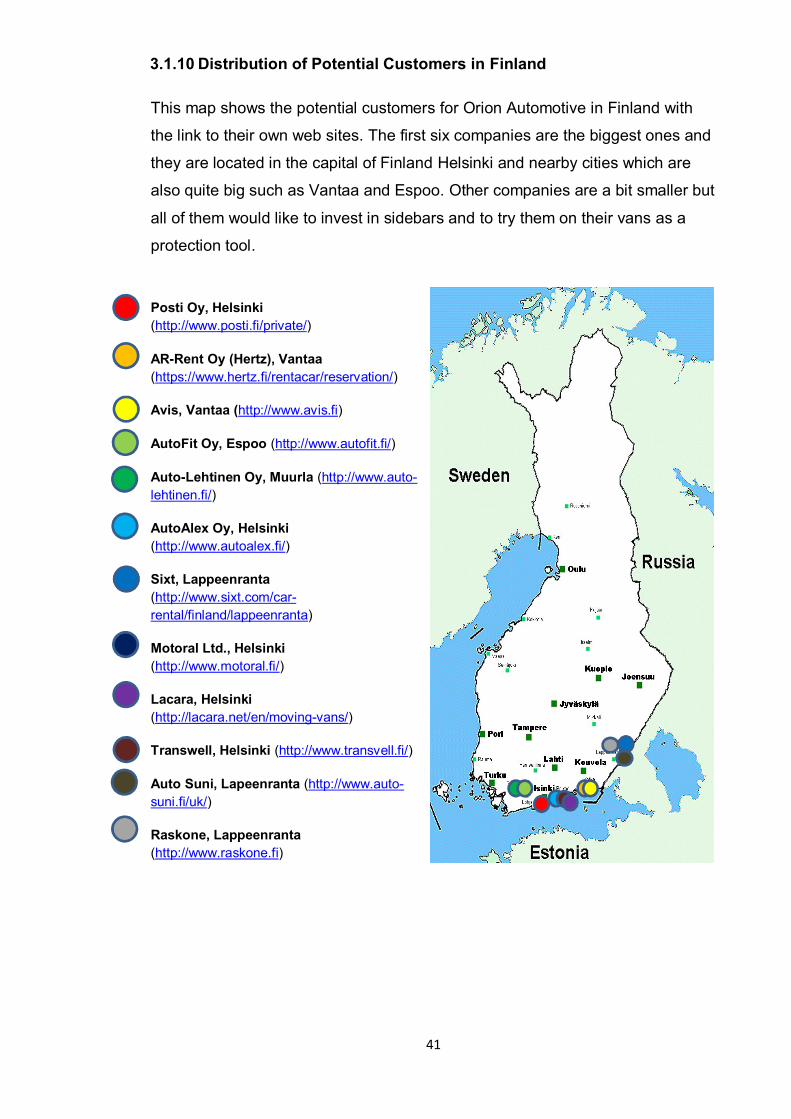
3.1.10 Distribution of Potential Customers in Finland
This map shows the potential customers for Orion Automotive in Finland with
the link to their own web sites. The first six companies are the biggest ones and
they are located in the capital of Finland Helsinki and nearby cities which are
also quite big such as Vantaa and Espoo. Other companies are a bit smaller but
all of them would like to invest in sidebars and to try them on their vans as a
protection tool.
Posti Oy, Helsinki (http://www.posti.fi/private/)
AR-Rent Oy (Hertz), Vantaa (https://www.hertz.fi/rentacar/reservation/)
Avis, Vantaa (http://www.avis.fi)
AutoFit Oy, Espoo (http://www.autofit.fi/)
Auto-Lehtinen Oy, Muurla (http://www.auto-lehtinen.fi/)
AutoAlex Oy, Helsinki (http://www.autoalex.fi/)
Sixt, Lappeenranta (http://www.sixt.com/car-rental/finland/lappeenranta)
Motoral Ltd., Helsinki (http://www.motoral.fi/)
Lacara, Helsinki (http://lacara.net/en/moving-vans/)
Transwell, Helsinki (http://www.transvell.fi/)
Auto Suni, Lapeenranta (http://www.auto-suni.fi/uk/)
Raskone, Lappeenranta (http://www.raskone.fi)
42
3.2 Market Research in the United Kingdom
3.2.1 General Overview of the UK
To forecast the business opportunities in the UK, a desk research on the
situation of road accidents and vans-related industries was conducted.
According to the official statistic, there are around 730,000 road casualties in
the UK per year. Out of this figure, it is estimated that, in 2007-2009,
Westminster had the highest rate of crushes, with 455 crushes per day. London
ranked the second place, with 410 crushes per day. Hackney, Camden and
Lambeth had 375,371 and 324 crashes per day respectively.
The number of vans on UK’s roads increased to 4,279,078 between 2002-
2012. For road accidents and safety statistics especially for vans and light
goods vehicles, several reports published by the Department for Transport were
reviewed. It is found that light damages are the most likely to happen, which
may be avoided by sidebars effectively. Around 10,000 vans suffered light
damages in 2012.
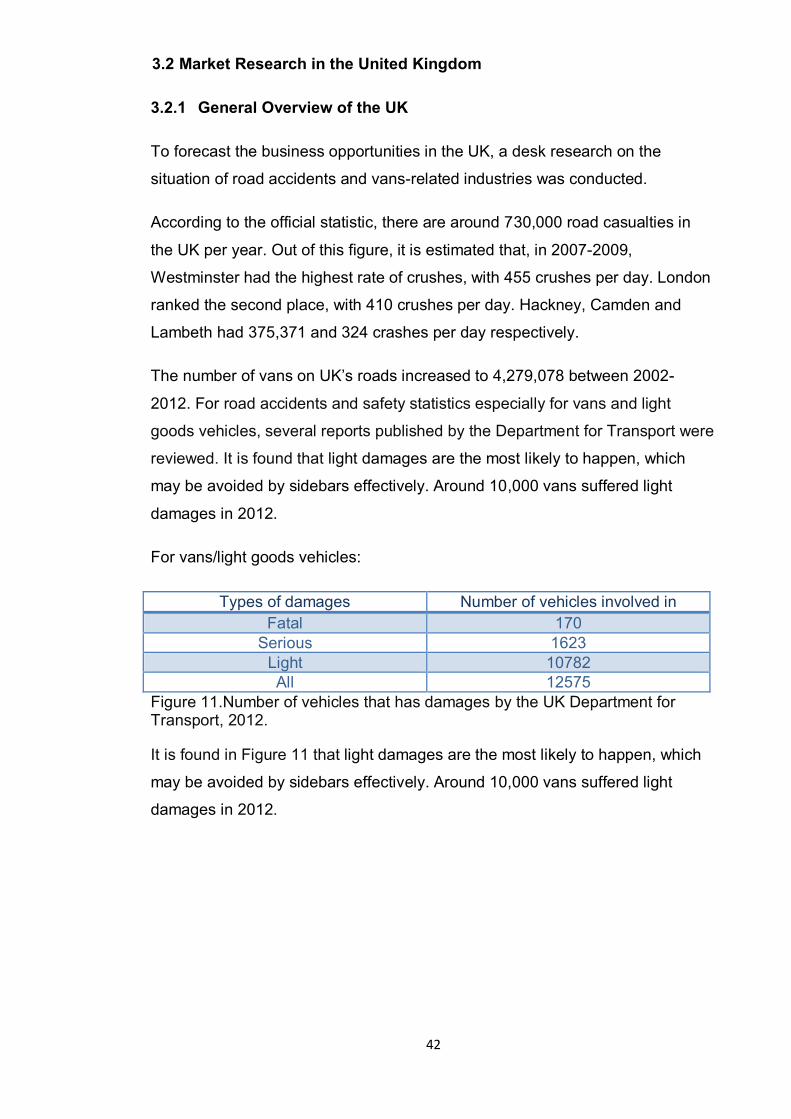
For vans/light goods vehicles:
Types of damages Number of vehicles involved in Fatal 170
Serious 1623 Light 10782 All 12575
Figure 11.Number of vehicles that has damages by the UK Department for Transport, 2012.
It is found in Figure 11 that light damages are the most likely to happen, which
may be avoided by sidebars effectively. Around 10,000 vans suffered light
damages in 2012.
43
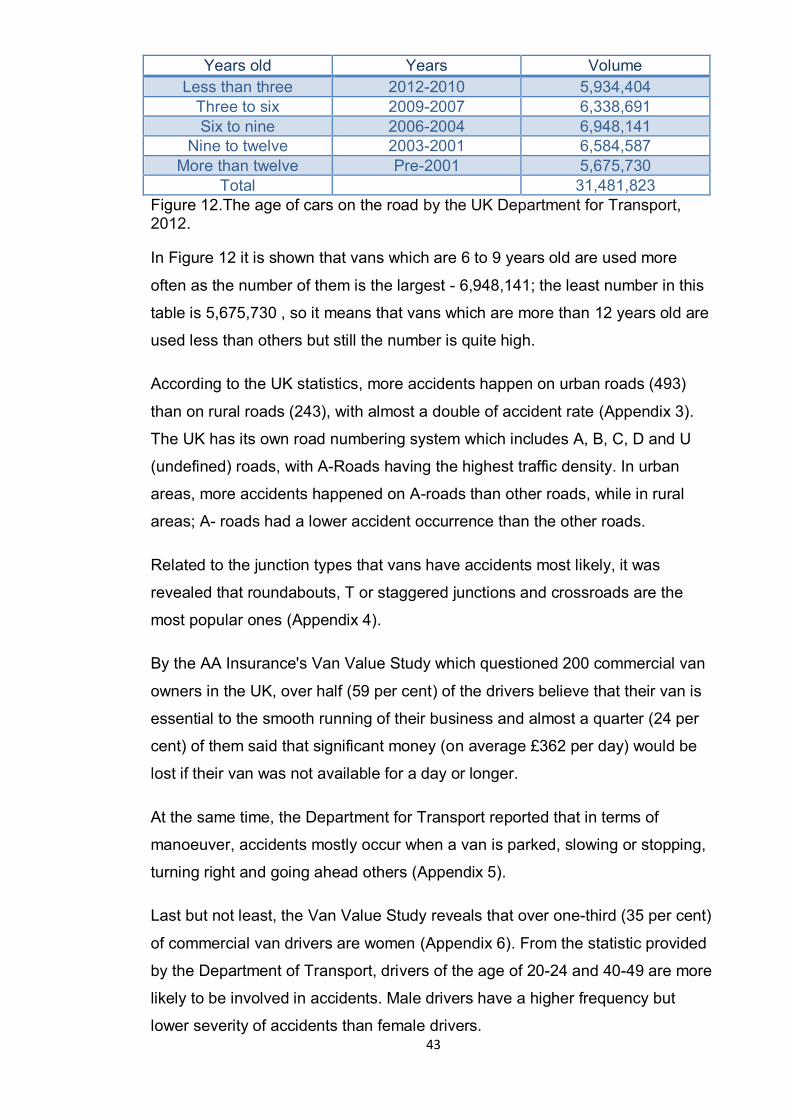
Years old Years Volume Less than three 2012-2010 5,934,404
Three to six 2009-2007 6,338,691 Six to nine 2006-2004 6,948,141
Nine to twelve 2003-2001 6,584,587 More than twelve Pre-2001 5,675,730
Total 31,481,823 Figure 12.The age of cars on the road by the UK Department for Transport, 2012.
In Figure 12 it is shown that vans which are 6 to 9 years old are used more
often as the number of them is the largest - 6,948,141; the least number in this
table is 5,675,730 , so it means that vans which are more than 12 years old are
used less than others but still the number is quite high.
According to the UK statistics, more accidents happen on urban roads (493)
than on rural roads (243), with almost a double of accident rate (Appendix 3).
The UK has its own road numbering system which includes A, B, C, D and U
(undefined) roads, with A-Roads having the highest traffic density. In urban
areas, more accidents happened on A-roads than other roads, while in rural
areas; A- roads had a lower accident occurrence than the other roads.
Related to the junction types that vans have accidents most likely, it was
revealed that roundabouts, T or staggered junctions and crossroads are the
most popular ones (Appendix 4).
By the AA Insurance's Van Value Study which questioned 200 commercial van
owners in the UK, over half (59 per cent) of the drivers believe that their van is
essential to the smooth running of their business and almost a quarter (24 per
cent) of them said that significant money (on average £362 per day) would be
lost if their van was not available for a day or longer.
At the same time, the Department for Transport reported that in terms of
manoeuver, accidents mostly occur when a van is parked, slowing or stopping,
turning right and going ahead others (Appendix 5).
Last but not least, the Van Value Study reveals that over one-third (35 per cent)
of commercial van drivers are women (Appendix 6). From the statistic provided
by the Department of Transport, drivers of the age of 20-24 and 40-49 are more
likely to be involved in accidents. Male drivers have a higher frequency but
lower severity of accidents than female drivers.
44
3.2.2 Market Growth Rate
According to the Society of Motor Manufacturers and Traders (SMMT),
Commercial vehicle market grows 25.3 per cent in March to 67,965 units, due to
positive van and truck performance. Van registrations led by 2.5 – 3.5t vans, up
23.8 per cent to 34,007 in March. The third consecutive month of increased
truck demand sees 41.0 per cent growth in 2015.
In the van and truck markets, there has been a clear shift towards the larger
vehicles in the sector in the first three months of the year 2015. Both 2.5 – 3.5t
vans and 3-axle artic trucks have seen a sharp increase in registrations as
operators seek to make their fleets as flexible and cost-effective as possible.
3.2.3 Market Profitability and Porter’s Five Forces Analysis
As for the UK market, figures released today by the Society of Motor
Manufacturers and Traders (SMMT) show that the UK new car market has
grown for a 36th consecutive month which is a record growth period. In
February, traditionally one of the quietest months of the year ahead of a number
plate change in March, the market grew 12.0 per cent year-on-year with 76,958
new cars registered, achieving a year-to-date rise of 8.3 per cent. Fleet buyers
drove this increase with registrations up 19.9 per cent in February, while the
private market saw an increase of 3.4 per cent. For the year 2015, it is expected
a more stable market to operate in.
Supplier power
The increasing importance of infotainment and telematics systems is disruptive
for OEMs and traditional suppliers, putting a premium on innovation and
changing the ways that industry players design and develop new products and
services. Software breakthroughs are becoming as critical as hardware
innovation, and competition is increasingly coming from nontraditional players.
All these mean that the suppliers need to increase the prices because of the
new innovative materials.
The UK Automotive market is big and open. There are a lot of substitute goods,
so suppliers do not have a strong power.
Buyer power
45
Buyers have significant market power when they are informed about the prices
and quality of goods. Buyers also have the ability to control the price, quality
and service conditions. In the UK, customers are trying to decrease the prices
and get the high quality of products. Also, customers are not well informed
about the sidebars target, mostly people think that they are for better looking of
the car. So, it could mean that customers do not have a strong power of
controlling the sidebars production.
Competitive Rivalry
The UK market is very competitive for Orion Automotive as there is a huge
amount of companies that sell sidebars and car accessories. The competition is
also so wide because the demand for sidebars is not high. And, a lot of
companies sell the products for different reasons. The main one is-great
appearance of the car, not the protection. So, it could be a challenging task for
Orion to enter the market. It needs a strong approval brochure with numbers to
affect the customers’ minds.
Threat of Substitution
There are a lot of UK companies that provide customers with the wide range of
car accessories and sidebars in different colors and shapes. Also, the prices
depend on the companies and the quality of materials. Often, the material used
to produce sidebars in UK companies is stainless steel, but it does not tell the
truth. In many cases, customers buy them and are not satisfied with the quality
after some time because in real the sidebar was made of a cheaper material.
That could be a real difficulty for Orion to change people attitude that Orion sells
a real sidebar.
46
Threat of New Entry
As the UK is an expensive country with its own currency, there could be extra
costs while entering its market, also additional tariffs and boundaries, political
and administrative obstacles like special licenses, certification, standards, etc.
3.2.4 Industries in the UK where vans are used
During the project, several largest industries where vans are used were found.
The major one is delivery or courier companies that are used to deliver different
kinds of goods, luggage, furniture and other things according to the order. The
largest courier companies in the UK are: DHL, FedEx, EMS International, TNT,
Yodel, DPD, AJG Parcel, etc.
Taxi companies as well as shuttle companies are also a big industry where
vans are used to transfer people to different destinations around the country.
There are over 40 airports in the UK, so transferring people to airports is an
everyday challenge for taxi and shuttle companies.
Other industries where vans are used: postal services, police and ambulance.
All three governmental organizations have vans fleets to deliver: posts inside
the country and concerning the police and ambulance, people in case of
different accidents and occasions.
3.2.5 Usage and Popularity of the sidebars in the UK
The main question to answer in this part is what people in the UK are thinking
about sidebars, are they for protection or for the stylish look of a van.
Most companies claim that sidebars are only a luxury accessory for the car and
just a waste of money. Also, another opinion is that sidebars reduce the space
between the car and the ground, so it can be the cause of small damages. For
example, when parking the car on the higher ground or when driving the rural
roads, the sidebar can be the reason the car has damage on both sides and
bottom.
Some companies say that sidebars can protect the van from small defects and
damages. The main point is that sidebar prevents small damage, so the owners
of vans do not need to keep repainting the vehicle every time it has a little
47
scrape, saving time and money. Moreover, sidebars are robust and do not need
replacement often.
3.2.6 Competitors in the UK
Concerning competitors that provide sidebars to clients, there are plenty of
them in the UK. Almost all of them produce different kinds of sidebars of various
high quality materials: polished stainless steel, stainless steel chrome, black
matt or gloss, carbon dipped or custom dipped color. The size of a sidebar
depends on the vehicle used.
One of the main competitors is Vanstyle Company which has built on more than
25 years of experience selling into the automotive industry. Also, Vanstyle is the
largest importer and distributor of van styling accessories in the UK for different
kinds of vans. The company tries to stay competitive on the market by setting
attractive prices for the products. Moreover, it provides the client with Free
Fitting Service, installing the purchased products to the van.
Another big competitor is DCC4x4 Company, providing a big variety of sidebars
from medium price to expensive and from simple to luxurious models. Most of
the sidebars are predrilled and customers just need to bolt on the sidebar to the
vehicle and they are not expensive. New models of Range Rover have
protective sidebars, the price of which is higher than the normal one.
The third competitor is Sidesteps UK, a family business which is operating in
the market since 2003. All stepbars and sidebars are made in the UK – the
West Midlands. The price for all sidebars in this company is 210 euro per pair.
The installation of one sidebar will take 10 minutes as a Quick Fitting Service.
Shipment: for most companies inside the UK, the delivery time of sidebar is 24
hours. But, delivery times vary depending on the shipping destination and
service chosen. Also, they can deliver larger parts to the UK and many to EEC
countries via UK Couriers including Night Freight and UPS. Smaller parts can
be delivered worldwide using standard small packets postage.
Installation: not all companies provide clients with the installation service; they
just send the instruction about the installation of sidebars.
48
Payment: all payments must be made in £GBP (Sterling) and if there is another
currency, it is transferred to Sterling, according to currency exchange.
Installation of sidebars on the van is in additional price.
Return policy: clients can return unused items in 'as new' condition for a refund.
The number of day when the customer can send the sidebars back varies from
7 to 14 days, according to different companies. Related to distance selling
regulations, the client is obliged to write about a defected sidebar within 7 days
by letter or email, and the new shipment will be made in 14 days.
3.2.7 Damage Prevention Methods in the UK
In the UK there are several methods used to prevent small damages on
vehicles such as: parking sensors or cameras. Parking sensors are obstacle
detection systems which utilize ultrasonic technology to help drivers maneuver
more safely. They are equipped with either one or two pairs of sensors which
beam an ultrasonic (sound) signal. The sensors both transmit and receive
signals and warn for possible obstacles. It is a very popular prevention method
as well as cameras, especially 3rd eye monitor cameras, fixed view cameras
and Tilt cameras for looking the road behind.
In addition to this, driver trainings are also damage prevention methods.
Therefore, a lot of companies that use vans for the core part of their business
suggest trainings for their drivers to improve skills and be more experienced on
the road and parking places. Also, the aim of training is to minimize
occupational road risk and reduce fleet running costs.
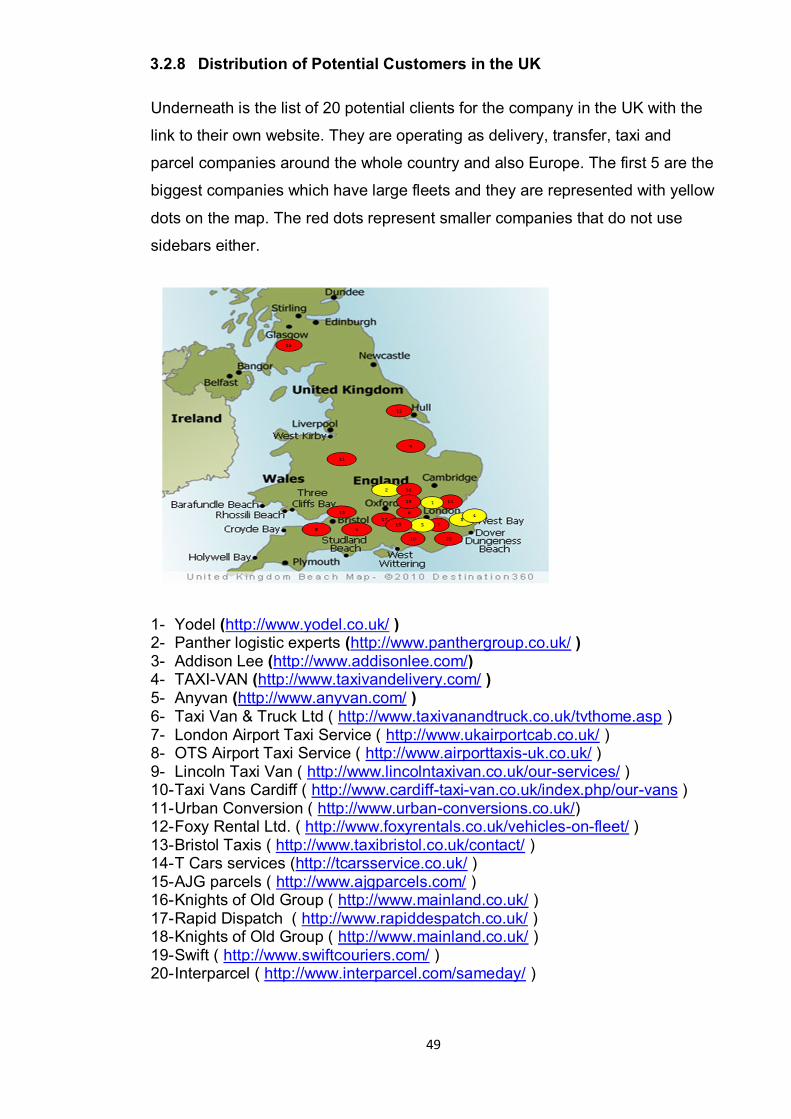
49
3.2.8 Distribution of Potential Customers in the UK
Underneath is the list of 20 potential clients for the company in the UK with the
link to their own website. They are operating as delivery, transfer, taxi and
parcel companies around the whole country and also Europe. The first 5 are the
biggest companies which have large fleets and they are represented with yellow
dots on the map. The red dots represent smaller companies that do not use
sidebars either.
1- Yodel (http://www.yodel.co.uk/ ) 2- Panther logistic experts (http://www.panthergroup.co.uk/ ) 3- Addison Lee (http://www.addisonlee.com/) 4- TAXI-VAN (http://www.taxivandelivery.com/ ) 5- Anyvan (http://www.anyvan.com/ ) 6- Taxi Van & Truck Ltd ( http://www.taxivanandtruck.co.uk/tvthome.asp ) 7- London Airport Taxi Service ( http://www.ukairportcab.co.uk/ ) 8- OTS Airport Taxi Service ( http://www.airporttaxis-uk.co.uk/ ) 9- Lincoln Taxi Van ( http://www.lincolntaxivan.co.uk/our-services/ ) 10- Taxi Vans Cardiff ( http://www.cardiff-taxi-van.co.uk/index.php/our-vans ) 11- Urban Conversion ( http://www.urban-conversions.co.uk/) 12- Foxy Rental Ltd. ( http://www.foxyrentals.co.uk/vehicles-on-fleet/ ) 13- Bristol Taxis ( http://www.taxibristol.co.uk/contact/ ) 14- T Cars services (http://tcarsservice.co.uk/ ) 15- AJG parcels ( http://www.ajgparcels.com/ ) 16- Knights of Old Group ( http://www.mainland.co.uk/ ) 17- Rapid Dispatch ( http://www.rapiddespatch.co.uk/ ) 18- Knights of Old Group ( http://www.mainland.co.uk/ ) 19- Swift ( http://www.swiftcouriers.com/ ) 20- Interparcel ( http://www.interparcel.com/sameday/ )
50
4. Summary and Discussion
The purpose of the study was to explore the market potential of Finnish and UK
markets and to help the Orion Automotive Company to find ways of expanding
the business there. Also, the aim of this thesis was to find potential customers in
both markets and suggest ways of reaching them.
Previous research about Dutch and German markets made by Ivanova et al.
(2014) was taken as the foundation of this thesis. The Finnish and the UK
markets were explored by the same structure as the Dutch and the German
ones because it was suggested by Orion Automotive to use one way of
investigating the markets for providing better comparisons and
recommendations to the company finally.
The whole research for this thesis was made in cooperation with the case
company Orion Automotive. The main goals of the company were to understand
how each market develops nowadays in automotive industry, how many
companies use sidebars and for what reasons, advantages and disadvantages
of sidebars and the number of reachable potential customers. So, the company
was mostly interested in the statistical information about the markets and
answers given by potential companies during the interviews and questionnaires.
The empirical part of the thesis was based on the desk research and the
answers from questionnaires that were sent to companies in Finland, and also
from phone interviews with UK companies. All the information was gathered
from the existing sources and real companies.
To sum up, all the vital information from the questionnaires and phone
interviews is presented below in the second part of this chapter and the
following recommendations in the third part of this chapter.
4.1 Discussion of Findings
4.1.1 Finland
During the research, the questionnaire was sent to 25 companies. Replies were
got only from 12 of them and they have been very beneficial for Orion
Automotive as the knowledge and market potential of sidebars becomes clearer
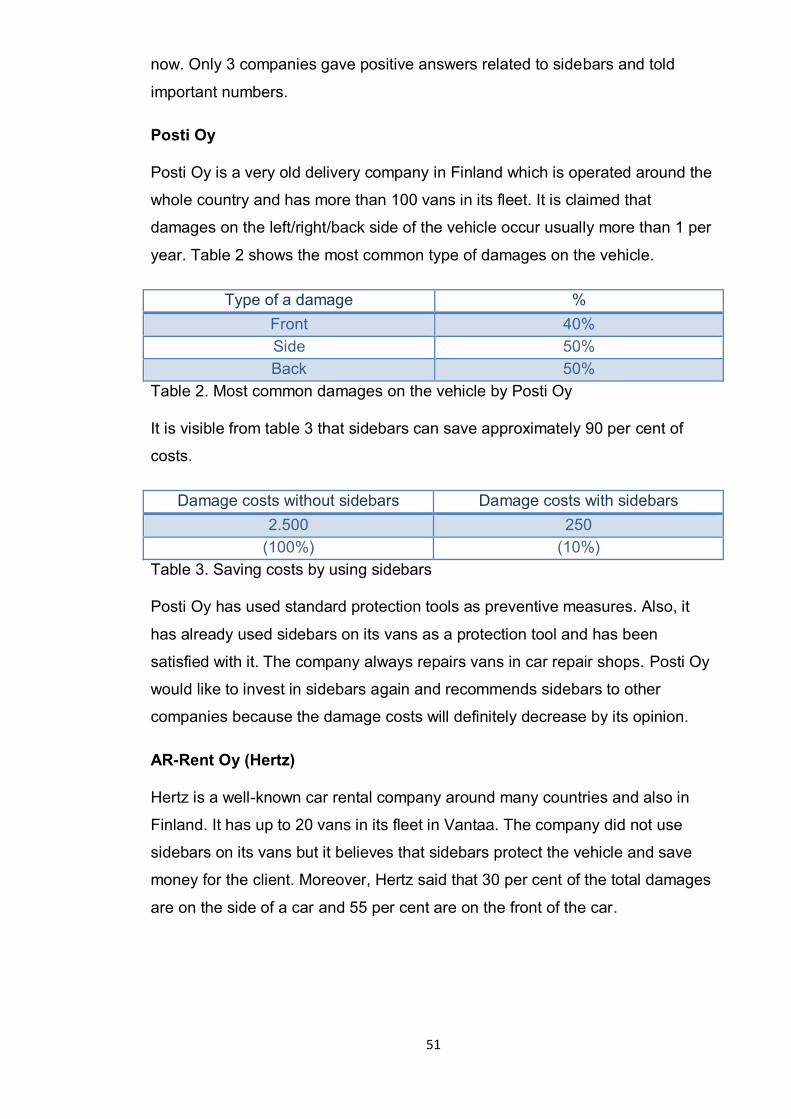
51
now. Only 3 companies gave positive answers related to sidebars and told
important numbers.
Posti Oy
Posti Oy is a very old delivery company in Finland which is operated around the
whole country and has more than 100 vans in its fleet. It is claimed that
damages on the left/right/back side of the vehicle occur usually more than 1 per
year. Table 2 shows the most common type of damages on the vehicle.
Type of a damage % Front 40% Side 50% Back 50%
Table 2. Most common damages on the vehicle by Posti Oy
It is visible from table 3 that sidebars can save approximately 90 per cent of
costs.
Damage costs without sidebars Damage costs with sidebars 2.500 250
(100%) (10%) Table 3. Saving costs by using sidebars
Posti Oy has used standard protection tools as preventive measures. Also, it
has already used sidebars on its vans as a protection tool and has been
satisfied with it. The company always repairs vans in car repair shops. Posti Oy
would like to invest in sidebars again and recommends sidebars to other
companies because the damage costs will definitely decrease by its opinion.
AR-Rent Oy (Hertz)
Hertz is a well-known car rental company around many countries and also in
Finland. It has up to 20 vans in its fleet in Vantaa. The company did not use
sidebars on its vans but it believes that sidebars protect the vehicle and save
money for the client. Moreover, Hertz said that 30 per cent of the total damages
are on the side of a car and 55 per cent are on the front of the car.
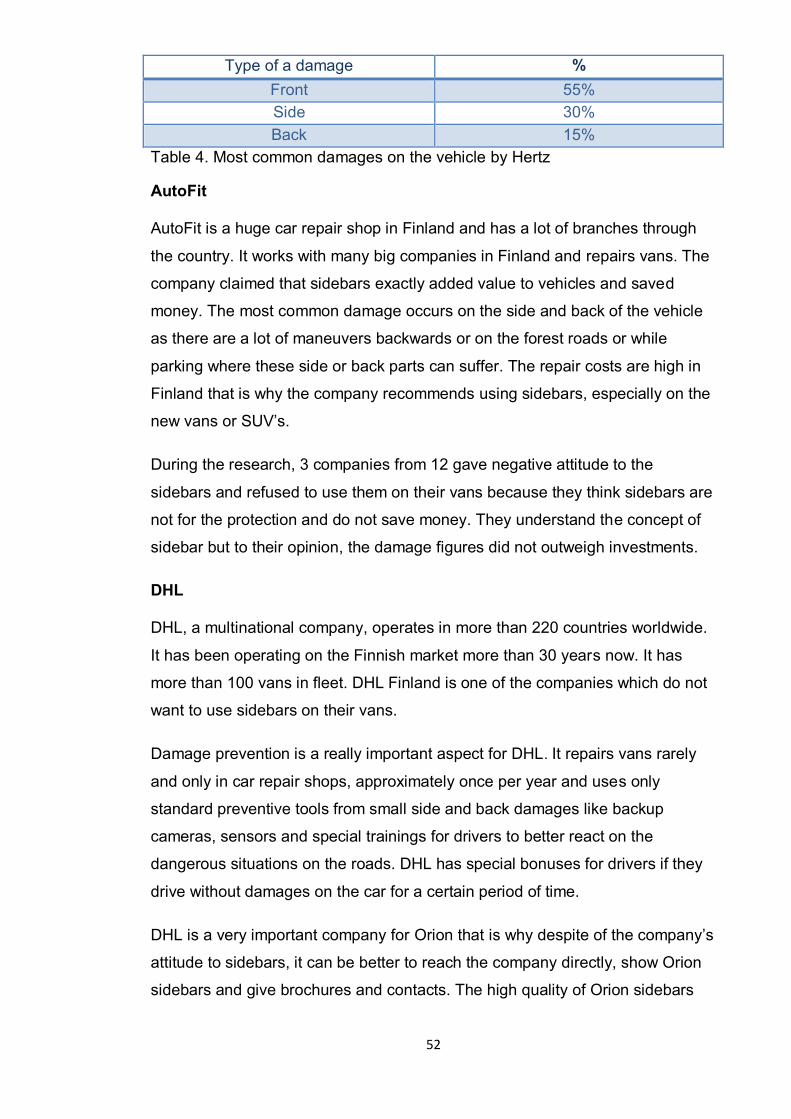
52
Type of a damage % Front 55% Side 30% Back 15%
Table 4. Most common damages on the vehicle by Hertz
AutoFit
AutoFit is a huge car repair shop in Finland and has a lot of branches through
the country. It works with many big companies in Finland and repairs vans. The
company claimed that sidebars exactly added value to vehicles and saved
money. The most common damage occurs on the side and back of the vehicle
as there are a lot of maneuvers backwards or on the forest roads or while
parking where these side or back parts can suffer. The repair costs are high in
Finland that is why the company recommends using sidebars, especially on the
new vans or SUV’s.
During the research, 3 companies from 12 gave negative attitude to the
sidebars and refused to use them on their vans because they think sidebars are
not for the protection and do not save money. They understand the concept of
sidebar but to their opinion, the damage figures did not outweigh investments.
DHL
DHL, a multinational company, operates in more than 220 countries worldwide.
It has been operating on the Finnish market more than 30 years now. It has
more than 100 vans in fleet. DHL Finland is one of the companies which do not
want to use sidebars on their vans.
Damage prevention is a really important aspect for DHL. It repairs vans rarely
and only in car repair shops, approximately once per year and uses only
standard preventive tools from small side and back damages like backup
cameras, sensors and special trainings for drivers to better react on the
dangerous situations on the roads. DHL has special bonuses for drivers if they
drive without damages on the car for a certain period of time.
DHL is a very important company for Orion that is why despite of the company’s
attitude to sidebars, it can be better to reach the company directly, show Orion
sidebars and give brochures and contacts. The high quality of Orion sidebars
53
and suitable price can affect the DHL position related to sidebars installation to
vehicles.
Back to the research questionnaire, other 6 companies gave vague answers to
questions related to sidebars. They do not know exactly the concept of sidebars
and cannot decide whether they would like to invest in sidebars or not.
Companies claimed that buying a pair of sidebars can cost a lot for them: cost
of installation, fixing and maintaining of an ideal appearance after.
Also, companies thought that sidebars protrude out of the car it is sometimes
unclear whether a sidebar actually prevented damage or not. The belief is that it
might have been damaged because of its protrusion. This is an understandable
argument, but in most cases an invalid one. Because the sidebar’s protrusion is
relatively small, the only damages that might be caused by the sidebar itself
when turning are the ones at the rear tip of the sidebars.
Companies need clear advantages of using sidebars and explanations how
sidebars can save money, so they need to see numbers which Orion has to
show to companies in Finland. Furthermore, some of these companies said that
driver training is far more superior to any other damage prevention measure.
4.1.2 The United Kingdom
During the research by Ivanova et.al (2014), 33 companies were called and
answered the questionnaire including a short description of the company itself,
some statistics about van fleets and usage of sidebars. Only 3 companies gave
exact answers and numbers:
1) Yodel – delivery company (operated 5,000 vans)
2) T Cars Services – taxi company (operated 40 vans)
3) Addison Lee - London’s Largest Minicab Company ( operated 120 vans)
All these companies operate mostly in dense populated areas because their
service is connected to delivery of people and goods inside the cities and
nearby. The taxi company on the other hand operates everywhere, in different
kinds of locations.
54
In addition to this, these 3 companies do not use sidebars because in their
opinion it is a waste of money, since it is not only about the purchase itself but
also the installation. Damages that occurred to vans are always fixed by
company’s own mechanics, not in special garages or car services because it
costs more, especially when it is a big van fleet.
Concerning the questionnaire, it was divided into 3 parts: general questions,
questions related to damages and statements part that required an
agree/disagree answer.
The first question, related to the amount of miles that every van drove, was not
answered. Especially companies that have a big number of vans could not give
any correct numbers as they did not calculate this kind of information.
Taking into consideration the questions about damages to the vans, it was
difficult for companies to answer them in a short time, during the phone call
because they said these questions have more individual character.
According to the statements of the questionnaire, companies gave only their
perceptions about sidebars because they do not use them on vans. For the
statement - “Sidebar is an easy way of reducing damage costs”, companies
totally disagree because they do not spend money on any small defects on
vans. So, most of the companies disagreed about having sidebars on vans
because when a side damage occurs, the sidebar shifts the front rail of a car
and it will cost much more money to repair the vehicle.
To sum up, UK companies are hardly reachable by email as well as by phone
calls. Also, most companies did not want to share any kind of information
related to detailed numbers, statistics because they did not have time for it or
they did not have any helpful information for the project. The majority of the
companies was not friendly and was really skeptical to every kind of question
that affected the project strongly.
55
4.2 Recommendations to Orion Automotive
Finland
To conclude, by exploring the Finnish market and making the deep desk
research, automotive industry is well developed in Finland. There are a lot of
different companies related to vehicle business which Orion can reach and
suggest its sidebars. In fact, sidebars are used quite often by Finnish
companies, but generally, the market is not saturated of sidebars in comparison
with the Netherlands and the UK markets. It is very common in Finland to use
online web shops, especially in ordering automotive vehicle parts. The most
orders are made in the USA companies which provide different sidebars. By this
fact, it is valuable for Orion Company to create an online web shop in the
Finnish online market for providing car accessories and sidebars.
By the desk research, a lot of useful statistics and information was found.
Finland has 20 per cent of not paved roads, a lot of forest roads, so a big
number of vans can suffer and have small side and back damages from gravel,
small stones, etc. Sidebars can protect vehicles from it that is why Orion needs
to suggest its production to different companies that use vans and SUV’s daily,
for example to delivery companies.
Finland has a very rigorous climate. In winter there is a lot of snow everywhere
and it could be a stone or an obstacle on the forest road under the snow. The
sidebar can save the vehicle from small damages that can occur, so it is a good
product for this market.
Also, sidebars can reduce the clearance of the car, but Finland has good
smooth roads, so it will not be a problem for vehicles and for companies to use
it. So, Orion Company can promote its sidebars in different parts of the country.
Every certain time, Finnish drivers have to take special trainings to improve
driving skills at companies. It means that Finnish drivers are very careful and
attentive, but despite of this fact, they always think about the safety of a car,
that is why sidebars can be suggested to them in any case.
The average age of vans in Finland is 12.6, according to 2012. It means that
there are a lot of old vans that need the protection like Orion sidebars.
56
According to the Finnish Statistics, the most popular vans makes inside the
country are: Toyota, Volkswagen, Ford, Mercedes-Benz and Nissan. Mercedes-
Benz and Volkswagen are bought more often than the other three brands, so
Orion Company should have more sidebars and car accessories in warehouse
for these brands.
As sidebars are a damage prevention tool, they are always put to a new vehicle
to avoid extra costs to fix the damage. Orion should approach companies in
order to convince them to install sidebars on the new vans.
The questionnaire gave the important information related to different industries
and companies in Finland. It was sent to 25 companies and only 12 of them
answered and gave some vital numbers. Approximately 3 big companies have
more than 100 vans in their fleets. About 6 companies have up to 20 vans in
usage. Other companies have up to 10 vans. Also, during the interview it was
said by 3 companies that they would like to buy sidebars because sidebars can
save money and protect the car from light damages. Another 3 companies do
not want to invest in sidebars as sidebars are a very expensive protection tool
and do not save the car from damages on roads. The last part of companies
does not know the exact concept of sidebars. They do not know whether it is a
good way to invest in sidebars for their companies or not. Orion Company
should straightly suggest its production to every group of companies because
the high quality certified sidebars can affect the attitude of the companies and
make them all invest in this product.
The main industries where vans are used in Finland are transport and delivery
companies, construction companies, forestry companies and rental companies.
According to the investigation of the Finnish Automotive industry, the most
active season for vans sales are spring months March, April and May. Knowing
when most vans are bought will allow companies as Orion to choose the right
moment to promote their products among companies and linked to that have
enough products in stock to be able to handle the bigger amount of orders.
According to the latest Finnish Statistics, in February 2015, 1,118 light
commercial vehicles were registered. This number is 2.3 per cent higher than
the previous year. The most common brands registered from January to
February are Volkswagen, Toyota and Skoda.
57
Related to competitors, the number of them is not high in comparison with the
UK and the Netherlands. The price of competitors’ sidebars is quite high as well
as the maintenance of it, so Orion can benefit in the Finnish market by providing
its stainless steel high quality sidebars.
As Orion Company has the collaboration with DHL Netherlands, it can be the
first step to connect with DHL Finland and discuss the sidebar product.
After investigation of the Finnish market, it was found out that there are more
Web shops with car accessories in Finland that provide sidebars to customers.
So, it can be a profitable way for Orion Company to create firstly a Web shop in
Finland to enter the market a bit quicker or find dealers who can sell Orion
sidebars in the Finnish market.
The United Kingdom
In conclusion, all the results about the UK market in this project were found
mainly during the desk research which took more than one month of exploring
the UK market. Special attention was put on searching for potential clients for
Orion, companies that are using sidebars already and competitors that are
selling sidebars around the UK. Also, some results were found from the
interviews with 33 British companies but not much because a lot of them were
unreachable in case of lack of information, not enough time for speaking and
just putting the phone down without any reason.
The desk research shows that the UK market is not easy to reach and collect all
useful information about sidebars, its usage and important information related to
it. The main point about the UK is that people prefer to put sidebars on their
cars as the luxury accessory, not for the protection because there are a lot of
luxurious cars in the UK and people want to make their cars more attractive.
Moreover, there are some methods of prevention that are used in the UK to
protect the car from damage. The most popular ones are different kinds of
cameras and parking sensors.
The largest industries where vans are used are delivery companies as the main
van business in the country and taxi and shuttle companies because there are
more than 40 airports in the UK and transferring of people there is needed very
often.

58
Concerning competitors, the number of them is quite big around the UK. They
sell different kinds of sidebars in various colors. The price depends on the
material and the location of production. The majority of companies deliver
sidebars in 24 hours which is very convenient for clients. Also, many companies
operate all over Europe and distribute their own production to different regions.
59
Figures
Figure 1. Market Conceptual Diagram by World of Knowledge, 2008, p.16 Figure 2. Product Diffusion Curve by QuickMBA, 2010, p. 19 Figure 3. SWOT analysis by NetMBA, 2004, p.22 Figure 4. The market research process by Jim Blythe, 2005, p.23 Figure 5. Vehicles in register by Autoalan Tiedotuskeskus, 2014 p. 25 Figure 6. Average age of vehicle in use, 31.12.2013 by Autoalan Tiedotuskeskus, 2013, p.27 Figure 7. First registration of vehicles by Statistics Finland, 5 March 2015, p.27 Figure 8. Percentage shares of turnover of motor vehicle trade products in industry categories 4511-4540 by Statistics Finland, 2012, p. 28 Figure 9. 12 months change on the main roads in the whole country (%) by the Road Transport Statistics, 2015, p.37 Figure 10. Van registered to organizations 1-03/2015 by Autoalan Tiedotuskeskus, 2015, p.38 Figure 11. Number of vehicles that has damages, by the UK Department for Transport, 2012, p. 42 Figure 12. The age of cars on the road by the UK Department for Transport, 2012, p.43
60
Tables
Table 1. SWOT analysis of Finland for Orion Automotive, p.31 Table 2. Most common damages on the vehicle by Posti Oy Company, p.51 Table 3. Saving costs by using sidebars, p.51 Table 4. Most common damages on the vehicle by Hertz Company, p.52
61
References
Aaker, A.D.& McLoughlin, D. 2010. Strategic Market Management: Global Perspectives. Chichester, UK: John Wiley and Sons.
Alton, A J. 1963. Journal of Marketing (pre-1986) 27.000003, American Marketing Association. New York, United States.
Autoalan Tiedotuskeskus. Van registered to organization 1-03/2015. 2015. http://www.aut.fi/files/957/March_2015.pdf Accessed on the 21st of March.
Autoalan Tiedotuskeskus. Vans in register by make 31.12.2013 (Top 50). 2014. http://www.autoalantiedotuskeskus.fi/en/statistics/vehicles_in_register/yearly/vehicles_in_register_31.12.2013/vans_in_register_by_make_31.12.2013 Accessed on the 21st of March.
Autoalan Tiedotuskeskus. Vehicle in register 1940 – 2014. 2015. http://www.autoalantiedotuskeskus.fi/en/statistics/vehicles_in_register/long-term_statistics/development_of_amount_of_automobiles_in_register Accessed on the 20th of March.
Barbara B. Kawulich. Data Analysis Techniques in Qualitative Research. State University of West Georgia. Education Annex, GA 30118-5160.
Blythe, Jim. Essentials of Marketing (3d edition). 2005. Pearson Education Limited 2001, 2005.
Car Accessories Company Direct4x4. Competitors for Orion Automotive in UK. 2015. http://www.direct4x4.co.uk/side-steps; http://www.jcwhitney.com/lund-3-round-bent-powder-coated-nerf-bars/p3089886.jcwx Accessed on the 25th of August.
Car accessories company in Finland. AutoKilta. Competitors for Orion Automotive. 2015. http://www.autokilta.fi/fi Accessed on the 25th of March.
Car Accessories Company. Vanstyle. Competitors for Orion Automotive in UK. 2015. http://www.vanstyle.co.uk/van/safety-sidebars-polished-chrome-caps-transit-0006-p-326.html Accessed on the 25th of August.
Car parts company in Finland. Ruukki. Competotirs for Orion Automotive. 2015. http://www.ruukki.com/Steel/Stainless-steel-and-aluminium-products/Stainless-steel-bars Accessed on the 25th of March.
Department for Transport Statistics. 2013. Report on Drivers in reported accidents by gender, number injured, road user type and age, Great Britain, latest available year 2012. https://www.gov.uk/government/statistics/reported-road-casualties-great-britain-annual-report-2013 Accessed on the 15th of August.
Department for Transport Statistics. 2013. Report on Vehicles involved in reported accidents by vehicles type and manoeuver. Great Britain. https://www.gov.uk/government/statistics/reported-road-casualties-great-britain-annual-report-2013 Accessed on the 15th of August.
62
Depatment for Transport Statistics. 2013. Report on Vehicles involved in reported accidents by accident severity and vehicle types. https://www.gov.uk/government/statistics/reported-road-casualties-great-britain-annual-report-2013 Accessed on the 15th of August.
Depatment for Transport Statistics. 2013. Report on Vehicles involved in reported accidents by junction type, vehicle type, built-up and non built-up roads.Great Britain. 2012. https://www.gov.uk/government/statistics/reported-road-casualties-great-britain-annual-report-2013 Accessed on the 15th of August.
Depatment for Transport Statistics. 2013. Vehicle involvement rates for reported accidents, by vehicle type, urban and rural roads, road class, accidents severity and traffic. https://www.gov.uk/government/statistics/reported-road-casualties-great-britain-annual-report-2013 Accessed on the 15th of August.
European Automobile Manufacturers’ Association (ACEA).2015. Auto industry cautiously optimistic for 2015. http://www.acea.be/press-releases/article/auto-industry-cautiously-optimistic-for-2015 Accessed on the 30th of April.
Finland- From a crisis to a successful membership of the EU and the EMU. 2006. http://www.suomenpankki.fi/en/suomen_pankki/ajankohtaista/puheet/Documents/060421SS_Puola.pdf Accessed on the 29th of April.
Finnish Transport Agency. 12 month change on main roads in the whole country (%). 2015. http://portal.liikennevirasto.fi/sivu/www/e/fta/statistics Accessed on the 21st of March.
Finnish Transport Agency. Transport Network. Roads. 2015. http://portal.liikennevirasto.fi/sivu/www/e/transport_network/roads Accessed on the 20th of March.
Ghauri, P & Grönhaug, K. 2005. Research Methods in Business Studies (3d Edition). Pearson Education Limited.Essex: Great Britain.
Hague, Paul N.,Hague, Nick.2004. Market Research in Practice: A Guide to the Basics. Kogan Page. Limited
Internet Center for Management and Business Administration. PEST Analysis. http://www.netmba.com/strategy/pest/ Accessed on the 10th of April.
Ivanova et al. 2014. Cost-Benefit Consultancy Report V1.0 (1). Sidebar Business Proposition. Fontys University of Applied Sciences. The Netherlands.
Ivanova et al. 2014. Market Potential Consultancy Report V1.0 (1). Sidebar Business Proposition. Fontys University of Applied Sciences. The Netherlands.
Kotler P. & Armstrong G.2010.Principles of Marketing (13th edition). Pearson Education Limited. Prentice Hall.London.
Kotler, Philip. 2005. Marketing management.(12th edition). Prentice Hall.
Merriam, Sharan B. 1998. Qualitative Research and Case Study Applications in Education. San Francisco: Jossey-Bass.
63
PEST Analysis. 2006. http://www.washington.edu/research/rapid/resources/toolsTemplates/PEST_analysis.pdf Accessed on the 10th of April.
Porter, M.E. 2008. The Five Competitive Forces That Shape Strategy. Harvard Business Review. January 2008 pp 79-93
Porter, Michael E., Competitive Advantage. 1985. Ch. 1, pp 11-15. The Free Press. New York.
Russian Trade Representation in Finland. Strategies for economic development and clean technologies. 2014. http://www.rusfintrade.ru/site/article/3119 Accessed on the 6th of April.
Saunders, Mark, Lewis, Philip and Thornhill, Adrian. 2009. Research methods for business students (5th edition). Prentice Hall.
SMMT. Driving the Motor Industry.Demand for larger vehicles drives commercial vehicle growth.2015. http://www.smmt.co.uk/2015/04/cv-registrations-march-2015/ Accessed on the 30th of April.
Statista. The Statistics Portal. 2015. http://www.statista.com/statistics/226337/forecast-for-the-growth-of-car-markets/ Accessed on the 30th of April.
Statistics Finland. First registrations of motor vehicles .March 2015. http://www.stat.fi/til/merek/2015/02/merek_2015_02_2015-03-05_tie_001_en.html Accessed on the 21st of March.
Statistics Finland. Motor Vehicle Stock. 20 March 2015. http://www.stat.fi/til/mkan/index_en.html Accessed on the 20th of March.
Statistics Finland. Percentage shares of turnover of motor vehicle trade products in industry categories 4511-4540. 2012. http://www.stat.fi/til/auma/2010/auma_2010_2012-04-25_tie_001_en.html Accessed on the 21st of March.
SWOT Analysis. 2014. http://powerbranding.ru/biznes-analiz/swot/primer-enterprise/ Accessed on the 10th of April.
Terve magazine. Automotive World of Finland. 2015. http://terve.su/avtomobilnyy-mir-finlyandii Accessed on the 20th of March.
The Finnish Border Guard. 2015. Border crossing points. http://www.raja.fi/guidelines/border_crossing/border_crossing_points. Accessed on the 5th of April.
The Marketing analysis 2015. http://www.marketingdonut.co.uk/marketing/market-research/market-analysis Accessed on 2d of April.
The society of motor manufacturers and traders. Automotive Information Services. 2013. http://www.smmt.co.uk/wp-content/uploads/sites/2/SMMT-2013-Motor-Industry-Facts-guide.pdf Accessed on the 15th of August.

64
University of Cambridge. Decision support tools. Porter’s Value Chain. http://www.ifm.eng.cam.ac.uk/research/dstools/value-chain-/ Accessed on the 2d of April.
Wilson, Alan. 2002. Marketing research, an integrated approach (2d edition). Financial Times. Prentice Hall. Stroud. United Kingdom.
Wolcott, H.F. (1994). Transforming qualitative data: Description, analysis, interpretation. Thousand Oaks, CA: Sage.
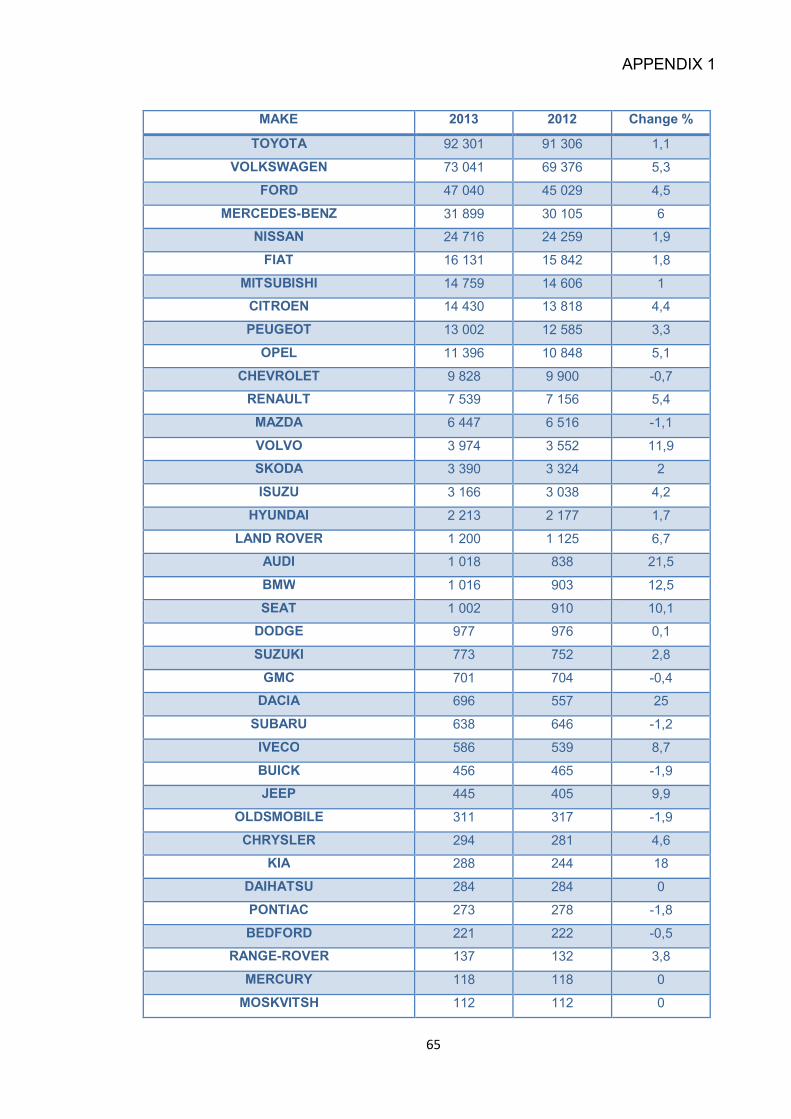
65
APPENDIX 1
MAKE 2013 2012 Change %
TOYOTA 92 301 91 306 1,1
VOLKSWAGEN 73 041 69 376 5,3
FORD 47 040 45 029 4,5
MERCEDES-BENZ 31 899 30 105 6
NISSAN 24 716 24 259 1,9
FIAT 16 131 15 842 1,8
MITSUBISHI 14 759 14 606 1
CITROEN 14 430 13 818 4,4
PEUGEOT 13 002 12 585 3,3
OPEL 11 396 10 848 5,1
CHEVROLET 9 828 9 900 -0,7
RENAULT 7 539 7 156 5,4
MAZDA 6 447 6 516 -1,1
VOLVO 3 974 3 552 11,9
SKODA 3 390 3 324 2
ISUZU 3 166 3 038 4,2
HYUNDAI 2 213 2 177 1,7
LAND ROVER 1 200 1 125 6,7
AUDI 1 018 838 21,5
BMW 1 016 903 12,5
SEAT 1 002 910 10,1
DODGE 977 976 0,1
SUZUKI 773 752 2,8
GMC 701 704 -0,4
DACIA 696 557 25
SUBARU 638 646 -1,2
IVECO 586 539 8,7
BUICK 456 465 -1,9
JEEP 445 405 9,9
OLDSMOBILE 311 317 -1,9
CHRYSLER 294 281 4,6
KIA 288 244 18
DAIHATSU 284 284 0
PONTIAC 273 278 -1,8
BEDFORD 221 222 -0,5
RANGE-ROVER 137 132 3,8
MERCURY 118 118 0
MOSKVITSH 112 112 0
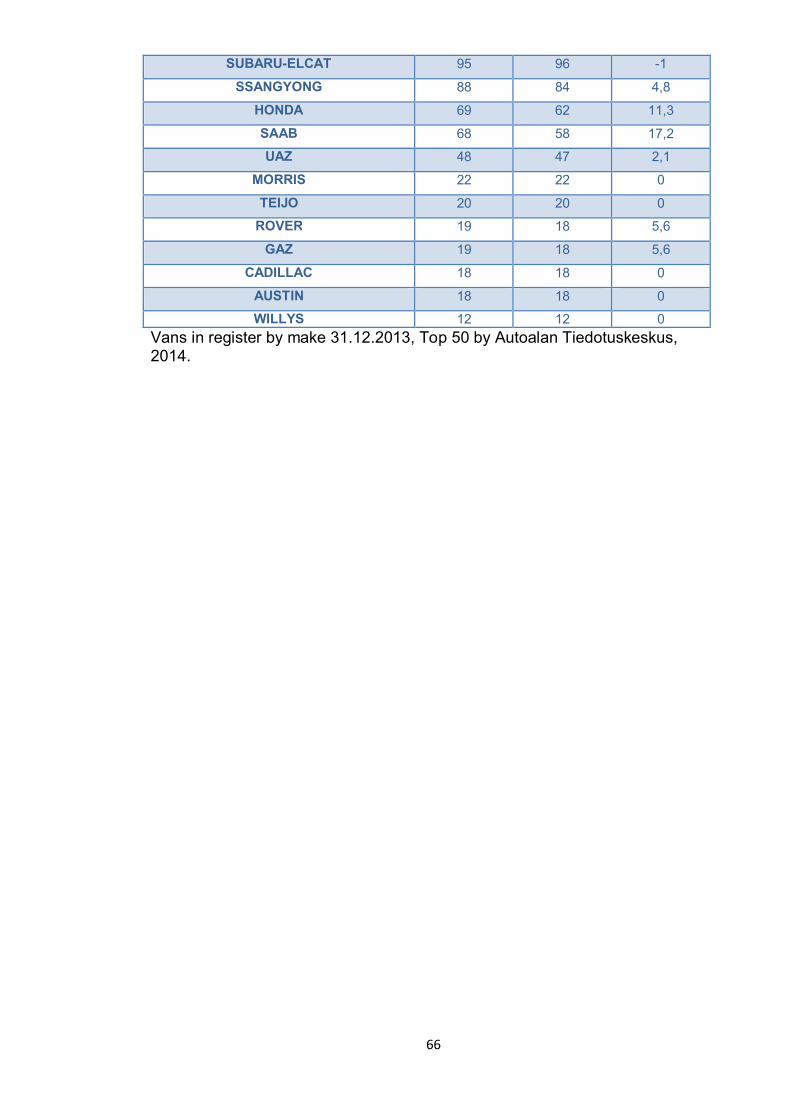
66
Vans in register by make 31.12.2013, Top 50 by Autoalan Tiedotuskeskus, 2014.
SUBARU-ELCAT 95 96 -1
SSANGYONG 88 84 4,8
HONDA 69 62 11,3
SAAB 68 58 17,2
UAZ 48 47 2,1
MORRIS 22 22 0
TEIJO 20 20 0
ROVER 19 18 5,6
GAZ 19 18 5,6
CADILLAC 18 18 0
AUSTIN 18 18 0
WILLYS 12 12 0
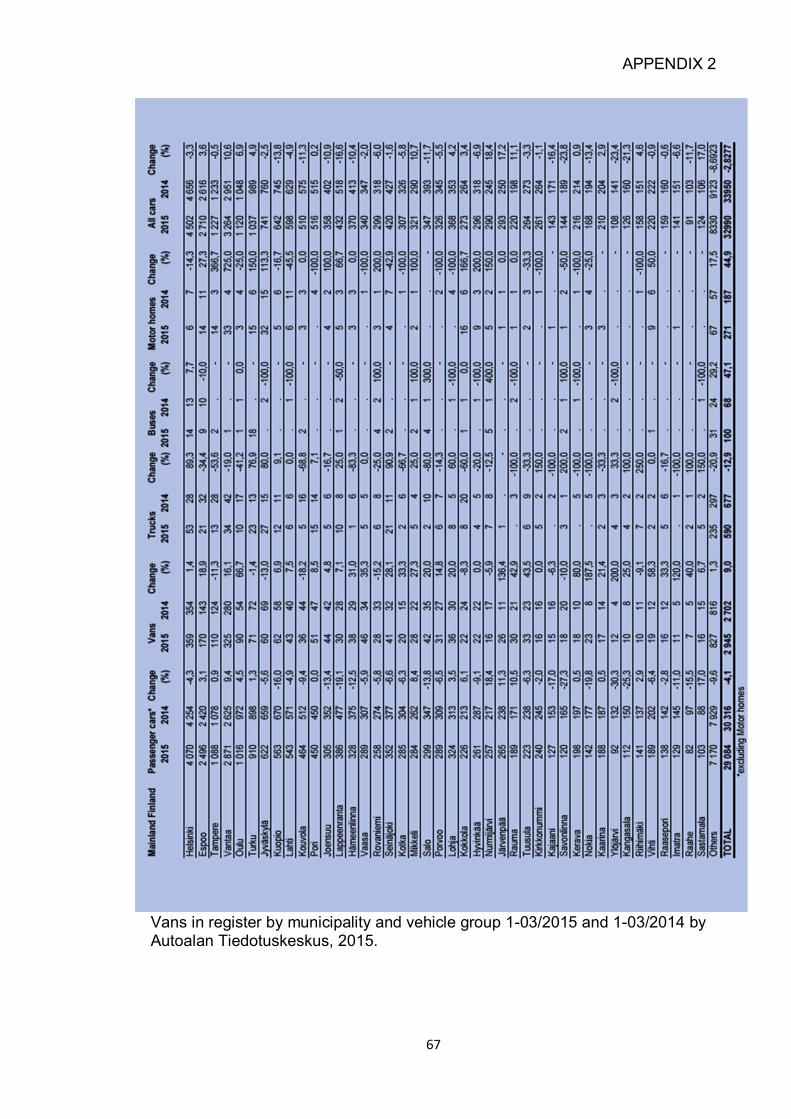
67
APPENDIX 2
Vans in register by municipality and vehicle group 1-03/2015 and 1-03/2014 by Autoalan Tiedotuskeskus, 2015.
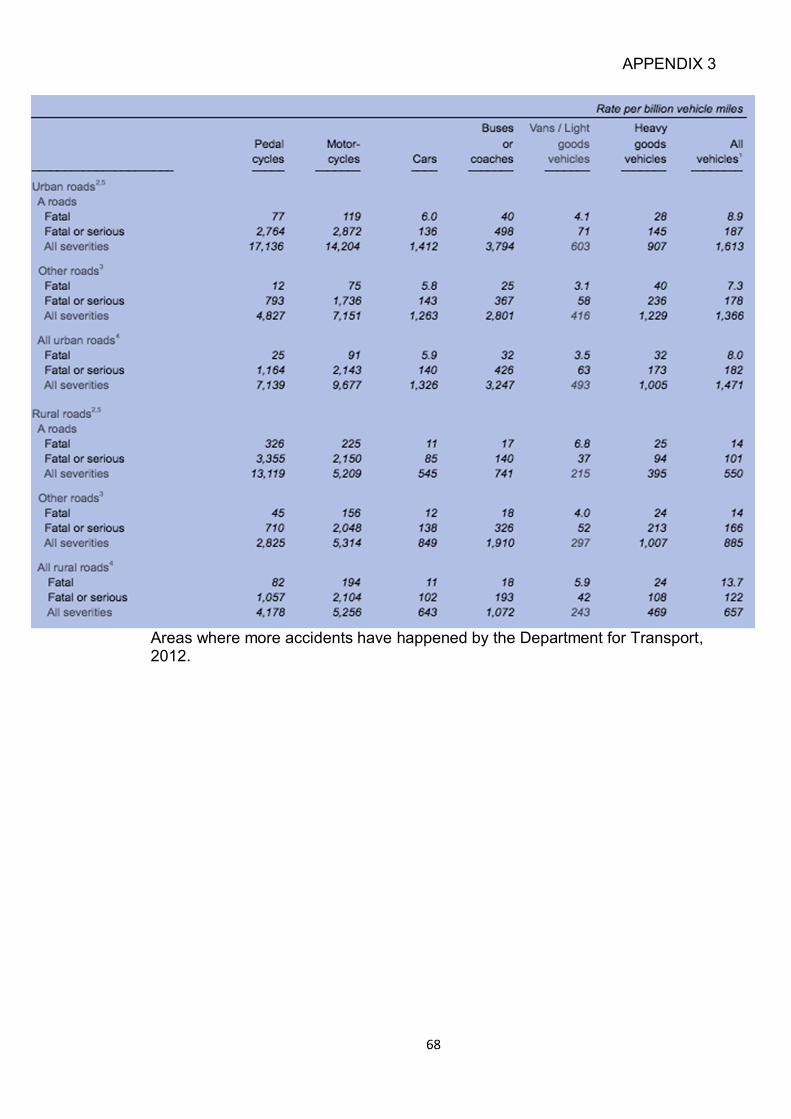
68
APPENDIX 3
Areas where more accidents have happened by the Department for Transport, 2012.
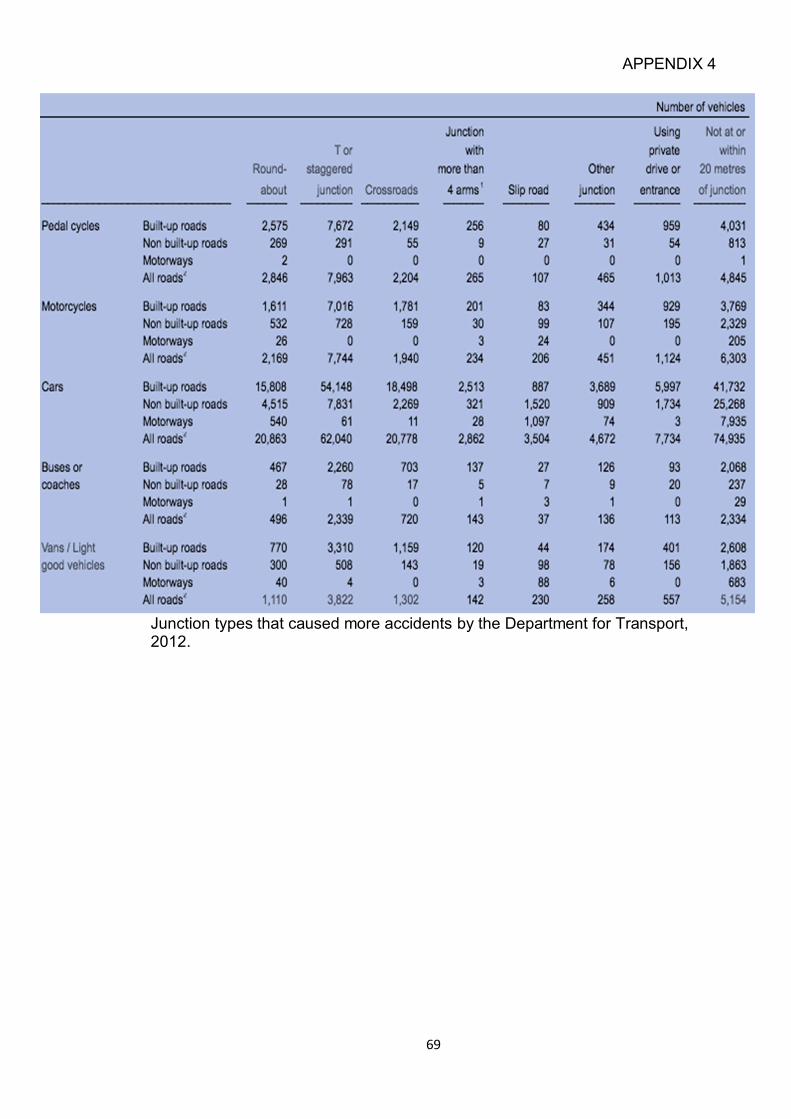
69
APPENDIX 4
Junction types that caused more accidents by the Department for Transport, 2012.
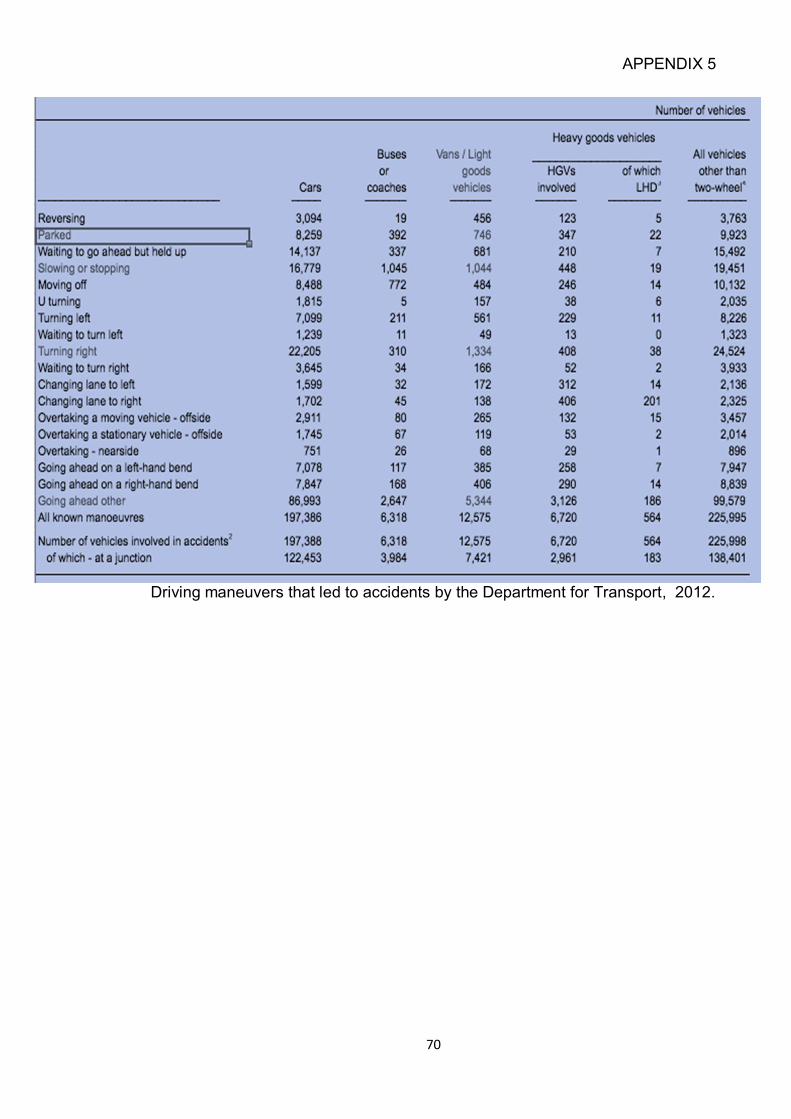
70
APPENDIX 5
Driving maneuvers that led to accidents by the Department for Transport, 2012.
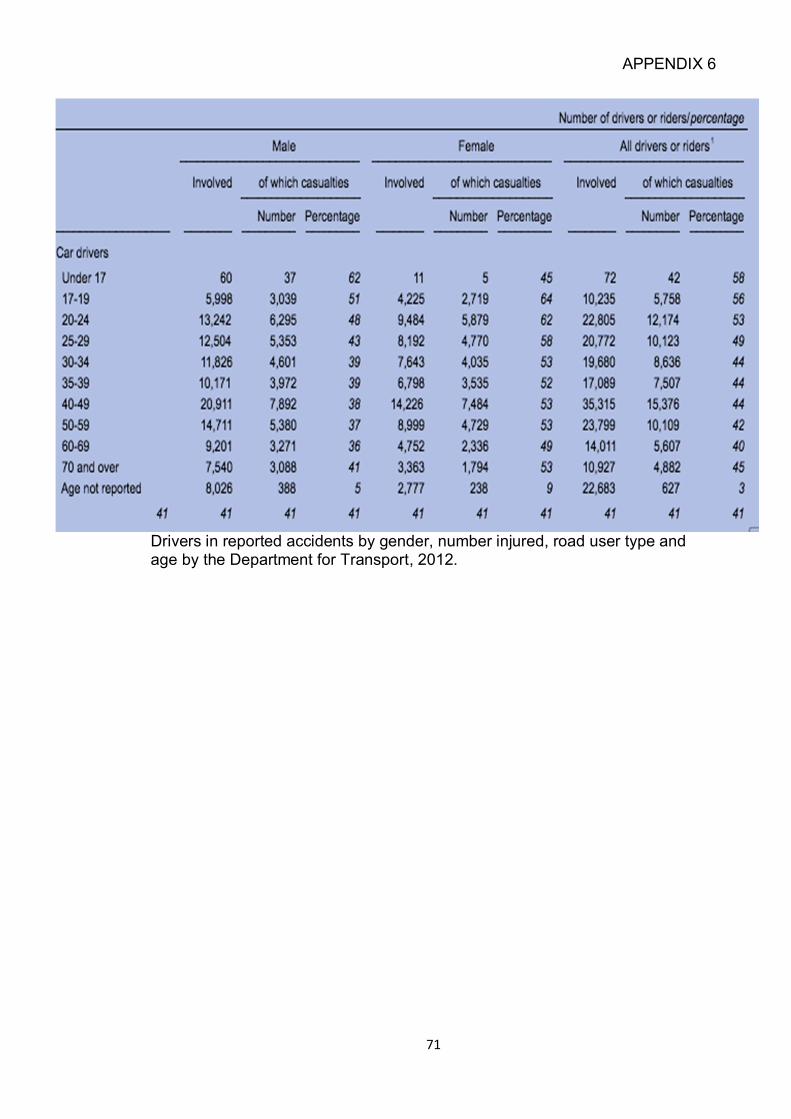
71
APPENDIX 6
Drivers in reported accidents by gender, number injured, road user type and age by the Department for Transport, 2012.
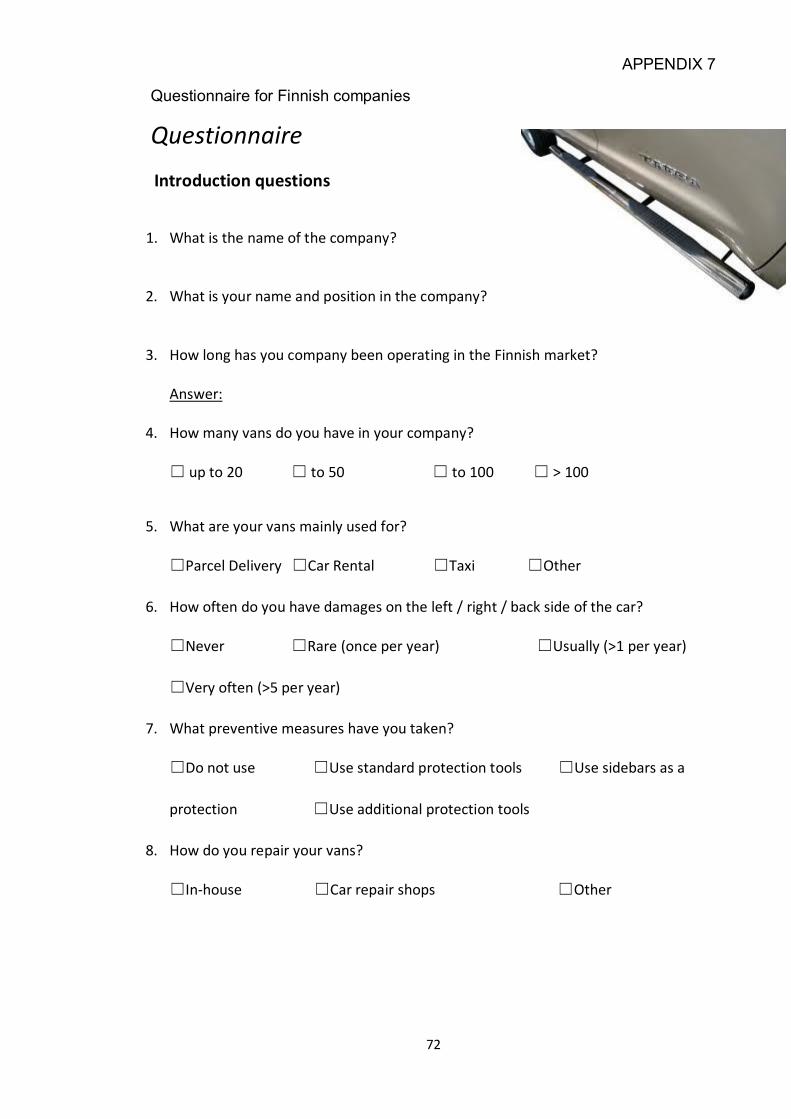
72
APPENDIX 7
Questionnaire for Finnish companies
Questionnaire
Introduction questions
1. What is the name of the company?
2. What is your name and position in the company?
3. How long has you company been operating in the Finnish market?
Answer:
4. How many vans do you have in your company?
☐ up to 20 ☐ to 50 ☐ to 100 ☐ > 100
5. What are your vans mainly used for?
☐Parcel Delivery ☐Car Rental ☐Taxi ☐Other
6. How often do you have damages on the left / right / back side of the car?
☐Never ☐Rare (once per year) ☐Usually (>1 per year)
☐Very often (>5 per year)
7. What preventive measures have you taken?
☐Do not use ☐Use standard protection tools ☐Use sidebars as a
protection ☐Use additional protection tools
8. How do you repair your vans?
☐In-house ☐Car repair shops ☐Other
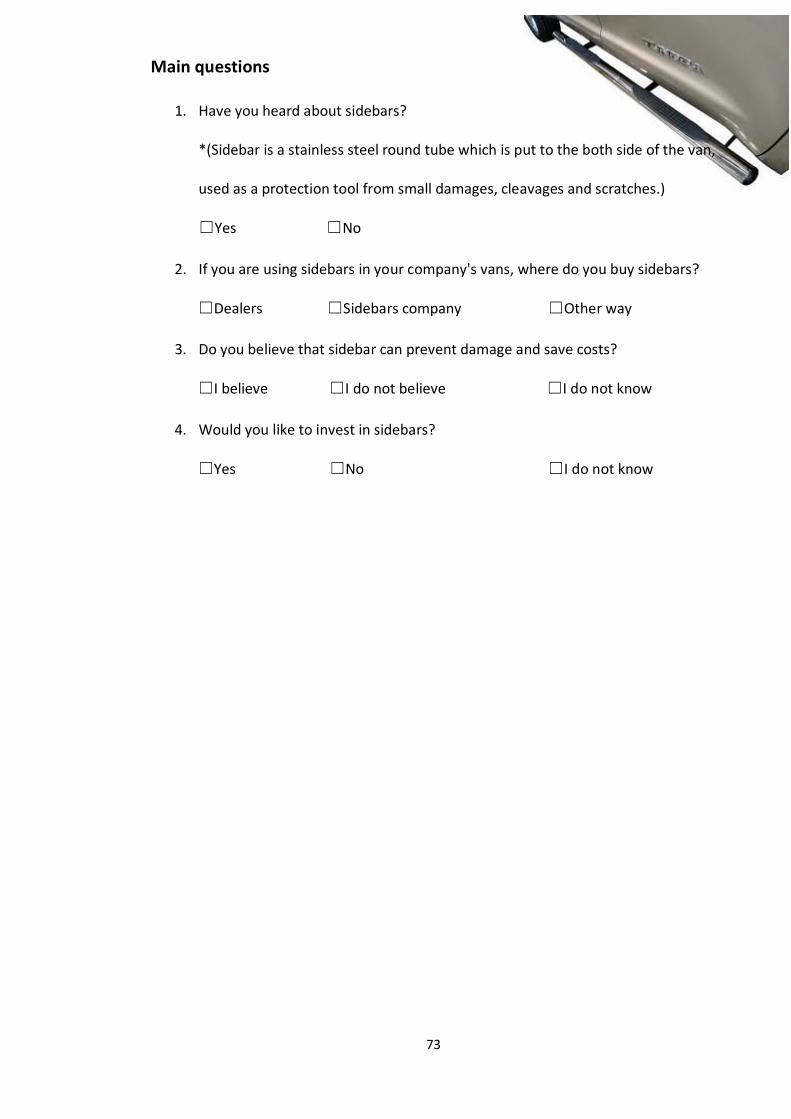
73
Main questions
1. Have you heard about sidebars?
*(Sidebar is a stainless steel round tube which is put to the both side of the van,
used as a protection tool from small damages, cleavages and scratches.)
☐Yes ☐No
2. If you are using sidebars in your company's vans, where do you buy sidebars?
☐Dealers ☐Sidebars company ☐Other way
3. Do you believe that sidebar can prevent damage and save costs?
☐I believe ☐I do not believe ☐I do not know
4. Would you like to invest in sidebars?
☐Yes ☐No ☐I do not know
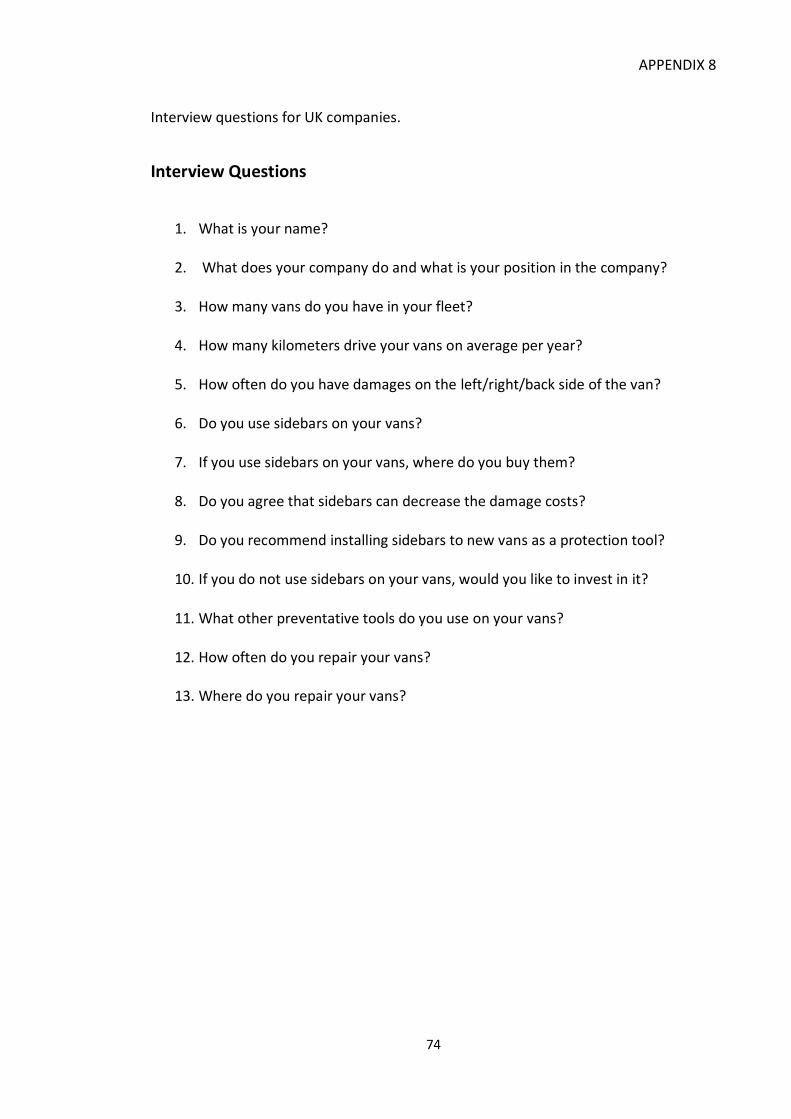
74
APPENDIX 8
Interview questions for UK companies.
Interview Questions
1. What is your name?
2. What does your company do and what is your position in the company?
3. How many vans do you have in your fleet?
4. How many kilometers drive your vans on average per year?
5. How often do you have damages on the left/right/back side of the van?
6. Do you use sidebars on your vans?
7. If you use sidebars on your vans, where do you buy them?
8. Do you agree that sidebars can decrease the damage costs?
9. Do you recommend installing sidebars to new vans as a protection tool?
10. If you do not use sidebars on your vans, would you like to invest in it?
11. What other preventative tools do you use on your vans?
12. How often do you repair your vans?
13. Where do you repair your vans?
Copyright © 2022 FDOKUMEN