
Optimal oligopoly pricing and the threat of entry:: Canadian evidence
Upload
khangminh22Category
view
0download
0
Chapter 1: Introduction
This article looks to examine the present U.K. beer mar-
ket and how small, cask ale brewers interact and com-
pete with others around them. Once the characteristics
of beer as an economic good have been ascertained,
attention shall focus on how small brewers act upon
this. Through gleaning the existing literature, establish-
ing an up-to-date model for the long run demand for
beer, and direct interviews with small brewers, a vivid
picture for what it takes to survive as a cask ale brewer
will be presented.
It is necessary to first look at the changes to the U.K.
brewing industry since the late 1980s in order to
appreciate the current market dynamics. This is not an
arbitrary choice; in 1989 the Monopolies & Mergers
Commission published a report1 recommending a break
up of the extensive vertical integration that was present
in the Beer Market at that time. The resulting legislation
caused the nature of brewing and retailing beer to be
transformed in a major way, changes that aimed to break
up a market which had displayed classic oligopolistic
tendencies.
Next, historical context will be given as a prelude to the
late 1980s oligopoly, before undertaking an analysis for
a new entrant and finally a brief summary will be given
of the current state of U.K. beer market.
1.1 Historical background
Towards the end of the 19th Century in Britain, in part
due to the introduction of the 1869 Beer and Wine Act,
the system of establishing Tied Houses began to rear
itself. All brewers, including the ‘Burton Brewers’ who
previously relied on the superiority of their beer to get
them into any public house, were beginning to build up
property portfolios as Tied Houses were refusing their
alcohol.
With owning property came the implicit restriction of
other brewers selling their beer in those premises. This
being the precedent, competition stepped up to purchase
outlets as forward integration was the surest way to
guarantee beer sales.
This industry set up continued, largely undisturbed until
the post war years. The next major shake up in the mar-
ket came towards the end of the 1950s and through to
the 1970s with a number of horizontal mergers occurring.
There are a number of reasons for this, some of which
can be attributed to general economic factors, such as a
flexible stock market that meant less cash was needed
upfront for deals, thus facilitating merger activity.
Others were related more directly to the U.K. beer
market. The growing level of beer demand in the UK,
coupled with a realisation in the City that many of the
brewers’ had undervalued assets spurred brewers into
activity. Merging resources was the best way of increasing
scale economies, increasing efficiency and subsequent-
ly fending off attack from predatory takeover bids that
looked to utilise the value of the Brewers’ property.
There is much documentation on specific deals that took
place in the time period prior to The Supply of Beer
which shall be omitted for the sake of repetition.
Journal of the Brewery History Society38
BREWERY
HISTORY
The Journal is © 2014
The Brewery History Society
Brewery History (2014) 158, 38-71
COMPETITION AND OLIGOPOLY IN THE UK BEER MARKET:
HOW DO SMALL BREWERS SURVIVE?
SAM FLOY
By the late 1980s, there were six national brewers in the
U.K. Beer Market. Together they were responsible for
75% of the total beer production in the U.K. in 1985.2
With the system of Tied Houses, these brewers held
considerable market power. Though it should be noted
that the grip of tied trade had loosened somewhat, with
the growth of import dependence and growth in ancil-
lary segments such as restaurant and off-licence
sales.3
1.2 Five forces analysis: Grolsch
Due to its succinctness and applicability for analysing
the pressures faced by firms, a desirable method for
evaluating the beer marketplace in the 1980s is through
Porters’ Five Forces.4
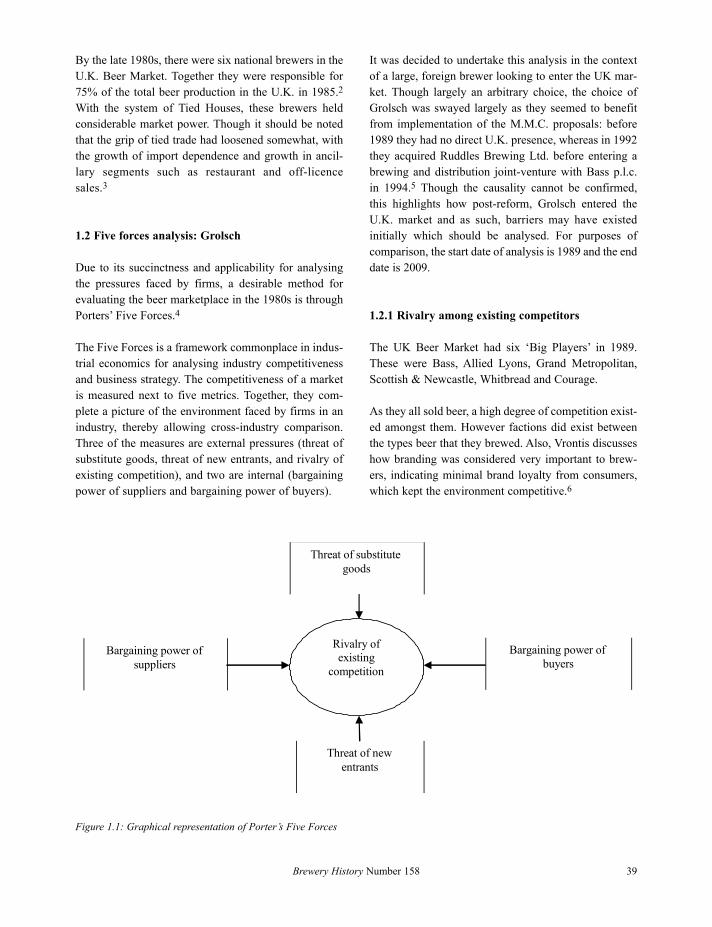
The Five Forces is a framework commonplace in indus-
trial economics for analysing industry competitiveness
and business strategy. The competitiveness of a market
is measured next to five metrics. Together, they com-
plete a picture of the environment faced by firms in an
industry, thereby allowing cross-industry comparison.
Three of the measures are external pressures (threat of
substitute goods, threat of new entrants, and rivalry of
existing competition), and two are internal (bargaining
power of suppliers and bargaining power of buyers).
It was decided to undertake this analysis in the context
of a large, foreign brewer looking to enter the UK mar-
ket. Though largely an arbitrary choice, the choice of
Grolsch was swayed largely as they seemed to benefit
from implementation of the M.M.C. proposals: before
1989 they had no direct U.K. presence, whereas in 1992
they acquired Ruddles Brewing Ltd. before entering a
brewing and distribution joint-venture with Bass p.l.c.
in 1994.5 Though the causality cannot be confirmed,
this highlights how post-reform, Grolsch entered the
U.K. market and as such, barriers may have existed
initially which should be analysed. For purposes of
comparison, the start date of analysis is 1989 and the end
date is 2009.
1.2.1 Rivalry among existing competitors
The UK Beer Market had six ‘Big Players’ in 1989.
These were Bass, Allied Lyons, Grand Metropolitan,
Scottish & Newcastle, Whitbread and Courage.
As they all sold beer, a high degree of competition exist-
ed amongst them. However factions did exist between
the types beer that they brewed. Also, Vrontis discusses
how branding was considered very important to brew-
ers, indicating minimal brand loyalty from consumers,
which kept the environment competitive.6
Brewery History Number 158 39
Rivalry of
existing
competition
Threat of substitute
goods
Bargaining power of
buyers
Bargaining power of
suppliers
Threat of new
entrants
Figure 1.1: Graphical representation of Porter’s Five Forces
By 2009, the make-up had changed somewhat, with
Heineken N.V., Molson Coors Brewing Company and
Anheuser-Busch InBev controlling 71.6% of the mar-
ket.7 This again highlights the oligopolistic nature of
U.K. brewing.
1.2.2 Bargaining power of suppliers
Brewers, especially the large ones, would normally be
the largest buyer from their suppliers, meaning that they
could exert a degree of monopsony over them. This is a
trend across the market and would be faced by all play-
ers with minimal differential. The same can be said of
the current situation.
1.2.3 Bargaining power of buyers
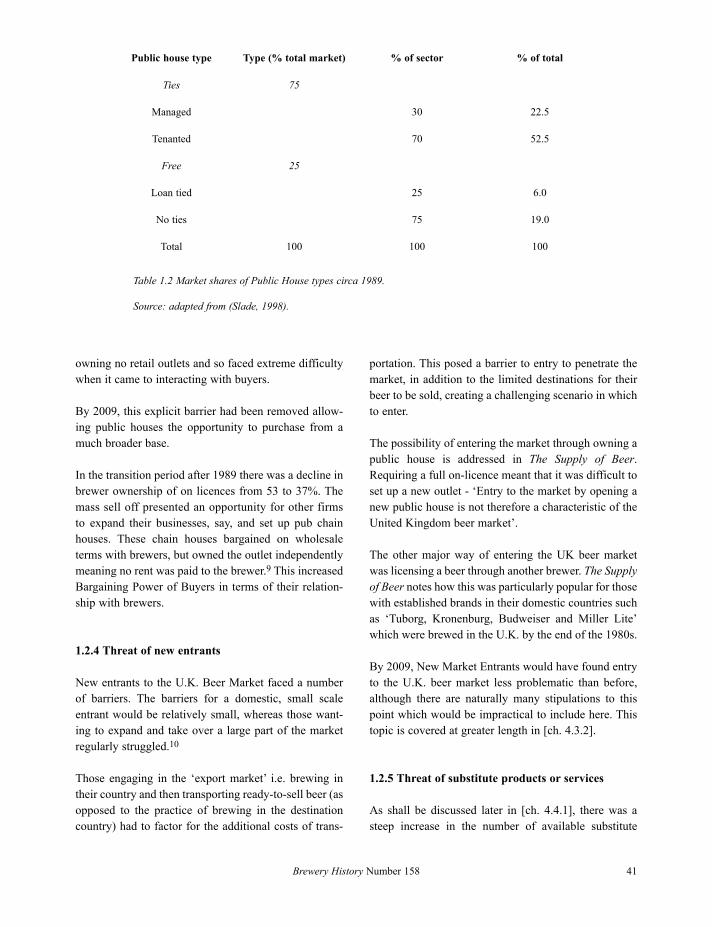
This is the defining feature of the late 1980s Beer
Market. Buyers of beer were mainly public houses and
of these 75% were in tied trade (see Table 1.2). This was
where brewer exerted heavy influence over what and
how beer was sold in pubs. As a result buyers had a
restricted amount of beer that they could buy which was
of their own choice. If a house was linked to a brewery
then they wielded a tremendous amount of power over
what was ordered (often these agreements would be
contractual8). If a house had ‘an agreement’ with a
brewery, then the buyer was guaranteed to purchase a
high proportion of their alcohol from that one source.
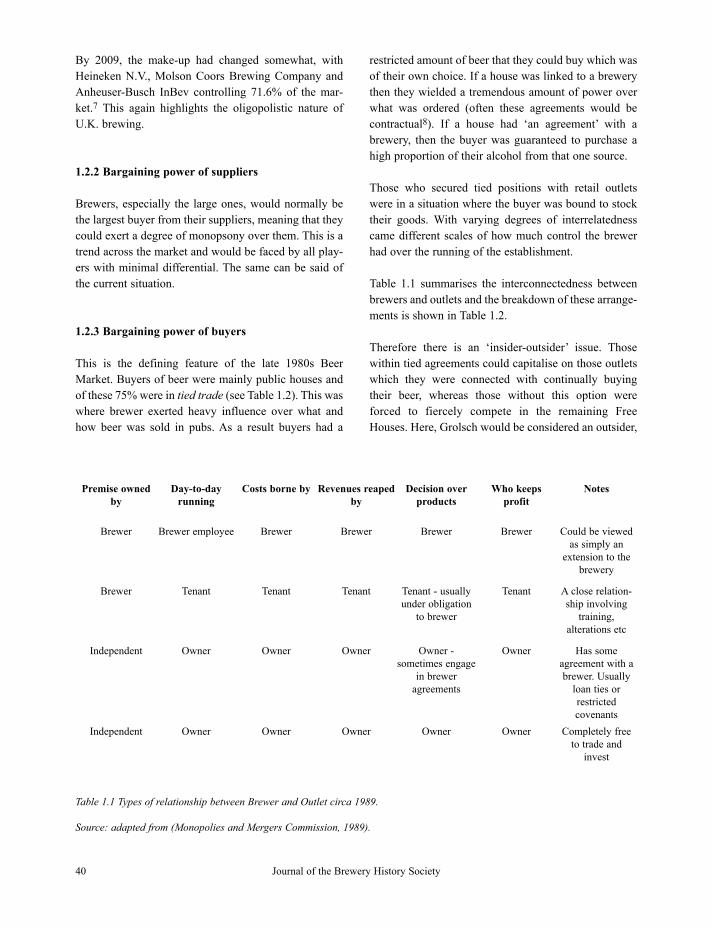
Those who secured tied positions with retail outlets
were in a situation where the buyer was bound to stock
their goods. With varying degrees of interrelatedness
came different scales of how much control the brewer
had over the running of the establishment.
Table 1.1 summarises the interconnectedness between
brewers and outlets and the breakdown of these arrange-
ments is shown in Table 1.2.
Therefore there is an ‘insider-outsider’ issue. Those
within tied agreements could capitalise on those outlets
which they were connected with continually buying
their beer, whereas those without this option were
forced to fiercely compete in the remaining Free
Houses. Here, Grolsch would be considered an outsider,
Journal of the Brewery History Society40
Premise owned
by
Day-to-day
running
Costs borne by Revenues reaped
by
Decision over
products
Who keeps
profit
Notes
Brewer Brewer employee Brewer Brewer Brewer Brewer Could be viewed
as simply an
extension to the
brewery
Brewer Tenant Tenant Tenant Tenant - usually
under obligation
to brewer
Tenant A close relation-
ship involving
training,
alterations etc
Independent Owner Owner Owner Owner -
sometimes engage
in brewer
agreements
Owner Has some
agreement with a
brewer. Usually
loan ties or
restricted
covenants
Independent Owner Owner Owner Owner Owner Completely free
to trade and
invest
Table 1.1 Types of relationship between Brewer and Outlet circa 1989.
Source: adapted from (Monopolies and Mergers Commission, 1989).
owning no retail outlets and so faced extreme difficulty
when it came to interacting with buyers.
By 2009, this explicit barrier had been removed allow-
ing public houses the opportunity to purchase from a
much broader base.
In the transition period after 1989 there was a decline in
brewer ownership of on licences from 53 to 37%. The
mass sell off presented an opportunity for other firms
to expand their businesses, say, and set up pub chain
houses. These chain houses bargained on wholesale
terms with brewers, but owned the outlet independently
meaning no rent was paid to the brewer.9 This increased
Bargaining Power of Buyers in terms of their relation-
ship with brewers.
1.2.4 Threat of new entrants
New entrants to the U.K. Beer Market faced a number
of barriers. The barriers for a domestic, small scale
entrant would be relatively small, whereas those want-
ing to expand and take over a large part of the market
regularly struggled.10
Those engaging in the ‘export market’ i.e. brewing in
their country and then transporting ready-to-sell beer (as
opposed to the practice of brewing in the destination
country) had to factor for the additional costs of trans-
portation. This posed a barrier to entry to penetrate the
market, in addition to the limited destinations for their
beer to be sold, creating a challenging scenario in which
to enter.
The possibility of entering the market through owning a
public house is addressed in The Supply of Beer.
Requiring a full on-licence meant that it was difficult to
set up a new outlet - ‘Entry to the market by opening a
new public house is not therefore a characteristic of the
United Kingdom beer market’.
The other major way of entering the UK beer market
was licensing a beer through another brewer. The Supply
of Beer notes how this was particularly popular for those
with established brands in their domestic countries such
as ‘Tuborg, Kronenburg, Budweiser and Miller Lite’
which were brewed in the U.K. by the end of the 1980s.
By 2009, New Market Entrants would have found entry
to the U.K. beer market less problematic than before,
although there are naturally many stipulations to this
point which would be impractical to include here. This
topic is covered at greater length in [ch. 4.3.2].
1.2.5 Threat of substitute products or services
As shall be discussed later in [ch. 4.4.1], there was a
steep increase in the number of available substitute
Brewery History Number 158 41
Public house type Type (% total market) % of sector % of total
Ties 75
Managed 30 22.5
Tenanted 70 52.5
Free 25
Loan tied 25 6.0
No ties 75 19.0
Total 100 100 100
Table 1.2 Market shares of Public House types circa 1989.
Source: adapted from (Slade, 1998).
goods during the testing period. During the 1980s, beer
encountered few substitutes compared with 2009. A rise
in product innovation in the alcohol market has meant
that beer faces greater pressure than before.
1.3 Summary
After the publication of the M.M.C. report, brewers and
related groups underwent a period of lobbying which
resulted in a less severe implementation of their recom-
mendations. Nevertheless, these actions led to a drastic
change to the way that the market operated.
The above analysis suggests that an oligopoly has con-
tinued to prevail in the U.K. Beer Market in 2009.
Conceptually, ‘chain houses’ replaced the tied estate in
the role of dominant buyer, reinforcing pressure on
brewers. With this established, the existing literature
shall now be examined, and the behaviour of cask ale
brewers shall be introduced.
Chapter 2: Literature review
2.1 Introduction
In researching the canon of literature in the field of beer,
a wide array of approaches and rationales for studying
this topic were highlighted. Some looked at industry
formation and the implications for merger policy, whilst
others looked at whether the good should be taxed for
government revenue purposes. Contemporary reports of
the growth in the U.S. equivalent, craft brewing have
been consulted, which can be used to draw parallels
with the U.K. case. Many articles have highlighted the
importance of advertising in the industry and finally a
number of studies of what factors affect beer demand
are looked at.
These key themes emerged as the best way to analyse
the existing body of literature and serve as a sound way
of establishing a solid platform to base this work on.
The majority of the literature on the subject of beer has
been focussed on the U.S. market. Despite differences
in the history of brewing in the U.K. and .US., the prod-
uct and consumer share broadly similar characteristics
and so analysis of these studies is not in vain. For the
large part, discoveries about general beer demand found
within these texts will be applicable to the understand-
ing of how small U.K. brewers survive. With literature
describing the specifics of the U.S. craft brewing move-
ment, only tentative parallels can be drawn with the
U.K. and so recent independent studies of this market
are called upon to give more colour.
2.2 Determinants of industry set up
Moving then to the first key theme in understanding the
beer market: the determinants of industry set-up. Early
studies placed their attention on what caused industry
concentration.11
In one particular study,12 attempted to establish whether
a rise in industry concentration was beneficial or detri-
mental to the consumer, in doing so determining its
causes. Lynk hypothesised two possible theories for
why concentration may rise, the first being natural mar-
ket evolution of successful firms displacing those that
are less successful. Alternatively, rising concentration
may have arisen through exclusion of small brewers by
larger firms. This was most likely to manifest itself
through regional outlets becoming pressured to sell only
certain brands of beer and, with more might behind
them, the larger brewers hold a credible threat of with-
drawal meaning that smaller brewers would become
forced out. Interestingly, Lynk notes, in reference to the
U.S. beer market, that ‘with trivial exceptions, beer
producers, wholesalers, and retailers are independent
operations’. Certainly before the time of the Monopolies
& Mergers Commission Report of 1989, this was not
the case in the U.K., with deep vertical integration
throughout the industry. As the market has evolved,
stemming from the resulting policies, there is presently
less formal integration within the supply chain and so
the analysis presented by Lynk here becomes more
applicable.
Around this time there was a general thread of study,
which looked indirectly at concentration, to answer how
both large and small firms competed and survived in the
same industry. Caves & Porter hypothesised that, with
the existence of mobility barriers between markets,
groups in the same industry can face different demand
and cost functions.13 This issue was applied to brewing
by Tremblay, analysing the persistence, of both national
Journal of the Brewery History Society42
and local brewers.14 In his study of strategic groups in
the U.S. beer market, Tremblay found that a national
group had been established, implying that smaller brew-
ers were restricted from entering. This theory can be
applied to the UK beer market too, with heterogeneous
products: lager, ales and stouts persisting (albeit in vary-
ing proportions) for the past 50 years.15
Moving to the concentration of the wider beer industry,
Tremblay, Iwasaki, and Tremblay describe how the U.S.
market, as a whole, saw a huge rise in the concentration
of the four largest members, with the CR4 ratio rocket-
ing from 44% in 1970 to 98% in 2003.16 A similar rise
in concentration has been noted in the UK by Slade.17
Honing in on the micro sector of the market requires an
alternative theory. Studies into the movements of firms
in new markets focus on entry, exit and informational
feedbacks.
The area of industry population dynamics is broad and
incorporates many theories. In light of staying pertinent
just a couple of articles shall be mentioned, despite
appreciation of many more threads of research exist-
ing.18
Geroski & Mazzucato and Howarth, Schivardi, &
Woywode in particular present theories of industry
population dynamics, looking generally and then
specifically to the brewing industry.19 Their pattern of
a sudden rise in firm numbers preceding a sharp decline
is certainly relevant to U.K. beer market.
Howarth, Schivardi, & Woywode analyse the U.S.
brewing market and, despite their testing period being
over a hundred years ago the theoretical model offers an
intuitive explanation for characteristics that bear resem-
blance to the U.K. beer micro market today. The logic
follows that uncertain, yet risk-taking entrepreneurs
enter a new market with insufficient information to
know of their venture’s profitability. As profits eventu-
ally rise and this information is relayed to other agents,
they too enter the market. With a flood of new agents
operating in the market, those who were the ‘first
mover’ held the advantage and the firms who delayed
eventually perish; in the brewing study this especially
happened within 1-5 years of entry. The industry
therefore ‘shakes out’ excess numbers and returns to a
sustainable level. Geroski & Mazzucato complete a
similar exercise on the U.S. car making industry, pre-
senting various methods of how to model this, reaching
a similar conclusion.
A further theoretical model that can used to interpret
the U.K. beer market is the Chamberlin model of
monopolistic competition. In industries where non-price
competition exists, there will be excess capacity in each
firm and insufficient productive capacity in the industry,
due largely to under-utilised economies of scale.20
Koutsoyiannis explains the intuition behind this
model.21
Individual firm demand is relatively elastic compared to
industry demand. When competing on price, they will
produce close to the Minimum Efficient Scale, however
if instead the market engages upon non-price competi-
tion then the price in the industry will rise. This is
because firms abandon their individual curves and focus
instead on maximising their market share. As more
firms engage in this, the industry demand curve shifts to
the left, with the optimal point occurring with tangency
to the Long Run Average Cost Curve. At this point,
economies of scale are not maximised and, assuming
free entry to the market, this means that start up firms
can enter and become profitable, despite the relatively
high costs. Consequently there is a rise in market entry,
with high prices and small firms competing on non-
price characteristics.
There are a number of assumptions with this model
which mean it may not be considered wholly applicable,
however there may be a case for suggesting that the
U.K. real ale market exhibits the characteristics put for-
ward in this model. This will be discussed later in [ch.
4.3.2].
2.3 Small brewer literature
From looking at theoretical models, the second theme
focuses purely on the characteristics of beer and, in
particular, smaller brewers. Once again, a large body of
text exists looking at U.S. brewing and for the purpose
of clarification, the comparable US small brewers are
named ‘craft brewers’.
To begin, characteristics of craft beer and brewing are
given, as described in Kleban & Nickerson, to establish
Brewery History Number 158 43
a stronger foothold on what is being discussed.22 Craft
brewers focus on differentiation, deriving their value
through traditional styles of brewing and adding unique
mixes of other flavours. Craft brewers engage in locali-
ty not only on the supply side, but also demand through
involving themselves with the local community and are
generally horizontally differentiated with a limited
amount of substitutes. They compete and differentiate
with normal beers through distinctive taste and superior
quality, this being the main reason for them differentiat-
ing horizontally as competing on price is not possible
due to the extensive economies of scale that larger
brewers can utilise.
Despite similarities in the markets today, the roots of
small-scale brewing, as noted in Datamonitor, are very
different.23 The U.K. had seen a long decline in small
scale brewing since World War II, but then with the start
of the Campaign for Real Ale (CAMRA) and the gov-
ernment introducing the Progressive Beer Duty (P.B.D.)
in 2002, smaller brewers have been stimulated and the
number of total brewers has rocketed from 87 in 1975 to
767 in 2011.24
By contrast, the U.S. has less of a culture of homebrew-
ing in part due to the prohibition era of the 1920s and
1930s. The emergence of craft brewers was borne out of
tiredness with bland, corporate lagers and has followed
a similar explosion in numbers.
Much has been made of the recent upsurge in not only
the number of small brewers in the U.S., but also the
counter-trend rise in demand for craft beers. As
explained in Kleban & Nickerson, beer sales by volume
in 2009 were down 2.2% in general, imported beers
down 9.8%, yet craft beer saw a rise in volume of 4.3%.
In the UK, there has been a trend of cask ale’s share of
the total on-trade beer sold increasing. In 2006 it was
12.4% whereas 2010 it stood at 15.0%, rising each year
as reported by Brown citing B.B.P.A./H.M.R.C. data.25
What are the reasons for this growth in a declining mar-
ket? Carroll & Swaminathan attempt to answer this
directly and echo Peterson that ‘consumers might be
reacting against mass society, its production techniques
and its corporate organisations’.26 & 27 The desire for
consumers to choose local, authentic brewers arises
from interviews that the authors have held with large
brewers.
In a report examining how these larger brewers can cap-
italise on this changing trend, Datamonitor notes how
there has been a move for consumers to opt for ‘less of
the best’ when it comes to craft beer, choosing to ‘trade
up but drink less’.
Another avenue that craft brewers are exploring is the
food and drink market. An industry report noted how
there has been a rise in U.S. restaurants embracing beer
and encouraging customers to match tastes and flavours.
In it, Scarpa includes interviews with restaurateurs
describing how they are seeing differences in consumer
behaviour when it comes to selling beer.28 Craft beer is
benefiting because consumers don’t wish to drink a
bland lager with their meal; one director neatly sum-
marised the situation whereby their wine-orientated
restaurant has gradually begun stocking craft beer: ‘It’s
to the point that the better I make the beer list, the more
beer I sell’.29 Like other restaurants, they have ‘gradu-
ally replaced familiar premium brews with unusual
offerings’. One such owner talks of how ‘people share
them like a bottle of wine’30 whilst another in the indus-
try31 states how consumers have become a lot more
knowledgeable and as such are no longer asking ‘the
difference between lager and ale’ but instead intricacies
between the types of yeast that are used.
This represents an opportunity for craft brewers in the
U.K. too, and there is evidence that a similar movement
has begun32 and the introduction of an accredited Beer
Sommelier Scheme. The area of expanding into restau-
rants is one that real ale brewers can capitalise on as
their main differentiating factor over national lagers is
taste. Due to the idiosyncratic ways of brewing that
allow a plethora of flavours and styles to be brewed,
craft brewers can produce an array of beers that restau-
rants will want to stock to match with their food. Some
have also adopted the ‘brewpub’ format33 where only
beer that is brewed on site is used at the restaurant.
As alluded to earlier, much of the formal analysis on the
U.K. beer market focuses more on the large brewers,
their make-up and control of brands in the industry.
Specifics to the real ale movement most likely come
from industry, or sub-sector publications and so natural-
ly have a slant on portraying their area in a positive
light. Nonetheless, organisations such as CAMRA pro-
vide a wealth of literature cataloguing the real ale trade
which proves invaluable for researchers.
Journal of the Brewery History Society44
2.3 Advertising
Returning to the academic realm, the third theme of
advertising is prominent in studies applied to the brew-
ing industry. Intellectual interest began in earnest in
the U.S. after the introduction of the television and the
newfound ability for brewers to connect beyond their
immediate region.34 Early studies used the post-war era
to analyse these effects, the seminal study being
Greer.35
In the early 1970s, Greer looked at how advertising
expenditure may foster industry concentration. The
logic goes that with increasing returns to scale on adver-
tising expenditure Horowitz & Horowitz larger firms
can maintain greater advertising, in relation to sales,
than smaller firms.36 With this ‘game’ of high advertis-
ing expenditure, firms don’t wish to decrease their
expenditure causing unskilful advertisers out of the
market. This stimulates them to merge with one and
other, increasing industry concentration.
The issue of advertisings’ relevance in determining
industry structure is hotly discussed in an exchange of
articles during the 1980s with Lynk,37 Tremblay,38 and
Lynk.39 After Lynk offered up two hypotheses for caus-
es of high concentration, Tremblay argued that firms’
use of advertising deserved more credit for causing a
rise in concentration. To this, Lynk rebutted that
Tremblay’s analysis may have only served to highlight
that the role of advertising had simply transferred from
retailer to producer, thus explaining why those who
advertised heavily received a higher price per barrel
than those who didn’t.
Scherer40 investigated this area and concluded that a
more important factor in the change in industry concen-
tration is an intensification by market leaders to increase
their industrial capacity, whereas McGahan, in looking
at the causes for U.S. brewing oligopoly, noted that
[large brewers] could no longer rely on capacity constraints to
prevent dissipation of profits through price competition’,
instead the ‘leaders therefore developed national advertising
presences ... [that] would constrain competition.41
Another tangent for the role of advertising in the beer
market is whether it expands the industry as a whole or
just shifts market shares. It is useful to discuss whether
advertising stimulates demand in an industry as a whole,
or whether it just redistributes it between existing firms:
is it predatory or cooperative.
Baker & Bresnahan42 find that advertising doesn’t
affect the overall demand for beer in their study on three
large U.S. brewers, whilst Duffy43 finds a slight positive
effect when investigating the U.K. case. Walsh44 too
finds ‘that beer advertising tends to stimulate beer
consumption albeit partially at the expense of spirits
and wine consumption’, which leads to Nelson45 who
suggests that a substitution effect between different
forms of alcohol advertising may exist, finding that a
reduction in spirit advertising causes a positive, yet sta-
tistically insignificant, increase in beer demand.
We are therefore inconclusive on the effect of advertis-
ing on the overall demand for beer. If we were to take a
positive view on the matter, consistent with Duffy and
Walsh (who both investigated the U.K. market), then
this becomes important for small U.K. brewers. If large
brewers are advertising themselves heavily, then the
whole beer sector benefits at, say, the expense of wine
or spirits. This may have positive externality benefits
for craft brewers as consumers experiment within the
beer sector, boosting their sales.
Whilst these focus on traditional methods of advertising
such as television and radio expenditure, this perhaps
could no longer be sufficient for analysing the effect of
advertising on the brewing industry. Within the litera-
ture it was found that consistently only large national
brewers were being analysed. Studies from Greer46 and
Horowitz & Horowitz47 explain how for brewers to
succeed, high advertising revenue is needed and that
advertising exerts increasing returns to scale. In 2009
SIBA reported, in reference to small UK brewers, an
‘average of 4.5% of turnover is dedicated to the full
range of marketing tools’, compared to a widely
accepted truth it is much higher for large brewers who
advertise worldwide, this highlights how the relevance
of traditional advertising becomes diminished in the
current case.48
Academically, Ling, Lawler, McBain, & Moscardini
note the importance of internet advertising and how this
issue has become particularly relevant for small UK
brewers.49 In looking at industry reports by the Society
for Independent Brewers for 2010 and 2011 the impor-
Brewery History Number 158 45
tance of online marketing becomes apparent. They note
that ‘57% of local brewers now use social networking
(Facebook, Twitter, etc.) as a serious and very efficient
marketing tool’ as well as more directly confirming
this point; both years have ‘website & online’ taking
priority over ‘advertising’ in respondents’ marketing
budgets.50
A consideration of internet advertising and craft brewers
is initiated by Clemons, Gao, & Hitt who look at the role
of websites offering consumers the opportunity to rank
beers that they have tried.51 Although this is not a direct
marketing tool undertaken by small brewers, it
nonetheless demonstrates how consumers of their good
are willing to engage in online activity which is some-
thing many brewers have begun to harness.
2.4 Factors affecting beer demand
Moving to the final theme in this literature review, we
now look at what factors have been considered as
appropriate for analysing beer demand
A useful place to begin is Fogarty as he undertakes a
broad survey of the alcohol demand literature.52 Fogarty
brings together literature spanning over 50 years to
compile a meta-study in the subject matter. This often
aggregated beer studies with those of general alcohol
but nonetheless, some salient points are made which are
worth consideration. It further acted as a portal into a
number of key ideas in the literature.
The first to consider is the possibility of undertaking a
rational addiction hypothesis, akin to Becker &
Murphy.53 Here the authors factor in a demand model
whereby previous consumption of the good promotes
future consumption which continues over time.
However, despite this being arguable for some types
of alcohol, real ale does not appear to carry the same
characteristics.54
Within the literature there is a description of the evolu-
tion of statistical models that have been used. The focus
of this section is not to find the most effective form to
model beer demand, rather to discover an econometric
structure that can adequately answer what changes may
have occurred. Consequently, a thorough analysis of
different statistical methods is unnecessary.
Back to the literature at large, Penm looks at the differ-
ent containers that beer is packaged in and finds that
this has a significant effect on how beer is consumed.55
This would prove a useful exercise when examining
U.K. brewers; however data restrictions render this
inapplicable for the present study. This would have been
possible had the good itself been homogenous and
produced in various containers, say a multinational
lager, however as many small U.K. brewers produce
relatively little, it is understandable that this kind of
analysis must go amiss.
An article that addressed some of the factors that affect
beer demand is Culbertson & Bradford, yet their pri-
mary focus is identifying the causes of price differen-
tials between US states.56 This requires a breadth of
variables to explain the diversity between states. One
such anomaly was that certain states had laws that
entitled consumers to a refund if they returned empty
bottles. During the period of study in my U.K. case, this
law has not been in place. As such this merely con-
tributes to the overall understanding for what should be
considered for analysis on beer demand.
Koksalan, Erkip, & Moskowitz discuss the Turkish
market.57 With motivation from private brewers they try
and discover a host of factors affecting beer demand.
The model has benefits as it took a commercial point
of view, confirming accuracy of data and adopting a
combination of academic and practitioner opinion. This
contrasts with Ogwang & Cho who instead are moti-
vated by advising the government on how to curtail
alcoholic consumption of these beverages.58 However,
included in the Koksalan, Erkip, & Moskowitz model
are variables that are irrelevant for a U.K. model: cli-
mate, tourism, and the month of Ramadan. The Turkish
market is therefore somewhat incomparable with the
U.K. small brewing industry, although once again it
added to the overall picture of beer demand.
Of the studies analysed, Hausman, Leonard, & Zona
displayed desirable properties for a model of U.K.
beer.59 Their approach to the demand for differentiated
products and their elasticities allows for multiple
product types, akin to lager, ale, stout etc. Whilst this
would prove to be of interest, data restrictions on the
U.K. case prevent this from being a viable avenue of
study for the time being. This is further discussed in [ch.
3.9].
Journal of the Brewery History Society46
Abbott, Lawler, & Ling provide a long term demand
function for beer in the U.K. market.60 Using the three
factors of real disposable income, price index for beer
relative to all other goods and a price index for beer rel-
ative to other alcoholic substitutes, the authors run a
time series for the U.K. beer market between 1984Q1
and 1994Q1.
During the period of this analysis, craft brewing saw the
continuation of its renaissance in the U.K. With the sub-
sequent explosion of new small brewers, this presents
itself as an ideal opportunity to compare the results of
Abbott, Lawler, & Ling with updated data and measure
what affect, if any, the craft sector has had on the U.K.
Beer Market.
This is the most appropriate method to use as a baseline
from which to measure the current beer market as it con-
tains what the literature has shown to be the three most
significant variables that affect the demand for beer.
Their analysis was on the U.K., meaning that any cross-
country factors need not be considered. Further they
consider the aggregate output of beer, rather than a nar-
rower focus on, say, the container that it is consumed,
meaning data comparison can be much more accurate.
2.5 Summary
To conclude this chapter, a number of pertinent points
have been extracted from the current body of literature.
The U.K. beer market could be applied to Chamberlin’s
model of monopolistic competition, the small brewer
sub-sector may display further similarities with U.S.
craft scene, and an appropriate method for modelling
the long run demand has been found in Abbot, Lawler,
& Ling. Greater certainty on these issues is developed in
[ch. 4.3.2].
Chapter 3: Data analysis
3.1 Summary
This chapter serves to give a brief overview of the data
analysis section of the study. For a fuller explanation of
the steps of the statistical regression, as well as how data
from primary and secondary sources were gathered,
refer to Appendix 4
After discussion in [ch. 2.4] the functional form, or type
of equation, used to examine the demand for beer is the
double-log method. This has the benefits of being con-
sistent with the existing literature, and a having simple
interpretation.
The data used is also consistent with previous studies,
and from reliable sources, allowing a robust comparison
to be made.
The main issue that need to be considered in terms of
how the data behaves is a known as stationarity. In the
example of beer, the levels of each variable (quantity of
output, income, price of beer, and price of substitutes)
are taken at the end of each quarter in a given year.
Stationarity tests whether there are any changes that
may occur due to, say, seasonality, that won’t be picked
up in changes in the variables.
For example, in the fourth quarter of every year, the
level of beer output may increase because of a surge in
Christmas sales.
In statistical terms, this wouldn’t be because of a change
in any of the inputs (the price of income doesn’t rise in
Q4 meaning more people buy beer, say) and therefore
will be a result of an independent factor.
A number of statistical processes are undertaken to
test for the presence of this stationarity, and also
deeper complexities that are required to give the model
rigour. The resultant equation passes these tests allow-
ing the model to be interpreted free of statistical
apprehension.
The Long Run model for Beer Demand in the U.K. can
be interpreted as:
Q = 2.26769LY - 4.57367LPb + 0.80701LPs
Chapter 4: Results
4.1 Introduction
This chapter interprets the statistical results of the
updated U.K. beer market model and places it within
the existing body of literature. Further, it absorbs the
additional data that has been collated, and presents the
Brewery History Number 158 47
findings in the context of the existing Chamberlin
model (explanation is given in section 4.4). When dis-
cussing the implications for the U.K. beer market,
analysis of large brewers isn’t considered; instead focus
is drawn to the small, cask ale brewers which this paper
set out to explore.
Translating the Long Run model we have just found, we
are able to say that: for a 1% percentage in income, the
quantity of beer demanded will increase by 2.27%,
holding other variables constant.
A 1% percentage increase in the price of beer compared
to all other goods will cause a decrease in the quantity
of beer demanded by 4.57%, and a 1% percentage
increase in the price of beer compared to all other goods
will cause a decrease in the quantity of beer demanded
by 0.81%. In all these cases, other factors must be held
constant.
The percentage change of income, the price of beer, and
the price of substitutes can also be termed as elasticities.
In this instance, the percentage change is relative to the
quantity demanded, and therefore is referred to as the
elasticity of demand.
4.2 Discussion of results
It is necessary to compare this finding with what is
already present in the current literature.
Due to the way that the equation has been set up, (i.e. a
double-log model), the coefficients of the variables can
be interpreted as the elasticity of demand.
Elasticity of demand
The elasticity of a product, in this example, means how
sensitive the input is (i.e. income, price of beer or price
of substitute goods) is to the level of output (volume of
beer). The level of elasticity is always measured in
absolute terms.
A product is said to have a higher elasticity of demand
if the coefficient is greater than one. In the case of the
U.K. beer market, this is income and price of beer. What
this means is that if, say, income increases by 1%, the
resultant change in quantity of beer is more than 1%.
The relationship of each variable with the level of quan-
tity demanded is known as an elasticity of demand. This
is income, own-price, and cross-price, and measures the
percentage change in income, the price of beer and the
price of substitutes respectively.
Each of the variables will be discussed in greater length
in the subsequent sections.
When interpreting these results, the existing literature
will be consulted for markers on the appropriateness of
the findings, but also to support some of the implica-
tions. Beyond this, the viewpoints gathered from the
primary data collection will give further credibility to
discussion.
4.2.1 Income elasticity
The question of whether beer is a normal good is the
most contentious of the three variables, in the literature.
A normal good is one where, as the level of income in
the economy rises, the quantity of the good demanded
increases. In terms of elasticity, it is represented by a
positive sign.
Earlier in [ch. 2.1], it was accepted that the consumer
habits of beer drinkers internationally61 were largely
the same. As such, it is suitable to compare studies that
have been undertaken in these countries, to broaden the
scope of potential sources.
Studies throughout the literature yield no definite
conclusion on what effect income has on the quantity of
beer sold; for example Hogarty & Elzinga62 examined
the U.S. demand between 1956-9 whilst Clements &
Johnson studied Australia between 1955-77.63 Both
found beer to be a normal good, with income elasticities
of 0.59 and 0.80, respectively.
Studying the U.K. from 1956-75, McGuinness con-
cluded that he must ‘accept a result which implies that
the effect of income on consumption is not significantly
different from zero’.64 Similarly, Ornstein & Hanssens
find that ‘income is unrelated to beer consumption’.65
However, their research in the U.S. includes variables
such as the state’s religion and also its legal drinking age
which are unnecessary in the U.K. case.
Journal of the Brewery History Society48
Finally, there have been some studies that concluded
beer to be an inferior good. An inferior good is one
where, as the level of income in the economy rises, the
quantity of the good demanded decreases. In terms of
elasticity, it is represented by a negative sign.
Between 1974-80 Lynk found in the 38 U.S. states, the
income elasticity to be negative.66 Further, Tremblay,
using pooled data from 1950-77 stated: ‘Results here
imply that beer is an inferior good’, whilst also noting
that ‘this may not be true of particular brands’.67 This is
an issue that will be discussed in [ch. 4.3.2].
4.2.2 Own-price elasticity
In keeping with economic theory, the sign of elasticity
for beer is negative. Where this differs from the majori-
ty of other studies is that it implies that beer is an elas-
tic good; it’s measure of elasticity is -4.57 (i.e. absolute
number is greater than 1).
When examining the existing literature, a number of
different values for the own-price elasticity were found.
These findings have been taken solely from the U.K.,
which will arguably increase the relevance and compa-
rability with the present study.
Three main studies were completed during the 25 years
from the mid-1950s to the late-1970s. Walsh,68
McGuinness,69 and Godfrey70 found the own-price
elasticities to be -0.13, -0.30 and -0.14, respectively.
This clearly points to beer displaying the characteristics
of an inelastic good, whereby a large change in its price
is required for a change in the quantity demanded.
More recently however, Abbott, Lawler, & Ling71 and
Moosa & Baxter72 have found beer in the U.K. to be an
elastic good. It would seem that the current results fit
with this more up-to-date trend.
4.2.3 Cross-price elasticity
There are a few issues that need to be considered when
assessing the cross-price elasticity of demand for beer.
Firstly, and most simply, which goods should be consid-
ered as a potential substitute? The literature has come to
a consensus that the three, core alcoholic groups can be
summarised as beer, wine and spirits. Some studies that
analysed the demand for alcohol often grouped these
together as one commodity, for example McGuinness
implicitly making all three substitutes with one and
other.73 Others, such as Duffy reported the groups indi-
vidually and found beer to be a substitute with wine and
spirits individually.74 Johnson & Oksanen too report a
regression and find wine to have an elasticity of -0.121
and spirits at -0.042.75 Heien & Pompelli find beer to
have own-price elasticity of -0.84, -0.21 with wine and
-0.09 with spirits.76
Many of these studies have focussed on the demand for
alcohol as a whole and as such present beer, wine and
spirits as individual variables. However, with the pres-
ent task being to model what changes may have
occurred in the long run demand for beer, it is in keep-
ing with Abbott, Lawler, & Ling that wine and spirits
are grouped together as the substitutes for beer.77
Further, when assimilating data, the O.N.S. provided an
index for ‘alcoholic drinks: wines & spirits’ indicating
that it is appropriate to group these goods together.
4.3 General implications
From these results, a number of implications can be
drawn.
4.3.1 Implications of relationship with income
Firstly, that beer can now be considered, economically
speaking, as a ‘luxury good’. This merely indicates that,
unlike previous studies, it has been found that income is
now a large determinant on how much beer is demanded,
whereas before other factors accounted for its volume.
4.3.2 Implications of relationship with substitutes
The second main point to take away from this is how
beer has become a much more elastic good since the
three studies by Walsh, McGuinness and Godfrey. There
are a number of reasons why this is the case. For this
sub-section, it was chosen to look beyond economic
studies into reasons for the decline in beer demand,
utilising the sociology literature. This captured an inter-
pretive, qualitative perspective which supported the
Brewery History Number 158 49
existing, more objective and quantitative sources that
have been used.
Firstly, there has been much written about the core beer
drinker originating from a traditional, heavy-industry
community and how the two have seen a decline togeth-
er Gofton.78 With the erosion of labour intensive
employment, especially in the North of England, the
working class labourer no longer regularly frequented
the public house to consume his beer. Indeed, ‘Beer
drinking and the public house fitted into the discipline
of industrial work’.79
There was also a change in the consumer profile of pub-
lic house operated for. As pubs began to open their
doors to a wider audience, the variety of alcohol that
they offered broadened too. Mintel writes of ‘a gradual
replacement of this mixed-age, single-sex customer
base ... leading to a growing differentiation of the alco-
hol market’.80
Measham & Brain view this transformation from drink-
ing beer to other alcohol types as a move from ‘an
industrial to a post-industrial order’.81 Though viewed
from a slightly different perspective they highlight a few
key reasons for the decline in beer drinking and rise in
popularity of other drinks. Firstly, ‘alcohol became
recommodified’, introducing a new era of ‘high strength
bottled beers, ciders, lagers and fortified wines’, ‘ready-
to-drink spirit and mixers (R.T.D.s)’, ‘flavoured alco-
holic beverages (F.A.B.s)’ and later ‘“buzz” drinks con-
taining legal stimulants such as caffeine or guarana’.
Secondly, wine and beer became up to 50% stronger to
compete in the ‘pyschoactive market’.82 Thirdly, alco-
hol was advertised as a lifestyle marker to appeal to
market niches, again moving away from traditional beer
drinking. And finally, there was an overhaul of the
establishments that alcohol was consumed in, with an
increase in cafe bars and other alternatives. This was
coined the ‘On Trade revolution’.
This all provides a picture of the changing scene of alco-
hol consumption in the U.K. The traditional, insulated
safe-haven of the public house and the beer-drinking
male meant that beer, with at the time relatively few
substitutes, behaved as an inelastic good. Once these
doors were prised open, an influx of new drinks and
new drinkers bombarded the established routine. With a
rise in substitute goods and a decline in the core con-
sumer, beer could no longer claim to sit on a pedestal
and had to survive in a much more competitive market.
This inevitably led to it having a much higher own-price
elasticity of demand than before.
Having assessed the varied reasons for the increase in
beer market competitiveness, it is time apply these find-
ings to a theoretical model. As mentioned in [ch. 2.2],
the current standing of the U.K. beer market will be
analysed in the context of Chamberlin’s model of
monopolistic competition to assess how applicable it is.
4.4 Chamberlin’s model
4.4.1 Characteristics
The characteristics of the model are laid out by Hart83 to
feature:
1. Many firms producing differentiated commodities
2. Each firm is negligible, in that it can ignore its
impact on, and hence reactions from, other firms
3. Free entry leads to zero profit of operating firms
4. Each firm faces a downward-sloping demand curve
and hence equilibrium price exceeds marginal cost
The U.K. beer market will be assessed to see how well
it fits this model, with particular attention to small brew-
ers; the focus of this study.
Firstly, it is clear that the beer market is characterised by
many firms producing differentiated goods. With the
number of breweries in the U.K. having risen to 767 by
2011, this represents a high degree of differentiating
potential, especially as craft brewers aim to produce
diverse array of beer with a different flavours. As noted
by the SIBA report of 2011 there was ‘the possibility
that 6,000 different cask beers were produced last year’
compared with 304 35 years ago.
Secondly, certainly in terms of smaller brewers, their
influence on each other will be minimal. Each brewer
will be trying to produce as much as possible to sell to
the market and won’t be in a position to exert meaning-
ful influence over their competitors.
Lastly, it is more than plausible to see cask ale brewers
making a small, if negligible, profit from the beer they
Journal of the Brewery History Society50
produce. Larger brewers in the U.K. market: Heineken
N.V., Molson Coors Brewing Company and Anheuser-
Busch InBev, will not meet the second and third criteria
as they operate on such large scales that the effect of
their output decisions is greater than negligible. Further,
their profits are in thousands of millions.84
Heflebower asserts that ‘Chamberlin concluded that
where entry is easy the number of sellers of a good
would be enhanced by non-price competition’.85 It has
already been established that the introduction of
Progressive Beer Duties eased the entry of small brew-
ers into the market and led to a subsequent influx of new
firms. The increase in number of different brews is also
indicative of a rise in non-price competition.
It has therefore been established that the market for
small brewers has met the Chamberlin specification,
the next section will look at how this will affect the sub-
sector.
4.4.2 Implications
One of the major implications of the theory is that
excess capacity will occur. This issue is considered
important for its welfare implications, however this is
not the setting to rekindle the debate, merely check its
applicability. It is agreed that large brewers can produce
beer for less than cask ale brewers can. Simple logic
would suggest that if these assets were pooled and
utilised, then output of beer would increase in the mar-
ket, implying that excess capacity exists. Further, in
response to survey question on how ‘Total Costs would
be affected if production increased 50%’ all the
responses were less than 50%, pointing to the minimum
efficient scale not being met. One respondent even
answered ‘Fixed costs will stay the same as we have
enough capacity to absorb this’.
4.5 Large brewer involvement
A sequential question to ask from this then, is why don’t
large brewers exploit their economies of scale, produce
cask ale cheaper than smaller brewers and earn the prof-
its for themselves? Drawing on various sources to help
answer this, it becomes apparent that it would be very
difficult for a large U.K. brewer to succeed. As men-
tioned in the [ch. 2.3] Carroll & Swaminathan try to
ascertain the reasons for the U.S. microbrewery
revival.86 In doing so, they document the response from
mass producers to the resurgence in small brewing and
despite only paying attention to the U.S., their rationale
will still be applicable to the U.K. case. They note that,
‘Despite their vast resources and immeasurable techni-
cal expertise, these efforts have, for the most part, been
met with limited success’.
One of the key reasons for this is that consumers of
craft-style beer display animosity towards mass produc-
ers. They further raise the question of why consumers
decide ‘to purchase on the basis of organisational form
identity rather than product characteristics’ drawing
upon a study that found that these consumers ‘think that
all [products brewed by a particular brewery] taste the
same, and [their] mind is closed’.87
That drinkers won’t purchase from a brewer because
of their size therefore presents itself as a commercial
barrier to entry into the cask ale market. From an oper-
ational perspective, the two brewers interviewed for this
paper both held the opinion that cask ale can’t be suc-
cessfully brewed by mass producers and when asked
about this, they responded: ‘I don’t think they can do it,
I think they’re too big. It’s like the Titanic, it can’t move
quickly can it. Whereas we can duck and dive, we can
be very reactive’ (Brewer 1). Further, ‘They do say that
when a brewery gets big, the quality changes. And it
does’ before explaining how beer brewed on a large
scale has, to some extent, lack flavour in order that it is
‘offensive to nobody’ (Brewer 2).
Moving then under the premise that it is only small
brewers participating in the cask ale market,
Chamberlin’s theory is now consulted to assess whether
the present situation is in an equilibrium state, or
whether the market will adjust to exploit these ineffi-
ciencies. These adjustments manifest themselves
through firms leaving the market, in a similar fashion to
the ‘shake out’ described by Howarth, Schivardi, &
Woywode in [ch 2.2].88 Chamberlin’s opinion on this is
provided by Ireland in that ‘too many firms each supply
too little output’ and that ‘a rise in costs tends to squeeze
out some firms and reduces this problem’.89
It is likely that input costs will rise which would imply
that the number of firms in the market will fall.
Brewery History Number 158 51
Supporting this case is one craft brewer whom I inter-
viewed who described his view on whether having more
entrants is sustainable as follows ‘there’s got to be a
limit, the bubble’s going to burst’. In more detail he
explained, ‘the market’s still quite small, only so many
pubs in the area can have our beer ... if there are more
breweries and somebody else is on the bar - we’re not’.
When describing the present outlook for cask ale pro-
ducers, (Brewer 2) summated the competitive nature as:
‘we’re in a special niche market, but we’re competing
now because there are a lot of up and coming breweries
that are just starting to do the same thing’.
4.6 Strategies adopted by cask ale brewers
The different strategies that have been adopted by these
small brewers to survive in the marketplace shall now
be discussed.
Mainly direct sources were utilised in order to fully
appreciate the intricacies of small brewer operations,
described in [ch. 3.10] rather than rely on general
strategies that may be reported in the academic litera-
ture.
One of the key themes that emerged, beyond focusing
on quality, was brewers associating themselves within
their local region. On the survey question on how small
brewers differentiated themselves, the responses gained
included: ‘Locality, provenance and customer service’,
‘Local orientation, such as beers named after old
Wiltshire dialect’, ‘Quality of our beers’ and ‘Local
products & good service’.
This aligns with Peterson that consumers wish to kick
back against mass society.90 Further, this fits into the
‘New Villagers’ movement highlighted by Brown
whereby consumers are beginning to actively support
their local economies.91 Other ways of doing this have
been through promoting brewery tours to get people
interested locally (Brewer 2).
In terms of marketing, the 2011 SIBA report highlights
the extent to which small brewers have utilised social
media: ‘57% of local brewers now use social net-
working (Facebook, Twitter, etc.) as a serious and very
efficient marketing tool - not far off double the 32%
reported in last year’s survey’. This provides them with
a platform to connect with more consumers.
On innovation and development of new products there
is no definitive consensus. (Brewer 2) talks about the
flood of new styles being adopted in America and how
they ‘are actually starting to do a lot more in that vein’,
whereas (Brewer 1) instead focuses more on brand
building of their existing brews. Many of the responses
in the survey alluded to periodically brewing different
seasonal beers.
Brewers large and small try to reach out and tap into
new markets. It is well documented that attracting
women to beer would be profitable and hasn’t been
done yet,92 with some brewers actively engaging in
female-orientated marketing events.93 Another area that
has been explored is associating with restaurants and
matching food with beer, comparable with the move-
ment that has occurred in the U.S., cited in [ch 2.3].
4.7 Interaction with industry groups
This is not necessarily a differentiating factor, yet still
an important consideration in small brewer survival.
Organisations CAMRA and SIBA have established
themselves as lobbyists for the beer industry with the
BBPA reporting how both continue to fight for the
preservation of P.B.D.’s, something that will affect
small brewers immensely.94 Though there is the possi-
bility of positive bias in their results, in 2011 SIBA
reported that from their annual survey, 81% of respon-
dents believe that ‘[P.B.D.’s] permanent retention is
essential to my business’.
Through their lobbying, SIBA and CAMRA look to pro-
mote the best interests of small brewers on a national
level. Whilst control over differentiating from rivals,
product innovation and quality measures can be mostly
achieved through the decisions that the firm makes
itself, this highlights how powerless most brewers are
to changes that happen at a national level.
Though not possible to quantify, it should be remem-
bered that a large part of the survival of cask ale brew-
ers remains out of their control. If legislation, such as an
abolition of P.B.D.’s, is introduced then the evidence
would suggest that the survival of small brewers is in
peril, regardless of whether they implement the strate-
gies mentioned above.
Journal of the Brewery History Society52
4.8 Summary
This chapter has found that the wider demand for beer
has become much more sensitive to both income and its
own-price as a result of a decline in traditional beer
drinkers and an explosion of alternative products acting
as substitutes. This shows how beer as a commodity is
now operating in a fiercely competitive market and that
its volume has been steadily declining.
Within this setting, cask ale has seen a revival, both in
consumer demand and entrants to the market. It has
been established that, for now at least, the provision of
real ale is reserved for small brewers, however with a
huge increase in the number of breweries opening this
has led to heightened competition to supply the market.
As a result, a number of innovative techniques have
been employed to ensure route to market.
The looming threat of P.B.D. removal casts further
doubt on small brewers’ survivorship which may uni-
formly raise costs and wipe out a large portion of the
market. Organisations SIBA and CAMRA have strived
to mitigate these implementations, however prediction
on legislation outcome should be left to the fool-
hardy.
Chapter 5: Conclusion
This dissertation has looked to answer how UK small
brewers survive in the context of an evolving market for
beer.
Small brewers have reacted to being in a much more
competitive market through product innovation and tap-
ping into a revived consumer interest in localism.
Establishing this differentiation has involved approach-
ing new markets that mass produced beer has struggled
to conquer.
Cask ale brewers in the U.K. rely heavily on P.B.D.’s. If
removed, it is foreseeable that the majority of the sub-
sector would perish.
This paper has presented an up-to-date model for the
long run demand for beer in the UK, which has found
beer to be a much more elastic good than previously
found. This is has been supported by qualitative find-
ings also. Further, it has displayed strategies that small
brewers have adopted in order to survive.
The research has shortcomings in that more primary
data could have been gathered to enrich the analysis
undertaken. The main constraint with the lack of brew-
er response was time; these are often small operations
who cannot afford the hours to devote to academic
research.
It summation it seems that despite the glamour associat-
ed with owning a small brewery, the U.K. beer market
is a tough one for brewers to survive in.
Acknowledgements
I would thoroughly thank my supervisor Dr Kevin Lawler for
his insatiable interest in this topic and for his continual support
and guidance throughout this study.
Thanks also go to Brewer 1 (Purity Brewing) and Brewer 2
(The Durham Brewery) for their invaluable insight of how a
small brewer operates.
References
1. (Monopolies and Mergers Commission, 1989), referred
here as The Supply of Beer.
2. ibid.
3. Slade, M. (2010) ‘Competition policy towards brewing’.
In J. Swinnen (ed.), The Economics of Beer. Oxford: Oxford
University Press.
4. Porter, M.E. (2008) ‘The Five Competitive Forces that
shape strategy’. Harvard Business Review. pp.78-93.
5. The Independent. (25/02/1994). Bass in joint venture with
Grolsch for distribution. Retrieved 03/03/2012 from:
http://www.independent.co.uk/news/business/bass-in-joint-
venture-with-grolsch-for-distribution-1396350.html
6. Vrontis, D. (1988). ‘Strategic assessment: the importance
of branding in the European beer market’. British Food
Journal. pp.76-84.
7. Datamonitor (2010) Beer in the United Kingdom. London:
Datamonitor.
8. The Supply of Beer.
9. Slade, M. (2010) op. cit.
10. Lawler, K. & Lee, K.-P. (2003) ‘Brewing’. In P. Johnson
(ed.), Industries in Europe Competition, Trends and Policy
Brewery History Number 158 53
Issues. Cheltenham: Edward Elgar Publishing Limited.
11. Horowitz, I. & Horowitz, A.R. (1969) ‘Concentration,
competition, and mergers in brewing’. In J.F. Weston & S.
Peltzman (eds.), Public Policy Toward Mergers. Cambridge,
MA: Goodyear Publishing Co.; Greer, D.F. (1971) ‘Product
differentiation and concentration in the brewing industry’. The
Journal of Industrial Economics. pp.201-219; Greer, D.F.
(1981) ‘The causes of concentration in the US brewing
industry’. Quarterly Review of Economics and Business.
pp.87-106; and Hawkins, K. & Radcliffe, R. (1971)
‘Competition in the brewing Industry’. Journal of Industrial
Economics. pp.20-41. The latter focuses on the UK industry.
12. Lynk, W.J. (1984) ‘Interpretting rising concentration: the
case of beer’. The Journal of Business. pp.43-55.
13. Caves, R.E. & Porter, M.E. (1977) ‘From entry barriers
to mobility barriers: conjectural decisions and contrived
deterrence to new competiton’. The Quarterly Journal of
Economics. pp.241-262.
14. Trembley, V.J. (1985a) ‘A Reappraisal of Interpreting
Rising Concentration: The Case of Beer’, Journal of
Business. 58, 4, October, pp.419-431.
15. A recent report by Datamonitor (op. cit.) had
segmentation as: Standard lager 40.4%, Premium lager
35.7%, Ales, stouts and bitters 12.8%, Speciality beer 9.1%
and Low/no alcohol beer 2.0% showing the survival of cer-
tain sub-sectors.
16. Tremblay, V.J., Iwasaki, N. & Tremblay, C.H. (2005)
‘The dynamics of industry concentration for U.S. micro and
macro brewers’. Review of Industrial Organization. pp.307-
324.
17. Slade, M. (2004) ‘Market power and joint dominance in
UK brewing’. Journal of Industrial Economics. pp.133-163.
18. For example: Jovanovic, B., & MacDonald, G. (1994).
‘The life cycle of a competitive industry’. Journal of Political
Economy. pp.322-347; and Klepper, S. (1996) ‘Entry, exit,
growth and innovation over the product life cycle’. American
Economic Review. pp.562-583.
19. Geroski, P. & Mazzucato, M. (2001) ‘Modelling the
dynamics of industry populations’. International Journal of
Industrial Organization. pp.1003-1022; and Howarth, M.,
Schivardi, F. & Woywode, M. (2001) ‘On industry life-cycles:
delay, entry, and shakeout in beer brewing’. International
Journal of Industrial Organization. pp.1023-1052.
20. Chamberlin, E. (1933) The Theory of Monopolistic
Competition. Cambridge, Mass.: Harvard University Press.
21. Koutsoyiannis, A. (1979) Modern Microeconomics (2nd
ed.). Hong Kong: Macmillan Publishers Ltd.
22. Kleban, J. & Nickerson, I. (2011) The U.S. Craft Brew
Industry. Allied Academies International Conference.
Orlando: Dreamcatchers Group, LLC.
23. Datamonitor (2010) op. cit.
24. SIBA (2010) Local Brewing Report 2010. Burton-on-
Trent: Society of Independent Brewers; and SIBA (2011)
Local Beer: Brewing Industry Report. Burton-upon-Trent:
SIBA, Society of Independent Brewers.
25. Brown, P. (2011) The Cask Report 2011-12.
26. Carroll, G.R., & Swaminathan, A. (2000) ‘Why the
microbrewery movement? Organizational dynamics of
resource partitioning in the U.S.’ American Journal of
Sociology. pp.715-762.
27. Peterson, R. (1997) Creating Country Music:
Fabricating Authenticity. Chicago: University of Chicago
Press.
28. Scarpa, J. (23-30/11/2009). ‘Liquid assets: restaurant
owners tap craft beer’s profitable power’. Nation’s Restaurant
News. pp.1-26.
29. W. Craig Cooper, Wine Director at Pops For
Champagne, Chicago.
30. Brian McKeaney, co-owner Rush Street, Culver City,
California.
31. Rich Higgins, craft brewer and restaurant beer consultant
in San Francisco.
32. Thatchers Beer Blog. (19/02/2011). ‘Whats better with
food, beer or wine? Only one way to find out ...’ Retrieved
26/01/2012 from ThatchersBeerBlog: http://thatchers-
beerblog.wordpress.com/2011/02/19/adnams-beer-vs-forrest-
estate-wine-food-matching-evening/
33. Zerodegree microbrewery and restaurant, etc.
34. George, L. (2009) ‘National television and the market
for local products: the case of beer’. The Journal of Industrial
Economics. pp.85-112.
35. Greer, D.F. (1971) ‘Product differentiation and
concentration in the brewing industry’. The Journal of
Industrial Economics. pp.201-219.
36. Horowitz, I. & Horowitz, A.R. (1969) op. cit.
37. Lynk, W.J. (1984) op. cit.
38. Trembley, V.J. (1985a) op.cit.
39. Lynk, W.J. (1985) ‘The price and output of beer revisit-
ed. Journal of Business. pp.433-437.
40. Scherer, F.M. (1996). Industry Structure, Strategy, and
Public Policy. New York: HarperCollins.
41. McGahan, A.M. (1991) ‘The emergence of the national
brewing oligopoly: competition in the American market,
1933-1958’. Business History Review. pp.229-284.
42. Baker, J.B., & Bresnahan, T.F. (1985) ‘The gains from
merger or collusion in product-differentiated industries’.
Journal of Industrial Economics. pp.427-44.
43. Duffy, M. (1983) ‘The demand for alcoholic drink in the
Journal of the Brewery History Society54
United Kingdom, 1963-78’. Applied Economics. pp.125-40.
44. Walsh, B.M. (1982) ‘The demand for alcohol in the
U.K.: a comment’. Journal of Industrial Economics. pp.439-
446.
45. Nelson, J.P. (2003) ‘Advertising bans, monopoly, and
alcohol demand: testing for substitution effects using State
Panel Data’. Review of Industrial Organization. pp.1-25.
46. Greer, D.F. (1971) op. cit.
47. Horowitz, I. & Horowitz, A.R. (1969) op. cit.
48. SIBA (2009) Local Brewing Report 2009. Burton-on-
Trent: Society of Independent Brewers.
49. Ling, M., Lawler, K., McBain, N. & Moscardini, A.
(1999) ‘Economics of advertising: Emerging functions of
Internet advertising’. Netnomics. pp.127-136.
50. SIBA (2011) op. cit.
51. Clemons, E.K., Gao, G. & Hitt, L. (2006) ‘When online
reviews meet hyperdifferentiation: a study of the craft beer
industry’. Journal of Management Information Systems.
pp.149-171.
52. Fogarty, J. (2010) ‘The demand for beers, wines and
spirits: a survey of the literature. Journal of Economic
Surveys. pp.428-478.
53. Becker, G. & Murphy, K. (1988) ‘A rational theory of
addiction’. Journal of Political Economy. pp.675-700.
54. Brown, P. (2011) op. cit.
55. Penm, J. (1988) ‘An econometric study of the demand
for bottled, canned and bulk beer’. Economic Record. pp.268-
275.
56. Culbertson, W.P. & Bradford, D. (1991) ‘The price of
beer: some evidence from interstate comparisons’.
International Journal of Industrial Organization. pp.275-289.
57. Koksalan, M., Erkip, N. & Moskowitz, H. (1999)
‘Explaining beer demand: a residual modeling regression
approach using statistical process control’. International
Journal of Production Economics. pp.265-276.
58. Ogwang, T. & Cho, D. (2009) ‘Economic determinants
of the consumption of alcoholic beverages in Canada: a panel
data analysis’. Empirical Economics. pp.599-613.
59. Hausman, J., Leonard, G. & Zona, J.D. (1994)
‘Competitive analysis with differentiated products’. Annales
d'Economie et de Statistique. pp.159-180.
60. Abbott, A.J., Lawler, K.A., & Ling, M. (1998) ‘An
empirical analysis ofthe effects of the Monopolies and
Mergers Commission Beer Orders (1989) on the UK brewing
industry’. Applied Economics. pp.145-149.
61. Or perhaps former British Colonies would be more
appropriate.
62. Hogarty, T.F. & Elzinga, K.G. (1972) ‘The demand for
beer’. Review of Economics and Statistics. pp.195-8.
63. Clements, K.W. & Johnson, L.W. (1983) ‘The demand
for beer, wine, and spirits: a systemwide analysis’. Journal of
Business. pp.273-304.
64. McGuinness, T. (1980) ‘An econometric analysis of total
demand for alcoholic beverages in the UK: 1956-75’. Journal
of Industrial Economics. pp.85-109.
65. Ornstein, S.I. & Hanssens, D.M. (1985) ‘Alcohol control
laws and the consumption of distilled spirits and beer’.
Journal of Consumer Research. pp.200-13.
66. Lynk, W.J. (1984) op. cit.
67. Trembley, V.J. (1985b) ‘Strategic Groups and the
Demand for Beer’, Journal of Industrial Economics. 34, 2,
December. pp.183-198.
68. Walsh, B.M. (1982) op. cit.
69. McGuinness, T. (1983) ‘The demand for beer, spirits and
wine in the UK: 1956-1979’. In M. Grant, M. Plant, & A.
Williams (eds.), Economics and Alcohol. London: Croom
Helm.
70. Godfrey, C. (1988) ‘Licensing and the demand for
alcohol’. Applied Economics. pp.1541-1558.
71. Abbott, A.J., Lawler, K.A., & Ling, M. (1998) op. cit.
72. Moosa, I.A., & Baxter, J.L. (2002) ‘Modelling the trend
and seasonals within an AIDS model of the demand for
alcoholic beverages in the United Kingdom’. Journal of
Applied Econometrics. pp.95-106.
73. McGuinness, T. (1983) op. cit.
74. Duffy, M. (1981) ‘The influence of prices, consumer
incomes and advertising upon the demand for alcoholic drink
in the United Kingdom: an econometric study’. British
Journal on Alcohol and Alcoholism. pp.200-209.
75. Johnson, J.A. & Oksanen, E.H. (1977) ‘Estimation of
demand for alcoholic beverages in Canada from pooled time
series and cross sections’. The Review of Economics and
Statistics. pp.113-118.
76. Heien, D. & Pompelli, G. (1989) ‘The demand for
alcoholic beverages: economic and demographic effects’.
Southern Economic Journal. pp.759-770.
77. Abbott, A.J., Lawler, K.A., & Ling, M. (1998) op. cit.
78. Gofton, L. (1990) ‘On the town: drink and the “New
Lawlessness”’. Youth and Society. pp.33-9.
79. Coffield, F. & Gofton, L. (1994) Drugs and Young
People. London: Institute for Public Policy Research.
80. Mintel. (1988) The On Trade Revolution: The Brewing
Industry Response to Change. Mintel Publications Limited.
81. Measham, F. & Brain, K. (2005) ‘“Binge” drinking,
British alcohol policy and the new culture of intoxication’.
Crime Media Culture: An International Journal. pp.262-283.
82. Measham & Brain note that the alcohol industry reacted
in kind to the normalisation of recreational drug use during
Brewery History Number 158 55
1990s.
83. Hart, O.D. (1985) ‘Monopolistic competition in the spirit
of Chamberlin: a general model’. Review of Economic
Studies. pp.529-546.
84. Datamonitor (2010) op. cit.
85. Heflebower, R.B. (1967) ‘The theory and effects of
nonprice competition’. In R.E. Kuenne (ed.) Monopolistic
Competition Theory: Studies in Impact. United States of
America: John Wiley & Sons, Inc.
86. Carroll, G.R., & Swaminathan, A. (2000) op. cit.
87. Quoted in Van Munching, P. (1997) Beer Blast: The
Inside Stories of the Brewing Industry’s Bizarre Battles for
Your Money. New York: Random House. p.247.
88. Howarth, M., Schivardi, F. & Woywode, M. (2001)
op.cit.
89. Ireland, N.J. (1987) Product Differentiation and
Non-Price Competition. Padstow, Cornwall: Unicus Graphics
Ltd.
90. Peterson, R. (1997) op. cit.
91. Brown, P. (2011) op. cit.
92. EUCAM. (2008) Women - The new market: Trends in
Alcohol Marketing. The Netherlands: European Centre for
Monitoring Alcohol Marketing.
93. Purity Brewing Co. (16/02/2012) ‘Hit FemALE event
strikes again’. Retrieved 01/03/2012, from Purity Brewing
Co.: http://www.puritybrewing.com/images/120216%20-
%20FemALE%20Strikes%20Again.pdf
94. BBPA. (08/03/2012) ‘Industry united on duty freeze -
lobby your MPs, Brigid Simmonds urges SIBA conference’.
Retrieved 11/03/2012, from British Beer & Pub Association:
http://www.beerandpub.com/newsList_detail.aspx?newsId=48
7
Appendices
Appendix A: Transcript from Purity Brewing
Brewer 1: (Halsey, 2011)
Sam Floy: What’s the general ethos for Purity?
Paul Halsey: It’s always trying to be slightly different to the
traditional Cask Ale market. So we’re six years old in
October, we thought there was an opportunity to, in basic
terms, funk it all up a bit really, make it slightly cool. A little
bit like what happened in the American Craft Ale market, in
particular in the North West in Oregon (?) and Seattle is that
they’ve made it more of a lifestyle choice, slightly cool.
Historically cask ale in the UK is CAMRA/ traditional pubs,
we said no, we’ve got to attract 20-30 year old males and
we’ve got to get women into it so we made the branding
really cool, we made our beer slightly lighter, slightly chilled
and we’ve got involved in loads of contemporary events:
music, food festivals stuff like that, so our approach is very
much marketing driven, brand-driven and we’ve got very
good, consistent quality beers that follow that behind.
SF: And has that always been from inception, or have you
had to change that at all?
PH: No from inception we started with two beers: Gold and
Ubu, and we introduced Mad Goose a few years ago. We are
virtually at capacity at the moment so we can’t keep
introducing new beers because innovation is a key part of that
differentiation. So that will come about once the new brewery
is built.
SF: Who do you see as your main competition?
PH: I think, the micro-/ craft beer market is the competition,
we don’t see a lot of competition from within the Midlands,
although Wye Valley, 60 miles away are very good at what
they do, their approach is very typical; about community
spirit, sustainability, all about local sourcing. Yeah that’s
important, but we’re about being cool and the brand and the
music, and the arts. In more of a lifestyle choice, a cool
choice, people who didn’t probably drink cask beer five/seven
years ago. National brewers are going to be competition
because they’ve got declining market, declining volumes so
they’re going to start looking at the micro- market and start
introducing beers that are slightly similar to our style. I don’t
think they can do it, I think they’re too big. It’s like the
Titanic, it can’t move quickly can it. Whereas we can duck
and dive, we can be very reactive. So yeah, new and up-and-
coming microbreweries are going to be our competition.
SF: And so when you’re planning campaigns, you’re not
directly thinking about what people like Carlsberg/ Heineken
are doing. Are you focussing more on your market?
PH: We certainly look at the wider market, and what they do,
we look very closely to that side of the market, get all the
publications sent through. I’m out with the consumers on a
regular basis. It’s interesting what they do, but because of
their size and how big they are ... we’re into independent
thinking, free-thinking kind of person - they’re almost anti-
big brand, this urbanisation thing is all about it’s cool and it’s
... ‘I like Purity because they’re not force-feeding me to drink
their beer, but it’s a great brand’. So they’re very brand
conscious but they’re fiercely independent on what brands
they want to be part of. It’s a bit like the music world, do you
Journal of the Brewery History Society56
like Hip-Hop/ mainstream/ Indie, you follow that brand. It’s a
little bit like that really.
SF: Have you found through talking to consumers that you’ve
seen people actively moving away from say, having a
Carlsberg, to having an Ubu?
PH: Yeah, I think there are certain drinkers that always going
to consume a brand, they’re going to have a major brand.
Carling spends how many millions of pounds on advertising a
year, they are always going to drink Carling. That’s not the
kind of consumer that we’re after, we’re after the more
discerning consumer that wants to spend good money on a
really refreshing and interesting kind of premium beer. So
we’re trying to trap possibly the wine drinker or the premium
packaged lager drinker, the more discerning drinker. We have
got hold of the mainstream drinker and we’ve introduced
them to it and they like it, but there’s a big slice of it that
we’re never going to get. I was thinking of a small
percentage, and it’s a big percentage of that small percentage,
that it’s a big enough number that we’ll bring them over. It’s
getting people away from your premium packaged and wines
and getting them into beer in a different environment, so you
start to see cask beer in style bars, in boutique hotels which
you never saw six or seven years ago.
SF: And what’s been the main drive towards that change, has
that been consumer driven or is that you going to these
boutique hotels and saying - ‘I think you should stock this for
these reasons’?
PH: I think it’s both. The consumer’s got fed up with bland,
the next generation of drinkers, the 20-30 year olds coming
through want to drink the opposite of what their father drank
which was a lager/ Stella drinker and almost like they’re
kicking back against that. And I think that the younger
people, women as well, are a lot more informed and they
want flavour, they want provenance, they want to understand
about the brand, they want to buy into it, they’re not just
fooled by advertising anymore, they really want the details.
And someone who can tick a load of boxes, saying that it’s
sustainable, it’s great quality, actually we’re quite cool, we
care about our community. That makes a difference to people.
SF: And so is that how you’ve seen yourself differentiating,
this is the brand, your competitors aren’t focussing as much
on their brand? Or are there similar brewers who are again
going for your angle as well, sort of trying to be ...
PH: I think some of the specialist companies have gone down
the route of innovation, it’s about bringing new beers to the
market all the time. Rather than brand building, but they’ve
really been innovative with some of their beers, and the
brand’s come about by default really. We’ve really focused on
establishing a brand, Purity as a brand, and our three beers
and focussing on those three beers to establish permanency
with those brands and like the question before, have we
driven the brand or has the consumer, and it’s a bit of both,
the consumer has wanted change and wanted things different,
the general tastes are bland and don’t want that anymore, and
we’ve driven that we’ve positioned the brand with boutiques
hotels, premium bars, we’ve done a lot of food and drink
matching in Michelin Star restaurants and people have
thought, I go and have a meal and not have to buy a really
expensive bottle of wine, actually you can have a fantastic
bottle of beer with this, that really does complement that
course so we’ve done a lot of work with beer and women,
we’ve done events in Birmingham solely for women, and
again matching food and drink. So we’ve driven that as well,
I think the consumer has just been ready for that change.
SF: How much are you committing to your marketing, brand
awareness and these events you were saying about, putting on
the beer and food events, how much as a percentage/ as a
lump sum are you ...
PH: I would say 75% - we just took on a new marketing PR
manager, to kind of drive this. So 75% of our marketing
brand is about positioning the brand in that area, so we’ll
update our website - make it more innovative and challeng-
ing, more interactive, we’re going to carry on supporting the
music/ the arts/ the food/ the restaurants. Most breweries have
been set up by ex-brewers or hobbyists who don’t really
understand the brand, they’re either brewers or they come
from an engineering background, we’ve come very much
from a marketing background.
SF: Out of interest what is your background?
PH: Sales and Marketing at Bass Brewers, Sales Director at
big regional brewers and ran pubs and restaurants from
inception to finish. I understand not just brands and market-
ing/ routes to market, I understand the consumer and being a
retailer as well.
SF: What is your interaction with organisations like SIBA/
CAMRA/ BBPA?
PH: BBPA not so much. SIBA have really evolved over the
past five years as a group, an industry group and a voice for
the industry, for the brewers. I’ve been very active in that,
was a non-executive trustee for them as well for three years -
the representative from the Midlands. They also enable route
to market as well (Direct Delivery Service), enables us to
Brewery History Number 158 57
access the likes of Enterprise Inns and Punch Taverns through
DDS, but you can read about that on the internet..
CAMRA: consumer group. Big break for cask beer over the
years, I think they’ve had their day in my opinion, but we
work with them.
SF: SIBA on the supply side, CAMRA on the demand side..
PH: SIBA is a trade organisation/ trade body and represents
brewers, small brewers and CAMRA is the consumer group.
SF: The evolution of small brewers coming back to the fore-
front, why is it that smaller brewers are seeing a resurgence
PH: It all started with the MMC Report in the eighties that
broke the tie up and enabled the Guest Ale into big pubs
owned groups owned by brewers so you have the mergers
which lead to the formation of the big pub groups such as
Enterprise or Punch Taverns are formed, breweries got sold
off. The focus of the big companies such as Bass and Allied
came away from cask beer, they said ‘that’s dead, it’s all
about lager, lager’s the future’ - so they took their eye of cask
beer and some of the smaller, regional brewers got formed
and in the last ten years, progressive beer duty came about
which really encouraged anybody brewing <60 brewers
barrels a week got a 50% reduction on their duty rate, so that
encouraged innovation and new brewers to come to the
market and I think the upsurge has come about through differ-
entiation/ innovation and consumers change - they want
flavour, they want choice, they want local, they want to sup-
port the local community and if there’s a brewer down the
road brewing great local beer, they really buy into it. In
Birmingham there was Mitchells & Butlers brewing their
beer, Bass in Burton, Davenports in Birmingham, Amstells in
... those guys are gone, so no-one had a local brewery
anymore. Now there’s 800 brewers in the UK again, and
localism has really come about. Quality and consistency is
key to it. If quality consistency is not right then it’s not going
to work, like I said, we are competing with the Big Boys, we
can’t in terms of our market, expand but in terms of
consistently quality, we’re more innovative, we relate more to
the local community. They can come and see us, we’re part of
the community.
SF: And so do you see in that sense, you’re always going to
be somewhat constrained in that if a lot of your strategy is
connecting to the local community, if you’re then pitching it,
trying to sell your beer to someone who lives 200 miles away,
then they’re not necessarily going to have that ...
PH: I would say that if used say, the Alcester Brewing
Company that wouldn’t mean anything to anyone probably
outside of Warwickshire, but because the name is Purity and
the name is very much developed on integrity, natural
ingredients, quality - that’s why we used it. But Purity can be
sold throughout the UK, can be sold throughout Europe so we
don’t feel we’re kind of like, shackled in any way, we know
our beer will sell really well in London we know our beer
will sell well in the North of England, a lot of smaller micros
are very much, very local and because they are using a name
like Warwickshire Brewing Company or Wye Valley there is a
limit to how far that beer can go before it doesn’t really sink
in with that local community. We believe that the Purity brand
doesn’t have those shackles around it. Although we’re very
strong in the West Midlands, that’s our heartland.
SF: I’ve seen that you’ve expanded all over the place, I’ve
had Ubu quite a lot and then I was down in London in the
summer and just saw it there, just in a pub and was like ‘I
wasn’t expecting that’. How have you gone about
distribution? Do your guys drive down to London each time
or ...
PH: Route to market is really key to the brand’s success,
we’ve decided not to use wholesalers just because
wholesalers, we believe, damage your brand, they don’t really
care for your beer and if there’s another beer that comes out
that is better or cheaper and they can make more margin then
they’ll replace it, so it’s been very much - 70 mile radius and
we’ll deliver direct, in London we’ve chosen a few partners to
work with, and London’s been very much part of our strategy
and more so going forward so in London we’ve got Adnams
representing us and we’ve got a company called Euroboozer
that we give them exclusivity, outside Adnams, for the
London area. So we’ve probably got about 13 permanent
stockists in London.
SF: And so is there a plan then to find more of these partner-
ships as it were?
PH: Yeah we want to develop the London partnership and
make it bigger and better, so we’re looking to quadruple what
we send to London. We’ve found, we believe, a partner in
Bristol for the South West. Midlands, we can grow further
throughout our own direct delivery and we’re going to look
for a partner up in the North of England who can do Leeds,
Manchester, Sheffield and York. But not wholesalers.
SF: Where do you see Purity going in the next ten years, do
you think that there’s going to be other brewers that are going
to try a similar business model to yours and will that be a
problem for you going forward?
PH: Well business is business, it will be very much about us
Journal of the Brewery History Society58
innovating and continuing differentiating ourselves in terms
of what we do; if you stand still you’ll lose your market share
so we need to grow the business as I said to you before,
London is really key so we’re looking at how we’re
developing there, we’re going to get two more sales people
into the team to develop our sales and we’re going to be
looking at doing an unfiltered, unpasteurised keg version of
one of our beers and we’re going to be bring two more beers
to the market once the new brewery is built so it’s continually
evolving, continually looking at bringing new beers to the
market and through working on the brand and the digital side
of our business and making sure that we’re still cool out there
and we believe we can treble our business from 10,000
barrels that we currently do to 30,000 so ... hopefully in 5-7
years’ time, that’s what we’ll be doing.
SF: Just quickly, how have you come up with trebling your
output?
PH: At the moment we’re at capacity in our current brewery,
we’re selling the beer that we brew and we can’t brew much
more. We’re putting a new sales team in place, two new
people for the Midlands, we’re going to develop in London
and even further so that we can quadruple volume there, and
then we’re going to set a partner up in the North of England.
And there are a couple of Pub Companies that want to trade
with us, and we’re looking at doing that. Doing a new keg
version of one of our beers will open up a new market to us.
Appendix B: Transcript from Durham Brewery
Brewer 2: (Gibbs, 2011)
Sam Floy: So, what is the general ethos in your business to
ensure that you thrive?
Steve Gibbs: Well, depends what you mean by general. Erm,
there is a tendency for microbrewers to want to get bigger, it’s
this thing with business, business has to get bigger to make
more money to get more products through, erm, that OK
that’s not really craft - that’s big business, that’s aping the big
breweries and a lot of small breweries now are getting bigger
and bigger and bigger and they’re selling more and more
volume, for cheaper and cheaper and cheaper, and there are so
many breweries now. When we started, there were two
hundred, two hundred in the country (including the big ones),
now there’s more like eight hundred, so the competition has
increased exponentially, the market itself hasn’t really grown,
the number of pubs is diminishing all the time, it is changing
but it’s ... One side is for volume.
The other side of the ethos is proper craft and making beers
that are different. What we’d like to do, we’ve always ... we
started off as cask only. Ten years ago we started doing
bottles, now we’re doing more and more different bottles,
we’re finding - especially from America which is extremely
innovative - we’re getting all kinds of new beer styles
through, they experiment like mad. Well it’s starting to filter
through to England, especially with people like Brewdog,
they’ve copied the American ... There’s this thing about IPA.
IPA is Indian Pale Ale, but the Americans have taken it right
on board and changed it, and they’ve come up with very bitter
beers, with hop aromas, from their own hops, that are really
aromatic, but very bitter. So bitter that it’s astringent, this is
what Brewdog have done. But there’s lots of new things
coming through so we’re actually starting to do a lot more in
that vein. We’re doing lagers. We do wheat beers and all sorts
of things, but to survive we’re not going down the volume
route, we’re going down the niche route. Because we’re going
to stay small, we’re not going to get big, that’s our ethos.
So there’s two different types of playing the game. The North
East is a bit slow I’m afraid, erm but there is a contingent
within Newcastle which is going for the new stuff.
SF: And so when you say that you started doing Wheat Beers
and started to do lagers, is that a case of ... how do you then
about ... do you do it from scratch? If you’ve never done a
lager before how do you then go and make your own lager?
SG: Well we’ve been doing this for years actually. I’ve been
experimenting with these beers for years but they’ve just
becoming popular now, so I think that I was before the
market, ahead of my time in a way, but all you do is ... the
difference is you find out how, OK, a lager, a proper lager is,
erm is made with a bottom fermenting yeast, it’s made under
low temperatures and lager means that it’s stored, it’s kept,
forget about Stella because that’s not lager. But just read
books and find out, and taste stuff, get the right yeast, give it
the right conditions and make it. Simple.
SF: OK, you sort of eluded to it then, so you see your main
competition, is it mainly these other microbreweries or do
you at all consider what Stella, Carlsberg are ...
SG: Nah, we’ve never considered the large brewers to be our
competition. It’s the small brewers. Erm and it hasn’t been
too bad up until the last two or three years, but there’s been
an explosion in the number of microbrewers, and the market’s
still quite small, but only so many pubs in the area that can
have our beer. I mean, you’ve just told me that you can’t, well
there’s only so many that can have our beer, but with more
and more breweries, OK we’re not actually out to kill each
other. But if there are more breweries and somebody else is
Brewery History Number 158 59
on the bar - we’re not. It’s just simple logic isn’t it. Erm and
there are more coming up all of the time. There are more
starting all of the time. For years I’ve been saying, look
there’s got to be a limit, the bubble’s going to burst, so look,
if you’re going to make it, you’re going to make it so difficult
to sell beer because there are too many of us and you’re
another extra one, you’re going into this market and you’re
going to make it even more difficult, even for yourself. They
still keep piling in, cos everybody’s heard that it’s a growth
industry. The trouble is, beer volumes overall are reducing in
mature markets, the growth is China, India, I don’t know
about Japan but definitely in the Emerging Economies, there’s
growth in Beer, because they’ve never had it, they’ve never
really had it. But it in the mature economies like ours and
America, the beer volumes are actually going down. I think
just this morning I was reading an article about 1.2% down
last year, that was the total beer market, but Craft breweries
are increasing whereas a few years ago they were 1% of the
market and now they’re more like 4-5% of the market. But
microbrewing is increasing into a falling market. I don’t know
whether we’ll actually break the mould and keep increasing
but if the market’s going down, when are we are going to hit
the point when microbrewing - the bubble breaks and micro-
brewers just can’t go any further. We just don’t know. Unless,
we’re creating a brand new market, forget the old beer market
with the Big Brewers, we’re not competing with them, we’re
making something new and something different. People used
to go down a pub and have a pint of bitter or a pint of mild,
or mix them and have mild and bitter, and your brewery was
your local brewery. And that’s what they drank, all of the
time. The local people - Spennymoor they don’t like our
Magus, the best selling pale beer, I think because it’s got
flavour. They like John Smiths and those sorts of things. They
will not move onto something new. It’s that mass market
which is actually dying a death. But our market is something
new. People come in here, they want something to drink at
home, they’re not going to the pub so much. They drink at
home and if they’ve got some money to spend, they don’t
want to drink some ordinary beer, they’ll drink ours. So
really, maybe we’re creating a brand new market and maybe
that will keep increasing. Who knows, but there’s going to be
a deciding point soon, because there are too many.
SF: So what do you think is the main reason why it’s gone
from 200 to 800? Is there any particular, specific reasons why
you think ...
SG: Yeah, well CAMRA and SIBA. We’re in SIBA, I was in
SIBA when it was just a handful of people, we started seven-
teen years ago and we got into SIBA straight away, it was
only a few people in it. And SIBA campaigned for
progressive Beer Duty which means that we were paying the
same beer duty as the large brewer. And the government
brought in this progressive beer duty. If you’re under 5,000
hectolitres a year, that’s your production, you’re on half beer
duty, and then you go on a sliding scale up to what everybody
else pays. This reduction in Beer Duty made it much cheaper
for us to make beer, because we’re not saddled with all of the
costs and the tax. That was a big incentive for brewers to start
up. On top of that, CAMRA and SIBA have been saying for
years: ‘Look it’s fantastic, there’s lots of breweries starting
up, this industry’s doing so well’, so everybody thinks ... Of
course there’s this other thing as well which is that people
think to have a brewery is just a wonderful thing. Because of
these reasons, people have piled in. Before progressive Beer
Duty we were profitable. A lot of people were really
struggling and the idea was that you’d spend the money on
your business, or you could reduce your prices to get into the
Big Brewers. The Big Accounts. So you get into Pub
Companies, this sort of thing. So your beer is cheaper. But
because you haven’t got Economies of Scale, our beer was far
too expensive to make. Therefore, we couldn’t expand into
the big markets. So you’ve got progressive beer duty, that
allows you to get in, because you can do it cheaper. And what
has happened is what I thought would happen, market forces
took over, the price of beer has been coming down for years,
not at the Bar, it’s been coming down for breweries and
wholesale, so that’s encouraged people to get in, more
breweries think that this is a fantastic market, plus of course
everybody’s saying ‘it’s a growing market’, well it is still, and
that has given people an incentive, plus this halo effect - this
"Have a Microbrewery - fantastic", eventually reality will hit,
and eventually the bubble’s got to burst, it’s got to. I can’t see
it keeping going, unless people find different ways of selling
beer I just don’t know. I don’t think the market can take much
more.
SF: You mentioned earlier that the cost of brewing has gone
down, despite ...
SG: That’s the tax
SF: Have your input prices gone down at all ...
SG: They’ve gone up massively. A couple of years or so ago,
there was bad weather which means malt prices went up, one
year there was a very bad year for hops. Hops went up
massively in price, they’ve come down since, but what’s
happened is that the duty is really the big thing. What’s hap-
pened is, we’ve got lower duty and we can sell beer cheap to
the pub, now the pubs have not responded to that by reducing
Journal of the Brewery History Society60
the price to the customer. Apart from, say, Wetherspoons -
who use the "supermarket principle", he’s used that himself.
Actually it’s biting him [Tim Martin] now because he’s
complaining about the market.
The lower prices are giving greater profit to the pubs.
Whereas the pubs used to, we used to sell and they’d say that
they wanted about 50% Gross Profit Margin, now they’re
wanting more like 70%. They’re taking more profit from us,
they’re still keeping the price up with the customer, but in a
way I can’t blame them because they’re not getting as much
volume through the pub. So they’ve got to make more profit
per item to be viable. Because people aren’t drinking in pubs
like they used to. There are other influences here as well, why
don’t people go to pubs like they used to? Well, the govern-
ment, we started recession and what the government does? It
brings in ‘no smoking in pubs’. So the pubs emptied
overnight. There are some pubs which just died overnight
because there’s no smoking. A lot of those drinkers who went
every night were smokers. So they drink at home. It’s one of
the biggest industries in the country and the government is
wrecking it. OK, Drink Drive. You shouldn’t drink and drive,
but all of these laws are conspiring against pubs. So what
we’ve done is, this is the way we’re competing is - you’re in
our retail unit. We’ve got a Bar here, we’ve got a full On-
Licence. We’ve also got lots of bottles and we’re exporting as
well. So we’re responding in different ways, we’re still going
to the pubs, but the bottles now are probably a third of
turnover.
SF: And this has grown from nothing 10 years ago, has it
been a steady increase?
SG: Oh it’s steady, it’s going and going. Yeah and we’re
getting named internationally as well.
SF: So where are you exporting to?
SG: We’ve got a customer in Austria, we’ve got a couple of
customers in Canada, I think probably in Italy and do you
know we had a man in here last week on a Brewery Tour.
And that’s another thing we’re doing, brewery tours - getting
people interested, locally. He came from Virginia and our
Temptation, a Russian Stout 10%, he says this is a sought
after beer in Virginia. I didn’t even know. So somebody’s
wholesaled it to Virginia. We’ve been in Australia, New
Zealand. We’ve been all over the world. It’s only small as we
can’t do much. But this is the way that we’re responding to
the current market. We’ve rebranded, got new 5l mini-casks
for home consumption. I’ve got new products all of the time.
All sorts of new things. We are niche and we like to be
special, that’s how we’ve coped with it. But the pubs really,
they’re not doing as well as they were.
SF: So what percentage of your beer goes to pubs?
SG: It’s just bottles and pubs, so 65-70%.
SF: These are mainly local pubs, is that more for transport?
Or do you go quite far afield?
SG: We were a cult brewery in West Yorkshire. 10 odd years
ago. We were big. We’ve been in Manchester area,
Nottingham, Derby. We’re finding now that we’re going less
and less further afield. Because there are so many breweries
locally and they’re having their local beers. If we’re going to
go, say 150 miles or so, you’ve got to fill a van up and unless
you really are wholesaling and you’re going a long, long way,
you’ve got to have a van load and it’s got to deliver that load
in one day and come back home. So you’re limited by that.
Now if you can’t fill a van up, you either go less often so you
do get a van full, or you don’t even go at all. But it’s reduced
the amount of journeys we’ve got to Sheffield or wherever
because of the competition with so many microbreweries and
the price coming down, it’s not viable with fuel costs going
up. So we’re squeezed the whole time, so we’re looking at
different ways to sell beer. But that’s what the market is
doing. Too many breweries. And the pubs, people aren’t
going out the same.
SF: And so, the name - ‘The Durham Brewery’ - that’s obvi-
ously striking a chord with people here. When you started up,
did that mean that at inception you always had the idea of
keeping local. You’ve got these dots all over the world, but it
was never like you were going to make a beer that was drunk
all across the country?
SG: We’d prefer to be local. But it’s cheaper for us as a start -
we didn’t spend as much money on vans, on fuel and every-
thing else. We’re getting more and more local, especially in
Newcastle. We made a beer very early on called Magus, it’s
really very popular, some pubs have it on the whole time. It
would be good to be more and more local and sell more of
the bottles locally. There’s people coming in all of the time.
We had somebody last weekend, he says he comes up here
really to just get the beer. He’s come 70 miles, just to stock
up on our beer and I says ‘it would be cheaper for you buy it
online and just get it delivered because it’s only £8.50’ rather
than coming up here in a car and then going home in a car all
that way. He says he likes coming though. So that part of the
business is increasing all of the time.
SF: So going back to the name, are finding that these
companies in Virginia and Austria are enjoying the beer for its
Brewery History Number 158 61
taste, but is the Durham brand, the fact that Durham is this
old, North Eastern English city, is that striking a chord with
international companies, or is it purely on the taste do you
think?
SG: I haven’t a clue. We’ve got this customer in Austria, he
really does go for our beers and he gets a couple of pallets a
year, just for his own restaurant. And he has a Beer Festival
every two years. We took a Bar with hand pumps, now they
don’t have hand pumps across there - it’s all keg - so that was
new for them. But we’d got a big banner up saying: Durham
Brewery from the North East and people were asking us - is
that in Scotland? Because people in Austria haven’t heard of
Durham, not even Newcastle, but they’ve heard of Scotland.
When they come on holiday to Britain, they go to Scotland
because there’s something over there that says ‘Scotland is
the place to be’. Don’t ask me why. So I really don’t know if
The Durham Brewery means anything to anybody out of the
country. If they do like our beer it’s because of the flavour.
One thing that I think has made a big difference is that we’ve
got awards. This year we’ve got an award from the
International Beer Challenge. Also, the British Bottlers
Institute. Now I think that wholesalers look at the results of
these awards and then source the beers because if it’s going to
win an award, it must be alright. So I think these foreign
people and whoever will look at these awards and think ‘we’d
better try that’. Maybe that’s how we’re getting in.
SF: So what is your relationship with wholesalers, do you
have a number of local wholesalers?
SG: Oh they can be all over the place.
SF: But you actively look to ...
SG: We don’t actually, we’re not very aggressive - they come
to us. But the beer reputation is travelling far and wide.
Doesn’t matter the bloke across the road doesn’t know we
exist, but they know we exist in Virginia. Fellow in Bowburn
doesn’t know, the North East is a strange ...
SF: Were you affected by the Tied Estates?
SG: Look at the students, we can’t get in. We are affected.
There’s a massive market there - can’t get in. Well bits and
bobs here and there. We did a Hild Bede ale, Special Label.
But it’s not very often that we get something from the stu-
dents. So yes, we are affected. SIBA started a direct delivery
scheme, where SIBA negotiated prices with Punch, Enterprise
some of the big people. We can deliver to those pubs direct,
but only on a special price grid so yes we can get in on those
because of that. But going direct is much more difficult, they
just want it too cheap. Lots of small breweries are in
Wetherspoons, there’s no profit. They just want it so cheap
that there’s no profit. And for us, no point. If it’s not going to
make profit then there’s no point. So the big stuff is still a bit
out of range as they still want ... it doesn’t matter how cheap
you sell it, they going to want it a bit cheaper. And another
brewery down the road will do it that bit cheaper. They
might not be making any profit, but they’ll still do it. This is
a
market economy. And this is why I’m saying that there are
too many breweries.
SF: You mentioned with SIBA, they helped you out Direct
Delivery, how else do CAMRA and other institutions help
you out. Do they help you with marketing or anything like
that?
SG: Well CAMRA’s a do-do (shouldn’t say that). CAMRA’s
not going to help anybody. We help CAMRA. We sponsor
the local beer festival. Costs us £1000 this year. But it does
get us a good range of beers in. Good exposure, good
advertising. But we’re actually helping them. CAMRA did a
good thing, they got the whole Cask Beer thing restarted, and
all these microbreweries are really because of CAMRA and
SIBA of course is helping us to get to market, but when it
comes to marketing it’s us. You mentioned the name, The
Durham Brewery well when we started we thought, what are
we going to call it? And I thought what’s the best name that
makes us look big? The Durham Brewery. So we got it and
our bottled beers especially have got ecclesiastical names, so
we’ve locked into local Christianity, the Celtic Christianity
and the Cathedral. Then there’s St Cuthbert of course, you’ve
got Celtic knotwork. So that’s our idea and the marketing is
all us. If we win an award, we have to tell people. Nobody
else does it for us. It’s just a tool that we can then use which
is all down to us. We’ve just had a brand new website made,
which is marketing again. It looks good, gives people confi-
dence that we know what we’re doing. But it costs us.
SF: So how much on a typical year over the past five years,
how much would you spend on advertising, say a percentage
of Total Cost? Or is that ...
SG: On a normal year, very little. People ring us up all the
time, newspapers, the advertisers but we find that type of
advertising doesn’t do us any good because if people know
about us they come anyway and it’s something with the
human brain, it works in categories, it sees what it knows, it
likes what it knows and an advert for something that they
don’t know about doesn’t get seen. It’s almost transparent.
And those little adverts don’t do any good at all so we do for
some years we’ve been doing one in the Advertiser which is
Journal of the Brewery History Society62
a whole page. One page pull out on the Christmas Edition,
that’s cost us £500. Then there’ll be CAMRA, we’ve spent
£1000 on, so I don’t know. We’ll probably do £2-3000 out of
a turnover of £400,000, it’s peanuts. This year we’ve spent a
heck of a lot. This year we’ve gone into loss last month
because we’ve been spending so much. Spent £10,000 on
doing new bottle labels and a new website. On top of that,
new tanks, all sorts. We can see things dying this year with
the recession, we’re really pushing hard to keep the impetus
up. So this year we’ve spent a lot, but normally hardly any.
Don’t need to because we can do all of our own posters, we
do our own bottle labels, the website is a fantastic tool now.
I’ve got over 900 people on an e-mail newsletter. Using a lot
of Twitter, got Facebook, but that doesn’t work the same.
We’re pushing in those ways. We’re pushing to the people
that appreciate us. To move somebody from drinking John
Smiths Smooth to drinking this, which is what we need to do,
is almost impossible. But even then, we go to markets.
Sedgefield - a waste of time. It’s known for its car boot sales,
we went there and were lucky if we broke even. There last
weekend, passers-by looking for a discount. And yet, I was in
York a couple of weeks ago, and there’s a fantastic shop there
with all sorts of beer from all over the world, stuff in
champagne bottles, from microbreweries. Or in Manchester.
And they’re selling it for a damn good price. But the people
who like it, like it. There is a market there, but it’s a small
one and it’s ... I was reading this morning about the American
market; the people who like this sort of beer are affluent and
don’t mind spending a bit extra. But for the general market,
the John Smiths Smooth drinkers they’re not interested and
will just drink something tasteless and cheap. But we’re in a
special niche market, but we’re competing now because there
are a lot of up and coming breweries that are just starting to
do the same thing.
SF: And so do you feel like you’ve got a First Mover
Advantage over these breweries ...
SG: Oh yeah.
SF: So you can sort of be quite nimble so if you see other
brewers starting to do things you can come over and almost
use the Durham Brewery brand to quash what they’re doing?
SG: Well we started seventeen years ago and we’ve got the
reputation. Whereas someone starting today has no reputation,
he’s going to find it hard. So he’s got to do something blasto,
something really good to grab the market, we’ve got a good
established name. Yeah, it does help. And because of that
we’ve got revenue, we’ve got proper customer base so this
year we’ve sort of turned it around more to the retail, more to
the special ... So we’ve changed.
We moved away from the big logo with a bit of text to a
newer version. The old label is more associated with quality,
seen like a wine bottle label.
SG: They do say that when a brewery gets big, the quality
changes. And it does. I think one of the reasons that the really
large brewers make bland beer is because they do large
volume and it’s the beer which has to be offensive to nobody.
It’s got to be universally acceptable whereas we’ve got lots of
different beers and some people might hate one but they like
another one but, if they’re going to hate something about that
one it means if you’re going to do lots of volume, you’ve
really got to have a smaller range of beers to cope with it. So
you’ve got to have everybody liking it. And that’s why it’s
bland.
Appendix C: Questionnaire and responses
Response 1
General
Name of Brewery:
Address:
Established:
Contact Details:
Financial
Annual turnover: £1.1 million
Total annual sales (volume): 4,500bbl
Staff employed: 10
Investment Profile (%): {percentage of what and over what
time period?}
- Fixed capital [brewing equipment etc.]
- Staff
- Branding
Production
Annual Total Cost of production of beer: Direct costs total
£650,000 (including distribution costs £15,000 and cellar
services costs of £13,000)
Breakdown of cost structure (%): As percentage of turnover
- Production - we achieve a 42% gross margin on production
as noted above.
- Administration {what to include in this?}
- Advertising (including general marketing, POS etc) 3.4%
How would Total Costs be affected if production increased
50%: Fall
How would Total Costs be affected if production decreased
25%: Same
Brewery History Number 158 63
How can you lower your Unit Cost of production, and what
steps are you taking to do so: Increased investment in
equipment to make process more efficient, training of
operatives
How many different brews do you produce: 3 at any time
during the year - 2 full time and one rotating seasonal of
which total number produced to date is 3
Qualitative Questions
What is your general ethos to ensure that you thrive as
a business? Quality, Quality and Quality
Who do you see as your main competition? Regional brewers
How do you differentiate against your competitors? Locality,
provenance, customer service
There has been a resurgence in smaller brewers in the last few
years, what is your view on this? Very good for the industry,
promoting locally sourced products and the local supply
chain therein, raising awareness in consumers about home
grown(brewed!) products, developing a potential to export
especially with Olympics and Jubilee approaching.
Response 2
General
Financial
Annual turnover: £50k
Total annual sales (volume): 300 Hl’s
Staff employed: 0
Investment Profile (%): N/A
- Fixed capital [brewing equipment etc.]
- Staff
- Branding
Production
Annual Total Cost of production of beer:£40k
Breakdown of cost structure (%):
- Production 90%
- Administration 8%
- Advertising 2%
How would Total Costs be affected if production increased
50%: Production costs would rise by 25%
How would Total Costs be affected if production decreased
25%: Costs reduced by ingredients not used
How can you lower your Unit Cost of production, and what
steps are you taking to do so: Brew more in order that
overheads covered by more brews
How many different brews do you produce: 6 (incl 2
seasonal)
Qualitative Questions
What is your general ethos to ensure that you thrive as a
business? Ensure the quality is good
Who do you see as your main competition? Competition not
the major issue, lack of investment of time and money is
How do you differentiate against your competitors? Local
orientation, such as beers named after old Wiltshire dialect
There has been a resurgence in smaller brewers in the last few
years, what is your view on this? Its positive
Response 3
General
Financial
Annual turnover: £300k
Total annual sales (volume):
Staff employed: 5
Investment Profile (%):
- Fixed capital [brewing equipment etc.]
- Staff
- Branding
Production
Annual Total Cost of production of beer:
Breakdown of cost structure (%):
- Production 40% Excise 40%
- Administration 15%
- Advertising 5%
How would Total Costs be affected if production increased
50%: Excise & materials increase 50%, labour 25%
How would Total Costs be affected if production decreased
25%: Excise & materials down 25%, labour 10%
How can you lower your Unit Cost of production, and what
steps are you taking to do so: Increase sales - other costs
already reviewed & cut
How many different brews do you produce: 8 regular,
monthly specials
Journal of the Brewery History Society64
Qualitative Questions
What is your general ethos to ensure that you thrive as
a business? Cash flow & sales are prime focus
Who do you see as your main competition? Sheer number of
small breweries
How do you differentiate against your competitors? Quality
of our beers
There has been a resurgence in smaller brewers in the last few
years, what is your view on this? Market is too crowded,
given the number of pubs closing
Further Comment
If you have anything more that you would like contribute,
please do so below:
The recession and cheap booze from supermarkets is
hitting our pub customers hard, with more & more
pubs closing. The situation is made worse by the big
pubcos (Enterprise & Punch etc) not permitting their
tenants & managers to buy direct from breweries but
instead tying their houses to buy only from the pubco.
Effectively there are only a fraction of pubs we can
sell to.
Response 4
General
Financial
Annual turnover: £140,000
Total annual sales (volume): 600+ barrels
Staff employed: 2
Investment Profile (%):
- Fixed capital [brewing equipment etc.] 60%
- Staff 10%
- Branding 30%
Production
Annual Total Cost of production of beer:
Breakdown of cost structure (%):
- Production52%
- Administration 24%
- Advertising 3%
How would Total Costs be affected if production increased
50%: Production costs would increase by 30%, other costs
would only go up about 15%
How would Total Costs be affected if production decreased
25%: Production costs would decrease, but very little saving
elsewhere
How can you lower your Unit Cost of production, and what
steps are you taking to do so: Wouldn’t want to, quality
ingredients & no short cuts is where craft brewers score
How many different brews do you produce: 6 regulars +
others through the year
Qualitative Questions
What is your general ethos to ensure that you thrive as a
business? To do something that we enjoy
Who do you see as your main competition? Other brewers,
small and regional
How do you differentiate against your competitors? Local
products & good service,
There has been a resurgence in smaller brewers in the last few
years, what is your view on this? Debatable as to whether it
is sustainable, but need new entrants to keep the industry
moving forward and innovating
Further Comment
If you have anything more that you would like contribute,
please do so below:
Response 5
General
Financial
Annual turnover:£50 M
Total annual sales (volume):
Staff employed: 140
Investment Profile (%):
- Fixed capital [brewing equipment etc.]?
- Staff?
- Branding ?
Production
Annual Total Cost of production of beer: Overheads over
£2 M
Breakdown of cost structure (%):
- Production inc warehousing and transport overheads only
54%
Brewery History Number 158 65
Journal of the Brewery History Society66
- Administration -29%
- Advertising - Marketing 5.4%
How would Total Costs be affected if production increased
50%: Fixed costs will stay the same as we have enough
capacity to absorb this. Variables such as energy will go
down.
How would Total Costs be affected if production decreased
25%: Fixed costs will stay the same as we have to operate
with this amount of people.
How can you lower your Unit Cost of production, and what
steps are you taking to do so: Reduction in labour - energy
efficiencies
How many different brews do you produce: 37 over 50 brls
Qualitative Questions
What is your general ethos to ensure that you thrive as a
business? Growth and cost savings
Who do you see as your main competition? All breweries
How do you differentiate against your competitors? ?
There has been a resurgence in smaller brewers in the last few
years, what is your view on this? They have an unfair
advantage in duty which gives them a £55/brl gain through
PBD. Breweries of this scale do not get that much
advantage. I personally agree that the PBD is a good thing -
but some retailers have used this to get unfair discounts
form small brewers. Too many brewers at a small level
which effect competition particularly amongst themselves
rather than the medium size brewers.
Appendix 4: Data Analysis
3.2 Functional form
Discussion starts with the model chosen for the regression.
From researching the existing literature a number of studies
were considered that aimed to model the Long Run demand for
beer – these are discussed in [ch. 2.4].
In terms of specification, a double-log model was chosen, in
keeping with studies by (Lee & Tremblay, 1992), (Adrian &
Ferguson, 1987), (Clements, Yang, & Zheng, 1997) and
(Abbott, Lawler, & Ling, 1998). This technique has certain
pitfalls, alluded to in the meta-analysis undertaken by (Fogarty,
2010), that include a potential overestimation of elasticities.
Nevertheless, (Alston, Chalfant, & Piggott, 2002) describe
reasons behind the popularity of the double-log model, includ-
ing its simplicity and ease of interpretation. Continuing from
this, the following regression, based on (Abbott, Lawler, &
Ling, 1998) is adopted:
Where:
Q: total number of barrels consumed per quarter
Y: real disposable income
Pb: price of beer relative to all other goods
Ps: price of substitute alcoholic products
3.3 Discussion of data
The focus of this study was solely the UK market. A benefit of
this was that the UK possesses a number of trustworthy and
reputable sources of statistical information. Had this been a
cross-country study, data in different formats would have to be
adopted, potentially contaminating the final form that it took.
An important consideration has been the period of study with
which this analysis was undertook, with much being dictated
by data availability. The HMRC provided figures from their
‘Beer and Cider - Historic Clearances and Revenue’ report to
use for Q. This begins with 1994Q1, conveniently the last
quarter used by (Abbott, Lawler, & Ling, 1998) and ends with
2011Q3. With this period as a marker, the ONS were able to
supply the remaining data from their ‘Quarterly National
Accounts Q3 2011’ (Y) and ‘Consumer Trends Dataset – Q3
2011’ for (Pb) and (Ps). The latter had the advantage of pre-
senting the price levels as part of an RPI Index, implicitly giv-
ing them relative to the price of all other goods.
As alluded to there were relatively few issues that presented
themselves from the data sources. One minor transformation
was made nonetheless: converting the data from hectolitres
into barrels. This was to align it with the bulk of existing litera-
ture, allowing for more worthwhile comparison.
All variables were then converted into log-form to begin a
regression.
3.4 Nonstationarity
When considering time series data such as this regression, one
of the key issues that needs to be tested for is stationarity, or
rather its absence. Indeed, in his introduction to concepts of
stationarity in time series, (Maddala, 2001) admits that “most
of the time series we encounter are nonstationary”
As background, an informal definition of stationarity is when
a variable has a mean and variance that remain constant and
are independent of time (Harris, 1995). When this is violated,
one of the consequences is a spurious regression and that the
results can’t be trusted. In addition there could be
contemporaneous correlations between the variables, rather
than causal relationships, again negating correct inference.
3.4.1 Cointegration
However, despite this it is still possible to use nonstationary
variables in data analysis. In their seminal paper, (Engle &
Granger, 1987) contend that if variables are cointegrating it is
possible that a spurious regression may not occur. The
intuition behind this is that cointegration between variables
allows them to act as if they were in long term equilibrium
i.e. the difference between them is stationary. Consequently,
despite possessing stochastic, nonstationary trends, they can
be modelled to act in a way not stochastically different from
stationarity.
It would prove beneficial to explain some notation regarding
the order of integration and its relationship with stationarity.
A variable that is integrated to the dth degree is denoted as
I(d). With no order of integration, I(0), the variable is said to
be stationary whereas at I(1) it is non-stationary. At I(1), if a
cointegrating relationship exists then the relationship can be
considered not significantly different from stationary. Higher
orders of integration complicate matters, however within the
present analysis this issue did not arise and so explanation
would be superfluous.
For further clarification, (Challis & Kitney, 1991) explain that
nonstationary variables possess a stochastic trend and that
they contain a unit root.
There are a number of techniques that can be adopted to test
for these unit roots and hence for nonstationarity.
3.5 Nonstationarity tests
The two methods adopted to test for nonstationarity are as
follows:
3.5.1 Augmented Dickey-Fuller Test
It serves as an extension of the standard Dickey-Fuller Test to
incorporate lags.
The simple DF Test begins:
Testing the null hypothesis of
against an alternative,
A regression is then done on:
where V is the first difference operator. A unit root test is
equiva
The ADF is tested in the same way, but the model is extended
to include lags of on the right hand side. This then becomes:
The ADF is preferable to the simple process as it incorporates
lags which are of aimportance in testing stationarity. One of
the downsides of this is that lags have to be pre-determined,
however for this a number of procedures have been devised
(Ng & Perron, 2001). For this regression, the Akaike informa-
tion criteria (AIC) is adopted.
3.5.2 Phillips-Perron (PP) Test
This builds upon the DF test, however instead of instead of
adding higher-order lagged terms, they undertake a non-para-
metric correction of the t-test statistic to account for autocor-
relation.
The test fits the following regression:
The statistic for this is:
where:
is OLS residual
n is the number of observations
k is the number of covariates
From discussion of these tests, the decision of whether unit
roots are present will be based on the results of both the ADF
and PP tests.
Brewery History Number 158 67
equivalent to finding
where is a constant, a coefficient on a time trend and
the lag order for the process.
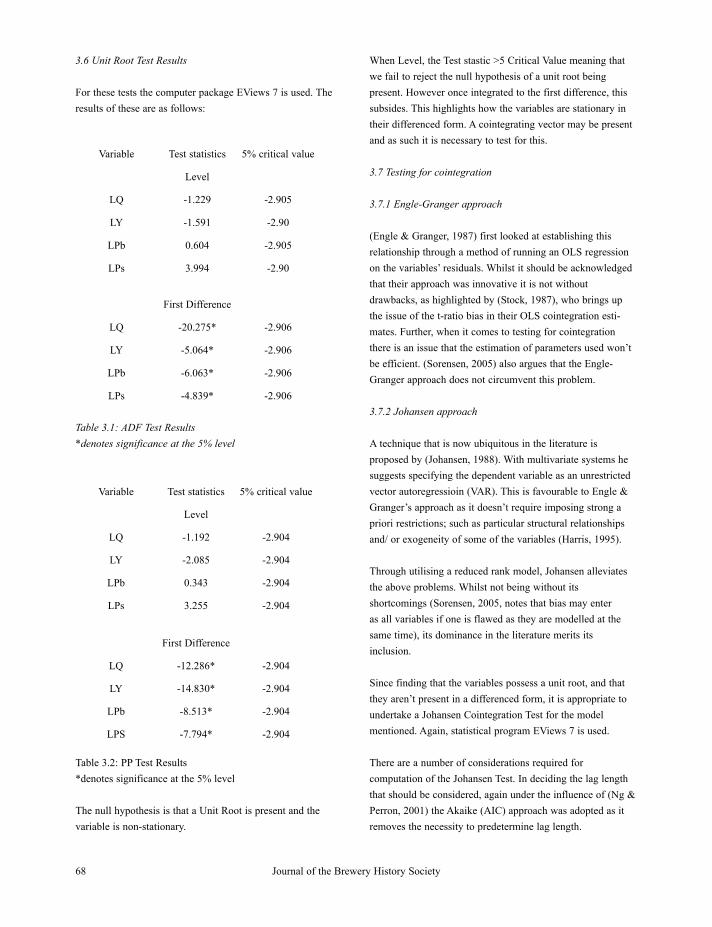
3.6 Unit Root Test Results
For these tests the computer package EViews 7 is used. The
results of these are as follows:
Table 3.1: ADF Test Results
*denotes significance at the 5% level
Table 3.2: PP Test Results
*denotes significance at the 5% level
The null hypothesis is that a Unit Root is present and the
variable is non-stationary.
When Level, the Test stastic >5 Critical Value meaning that
we fail to reject the null hypothesis of a unit root being
present. However once integrated to the first difference, this
subsides. This highlights how the variables are stationary in
their differenced form. A cointegrating vector may be present
and as such it is necessary to test for this.
3.7 Testing for cointegration
3.7.1 Engle-Granger approach
(Engle & Granger, 1987) first looked at establishing this
relationship through a method of running an OLS regression
on the variables’ residuals. Whilst it should be acknowledged
that their approach was innovative it is not without
drawbacks, as highlighted by (Stock, 1987), who brings up
the issue of the t-ratio bias in their OLS cointegration esti-
mates. Further, when it comes to testing for cointegration
there is an issue that the estimation of parameters used won’t
be efficient. (Sorensen, 2005) also argues that the Engle-
Granger approach does not circumvent this problem.
3.7.2 Johansen approach
A technique that is now ubiquitous in the literature is
proposed by (Johansen, 1988). With multivariate systems he
suggests specifying the dependent variable as an unrestricted
vector autoregressioin (VAR). This is favourable to Engle &
Granger’s approach as it doesn’t require imposing strong a
priori restrictions; such as particular structural relationships
and/ or exogeneity of some of the variables (Harris, 1995).
Through utilising a reduced rank model, Johansen alleviates
the above problems. Whilst not being without its
shortcomings (Sorensen, 2005, notes that bias may enter
as all variables if one is flawed as they are modelled at the
same time), its dominance in the literature merits its
inclusion.
Since finding that the variables possess a unit root, and that
they aren’t present in a differenced form, it is appropriate to
undertake a Johansen Cointegration Test for the model
mentioned. Again, statistical program EViews 7 is used.
There are a number of considerations required for
computation of the Johansen Test. In deciding the lag length
that should be considered, again under the influence of (Ng &
Perron, 2001) the Akaike (AIC) approach was adopted as it
removes the necessity to predetermine lag length.
Journal of the Brewery History Society68
Variable Test statistics 5% critical value
Level
LQ -1.229 -2.905
LY -1.591 -2.90
LPb 0.604 -2.905
LPs 3.994 -2.90
First Difference
LQ -20.275* -2.906
LY -5.064* -2.906
LPb -6.063* -2.906
LPs -4.839* -2.906
Variable Test statistics 5% critical value
Level
LQ -1.192 -2.904
LY -2.085 -2.904
LPb 0.343 -2.904
LPs 3.255 -2.904
First Difference
LQ -12.286* -2.904
LY -14.830* -2.904
LPb -8.513* -2.904
LPS -7.794* -2.904
A further consideration that is required is whether to allow for
a linear deterministic trend in the Cointegration Test. From
visual representation of the variables, it becomes clear to test
with an intercept and trend in the cointegration equation.
3.7.3 Johansen Test results
There are two results that emerge from the Johansen Test:
Trace and Maximum Eigenvalue. The Trace statistic is testing
the null hypothesis of there being at most r cointegrating
relations and the Maximum Eigenvalue statistic has null
hypothesis of r cointegrating relations against an alternative
of r + 1 (Johansen, 1991). The results of the regression are as
follows:
Table 3.3: Unrestricted Cointegration Rank Test (Trace)
Trace test indicates 2 cointegrating eqn(s) at the 0.05 level
* denotes rejection of the hypothesis at the 0.05 level
**MacKinnon-Haug-Michelis (1999) p-values
Table 3.4 : Unrestricted Cointegration Rank Test (Maximum
Eigenvalue)
Max-eigenvalue test indicates 1 cointegrating eqn(s) at the
0.05 level
* denotes rejection of the hypothesis at the 0.05 level
**MacKinnon-Haug-Michelis (1999) p-values
It is apparent that there is a disagreement in the results and as
such, discretion is required. Scrutinising the figures reveals
that the Trace test statistic is only marginally significant at
two cointegrating equations whereas the Maximum
Eigenvalue statistic is more secure in its prediction of one
equation. In the absence of cordial numbers, the results are
interpreted as having one cointegrating equation.
With a cointegrating equation where variables are I(1), this
implies that the results obtained will not behave in a spurious
manner and hence the Long Run model for Beer Demand in
the UK can be interpreted as:
Q = 2.26769LY – 4.57367LPb + 0.80701LPs
3.8 Error Correction Model
In order to account for the short term behaviour in beer
demand it is necessary to incorporate an Error Correction
Model (ECM). Again, it is appropriate to adopt Johansen’s
approach utilising the technique of a Vector Error Correction
Model (VECM), designed for VAR models with nonstationary
variables that are known to be cointegrated.
This is a one step approach that again supersedes the Engle
Granger methodology. As (Maysami & Koh, 2000) describe,
the VECM is favourable because it works in one step, rather
than two, removing the requirement for specific variables to
be normalised. This is more efficient than Engle-Granger,
where errors in the first step are carried over to the second.
3.8.1 Johansen’s VECM
After setting up a VAR, some diagnostic tests are needed to
check how it behaves. Firstly, the autoregressive (AR) roots.
If the VAR is stationary then all roots will have a modulus of
less than one. With this condition met an appropriate lag
length must be identified and through using the VAR Lag
Length Criteria specification provided by EViews the results
are:
Brewery History Number 158 69
Hypothesized
No. of CE(s)
Eigenvalue Trace
Statistic
0.05
Critical
Value
Prob.**
None 0.631992 112.1460 63.87610 0.0000
At most 1* 0.266123 44.16972 42.91525 0.0372
At most 2 0.224450 23.12957 25.87211 0.1057
At most 3 0.082367 5.845109 12.51798 0.4802
Hypothesized
No. of CE(s)
Eigenvalue Trace
Statistic
0.05
Critical
Value
Prob.**
None 0.631992 67.97624 32.11832 0.0000
At most 1* 0.266123 21.04015 25.82321 0.1889
At most 2 0.224450 17.28446 19.38704 0.0984
At most 3 0.082367 5.845109 12.51798 0.4802

Table 3.5: VAR Lag Order Selection Criteria
This inclines towards having lag length at five variables, in
keeping with the AIC criteria that was adopted in the initial
model.
Undertaking the same tests as before, it is found that the VAR
has one cointegrating vector after running the Johansen Test
for Trace Test and Maximum Eigenvalues and in keeping
with (Juselius, 2000) it is recommended that the lag length of
the VECM is one less than the VAR. In this instance the
VECM is modelled with four lags.
3.8.2 VECM Results
The results of the VECM calculated are as follows:
Table 3.6: Vector Error Correction Estimates
Sample (adjusted): 6 71
Included observations: 66 after adjustments
Standard errors in ( ) & t-statistics in [ ]
What is of importance here is that the coefficients of the short
term correction are of the opposite magnitude to the long run
model. This accounts for the short term deviation from the
long term trend for the previous lag, which is in keeping with
what is expected.
3.9 Discussion of quantitative methodology
Before continuing, it is appropriate to evaluate the quantita-
tive methodology that has been used.
This regression has looked at the aggregated demand for beer
whilst detailed analysis will be on the how individual brewers
act within the market; this could present an issue when
interpreting the elasticities. (Slade, 2004) discusses the issue
of price elasticity. “When a product is homogenous, a single
price prevails in the market. There is therefore just one price
elasticity of demand – the own-price elasticity – to estimate.
When products are differentiated, in contrast, the number of
brands can be very large ... and the number of elasticities is
formidable”. In the case of the current regression, these
different elasticities are not picked up, instead there is an
aggregated figure.
It could therefore be more applicable to use methodology
used by (Hausman, Leonard, & Zona, 1994); a study that
provides elasticity estimates for beer as a group and also for
different beer brands. The reported own-price elasticity
estimates for different beer brands range from -3.8 to -6.2,
and the estimated own-price elasticity for beer as a group at -
1.3. This is to be expected with firms facing substitutes within
the group as well as other product types.
Whilst this type of analysis would be more insightful for the
study, there are constraints from the data. The authors gained
access to the largest US brewers, using detailed metrics of
beer type and number of stores these were sold in. This is
unfeasible in the case of small UK brewers and so an
aggregated form was taken. Nonetheless, the final results and
supporting literature act to support good interpretation of
these results.
3.10 Discussion of qualitative methodology
This section briefly describes the methodology for obtaining
the qualitative material used in analysis.
As this is a paper asking how small brewers survive, firms
were contacted directly in search of an answer. This was done
Journal of the Brewery History Society70
FPE AIC SC HQ
2.69e-11 -12.98667 -12.85286 -12.93387
7.88e-16 -23.42640 -22.75736 -23.16242
4.66e-16 -23.95711 -22.75283 -23.48194
2.40e-16 -24.63516 -22.89565 -23.94881
1.09e-16 -25.45163 -23.17689* -24.55410*
9.84e-17* -25.60184* -22.79187 -24.49313
1.12e-16 -25.53913 -22.19392 -24.21923
Cointegrating Eq: CointEq1
LQ(-1) 1.000000
LY(-1) -0.694900
(0.38666)
[-1.79718]
LPB(-1) 2.071194
(0.97764)
[ 2.11857]
LPS(-1) -0.562099
(0.68958)
[-0.81513]
in two ways; first, through conducting a generic questionnaire
that was sent out to over a hundred small brewers (contacts
were found from the SIBA website and a survey was sent out
via e-mail) and second through one-on-one interviews. Full
details of these are in Appendices A, B and C.
Secondary data were also sourced through investigation of
journals outside the economic literature. This was achieved
through an initial electronic search, and then systematic
exploration of the references
When drawing up the survey, it was decided to utilise a mixed
method approach to gather both quantitative and qualitative
responses. The initial intention was to assemble an average
cost curve for small brewers. Unfortunately, the lack of clear
responses rendered this unworkable. An area of fruitful return
however occurred with the qualitative responses. Here, open
ended questions were distributed to allow the brewers to
express, for example, their “ethos to ensure you thrive as a
business” and how they “differentiate against your
competitors”.
In hindsight, it can be noted that the initial quantitative
questions required effort which often deterred respondents
from answering them. This meant that the later, arguably
easier, questions based on opinion rather than fact, were not
answered.
Separate face-to-face interviews were arranged with
Managing Directors of two small breweries. These were semi-
structured interviews allowing flexibility from both researcher
and respondent to enhance the opportunity of garnering rich
textual data. Subsequent interpretation was undertaken by the
researcher. On both occasions conversations were recorded
and later transcribed. Again, questions remained open to
allow the brewers to express the strategies that they adopted
to survive and thrive. This method was beneficial in that a
rapport could be built, allowing the interviewee to go into
more specifics as well as asking for clarification when
needed.
In terms of which brewers were selected, two were chosen for
interview out of the five enquiries made in the West Midland
and North Eastern areas. It was decided that a firm operating
in each of these geographical markets would broaden the
scope to gain a fuller picture for the whole UK. Whilst it is
not appropriate to draw generalisations from just two sources,
the results align with survey responses from brewers
throughout the UK. This suggests that the depth that the
interviews went into could plausibly have been found in other
locations and so should be strongly considered.
Full consent was granted from the brewers conducting face-
to-face interviews and it was agreed that survey respondents
would remain anonymous.
Appendix 5: Data Sources
As mentioned, the sources for my data were as follows:
Q: ‘Beer and Cider – Historic Clearances and Revenue’ from
HMRC. This covered monthly data from Jan-94 to Sep-11.
Once manually converted to quarterly data and then again
from hectolitres to barrels using the conversion [1hl =
0.611026 barrels]
Y: ‘Quarterly National Accounts Q3 2011’ from ONS
Pb: ‘Consumer Trends Dataset – Q3 2011’ from ONS
Ps: ‘Consumer Trends Dataset – Q3 2011’ from ONS
All data was accessed electronically.
Brewery History Number 158 71
Copyright © 2022 FDOKUMEN