The Beer Game: Its History and Rule Changes
41
The Beer Game: Its History and Rule Changes Ignacio J Martinez-Moyano (a) 1 , Joel Rahn (b) , and Roberta Spencer (c) 2 (a) Center for Policy Research, University at Albany, 135 Western Av, Albany, NY 12222 [email protected] (b) Independent Consultant [email protected] (c) System Dynamics Society, 135 Western Av, Albany, NY 12222 [email protected] Abstract This paper explores the history of the Beer Game, its rules, and lessons. By triangulating information from the literature, archival analysis, and interviews with experts in the field, we have identified the main changes in the game over its almost 50-year history. Additionally, an exploration of possible changes to the game and new games in the field of system dynamics are examined. First Draft 1 Corresponding author at [email protected] or (518) 442-3859 2 The authors are listed in alphabetical order having their contributions being of equal importance.
-
Upload
independent -
Category
Documents
-
view
1 -
download
0
Transcript of The Beer Game: Its History and Rule Changes

The Beer Game: Its History and Rule Changes
Ignacio J Martinez-Moyano (a) 1, Joel Rahn (b), and Roberta Spencer (c) 2
(a) Center for Policy Research, University at Albany, 135 Western Av, Albany, NY 12222
[email protected] (b) Independent Consultant [email protected]
(c) System Dynamics Society, 135 Western Av, Albany, NY 12222 [email protected]
Abstract
This paper explores the history of the Beer Game, its rules, and lessons. By triangulating information from the literature, archival analysis, and interviews with experts in the field, we have identified the main changes in the game over its almost 50-year history. Additionally, an exploration of possible changes to the game and new games in the field of system dynamics are examined.
FFiirrsstt DDrraafftt
1 Corresponding author at [email protected] or (518) 442-3859 2 The authors are listed in alphabetical order having their contributions being of equal importance.

Page 2
Table of Contents Abstract ........................................................................................................................................... 1 Table of Contents............................................................................................................................ 2 List of Figures ................................................................................................................................. 3 Introduction..................................................................................................................................... 4 Introduction..................................................................................................................................... 4
The Data Used in this Paper........................................................................................................ 5 Major Phases in Beer Game History........................................................................................... 5
Beer Game Pre-History Phase (1956-1973) ................................................................................... 6 Beer Game Past-History Phase (1973-1992) ................................................................................ 24 Beer Game Recent-History Phase (1992-2005)............................................................................ 27
Beer Game Numbers ................................................................................................................. 27 Current Version of the Beer Game ........................................................................................... 31 Lessons of the Beer Game ........................................................................................................ 34
What Are People Really Learning with the Beer Game? ..................................................... 35 Beer Game Future-History Phase (2005-????) ............................................................................. 35 Conclusions ................................................................................................................................... 35 Beer Game (soon to be annotated) Bibliography.......................................................................... 36 References ..................................................................................................................................... 36 Appendix I..................................................................................................................................... 40 Appendix II ................................................................................................................................... 40

Page 3
List of Figures Figure 1.—Major Phases in Beer Game History ............................................................................ 6 Figure 2.—Beer Game Pre-History (1956-1973) ........................................................................... 6 Figure 3.—Model of a Retail-Wholesale-Factory Distribution System (as presented by Jones
1957, p. 8) ............................................................................................................................... 8 Figure 4.—Behavior of Multi-Stage Distribution System (as presented by Jones 1957, p. 8)....... 9 Figure 5.—Production-Distribution System D-0016 (Forrester 1958b, p. 8) ................................. 9 Figure 6.—Production-Distribution Model as presented in D-0023 (Forrester 1958c, pp. 12-15)
............................................................................................................................................... 10 Figure 7.—Production-Distribution System (as presented in Forrester 1958d, p. 41 and 50) ..... 11 Figure 8.—Response of production-distribution system to a sudden 10% increase in retail sales
(as presented in Forrester 1958d, p. 43)................................................................................ 12 Figure 9.—Production-Distribution System as presented in D-0034 (Forrester 1959a, p. 7) ...... 13 Figure 10.—Factory-Production Sector in D-0051 (Howard 1959)............................................. 14 Figure 11.—Factory-Labor Sector in D-0051 (Howard 1959)..................................................... 14 Figure 12.—Factory-Cash Sector in D-0051 (Howard 1959) ...................................................... 15 Figure 13.—Customer Sector in D-0051 (Howard 1959) ............................................................ 15 Figure 14.—Four-Stage Industry Model Simulation Table Set Up (from Fey 1961a, D-100-1 p.
1) ........................................................................................................................................... 16 Figure 15.—Organization of Production Distribution System (Forrester 1961, p. 22 and 36) .... 17 Figure 16.—Response of the Production Distribution System to an Increase in retail sales of 10%
(as presented in Forrester 1961, p. 24).................................................................................. 18 Figure 17.—Organization of Production Distribution System (from Fey 1961d, D-102-1) ........ 19 Figure 18.—Setup for one sector of simulation (Figure 2-1 in Jarmain 1963, p. 7)..................... 20 Figure 19.—Distribution System presented in D-1140-1 (Budden 1969, p. 1) ............................ 21 Figure 20.—A Schematic View of the Flows of Orders and Beer (Miller 1973, p. 9)................. 22 Figure 21.—One Sector for the Hand Simulation (Miller 1973, p. 15) ........................................ 23 Figure 22.—Beer Game Past-History (1973-1992) ...................................................................... 24 Figure 23.—Beer Game Board (as presented in Sterman 1989, p. 327) ...................................... 25 Figure 24.—Manage my Position Syndrome (from Senge 1990, p. 49-50) ................................. 26 Figure 25.—Beer Game Recent-History (1992-2005).................................................................. 27 Figure 26.—Beer Game Sales (source: System Dynamics Society Office) ................................. 28 Figure 27.—Beer Game Boards Sold (source: System Dynamics Society Office)...................... 28 Figure 28.—Beer Game Boards Sold by Continent (source: System Dynamics Society Office) 29 Figure 29.—Beer Game Boards Sold by Continent (detailed) ..................................................... 30 Figure 30.—Current Version of the Beer Game Board ................................................................ 31 Figure 31.—Current Version of the Beer Game Board (including set-up)................................... 32 Figure 32.—Experimental Results for Typical Trials of the Beer Game (as presented in Figure 4
of Sterman 1989, p. 330)....................................................................................................... 32 Figure 33.—Hierarchy of Explanatory Power (as presented in System_Dynamics_Society 1998)
............................................................................................................................................... 33 Figure 34.—Current Version of the Beer Game Board (enlarged)............................................... 41 Figure 35.—Current Version of the Beer Game Board (with set up and enlarged) ..................... 41

Page 4
Introduction The Beer Game is the most widely known game in the field of system dynamics. It has been played by thousands of people all over the world for almost 50 years. System dynamicists claim that it is one of the best ways to introduce newcomers to the field in an environment that is fun and engaging for learning. Over the years, the Beer Game has provided “a laboratory for exploring how structure influences behavior” (Senge 1990, p. 45) and how delays in the system lead to instability. Additionally, since the System Dynamics Society started selling Beer Game boards as part of their services in 1992, the game has represented a very important source of income for it. Because of the importance of the game to the system dynamics community, we decided to explore its origin and changes over its history. Some questions that have guided our inquiry include:
• Where did the Beer Game come from? • Who invented the Beer Game? • Why has the Beer Game become such a powerful way to communicate very important lessons
that the system dynamics field has to offer to the world? • How can we, as a field, learn from the ‘Beer Game’ experience to create more games that engage
people and deliver powerful insights?
Most of the references to the Beer Game indicate, “it was first developed in the 1960’s at the Massachusetts Institute of Technology’s Sloan School of Management.” (Senge 1990, p. 27) However, detailed specifics about its origin are seldom mentioned or explored.
According to Forrester (2005), the real-life problem that originated the thinking behind what
became the Beer Game was a recurring problem at a General Electric appliance factory. Forrester explains:
“What is now called the Beer Game arose out of discussions with some people at General Electric, [during 1956-57] who were troubled by why their household appliances factory in Kentucky had huge swings in production. They would be working seven days a week, three shifts, one year and then have half the people laid off two or three years later. They would blame such production fluctuation on business cycles, but that was not entirely persuasive.”
After meeting with managers and executives from GE, Forrester, using concepts from
servomechanisms and control theory, generated the first simulation in system dynamics by handwriting the relationships between variables on a sheet of paper in a notebook. In this simulation, Forrester (2005) explains:
“There were columns for employees, production rate, and backlog and inventory; each line was a week. Each week the inventories, backlog, and production rate from the preceding week would be used to decide what change to make in production in the current week. The new production rate would lead to the inventory and backlog they would have in the next week, and so forth down the page. It became evident that even with a constant demand from the market the system would still create the instability the company had been

Page 5
experiencing. That was the start of the system dynamics development. We converted that notebook exercise into what now is known as the Beer Game, it was then the household appliance game or the production-distribution game.”
Today, the Beer Game is a ‘physical simulation’ game3 (using boards, paper slips, chips, etc) that
allows individuals who play it to experience a simplified multi-echelon production-distribution system. In this physical simulation, the players find themselves immersed in a simulated environment that reflects real-life conditions and, at the same time, is simplified in such a way that it can be seen in its entirety by looking around the table. The physical format of the Beer Game (herein called board-based format) is the most commonly used format. Furthermore, many experts think that it is the only format that truly allows the participants to experience all the features that a real system has to offer (Forrester 2005; Meadows 2005). Gaming environments should create great emotional involvement by the participants, and at the same time, hopefully, not teach anything that is incorrect in the process (Forrester 2005). According to Forrester (2005), the Beer Game “is an opener to the importance of serious industrial dynamics simulation and policy studies.” (Forrester 2005)
The Data Used in this Paper The data used in this paper comes from three different sources. First, we relied on published literature dealing with the Beer Game to explore the ‘public’, written version of its history. Second, archival investigation of the D-memo files of the System Dynamics Group at MIT was used to get information about the less well-known written history. Third, interviews with Beer Game experts of the system dynamics community were conducted to account for the unwritten history. The group of experts interviewed was determined using a snowball-sampling technique (Brewer and Hunter 1989; Newman and Benz 1998; Bernard 2000) starting with Professor Jay Forrester4. For a list of the experts contacted following this sampling technique, see Appendix 1 of this document.
Major Phases in Beer Game History How old is the Beer Game? It depends on when you decide that the game was born. If it is when it was first referred to as ‘the Beer Game’, the game is 32 years old. Alternatively, if we count from the first mention of the production-distribution problem in the literature, the game would be 49 years old.
Four major phases in the 49-year history of the Beer Game emerged in our investigation (see Figure 1). First, the pre-history 5 phase that covers 17 years from the first mention of the production-distribution problem to the first mention of the simulation as ‘the Beer Game’ in 1973. Second, the past-history phase that covers 19 years from 1973 to when the System Dynamics Society began selling Beer Game boards in 1992. Third, the recent-history phase that covers the 13 years from 1992 to 2005 including the present form of the game. Last, the future-history 6 phase that deals with the future of the Beer Game. 3 There are several computerized versions available today. For a review of some of these versions, see Li (2000). 4 Note to reviewers: We have not finished the interviews with all the experts, but we hope to do so before the conference. 5 Borrowing the term from a communication from Dr. Dennis Meadows 6 Borrowing from a similar term presented by Arie de Geus (1997) in his work related to organizational longevity: ‘the history of the future.’

Page 6
1956 … 1973 1992…2005
Pre-History
1973…1992
Past-History Recent-History
17 Years 19 Years 13 Years
2005…????
Future-History
? Years
Figure 1.—Major Phases in Beer Game History
Beer Game Pre-History Phase (1956-1973)
The first phase of history of the game starts in 1956 with D-0000 7 (Forrester) and ends in 1973 with the appearance of D-1867 (Miller). In D-0000 (1956) by Professor Forrester, the first mention is made of the production-distribution problem as an important problem to be tackled using system dynamics (industrial dynamics, at the time 8). The pre-history of the game ends in 1973 with D-1867 (Miller) because in that D-memo the simulation is referred to for the first time as the Beer Game. Figure 2 presents details of some documents that are key, in this part of the history, of the Beer Game.
Year 1956 1957 1958 1959 1961 1963 1973
Type of Document D-0000 D-0001 HBR D-0034 Book Book D-1867
Description
Forrester Mentions
Production-Distribution Cycle
R.K. Bennett presents the
equations to be used in the 'production
distribution' ----Model 3
Forrester's article "Industrial
Dynamics" is published in the
July-August Issue
Forrester presents the equations for the production -
distribution system presented in the 1958 HBR
article
Forrester's Industrial
Dynamics Book is published
Production-Distribution Simulation
presented in Problems in Industrial
Dynamics (Ch 2; 2.1)
First mention of the Simulation as The Beer Game
Type of Document Thesis D-0023 D-0049-1 D-1873
Description
Malcom M. Jones Bachelors Thesis
present 'production-distribution'
Model 1
First use of the "production-distribution-advertising" model in a
summer session (August)
Forrester presents the equations for advertising of the
production -distribution
system presented in the 1958 HBR
article
First Time used in a course
Number of Stages Used
3 3 3 3 3 4 4
Names of StagesRetail,
Wholesale, and Factory
Retail, Distributor, and Factory
Retail, Distributor, and Factory
Retail, Distributor, and Factory
Retail, Distributor, and Factory
Retail, Two Distributors, and
Factory
Retail, Two Distributors, and
Factory
Figure 2.—Beer Game Pre-History (1956-1973)
7 D-Memos are part of a filing and archiving system that began with D-0 in 1956. The “D” indicates “document” and the “memo” segment identifies the paper. 8 The Industrial Dynamics Group changed its name to the System Dynamics Group by Professor Forrester’s initiative on October 28, 1970 as documented in D-1399 (1970).

Page 7
What we know now as ‘The Beer Game’ is an evolution of the first work in the industrial dynamics field that dealt with a production-distribution problem that was referred to as the “Production-Distribution Model” in the first D-memos (Bennet 1957; Forrester 1957b, a) of the Industrial Dynamics Group at MIT. This first production-distribution model (organized in various versions—1 through 9), described a three-stage production distribution system consisting of a retailer, a distributor, and a factory.
The first mention of this problem is found on Forrester’s first D-memo ever written, D-0000
(1956). In this memo to the faculty, Forrester explains what is dynamic structure and uses several examples to clarify concepts like stocks, flows, and delays in systems. In his example of economic system models (1956), he explains:
“one should be alert to the individual time lags in a chain like the following which might be part of the system responding to movement from a period of stable consumer production to a new higher stable level requiring new investment in production equipment: Increase in consumption Depletion in retail inventory Depletion in wholesale inventory Depletion in Factory Inventory Higher level of Factory production Continued demand for more goods Decision to invest in more plant Orders for capital equipment Attraction of labor to industries producing capital equipment Lead time for producing capital equipment
If the capital equipment industries do not have sufficient capacity, add:
Installation of equipment in capital goods industries Lead time for producing capital goods for sale Installation of new equipment
Factory lead time to produce consume goods with new equipment
Distribution of additional consumer goods Goods available at consumer level The preceding chain contains both material and information flow steps and one labor mobility item. It does not contain money flow paths that would act as coupling channels between various paths of the chain. This chain is not a model in itself but one of the threads that might be traversed through the interconnected system of a full model. There are actually many important sub-loops in the chain that are not indicated. When the preceding chain is detailed to include typical management policies these introduced amplification into some steps of the sequence.” (p. 15-16)
The very first of these models, the Production-Distribution Model 1, was initially articulated and
presented in the bachelors thesis of Malcolm M. Jones (1957)—first mentioned as part of the industrial dynamics body of knowledge by Roberts (1961b) in D-144-1. Jones’ thesis, “Analysis of the Causes of Inventory and Production Oscillations in a Retail-Wholesale-Factory Distribution System” is the first

Page 8
reference found that deals with this problem. Furthermore, this reference precedes Forrester’s (1958d) Harvard Business Review article that describes the complete production-distribution model that eventually became the Beer Game. Jones’ thesis, supervised by Professor Forrester, expanded on work conducted by Forrester in the Industrial Dynamics Group at MIT enhancing the approach presented in a paper released by the General Electric Company (Mills and Singleton 1956) that dealt with a two-stage production-distribution system (retailer-factory system). The thesis focus was “the stability of the entire distribution system, (i.e. its ability to damp out oscillations that might be introduced), and the effect of the time lags, ordering policies, and inventory policies, inherent in the system upon its stability.” (Jones 1957, p. 5)
Jones (1957), portrayed “a multi loop system [see Figure 3] such as the retail-wholesale -factory distribution system commonly used by numerous American industries.”(p. 6) Jones’ (1957) production-distribution system was a three echelon system with order lags of just one week, a two week lag in purchasing and accounting, and delivery delays between echelons of one week (except for the factory that had a production lead time of 12 weeks).
Figure 3.—Model of a Retail-Wholesale-Factory Distribution System (as presented by Jones 1957, p. 8)
Figure 4 presents the behavior generated by the production-distribution system depicted in Jones’ (1957) work.

Page 9
[A] [B]
Figure 4.—Behavior of Multi-Stage Distribution System (as presented by Jones 1957, p. 8)
The production-distribution model was explored in several ways including adding the effects of capital investment at the factory (Enos 1958) and advertisement (Forrester 1958a).
Forrester (1958b), in his explanations on how to formulate quantitative models of dynamic
behavior of industrial and economic systems, presents a simplified example of a production-distribution system for analysis (see Figure 5). This simplified example is a precursor of the elaborated version presented in Forrester’s later publications (1958d; 1961).
The simplified production-distribution system presented in Forrester (1958b) shows a three-stage
system that includes a retail stage, a distributor stage, and a factory stage.
Figure 5.—Production-Distribution System D-0016 (Forrester 1958b, p. 8)

Page 10
[A] [B]
[C] [D]
Figure 6.—Production-Distribution Model as presented in D-0023 (Forrester 1958c, pp. 12-15)
Page 11
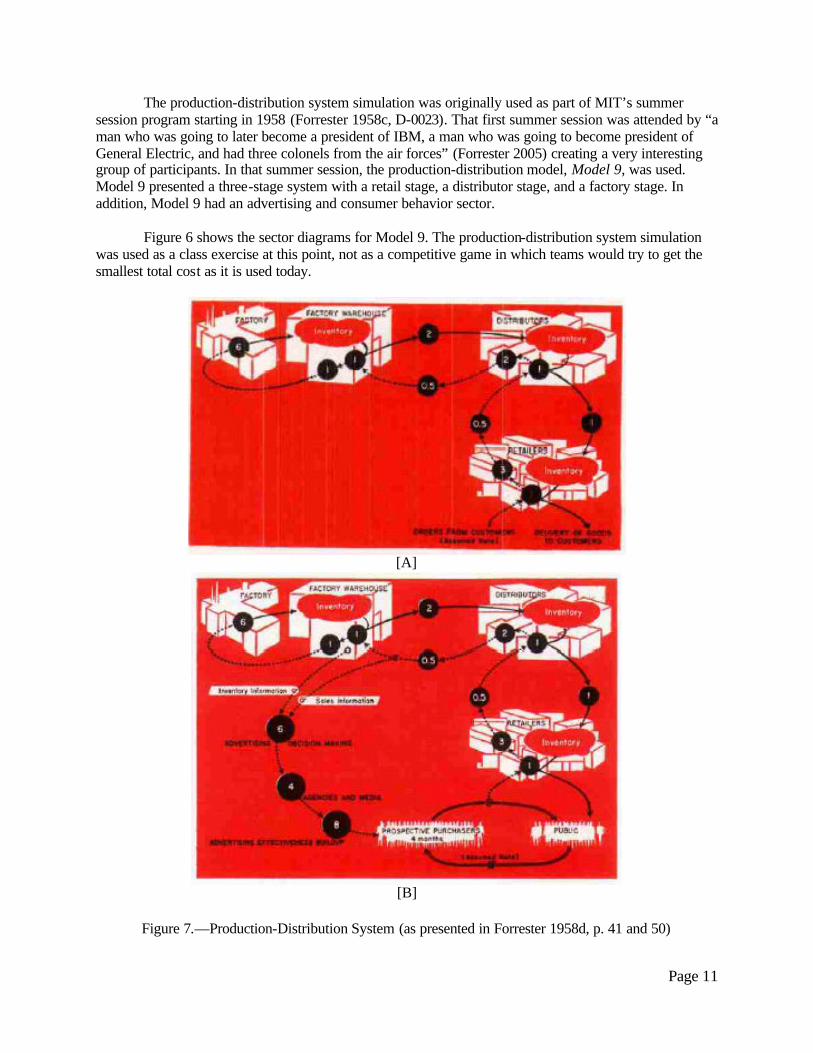
The production-distribution system simulation was originally used as part of MIT’s summer session program starting in 1958 (Forrester 1958c, D-0023). That first summer session was attended by “a man who was going to later become a president of IBM, a man who was going to become president of General Electric, and had three colonels from the air forces” (Forrester 2005) creating a very interesting group of participants. In that summer session, the production-distribution model, Model 9, was used. Model 9 presented a three-stage system with a retail stage, a distributor stage, and a factory stage. In addition, Model 9 had an advertising and consumer behavior sector.
Figure 6 shows the sector diagrams for Model 9. The production-distribution system simulation was used as a class exercise at this point, not as a competitive game in which teams would try to get the smallest total cost as it is used today.
[A]
[B]
Figure 7.—Production-Distribution System (as presented in Forrester 1958d, p. 41 and 50)

Page 12
Later that year, Forrester’s (1958d) Harvard Business Review article was published. In this article, Forrester presents a lengthy explanation of the structure and behavior of a three-stage production-distribution system that includes a retailer, a distributor, and a factory (like the one drafted in D-0023 Forrester 1958c). In this production-distribution system, the effect of advertising is explored with simulation (see Figure 7 for a depiction of the structure of the system studied without [A] and with advertising [B]). Figure 8 presents the dynamic behavior that the system generates without advertising. Oscillation, amplification and phase lag are evident in Figure 8 and this behavior is also observed in output from a typical Beer Game (see Figure 33).
Figure 8.—Response of production-distribution system to a sudden 10% increase in retail sales (as presented in Forrester 1958d, p. 43).
The first detailed class notes and equations of a dynamics model of corporate activity were written by Forrester (1959a) in D-0034. These equations and notes explored the production-distribution sectors discussed in Forrester (1958d). Later, in D-0049-1 (Forrester 1959b) , the advertising formulas are presented and explained in great detail.
According to Forrester (2005), the original version of the Beer Game “grew out of the
background work that led to the first article in the Harvard Business Review” (Forrester 1958d). Furthermore, by being a part of the first summer session in 1958, it became a natural testing ground for developing a hands-on simulation of the production-distribution system and using it as a teaching tool. See Figure 9 for a representation of the system.

Page 13
Figure 9.—Production-Distribution System as presented in D-0034 (Forrester 1959a, p. 7)
During the summer session of 1959, the production-distribution system became a model and
simulation game containing a factory—with production, labor, and inventory—a distributor, and a customer (Howard 1959, D-0051). The factory increased production by hiring more labor, but it had more factory structure, involving hiring and layoffs, than the current Beer Game. The factory was only interested in rapid delivery and maintaining inventory levels over time. Forrester (2005) comments:
“The factory had a production process that depended on employees. Production was proportional to employees, and the player hired with a six-week delay before the new employees could produce. During that six-week training delay, the prospective employees were not yet producing. In addition, if the player wanted to lay off employees, the player had to give them notice (perhaps four weeks) during which they continued to produce before terminating employment. Such additional factory structure accentuated the inherent instability of the system.” (Forrester 2005)
With the addition of a capacity-building process at the factory end, “these [capacity-building]
dynamics would dominate the whole game” (Forrester 2005) creating a more complicated process to control. In short, the change introduced in D-0051 (Howard 1959) represented a big change in the production-distribution game structure making the process more difficult to stabilize. Figures 10 to 13 show the different sectors contained in that version of the production-distribution system.

Page 14
Figure 10.—Factory-Production Sector in D-0051 (Howard 1959)
Figure 11.—Factory-Labor Sector in D-0051 (Howard 1959)

Page 15
Figure 12.—Factory-Cash Sector in D-0051 (Howard 1959)
Figure 13.—Customer Sector in D-0051 (Howard 1959)

Page 16
In the summer session of 1960, a simplified version of the model was used and the exercise was described in D-0071 (Pugh 1960a) as a class simulation. Additionally, in D-0104, Pugh (1960b) for the first time, presents a detailed list of the materials necessary to run the simplified D-0051 (Howard 1959) model. This is the first attempt to standardize the way to conduct this production-distribution game. This simplified version is a four-stage version of a production-distribution system very similar to the lay out of today’s Beer Game. Later, D-memos 100-1, 101-1, and 102-1 (Fey 1961b, d, c) present several of the necessary materials that were used in the 1961 summer session. Figure 14 presents the first ‘board’ of the game as described in D-100-1 (Fey 1961b). Note that the order delays and the delivery delays were a single time unit instead of the current two. D-101-1 (Fey 1961c) presents instructions for playing the game including the sequence of steps necessary to replicate the calculations made by the computerized model.
Figure 14.—Four-Stage Industry Model Simulation Table Set Up (from Fey 1961a, D-100-1 p. 1)
In 1961, Forrester published Industrial Dynamics in which very elaborate descriptions of the model and the behavior of the production-distribution system are presented in Chapter 2 (and simulated in Chapter 15). Forrester (2005) comments that “the game came before the book. I mean the book is a consequence of the thinking that had been going on for three or four years.” Figure 15 presents the organization of the production-distribution system described in Forrester (1961) (with [B] and without [A] the advertising sector).

Page 17
[A] [B]
Figure 15.—Organization of Production Distribution System (Forrester 1961, p. 22 and 36)
Figure 16 shows the simulated response of the system to a sudden 10% increase in retail sales
without the advertising sector. The behavior presented in Figure 16 exhibits the characteristic pattern that the Beer Game exhibits—oscillation, amplification, and phase lag.

Page 18
Figure 16.—Response of the Production Distribution System to an Increase in retail sales of 10% (as presented in Forrester 1961, p. 24)
In D-102-1, Fey (1961d) presents the organization of one sector of the production-distribution system used in the simulation exercise (see Figure 17). In this diagram, one can observe the explicit unfilled orders stock that is used for shipment control, found also in the production-distribution systems explained in D-0034 (Forrester 1959a) and D-0051 (Howard 1959).

Page 19
Figure 17.—Organization of Production Distribution System (from Fey 1961d, D-102-1)
In 1966, the hand simulation exercise changed from the production-distribution system (based on Jarmain’s (1963) Problems in Industrial Dynamics problem 2.1) to a water supply system (Pedersen 1966, D-0914). When this change occurred, the original hand simulation exercise was renamed as the production-inventory project (Swanson 1966, D-0919). Additionally, by 1965 the use of the simulation exercise was present in the undergraduate program (Fey 1965a, D-0884; 1965b, D-0885)
Early descriptions of the simulation procedure appeared in D-0470 (Miller 1962a) and D-0474
(Miller 1962b). Additionally, in Jarmain’s (1963) work, a proposed setup for one sector of the simulation is presented (see Figure 18). The setup includes an explicit backlog, a mail delay of orders, and the inventory of the echelon. The exercise was conceived “for use in an introductory class in industrial dynamics” (Jarmain 1963, p. 5) where students would assume the roles of participants in a simplified production-distribution system. In this exercise, four stages are used, a retailer, two levels of distributors, and a factory warehouse. The initial inventory used is 20 units and the factory lead-time is 5 weeks. The participants were told that the goal was to maintain a constant 20-unit inventory. The sequence of the simulation was described by Jarmain (1963, p. 7).
1. “Fill the order in the unfilled-order backlog by giving the requested
number of units to your customers. 2. If the order was completely filled, remove it from the backlog and
discard it. If it was not completely filled, subtract the units shipped from the units requested and leave the slip in the backlog.
3. Take the units that you are receiving from your supplier and place them in your inventory.

Page 20
4. Record your inventory on the graph supplied. 5. Decide how many units you wish to order and place your order face
down in the mail delay to your supplier. 6. Record on the other graph the number of units you ordered. 7. Take the oldest order in your mail delay and place it in your backlog.
One time period has now passed, and you will repeat the instructions, starting again at 1.”
In the exercise described by Jarmain (1963), a step increase in customer orders from four to six is
suggested at time step three. Additionally, Jarmain (1963) suggests that play continue for approximately 20 time steps. In Jarmain’s (1963) description of the exercise, the only reference to a debrief process is a very basic call for analysis of the results. The description follows:
“After the simulation has been carried through a sufficient number of time steps, compare the graphs that have been plotted, discuss the observed behavior, and attempt to determine the behavior occurred.” (p. 7)
Figure 18.—Setup for one sector of simulation (Figure 2-1 in Jarmain 1963, p. 7)
Additionally, a description of how to conduct a hand simulation exercise appeared in D-0801 (Swanson 1965a) and D-0809 (Swanson 1965b). Furthermore, in D-1140-1 (Budden 1969), presented a one-sector structure of the classroom simulation exercise used in the course Principles of Systems [15.572/3] (see Figure 19).
, During this period, other management games were presented and explored in D-memo files.
These games include the Dominion Typesetters Inc. Game (in Jarmain 1962a, D-357; 1962b, D-358), the SATAN Game (Greer 1962, D-463; 1963a, D-0584; 1963b, D-0587), and the SIM Game (Roberts 1964, D-694). In addition to the development of simulation games, D-0054 (IDG 1959) explored “management policies for improving stability of distribution systems” (p.3) as feasible thesis work (bachelors and masters). Additionally, in D-0290 (Roberts 1961a, p.11) , the development of top management industrial dynamics games is introduced.

Page 21
Figure 19.—Distribution System presented in D-1140-1 (Budden 1969, p. 1)
The classroom simulation exercise described in D-1140-1 (Budden 1969) is a four-stage production-distribution system in which all the echelons have an initial inventory of 12 units 9 and have 4 units in the delivery delay and the production pipeline is full. As well, the incoming orders, for all echelons, are four units. The cost for carrying inventory is $0.50 per week per unit and the cost of backlog is $2.00 per unit per week. The simulation exercise was set up to replicate a situation that can resemble real life experience.
Miller (1973), in D-1867, mentioned for the first time, that “the basis for this game will be a
situation taken from industrial experience” (p. 2). The document reads “in order to meet customer demand, many beer companies have to maintain large inventories of beer” and that “a significant activity of the beer company is to maintain the minimum amount of beer necessary to satisfy customer demand reasonably quickly” setting the stage for what we know today as the Beer Game. Miller (1973) also writes about a four-stage Beer Game. This structure includes a retailer, a wholesaler, a distributor, and a factory (Figure 20 was used to show the schematics of the game).
9 In D-1140-1 (1969), the initial inventory is referred to as “12 poker” (probably referring to poker chips)

Page 22
Figure 20.—A Schematic View of the Flows of Orders and Beer (Miller 1973, p. 9)
The order and delivery delays are described as being a one-week delay for three echelons and two weeks for the factory (one additional week for the production order) (Miller 1973, p. 4). However, in a one-sector diagram of the game (see Figure 21), it appears that a two-week delay is built into the structure. The cost of carrying inventory or having a backlog is identical to that described in the previous version. What has been added by Miller, since Budden (1969) is that the objective of the simulation is to minimize the total cost of the distribution chain. Furthermore, the duration of the simulation is extended from 20 to 40 weeks to generate the dynamics (today, in general, the game is played to 36 weeks).
Miller’s (1973, p. 10) instructions to facilitators contain the following eight steps that constitute
one week’s simulation:
1. “Fill orders” Fill from inventory any order in the unfilled order backlog by placing the total requested number of units in the right half of the shipping delay to the sector on your left. If zero cases of beer are shipped place apiece of paper in the delay to occupy the place of the shipment as it is moved through the day. If the order was completely filled, remove it from the backlog and discard it. If it was not completely filled, subtract the units filled shipped from the units requested and leave the slip in the backlog.
2. “Record Effective Inventory” Record your effective inventory on the graph provided. Effective inventory is equal to actual inventory minus order backlog if any, and can be either positive or negative. (Negative effective inventory indicates “out-of-beer” situations).
3. “Advance Shipment” Advance the cases of beer in the left half of the shipping delay to the left.
4. “Advance Shipping Delay” Advance the units in the right half of the shipping delay to the left.
5. “Make Order” Decide how many units you wish to order and place your order face down in the left half of the order mail delay to your supplier, the sector on your right.
6. “Record Order” Record on the other graph the number of units that you ordered.

Page 23
7. “Receive Order” Take the order in the right half of the mail delay and place it in your backlog.
8. “Advance Order Slip” Advance the order slip from the left half of the mail delay to the right. The simulation of one week’s activities is now completed, and the sequence begins again at step one.
Another feature of this first description of the Beer Game is that the structure includes an explicit
order backlog that is differentiated from the actual inventory. This feature forces people to visualize the two quantities (see Figure 21). Additionally, in Figure 21 the different steps of the game are identified, however, some of them do not coincide with the description presented. It should also be noted that the proposed sequence of steps does not replicate the sequence of calculations used in the computerized model: Levels, Auxiliaries, Rates, and Levels.
Figure 21.—One Sector for the Hand Simulation (Miller 1973, p. 15)

Page 24
Beer Game Past-History Phase (1973-1992) The next phase in the history of the Beer Game is the past-history phase that goes from the first mention of the game as the Beer Game (1973) to the moment when the first Beer Game board was sold by the System Dynamics Society (1992). Figure 22 shows a detailed account of the different documents that describe part of this phase of the history of the game.
Year 1973 1980 1984 1989 1990 1991 1992
Type of Document
D-1867 D-3236 D-3679 Article Book D-4200 Game Boards
Description
First mention of the Simulation as The Beer Game
Production-Distribution
Game debrief presented by Peter Senge
Instructions for Running the Beer Distribution Game by John Sterman
John Sterman's Modeling
Managerial Behavior is published in Management
Science
Peter Senge uses the 'Beer Game' in Chapter 2 of
'the Fifth Discipline'
Daniel Kim presents Revised materials for the
Beer game
First Time that a Beer Game
boards is Sold by the System
Dynamics Society
Type of Document
D-1873 Video D-4281-1
Description
First Time used in a regular course 15.879 at MIT
The MacNeil/Lehrer
News Hour Video "Focus: Risky Business" with
John Sterman is realeased
(WGBH-TV Boston)
An annotated bibliography for the Beer Game
by John Sterman
Number of Stages Used
4-
4 4 3 4 4
Names of StagesRetail, Two
Distributors, and Factory
-
Retailer, Wholesaler,
Distributor, and Factory
Retailer, Wholesaler,
Distributor, and Factory
Retail, Distributor, and Factory
Retailer, Wholesaler,
Distributor, and Factory
Retailer, Wholesaler,
Distributor, and Factory
Figure 22.—Beer Game Past-History (1973-1992)
The first reference of the use of the Beer Game, rather than the production-distribution exercise, in a regular MIT course is found in Goodman (1973) , D-1873. Senge (1980) , in D-3236, presents a five-page document suggesting how to debrief the game to enhance the lessons for the benefit of the players. This is the first document that presents a detailed version of how to communicate the powerful insights the game has to offer. Senge (1980), organizes the debrief in a post-game discussion around nine points. A simplified version of the points made by Senge is presented here 10:
1. Tape up all the graphs of the results. 2. Find out which team won. 3. Clarify the purpose of the game. 4. Ask participants what their experience of playing the game was. 5. After a few minutes of discussion, center the attention on the graphs of the results. 6. Emphasize that the internal structure is causing the behavior.
10 For details of the points, see D-3236 or Senge (1990) chapter 3.

Page 25
7. Explain how the understanding of the systemic structure generates leverage. 8. If time permits, have people think about examples of structures that create the behavior that they observe. 9. Bring up the problem of “how do we deal more effectively with underlying structure?” Explaining that precisely this is the purpose of system dynamics.
Four years later, in D-3679, Sterman (1984) “outlines the protocol for the beer distribution game
developed to introduce people to concepts of system dynamics” (p. 1). This provides the system dynamics community a reference on how to conduct game sessions in an organized fashion. Sterman points out that sessions can vary in size from as few as four participants to as many as 60 11.
Sterman (1989) used the Beer Game as a research platform to investigate managerial behavior.
Sterman’s (1989) results 12, published in Management Science journal, gave the field, and the Beer Game, exposure in the larger scientific community. Figure 23 presents the layout of the Beer Game board used by Sterman in his investigation. This board is essentially the same as the current version of the Beer Game.
Figure 23.—Beer Game Board (as presented in Sterman 1989, p. 327)
Following Sterman’s (1989) publication, Senge (1990) , in Chapter 3 of The Fifth Discipline, uses
the Beer Game as an example in which he explores the question of whether people are prisoners of the system or of their own thinking. In his explanation of the Beer Game though, Senge uses a three-stage production distributor system (retailer, wholesaler, and brewery) instead of the four-stage system described and used since 1961 at MIT. Senge’s system is a version of the game that is similar to the original production-distribution system presented by Forrester (1961) and other members of the Industrial Dynamics Group at MIT pre-1961.
Senge’s explanation includes a change in customer orders from four cases per week to eight cases
per week introduced at week 2 in the game (in the current version of the game this occurs in week 5). Additionally, Senge (1990) makes the case for a management syndrome that emerges in the process of the game: the manage-my-position syndrome. Senge argues that managers in situations like those in the game
11 Sterman reports that the Beer Game session facilitated for incoming MBA class at MIT every year often has more than 400 participants. 12 Modeling Managerial Behavior: Misperceptions of Feedback in a Dynamic Decision Making Experiment

Page 26
tend to forget about the complete system and concentrate on managing their own echelon (Figure 24 is a graphic representation). This result is consistent with findings by Sterman (1989) related to the factors that contribute to the instability of the supply chain. According to Sterman, one important factor is the misperception of feedback and the failure to account for the supply line. Senge (1990) proposes two rules to overcome that syndrome and behavior: (1) Keep in mind the beer that you ordered but, because of the delay, has not yet arrived, and (2) Don’t panic.
[A]
[B]
Figure 24.—Manage my Position Syndrome (from Senge 1990, p. 49-50)
One year after Senge’s (1990) work was published, Kim (1991) , in D-4200, presented a set of
revised Beer Game materials that allowed for a more systematic production of all the necessary components of a Beer Game session. Then, in D-4281-1 (Sterman 1991), given the growing use of the Beer Game in education and research, Sterman (1991) authors an annotated bibliography of publications

Page 27
that deal with Beer Game related issues. This momentum revealed a need for easy access to standardized Beer Game materials. The System Dynamics Society recognized this need and, in 1992, started selling Beer Game boards as part of its normal activities.
Beer Game Recent-History Phase (1992-2005)
The recent-history phase of the game goes from 1992, when the System Dynamics Society began to sell Beer Game boards, to 2005. Figure 25 shows a description of the documents and events that can be viewed as important in this part of the Game’s history.
Year 1992 1993 2004
Type of Document
Game Board D-4328 Game Boards
Description
First Time that a Beer Game
boards is Sold by the System
Dynamics Society
Sterman's Teaching Takes
Off : Flight Simulators for Management Education i s
published
The System Dynamics Society
sells a record number of Beer
Game boards in a year
Type of Document
D-4281-1 D-4377
Description
An annotated bibliography for the Beer Game
by John Sterman
A computerized version of the Beer Game is presented by
Michael Goodman, Brian Kreutzer, John Sterman, and
David Kreutzer
Number of Stages Used
4 4 4
Names of Stages
Retailer, Wholesaler,
Distributor, and Factory
Retailer, Wholesaler,
Distributor, and Factory
Retailer, Wholesaler,
Distributor, and Factory
Figure 25.—Beer Game Recent-History (1992-2005)
A typical Beer Game set sold by the System Dynamics Society includes a board, chips, order slips, a deck of customer orders, the MacNeil Lehrer video showing the game being played, a set of instructions, and a set of charts and graphs to be used in the game13.
Beer Game Numbers Since 1992, the System Dynamics Society has been the official distributor of Beer Game boards
in the system dynamics community. With this move, the Beer Game became the flagship game of the community. During the first year, the Society sold approximately 20 boards and in the second year, 225—a ten-fold increase in sales. During a 13-year period, the sales of Beer Game boards have been growing as shown in Figure 26. As shown the figure below, the trend of Beer Game boards sold per year has been increasing over time.
13 The System Dynamics Society, in order to generate economies of scale orders Beer Game boards from its supplier in 1,000-unit lots. Given that each board weights approximately 2 pounds, the shipment comes to the System Dynamics Society’s office literally a ton at a time.

Page 28
Beer Game Boards Soldby the System Dynamics Society
0200400600800
10001200
1992
est
1993
est
1994
est
1995
est
1996
est
1997
est
1998
1999
2000
2001
2002
2003
2004
Bo
ard
s p
er Y
ear
010002000300040005000600070008000
Acc
um
ula
ted
Bo
ard
s
Boards per Year Accumulated Boards
Figure 26.—Beer Game Sales (source: System Dynamics Society Office)
The System Dynamics Society has been selling Beer Game boards since 1992 to a variety of clients and geographic destinations. The different clients include universities, consulting firms, businesses, training agencies, government agencies, etc. In 2004, the academic clients represented 25% of the total sales, the non-academic clients 48%, and unknown 27% (see Figure 28).
Boards Sold by Type of Client (2004)
Non-Academic
48%
Unknown27%
Academic25%
Figure 27.—Beer Game Boards Sold (source: System Dynamics Society Office)
Additionally, a breakdown by continent shows that two thirds of the boards sold in 2004 are shipped to North/Central/South America making it the largest recipient of Beer Game boards in the world (see Figure 29).

Page 29
Boards Sold by Continent (2004)
America66%
Europe20%
Oceania9%
Asia4%
Africa1%
Figure 28.—Beer Game Boards Sold by Continent (source: System Dynamics Society Office)
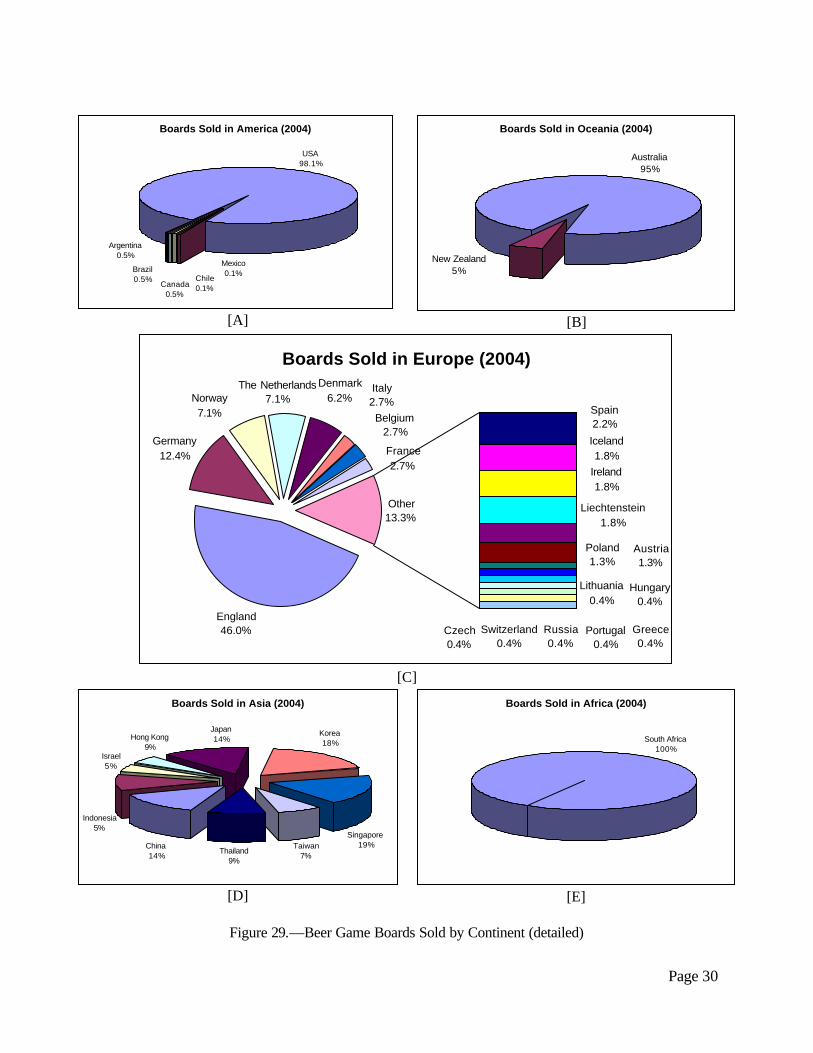
Figure 29 shows the breakdown per country for each continent. In the Americas, the US received 98.1% of the Beer Game boards, in Oceania; the largest buyer was Australia with 95% of the boards. In Europe, the largest buyer was England with 46% and in Asia there were four countries that came very close, Singapore (19%), Korea (18%), China (14%), and Japan (14%). Lastly, in Africa, South Africa accounted for 100% of the sales.
Page 30
Boards Sold in America (2004)
USA98.1%
Argentina0.5%
Brazil0.5%
Canada0.5%
Chile0.1%
Mexico0.1%
[A]
Boards Sold in Oceania (2004)
Australia95%
New Zealand5%
[B]
Boards Sold in Europe (2004)
England46.0%
Germany12.4%
Other13.3%
Greece0.4%
Poland1.3%
Hungary0.4%
Lithuania0.4%
Portugal0.4%
Russia0.4%
Switzerland0.4%
Czech0.4%
Austria1.3%
Liechtenstein1.8%
Ireland1.8%
Iceland1.8%
Spain2.2%
The Netherlands7.1%Norway
7.1%
Denmark6.2%
Italy2.7%
France2.7%
Belgium2.7%
[C]
Boards Sold in Asia (2004)
China14%
Thailand9%
Taiwan7%
Singapore19%
Korea 18%
Japan14%
Israel5%
Indonesia5%
Hong Kong9%
[D]
Boards Sold in Africa (2004)
South Africa100%
[E]
Figure 29.—Beer Game Boards Sold by Continent (detailed)

Page 31
Current Version of the Beer Game The current version of the Beer Game board is shown in Figure 3114. The current version represents a four-stage system that includes a retailer, a wholesaler, a distributor, and a factory. This version includes two-week delays both in the ordering process as in the shipment of goods down the pipeline. Additionally, the system has a one-week delay in the ordering side of the factory end and a two-week delay in production. The factory has unlimited capacity and unlimited access to raw materials.
Figure 30.—Current Version of the Beer Game Board
The rules15 of the current version of the Beer Game are as follows (System_Dynamics_Society 1998) 16:
(a) Have each team pick a name for their brewery. (b) Have each person ante up $1.00, or an appropriate amount, which will go tot the winning
team. (c) The object of the game is to minimize total cost for your team. The team with the lowest total
costs wins. Costs are computed in the following way: the carrying costs of inventory are $0.50 per case per week. Out-of-stock costs, or backlog costs, are $1.00 per case per week. The costs of each stage (retailer, wholesaler, distributor, factory) for each week, added up for the total length of the game, determine the total cost.
(d) No communication between positions. […] The only communication between sectors should be through the passing of orders and the receiving of beer.
(e) Retailers are the only ones who know what the customers actually order. They should not reveal this information to anyone else.
The initial conditions include 12 chips (representing 12 cases of beer) in each inventory position
(see red chips in Figure 31) and 4 chips in each shipping box and production delay. Additionally, order slips with “4” written on them should be facing down in each order box (orders placed, incoming orders, and production request). The provided deck of customer order cards includes orders for weeks one through fifty, which coincides with what the players are told that the game will last. However, the game is typically played for 36 weeks because by then the oscillatory dynamics have merged and the horizon effect can be avoided.
14 See Appendix II for an enlarged picture of the Beer Game board. 15 A synthesized version of the rules is presented, for a full version go to (System Dynamics Society, 1998) 16 These instructions are an adaptation of instructions written by John Sterman

Page 32
Figure 31.—Current Version of the Beer Game Board (including set-up)
Typically, Beer Game sessions run for three to four hours including the debriefing of the game. The typical games generate the behavior shown in Figure 32.
Figure 32.—Experimental Results for Typical Trials of the Beer Game (as presented in Figure 4 of Sterman 1989, p. 330)
The instructions provided by the System Dynamics Society include a guide for post-game discussion that include:
1- Get all the graph sheets of results (orders, effective inventory) taped up for display. 2- Find out which team won (lowest total cost) and distribute the winnings.

Page 33
3- Clarify that although they played the game to minimize cost, that is not the real purpose of the game. The game is designed to:
a. Give players an experience of playing a role in the system b. Show them how “structure produces behavior”
4- Ask participants what their experience of playing the game was. 5- After a few minutes (about 10) of discussion, look at the graph of the results. Ask them, “What
commonalities do you see in the graphs for the different teams?” 6- After having them all see the extent to which different people produce similar results in a
common structure, you then need to move on to what is usually the most powerful behavior. 7- Explain that the assumption that the system’s problems are caused by the customer stems from
the external orientation most of us adopt in dealing with most problems. A Figure suggested to be used is presented in Figure 33.
Figure 33.—Hierarchy of Explanatory Power (as presented in System_Dynamics_Society 1998)
The steps of the game, as described in the System Dynamics Society’s (1998) instructions are as follows:
1- “Receive Inventory and advance the shipping delays. Factory advance the production delay.
2- Look at incoming orders and fill orders. (Retailer looks at customer order cards. Factory looks at incoming orders, not the production request). All incoming orders PLUS orders in backlog must be filled. If your inventory is insufficient to fill incoming orders plus backlog, fill as many orders as you can and add the remaining orders to your backlog.
3- Record your inventory or backlog. 4- Advance the order slips; and the brewery brews. That is, the factory
converts the production request from last week into cases of beer and put the cases (chips) in the first production delay.
5- Place and record your orders. Factory places and records its production requests.” (p. 9)
Page 34
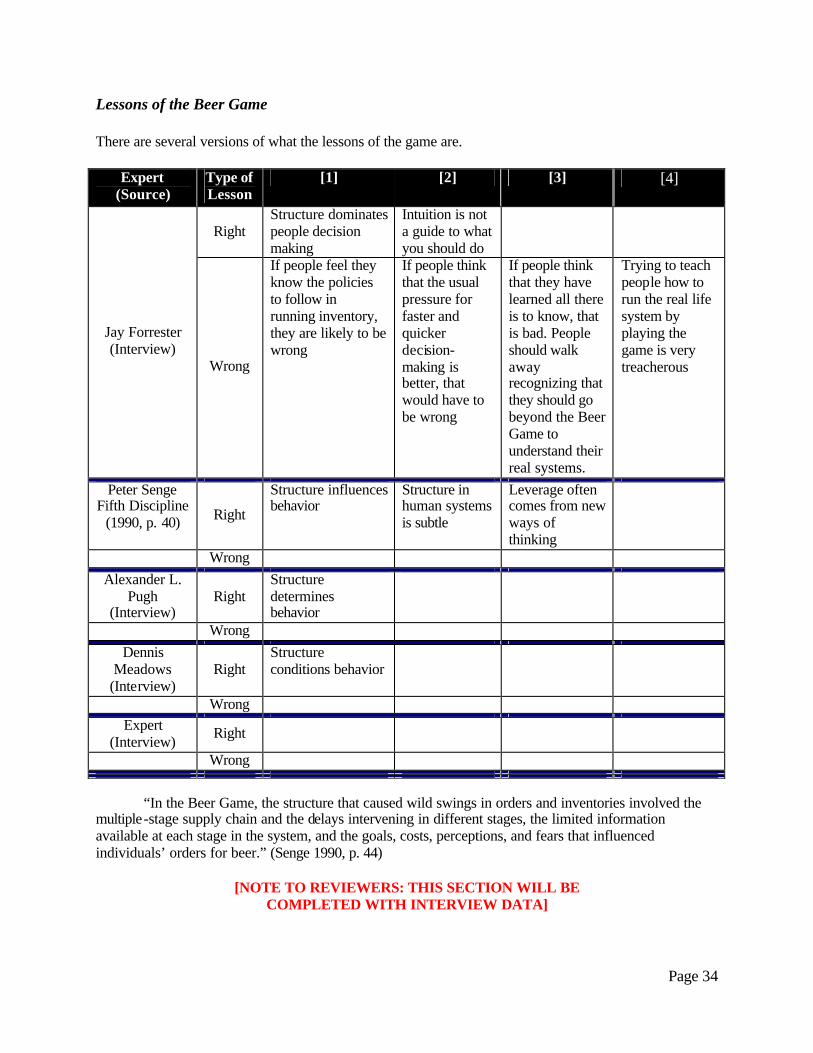
Lessons of the Beer Game
There are several versions of what the lessons of the game are.
Expert (Source)
Type of Lesson
[1] [2] [3] [4]
Right Structure dominates people decision making
Intuition is not a guide to what you should do
Jay Forrester (Interview)
Wrong
If people feel they know the policies to follow in running inventory, they are likely to be wrong
If people think that the usual pressure for faster and quicker decision-making is better, that would have to be wrong
If people think that they have learned all there is to know, that is bad. People should walk away recognizing that they should go beyond the Beer Game to understand their real systems.
Trying to teach people how to run the real life system by playing the game is very treacherous
Peter Senge Fifth Discipline
(1990, p. 40) Right
Structure influences behavior
Structure in human systems is subtle
Leverage often comes from new ways of thinking
Wrong Alexander L.
Pugh (Interview)
Right Structure determines behavior
Wrong Dennis
Meadows (Interview)
Right Structure conditions behavior
Wrong Expert
(Interview) Right
Wrong “In the Beer Game, the structure that caused wild swings in orders and inventories involved the
multiple-stage supply chain and the delays intervening in different stages, the limited information available at each stage in the system, and the goals, costs, perceptions, and fears that influenced individuals’ orders for beer.” (Senge 1990, p. 44)
[NOTE TO REVIEWERS: THIS SECTION WILL BE
COMPLETED WITH INTERVIEW DATA]

Page 35
What Are People Really Learning with the Beer Game?
People seem to learn about the importance of systemic structure and the power of acknowledging feedback. However, it seems to be the case that people, after playing the game, keep on repeating the same mistakes repeatedly.
If people played the game repeatedly until they learned, probably they would be capable of dealing with a certain type of change introduced in the game (step function). However, it seems to be that the level of learning acquired by just playing the game does not allow people to deal with every type of input change in the game.
[NOTE TO REVIEWERS: THIS SECTION WILL BE COMPLETED WITH INTERVIEW DATA]
Beer Game Future-History Phase (2005-????) Exploration of the additional contributions that the game has to offer
Exploration of different versions of the game 1. Normal version 2. Expert Version
a. Elaborated version of the Factory (capacity building) side of the game. Exploration of ‘improvements’ to the game New Games to be developed
[NOTE TO REVIEWERS: THIS SECTION WILL BE
COMPLETED WITH INTERVIEW DATA]
Conclusions
The Beer Game, or some varia tion of it, has been used for almost 50 years to show how structure determines behavior and why it is important to understand that underlying structure causes behavior.
The System Dynamics Society, from 1992 to 2004, sold more than 7,500 Beer Game boards that
have gone to every corner of the world. If the board were used just once (which is a very conservative assumption), more than 30,000 people would have been exposed to the game; if the board games sold by the System Dynamics Society were used 10 times each, the figure grows to 300,000 people.
The game has maintained its structure and general mechanisms of play for more than 30 years
and it is unlikely that it will change. The most criticized problem with the game is that ‘it takes too long to play’, and that ‘it is very confusing’. However, these characteristics seem to be present in real life in such a way that the players and facilitators keep on finding the experience very rewarding and informative. It seems to be that; the Achilles heel of the game has to do with how to communicate the powerful insights that the game has to offer. Forrester expresses it by saying “you want to be able to communicate the insights that the game has to offer, create great emotional involvement on the part of participants, and at the same time, hopefully, not teach anything that is incorrect in the process” (Forrester 2005). It seems to be that “what is important is not the game, but the gaming experience” (Meadows 2005) and the facilitator plays a key role in generating an adequate gaming experience with the Beer Game. Additional effort to enhance the current support materials for debriefing the game is warranted. To build on the success of the Beer Game as a vehicle to disseminate system dynamics concepts, the

Page 36
development of new games (much like Meadows et. al. have been doing for many years) is a promising avenue for research and development within the system dynamics community.
[TO BE COMPLETED]
Beer Game (soon to be annotated) Bibliography
Following Sterman’s (1992) effort to present a useful list of references related to the beer distribution game, we present an updated list of references in chronological order. See in References section the next list of references:
1. Forrester, J. W. (1956). D-0000 Note to the Faculty Research Seminar. Cambridge, MA, MIT System Dynamics Group: 28.
2. Jones, M. M. (1957). Analysis of the Causes of Inventory and Production Oscillations in a Retail-Wholesale-Factory Distribution System. Bachelor of Science Degree Thesis presented to the Economics, Politics, and Engineering Department. Cambridge. MA, M.I.T: 72.
3. Bennet, R. K. (1957). D-0001 The Difference Equations for the Production-Distribution Model 3. Cambridge, MA, MIT System Dynamics Group: 15.
4. Croson, R., K. Donohue, E. Katok and J. Sterman (2005). Order Stability in Supply Chains: Coordination Risk and the Role of Coordination Stock. Unpublished Manuscript: 31.
[TO BE COMPLETED, PROBABLY AFTER THE CONFERENCE]
References 1 Bennet, R. K. (1957). D-0001 The Difference Equations for the Production-Distribution Model 3.
Cambridge, MA, MIT System Dynamics Group: 15.
2 Bernard, H. R. (2000). Social Research Methods: Qualitative and Quantitative Approaches. Thousand Oaks, California, Sage Publications, Inc.
3 Brewer, J. and A. Hunter (1989). Multimethod Research: A Synthesis of Styles. Newbury Park, CA, Sage Publications.
4 Budden, J. (1969). D-1140-1 Principles of Systems/Preview of Classroom Simulation. Cambridge, MA, MIT System Dynamics Group: 3.
5 Enos, J. L. (1958). D-0018 Production-Distribution Model With Capital Investment. Cambridge, MA, MIT System Dynamics Group: 14.
6 Fey, W. R. (1961a). D-100-1 Instructions to Staff for Simulation of Four-Stage Industry Model. Cambridge, MA, MIT System Dynamics Group: 2.
7 Fey, W. R. (1961b). D-0100-1 Instructions to Staff for Simulation of Four-Stage Industry Model. Cambridge, MA, MIT System Dynamics Group: 2.

Page 37
8 Fey, W. R. (1961c). D-0101-1 Procedure for Simulation of One Stage of Four-Stage Industry Model (D-0101-1 retyped with minor revisions and given to Summer Session 1961). Cambridge, MA, MIT System Dynamics Group: 1.
9 Fey, W. R. (1961d). D-0102-1 Diagram 1--Flow Diagram for One Stage of Four-Stage Industry. Cambridge, MA, MIT System Dynamics Group: 1.
10 Fey, W. R. (1965a). D-0884 Undergraduate Systems Program/Preparation for Class Simulation. Cambridge, MA, MIT System Dynamics Group: 1.
11 Fey, W. R. (1965b). D-0885 Undergraduate Systems Program/Follow-up of Class Simulation. Cambridge, MA, MIT System Dynamics Group: 1.
12 Forrester, J. W. (1956). D-0000 Note to the Faculty Research Seminar. Cambridge, MA, MIT System Dynamics Group: 28.
13 Forrester, J. W. (1957a). D-0002 Ordering Decision Criteria to Use in Production-Distribution Inventory Model 4 (Revised version of model 3). Cambridge, MA, MIT System Dynamics Group: 7.
14 Forrester, J. W. (1957b). D-0003 Conditions for computing Production-Distribution Model 4. Cambridge, MA, MIT System Dynamics Group: 3.
15 Forrester, J. W. (1958a). D-0011 Production-Distribution-Consumer-Advertising System. Cambridge, MA, MIT System Dynamics Group: 14.
16 Forrester, J. W. (1958b). D-0016 Formulating Cuantitative Models of Dynamic Behavior of Industrial and Economic Systems, Part I. Cambridge, MA, MIT System Dynamics Group: 55.
17 Forrester, J. W. (1958c). D-0023 Production-Distribution System. Cambridge, MA, MIT System Dynamics Group: 15.
18 Forrester, J. W. (1958d). "Industrial Dynamics: A Major Breakthrough for Decision Makers." Harvard Business Review 26(4): 37-66.
19 Forrester, J. W. (1959a). D-0034 Equations for Production Distribution System--A Section of Industrial Dynamics Class Notes. Cambridge, MA, MIT System Dynamics Group: 57.
20 Forrester, J. W. (1959b). D-0049-1 Equations for Advertising in the Production-Distribution System in the July 1958 Harvard Business Review Article. Cambridge, MA, MIT System Dynamics Group: 18.
21 Forrester, J. W. (1961). Industrial Dynamics. Cambridge MA, Productivity Press.
22 Forrester, J. W. (2005). Interview on "The History of the Beer Game".
23 Goodman, M. (1973). D-1873 Introductory Course in System Dynamics. Cambridge, MA, MIT System Dynamics Group: 21.
24 Greer, C. (1962). D-0463 Industrial Dynamics/The SATAN Corporation and the SATAN Management Game. Cambridge, MA, MIT System Dynamics Group: 8.

Page 38
25 Greer, C. (1963a). D-0584 Industrial Dynamics/Progress Report - SATAN Management Game/End of month 27. Cambridge, MA, MIT System Dynamics Group: 1.
26 Greer, C. (1963b). D-0587 Industrial Dynamics/Progress Report - SATAN Management Game/End of month 30. Cambridge, MA, MIT System Dynamics Group: 1.
27 Howard, D. J. (1959). D-0051 Description of the Model of Production, Scheduling and Customer Delay as Used in the 1959 Summer Session. Cambridge, MA, MIT System Dynamics Group: 34.
28 IDG (1959). D-0054 Industrial Dynamics Thesis Suggestions. Cambridge, MA, MIT System Dynamics Group: 7.
29 Jarmain, E. (1962a). D-0357 Industrial Dynamics/Classroom Simulation Exercise--Dominion Typesetters Inc. Cambridge, MA, MIT System Dynamics Group: 5.
30 Jarmain, E. (1962b). D-0358 Industrial Dynamics/Instructions for Instructor/Classroom Simulation Exercise/Dominion Typesetters Inc. Cambridge, MA, MIT System Dynamics Group: 5.
31 Jarmain, E. W. (1963). Problems in Industrial Dynamics. Cambridge, MA, M.I.T. Press.
32 Jones, M. M. (1957). Analysis of the Causes of Inventory and Production Oscillations in a Retail-Wholesale-Factory Distribution System. Bachelor of Science Degree Thesis presented to the Economics, Politics, and Engineering Department. Cambridge. MA, M.I.T: 72.
33 Kim, D. (1991). D-4200 Revised Beer Game Materials. Cambridge, MA, MIT System Dynamics Group: 7.
34 Meadows, D. (2005). Interview on "The History of the Beer Game".
35 Miller, J. (1973). D-1867 15.879 - Instructions for Group Session On the Hand Simulation Game (Spring 1973). Cambridge, MA, MIT System Dynamics Group: 15.
36 Miller, R. F. (1962a). D-0470 Industrial Dynamics/System Description for Classroom Simulation. Cambridge, MA, MIT System Dynamics Group: 4.
37 Miller, R. F. (1962b). D-0474 Industrial Dynamics/Directions to Staff for Administering Classroom Simulation. Cambridge, MA, MIT System Dynamics Group: 2.
38 Mills, H. D. and R. R. Singleton (1956). Inventory and Production Stability. Operations Research and Synthesis: Consulting Services. New York, General Electric Company.
39 Newman, I. and C. R. Benz (1998). Qualitative-Quantitative Research Methodology: Exploring the Interactive Continuum. Carbondale, IL, Southern Illinois University Press.
40 Pedersen, E. V. (1966). D-0914 Industrial Dynamics/Hand Simulation Exercise. Cambridge, MA, MIT System Dynamics Group: 3.
41 Pugh, A. L. (1960a). D-0071 Schedule/1960 M.I.T. Summer Session / Industrial Dynamics Course 15.21S/June 14 through June 24. Cambridge, MA, MIT System Dynamics Group: 5.
42 Pugh, A. L. (1960b). D-0104 Materials for the 1960 Summer Session simulation of a simplified D-51 model. Cambridge, MA, MIT System Dynamics Group: 1.

Page 39
43 Roberts, E. (1961a). D-290 Sugestions for Industrial Dynamics Theses. Cambridge, MA, MIT System Dynamics Group: 11.
44 Roberts, E. (1964). D-0694 SIM Game. Cambridge, MA, MIT System Dynamics Group: 2.
45 Roberts, E. B. (1961b). D-144-1 Complete Listing of Industrial Dynamics Theses. Cambridge, MA, MIT System Dynamics Group: 4.
46 Senge, P. (1980). D-3236 Production Distribution Game Debrief. Cambridge, MA, MIT System Dynamics Group: 5.
47 Senge, P. M. (1990). The Fifth Discipline: the Art and Practice of the Learning Organization. New York, Doubleday/Currency.
48 Sterman, J. D. (1984). D-3279 Instructions for Running the Beer Distribution Game. D-memo files, MIT-System Dynamics Group: 18.
49 Sterman, J. D. (1989). "Modeling Managerial Behavior: Misperceptions of Feedback in a Dynamic Decision Making Experiment." Management Science 35(3): 321-339.
50 Sterman, J. D. (1991). D-4281-1 The Beer Distribution Game: An Annotated Bibliography. D-Memo Files. Cambridge, MA, MIT-System Dynamics Group: 2.
51 Sterman, J. D. (1992). The Beer Distribution Game: An Annotated Bibliography Covering its History and Use in Education and Research. Cambridge, MA, MIT: 2.
52 Swanson (1966). D-0919 Industrial Dynamics/Production Inventory Project. Cambridge, MA, MIT System Dynamics Group: 4.
53 Swanson, C. V. (1965a). D-0801 Industrial Dynamics/Hand Simulation Exercise. Cambridge, MA, MIT System Dynamics Group: 3.
54 Swanson, C. V. (1965b). D-0809 Industrial Dynamics/Hand Simulation Exercise. Cambridge, MA, MIT System Dynamics Group: 3.
55 System_Dynamics_Society (1998). Instructions for Running the Production-Distribution Game "The Beer Game" Albany, NY: 16.

Page 40
Appendix I List of experts participating in this study
1. Jay Forrester 2. Alexander L. Pugh III 3. Willard Fey 4. David Packer 5. Peter Senge 6. John D. Sterman 7. Dennis Meadows 8. Bob Eberlein
Appendix II
The appendix shows enlarged pictures of the current version of the Beer Game (one with the setup of the initial conditions for the game).

Page 41
Figure 34.—Current Version of the Beer Game Board (enlarged)
Figure 35.—Current Version of the Beer Game Board (with set up and enlarged)