Optimal oligopoly pricing and the threat of entry:: Canadian evidence
17
International Journal of Industrial Organization 5 (1987) 323-339, North-Holland OPTIMAL OLIGOPOLY PRICING AND THE THREAT OF ENTRY Canadian Evidence Robert MASSON* Cornell University, Ithaca, N Y 14853, USA Joseph SHAANAN* Oklahoma State University, Stillwater, OK 74078, USA Final version received October 1986 In earlier work we tested stochastic/dynamic limit pricing using U.S. data. We replicate these tests using Canadian data. The results are weak, but consistent with the earlier tests, Along the way we deal with several methodological problems: How does the new 'rational limit pricing' relate to the test? How might oligopoly influences be integrated into limit pricing? How should existing concentration affect entrant behavior? Might factors which suppress industry profita- bility not, ceteris paribus, deter entry? What might one do with correlated proxy variables? Should 'weak' results be interpreted the same in a replication test, as in a de novo test? 1. Introduction In Masson and Shaanan (1982) we provided a test for limit pricing. In that test we examined the determinants of profit rates and of entry in a simul- taneous equations model using U,S. data, The results were supportive of the stochastic/dynamic limit pricing models of Kamien and Schwartz (1971) and of Baron (1973). The objective of the current study is to see if similar results would be obtained from an independent examination of a similar economy, Canada. The answer to this question is a qualified 'Yes', the results are consistent, but weak. Along the way to these results we integrate the new rational limit pricing literature [Matthews and Mirman (1983), Saloner (1982)], And in response to comments, we pursue some methodological points about differences between oligopoties and monopolies in entry models. *We received some funding from the College of Business Administration at Oklahoma State and from NSF Grant no. SES-8111237 at Cornell. We thank P. Geroski and J.D. Rea for comments; C. Oonjitt and C.W. Tseng for data assistance; and Statistics Canada, especially A. Dorland and K. Lal for data and advice. The form of this paper has been molded in large part by anonymous reviewers. Many of their contributions are noted in text. 0167-7187/87/$3.50 © 1987, Elsevier Science Publishers B.V. (North-Holland)
Transcript of Optimal oligopoly pricing and the threat of entry:: Canadian evidence

International Journal of Industrial Organization 5 (1987) 323-339, North-Holland
O P T I M A L O L I G O P O L Y P R I C I N G A N D T H E T H R E A T O F E N T R Y
Canadian Evidence
R o b e r t M A S S O N *
Cornell University, Ithaca, N Y 14853, USA
J o s e p h S H A A N A N *
Oklahoma State University, Stillwater, OK 74078, USA
Final version received October 1986
In earlier work we tested stochastic/dynamic limit pricing using U.S. data. We replicate these tests using Canadian data. The results are weak, but consistent with the earlier tests, Along the way we deal with several methodological problems: How does the new 'rational limit pricing' relate to the test? How might oligopoly influences be integrated into limit pricing? How should existing concentration affect entrant behavior? Might factors which suppress industry profita- bility not, ceteris paribus, deter entry? What might one do with correlated proxy variables? Should 'weak' results be interpreted the same in a replication test, as in a de novo test?
1. Introduction
In M a s s o n a n d S h a a n a n (1982) we p rov ided a test for l imit pricing. In t ha t test we e x a m i n e d the d e t e r m i n a n t s of profi t ra tes a n d of en t ry in a s imul- t aneous e q u a t i o n s m o d e l us ing U,S. data , T he resul ts were suppor t ive of the s t o c h a s t i c / d y n a m i c l imit p r ic ing mode l s of K a m i e n and Schwar tz (1971) a n d of B a r o n (1973). T he object ive of the cu r r en t s tudy is to see if s imi la r results wou ld be o b t a i n e d f rom an i n d e p e n d e n t e x a m i n a t i o n of a s imi la r economy, C a n a d a . T he answer to this ques t ion is a qualified 'Yes' , the resul ts are consis tent , bu t weak. A long the way to these results we in t eg ra t e the new ra t iona l l imit pr ic ing l i t e ra tu re [ M a t t h e w s and M i r m a n (1983), S a l o n e r (1982)], And in r e sponse to c o m m e n t s , we pursue some me thodo log i ca l po in t s a b o u t differences be tween ol igopot ies a n d m o n o p o l i e s in en t ry models .
*We received some funding from the College of Business Administration at Oklahoma State and from NSF Grant no. SES-8111237 at Cornell. We thank P. Geroski and J.D. Rea for comments; C. Oonjitt and C.W. Tseng for data assistance; and Statistics Canada, especially A. Dorland and K. Lal for data and advice. The form of this paper has been molded in large part by anonymous reviewers. Many of their contributions are noted in text.
0167-7187/87/$3.50 © 1987, Elsevier Science Publishers B.V. (North-Holland)

324 R. Masson and J, Shaanan, Optimal oligopoly pricing, threat of entry
2. Theoretical review, update and extensions
Following Bain's (1949, 1956) pioneering work, the 1970s saw extensions to dynamic [Gaskins (1971)] and stochastic/dynamic [Kamien and Schwartz (1971), Baron (1973)] limit pricing theories. Equilibrium (not necessarily steady state) behavior differs across these models. In Bain's model a monopolist facing low entry barriers will maximize shortrun profits, allowing its monopoly to erode. Bain places his emphasis on higher barrier cases. Once barriers rise above some level, price discontinuously drops to the highest price consistent with forestalling all entry. This limit price then rises with barriers until entry is blockaded at, the shortrun maximizing price. Gaskins supplemented Bain's analysis with a dynamic/deterministic model. In the better known version of this model [Gaskins (1971)] price is a declining function of entry barriers. In his more general analysis, Gaskins (1970) analyzes the case in which lower prices do not eliminate fringe firms. As in the other model, the firm prices to permit entry if barriers are low. Then the price declines as barriers are higher until all entry is forestalled. But after this point price rises with higher barriers, following Bain's pattern for high barriers. In the stochastic/dynamic models prices always exceed entry forestalling levels, and fall short of their shortrun profit maximizing levels, unless entry is blockaded at the shortrun maximizing price.
By modeling entry behavior, our empirical test of limit pricing [Masson and Shaanan (1982)] allowed us to estimate the entry forestalling level of profits. We next assumed that a high concentration oligopoly will act similar to a monopoly in a limit pricing model. Finally we tested incumbent firm behavior for evidence of these pricing patterns.
Limit pricing theory through the 1970s was often criticized for modeling only incumbent firm behavior without considering the rationality of potential entrant reactions to limit pricing. More recently Saloner (1982), and Matthews and Mirman (1983), following Milgrom and Roberts (1982), demonstrate that limit pricing may arise from equilibrium behavior when there are infor- mation asymmetries. For example, limit pricing may arise if entrants are imperfectly informed of some aspect of the incumbents' market (e.g., marginal costs, demand elasticity), leaving them unable to infer the monopolist 's profit maximizing price or likely entry reactions. ~ Further, incumbents do not know all aspects of potential entrants (e.g., their anticipated costs). The result is that the incumbent firms face uncertain entry, and behave like the firms in the stochastic/dynamic models of Kamien and Schwartz and of Baron. The same stochastic/dynamic limit pricing test can be used to test these 'rational limit pricing' models. 2
iBain (1949, 1952) mentions the same uncertainty and notes that limit pricing may not work if entrants perceive a 'bluff'.
:The stochastic/dynamic models are essentially one side of the 'rational limit pricing' model.

R. Masson and J. Shaanan, Optimal oligopoly pricing, threat of entry 325
Finally, we consider limit pricing models in oligopoly. 3 Rather than ar indepth analysis, suppose that we can separate the problem into two questions: (1) 'How will oligopolists facing entry set prices?' and (2) 'Ho~ will potential entrants react when considering entry into an oligopoly?'
Suppose there is a symmetric constant returns to scale oligopoly in Nash. Price-Equilibrium. Suppose that firm 3, the typical firm, has profits of
rq = QI(pa... p,)(pl - c ) + V1(pl... p,),
where
Q1 is firm l's demand, 1/1 is firm l's expected future value, discounted to today.
(31
Expected future value is of some such form as
where
i Pi
V1 = ~ Pi(P,... P,) V(n + i)/(n + i), i=O
is the number of entrants, is the probability of i entrants,
V(n + i) is the future industry value (after entry costs), /£ is the maximal number of potential entrants.
(2
We assume that 6Vl/6pi<O (higher current prices raise entry, lowering future profits).
For any set of rivals' prices, and hence for their Nash equilibrium values, the first order condition for (1) yields
o r
6QI 6V 6pt (p~-c)+~-~p =-Q~,
6P, -0-~1) \--~11 p,(p,-c)Q,
(3)
= - i . ( 4 )
Converting to elasticities (negative) and taking absolute values, this is
P~ )
3Several reviewers felt that oligopoly was not appropriately handled in earlier drafts, or in our 1982 paper. But reviewers differed in their expectations about the sign of the bias.

326 R. Masson and J. Shaanan, Optimal oligopoly pricing, threat of entry
where
e~[ is firm l 's equil ibrium demand elasticity in absolute value, ev~ is the elasticity of future value with respect to current price.
One normally assumes that firm demand becomes more elastic as n increases (concentrat ion decreases). 4 Now, note that ( P t - c ) / P l = 1/le11[ if, and only if, ]evllv1/rcl=O. Norma l ly bo th [evil and (V~/rct) will be strictly positive whenever prices are high enough to a t t ract entry. This raises the denominator in (5) [ lowering ( p ~ - c ) / p t ]. Accordingly, if compet i t ion alone does not deter entry, firms will use a form of limit pricing even wi thout agreements to do so. 5 Further , as concent ra t ion rises (n falls) so will price, al though due to limit pricing the rise in price is reduced. ~
Higher concentrat ion can also be argued to raise, or lower, the incentive to enter. Holding other factors constant, why might a concent ra ted industry be less profitable to enter? Orr 's (1974) intuit ion is ' . . . the possibil i ty that the established firms may col lude to thwar t entry'. 7 At the same time Baron 's (1973) intuit ion runs the opposi te way. One a rgument to suppor t Baron 's intuition is essentially as follows. Suppose a potent ia l en t rant can expect a symmetric post entry equil ibrium. Then, for any m i n i m u m efficient plant scale, the more firms there are already in the market , the more likely that entry will lead to opera t ion below minimal efficient scale, and hence be less profitable. 8
Another set of arguments can be made which revolve a round beliefs about oligopolistic 'agreement ' . 9 Suppose that ol igopolies are ei ther in Nash equil ibrium or have reached 'agreement ' . Profits are likely to be higher if there are fewer firms (higher concentrat ion) , demand is less elastic, or the firms have reached agreement. Suppose that a potent ia l en t ran t can observe concentrat ion, but cannot know whether observed profits arise from a Nash
"*See, for example, Dixit and Stiglitz (1977). 5If ,~V/,~p is equal to zero at the Nash equilibrium then there will be no limit pricing effect.
This is assumed to occur for prices below entry forestalling levels. It may also occur when pre- entry price is not regarded as an entry signal (e.g., if potential entrants are perfectly informed or the market is rapidly changing). Other cases may exist with positive expected entry, but without limit pricing effects, if locally 6 V/fp = O.
6If entry is a positive function of concentration, for any price, this result may be reversed. See Kamien and Schwartz (1975) and Lippman (1980) for related models. In Lippman's model entry leads to symmetric equilibria. Accordingly, an entrant's share is anticipated to be 1/(n+ 1) of the market. Then for any given price, each incumbent's revenues would drop by 1/(n+ I) with entry. Accordingly entry is more costly to incumbents if n is small. If entrant size is the function of concentration assumed by Lippman (independent of MES), then a uniformly conspiratorial world may lead to a negative concentration/profits correlation!
7Retaliation may slow expansion, limit market share, or eliminate a firm. aRelated ideas are in Kamien and Schwartz (1975) and Lippman (1980). 9Bain (1949), Harrington (1984), Matthews and Mirman (1983), Saloner (1982) and Kirman
and Masson (1986) all mention that potential entrants' beliefs about incumbents' coordinating abilities may influence entry.

R. Masson and J. Shaanan, Optimal oligopoly pricing, threat of entry 327
equilibrium or from agreement. One possibility for this case is that entry into less concentrated industries might be, ceteris paribus, less profitable. To see this, suppose profits are 'high', but the industry is only moderately concen- trated. A potential entrant may assign a high probability to an 'agreement' as the cause for the high profits (the probability that firm demand elasticities were sufficiently inelastic to lead to a Nash equilibrium with these profits is low). It may also believe that the probability that the agreement will remain stable, post entry, rather than falling to a Nash equilibrium, is not great) ° But if the same profitability were observed in a concentrated industry, the entrant might have different conjectures. First, it would be more likely that the high profit level was generated by the fewness of firms in a Nash equilibrium. Further, even if the oligopoly were one with an agreement, the probability that the agreement would be destabilized by entry would be lower [cf. Duetsch (1975)-]. Therefore one could reason that, ceteris paribus, concentrated industries are more likely to be profitable to enter.
Of course the world of beliefs is a Pandora's box. There is another equally plausible story leading to the opposite conclusion. Suppose that the entrant believed that collusion was hard, and hence rare. It would then believe that collusion was impossible in any unconcentrated industry, and fragile, if it occurs, in any concentrated industry. This reverses the story. For any given high profit rate, the concentrated industries may then be, ceteris paribus, less attractive to enter.
Accordingly, concentration may positively or negatively influence entry, holding profit rates and entry barriers constant. Finally, if concentration independently affects entry then incumbent firms should account for this in their limit price.
With this theoretical background, we turn to testing.
3. The testing model
3.1. Model structure
The a priori testing model follows our 1982 specification, with the addition of trade variables to reflect the greater openness of the Canadian economy. We start with two testing equations of the form
n'~ = F( Ct, B, Gt, Et, T) + e t, (6)
E, + 1 = H(n~, B, Gt) + r/t + 1, (7)
1°An agreement requires n(n-1) information/agreement links between firms, so the difficulty of agreement rises geometrically with the number of firms. For an agreement pair interpretation, see Scherer (1980, pp. 199-200). or for an information link interpretation, Stigler (1964).

328 R. Masson and J. Shaanan, Optimal oligopoly pricing, threat of entry
where
Ct B Gt Et T
g't, ~t + 1
is the profit rate (on equity) actually realized in t, is concentration in t, is a vector of entry barriers, is growth in t, is entry in t, is a vector of international trade variables, and are the error structures.
After estimation of (6) and (7), two unobserved variables are constructed. The first is the optimal level of profits, n °, (from the optimal limit price) which would be selected by a joint longrun-profit maximizing oligopoly as a function of the exogenous variables. This is
rC ° = F ( C max, B, Gt, Et, T), (8)
derived from the estimated parameters of (7), implicitly solving H(n~', B, G~) -- 0 at its maximal level, C ~ax.l~
The second unobserved variable is the entry forestalling level of profits, lr e, as a function of entry costs (barriers) and growth. This is
zf = h(B, Gt), (9)
derived from the estimated parameters of (7), implicitly solving H(n~, B, Gt)= 0 for that ~, zf, at which entry, E,+~, equals zero.
The equations are presented without functional form, as some hypotheses are explicitly non-linear. The hypotheses for testing are:
(1) Bain's static, non-stochastic limit pricing: n ° is high for low entry barriers, then drops to ~°=7¢ (with 6~r/6B > 0 for non-blockaded entry) for higher barriers.
(2) Gaskins' dynamic limit pricing: n ° starts high and is either: (a) monoton- ically decreasing in barriers, or (b) monotonically decreasing in barriers until ~° falls to 7¢, and then ~°= ~f for higher (non-blockaded) barriers.
(3) Kamien and Schwartz' or Baron's stochastic~dynamic limit pricing and/or Matthews and Mirman's or Saloner's rational limit pricing: r~°> rc f through- out, and converging upon ~r as barriers become high,
Several conceptual factors should be noted. First, predictions about n ° (optimal profits) need not apply to n" (actual profits). In practice competition may lead to n" well below ~° or ~f. The p o w e r of the test arises in
HWe use the sample maximum. If at C m"x profits are less than monopoly levels, the estimate of ~° is conservative.

R. Masson and J. Shaanan, Optimal oligopoly pricing, threat of entry 329
establishing whether: (a) industries with high concentration select to price above ~f, but below the monopoly level rc m, and (b) whether the price selected by such industries is predicated upon the level of entry barriers. A second conceptual factor is that concentration, C, is absent from the entry equation. As noted in section 2, higher C might be argued to lead to greater, or less, entry. We test C in the entry equation following reviewers' comments,
A third factor is that we omit import and tariff variables from the entry equation. Our a priori model was that entry is attracted by ~", adjusted up for growth and down for the price response to entry and expected entry costs (captured by barriers). Entry costs, and reactions, are conceptually very different from factors which suppress profits on an ongoing basis. Pre-entry profits serve as a signal for post-entry profitability. Both pre- and post-entry profitability will be affected by numerous factors such as elasticity of market demand, cross elasticities of intra-market demand, coordination between domestic firms, and reactions of international rivals. Whatever factors affect pre-entry profits we assume to act with equal strength post entry, An observable factor, like imports, will only have an independent effect upon entry if its anticipated influence upon post-entry profits relative to pre-entry profits differs from the average influence of the unknown factors underlying the signal. The direction of effect may seem perverse. For example, a factor suppressing profits could for any level of profits, attract entry. This would occur if its profit suppressing effect was thought to have been fully felt in lowered pre-entry profits. Our belief was that trade variables should not add significantly to the information already contained in the profit signal. Again, following reviewers' suggestions, we test the trade variables in the entry equation.
Having C and T in the entry test is consistent with limit pricing, so adding them helps test if the maintained hypothesis is robust. That is, the focus in each case is upon whether: (1) z° and nf have the right slopes, (2) no>~e at low entry barriers, and (3) 7r ° converges towards ~f at higher barriers.
Finally, as noted in our 1982 paper, this simultaneous equation model can be recursively identified if corr[et, r/t+ 1] _~0, and if potential endogeneity of the advertising/sales ratio, a proxy for product differentiation, is rejected by a Wu-Hausman test. 12
3.2. Data
Our sample is 43 manufacturing industries of which 24 are consumer goods and 19 are producer goods. The sample was chiefly determined by
~2Products with high potential differentiability (exogenous) are likely to have high (endogen- ous) advertising/sales. Holding differentiabitity constant, A/S is clearly endogenous. But the Wu- Hausman test indicated that the component was sufficiently small, in relative terms, that a model specification treating A/S as if it were exogenous was appropriate.

330 R. Masson and J. Shaanan, Optimal oligopoly pricing, threat of entry
decisions upon whether the industry definition was likely to lead to meaningful use of (national) concentration data, the availability of data for entry and profits, and finally data on imports and tariffs. In the model presentation we refer to two time periods, t and t + 1. Time period t + 1 is the years 1964-1967, while.t covers 1960-1963. The data are as follows:
n~ is profits on equity for 1960-1963 from the National Revenue Depart- ment (1962-1965). I-Some adjustments were made from Industry, Trade and Commerce (1964)1.
Ct is a concentration measure suggested by Caves et al. (1980). This is the four firm concentration ratio multiplied b y the coefficient of variation for the top eight firms. The wider the asymmetries between firms in the top eight, holding four firm concentration constant, then either the more dominant are the leading firms in the top four, or the less powerful are those between five and eight. C is discussed further below.
For entry barriers we considered measures for economies of scale, product differentiation, and absolute capital requirements. We dropped the last of these from the estimation for two reasons. The first is that it had low t values (and a perverse sign in the entry equation) and the second is that it also had weak t values with our U.S. data [Masson and Shaanan (1982)-] and a perverse sign when we used the U.S. price cost margin as our dependent variable [Masson and Shaanan (1984)1.
Bs is a proxy for economies of scale. To calculate B, we first estimated a Comanor and Wilson (1967) proxy for minimal efficient scale (MES) based upon U.S. data. (The reasons for using U.S. data are discussed later.) This is a 1963 measure of the average plant value of shipments of the top plants producing 50~o of industry value of shipments divided by industry value of shipments. This is scaled to Canada by multiplying the ratio of U.S. value of shipments to Canadian value of shipments. Then MES was divided by a U.S. measure of the 'cost disadvantage ratio' [see Caves, Khalilzadeh-Shirazi and Porter (1975)]. CDR is the ratio of the value added per worker of the smallest plants accounting for 50~ of industry employment to that for the remaining plants. The deviation of CDR below one is a proxy for the cost disadvantage suffered by plants of sub-MES scale. (CDRs greater than one are truncated to equal one.)
B a is a proxy for product differentiation. This 1965 advertising/sales ratio is from Dominion Bureau of Statistics (1968).
Gt is growth of domestic producers' sales: ((1963 sa les-1960 sales)/1960 sales). The data sources for G are the same as for zr a.
Et was not available to us. (Et÷l is used in the entry equation.) In place of Et we test whether the coefficients in the profit equation are sensitive to the inclusion of the determinants of Et [e.g., n~_ 1, B, Gt- 1, see (7)1 in the profit equation.

R. Masson and J, Shaanan, Optimal oligopoly pricing, threat of entry 331
The trade variables, T, are imports, I, and NT, a measure of the nomina tariff. These follow:
1 is the 1962 (imports/(domestic output +imports)) from Dominion Bureau of Statistics (1969). The auto industry was adjusted using Beigie (1970).
N T is nominal tariff for 1963 from Melvin and Wilkinson (]968) and GATT (1967).
Et+l is the sum of annual increases, over four years, in the number of firms (defined by sales above $500,000 or assets above $250,000) from Industry, Trade and Commerce (1967). 13 For a year in which the number of firms in an industry declined, entry for that year was set at zero, so E,+I >0. Since only two industries had entry equal to zero we use OLS for estimation.
Finally, a few words on the choice of B~ and C. The reasons for their selection is both econometric and economic. Both of these are proxies, one for efficient plant size and the other for market power. As proxies they are by hypothesis measured with error. If the measurement error for one is correlated with either the true value, or the measurement error of the other, then coefficient estimates will be biased. Four firm concentration and the MES proxy are inherently correlated, with that correlation tending to be stronger for small markets, where leading firms are likely to have few plants [see Davies (1980)]. Further, for smaller markets MES may be systematically biased, with the bias correlated with four firm concentration? 4 If the factor price ratios for Canada are identical to those for the U.S.; if a de novo plant in Canada would have available the same technology set available in the U.S.; and if due to smaller Canadian markets most firms in some industries operate at less than MES, where they do not do so in the U.S., then a U.S. based Bs measure may be more accurate than a Canadian based measure. If factor prices are not identical, etc., a U.S. based measure may not be as accurate, but may still have an advantage because its measurement error should be less correlated with measured concentration and/or true market power.
Economies of scale for Canada have also been measured using hybrids of U.S. and Canadian data. Baldwin and Gorecki (1983b) opt for a U.S. measure for MES and a Canadian measure for CDR, whereas Caves et al. (1980) opt for a Canadian measure for MES and a U.S, based measure for CDR. Both of their measures are also examined below.
Our concentration measure is that by Caves et al. (1980). Not only is this measure a plausible proxy for market power, its measurement error seems
~3This is comparable to Orr's (1974) measure. A reviewer suggested that intra-period shifts could lead to perverse estimates. We accordingly tried the change in the number of firms over the entire period, obtaining essentially the same results.
14Operation below MES may be endogenously related to the size of market (or country). For a differentiated product equilibrium own price elasticity for a variety may rise with the number of varieties (as cross elasticities rise). Then in a zero profit equilibrium firms will operate closer to MES when the market is larger,

332 R, Masson and J. Shaanan, Optimal oligopoly pricing, threat of entry
less likely to be correlated with B~ than a straight four firm concentra t ion ratio. 15
4. The tests
The important sub-hypotheses tested are:
(a) market power 's (concentrat ion) effects on profits, (b) whether pre-entry profits at t ract entry, (c) whether barriers discourage entry, (d) whether 7r ° is greater than 72 f and converges towards zf as barriers rise.
The tests we report here are those of our a priori specification and those including the variables suggested by the reviewers.
4.1. Our a priori specification ~6
The a priori specification led to the fol lowing results in l inear form (reporting t-values in parentheses and significance of 1~o as three asterisks, 5 ~ as two, and 10~o as a single asterisk):
n7=3.94 + O.02Ct+O.O1Bs+O.65Ba + O,02Gr-O.O2I+O.O6NT, (2,95)*** (1.49)* (0.49) (4.87)*** (0,90) (0.56) (1.04)
R 2 =0,54, (10)
E~+ ~ = 18.94 + 1 . 4 6 r c ~ - 0 . 4 6 B , - 1 . 6 8 B , + 0 . 2 6 G t ,
(1.99)** (1,02) (2.95)*** (1.11) (1.22)
R2 =0.25, (11)
The signs are all 'correct ' but the results are generally weak. Concen t ra t ion is marginally significant in (10) and profits insignificant in (11). One entry barrier was significant in each, but a different ent ry barr ier was significant in
l~Waterson (1984) and Geroski (1983) discuss 'ideal' concentration measures. Caves et al. (1980) discuss the reasons for using the coefficient of variation of the top eight times four firm concentration. Waterson notes that the Herfindahl for n firms can be expressed in terms of the n firm coefficient of variation. Our measure of concentration was correlated 0.33 with our measure of Bs. It was correlated at 0.49 and 0.41 with the alternative measures we label as 'Baldwin- Gorecki' and 'Caves et al.'. Both the Herfindahl and the C4 were more highly correlated with each of the Bs measures.
16We conducted an earlier test using the readily available Herfindahl and Herfindahl squared. The Herfindahl correlated highly (0.61) with the Canadian measure of MES adjusted by U.S, CDR we used first. Faced with this multicollinearity (and very small positive t-value) we moved to the measures reported here.
R. Masson and J. Shaanan, Optimal oligopoly pricing, threat of entry 333
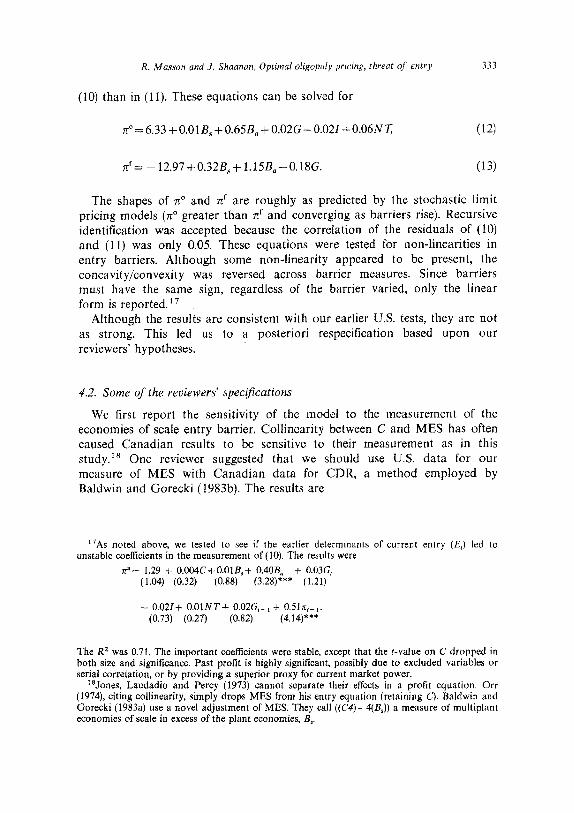
(I0) than in (11). These equat ions can be solved for
rc ° = 6.33 + 0.01B s + 0.65B a + 0.02G - 0,02• + 0.06N T,, (12)
rcf= - 12.97 + 0.32B~ + 1.15Ba-O.18G. (13)
The shapes of ~o and ~z f are roughly as predicted by the stochastic limit pricing models (~° greater than ~z f and converging as barriers rise). Recursive identification was accepted because the correlat ion of the residuals of (10) and (11) was only 0.05. These equat ions were tested for non-lineari t ies in entry barriers. Al though some non-l ineari ty appeared to be present, the concavi ty /convexi ty was reversed across barrier measures. Since barriers must have the same sign, regardless of the barrier varied, only the linear form is reported. 17
Al though the results are consistent with our earlier U.S. tests, they are not as strong. This led us to a posteriori respecification based upon our reviewers' hypotheses.
4.2. Some of the reviewers' specifications
We first report the sensitivity of the model to the measurement of the economies of scale ent ry barrier. Col l inear i ty between C and M E S has often caused Canad ian results to be sensitive to their measurement as in this study. Is One reviewer suggested that we should use U.S. da ta for our measure of M E S with Canad ian data for CDR, a me thod employed by Baldwin and Gorecki (1983b). The results are
17As noted above, we tested to see if the earlier determinants of current entry (Et) led to unstable coefficients in the measurement of (10). The results were
n a= 1.29 + 0.004C+0.01B~+ 0.40B a + O.03G t
(1.04) (0.32) (0.88) (3.28)*** (1.21)
- 0.02•+ 0.01NT+ 0.02G,_x + 0.51rct_l. (0.73) (0.27) (0.82) (4.14)***
The R 2 was 0.71. The important coefficients were stable, except that the t-value on C dropped in both size and significance. Past profit is highly significant, possibly due to excluded variables or serial correlation, or by providing a superior proxy for current market power.
lSjones, Laudadio and Percy (1973) cannot separate their effects in a profit equation. Orr (1974), citing collinearity, simply drops MES from his entry equation (retaining C). Baldwin and Gorecki (1983a) use a novel adjustment of MES. They call ((C4)--4(B~)) a measure of multiplant economies of scale in excess of the plant economies, B,.

334 R, Masson and J. Shaanan, Optimal oligopoly pricing, threat of entry
Baldwin-Gorecki method
nT= 3.97 + O.02C,+O.O04B~+O.65B a (2.73)*** (1.21) (0 .34) (4.77)***
+ 0.02Gt- 0.01I+ 0.05NT, (1.00) (0.47) (0.93)
R ) =0.53, (14)
Et+1=18.32 + 1,48rc~-0.19B~ - 1.81Ba+ 0.16Gt, (1.82)** (0.97) (2.15)** (1.14) (0.72)
R2=0,17. (15)
The results are much like (10) and (11). One difference is that concentration loses its already marginal significance in the profit equation. Other dif- ferences of note are that B~ becomes insignificant in the entry equation and the equation's R 2 drops a bit.
More marked differences appear with the Caves et al. (1980) approach of using U.S. data for CDR, but Canadian data for MES. Caves then defines B~- MES if CDR < 0.9, and Bs-= 0 otherwise.
Caves et al. method
rr~=4.31 + 0.01Ct+ 0.19B~ + 0.63B~ (3.65)*** (0.78) (2.67)*** (5.55)***
+ 0.01G t - 0.03•+ 0.05NT, (0.60) (1.11) (1.07)
R z =0,61, (16)
E~+1=14.62 + 2.80n~' -- 2.09B~ -- 3.51B, + 0.19G t, (1.51)* (1.81)** (3.12)*** (2.33)** (0.94)
R2 = 0.26. (17)
In the profit equation B~ becomes significant and the t-value on C drops slightly further. Both equations have slightly higher R2s. The entry equation has a higher R 2 accompanied by both profit rate and advertising becoming statistically significant.

R. Masson and J. Shaanan, Optimal oligopoly pricing, threat of entry 335
Each specification maintains the expected sign results of the stochastic or rational limit pricing models, including ~o>~r and converging as barriers rise. The Caves et al. specification gives the strongest entry equation, but does not lead to C being significant in the profit equation.
Finally, some have suggested that concentration and/or trade variables should be in the entry equation. Using our initial definition of B~ based upon U.S. data we arrive at
Reviewers' entry hypotheses using our scale measure
Et+1=36.19 -t- 1.89rc~-0.31Bs - 2.39Ba (2.94)*** (1.37)* (2.02)** (1.70)**
+ 0.24G t - 0.22C t - 0.50• - 0.25NT, (1.17) (1,99)t (2.06)t (0.55)
R 2 =0 .41 . (18)
(A ' t ' signifies 10~ significance when the appropriate, see section 2, two- tailed test is applied.)
Adding the same variables to the strongest entry equation, based upon the Caves et al. method, this resulted in
Reviewers' entry hypotheses using the Caves et aI. scale measure
Et+1=35.69 + 2.827r~ - 1.31B~ - 3.57B, (2.85)*** (1.87)** (1.90)** (2.53)***
+ 0.17G t - 0.23C t - 0.43• - 0.47NT, (0.84) (2.O7)? (1.71)? (1.07)
R2=0.40. (19)
The F test for adding these variables to eq. (18) is 3.26, and for eq. (19) it is 2.76. The critical value of F for the 5% level is 2.88. Adding these variables does not change the qualitative limit pricing results. Using our measure of B,, eq. (18) gives slightly better results than eq. (11). Now profits and advertising become significant (albeit profits only marginally so). Adding these variables in (19), with the Caves et al. scale measure yields similar results to those in (17), but with a weaker t-value for scale economies (5% rather than 1% significance).
Finally it is interesting to ask what new results these variables add to the model. The most interesting one is the negative influence of C in (18) and

336 R. Masson and J. Shaanan, Optimal oligopoly pricing, threat of entry
(19). Since C has been hypothesized to have either a positive or negative influence on entry, a two-tailed test is appropriate . C is significant at the 10~ level in (18) and (19).
If one believes that C has a negative impact on entry (holding profits and barriers constant) this could have great policy significance. The negative influence of C means that when concent ra t ion is higher, the corrective influences of competi t ion are slowed.
Our a priori belief was that the influence of concent ra t ion on entry would be about neutral. The reasons for this belief relate to our judgement that none of the arguments we presented in section 2 are empirically important . But the results in (18) and (19) suggest that concent ra t ion should be included.
As a cross check we reran our U.S. sample EMasson and Shaanan (1982)] entry equat ion with the addit ion of concentra t ion. Unl ike our Canad ian data, ~he U.S. entry measure is market share, and our U.S. model also has a measure of absolute capital costs of entry, Bk. (For more details, see our 1982 paper.) The results were
E r + l = - 4 , 8 7 + 0.55rc a - 0.32Bs - 0.01B k (2.01)** (2.15)** (2.08)** (1.67)*
- 0 , 2 3 B , + 0.05G~+ 0.4Cr (1.74)** (0.16) ( 1 . 3 5 ) (20)
The result here is a positive sign on C in the entry equat ion, with a t-value of 1.35 (significant only at the 20~o level in a two-tailed test). One possibility is that the opposite signs reflect a single under ly ing economic process, but industry structures differ across countries. 19 These results can be rat ionalized if: (1) retal iat ion only becomes feasible for C>C*, (2) most of the Canad i an sample has C>C*, and (3) the reverse is t rue for the U.S, sample. Accordingly we examined quadrat ic versions on both samples. Ent ry is convex in C for both samples. The convexity is significant in the U.S., bu t weak in Canada , with the m i n i m u m points of each inconsis tent with the other. 2°
19Other tests of C have been performed. See Schwalbach for a positive effect on entry in Germany. Duetsch (1975) found C positive and significant on a U,S. sample with entry measured by numbers of firms, as in all Canadian tests. More recently he finds it to be generally positive, but insignificant I-Duetsch (1984)]. Orr found a significant negative effect of C in his Canadian tests. (But he eliminated B s from his test, making it hard to attribute this affect to C.) Shapiro and Khemani (1986) find that both C and B, have a significantly negative effect on entry in Canada. But Baldwin and Gorecki (1983a) find that for Canada (C4-4B~) is negative and [(C8) x (coefficient of variation, 8)] is positive. They interpret only the second term as the concentration effect (see previous footnote).
2°The minimum entry points are for a C above the sample max in Canada and a C below the sample mean in the U.S.

R. Masson and J. Shaanan, Optimal oligopoly pricing, threat of entry 337
Another possibility is that the differences arise because Canadian Anti- combines Law is far weaker than U.S. Antitrust Law. For example, retaliation (or predation) may be easier in Canada. Alternatively, following the 'beliefs' arguments in section 2, suppose that potential entrants believe that collusion is hard and thus rare everywhere but in concentrated Canadian industries. If entrants fear destabilizing collusion, they will avoid the highly concentrated Canadian industries. Neither explanation for the difference between the U.S. and Canada results based upon antitrust law seems convincing to us,
Clearly the effects of concentration on entry could use further research. Our priors have altered very little, believing that concentration will generally play a small role in the entry decision. To us a more likely interpretation of the negative coefficient is that C is picking up some other effects. For example, as posited by Baldwin and Gorecki (1983a), concentration may in part measure effects of multi-plant economies of scale, 21
Finally, the trade variables deserve mention. Holding existing profit level (and other variables) constant, firms seem to be more reluctant to enter high import industries. Since pre-entry profit levels should reflect the equilibrium effect of imports, they may have either sign on the entry decision, Again the ' t ' on the t-value indicates 10~ significance on a two-tailed test. Perhaps, for any given profit level, greater import industries are seen as riskier by potential entrants, because of potential exchange rate shifts.
4.3. Summarizing results of specification on limit pricing
All signs in all tests are as predicted by the stochastic/dynamic limit pricing models. For the profit equation concentration is only significant in one specification: the a priori specification. Collinearity between B, and concentration makes their effects hard to disentangle.
In the entry equations profits attract entry. Although this effect is quite significant in both tests using the Caves et al. economies of scale measure, it is only marginally significant in one other specification: the a priori model with concentration and trade variables added. Proxies for barriers are significant in all entry specifications with the exception of advertising in two models. Finally, n ° exceeds n f, and converges towards n f for all specifications.
Overall the Caves et al. specification provides the strongest support for all hypotheses, except for the market power effect of concentration on profits,
5. Conclusions
Replication studies using independent data can help confirm a hypothesis. Strong results, or numerous replications can lead to strong confirmation.
21See footnotes 18 and 19.

338 R, Masson and J. Shaanan, Optimal oligopoly pricing, threat of entry
We replicated our 1982 l imit pricing test wi th C a n a d i a n data , bu t d id no t achieve s t rong results. Suspect ing col l inear i ty we tr ied some a l te rna t ive specifications suggested by reviewers. P a r a m e t e r e s t ima tes var ied somewha t , with some changes in significance levels, bu t aI1 results r ema ined cons i s ten t with the dynamic / s tochas t i c l imit pr ic ing predic t ions . Along this p a t h we did find tha t if c o n c e n t r a t i o n affects entry, its effects a p p e a r to be different
between the U.S, and C anada . Given the weak, bu t cons i s ten t results, the rep l ica t ion adds m o d e s t
addi t ional s u p p o r t to the l imit pr ic ing hypothes is . O n e possibi l i ty is to
pursue repl icat ion with o the r i n d e p e n d e n t da t a sets.
References
Bain, Joe, 1949, Pricing in monopoly and oligopoly, American Economic Review 39, March, 448-463.
Bain, Joe, 1952, Price theory (Wiley, New York). Bain, Joe, 1956, Barriers to new competition (Harvard University Press, Cambridge, MA). Baldwin, John and Paul Gorecki, with J. McVey and J. Crysdale, 1983a, Entry and exit to the
Canadian manufacturing sector: 1970-1979, Discussion paper (Economic Council of Canada, Ottawa).
Baldwin, John and Paul Gorecki, 1983b, Trade, tariffs and relative plant scale in Canadian manufacturing industries: 1970-1979, Discussion paper (Economic Council of Canada, Ottawa).
Baron, David P., 1973, Limit pricing, potential entry, and barriers to entry, American Economic Review 62, Sept., 666-674.
Beigie, Carl E., 1970, The Canada-U.S. automotive agreement: An evaluation (Canadian- American Committee, National Planning Association, Washington, DC, and Private Planning Association of Canada, Montreal).
Caves, Richard E., J, Khalilzadeh-Shirazi and M.E. Porter, 1975, Scale economies in statistical analyses of market power, Review of Economics and Statistics 57, May, 133-140.
Caves, Richard E., Michael E, Porter and A. Michael Spence, with John T. Scott, 1980, Competition in the open economy (Harvard University Press, Cambridge, MA).
Comanor, William and Thomas Wilson, 1967, Advertising, market structure, and performance, Review of Economics and Statistics 49, Nov., 423~-40.
Consumer and Corporate Affairs Department, Government of Canada, 1971, Concentration in the manufacturing industries of Canada (Information Canada, Ottawa).
Davies, Stephen, 1980, Minimum efficient size and seller concentration: An empirical problem, Journal of Industrial Economics 28, March, 287-301.
Dixit, Avinash and Joseph E. Stiglitz, 1977, Monopolistic competition and optimal product differentiation, American Economic Review 67, June, 297-308.
Dominion Bureau of Statistics, 1965, Corporation finance statistics (Ottawa). Dominion Bureau of Statistics, 1968, Advertising expenditures (Ottawa). Dominion Bureau of Statistics, 1969, The input-output structure of the Canadian economy,
1961, Vols. 1 and 2 (Ottawa). Duetsch, Larry L., 1975, Structure, performance and the net rate of entry into manufacturing
industries, Southern Economic Journal 41, Jan., 450-456. Duetsch, Larry L., 1984, Entry and the extent of multiplant operations, Journal of Economics"
32, June, 477--488. Gaskins, Darius, 1970, Optimal pricing by dominant firms, Unpublished doctoral dissertation
(University of Michigan, Ann Arbor, MI). Gaskins, Darius, 1971, Dynamic limit pricing: Optimal pricing under threat of entry, Journal of
Economic Theory 3, Sept., 309-322.
R. Masson and J. Shaanan, Optimal oligopoly pricing, threat of entry 339
GATT, 1967, Legal instruments embodying the results of the 1964-1967 trade conference, Vol. 1 (Geneva).
Geroski, Paul, 1983, Some reflections on the theory and application of concentration indices, International Journal of Industrial Organization 1, March, 79-94.
Harrington, Joseph E., Jr., 1984, Noncooperative behavior by a cartel as an entry-deterring signal, Rand Journal of Economics 15, Autumn, 426-433.
Industry, Trade and Commerce, Government of Canada, 1964 and 1967, Corporations and Labor Union Returns Act, Part 1 (Dominion Statistician, Ottawa).
Jones, J.C.H., Leonard Laudadio and M. Percy, 1973, Market structure and profitability in Canadian manufacturing industry: Some cross-section results, Canadian Journal of Economics 6, Aug., 356-358.
Kamien, Morton and Nancy Schwartz, 1971, Limit pricing and uncertain entry, Econometrica 39, May, 441-454.
Kamien, Morton and Nancy Schwartz, 1975, Cournot oligopoly with uncertain entry, Review of Economic Studies 42, Jan., 125-131.
Kirman, William and Robert T. Masson, 1986, Capacity signals and entry deterrence, Inter- national Journal of Industrial Organization 4, March, 25-42.
Lippman, Steven A., 1980, Optimal pricing to retard entry, Review of Economic Studies 47, July. 723-731.
Masson, Robert T. and Joseph Shaanan, 1982, Stochastic~:lynamic limiting pricing: An empirical test, Review of Economics and Statistics 64, Aug., 413-423.
Masson, Robert T. and Joseph Shaanan, 1984, Social costs of oligopoly and the value of competition, Economic Journal, Sept., 520-535.
Matthews, Steven A. and Leonard J. Mirman, 1983, Equilibrium limit pricing: The effects of private information and stochastic demand, Econometrica 51, June.
Melvin, James R. and Bruce W. Wilkinson, 1968, Effective tariff protection in the Canadian economy, Special study no. 9 (Economic Council of Canada, Ottawa).
Milgrom, Paul and John Roberts, 1982, Limit pricing and entry under incomplete information: An equilibrium analysis, Econometrica 50, March.
National Revenue Department, Government of Canada, 1962-1965, Corporation statistics, Taxation years 1960-1963 (Ottawa).
Orr, Dale, 1974, The determinants of entry: A study of Canadian manufacturing industries, Review of Economics and Statistics 56, Feb., 58-66.
Saloner, Garth, 1982, Essays on information transmission under uncertainty, unpublished Ph.D. dissertation (Stanford University, Stanford, CA).
Scherer, F.M., 1980, Industrial market structure and economic performance (Rand McNally, Chicago, IL).
Schwalbach, Joachim, 1987, Entry by diversified firms into German industries, International Journal of Industrial Organization 5, March, 43-49.
Shapiro, Daniel and Shayam Khemani, 1987, The determinants of entry and exit reconsidered, International Journal of Industrial Organization 5, March, 15-26.
Statistics Canada, 1973, Industrial organization and concentration in the manufacturing, mining and logging industries (Ottawa).
Stigler, George, 1964, A theory of oligopoly, Journal of Political Economics 72, Feb., 44--61. U.S. Department of Commerce, Bureau of the Census, 1966, Census of manufacturers, 1963 (U.S.
Government Printing Office, Washington, DC). Waterson, Michael, 1984, Economic theory of the industry (Cambridge University Press,
Cambridge).