ENISA Threat Landscape Report 2016
86
www.enisa.europa.eu European Union Agency For Network and Information Security ENISA Threat Landscape Report 2016 15 Top Cyber-Threats and Trends FINAL VERSION 1.0 ETL 2016 JANUARY 2017
-
Upload
khangminh22 -
Category
Documents
-
view
1 -
download
0
Transcript of ENISA Threat Landscape Report 2016

www.enisa.europa.eu European Union Agency For Network and Information Security
ENISA Threat Landscape Report 2016 15 Top Cyber-Threats and Trends
FINAL VERSION
1.0
ETL 2016
JANUARY 2017

ENISA Threat Landscape Report 2016 Final version | 1.0 | OPSEC | January 2017
02
About ENISA
The European Union Agency for Network and Information Security (ENISA) is a centre of network and information security expertise for the EU, its member states, the private sector and Europe’s citizens. ENISA works with these groups to develop advice and recommendations on good practice in information security. It assists EU member states in implementing relevant EU legislation and works to improve the resilience of Europe’s critical information infrastructure and networks. ENISA seeks to enhance existing expertise in EU member states by supporting the development of cross-border communities committed to improving network and information security throughout the EU. More information about ENISA and its work can be found at www.enisa.europa.eu.
Contact For queries on this paper, please use [email protected] or [email protected] For media enquiries about this paper, please use [email protected].
Acknowledgements ENISA would like to thank the members of the ENISA ETL Stakeholder group: Pierluigi Paganini, Chief Security Information Officer, IT, Paul Samwel, Banking, NL, Tom Koehler, Consulting, DE, Jason Finlayson, Consulting, IR, Stavros Lingris, CERT, EU, Jart Armin, Worldwide coalitions/Initiatives, International, Thomas Häberlen, Member State, DE, Neil Thacker, Consulting, UK, Shin Adachi, Security Analyst, US, R. Jane Ginn, Consulting, US, Polo Bais, Member State, NL. The group has provided valuable input, has supported the ENISA threat analysis and has reviewed ENISA material. Their support is highly appreciated and has definitely contributed to the quality of the material presented in this report. Moreover, we would like to thank CYjAX for granting access pro bono to its cyber risk intelligence portal providing information on cyber threats and cyber-crime.
Legal notice Notice must be taken that this publication represents the views and interpretations of ENISA, unless stated otherwise. This publication should not be construed to be a legal action of ENISA or the ENISA bodies unless adopted pursuant to the Regulation (EU) No 526/2013. This publication does not necessarily represent state-of the-art and ENISA may update it from time to time. Third-party sources are quoted as appropriate. ENISA is not responsible for the content of the external sources including external websites referenced in this publication. This publication is intended for information purposes only. It must be accessible free of charge. Neither ENISA nor any person acting on its behalf is responsible for the use that might be made of the information contained in this publication. Copyright Notice © European Union Agency for Network and Information Security (ENISA), 2017 Reproduction is authorised provided the source is acknowledged. ISBN978-92-9204-202-8, ISSN 2363-3050, DOI 10.2824/92184

ENISA Threat Landscape Report 2016 Final version | 1.0 | OPSEC | January 2017
03
Table of Contents
Executive Summary 5
1. Introduction 8
Policy context 9
Target audience 9
Structure of the document 10
2. Cyber Threat Intelligence and ETL 11
Cyber Threat Intelligence: State-of-play 11
CTI Big Picture: An Overview 13
The role of assets in CTI 15
Threat taxonomy 16
Assessed emerging CTI issues 17
Scope and used definitions 18
3. Top cyber-threats 19
Content and purpose of this chapter 19
Malware 21
Web-based attacks 24
Web application attacks 27
Denial of Service 30
Botnets 34
Phishing 38
Spam 41
Ransomware 43
Insider threat 46
Physical manipulation/damage/theft/loss 49
Exploit kits 51
Data breaches 54
Identity theft 57
Information leakage 60
Cyber espionage 63

ENISA Threat Landscape Report 2016 Final version | 1.0 | OPSEC | January 2017
04
Visualising changes in the current threat landscape 66
4. Threat Agents 67
Threat agents and trends 67
Top threat agents and motives 68
Threat Agents and top threats 72
5. Attack Vectors 74
Introduction 74
Common ransomware attacks 74
Common attacks to breach data 75
Distributed Denial of Services (DDoS) attacks 77
Targeted attacks 78
6. Conclusions 80
Main cyber-issues ahead 80
Conclusions 83

ENISA Threat Landscape Report 2016 Final version | 1.0 | OPSEC | January 2017
05
Executive Summary
The ENISA Threat Landscape 2016 - the summary of the most prevalent cyber-threats – is sobering: everybody is exposed to cyber-threats, with the main motive being monetization. The year 2016 is thus characterized by “the efficiency of cyber-crime monetization”. Undoubtedly, optimization of cyber-crime turnover was THE trend observed in 2016. And, as with many of the negative aspects in cyber-space, this trend is here to stay. The development and optimization of badware towards profit will remain the main parameter for attack methods, tools and tactics. Attacks including multiple channels and various layers seem to be the “state-of-the-art” for advanced threat agents. While robust, efficiently managed flexible tools continue to be widely available, even to low capability threat agents “as-a-service”.
Fortunately, the maturity of defenders increases too. In 2016, cyber-threat prevention has:
Gained routine in disruptions of malicious activities through operations coordinated by law enforcement and including vendors and state actors.
Achieved some advantages in attribution through exploitation of weaknesses of anonymization infrastructures, tools and virtual currencies.
Gained valuable experience by major attacks in the area of DDoS. This will help towards future mitigation of such attacks that in the past have been considered as disastrous.
Cyber-security has gained in importance in the professional education and training market. It is remarkably strengthened in universities and training organisations in an attempt to cover the demand and thus counteract current and future skill shortage.
However, in cyber-space the attackers are one step ahead. The advances of defenders have been the result of superiority of attackers in:
Abusing unsecured components to mobilize a very large attack potential. This capacity that has been demonstrated by means of DDoS attacks by infected IoT devices.
Successfully launching extortion attacks that have targeted commercial organisations and have achieved very high levels of ransom and high rates of paying victims.
Demonstrating very big impact achieved by multi-layered attacks to affect the outcome of democratic processes at the example of the US elections.
Operating large malicious infrastructures that are managed efficiently and resiliently to withstand takedowns and allow for quick development and multi-tenancy.
Expectedly, all above issues can be followed by means of the assessment performed within the ENISA Threat Landscape (ETL 2016). In the following report, we give an overview of the top cyber-threats assessed in 2016. By concentrating more on the cyber-threats, ETL 2016 is more streamlined towards the details of cyber threats, while it provides information on threat agents and attack vectors.
Based on this material, we deliver our conclusions for policy makers, businesses and research. They serve as recommendations and are taken into account in the future activities of ENISA and its stakeholders. An overview of identified points is as follows:

ENISA Threat Landscape Report 2016 Final version | 1.0 | OPSEC | January 2017
06
Policy conclusions:
- Organize multi-stakeholders debates in an attempt to establish common denominators for responsibilities, areas of concern, open issues and course of action with regard to cyber-security in general and cyber-threat intelligence in particular.
- Based on CTI, establish/revive dialogue among all concerned parties on the balance between security, privacy and surveillance requirements, both at national and international levels. The achieved results may not worsen the exposure to related cyber-threats.
- Develop the engagements in the areas of cyber-security education, training and awareness with regard to good practices, skill development and youth engagements. Main parameter in this engagements should be the dissemination of controls for the mitigation of cyber-threats, as indicated in the findings of this report.
Business conclusions:
- Use CTI as an active tool to defend assets but also to assess efficiency level of protection measures in place with regard to the cotemporary cyber-threat exposure.
- Investigate methods to communicate cyber-threat knowledge to the boardrooms and integrated CTI with existing risk management models.
- Use CTI as a factor to reduce costs of security controls, share information on modus operandi and define active-defence methods.
Research conclusions:
- Study the dynamics of badware and attack methods over the last years with the aim to proactively prepare for future threats. Use artificial intelligence methods to recognise/discover causal relationships among various elements of CTI.
- Develop models for active defence, enhance CTI in to include business requirements and elaborate on asset management and security management integration.
In the last chapter (see chapter 6.1), a number of important issues leading to those conclusions are mentioned; this chapter provides more elaborated conclusions. It is proposed to consider these issues and identify their relevance by reflecting them to the own situation.
The figure below summarizes the top 15 cyber-threats and threat trends in comparison to the threat landscape of 2016.

ENISA Threat Landscape Report 2016 Final version | 1.0 | OPSEC | January 2017
07
Top Threats 2015 Assessed
Trends 2015 Top Threats 2016
Assessed Trends 2016
Change in ranking
1. Malware 1. Malware → 2. Web based attacks 2. Web based attacks → 3. Web application attacks 3. Web application attacks → 4. Botnets 4. Denial of service ↑ 5. Denial of service 5. Botnets ↓ 6. Physical damage/theft/loss 6. Phishing ↑ 7. Insider threat (malicious,
accidental) 7. Spam ↑ 8. Phishing 8. Ransomware ↑ 9. Spam 9. Insider threat (malicious,
accidental) ↓
10. Exploit kits 10. Physical manipulation/damage/ theft/loss
↓
11. Data breaches 11. Exploit kits ↓ 12. Identity theft 12. Data breaches ↓ 13. Information leakage 13. Identity theft ↓ 14. Ransomware 14. Information leakage ↓ 15. Cyber espionage 15. Cyber espionage →
Legend: Trends: Declining, Stable, Increasing Ranking: ↑Going up, → Same, ↓ Going down
Figure 1: Overview and comparison of the current threat landscape 2016 with the one of 20151.
1 Besides changes in ranking, the figure also displays the trends identified for each threat. The interesting phenomenon of having some threats with stable or decreasing trend climbing up the ranking, is mostly due to the fact that, albeit stagnation/reduction, the role of this threat in the total landscape has grown, for example through volume of malicious activities, identified incidents, breaches attributed to the threat, etc. Similarly, other threats with increasing trend are lowered in the ranking (e.g. 2016’s threat ranks 10-12 in the table below). This is due to threats climbing to higher positions of the ranking, inevitably leading to lowering all other threats below.

ENISA Threat Landscape Report 2016 Final version | 1.0 | OPSEC | January 2017
08
1. Introduction
This is the ENISA Threat Landscape report 2016 (ETL 2016). It is the fifth in a series of reports analysing cyber-threats through collection of open source material2. The effort consists in information collection, information collation and information analysis. The time span of this exercise covers the period between December 2015 and December 2016.
After discussion (ENISA external and internal), there are some changes/adaptations in the ETL 2016. As opposed to previous years, this document consists of the current cyber-threat landscape. The part covering the impact of cyber-threats to various thematic areas has been abandoned. There are two main reasons for this:
To concentrate more on the main “product” of the ETL, this being the list of top cyber-threats. Based on feedback received, stakeholders have expressed their wish to have more comprehensive information about these top cyber threats and their components; and
Through internal distribution of work, emerging technology issues are covered by multiple ENISA projects addressing critical and smart infrastructures, but also elaborating on privacy and security issues. To this extent, assessment of exposure will be done within these projects, based on the ETL information.
The implications of this decision is an ETL that is more streamlined to the top 15 cyber-threats and the related information. Further shifts that are planned for the next year is the full integration of ENISA Info Notes3 and ETL, while some efforts will be invested in better visualization of interconnections (semantics) among all entities involved in ETL (see also section 2.6). Our focus is to better visualise the interconnection, while providing threat information within the year in a regular manner.
As regards the integration of Info Notes and ETL, it is planned to establish the link by better materializing the contextual relationships. In other words, Info Notes will contain links to the top cyber-threats by means of references to threat agents, resources, mitigation, attack vectors, assets, etc. In this way, Info Notes will contribute towards a deeper analysis, complementarity and better understanding of matters related to assessed cyber-threats.
Besides open source information, in this report ENISA has used information provided by the MISP platform4, by CERT-EU5 and by also using threat intelligence of the cyber-security portal CYjAX6, granted as access pro bono to ENISA. Confidential information found in these platforms has just been taken into account in our analysis without any disclosure or reference to this material.
2 It is worth mentioning, that in this chapter some parts of the ETL 2015 text have been reused, in particular regarding the sections policy context and target group. These two topics are considered identical to the previous landscapes. 3 https://www.enisa.europa.eu/publications/info-notes#c5=2006&c5=2016&c5=false&c2=infonote_publication_date&reversed=on&b_start=0, accessed November 2018. 4 http://www.misp-project.org/, accessed November 2015. 5 https://cert.europa.eu/cert/filteredition/en/CERT-LatestNews.html, accessed November 2015. 6 https://www.cyjax.com/, accessed November 2015.

ENISA Threat Landscape Report 2016 Final version | 1.0 | OPSEC | January 2017
09
Just as in previous years, ENISA has consulted the ETL Stakeholder group that accompanies the threat analysis work. The group has provided valuable input, has supported the ENISA threat analysis and has reviewed ENISA material.
Last but not least, ENISA has a tight cooperation with CERT-EU in the area of threat information. This is implemented by means of mutual reviews of cyber-threat assessments, use of CERT-EU services and by of intensive personal communication. This allows maintaining a high level of coherence in mutual views on cyber-threat assessment. Moreover, ENISA capitalizes on valuable comprehensive threat information that CERT-EU delivers to its partners. This kind of cooperation gets continuously intensified and leads to complementarity of viewpoints, a fact that represents an added-value for the recipients of the produced material.
Policy context The Cyber Security Strategy of the EU7 underscores the importance of threat analysis and emerging trends in cyber security. The ENISA Threat Landscape contributes towards the achievement of objectives formulated in this strategy, in particular by contributing to the identification of emerging trends in cyber-threats and understanding the evolution of cyber-crime (see 2.4 regarding proposed role of ENISA).
Moreover, the new ENISA Regulation8 mentions the need to analyse current and emerging risks (and their components), stating: “the Agency, in cooperation with Member States and, as appropriate, with statistical bodies and others, collects relevant information”. In particular, under Art. 3, Tasks, d), iii), the new ENISA regulations states that ENISA should “enable effective responses to current and emerging network and information security risks and threats”.
ETL is also related to the context of NIS Directive9, as it contributes towards provision of cyber-threat knowledge needed for various purposes defined in NIS-Directive (e.g. article 69). Moreover, it comprises a comprehensive overview of cyber-threats and as such it is a decision support tool for EU Member States and can be used in various tasks in the process of building cyber-capabilities.
Target audience Information in this report has mainly strategic and tactical relevance10 to cyber-threats and related information. Such information has long-term relevance of approximately up to one year. It is directed to executives, security architects and security managers. Nonetheless, provided information is also easily consumable by non-experts.
Looking at the details provided by this report and ETL in general, one can discriminate among the following information types and target groups:
The first part of the document that can be found in chapter 2 is a description of the current state-of-play in cyber threat intelligence (CTI). It reflects discussions performed in 2016 with the ENISA Threat Landscape Stakeholder Group (ETL SG) and covers current needs identified in the area of strategic use of cyber-threat intelligence. This information targets security professionals or scholars interested in open issues of CTI.
7 http://www.ec.europa.eu/digital-agenda/en/news/eu-cybersecurity-plan-protect-open-internet-and-online-freedom-and-opportunity-cyber-security, accessed November 2015.
8 http://eur-lex.europa.eu/LexUriServ/LexUriServ.do?uri=OJ:L:2013:165:0041:0058:EN:PDF, accessed November 2015. 9 http://eur-lex.europa.eu/legal-content/EN/TXT/PDF/?uri=CELEX:32016L1148&from=EN, accessed November 2016. 10 https://www.cpni.gov.uk/documents/publications/2015/23-march-2015-mwr_threat_intelligence_whitepaper-2015.pdf?epslanguage=en-gb, accessed December 2016.

ENISA Threat Landscape Report 2016 Final version | 1.0 | OPSEC | January 2017
10
The top cyber-threats may find a wider group of potential stakeholders who are interested in understanding the threat landscape in general means or would like to deepen into particular threats and their aspects. Hence decision makers, security architects, risk managers, auditors clearly belong to the target group. And again, scholars and end-users who wish to get informed about the where-about of various cyber-threats may find this material useful. Last but not least, ETL 2016 can be a useful tool for professionals of any speciality who are interested in understanding the state-of-play in the area of cyber-threats.
Besides the information on cyber-threats, ETL is offering an overview of the entire cybersecurity threat “ecosystem”, by covering the relationships of various objects, such as threat agents, trends and mitigation controls. These interconnections make up the context of cyber-threats and can be used in various other activities, such as any kind of security assessment, identification of protection needs or categorization of assets.
Finally, in 2016 ENISA has produced two detailed threat assessments in two sectors. These thematic landscapes have been issued for Mobile to Mobile Communication (M2M)11 and Hardware12 and are published as separate reports.
Structure of the document The structure of ETL 2016 is as follows:
Chapter 2 “Cyber Threat Intelligence and ETL” provides an overview of recent developments in cyber-threat intelligence positions the ETL and summarizes some cyber-threat intelligence issues that are seen as emerging.
Chapter 3 “Top Cyber-Threats” is the heart of the ENISA Threat Landscape. It provides the results of the yearly threat assessment for the top 15 cyber-threats.
Chapter 4 “Threat Agents” is an overview of threat agents with short profiles and references to developments that have been observed for every threat agent group in the reporting period.
Chapter 5 “Attack Vectors” provides an overview of important attack vectors that have led to the most important incidents in 2016.
Chapter 6 “Conclusions” concludes this year’s ETL. By synthesizing a generic view from the assessed cyber-threats, it provides some policy, business and research recommendations.
11 https://www.enisa.europa.eu/publications/m2m-communications-threat-landscape/ 12 https://www.enisa.europa.eu/publications/hardware-threat-landscape/

ENISA Threat Landscape Report 2016 Final version | 1.0 | OPSEC | January 2017
11
2. Cyber Threat Intelligence and ETL
Cyber Threat Intelligence: State-of-play Continuing the trend of the previous years, in 2016 cyber threat intelligence (CTI) and threat analysis have gone through significant developments regarding improvement of methods, further elaboration of good practices and adoption/implementation paths. An expansion of the available tool landscape and an enlargement of functions for managing CTI has also taken place13. By mainly focussing on strategic and partially on tactical threat intelligence, we have observed main trends and developments in the evolution of methods and good practices. In particular:
Enrichment of cyber threat intelligence with guidance from the area of public health: This has been
materialised by comparing threats with epidemics and by considering methods to achieve public
health with cyber threat and risk mitigation techniques14. Though not new15, comparing cyber threats
and public health has achieved some increased attention, in particular with regard to CTI sharing and
focus on victims16.
Adoption of good practices from military and intelligence services: The need to introduce new
elements in the CTI life cycle17 is evident, especially due to its adoption in various sectors (i.e. military
and national security). This is also not a new development18. However, in 2016 this trend has reached
such a maturity as to become integral part in various trainings in the area of CTI19,20. Moreover as CTI
becomes important in cyber warfare, we see a strong cross-fertilization of ideas between these
disciplines21.
Bridging CTI and risk management, considering business requirements for threat assessment and
ensuring better risk mitigation through cyber threat information: This is quite an emerging trend, as
the need to coordinate operational security and business activities is continuously growing. Business
people and in particular decision makers, need to understand how threat intelligence will help them to
mitigate business risks. Similarly, it needs to be clear how business requirements are reflected towards
security operational activities (i.e. Security Operations Centre - SOC). It is indicative that in this year’s
13 https://github.com/hslatman/awesome-threat-intelligence, accessed November 2016. 14 https://www.iiss.org/-/media//silos/survival/2016/survival/58-1-03-buchanan/58-1-03-buchanan.pdf, accessed July 2016. 15 http://www.secure.edu.pl/pdf/2014/D2_1130_P_Armin.pdf, accessed July 2016. 16 https://www.irgc.org/wp-content/uploads/2016/04/IRGC-Public-Cybersecurity-OP-2016.pdf, accessed July 2016. 17 https://www.sans.org/reading-room/whitepapers/threats/threat-intelligence-planning-direction-36857, accessed July 2016. 18 http://www.sei.cmu.edu/library/assets/whitepapers/citp-summary-key-findings.pdf, accessed September 2016. 19 https://www.theintelligenceacademy.net/courses/openacademy/open-intellacademy-faculty/, accessed September 2016. 20 https://www.mcafeeinstitute.com/courses/certified-counter-intelligence-threat-analyst, accessed September 2016. 21http://www.insaonline.org/i/d/a/b/TacticalCyber.aspx, accessed August 2016.

ENISA Threat Landscape Report 2016 Final version | 1.0 | OPSEC | January 2017
12
RSA Conference (RSA Conference 2016) CTI has been discussed intensively, and in particular its
interplay with Risk Management22,23,24.
Increase in number of identified CTI use cases: Through numerous interactions in the CTI community,
the issue of CTI usage has reached a high degree of detail, that is, many use cases of CTI have been
identified25,26. Combined with the increasing number of CTI tools (see point below), advancements in
the definition of use cases increase adoption of CTI methods in a variety of IT and business
environments.
Wider adoption of good practices: Various tools and good practices come to support CTI adoption, in
particular at the operational level. Together with CTI good practices, such tools are in support of threat
intelligence activities, covering detection of attack patterns, co-relation of intelligence information on
bad URLs/IPs and correlation of security logs from different platforms. In the law enforcement sector,
for example, we have seen very efficient practices in identifying, locating and attributing cyber-crime,
while performing comprehensive reporting addressed both to experts and non-experts181.
Increase of CTI importance in professional skill-set: CTI achieved first rank of the top 5 cyber security
skills in 201627. This trend is indicative of two things: the increasing role of CTI in cyber security
business on the one hand and the relatively low maturity of CTI in terms of existence of (trainable)
good practices on the other. Organisations in need of CTI professionals are already looking for options
to overcome this skill shortage.
Available standards in the area are gaining importance: Various professional services are based on
such standards and are also supported by various tools. It is expected that the role of such standards
will increase, while at the same time standardisation bodies will take care of integrating them more
systematically into security management practices.
Significant increase of investments: Last but not least, nation states are going to significantly increase
investments in cyber-defence. This will boost CTI as one of the main areas to be developed. In
combination with military intelligence, CTI will become a powerful tool in cyber-defence. Moreover,
these investments will generate new services and functions that will also be made available in the civil
market and in education. Cyber-defence is going to engage/attract available CTI capabilities and
resources. This however might further worsen CTI know-how availability.
Generally speaking, the availability of authoritative CTI resources has become better in 2016. Various CTI professionals have digested existing sources and provide comprehensive information on CTI developments. Some digested collection of existing CTI sources can be found here28,29.
22 https://www.rsaconference.com/blogs/threat-modeling-peers-discuss-risk-based-application-security-design-at-rsac-2016, accessed July 2016. 23 https://www.rsaconference.com/events/us16/agenda/sessions/2364/bridging-the-gap-between-threat-intelligence-and, accessed July 2016. 24 http://www.csoonline.com/article/3038833/security/threat-intelligence-programs-lack-context-experts-say.html, accessed July 2016. 25 http://blogs.gartner.com/anton-chuvakin/2016/05/16/how-a-lower-maturity-security-organization-can-use-threat-intel/, accessed July 2016. 26 http://blogs.gartner.com/anton-chuvakin/2016/06/28/babys-first-threat-intel-usage-questions/, accessed July 2016. 27 http://www.darkreading.com/careers-and-people/5-hot-security-job-skills-/d/d-id/1324678, accessed July 2015. 28 http://reads.threatintel.eu/, accessed July 2016. 29 https://github.com/hslatman/awesome-threat-intelligence, accessed July 2016.

ENISA Threat Landscape Report 2016 Final version | 1.0 | OPSEC | January 2017
13
CTI Big Picture: An Overview A deficit in available context for CTI content has been identified in various expert fora, articles30 and events this year31. During discussions with the ETL expert group, the need for summarizing CTI concepts has been identified. The aim of this task is to highlight the context of CTI by showing the interplay between its various related components. Moreover, one may spot areas that are under-developed and as such not well utilized in the acquisition and use of CTI.
A “CTI big picture” has been developed in order to demonstrate the connection to business processes and illustrate context to various CTI components. This overview contributes to the identification and illustration of co-relations, the main task to pass from CTI information to knowledge. Clarification of relationships among various CTI-relevant parts will help getting non-IT-Security people, business fraud analysts and business process owners on the same pace with regard to the analysis/assessment of threat exposure to an organisation. Finally, the presented overview positions the content of the ENISA Threat Landscape with regard to the CTI big picture.
The CTI overview is shown in Figure 2 . It demonstrates all elements covered within an attack to a business process and shows with which artefacts the assets involved in the process are targeted. It is worth mentioning, that not all artefacts/components used are IT related (see grey area in figure below); there are steps/procedures used within an attack, that are performed by just having knowledge or information about the details of the business process at stake. In other words a Modus Operandi (MO) of an attack is not completely IT-based. Moreover, business related issues (i.e. detailed knowledge of the business process) are key, both in planning an attack and in analysing an incident. This is represented in the figure below by means for the business process as entry point to the execution of the fraud case/attack scenario.
Business Process
Business Process Assault Plan/ScenarioFraud Case
Cyber Attack Vector (Campaign)Pre-attack phase Post-attack phase
TTP 1 TTP n
Modus Operandi
Cyber threat 1 Cyber threat 2 Cyber threat 3 Cyber threat 4
Tactics, Techniques and Procedures
Cyber-Threats
Reconnaissance Weaponization Delivery Exploitation InstallationCommand &
ControlActions on ObjectivesKill Chain
Weakness led to fraud
Implemented by
Uses techniques
Threats eventually used in KC phases
Based on cyber threats
Affected Assets
E.g. recon based on human engineering
E.g. monetization based on money mules
Targeting assets
IT/Cyber related content
Legend:
Figure 2: Big picture CTI elements from Modus Operandi to affected assets
30 http://raffy.ch/blog/2016/08/13/threat-intelligence-useful-whats-the-future/, accessed September 2016. 31 https://www.rsaconference.com/events/us16, accessed September 2016.

ENISA Threat Landscape Report 2016 Final version | 1.0 | OPSEC | January 2017
14
But the big picture of Figure 2 shows also the main challenges related to CTI. In particular32:
CTI needs to encompass knowledge of the business processes and business assets at stake. This can be
done by co-relating technical incidents over IT assets to compound business assets. Additional
elements will need to be considered, such as business requirements, business process owner, risk
owner/asset owner, etc. As an example, such information could be used in the business impact
assessment of data breached incidents like xDedic33, where hacked business servers are offered to
malicious users.
It is interesting to analyse attacks and convert them to business oriented modus operandi (MO). This
kind of information (context) is necessary in order to extrapolate an incident at the level of business
processes with the aim to detect and mitigate the business risk/fraud.
By collecting information about known modus operandi, one may calculate the business impact that
could be caused by the relevant attack. As a matter of fact, business impact can be better
communicated to the asset owners and decision makers, who in most cases are not cyber-security
fluent. To this extent, MO are valuable pieces of information that should be shared among
organisations that are acting in similar business sectors. They comprise “ready to use” CTI knowledge
pieces that are directly applicable to organisation types.
It should be clear that cyber-related content may constitute just one part of an attack. Important
attack steps may be initiated or executed through techniques that are based solely on the
organisational/human engineering channel34. These are very important parts of a MO and should not
be left out CTI, solely because they do not happen in the cyber-space.
The role of asset based modelling of business processes and security controls is quite important in the
establishment of CTI context and necessary for the successful analysis of incidents. When assets are
not used in security and business processes, this co-relation needs to be done “manually” during the
analysis phase. As such will be rather resource intensive and costly and will only be encountered ex-
post (i.e. after the hack). Hence, assets may be assigned a central role in CTI, as they are targets for
both offensive and defensive activities. The role of assets in CTI is subject of chapter 2.3 below.
Kill-chain35 may be utilized in order to associate an incident to group(s) of assets given the phase an
incident has been detected (e.g. deliver, installation, command and control). This matter is further
elaborated in the coming discussion (see section 2.1).
Given that the big picture of CTI contains both cyber-security/technical and business related
information, it is still open what can be the roles that possess the skills required to consolidate and
maintain this knowledge within an organisation. Discussion with various experts in the filed show that
currently organisations use ad-hoc solutions to this, while no good practices do exist for this matter.
Interestingly, some analyses use charts with similar content to depict the course of attacks, both related to a specific36 and to generic ones37. They seem to constitute a very comprehensive and clear representation
32 List is not sorted according to any priorities. 33 https://securelist.com/blog/research/75027/xdedic-the-shady-world-of-hacked-servers-for-sale/, accessed September 2016. 34 http://www.mediapro.com/blog/human-factor-report/, accessed September 2016. 35 https://en.wikipedia.org/wiki/Kill_chain, accessed September 2016. 36 http://www.thedarkvisitor.com/2008/05/chinese-hacker-virus-industry-chain/, accessed September 2016. 37 https://www.linkedin.com/pulse/effective-cyber-security-economics-efficiency-daniel-korstad, accessed September 2016.

ENISA Threat Landscape Report 2016 Final version | 1.0 | OPSEC | January 2017
15
of the steps of an attack and should be used in the analysis phase of incident or threat related information. Equally interesting are presentations that cover the entire life-cycle of CTI at a very good level of detail22,38.
The role of assets in CTI Assets are an important element both in information security management39 (ISMS) and Risk Assessment/Management. The merits of asset based risk assessment are obvious40,41: assets, vulnerabilities, threats and controls are four strongly interconnected entities that embed strong security context (see also diagram in chapter 2.6). Hence, in the attempt to enhance context in CTI, assets play a central role. They materialize the consequences of a succeeded threat (via an incident), while establishing a bridge to business processes, business owners, risk owners, etc. Important de-facto standards for cyber threat artefacts such as STIX42 foresee the inclusion of assets as part of an incident43.
We believe that in CTI assets deserve more attention and need to be considered as THE independent entities for which not only the effects of an incident are interesting, but also to which many other CTI concepts do connect. By shifting our focus to the assets from the CTI big picture (see Figure 2), we show in Figure 3 below examples of how assets can assist in building useful CTI co-relations. In particular:
Based on the top 15 cyber threats, for example, one can identify which is the exposure of single assets
and asset groups at any degree of detail (i.e. business assets and technical assets).
Through a possible grouping of assets according to kill chain steps, one can identify which security
controls are available to mitigate reconnaissance activities that can be performed by abusing asset
properties. Obviously the same can be done for all other kill-chain phases.
Based on the above, one can identify the efficiency of controls given an assumed threat exposure.
By considering the extensions defined in the big picture, one can identify the efficiency of existing
security controls for a certain modus operandi. Moreover, simulation of cyber threats may provide
exposure of assets due to known weaknesses (technical, organizational).
Based on changes in cyber-threat landscape, new vulnerabilities/weaknesses and new modus
operandi, security controls can be revisited.
Asset exposure can be grouped based on a business process or an asset owner.
The asset inventory is a very good tool to connect technical information (i.e. Indicators of Compromise
– IOCs, TTPs, strategic and tactical CTI, etc.) to business assets and business processes.
It is worth mentioning, that these are examples of possible CTI context that can be established via assets. Many additional examples may be derived, especially if threat agents, business owners, TTPs, fraud scenarios, etc. are also being taken into account.
38 https://www.rsaconference.com/writable/presentations/file_upload/cxo-t08r-threat-intelligence-is-like-three-day-potty-training.pdf, accessed September 2016. 39 http://advisera.com/27001academy/knowledgebase/how-to-handle-asset-register-asset-inventory-according-to-iso-27001/, accessed September 2016. 40 http://www.vigilantsoftware.co.uk/blog/conducting-an-asset-based-risk-assessment-in-iso-270012013/, accessed September 2016. 41 http://advisera.com/27001academy/knowledgebase/iso-27001-risk-assessment-how-to-match-assets-threats-and-vulnerabilities/?icn=free-knowledgebase-27001&ici=bottom-iso-27001-risk-assessment-how-to-match-assets-threats-and-vulnerabilities-txt, accessed September 2016. 42 https://stixproject.github.io/about/, accessed December 2016. 43 https://stixproject.github.io/documentation/idioms/affected-assets/, accessed September 2016.

ENISA Threat Landscape Report 2016 Final version | 1.0 | OPSEC | January 2017
16
TTP 1 TTP n
Cyber threat 1 Cyber threat 2 Cyber threat 3 Cyber threat 4
Tactics, Techniques and Procedures
Cyber-Threats
Reconnaissance Weaponization Delivery Exploitation InstallationCommand &
ControlActions on Objectives
Kill Chain
Affected Assets
Vulnerabilities/Weaknesses
Security ControlsImplementedControls
Grouping of Assets according to their potential role in Kill Chain Phases
Exposure reduction via controls
Targeting assets via exploitationExploitableWeaknesses
Threats eventually used in KC phases
Figure 3: Assets grouped according to their exposure with regard to Kill Chain phases
Though not very different from existing approaches to threat/risk management and CTI lifecycle approaches44,45, this proposal puts at the foreground the examination of asset protection with regard to currently available threats. At the same time, it provides clearer and more efficient methods for feedback loops among CTI, risk assessment and security management. Another advantage of this approach is, that it leads to a better “segmentation” of protection measures and assets towards threats/threat groups and modus operandi. This will support a better connection of CTI to business processes and business objectives, as often requested in 2016 in various occasions31. Finally, as often indicated in the ENISA Threat Landscape, this would further facilitate moving from vendor to user/customer driven security market.
Threat taxonomy During 2016, ENISA has launched a Threat Taxonomy46. This is a hierarchy of threats with the aim to establish a point of reference for various threat types and detailed threat information. The benefits of such structures have been described in last year’s threat landscape47. In 2016, the applicability of this structure has been investigated. The achievements obtained were:
44 https://www.cybersecurityintelligence.com/blog/understanding-the-threat-intelligence-lifecycle-911.html, accessed November 2016. 45 http://www.ey.com/Publication/vwLUAssets/EY-how-do-you-find-the-criminal-before-they-commit-the-cybercrime/%24FILE/EY-how-do-you-find-the-criminal-before-they-commit-the-cybercrime.pdf, accessed November 216. 46 https://www.enisa.europa.eu/topics/threat-risk-management/threats-and-trends/enisa-threat-landscape/etl2015/enisa-threat-taxonomy-a-tool-for-structuring-threat-information, accessed September 2016. 47 https://www.enisa.europa.eu/publications/etl2015, accessed September 2016.

ENISA Threat Landscape Report 2016 Final version | 1.0 | OPSEC | January 2017
17
The threat taxonomy has been adopted by MISP48, the major platform for information sharing on
malware. MISP has integrated the ENISA threat taxonomy to the vocabulary used and it has
consolidated it with other taxonomies49.
Various players in CTI have contacted ENISA to obtain permission to use it as a threat catalogue within
their threat assessment and risk assessment methods.
ENISA has used the threat taxonomy to communicate the contents of various threat groups to various
co-operation partners. Based on this information, for example, CSIRTs are in the position to derive
filtering rules. These rules are then used to dynamically deliver to ENISA dashboards with desired
information about particular threats. This information flows in the yearly threat analysis.
ENISA will continue maintaining the threat taxonomy as “living document” and share it with the community both over the ENISA web site and major other sites using this resource.
Assessed emerging CTI issues Concluding this chapter, we summarise current trends and emerging issues in the area of CTI. It is expected that these issues will occupy the related community in the coming months/year:
Stronger inclusion of assets in relevant CTI concepts and especially with regard to information about
business objectives and business processes. This will lead to a better integration of CTI with enterprise
risk management. Models to relate business Impact to technical threats might be further elaborated
and tested. This will help organizations to implement business driven threat management.
A variety of European countries50, 51, 52 and public organisations53 perform massive investments in
cyber-security defence capabilities. It is expected that these investments will boost CTI as one of the
most desired resources for the years to come.
The trend observed in the area of cyber-defence, will create significant momentum for CTI methods
and tools. By including available intelligence capabilities, CTI will be further improved and will thus
further mature. This trend will result the creation of new niches for market products and services.
Similar trends will be the result of advancing existing CTI practices in a similar pace as it has been
observed in the recent years, whereas “connectivity” to business requirements will lead this
development.
Just as in any emerging technology area, in CTI some de-facto standards have emerged.
Standardisation bodies will need to speed-up reaction time and introduce timely CTI in existing
practices.
The use of CTI in testing effectiveness of existing security controls will be an important element in the
management of security. This will reduce expenses of certification and compliance efforts, while
leading to a more “agile” security approach. Moreover, this process could build the basis for red-
48 http://www.misp-project.org/, accessed September 2016. 49 https://github.com/MISP/misp-taxonomies/commit/70be9e35706aa0b782ebfd5c6af6d587f760ede0, accessed September 2016. 50 https://techcrunch.com/2015/11/18/uk-gov-to-invest-in-security-startups/, accessed September 2016. 51 http://www.europeanfiles.eu/wp-content/uploads/issues/2016-january-40.pdf, accessed September 2016. 52 http://www.janes.com/article/59861/germany-outlines-plan-to-create-bundeswehr-cyber-command, accessed September 2016. 53 http://www.heise.de/tp/artikel/48/48970/1.html, accessed September 2016.

ENISA Threat Landscape Report 2016 Final version | 1.0 | OPSEC | January 2017
18
teaming activities within an organisation. Last but not least, CTI could be used in assessing control
costs against threat exposure level of business processes.
Scope and used definitions The method used for the development of ETL has been documented in previous landscapes. Indicatively we would like to mention chapter 2.1 of ETL 2015 (see chapter “Data structures used in the threat analysis process and threat landscaping”)47, as well as chapter 2.4 of ETL 201454 (see “Content of this year’s ETL and Terminology”). For this reason, in ETL 2016 we do not refer to the method and model underlying the creation of the present report. Interested readers will need to consider the material mentioned above.
The definitions used in this study are identical to the ones of ETL 201547. In order to visualize the relationships among all elements of risks, we use a figure taken from ISO 15408:2005 (see Figure 4). This figure has a level of granularity that is sufficient to illustrate the main elements of threat and risk mentioned in this report. The entities “Owner”, “Countermeasures”, “Vulnerabilities”, “Risks” and partially “Assets” are not taken into account in the ETL. They appear in the figure in order to show their context with regard to threats. The notion of attack vector is being displayed in this figure and is covered in the present report (see chapter 5).
One should note that the entities threat agent and threat presented in Figure 4 are part of the ETL data model. This is quite natural as these entities make up the kernel of ETL.
As regards risks, we adopt the definition according to the widely accepted standard ISO 27005: “Threats abuse vulnerabilities of assets to generate harm for the organisation”. In more detailed terms, we consider risk as being composed of the following elements:
Asset (Vulnerabilities, Controls), Threat (Threat Agent Profile, Likelihood) and Impact.
Figure 4: The elements of risk and their relationships according to ISO 15408:2005
54 https://www.enisa.europa.eu/publications/enisa-threat-landscape-2014/at_download/fullReport, accessed December 2016.
Owners
Countermeasures
Vulnerabilities
Threat agents
Risks
AssetsThreats
value
wish to minimise
imposereduce
that may possess
that may be reduced by
may be aware of
leading to
that exploit
that increase
wish to abuse and/or may damage
to
to
give rise to
Attack Vectorsbased on (set of)
use

ENISA Threat Landscape Report 2016 Final version | 1.0 | OPSEC | January 2017
19
3. Top cyber-threats
Content and purpose of this chapter This chapter presents the current threat landscape 2016 as it has been assessed through analysis and collation of collected information. Open source intelligence (OSINT) was once again the method used to collect the information that served as input to our threat analysis process. The main time window for the collection of information is one year: November/December 2015 till the same period of 2016. We refer to this period as “the reporting period”. The collected information represents a significant part of news/articles/discussions that took place in this period. Though non-exhaustive55, they considered as representative for the cyber-threat landscape.
While the available material on cyber threats and threat intelligence continued growing, in this year some events with particular media impact have dominated the headlines. Examples are IoT security events, big DDoS attacks, data breaches and extortion/ransom activities. Thought making up a significant amount of 2016’s incidents, these events are not the only ones that are remarkable. A series of other cyber-threats have been developed that have caused severe impact on assets, such as the development of underground market of cyber-crime-as-a-service, the increased speed of compromises and the lower rates of incident detection, just to mention the most important ones. These are supposed to be the main matters of concern, as they have a long-term impact in the cyber-space.
The information collection exercise conducted in 2016 involved tight cooperation with CERT-EU, the ENISA stakeholder group and provided pro-bono access to a threat intelligence portal of CYjAX56 (CYjAX Security Portal). Moreover, malware information has been taken into account through the malware information sharing platform MISP. Though the information taken into account contained some classified information, this material has not been disclosed. It has just been taken into account during the analysis process, e.g. in the validation of performed assessments.
The total number of resources referenced in this chapter are ca. 200, comprising main resources that are considered to reflect the developments of the cyber-threat landscape in an authentic manner. Additional overlapping information sources collected (ca. another 200) are not part of the document.
The fifteen top threats assessed and presented in this chapter are the ones that prevailed in the reporting period. There are some noticeable facts about the cyber-threat information presented in the individual threat descriptions/assessment below:
The structure of each cyber-threat contains its position in the kill-chain, a generic 7-step model depicting the phases of an attack57. This presentation has been readopted in the ETL 2016 after received stakeholder feedback.
It is considered that data breaches and identity theft are not typical cyber-threats. Rather, they are consequences of successful threats (i.e. actions on objectives, if formulated according to the kill-chain).
55 Due to the surging number of information on cyber-security incidents and threats and the limited available resources, it is likely that many articles, reports, white papers, etc. have escaped our attention. It may also be the case that missing reports have been intentionally left out from our references because they had significant overlaps with used references. 56 https://www.cyjax.com/, accessed November 2016. 57 http://www.lockheedmartin.com/content/dam/lockheed/data/corporate/documents/LM-White-Paper-Intel-Driven-Defense.pdf, accessed November 2016.

ENISA Threat Landscape Report 2016 Final version | 1.0 | OPSEC | January 2017
20
In other words, in order to breach information, one has to successfully launch one or some of the other cyber-threats addressed in this chapter. As such, data breach and identity theft are maintained in our top list because they are found throughout the analysed material.
The presented 15 cyber-threats do not all belong to different threat categories. Hence, they represent instance from 12 threat types, according to the threat taxonomy used58. This means that they share common characteristics, such as protection measures, dependencies and initiating threat actors. Ransomware, for example, is a specialization of the threat type malware. Hence, for this threat all malware protection measures apply, plus some that are special for the specialized threat, i.e. in this case ransomware.
Cyber espionage is merely a motive than a cyber-threat. This cyber-threat is maintained because it unites almost all of the other cyber-threats in addition to some high-capability threats that are specially crafted by state-sponsored organisations, such as advanced hacking tools, vulnerability discovery and combination of military/law enforcement intelligence methods.
As a final note in this context, one should mention that in the near future, ENISA will put some emphasis on a more dynamic development of cyber-threat assessments and a more immediate communication of assessments via targeted communication. For this purpose, an interactive model will be developed, supported by automated tools. This infrastructure aims at facilitation of information presentation, integration of various information types and enabling stakeholder feedback. It will support a more interactive, omnidirectional communication of threat information and related issues to relevant stakeholders.
58 https://www.enisa.europa.eu/topics/threat-risk-management/threats-and-trends/enisa-threat-landscape/threat-taxonomy, accessed November 2016.

ENISA Threat Landscape Report 2016 Final version | 1.0 | OPSEC | January 2017
21
Malware Malware clearly tops cyber-threats for yet another year. Malware samples have reached ca. 600 million per quarter182. It is interesting to see that in 2016 mobile malware reaches a growth of ca. 150%. Malware has two important foci in this year: ransomware and information stealing. Some malware “headlines” related to IoT are rather a qualitative than a quantitative concern59, although experts believe that IoT will be the new avenue for malware misuse60. Mobile malware, ransomware and information stealers are the main areas of “malware innovation”. Highlights of new functions encountered are: use of anonymization strategies, strong encryption (including https), flexible key management schemes, as well as obfuscation methods for detection of payload, detection of installation, etc.61. The massive proliferation of ransomware in 2016 has drawn the attention of threat intelligence vendors175,176,72 and organisations62, who have issued corresponding information notes and alerts. Equally impressive was the fact that state-sponsored threat actors have launched malware that has had high efficiency by exploiting quite a few zero-day vulnerabilities. Useful (i.e. comprehensive and well visualised) online malware activity resources can be found here63,64,65.
In the reporting period we have assessed that:
Trojans, PUPs (Potentially Unwanted Programs), Droppers, Ransomware, Command and Control (C&C),
key-logger/phishing based key-loggers, backdoor, information exfiltration, DDoS malware, and RAT are
the main categories of malware that have prevailed the internet in the reporting period216,66. The trend
was again increasing. Particular high increase rates have been encountered in mobile malware with 9
to 10 million malware samples. This is an increase of ca. 150% over 2015182.
The average lifespan of malware hashes (i.e. unique identification of a malware variant used by
malware detection tools) has been reduced to less than an hour. This means that a specific malware
variant exists for ca. one hour and is been encountered only once. This is indicative of the speed of
malware mutation in order to evade detection216 on the one hand, and one of the reasons for gaps in
end-point protection measures (i.e. anti-virus software).
Malware infection channels - also reflecting the means of malware transportation - are topped by 1.
Malware as e-mail attachment, 2. Web drive-by and 3. E-mail with malicious URL216. Knowing this, it
becomes evident that user training and awareness can lead to significant reduction of malware
infections.
Detection evasion techniques found in this year’s malware include: checking for running antivirus
process (and eventually trying to terminate it), checks for existence of a test environment67 / virtual
59 http://motherboard.vice.com/read/internet-of-things-malware-mirai-ddos, accessed October 2016. 60 http://www.iottechnews.com/news/2016/sep/28/iot-malware-attacks-being-more-sophisticated-china-and-us-source/, accessed October 2016. 61 https://www.sans.org/reading-room/whitepapers/forensics/detecting-malware-sandbox-evasion-techniques-36667, accessed October 2016. 62 https://www.fbi.gov/news/stories/incidents-of-ransomware-on-the-rise, accessed October 2016. 63 https://threatmap.checkpoint.com/ThreatPortal/livemap.html, accessed October 2016. 64 http://map.norsecorp.com/#/, accessed October 2016. 65 https://cybermap.kaspersky.com/, accessed October 2016. 66 https://securelist.com/analysis/quarterly-malware-reports/75640/it-threat-evolution-in-q2-2016-statistics/, accessed October 2016. 67 http://news.softpedia.com/news/clever-malware-is-clever-adds-new-anti-detection-tricks-508596.shtml, accessed October 2016.

ENISA Threat Landscape Report 2016 Final version | 1.0 | OPSEC | January 2017
22
machine by evaluating the performance of API calls, checks for existence of various analyst tools68,
checks of localization information to detect nationality of user, encryption of configuration files,
selective memory loading of malware modules. It is worth mentioning that state-sponsored malware
may include additional unknown “features” that and may exploit zero-day vulnerabilities69.
The mobile malware scene has shown further progress towards maturity70. Sophisticated malware on
mobiles covers a wide range of purposes, ranging from monetization via ransomware to targeted
state-sponsored attacks to individual user groups71. Just as on other platforms, ransomware on mobile
has been quadrupled in 201672. iOS infections grew too. In general, however, owning an Android
phone means that it is ca. three times riskier to get infected73. It seems that Android malware is easier
to distribute than iOS malware, possibly through a more rigid vetting process in the app store but also
weaker operating system update processes.
One question that puzzles end-users and defenders in general is the efficiency of available anti-virus
software. There are some organisations who test efficiency of AV-tools regularly74,75. It is suggested
that interested users visit such web-sites before purchasing anti-virus protection. Nonetheless, given
the existing malware protection both at end-devices and servers, there is evidence that infection rate
in residential networks is about 12%, while in mobile networks is twenty times less, i.e. about 0,6%70.
One of the important tools for continuously increasing malware proliferation is the availability of
Malware-as-a-service offerings76. The existence of such infrastructures - consisting often of various
massive components like botnets, exploit kits, malware configurators and source code – reveal
complexity from end users who can rent them for a few thousand dollars per month to launch for
example ransomware attacks with ca. 100.000 US $ monthly revenues76,77. This will be a booming
business for the years to come78 but also a target for law enforcement agencies187.
As regards the population of malware in circulation, it consists of ca. 60% Trojans, ca. 16% Viruses, ca.
11% Worms, ca. 4% PUPs and ca. 2% Adware/Spyware79. As regards the cause of infections, it has been
reported that ca. 66% are caused by Trojans, ca. 2% by Viruses, ca. 3% by worms, ca. 4% by
Adware/Spyware and ca. 25% by PUPs79. These numbers make clear that Trojans, Adware/Spyware
and PUPs are very efficient, while Viruses and Worms much less. This may explain declining numbers
for these two latter types of malware. The top five countries regarding infection rates are China,
Turkey, Taiwan, Ecuador and Guatemala (infections rates between 50 and 40%). European countries
68 https://www.sans.org/reading-room/whitepapers/forensics/detecting-malware-sandbox-evasion-techniques-36667, accessed October 2016. 69 https://citizenlab.org/2016/08/million-dollar-dissident-iphone-zero-day-nso-group-uae/, accessed October 2016. 70 http://resources.alcatel-lucent.com/asset/200492, accessed October 2016. 71 https://www.middleeastmonitor.com/20160827-israeli-malware-planted-in-iphone-of-uaes-rights-activists/, accessed October 2016. 72 https://securelist.com/files/2016/06/KSN_Report_Ransomware_2014-2016_final_ENG.pdf, accessed October 2016. 73 https://www.skycure.com/wp-content/uploads/2016/06/Skycure-Q1-2016-MobileThreatIntelligenceReport.pdf, accessed October 2016. 74 https://www.av-test.org/en/, accessed October 2016. 75 https://www.av-comparatives.org/dynamic-tests/, accessed October 2016. 76 http://www.infosecurity-magazine.com/news/enormous-malware-as-a-service/, accessed October 2016. 77 http://whatismyipaddress.com/maas, accessed October 2016. 78 https://securityintelligence.com/cybercrime-as-a-service-poses-a-growing-challenge/, accessed October 2016. 79 http://www.pandasecurity.com/mediacenter/src/uploads/2016/05/Pandalabs-2016-T1-EN-LR.pdf, accessed October 2016.

ENISA Threat Landscape Report 2016 Final version | 1.0 | OPSEC | January 2017
23
are at the bottom of infection rates: Sweden, Norway, Finland, Switzerland and Belgium (infection
rates around 20%).
Observed current trend for this threat: increasing
Related threats: Malware, Spam, Exploit kits, Botnets, Information Leakage, Data Breaches.
Authoritative Resources 2016: “IT threat evolution in Q2 2016 – Statistics”, Kaspersky72, “Mobile Threat Intelligence Report”, Skycure73, “PANDALABS QUARTERLY REPORT Q1 2016”, Pandalabs79, “McAfee Labs, Threats Report, September 2016”, McAfee182.
Kill Chain:
Reconnaissance Weaponisation Delivery Exploitation Installation Command andControl
Actions onObjectives
Malware
Step of Attack Workflow
Width of Purpose
Figure 5: Position of Malware in the kill-chain
Mitigation vector: The mitigation vector for this threat contains the following elements:
Reliance on only end-point or server malware detection and mitigation is not sufficient. Malware detection should be implemented for all inbound/outbound channels, including network, web and application systems in all used platforms (i.e. servers, network infrastructure, personal computers and mobile devices).
Establishment of interfaces of malware detection functions with security incident management in order to establish efficient response capabilities.
Use of available tools on malware analysis as well as sharing of malware information and malware mitigation (i.e. MISP)48.
Development of security policies that specify the processes followed in cases of infection. Involve all relevant roles, including executives, operations and end-users.
Understanding of capabilities of various tools and development of solutions (e.g. multi-scanner/multichannel approaches to cover gaps.
Regular update of malware mitigation controls and adaptation to new attack methods/vectors.
Regular monitor of antivirus tests74,75.

ENISA Threat Landscape Report 2016 Final version | 1.0 | OPSEC | January 2017
24
Web-based attacks Web based attacks are those that use web components as an attack surface. As web components we understand parts of the web infrastructure, such as web servers, web clients (browsers) content management systems (CMS) and browser extensions. In particular, under this threat category we subsume threats related to web server and web clients such as drive-by attacks, redirection, water-holing attacks, web browser and web server exploits, browser extension attacks abusing vulnerabilities and man-in-the-browser-attacks. This threat is a discrete one to web application attacks that are merely concerned with the weaknesses in the attack surface offered by web applications, that is, applications that are based/run on web-based components. It is expected that in 2016 web attacks will continue increasing. However, for the first time after few years, they hold second position in the generic category of network attacks behind DDoS attacks182. At this point it is worth noticing that although classified as second by this very report –motivated by means of numbers – another reason for the high ranking of web-based attacks is because of the severe impact as malware installation vector216. The latter is being considered as an equally important classification criterion.
In the reporting period we have assessed that:
Improper operation (i.e. installation, configuration and maintenance) of CMSs seems to be a significant
source of attacks to sites that have been developed with those CMSs. From the infected web pages, a
big part seems to have been developed with WordPress (ca. 78%), Joomla! (ca. 14%) and Magento (ca.
5%)80. One main reason for these infections are outdated plugins used within these CMSs. WordPress
had the lowest number of outdated extensions, whereas Magento had most of them. Joomla! was
second. Interestingly enough, it seems that the reasons for outdated extensions are due to
customizations and own developments and the fear of backwards compatibility. Top three infections
have been the use of (PHP) backdoors, malware installation (spyware) and Search Engine Optimization
(SEO) compromise80.
Drive-by downloads are still very high in the list of malware installation tools, right after e-mail/spam
attachments216. As opposed to water-holing attacks, drive-by is method for non-targeted malware
distribution. Drive-by is the main method to distribute crimeware via manipulated web sites156. To this
extend, one can assume that the number of active drive-by download links may be found in most of
the 270 million currently suspicious web sites81. Being the main tool for malware distribution, drive-by
download toolkits are already available in the underground market for prices between 100 and 700$ a
month including 24/7 support224.
Vulnerability of browsers and plugins play a significant role in attacking end points. As regards browser
vulnerabilities, in 2016 it has been reported that Internet Explorer had the most, followed by Chrome
and Safari and Mozilla224. As regards plugin vulnerabilities, there has been a strong increase in Adobe
plugins (more than tripled) Apple plugins (more than tripled), while Chrome and ActiveX plugins were
significantly reduced (to almost half)224. According to reports from end-point protection vendors 78%
of web sites found to have vulnerabilities, of which ca, 15% were critical224.
Watering hole (or water-holing) attacks are an infamous type of attack that belongs to the top
concerns of security experts in an increasing fashion163,82. Watering hole attacks are quite long in the
80 https://sucuri.net/website-security/Reports/Sucuri-Website-Hacked-Report-2016Q1.pdf, accessed October 2016. 81 http://www-03.ibm.com/security/xforce/, accessed October 2016. 82 https://webroot-cms-cdn.s3.amazonaws.com/4814/5954/2435/2016_cyberedge_group_cyberthreat_defense_report.pdf, accessed October 2016.

ENISA Threat Landscape Report 2016 Final version | 1.0 | OPSEC | January 2017
25
wild; they are using a compromised site to download malware to visitor’s machines, eventually
through an exploit kit83. The victims are decoyed by means of spear-phishing attacks. To this extent,
watering hole attacks are drive-by download attacks crafted for a specific victim group (i.e. developers,
journalists, etc.) by eventually exploiting actual vulnerabilities. Watering hole attacks may possess
remarkable sophistication by activating their injects only when the visitor’s IP is in a certain range. This
behaviour makes them difficult to trace and at the same time very targeted224.
Malicious IPs / URLs are discrete addressable locations in the internet that are misused for malicious
purposes. Such URLs may have been entirely crafted with malicious motives or may be legitimate
IPs/URLs that have been hacked. As such, the number and nature of malicious URLs may vary
significantly. At the time being, it is estimated that ca. 860 million bad URLs do exist175. Though the
number is large, in the first half of 2016 there is a big reduction in bad URLs of ca. 50%175. This may be
due to better web site protection measures and better control of domain name registration processes
and usage. In 2016 a very useful resource for detecting malicious web sites for free has been found84.
A significant security protection used in securing interactions with web components is the SSL/TLS
protocol. Though not directly relevant to web based attacks, web infrastructure components are the
usual attack surface to abuse weaknesses of the encryption. To this extent, owners and users of web
components need to be vigilant with regard to the maintenance and usage of those protocols and the
versions of corresponding components. Despite providing secure encryption per se, the hacking is
usually based on mismanaged and ill-maintained components with unpatched vulenrabilities224. The
community will need to develop awareness about the importance of the trust chain in web
infrastructure to maintain the strengths of SSL/TLS.
Observed current trend for this threat: increasing
Related threats: Malware, Spam, Botnets, Information Leakage, Data Breaches.
Authoritative Resources 2016: “WEBSITE HACKED TREND REPORT, 2016 - Q1”, Sucuri80, “Internet Security Threat Report Internet Report VOLUME 21, APRIL 2016”, Symantec224, “2016 Cyberthreat Defence Report”, Cyberedge Group82, “2016 Data Breach Investigations Report”, Verizon216.
Kill Chain:
Reconnaissance Weaponisation Delivery Exploitation Installation Command andControl
Actions onObjectives
Web based attacks
Step of Attack Workflow
Width of Purpose
Figure 6: Position of Web based attacks in kill-chain
Mitigation vector: The mitigation vector for this threat contains the following elements:
83 https://www.symantec.com/content/en/us/about/media/pdfs/b-istr_18_watering_hole_edits.en-us.pdf, accessed October 2016. 84 https://zeltser.com/lookup-malicious-websites/, accessed October 2016.

ENISA Threat Landscape Report 2016 Final version | 1.0 | OPSEC | January 2017
26
Protection of end point from unpatched software containing known vulnerabilities.
Avoidance of installation of malicious programs through potentially unwanted programs (PUPs).
Monitoring of behaviour of software to detect malicious object, such as web browser plug-ins.
Filtering web browser traffic to detect obfuscated web based attacks.
Web address, web content, files and applications reputation solutions, blacklisting and filtering to establish risk-oriented categorization of web resources.
Check application and web-browser settings in order to avoid unwanted behaviour based on default settings (esp. for mobile devices).
Do not trust browser plugins unless they are from trusted source; follow relevant recommendations85.
85 https://www.enisa.europa.eu/publications/info-notes/malware-in-browser-extensions, accessed November 2016.

ENISA Threat Landscape Report 2016 Final version | 1.0 | OPSEC | January 2017
27
Web application attacks Web application attacks are related to attacks against available web applications and web services. Certainly, such attacks have overlaps with web based attacks, as regards weaknesses and vulnerabilities of web infrastructure components: some web application attacks may be launched by abusing vulnerabilities or misconfiguration of web components, the infrastructure upon which web applications are running. It is worth mentioning that these attacks also include mobile apps, as they provide interfaces/APIs to web sources. Generally speaking, web application attacks have increased by ca. 15% in 2016 and are considered as the biggest threat to organisational security82,86. Given the number of available application vulnerabilities this is quite natural; web applications are – in most cases – a publicly available asset that also constitutes an attack surface that can be easily challenged by threat agents. This explains why web applications have the biggest share in the causes for data breaches216,86, while they play a lower role in the total number of incidents216,87. Though not fully up to date, information about web application security can be found here88. Some interesting web hacking methods can be found here89.
In the reporting period we have assessed that:
Few of the analysed reports indicate main web application attack methods. We consider this as very
useful information by means of potential protection measures to consider for their mitigation. In the
following list, assessed web application attack methods are mentioned in terms of frequency of
appearance: Local File Inclusion90 (LFI), SQL injection (SQLi), Cross Site Scripting (XSS), Remote File
Inclusion91 and PHP injection92. These attack methods come in addition to improper input, prediction
of resource allocation, directory indexing and session manipulation86. Finally, useful technical
information on web hacking has been also found, explaining techniques related to particular technical
environments93.
Obviously, attackers of web applications prefer to run their campaigns anonymously. In this way,
attackers would like to erase their trails and impede attribution. In the reporting period, we have seen
an increase in the use of anonymity mechanisms for web application attacks103 (just as it is the case
with other types of attacks, e.g. DDoS). It has been reported that approx. one third of web application
attacks have been performed by VPN or proxy103. Such attacks have been performed by ca. 20% of the
IPs used for web application attacks. This indicates a clear trend towards efficient usage of
anonymization services to attack web applications. It is very interesting to note that ca. 70% of
anonymized web application attacks have the US as origin103.
It has been reported that the top five most vulnerabilities for web application components are:
transport layer weaknesses94, information leakage through insufficient information protection in
runtime and transfer, Cross Site Scripting (XSS), weaknesses leading to content spoofing and
weaknesses of credentials leading to successful brute force attacks86. It is interesting to observe that
86 https://www.whitehatsec.com/info/website-stats-report-2016-wp/, accessed October 2016. 87 http://www-01.ibm.com/common/ssi/cgi-bin/ssialias?htmlfid=SEJ03320USEN, accessed October 2016. 88 http://www.webappsec.org/, accessed October 2016. 89 http://null-byte.wonderhowto.com/how-to/hack-like-pro-hack-web-apps-part-6-using-owasp-zap-find-vulnerabilities-0168129/, accessed October 2016. 90 http://hakipedia.com/index.php/Local_File_Inclusion, accessed October 2016. 91 http://projects.webappsec.org/w/page/13246955/Remote%20File%20Inclusion, accessed October 2016. 92 https://www.owasp.org/index.php/PHP_Object_Injection, accessed October 2016. 93 https://www.whitehatsec.com/blog/top-10-web-hacking-techniques-of-2015/, accessed October 2016. 94 http://www.sueddeutsche.de/digital/drown-angriff-it-forscher-knacken-ein-fuenftel-aller-sicheren-webseiten-1.2886536, accessed October 2016.

ENISA Threat Landscape Report 2016 Final version | 1.0 | OPSEC | January 2017
28
brute force and transport layer attacks (in particular SSL/TLS) seem to be omnipresent also outside
web application attack182 (i.e. via web based attacks and denial of service attacks respectively).
Especially with combination of weak password, brute force seems to be an important role in data
breaches.
It is interesting to have a look at the remediation level achieved by web application operators for
various vulnerabilies86. This information provides valuable insight into the level of protection
implemented and makes clear which is attack surface is more likely to be subject of attacks. In the time
period between 2013 and 2015, top five highest remediation levels have been achieved for: transport
layer protection (ca. 60%), input validation/handling (ca. 60%), Cross Site Scripting (XSS) (ca. 55%),
Predictable Resource Allocation (ca. 55%) and Directory Indexing (ca. 53%). Five lowest remediation
rates have been reported for: Insufficient Password Protection, Brute Force, Cross Site Request
Forgery, Session Management and Abuse of Functions (mitigation levels ca. 20-30%). Summarizing, this
means that the exposure through existing web application remediation levels is quite high and has
remained more or less unchanged in the last 3-4 years. This will remain an area where we will see a lot
of successful attacks with all possible consequences.
Industry sector assessed exposure rates of web applications are very interesting. They are a very good
generic means of assessing the risk level of web applications for various sectors. Going from the less
vulnerable to the most vulnerable sectors per web application exposure, we find Media/Entertainment
(ca. 44%), Insurances (ca. 44%), Energy (ca. 47%) and Banking (ca. 50%). At the low end one finds IT-
Sector (ca. 66%), Food (ca. 60%) and Manufacturing (ca. 60%). These levels show clearly that the
exposure level, especially for sectors of high monetization (i.e. banking) are still quite high. Moreover,
given IoT and Industry 4.0 initiatives in manufacturing95, one can characterize available web application
security levels as unacceptable (in particular given the criticality of those areas).
Comparing the above assessment with the registered web application incidents103 we see the following
picture: Retail (ca. 40%), Hotel and Travel (ca. 21%), Financial Sector (ca. 11%), Media/Entertainment
(ca. 5%) and Public Sector (ca. 5%). While the emergence of Brazil as a target may be related with the
hosting of the Olympic Games, retail and financial sector incidents may be related to the strong motive
of monetization surfaced in 2016.
In the reporting period, the top five countries that were sources of web application attacks were103:
Brazil (ca. 25%), US (ca. 23%), Germany (ca. 9%), Russia (ca. 7%) and China (ca. 4%). Looking at the
target of web application attacks we find at the top five positions: US (ca. 64%), Brazil (ca. 10%), UK
(ca. 6%), India (ca. 4%) and Canada (ca. 4%).
Observed current trend for this threat: increasing
Related threats: Malware, Spam, Botnets, Information Leakage, Data Breaches.
Authoritative Resources 2016: “Web Applications Security Statistics Report 2016”, WhiteHat Secucrity86, “State of the Internet / Security: Q2 2016 Report on DDoS & Web App Attack Trends”, Akamai103.
Kill Chain:
95 http://www.ibm.com/internet-of-things/iot-news/announcements/industry-4.0/, accessed October 2016.

ENISA Threat Landscape Report 2016 Final version | 1.0 | OPSEC | January 2017
29
Reconnaissance Weaponisation Delivery Exploitation Installation Command andControl
Actions onObjectives
Web application attacks
Step of Attack Workflow
Width of Purpose
Figure 7: Position of Web application attacks in kill-chain
Mitigation vector: The mitigation vector for this threat contains the following elements:
Formulation of security policies for the development and operation of applications.
Use of authentication and authorization mechanisms with a strength corresponding to the state-of-the-art.
Installation of Web application firewalling (WAF)96.
Performance of traffic filtering to all relevant channels (web, network, mail).
Performance of input verification.
Deployment of bandwidth management.
Performance of regular web application vulnerability scanning and intrusion detection.
96 http://www.darknet.org.uk/2015/11/modsecurity-open-source-web-application-firewall/, accessed November 2015.

ENISA Threat Landscape Report 2016 Final version | 1.0 | OPSEC | January 2017
30
Denial of Service In the reporting period denial of service (DoS) has delivered an impressive presence: it is the threat right on the intersection point of two main aims in cyber-space: monetizing malicious activities and cyber-crime-as-a-service. Together with botnets, DoS has been the main instrument that led to extortion, service and infrastructure tango-downs97 and finally data breaches. An attack with bandwidth of ca. 1 TB has come in September98 to materialize the expectations of last year’s predictions about the feasibility of this size of attacks. An alarming point regarding this attack was the efficiency in infection of huge network of simple IoT devices with the corresponding DDoS Trojan99 and orchestrating the attack100. A repeated massive attack of this kind has been executed shortly after, impacting big web sites worldwide101. Moreover, of great concern is the fact that an attack of this magnitude may become a serious threat for the entire internet102. Albeit these events of symbolic nature, during 2016 cyber-criminals have used DDoS as a main channel to launch attacks in a repeated manner. Through optimization of packet-per-bandwidth ratio, reflection and obfuscation, the effects of DDoS have been one of main security challenges. In all kinds of systems and sectors we have seen in 2016 increased number of DDoS attacks103.
In the reporting period we have assessed that:
Web browser impersonators have been the most frequent DDoS bots (45%)104. It is worth noting the
level of advancement in obfuscation capabilities of attacks to (web) applications: 36 % of application
attacks pass existing protection on standard security challenges such as cookies and JS footprint105.
This is a significant increase from ca. 6% that has been assessed last year104.
Single vector attacks continue to prevail with ca. 50% of all attacks. This was due to the increase of NTP
reflection106 that had created single vector attacks. Moreover, in the largest attack this year single
vector direct traffic (generic routing encapsulation (GRE) data packets, a communication protocol used
to establish a direct, point-to-point connection between network nodes), was rather the method of big
attack to Krebs’ web site99.
Network traffic created by large scale DDoS attacks107 may cause connectivity problems in internet
and/or lead to unavailability of important services, both of DDoS security providers102 and ISPs. Albeit
DDoS protection service providers are an effective solution, a cascade of security measures including
ISPs is considered as more effective. Through implementation of relevant controls at the level of ISPs, a
significant mitigation of DDoS can be achieved108 (see also mitigation measures below).
97 http://metropolitan.fi/entry/ddos-attack-halts-heating-in-finland-amidst-winter, accessed November 2016. 98 http://www.techradar.com/news/internet/here-s-how-security-cameras-drove-the-world-s-biggest-ddos-attack-ever-1329480, accessed October 2016. 99 http://news.softpedia.com/news/source-code-of-ddos-botnet-that-attacked-krebs-released-by-its-author-508864.shtml, accessed October 2016. 100 http://www.techradar.com/news/internet/here-s-how-security-cameras-drove-the-world-s-biggest-ddos-attack-ever-1329480, accessed October 2016. 101 https://www.rt.com/news/363642-websites-outage-ddos-attack/, accessed October 2016. 102 http://arstechnica.com/security/2016/09/why-the-silencing-of-krebsonsecurity-opens-a-troubling-chapter-for-the-net/, accessed October 2016. 103 https://content.akamai.com/PG6852-q2-2016-soti-security.html, accessed October 2016. 104 https://www.incapsula.com/ddos-report/ddos-report-q1-2016.html, accessed October 2016. 105 https://www.incapsula.com/blog/banishing-bad-bots.html, accessed October 2016. 106 https://www.incapsula.com/ddos/attack-glossary/ntp-amplification.html, accessed November 2016. 107 http://www.scmagazineuk.com/ovh-suffers-11tbps-ddos-attack/article/524826/, accessed October 2016. 108 http://security.stackexchange.com/questions/134767/how-can-isps-handle-ddos-attacks, accessed October 2016.

ENISA Threat Landscape Report 2016 Final version | 1.0 | OPSEC | January 2017
31
In 2016, the trend of increased number of multi-vector attacks continues104. Depending on the
reported sample and sectors covered, multi-vector attacks account for ca. 35-50% of all attacks. This is
an increase of ca. 10% in this year. This trend is an indication for more efficient botnets (called hybrid)
that are in the position to create attacks ranging from single to multiple vectors103, in particular for
large scale attacks (i.e. over 300Gbps).
At the beginning of 2016, we have seen DDoS attacks being used as an extortion attempts, that is, a
pressure medium for monetization109,110. This is a shift in DDoS motive, moving from activist
disruptions to direct monetization. As such, this trends follows contemporary shift of motives noticed
in 2016 with monetization ranking at first position216.
Continuing last year’s trend, in 2016 DDoS is a main item in underground markets. In this year’ prices
have gone from ca. 25-30$ an hour down to 5$, turning thus DDoS to a commodity that is affordable
for virtually everyone111.
A remarkable event in DDoS business is considered to be the publication of source code of Mirai DDoS
Trojan, the malware that has been used to attack the web site Krebs on Security. It has been assessed
that, while this movement might aim at hampering the work of law enforcement, it opens new
avenues for the creation of DDoS bots based on simple devices112,113.
Another remarkable trend in DDoS attacks is the continuous increase of Mpps (Mega packets per
second) within relatively low-bandwidth network layer attacks104. Albeit using low-bandwidth, such
attacks are performed at an extremely high speed, thus challenging the forwarding capabilities of
network devices (i.e. switches). This equals a denial of service for legitimate users of those devices.
Following the network layer attack trend, application attacks increased approx. 30%103. The most
popular attack vectors are Local File Inclusion (LFI) and SQL-injection (SQLi), as they account for ca.
88% of the entire traffic. From the registered application attacks, ca. one third goes through
anonymization service (Proxy/VPN) 103. Moreover, an increase in frequency of repeated attacks to
targets has been assessed104 (from ca. 25% of targets last year to ca. 30% in 1Q 20160). Similarly, the
duration of the attacks also increase from last year.
The geography of DDoS is interesting. Firstly it varies for network layer and application attacks: while
China (ca. 50%), US (ca. 17%) and Taiwan (ca. 5%) top network layer attacks, Brazil (ca. 25%), US (ca.
23%) and Germany (ca. 9%) are top three application attack sources. Respectively, victims of network
attacks are Gaming Industry (ca. 55%), Software & Technology (ca. 25%) and Financial Services (ca.
5%); application attacks target Retail (ca. 43%), Hotel & Travel (ranging from ca. 10-20%) and Financial
Services (ca. 12%)103. In general it has been assessed114 that 73% of all organisations have suffered a
DDoS attack, of which 85% have surfaced multiple attacks.
109 http://www.databreachtoday.com/cyber-extortion-fighting-ddos-attacks-a-8828, accessed October 2016. 110 https://hacked.com/report-ddos-attacks-are-becoming-extortion-attempts-rather-than-activist-disruptions/, accessed October 2016. 111 http://www.computerweekly.com/news/450296906/DDoS-attacks-openly-on-offer-for-5-an-hour-researchers-discover?utm_content=recipe7&utm_medium=EM&asrc=EM_ERU_57944770&utm_campaign=20160527_ERU%20Transmission%20for%2005/27/2016%20(UserUniverse:%202080202)[email protected]&utm_source=ERU&src=5514617, accessed October 2016. 112 http://news.softpedia.com/news/source-code-of-ddos-botnet-that-attacked-krebs-released-by-its-author-508864.shtml, accessed October 2016. 113 http://securityaffairs.co/wordpress/51868/malware/mirai-botnet-source-code.html, accessed October 2016.

ENISA Threat Landscape Report 2016 Final version | 1.0 | OPSEC | January 2017
32
In many cases, DDoS attacks are “smokescreens” for other types of attacks. A study114 has indicated
that virus infection (ca. 46%), malware activation (ca. 37%), network compromise (ca. 25%), loss of
customer trust (ca. 23%) and customer data theft (ca. 21%) are the top five actual objectives behind
the DDoS attack.
Given the level of attention DDoS attacks have reached in autumn 2016, both the US government115
and the EU116 have announced/channelled activities regarding minimum security levels for IoT devices
/ devices that may be connected to the internet. Given the impact of these DDoS attacks, it is expected
that the issue will attract the attention of more governmental / public actors.
Observed current trend for this threat: increasing
Related threats: Botnets, Malware, Web Application Attacks, Web Based Attacks, Phishing, Spam, Information Leakage.
Authoritative Resources 2016: “State of the Internet / Security: Q2 2016 Report on DDoS & Web App Attack Trends”, Akamai103, “Global DDoS Threat Landscape Q1 2016”, IMPERVA INCAPSULA104, “Arbor Networks 11th Annual Worldwide Infrastructure Security Report”, Arbor Netorks119, “Worldwide DDoS Attacks & Protection Report”, Neustar114.
Kill Chain:
Reconnaissance Weaponisation Delivery Exploitation Installation Command andControl
Actions onObjectives
Denial of Service
Step of Attack Workflow
Width of Purpose
Figure 8: Position of Denial of Service in the kill-chain
Mitigation vector: The mitigation vector for this threat contains the following elements (e.g. see also117):
Creation of a DoS/DDoS security policy including a reaction plan to detected incidents.
Use of ISPs who implement DDoS protection measures118.
Consideration of using a managed solution for DDoS protection.
114 https://hello.neustar.biz/2016_2h_ddos_report_security_lp.html, accessed October 2016. 115 http://uk.reuters.com/article/us-usa-cyber-devices-idUKKCN12P047, accessed October 2016. 116 https://www.euractiv.com/section/innovation-industry/news/commission-plans-cybersecurity-rules-for-internet-connected-machines/, accessed October 2016. 117 https://securityintelligence.com/hacktivism-fearmongering-or-real-threat/, accessed November 2016. 118 http://security.stackexchange.com/questions/134767/how-can-isps-handle-ddos-attacks, accessed November 2016.

ENISA Threat Landscape Report 2016 Final version | 1.0 | OPSEC | January 2017
33
Selection of a technical DoS/DDoS protection approach (e.g. Firewall based, Access Control Lists (ACLs), Load-balancer, IPS/WAF, Intelligent DDoS mitigation systems (IDMS) at network perimeter, Cloud-based DDoS mitigation service216, etc.)119.
Assessment and documentation of roles of all third parties involved in the implemented protection DoS/DDoS approach. Regular test of reaction time and efficiency of involved roles.
Establishment of interfaces of implemented solution with company operations to collect and process information from DoS/DDoS protection and incidents.
Regular reassessment needs and checking of effectiveness of implemented controls, as well as new developments.
Development of preparedness for identifying attacks that happen under the cover of DDoS. An intrusion prevention system (IPS) is the basis for the identification of other intrusion attempts.
119 https://www.arbornetworks.com/images/documents/WISR2016_EN_Web.pdf, accessed November 2015.

ENISA Threat Landscape Report 2016 Final version | 1.0 | OPSEC | January 2017
34
Botnets Being the work-horse of adversaries, botnets continued being a major tool for manifold attacks in 2016. Their role is enforced and their use increased, yet with an even higher maturity, complexity - by means of obfuscation techniques used - and efficiency. A notable fact about botnets is their “resilience”: in 2016, Necrus a botnet that has been taken down in October 2015 has been revived by demonstrating impressive activity in high-volume spam campaigns120. Unfortunately, this fact comes to turn true predictions about the effectiveness of botnet take-downs121. Nonetheless, the high level of cooperation that led to these successful takedowns is certainly the right direction on order to surface cyber-crime122, while it can also lead to durable extinction of botnets from the threat landscape123. Moreover, such cooperation will lead to activities that may cause to attributions regarding other cyber-threats. Seen in relation to relevant US regulation act124, this might be a successful/viable mitigation option. All in all, the trend of the year 2016 in the area of botnets was the rise of IoT botnets125, in particular for DDoS attacks. Just as it was the case with mobile platforms some years ago, it seems that IoT will be the next platform to which cyber threats will be migrated to. As it is the case for most of cyber-threats, botnet activity in 2016 had monetization as main driver (see assessment below).
In the reporting period we have assessed that:
Main botnet types observed that also have a lion’s share in C&C activities are botnets for spam and
malware distribution126, botnets for DDoS campaigns127, ad-fraud botnets128,129, and, though in the
minority, some dedicated, allegedly high capability botnets130. It is interesting that botnets are
flexible/multiuse tools hence allowing for interchangeable roles, i.e. malware bots may create DDoS
bots, other spam bots or other dedicated bots131, and so on. And some support multitenant
functions132 that allow them to be used within cyber-crime-as-a-service platforms.
It is impressive to see the techniques used by botnets to fool security controls such as spam filtering.
High-speed spam volumes have achieved passing spam filters, achieving thus a significant increase in
spams passing updated filters133. As another detection relevant item, advances have been observed in
C&C communication: in order to evade detection, zombies communicated via twitter or internet Relay
120 http://securityaffairs.co/wordpress/51759/cyber-crime/necurs-botnet-resurrection.html, accessed October 2016. 121 http://www.scmagazineuk.com/botnet-takedowns-are-they-worth-it/article/428021/, accessed October 2016. 122 https://www.botconf.eu/wp-content/uploads/2015/12/OK-K01-Margarita-Louca-Botnet-takedowns-cooperation.pdf, accessed October 2016. 123 http://arstechnica.com/security/2016/04/researchers-help-shut-down-spam-botnet-that-enslaved-4000-linux-machines/, accessed October 2016. 124 https://cdt.org/blog/all-bots-must-die-how-a-new-senate-bill-to-combat-botnets-could-put-privacy-at-risk/, accessed October 2016. 125 https://threatpost.com/iot-botnets-are-the-new-normal-of-ddos-attacks/121093/, accessed October 2016. 126 https://www.fireeye.com/blog/threat-research/2016/01/dridex_botnet_resume.html, accessed October 2016. 127 http://www.darkreading.com/endpoint/another-iot-dominated-botnet-rises-with-almost-1m-infected-devices/d/d-id/1326776, accessed October 2016. 128 http://adage.com/article/digital/ana-report-7-2-billion-lost-ad-fraud-2015/302201/?utm_campaign=SocialFlow&utm_source=Twitter&utm_medium=Social, accessed October 2016. 129 https://labs.bitdefender.com/2016/05/inside-the-million-machine-clickfraud-botnet/, accessed October 2016. 130https://www.forcepoint.com/sites/default/files/resources/files/report_jaku_analysis_of_botnet_campaign_en_0.pdf, accessed October 2016. 131 https://www.arbornetworks.com/blog/asert/lizard-brain-lizardstresser/, accessed October 2016. 132 https://www.incapsula.com/blog/botnet-landscape-social-graph-analysis.html, accessed October 2016. 133 http://blog.talosintel.com/2016/09/the-rising-tides-of-spam.html, accessed October 2016.

ENISA Threat Landscape Report 2016 Final version | 1.0 | OPSEC | January 2017
35
Chat (IRC) as channels134,135. Finally, almost 18% of application layer DDoS bots were in the position to
overcome cookie and Java Script challenges, when mimicking legitimate user browsers to attack an
application. This is a sharp increase from last year’s 7%104.
We have seen botnets that were taken down are again re-established by their operators, or they are
taken over by other criminals. This is a known issue that is being controversially discussed in the cyber-
defence community136,164. So we have seen again Kelihos being active in the wild, despite its 2
takedown campaigns that have been achieved through international cooperation137,138. Similarly, in the
reporting period the operation of Ramnit botnet has been re-established after its takedown on
February 2015139,140. The same is holds true for the Nectus botnet141. It seems that the code base of
recurring botnet instances has gone through various improvements, as stated below, at the example of
a DDoS malware disclosure, it looks as if botnet source code be shared among various cooperating
adversaries.
It is remarkable that botnets are also used by high capability threat agents to target particular profiles
of victims. In the reporting period the botnet Jaku has been detected and analysed by researchers130.
These target group specific botnets are a significant threat to targeted organisations. In the Jarku case,
for example, these were international organisations, NGOs, Engineering Companies, Academics,
Scientists and Government Employees. Given ca. 19.000 victims and the nature of the organisations
hit, it becomes apparent how big the impact of such botnets might be.
In 2016, the botnet defence community has observed some time windows of inactivity of the largest
botnets worldwide. This has triggered quite some discussions about the reasons of such
phenomena142, while the question of how such a large infrastructure can be brought down has not
been answered143. There are speculations of whether this was due to some arrests or if the operators
have just updated their infrastructure to evade detection by law enforcement. Later, some very
comprehensive analysis of code has shown that Dridex implements API obfuscation that hides
interaction and concludes that a new obfuscation method with encryption has been installed144.
Besides the use case of direct monetization of botnet infrastructures, they are also increasingly offered
by means of DDoS-as-a-Service in various underground for a. In the reporting period the prices for
botnet rentals have dropped significantly. One hour DDoS that costed last year ca. 25-30$ is now
134 http://www.welivesecurity.com/2016/08/24/first-twitter-controlled-android-botnet-discovered/, accessed October 2016. 135 https://www.wordfence.com/blog/2016/08/hacking-wordpress-botnet/, accessed October 2016. 136 http://www.darkreading.com/endpoint/lessons-learned-from-the-ramnit-botnet-takedown/a/d-id/1320861, accessed October 2016. 137 https://en.wikipedia.org/wiki/Kelihos_botnet, accessed October 2016. 138 https://www.malwaretech.com/2016/08/significant-increase-in-kelihos-botnet-activity.html, accessed October 2016. 139 https://nakedsecurity.sophos.com/2015/02/27/europol-takedown-of-ramnit-botnet-frees-3-2-million-pcs-from-cybercriminals-grasp/, accessed October 2016. 140 http://www.securityweek.com/ramnit-banking-trojan-resumes-activity, accessed October 2016. 141 http://securityaffairs.co/wordpress/51759/cyber-crime/necurs-botnet-resurrection.html, accessed October 2016. 142 http://www.securityweek.com/dridex-locky-attacks-inactive-after-necurs-botnet-disruption, accessed October 2016. 143 https://motherboard.vice.com/read/one-of-the-worlds-largest-botnets-has-vanished, accessed October 2016. 144 https://securityintelligence.com/protected-api-calls-and-string-constants-looting-dridexs-candy-box/, accessed October 2016.
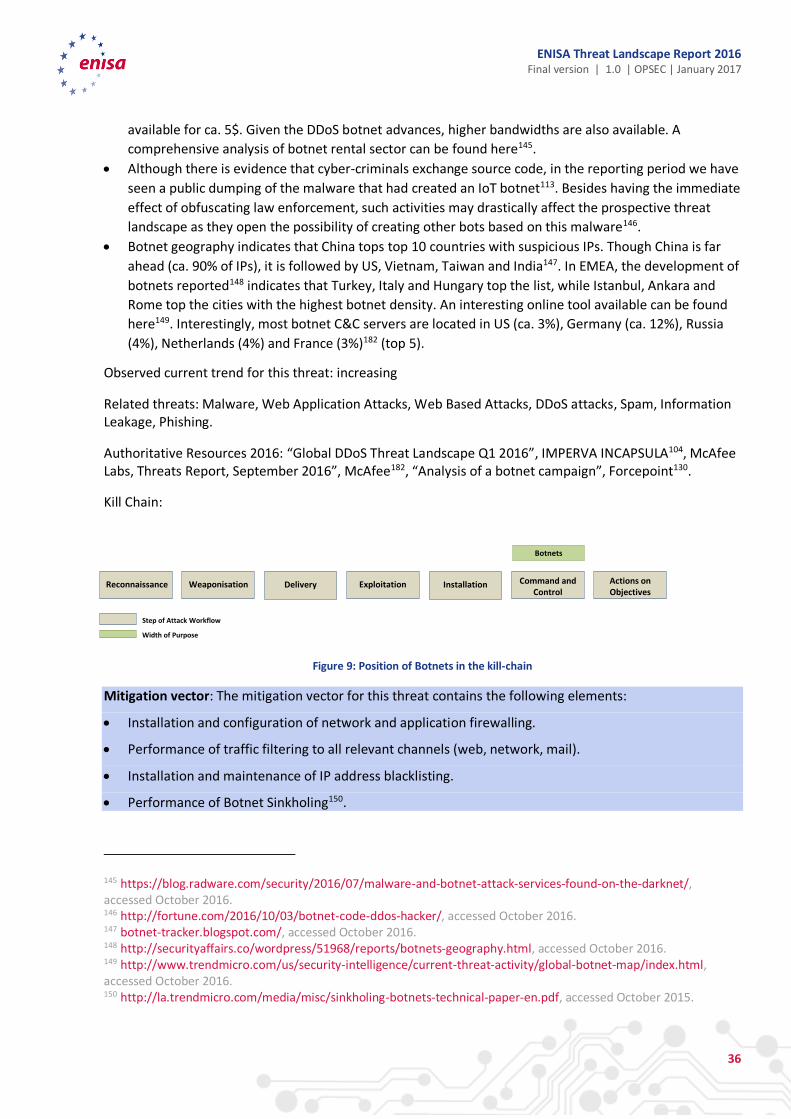
ENISA Threat Landscape Report 2016 Final version | 1.0 | OPSEC | January 2017
36
available for ca. 5$. Given the DDoS botnet advances, higher bandwidths are also available. A
comprehensive analysis of botnet rental sector can be found here145.
Although there is evidence that cyber-criminals exchange source code, in the reporting period we have
seen a public dumping of the malware that had created an IoT botnet113. Besides having the immediate
effect of obfuscating law enforcement, such activities may drastically affect the prospective threat
landscape as they open the possibility of creating other bots based on this malware146.
Botnet geography indicates that China tops top 10 countries with suspicious IPs. Though China is far
ahead (ca. 90% of IPs), it is followed by US, Vietnam, Taiwan and India147. In EMEA, the development of
botnets reported148 indicates that Turkey, Italy and Hungary top the list, while Istanbul, Ankara and
Rome top the cities with the highest botnet density. An interesting online tool available can be found
here149. Interestingly, most botnet C&C servers are located in US (ca. 3%), Germany (ca. 12%), Russia
(4%), Netherlands (4%) and France (3%)182 (top 5).
Observed current trend for this threat: increasing
Related threats: Malware, Web Application Attacks, Web Based Attacks, DDoS attacks, Spam, Information Leakage, Phishing.
Authoritative Resources 2016: “Global DDoS Threat Landscape Q1 2016”, IMPERVA INCAPSULA104, McAfee Labs, Threats Report, September 2016”, McAfee182, “Analysis of a botnet campaign”, Forcepoint130.
Kill Chain:
Reconnaissance Weaponisation Delivery Exploitation Installation Command andControl
Actions onObjectives
Botnets
Step of Attack Workflow
Width of Purpose
Figure 9: Position of Botnets in the kill-chain
Mitigation vector: The mitigation vector for this threat contains the following elements:
Installation and configuration of network and application firewalling.
Performance of traffic filtering to all relevant channels (web, network, mail).
Installation and maintenance of IP address blacklisting.
Performance of Botnet Sinkholing150.
145 https://blog.radware.com/security/2016/07/malware-and-botnet-attack-services-found-on-the-darknet/, accessed October 2016. 146 http://fortune.com/2016/10/03/botnet-code-ddos-hacker/, accessed October 2016. 147 botnet-tracker.blogspot.com/, accessed October 2016. 148 http://securityaffairs.co/wordpress/51968/reports/botnets-geography.html, accessed October 2016. 149 http://www.trendmicro.com/us/security-intelligence/current-threat-activity/global-botnet-map/index.html, accessed October 2016. 150 http://la.trendmicro.com/media/misc/sinkholing-botnets-technical-paper-en.pdf, accessed October 2015.

ENISA Threat Landscape Report 2016 Final version | 1.0 | OPSEC | January 2017
37
Performance of updates in a regular basis in orchestration with vulnerability management.
Orchestration of controls both at host and network level as described in this resource151.
A standard for invalid traffic detection methods has been developed152. Accredited organisations may support in detection and filtering of fraudulent traffic153.
151 https://www.shadowserver.org/wiki/pmwiki.php/Information/BotnetDetection, accessed November 2015. 152 http://mediaratingcouncil.org/GI063015_IVT%20Addendum%20Draft%205.0%20(Public%20Comment).pdf, accessed November 2016. 153 https://www.whiteops.com/press-releases/white-ops-mrc-accreditation, accessed November 2016.

ENISA Threat Landscape Report 2016 Final version | 1.0 | OPSEC | January 2017
38
Phishing Phishing in a cyber-threat that is present in many attack vectors. In the reporting period, the use of phishing has been intensified. Yet not necessarily increased by numbers, this trend has been manifested by means of a better quality and better methods to target victims181. As regards human targets, phishing has continued abusing information found in social media154. In the reporting period phishing had a significant involvement within ransomware campaign. These had increased reportedly by ca. 800% in first quarter 2016 compared to last quarter of 2015155. This rate may be explained with the increase of unique phishing sites by 61%, reported for the second quarter of 2016 by APWG156. Moreover, it is noticeable that phishing has successfully reached the executive level: phishing based CEO fraud based on has caused significant losses to companies157. Such attacks are performed either by taking over executive’s mail accounts through phishing, or by directly phishing employees with faked mails from the CEO158.
In the reporting period we have assessed that:
One of the main concerns of phishers is to try to bypass security measures at victim’s destination. This
is mainly attempted by trying to place their campaigns on legitimate, highly reputable domains. In
those cases the phishing content or the malware itself is uploaded on hacked legitimate web site159
(technique also known as water-holing). By using legitimate pages, attackers avoid getting their
phishing pages blacklisted. While these techniques are used for more targeted campaigns, phishers
use also bulk mailings of low-sophistication phishing messages directed to massive user segments.
Another trend observed in 2016 is the combination of phishing with intelligence that has been gained
through social media. Besides spreading phishing messages to a certain target group, attackers have
collected information from social media regarding behaviours, for example about their jobs, habits and
organisational structures224. It is expected that attacks on multiple levels of victim’s life are going to
increase in the future, in particular when breached information from IoT is being taken into account. In
addition, the security community should concentrate to potentially important incidents which,
although they do not attract media attention, might be detrimental for users160.
Measured user behaviour in coping with phishing messages is indicative for the success rates of this
threat. 30% of the messages have been opened by the recipients on the average. 12% of the recipients
have clicked the attached malware/link and have thus caused an infection in their system216. It is
interesting that both numbers seem to be bigger than in previous years, a fact that is quite worrying
given that one would expect that users should have been more vigilant. The explanation may be the
higher efficiency achieved by phishers given advancements in fooling people.
It has been reported that phishing is declining since 2013224. Nonetheless, targeted phishing (spear
phishing) campaigns have increased by 55% in 2015. Together with infection rates attributed to
154 http://www.itproportal.com/news/social-media-still-an-important-tool-for-phishing/, accessed October 2016. 155 http://www.infosecurity-magazine.com/news/ransomware-sends-phishing-volumes/, accessed October 2016. 156 https://docs.apwg.org/reports/apwg_trends_report_q2_2016.pdf, accessed October 2016. 157 https://krebsonsecurity.com/2016/04/fbi-2-3-billion-lost-to-ceo-email-scams/, accessed October 2016. 158 https://lifars.com/2016/07/email-scammers-stealing-billions-from-american-companies/?utm_source=Subs&utm_campaign=851e26b20d-CyberNews_July_28&utm_medium=email&utm_term=0_a931d19921-851e26b20d-342302245, accessed October 2016. 159 https://kasperskycontenthub.com/securelist/files/2016/08/Spam-report_Q2-2016_final_ENG.pdf, accessed October 2016. 160 http://uk.reuters.com/article/us-johnson-johnson-cyber-insulin-pumps-e-idUKKCN12411L, accessed November 2016.

ENISA Threat Landscape Report 2016 Final version | 1.0 | OPSEC | January 2017
39
phishing messages, phishing is rather a concern of increasing significance. It demonstrates that when
intelligence about the victim group profile is taken into account, much higher impact can be achieved
by notably less attack volumes181. Hence, while phishing has played an important role in some other
threats, it has declined in general. As reasons for this decline one can recognise the efficiency of anti-
phishing measures and the increase of phishing quality (i.e. more targeted phishing attacks).
Some interesting figures regarding phishing “demographics” are: the number of unique brands
attacked are around 400, for which ca. 350-400 URLs per brand have been used156. Microsoft (ca. 8%),
Facebook (ca. 8%) and Yahoo (ca. 7%) are the top three organisations mentioned in phishing
messages159. Expectedly, financial organisations have the lions share in phishing topics (ca. 42%,
increased by 2%). Finally, spear phishing has targeted increasingly small companies (1-250 employees),
while share of large and medium sized companies has been reduced224,161. It is believed that this trend
will continue in the near future. Surveys show that phishing is at the third position of most damaging
threats162.
Interesting numbers regarding the geography of phishing include the top 5 countries hosting phishing
web site: US, Belize, Hong Kong, Belgium, and UK163. The geography of phishing victims include China
(ca. 20%), Brazil (ca. 18%), Algeria (ca. 14%), UK (ca. 13%) and Australia (ca. 12,5%). It is worth
mentioning, that the Olympic Games in Brazil have been one of the topics of phishing messages that
has led to having Brazil at the second rank. Top five attachment types of spear phishing attacks have
been: .doc (ca. 40%), .exe (ca. 17%), .src (ca. 14%), .xls (ca. 6%) and .bin (ca. 5%)224.
We believe that the significant ransomware activity in 2016 will affect the phishing statistics, as
phishing was a tool also for infection with ransomware. Moreover, the irregularities observed in the
operation of large spam botnets in June/July164 this year will also affect the phishing landscape. This is
an indicator on how dependent are cyber-threat to each other.
Observed current trend for this threat: stable, slightly decreasing
Related threats: Malware, Spam, Botnets, Information Leakage, Data Breaches.
Authoritative Resources 2016: “SPAM AND PHISHING IN Q2 2016”, Kaspersky159, “Phishing Activity Trends Report 2nd Quarter 2016”, APWG156, “Internet Security Threat Report Internet Report VOLUME 21, APRIL 2016”, Symantec224, “Forcepoint 2016 Global Threat Report”, Forcepoint163.
Kill Chain:
161 https://www.symantec.com/content/dam/symantec/docs/infographics/istr-attackers-strike-large-business-en.pdf, accessed October 2016. 162 http://blogs.splunk.com/2016/06/29/detecting-and-responding-to-the-accidental-breach/, accessed October 2016. 163 https://www.forcepoint.com/resources/reports/forcepoint-2016-global-threat-report, accessed October 2016. 164 https://www.malwaretech.com/2016/06/whats-happening-with-necurs-dridex-and.html, accessed October 2016.

ENISA Threat Landscape Report 2016 Final version | 1.0 | OPSEC | January 2017
40
Reconnaissance Weaponisation Delivery Exploitation Installation Command andControl
Actions onObjectives
Phishing
Step of Attack Workflow
Width of Purpose
Figure 10: Position of phishing in the kill-chain
Mitigation vector: The mitigation vector for this threat contains the following elements:
Implementation of awareness training targeted to phishing.
Performance of secure gateway e-mail-filtering.
Performance of sender identity and DNS verification.
Detection and deletion of malicious attachments.
Scan received and clicked URLs upon malicious characteristics.
Implementation of fraud and anomaly detection at network level both inbound and outbound165,166.
Implementation of multiple controls (including two factor authentication) for critical financial transactions.
165 https://www.ncbi.nlm.nih.gov/pmc/articles/PMC4701335/, accessed November 2016. 166 https://eprint.iacr.org/2016/040.pdf, accessed November 2016.

ENISA Threat Landscape Report 2016 Final version | 1.0 | OPSEC | January 2017
41
Spam Spam is the main means for the transport of malware and malicious URLs. This payload is “wrapped” accordingly in the form of spam messages and phishing messages167. Spam is mainly distributed by large spam botnets, that is, devices that are taken over and form large network of zombies adhering to C&C servers. Following the trends of botnets (see also section 3.6), these networks consist of user devices of all kinds and servers including virtual ones. Spam reduces continuously since 2013, going down from ca. 85% to ca. 55% of the entire mail volume159. In June 2015, spam rates felt under 50% for the first time since 2003224! Though continuously reducing, spam flourishes as attack vector; and this is not a contradiction: as phishing messages sent as spam are the most often initial steps of successful attacks. In other words, although reduced in numbers, spam has gained in quality by combining information to fool victims most efficiently, i.e. social phishing, vulnerability scanning168, better obfuscation of messages to evade spam filtering133, etc. Albeit spam reduction, spam messages sent per e-mail still remain to be the most frequently used channel by cyber-criminals to reach their victims224,176.
In the reporting period we have assessed that:
As every year, spam campaigns piggyback with international events drawing the attention of many
victims: in this year Euro 2016 Football Tournament, Olympic Games in Brazil and US elections. In the
former, spammers have lured victims with face lottery prizes allowing to watch the game live. In case
of the US elections, spammers offered potential victims tips and tricks to get rich just as Trump did159.
Besides important international events, subjects covered by spams this year were: invoices of fake
orders/transactions, bills from utility provider, notifications from post office about shipment delivery,
message concerning tax refund, as well as fake credit card rewards182. It is worth mentioning, that as
regards spam payload, ransomware Trojans hold the first position of ca. 20% of the entire spam159. Ca.
70-80% of spam messages are below 2KB, with the rest being between 2 and 50 KBs159.
In 2016, the “snowshoe” spam method has been increasingly used224. In such a spam campaign,
massive amounts of spam are sent out to a wide IP range. This reduces the efficiency of spam filters
and identification of IP reputation. It is worth mentioning that such techniques “match” developments
assessed in botnets and denial of service attacks where large packets and requests per second (pps or
rps) have been encountered169. In this way, security controls installed in the perimeter can be made
void. Another obfuscation method that has been observed in 2015 and continues in 2016 is the use of
alphanumeric symbols UTF-8 characters to encode malicious URLs and thus evade detection159.
Spam statistics indicate that no particular company type/size has been targeted more than other. All
have a spam rate of about 50-52% spam in email messages. In 2016, a reduction in spam URLs has
been observed. Kelihos botnet tops spam botnet activity, followed by Gamut and Necrus. Top five
countries that are sources of spam are US (ca. 11 %), Vietnam (ca. 10%), India (ca. 10%), China (ca. 7%)
and Mexico (ca. 4,5%). Actual spam statistics can be found from Spamhouse project’s web site170,
including top 10 countries, top 10 spammers and top 10 spam IPs.
Observed current trend for this threat: reducing
167 It is worth mentioning that it is not always possible to discriminate among spam and phishing, for example wide phishing attacks abusing top brands. 168 https://security.elarlang.eu/cve-2016-4803-dotcms-email-header-injection-vulnerability-full-disclosure.html, accessed October 2016. 169 https://blog.cloudflare.com/a-winter-of-400gbps-weekend-ddos-attacks/, accessed October 2016. 170 https://www.spamhaus.org/statistics/countries/, accessed October 2016.

ENISA Threat Landscape Report 2016 Final version | 1.0 | OPSEC | January 2017
42
Related threats: Malware, Spam, Botnets, Information Leakage, Data Breaches.
Authoritative Resources 2016: “SPAM AND PHISHING IN Q2 2016”, Kaspersky159, “Internet Security Threat Report Internet Report VOLUME 21, APRIL 2016”, Symantec224
Kill Chain:
Reconnaissance Weaponisation Delivery Exploitation Installation Command andControl
Actions onObjectives
Spam
Step of Attack Workflow
Width of Purpose
Figure 11: Position of Spam in the kill-chain
Mitigation vector: The mitigation vector for this threat contains the same elements as phishing, with some additional controls:
Use of a security e-mail gateway with regular (possibly automated) maintenance of filters (anti-spam, anti-malware, policy-based filtering).
Block of executables (and macros) found in mail attachments.
Disable automatic execution of code, macros, rendering of graphics and preloading mailed links at the mail clients and update them frequently.
Educate the users, e.g. to ask themselves, e.g. if they know the sender, if they feel comfortable with the attachment content and type, if they recognize the subject matter of the mail, etc.
Just as in phishing, protection over multiple layers should be implemented to overcome weaknesses of scanners/filtering.

ENISA Threat Landscape Report 2016 Final version | 1.0 | OPSEC | January 2017
43
Ransomware Of all the cyber-threats in 2016, ransomware has delivered the most impressive growth in all categories: number of campaigns, number of victims, average ransom paid, advanced of infection methods used, “depth” of damage and turnover for cyber-criminals. In 2016, ransomware was the main element for the manifestation of monetization as the main motive of cyber-criminals. Among others, this has been achieved by better targeting victim groups such as professional users and companies with the aim of maximizing profits. In doing so, ransomware authors / operators have been using techniques that have been observed in the past within high capability threat agents, such as spear phishing, encryption, obfuscation, etc. Given the revenues from this malicious activities, it can be expected that ransomware operators will further advance their tactics and maximize revenues. In the reporting year the turnover from extortion / ransom is expected to reach 1 billion $171, thus approximately doubled within one year172. As within many cyber-crime activities, cryptocurrencies have facilitate this development by providing an almost anonymous means for the monetization of ransom173. It is notable that in Europe a cooperation between law enforcement and private sector has been created to inform the public about ransomware174. In this site, detailed information about ransomware can be found, together with useful protection advice. The impression ransomware left to the cyber-security and user-community in 2016 is reflected by the number of dedicated reports by many of the major CTI vendors (see list of authoritative resources).
In the reporting period we have assessed that:
In comparison to previous years, ransomware has advanced by means of spread and infection
techniques. It now uses the full range of malware spread infrastructures such as spam-botnets, exploit
kits, drive-by downloads and infected USBs175. Infection rates have been increased by using specialized
campaigns for different victim profiles. Company infrastructures have been much stronger targeted, as
their IT-assets obtain much higher ransoms than those of private users. Techniques used resemble
those used by high capability adversaries, such as spear-phishing and APs176.
There have been many significant improvements in ransomware variety and functionality. Firstly, the
number of ransomware families increased over 172%, reaching in 2016 75 versus 29 of last year175.
Main implemented functional improvements relate to a more comprehensive and “deeper” damage of
files including backups175,176; more targeted damage of specific types of files (i.e. database files, tax
related files, web pages); vulnerability based exploitation of targets to increase infection rates;
methods to increase ransom in case users delay payment deadline; change of communication methods
to victims to better negotiate ransom amount (e.g. via emails instead of fixed banners); more
171 https://www.echoworx.com/protect-sensitive-information/ransomware-2016-billion-dollar-business-nightmare/, accessed October 2016. 172 http://www.washingtontimes.com/news/2015/nov/2/cybercriminals-rake-in-325m-cryptowall-ransomware/, accessed October 2016. 173 http://www.theatlantic.com/business/archive/2016/06/ransomware-new-economics-cybercrime/485888/, accessed October 2016. 174 https://www.nomoreransom.org, accessed October 2016. 175 http://www.trendmicro.com/cloud-content/us/pdfs/security-intelligence/reports/rpt-the-reign-of-ransomware.pdf, accessed October 2018. 176http://www.symantec.com/content/en/us/enterprise/media/security_response/whitepapers/ISTR2016_Ransomware_and_Businesses.pdf, accessed October 2016.

ENISA Threat Landscape Report 2016 Final version | 1.0 | OPSEC | January 2017
44
stealthy/creepy encryption of infected computers; more advanced management of encryption keys;
evaluation of run-time environment details to evade detection177.
Regarding affected victim platform families, in 2016 there is a clear trend towards professional IT-
environments178. Through selection of operating system and vulnerability scanning (e.g. Shellshock),
adversaries have opted for the identification enterprise servers (i.e. Linux and other Linux derivatives).
Once hacked, these systems have been used to perform reconnaissance in the entire company
network with the objective to identify valuable company files, backup systems and routines and
desktop computers. Besides servers, the “traditional” focus on consumer systems continued. Mobile
Android platforms are also on the list of ransomware72. Going beyond demo takeovers179, it is expected
that IoT devices will also be targeted in the future176 by specific ransomware variants180,181.
Ransomware has targeted organisations and consumers at rates of ca. 40% and 60 % respectively. In
the reporting period, the ransom requested on the average is ca. 600-700$, an increase of ca. 100% in
comparison to the previous year. In the US, the total loss reported exceeds 24$ million by the middle
of 2016176, while it has been reported that a single ransomware operator was in the position to achieve
a turnover of 121 million $ in half a year182. More recent estimations about ca. 210 million US$ for the
first three months of 2016 have been found183. For the entire year 2016, loss of one billion US $ has
been estimated184.
Cryptocurrencies have significantly facilitated the required anonymity to cash the ransom. By using
Bitcoins as the main payment methods, cyber-criminals capitalize on the preparedness of victims to
increasingly use this method. Being almost anonymous, Bitcoins have come to replace gift vouchers
that are more difficult to monetize176. In the future, state sponsored actions against cryptocurrencies
may be intensified/initiated185.
A trend in ransomware that may bear significant risks is the emergence of ransomware-as-a-service
offerings (RaaS)271. Such offerings attract potential users, especially by offering prices below 40$ for a
licence of the malware186. Performed operations of law enforcement to shut down such services are
indicative about the risk level caused by such offerings187.
Regarding victim geography, top five countries are US (ca. 28%), other (ca. 20%), Canada (ca. 16%)
Australia (ca. 11%) and India (ca. 9%). Looking at sectors of victims, top five are: consumers (ca. 57%),
Services (ca. 38%), Manufacturing (ca. 17%), Public Administration (ca. 10%) and financial sector /
177 https://threatpost.com/necurs-botnet-is-back-updated-with-smarter-locky-variant/118883/, accessed October 2016. 178 https://www.fireeye.com/current-threats/what-is-cyber-security/ransomware.html, accessed October 2016. 179 http://www.computerworld.com/article/3105001/security/hackers-demonstrated-first-ransomware-for-iot-thermostats-at-def-con.html, accessed October 2016. 180 https://iotsecurityfoundation.org/the-iot-ransomware-threat-is-more-serious-than-you-think/, accessed October 2016. 181 https://www.europol.europa.eu/content/internet-organised-crime-threat-assessment-iocta-2016, accessed October 2015. 182 http://www.mcafee.com/us/resources/reports/rp-quarterly-threats-sep-2016.pdf, accessed October 2016. 183 http://money.cnn.com/2016/04/15/technology/ransomware-cyber-security/, accessed October 2016.F210 184 https://blog.360totalsecurity.com/en/attack-loss-ransomware-2016/, accessed December 2016. 185 http://www.businessinsider.com/preventing-ransomware-attacks-by-targeting-bitcoin-and-cryptocurrency-2016-9, accessed 2016. 186 http://securityaffairs.co/wordpress/49362/breaking-news/stampado-ransomware.html, accessed October 2016. 187 http://securityaffairs.co/wordpress/52061/malware/encryptor-raas-fall.html, accessed October 2016.

ENISA Threat Landscape Report 2016 Final version | 1.0 | OPSEC | January 2017
45
Insurance (ca. 10%). Noticeably a resource 176 mentions that although healthcare had made the
headlines, it does not seem to play a significant role in the statistics of ransomware victims.
Observed current trend for this threat: increasing
Related threats: Malware, Web Application Attacks, Web Based Attacks, DDoS attacks, Spam, Information Leakage, Phishing.
Authoritative Resources 2016: “The Reign of Ransomware”, Trend Micro175, “Ransomware and Businesses 2016”, Symantec176, “KSN REPORT: RANSOMWARE IN 2014-2016 June 2016”, Kaspersky72, “Inside an Organized Russian Ransomware Campaign”, Flashpoint271.
Kill Chain:
Reconnaissance Weaponisation Delivery Exploitation Installation Command andControl
Actions onObjectives
Ransomware
Step of Attack Workflow
Width of Purpose
Figure 12: Position of Ransomware in the kill-chain
Mitigation vector: The mitigation vector for this threat contains the following elements, again not overlap free with measures mentioned in other cyber-threats and in particular in malware:
Exact definition and implementation of minimum user data access rights in order to minimize the impact of attacks (i.e. less rights, less data encrypted).
Availability of reliable back-up off-line schemes that are tested and are in the position to quickly recover user data.
Implementation of robust vulnerability and patch management.
Implementation of content filtering to filter out unwanted attachments, mails with malicious content, spam and unwanted network traffic.
Installation of end-point protection by means of anti-virus programs but also blocking execution of files (e.g. block execution in Temp folder).
Use of policies for the control external devices and port-accessibility for all kinds of devices.
Use of whitelisting to prevent unknown executables from being executed at the end-points.
Invest in user awareness esp. with regard to secure browsing behaviour188.
Follow recent ransomware developments and prevention proposals in this189 resource.
188 http://theconversation.com/its-easier-to-defend-against-ransomware-than-you-might-think-57258, accessed November 2016. 189 https://www.nomoreransom.org/prevention-advice.html, accessed November 2016.

ENISA Threat Landscape Report 2016 Final version | 1.0 | OPSEC | January 2017
46
Insider threat Insider threat continues playing an important role in the threat landscape. As the assessment and analysis of incidents matures, we are in the position to better understand the role of this threat. This, among others, lies in the fact that protection systems are being used that allow for an identification of insider actions and different causes of insider misuse. Moreover, studies have been performed based on a wide basis of participants and experts. They have allowed for the illumination of all possible nuances of insider threat, by including experiences from various areas of expertise and sectors190,191. So it is known, for example, that the inadvertently caused part of insider threat coves a significant part of all registered incidents (i.e. between 50% and 60%)163,190,191. Negligence is another cause for incidents caused by insiders that may lead to breaches of credentials through external attacks192. Though not intentionally caused, such attacks – also referred to as accidental insider incidents163 - succeed because of lax security policy implementation. Breaches caused by such incidents are difficult to detect. Over 70% of surveyed191 individuals expressed their concern about protection and identification inadvertent insider data breaches.
In the reporting period we have assessed that:
The activities of insiders have been classified in some detail216. In particular, the top five identified
insider incidents / actions are: privilege abuse (ca. 60%), data mishandling (ca. 13%), use of non-
approved hardware (ca. 10%), use of inappropriate software (ca. 10%)and abuse of privilege
possession (ca. 10%). Interestingly, financial benefit is still top motive (declining) in 50% of confirmed
insider cases, while espionage seems to pick up as second one216,192 with ca. 30% in 2015. In general,
monetization, fraud, sabotage, intellectual property (IP) theft and espionage seem to be the concerns
of individuals participated in a mass survey192.
Identification of insider breaches is top concern of defenders. And this concern is justified: insider
breaches belong to the most difficult to detect and protect from. The timeline of discovery of insider
breaches shows that the vast majority of incidents (ca. 70%) are detected after months and years216.
This rate is more or less similar in the last 3 years, indicating that the management of this threat has
not demonstrated any progress in recent years. This is an interesting yet disappointing fact, as this
threat can be significantly reduced with a mix of training and technical controls, whereas training
seems to be the most important mitigation measure192.
Various groups and connected profiles of insiders have been identified. A classification of (user) insider
groups according to the potential impact caused by incidents is as follows192: Privileged IT users /
Admins (ca. 60%), Contractors / Consultants / Temporary Workers (ca. 57%), Employees (ca. 50%),
Privileged Business users (ca. 50%), Executive Managers (ca. 30%), Business Partners and Other IT Staff
(ca. 20%). All in all, it has been reported that insider threat was responsible for ca. 15% of confirmed
data breaches in 2015163,193, while insiders were behind ca. 60% of the total incidents194.
Regarding the frequency of insider threats in various organisations, one may identify public sector,
healthcare and finance as the sectors with most incidents216. Surveyed information shows that
majority of organisations think that insider attacks have increased frequency (ca. 56%). As regards
190 http://www.crowdresearchpartners.com/wp-content/uploads/2016/09/Insider-Threat-Report-2016.pdf, accessed October 2016. 191 http://www.veriato.com/docs/default-source/infographics/insider-threat-spotlight-report.pdf?sfvrsn=10, accessed October 2016. 192 https://www.virtru.com/blog/insider-threat-detection/, accessed October 2016. 193 http://www.idtheftcenter.org/Data-Breaches/2015databreaches.html, accessed October 2016. 194 http://www-03.ibm.com/security/data-breach/cyber-security-index.html, accessed October 2016.

ENISA Threat Landscape Report 2016 Final version | 1.0 | OPSEC | January 2017
47
number of experienced insider attacks, some 30% have experienced one to many attacks, while ca.
50% are not sure about the number of experienced insider attacks162,192. This shows the increased need
for action in this area: more than half of organisations do not monitor insider threat, while they believe
that the frequency of this threat will increase. Here we see a high necessity and high potential for
improvements.
Looking at the barriers to insider threat protection shows192 that lack of skills (i.e. lack of training) is the
main reason for exposure to this threat (reported in ca. 60% of surveyed organisations). Lack of budget
is the second reason for inefficiencies in insider threat management (by ca. 50% of the cases).
Interestingly, lack of collaboration and lack of silo-breaking is the third barrier assessed (ca. 48%). In
other words: with regard to insider threat, training and communication – two rather “low tech”
controls – seem to be the ones that can be further advanced in most of the organisations. Ca. 40% of
the organisations believe that the current state-of-play in insider threat management is at a sufficient
level.
Observed current trend for this threat: stable, flat increase
Related threats: Malware, Spam, Botnets, Information Leakage, Data Breaches.
Authoritative Resources 2016: “INSIDER THREAT, Spotlight Report”, Crowd Research Partners190, “Insider Threat Spotlight Report Infographics”, Veriato191, “2016 Cyber Security Intelligence Index”, IBM194, “2016 Data Breach Investigations Report”, Verizon216.
Kill Chain:
Reconnaissance Weaponisation Delivery Exploitation Installation Command andControl
Actions onObjectives
Insider threat
Step of Attack Workflow
Width of Purpose
Figure 13: Position Insider threat in kill-chain
Mitigation vector: The mitigation vector for this threat contains the following elements195:
Definition of a security policy regarding insider threats, in particular based on user awareness, one of the most effective controls for this type of cyber-threat163.
Use of identity and access management (IAM) solutions by also implementing segregation of duties (e.g. according to defined roles).
Implementation of identity governance solutions defining and enforcing role-based access control.
Implementation/use of security intelligence solutions.
Use of data-based behaviour analysis tools.
Implementation of privileged identity management (PIM) solutions.
195 http://resources.sei.cmu.edu/asset_files/TechnicalReport/2012_005_001_34033.pdf, accessed November 2015.
ENISA Threat Landscape Report 2016 Final version | 1.0 | OPSEC | January 2017
48
Implementation of training and awareness activities
Implementation of audit and user monitoring schemes.

ENISA Threat Landscape Report 2016 Final version | 1.0 | OPSEC | January 2017
49
Physical manipulation/damage/theft/loss Though not really a cyber-threat, loss and theft continue having severe impact on all kind of digital assets. Physical damage/theft/loss is considered as one of the main reasons for data breaches175 and information leakage196: device losses - such as laptops and USB drives - account for ca. 40% of confirmed data breaches182. The impact of this threat is achieved by low protection levels in end devices. It is being reported that ca. 70% of end devices have no or weak encryption of storage media implemented197. Apparently, the exposure to this threat is still not being recognized in the way it deserves it, both by end-users and organisations, although protection by means of storage encryption would suffice to mitigate the risks emanating from data breaches. This threat will continue to bother users and organisations alike: IoT devices/tokens will also be subject to losses/theft. Moreover, unprotected IoT information on mobile devices will increase the impact of theft/loss198. Given the increased number of mobile devices, securing the perimeter will keep being one of the challenges of cyber-security professionals. Device users will need to be more vigilant when purchasing and using mobile devices and gadgets. The corresponding security controls involving user training and awareness are not costly and may significantly reduce exposure to this threat. Moreover, uncontrolled physical access to a device may have detrimental effects, as ATM fraud has shown199. Finally, it is very interesting to see the role of physical loss of non-digital media in the incident statistics. This kind of loss is often left out from security assessments.
In the reporting period we have assessed that:
By including physical manipulation in this threat, we are immediately in the main cause of incidents in
the area of ATM fraud199. Although cyber-criminals are deploying increasingly cyber-methods for ATM
fraud, physical methods still account for the majority of attacks to ATMs. Until the first half of 2015
(period covered by assessed report199), there has been an increasing number of physical attacks to
ATMs, with an increase for the 4th consequent year, both incident wise and losses wise. Operators of
ATMs but also POS-devices need to pay more attention to physical protection.
A quite alarming sign is the apparent misperception between reality and level of concern: security
professionals seem to classify the severity of device loss lower than its rank in its impact. More
precisely, while loss is the fifth security concern200, it the second cause of data loss182. It seems that
only one third of the surveyed companies have implemented data loss protection controls for physical
media. For this reason, it is proposed that physical protection measures are constantly reviewed and
compared to breaches stemming from device loss. It has been reported that the bad guys are not to be
blamed for theft more than insiders: physical “loss of assets are 100 times more prevalent than
theft”216.
In the reporting period we have collected a report from an insurance company based on a European
survey. This information is very interesting and unique because it reflects comprehensive incident-
analysis, a fact that gives a more holistic and cost-centric view of incident causes in the European
space225. This work has shown that physical loss of non-electronic media/devices causes a higher
number of incidents (ca. 42%) than lost/stolen equipment (ca. 37%). Though it sounds contradictory, it
196 https://pages.bitglass.com/Report-Financial-Services-Breach-Report-2016-LP.html, accessed November 2016. 197 https://www.thehaguesecuritydelta.com/media/com_hsd/report/57/document/4aa6-3786enw.pdf, accessed November 2016. 198 https://threatpost.com/bluetooth-hack-leaves-many-smart-locks-iot-devices-vulnerable/119825/, accessed November 216. 199 http://blog.trendmicro.com/trendlabs-security-intelligence/atm-malware-on-the-rise/, accessed November 2016. 200 http://www.crowdresearchpartners.com/wp-content/uploads/2016/03/BYOD-and-Mobile-Security-Report-2016.pdf, accessed November 2016.

ENISA Threat Landscape Report 2016 Final version | 1.0 | OPSEC | January 2017
50
becomes apparent that if taken together, these two physical threats are a basic consequence of losses
in cyber-space! In the US, ca. one third of companies admit that they have experienced loss of mobile
devices; one third of these cases have led to risk exposure201.
A collected report on data loss report verifies that physical media cause ca. 40% of information loss202.
The same report provides an interesting analysis of various physical media participating in loss/theft
(sequence according to incidents): laptops/tablets, USB-drives, mobile phones, printed media,
CDs/DVDs, microphones/WebCams and faxes. Increases of construction density, storage capacity,
processing power and autonomy, will lead to miniaturization of devices (i.e. IoT, wearables, e-health,
etc.). At the same time, these devices will hold a bigger amount of processed data and functions (i.e.
mobile apps). These facts will lead to much greater impact caused by physical modification/loss/theft
or damage of those devices and will further increase the prevalence of this threat202.
Observed current trend for this threat: increase
Related threats: Identity theft, Web application attacks, Web based attacks, Data breaches.
Authoritative Resources 2016: “2016 Data Breach Investigations Report”, Verizon216, “Grand Theft Data”, McAfee202.
Kill Chain:
Reconnaissance Weaponisation Delivery Exploitation Installation Command andControl
Actions onObjectives
Physical damage/theft/
loss
Step of Attack Workflow
Width of Purpose
Figure 14: Position of Physical manipulation/damage/theft/loss in the kill-chain
Mitigation vector: The mitigation vector for this threat contains the following elements:
Use of encryption in all information storage and flow that is outside the security perimeter (devices, networks). This will eliminate the impact from this threat.
Establish well communicated procedures for physical protection of assets, covering the cases of loss, damage and theft.
Use asset inventories to keep track of user devices and remind owners to check availability.
Consider transferring the risks from this threat to an insurance.
Put all necessary processes to reduce the time for the management of theft/damage/loss incidents.
Develop user guides for mobile devices and use good practices203.
201 https://business.kaspersky.com/security_risks_report_financial_impact/, accessed November 2016. 202 http://www.mcafee.com/us/resources/reports/rp-data-exfiltration.pdf#sf29756990, accessed November 2016. 203 http://transition.fcc.gov/cgb/consumerfacts/lostwirelessdevices.pdf, accessed November 2016.

ENISA Threat Landscape Report 2016 Final version | 1.0 | OPSEC | January 2017
51
Exploit kits Exploit kits (EK) are - next to botnets - major tools for the installation of malware. They install malicious payload on victim devices based on the exploits (vulnerabilities) found on those devices. This makes EKs one of the most successful tools for malware installation. In 2016, exploit kits have been in the cyber-security headlines, on the one hand because of their role in spreading ransomware and on the other hand because EKs are permanent targets of law-enforcement and vendor take-down operations181,204. Given anomalies in their operation, especially in 2016, exploit kits are discussed very controversially205: many think that the dramatic drop of Angler activity in summer 2016206 is not detrimental for its operation. Eventual gaps in malware distribution would be covered by other exploit kits. To this extend, it seems that the exploit kit landscape may undergo dramatic changes in short periods of time. However, these changes do not really generate a gap, as other tools or newer developments come to fill these gaps. One fact is yet undebatable in the threat landscape: even if there are irregularities in the operation of EK, they will remain central parts of the criminal infrastructure. Recent developments in complexity/sophistication and obfuscation that has been assessed in existing EK is a clear indication of the continuous investment of significant efforts in these platforms from groups engaged in cyber-crime.
In the reporting period we have assessed that:
Albeit operational instabilities observed in summer this year, EKs are further developed with main
objective to evade detection. Main functions regarding this are domain shadowing207 to bypass black
list filtering, payload encryption to evade antivirus functions and other methods such as creation of
multiple hashes for delivered payload. The functions of EK at the example of Angler are explained in
detail in a resource that has been issued in Q3 this year208. It contains comprehensive presentations of
this EK and details of its functions. It has been argued, that EK developers mimic functions found in
legitimate or malicious tools, such as other EKs. In this way, a permanent advancement in infection and
obfuscation is being achieved. These investments are possible due to the significant turnovers
achieved by those tools (e.g. ransomware, click-fraud, malware distribution), e.g. it is being argued
that Angler might have turned over some 60 million US$208.
In the reporting period, evidence has been found that in 2015 a major end-device-protection provider
has blocked ca. 1,2 million EK attacks per day224. In 2016, through the proliferation of ransomware, EK
usage might have grown. References of ca. 90 K victims per daily only from Angler have been found.
Given that Angler covered ca. 60% of EK205, one may calculate total ca. 130 K victims per day. Though
significantly smaller as assessed by end-device protection provider, it is still a big number. This explains
the relatively high classification of this cyber threat.
Exploit kits are offered in underground fora as-a-service209. The service covers the update of
vulnerabilities exploited and provides guarantees about high infection rates. The prices for rentals of
EK vary, according to the available EKs in the underground market. It has been reported that while
204 http://www.trendmicro.com/vinfo/us/security/definition/exploit-kit, accessed October 2016. 205 http://blog.trendmicro.com/trendlabs-security-intelligence/angler-shift-ek-landscape-new-crytpo-ransomware-activity/, accessed October 2016. 206 http://www.securityweek.com/exploit-kit-activity-down-96-april, accessed December 2016. 207 http://defintel.com/blog/index.php/tag/domain-shadowing, accessed October 2016. 208 http://www.talosintelligence.com/angler-exposed/, accessed October 2016. 209 http://documents.trendmicro.com/assets/guides/executive-brief-exploits-as-a-service.pdf, accessed October 2016.

ENISA Threat Landscape Report 2016 Final version | 1.0 | OPSEC | January 2017
52
Angler operation almost stopped, the prices for Neutrino have picked up by 100% reaching ca. 7000
US$ per month209.
Exploit kits are updated with known vulnerabilities that are exploited on end-devices. The
vulnerabilities found in the reporting period are related to Browsers (ca. 48%), Android (ca. 24%),
Microsoft Office (ca. 14%), Java (ca.7%), Adobe Flash Player (ca. 6%) and Adobe Reader (ca.1 %)66. It is
worth mentioning, that in 2015-2016, there is a decline in new vulnerabilities210. It is remarkable that a
trick of EK infection observed this year was to combine EK with watering hole attacks by infecting sites
concerning obituaries in small regional newspapers208. Apparently the idea is to lure people above a
certain age, assuming less technical knowledge and end-devices with unpatched software and a lot of
vulnerabilities. As in many other cyber-threat, this kind of tricks allow adversaries to narrow their
target group profiles with the aim of high infection rates.
It is being argued that there is not a single EK that constitutes single point of failure. Rather, other EKs
will take over the malicious payload of potentially shut down EKs. Partially, this is due to the presence
of multiple EKs in the underground market of EK-as-a-service offerings. Hence, the almost suspension
of Angler operations in summer, have led to stronger engagements of other EKs available211. Just as
dictated by market rules, the demand has been channelled to other available offerings. With the
availability of multiple offerings and eventual interconnections among malicious infrastructure
providers, it is hard to achieve a durable distortion via law-enforcement activities directed to a single
EK offering. The race with EK providers is characterised as a “running battle”212.
Observed current trend for this threat: increasing
Related threats: Malware, Spam, Botnets, Information Leakage, Data Breaches.
Authoritative Resources 2016: “Exploits as a Service”, Trend Micro209, “Internet Security Threat Report Internet Report VOLUME 21, APRIL 2016”, Symantec224, “IT threat evolution in Q2 2016 – Statistics”, Kaspersky72.
Kill Chain:
Reconnaissance Weaponisation Delivery Exploitation Installation Command andControl
Actions onObjectives
Exploit kits
Step of Attack Workflow
Width of Purpose
Figure 15: Position of Exploit kits in the kill-chain
Mitigation vector: Exploit kits are infecting systems based on their vulnerabilities. Exploit kit themselves are installed as malware. Hence the mitigation vector for this threat contains elements found in malware:
Performance of updates in a regular basis in orchestration with vulnerability management.
210 https://www.exploit-db.com/exploit-database-statistics/, accessed October 2016. 211 https://isc.sans.edu/forums/diary/Exploit+kit+roundup+Less+Angler+more+Nuclear/20255/, accessed October 2016. 212 http://www.bbc.com/news/technology-34464447, accessed October 2016.

ENISA Threat Landscape Report 2016 Final version | 1.0 | OPSEC | January 2017
53
Malware detection should be implemented for all inbound/outbound channels, including network, web and application systems in all used platforms (i.e. servers, network infrastructure, personal computers and mobile devices).
Use of a security e-mail gateway with regular (possibly automated) maintenance of filters (anti-spam, anti-malware, policy-based filtering), as well as content filtering to filter out unwanted attachments, mails with malicious content and spam.
Follow various vendor good practices213.
213 http://documents.trendmicro.com/assets/guides/executive-brief-exploits-as-a-service.pdf, accessed November 2016.

ENISA Threat Landscape Report 2016 Final version | 1.0 | OPSEC | January 2017
54
Data breaches In 2016 data breaches - the number of confirmed successful attempts to compromise confidential data- has grown significantly. The current level of data breaches is ca. 25% higher214 than 2015 and almost 45% more than that of 2014 that was characterized as the “year of the data breach”215. This is an alerting signal for the entire threat landscape. One should not forget that breached data are abused mainly to perform further breaches. This is because significant part of breached information consists of credentials. Hence, more data breaches mean more future attacks with fairly good chances to further breach data. Evidence found216 states that over 20% of data breaches are performed by using stolen credentials or brute force them. Responding to weakness of passwords and given the data breach figures of past years, many providers follow the proposal of the security community and offer two factor authentication. A further factor towards breaching data lies in the fact that credentials are offered for low prices in the underground market. In 2016, researchers have found out that for some 2 years now, cybercriminals offered breached credentials to low prices217. The offering consisted of ca. 75.000 credentials from various types of IT components (from servers to end-user devices) and various sectors (from banking to retail and public sector). Similarly, massive user data breached from yahoo can allegedly be used for phishing attacks218. In the reporting period, ENISA has published an Info Note on data breaches219.
In the reporting period we have assessed that:
It seems that a significant part of data breaches is still due to poor quality of data protection. Analysis
of leaked LinkedIn data from a breach back in 2012 reveals poor quality of used passwords220. Ca. 78%
of the passwords could be brute forced. Though maybe not representative for today’s password
qualities, it is interesting to see the order of magnitude of this weakness, in particular the amount of
trivial passwords. Similar “sloppiness” with sensitive data characterizes many breaches, with the ones
at media being the top of the iceberg221. It is being argued, that ca, 75% of data breaches are due to
weakly protected privileged credentials222.
In 2016, the gap between time to compromise/exfiltration and time to detect a breach has further
grown216. This is really bad news as it indicates that the bad guys are gaining speed, while the good
guys cannot keep-up. It is characteristic for the increasing efficiency of attacks, that ca. 90% of
compromises happen within seconds/minutes; while the time to detect within seconds/hours accounts
for just ca. 25% of the breaches.
Another interesting element of data breaches is the nature of stakeholders involved in activities
regarding the discovery of data breaches216 (such as detection, forensics and analysis). In particular,
214 http://www.idtheftcenter.org/images/breach/ITRCBreachReport2016.pdf, accessed September 2016. 215 https://www.enisa.europa.eu/publications/enisa-threat-landscape-2014/at_download/fullReport, accessed September 2016. 216 http://www.verizonenterprise.com/resources/reports/rp_DBIR_2016_Report_en_xg.pdf, accessed September 2016. 217 https://securelist.com/blog/research/75027/xdedic-the-shady-world-of-hacked-servers-for-sale/, accessed September 2016. 218 http://www.wsj.com/articles/yahoo-says-information-on-at-least-500-million-user-accounts-is-stolen-1474569637, accessed September 2016. 219 https://www.enisa.europa.eu/publications/info-notes/massive-data-breaches, accessed September 2016. 220 http://www.theregister.co.uk/2016/05/24/linkedin_password_leak_hack_crack/, accessed September 2016. 221 http://www.telegraph.co.uk/news/2016/09/22/michelle-obamas-passport-scan-posted-online-in-apparent-hack/, accessed September 2016. 222 http://www.databreachtoday.com/webinars/avoid-75-all-data-breaches-by-keeping-privileged-credentials-secure-w-1038?rf=promotional_webinar, accessed October 2016.

ENISA Threat Landscape Report 2016 Final version | 1.0 | OPSEC | January 2017
55
law enforcement has a growing presence, together with third party organisations. On the contrary,
internal discovery and fraud detection are declining. This fact underlines the increased involvement of
law enforcement in cyber-business, as well as the important role of vendors. It seems that these are
two poles attracting cyber-security skills at the time being.
A study223 performed on costs data breach reveals that the average cost of data breach is ca. $4 Million
or ca. $150 per stolen record. The total cost of data breach has increased ca. 30% from 2013. It is
interesting that cost of data breaches varies heavily depending on geography (top costs in US and
Germany) but also depending on business sector (highest in health care and education). Finally, data
breach causes depend also on geography, with low capability regions suffering data breaches due to
errors or losses, while in areas with higher capabilities data breaches are due to sophisticated hacking
methods.
The type of assets involved in data breaches fully meet expectations and correspond to assessed
trends216: while attackers continue targeting servers, also personal/user devices come on the scene.
This is trend is attributed to the use of mobile and IoT devices. Another increasing attack surface are
humans: with the advancement of phishing techniques (see also phishing in section 3.7), human
weaknesses have become a main exploit channel. The corresponding breach rates per asset are: 40%,
ca. 35%, can ca. 25% for servers, user devices and persons, respectively.
Business sectors breached214 are business services ca. 4%, medical/healthcare ca. 36%, educational ca.
9 %, government/military ca. 36%, and banking / credit / financial ca. 4%. This classification is based on
the number of incidents. As regards numbers of records breached, at the time of writing this report,
ca. 35 million records were reported breached, while the number of unknown breaches is assumed to
be much bigger (i.e. non-validated yahoo breach is estimated to include data of about ca. 200 million
users)224.
It is remarkable, that significant gap between data breaches reality and perception has been
assessed225. In particular, although c. 92% of European businesses have experienced a data breach in
the past 5 years, only 42% of their interviewees consider data breach as a relevant risk for their
organisation. This mismatch between reality and perception is a considerable risk for the achievement
of reduction of data breaches.
Threats that have led to data breaches are malware, use of stolen credentials, use of backdoors and
phishing. Involved actors are in the majority external with internal having a significant part. Figures are
differentiated a bit in assessed material: external attacks seem to account for 65-80% of the attacks,
while theft/loss is about 20% and insider threat between 10 and 15%224,216.
Observed current trend for this threat: increasing
Related threats: Malware, Web Based Attacks, Identity Theft, Phishing, Spam, Physical Damage/Theft /Loss Insider Threat, Information Leakage.
Authoritative Resources 2016: “2016 Data Breach Investigations Report”, Verizon216, “Internet Security Threat Report Internet Report VOLUME 21, APRIL 2016”, Symantec224, “2016 Data Breach Category
223 http://www-03.ibm.com/security/data-breach/, accessed September 2016. 224 https://www.symantec.com/content/dam/symantec/docs/reports/istr-21-2016-en.pdf?aid=elq_9562&om_sem_kw=elq_14669249&om_ext_cid=biz_email_elq_, accessed September 2016. 225https://www.lloyds.com/~/media/files/lloyds/about%20lloyds/cob/cyber/report/lloyds_cyber_surveyreport_v2_190916.pdf, accessed September 2016.

ENISA Threat Landscape Report 2016 Final version | 1.0 | OPSEC | January 2017
56
Summary”, Identity Theft Resource Centre214, “Facing the cyber risk challenge: A report by Lloyd’s”, Lloyd’s225.
Kill Chain:
Reconnaissance Weaponisation Delivery Exploitation Installation Command andControl
Actions onObjectives
Data Breaches
Step of Attack Workflow
Width of Purpose
Figure 16: Position of Data breaches in the kill-chain
Mitigation vector: It is worth mentioning that due to wide nature of threats that can lead to a data breach, mitigation controls mentioned overlap with other cyber-threats. The mitigation vector for this threat contains the following elements:
Performance of data classification to assess and reflect the level of protection needed according to data categories.
Implementation of Data Loss Prevention solutions to protect data according to their class both in transit and in rest.
Usage of encryption of sensitive data, both in transit and in rest.
Reduction of access rights to data according to principle of least privileges.
Development and implementation of security policies for all devices used.
Performance of updates in a regular basis in orchestration with vulnerability management.
Implementation of malware protection and insider threat protection policies.

ENISA Threat Landscape Report 2016 Final version | 1.0 | OPSEC | January 2017
57
Identity theft Identity theft is a special case of data breach and is related to compromise of identity information of humans or machines. As such, identity theft is not a cyber threat on its own. It is rather the result of successful attacks through other cyber-threats targeting identity information. As indicated by its name, identity theft is about losing information related to: identifiable names, addresses, contact data, credentials, financial data, health data, logs, etc. A typical threat that leads to identity theft is information leakage. Given its nature, identity information is a valuable asset for its owner; and at the same time is an excellent target for monetization oriented abuse. And this is exactly the focus of identity theft, also in 2016: identity theft has grown as the result of growth in many of the addressed cyber-threats. Moreover, in the reporting period we have seen a well organised marketplace will massive amount of server and machine credentials covering a large amount of sectors and application areas226. Though probably not unique of this kind, it is a good example of the maturity, quality and accuracy of such offerings. Large number of high profile servers from various sectors, including embedded management functions are offered at prices of 7 US$ per credential. This is the perfect basis for series of malicious activities and gives precise view of the importance of identity protection. The low prices make this information affordable also for low capability threat agents.
In the reporting period we have assessed that:
Important information about identity theft and fraud originates from the US227,228,229. These resources
provide important information on identity theft and data breaches. In the EU space, information about
identity theft and identity fraud are scarcer, in particular as regards governmental/public
organisations. Some information can be found in Nordic countries230, whereas identity fraud is covered
more comprehensively in UK231. Driven from the private sector, an interesting resource has been found
that covers European space232. Given increase rates of ca. 50% in the area233 it is a fact that there is an
urgent necessity to track identity theft and fraud within the EU. It remains to be seen what the impact
of eIDAs regulation is going to be w.r.t. identity fraud protection234.
According to predictions on identity theft trends found235, it is important to underline an emerging
trend w.r.t. increased levels of exposure of identities from “sensitive” social groups, in particular
children and young students: With the increasing digitization of school performance, learning
capabilities, social profiles, etc., identity information of children is getting digitised. Given the speed of
this development and the (low) protection level found in educational organisations, it becomes evident
that these identities are at risk.
Another important issue assessed is the emerging evolution of identity due to proliferation of new
technologies in people’s lives. While content from technological devices such as mobile phones, tablets
226 https://securelist.com/files/2016/06/xDedic_marketplace_ENG.pdf, accessed October 2016. 227 http://www.iii.org/fact-statistic/identity-theft-and-cybercrime, accessed October 2016. 228 http://hosted.verticalresponse.com/358216/ac0a9368d8/1746749985/0f7bdaadc2/, accessed October 2016. 229 http://www.asecurelife.com/category/personal-security/identity-theft/, accessed October 2016. 230 http://www.konsumenteuropa.se/en/news-and-press-releases/eu-kommissionen/archive-2016/reduce-the-risk-of-id-theft/, accessed October 2016. 231 https://www.cifas.org.uk/identity_fraud, accessed October 2016. 232 https://www.secureidentityalliance.org/, accessed October 216. 233 https://www.cifas.org.uk/research_and_reports, accessed October 2016. 234 https://ec.europa.eu/digital-single-market/en/e-identification, accessed October 2016. 235 http://www.idtheftcenter.org/Identity-Theft/itrc-s-predictions-for-2016.html, accessed October 216.

ENISA Threat Landscape Report 2016 Final version | 1.0 | OPSEC | January 2017
58
and computers are already considered part of private life/home236, IoT contributes to the expansion of
“virtual” home space. With the increased virtualization of intimate user environment, the definition of
identity evolves. Instead of changing the definition of identity on the occasion of prosecuted identity
fraud cases (i.e. let-the-fraud-happen-and-then-we-see posture), a more proactive means of identity
evolution should be thought including state, private and consumer organisations. This trend is
reinforced by the very nature of humans to immediately adopt new technological developments - even
in early phases – without making any thoughts about their possibly long-term privacy implications.
Identity information is one of the most lucrative sources in underground markets. Obviously, the
massive availability of breached identity information is the perfect source of new data and identity
information breaches: xDedic226, an underground market with major server credentials, is the perfect
illustration of this. Hence, data and identity information breaches lead to more breaches. In order to
break this vicious circle, long term measures of international scope are necessary.
Identity theft reported in 2016 shows237 that Businesses (ca. 43%) lead the statistics, followed by
Medical/Healthcare (ca. 36%), Education (ca.9%), Government/Military (ca. 7%) and Banking/Financial
(ca. 4%). The misuse that has happened with stolen identities is related to227: Government documents
or benefits fraud (tax refunds) (ca. 49%), Credit card fraud (ca. 15%), Phone or utilities fraud (ca. 10%),
Bank fraud (Ca. 6%), Attempted identity theft (ca. 3.7%), Loan fraud (ca. 3.5%), Employment-related
fraud (ca. 3.3%), Other (ca. 19%). Interestingly, statistics are a verification of the monetization trend of
the reporting period. It is furthermore noticeable that although data breaches have increased in 2016,
the number of identity records stolen are less than in previous year.
Observed current trend for this threat: decrease (of stolen identity records)
Related threats: Malware, Spam, Botnets, Information Leakage, Data Breaches.
Authoritative Resources 2016: “Identity Theft and Cybercrime”, Insurance Information Institute227, “2016 Data Breach Category Summary”, Identity Theft Resource Centre214.
Kill Chain:
Reconnaissance Weaponisation Delivery Exploitation Installation Command andControl
Actions onObjectives
Identity theft
Step of Attack Workflow
Width of Purpose
Figure 17: Position of Identity theft in the kill-chain
Mitigation vector: The mitigation vector for this threat contains the following elements:
All physical identity documents and copies hereof should be adequately protected against unauthorised access. This should include documents in transit, such as ones sent via mail delivery services.
236 http://www.msnbc.com/msnbc/supreme-court-cell-phone-privacy-searches, accessed October 2016. 237 http://hosted.verticalresponse.com/358216/ac0a9368d8/1746749985/0f7bdaadc2/, accessed October 2016.
ENISA Threat Landscape Report 2016 Final version | 1.0 | OPSEC | January 2017
59
Identity information should not be undisclosed to unsolicited recipients and their requests. Such unsolicited requests may arrive via online requests, by phone, mail or in person.
Users should be aware of accidentally disclosing their identity data by using it in crowded places, for example by means of their devices or by means of publicly available ATMs and POS devices.
Transactions documented by means of bank statements or received receipts should be checked regularly upon irregularities.
Install content filtering to filter out unwanted attachments, mails with malicious content, spam and unwanted network traffic.
Install end-point protection by means of anti-virus programs but also block execution of files appropriately (e.g. block execution in Temp folder).
Ensure good quality of credentials and secure methods for their storage.
Use of Data Loss Prevention (DLP) solutions. A detailed guide for DLP can be found here238.
A detailed list of practical identity theft mitigation propositions can be found here239.
238 http://www.mcafee.com/us/resources/reports/rp-data-protection-benchmark-study-ponemon.pdf, accessed October 2016. 239 http://www.asecurelife.com/ways-to-prevent-identity-theft/, accessed November 2016.

ENISA Threat Landscape Report 2016 Final version | 1.0 | OPSEC | January 2017
60
Information leakage Information leakage is a category of cyber-threats abusing weaknesses of run-time systems, of components configuration, programming mistakes and user behaviour in order to leak important information. Usually, leaked information serves as input to other threats and helps committing further cyber-crimes. Information leakage can be performed on all levels of components, from hardware to software and services. Information leakage attacks aim at discovering ways to obtain access to unencrypted or weakly encrypted user data. In the reporting period, we have seen massive opportunities that could lead to data leakage, in particular in big sport events such as Euro 2016 Football Tournament240 and Olympic Games159. Apart from abusing weaknesses, information leakage can be achieved by specially crafted malicious artefacts such as fake applications and fake offerings, such as free Wi-Fi, free mail, free storage space, etc. Finally, social media information is a source of “voluntarily leaked” personal information that can be misused to feed other cyber-threats (e.g. phishing). Leakage, in many cases accidental, is one of the main causes of breached identities224. Information leakage almost tripled from 2014, while this threat has caused 48% of all identity breaches in 2015.
In the reporting period we have assessed that:
Being one of the main protection measures of the internet, the SSL/TLS protocol is a permanent target
of cyber-criminals through leakage attacks. SSL leakage attacks have been encountered in the
reporting period, some of those being developed by security researchers241,242. It is interesting that
some of the attacks to SSL/TLS are based on “forgotten” features of older version of browsers that are
configured to use old versions of these protocols with weaker cryptography. One can argue that these
attacks are actually web based attacks as they target browser versions. Though this is right, it needs to
be underlined that leak attacks target rather the components of SSL, based on a vulnerability of the
browser, a typical case of dependency between two threat types.
Another common target for leakage attack is network communication. Through the proliferation of
anonymity mechanisms, such as TOR and VPN, cyber-criminals wish to de-anonymize communications.
Most common target is the IP protocol: attackers try to find identifiable information from the
communication headers, such as IP addresses. While known DNS and IP leak243attacks are widely used,
adversaries try to abuse misconfigured or maliciously re-directed network communications before the
VPN to tap communicated content or de-anonymize the IP address. Comprehensive testing and
mitigation measures of existing connections for this threat can be found online243.
Leaks in applications, particularly mobile apps, are a common attack vectors to leak user information.
In 2016, we have seen a mainstream mobile application (Pokemon Go) to deliver full access to google
user accounts244. Assuming an error as source of this leak, it is interesting to see the level of exposure
such a leak may cause. The impact of this erroneous function demonstrates the potential behind
information leakage attacks. A demo on misuse of weakly implemented single sign-on protocol of a
240 http://www.scmagazineuk.com/euro-2016-causes-spike-in-cyber-crime-on-mobile-devices/article/507413/m, accessed October 2016. 241 https://www.feistyduck.com/bulletproof-tls-newsletter/issue_19_sweet32_heist_time_pac_and_wpad.html, accessed October 2016. 242 https://sweet32.info/, accessed October 2016. 243 https://www.dnsleaktest.com/what-is-a-dns-leak.html, accessed October 2016. 244 https://www.cnet.com/news/pokemon-go-gotta-catch-all-your-personal-data/, accessed October 016.

ENISA Threat Landscape Report 2016 Final version | 1.0 | OPSEC | January 2017
61
widely used Android application has shown the effect of application leaks245. Through abuse of this
weakness, the entire private user data can be accessed by the attacker.
Being a valuable asset itself, virtual currencies are a permanent target both for cyber-criminals and law
enforcement agencies. While bad guys are behind user wallets, state-sponsored actors are interested
in unveiling the identities of criminals behind performed transactions. There is an ongoing race for
virtual currencies anonymization246. Weaknesses of anonymization algorithms and hiding of
transacting partners are analysed. At the same time, the anonymization community disseminates basic
rules to mitigate leakage attacks246.
There is not an attempt that would be left unexploited by attackers when there is sufficient reward
from a potentially successful attack. This has been demonstrated by recent reports regarding leaks
related to CIP which are based on pagers used within this sector247. The study shows that a lot of
pagers are still in use, especially in sectors of “breath-taking” criticality like nuclear plants, chemical
plants, power plants and substation management, facility management and building automation. Most
of the information is unsecured (ca. 90%), while half of the communicated information is numeric and
alphanumeric (ca. 47%). The impact caused by information leaks in this area is obvious big, while this
example may not be the only one.
Observed current trend for this threat: increase
Related threats: Identity theft, Web application attacks, Web based attacks, Data breaches.
Authoritative Resources 2016: “Leaking Beeps: Unencrypted Pager Messages in Industrial Environments”, Trend Micro247, “SPAM AND PHISHING IN Q2 2016”, Kaspersky159.
Kill Chain:
Reconnaissance Weaponisation Delivery Exploitation Installation Command andControl
Actions onObjectives
Information leakage
Step of Attack Workflow
Width of Purpose
Figure 18: Position Information leakage in the kill-chain
Mitigation vector: The mitigation vector for this threat contains the following elements248:
Avoidance of clear-clear text information, especially when stored or on the move.
Performance of dynamic analysis of application code, both by means of automated or manually performed code scans and input/output behaviour.
245 https://threatpost.com/oauth-2-0-hack-exposes-1-billion-mobile-apps-to-account-hijacking/121889/, accessed November 2016. 246 https://bitcoinmagazine.com/articles/is-bitcoin-anonymous-a-complete-beginner-s-guide-1447875283, accessed October 2016. 247 http://www.trendmicro.com/cloud-content/us/pdfs/security-intelligence/white-papers/wp_leaking-beeps-industrial.pdf, accessed October 2016. 248 https://www.prot-on.com/tips-to-prevent-information-leaks-in-your-company, accessed November 2015.

ENISA Threat Landscape Report 2016 Final version | 1.0 | OPSEC | January 2017
62
Performance of static analysis of application code to identify weaknesses in programming. This analysis should be done both for source and object code.
Performance of manual code reviews at a certain level of code details, whereas more detailed analysis should be done tool-based.
Perform classification of processed/transmitted/stored information according to the level of confidentiality.
Use of technology tools to avoid possible leakage of data such as vulnerability scans, malware scans and data loss prevention tools.
Identification of all devices and applications that have access/they process confidential information and application of steps above to secure devices and applications with regard to information leakage threats.

ENISA Threat Landscape Report 2016 Final version | 1.0 | OPSEC | January 2017
63
Cyber espionage Though being a different sector as intelligence and state-sponsored espionage, military is just another component of the overall national security. Hence, military comes to complement the activities of cyber threat intelligence with intelligence methods coming from the military field. This is definitely an important development of the threat landscape: intelligence and military capabilities in the area of cyber-space will mutually reinforce each-other and will “release” new potential, both in the security market but also in the cyber-space per se. In 2016 we have arrived at the state that cyber is also officially recognised as a battlefield249. Official declarations about development of cyber-capabilities in the military sector is the consequence in EU Member States250 and defence-related organisations251. These forces come to join activities of competitors and state-affiliates216. At the same time, in the future it will be even more difficult to distinguish the activities of those actors, both by means of campaigns and attribution. In the reporting period, cyber-espionage has been the 3rd most common motive of performed attacks while cyber-warfare appears for 2016 as the 4th most common motive252. Two important things to note at this level: firstly, known/confirmed cases are the top of the iceberg. This is because espionage campaigns are difficult to identify. And once identified are difficult/costly to analyse. It is believed that cyber-espionage is the motive of much more undetected campaigns253. To this extend, the assessed descending trend of this threat may not be fully valid. Secondly, cyber-espionage is much targeted: it uses the same methods as cyber-crime, but it possesses intelligence allowing to lure victims much more efficiently.
In the reporting period we have assessed that:
In 2016 we have seen a very interesting ATP campaign that was entirely crafted from existing code
found in various online fora: the copy-paste APT254. It is noticeable that all tools necessary for a rather
complex campaign are available online, accessible by everyone. Nonetheless, the attack vector used
has typical APT characteristics, both by the complexity of the attack vector and the efficiently in
targeting military personnel and organisations. Allegedly, the campaign has infected some 2500 end-
points. Being typical for this kind of attacks, the initial infection has been performed by means of a
phishing message.
In the reporting period, another very interesting event was the compromise of tools that were
allegedly used by NSA255,256. In particular, a hacker group has claimed to be in the possession of a large
amount of tools used by the “Equation Group”, a group associated to NSA. They have started an
auction to sell this material. Though it is not clear how this hack has been achieved, the tools were
based on zero-day vulnerabilities of CISCO routers257. One of the interesting questions regarding this
249 http://www.euronews.com/2016/06/15/cyberspace-is-officially-a-war-zone-nato, accessed November 2016. 250 http://www.defensenews.com/story/defense/international/europe/2016/04/27/germany-cyber-it-armed-forces-military-branch/83590028/, accessed November 2016. 251 http://www.heise.de/newsticker/meldung/Groesstes-deutsches-Cyber-Forschungszentrum-entsteht-an-Muenchner-Bundeswehr-Uni-3280543.html, accessed November 2016. 252 http://www.hackmageddon.com/category/security/cyber-attacks-statistics/, accessed November 2016. 253 https://www.ncsc.nl/binaries/content/documents/ncsc-en/current-topics/cyber-security-assessment-netherlands/cyber-security-assessment-netherlands-2016/1/CSAN2016.pdf, accessed November 2016. 254 https://s3-us-west-2.amazonaws.com/cymmetria-blog/public/Unveiling_Patchwork.pdf, accessed November 2016. 255 https://securelist.com/blog/incidents/75812/the-equation-giveaway/, accessed November 2016. 256 https://www.enisa.europa.eu/publications/info-notes/the-201cshadow-brokers201d-story, accessed November 2016. 257 http://arstechnica.com/security/2016/08/nsa-linked-cisco-exploit-poses-bigger-threat-than-previously-thought/, accessed November 2016.

ENISA Threat Landscape Report 2016 Final version | 1.0 | OPSEC | January 2017
64
incident are the implications of hacking national security (or even military) and coming to the
possession of cyber-tools/weapons. Such a successful operation may end up with a horror scenario of
a malicious actor be in the possession of tools able of “massive destruction” at least in the cyber-
space.
Another interesting issue that has arose in the reporting period is the deployment of espionage and
surveillance/interception tools by rogue states and organisations that do not respect human rights or
do not follow lawful practices258,259. These tools were used to monitor journalists and human rights
activists260. On this occasion, the cyber-security community might need to start discussions on possible
measures to avoid that such tools come to the hands of malicious users or are used to victimize user
groups. Given the turnover achieved by cyber-crime, one could not even exclude that such tools may
come in the possession of cyber-criminals!
The cases mentioned in the two bullet points above have one thing in common: both base their attack
vectors on zero-day vulnerabilities. That is, their tools abuse vulnerabilities that are publicly unknown,
yet only available to the developer of the tools. Especially in 2016 we have seen quite some zero-day
vulnerabilities being in the possession of companies/groups/actors that are supposed to be close to
national security agencies. Just as the possession of powerful cyber-espionage tools, the community
needs to discuss the conditions under which vulnerability hunting is being performed and under which
known vulnerabilities are being made public261.
Though in 2016 we have seen very sophisticated ATPs262, it is believed that high capability agents (i.e.
nation states and military operations) will capitalize in the future on more off-the-self campaigns159.
Hence, departing from the investment of new vulnerabilities (see bullet above), they will orchestrate
their attacks by using available/common attack techniques. This tactic will enhance stealthiness:
custom, highly sophisticated tools are easier to trace and locate (e.g. to be attributed to providers and
geography). Nonetheless, known vulnerabilities are almost equally available in the majority of IT-
environments, in a manner that is appropriate at least for the infiltration phase.
An excellent resource with extensive information about APTs has been found263. It contains
comprehensive details about APTs and all related components such as operations, malware,
geographies, etc. Moreover, it is a good summary of attacks according to sectors and asset groups. This
material can be used to assess exposure and understand attack tactics.
Observed current trend for this threat: decrease
Related threats: Identity theft, Web application attacks, Web based attacks, Data breaches.
258 http://surveillance.rsf.org/en/hacking-team/, accessed November 2016. 259 http://www.nytimes.com/2016/09/03/technology/nso-group-how-spy-tech-firms-let-governments-see-everything-on-a-smartphone.html?_r=2, accessed November 2016. 260 http://motherboard.vice.com/read/government-hackers-iphone-hacking-jailbreak-nso-group, accessed November 2016. 261 https://www.enisa.europa.eu/publications/info-notes/responsible-vulnerability-disclosure-and-response-matter, accessed November 2016. 262 https://securelist.com/analysis/publications/75533/faq-the-projectsauron-apt/, accessed November 2016. 263 https://docs.google.com/spreadsheets/d/1H9_xaxQHpWaa4O_Son4Gx0YOIzlcBWMsdvePFX68EKU/pubhtml#, accessed November 2016.

ENISA Threat Landscape Report 2016 Final version | 1.0 | OPSEC | January 2017
65
Authoritative Resources 2016: “Cyber Security Assessment Netherlands, CSAN 2016”, National Cyber Security Centre253, “UNVEILING PATCHWORK – THE COPY-PASTE APT”, Cymmetria254, “2016 Data Breach Investigations Report”, Verizon216.
Kill Chain:
Reconnaissance Weaponisation Delivery Exploitation Installation Command andControl
Actions onObjectives
Cyber espionage
Step of Attack Workflow
Width of Purpose
Figure 19: Position of Cyber espionage in the kill-chain
Mitigation vector: Due to the comprehensive nature of this threat, it would contain several mitigation measures found in other threats of this report. Following advice found216, baseline mitigation controls for this threat are:
Identification of mission critical roles in the organisation and estimation of their exposure to espionage risks. Based on business information (i.e. business intelligence), risks to businesses and level of espionage risks are being evaluated.
Creation of security policies that accommodate human resource, business and operational security controls to cater for risk mitigation regarding loss of human resources and business assets. This will include rules and practices for awareness raising, corporate governance and security operations.
Establishment of corporate practices to communicate, train and apply the developed rules and keep operational parts defined up and running.
Development criteria (KPIs) to benchmark the operation and adapt it to upcoming changes.
Depending on the risk level assessed, whitelisting for critical application services should be developed.
Vulnerability assessment and patching of used software should be performed regularly, especially for systems that are in the perimeter, such as web applications, web infrastructure and office applications.
Implementation of need to know principle for access rights definition and establishment of controls to monitor misuse of privileged profiles.
Establishment of content filtering for all inbound and outbound channels (e-mail, web, network traffic).

ENISA Threat Landscape Report 2016 Final version | 1.0 | OPSEC | January 2017
66
Visualising changes in the current threat landscape This chapter provides a visualization of the changes assessed in 2016’s landscape in comparison to the one of the previous year (see Figure 20). Besides changes in ranking, the figure also displays the trends identified for each threat. The interesting phenomenon of having some threats with stable or decreasing trend climbing up the ranking, is mostly due to the fact that, albeit stagnation/reduction, the role of this threat in the total landscape has grown, for example through volume of malicious activities, identified incidents, breaches attributed to the threat, etc. Similarly, other threats with increasing trend are lowered in the ranking (e.g. 2016’s threat ranks 10-12 in the table below). This is due to threats climbing to higher positions of the ranking, inevitably leading to lowering all other threats below.
Top Threats 2015 Assessed
Trends 2015 Top Threats 2016
Assessed Trends 2016
Change in ranking
1. Malware 1. Malware → 2. Web based attacks 2. Web based attacks → 3. Web application attacks 3. Web application attacks → 4. Botnets 4. Denial of service ↑ 5. Denial of service 5. Botnets ↓ 6. Physical damage/theft/loss 6. Phishing ↑ 7. Insider threat (malicious,
accidental) 7. Spam ↑ 8. Phishing 8. Ransomware ↑ 9. Spam 9. Insider threat ↓
10. Exploit kits 10. Physical manipulation/damage/ theft/loss
↓
11. Data breaches 11. Exploit kits ↓ 12. Identity theft 12. Data breaches ↓ 13. Information leakage 13. Identity theft ↓ 14. Ransomware 14. Information leakage ↓ 15. Cyber espionage 15. Cyber espionage →
Legend: Trends: Declining, Stable, Increasing Ranking: ↑Going up, → Same, ↓ Going down
Figure 20: Overview and comparison of the current threat landscape with the one of 2015.
ENISA Threat Landscape Report 2016 Final version | 1.0 | OPSEC | January 2017
67
4. Threat Agents
Threat agents and trends In the reporting period, we have observed advances made by both “cyber-hunters” and “cyber-huntees” - the good and the bad guys. These developments go along the lines assessed in previous years and seem to make up the golden rule in cyber-threat agents domain: cyber-threat agents are always a step ahead of the defenders. As this race continued in 2016, there are some changes in the state-of-play. These changes are reflected in the characteristics of both attackers and defenders and include: motivations, level of capabilities, focus, level of preparedness, striking power, etc.
Hence, one can differentiate the current state-of-play by looking at details of behaviours of both groups. Such a comparison shows that in 2016 defenders:
Expanded their knowledge on modus operandi: by using/implementing cyber-threat intelligence,
defenders have put themselves in the position to increasingly collect information on modus operandi.
This has been achieved by projecting attack methods to business and product processes. This allows
for a better proactive defence of important business assets (see also Figure 3). Tough still at an initial
phase, this development goes to the right direction towards an effective proactive protection strategy.
Investigated and Implemented methods to de-anonymize dark net: in the reporting period, assessed
weaknesses of common anonymization platforms and methods have been identified and used for the
successful identification of adversaries264. It is interesting that this trend has been observed for virtual
currencies246.
Understood that defence is one main course of action: hence defence tactics have been analysed and
assigned to the phases of a hunting maturity model265. Part of this development is the identification of
various defence capabilities and the introduction of active/offensive defence. This is quite an
interesting development as it may significantly change the way threats are surfaced in
organisations266,267.
Active defence has started to be implemented: by means of dedicated practices, methods, roles and
teams, member states have started with the implementation of active defence268. The use of security
teams to support this has started being re-discussed269,270 and become part of cyber-security defence
strategy.
At the same time attackers:
Understand how to use publicly available intelligence: by leveraging on available information - i.e. on
vulnerabilities, malicious code and best practices on anonymization techniques - adversaries
264 https://crypto.stanford.edu/seclab/sem-14-15/pustogarov.html, accessed November 2016. 265 https://www.sans.org/reading-room/whitepapers/analyst/who-what-where-when-effective-threat-hunting-36785, accessed November 2016. 266 https://theglobalobservatory.org/2016/11/cybercrime-active-defense-mirai-botnet/, accessed November 2016. 267 https://cchs.gwu.edu/sites/cchs.gwu.edu/files/downloads/CCHS-ActiveDefenseReportFINAL.pdf, accessed November 2016. 268 http://www.theregister.co.uk/2016/09/16/uk_gov_active_cyber_defence/, accessed November 2016. 269 https://danielmiessler.com/study/red-blue-purple-teams/, accessed November 2016. 270 http://redteams.net/, accessed November 2016.

ENISA Threat Landscape Report 2016 Final version | 1.0 | OPSEC | January 2017
68
implement their learning curve. The use dark web to exchange information among groups is one main
channel for exchanging this information.
Try to avoid attack methods that inherently unveil their identity: threat agents do very selectively
chose their attack practices with the aim to avoid attribution. In particular high-capability state-
sponsored actors seem to depart form APT attacks that unveil their identity through nature of used
tools. Instead, more “plain vanilla” TTPs are used, while the efficiency is increased through the
targeted manner of the campaign.
Continue maturing and marketing their infrastructures: cyber-threat agents invest significant amounts
from their profits to advance and mature their infrastructures. This translates in more innovative
tactics and techniques incorporated into tools used. Code sharing is a main element that contributes to
this advancement. At the same time, developed infrastructures are offered by means of various use-
cases to end-user who can use them on their behalf. In the reporting period we have seen maturity
steps taken in this direction, in particular in the area of ransomware271. All in all – and as explained in
the top cyber-threats – the requirements to enter cyber-crime has been lowered through these service
offerings.
The above mentioned points largely demonstrate the boundaries of the “race” between attackers and defenders. This race has led to the following developments/observations in the cyber-space:
In the reporting period we have seen law-enforcement agencies being very active with arrests of
cyber-criminals and infrastructure takedowns. Liaisons with sector organisations were key in
identifying malicious activities and infrastructure takedowns. However, as no statistical evidence could
be assessed, no conclusions about trends in convictions of cyber-criminals can be made.
Adversaries have increased cyber-crime “capitalization” to new all-time records. The monetization
trend has led to record turnovers for cyber-crime activities and this trend seems to continue.
Though defender engagements, the entry level threshold has been raised. Yet, through available
information, the entry level capability of novice hackers is higher, thus partially compensating
advancements of defenders. This may lead to less “opportunistic”, low capability hacking. But at the
same time, advances in multi-tenant malicious infrastructures come to neutralize counterbalance this.
The assessed gap between the time to compromise and time to detect increased further in 2016216:
defenders are in the position to detect incidents at a lower speed as they are caused. This trend needs
to be reversed in order to at least stabilize the effects of malicious activities of cyber-criminals.
Top threat agents and motives In this chapter we present an outline of top threat agent groups. It includes observations about their motives and main trends assessed with regard to their capabilities. This is a complementary view to the threat assessments (including tools, methods and tactics) presented within the top cyber-threats (see chapter 3) and the attack vectors (see chapter 5).
Just as in previous threat landscapes, in this year we consider the following threat agents’ groups: cyber-criminals, insiders, cyber-spies, hacktivists, cyber-offenders, cyber-fighters, cyber-terrorists and script-kiddies. It should be noted that the sequence of mentioning is according to their engagement in the threat landscape216,253,272. Some of the sources found, tend to describe threat agents as a set of motives. Though
271 https://www.flashpoint-intel.com/book/ransomware-as-a-service/, accessed November 2016. 272https://www.gov.uk/government/uploads/system/uploads/attachment_data/file/564268/national_cyber_security_strategy.pdf, accessed November 2016.

ENISA Threat Landscape Report 2016 Final version | 1.0 | OPSEC | January 2017
69
equally useful, this description does not embrace capability levels, group identification and dynamics aspects.
The assessed cyber threat agent groups are as follows:
Cyber-criminals are the most active threat agent group in cyber-space, being responsible for at least two third of the registered incidents273. While the generic characteristics of this threat agent group are similar to the ones assessed in the previous years, the group has undergone some further maturity and progress, merely regarding its capabilities and used techniques to maximize monetization. As regards the capabilities, in the reporting period we have seen advancements in the scale of attacks: combinations of various platforms (i.e. mobile, social and technical) are key to achieve penetration in sectors like banking and e-health. Moreover, the effective management of large malicious infrastructures has been a demonstration of operational capabilities; this has been observed in respect to botnet operations120, update actions of exploit kit infrastructure205, but also the orchestration of very massive DDoS attacks through IoT devices100. As regards the used techniques, in 2016 there has been a concentration on ransom and extortion campaigns. This has been achieved by crafting malicious functions in ways so that not much options had left open to victims to regain control over their data, as to pay the ransom. A further “novelty” of this year was the use of DDoS as a means to blackmail victims by attacking their service availability253. Finally, worth reporting is the ability of cyber-criminals to establish anonymity for their operations, transactions and money laundering. This has led to low level of attributions and new records of cyber-crime turnovers. Last but not least, affiliate programmes274,275 and marketing of cyber-crime-as-a-service271 are some important achievements; in these areas we have seen advancements that have put forward approaches from previous years.
For another year, insiders have been one of the main actors to threaten their organisations, both intentionally and unintentionally. Intention, negligence and error are the three sources of threats attributed to this group, intention is source of the fewer incidents. Most typical are violations of existing security policies through negligence and user errors. Most insider threats are observed by privileged users, followed by contractors and employees. It is worth mentioning, that form the own employees, one group that may cause significant impact are executive managers. This is because of their access to intellectual property information, often the most desirable asset from the point of view of competitors and thus primary subject of monetization. An important issue that needs to be mentioned here, is the blurry nature of this threat group. This is because insiders are very often victims of targeted attacks (e.g. web based attacks and phishing). Usually, these attacks result in loss of credentials that are then abused to get access to data/services. Given the difficulty in attribution, these incidents may be erroneously assigned to insiders. As regards capabilities and tools used by insiders have been mostly covered in the corresponding threat (see section 3.14). Moreover, given the availability of strong financial capabilities of cyber-crime and state-sponsored agents, it is possible to assume blurriness among insiders and these threat agent groups.
Given the quite high number of large events, commercial developments and international conflicts, 2016 has been a quite busy year for hacktivists276. Examples of those events were the Euro 2016 Football Tournament, the Olympic Games, political developments in Turkey and Syria, but also the merger of
273 http://www.hackmageddon.com/, accessed November 2016. 274 http://www.bleepingcomputer.com/news/security/the-petya-and-mischa-ransomwares-part-of-a-new-affiliate-service/, accessed November 2016. 275 https://blog.fortinet.com/2016/09/12/from-shark-to-atom-ransomware-service-offers-generous-returns, accessed November 2016. 276 https://www2.deloitte.com/content/dam/Deloitte/us/Documents/risk/us-aers-hacktivism.pdf, accessed November 2016.

ENISA Threat Landscape Report 2016 Final version | 1.0 | OPSEC | January 2017
70
Monsanto and Bayer. The protests have been on typical activist themes such as environmental policy, discrimination, corruption, pacifism, public health issues, support of minorities, media277, etc. Though reported being between 3rd and 4th in the threat agent ranking, hacktivists activities may be consider as stable over the years, causing low to medium impact damage through denial of service, data leaks and defacement campaigns276. Their activities continue to have the creation of embracement and consequently public awareness. Experience shows that hacktivists cooperate on a group basis without any leadership schemes. Rather they consists of groups of hackers who –based on various events - are connected on an ad-hoc manner whenever they ideology contradicts to some national or international developments. It is interesting that their activities might even be supportive to international, institutional initiatives directed towards aggressive fringe groups278.
State-sponsored actors, the cyber-spies have been approx. the fourth most active threat agent group (in the table below cyber-spies are divided according to their motives in the categories Nation States and Corporations). Formally speaking, this threat group would include intelligence agencies and military organisations. This is a common way of looking at this group253. It seems to make perfect sense, as far as command structure, targets and means are not taken into account. As a matter of fact, due to the early maturity of military cyber-capabilities it is not perfectly clear where the differentiation between cyber-spying and cyber-combating might be. We expect this to change in the coming years. Coming back to the characteristics of this threat agent group, one has to note that there are interesting developments in this area in 2016279. In particular, for the first time we have seen a breach of massive state-sponsored tools256. This major event raises important questions in the cyber-security community, namely if the loss of high-end state-sponsored cyber-tools are equivalent to loss of heavy weapons. Should, for example, this loss have been caused by cyber-criminals, one might imagine any catastrophic impact following such event280. Another important development in this threat agent group regards a shift in their tactics: it seems that state-sponsored activities try to be as stealthy as possible regarding their tools and tactics. In other words, specially-crafted tools are used as less as possible to evade recognition of their trails and eventually attribution. Rather, off-the-shelf tools and methods are used, just as the ones used by cyber-criminals. In this way, and due to the low level of attribution, activities of these groups mingle with the vast cyber-crime mass and stay undetected. Moreover, it has been reported that often cyber-espionage attacks are contracted to other companies or other groups281,282,253. This this strategy generates risks for loss of powerful cyber-tools and leakage of top secret information (aka whistleblowing). Finally, one should mention in this respect alleged influence in election processes from state-sponsored actors: both in the
277 https://blog.sensecy.com/2016/09/21/opclosedmedia-hacktivists-target-the-media-sector/, accessed November 2016. 278 http://motherboard.vice.com/read/anti-isis-hacktivists-are-attacking-the-internet-archive, accessed November 2016. 279 https://www.ft.com/content/d63c5b3a-65ff-11e6-a08a-c7ac04ef00aa, accessed November 2016. 280 http://www.007.com/, accessed November 2016. 281 https://intelnews.org/2016/10/10/01-1990/, accessed November 2016. 282 https://theintercept.com/2016/10/24/darkmatter-united-arab-emirates-spies-for-hire/, accessed November 2016.

ENISA Threat Landscape Report 2016 Final version | 1.0 | OPSEC | January 2017
71
recent US election as well as future European elections, parties see the risk of influence through cyber-attacks283,284,285,286.
Cyber fighters are nationally or religiously motivated groups that have been assigned to aggressive, high capability campaigns287,288. Being led by ideological values, this group may move in the “grey zone” between activists, terrorists and cyber-spies and cyber-army. Fact is, that assessments assign to this threat agent group very high capabilities289; hackers from this group – and in particular from Syrian Electronic Army - belong to the most wanted cyber-threat agents by law enforcement agencies290. Allegations show that members of this threat agent group are distributed in the globe and ally to run their operations. Typical attack vectors of this group are denial of service, social engineering and phishing attacks. Their aim is to embarrass and deface media, but also governments, companies and banks. They are considered to be very active and very efficient in their campaigns291. Organisations that might consider themselves belonging to their targets may need to take strong security measures.
The recent terroristic attacks, the following media reports and international engagements against ISIS has move the focus of the cyber-security community to cyber-terrorism. Yet no known terroristic threat can be attributed to cyber-terrorists (named also cyber-jihadism), some hacker groups are considered acting with jihadist objectives, in many cases being openly pro IS. However, the term cyber jihad is supposed to include additional groups like al Qaeda, Boko Haram, etc. Given recent developments against ISIS, some cyber-security organisations have invested some efforts in assessing capability level and available tools292,293. Their activities are mainly concentrated in hacking, defacements and hijacking of social media accounts. As reported, in the reporting period ISIS cyber-terrorists have been located monitored and killed in Syria. This makes evident that national security services are tracking these individuals with high profile and high capability campaigns with the aim of their final elimination. Current assessments of cyber-terrorist capabilities show that they are using available anonymization tools and techniques, while some communication takes place in the dark web. To this extend, they possess “main stream” knowledge, while they are going along new IoT targets to intercept surveillance systems294. Another issue that may hinder them is the aversion of other fellow hackers to engage in jihad-motivated activities. Yet, by using “cyber-crime-as-a-service” they will be in the position to launch massive attacks against their targets.
There is certainly a category of threat agents that are copycats and/or hack for fun, or grudge. These are occasional actors with usually low capabilities, often covered by the threat agent group script kiddies. This is typically a low capability and low motivation group that exercises in their hacking capabilities. Just as any
283 http://freebeacon.com/national-security/clinton-email-server-hit-cyber-attacks-russians-hackers/, accessed November 2016. 284 http://www.spiegel.de/politik/ausland/hillary-clinton-und-der-email-hack-stecken-donald-trump-und-russland-dahinter-a-1116367.html, accessed November 2016. 285 https://www.theguardian.com/world/2016/nov/08/russian-cyber-attacks-could-influence-german-election-says-merkel, accessed November 2016. 286 http://www.fiia.fi/en/publication/628/election_hacking_in_democracies/, accessed November 2016. 287 https://en.wikipedia.org/wiki/Syrian_Electronic_Army, accessed November 2016. 288 https://www.facebook.com/Anonghost.officiel/, accessed November 2016. 289 https://community.hpe.com/t5/Security-Research/Understanding-the-Syrian-Electronic-Army-SEA/ba-p/6040559#.WC6xg3pjL-U, accessed November 2016. 290 http://thetechnews.com/2016/04/03/introducing-fbis-most-wanted-cybercriminals/, accessed November 2016. 291 http://www.zone-h.org/archive/notifier=AnonGhost?zh=1, accessed November 2016. 292 http://icitech.org/wp-content/uploads/2016/06/ICIT-Brief-The-Anatomy-of-Cyber-Jihad1.pdf, accessed November 2016. 293 https://www.flashpoint-intel.com/book/tech-jihad-dissecting-jihadists-digital-toolbox/, accessed November 2016. 294 http://securityaffairs.co/wordpress/53048/terrorism/isis-surveillance-cameras.html, accessed November 2016.

ENISA Threat Landscape Report 2016 Final version | 1.0 | OPSEC | January 2017
72
other of the low-capability threat agent groups, this one may become dangerous by using available information on tools, anonymization, attack methods, etc. Even more serious can be the activities of this group if they manage to use crime-as-a-service-offerings that are available in the dark market. Given current prices, quite some damage could be done by using their pocket money. Risk that can be surfaced by this target group is to unintentionally be associated with any operation related to cyber-terrorism and thus get engaged within the cyber-battlefield. As a final note: talented IT individuals are increasingly engaged in cyber-security challenges organised by various organisations and member states295. In such events, the interests of talented young hackers can be channelled to the right direction, by at the same time earning recognition and respect by their mates and by cyber-security community.
Concluding this chapter, we would like to deliver some comments regarding still very “foggy” areas of the cyber-threat landscape. For the sake of this discussion we call this cyber offenders and other ”grey zone” agents. With these terms we would like to focus reader’s attention to the following rather unknown parameters of threat agents:
While cyber-warfare has been announced as an activity area, it is not known if nation states engage in this area. Just very recently, UK was maybe the first state admitting involvement in a cyber-space military campaign296.
In the defender camp, skill shortage in cyber-security has been assessed long ago297. Nowadays, some nation states announce development of cyber-armies counting some thousands cyber-soldiers52. Surely, this development may lead to “cannibalism” effects in the corresponding job market. So one has to ask: is this “competition” on finding skills meaningful, or is it going to create some gaps in some fields of protection?
In many cases it is very difficult to recognise in which threat agent group an adversary belongs to. In some cases vivid movements from one group to the other may happen. Sure is, that if someone engages in some form of hacking, they will attract the attention of national security. Depending on the group, this might be detrimental for the related individual. Minors engaging in hacking should be informed about the risks of this “hobby” the earliest possible. Is the community aware of this?
Some of the above points are taken up in the conclusions of this report (see chapter 6.2).
Threat Agents and top threats The involvement of the above threat agents in the deployment of the identified top cyber-threats is
presented in the table below (see Table 1). The purpose of this table is to visualize which threat agent
groups are involve in which threats. This information is targeted towards stakeholders who are interested
in assessing possible threat agent involvement in the deployment of threats. This information might be
useful in identifying the capability level can be assumed behind the top threats and thus support in
decisions concerning the strength of the security controls that are implemented to protect valuable assets.
295 http://www.europeancybersecuritychallenge.eu/, accessed November 2016. 296 https://www.schneier.com/blog/archives/2016/10/uk_admitting_of.html, accessed November 2016. 297 http://www.informationweek.com/strategic-cio/security-and-risk-strategy/cyber-security-skills-shortage-leaves-companies-vulnerable/d/d-id/1326463, accessed November 2016.

ENISA Threat Landscape Report 2016 Final version | 1.0 | OPSEC | January 2017
73
THREAT AGENTS
Cyber-criminals
Insiders Nation States
Corporations Hacktivists Cyber-
fighters Cyber-
terrorists Script kiddies
Malware ✓ ✓ ✓ ✓ ✓ ✓ ✓ ✓
Web-based attacks
✓ ✓ ✓ ✓ ✓ ✓ ✓
Web application attacks
✓ ✓ ✓ ✓ ✓ ✓ ✓
Denial of Service ✓ ✓ ✓ ✓ ✓ ✓ ✓
Botnets ✓ ✓ ✓ ✓ ✓ ✓ ✓
Phishing ✓ ✓ ✓ ✓ ✓ ✓ ✓
Spam ✓ ✓ ✓ ✓
Ransomware ✓ ✓ ✓ ✓ ✓ ✓
Insider threat ✓ ✓ ✓ ✓ ✓
Physical manipulation /
damage / theft / loss
✓ ✓ ✓ ✓ ✓ ✓ ✓
Exploit kits ✓ ✓ ✓ ✓
Data breaches ✓ ✓ ✓ ✓ ✓ ✓ ✓ ✓
Identity theft ✓ ✓ ✓ ✓ ✓ ✓ ✓ ✓
Information leakage
✓ ✓ ✓ ✓ ✓ ✓ ✓
Cyber espionage ✓ ✓ ✓ ✓
Legend: Primary group for threat: ✓
Secondary group for threat: ✓
Table 1: Involvement of threat agents in the top cyber-threats
In this table we differentiate between threats that are typically deployed through a group (primary group of a threat) and threats that are secondarily deployed by a group. This differentiation is being graphically through the colours of the check symbols in the table (see also Legend in Table 1).

ENISA Threat Landscape Report 2016 Final version | 1.0 | OPSEC | January 2017
74
5. Attack Vectors
Introduction The deployment of the different cyber threats assessed in the previous chapters is done by the launch of one or more attack vectors. Specifically, an attack vector is a means by which a threat agent can abuse of weaknesses or vulnerabilities on assets (including human) to achieve a specific outcome. In the correct context, the study of the different steps performed on an attack vectors can provide valuable information about how cyber threats can be materialized.
These description of the workflow of the attacks are important pieces of information in order to have a better understanding of cyber threats and the tactics, techniques and procedures (TTP) followed by threat agent, and gives to defenders the opportunity to implement appropriate defences to eliminate vulnerabilities.
In this ETL four common attack vectors have been analysed, namely i) common ransomware attacks, ii) common attacks to breach data, iii) distributed Denial of Services (DDoS) attacks and iv) targeted attacks. These four attack types have been selected because they present prevailing and habitual scenarios where different threats and high capability threat-agents converge.
For each attack vector, we present a brief description, introducing the attack vector together with any remarkable fact or characteristic. Later, in order to develop specific countermeasures or controls to mitigate any particular part of the attack, we expose its details by enumerating, step by step, different procedures, methods or resources followed by the threat agent to accomplish the attack.
Since kill-chains provide a generic classification scheme which is helpful for a better understanding of the method of an attack and is widely used in the rest of the ETL reports, references to the kill chain nomenclature may be found during the different descriptions, in the same way references to recent events are provided during the exposition. Finally, relations with the top threats and involved threat agents linked with this specific attack vector are provided.
Common ransomware attacks The use of ransomware to perform large scale cyber extortion campaigns is increasing in the past years, “never before in the history of human kind have people across the world been subjected to extortion on a massive scale as they are today”298. The usual attack vector for cyber extortion using ransomware is the following:
Attackers gather a massive amount of emails address, it can be done in different ways, and they can be collected by the attacker from different sources including previous data leakages or can be purchased by different underground channels. In the case of targeting specific organizations, social engineering attacks can be done in order get specifics email addresses.
The attacker/s then creates a piece of malware focused on encrypting valuable information on the target, like documents, pictures or media files299. Most of the times, the encrypted information will be only possible to recover if the key is delivered by the attacker for that specific system. Sometimes, if the attacker does not have the needed knowledge to create the malware, is possible to obtain this
298 https://www.symantec.com/content/dam/symantec/docs/reports/istr-21-2016-en.pdf, accessed November 2016. 299 http://www.trendmicro.com/vinfo/us/security/news/cybercrime-and-digital-threats/ransomware-101-what-it-is-and-how-it-works, accessed November 2016.

ENISA Threat Landscape Report 2016 Final version | 1.0 | OPSEC | January 2017
75
piece of malware on demand (crimeware/malware as a service300). Malware gangs offers affiliation programs301 including all needed to perform ransomware activities.
The attacker will perform the distribution of the malware, usually using phishing campaigns. This phishing is crafted in a way (sometimes referring to package delivery information or an invoice) which can be attractive for “unaware” users. The email will contain either the malware itself or an URL leading to it.
Other usual vector for performing the distribution is injecting malicious code either in compromised sites or through malvertising 302to perform drive-by303or attacks using Exploit kits 304, which will check, redirect and exploit the victim’s system depending his operating system, browser and plugins installed.
Finally, if the infection is successful and the encryption is performed on the victim, information about the instructions for payment will be show to the user, in the recent times, ransomware relies on the use of TOR and Bitcoin for anonymity of the attacker activities and payment.
Lately, new malware are implementing new methods to force victims to pay305, including threaten the victim to make public encrypted if the payment is not received, making the extortion more effective.
Top Threats related:
Malware, Web-based attacks, Phishing, Ransomware, Exploit kits, Information leakage
Threat Agents involved:
Cyber Criminals, Script Kiddies
Common attacks to breach data A data breach is defined as “the intentional or unintentional release of secure or private/confidential information to an untrusted environment”306 . Usually, data breaches involves payment card information (PCI), personal health information (PHI), personally identifiable information (PII), trade secrets, or intellectual property. Attack vectors which may lead to a data breach scenario307 can be disparate and are usually performed as a multi-staged process:
Reconnaissance can be performed using different methods, usually the objective is to gather information about the target organization’s assets, either systems (searching for a vulnerability to exploit) or persons which can lead to a “first step” on the organization. For this purpose collection of
300 http://www.forbes.com/sites/kevinmurnane/2016/07/15/ransomware-as-a-service-being-offered-for-39-on-the-dark-net/#43fa4f0c302d, accessed November 2016. 301 https://blogs.sophos.com/2015/12/31/the-current-state-of-ransomware-ctb-locker/, accessed November 2016. 302 http://www.computerweekly.com/news/4500278672/Crypto-ransomware-lurks-in-ads-on-popular-websites, accessed November 2016. 303 https://heimdalsecurity.com/blog/wp-content/uploads/hs-How-a-drive-by-attack-happens.gif, accessed November 2016. 304 http://documents.trendmicro.com/images/TEx/articles/exploitkit-figure-1.jpg, accessed November 2016. 305 http://www.computerworld.com/article/3002120/security/new-ransomware-program-threatens-to-publish-user-files.html, accessed November 2016. 306 https://en.wikipedia.org/wiki/Data_breach, accessed November 2016. 307 https://securityintelligence.com/wp-content/uploads/2014/01/TargetBreachAnatomy-v3.png, accessed November 2016.

ENISA Threat Landscape Report 2016 Final version | 1.0 | OPSEC | January 2017
76
data can be obtained from public available sources, from underground markets308 or performing particular actions like scanning or social engineering.
Once the information is collected, the next step is the creation of an artefact to deliver or a payload to exploit a vulnerability on a specific system. Malware seems to be a common factor in different parts of the process in a data breach scenario: Can be found in the delivery together with social engineering or phishing309, performing automatic internal reconnaissance and spreading in the target network or during the actions on the objective by the exfiltration of information on the target systems310.
The delivery of the malware is usually performed through spear phishing or, in other cases, drive-by attacks. Recent malware pieces related with data breaches on Point of Sale devices (PoS) includes RAM Scrapping 311 functionalities for obtaining specific financial data from the infected devices.
Once inside the organization, different actions can be performed in order access sensitive systems: collecting different information for exploiting other vectors, including credentials, sniffing and lateral movement on the network, privilege escalation on the system.
The attacker can install or update other pieces of malware which can allow the remote command and control, data exfiltration or other actions on the objective.
Once the information is ex-filtrated, and depending on the motivation of the attacker, different actions have been seen. Information is often used to perform cyber extortions, especially if the information is sensitive or valuable, in other cases, is sold in underground markets or publicly released through different channels like P2P networks or pastebin.
It is worth mentioning that data breaches are sometimes used as a part of hybrids attacks in a more complex scenario 312which may be composed by data leakages, disinformation, denial of service attacks, coordinated social media campaigns and other actions313, usually in order to obtain financial, political or geostrategic revenues, examples are found in the past US presidential314 campaign or during the Ukrainian crisis315.
Relation with Threats:
Malware, Web-based attacks, Web application attacks, Botnets, Phishing, Insider threat, Exploit kits, Data breaches, Identity theft, Information leakage, Cyber espionage
Relation with Threat Agents:
308 https://www.symantec.com/connect/blogs/underground-black-market-thriving-trade-stolen-data-malware-and-attack-services, accessed November 2016. 309 https://www.washingtonpost.com/news/the-switch/wp/2016/03/01/the-human-problem-at-the-heart-of-snapchats-employee-data-breach/, accessed November 2016. 310 http://researchcenter.paloaltonetworks.com/2015/10/understanding-and-preventing-point-of-sale-attacks/, accessed November 2016. 311 https://nakedsecurity.sophos.com/2013/07/16/a-look-at-point-of-sale-ram-scraper-malware-and-how-it-works/, accessed November 2016. 312 https://www.wired.com/2016/11/real-hacker-threat-election-day-data-deception-denial/, accessed November 2016. 313 http://europolity.eu/wp-content/uploads/2016/07/Vol.-10.-No.-1.-2016-editat.7-23.pdf, accessed November 2016. 314 https://www.theguardian.com/technology/2016/nov/16/wikileaks-elections-hackers-surveillance-technology, accessed November 2016. 315 https://advox.globalvoices.org/2016/05/11/ukrainian-activists-leak-personal-information-of-thousands-of-war-reporters-in-the-donbas/, accessed November 2016.
ENISA Threat Landscape Report 2016 Final version | 1.0 | OPSEC | January 2017
77
Cyber Criminals, Insiders, Nation States, Corporations, Hacktivist, Cyber Terrorists
Distributed Denial of Services (DDoS) attacks The most common scenario of a DDoS attacks are normally performed by different devices against one or many specific targets, in many cases these systems were previously infected with malware through different methods like phishing campaigns or exploit kits316 and controlled remotely, being able to perform orchestrated actions on demand, somehow, DDoS can be considered, as “actions on objectives” for other attacks vector, however, we can distinguish a common pattern which may lead to a DDoS attacks.
In the case of recent IoT DDoS 317 the use of crawlers (Shodan318) and network scanners are common techniques of reconnaissance to find systems with a particular vulnerability or with default passwords which can be easy to abuse. In the same way, in amplification attacks, such DNS319 and NTP320, a previous scanning of big IP address range is performed to explore for systems that can be used for this concrete matter, however, no compromised devices are needed, improperly configured services are used instead to perform specially crafted requests which can lead to massive responses to a target.
Once the target is located and exploited, malware321 is usually installed on the device in order to allow the attacker to perform remote actions, for example in the recent case of Mirai botnet322, reconnaissance, exploitation and spreading were performed automatically on different IoT systems, such IP webcams, home routers or DVRs, using a table of more than 60 common factory default usernames and passwords.323
Once compromised, the malware establish communication with the control server (C2) and is able then to perform different actions remotely. In the specific case of amplification attacks, no control server is needed, the attacker just send a specially forged request to the previously collected list of misconfigured devices. However, the attacker can use a botnet of compromised devices to increase the number of spoofed requests, drastically boosting the volume of traffic directed at the targeted server.
Attackers normally use a botnet, or even rent one for a particular purpose or campaign using underground forums and often, cybercriminals perform extortions to organizations or companies324 threatening to execute Denial of Service actions325 . Is common to receive a small attack or evidence as a “demonstration of power” by the attackers followed by an email with their demands326 and the way of payment.
316 http://www.trendmicro.com/vinfo/us/security/definition/exploit-kit, accessed November 2016. 317 https://threatpost.com/bashlite-family-of-malware-infects-1-million-iot-devices/120230/, accessed November 2016. 318 http://arstechnica.com/security/2016/01/how-to-search-the-internet-of-things-for-photos-of-sleeping-babies/, accessed November 2016. 319 https://www.incapsula.com/ddos/attack-glossary/dns-amplification.html, accessed November 2016. 320 https://www.incapsula.com/ddos/attack-glossary/ntp-amplification.html, accessed November 2016. 321 https://www.incapsula.com/blog/malware-analysis-mirai-ddos-botnet.html, accessed November 2016. 322 http://searchsecurity.techtarget.com/news/450401962/Details-emerging-on-Dyn-DNS-DDoS-attack-Mirai-IoT-botnet, accessed November 2016. 323 https://en.wikipedia.org/wiki/Mirai_%28malware%29, accessed November 2016. 324 http://www.computerworlduk.com/security/story-of-ddos-extortion-attack-how-one-company-decided-take-stand-3642016/, accessed November 2016. 325 http://www.computerworld.com/article/3061813/security/empty-ddos-threats-deliver-100k-to-extortion-group.html, accessed November 2016. 326 http://www.ibtimes.co.uk/armada-collective-hackers-launch-bitcoin-extorting-ddos-attacks-unwitting-victims-1579789, accessed November 2016.

ENISA Threat Landscape Report 2016 Final version | 1.0 | OPSEC | January 2017
78
Recent DDoS attacks using (Internet of Things) IoT devices327 and affecting different Internet services328 has exposed how this threat can be easily used to perform devastating actions on specific objectives, including basic Internet infrastructure329. Even though some of these compromised devices are not powerful in term of processing, they can generate massive amounts of bogus traffic330 to swamp targeted servers.
Relation with Threats:
Malware, Web-based attacks, Web application attacks, Denial of Service, Botnets
Relation with Threat Agents:
Cyber Criminals, Nation States, Hacktivist, Cyber terrorists, Script Kiddies
Targeted attacks Targeted attacks are malicious attacks that are aimed to a specific individual, company, system or software based on some specific knowledge regarding the target, as a particular example, APT331 (advanced persistent Threat) can be considered a complex targeted attack. Targeted attacks, unlike other attacks, are not widespread which make it more difficult to detect and contain, is common the creation of campaigns for specific objectives, designed to compromise a target infrastructure. Attack vector on targeted attacks uses to:
Threat agents, as a first step, identify, collect and gather available information, public or by other channels about the target organization. This information can range from emails address to application and software used or websites most visited. Sometimes, attackers uses social engineering techniques to obtain valuable information332, even contacting directly to the organization or through previous identified key stakeholders. The target is the creation of more convincing artefacts, identify possible vulnerable application or the identification of key person to perform the delivery.
With this information, threat agents can create a plan of action specific for that target and proceeds to create specially crafted artefacts. It could include customized phishing and malware, exploits for specific systems.
In targeted attacks is common the use of watering holes attacks 333 as a delivery method: Compromising the most common visited sites for the target (organization or individual) in order to be able to perform drive-by attacks which can lead to the victim browser exploitation. Sometimes this technique is combined with the use of zero days exploits.
327 http://www.welivesecurity.com/2016/10/24/10-things-know-october-21-iot-ddos-attacks, accessed November 2016. 328 http://www.pcworld.com/article/3133847/internet/ddos-attack-on-dyn-knocks-spotify-twitter-github-etsy-and-more-offline.html, accessed November 2016. 329 http://searchsecurity.techtarget.com/news/450401962/Details-emerging-on-Dyn-DNS-DDoS-attack-Mirai-IoT-botnet, accessed November 2016. 330 http://securityaffairs.co/wordpress/51726/cyber-crime/ovh-hit-botnet-iot.html, accessed November 2016. 331 http://documents.trendmicro.com/images/TEx/articles/targeted-attack-stages.jpg, accessed November 2016. 332 http://www.itbusiness.ca/wp-content/uploads/2011/12/symantec.jpg, accessed November 2016. 333 https://en.wikipedia.org/wiki/Watering_hole_attack, accessed November 2016.

ENISA Threat Landscape Report 2016 Final version | 1.0 | OPSEC | January 2017
79
Other sophisticated attacks can use infected media for circumvolving external network defences or for penetrating in to airgaps334, and supply chains attacks 335 336
If the execution of the code Is performed successfully on the victims system, the malicious artifact performs the installation of additional malware, usually by downloading from a remote site and subsequently stablishing a communication channel with the adversary (command and control) in order to perform different actions on objective (data exfiltration, lateral movement, obtaining company information)
In some cases, capabilities and the high degree of planning, knowledge, orchestration and resources, this kind of attacks are usually attributed to threat actors not related with cybercrime. Due to the duration (is usual that this kind of attacks remains undetected for log time) and the expected low economical revenue of the attack, it is assumed that only state sponsored espionage can sustain an attack of this nature.
Relation with Threats:
Malware, Web-based attacks, Web application attacks, Botnets, Phishing, Insider threat, Exploit kits, Data breaches, Identity theft, Information leakage, Cyber espionage
Relation with Threat Agents:
Cyber criminals, Insiders, Nation States, Corporations, Hacktivists, Cyber Fighters, Cyber terrorists, Script kiddies
334 https://securelist.com/analysis/publications/75533/faq-the-projectsauron-apt/, accessed November 2016. 335 https://en.wikipedia.org/wiki/Supply_chain_attack, accessed November 2016. 336 https://1.bp.blogspot.com/-KrWEjffgbgM/V4ZzHftbVgI/AAAAAAAAAIo/O962UNy7e1EPhjG2NRsqZNriVQT8so2hACLcB/s1600/777.png, accessed November 2016.

ENISA Threat Landscape Report 2016 Final version | 1.0 | OPSEC | January 2017
80
6. Conclusions
Main cyber-issues ahead This chapter summarizes the most salient issues from this year’s cyber-threat landscape. It is a collection of issues that - according to their significance but also the potential consequences they may have in the cyber-space - will challenge the cyber-security community in the coming months/year in various degrees of intensity. Though some causality can be found behind the sequence of the points below, no prioritisation or ranking has been applied. Each issue has been subsumed by means of few words that try to summarize the topic (in bold).
Cyber-mediatic vs. cyber-silent: Just as in previous assessments, in the reporting period we have seen a lot of headlines on cyber-matters, mostly security incidents. Knowing since some time now the role of media, one might expect that adversaries may also “misuse” them with the aim to attract the attention of the public to the wrong direction. The reason is simple: in attack tactics smoke-screening is an important, yet effective technique. Behind “mediatic” attacks, there might be some hidden objective such as attacks on the real target, whereas the front-side attack has just a deceptive character. The appetite of media for any type of cyber-attack is quite big, however, media may contribute in achieving a negative effect: “The Shepherd Boy and The Wolf”337 – effect. Users will become disinterested about or get used to media reports on cyber-threats and will disregard their real risk exposure338. This is the worst thing that can happen in the cyber-protection battle.
Maliciously augmented reality: Main question of any miscreant is how to affect reality280. In 2016 we have seen a series of such attempts, in most cases trying to affect the US elections, allegedly launched through cyber-operations283,284,339,286. Though this is not the first attempt to manipulate reality through virtual artefacts340, this is a very new development in cyber-scape341. The fact that there has been an attempt to affect political developments in democracies is a quite scary scenario. The cyber-community is quite alerted by this development. It is apparent that cyber-attacks now include multiple layers, that is, they affect more than one channels. In this year, these attacks have included hacking, leakage and media influences. And the achieved results are impressive. Facebook has reacted by announcing their attempt to stop fake news342. Given the potential role of both cyber-criminals and state sponsored actors with regard to multi-level cyber-attacks, one can easily understand the impact and range of this attack type may achieve in the future. It is expected that this matter will be taken up very soon by governmental/security organisations and digital service providers alike.
337 http://www.english-for-students.com/The-Shepherd-Boy-and-The-Wolf.html, accessed November 2016. 338 https://www.weforum.org/agenda/2016/11/moving-beyond-fear-uncertainty-and-doubt, accessed November 2016. 339http://www.slate.com/blogs/the_slatest/2016/09/28/fbi_says_it_has_detected_more_attempts_to_hack_voter_registration_systems.html, accessed November 2016. 340 http://www.manufacturing.net/news/2015/06/report-russian-internet-trolls-behind-louisiana-chemical-explosion-hoax, accessed November 2016. 341 https://bobsullivan.net/election2016/scientists-have-evidence-that-hackers-cost-hillary-the-election-wrong-our-election-process-really-really-wrong/?utm_source=BobSullivan.net&utm_campaign=3a193217e5-RSS_EMAIL_CAMPAIGN&utm_medium=email&utm_term=0_edc212b71b-3a193217e5-198020001, accessed November 2016. 342 http://www.zdnet.com/article/facebooks-zuckerberg-details-plan-to-stop-fake-news/, accessed November 2016.

ENISA Threat Landscape Report 2016 Final version | 1.0 | OPSEC | January 2017
81
Break spiral of breaches: Data breaches increase, because cyber-criminals are becoming more successful with their campaigns. But when the breached data contains identity information, it is being used to breach more data. And this data contains more identity information and so on. The vicious cycle of data breach is a spiral that is being constantly enlarged. This inherently leads to a bigger gap between time to compromise and time to detect216. Given that attribution is difficult, defenders might need to concentrate on taking down of market places selling breached data and disrupt other means of dissemination of this information. At the same time, the maturity level of security management will need to be increased, especially for low capability user groups.
What is a cyber-weapon? One can easily imagine the impact of breaking into a military depot and stealing weapons. It would be very high, in particular if those weapons are of high destruction power. Is such an event comparable with the loss of cyber-tools used by a national security organisation343? What is the impact of such a loss, especially given the fact that the software can be endless copied and fall in the hands of cyber-criminals? Is a 1TB DDoS attack-capability a cyber-weapon? These questions are extremely important and extremely relevant for the cyber-security and national security community. Such a discussion would need to embrace a variety of players, both within and outside the cyber-space. Apparently, discussion with similar content are currently taking place within an international agreement for security that has been originally initiated to control conventional weapons and munition movement world-wide344. Albeit cyber-security has been added to this agreement, it has to be recognized that this amendment is an expedient action, as cyber would deserve an own context that goes definitely beyond conventional weapons. This discussion should also embrace vulnerabilities: in the reporting period we have seen quite a few cases of commercially offered tools that were based on zero-day vulnerabilities258,260. Remarkably, tools abusing zero-day vulnerabilities have been sold to rogue actors. The international community will need to search for mechanisms controlling zero-day vulnerabilities.
Executive’s toolbox: The issue of interfacing CTI with executive management is at very early maturity steps. Moreover humans - and in particular decision makers - have often wrong impressions about actual risk exposure and risk perception. This attitude can be costly (i.e. overestimation of risks) and dangerous (under-estimation of exposure). In the reporting period, some extensive discussions regarding the interconnection of CTI with enterprise risk management have taken place22. In some working engagements, we have assessed that an international organisation works on the feasibility assessment for boardroom tools related to threat and risk management345 (based on the work of a consulting company346). It is believed that the inclusion of actionable advice and cyber-threat inclusive information at the board-level is imperative. It is going to be an enabling factor towards the critical process of company/product digitization (e.g. paying attention to these issues mentioned here347).
Implementation of quick-wins: This year’s assessment has shown that there are still some cyber-threats where user awareness could significantly reduce exposure; relevant training would achieve a massive reduction of incidents (expected to be over 50%). Quick wins through awareness, especially regarding phishing, ransomware, insider threat and physical manipulation/damage/loss/theft are lagging behind feasible implementation levels. Though guidance and good practices do exist, there is no systematic means of getting this knowledge to end-users. It seems that a better “packaging” and better dissemination of
343 http://arstechnica.com/security/2016/08/code-dumped-online-came-from-omnipotent-nsa-tied-hacking-group/, accessed November 2016. 344https://en.wikipedia.org/wiki/Wassenaar_Arrangement, accessed November 2016. 345 https://www.weforum.org/, accessed November 2016. 346 https://www2.deloitte.com/content/dam/Deloitte/uk/Documents/technology/deloitte-uk-cyber-risk.pdf, accessed November 2016. 347 https://shift.newco.co/the-end-of-tech-companies-b093e82d1118#.n8hv7syc8, accessed November 2016.
ENISA Threat Landscape Report 2016 Final version | 1.0 | OPSEC | January 2017
82
these practices may improve the situation, especially for stakeholders with low capabilities, including consumers.
Hunting cyber-security experts: Cyber-security and in particular CTI is currently booming. New types of organisations from the area of military come to complete the picture of big white-hat cyber-players. Yet the question is how to fill the gap in cyber-security and cyber-threats skills. Is the enlargement of cyber-warfare going to affect other, commercial areas? This is a difficult question given that already today, a wide grey area does exist among cyber-crime, cyber-warfare, cyber-espionage, vendors, researches and other commercial organisations. Here, we see actors changing camps, while official vendors may be occupied by rogue customers. Given the huge turnover of cyber-crime, investments may go to any direction, including legitimate companies. At the same time it is not foreseeable what forces will be released in the relevant market if – for example – in an EU member state like Germany the military operations will be enlarged with ca. 13.000 cyber-soldiers52,348. The cyber-security community will need to be in tight contact in order to avoid “cannibalization”/distortion effects with regard to available skills.
Security vs. privacy revamped: We see a race between the ones who want privacy, e.g. encryption, and the ones that want security through surveillance. In 2016, there is evidence that the privacy vs. national security battle is as uncertain as never before. Various states tend to develop own interpretations on how cyber-security and surveillance will be implemented in order to ensure national security349. Nonetheless, having different encryption and privacy regulations, new encryption “legislation geographies” are created. Citizens on the move within these areas may find their compliance status changing. This is a similar situation as older generations have experienced when strong encryption was restricted in the US by law350. Given that ca. half of the internet traffic is already encrypted, national security sees this as an increasing obstacle in gaining intelligence from data communications. At the same time, states and industry work on censorship functions and on control of massive traffic streams/bandwidths. And political developments show a trend towards de-globalization. This may lead to control centres of big parts of the internet. Such entities may be in the position to exert their power to all nations and individuals who have caused this traffic351. The tension created by this diverging development will certainly bother the cyber-security community in the future.
Weak security for commerce: But also emerging commercial interests demonstrate willingness to rather weaken cyber-security and privacy352. The existence of heterogeneity in security and privacy regulations is seen as an obstacle for service provisioning crossing geographical borders. Big players in the area of digital service provisioning have an inherent interest to deploy unified products without having to cover all privacy requirements in target markets. If seen in conjunction with the influence of lobbyists in central governmental structures353, it becomes apparent that the pressure on strong security and privacy standards, at least in Europe, will increase in the near future.
348 http://www.defensenews.com/story/defense/international/europe/2016/04/27/germany-cyber-it-armed-forces-military-branch/83590028/, accessed November 2016. 349 https://www.theguardian.com/world/2016/nov/19/extreme-surveillance-becomes-uk-law-with-barely-a-whimper, accessed November 2016. 350 https://en.wikipedia.org/wiki/Export_of_cryptography_from_the_United_States, accessed November 2016. 351 http://www.iisp.gatech.edu/sites/default/files/documents/2017_threats_report_finalblu-web.pdf, accessed November 2016. 352 http://www.spiegel.de/wirtschaft/soziales/tisa-leaks-wie-das-dienstleistungsabkommen-den-datenschutz-gefaehrdet-a-1122844.html, accessed November 2016. 353 https://lobbyfacts.eu/, accessed November 2016.

ENISA Threat Landscape Report 2016 Final version | 1.0 | OPSEC | January 2017
83
Digital divide and cyber-security: Preparedness to share personal data for free declines (50% according to351). This has been observed for users of digital services and corresponds to privacy awareness efforts of governments and consumer organisations. At the same time, the new form of Digital Divide354, shows a gap between online habits of poor and rich: disadvantaged individuals spend more time online than the advantaged ones. And while advantaged individuals use the internet in an explorative manner, the disadvantaged use it as a game and a means to develop themselves socially. This habit leads to higher risks with regard to privacy and security matters and it thus makes disadvantaged individuals more vulnerable to malicious intents in cyber-space. It is expected that reduction of the new form of Digital Divide will need to include security awareness measures.
Mutation of badware: We have seen significant change in attack tactics, especially if seen in a depth of 2-3 years. This can be observed at the example of ransomware: available functions of the malware can be mingled in different attack vectors351. If different motives than monetization are considered, it became apparent that other combinations may be used, for example as sabotage act, service interruption, etc. And besides ransomware, there are several functions available in the internet (including dark web) to craft a variety of attacks. The copy-paste campaign254 has demonstrated the efficiency and potential of this sort of new misuse cases. Though currently there is not much that can be done to hinder this, innovative approaches using AI techniques could help in development of new countermeasures. It is believed that AI in general is a promising approach to cyber-security355.
Elaboration of end-user related modus operandi: There are some attacks targeting end-users by cyber-criminals such as ransomware. Some more complex, yet high-impact threats such as bullying and grooming, defacement and fake news are being launched by using cyber-space tools. Given that end-users are often not in the position to surface such threats, it should be interesting to study those by means of CTI and develop end-user related modus operandi. Available information on these threats should be integrated to this cyber-threat intelligence to build up comprehensive, end-to-end descriptions of this kinds of misuse. Such information should then be disseminated to related multiplier organisations with the objective to reach target audience.
Conclusions For yet another year, the cyber-threat landscape has unfolded its full dynamics and has raised numerous issues and matters for consideration in the near future. Both derived from the above issues but also from the assessments of individual cyber-threats, we summarize below the main conclusions drawn from the performed assessment. We divide our conclusions in three different areas to roughly indicate their relevance to policy, business and research, knowing that this classification is not fully free of overlaps.
Policy conclusions
Establishment of liaisons and performance of discussions with CTI stakeholders including vendors, national security organisations, defence and social partners on cyber-security in general and cyber-threat intelligence in particular.
Based on available CTI, investigate/expand current view of minimum/baseline security requirements for various areas of infrastructure, according to sectors, types of services, types of users, etc. It is very important to take into account low capability actors like for example minors ageing population and disadvantaged individuals.
354 https://www.linkedin.com/pulse/new-digital-divide-emilio-mordini, accessed November 2016. 355 http://cacm.acm.org/magazines/2016/5/201590-cybersecurity-gets-smart/fulltext, accessed November 2016.
ENISA Threat Landscape Report 2016 Final version | 1.0 | OPSEC | January 2017
84
Revival of discussions regarding coexistence and balance between privacy and national (cyber-) security. Include the view of both commercial and state actors and apply achieved results to treaties/arrangements governing international cooperation initiatives.
Continue and amplify engagements in the area of security training, dissemination of good practices and awareness raising, skill development as well as youth engagement and challenges.
Promote the dissemination of good practices and standards to facilitate the use of common patterns for CTI and engage with CTI providers to disseminate available use cases.
Capitalize on the leading role of Europe in security and privacy towards further development as competitive advantages. In the time of the globalization of service provisioning, this may help EU digital services to reach wider customer bases, thus boosting economic development.
Consider issues presented in the previous section and find out interesting areas that might be relevant to national policy activities.
Proceed with discussion on the matter of vulnerability management with focus on zero-day vulnerability discovery, marketing of products that zero-day vulnerabilities, disclosure of vulnerabilities, etc.
Business conclusions
Use available good practices and standards in the collection, analysis, structuring and dissemination of CTI.
Use CTI as an active tool to simulate cyber threats and attacks with the objective to test available protection measures. Use this approach as an example to create different “protection landscapes”, that is, assessed protection schemes that best mitigate current threats.
Define read-team activities based on CTI and create tool and procedural models as good practices to facilitate the work of such teams.
Use CTI and related artefacts (e.g. tools, methods, etc.) to reduce expenses of certification and compliance efforts through continuous improvement of available controls.
Based on CTI, investigate approaches leading to a more “agile” security approach that takes into account risk management and interplay with security architecture.
Invest in the identification of modus operandi for various sectors. This information should be neutralized from competitive information in order to be shared within stakeholders of a single sector.
Development of active-defence models in cooperation with various stakeholders in the area of cyber-defence, e.g. national security centres, law enforcement, military, etc.
Development of tools for the board-room that contain CTI information, together with current risk and protection landscapes.

ENISA Threat Landscape Report 2016 Final version | 1.0 | OPSEC | January 2017
85
IoT security is an important issue that needs to be integrated in developed products by design. Innovative products in this area may have great chances to win big parts of the still immature market356.
Research conclusions
Definition of research roadmaps for AI in cyber-threat intelligence. This could include (but not restricted to) attack pattern recognition and knowledge discovery and enrichment of cyber-threat context.
Development of security models based on agility/dynamics of cyber-threats. This should also include the use of cyber-threat intelligence to assess efficiency and performance of implemented security controls.
Research in new innovative security controls towards development of trust between components but also users, eventually based not only on “something you know” and “something you possess”, but also “something you are”.
Study of malicious functions/code towards understanding issues such as evolution, level of impact and complexity/sophistication, availability, attribution, etc.
Development of methods for the identification and sharing of Modus Operandi without disclosing competitive information.
Elaboration of asset based cyber-threat intelligence including various use cases.
Develop models to further detail methods, tools and techniques for active defence.
356 http://www.bitdefender.com/box/, accessed November 2016.

ENISA European Union Agency for Network and Information Security Science and Technology Park of Crete (ITE) Vassilika Vouton, 700 13, Heraklion, Greece
Athens Office 1 Vasilissis Sofias Marousi 151 24, Attiki, Greece
PO Box 1309, 710 01 Heraklion, Greece Tel: +30 28 14 40 9710 [email protected] www.enisa.europa.eu
ISBN: 978-92-9204-202-8 ISSN 2363-3050 DOI: 10.2824/92184
TP-AE-16-001-EN-N