Landscape and chronology
9
19 — 2 Landscape and chronology J.P. Kleijne & H.J.T. Weerts 2.1 Geological development of the Bergen tidal basin The Mienakker site is situated in a former tidal basin, known as the Bergen tidal basin.16 This basin developed when from the Early Holocene onwards a large incised valley drowned due to sea-level rise. This was the former Rhine valley, which was abandoned by the Rhine around 40,000 BP.17 Aſterwards, a smaller river flowed through this valley, fed mainly by the Vecht river (Fig. 2.1). Since sea-level rise was rapid in the first half of the Holocene, almost the entire western part of the Netherlands drowned and changed from sandy Pleistocene landscapes to tidal basins one of which is the Bergen tidal basin (Fig. 2.2). Due to its low-lying Pleistocene topography, the Bergen valley was the first to drown.18 Around 4000 BC, global sea-level rise stopped because the ice masses above North America and Scandinavia had completely melted. For the Netherlands, however, relative sea-level (RSL) rise continued because the Netherlands is subsiding due to glacio-isostatic adjustment and its structural geology.19 If the land subsides at a given location while global sea level remains constant, RSL continues to rise there. RSL rise proceeded slowly in the Netherlands. Because sediment input to the coastal zone from the North Sea by marine currents and wave action and fluvial input by the Rhine exceeded RSL rise, the coast started to prograde from 4000 BC onward, despite the slow rising RSL.20 Successively, the tidal inlets closed and beach ridges with small dunes formed in a westward direction along the North Sea coast. The Bergen inlet was the last to close because here the volume to be filled was largest and it was furthest away from the sediment sources. Around 3200 BC the Bergen tidal basin was still in existence, but it had almost completely silted up to form a salt marsh, dissected by several tidal creeks (Fig. 2.3). The highest parts of this salt marsh were only flooded during storms and spring tides. To the northwest and southwest, habitable beach ridges existed near the coast. Even further to the north, high Pleistocene grounds cropped out where Texel and Wieringen are now situated. In the salt marsh itself, the levees along the tidal creeks were aractive habitable areas (Fig. 2.4). Further away from the tidal creeks, peat started to form. For some time, this dynamic landscape was an aractive region for prehistoric man. Several very different landscapes existed close to each other. Food supply, from both animals and plants, was rich and diverse and living conditions were generally dry. Finally, the Bergen inlet closed around 1500 BC.21 Due to the ever-rising sea level, the water table also continued to rise. Peat formation continued and eventually the entire region was covered by peat and deserted. 2.2 Mienakker landscape and chronology 2.2.1 The local landscape The Mienakker site was situated in this dynamic tidal landscape. Borehole survey in the 1980s and 1990s resulted in a detailed picture of the local palaeogeography.22 The site at Mienakker is situated on a small levee between two small tidal creeks. The topography of the site is mainly influenced by the location and development of these tidal creeks. Before habitation commenced, a large tidal channel existed in the area. This resulted in the formation of high levees in the wider landscape around Mienakker.23 Some time aſter the channel silted up, a washover fan covered the site during a flood event.24 This fan covered the pre-existing landscape, resulting in a gently sloping landscape of depressions and former creek beds. Two small washover channels remained open in this landscape. They were connected to the larger tidal channel, thereby creating open water transport routes between the coast and the hinterland (Figs. 2.5 and 2.6). People seled on the levees along these channels during later Neolithic times (Fig. 2.7). In the washover salt marsh a complex mosaic of both saltwater and freshwater zones developed and peat started to accumulate. This is shown in the vegetation distribution as illustrated by the analysis of pollen, charcoal and macro-remains and by the analysis of molluscs.25 16 Also known as the North Holland basin, see also Smit 2012. 17 Busschers et al. 2007. 18 Beets & Van der Spek 2000. 19 Weerts 2013. 20 Beets & Van der Spek 2000. 21 De Mulder & Bosch 1982, 146; Westerhoff, De Mulder & De Gans 1987, 87. 22 Lenselink 2001b. 23 Lenselink 2001b, 127, Fig. 5e. 24 Lenselink 2001b, 128, Fig. 5f. 25 For pollen analysis see Van Smeerdijk 2001; for mollusc analysis see Kuijper 2001; for charcoal analysis see Brinkkemper & Van den Hof, this volume; for macro-botanical analysis see Kubiak-Martens, this volume.
Transcript of Landscape and chronology

19—
2 Landscape and chronology J.P. Kleijne & H.J.T. Weerts
2.1 Geological development of the Bergen tidal basin
The Mienakker site is situated in a former tidal basin, known as the Bergen tidal basin.16 This basin developed when from the Early Holocene onwards a large incised valley drowned due to sea-level rise. This was the former Rhine valley, which was abandoned by the Rhine around 40,000 BP.17 Afterwards, a smaller river flowed through this valley, fed mainly by the Vecht river (Fig. 2.1).
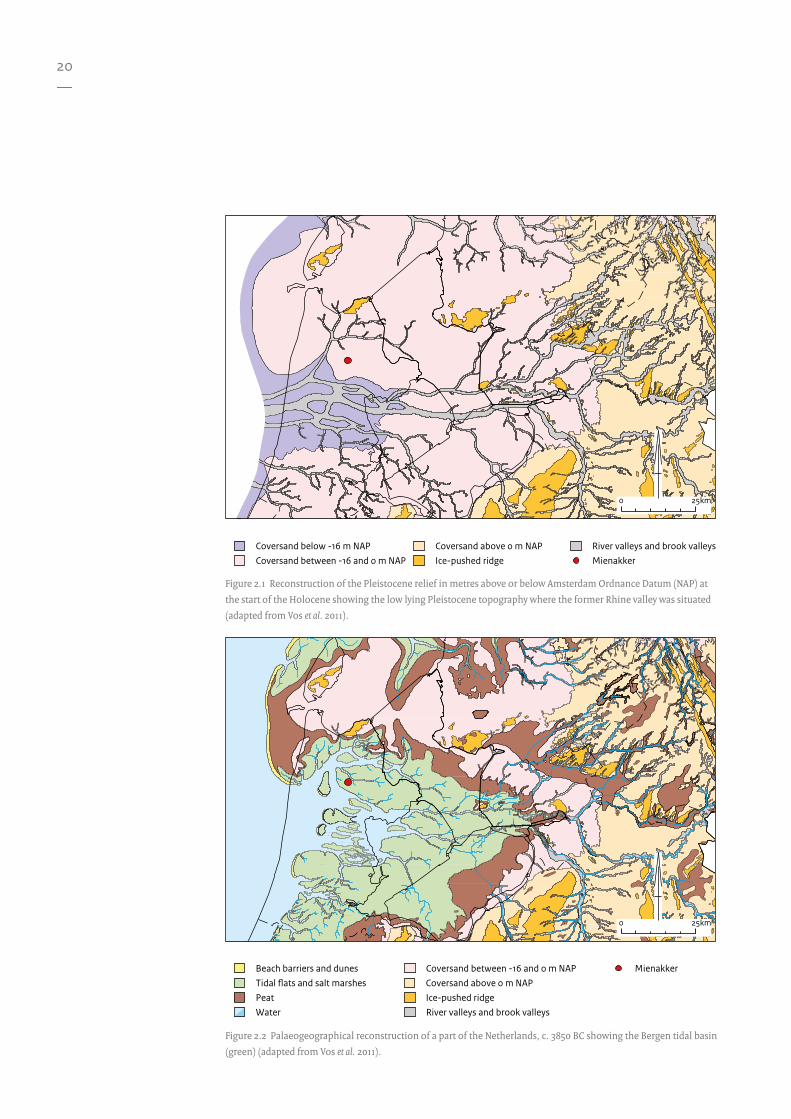
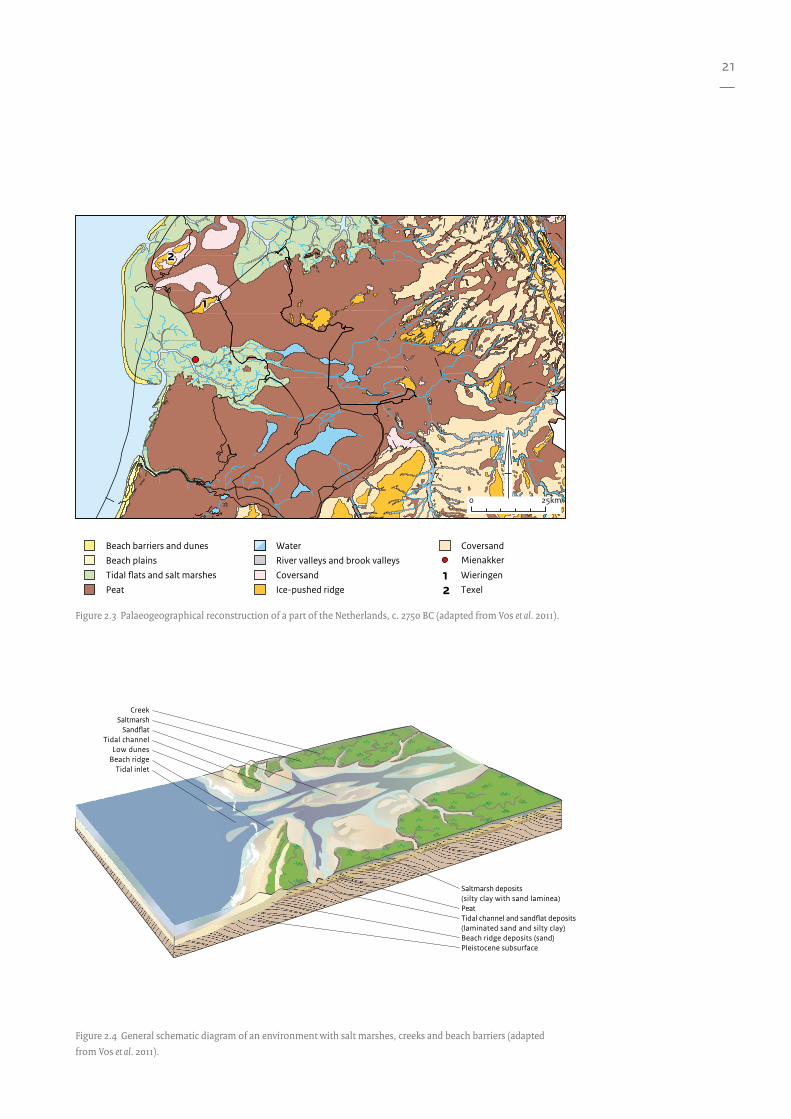
Since sea-level rise was rapid in the first half of the Holocene, almost the entire western part of the Netherlands drowned and changed from sandy Pleistocene landscapes to tidal basins one of which is the Bergen tidal basin (Fig. 2.2). Due to its low-lying Pleistocene topography, the Bergen valley was the first to drown.18 Around 4000 BC, global sea-level rise stopped because the ice masses above North America and Scandinavia had completely melted. For the Netherlands, however, relative sea-level (RSL) rise continued because the Netherlands is subsiding due to glacio-isostatic adjustment and its structural geology.19 If the land subsides at a given location while global sea level remains constant, RSL continues to rise there. RSL rise proceeded slowly in the Netherlands. Because sediment input to the coastal zone from the North Sea by marine currents and wave action and fluvial input by the Rhine exceeded RSL rise, the coast started to prograde from 4000 BC onward, despite the slow rising RSL.20 Successively, the tidal inlets closed and beach ridges with small dunes formed in a westward direction along the North Sea coast. The Bergen inlet was the last to close because here the volume to be filled was largest and it was furthest away from the sediment sources. Around 3200 BC the Bergen tidal basin was still in existence, but it had almost completely silted up to form a salt marsh, dissected by several tidal creeks (Fig. 2.3). The highest parts of this salt marsh were only flooded during storms and spring tides. To the northwest and southwest, habitable beach ridges existed near the coast. Even further to the north, high Pleistocene grounds cropped out where Texel and Wieringen are now
situated. In the salt marsh itself, the levees along the tidal creeks were attractive habitable areas (Fig. 2.4). Further away from the tidal creeks, peat started to form. For some time, this dynamic landscape was an attractive region for prehistoric man. Several very different landscapes existed close to each other. Food supply, from both animals and plants, was rich and diverse and living conditions were generally dry. Finally, the Bergen inlet closed around 1500 BC.21 Due to the ever-rising sea level, the water table also continued to rise. Peat formation continued and eventually the entire region was covered by peat and deserted.
2.2 Mienakker landscape and chronology
2.2.1 The local landscape
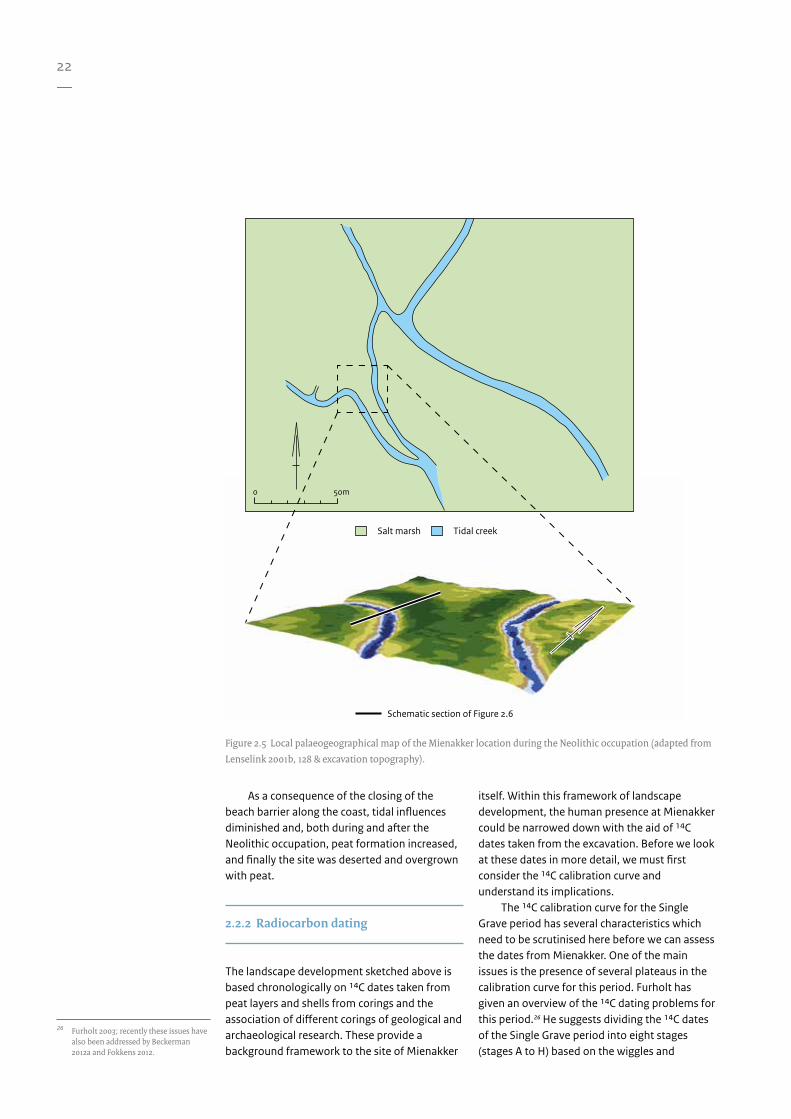
The Mienakker site was situated in this dynamic tidal landscape. Borehole survey in the 1980s and 1990s resulted in a detailed picture of the local palaeogeography.22 The site at Mienakker is situated on a small levee between two small tidal creeks. The topography of the site is mainly influenced by the location and development of these tidal creeks. Before habitation commenced, a large tidal channel existed in the area. This resulted in the formation of high levees in the wider landscape around Mienakker.23 Some time after the channel silted up, a washover fan covered the site during a flood event.24 This fan covered the pre-existing landscape, resulting in a gently sloping landscape of depressions and former creek beds. Two small washover channels remained open in this landscape. They were connected to the larger tidal channel, thereby creating open water transport routes between the coast and the hinterland (Figs. 2.5 and 2.6).
People settled on the levees along these channels during later Neolithic times (Fig. 2.7). In the washover salt marsh a complex mosaic of both saltwater and freshwater zones developed and peat started to accumulate. This is shown in the vegetation distribution as illustrated by the analysis of pollen, charcoal and macro-remains and by the analysis of molluscs.25
16 Also known as the North Holland basin, see also Smit 2012.
17 Busschers et al. 2007.18 Beets & Van der Spek 2000.19 Weerts 2013. 20 Beets & Van der Spek 2000.21 De Mulder & Bosch 1982, 146; Westerhoff,
De Mulder & De Gans 1987, 87.22 Lenselink 2001b. 23 Lenselink 2001b, 127, Fig. 5e.24 Lenselink 2001b, 128, Fig. 5f.25 For pollen analysis see Van Smeerdijk
2001; for mollusc analysis see Kuijper 2001; for charcoal analysis see Brinkkemper & Van den Hof, this volume; for macro-botanical analysis see Kubiak-Martens, this volume.
20—
25km0
Coversand between -16 and 0 m NAPRiver valleys and brook valleys
Ice-pushed ridge MienakkerCoversand above 0 m NAPCoversand below -16 m NAP
25km0
Beach barriers and dunesTidal �ats and salt marshesPeatWater
Coversand between -16 and 0 m NAP
River valleys and brook valleys
Coversand above 0 m NAPIce-pushed ridge
Mienakker
Figure 2.1 Reconstruction of the Pleistocene relief in metres above or below Amsterdam Ordnance Datum (NAP) at
the start of the Holocene showing the low lying Pleistocene topography where the former Rhine valley was situated
(adapted from Vos et al. 2011).
Figure 2.2 Palaeogeographical reconstruction of a part of the Netherlands, c. 3850 BC showing the Bergen tidal basin
(green) (adapted from Vos et al. 2011).
21—
Figure 2.3 Palaeogeographical reconstruction of a part of the Netherlands, c. 2750 BC (adapted from Vos et al. 2011).
Figure 2.4 General schematic diagram of an environment with salt marshes, creeks and beach barriers (adapted
from Vos et al. 2011).
25km0
Beach barriers and dunesBeach plainsTidal ats and salt marshesPeat
River valleys and brook valleysWater
Ice-pushed ridgeCoversand
MienakkerCoversand
TexelWieringen1
1
2
1
2
2
CreekSaltmarsh
Sand�atTidal channel
Low dunesBeach ridge
Tidal inlet
Saltmarsh deposits(silty clay with sand laminea)PeatTidal channel and sand�at deposits(laminated sand and silty clay)Beach ridge deposits (sand)Pleistocene subsurface
22—
26 Furholt 2003; recently these issues have
also been addressed by Beckerman 2012a and Fokkens 2012.
As a consequence of the closing of the beach barrier along the coast, tidal influences diminished and, both during and after the Neolithic occupation, peat formation increased, and finally the site was deserted and overgrown with peat.
2.2.2 Radiocarbon dating
The landscape development sketched above is based chronologically on 14C dates taken from peat layers and shells from corings and the association of different corings of geological and archaeological research. These provide a background framework to the site of Mienakker
itself. Within this framework of landscape development, the human presence at Mienakker could be narrowed down with the aid of 14C dates taken from the excavation. Before we look at these dates in more detail, we must first consider the 14C calibration curve and understand its implications.
The 14C calibration curve for the Single Grave period has several characteristics which need to be scrutinised here before we can assess the dates from Mienakker. One of the main issues is the presence of several plateaus in the calibration curve for this period. Furholt has given an overview of the 14C dating problems for this period.26 He suggests dividing the 14C dates of the Single Grave period into eight stages (stages A to H) based on the wiggles and
Figure 2.5 Local palaeogeographical map of the Mienakker location during the Neolithic occupation (adapted from
Lenselink 2001b, 128 & excavation topography).
50m0
Salt marsh Tidal creek
Schematic section of Figure 2.6

23—
27 Furholt 2003, 15.28 Lanting & Van der Plicht 2000, 76-77:
GrA-1670: 3890 ± 50 BP and GrA-15698: 4010 ± 50 BP.
29 Lanting & Van der Plicht 2000, 76-77.30 Lanting & Van der Plicht 2000, 77.31 Lanting & Van der Plicht 1996.
plateaus in the 14C curve.27 These wiggles and plateaus complicate the chronology of Single Grave sites and make interpretation of 14C dates and the allocation of dates to specific phases difficult (Fig. 2.8). When taken at face value, most 14C dates can only convincingly be ascribed to one of these separate phases. When they are combined with site stratigraphy, however, a more detailed picture might be obtained for specific sites.
From Mienakker six radiocarbon dates are available (Table 2.1 and Fig. 2.9). Two 14C dates were taken from the inhumation burial.28 Samples of bone collagen were taken from the human remains. The material was poorly preserved. Unfortunately one of those dates
(GrA-1670) must be regarded as unreliable because during its measurement irregularities in the laboratory were encountered. Therefore the outcome of this date has to be rejected.29 The outcome of second sample: GrA-15698 can be regarded as reliable with some reservations because the collagen content of the sampled bone was low.30
Since human remains can be prone to the reservoir effect due to dietary variation, δ13C and δ15N were taken, and should therefore be mentioned here (Fig. 2.10 and Table 2.1).31 This value show an indication for a predominantly aquatic diet. This observation is corroborated when this value is compared with values of human bone from Hardinxveld, Schipluiden, and
1
2
3
4
5
0m -NAP
Mienakker
Tidal creek deposits (laminated sand and silty clay)Salt marsh deposits (silty clay with sand laminae)
Salt marsh deposits (humic clay)Peat
Figure 2.6 Schematic section through the site (adapted from Lenselink 2001b, Fig. 6).

24—
Figure 2.8 Furholt’s graph of the calibration curve and phasing for the Single Grave Culture (after Furholt 2003, Fig 1, p.15).
7 6
1,2 8 28201115181710
2322,24
916 19
123,4,5
317 6
1,2 8 28201115181710
2322,24
916 19
123,4,5
31
10km0
Beach barriers and dunesBeach plainsTidal �ats and salt marshes
Water
Ice-pushed ridgeCoversandPeat
MienakkerOther SGC sites
5200
5000
4800
4600
4400
4200
4000
3800
3600
3400
3500 3000Calibrated date (BC)
2500 2000
Radi
ocar
bon
dete
rmin
atio
n (B
P)
BA
C
D
E
F
G
H
3350-3090
3090-2920
2920-2880
2880-25802620-2480
2480-2200
2200-2020
Atmospheric data from Stuiver et al. (1998); OxCal v3.5 Bronk Ramsey (2000); cub r.4 sd:1 prob usp[chron]
Figure 2.7 Mienakker and other Late Neolithic sites in West Frisia plotted on a palaeogeographic map of around
2750 BC (adapted from Vos et al. 2011).
1, 2: De Vrijheid 1 and 2
3, 4, 5: Flevo 1,2a and 2b
6: Kolhorn
7: Poolland
8: Zeewijk
9: De Veken
10: Meester Juffer
11: Aartswoud
12: Gouwe
15: Maantjesland
16: Mienakker
17, 18: Molenkolk 1 and 2
19: Portelwoid
20: Rhomneyhut
22, 23, 24: Zandwerven 1, 2 and 3
25: Westfrisiaweg
31: Keinsmerbrug
(numbers after Van Heeringen &
Theunissen 2001).

25—
Figure 2.9 Multiplot of the calibrated 14C dates of Mienakker.
GrA-108
GrA-109
GrA-110
GrA-15698
GrA-56044
3000 2800 2600 2400 2200
Calibrated date (cal BC)
OxCal v.4.2.2 Bronk Ramsey (2009); r:5 Atmospheric data from Reimer et al. (2009)
Table 2.1 Overview of all radiocarbon dates from Mienakker.
Nr Site reference Reference number
Material/Site context
14C (years BP)
σ ‰C δ13C δ15N Reference
1 Mienakker I (1632-3882-35)
GrA-108 charred reed, upper creek filling
4130 40 - -25.36 - Hogestijn 1997, 29; Van Heeringen & Theunissen 2001, part 2, p. 172
2 Mienakker II (1632-4945-110)
GrA-109 charred reed, lower creek filling
4100 30 58.6 -23.08 - Hogestijn 1997, 29; Van Heeringen & Theunissen 2001, part 2, p. 172
3 Mienakker III (1632-5131-110)
GrA-110 charred reed, lower creek filling
4120 30 50.0 -22.73 - Hogestijn 1997, 29; Van Heeringen & Theunissen 2001, part 2, p. 172
*4 Hoogwoud-Mienakker
GrA-1670 OPM'90, bone, collagen quality low
3890 50 - -17.26 - Lanting & Van der Plicht 2000
5 Hoogwoud-Mienakker 2
GrA-15698 OPM'90, bone, collagen quality low
4010 50 33.7 -18.35 15.5 Lanting & Van der Plicht 2000
6 Mienakker vnr 6188 spoor 120
GrA-56044 cereal grain 3975 40 66.7 -23.32 - this volume
* the result of GrA-1670 is shown but is not reliable.

26—
32 Smits & Van der Plicht 2009.33 Lanting & Van der Plicht 1996, 493.34 Fernandes et al., 2012, 2013.35 Hogestijn 1997.36 Hogestijn 1997, 29: GrA-109: 4100±30
BP; GrA-110: 4120±30 BP.37 Always at 2-sigma, unless indicated
otherwise.38 Hogestijn 1997, 29: GrA-108: 4130 ± 40
BP. 39 Find number 6188; GrA-56044: 3975 ± 40
BP.
Swifterbant.32 Furthermore these values indicate a possible influence of an aquatic reservoir effect in the 14C values. This should be taken into consideration when assessing the dates of Mienakker. For the southern North Sea, the marine reservoir effect is approximately 400 years.33 If the aquatic reservoir effect is caused by a freshwater aquatic diet, the reservoir effect may even be larger.34
Samples from charred reed fragments coming from sediments in the southern channel creek were taken during the excavation and dated in the 1990s.35 Two samples come from the bottom layers of this creek.36 Calibrated, these dates give (for GrA-109) 2863-2502 cal BC and (for GrA-110) 2866-2578 cal BC. 37 Another 14C date from the creek, but then from the top sediments, gave a calibrated result of 2873-2581 cal BC; Fig. 2.9).38 The sample from the sediment in the top of the channel (GrA-108) gives the oldest BP outcome. However this outcome, the standard deviation
and the outcomes of the other dates (GrA-109 and GrA-110) show a considerable overlap and fall within the same range. The 14C dates might be part of several specific burning events from which material remnants ended up in the creek on different occasions or they all are the result of one event. All in all, the charred reed fragments represent activities at the site during the first phase of occupation, before the creek was completely filled with sediments. It is likely that the charring of reeds is the result of human activity, however a natural cause cannot entirely be dismissed. A new 14C date was taken during the course of this project from the occupation debris itself. Cereal grains from feature S120 were dated39 (Fig. 2.9). After calibration this sample gives an outcome of 2581-2346 cal BC. Radiocarbon dates taken from the site at Mienakker establish the beginning of occupation between 2850 and 2580 cal BC (Furholt’s phase D). The date of the cereal grain from feature 120 corresponds to Furholt’s
Figure 2.10 The δ13C and δ15N value of the human bones from the Mienakker burial compared with values from human
bones from Hardinxveld, Schipluiden and Swifterbant (adapted from Smits & Van der Plicht 2009, Fig. 11, p. 73).
4
6
8
10
12
14
16
18
20
Hardinxveld
Mienakker
Swi�erbant
Schipluiden
-26 -24 -22 -20 -18 -16
δ15N
(‰)
δ13C (‰)

27—
40 Nobles, this volume Chapter 11.41 See Smit 2012, 21 Fig. 2.4 for the
Keinsmerbrug 14C dates.42 Exaltus 1992; Exaltus & Miedema 1994.43 Exaltus 1992; Exaltus & Miedema 1994.44 Exaltus 1992.45 Comparative research: e.g. Huisman,
Jongmans & Raemaekers 2009; Boschian & Montagnari-Kokelj 2000; Shillito & Matthews 2013; Experimental work: e.g. Miller et al. 2009; Miller & Sievers 2012.
phase E and the calibrated date of the inhumation falls in phase D-F.
These 14C dates from the site at Mienakker present us with the building blocks for a chronological model.40 Based on the 14C dates alone Figure 2.8 hints at the presence of potentially two phases at this site. Taken into account the possible reservoir effect in sample GrA-15698 one could argue that the burial is the youngest dated feature. The activities employed at Mienakker can be placed in Furholt phases D-F. A comparison with the radiocarbon dating results from Keinsmerbrug, predominantly between 2580-2430 cal BC, suggests that occupation at Mienakker started earlier than at Keinsmerbrug.41 One could argue that the second phase of activities at Mienakker as shown by the dates of the cereal and the burial overlap with the activities at Keinsmerbrug.
2.2.3 Micromorphology
Micromorphological analysis of the Mienakker site was performed in 1990 by R. Exaltus.42 This was one of the first analyses of this type to take place in Dutch archaeology. A single trench, trench 23, was chosen for micromorphological analysis. The west-east profile, cutting through the entire site, was sampled, in addition to the east-facing profile of this specific trench. Finally, a test pit was dug west of the site specifically for micromorphological purposes. Many of the micromorphological samples taken show bands of carbonised remains of non-woody plants embedded within the cultural layer and the natural sediment. Unfortunately, the pictures of the thin sections that were used for micromorphological analysis are of very poor quality. The thin sections themselves are no longer available. Hence, no pictures of the sections are shown here.
These bands indicate the presence of fires and the burning of non-woody plant material, most likely reeds.43 The relatively low-lying bands were later covered by occupation waste or natural sediments, or they were trampled and disturbed. These bands themselves probably indicate episodes of burning and usage. On the higher parts of the levee, in a feature later designated the ‘hearth pit’ (see Fig. 3.1) associated with structure MKI, a long
micromorphological section was taken. In the slides, an (at first sight) undisturbed accumulation of twelve different bands of waste material was uncovered. These were interpreted by the micromorphologist as evidence of several different episodes of very specific cooking activities and the burning of fires.44
Recent studies have however shown that more caution should applied to any such interpretation. Comparative research and experimental work has been conducted all over the world since the 1990s.45 These studies show that the interpretation of micromorphological thin-sections is not as straightforward as previously thought. Renewed analysis of the old thin-section slides, if available, could give much more detailed knowledge as to the practices carried out at Mienakker and the specific processes taking place during occupation.
Due to the above mentioned developments in the study of thin sections and the impossibility to look at these slides again within this project, the results and the interpretations obtained in the 1990s could not be integrated into the present analyses. Therefore the micromorphological studies present no additional information into the potential depositional development at the site and its internal chronology.