Manual TC3 Scope View
172
Manual TC3 Scope View TwinCAT 3 1.9 2019-03-20 TE13xx Version: Date: Order No.:
-
Upload
khangminh22 -
Category
Documents
-
view
2 -
download
0
Transcript of Manual TC3 Scope View
Manual
TC3 Scope View
TwinCAT 3
1.92019-03-20TE13xx
Version:Date:Order No.:

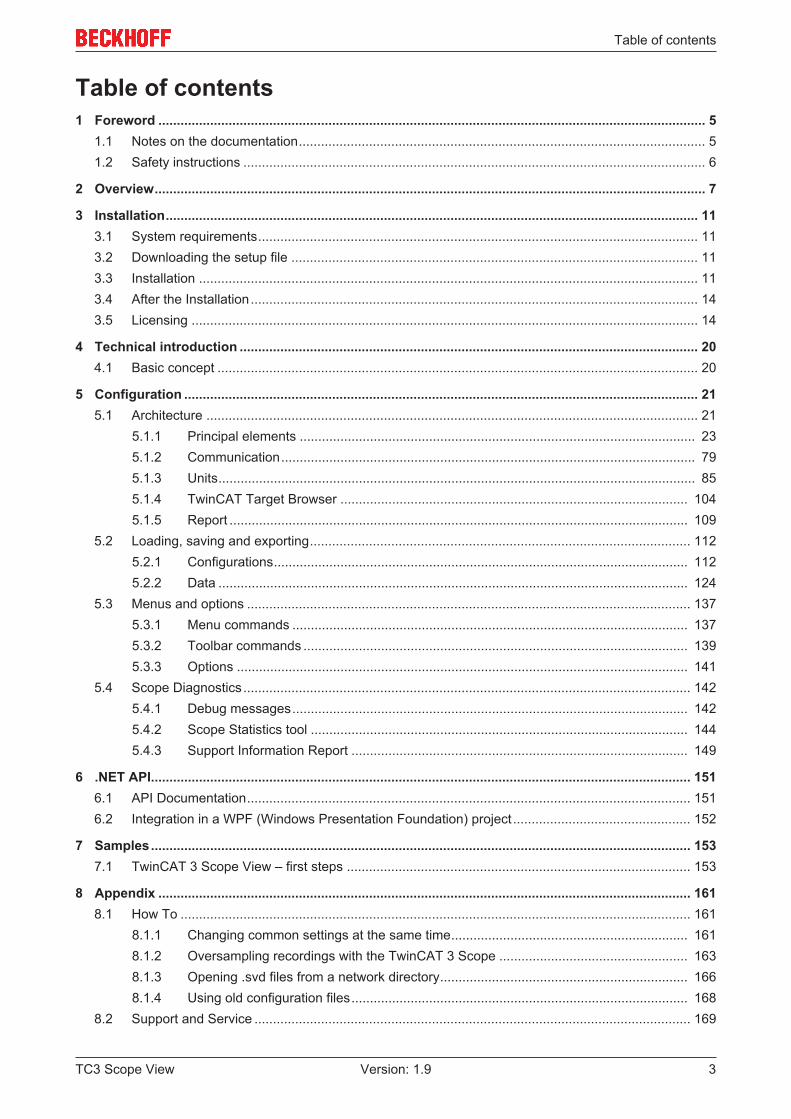
Table of contents
TC3 Scope View 3Version: 1.9
Table of contents1 Foreword .................................................................................................................................................... 5
1.1 Notes on the documentation.............................................................................................................. 51.2 Safety instructions ............................................................................................................................. 6
2 Overview..................................................................................................................................................... 7
3 Installation................................................................................................................................................ 113.1 System requirements....................................................................................................................... 113.2 Downloading the setup file .............................................................................................................. 113.3 Installation ....................................................................................................................................... 113.4 After the Installation......................................................................................................................... 143.5 Licensing ......................................................................................................................................... 14
4 Technical introduction ............................................................................................................................ 204.1 Basic concept .................................................................................................................................. 20
5 Configuration ........................................................................................................................................... 215.1 Architecture ..................................................................................................................................... 21
5.1.1 Principal elements ........................................................................................................... 235.1.2 Communication................................................................................................................ 795.1.3 Units................................................................................................................................. 855.1.4 TwinCAT Target Browser .............................................................................................. 1045.1.5 Report ............................................................................................................................ 109
5.2 Loading, saving and exporting....................................................................................................... 1125.2.1 Configurations................................................................................................................ 1125.2.2 Data ............................................................................................................................... 124
5.3 Menus and options ........................................................................................................................ 1375.3.1 Menu commands ........................................................................................................... 1375.3.2 Toolbar commands ........................................................................................................ 1395.3.3 Options .......................................................................................................................... 141
5.4 Scope Diagnostics ......................................................................................................................... 1425.4.1 Debug messages........................................................................................................... 1425.4.2 Scope Statistics tool ...................................................................................................... 1445.4.3 Support Information Report ........................................................................................... 149
6 .NET API.................................................................................................................................................. 1516.1 API Documentation........................................................................................................................ 1516.2 Integration in a WPF (Windows Presentation Foundation) project ................................................ 152
7 Samples.................................................................................................................................................. 1537.1 TwinCAT 3 Scope View – first steps ............................................................................................. 153
8 Appendix ................................................................................................................................................ 1618.1 How To .......................................................................................................................................... 161
8.1.1 Changing common settings at the same time................................................................ 1618.1.2 Oversampling recordings with the TwinCAT 3 Scope ................................................... 1638.1.3 Opening .svd files from a network directory................................................................... 1668.1.4 Using old configuration files........................................................................................... 168
8.2 Support and Service ...................................................................................................................... 169
Table of contents
TC3 Scope View4 Version: 1.9
8.3 FAQ ............................................................................................................................................... 1708.4 TwinCAT Scope Glossary ............................................................................................................. 171
Glossary ................................................................................................................................................. 172
Foreword
TC3 Scope View 5Version: 1.9
1 Foreword
1.1 Notes on the documentationThis description is only intended for the use of trained specialists in control and automation engineering whoare familiar with the applicable national standards.It is essential that the documentation and the following notes and explanations are followed when installingand commissioning the components. It is the duty of the technical personnel to use the documentation published at the respective time of eachinstallation and commissioning.
The responsible staff must ensure that the application or use of the products described satisfy all therequirements for safety, including all the relevant laws, regulations, guidelines and standards.
Disclaimer
The documentation has been prepared with care. The products described are, however, constantly underdevelopment.We reserve the right to revise and change the documentation at any time and without prior announcement.No claims for the modification of products that have already been supplied may be made on the basis of thedata, diagrams and descriptions in this documentation.
Trademarks
Beckhoff®, TwinCAT®, EtherCAT®, Safety over EtherCAT®, TwinSAFE®, XFC® and XTS® are registeredtrademarks of and licensed by Beckhoff Automation GmbH.Other designations used in this publication may be trademarks whose use by third parties for their ownpurposes could violate the rights of the owners.
Patent Pending
The EtherCAT Technology is covered, including but not limited to the following patent applications andpatents:EP1590927, EP1789857, DE102004044764, DE102007017835with corresponding applications or registrations in various other countries.
The TwinCAT Technology is covered, including but not limited to the following patent applications andpatents:EP0851348, US6167425 with corresponding applications or registrations in various other countries.
EtherCAT® is registered trademark and patented technology, licensed by Beckhoff Automation GmbH,Germany
Copyright
© Beckhoff Automation GmbH & Co. KG, Germany.The reproduction, distribution and utilization of this document as well as the communication of its contents toothers without express authorization are prohibited.Offenders will be held liable for the payment of damages. All rights reserved in the event of the grant of apatent, utility model or design.

Foreword
TC3 Scope View6 Version: 1.9
1.2 Safety instructions
Safety regulations
Please note the following safety instructions and explanations!Product-specific safety instructions can be found on following pages or in the areas mounting, wiring,commissioning etc.
Exclusion of liability
All the components are supplied in particular hardware and software configurations appropriate for theapplication. Modifications to hardware or software configurations other than those described in thedocumentation are not permitted, and nullify the liability of Beckhoff Automation GmbH & Co. KG.
Personnel qualification
This description is only intended for trained specialists in control, automation and drive engineering who arefamiliar with the applicable national standards.
Description of symbols
In this documentation the following symbols are used with an accompanying safety instruction or note. Thesafety instructions must be read carefully and followed without fail!
DANGERSerious risk of injury!Failure to follow the safety instructions associated with this symbol directly endangers the life and health ofpersons.
WARNINGRisk of injury!Failure to follow the safety instructions associated with this symbol endangers the life and health of per-sons.
CAUTIONPersonal injuries!Failure to follow the safety instructions associated with this symbol can lead to injuries to persons.
NOTEDamage to the environment or devicesFailure to follow the instructions associated with this symbol can lead to damage to the environment orequipment.
Tip or pointerThis symbol indicates information that contributes to better understanding.

Overview
TC3 Scope View 7Version: 1.9
2 OverviewTwinCAT 3 Scope is the charting and analysis tool for TwinCAT. Variables in TwinCAT can be recorded anddisplayed graphically. Sampling rates can be adjusted individually for each channel. Recordings in the µsrange and long-term recordings over several days are equally possible. Due to division into a Scope Viewwith multi-core support for the display of the signals and a Scope Server for the recording of the values, it ispossible it to connect to servers distributed in the field from a central View. A tool is thus available not onlyfor machine commissioning, but also for process monitoring. The TwinCAT 3 Scope functionality includescursor tools and trigger functions.
TwinCAT 3 Scope also sets new standards for Engineering. Like TwinCAT 3 itself, it is integrated inMicrosoft Visual Studio. It is thus possible to use TwinCAT 3 projects and Scope projects in parallel in asingle solution. Variables can be shifted very simply from the TwinCAT 3 project to a Scope configuration. Ofcourse, the Scope can also still be used as a standalone tool in the framework of the Visual Studio shell.
Due to the constantly increasing range of functions required of data analysis tools, the TwinCAT 3 Scope issubdivided into product levels with different ranges of features. The TwinCAT 3 Scope Base contains alicense-free View and a license-free Server. Both are installed together with TwinCAT 3 XAE.
Product note
The TwinCAT 3 Scope software consists of two products:
• TwinCAT 3 Scope View is a TwinCAT 3 engineering product and supplies the graphic interface for theconfiguration of recordings and the display of signal curves. The View is available in different productlevels and is licensed for the device on which it is displayed. This document contains the technicalproduct description.
• TwinCAT 3 Scope Server is a TwinCAT 3 function and provides the software for data logging. Theserver sends the recorded data to the View. The software is installed on distributed devices or on thelocal target device. The server license is issued for the device on which the server runs. In most casesthe Base version, which is installed together with TwinCAT XAE or the Scope View, is sufficient. Theserver license is only required if it is used independently, i.e. without View, e.g. for control via a PLCfunction block. The TwinCAT 3 Scope server is documented separately as part of the TwinCAT 3functions.
Both components must be available in the system in order to be able to use the Scope.
Principle of operation
The principle of operation of the two main components View and Server is explained in detail in the BasicConcept [ 20] in the Technical Introduction.
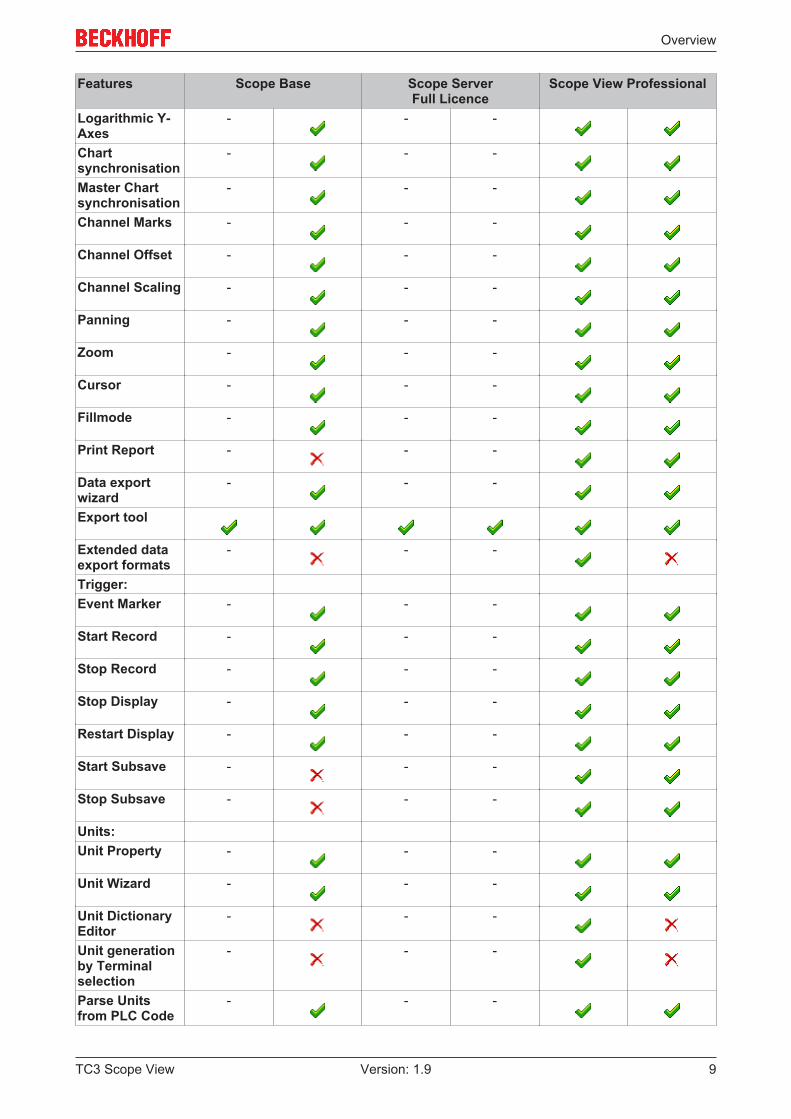
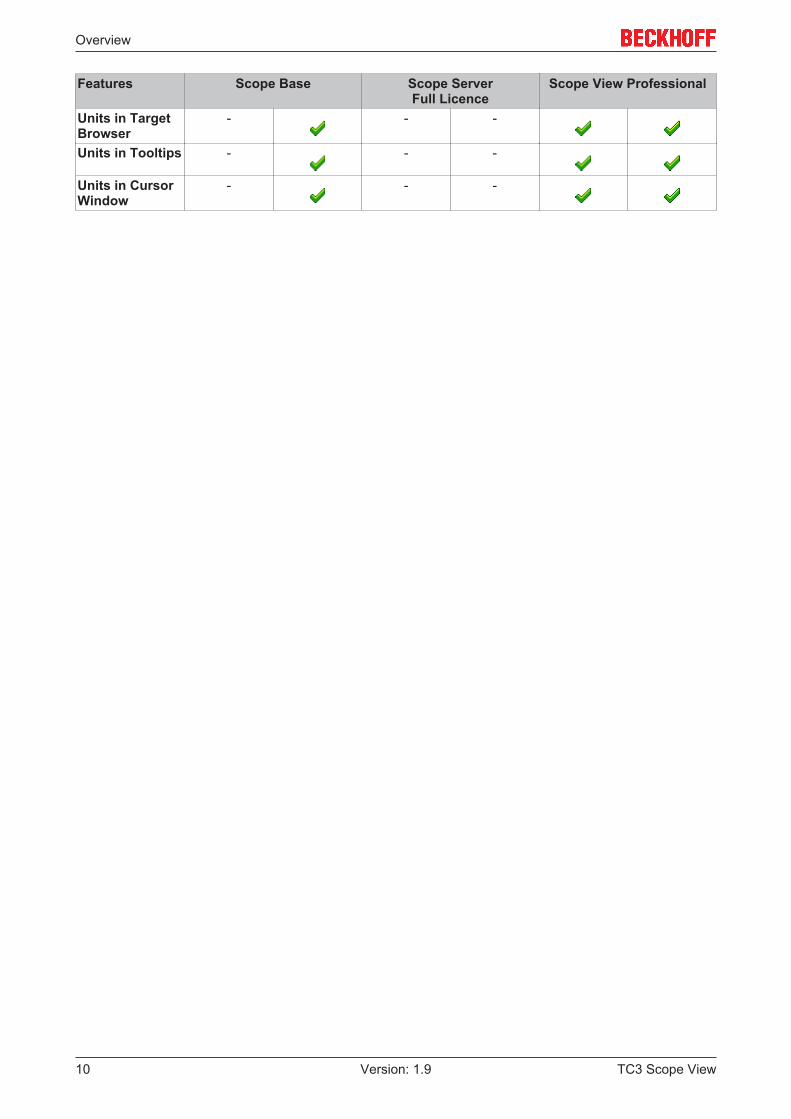
Product level / feature list
The following table shows which functionalities are available with which TwinCAT Scope level and thecorresponding licensing arrangement.

Overview
TC3 Scope View8 Version: 1.9
Features Scope Base Scope ServerFull Licence
Scope View Professional
Server View Server ViewFull 7 days trial
versionFull 7 days trial
versionGeneral:Free of charge
Local record
Remote Recordusing TargetServerRemote Recordusing LocalServerScope ControlIntegration
- - -
Long TimeRecords > 1h
- - -
Ring Buffer
Auto Save - - -
Restart Record - - -
View MulticoreSupport
- - -
Communication:ADS
OPC UA (3
Nodes) (3
Nodes)Base:ConfigurationWizard
- - -
Target BrowserFilter
- - -
IndividualSample Rate
- - -
Drag and DropforConfiguration
- - -
DockingWindows
- - -
YT Time basedCharts
- - -
XY Charts - - -
Array BarCharts
- - -
Overview Chart - - -
Stacked Y-Axes - - -
Overview
TC3 Scope View 9Version: 1.9
Features Scope Base Scope ServerFull Licence
Scope View Professional
Logarithmic Y-Axes
- - -
Chartsynchronisation
- - -
Master Chartsynchronisation
- - -
Channel Marks - - -
Channel Offset - - -
Channel Scaling - - -
Panning - - -
Zoom - - -
Cursor - - -
Fillmode - - -
Print Report - - -
Data exportwizard
- - -
Export tool
Extended dataexport formats
- - -
Trigger:Event Marker - - -
Start Record - - -
Stop Record - - -
Stop Display - - -
Restart Display - - -
Start Subsave - - -
Stop Subsave - - -
Units:Unit Property - - -
Unit Wizard - - -
Unit DictionaryEditor
- - -
Unit generationby Terminalselection
- - -
Parse Unitsfrom PLC Code
- - -
Overview
TC3 Scope View10 Version: 1.9
Features Scope Base Scope ServerFull Licence
Scope View Professional
Units in TargetBrowser
- - -
Units in Tooltips - - -
Units in CursorWindow
- - -

Installation
TC3 Scope View 11Version: 1.9
3 Installation
3.1 System requirementsThe following system requirements must be fulfilled for proper functioning of the TwinCAT 3 Scope View.
Supported operating systems
Windows Embedded Standard 7, Windows 7, Windows 10
TwinCAT
Minimum is TwinCAT 3 ADS.
.NET Framework
.NET Framework 4.5.1 is required.
The TwinCAT 3 Scope Base is installed together with TwinCAT 3 XAE. The further product levels andfeatures are enabled by licensing. If you use a newer Scope version outside a TwinCAT 3 XAE update, or ifyou want to install the Scope in stand-alone mode on a PC without TwinCAT 3 Engineering, you candownload the corresponding setup file from the internet.
Scope View can be licensed as a full version or as a 7-day test version. For limitations of the test version,please refer to the product overview page.
3.2 Downloading the setup fileTwinCAT Scope View is available for download from the Beckhoff website. In each case the latest productversion that can be licensed for each product level is made available. To download the setup file, perform thefollowing steps:
1. Start a web browser of your choice and go to the Beckhoff website at www.beckhoff.de.2. In the tree structure of the website, navigate to the node Automation > TwinCAT 3 > TE1xxx |
TC3 Engineering > TE13xx | TC3 Scope View Professional.3. Click on the Download link in order to place the software in the shopping cart. Then click on Start
download.4. (Optional) Transfer the downloaded file to the TwinCAT runtime system you wish to install the product
on.
3.3 InstallationThe following section describes how to install the TwinCAT 3 Function for Windows-based operatingsystems.
ü The TwinCAT 3 Function setup file was downloaded from the Beckhoff website.1. Run the setup file as administrator. To do this, select the command Run as administrator in the context
menu of the file.ð The installation dialog opens.

Installation
TC3 Scope View12 Version: 1.9
2. Accept the end user licensing agreement and click Next.
3. Enter your user data.
Installation
TC3 Scope View 13Version: 1.9
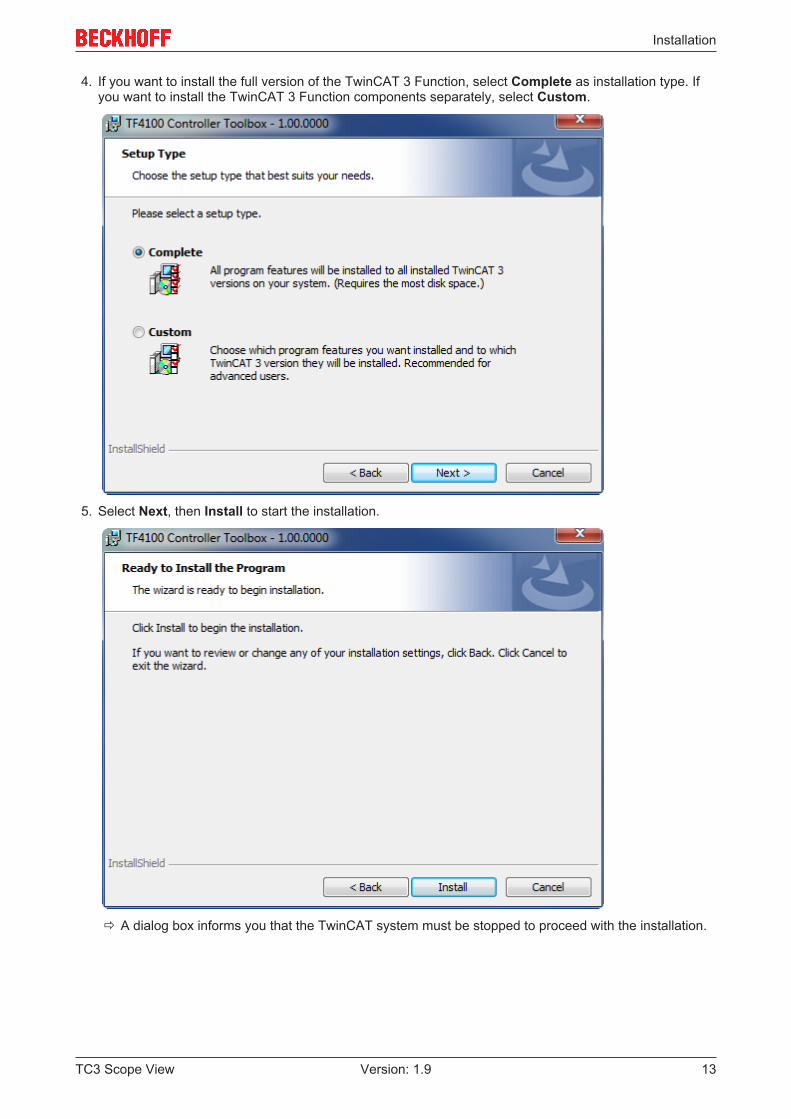
4. If you want to install the full version of the TwinCAT 3 Function, select Complete as installation type. Ifyou want to install the TwinCAT 3 Function components separately, select Custom.
5. Select Next, then Install to start the installation.
ð A dialog box informs you that the TwinCAT system must be stopped to proceed with the installation.
Installation
TC3 Scope View14 Version: 1.9
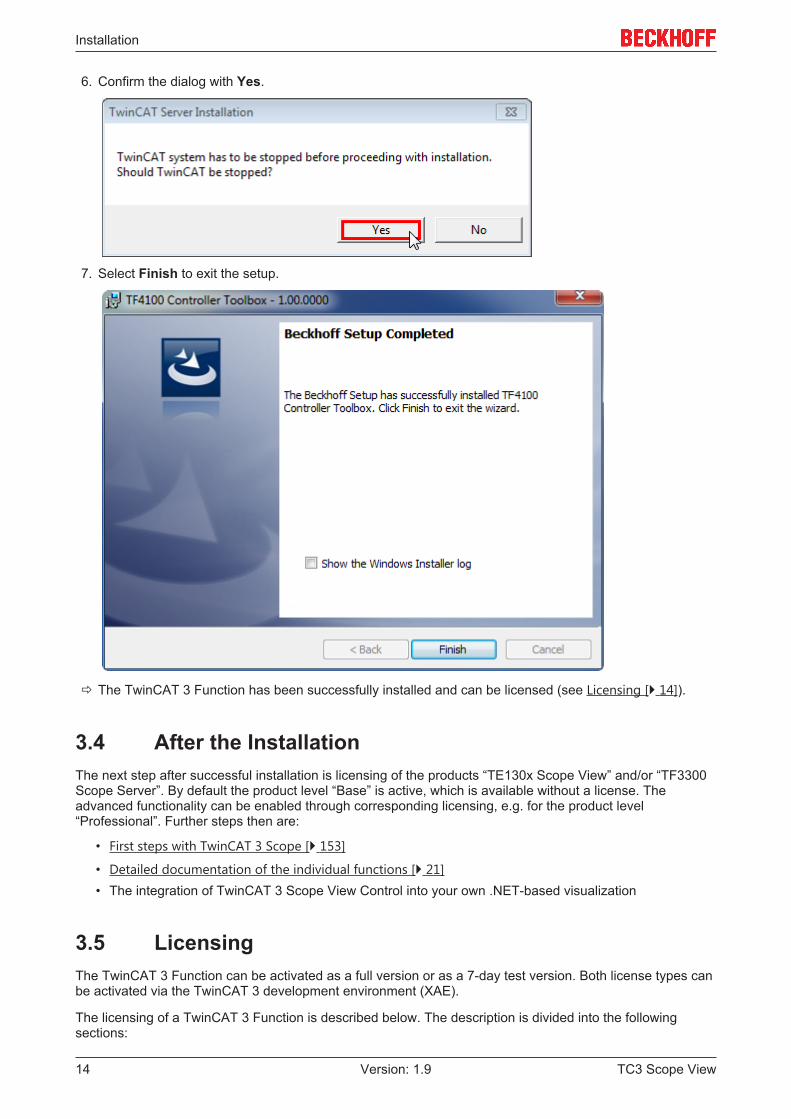
6. Confirm the dialog with Yes.
7. Select Finish to exit the setup.
ð The TwinCAT 3 Function has been successfully installed and can be licensed (see Licensing [ 14]).
3.4 After the InstallationThe next step after successful installation is licensing of the products “TE130x Scope View” and/or “TF3300Scope Server”. By default the product level “Base” is active, which is available without a license. Theadvanced functionality can be enabled through corresponding licensing, e.g. for the product level“Professional”. Further steps then are:
• First steps with TwinCAT 3 Scope [ 153]
• Detailed documentation of the individual functions [ 21]• The integration of TwinCAT 3 Scope View Control into your own .NET-based visualization
3.5 LicensingThe TwinCAT 3 Function can be activated as a full version or as a 7-day test version. Both license types canbe activated via the TwinCAT 3 development environment (XAE).
The licensing of a TwinCAT 3 Function is described below. The description is divided into the followingsections:

Installation
TC3 Scope View 15Version: 1.9
• Licensing a 7-day test version [ 15]
• Licensing a full version [ 16]
Further information on TwinCAT 3 licensing can be found in the “Licensing” documentation in the BeckhoffInformation System (TwinCAT 3 > Licensing).
Licensing a 7-day test version1. Start the TwinCAT 3 development environment (XAE).2. Open an existing TwinCAT 3 project or create a new project.3. If you want to activate the license for a remote device, set the desired target system. To do this, select
the target system from the Choose Target System drop-down list in the toolbar.ð The licensing settings always refer to the selected target system. When the project is activated on
the target system, the corresponding TwinCAT 3 licenses are automatically copied to this system.4. In the Solution Explorer, double-click License in the SYSTEM subtree.
ð The TwinCAT 3 license manager opens.5. Open the Manage Licenses tab. In the Add License column, check the check box for the license you
want to add to your project (e.g. “TF6420: TC3 Database Server“).
6. Open the Order Information (Runtime) tab.

Installation
TC3 Scope View16 Version: 1.9
ð In the tabular overview of licenses, the previously selected license is displayed with the status“missing”.
7. Click 7-Day Trial License... to activate the 7-day trial license.
ð A dialog box opens, prompting you to enter the security code displayed in the dialog.8. Enter the code exactly as it appears, confirm it and acknowledge the subsequent dialog indicating
successful activation.ð In the tabular overview of licenses, the license status now indicates the expiration date of the license.
9. Restart the TwinCAT system.ð The 7-day trial version is enabled.
Licensing a full version1. Start the TwinCAT 3 development environment (XAE).2. Open an existing TwinCAT 3 project or create a new project.3. If you want to activate the license for a remote device, set the desired target system. To do this, select
the target system from the Choose Target System drop-down list in the toolbar.ð The licensing settings always refer to the selected target system. When the project is activated on
the target system, the corresponding TwinCAT 3 licenses are automatically copied to this system.
Installation
TC3 Scope View 17Version: 1.9
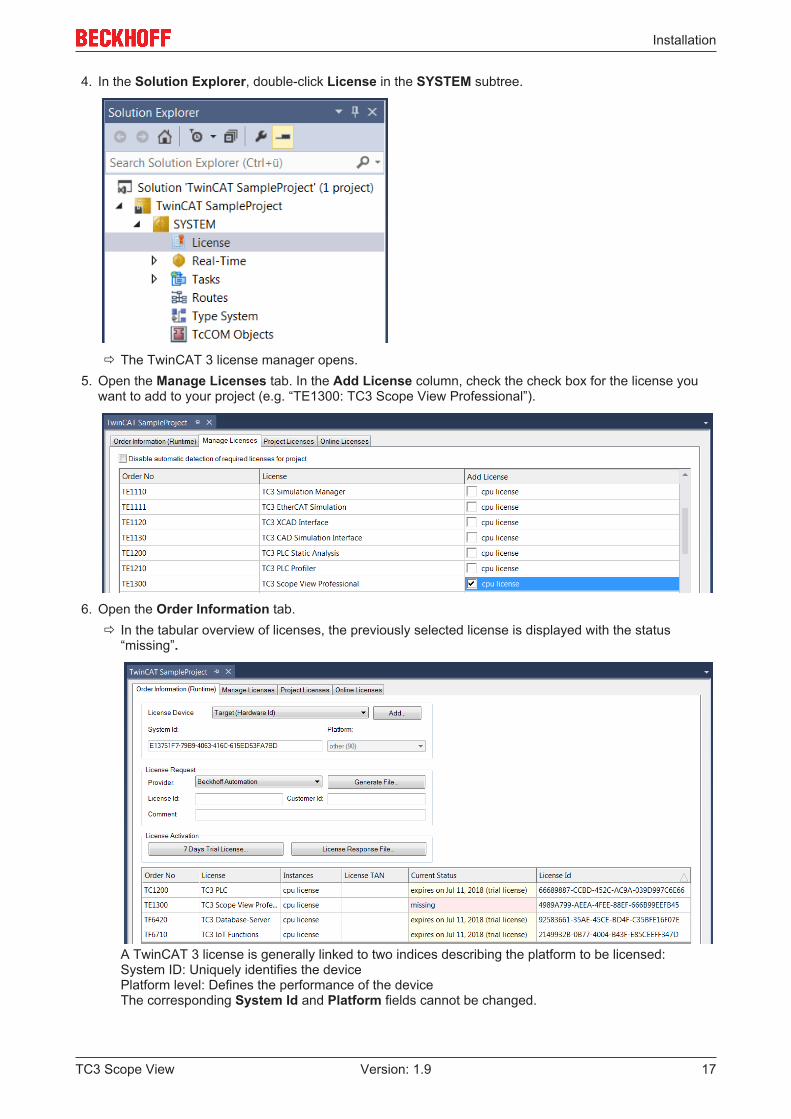
4. In the Solution Explorer, double-click License in the SYSTEM subtree.
ð The TwinCAT 3 license manager opens.5. Open the Manage Licenses tab. In the Add License column, check the check box for the license you
want to add to your project (e.g. “TE1300: TC3 Scope View Professional”).
6. Open the Order Information tab.ð In the tabular overview of licenses, the previously selected license is displayed with the status
“missing”.
A TwinCAT 3 license is generally linked to two indices describing the platform to be licensed:System ID: Uniquely identifies the devicePlatform level: Defines the performance of the deviceThe corresponding System Id and Platform fields cannot be changed.

Installation
TC3 Scope View18 Version: 1.9
7. Enter the order number (License Id) for the license to be activated and optionally a separate ordernumber (Customer Id), plus an optional comment for your own purposes (Comment). If you do notknow your Beckhoff order number, please contact your Beckhoff sales contact.
8. Click the Generate File... button to create a License Request File for the listed missing license.ð A window opens, in which you can specify where the License Request File is to be stored. (We
recommend accepting the default settings.)9. Select a location and click Save.
ð A prompt appears asking whether you want to send the License Request File to the Beckhoff licenseserver for verification:
• Click Yes to send the License Request File. A prerequisite is that an email program is installed on yourcomputer and that your computer is connected to the internet. When you click Yes, the systemautomatically generates a draft email containing the License Request File with all the necessaryinformation.
• Click No if your computer does not have an email program installed on it or is not connected to theinternet. Copy the License Request File onto a data storage device (e.g. a USB stick) and send the filefrom a computer with internet access and an email program to the Beckhoff license server([email protected]) by email.
10. Send the License Request File.ð The License Request File is sent to the Beckhoff license server. After receiving the email, the server
compares your license request with the specified order number and returns a License Response Fileby email. The Beckhoff license server returns the License Response File to the same email addressfrom which the License Request File was sent. The License Response File differs from the LicenseRequest File only by a signature that documents the validity of the license file content. You can viewthe contents of the License Response File with an editor suitable for XML files (e.g. “XML Notepad”).The contents of the License Response File must not be changed, otherwise the license file becomesinvalid.
11. Save the License Response File.
Installation
TC3 Scope View 19Version: 1.9
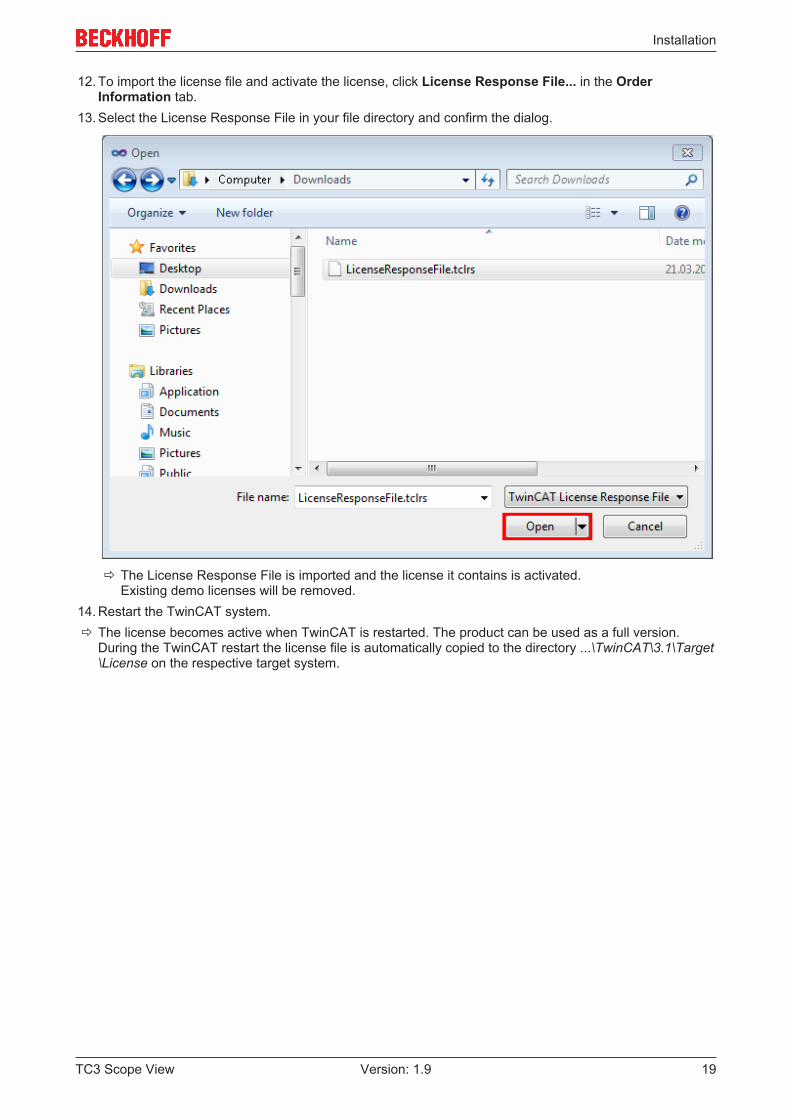
12. To import the license file and activate the license, click License Response File... in the OrderInformation tab.
13. Select the License Response File in your file directory and confirm the dialog.
ð The License Response File is imported and the license it contains is activated. Existing demo licenses will be removed.
14. Restart the TwinCAT system.ð The license becomes active when TwinCAT is restarted. The product can be used as a full version.
During the TwinCAT restart the license file is automatically copied to the directory ...\TwinCAT\3.1\Target\License on the respective target system.

Technical introduction
TC3 Scope View20 Version: 1.9
4 Technical introduction
4.1 Basic conceptThe TwinCAT Scope is divided into two main components: the Scope View and the Scope Server. TheScope Server performs the actual data recording. It can connect to control systems via ADS or OPC UA andrecord data. The configuration necessary for this is done in the Scope View. Apart from the configuration, therecorded data are also graphically displayed there in various types of chart.
The Scope View normally runs on the engineering systems of the service or commissioning technicians oron machine computers intended to prepare recorded data graphically for the machine personnel. It istherefore intended for commissioning and also for the continuous monitoring of machines and plants.
An ADS connection is necessary in order to be able to start a recording with a Scope View on a RemoteScope Server. A disconnection is also possible from version 3.3.3140.0. This means that the configuration isdownloaded to the server and continues to run autonomously there. Alternatively the remote server can becontrolled by a PLC function block. If no Scope Server is installed on the control system, the Scope Serveron the device with the Scope View –the so-called local server –can also be used. For this there must be aconstant connection to the remote device during the recording.
Apart from many properties in the Scope View for the graphic display and analysis of the data streams, theScope also offers the option of triggered, i.e. event-based operation. Furthermore it is possible to export therecorded data in various file formats to external tools for further processing.

Configuration
TC3 Scope View 21Version: 1.9
5 Configuration
5.1 ArchitectureNot only are signal curves represented in the TwinCAT 3 Scope View; recording configurations are alsocreated. For the creation of these configurations it is important to be familiar with the architecture of theTwinCAT 3 Scope View. This is reflected in the tree structure of the measurement project in the SolutionExplorer.
Configuration
TC3 Scope View22 Version: 1.9
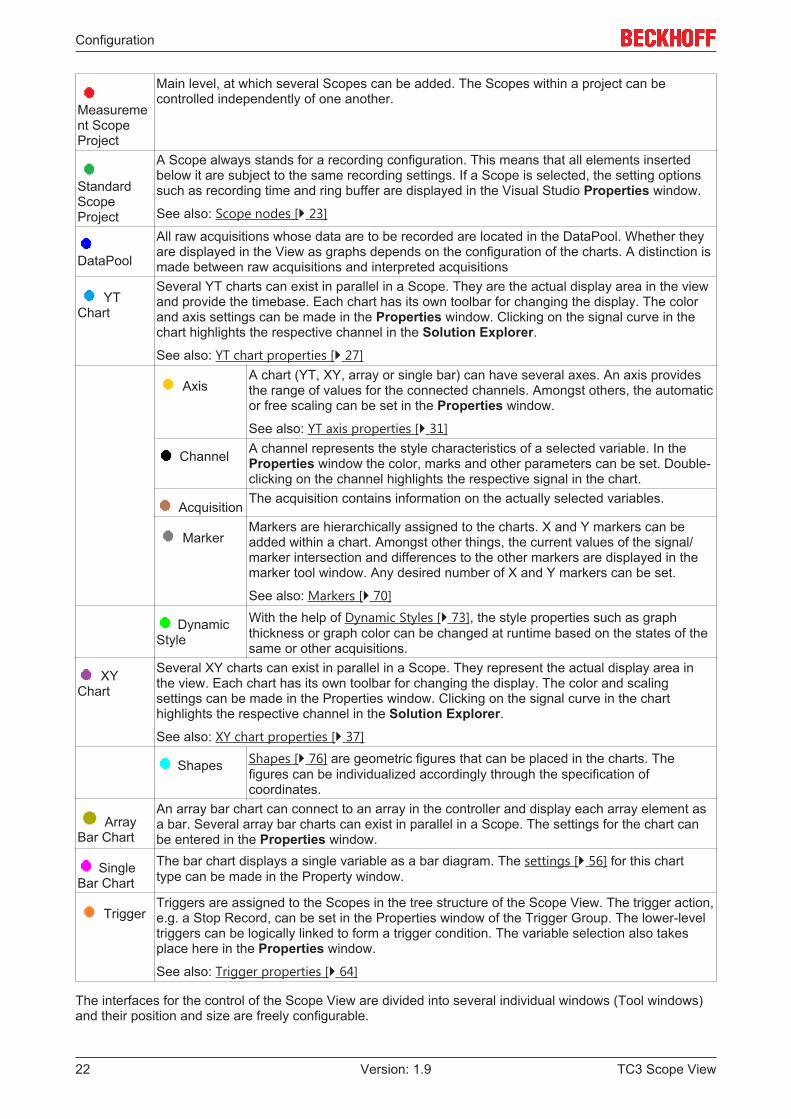
Measurement ScopeProject
Main level, at which several Scopes can be added. The Scopes within a project can becontrolled independently of one another.
StandardScopeProject
A Scope always stands for a recording configuration. This means that all elements insertedbelow it are subject to the same recording settings. If a Scope is selected, the setting optionssuch as recording time and ring buffer are displayed in the Visual Studio Properties window.
See also: Scope nodes [ 23]
DataPool
All raw acquisitions whose data are to be recorded are located in the DataPool. Whether theyare displayed in the View as graphs depends on the configuration of the charts. A distinction ismade between raw acquisitions and interpreted acquisitions
YTChart
Several YT charts can exist in parallel in a Scope. They are the actual display area in the viewand provide the timebase. Each chart has its own toolbar for changing the display. The colorand axis settings can be made in the Properties window. Clicking on the signal curve in thechart highlights the respective channel in the Solution Explorer.See also: YT chart properties [ 27]
AxisA chart (YT, XY, array or single bar) can have several axes. An axis providesthe range of values for the connected channels. Amongst others, the automaticor free scaling can be set in the Properties window.
See also: YT axis properties [ 31]
Channel A channel represents the style characteristics of a selected variable. In theProperties window the color, marks and other parameters can be set. Double-clicking on the channel highlights the respective signal in the chart.
AcquisitionThe acquisition contains information on the actually selected variables.
MarkerMarkers are hierarchically assigned to the charts. X and Y markers can beadded within a chart. Amongst other things, the current values of the signal/marker intersection and differences to the other markers are displayed in themarker tool window. Any desired number of X and Y markers can be set.
See also: Markers [ 70]
DynamicStyle
With the help of Dynamic Styles [ 73], the style properties such as graphthickness or graph color can be changed at runtime based on the states of thesame or other acquisitions.
XYChart
Several XY charts can exist in parallel in a Scope. They represent the actual display area inthe view. Each chart has its own toolbar for changing the display. The color and scalingsettings can be made in the Properties window. Clicking on the signal curve in the charthighlights the respective channel in the Solution Explorer.See also: XY chart properties [ 37]
Shapes Shapes [ 76] are geometric figures that can be placed in the charts. Thefigures can be individualized accordingly through the specification ofcoordinates.
ArrayBar Chart
An array bar chart can connect to an array in the controller and display each array element asa bar. Several array bar charts can exist in parallel in a Scope. The settings for the chart canbe entered in the Properties window.
SingleBar Chart
The bar chart displays a single variable as a bar diagram. The settings [ 56] for this charttype can be made in the Property window.
TriggerTriggers are assigned to the Scopes in the tree structure of the Scope View. The trigger action,e.g. a Stop Record, can be set in the Properties window of the Trigger Group. The lower-leveltriggers can be logically linked to form a trigger condition. The variable selection also takesplace here in the Properties window.
See also: Trigger properties [ 64]
The interfaces for the control of the Scope View are divided into several individual windows (Tool windows)and their position and size are freely configurable.
Configuration
TC3 Scope View 23Version: 1.9
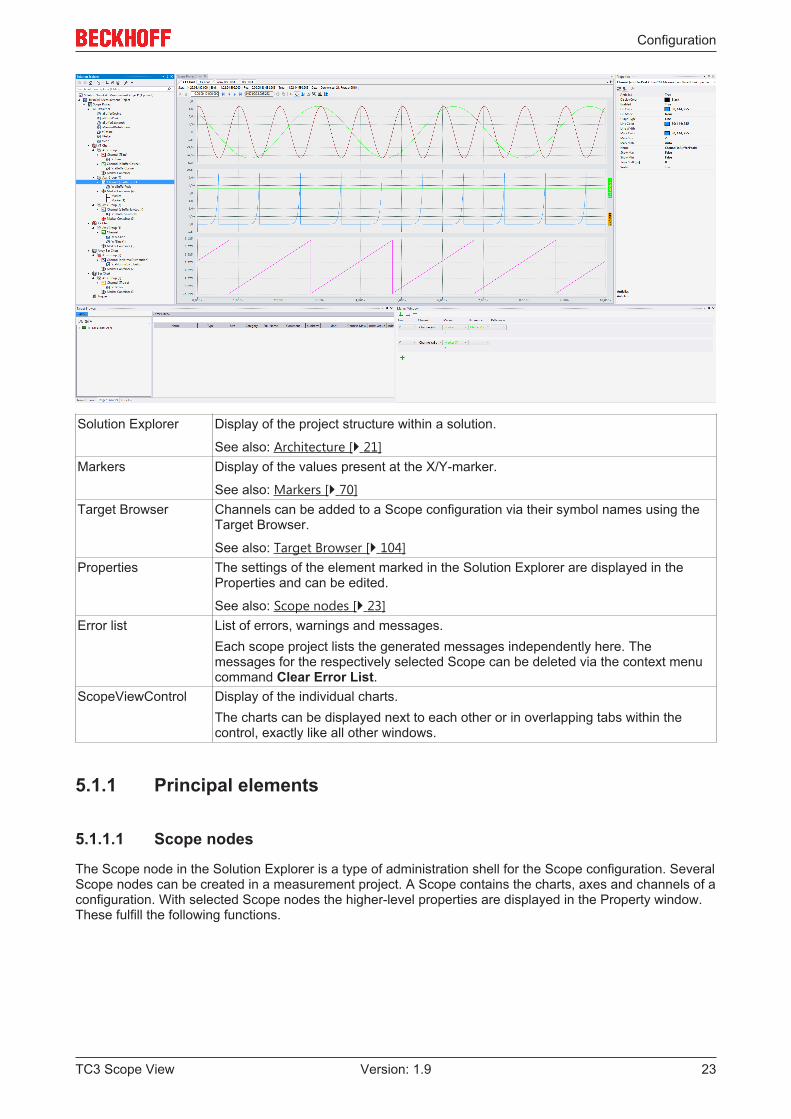
Solution Explorer Display of the project structure within a solution.
See also: Architecture [ 21]Markers Display of the values present at the X/Y-marker.
See also: Markers [ 70]Target Browser Channels can be added to a Scope configuration via their symbol names using the
Target Browser.
See also: Target Browser [ 104]Properties The settings of the element marked in the Solution Explorer are displayed in the
Properties and can be edited.
See also: Scope nodes [ 23]Error list List of errors, warnings and messages.
Each scope project lists the generated messages independently here. Themessages for the respectively selected Scope can be deleted via the context menucommand Clear Error List.
ScopeViewControl Display of the individual charts.The charts can be displayed next to each other or in overlapping tabs within thecontrol, exactly like all other windows.
5.1.1 Principal elements
5.1.1.1 Scope nodes
The Scope node in the Solution Explorer is a type of administration shell for the Scope configuration. SeveralScope nodes can be created in a measurement project. A Scope contains the charts, axes and channels of aconfiguration. With selected Scope nodes the higher-level properties are displayed in the Property window.These fulfill the following functions.

Configuration
TC3 Scope View24 Version: 1.9
Auto Save
Auto Save Path Here you can select the path for saving the recording via the file browser.Filename Mask Affects the filename of the recording to be saved. In this way it is possible to
realize continuous time stamps, for example.Use Auto Save Turns on automatic saving for a stopped recording.
Common
Comment A free comment can be stored here.File Name Filename of the current Scope instance.File Path Directory in which the Scope instance was saved.Graphics Shows the currently used graphic. A distinction is made between GDI+ and
DirectX.ViewDetailLevel Here you can set the level of detail for showing or hiding various options. For a
better overview, the Extended level is particularly recommended for XY plots. Theoption is therefore only available for XY plots at present. The options “Default” and“Extended” are available for all chart types.
Configuration
TC3 Scope View 25Version: 1.9
Record
Restart Record Here you can restart a stopped recording.Ring buffer Here you can specify how the server should respond, once the recording time has
been reached.• If the option is disabled, the recording is stopped when the recording time is
reached. The recording can be terminated prematurely via the stop button.• If the option is enabled the recording is not stopped, but the oldest data in the
memory is overwritten. This increases the start time of the recording. Therecording can be stopped by pressing the stop button.
Start Record Here you can set whether the recording should be started via the recording button(UserStart) or when a trigger event occurs (TriggerStart).
Record Mode
File Store Here you can specify whether the server should buffer the data in a local file (True)or only in the RAM (False). The choice depends on the quantity of data to berecorded and the recording equipment. The access time is faster, if only the RAM isused. For larger data quantities it is usually necessary to activate the “File Store”option.
Record Time Here you can specify the total recording time. It is entered in the formatDays:Hours:Minutes:Seconds.
Changing the settings of several Scopes at the same time
To change the settings for several Scopes at the same time, please refer to the chapter Multiple selection[ 161].
5.1.1.2 Data pool
The data pool is a container for project acquisitions. All acquisitions created for the project are placed in thedata pool. Acquisitions that are enabled at the start of a recording are recorded and can be referenced in theinterpreter of a channel during both the configuration and the recording in order to display the data of theacquisition.
There are two types of acquisition, the array bar acquisition, which is displayed with a green accent, andother acquisitions, which are displayed with a red accent. The array bar acquisitions can only be referencedin array bar channel interpreters and not in other channel interpreters or trigger set interpreters.
Each project has a data pool that is automatically added during creation.
In order to start a recording there may not be any acquisitions with the same configuration in the data pool.Since several interpreters may point to an acquisition, acquisitions with the same configuration are notnecessary.
Configuration
TC3 Scope View26 Version: 1.9
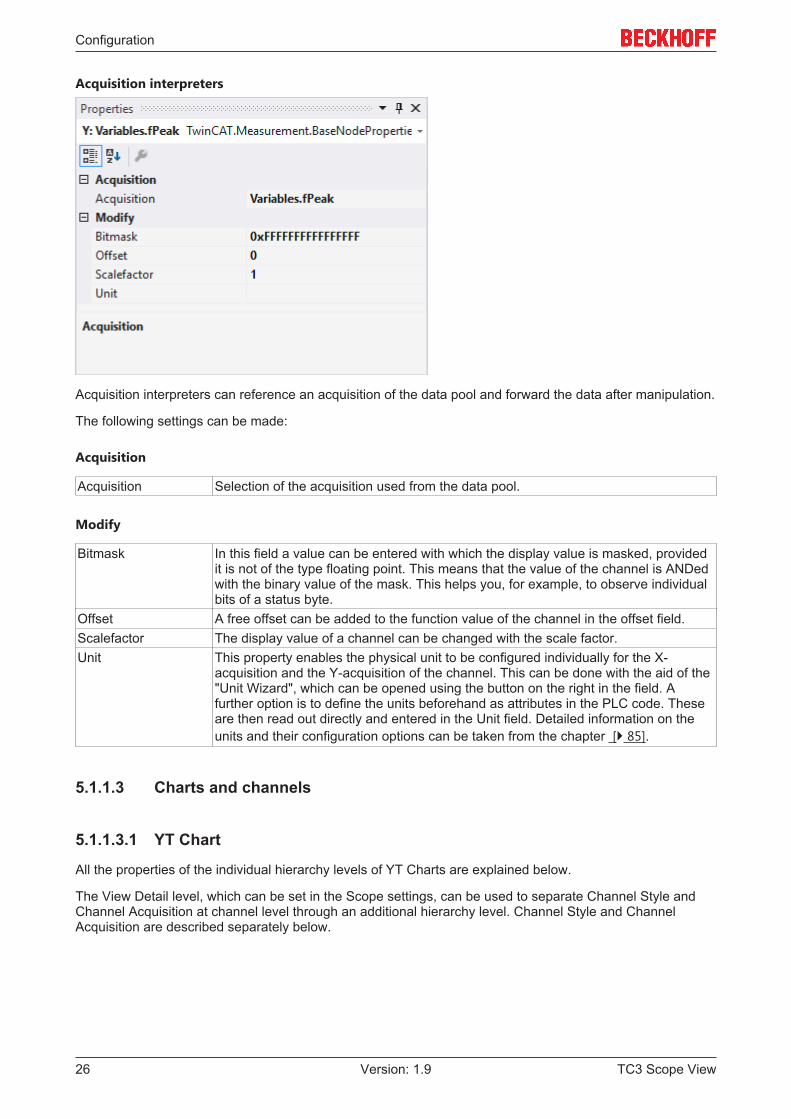
Acquisition interpreters
Acquisition interpreters can reference an acquisition of the data pool and forward the data after manipulation.
The following settings can be made:
Acquisition
Acquisition Selection of the acquisition used from the data pool.
Modify
Bitmask In this field a value can be entered with which the display value is masked, providedit is not of the type floating point. This means that the value of the channel is ANDedwith the binary value of the mask. This helps you, for example, to observe individualbits of a status byte.
Offset A free offset can be added to the function value of the channel in the offset field.Scalefactor The display value of a channel can be changed with the scale factor.Unit This property enables the physical unit to be configured individually for the X-
acquisition and the Y-acquisition of the channel. This can be done with the aid of the"Unit Wizard", which can be opened using the button on the right in the field. Afurther option is to define the units beforehand as attributes in the PLC code. Theseare then read out directly and entered in the Unit field. Detailed information on theunits and their configuration options can be taken from the chapter [ 85].
5.1.1.3 Charts and channels
5.1.1.3.1 YT Chart
All the properties of the individual hierarchy levels of YT Charts are explained below.
The View Detail level, which can be set in the Scope settings, can be used to separate Channel Style andChannel Acquisition at channel level through an additional hierarchy level. Channel Style and ChannelAcquisition are described separately below.
Configuration
TC3 Scope View 27Version: 1.9
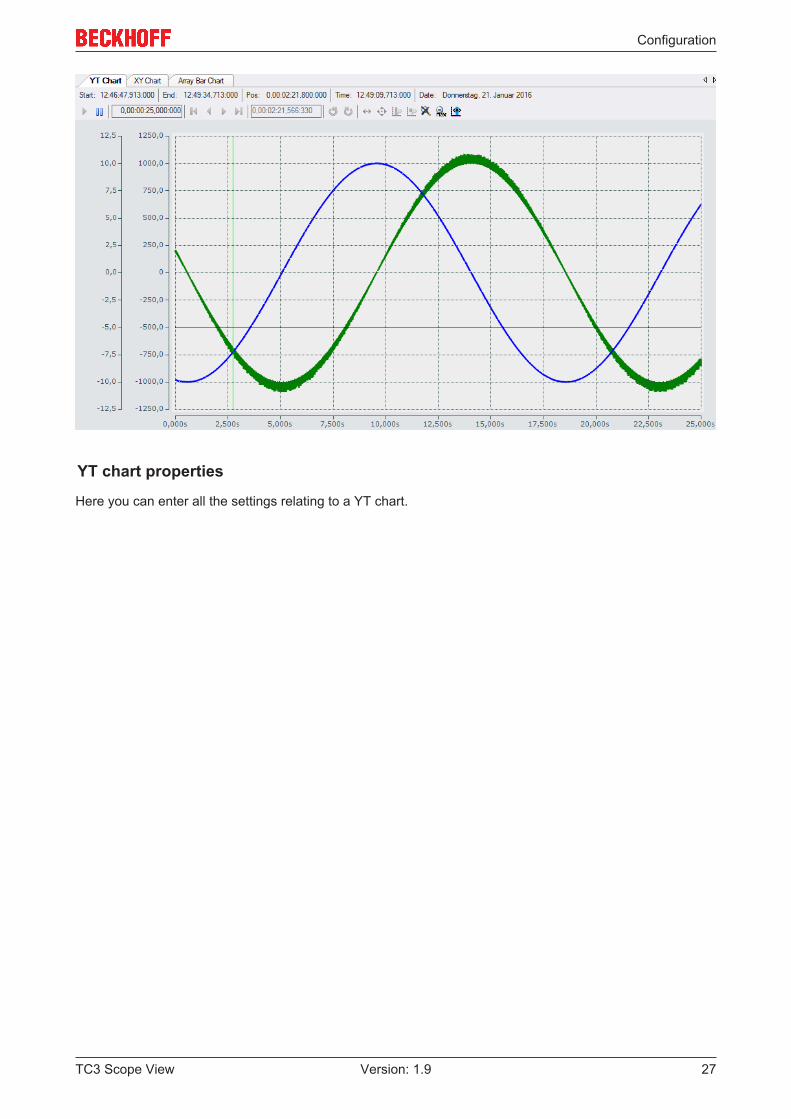
YT chart properties
Here you can enter all the settings relating to a YT chart.

Configuration
TC3 Scope View28 Version: 1.9
Behaviour
Auto Start If this option is enabled, the chart starts the live display when a new recording is started.Data Tool Tip If this option is enabled, a click on a data point results in display of a tool tip with the
exact values of the data point on the X- and Y-axis, plus the timestamp and name of thecorresponding channel.
Default DisplayWidth
This time specifies the standard width of the associated chart. This value is set, forexample, when the rescale button is selected in the chart toolbar.
Invert X-Axis Switches the signal sequence from the default (left to right) to right to leftMaster Chart In the drop-down list that is available here, a chart that is part of the current configuration
can be selected and designated as master chart. All actions that are executed in themaster chart are also automatically executed in this chart. A separate stop display optionis provided, through which Y-zoom and Y-panning modes are available. An overviewchart can also be displayed.
Configuration
TC3 Scope View 29Version: 1.9
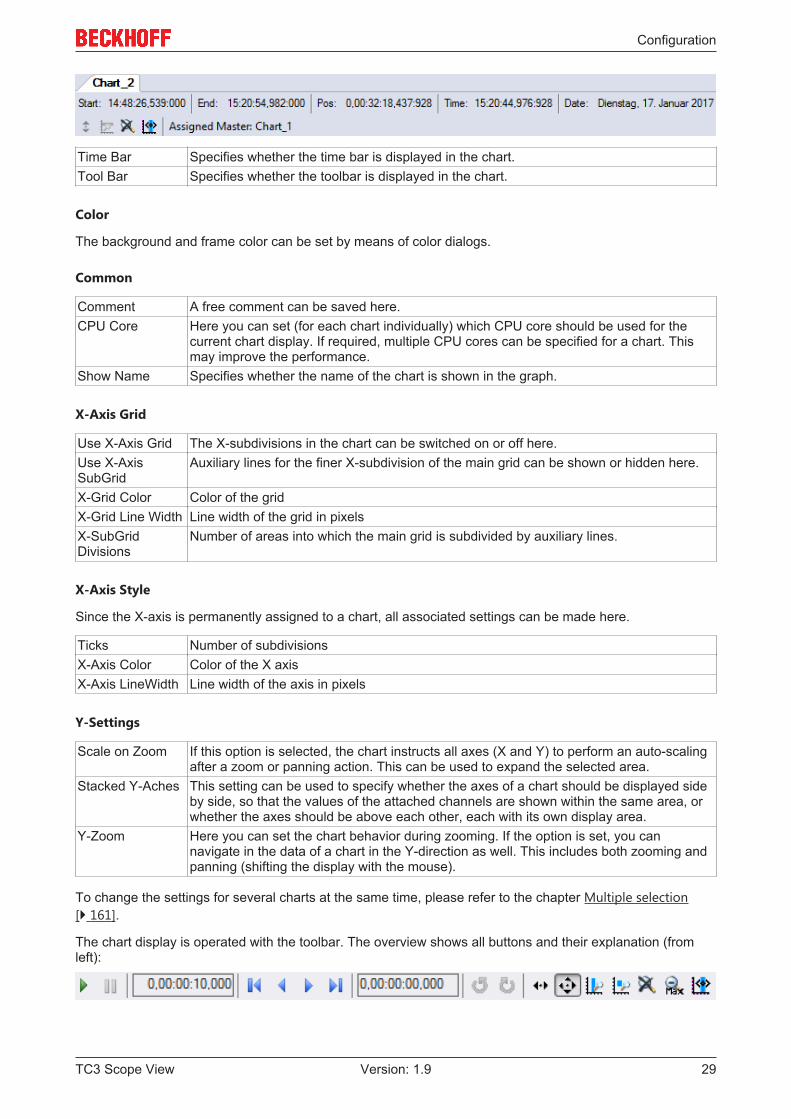
Time Bar Specifies whether the time bar is displayed in the chart.Tool Bar Specifies whether the toolbar is displayed in the chart.
Color
The background and frame color can be set by means of color dialogs.
Common
Comment A free comment can be saved here.CPU Core Here you can set (for each chart individually) which CPU core should be used for the
current chart display. If required, multiple CPU cores can be specified for a chart. Thismay improve the performance.
Show Name Specifies whether the name of the chart is shown in the graph.
X-Axis Grid
Use X-Axis Grid The X-subdivisions in the chart can be switched on or off here.Use X-AxisSubGrid
Auxiliary lines for the finer X-subdivision of the main grid can be shown or hidden here.
X-Grid Color Color of the gridX-Grid Line Width Line width of the grid in pixelsX-SubGridDivisions
Number of areas into which the main grid is subdivided by auxiliary lines.
X-Axis Style
Since the X-axis is permanently assigned to a chart, all associated settings can be made here.
Ticks Number of subdivisionsX-Axis Color Color of the X axisX-Axis LineWidth Line width of the axis in pixels
Y-Settings
Scale on Zoom If this option is selected, the chart instructs all axes (X and Y) to perform an auto-scalingafter a zoom or panning action. This can be used to expand the selected area.
Stacked Y-Aches This setting can be used to specify whether the axes of a chart should be displayed sideby side, so that the values of the attached channels are shown within the same area, orwhether the axes should be above each other, each with its own display area.
Y-Zoom Here you can set the chart behavior during zooming. If the option is set, you cannavigate in the data of a chart in the Y-direction as well. This includes both zooming andpanning (shifting the display with the mouse).
To change the settings for several charts at the same time, please refer to the chapter Multiple selection[ 161].
The chart display is operated with the toolbar. The overview shows all buttons and their explanation (fromleft):

Configuration
TC3 Scope View30 Version: 1.9
Play Starts the live display mode. The data currently being accumulated are displayed.Break The display switches to the pause mode. You can now navigate in the data already
recorded without stopping the recording.Display-Width The current display width is displayed here. It can be edited in the format hh:mm:ss,fff.
The zoom function works down to the µs range. Alternatively, the display width can bechanged by turning the mouse wheel in the selected chart window. The changed value isadopted automatically.
Scroll buttons The outer scroll buttons move the current display in steps that correspond to the displaywidth. The inner scroll keys move the display only by a tenth of the display width and canbe kept pressed to view the data set.
Position Shows the position. It can be edited in the format hh:mm:ss,fff. The colons are used asseparators. If not all units are edited the format is sorted in ascending order, starting withseconds.
Undo/Redo Time/Position
This option can be used to undo step changes in the display width or the current position,irrespective of how they were made (e.g. zoom, scroll, etc.). The right mouse button islikewise assigned this function. Once undone, values can be repeated with redo.
PanningHorizontal
In the horizontal panning mode the current display can be shifted along the x-axis byclicking and dragging with the mouse.
Panning Free In the free panning mode the current display can be shifted along the x- and y-axes byclicking and dragging with the mouse.
Zoom Horizontal A new time range for the display can be selected by stretching a rectangle over the x-axis.
Zoom Free You can zoom into the current display by stretching a rectangle over the graphic area.Zoom to Default Carries out an autoscale on all axes. The x-axis is/axes are set to the default display
time.Zoom Out Max Scales the x-axis in such a way that all current values in the recording appear in the
display.Overview Use the Overview option to display a chart within the chart. The signal range currently
shown in the main chart is highlighted in the Overview Chart. The Overview Chart alsooffers an absolute time axis for the whole recording time.
By turning the mouse wheel you can also zoom in or out on the current display. The cursor position of themouse determines the center.
The current recording times are displayed in the chart toolbar:
Start-Time The common starting point of the recordings of all connected channels. The start timedefines the zero point of the recording.
End-Time Maximum common time of all connected channels. The end time thus marks the finalvalue of the recording. The difference between the end time and start time is maximallyas large as the record time set (see Scope nodes [ 23]).
Position The position time represents the zero point of the current chart, i.e. the time from thestart time to the beginning of the display.
Time Absolute time at the chart originDate Absolute date at the chart origin

Configuration
TC3 Scope View 31Version: 1.9
YT axis properties
Here you can implement separate settings for each available YT axis.
Common
Caption Here you can enter an axis label.Comment A free comment can be saved here.Enabled Here you can switch the axis on or off completely. This functionality is also available via
the context menu.Show Caption Defines whether the name of the chart (Caption) is shown in the graph.

Configuration
TC3 Scope View32 Version: 1.9
Grid
Grid Color Color of the gridGrid Line Width Line width of the grid in pixelsSubGrid Divisions Number of areas into which the main grid is subdivided by auxiliary lines.
In the case of logarithmic scaling the auxiliary lines for subdivision are shown only in theset number if the range of values per tick is precisely one decade. Otherwise thedisplayed auxiliary line shows the decades not displayed in the main grid.
Use Grid The Y-subdivisions of the axis can be shown or hidden here.Use SubGrid Auxiliary lines for the finer Y-subdivision of the main grid can be shown or hidden here.
Auxiliary lines have no axis labeling.
Scale
Auto Scale If Auto Scale is active, each axis is scaled such that the last-known minimum andmaximum of all connected channels lie within the display range.
Axis Max If Auto Scale is inactive, the maximum value can be edited directly.Axis Min If Auto Scale is inactive, the minimum value can be edited directly.Logarithmic Switches between logarithmic and linear scaling of the axes.Precision Here you can specify the number of significant digits for the axis labeling. It corresponds
to the number of visible digits on the axis.Scale Mode Two auto-scaling modes are available for selection. The default mode is AutoGrowOnly.
This means the y-axis always scales to the historic maximum, until a rescale is carriedout for the current view. Alternatively, AutoGrowNShrink can be selected. This modealways automatically adjusts the maximum of the y-axis to the maximum in the currentview (display width).
Axis Style
Color Color of the axisLine Width Line width in pixelsTicks Maximum number of subdivisions. If there is not enough space for the selected number
of ticks, these are automatically reduced in the chart.In the case of logarithmic scaling the number of ticks depends on the displayed range ofvalues and can thus deviate from the settings.
Visible Specifies whether the axis is shown or hidden in the chart.
To change the settings for several axes at the same time, please refer to the chapter Multiple selection[ 161].
YT channel style
All style settings belonging to a YT channel can be made here.
Configuration
TC3 Scope View 33Version: 1.9
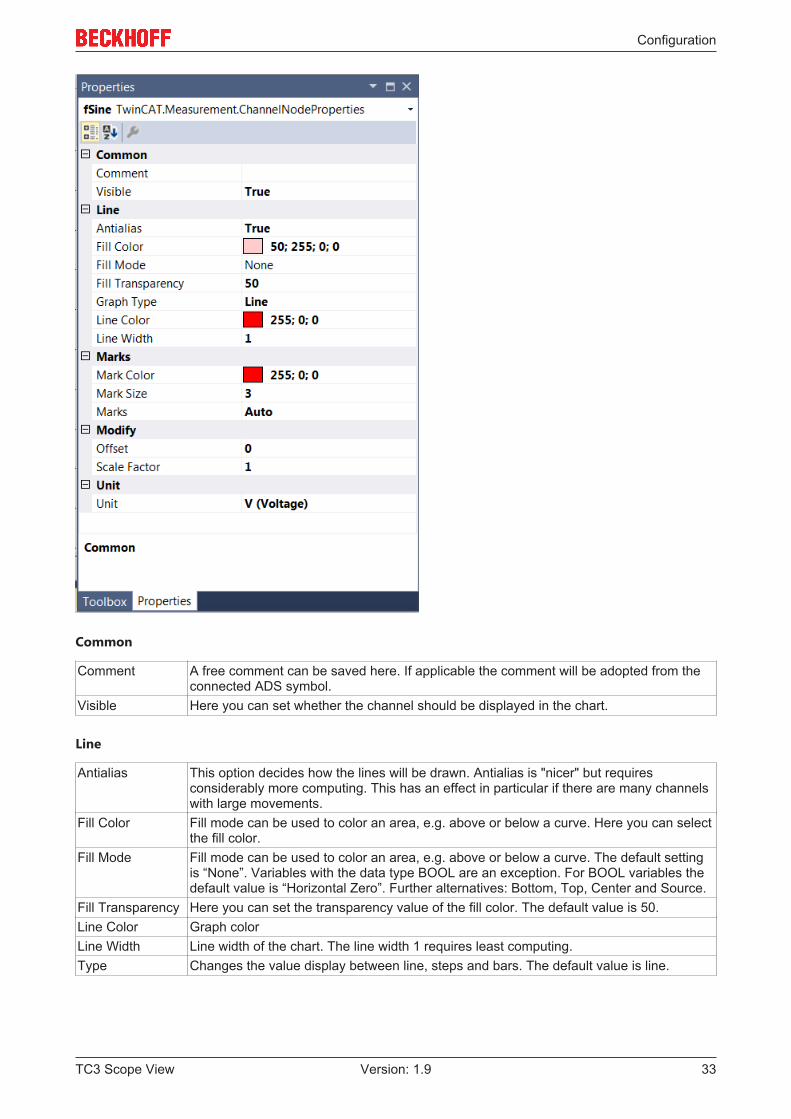
Common
Comment A free comment can be saved here. If applicable the comment will be adopted from theconnected ADS symbol.
Visible Here you can set whether the channel should be displayed in the chart.
Line
Antialias This option decides how the lines will be drawn. Antialias is "nicer" but requiresconsiderably more computing. This has an effect in particular if there are many channelswith large movements.
Fill Color Fill mode can be used to color an area, e.g. above or below a curve. Here you can selectthe fill color.
Fill Mode Fill mode can be used to color an area, e.g. above or below a curve. The default settingis “None”. Variables with the data type BOOL are an exception. For BOOL variables thedefault value is “Horizontal Zero”. Further alternatives: Bottom, Top, Center and Source.
Fill Transparency Here you can set the transparency value of the fill color. The default value is 50.Line Color Graph colorLine Width Line width of the chart. The line width 1 requires least computing.Type Changes the value display between line, steps and bars. The default value is line.

Configuration
TC3 Scope View34 Version: 1.9
Marks
Mark Color Color of the interpolation point markersMarks Selection of the visibility of markings: On (permanently visible) | Auto (dependent on the
zoom level) | Off (markings switched off).Mark Size Size of the interpolation point markers
Modify
Bit Mask In this field a value can be entered with which the display value is masked, provided it isnot of the type floating point. This means that the value of the channel is ANDed with thebinary value of the mask. This helps you, for example, to observe individual bits of astatus byte.
Offset A free offset can be added to the function value of the channel in the offset field.Scale Factor The display value of a channel can be changed with the scale factor. This makes sense if
angle signals are to be displayed in degrees, rather than radians, for example. With ascaling factor of k = 360 / (2*Pi) = 57.296, therefore, degrees would be displayed insteadof radians.
Time Shift This option enables the graph to be moved along the time axis. This can be useful tocompensate a known bus runtime, for example.
Unit
Unit This property allows the physical unit of the respective channel to be configured. Thiscan be done with the aid of the "Unit Wizard", which can be opened using the button onthe right in the field. A further option is to define the units beforehand as attributes in thePLC code. These are then read out directly and entered in the Unit field. Detailedinformation on the units and their configuration options can be taken from the sectionUnits [ 85].
To change the settings for several channels at the same time, please refer to the chapter Multiple selection[ 161].
Configuration of channel style properties with the aid of PLC attributes
All style properties of a channel can be set directly on a variable or a data type in the PLC with the aid ofattributes. This makes it possible to always display a certain symbol with the same style properties withouthaving to reconfigure it every time.
A PLC attribute is specified directly via the declaration of a variable or a data type in curly brackets.
The following syntax applies to the assignment of the channel style properties:
attribute 'TcScope' := '<Property1:value, Property2:value,…>'
Example:attribute 'TcScope' := '<LineWidth:3, LineColor:red>'
Any number of channel style properties can be specified in an attribute.
A separate syntax applies to the specification of the unit (Unit property; see: Configuration of units with theaid of PLC attributes [ 100]).
YT channel acquisition
All acquisition settings belonging to a YT channel can be made here.

Configuration
TC3 Scope View 35Version: 1.9
Different propertiesThe properties of the channels can deviate from the illustration shown here.Some setting possibilities are visible / editable only for special channels.Example: The setting Array Length is only visible for array symbols.

Configuration
TC3 Scope View36 Version: 1.9
Acquisition
Array Length Shows the number of array elements.Data-Type Indicates the data type of the selected variable.Enabled Here you can decide whether the configured channel should be recorded or not.Oversampling This option is only shown for arrays. The array is interpreted as a variable, and the
values of the individual array elements are displayed contiguously as oversamplingvalues. This corresponds to the behavior of EtherCAT oversampling terminals. The valuethat can be entered here describes the number of oversampling values to be displayed.By default, the value corresponds to the array length. See also: Oversampling recordings[ 163]
Sample State Here you can specify whether the data for the selected variables are to be sampled withthe TaskSampleTime or the FreeSampleTime.
Sample Time If the sample state “FreeSampleTime” was selected, you can set the sampling rate here.It is always greater than the TaskSampleTime.
Symbol based If this option is set, the variables are communicated via the symbol name. If this option isnot set, the variables are communicated via the Group and Offset indices, and the inputfields for Group and Offset are enabled.
Symbol Comment Here the actual symbol comment is displayed, if such a comment exists.Symbol IndexGroup
Group index of the variable
Symbol IndexOffset
Offset index of the variable
Symbol Name Symbol name of the selected variableSymbol Size Shows the size of the variables in bytes.Target Port Shows the variable port on the respective TwinCAT system. A drop-down list can be
used to select the available ports for the selected target system.Target System Indicates the target system selected for a recording. By default this is the target system
for the selected variable.Time Offset [s] This can be used for one-time manipulation of the original time stamp during recording of
the data point. e.g. to compensate path differences of different target systems. Thephase differences have to be determined manually by the user.
Use Local Server If this option is set, the Scope Server installed on the Scope View system is used for therecording. If the option is not set, a connection with the remote server of the targetsystem is established.
To change the settings for several channels at the same time, please refer to the chapter Multiple selection[ 161].
5.1.1.3.2 XY Chart
All the properties of the individual hierarchy levels of XY Charts are explained below.
The View Detail level, which can be set in the Scope settings, can be used to separate Channel Style andChannel Acquisition at channel level through an additional hierarchy level. Channel Style and ChannelAcquisition are described separately below.

Configuration
TC3 Scope View 37Version: 1.9
XY chart properties
All settings assigned to the XY chart can be made here.

Configuration
TC3 Scope View38 Version: 1.9
Behaviour
Auto Start If this option is enabled, the chart starts the live display when a new recording is started.Data Tool Tip If this option is enabled, a click on a data point results in display of a tool tip with the exact
values of the data point on the X- and Y-axis, plus the timestamp and name of thecorresponding channel.
Default DisplayWidth
This time indicates the display time for the signal or the signal length in the XY chart. Thisvalue is set, for example, when the rescale button is selected in the chart toolbar.
Master Chart In the drop-down list that is available here, a chart that is part of the current configurationcan be selected and designated as master chart. All actions that are executed in themaster chart are also automatically executed in this chart. A separate pause option isprovided, through which XY-zoom and XY-panning modes are available.
Time Bar Specifies whether the time bar is displayed in the chart.Tool Bar Specifies whether the toolbar is displayed in the chart.
Color
The background and frame color can be set by means of color dialogs.
Configuration
TC3 Scope View 39Version: 1.9
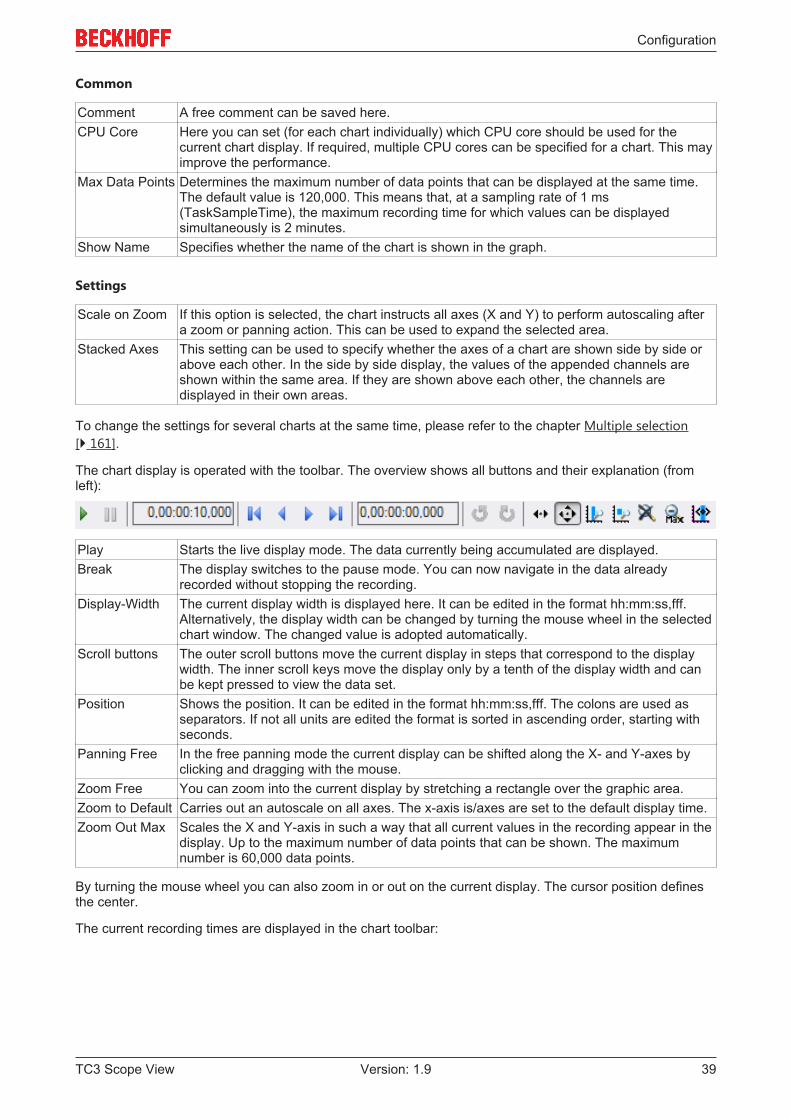
Common
Comment A free comment can be saved here.CPU Core Here you can set (for each chart individually) which CPU core should be used for the
current chart display. If required, multiple CPU cores can be specified for a chart. This mayimprove the performance.
Max Data Points Determines the maximum number of data points that can be displayed at the same time.The default value is 120,000. This means that, at a sampling rate of 1 ms(TaskSampleTime), the maximum recording time for which values can be displayedsimultaneously is 2 minutes.
Show Name Specifies whether the name of the chart is shown in the graph.
Settings
Scale on Zoom If this option is selected, the chart instructs all axes (X and Y) to perform autoscaling aftera zoom or panning action. This can be used to expand the selected area.
Stacked Axes This setting can be used to specify whether the axes of a chart are shown side by side orabove each other. In the side by side display, the values of the appended channels areshown within the same area. If they are shown above each other, the channels aredisplayed in their own areas.
To change the settings for several charts at the same time, please refer to the chapter Multiple selection[ 161].
The chart display is operated with the toolbar. The overview shows all buttons and their explanation (fromleft):
Play Starts the live display mode. The data currently being accumulated are displayed.Break The display switches to the pause mode. You can now navigate in the data already
recorded without stopping the recording.Display-Width The current display width is displayed here. It can be edited in the format hh:mm:ss,fff.
Alternatively, the display width can be changed by turning the mouse wheel in the selectedchart window. The changed value is adopted automatically.
Scroll buttons The outer scroll buttons move the current display in steps that correspond to the displaywidth. The inner scroll keys move the display only by a tenth of the display width and canbe kept pressed to view the data set.
Position Shows the position. It can be edited in the format hh:mm:ss,fff. The colons are used asseparators. If not all units are edited the format is sorted in ascending order, starting withseconds.
Panning Free In the free panning mode the current display can be shifted along the X- and Y-axes byclicking and dragging with the mouse.
Zoom Free You can zoom into the current display by stretching a rectangle over the graphic area.Zoom to Default Carries out an autoscale on all axes. The x-axis is/axes are set to the default display time.Zoom Out Max Scales the X and Y-axis in such a way that all current values in the recording appear in the
display. Up to the maximum number of data points that can be shown. The maximumnumber is 60,000 data points.
By turning the mouse wheel you can also zoom in or out on the current display. The cursor position definesthe center.
The current recording times are displayed in the chart toolbar:

Configuration
TC3 Scope View40 Version: 1.9
Start-Time The common starting point of the recordings of all connected channels. The start timedefines thus the zero point of the recording.
End-Time Maximum common time of all connected channels. The end time marks the final value ofthe recording. The difference between the end time and start time is maximally as large asthe record time set (see Scope nodes [ 23]).
Position The position time represents the zero point of the current chart, i.e. the time from the starttime to the beginning of the display.
Time Absolute time at the chart origin.Date Absolute date at the chart origin.
XY axis properties
Here you can set separate settings for each available XY axis.
Configuration
TC3 Scope View 41Version: 1.9
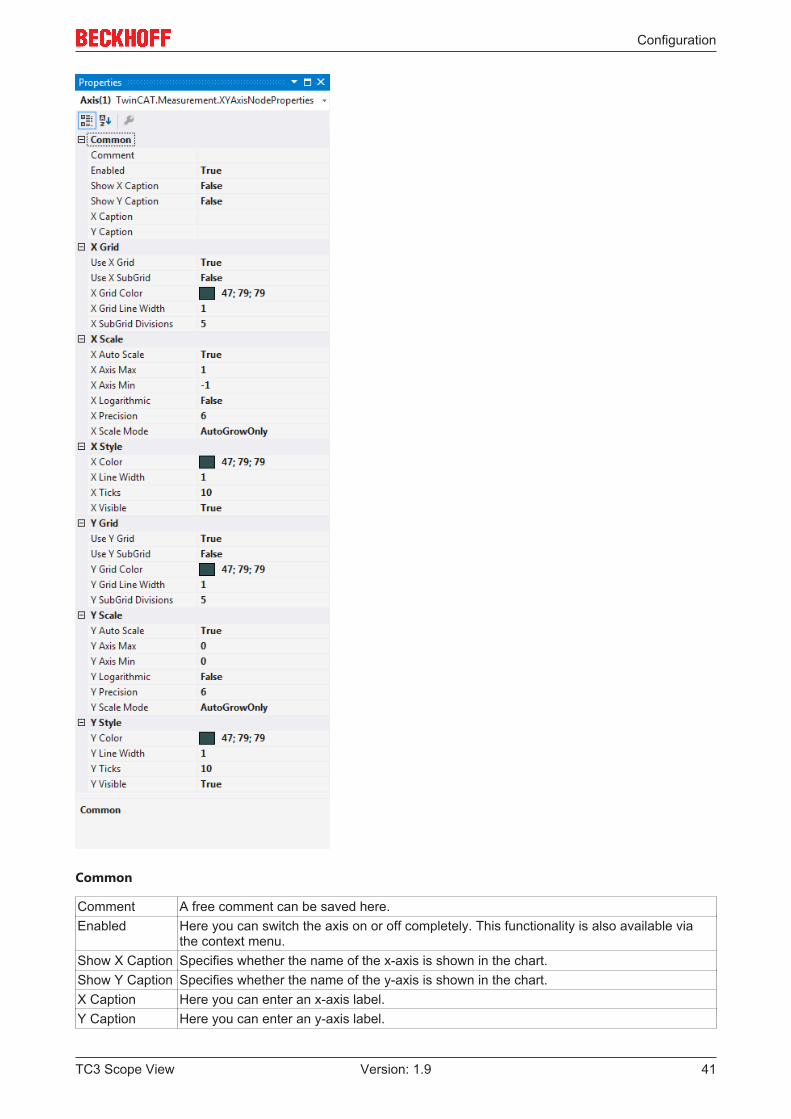
Common
Comment A free comment can be saved here.Enabled Here you can switch the axis on or off completely. This functionality is also available via
the context menu.Show X Caption Specifies whether the name of the x-axis is shown in the chart.Show Y Caption Specifies whether the name of the y-axis is shown in the chart.X Caption Here you can enter an x-axis label.Y Caption Here you can enter an y-axis label.

Configuration
TC3 Scope View42 Version: 1.9
X Grid
Use X Grid The X-subdivisions of the axis can be shown or hidden here.Use X SubGrid Auxiliary lines for the finer X-subdivision of the main grid can be shown or hidden here.
Auxiliary lines have no axis labeling.X Grid Color Color of the gridX Grid LineWidth
Line width of the grid in pixels
X SubGridDivisions
Number of areas into which the main grid is subdivided by auxiliary lines.In the case of logarithmic scaling the auxiliary lines for subdivision are shown only in theset number if the range of values per tick is precisely one decade. Otherwise the displayedauxiliary line shows the decades not displayed in the main grid.
X Scale
X Auto Scale If Auto Scale is active, each axis is scaled such that the last-known minimum andmaximum of all connected channels lie within the display range.
X Axis Max If Auto Scale is inactive, the maximum value can be edited directly.X Axis Min If Auto Scale is inactive, the minimum value can be edited directly.X Logarithmic Switches between logarithmic and linear scaling of the axes.X Precision Here you can specify the number of significant digits for the axis labeling. It corresponds to
the number of visible digits on the axis.X Scale Mode Two auto-scaling modes are available for selection. The default mode is AutoGrowOnly.
This means the x-axis always scales to the historic maximum, until a rescale is carried outfor the current view. Alternatively, AutoGrowNShrink can be selected. This mode alwaysautomatically adjusts the maximum of the x-axis to the maximum in the current view(display width).
X Style
X Color Color of the axisX Line Width Line width in pixelsX Ticks Maximum number of subdivisions. If there is not enough space for the selected number of
ticks, these are automatically reduced in the chart.In the case of logarithmic scaling the number of ticks depends on the displayed range ofvalues and can thus deviate from the settings.
X Visible Specifies whether the axis is shown or hidden in the chart.
Y Grid
Use Y Grid The Y-subdivisions of the axis can be shown or hidden here.Use Y SubGrid Auxiliary lines for the finer Y-subdivision of the main grid can be shown or hidden here.
Auxiliary lines have no axis labeling.Y Grid Color Color of the gridY Grid LineWidth
Line width of the grid in pixels
Y SubGridDivisions
Number of areas into which the main grid is subdivided by auxiliary lines.In the case of logarithmic scaling the auxiliary lines for subdivision are shown only in theset number if the range of values per tick is precisely one decade. Otherwise the displayedauxiliary line shows the decades not displayed in the main grid.
Configuration
TC3 Scope View 43Version: 1.9
Y Scale
Y Auto Scale If Auto Scale is active, each axis is scaled such that the last-known minimum andmaximum of all connected channels lie within the display range.
Y Axis Max If Auto Scale is inactive, the maximum value can be edited directly.Y Axis Min If Auto Scale is inactive, the minimum value can be edited directly.Y Logarithmic Switches between logarithmic and linear scaling of the axes.Y Precision Here you can specify the number of significant digits for the axis labeling. It corresponds to
the number of visible digits on the axis.Y Scale Mode Two auto-scaling modes are available for selection. The default mode is AutoGrowOnly.
This means the y-axis always scales to the historic maximum, until a rescale is carried outfor the current view. Alternatively, AutoGrowNShrink can be selected. This mode alwaysautomatically adjusts the maximum of the y-axis to the maximum in the current view(display width).
Y Style
Y Color Color of the axisY Line Width Line width in pixelsY Ticks Maximum number of subdivisions. If there is not enough space for the selected number of
ticks, these are automatically reduced in the chart.In the case of logarithmic scaling the number of ticks depends on the displayed range ofvalues and can thus deviate from the settings.
Y Visible Specifies whether the axis is shown or hidden in the chart.
To change the settings for several axes at the same time, please refer to the chapter Multiple selection[ 161].
XT channel style
All style settings belonging to a XY channel can be made here.
Configuration
TC3 Scope View44 Version: 1.9
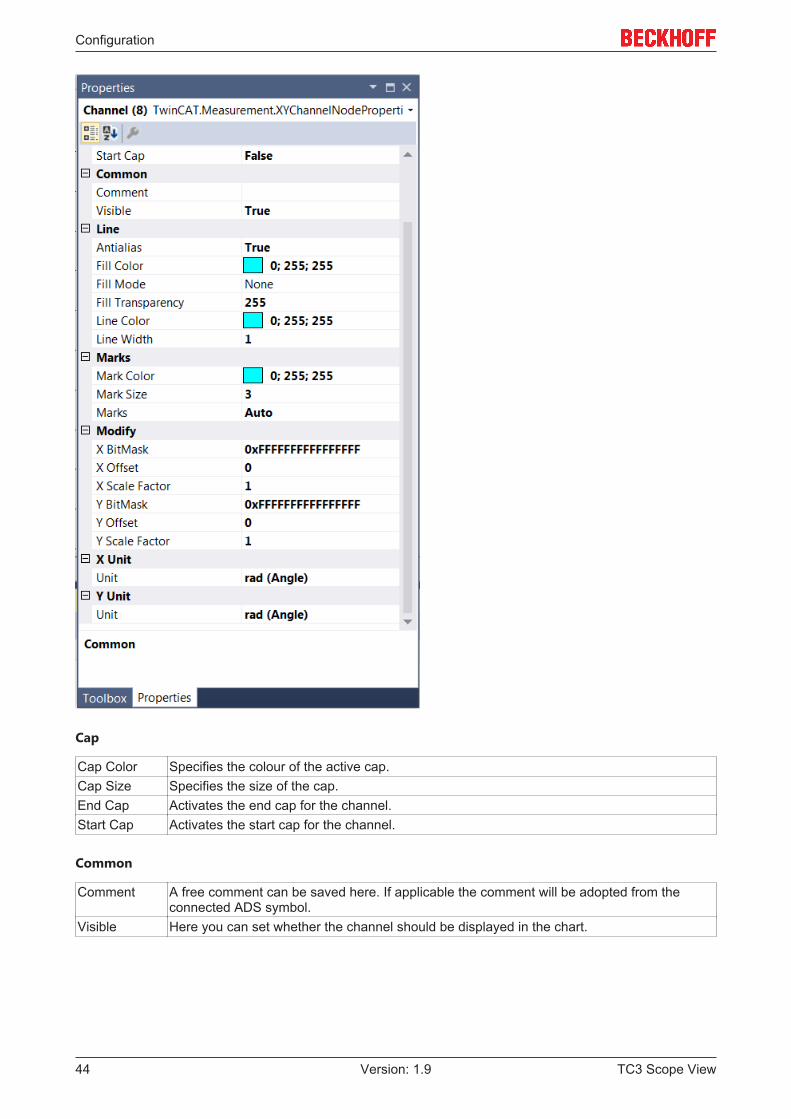
Cap
Cap Color Specifies the colour of the active cap.Cap Size Specifies the size of the cap.End Cap Activates the end cap for the channel.Start Cap Activates the start cap for the channel.
Common
Comment A free comment can be saved here. If applicable the comment will be adopted from theconnected ADS symbol.
Visible Here you can set whether the channel should be displayed in the chart.

Configuration
TC3 Scope View 45Version: 1.9
Line
Antialias This option decides how the lines will be drawn. Antialias is "nicer" but requires considerablymore computing. This has an effect in particular if there are many channels with largemovements.
Fill Color Fill mode can be used to color an area, e.g. above or below a curve. Here you can select thefill color.
Fill Mode Fill mode can be used to color an area, e.g. above or below a curve. The default setting is“None”. Alternatives are: Horizontal Zero, Bottom, Top, Center and Source.
FillTransparency
Here you can set the transparency value of the fill color. The default value is 50.
Line Color Graph colorLine Width Line width of the chart. The line width 1 requires least computing.
Marks
Mark Color Color of the interpolation point markersMarks Selection of the visibility of markings: On (permanently visible) | Auto (dependent on the
zoom level) | Off (markings switched off).Mark Size Size of the interpolation point markers
Modify
X Bit Mask In this field a value can be entered with which the display value is masked, provided it is notof the type floating point. This means that the value of the channel is ANDed with the binaryvalue of the mask. This helps you, for example, to observe individual bits of a status byte.
X Offset A free offset can be added to the function value of the channel in the offset field.X Scale Factor The display value of a channel can be changed with the scale factor.Y Bit Mask In this field a value can be entered with which the display value is masked, provided it is not
of the type floating point. This means that the value of the channel is ANDed with the binaryvalue of the mask. This helps you, for example, to observe individual bits of a status byte.
Y Offset A free offset can be added to the function value of the channel in the offset field.Y Scale Factor The display value of a channel can be changed with the scale factor.
X Unit and Y Unit
Unit This property enables the physical unit to be configured individually for the X-acquisition andthe Y-acquisition of the channel. This can be done with the aid of the "Unit Wizard", whichcan be opened using the button on the right in the field. A further option is to define the unitsbeforehand as attributes in the PLC code. These are then read out directly and entered inthe Unit field. Detailed information on the units and their configuration options can be takenfrom the section Units [ 85].
To change the settings for several channels at the same time, please refer to the chapter Multiple selection[ 161].
Configuration of channel style properties with the aid of PLC attributes
All style properties of a channel can be set directly on a variable or a data type in the PLC with the aid ofattributes. This makes it possible to always display a certain symbol with the same style properties withouthaving to reconfigure it every time.
A PLC attribute is specified directly via the declaration of a variable or a data type in curly brackets.
The following syntax applies to the assignment of the channel style properties:
attribute 'TcScope' := '<Property1:value, Property2:value,…>'
Configuration
TC3 Scope View46 Version: 1.9
Example:attribute 'TcScope' := '<LineWidth:3, LineColor:red>'
Any number of channel style properties can be specified in an attribute.
Note here that the X-acquisition and Y-acquisition sometimes have common channel style properties. Forexample, the properties that concern the line or the marks. If two symbols are added to an XY channel inwhich such properties are stored as PLC attributes, the properties of the symbol added last are always set. Aseparate syntax applies to the specification of the unit (Unit property; see: Configuration of units with the aidof PLC attributes [ 100]).
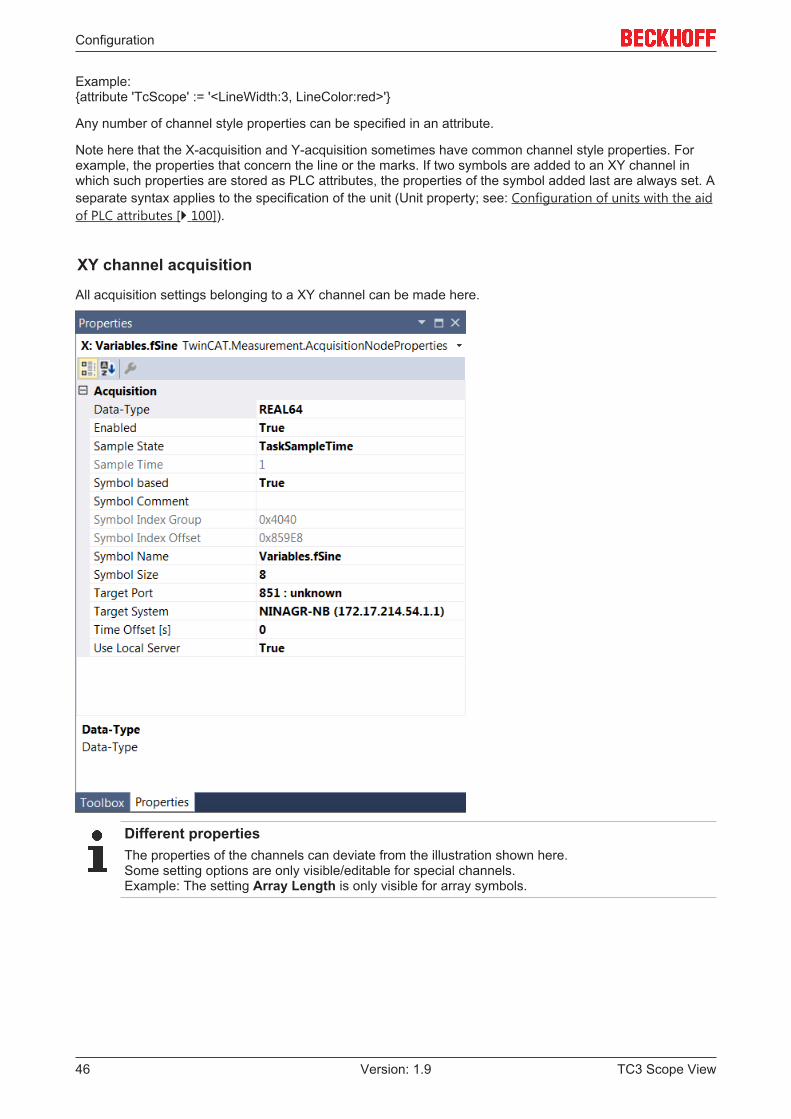
XY channel acquisition
All acquisition settings belonging to a XY channel can be made here.
Different propertiesThe properties of the channels can deviate from the illustration shown here.Some setting options are only visible/editable for special channels.Example: The setting Array Length is only visible for array symbols.

Configuration
TC3 Scope View 47Version: 1.9
Acquisition
Data-Type Indicates the data type of the selected variable.Enabled Here you can decide whether the configured channel should be recorded or not.Oversampling This option is only shown for arrays. The array is interpreted as a variable, and the values of
the individual array elements are displayed contiguously as oversampling values. Thiscorresponds to the behavior of EtherCAT oversampling terminals. The value that can beentered here describes the number of oversampling values to be displayed. By default, thevalue corresponds to the array length. Comparisons: Oversampling recordings [ 163].
Sample State Here you can specify whether the data for the selected variables are to be sampled with theTaskSampleTime or the FreeSampleTime.
Sample Time If the sample state “FreeSampleTime” was selected, you can set the sampling rate here. It isalways greater than the TaskSampleTime.
Symbol based If this option is set, the variables are communicated via the symbol name. If this option is notset, the variables are communicated via the Group and Offset indices, and the input fieldsfor Group and Offset are enabled.
SymbolComment
Here the actual symbol comment is displayed, if such a comment exists.
Symbol IndexGroup
Group index of the variable
Symbol IndexOffset
Offset index of the variable
Symbol Name Symbol name of the selected variable.Symbol Size Shows the size of the variables in bytes.Target Port Shows the variable port on the respective TwinCAT system. A drop-down list can be used to
select the available ports for the selected target system.Target System Indicates the target system selected for a recording. By default this is the target system for
the selected variable.Time Offset [s] This can be used for one-time manipulation of the original timestamp during recording of the
data point. e.g. to compensate path differences of different target systems. The phasedifferences have to be determined manually by the user.
Use LocalServer
If this option is set, the Scope Server installed on the Scope View system is used for therecording. If the option is not set, a connection with the remote server of the target system isestablished.
To change the settings for several channels at the same time, please refer to the chapter Multiple selection[ 161].
5.1.1.3.3 Array Bar Chart
The properties of the individual hierarchy levels of array bar charts are explained below.
The View Detail level, which can be set in the Scope settings, can be used to separate Channel Style andChannel Acquisition at channel level through an additional hierarchy level. Channel Style and ChannelAcquisition are described separately below.

Configuration
TC3 Scope View48 Version: 1.9
Bar chart properties
Here you can enter all the settings relating to a array bar chart.
Configuration
TC3 Scope View 49Version: 1.9
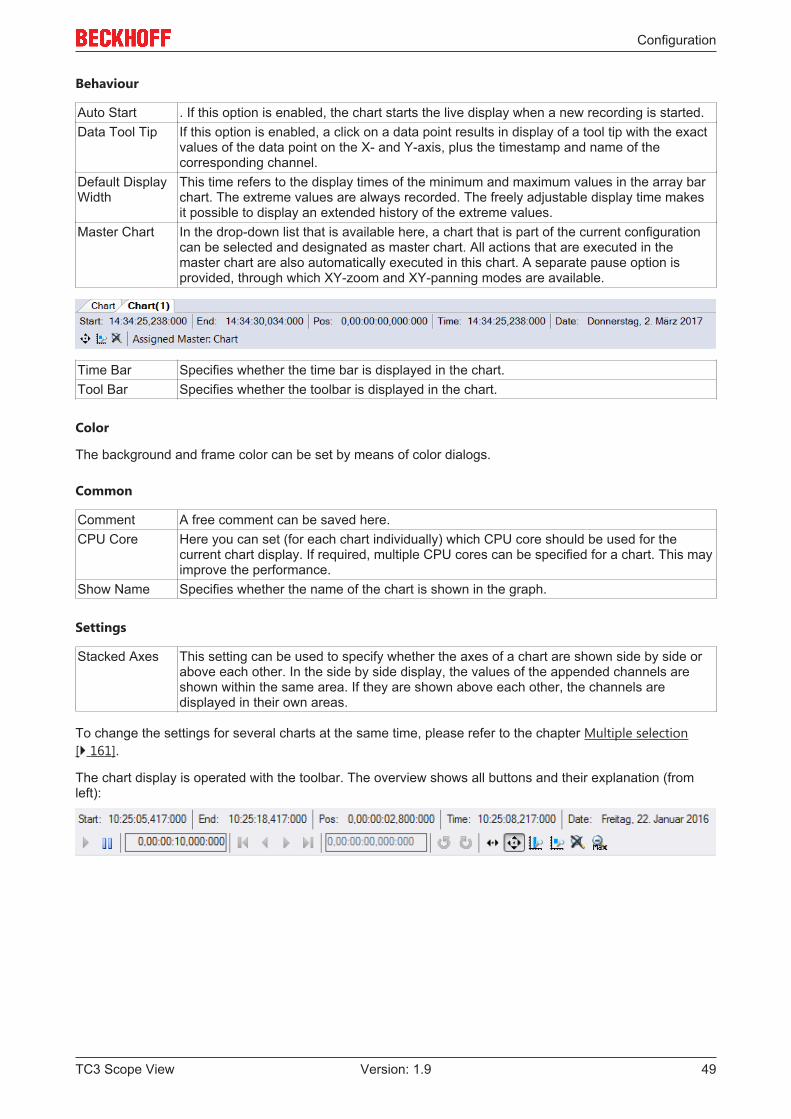
Behaviour
Auto Start . If this option is enabled, the chart starts the live display when a new recording is started.Data Tool Tip If this option is enabled, a click on a data point results in display of a tool tip with the exact
values of the data point on the X- and Y-axis, plus the timestamp and name of thecorresponding channel.
Default DisplayWidth
This time refers to the display times of the minimum and maximum values in the array barchart. The extreme values are always recorded. The freely adjustable display time makesit possible to display an extended history of the extreme values.
Master Chart In the drop-down list that is available here, a chart that is part of the current configurationcan be selected and designated as master chart. All actions that are executed in themaster chart are also automatically executed in this chart. A separate pause option isprovided, through which XY-zoom and XY-panning modes are available.
Time Bar Specifies whether the time bar is displayed in the chart.Tool Bar Specifies whether the toolbar is displayed in the chart.
Color
The background and frame color can be set by means of color dialogs.
Common
Comment A free comment can be saved here.CPU Core Here you can set (for each chart individually) which CPU core should be used for the
current chart display. If required, multiple CPU cores can be specified for a chart. This mayimprove the performance.
Show Name Specifies whether the name of the chart is shown in the graph.
Settings
Stacked Axes This setting can be used to specify whether the axes of a chart are shown side by side orabove each other. In the side by side display, the values of the appended channels areshown within the same area. If they are shown above each other, the channels aredisplayed in their own areas.
To change the settings for several charts at the same time, please refer to the chapter Multiple selection[ 161].
The chart display is operated with the toolbar. The overview shows all buttons and their explanation (fromleft):
Configuration
TC3 Scope View50 Version: 1.9
Play Starts the live display mode. The data currently being accumulated are displayed.Pause The display switches to the pause mode. You can now navigate in the data already
recorded without stopping the recording.Display-Width This time refers to the display times of the minimum and maximum values in the array bar
chart. The extreme values are always recorded. The freely adjustable display time makesit possible to display an extended history of the extreme values.
Scroll buttons The outer scroll buttons move the current display in steps that correspond to the displaywidth. The inner scroll keys move the display only by a tenth of the display width and canbe kept pressed to view the data set.
Position The displayed position can be edited in the Position field in the format hh:mm:ss,fff. Thecolons serve here as separators. If not all units are edited the format is sorted in ascendingorder, starting with seconds.
Undo/RedoTime/Position
This option can be used to undo step changes in the display width or the current position,irrespective of how they were made (e.g. zoom, scroll, etc.). The right mouse button islikewise assigned this function. Once undone, values can be repeated with redo.
PanningHorizontal
In the horizontal panning mode the current display can be shifted along the x-axis byclicking and dragging with the mouse.
Panning Free In the free panning mode the current display can be shifted along the x- and y-axes byclicking and dragging with the mouse.
Zoom Horizontal A new time range for the display can be selected by stretching a rectangle over the x-axis.Zoom Free You can zoom into the current display by stretching a rectangle over the graphic area.Zoom to Default If autoscale is set, this option triggers a zoom to the maximum number of array elements. If
autoscale is disabled, the zoom automatically focuses on the defined limits.Zoom Out Max Scales the x-axis such that all array elements are displayed.
Bar axis properties
All the settings for the axes of array bar charts are described here.
Configuration
TC3 Scope View 51Version: 1.9
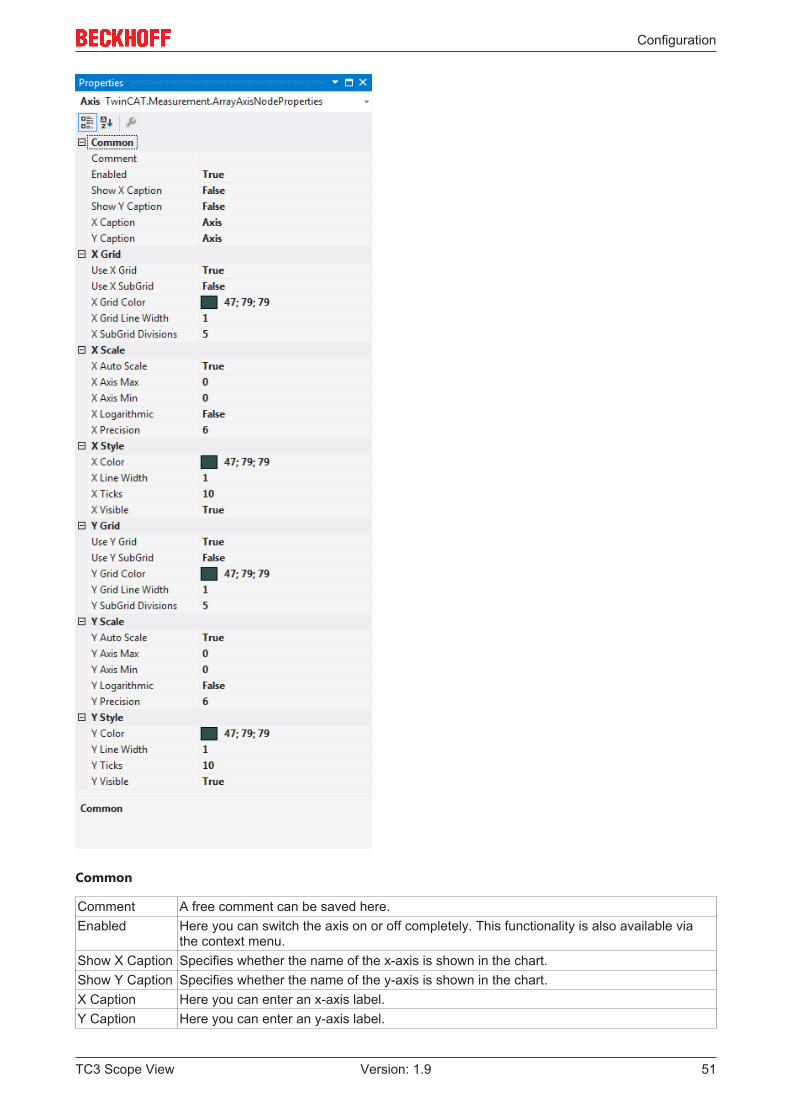
Common
Comment A free comment can be saved here.Enabled Here you can switch the axis on or off completely. This functionality is also available via
the context menu.Show X Caption Specifies whether the name of the x-axis is shown in the chart.Show Y Caption Specifies whether the name of the y-axis is shown in the chart.X Caption Here you can enter an x-axis label.Y Caption Here you can enter an y-axis label.

Configuration
TC3 Scope View52 Version: 1.9
X Grid
Use X Grid The X-subdivisions of the axis can be shown or hidden here.Use X SubGrid Auxiliary lines for the finer X-subdivision of the main grid can be shown or hidden here.
Auxiliary lines have no axis labeling.X Grid Color Color of the gridX Grid LineWidth
Line width of the grid in pixels
X SubGridDivisions
Number of areas into which the main grid is subdivided by auxiliary lines.In the case of logarithmic scaling the auxiliary lines for subdivision are shown only in theset number if the range of values per tick is precisely one decade. Otherwise the displayedauxiliary line shows the decades not displayed in the main grid.
X Scale
X Auto Scale If Auto Scale is active, each axis is scaled such that the last-known minimum andmaximum of all connected channels lie within the display range.
X Axis Max If Auto Scale is inactive, the maximum value can be edited directly.X Axis Min If Auto Scale is inactive, the minimum value can be edited directly.X Logarithmic Switches between logarithmic and linear scaling of the axes.X Precision Here you can specify the number of significant digits for the axis labeling. It corresponds to
the number of visible digits on the axis.
X Style
X Color Color of the axisX Line Width Line width in pixelsX Ticks Maximum number of subdivisions. If there is not enough space for the selected number of
ticks, these are automatically reduced in the chart.In the case of logarithmic scaling the number of ticks depends on the displayed range ofvalues and can thus deviate from the settings.
X Visible Specifies whether the axis is shown or hidden in the chart.
Y Grid
Use Y Grid The Y-subdivisions of the axis can be shown or hidden here.Use Y SubGrid Auxiliary lines for the finer Y-subdivision of the main grid can be shown or hidden here.
Auxiliary lines have no axis labeling.Y Grid Color Color of the gridY Grid LineWidth
Line width of the grid in pixels
Y SubGridDivisions
Number of areas into which the main grid is subdivided by auxiliary lines.In the case of logarithmic scaling the auxiliary lines for subdivision are shown only in theset number if the range of values per tick is precisely one decade. Otherwise the displayedauxiliary line shows the decades not displayed in the main grid.
Y Scale
Y Auto Scale If Auto Scale is active, each axis is scaled such that the last-known minimum andmaximum of all connected channels lie within the display range.
Y Axis Max If Auto Scale is inactive, the maximum value can be edited directly.Y Axis Min If Auto Scale is inactive, the minimum value can be edited directly.Y Logarithmic Switches between logarithmic and linear scaling of the axes.Y Precision Here you can specify the number of significant digits for the axis labeling. It corresponds to
the number of visible digits on the axis.

Configuration
TC3 Scope View 53Version: 1.9
Y Style
Y Color Color of the axisY Line Width Line width in pixelsY Ticks Maximum number of subdivisions. If there is not enough space for the selected number of
ticks, these are automatically reduced in the chart.In the case of logarithmic scaling the number of ticks depends on the displayed range ofvalues and can thus deviate from the settings.
Y Visible Specifies whether the axis is shown or hidden in the chart.
To change the settings for several axes at the same time, please refer to the chapter Multiple selection[ 161].
Bar channel style
All Style properties of array bar chart channels are explained here.
Common
Comment A free comment can be saved here. If applicable the comment will be adopted from theconnected ADS symbol.
Visible Here you can set whether the channel should be displayed in the chart.

Configuration
TC3 Scope View54 Version: 1.9
Line
Antialias This option decides how the lines will be drawn. Antialias is "nicer" but requires considerablymore computing. This has an effect in particular if there are many channels with largemovements.
Graph Type Here you can switch between different display types. The default value for an array bar chartis Bar. Other options are: Line and Stair.
Line Color Graph colorLine Width Line width of the chart. The line width 1 requires least computing.Show Max If the option is set to TRUE, the maximum values for the set display width are shown.Show Min If the option is set to TRUE, the minimum values for the set display width are shown.
Marks
Mark Color Color of the interpolation point markersMarks Selecting the visibility of markings → On (permanently visible) | Off (markings switched off).Mark Size Size of the interpolation point markers
Modify
BitMask In this field a value can be entered with which the display value is masked, provided it is notof the type floating point. This means that the value of the channel is ANDed with the binaryvalue of the mask. This helps you, for example, to observe individual bits of a status byte.
X Offset A free offset can be added to the function value of the channel in the offset field.X Scale Factor The display value of a channel can be changed with the scale factor.Y Offset A free offset can be added to the function value of the channel in the offset field.Y Scale Factor The display value of a channel can be changed with the scale factor.
Unit
Unit This property allows the physical unit of the respective channel to be configured. This can bedone with the aid of the "Unit Wizard", which can be opened using the button on the right inthe field. A further option is to define the units beforehand as attributes in the PLC code.These are then read out directly and entered in the Unit field. Detailed information on theunits and their configuration options can be taken from the section Units [ 85].
To change the settings for several channels at the same time, please refer to the chapter Multiple selection[ 161].
Configuration of channel style properties with the aid of PLC attributes
All style properties of a channel can be set directly on a variable or a data type in the PLC with the aid ofattributes. This makes it possible to always display a certain symbol with the same style properties withouthaving to reconfigure it every time.
A PLC attribute is specified directly via the declaration of a variable or a data type in curly brackets.
The following syntax applies to the assignment of the channel style properties:
attribute 'TcScope' := '<Property1:value, Property2:value,…>'
Example:attribute 'TcScope' := '<LineWidth:3, LineColor:red>'
Any number of channel style properties can be specified in an attribute.

Configuration
TC3 Scope View 55Version: 1.9
A separate syntax applies to the specification of the unit (Unit property; see: Configuration of units with theaid of PLC attributes [ 100]).
Bar channel acquisition
This section explains all settings for the channel acquisition of array bar chart channels.

Configuration
TC3 Scope View56 Version: 1.9
Acquisition
Array Length Indicates the length of selected arrays, which is also the maximum displayed on the x-axis.Data-Type Indicates the data type of the selected variable.Enabled Here you can decide whether the configured channel should be recorded or not.Sample State Here you can specify whether the data for the selected variables are to be sampled with the
TaskSampleTime or the FreeSampleTime. The default value for array bar charts is“FreeSample”, since it makes no sense to scan a bar display so quickly that it is not possiblefor the human eye to observe it.
Sample Time If the sample state “FreeSampleTime” was selected, you can set the sampling rate here. It isalways greater than the “TaskSampleTime”. The default setting for array bar charts is 100ms. This is a sampling rate for bar charts that is comfortable for the human eye.
Symbol based If this option is set, the variables are communicated via the symbol name. If this option is notset, the variables are communicated via the Group and Offset indices, and the input fieldsfor Group and Offset are enabled.
SymbolComment
Here the actual symbol comment is displayed, if such a comment exists.
Symbol IndexGroup
Group index of the variable
Symbol IndexOffset
Offset index of the variable
Symbol Name Symbol name of the selected variableSymbol Size Shows the size of the variables in bytes.Target Port Shows the variable port on the respective TwinCAT system. A drop-down box can be used
to select the available ports for the selected target system.Target System Indicates the target system selected for a recording. By default this is the target system for
the selected variable.Time Offset [s] This can be used for one-time manipulation of the original time stamp during recording of the
data point. e.g. to compensate path differences of different target systems. The phasedifferences have to be determined manually by the user.
Use LocalServer
If this option is set, the Scope Server installed on the Scope View system is used for therecording. If the option is not set, the system tries to connect to the remote server of thetarget system.
To change the settings for several channels at the same time, please refer to the chapter Multiple selection[ 161].
5.1.1.3.4 Single bar chart
All the properties of the individual hierarchy levels of single bar charts are explained below.

Configuration
TC3 Scope View 57Version: 1.9
Single bar chart properties
All settings assigned to the single bar chart can be made here.

Configuration
TC3 Scope View58 Version: 1.9
Behaviour
AutoStart If this option is enabled, the chart starts the live display when a new recording isstarted.
Data Tool Tip If this option is activated, a tool tip showing the exact values of a data point isdisplayed when clicking on the data point. The time stamp and the name ofcorresponding channel are also shown.
Default Display Width This time specifies the standard width of the associated chart. This value determinesthe period between the displayed minimum and maximum values.
Master Chart In the drop-down list that is available here, a chart that is part of the currentconfiguration can be selected and designated as master chart. All actions that areexecuted in the master chart are also automatically executed in this chart. Aseparate pause option is provided, through which Y-zoom and Y-panning modes areavailable. An overview chart can also be displayed.
Time Bar Specifies whether the time bar (information bar with time values) is displayed in thechart.
Tool Bar Specifies whether the toolbar is displayed in the chart.
Color
Border Color Defines the background color of the chart.Gradient Background Provides for a color gradient in the background color.

Configuration
TC3 Scope View 59Version: 1.9
Common
Comment A free comment can be saved here.CPU Core Here you can set (for each chart individually) which CPU core should be used for the
current chart display. If required, multiple CPU cores can be specified for a chart.This may improve the performance.
Refresh Time Defines a rate at which the chart in the user interface is refreshed.Show Name Specifies whether the name of the chart is shown in the graph.
Settings
Scale on Zoom If this option is selected, the chart instructs the Y-axes to perform autoscaling after azoom or panning action. The selected area can thus be widened.
Stacked Axes With this setting you can select whether the various axis groups are arranged on ahorizontal line or underneath one another.
To change the settings for several charts at the same time, please refer to the chapter Multiple selection[ 161].
The chart display is operated with the toolbar. The overview shows all buttons and their explanation (fromleft):
Play Starts the live display mode. The data currently being accumulated are displayed.Break The display switches to the pause mode. You can now navigate in the data already
recorded without stopping the recording.Display-Width The current display width is displayed here. It can be edited in the format
hh:mm:ss,fff. The zoom function works down to the µs range.Scroll buttons The outer scroll buttons move the current display in steps that correspond to the
display width. The inner scroll keys move the display only by a tenth of the displaywidth and can be kept pressed to view the data set.
Position Shows the position. It can be edited in the format hh:mm:ss,fff. The colons are usedas separators. If not all units are edited the format is sorted in ascending order,starting with seconds.
Undo/Redo Time/Position
This option can be used to undo step changes in the display width or the currentposition, irrespective of how they were made (e.g. zoom, scroll, etc.). The rightmouse button is likewise assigned this function. Once undone, values can berepeated with redo.
Panning Vertical In the vertical panning mode the current display can be shifted along the Y-axis byclicking and dragging.
Zoom Vertical A new value range for the Y-axis can be selected by stretching a rectangle over theaxis.
Zoom to Default Carries out an autoscale on all axes. The display range is reset to the default displaytime.
Zoom Out Max Sets the display range to the maximum recording length.Overview Use the Overview option to display a chart within the chart. The signal range
currently shown in the main chart is highlighted in the Overview Chart. In addition theoverview chart offers an absolute time axis for the entire recording duration.
The current recording times are displayed in the chart toolbar:

Configuration
TC3 Scope View60 Version: 1.9
Start-Time The common starting point of the recordings of all connected channels. The start timedefines the zero point of the recording.
End-Time Maximum common time of all connected channels. The end time thus marks the finalvalue of the recording. The difference between the end time and start time is maximallyas large as the record time set (see Scope nodes [ 23]).
Position The position time represents the zero point of the current chart, i.e. the time from thestart time to the beginning of the display.
Time Absolute time at the chart originDate Absolute date at the chart origin
Single bar axis properties
Settings can be made separately for each available single bar axis here.
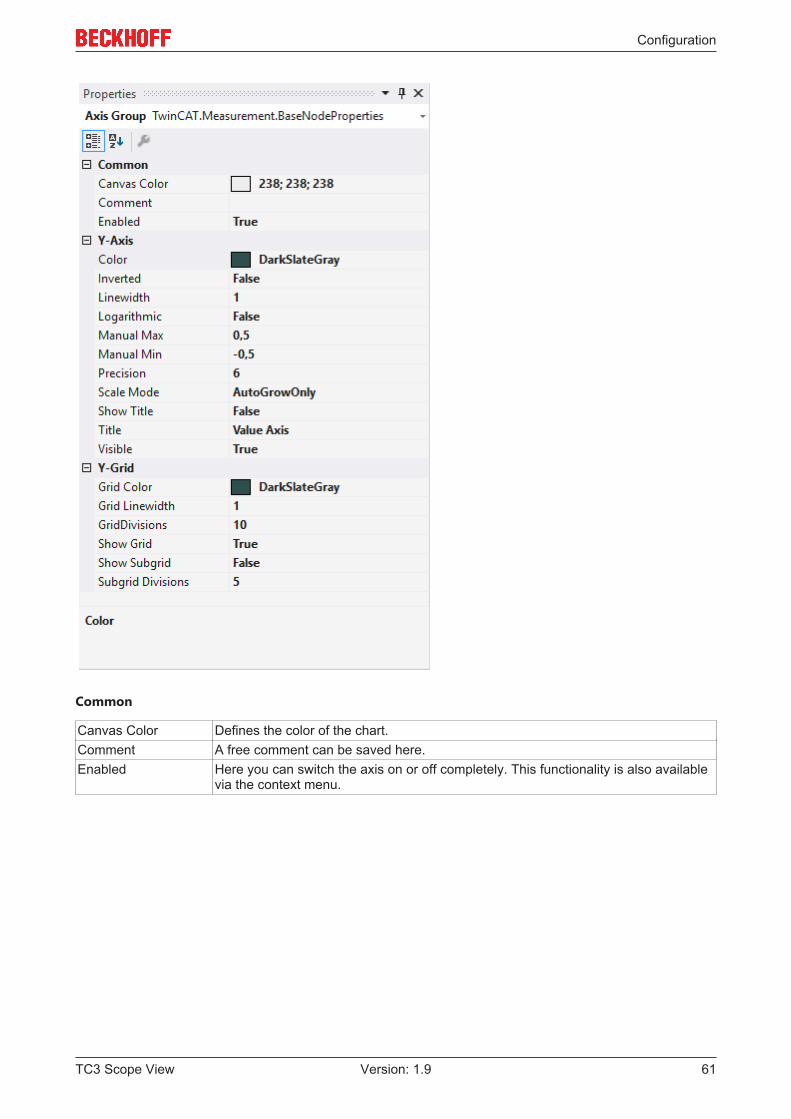
Configuration
TC3 Scope View 61Version: 1.9
Common
Canvas Color Defines the color of the chart.Comment A free comment can be saved here.Enabled Here you can switch the axis on or off completely. This functionality is also available
via the context menu.

Configuration
TC3 Scope View62 Version: 1.9
Y-axis
Color Color of the axisLinewidth Line width in pixelsLogarithmic Switches between logarithmic and linear scaling of the axes.Manual Max If the Scale Mode is set to MinMax, the maximum value can be edited directly.Manual Min If the Scale Mode is set to MinMax, the minimum value can be edited directly.Precision Here you can specify the number of significant digits for the axis labeling. It
corresponds to the number of visible digits on the axis.Scale Mode Two auto-scaling modes are available for selection. The default mode is
AutoGrowOnly. This means the y-axis always scales to the historic maximum, until arescale is carried out for the current view. Alternatively, AutoGrowNShrink can beselected. This mode always automatically adjusts the maximum of the y-axis to themaximum in the current view (display width).
Show Title Specifies whether the name of the axis is shown in the chart.Title Defines the name of the axis.Visible Specifies whether the axis is shown or hidden in the chart.
Y-Grid
Grid Color Color of the grid.Grid Linewidth Line width of the grid in pixelsGrid Divisions Maximum number of subdivisions. If there is not enough space for the selected
number of ticks, these are automatically reduced in the chart.In the case of logarithmic scaling the number of ticks depends on the displayedrange of values and can thus deviate from the settings.
Show Grid The subdivision of the axis can be shown or hidden here.Show Subgrid Auxiliary lines for the finer Y-subdivision of the main grid can be shown or hidden
here. These auxiliary lines have no axis labeling.Subgrid Divisions Number of areas into which the main grid is subdivided by auxiliary lines.
In the case of logarithmic scaling the auxiliary lines for subdivision are shown only inthe set number if the range of values per tick is precisely one decade. Otherwise thedisplayed auxiliary line shows the decades not displayed in the main grid.
To change the settings for several axes at the same time, please refer to the chapter Multiple selection[ 161].
Single Bar Channel
All settings belonging to a single bar channel can be made here.
Common
Enabled No data are acquired for the channel if Enabled is set to false.Visible Here you can set whether the channel should be displayed in the chart.

Configuration
TC3 Scope View 63Version: 1.9
Line
Antialias This option decides how the lines will be drawn. The computing time is longer withantialias. This has an effect in particular if there are many channels with largemovements.
Graph Type Here you can switch between different display types. The default value with a singlebar chart is bar. Other options are: Line and Stair.
Line Color Graph Colour.
Marks
Mark Color Color of the interpolation point marking.Mark Size Size of the interpolation point marking.Mark State Selecting the visibility of markings → On (permanently visible) | Off (markings
switched off).
Min/Max
Show Max If the option is set to TRUE, the maximum values for the set display width areshown.
Show Min If the option is set to TRUE, the minimum value for the set display width is shown.
Position
Position Indicates the position of the channel on the axis.
To change the settings for several channels at the same time, please refer to the chapter Multiple selection[ 161].
Configuration of channel style properties with the aid of PLC attributes
All style properties of a channel can be set directly on a variable or a data type in the PLC with the aid ofattributes. This makes it possible to always display a certain symbol with the same style properties withouthaving to reconfigure it every time.
A PLC attribute is specified directly via the declaration of a variable or a data type in curly brackets.
The following syntax applies to the assignment of the channel style properties:
attribute 'TcScope' := '<Property1:value, Property2:value,…>'
Example:attribute 'TcScope' := '<LineWidth:3, LineColor:red>'
Any number of channel style properties can be specified in an attribute.
A separate syntax applies to the specification of the unit (Unit property; see: Configuration of units with theaid of PLC attributes [ 100]).
Single bar channel acquisition
All the settings for the channel acquisition interpreter of single bar charts are explained here.
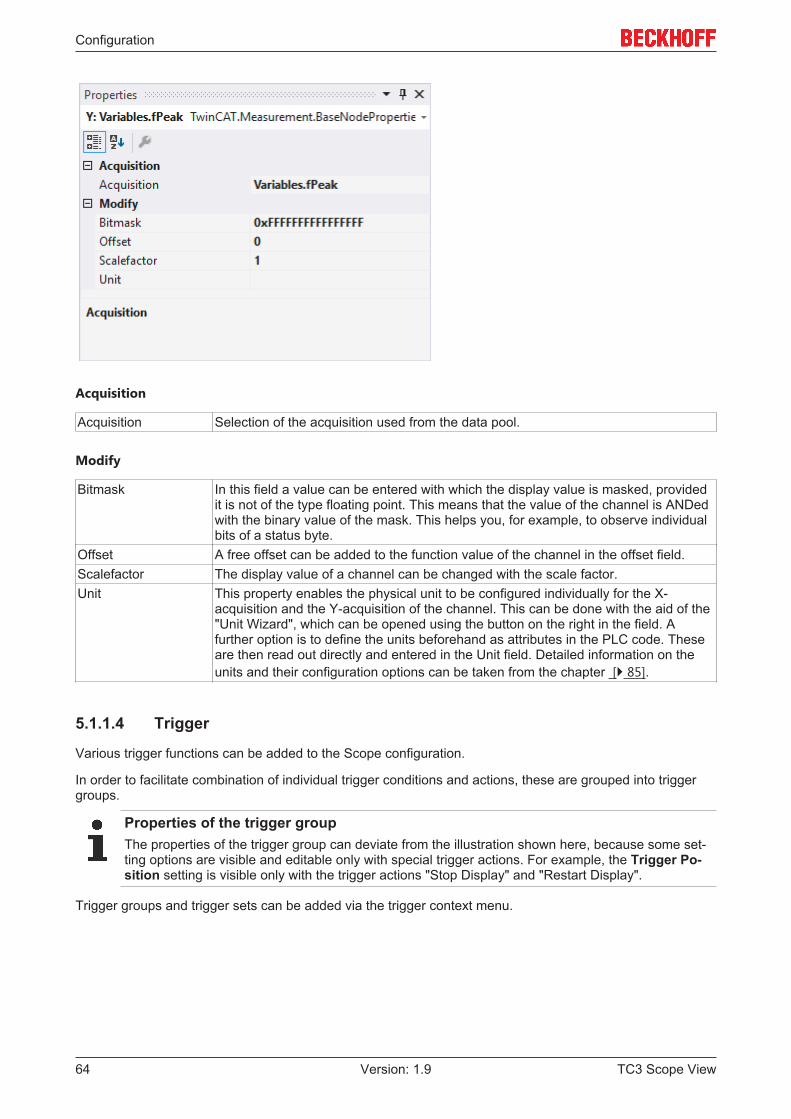
Configuration
TC3 Scope View64 Version: 1.9
Acquisition
Acquisition Selection of the acquisition used from the data pool.
Modify
Bitmask In this field a value can be entered with which the display value is masked, providedit is not of the type floating point. This means that the value of the channel is ANDedwith the binary value of the mask. This helps you, for example, to observe individualbits of a status byte.
Offset A free offset can be added to the function value of the channel in the offset field.Scalefactor The display value of a channel can be changed with the scale factor.Unit This property enables the physical unit to be configured individually for the X-
acquisition and the Y-acquisition of the channel. This can be done with the aid of the"Unit Wizard", which can be opened using the button on the right in the field. Afurther option is to define the units beforehand as attributes in the PLC code. Theseare then read out directly and entered in the Unit field. Detailed information on theunits and their configuration options can be taken from the chapter [ 85].
5.1.1.4 Trigger
Various trigger functions can be added to the Scope configuration.
In order to facilitate combination of individual trigger conditions and actions, these are grouped into triggergroups.
Properties of the trigger groupThe properties of the trigger group can deviate from the illustration shown here, because some set-ting options are visible and editable only with special trigger actions. For example, the Trigger Po-sition setting is visible only with the trigger actions "Stop Display" and "Restart Display".
Trigger groups and trigger sets can be added via the trigger context menu.
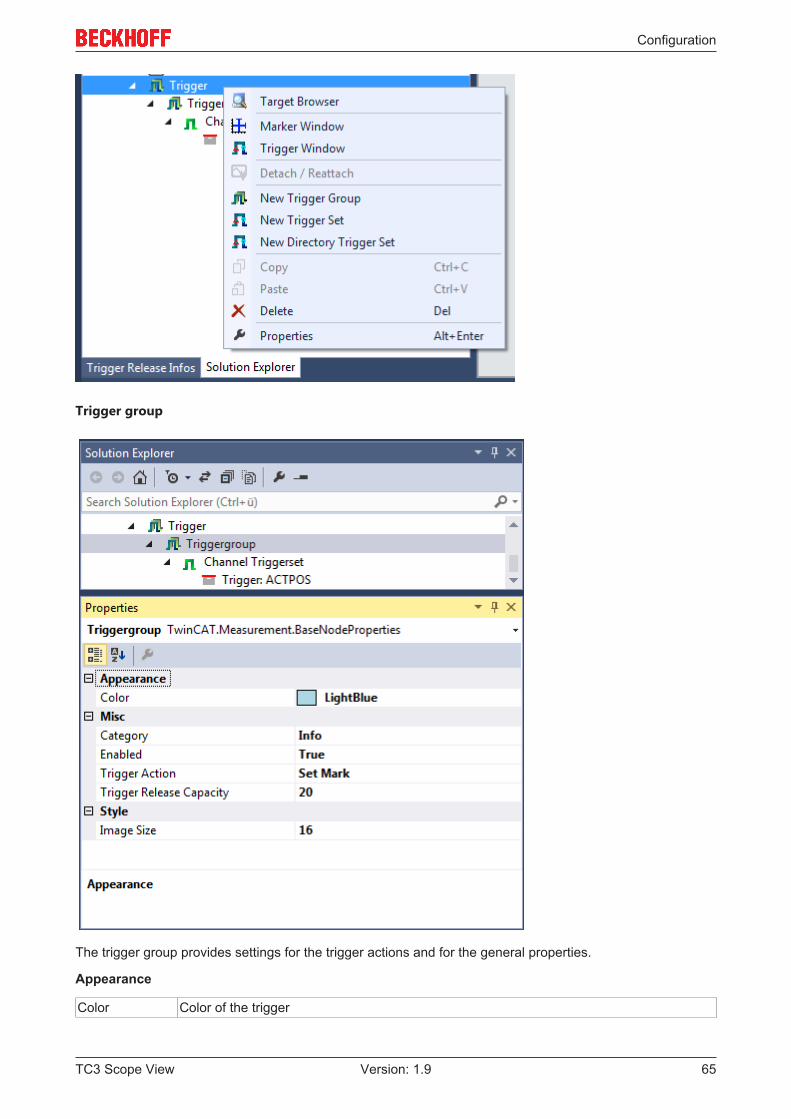
Configuration
TC3 Scope View 65Version: 1.9
Trigger group
The trigger group provides settings for the trigger actions and for the general properties.
Appearance
Color Color of the trigger

Configuration
TC3 Scope View66 Version: 1.9
Misc
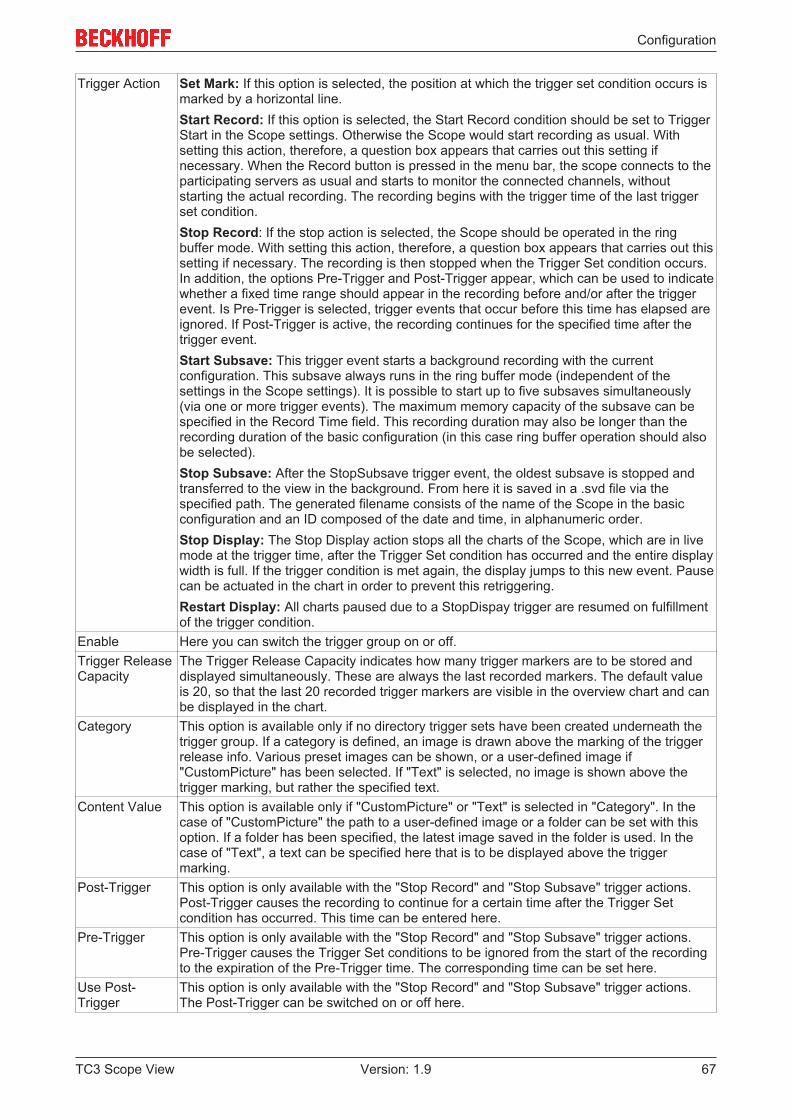
Configuration
TC3 Scope View 67Version: 1.9
Trigger Action Set Mark: If this option is selected, the position at which the trigger set condition occurs ismarked by a horizontal line.Start Record: If this option is selected, the Start Record condition should be set to TriggerStart in the Scope settings. Otherwise the Scope would start recording as usual. Withsetting this action, therefore, a question box appears that carries out this setting ifnecessary. When the Record button is pressed in the menu bar, the scope connects to theparticipating servers as usual and starts to monitor the connected channels, withoutstarting the actual recording. The recording begins with the trigger time of the last triggerset condition.Stop Record: If the stop action is selected, the Scope should be operated in the ringbuffer mode. With setting this action, therefore, a question box appears that carries out thissetting if necessary. The recording is then stopped when the Trigger Set condition occurs.In addition, the options Pre-Trigger and Post-Trigger appear, which can be used to indicatewhether a fixed time range should appear in the recording before and/or after the triggerevent. Is Pre-Trigger is selected, trigger events that occur before this time has elapsed areignored. If Post-Trigger is active, the recording continues for the specified time after thetrigger event.Start Subsave: This trigger event starts a background recording with the currentconfiguration. This subsave always runs in the ring buffer mode (independent of thesettings in the Scope settings). It is possible to start up to five subsaves simultaneously(via one or more trigger events). The maximum memory capacity of the subsave can bespecified in the Record Time field. This recording duration may also be longer than therecording duration of the basic configuration (in this case ring buffer operation should alsobe selected).Stop Subsave: After the StopSubsave trigger event, the oldest subsave is stopped andtransferred to the view in the background. From here it is saved in a .svd file via thespecified path. The generated filename consists of the name of the Scope in the basicconfiguration and an ID composed of the date and time, in alphanumeric order.Stop Display: The Stop Display action stops all the charts of the Scope, which are in livemode at the trigger time, after the Trigger Set condition has occurred and the entire displaywidth is full. If the trigger condition is met again, the display jumps to this new event. Pausecan be actuated in the chart in order to prevent this retriggering.Restart Display: All charts paused due to a StopDispay trigger are resumed on fulfillmentof the trigger condition.
Enable Here you can switch the trigger group on or off.Trigger ReleaseCapacity
The Trigger Release Capacity indicates how many trigger markers are to be stored anddisplayed simultaneously. These are always the last recorded markers. The default valueis 20, so that the last 20 recorded trigger markers are visible in the overview chart and canbe displayed in the chart.
Category This option is available only if no directory trigger sets have been created underneath thetrigger group. If a category is defined, an image is drawn above the marking of the triggerrelease info. Various preset images can be shown, or a user-defined image if"CustomPicture" has been selected. If "Text" is selected, no image is shown above thetrigger marking, but rather the specified text.
Content Value This option is available only if "CustomPicture" or "Text" is selected in "Category". In thecase of "CustomPicture" the path to a user-defined image or a folder can be set with thisoption. If a folder has been specified, the latest image saved in the folder is used. In thecase of "Text", a text can be specified here that is to be displayed above the triggermarking.
Post-Trigger This option is only available with the "Stop Record" and "Stop Subsave" trigger actions.Post-Trigger causes the recording to continue for a certain time after the Trigger Setcondition has occurred. This time can be entered here.
Pre-Trigger This option is only available with the "Stop Record" and "Stop Subsave" trigger actions.Pre-Trigger causes the Trigger Set conditions to be ignored from the start of the recordingto the expiration of the Pre-Trigger time. The corresponding time can be set here.
Use Post-Trigger
This option is only available with the "Stop Record" and "Stop Subsave" trigger actions.The Post-Trigger can be switched on or off here.

Configuration
TC3 Scope View68 Version: 1.9
Use Pre-Trigger This option is only available with the "Stop Record" and "Stop Subsave" trigger actions.The Pre-Trigger can be switched on or off here.
Record Time This option is only available with the trigger action "Start Subsave". The recording time forthe subsaves can be entered here. This recording duration may also be longer than therecording duration of the basic configuration (in this case ring buffer operation should alsobe selected).
Save Path This option is only available with the "Stop Subsave" trigger action. The path to the file inwhich the subsave is to be saved can be entered here.
Clear Chart This option is only available with the "Stop Display" and "Restart Display" trigger actions. Ifthis option is set, the chart range visible on the display is deleted when the Trigger Setcondition occurs again. It can be seen how the chart is continued until the next triggerevent.
Trigger Position This option is only available with the "Stop Display" and "Restart Display" trigger actions.The trigger position can be used to select the percentage of the display (display width)before or after the trigger event (for example: positive 0 pass of the green signal at 10 % of2.5 s = 0.25 s).
Auto delete (for Stop SubSave only)
Auto delete Defines the mode in which the auto delete function is to run. If set to "Disabled", no files willbe deleted. If set to "Capacity", the oldest file created will be deleted if more than the numberof files specified in "Delete more than" have been saved. If set to "OlderThan", all files olderthan the time specified in "Delete older than" will be deleted. The option"CapacityOrOlderThan" is a combination of "Capacity" and "OlderThan", i.e. files are deletedif the conditions for one of the two options are satisfied.
Delete morethan
This option defines when and with how many created files the oldest is to be deleted. Theoption is only active as long as "Capacity" or "CapacityOrOlderThan" is selected in "AutoDelete".
Delete olderthan
This option defines the number of seconds after which a file is to be deleted with auto delete.The option is only active as long as "OlderThan" or "CapacityOrOlderThan" is selected in"Auto Delete".
Channel Trigger Set
Each channel trigger set can be regarded as a self-contained trigger condition. The action report of thetrigger group defines what happens when a trigger group is triggered.
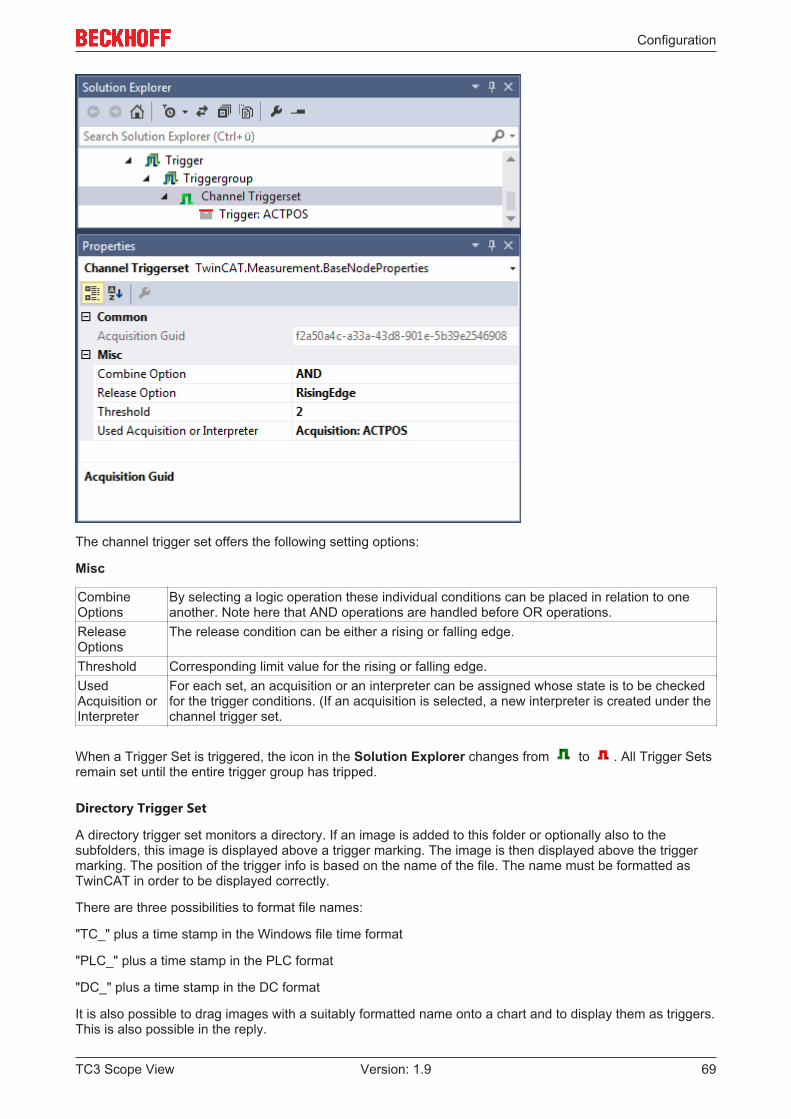
Configuration
TC3 Scope View 69Version: 1.9
The channel trigger set offers the following setting options:
Misc
CombineOptions
By selecting a logic operation these individual conditions can be placed in relation to oneanother. Note here that AND operations are handled before OR operations.
ReleaseOptions
The release condition can be either a rising or falling edge.
Threshold Corresponding limit value for the rising or falling edge.UsedAcquisition orInterpreter
For each set, an acquisition or an interpreter can be assigned whose state is to be checkedfor the trigger conditions. (If an acquisition is selected, a new interpreter is created under thechannel trigger set.
When a Trigger Set is triggered, the icon in the Solution Explorer changes from to . All Trigger Setsremain set until the entire trigger group has tripped.
Directory Trigger Set
A directory trigger set monitors a directory. If an image is added to this folder or optionally also to thesubfolders, this image is displayed above a trigger marking. The image is then displayed above the triggermarking. The position of the trigger info is based on the name of the file. The name must be formatted asTwinCAT in order to be displayed correctly.
There are three possibilities to format file names:
"TC_" plus a time stamp in the Windows file time format
"PLC_" plus a time stamp in the PLC format
"DC_" plus a time stamp in the DC format
It is also possible to drag images with a suitably formatted name onto a chart and to display them as triggers.This is also possible in the reply.
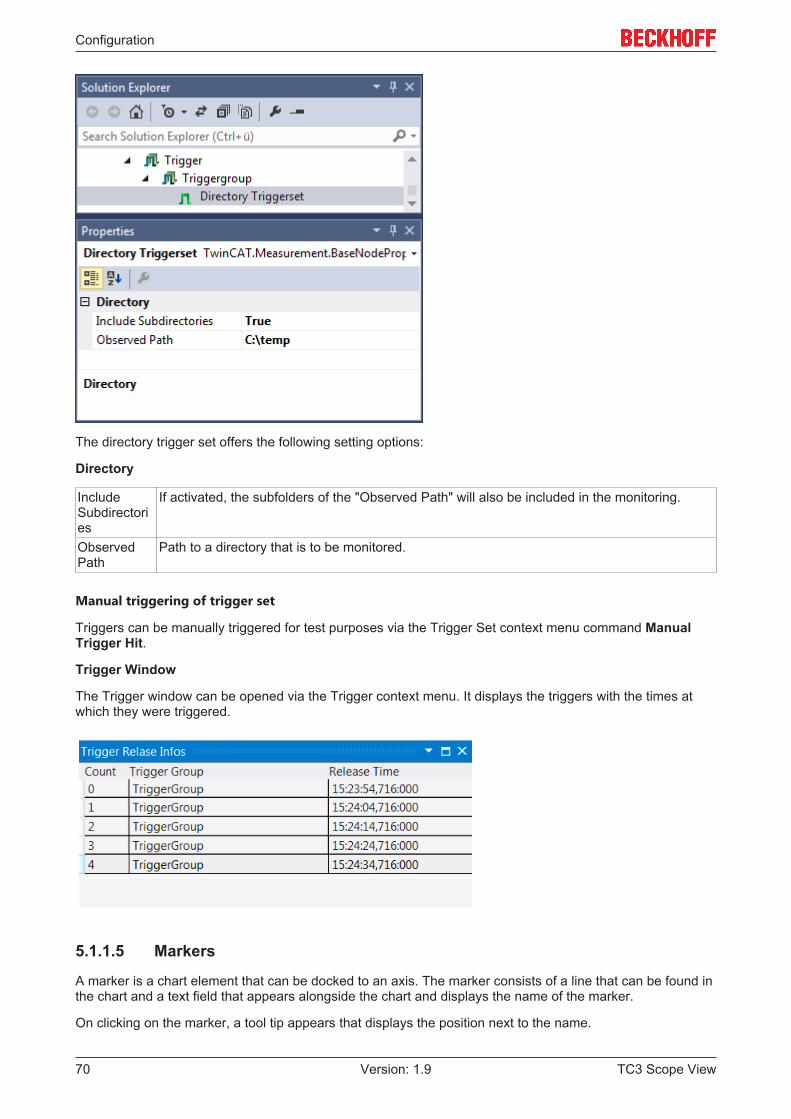
Configuration
TC3 Scope View70 Version: 1.9
The directory trigger set offers the following setting options:
Directory
IncludeSubdirectories
If activated, the subfolders of the "Observed Path" will also be included in the monitoring.
ObservedPath
Path to a directory that is to be monitored.
Manual triggering of trigger set
Triggers can be manually triggered for test purposes via the Trigger Set context menu command ManualTrigger Hit.
Trigger Window
The Trigger window can be opened via the Trigger context menu. It displays the triggers with the times atwhich they were triggered.
5.1.1.5 Markers
A marker is a chart element that can be docked to an axis. The marker consists of a line that can be found inthe chart and a text field that appears alongside the chart and displays the name of the marker.
On clicking on the marker, a tool tip appears that displays the position next to the name.
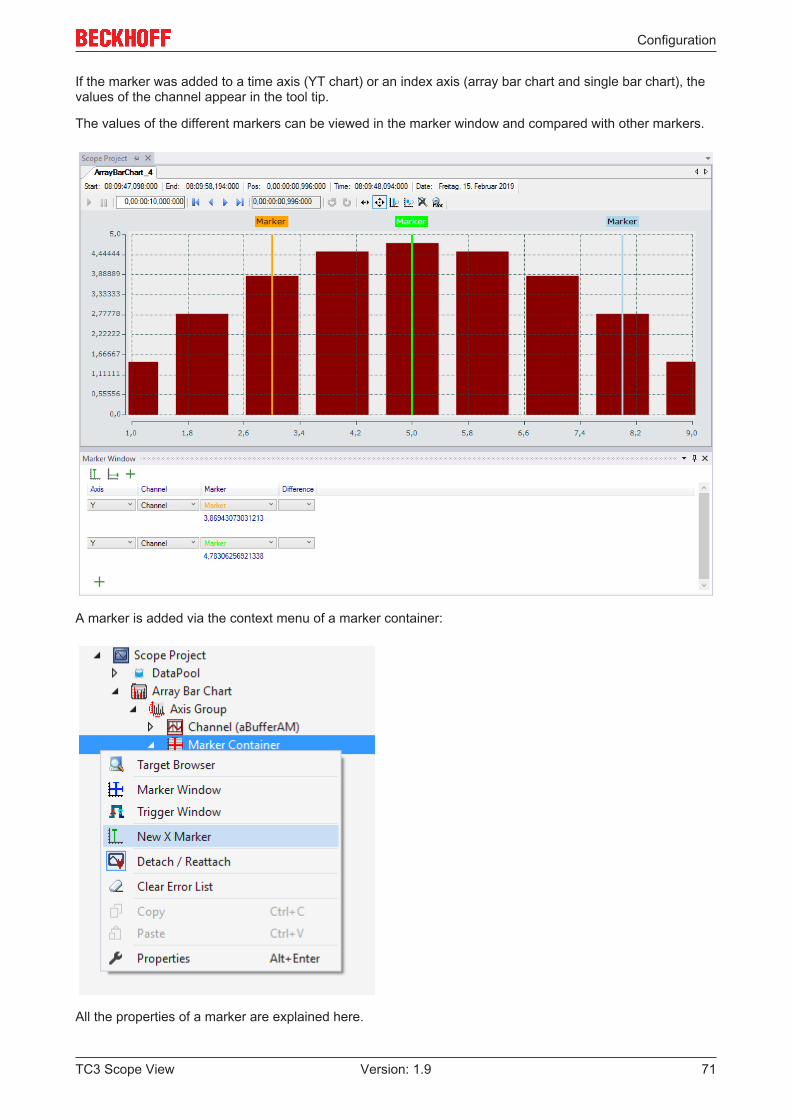
Configuration
TC3 Scope View 71Version: 1.9
If the marker was added to a time axis (YT chart) or an index axis (array bar chart and single bar chart), thevalues of the channel appear in the tool tip.
The values of the different markers can be viewed in the marker window and compared with other markers.
A marker is added via the context menu of a marker container:
All the properties of a marker are explained here.
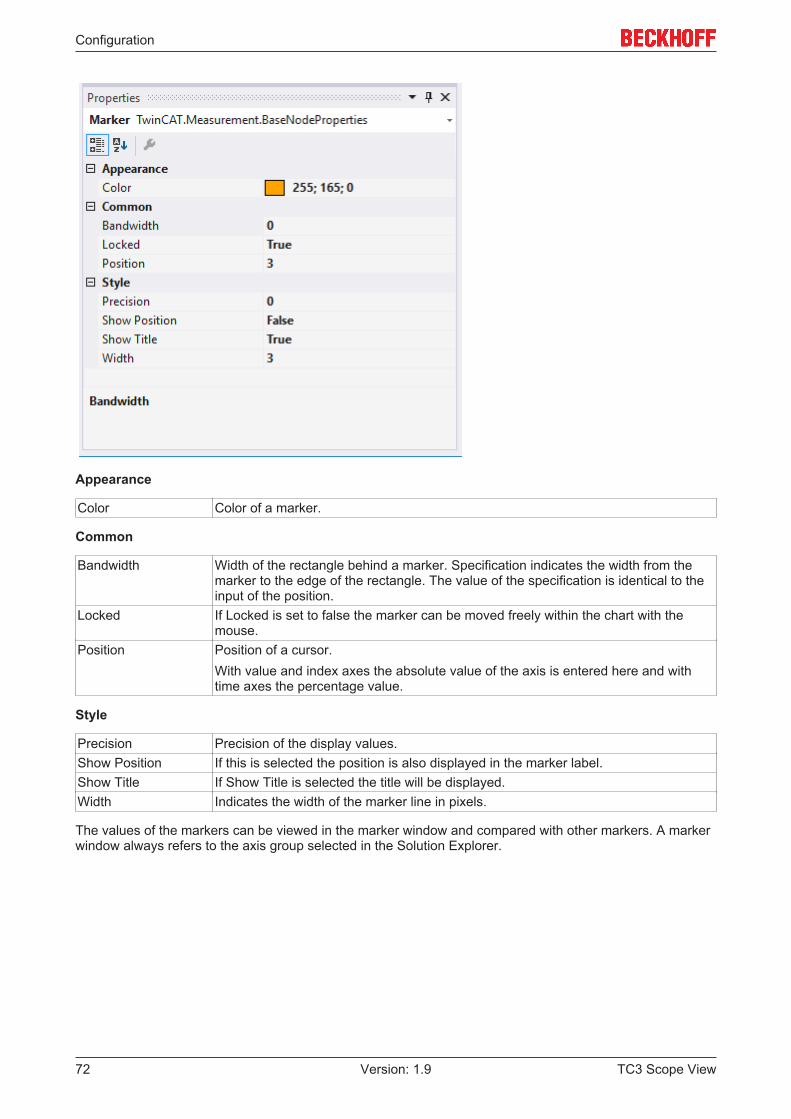
Configuration
TC3 Scope View72 Version: 1.9
Appearance
Color Color of a marker.
Common
Bandwidth Width of the rectangle behind a marker. Specification indicates the width from themarker to the edge of the rectangle. The value of the specification is identical to theinput of the position.
Locked If Locked is set to false the marker can be moved freely within the chart with themouse.
Position Position of a cursor.With value and index axes the absolute value of the axis is entered here and withtime axes the percentage value.
Style
Precision Precision of the display values.Show Position If this is selected the position is also displayed in the marker label.Show Title If Show Title is selected the title will be displayed.Width Indicates the width of the marker line in pixels.
The values of the markers can be viewed in the marker window and compared with other markers. A markerwindow always refers to the axis group selected in the Solution Explorer.
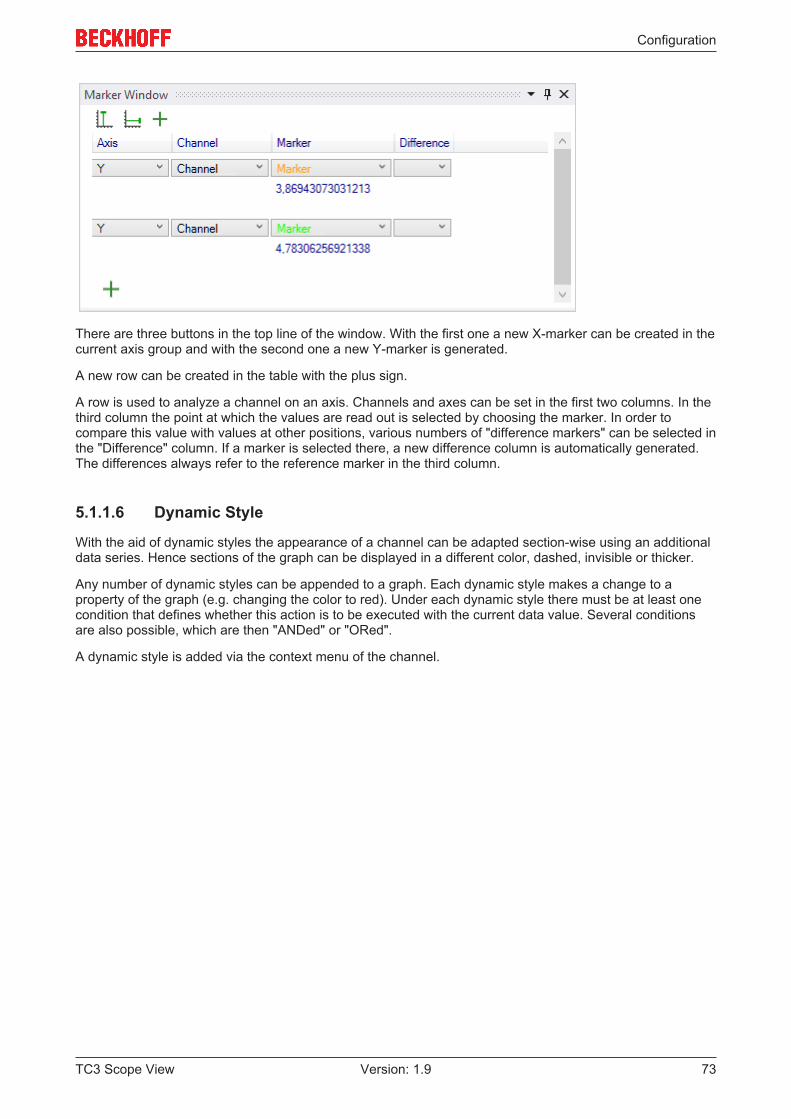
Configuration
TC3 Scope View 73Version: 1.9
There are three buttons in the top line of the window. With the first one a new X-marker can be created in thecurrent axis group and with the second one a new Y-marker is generated.
A new row can be created in the table with the plus sign.
A row is used to analyze a channel on an axis. Channels and axes can be set in the first two columns. In thethird column the point at which the values are read out is selected by choosing the marker. In order tocompare this value with values at other positions, various numbers of "difference markers" can be selected inthe "Difference" column. If a marker is selected there, a new difference column is automatically generated.The differences always refer to the reference marker in the third column.
5.1.1.6 Dynamic Style
With the aid of dynamic styles the appearance of a channel can be adapted section-wise using an additionaldata series. Hence sections of the graph can be displayed in a different color, dashed, invisible or thicker.
Any number of dynamic styles can be appended to a graph. Each dynamic style makes a change to aproperty of the graph (e.g. changing the color to red). Under each dynamic style there must be at least onecondition that defines whether this action is to be executed with the current data value. Several conditionsare also possible, which are then "ANDed" or "ORed".
A dynamic style is added via the context menu of the channel.

Configuration
TC3 Scope View74 Version: 1.9
If a channel contains at least one dynamic style, then a new entry "Acquisition" is displayed in the "DynamicStyle" group in the Properties window of the channel. The data series for all dynamic styles can be definedhere. This must be recorded by the same target system and sampled with the same sampling rate as theother data series of the channel.

Configuration
TC3 Scope View 75Version: 1.9
Dynamic styles can be used on channels in XY charts as well as on channels in YT charts. Hence there area great many application possibilities. Also in the motion area for the illustration of contours or simple alarmstates.
5.1.1.6.1 Dynamic style properties
All settings assigned to the dynamic style can be made here.
Apply To Defines which part(s) of the graph will be changed by the dynamic style. (Line,marker and/or fill area)
Color Defines the color that will be used when changing color. (Visible only if Style is set to"Colored").
LinkOption Specifies how the different conditions underneath the dynamic style are to be linked("and" or "or")
Style Specifies how the dynamic style should influence the graphs:• Normal → no change• Bold → bold• Dashed → dashed• Colored → other color• Invisible → invisible
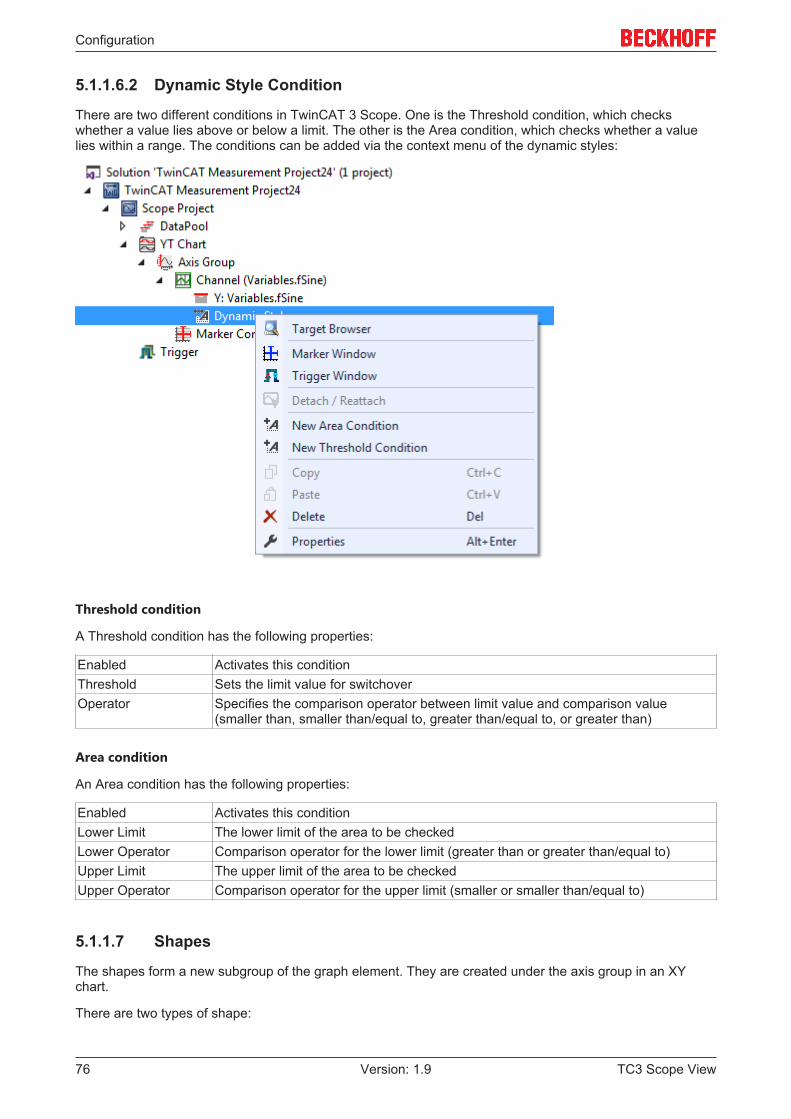
Configuration
TC3 Scope View76 Version: 1.9
5.1.1.6.2 Dynamic Style Condition
There are two different conditions in TwinCAT 3 Scope. One is the Threshold condition, which checkswhether a value lies above or below a limit. The other is the Area condition, which checks whether a valuelies within a range. The conditions can be added via the context menu of the dynamic styles:
Threshold condition
A Threshold condition has the following properties:
Enabled Activates this conditionThreshold Sets the limit value for switchoverOperator Specifies the comparison operator between limit value and comparison value
(smaller than, smaller than/equal to, greater than/equal to, or greater than)
Area condition
An Area condition has the following properties:
Enabled Activates this conditionLower Limit The lower limit of the area to be checkedLower Operator Comparison operator for the lower limit (greater than or greater than/equal to)Upper Limit The upper limit of the area to be checkedUpper Operator Comparison operator for the upper limit (smaller or smaller than/equal to)
5.1.1.7 Shapes
The shapes form a new subgroup of the graph element. They are created under the axis group in an XYchart.
There are two types of shape:
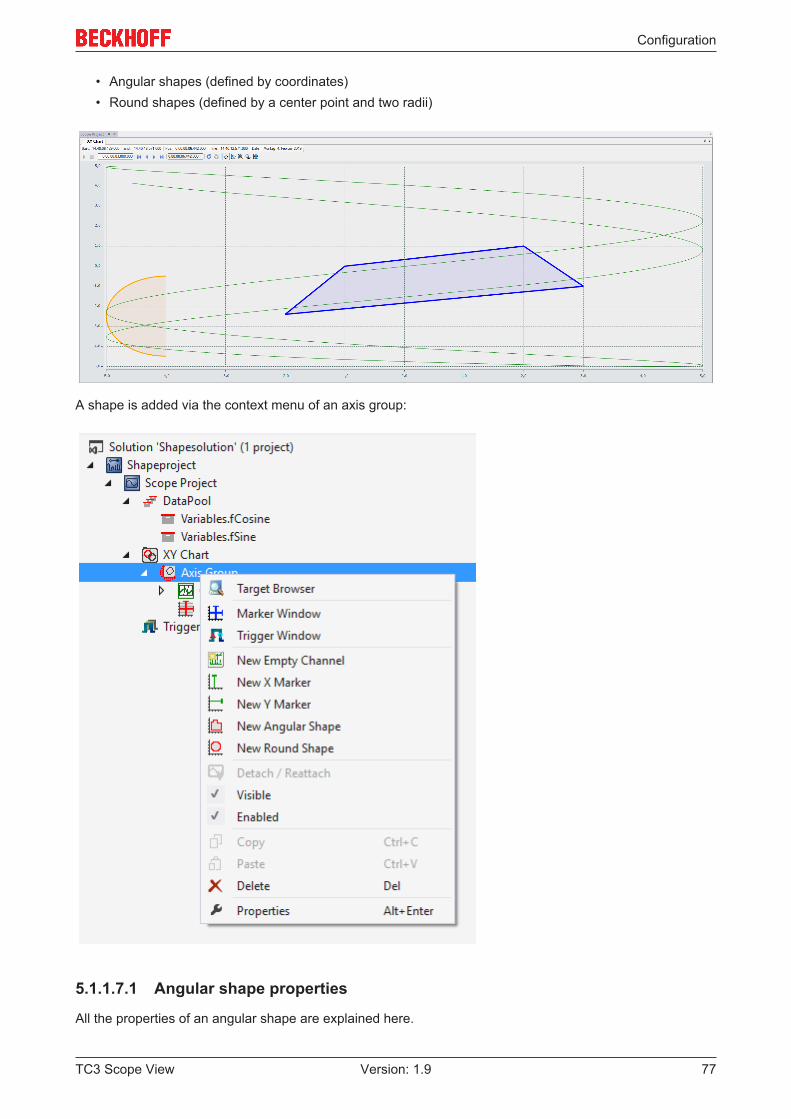
Configuration
TC3 Scope View 77Version: 1.9
• Angular shapes (defined by coordinates)• Round shapes (defined by a center point and two radii)
A shape is added via the context menu of an axis group:
5.1.1.7.1 Angular shape properties
All the properties of an angular shape are explained here.

Configuration
TC3 Scope View78 Version: 1.9
Points
Closed Shape If Closed Shape is selected, the last point is connected to the first point again.Points List of all points. (Notation: (x|y);(x|y))X Offset In the offset field a free offset can be added to the coordinates of the shape in the X-
direction.X-Scalefactor The points of the shape can be changed in the X-direction with the scale factor.Y Offset In the offset field a free offset can be added to the coordinates of the shape in the Y-
direction.Y-Scalefactor The points of the shape can be changed in the Y-direction with the scale factor.
Style
Fill Color Color of the area content.Line Width Width of the edges in pixels.Shape Color Color of the edge.
5.1.1.7.2 Round shape properties
All the properties of a round shape are explained here.

Configuration
TC3 Scope View 79Version: 1.9
Size
Aperture The aperture specifies how wide the circle will be drawn.Center Center point of the circle.Start Degree Starting angle from which the circle will be drawn.X Radius Radius of the circle in the X-direction.Y Radius Radius of the circle in the Y-direction.
Style
Fill Color Color of the area content.Line Width Width of the edges in pixels.Shape Color Color of the edge.
5.1.2 CommunicationIn principle the TE1300 and TF3300 documentation refers to the TwinCAT-specific communication via ADS.The TwinCAT3 Scope itself is also capable of receiving data via other communication channels anddisplaying them. For example via OPC UA. In this section the differences relating to the communicationchannels are illustrated and explained.
5.1.2.1 OPC UA
In addition to the standard communication protocol ADS, the TwinCAT 3 Scope View offers the option oftransmitting measured data via the standardized communication channel OPC UA. This is made possible byan OPC UA Client implemented in the TwinCAT 3 Scope Server and has the advantage that data can alsobe recorded from third-party suppliers' systems and analyzed (see illustration).
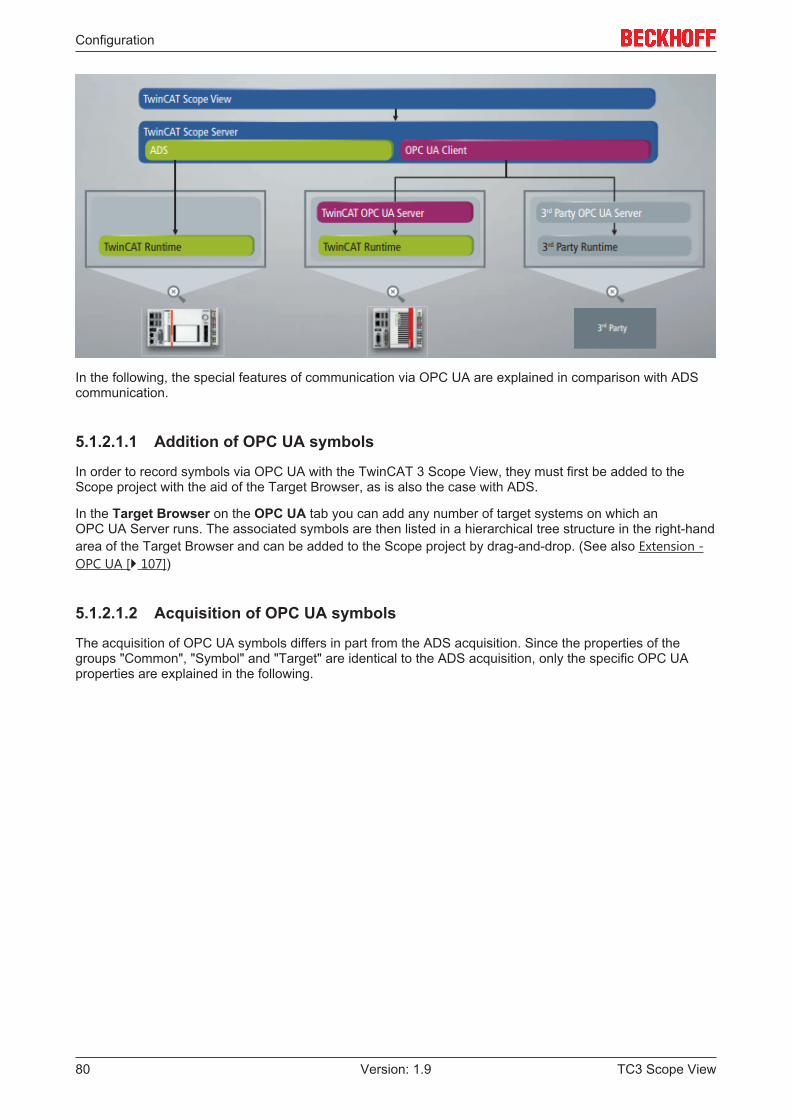
Configuration
TC3 Scope View80 Version: 1.9
In the following, the special features of communication via OPC UA are explained in comparison with ADScommunication.
5.1.2.1.1 Addition of OPC UA symbols
In order to record symbols via OPC UA with the TwinCAT 3 Scope View, they must first be added to theScope project with the aid of the Target Browser, as is also the case with ADS.
In the Target Browser on the OPC UA tab you can add any number of target systems on which anOPC UA Server runs. The associated symbols are then listed in a hierarchical tree structure in the right-handarea of the Target Browser and can be added to the Scope project by drag-and-drop. (See also Extension -OPC UA [ 107])
5.1.2.1.2 Acquisition of OPC UA symbols
The acquisition of OPC UA symbols differs in part from the ADS acquisition. Since the properties of thegroups "Common", "Symbol" and "Target" are identical to the ADS acquisition, only the specific OPC UAproperties are explained in the following.
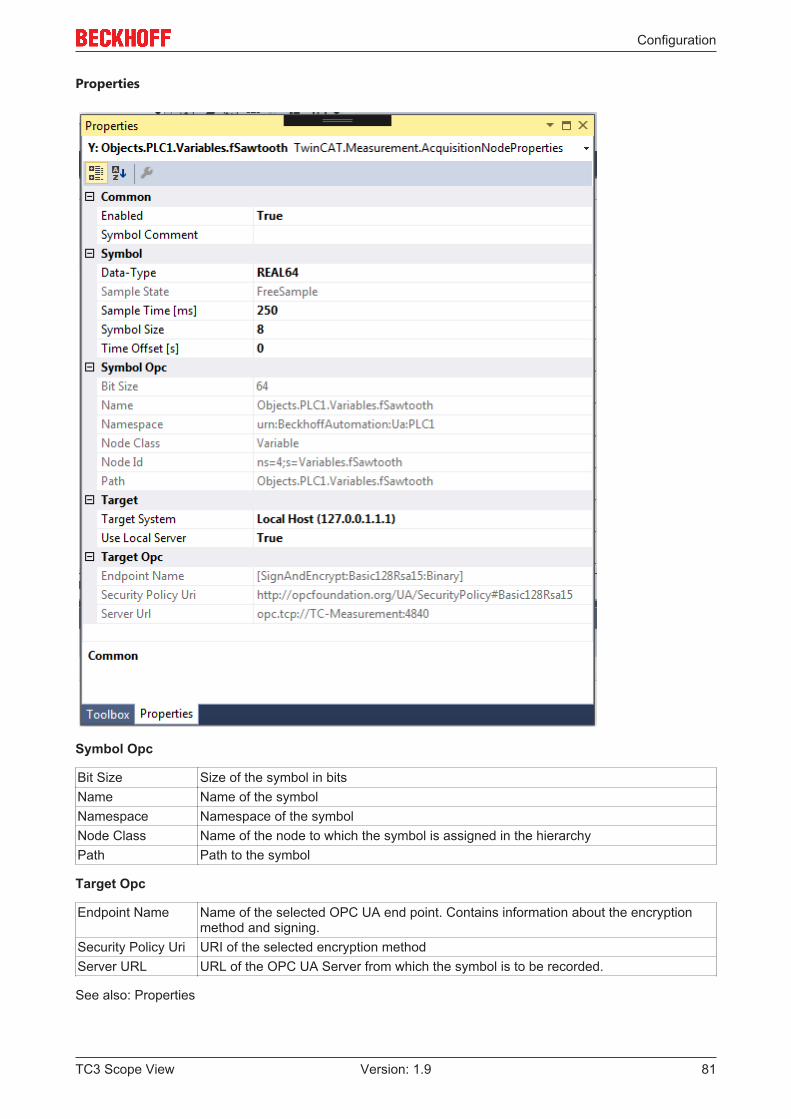
Configuration
TC3 Scope View 81Version: 1.9
Properties
Symbol Opc
Bit Size Size of the symbol in bitsName Name of the symbolNamespace Namespace of the symbolNode Class Name of the node to which the symbol is assigned in the hierarchyPath Path to the symbol
Target Opc
Endpoint Name Name of the selected OPC UA end point. Contains information about the encryptionmethod and signing.
Security Policy Uri URI of the selected encryption methodServer URL URL of the OPC UA Server from which the symbol is to be recorded.
See also: Properties
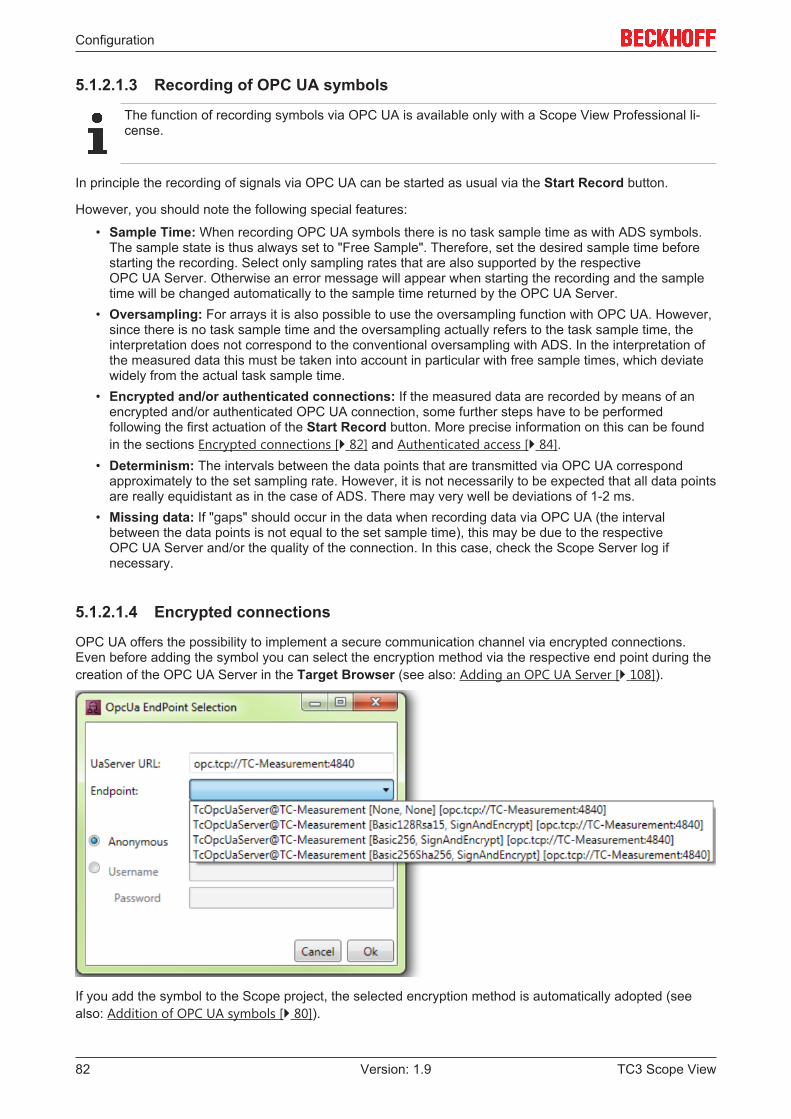
Configuration
TC3 Scope View82 Version: 1.9
5.1.2.1.3 Recording of OPC UA symbols
The function of recording symbols via OPC UA is available only with a Scope View Professional li-cense.
In principle the recording of signals via OPC UA can be started as usual via the Start Record button.
However, you should note the following special features:
• Sample Time: When recording OPC UA symbols there is no task sample time as with ADS symbols.The sample state is thus always set to "Free Sample". Therefore, set the desired sample time beforestarting the recording. Select only sampling rates that are also supported by the respectiveOPC UA Server. Otherwise an error message will appear when starting the recording and the sampletime will be changed automatically to the sample time returned by the OPC UA Server.
• Oversampling: For arrays it is also possible to use the oversampling function with OPC UA. However,since there is no task sample time and the oversampling actually refers to the task sample time, theinterpretation does not correspond to the conventional oversampling with ADS. In the interpretation ofthe measured data this must be taken into account in particular with free sample times, which deviatewidely from the actual task sample time.
• Encrypted and/or authenticated connections: If the measured data are recorded by means of anencrypted and/or authenticated OPC UA connection, some further steps have to be performedfollowing the first actuation of the Start Record button. More precise information on this can be foundin the sections Encrypted connections [ 82] and Authenticated access [ 84].
• Determinism: The intervals between the data points that are transmitted via OPC UA correspondapproximately to the set sampling rate. However, it is not necessarily to be expected that all data pointsare really equidistant as in the case of ADS. There may very well be deviations of 1-2 ms.
• Missing data: If "gaps" should occur in the data when recording data via OPC UA (the intervalbetween the data points is not equal to the set sample time), this may be due to the respectiveOPC UA Server and/or the quality of the connection. In this case, check the Scope Server log ifnecessary.
5.1.2.1.4 Encrypted connections
OPC UA offers the possibility to implement a secure communication channel via encrypted connections.Even before adding the symbol you can select the encryption method via the respective end point during thecreation of the OPC UA Server in the Target Browser (see also: Adding an OPC UA Server [ 108]).
If you add the symbol to the Scope project, the selected encryption method is automatically adopted (seealso: Addition of OPC UA symbols [ 80]).
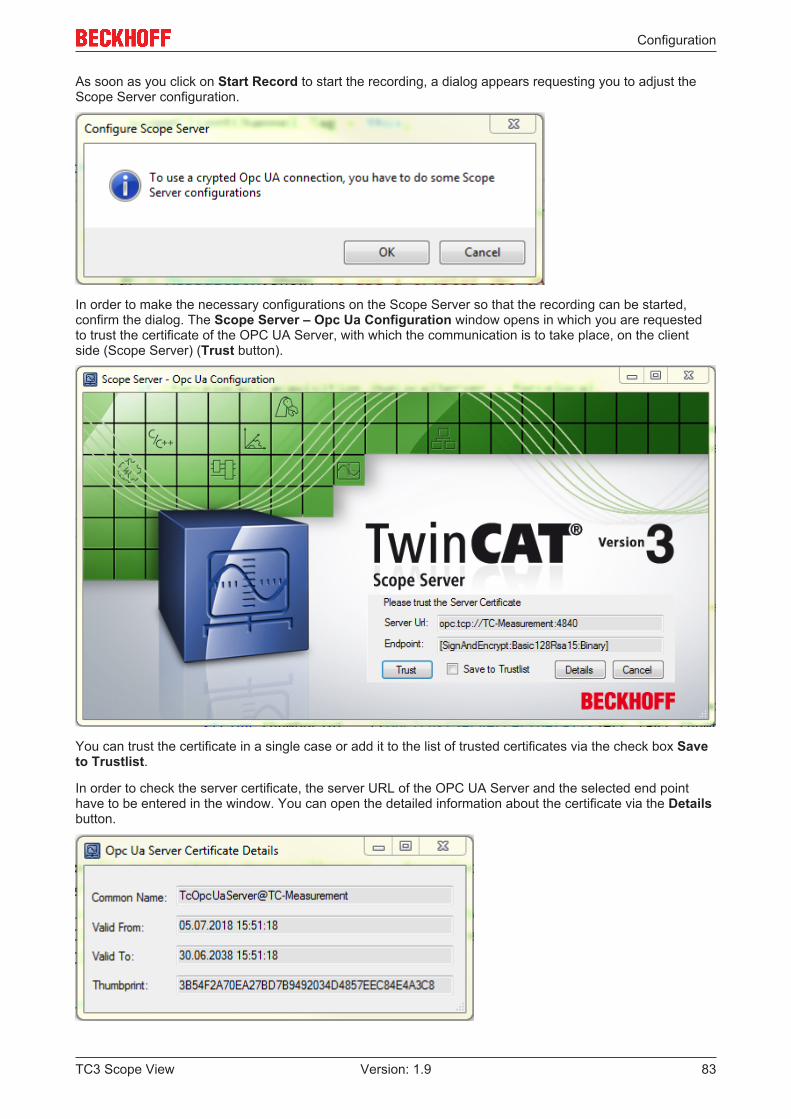
Configuration
TC3 Scope View 83Version: 1.9
As soon as you click on Start Record to start the recording, a dialog appears requesting you to adjust theScope Server configuration.
In order to make the necessary configurations on the Scope Server so that the recording can be started,confirm the dialog. The Scope Server – Opc Ua Configuration window opens in which you are requestedto trust the certificate of the OPC UA Server, with which the communication is to take place, on the clientside (Scope Server) (Trust button).
You can trust the certificate in a single case or add it to the list of trusted certificates via the check box Saveto Trustlist.
In order to check the server certificate, the server URL of the OPC UA Server and the selected end pointhave to be entered in the window. You can open the detailed information about the certificate via the Detailsbutton.
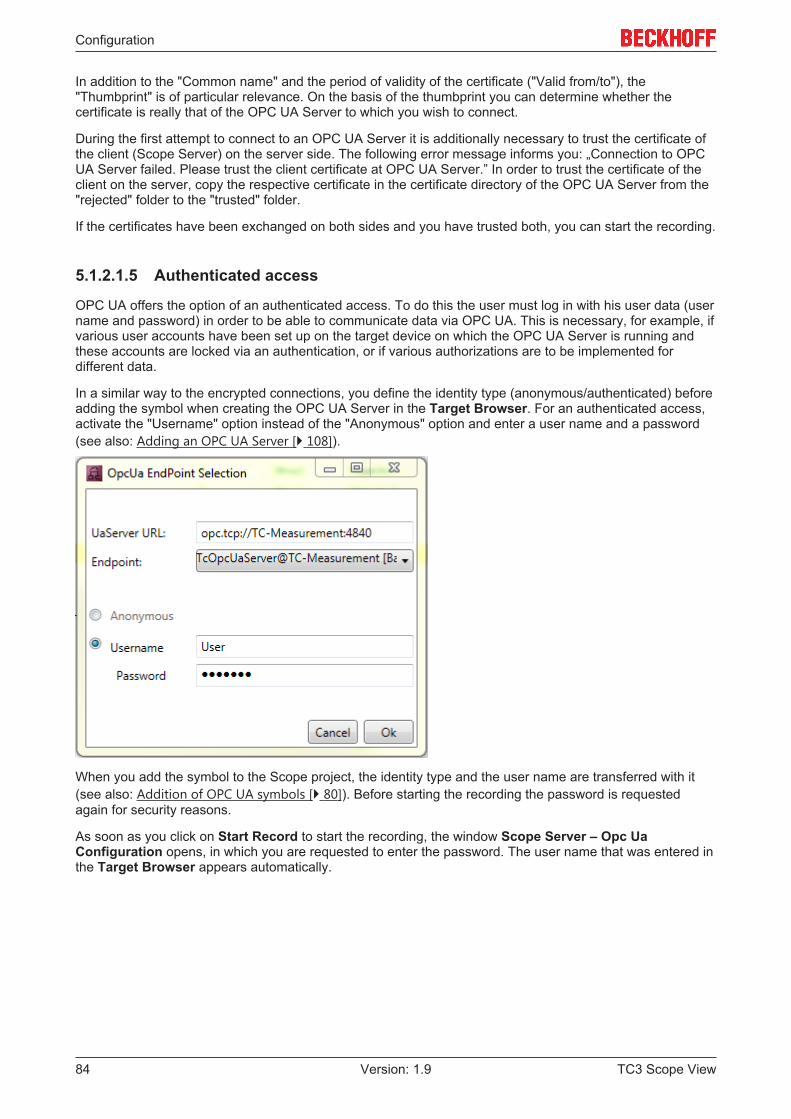
Configuration
TC3 Scope View84 Version: 1.9
In addition to the "Common name" and the period of validity of the certificate ("Valid from/to"), the"Thumbprint" is of particular relevance. On the basis of the thumbprint you can determine whether thecertificate is really that of the OPC UA Server to which you wish to connect.
During the first attempt to connect to an OPC UA Server it is additionally necessary to trust the certificate ofthe client (Scope Server) on the server side. The following error message informs you: „Connection to OPCUA Server failed. Please trust the client certificate at OPC UA Server.” In order to trust the certificate of theclient on the server, copy the respective certificate in the certificate directory of the OPC UA Server from the"rejected" folder to the "trusted" folder.
If the certificates have been exchanged on both sides and you have trusted both, you can start the recording.
5.1.2.1.5 Authenticated access
OPC UA offers the option of an authenticated access. To do this the user must log in with his user data (username and password) in order to be able to communicate data via OPC UA. This is necessary, for example, ifvarious user accounts have been set up on the target device on which the OPC UA Server is running andthese accounts are locked via an authentication, or if various authorizations are to be implemented fordifferent data.
In a similar way to the encrypted connections, you define the identity type (anonymous/authenticated) beforeadding the symbol when creating the OPC UA Server in the Target Browser. For an authenticated access,activate the "Username" option instead of the "Anonymous" option and enter a user name and a password(see also: Adding an OPC UA Server [ 108]).
When you add the symbol to the Scope project, the identity type and the user name are transferred with it(see also: Addition of OPC UA symbols [ 80]). Before starting the recording the password is requestedagain for security reasons.
As soon as you click on Start Record to start the recording, the window Scope Server – Opc UaConfiguration opens, in which you are requested to enter the password. The user name that was entered inthe Target Browser appears automatically.
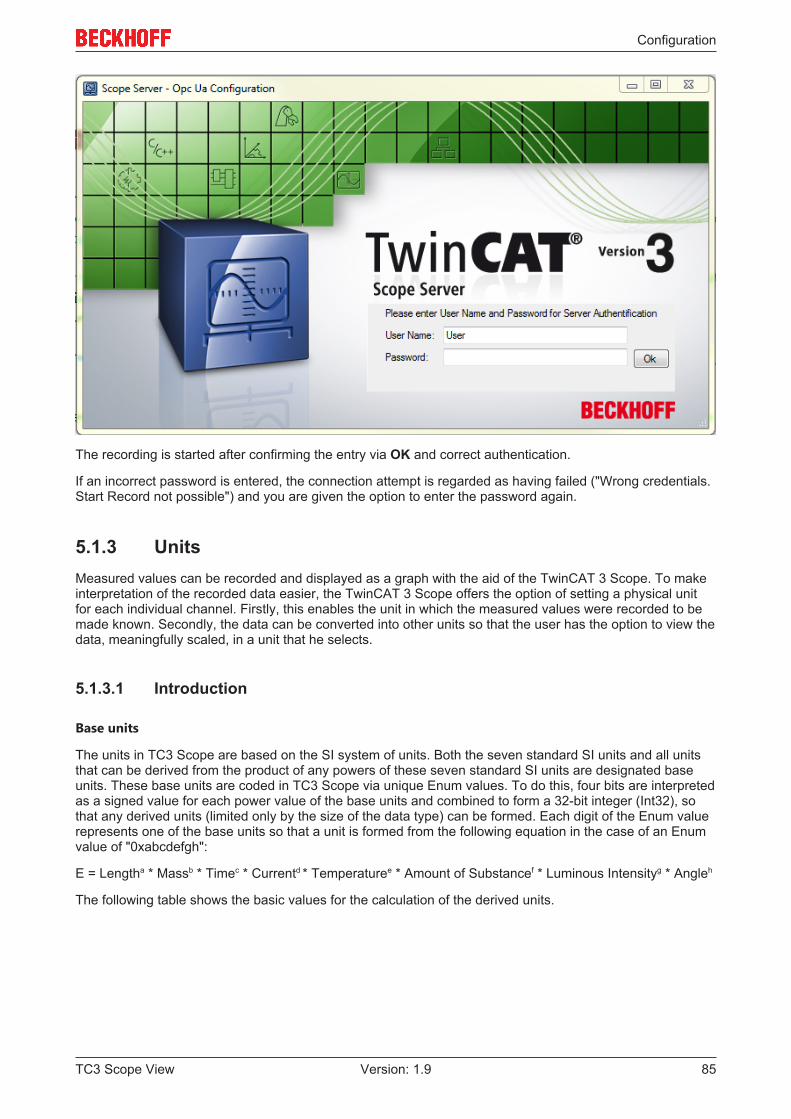
Configuration
TC3 Scope View 85Version: 1.9
The recording is started after confirming the entry via OK and correct authentication.
If an incorrect password is entered, the connection attempt is regarded as having failed ("Wrong credentials.Start Record not possible") and you are given the option to enter the password again.
5.1.3 UnitsMeasured values can be recorded and displayed as a graph with the aid of the TwinCAT 3 Scope. To makeinterpretation of the recorded data easier, the TwinCAT 3 Scope offers the option of setting a physical unitfor each individual channel. Firstly, this enables the unit in which the measured values were recorded to bemade known. Secondly, the data can be converted into other units so that the user has the option to view thedata, meaningfully scaled, in a unit that he selects.
5.1.3.1 Introduction
Base units
The units in TC3 Scope are based on the SI system of units. Both the seven standard SI units and all unitsthat can be derived from the product of any powers of these seven standard SI units are designated baseunits. These base units are coded in TC3 Scope via unique Enum values. To do this, four bits are interpretedas a signed value for each power value of the base units and combined to form a 32-bit integer (Int32), sothat any derived units (limited only by the size of the data type) can be formed. Each digit of the Enum valuerepresents one of the base units so that a unit is formed from the following equation in the case of an Enumvalue of "0xabcdefgh":
E = Lengtha * Massb * Timec * Currentd * Temperaturee * Amount of Substancef * Luminous Intensityg * Angleh
The following table shows the basic values for the calculation of the derived units.
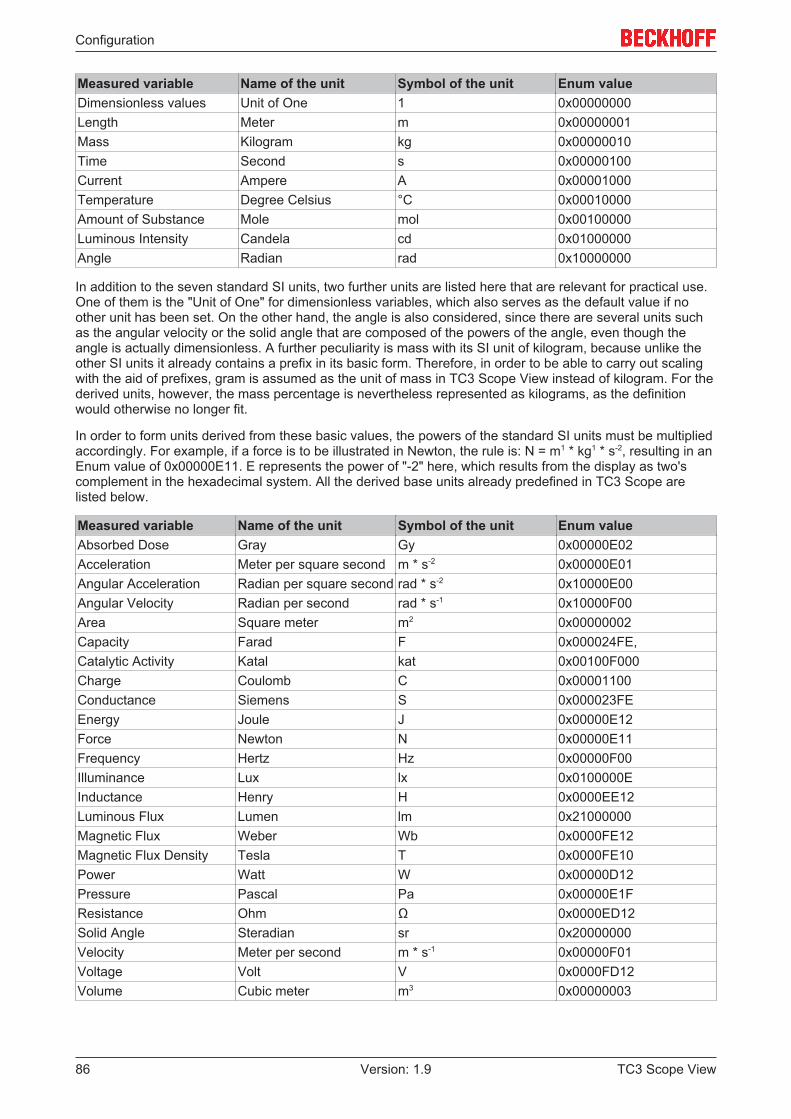
Configuration
TC3 Scope View86 Version: 1.9
Measured variable Name of the unit Symbol of the unit Enum valueDimensionless values Unit of One 1 0x00000000Length Meter m 0x00000001Mass Kilogram kg 0x00000010Time Second s 0x00000100Current Ampere A 0x00001000Temperature Degree Celsius °C 0x00010000Amount of Substance Mole mol 0x00100000Luminous Intensity Candela cd 0x01000000Angle Radian rad 0x10000000
In addition to the seven standard SI units, two further units are listed here that are relevant for practical use.One of them is the "Unit of One" for dimensionless variables, which also serves as the default value if noother unit has been set. On the other hand, the angle is also considered, since there are several units suchas the angular velocity or the solid angle that are composed of the powers of the angle, even though theangle is actually dimensionless. A further peculiarity is mass with its SI unit of kilogram, because unlike theother SI units it already contains a prefix in its basic form. Therefore, in order to be able to carry out scalingwith the aid of prefixes, gram is assumed as the unit of mass in TC3 Scope View instead of kilogram. For thederived units, however, the mass percentage is nevertheless represented as kilograms, as the definitionwould otherwise no longer fit.
In order to form units derived from these basic values, the powers of the standard SI units must be multipliedaccordingly. For example, if a force is to be illustrated in Newton, the rule is: N = m1 * kg1 * s-2, resulting in anEnum value of 0x00000E11. E represents the power of "-2" here, which results from the display as two'scomplement in the hexadecimal system. All the derived base units already predefined in TC3 Scope arelisted below.
Measured variable Name of the unit Symbol of the unit Enum valueAbsorbed Dose Gray Gy 0x00000E02Acceleration Meter per square second m * s-2 0x00000E01Angular Acceleration Radian per square second rad * s-2 0x10000E00Angular Velocity Radian per second rad * s-1 0x10000F00Area Square meter m2 0x00000002Capacity Farad F 0x000024FE,Catalytic Activity Katal kat 0x00100F000Charge Coulomb C 0x00001100Conductance Siemens S 0x000023FEEnergy Joule J 0x00000E12Force Newton N 0x00000E11Frequency Hertz Hz 0x00000F00Illuminance Lux lx 0x0100000EInductance Henry H 0x0000EE12Luminous Flux Lumen lm 0x21000000Magnetic Flux Weber Wb 0x0000FE12Magnetic Flux Density Tesla T 0x0000FE10Power Watt W 0x00000D12Pressure Pascal Pa 0x00000E1FResistance Ohm Ω 0x0000ED12Solid Angle Steradian sr 0x20000000Velocity Meter per second m * s-1 0x00000F01Voltage Volt V 0x0000FD12Volume Cubic meter m3 0x00000003
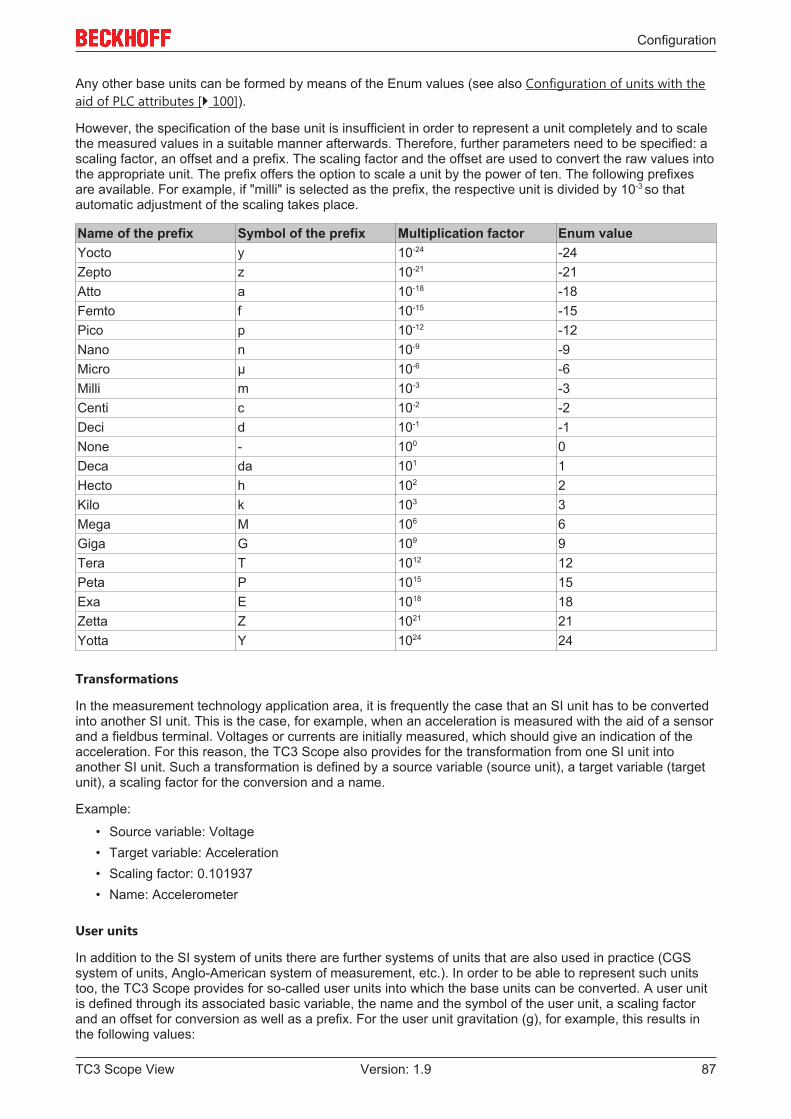
Configuration
TC3 Scope View 87Version: 1.9
Any other base units can be formed by means of the Enum values (see also Configuration of units with theaid of PLC attributes [ 100]).
However, the specification of the base unit is insufficient in order to represent a unit completely and to scalethe measured values in a suitable manner afterwards. Therefore, further parameters need to be specified: ascaling factor, an offset and a prefix. The scaling factor and the offset are used to convert the raw values intothe appropriate unit. The prefix offers the option to scale a unit by the power of ten. The following prefixesare available. For example, if "milli" is selected as the prefix, the respective unit is divided by 10-3 so thatautomatic adjustment of the scaling takes place.
Name of the prefix Symbol of the prefix Multiplication factor Enum valueYocto y 10-24 -24Zepto z 10-21 -21Atto a 10-18 -18Femto f 10-15 -15Pico p 10-12 -12Nano n 10-9 -9Micro µ 10-6 -6Milli m 10-3 -3Centi c 10-2 -2Deci d 10-1 -1None - 100 0Deca da 101 1Hecto h 102 2Kilo k 103 3Mega M 106 6Giga G 109 9Tera T 1012 12Peta P 1015 15Exa E 1018 18Zetta Z 1021 21Yotta Y 1024 24
Transformations
In the measurement technology application area, it is frequently the case that an SI unit has to be convertedinto another SI unit. This is the case, for example, when an acceleration is measured with the aid of a sensorand a fieldbus terminal. Voltages or currents are initially measured, which should give an indication of theacceleration. For this reason, the TC3 Scope also provides for the transformation from one SI unit intoanother SI unit. Such a transformation is defined by a source variable (source unit), a target variable (targetunit), a scaling factor for the conversion and a name.
Example:
• Source variable: Voltage• Target variable: Acceleration• Scaling factor: 0.101937• Name: Accelerometer
User units
In addition to the SI system of units there are further systems of units that are also used in practice (CGSsystem of units, Anglo-American system of measurement, etc.). In order to be able to represent such unitstoo, the TC3 Scope provides for so-called user units into which the base units can be converted. A user unitis defined through its associated basic variable, the name and the symbol of the user unit, a scaling factorand an offset for conversion as well as a prefix. For the user unit gravitation (g), for example, this results inthe following values:

Configuration
TC3 Scope View88 Version: 1.9
• Basic variable: Acceleration• Name: Gravity• Symbol: g• Scaling factor: 1 / 9.81• Offset: 0• Prefix: none
Resulting unit
A unit in the TC3 Scope can thus be composed of the three elements base unit, transformation and userunit, depending on what is required in the specific application case. However, it is always the resulting unitthat is displayed. If a voltage is the basic variable, which is then converted via a transformation into anacceleration in m/s2 and from there into g with the aid of a user unit, the measured data and offset with thescaling factors and offsets and the result is the acceleration in g.
The following illustration shows how the resulting unit is displayed in the Properties window:
If existent, the symbol for the prefix will be displayed first. After that comes the symbol for the unit andsubsequently the measured variable in brackets. Apart from the display in the Properties window, the unitsalso appear in the tooltips that appear when clicking on a data point (see illustration) and are displayed in thecursor window.
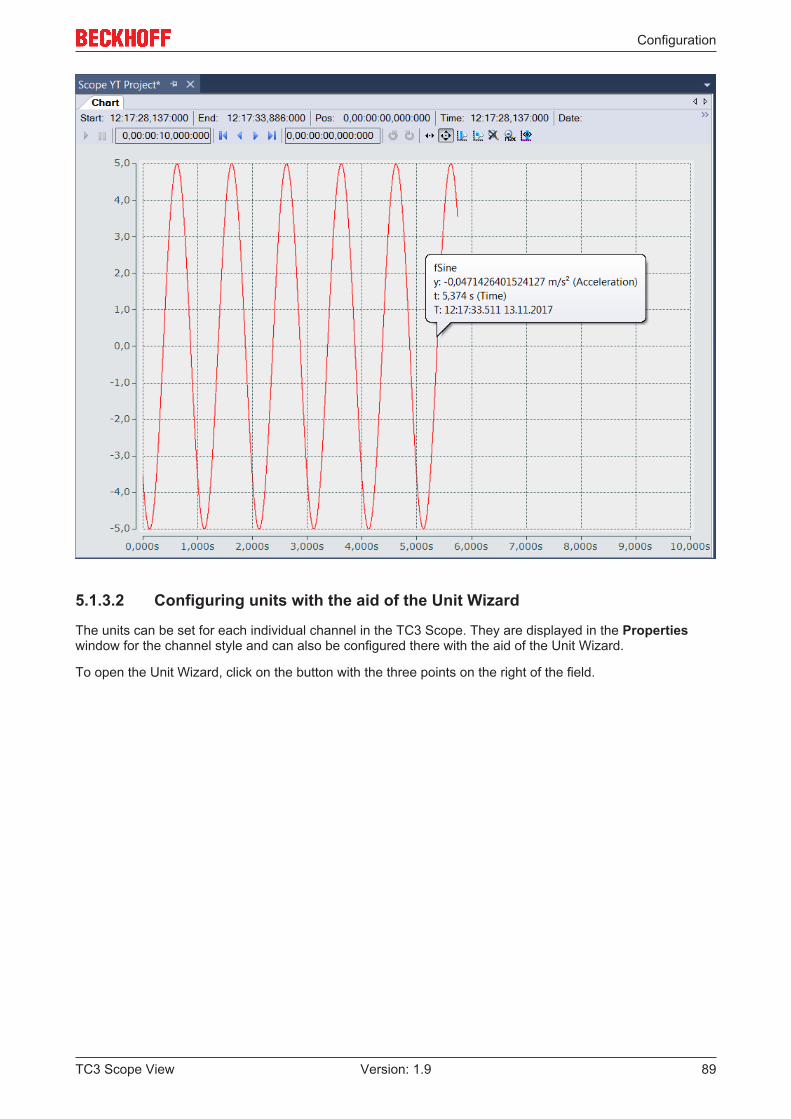
Configuration
TC3 Scope View 89Version: 1.9
5.1.3.2 Configuring units with the aid of the Unit Wizard
The units can be set for each individual channel in the TC3 Scope. They are displayed in the Propertieswindow for the channel style and can also be configured there with the aid of the Unit Wizard.
To open the Unit Wizard, click on the button with the three points on the right of the field.

Configuration
TC3 Scope View90 Version: 1.9
On the first page of the wizard there are three selection options between which you can choose, dependingon the type of values you have measured and recorded with the TC3 Scope.
• Scaled Value: If you have already scaled your values as desired and only wish to enter the appropriateunit, select the option "Scaled Value" [ 90].
• Unscaled Value: If you have not yet scaled your values and wish to scale them yourself with the aid ofa scaling factor and an offset in addition to selecting the unit, select the option "UnscaledValue" [ 91].
• Terminal Value: If you have measured your values using a Beckhoff fieldbus terminal and now wish toscale the values automatically through the setting of the hardware employed and to generate a unit,select the option "Terminal Value" [ 95]. (However, this option is available only with the Scope ViewProfessional License).
Scaled Value
If you have selected the option "Scaled Value", the following page opens:

Configuration
TC3 Scope View 91Version: 1.9
In order to select a unit, first select your measured variable. Subsequently, all units that come into questionfor the selected measured variable are displayed on the right-hand side. After you have selected the desiredunit you can optionally select a prefix. In the "Unit Preview" field at the bottom left you can see how thecurrently selected unit will be displayed later in the Properties window. Finally, you can set the unit with theCreate button. Since the values have already been scaled appropriately, no conversion of the values takesplace in this case. The selected unit is merely entered and displayed.
Unscaled Value
If you have selected the option "Unscaled Value", the following page opens:

Configuration
TC3 Scope View92 Version: 1.9
In order to select a unit, first select your measured variable. Subsequently, all units that come into questionfor the selected measured variable are displayed on the right-hand side. After having selected the desiredunit you can specify a scaling factor and an offset with which the measured values are to be converted intothe appropriate unit.
Subsequently, the Next button takes you to the next page, on which you can optionally select atransformation (e.g. a sensor). However, this page only appears if the previously selected unit is a base unitand not a user unit. Otherwise you will be taken directly to the last page of the dialog (Prefix Selection).
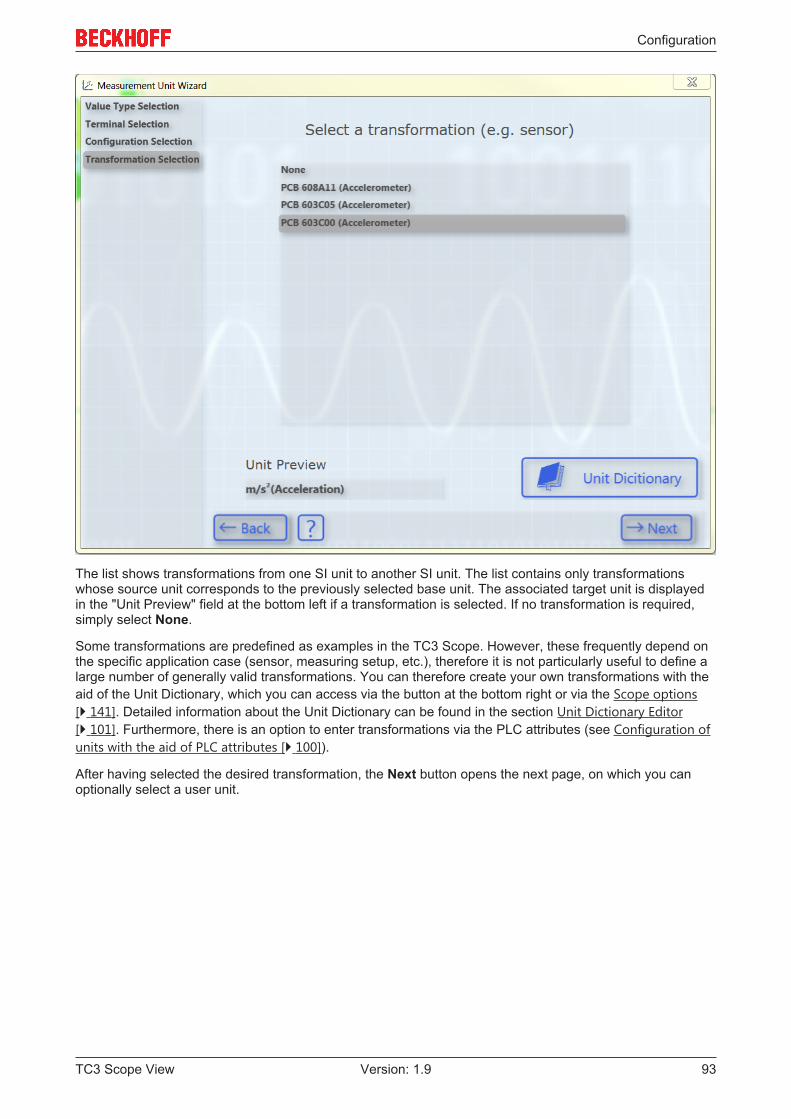
Configuration
TC3 Scope View 93Version: 1.9
The list shows transformations from one SI unit to another SI unit. The list contains only transformationswhose source unit corresponds to the previously selected base unit. The associated target unit is displayedin the "Unit Preview" field at the bottom left if a transformation is selected. If no transformation is required,simply select None.
Some transformations are predefined as examples in the TC3 Scope. However, these frequently depend onthe specific application case (sensor, measuring setup, etc.), therefore it is not particularly useful to define alarge number of generally valid transformations. You can therefore create your own transformations with theaid of the Unit Dictionary, which you can access via the button at the bottom right or via the Scope options[ 141]. Detailed information about the Unit Dictionary can be found in the section Unit Dictionary Editor[ 101]. Furthermore, there is an option to enter transformations via the PLC attributes (see Configuration ofunits with the aid of PLC attributes [ 100]).
After having selected the desired transformation, the Next button opens the next page, on which you canoptionally select a user unit.

Configuration
TC3 Scope View94 Version: 1.9
Once again, only user units that match the previously selected base unit appear. Some frequently used userunits are predefined. As with the transformations, further user units can be added via the Unit Dictionary orthe PLC attributes.
After selecting the user unit, you will be taken to the last page of this dialog:
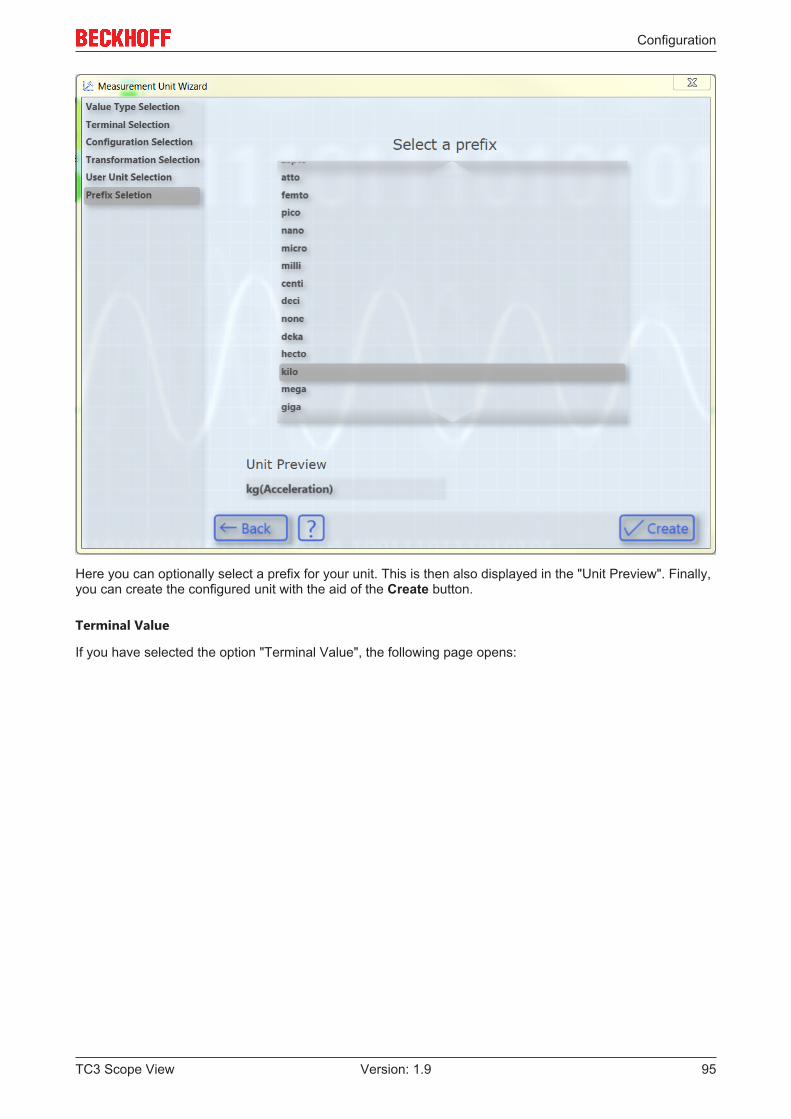
Configuration
TC3 Scope View 95Version: 1.9
Here you can optionally select a prefix for your unit. This is then also displayed in the "Unit Preview". Finally,you can create the configured unit with the aid of the Create button.
Terminal Value
If you have selected the option "Terminal Value", the following page opens:

Configuration
TC3 Scope View96 Version: 1.9
On this page you can select the type of terminal with which you recorded your measured values. SeveralBeckhoff EtherCAT terminals are already predefined. You can use the Unit Dictionary to view them or to addfurther terminals (see also Unit Dictionary Editor [ 101]).
Since a Beckhoff EtherCAT terminal can be configured in different ways, you must select the setconfiguration of your terminal on the next page.
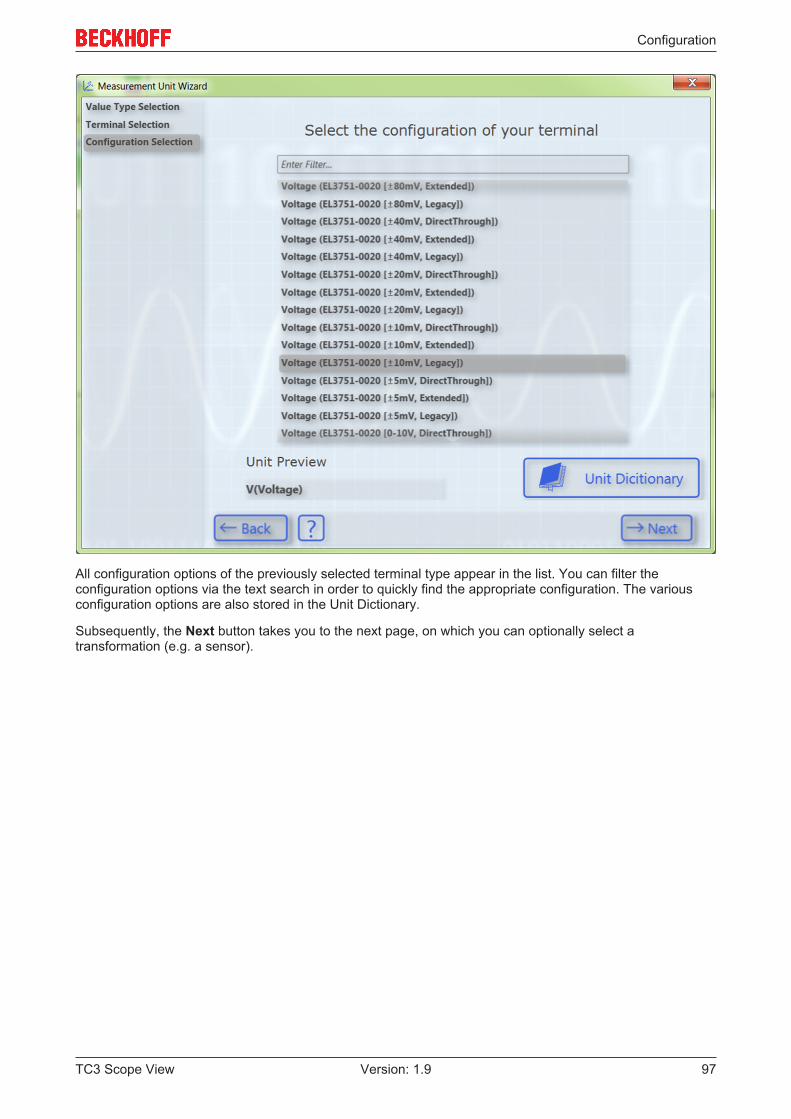
Configuration
TC3 Scope View 97Version: 1.9
All configuration options of the previously selected terminal type appear in the list. You can filter theconfiguration options via the text search in order to quickly find the appropriate configuration. The variousconfiguration options are also stored in the Unit Dictionary.
Subsequently, the Next button takes you to the next page, on which you can optionally select atransformation (e.g. a sensor).
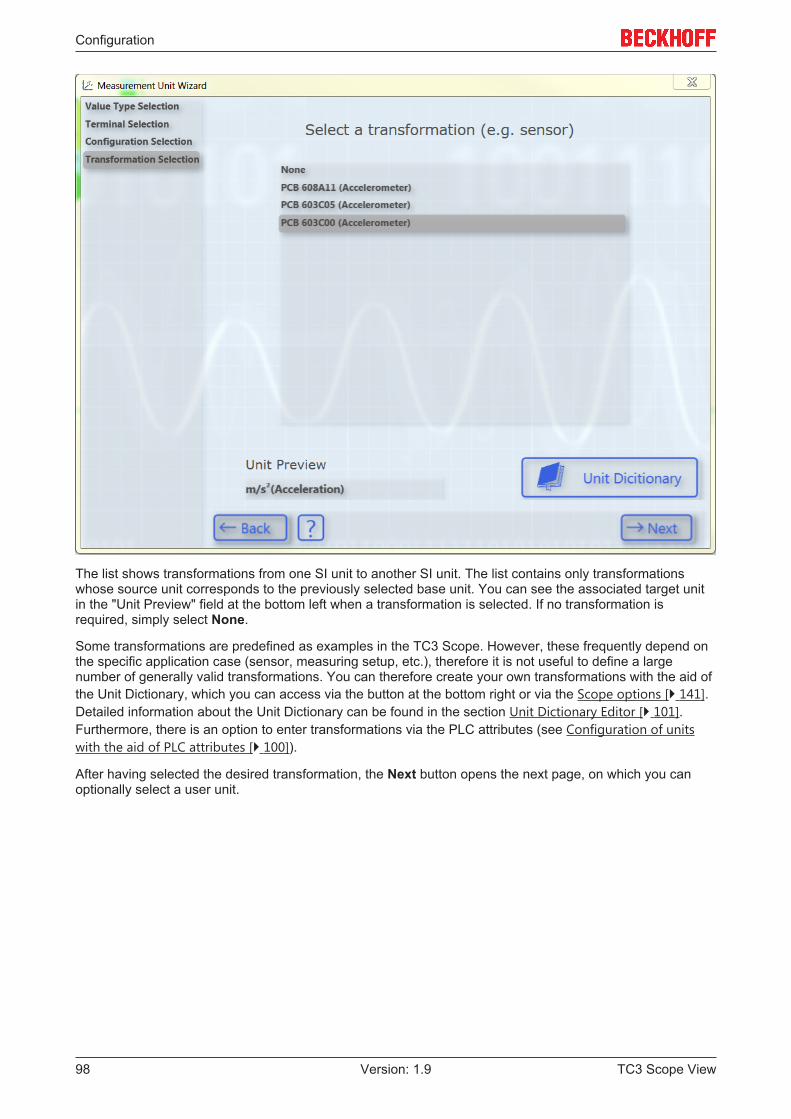
Configuration
TC3 Scope View98 Version: 1.9
The list shows transformations from one SI unit to another SI unit. The list contains only transformationswhose source unit corresponds to the previously selected base unit. You can see the associated target unitin the "Unit Preview" field at the bottom left when a transformation is selected. If no transformation isrequired, simply select None.
Some transformations are predefined as examples in the TC3 Scope. However, these frequently depend onthe specific application case (sensor, measuring setup, etc.), therefore it is not useful to define a largenumber of generally valid transformations. You can therefore create your own transformations with the aid ofthe Unit Dictionary, which you can access via the button at the bottom right or via the Scope options [ 141].Detailed information about the Unit Dictionary can be found in the section Unit Dictionary Editor [ 101].Furthermore, there is an option to enter transformations via the PLC attributes (see Configuration of unitswith the aid of PLC attributes [ 100]).
After having selected the desired transformation, the Next button opens the next page, on which you canoptionally select a user unit.
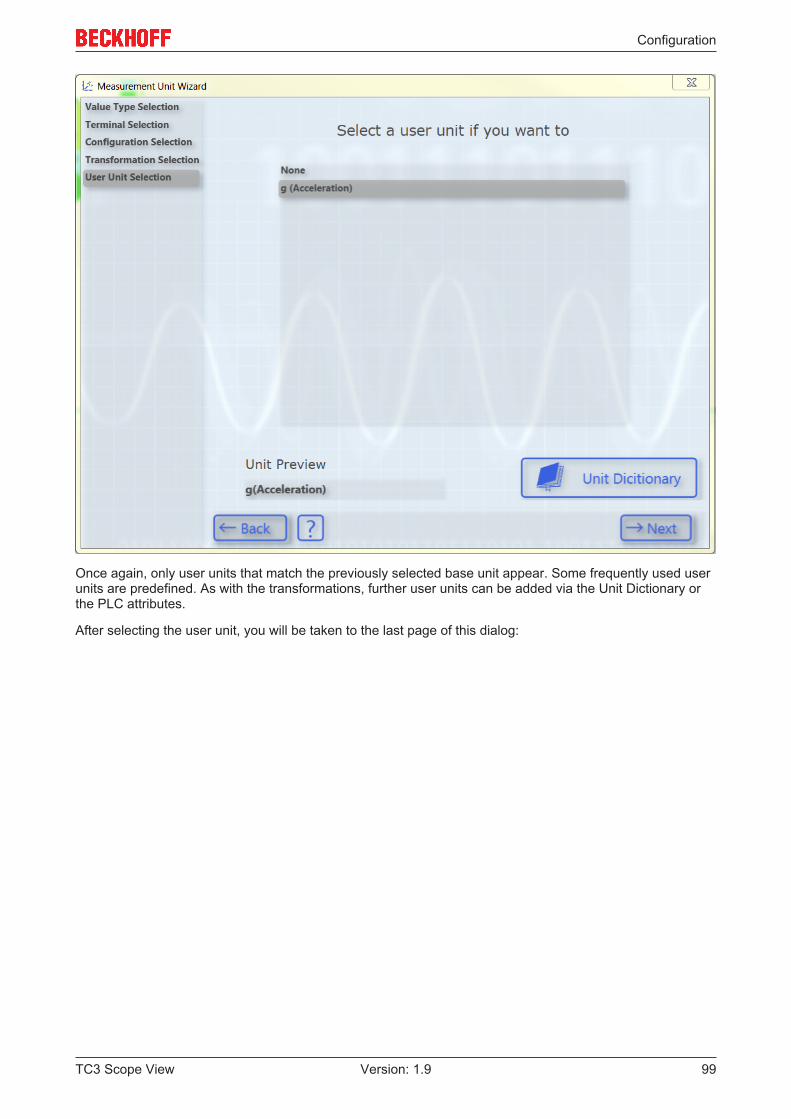
Configuration
TC3 Scope View 99Version: 1.9
Once again, only user units that match the previously selected base unit appear. Some frequently used userunits are predefined. As with the transformations, further user units can be added via the Unit Dictionary orthe PLC attributes.
After selecting the user unit, you will be taken to the last page of this dialog:

Configuration
TC3 Scope View100 Version: 1.9
Here you can optionally select a prefix for your unit. This is then also displayed in the "Unit Preview". Finally,you can create the configured unit with the aid of the Create button.
5.1.3.3 Configuration of units with the aid of PLC attributes
In addition to the input option via the Unit Wizard, units can also be configured with the aid of the attributes ofa symbol or a data type in the PLC code. This is useful, for example, if a certain variable is recorded morefrequently using the TC3 Scope. The unit then only needs to be provided once as an attribute and notreconfigured every time.
PLC attributes are specified directly via the declaration of a variable or the data type in curly brackets, as canbe seen in the illustration below.
Three different unit elements can be specified with the aid of the PLC attributes: Base units (BaseUnit),transformations (UnitTransformation) and user units (UserUnit).
The syntax for their input is as follows:
Base units
attribute 'BaseUnit' := '< BaseUnit, ScaleFactor, Offset, Prefix >'
e.g.: attribute 'BaseUnit' := '< AngularVelocity, 0.5, 0, kilo>'
→ The unit is then krad/s (AngularVelocity) with a ScaleFactor of 0.5.
Transformations
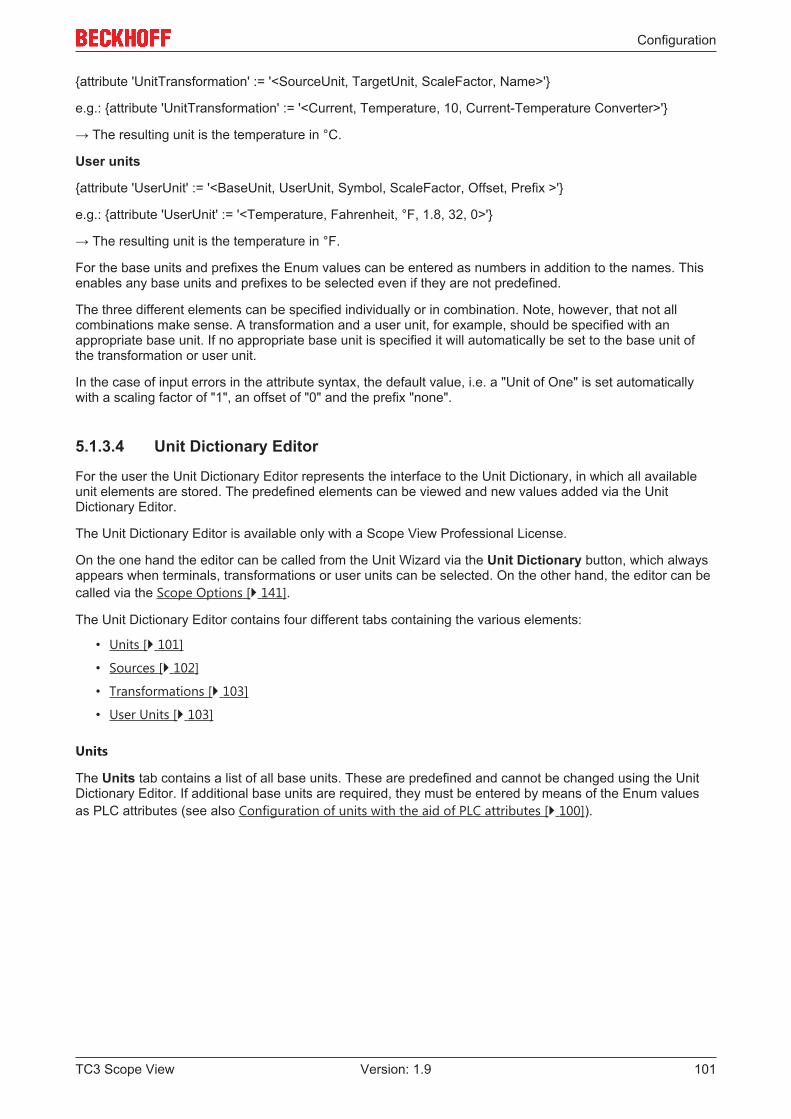
Configuration
TC3 Scope View 101Version: 1.9
attribute 'UnitTransformation' := '<SourceUnit, TargetUnit, ScaleFactor, Name>'
e.g.: attribute 'UnitTransformation' := '<Current, Temperature, 10, Current-Temperature Converter>'
→ The resulting unit is the temperature in °C.
User units
attribute 'UserUnit' := '<BaseUnit, UserUnit, Symbol, ScaleFactor, Offset, Prefix >'
e.g.: attribute 'UserUnit' := '<Temperature, Fahrenheit, °F, 1.8, 32, 0>'
→ The resulting unit is the temperature in °F.
For the base units and prefixes the Enum values can be entered as numbers in addition to the names. Thisenables any base units and prefixes to be selected even if they are not predefined.
The three different elements can be specified individually or in combination. Note, however, that not allcombinations make sense. A transformation and a user unit, for example, should be specified with anappropriate base unit. If no appropriate base unit is specified it will automatically be set to the base unit ofthe transformation or user unit.
In the case of input errors in the attribute syntax, the default value, i.e. a "Unit of One" is set automaticallywith a scaling factor of "1", an offset of "0" and the prefix "none".
5.1.3.4 Unit Dictionary Editor
For the user the Unit Dictionary Editor represents the interface to the Unit Dictionary, in which all availableunit elements are stored. The predefined elements can be viewed and new values added via the UnitDictionary Editor.
The Unit Dictionary Editor is available only with a Scope View Professional License.
On the one hand the editor can be called from the Unit Wizard via the Unit Dictionary button, which alwaysappears when terminals, transformations or user units can be selected. On the other hand, the editor can becalled via the Scope Options [ 141].
The Unit Dictionary Editor contains four different tabs containing the various elements:
• Units [ 101]
• Sources [ 102]
• Transformations [ 103]
• User Units [ 103]
Units
The Units tab contains a list of all base units. These are predefined and cannot be changed using the UnitDictionary Editor. If additional base units are required, they must be entered by means of the Enum valuesas PLC attributes (see also Configuration of units with the aid of PLC attributes [ 100]).
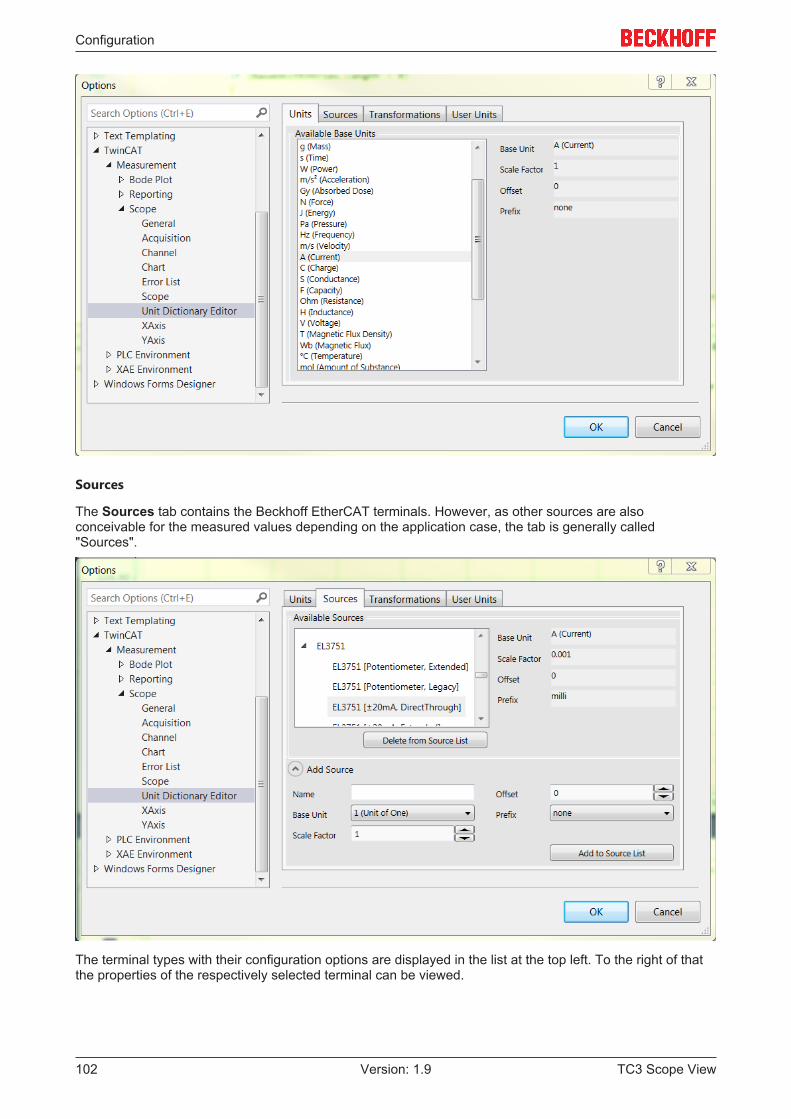
Configuration
TC3 Scope View102 Version: 1.9
Sources
The Sources tab contains the Beckhoff EtherCAT terminals. However, as other sources are alsoconceivable for the measured values depending on the application case, the tab is generally called"Sources".
The terminal types with their configuration options are displayed in the list at the top left. To the right of thatthe properties of the respectively selected terminal can be viewed.

Configuration
TC3 Scope View 103Version: 1.9
An input field can be opened in the lower area with the Add Source button. Further terminals or other user-specific sources can be added there. To do this it is merely necessary to fill out the fields. The elementcreated can then be added using the Add to Source List button. A selected element can be deleted againwith the Delete from Source List button. However, predefined values cannot be deleted from the list.
Note that when entering new "Source" elements, a terminal type and the associated configuration optionsshould be entered so that they can be sorted in the Unit Dictionary Editor and in the Unit Wizard analogousto the existing elements. For example, the terminal type in the above screenshot is "EL3751". Its associatedconfiguration options are added as individual elements. The name of the configuration begins with thedesignation of the terminal type and contains the respective configuration option behind that in squarebrackets.
Transformations
The Transformations tab contains all predefined transformations.
The properties of a selected transformation can be seen on the right. In order to define a new transformation,the input field must be opened via the Add Transformations button and the corresponding data entered.The transformation can then be added using the Add to Transformation List button. A selectedtransformation can be deleted again with the aid of the Delete from Transformation List button. Note thatpredefined transformations cannot be deleted.
User Units
The User Units tab contains all predefined user units.
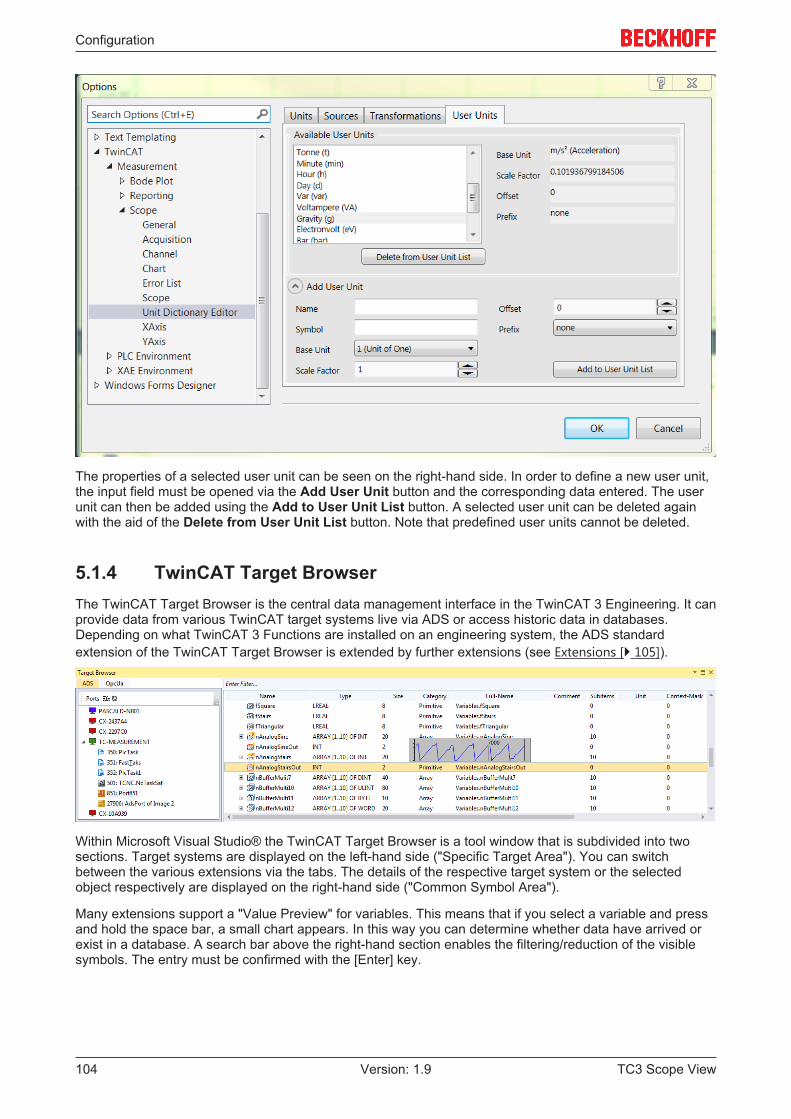
Configuration
TC3 Scope View104 Version: 1.9
The properties of a selected user unit can be seen on the right-hand side. In order to define a new user unit,the input field must be opened via the Add User Unit button and the corresponding data entered. The userunit can then be added using the Add to User Unit List button. A selected user unit can be deleted againwith the aid of the Delete from User Unit List button. Note that predefined user units cannot be deleted.
5.1.4 TwinCAT Target BrowserThe TwinCAT Target Browser is the central data management interface in the TwinCAT 3 Engineering. It canprovide data from various TwinCAT target systems live via ADS or access historic data in databases.Depending on what TwinCAT 3 Functions are installed on an engineering system, the ADS standardextension of the TwinCAT Target Browser is extended by further extensions (see Extensions [ 105]).
Within Microsoft Visual Studio® the TwinCAT Target Browser is a tool window that is subdivided into twosections. Target systems are displayed on the left-hand side ("Specific Target Area"). You can switchbetween the various extensions via the tabs. The details of the respective target system or the selectedobject respectively are displayed on the right-hand side ("Common Symbol Area").
Many extensions support a "Value Preview" for variables. This means that if you select a variable and pressand hold the space bar, a small chart appears. In this way you can determine whether data have arrived orexist in a database. A search bar above the right-hand section enables the filtering/reduction of the visiblesymbols. The entry must be confirmed with the [Enter] key.
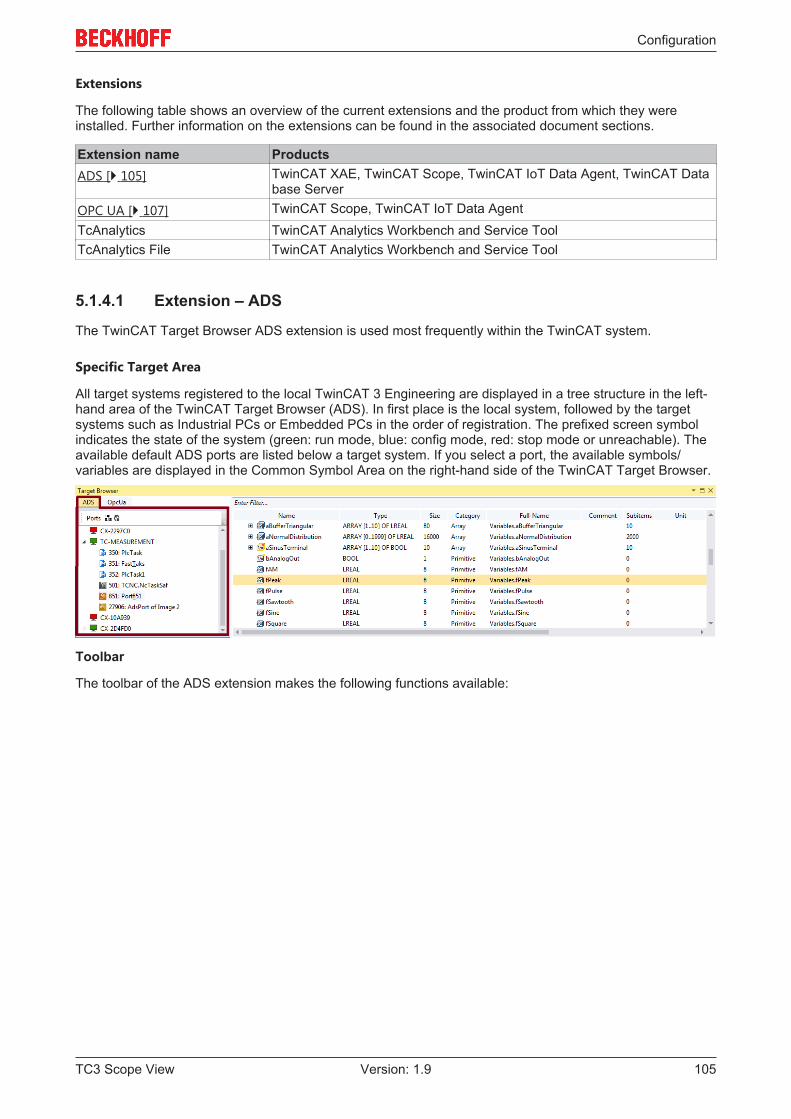
Configuration
TC3 Scope View 105Version: 1.9
Extensions
The following table shows an overview of the current extensions and the product from which they wereinstalled. Further information on the extensions can be found in the associated document sections.
Extension name ProductsADS [ 105] TwinCAT XAE, TwinCAT Scope, TwinCAT IoT Data Agent, TwinCAT Data
base ServerOPC UA [ 107] TwinCAT Scope, TwinCAT IoT Data AgentTcAnalytics TwinCAT Analytics Workbench and Service ToolTcAnalytics File TwinCAT Analytics Workbench and Service Tool
5.1.4.1 Extension – ADS
The TwinCAT Target Browser ADS extension is used most frequently within the TwinCAT system.
Specific Target Area
All target systems registered to the local TwinCAT 3 Engineering are displayed in a tree structure in the left-hand area of the TwinCAT Target Browser (ADS). In first place is the local system, followed by the targetsystems such as Industrial PCs or Embedded PCs in the order of registration. The prefixed screen symbolindicates the state of the system (green: run mode, blue: config mode, red: stop mode or unreachable). Theavailable default ADS ports are listed below a target system. If you select a port, the available symbols/variables are displayed in the Common Symbol Area on the right-hand side of the TwinCAT Target Browser.
Toolbar
The toolbar of the ADS extension makes the following functions available:
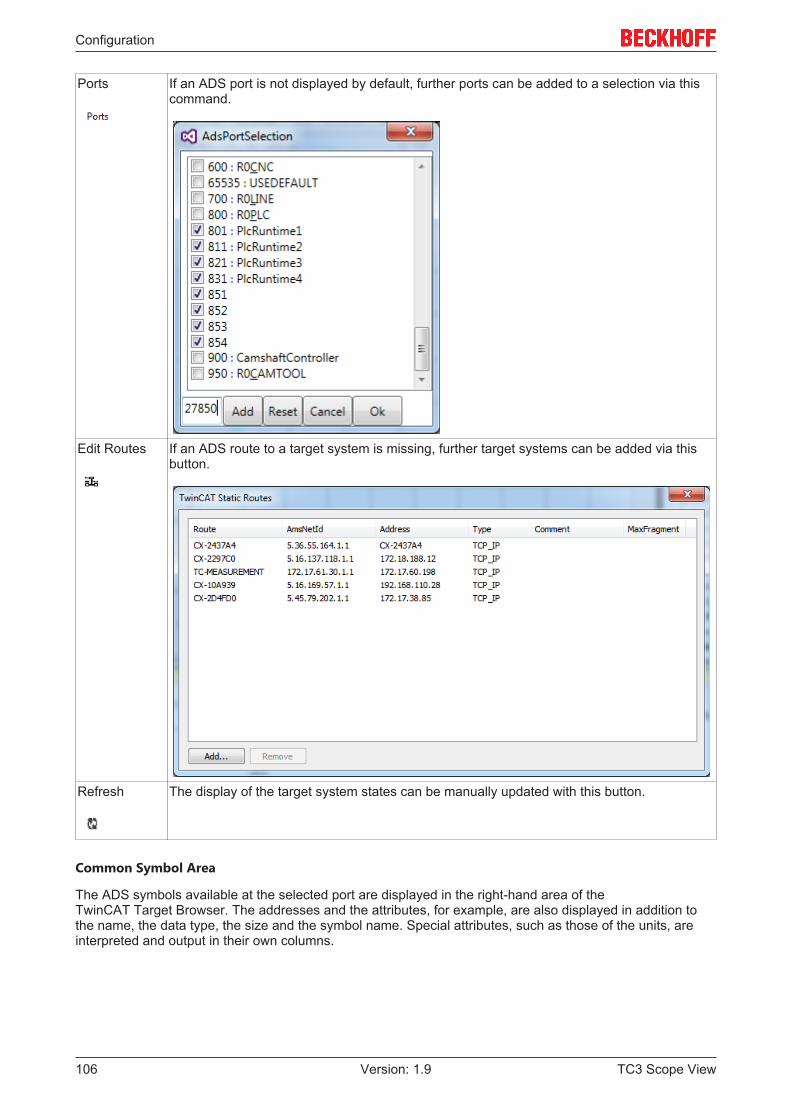
Configuration
TC3 Scope View106 Version: 1.9
Ports If an ADS port is not displayed by default, further ports can be added to a selection via thiscommand.
Edit Routes If an ADS route to a target system is missing, further target systems can be added via thisbutton.
Refresh The display of the target system states can be manually updated with this button.
Common Symbol Area
The ADS symbols available at the selected port are displayed in the right-hand area of theTwinCAT Target Browser. The addresses and the attributes, for example, are also displayed in addition tothe name, the data type, the size and the symbol name. Special attributes, such as those of the units, areinterpreted and output in their own columns.
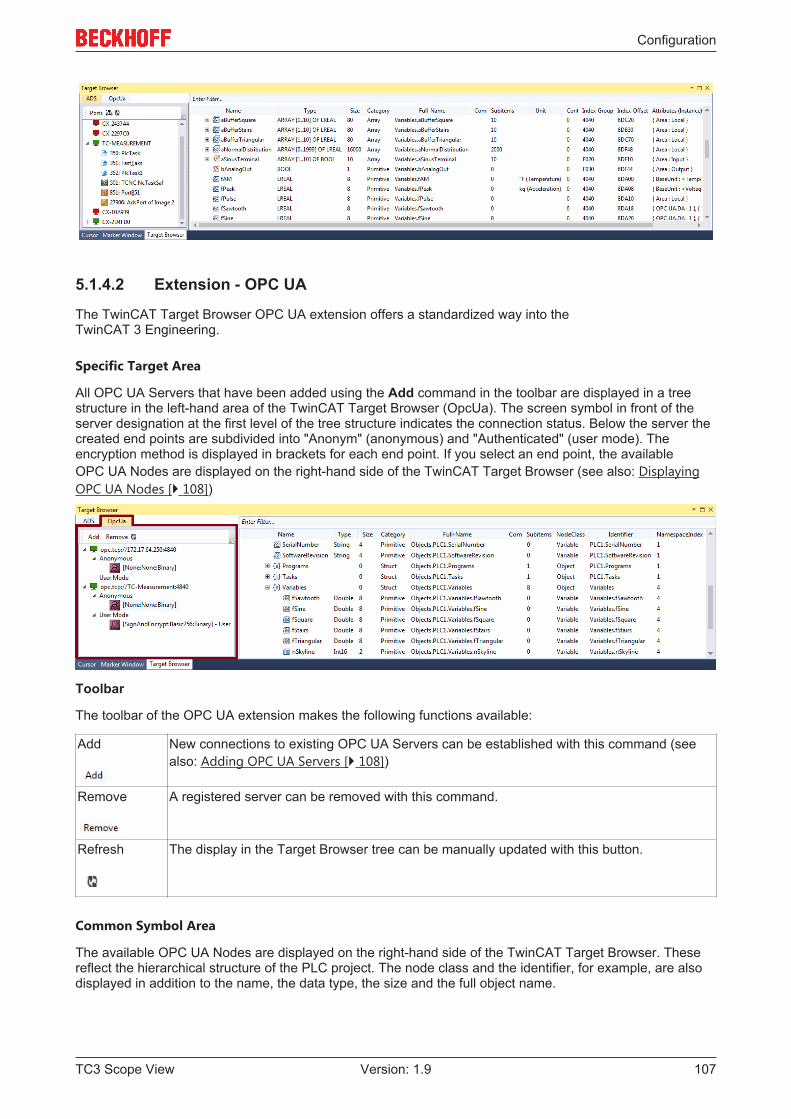
Configuration
TC3 Scope View 107Version: 1.9
5.1.4.2 Extension - OPC UA
The TwinCAT Target Browser OPC UA extension offers a standardized way into theTwinCAT 3 Engineering.
Specific Target Area
All OPC UA Servers that have been added using the Add command in the toolbar are displayed in a treestructure in the left-hand area of the TwinCAT Target Browser (OpcUa). The screen symbol in front of theserver designation at the first level of the tree structure indicates the connection status. Below the server thecreated end points are subdivided into "Anonym" (anonymous) and "Authenticated" (user mode). Theencryption method is displayed in brackets for each end point. If you select an end point, the availableOPC UA Nodes are displayed on the right-hand side of the TwinCAT Target Browser (see also: DisplayingOPC UA Nodes [ 108])
Toolbar
The toolbar of the OPC UA extension makes the following functions available:
Add New connections to existing OPC UA Servers can be established with this command (seealso: Adding OPC UA Servers [ 108])
Remove A registered server can be removed with this command.
Refresh The display in the Target Browser tree can be manually updated with this button.
Common Symbol Area
The available OPC UA Nodes are displayed on the right-hand side of the TwinCAT Target Browser. Thesereflect the hierarchical structure of the PLC project. The node class and the identifier, for example, are alsodisplayed in addition to the name, the data type, the size and the full object name.
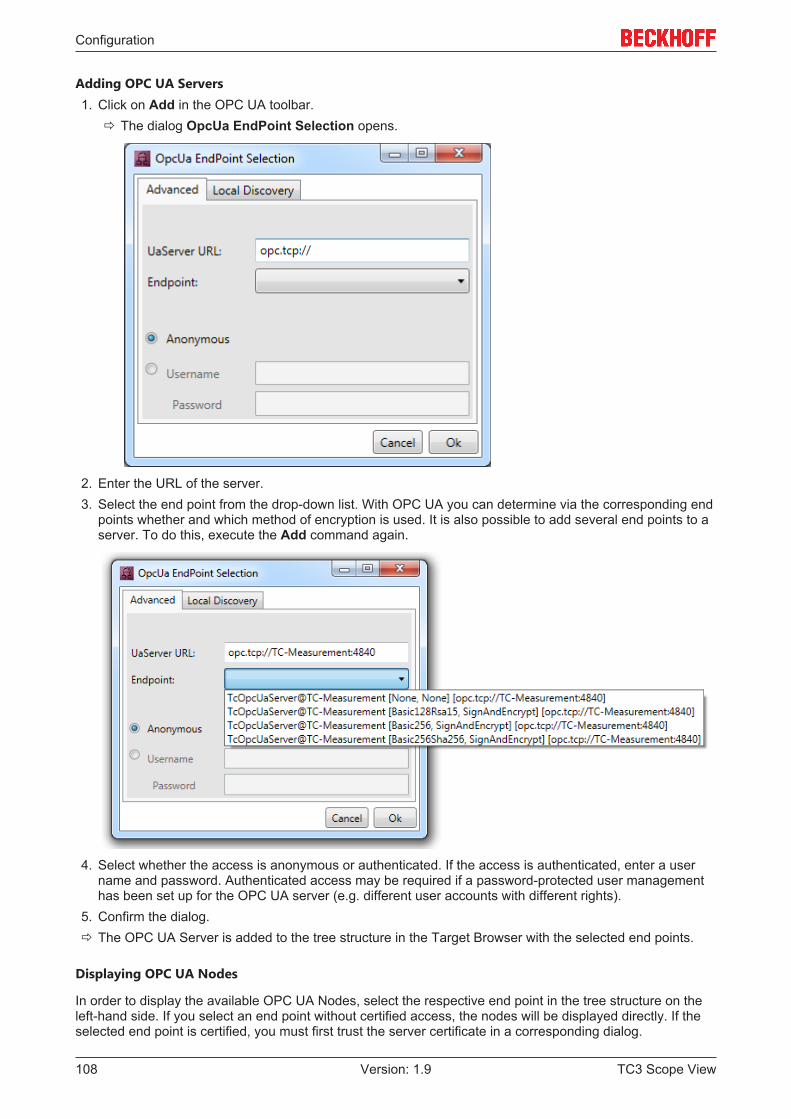
Configuration
TC3 Scope View108 Version: 1.9
Adding OPC UA Servers1. Click on Add in the OPC UA toolbar.
ð The dialog OpcUa EndPoint Selection opens.
2. Enter the URL of the server.3. Select the end point from the drop-down list. With OPC UA you can determine via the corresponding end
points whether and which method of encryption is used. It is also possible to add several end points to aserver. To do this, execute the Add command again.
4. Select whether the access is anonymous or authenticated. If the access is authenticated, enter a username and password. Authenticated access may be required if a password-protected user managementhas been set up for the OPC UA server (e.g. different user accounts with different rights).
5. Confirm the dialog.ð The OPC UA Server is added to the tree structure in the Target Browser with the selected end points.
Displaying OPC UA Nodes
In order to display the available OPC UA Nodes, select the respective end point in the tree structure on theleft-hand side. If you select an end point without certified access, the nodes will be displayed directly. If theselected end point is certified, you must first trust the server certificate in a corresponding dialog.
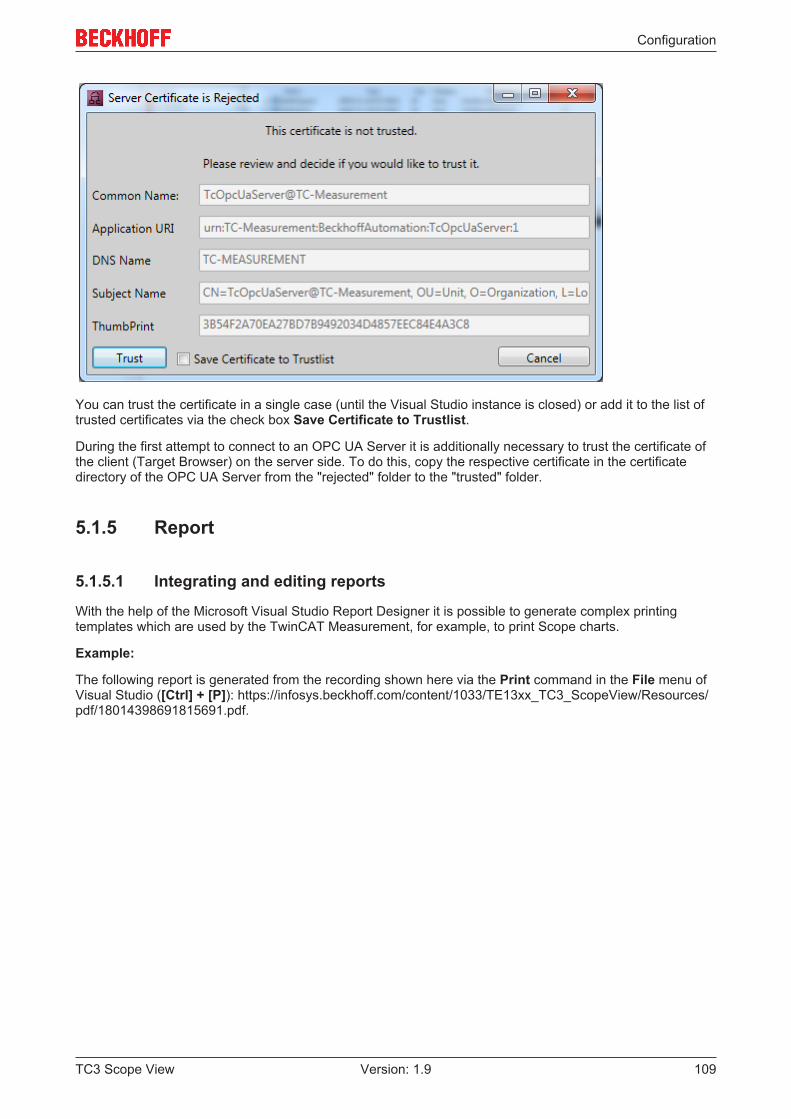
Configuration
TC3 Scope View 109Version: 1.9
You can trust the certificate in a single case (until the Visual Studio instance is closed) or add it to the list oftrusted certificates via the check box Save Certificate to Trustlist.
During the first attempt to connect to an OPC UA Server it is additionally necessary to trust the certificate ofthe client (Target Browser) on the server side. To do this, copy the respective certificate in the certificatedirectory of the OPC UA Server from the "rejected" folder to the "trusted" folder.
5.1.5 Report
5.1.5.1 Integrating and editing reports
With the help of the Microsoft Visual Studio Report Designer it is possible to generate complex printingtemplates which are used by the TwinCAT Measurement, for example, to print Scope charts.
Example:
The following report is generated from the recording shown here via the Print command in the File menu ofVisual Studio ([Ctrl] + [P]): https://infosys.beckhoff.com/content/1033/TE13xx_TC3_ScopeView/Resources/pdf/18014398691815691.pdf.
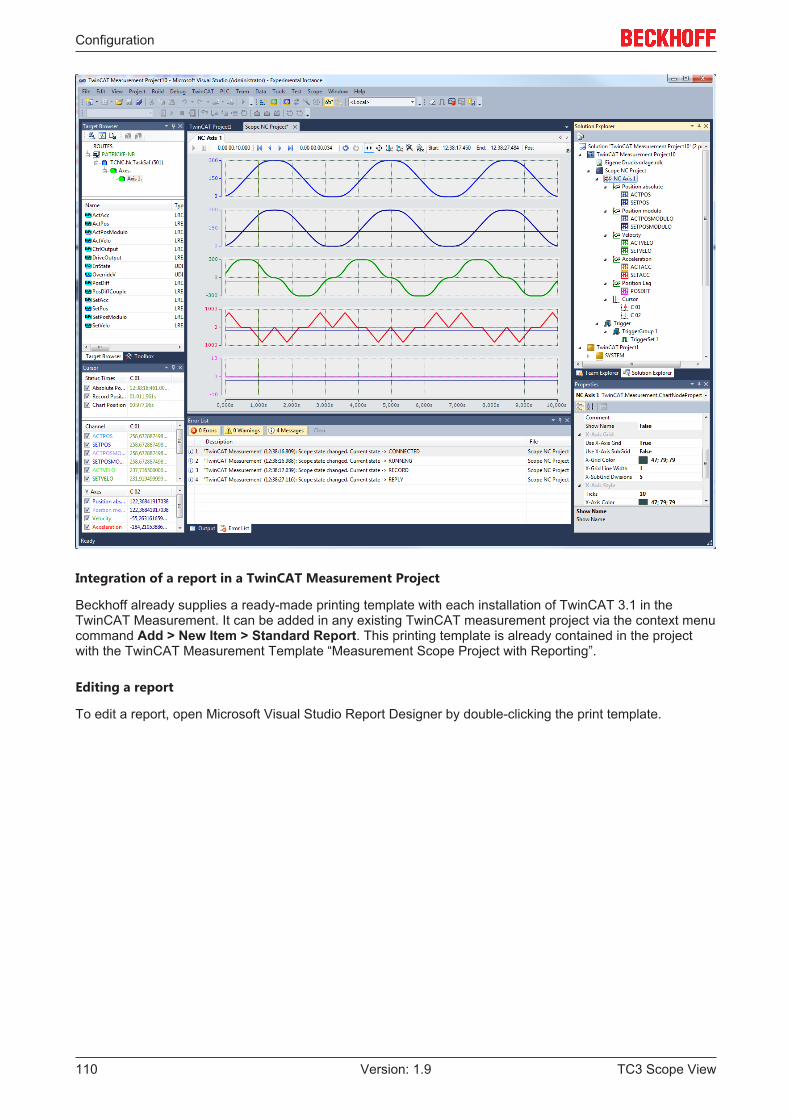
Configuration
TC3 Scope View110 Version: 1.9
Integration of a report in a TwinCAT Measurement Project
Beckhoff already supplies a ready-made printing template with each installation of TwinCAT 3.1 in theTwinCAT Measurement. It can be added in any existing TwinCAT measurement project via the context menucommand Add > New Item > Standard Report. This printing template is already contained in the projectwith the TwinCAT Measurement Template “Measurement Scope Project with Reporting”.
Editing a report
To edit a report, open Microsoft Visual Studio Report Designer by double-clicking the print template.

Configuration
TC3 Scope View 111Version: 1.9
For the editing of report templates, please refer to the following article: Report Designer (Visual Studio).
Data of the data set
For the design of your own printing templates, Beckhoff offers a ready-made data set containing all relevantdata of a Scope chart.
• Built-in Fields Execution Time: Time at which a print job was created Page Number: Current page number Report Name: Name of the report Total Pages: Total number of pages in the document User ID: User ID of the user who commissioned the report Language: Set system language
• Parameters ChartImage: Converted image of the chart. Can be converted back to an image using the
expression (System.Convert.FromBase64String (Parameters!ChartImage.Value). FilePath: Storage location of the associated Scope file Comment: The comment saved in the Scope element
Configuration
TC3 Scope View112 Version: 1.9
RecordStart: Start time of the recording RecordStop: Stop time of the recording
• Images logo: Beckhoff logo used in the standard template
• Channel_Properties AxisName: Name of the axis ChannelColorHex: Color of the channel in hexadecimal notation ChannelComment: Comment on the channel ChannelName: Name of the channel
• Cursor_Status_Times ColorHex: Color of the cursor in hexadecimal notation Column: Name of the cursor column Row: Name of the cursor row Value: Displayed value
• Cursor_X_Values ColorHex: Color of the cursor in hexadecimal notation Column: Name of the cursor column Row: Name of the cursor row Value: Displayed value
• Cursor_Y_Values ColorHex: Color of the cursor in hexadecimal notation Column: Name of the cursor column Row: Name of the cursor row Value: Displayed value
• Chart_Data Channel: Name of the channel Time: Time stamp of the value Value: Displayed value
Use of Chart_DataThe Chart_Data are the raw data of the chart. The raw data of the chart are for the creation of yourown displays. They are only exported if the setting Export Raw Data to Report has been selected(Options dialog [ 141]). This setting significantly delays the creation of reports.
5.2 Loading, saving and exporting
5.2.1 Configurations
5.2.1.1 Creating and editing configurations
The following section describes how you can create and edit a Scope configuration.

Configuration
TC3 Scope View 113Version: 1.9
5.2.1.1.1 Creating and editing a Scope project
Creating a measurement project
In the menu File > New select the command Project. In the dialog that opens select the category TwinCATMeasurement and the required template.
Available templates:
Empty Measurement project Empty Measurement Project. Scope configurations (.sv2 | .tcscope| .tcscopex) or scope data (.svd | .svdx) can subsequently be insertedhere.
Scope YT Project Contains a Scope instance and a preconfigured YT chart with acorresponding axis.
Scope YT Project with Reporting See "Scope YT Project" + a ready-made printing template forprinting charts.
Scope YT NC Project Contains a Scope instance, which was specially preconfigured forworking with drive axes. The template can easily be extended to thenumber of actually configured drive axes.
Scope XY Project Contains a Scope instance and a preconfigured XY chart with acorresponding axis.
Scope XY Project with Reporting See "Scope XY Project" + a ready-made printing template for printingcharts.
Scope Array Bar Project Contains a Scope instance and a preconfigured array bar chart witha corresponding axis.
Add Scope report/project
In the context menu of the Measurement project select the command Add > New Item..., then select therequired template in the dialog that opens.

Configuration
TC3 Scope View114 Version: 1.9
Available templates:
Scope Project Scope instance with a pre-configured chart and an axis.Scope NC Project Scope instance that has been specially pre-configured for working
with axes.Standard Report Printing template for printing charts.
Adding an existing Scope project to a measurement project
In the context menu of the measurement project, select the command Add > Existing Item and, in thedialog which then opens, select the desired file (.tcscopex | .tcscope | .sv2 | .svdx | .svd ) or drag the desiredfile by drag & drop onto the project in the Solution Explorer.
Adding variables
Adding variable or channels
The prerequisite is a TwinCAT Measurement project with a Scope View. To add channels to theconfiguration, double-click in the Target Browser on the corresponding channels in the tree structure ormark channels and select the command Add Symbols (Add Subsymbols) in the context menu or thetoolbar. The symbols are now inserted at the last-selected place in the Scope configuration. Alternatively,you can add selected elements anywhere in the configuration via drag & drop.
If you select a folder, an Ads Big type or an array containing subsymbols, the command Add Subsymbolsadds a channel for each subsymbol. The command Add Symbol only adds one channel with the informationfor the selected symbol.

Configuration
TC3 Scope View 115Version: 1.9
Disabling and enabling a channel
A channel can be disabled in the configuration in order to prevent it being recorded. However, it is retainedwhen saving the configuration.
In the Solution Explorer, mark the channel to be deactivated and set the Disabled property in theProperties window to TRUE.
Task selection
If you select a target computer in the tree structure, the connected tasks become visible. These are markedin color:
• Green = PLC task• Blue = NC task• Red = other
If a task is not displayed, you can use Enable Server Ports to call up a selection menu that displays therestriction to particular tasks.

Configuration
TC3 Scope View116 Version: 1.9
All popular Ads ports are displayed in the dialog, regardless of whether server tasks are concerned. If a portis not listed here it can be entered in the text field at the bottom left. All selected ports that are servers areadopted after confirming with OK. Subsequently a check is made as to which of the ports exist, in order toupdate the display.
Viewing the symbol list
If a symbol list is available for the selected task, you can call it by selecting. All symbols of a task aretransferred into a hierarchical view according to separators (e.g. '.'), allowing simple browsing.
Settings
The option Name Detail Level in the settings can be used to set the detail level of the channel name formedfrom the symbol name. If the detail level is zero, only the part of the symbol name after the last dot istransferred. Each further level then adds the term before the respective next full stop. For example, with adetail level of “0” the symbol “Main.Signals.Sine” becomes “Sine”, with a detail level of “1” it becomes“Signals.Sine”, with a detail level of “2” or higher “Main.Signals.Sine”.
Starting and stopping a recording
Once you have selected all channels for the recording you can start the recording with the Record command
in the TwinCAT Measurement toolbar ( ) and stop it again with the Stop Record command ( )
Adding and deleting elements
Adding a new chart
Select the New YT Chart or New XY Chart command in the context menu of the Scope instance.
Adding a new axis
Select the New Axis command in the context menu of the Scope / Chart instance.
Adding a new channel• Select the New Empty Channel command in the context menu of the Scope / Chart / Axis instance.• Drag & drop the symbol data from the Target Browser to an existing Scope / Chart / Axis instance.• Select the Add to Scope command in the context menu of the variable in the PLC editor.
Deletion of elements• In the Solution Explorer, mark the element to be deleted and press the [Del] button.• Select the Delete command in the context menu of the element.
Configuration
TC3 Scope View 117Version: 1.9
Shifting and copying elements
Moving and copying individual elements
Each element can be moved with drag & drop in the Solution Explorer. To copy an element, press the [Ctrl]button and shift the element by drag & drop.
Notes:
• If you move an element to another Scope, it is copied. Thus, it is still available in the original Scope.• When moving an element, it must always be placed on an element of a higher hierarchical level.• The described shift operations are available within a Scope even after the start of recording.
5.2.1.1.2 Creating and editing a Wizard project
The Measurement Wizard assists you in creating and configuring a user-defined Measurement Scopeproject by guiding you through the necessary steps with several successive dialogs.
Structure and mode of operation of the Measurement Wizard
In the main area of the wizard you will be instructed with the help of various design elements to select thesettings necessary for the Measurement Scope project. An option or setting is highlighted in gray afterselection. The wizard usually moves automatically to the next configuration step. Otherwise a button labeledNext appears at the bottom of the screen via which you can proceed to the next configuration step.
The steps that have already been completed are displayed in the left-hand area of the Wizard. The currentconfiguration step is highlighted in gray. You can return to an already completed configuration step via theprogress indicator or the Back button at the bottom edge of the wizard and edit the setting again.
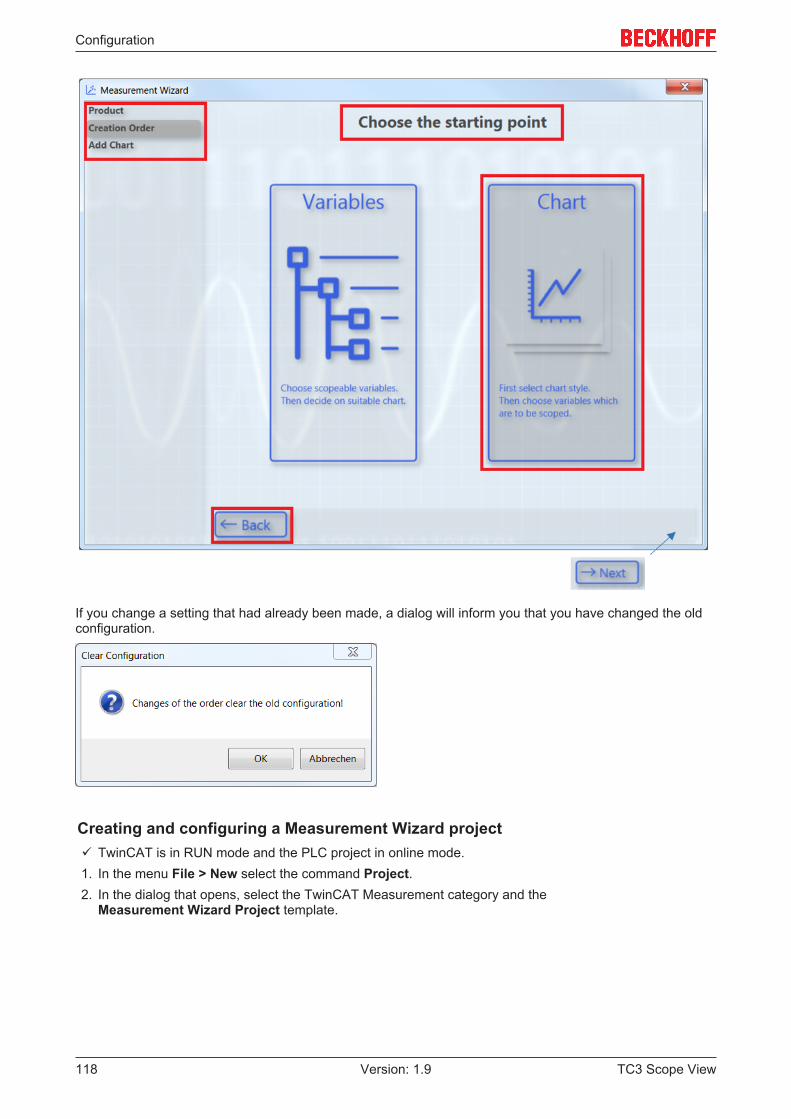
Configuration
TC3 Scope View118 Version: 1.9
If you change a setting that had already been made, a dialog will inform you that you have changed the oldconfiguration.
Creating and configuring a Measurement Wizard projectü TwinCAT is in RUN mode and the PLC project in online mode.1. In the menu File > New select the command Project.2. In the dialog that opens, select the TwinCAT Measurement category and the
Measurement Wizard Project template.
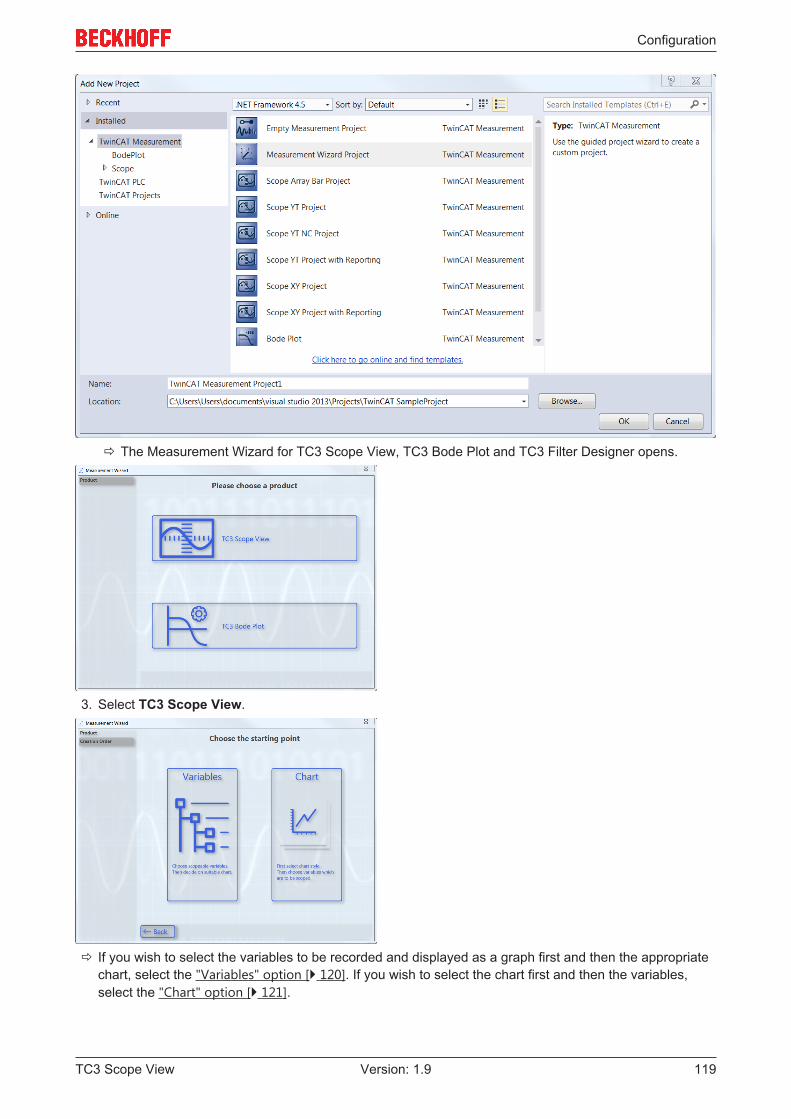
Configuration
TC3 Scope View 119Version: 1.9
ð The Measurement Wizard for TC3 Scope View, TC3 Bode Plot and TC3 Filter Designer opens.
3. Select TC3 Scope View.
ð If you wish to select the variables to be recorded and displayed as a graph first and then the appropriatechart, select the "Variables" option [ 120]. If you wish to select the chart first and then the variables,select the "Chart" option [ 121].
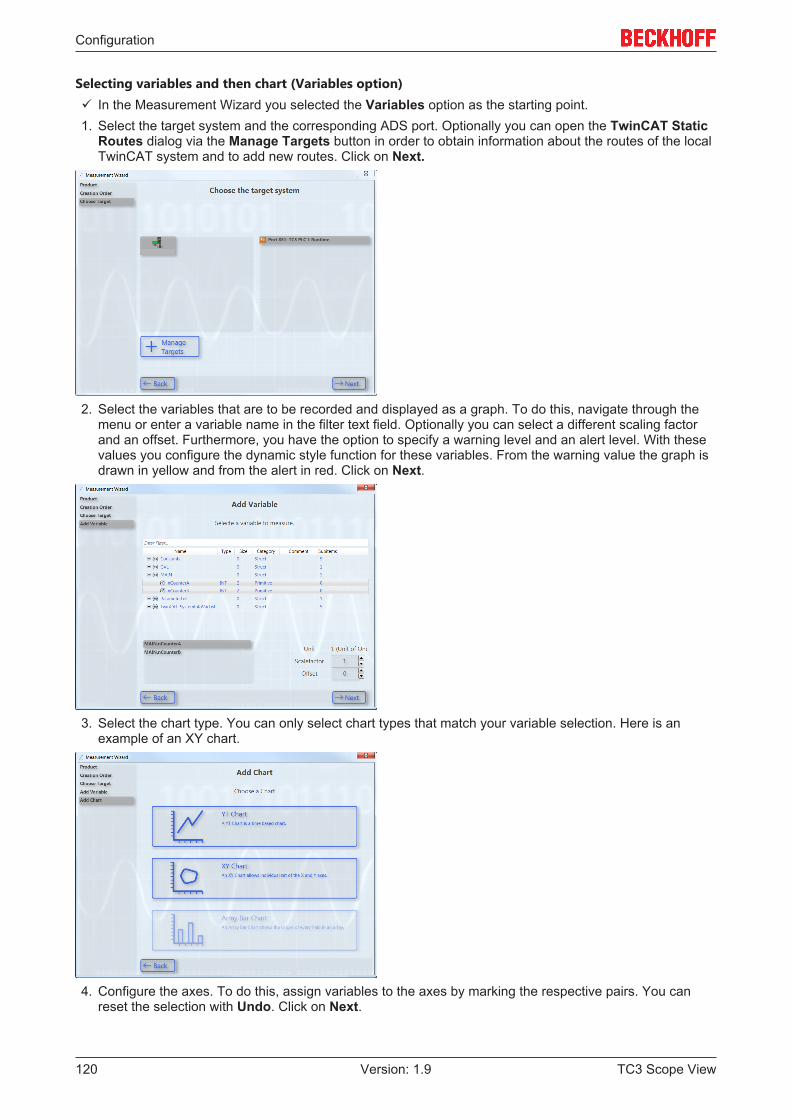
Configuration
TC3 Scope View120 Version: 1.9
Selecting variables and then chart (Variables option)ü In the Measurement Wizard you selected the Variables option as the starting point.1. Select the target system and the corresponding ADS port. Optionally you can open the TwinCAT Static
Routes dialog via the Manage Targets button in order to obtain information about the routes of the localTwinCAT system and to add new routes. Click on Next.
2. Select the variables that are to be recorded and displayed as a graph. To do this, navigate through themenu or enter a variable name in the filter text field. Optionally you can select a different scaling factorand an offset. Furthermore, you have the option to specify a warning level and an alert level. With thesevalues you configure the dynamic style function for these variables. From the warning value the graph isdrawn in yellow and from the alert in red. Click on Next.
3. Select the chart type. You can only select chart types that match your variable selection. Here is anexample of an XY chart.
4. Configure the axes. To do this, assign variables to the axes by marking the respective pairs. You canreset the selection with Undo. Click on Next.
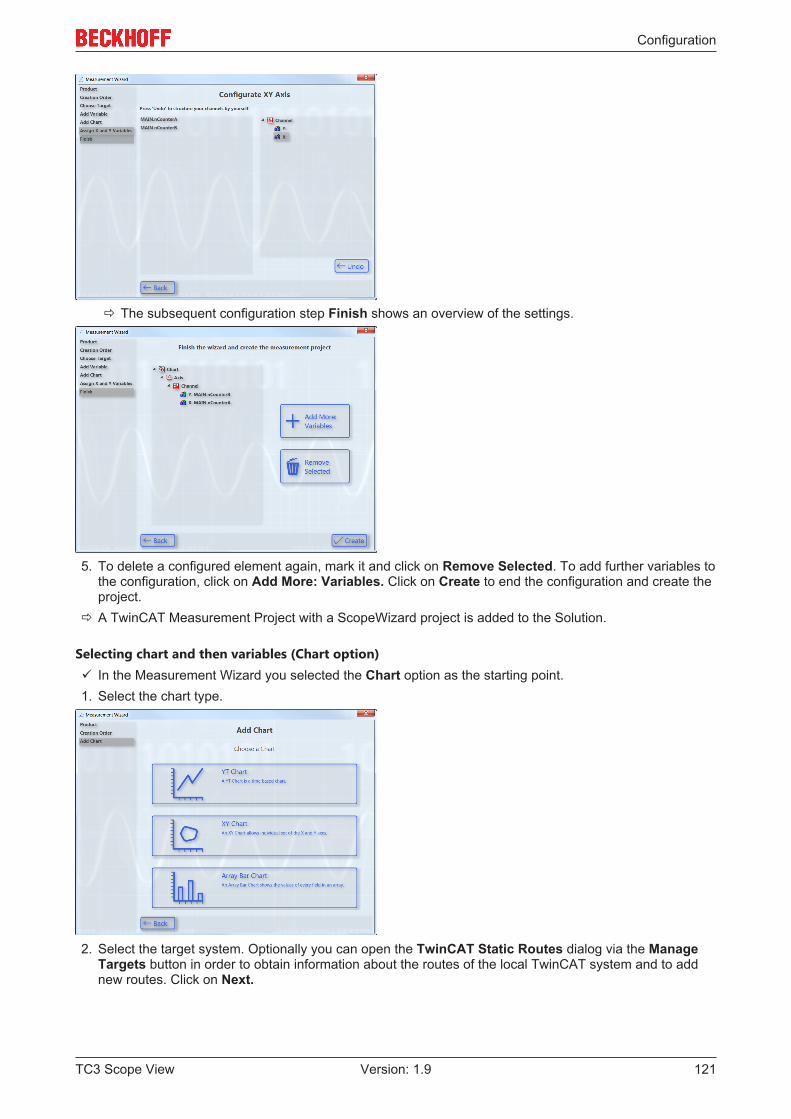
Configuration
TC3 Scope View 121Version: 1.9
ð The subsequent configuration step Finish shows an overview of the settings.
5. To delete a configured element again, mark it and click on Remove Selected. To add further variables tothe configuration, click on Add More: Variables. Click on Create to end the configuration and create theproject.
ð A TwinCAT Measurement Project with a ScopeWizard project is added to the Solution.
Selecting chart and then variables (Chart option)ü In the Measurement Wizard you selected the Chart option as the starting point.1. Select the chart type.
2. Select the target system. Optionally you can open the TwinCAT Static Routes dialog via the ManageTargets button in order to obtain information about the routes of the local TwinCAT system and to addnew routes. Click on Next.
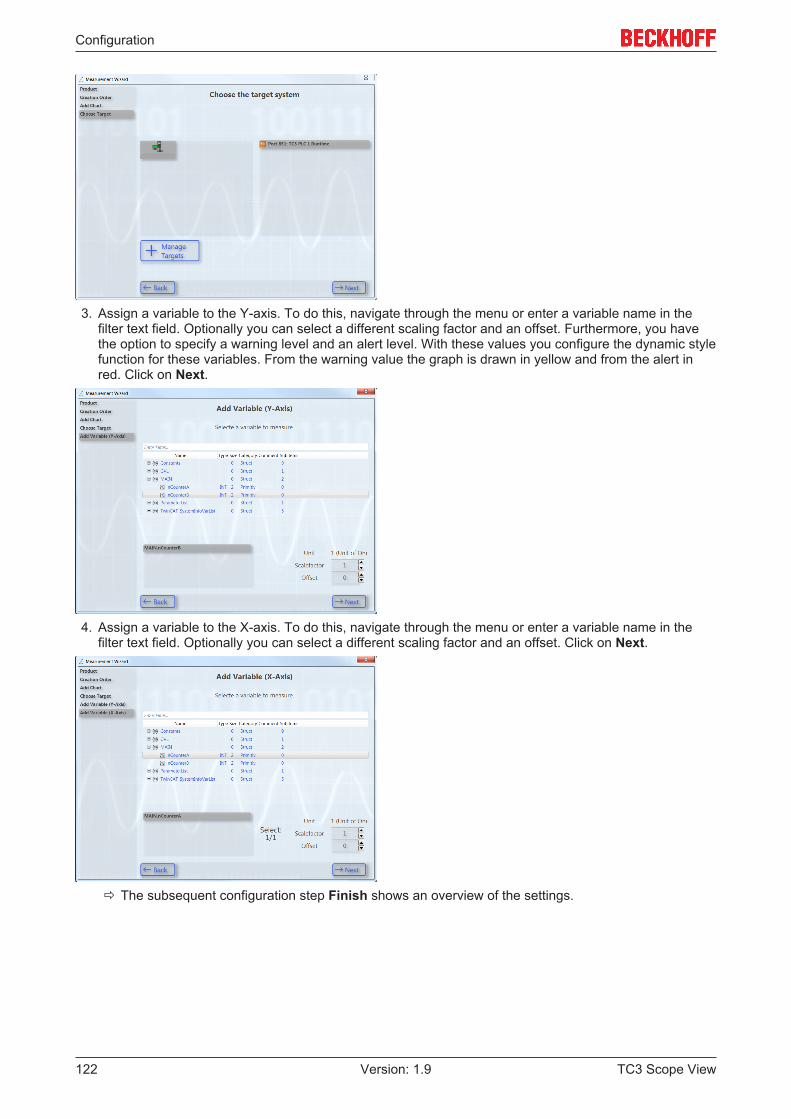
Configuration
TC3 Scope View122 Version: 1.9
3. Assign a variable to the Y-axis. To do this, navigate through the menu or enter a variable name in thefilter text field. Optionally you can select a different scaling factor and an offset. Furthermore, you havethe option to specify a warning level and an alert level. With these values you configure the dynamic stylefunction for these variables. From the warning value the graph is drawn in yellow and from the alert inred. Click on Next.
4. Assign a variable to the X-axis. To do this, navigate through the menu or enter a variable name in thefilter text field. Optionally you can select a different scaling factor and an offset. Click on Next.
ð The subsequent configuration step Finish shows an overview of the settings.

Configuration
TC3 Scope View 123Version: 1.9
5. To delete a configured element again, mark it and click on Remove Selected. To add a further chart tothe configuration, click on Add More: Chart. Click on Create to end the configuration and create theproject.
ð A TwinCAT Measurement Project with a ScopeWizard project is added to the Solution.
Editing Scope projects with the Scope Wizard
To edit a Measurement Wizard project or a Measurement Scope project with the aid of theMeasurement Wizard, select Update Project in Scope Wizard in the context menu of the scope project inthe Solution Explorer. The Measurement Wizard opens in which you can modify the configuration of theproject.
Project update with Scope WizardThe prerequisite for this function is that the original target system of the configuration is available onthe engineering system.
5.2.1.2 Saving and loading a configuration
Saving a Scope configuration:
In the File menu select the command Save. (default keyboard shortcut: [Ctrl] + [S])
Loading a Scope configuration• In the File > Open menu, select the Project/Solution command and, in the dialog which then opens,
select the project folder or the Measurement Project.• Scope files (.tcscope | .sv2 | .svd) can be opened directly by double-clicking. Since a Measurement
Project as the basis is missing, a selection dialog appears in which you can create a new project(Empty Measurement Project). The Scope called by a double-click is added to the newly createdproject. At the same time a copy of the file is placed in the new project directory.
• Measurement project files (.tcmproj) and solutions (.sln) can be opened directly by double-clicking.
5.2.1.3 Sending a configuration by e-mail
In the context menu of the Scope instance to be sent, select the command Send Project By Email.
If the Scope contains data (Scope state: replay), you can select whether the data should also be sent.

Configuration
TC3 Scope View124 Version: 1.9
5.2.2 Data
5.2.2.1 Formats
The TwinCAT Scope has been on the market since 2008 and now supports a series of its own file formatsdue to new developments. This page provides an overview of them. All formats can always be used with thelatest Scope version.
Configuration:
Scope version File formatAll in TwinCAT Scope2 (TwinCAT 2) .sv2From TwinCAT 3 Scope .tcscopeSince TwinCAT 3 Scope version 3.3.3140.0 .tcscopex
The configuration files can always be converted into the more up-to-date formats. i.e. .sv2>> .tcscope, .tcscope >> .tcscopex and also .sv2 >> .tcscopex.
Data:
The data are saved in .svd files in TwinCAT Scope 2 and also in TwinCAT 3 Scope up to version 3.3.3140.0.From version 3.3.3140.0 the files are saved in the new .svdx format. Old .svd files can also be convertedinto .svdx again.
From version 3.3.3140.0 a .tcscopex file is saved for the configuration. The data are written to a .svdx file.
5.2.2.2 Saving and loading data
Data that have been recorded with the TC3 Scope View can be saved as a .svdx file. A .svdx file is aspecific, non-disclosed data format of the TwinCAT 3 Scope View.
Saving data• Select the Save Data command in the Scope menu or in the toolbar. This creates a Scope data file
(svdx) that can be added directly to the measurement project or saved in a directory via the directoryselection dialog.
• If you add multiple files to a measurement project, the name of the svdx file is automaticallyincremented with a digit.
Loading data
The following options are available for loading data:
• Double-click the desired .svdx file in the file system. Visual Studio opens and the dialog New Projectappears. Select the Empty Measurement Project. The .svdx file is added to the new measurementproject.
• If a measurement project already exists, the .svdx file can be selected and opened via the commandAdd Existing Item.
• Open the measurement project, to which the .svdx file that was created has been added. In menuFile > Open select the command Project/Solution; in the dialog that opens open the correspondingproject.

Configuration
TC3 Scope View 125Version: 1.9
Reloading of svdx files
If already save data are no longer displayed due to a disconnection of the Scope's internal communication tothe Scope Server, the Reload command is automatically available in the context menu for the .svdx file. Youcan reload the data with this command.
Extracting Scope configurations from an svdx file
A .svdx file is visually identified as such. A yellow data symbol is displayed in the Solution Explorer. Thisenables exclusively data analysis within the file.
If you want to reuse the configuration, for example to make a new recording with the same configuration,select the command Extract Scope Configuration in the Scope menu.
5.2.2.3 Exporting data
In order to enable the further processing of the data recorded with the TwinCAT Scope, the data can beexported in various other data formats. The TwinCAT Measurement Export Wizard is provided in order tomake this as simple and as individual as possible.

Configuration
TC3 Scope View126 Version: 1.9
1. Open the Export Wizard via the Scope Menu > Export…2. On the first page you can select the desired target format. The original svd format is thereby selectable
again as the target simply in order to reduce existing scope recordings with regard to the number ofchannels or their duration. Further formats are csv, svb, tdms and dat.
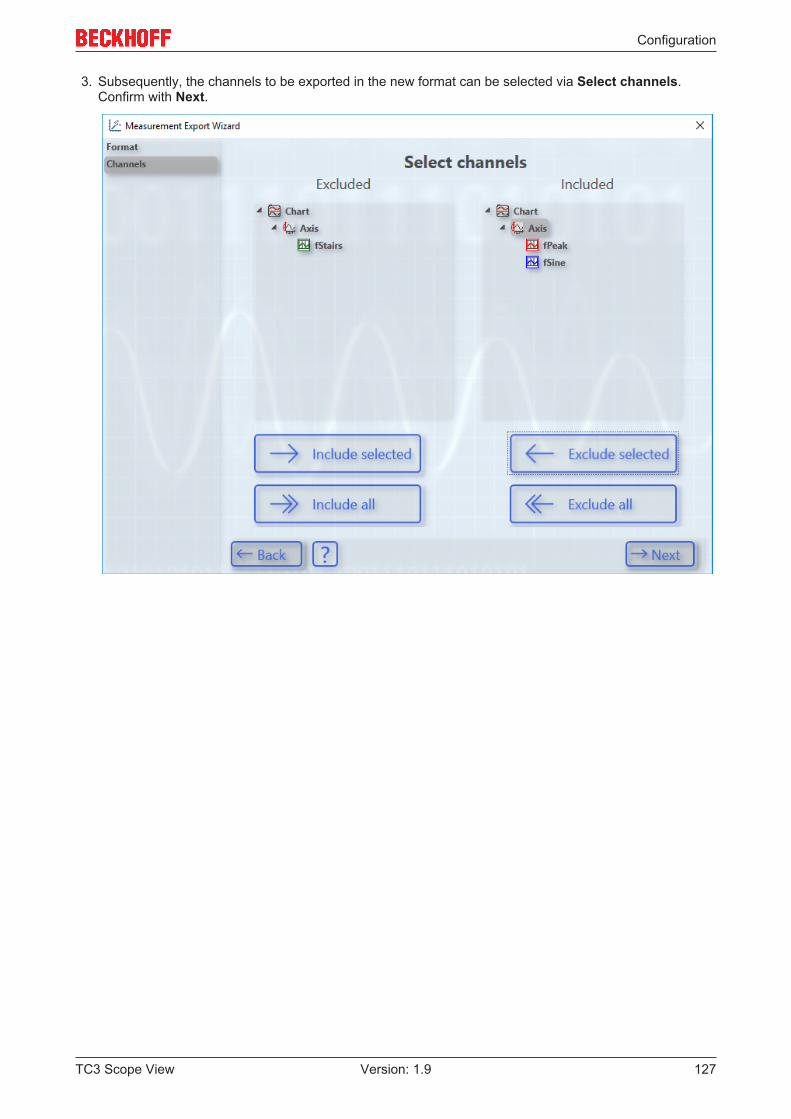
Configuration
TC3 Scope View 127Version: 1.9
3. Subsequently, the channels to be exported in the new format can be selected via Select channels.Confirm with Next.

Configuration
TC3 Scope View128 Version: 1.9
4. The timeframe that was defined by the recording is selected in the Select time period dialog. Select thistimeframe graphically with the mouse or textually with Export start time and Export end time. Confirmwith Next.
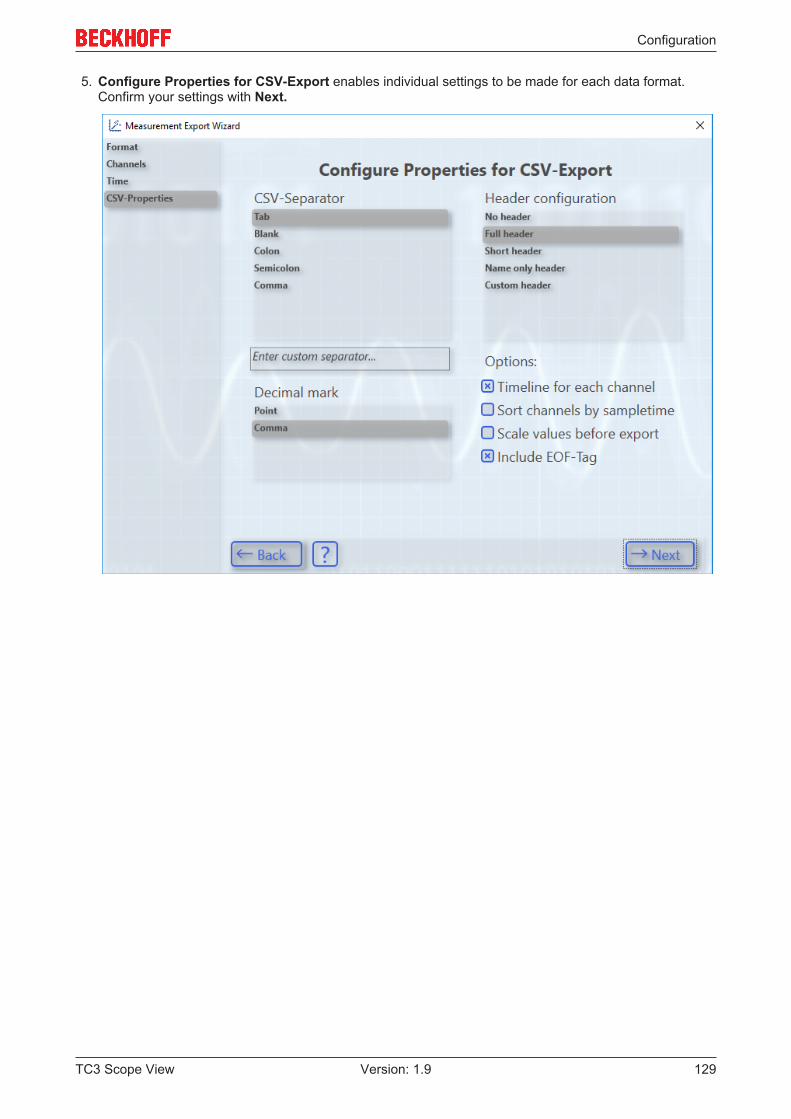
Configuration
TC3 Scope View 129Version: 1.9
5. Configure Properties for CSV-Export enables individual settings to be made for each data format.Confirm your settings with Next.
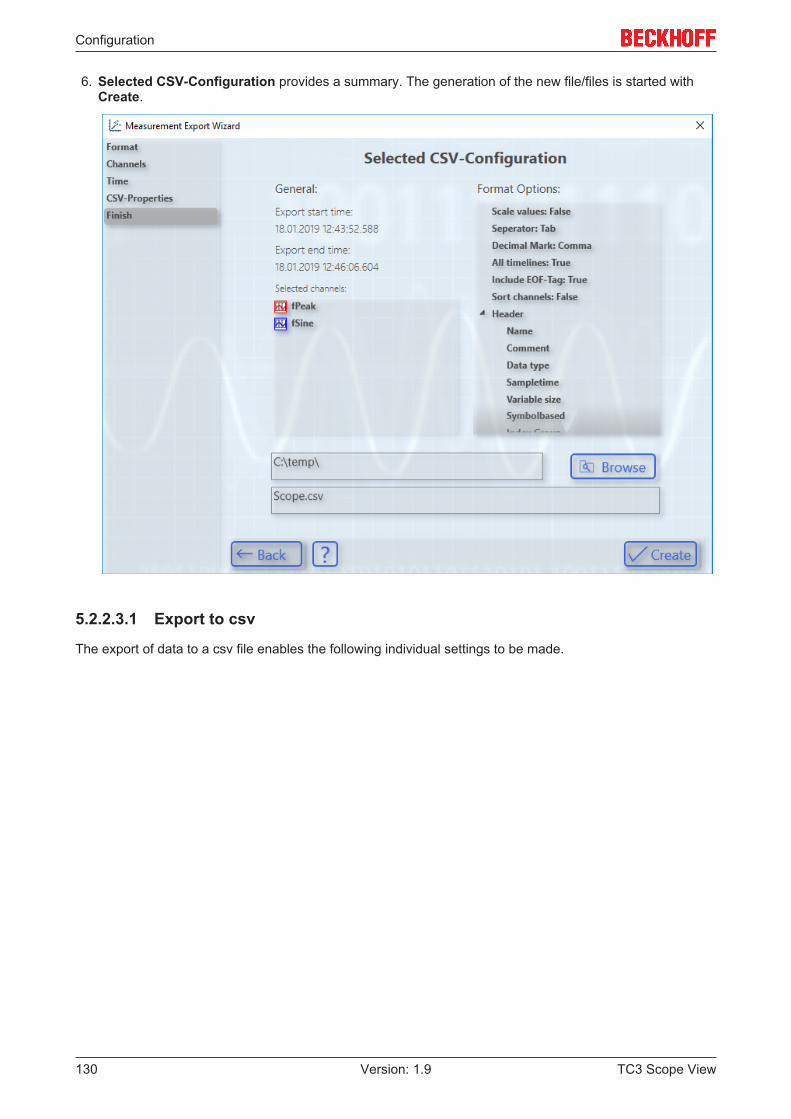
Configuration
TC3 Scope View130 Version: 1.9
6. Selected CSV-Configuration provides a summary. The generation of the new file/files is started withCreate.
5.2.2.3.1 Export to csv
The export of data to a csv file enables the following individual settings to be made.

Configuration
TC3 Scope View 131Version: 1.9
The separators and decimal markings to be used for the export can be selected. To do this the header withsome additional information can be switched completely on or off. An individual header is also possible viathe Custom header option. The page opens as an intermediate page by confirming Next.
Furthermore, you can decide in the options to export the time axis, which is inserted for each channel, onlyfor different sampling times. Sorting can then be done on the basis of the sampling rate. You can also exportscaled or unscaled values. An End-Of-File tag can optionally be written to the csv.
Individualization of the csv header when selecting Custom header:

Configuration
TC3 Scope View132 Version: 1.9
5.2.2.3.2 Export to svb
The TwinCAT Scope also supports the export of data to a binary format specified by Beckhoff. The fileextension of the created file is svb. The following parameters can be set:

Configuration
TC3 Scope View 133Version: 1.9
The header can be shown and hidden and also moved to its own file. You can choose whether to export thevalues in scaled or unscaled form, with and without sampling rate/time information.
Format description for developers
The binary data format is based on the text format but contains no separators. Instead the byte lengths of allvariable data types (such as character strings) are contained in the corresponding headers. All times arespecified in the file time format: 1 tick = 100 ns; origin is 1.1.1601 0h. All characters are stored in UTF8.

Configuration
TC3 Scope View134 Version: 1.9
Variable Size (Bytes) or Number of character DataTypeMAIN-HEADERHeaderSize 8 Int64NameSize 4 Int32Name NameSize Array of CharStartTime 8 Int64EndTime 8 Int64ChannelCount 4 Int32
Variable Size (Bytes) DataTypeChannel - Header #1ChannelHeaderSize 8 Int64NameSize 4 Int32Name NameSize Array of CharNetIdSize 4 Int32NetId NetIdSize Array of CharPort 4 Int32Sample Time 8 Int64SymbolBased 1 bool (as byte)SymoblNameSize 4 Int32Symbol name: SymbolNameSize Array of CharCommentSize 4 Int32Comment CommentSize Array of CharIndexGroup 8 Int64IndexOffset 8 Int64DataTypeSize 4 Int32DataType DataTypeSize Array of CharDataTypeId 4 Int32VariableSize 4 Int32Samples in File 8 Int64Data in File 8 Int64File-StartPosition 8 Int64Offset 8 Real64Scalefactor 8 Real64Bitmask 8 Int64Channel-Header #2...Channel-Header #MainHeader.ChannelCount
Variable Size (Bytes) DataTypeData Channel #1DataPoint #1Timestamp 4 UInt32Value ChannelHeader1.VariableSize ChannelHeader.DataTypeDataPoint #2...DataPoint ChannelHeader #1.Samples In FileData Channel #2...
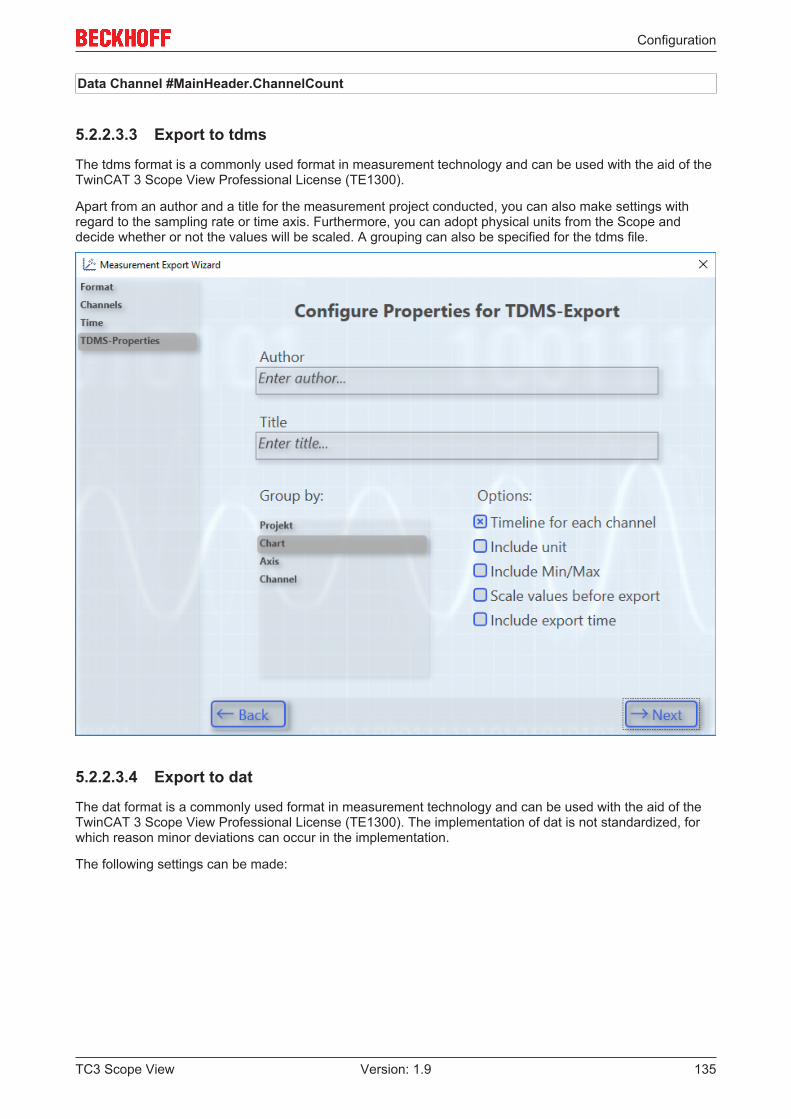
Configuration
TC3 Scope View 135Version: 1.9
Data Channel #MainHeader.ChannelCount
5.2.2.3.3 Export to tdms
The tdms format is a commonly used format in measurement technology and can be used with the aid of theTwinCAT 3 Scope View Professional License (TE1300).
Apart from an author and a title for the measurement project conducted, you can also make settings withregard to the sampling rate or time axis. Furthermore, you can adopt physical units from the Scope anddecide whether or not the values will be scaled. A grouping can also be specified for the tdms file.
5.2.2.3.4 Export to dat
The dat format is a commonly used format in measurement technology and can be used with the aid of theTwinCAT 3 Scope View Professional License (TE1300). The implementation of dat is not standardized, forwhich reason minor deviations can occur in the implementation.
The following settings can be made:

Configuration
TC3 Scope View136 Version: 1.9
5.2.2.3.5 Automated export
Along with the Scope, the TwinCAT 3 ScopeExportTool is additionally installed in the TE130X Scope Viewand in the TF3300 Scope Server directory. This can be used to subsequently convert contents of svd filesinto the supported export formats - without Visual Studio. The tool comes complete with its documentation. Italways requires a Professional License for the tdms and dat formats.
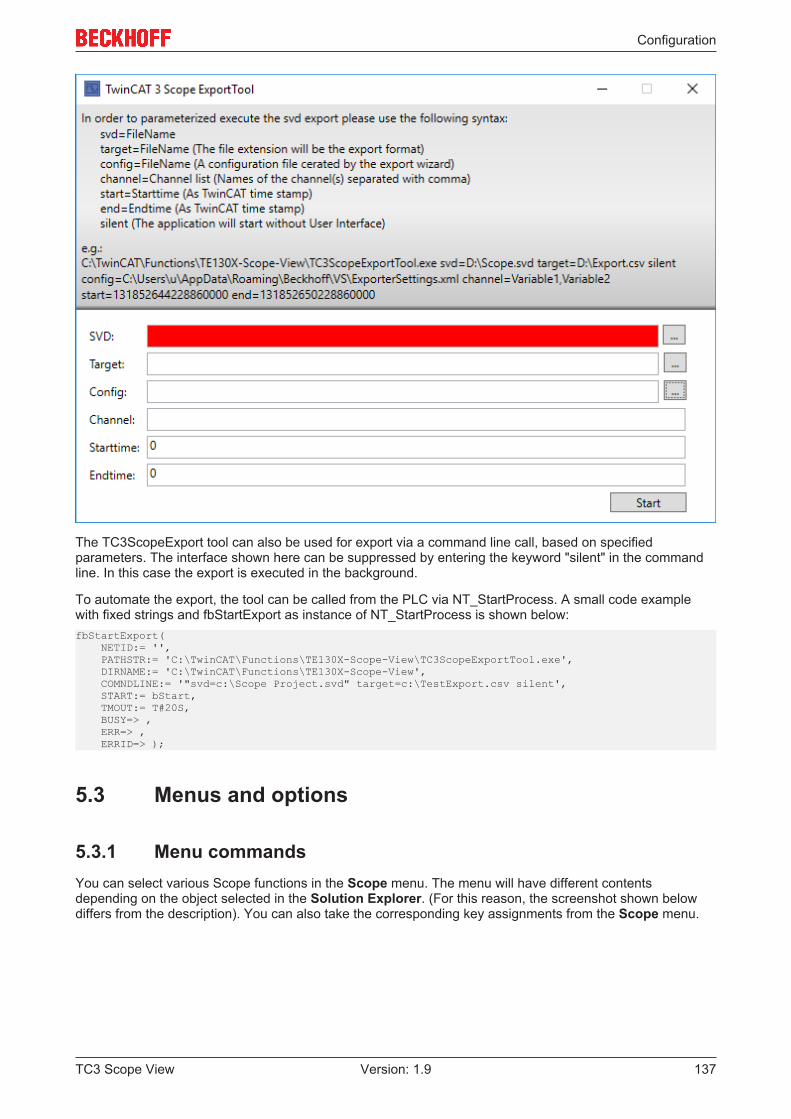
Configuration
TC3 Scope View 137Version: 1.9
The TC3ScopeExport tool can also be used for export via a command line call, based on specifiedparameters. The interface shown here can be suppressed by entering the keyword "silent" in the commandline. In this case the export is executed in the background.
To automate the export, the tool can be called from the PLC via NT_StartProcess. A small code examplewith fixed strings and fbStartExport as instance of NT_StartProcess is shown below:fbStartExport( NETID:= '', PATHSTR:= 'C:\TwinCAT\Functions\TE130X-Scope-View\TC3ScopeExportTool.exe', DIRNAME:= 'C:\TwinCAT\Functions\TE130X-Scope-View', COMNDLINE:= '"svd=c:\Scope Project.svd" target=c:\TestExport.csv silent', START:= bStart, TMOUT:= T#20S, BUSY=> , ERR=> , ERRID=> );
5.3 Menus and options
5.3.1 Menu commandsYou can select various Scope functions in the Scope menu. The menu will have different contentsdepending on the object selected in the Solution Explorer. (For this reason, the screenshot shown belowdiffers from the description). You can also take the corresponding key assignments from the Scope menu.

Configuration
TC3 Scope View138 Version: 1.9

Configuration
TC3 Scope View 139Version: 1.9
Target Browser Opens the Target Browser.Cursor Window Opens the cursor window.Send Project By E-Mail... Corresponds to the command Send Project By E-Mail... in the context
menu of the Scope instance to be sent.If the Scope contains data (Scope state: replay), you can selectwhether the data should also be sent.
Clear error list Deletes all entries (Error | Warning | Message) of the currently activeScope from the error list.
Change Ads Symbol... Dialog for the replacement of character strings. The symbol names ofall channels located below the selected element are edited.
Change Index Group... Dialog for incrementing / decrementing the Index Group / Index Offset.The acquisitions of all channels located below the selected element areedited.
New YT Chart Creates a new YT chart within the Scope.New XY Chart Creates a new XY chart within the Scope.New Array Bar Chart Creates a new array bar chart within the Scope.New Axis Creates a new axis within the chart. If the selected element is not a
chart, then a new chart is additionally created.New Empty Channel Creates a new channel within the axis. If no axis is selected, then a
new axis is additionally created.Delete Deletes the element currently selected in the Solution Explorer.Export to CSV Exports the data to a CSV or TXT file.Export to Binary Exports the data to a binary file.Export to DAT Exports the data to a DAT file.Export to TDMS Exports the data to a TDMS file.Extract Scope Configuration Extracts the Scope Configuration from the selected .svd file.Upload Configuration To Target Downloads the current configuration as a .tcscope file to a user-
selected target system.Save Data After stopping the recording, the current data including the
configuration can be saved in an .svd file.The generated Scope data file (.svd) can be added directly to theMeasurement Project or saved in a directory of your choice via thedirectory selection dialog.
Scope Messages Some frequently occurring message boxes in the scope are equippedwith a checkbox – Remember my answer and don't ask again! – sothat the question is not repeated the next time. This makes thehandling of the program individually adjustable for each user. If amessage box has been deactivated, it can be activated again here.
Local Scope Server... Opens the configuration interface of the Scope Server.Options... Opens the Visual Studio Options window and selects the Scope entry.
5.3.2 Toolbar commandsThe Scope recording can be started and stopped and the recorded data saved with the commands from theTwinCAT Measurement toolbar.
If the toolbar is not visible by default or was closed, you can call it up again via View > Toolbars.
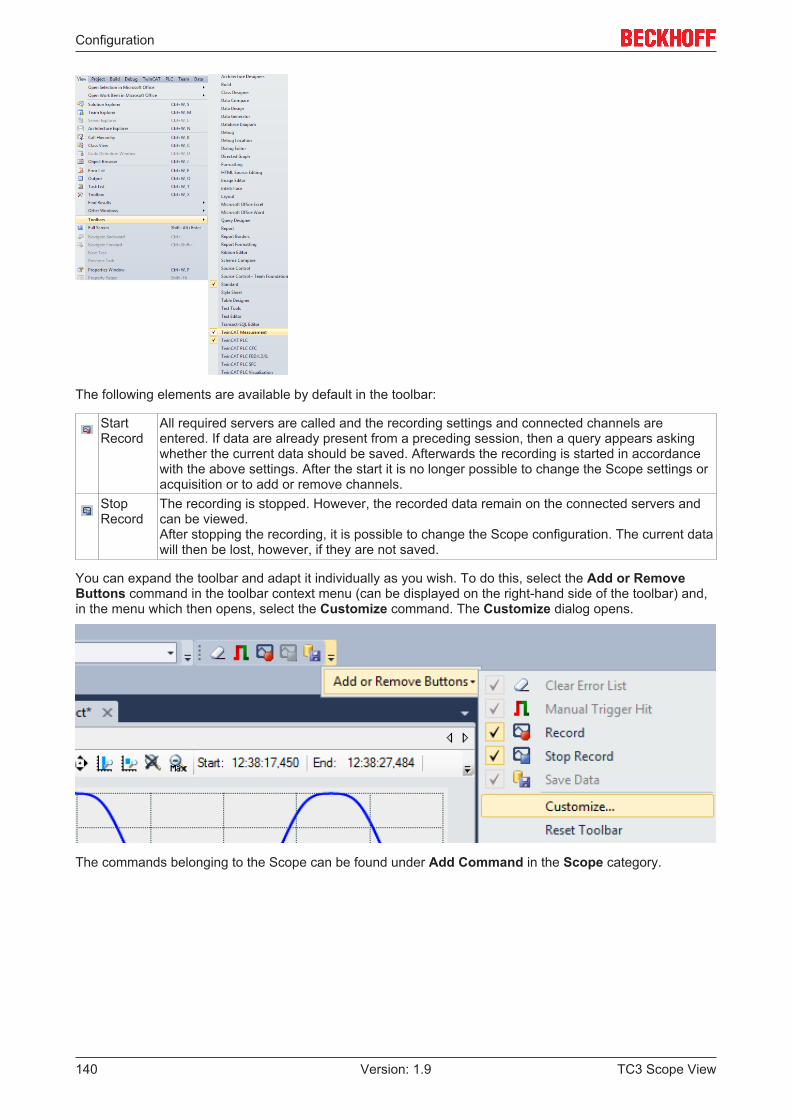
Configuration
TC3 Scope View140 Version: 1.9
The following elements are available by default in the toolbar:
StartRecord
All required servers are called and the recording settings and connected channels areentered. If data are already present from a preceding session, then a query appears askingwhether the current data should be saved. Afterwards the recording is started in accordancewith the above settings. After the start it is no longer possible to change the Scope settings oracquisition or to add or remove channels.
StopRecord
The recording is stopped. However, the recorded data remain on the connected servers andcan be viewed.After stopping the recording, it is possible to change the Scope configuration. The current datawill then be lost, however, if they are not saved.
You can expand the toolbar and adapt it individually as you wish. To do this, select the Add or RemoveButtons command in the toolbar context menu (can be displayed on the right-hand side of the toolbar) and,in the menu which then opens, select the Customize command. The Customize dialog opens.
The commands belonging to the Scope can be found under Add Command in the Scope category.

Configuration
TC3 Scope View 141Version: 1.9
5.3.3 OptionsYou can define the standard settings in the TwinCAT Measurement options. Open the options in VisualStudio via the Options… command in the Scope menu.
Options dialog
Reporting
General category

Configuration
TC3 Scope View142 Version: 1.9
Show Chart Timebar/Toolbar Specifies whether the time bar and toolbar of the Scope chart shouldbe visible in the printing template.
Use Custom Color TRUE: The following color settings will be applied before the chart isexported for the report. (You can select color combinations thatreduce the ink consumption for printing).
Border Background Color Color for the border of the chartChart Background Color Color for the background of the chartX-Axis Color Color for the labeling of the X-axisX-Axis Color Color for the grid of the X-axisY-Axis Color Color for the labeling of the Y-axisY-Axis Color Color for the grid of the Y-axisExport Raw Data to Report Provides the raw chart data for the report. (Significantly extends the
time it takes to generate a report | Only required for creating customcharts).
Scope
General Settings for the tracing of the Scope View product componentsAcquisition Standard acquisition data (will be used if empty channels are inserted)
See: Acquisition [ 34]Channel Standard channel settings (will be used if empty channels are inserted)
See: YT channel style [ 32]Chart Standard chart settings (will be used if new charts are inserted)
See: YT chart properties [ 27]Error list • Clear on Record: Deletes the respective error messages for the Scope instance from
the error list as soon as a Scope changes to the record mode.• Show Clear List Command: Shows the context menu command Clear Error List....• Show Messages: Shows messages from the Scope in the error list.• Show Warnings: Shows warnings from the Scope in the error list.
Scope Standard Scope settings (will be used if new Scope instances are inserted)
See also: Scope nodes [ 23]Unit DictionaryEditor
The Unit Dictionary is a sort of dictionary for all unit elements. These include base units,transformations and user units. All available unit elements stored in the dictionary can beviewed with the aid of the Unit Dictionary Editor. In addition, there is an option to add newvalues via the editor.
See: Units [ 85] and Unit Dictionary Editor [ 101]X-axis Standard axis settings for the X-axis (will be used if new axes are inserted)
See: YT axis properties [ 31]Y-axis Standard axis settings for the Y-axis (will be used if new axes are inserted)
See: YT axis properties [ 31]
5.4 Scope Diagnostics
5.4.1 Debug messagesFor a very deep diagnosis of the behavior of the TwinCAT Scope itself, debug messages can be activated inboth main components, View and Server. This can take place at various levels. The messages are describedin corresponding trace log files in the TwinCAT Functions directory, in each case under View and Server.
View:
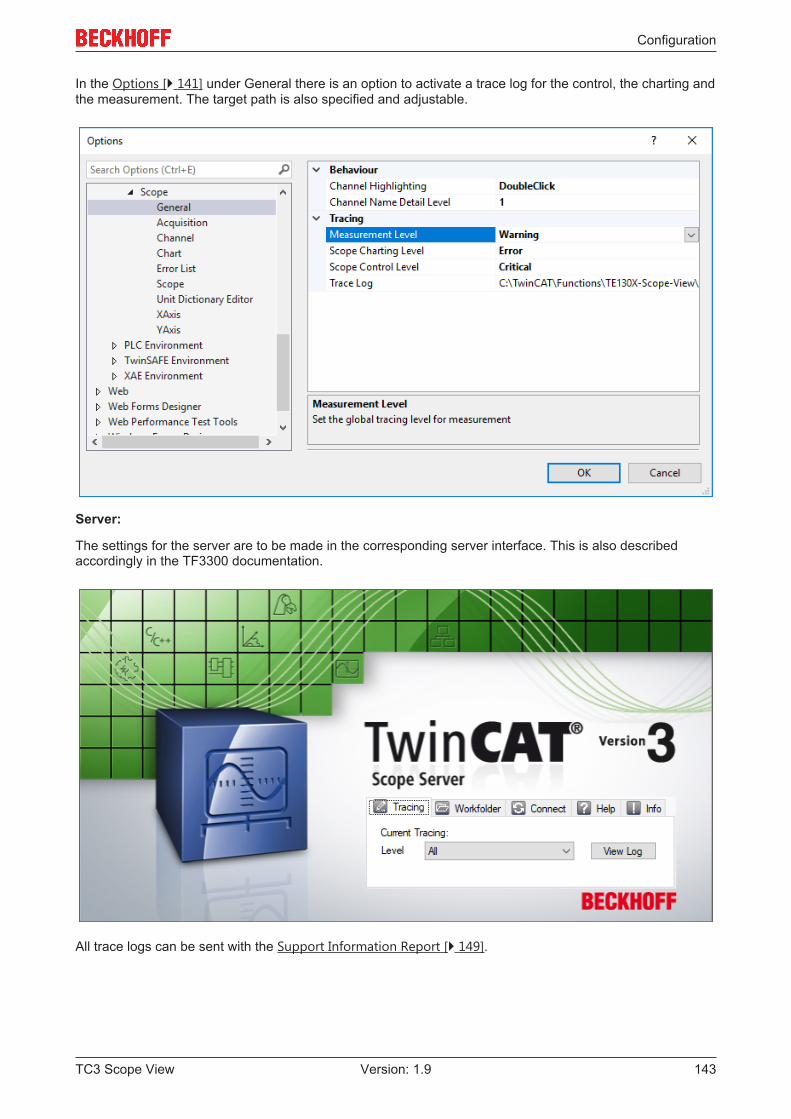
Configuration
TC3 Scope View 143Version: 1.9
In the Options [ 141] under General there is an option to activate a trace log for the control, the charting andthe measurement. The target path is also specified and adjustable.
Server:
The settings for the server are to be made in the corresponding server interface. This is also describedaccordingly in the TF3300 documentation.
All trace logs can be sent with the Support Information Report [ 149].
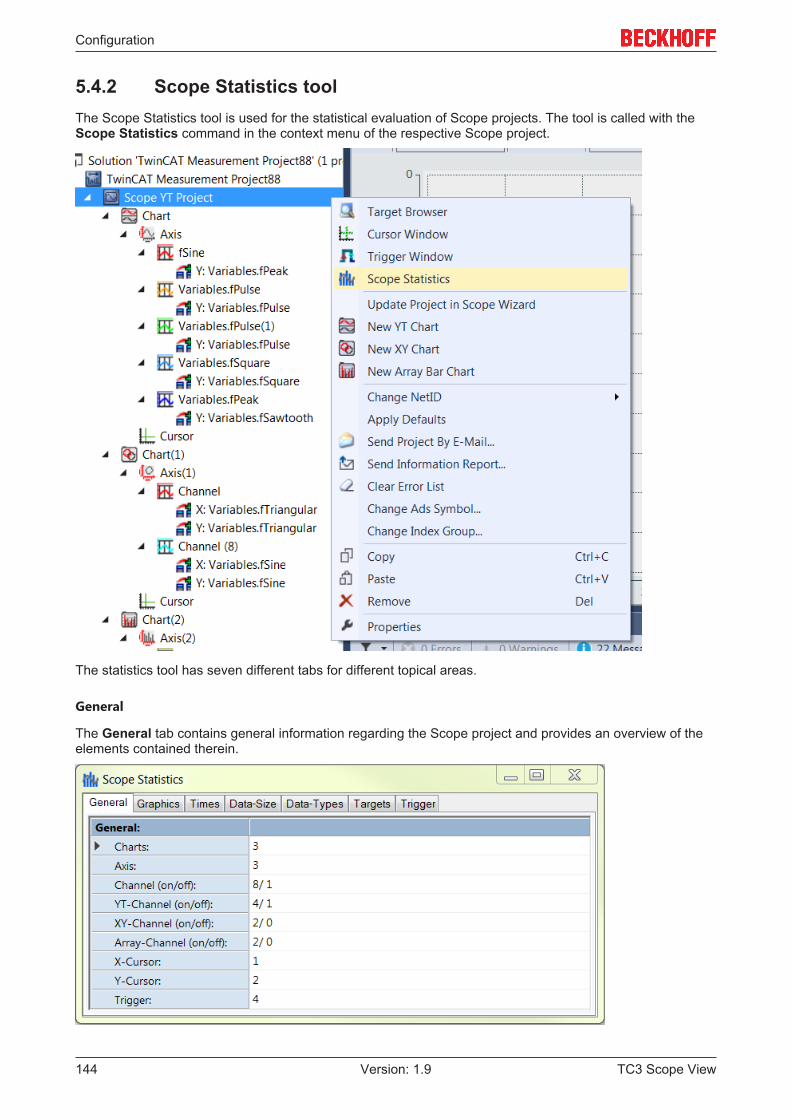
Configuration
TC3 Scope View144 Version: 1.9
5.4.2 Scope Statistics toolThe Scope Statistics tool is used for the statistical evaluation of Scope projects. The tool is called with theScope Statistics command in the context menu of the respective Scope project.
The statistics tool has seven different tabs for different topical areas.
General
The General tab contains general information regarding the Scope project and provides an overview of theelements contained therein.

Configuration
TC3 Scope View 145Version: 1.9
Charts Number of charts in the project.Axis Number of axes in the project.Channel (on/off) Number of channels in the project that are enabled (on) or disabled (off)
respectively.YT-Channel (on/off) Number of YT channels in the project that are enabled (on) or disabled (off)
respectively.XY-Channel (on/off) Number of XY channels in the project that are enabled (on) or disabled (off)
respectively.Array-Channel (on/off) Number of array channels in the project that are enabled (on) or disabled (off)
respectively.X-Cursor Number of X cursors in the project.Y-Cursor Number of Y cursors in the project.Trigger Number of triggers in the project.
Graphics
The Graphics tab contains information on the graphic properties of the respective project, as these affectthe drawing performance.
Graphic-Lib Graphic library currently in use.Core Separation Number of charts that use core separation.Overwrite-Mode Number of charts for which the overwrite mode is activated.Antialias Number of charts for which the "antialiasing" function is activated.Line-Width (min:max) Minimum and maximum set line width of the channels.Marks (on/ auto/ off) Number of channels for which the marks are activated (on), set to automatic
(auto) or deactivated (off) respectively.Channel (visible/invisible)
Number of visible or invisible channels respectively.
Times
The Times tab provides information on the time settings of the project.

Configuration
TC3 Scope View146 Version: 1.9
Record-Time Set recording time of the project.Free Sample-Times Number of channels for which the sample state "FreeSampleTime" is set. This
means that for these channels a free sampling rate has been set that is longer thanthe TaskSampleTime.
Oversamples Number of channels for which oversampling is activated.Sample-Time(min:max)
Minimum and maximum set sampling rate within the project.
Data-Size
The Data-Size tab contains information about the memory sizes.
Memory-Size File size of the complete recording.Config-Data-Size File size of the configuration file.Data-Stream Data stream during the recording.
Data-Types
The Data-Types tab contains information about the data types within the Scope project.

Configuration
TC3 Scope View 147Version: 1.9
The various data types of the channel acquisition are illustrated in a table and as a pie chart. Note here thatin the "ARRAY" line only the arrays of the array bar chart are listed. Other arrays, for example those used foroversampling purposes, are listed under the data types of their element.
To obtain a detailed overview, a table can be called via the Data-Types sorted by Sample-Times button inwhich the data types are listed in order of sampling rate.
The data types sorted according to target system are illustrated in a table via the Data-Types sorted byTarget-System button.
Targets
The Targets tab contains information on the target systems contained in the project.

Configuration
TC3 Scope View148 Version: 1.9
The following data are provided for each target system:
Targets AMS-NetId and target port of the target system.Device Information about whether the system is a local or a remote access system.Records (local Server) Total number of records and the number of records on the local Scope Server.Task Sample-Time Task sample time for the respective target system.
Trigger
The Trigger tab contains information on all triggers that exist in the project.
The following data are displayed for each trigger:
Trigger Associated channel whose state is to be tested for the selected trigger conditions.Group Trigger group to which the respective trigger belongs.Release Indicates whether the trigger condition is a rising or falling edge.Threshold Limit value of the trigger condition.Action Trigger action that is executed when it is triggered.Combine Selected linking options to the other trigger conditions.

Configuration
TC3 Scope View 149Version: 1.9
5.4.3 Support Information ReportThe Support Information Report is a tool for collecting product information for submission to Beckhofftechnical support. Collecting product-related data such as TwinCAT version/build, product version, imageversion and device type reduces email traffic significantly and enables more efficient advice.
Plug-in mechanism
Various Beckhoff products interface with the Support Information Report via a plug-in mechanism. Theseproducts, such as the TwinCAT Database Server, have a Support Information Report entry in thecorresponding product menu.
Creating and submitting a Support Information Reportü A Support Information Report is open.1. Use the Behaviour text field to describe the behavior that occurred in as much detail as possible.2. In the Attachment area, you can add files (screenshots etc.) to the report via the Add Attachment
button, if required. Files can optionally be selected via remote access. To do this, select a target from theRemote System dropdown list. Depending on the selected target, it may be possible to browse WindowsCE devices.
3. Enter your contact details and select a Beckhoff subsidiary for your country.This information is obligatory for submitting the Support Information Report.
4. You will be offered the option to store your contact details for future Support Information Reports. To dothis, tick the Store personal data check box.
5. The product-specific plug-ins can be found in the lower section of the Support Information Report. Tickthe Include in report check box. The information required for the product is added automatically, if it isavailable. The screenshot shows the current configuration of a TwinCAT Database Server in the form ofan XML file as an example.
6. Submitting the Support Information Report:• If the device has an email connection, you can submit the Support Information Report directly to the
Beckhoff subsidiary for your country via the Send Report button.• If the device does not have an email connection, you can save the Support Information Report locally
as a .zip file via the Save .zip button and then make it available via FTP, USB etc.
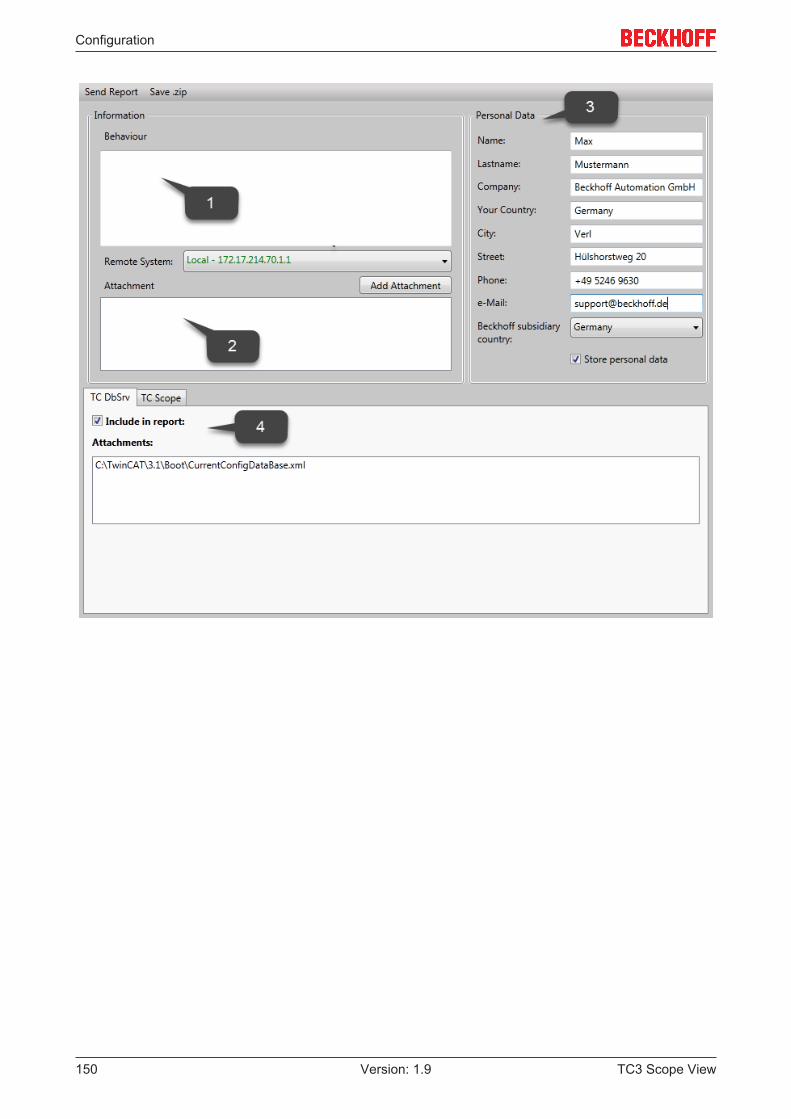
Configuration
TC3 Scope View150 Version: 1.9

.NET API
TC3 Scope View 151Version: 1.9
6 .NET APIIf you wish use the Scope View Control in your own .NET-based HMI, the TE1300 setup must be carried outon the target system. Via the component installation you can select whether the View or even just thebinaries are to be installed. Moreover, in this case the Engineering license for TE1300 has to be activated onthe target system.
6.1 API DocumentationThe attached class library offers an extensive source of information for developers who work with thetechnologies and services of TwinCAT Scope. Amongst other things, the library contains instructions andreference documents as well as example codes.
In order to find the desired contents, navigate through the table of contents, use the search function or switchto one of the sections of the library with the aid of a quick link.

.NET API
TC3 Scope View152 Version: 1.9
For example codes, switch in the left-hand area of the user interface to the Search tab and search for thekeyword “examples”.
In the search results you will find example codes for the trigger modules, cursor and many more.
See also:
Class library documentation
6.2 Integration in a WPF (Windows PresentationFoundation) project
In order to use the ScopeViewControl within WPF applications as well, you require a WindowsFormsHost asa the basis, since the ScopeViewControl is a Windows Forms UserControl.
1. Position a WindowsFormsHost control from the toolbar in the user interface of the WPF application youcreated.
2. Initialize the ScopeViewControl as described in the Windows Forms examples, and add the createdScopeViewControl to the WindowsFormsHost. When using the ScopeViewControl within the WPFapplication, only the “ScopeViewControl.Operating.SupportWpfRefresh” property needs to be set.
A sample implementation is shown below:namespace WpfApplication /// /// Interaction logic for MainWindow.xaml /// public partial class MainWindow : Window public MainWindow() InitializeComponent(); ScopeViewControl scopeViewControl = new ScopeViewControl(); scopeViewControl.Operating.SupportWpfRefresh = true; // Initialisierung des ScopeViewControl windowsFormsHost1.Child = scopeViewControl;
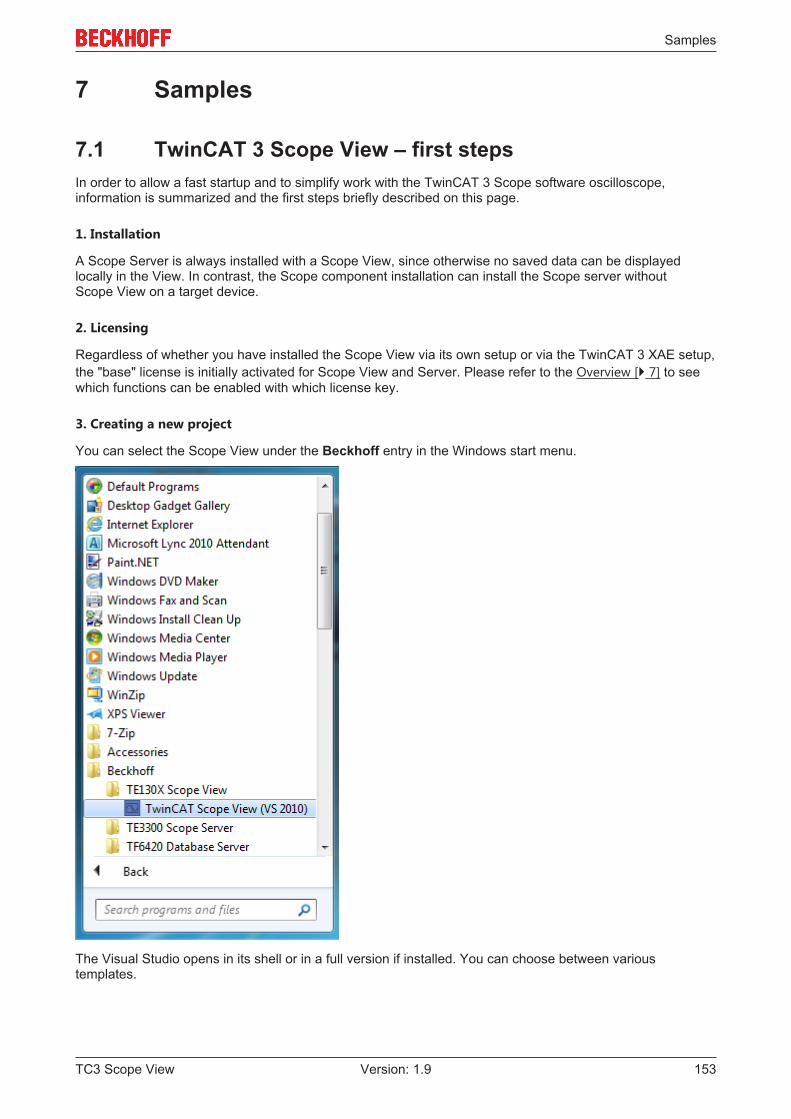
Samples
TC3 Scope View 153Version: 1.9
7 Samples
7.1 TwinCAT 3 Scope View – first stepsIn order to allow a fast startup and to simplify work with the TwinCAT 3 Scope software oscilloscope,information is summarized and the first steps briefly described on this page.
1. Installation
A Scope Server is always installed with a Scope View, since otherwise no saved data can be displayedlocally in the View. In contrast, the Scope component installation can install the Scope server withoutScope View on a target device.
2. Licensing
Regardless of whether you have installed the Scope View via its own setup or via the TwinCAT 3 XAE setup,the "base" license is initially activated for Scope View and Server. Please refer to the Overview [ 7] to seewhich functions can be enabled with which license key.
3. Creating a new project
You can select the Scope View under the Beckhoff entry in the Windows start menu.
The Visual Studio opens in its shell or in a full version if installed. You can choose between varioustemplates.
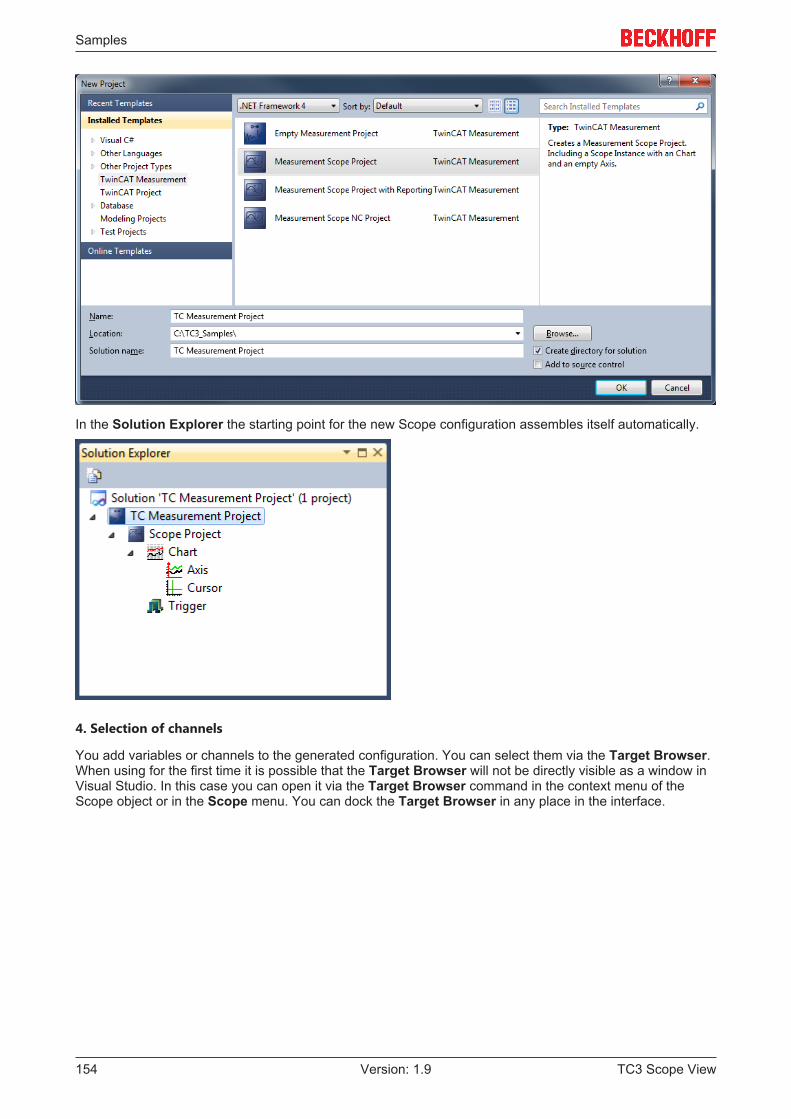
Samples
TC3 Scope View154 Version: 1.9
In the Solution Explorer the starting point for the new Scope configuration assembles itself automatically.
4. Selection of channels
You add variables or channels to the generated configuration. You can select them via the Target Browser.When using for the first time it is possible that the Target Browser will not be directly visible as a window inVisual Studio. In this case you can open it via the Target Browser command in the context menu of theScope object or in the Scope menu. You can dock the Target Browser in any place in the interface.

Samples
TC3 Scope View 155Version: 1.9
Select the respective target system in order to display the desired variables.
You can select the variables via multiple selection and add them to the configuration via the context menucommand Add Symbol or by drag & drop.
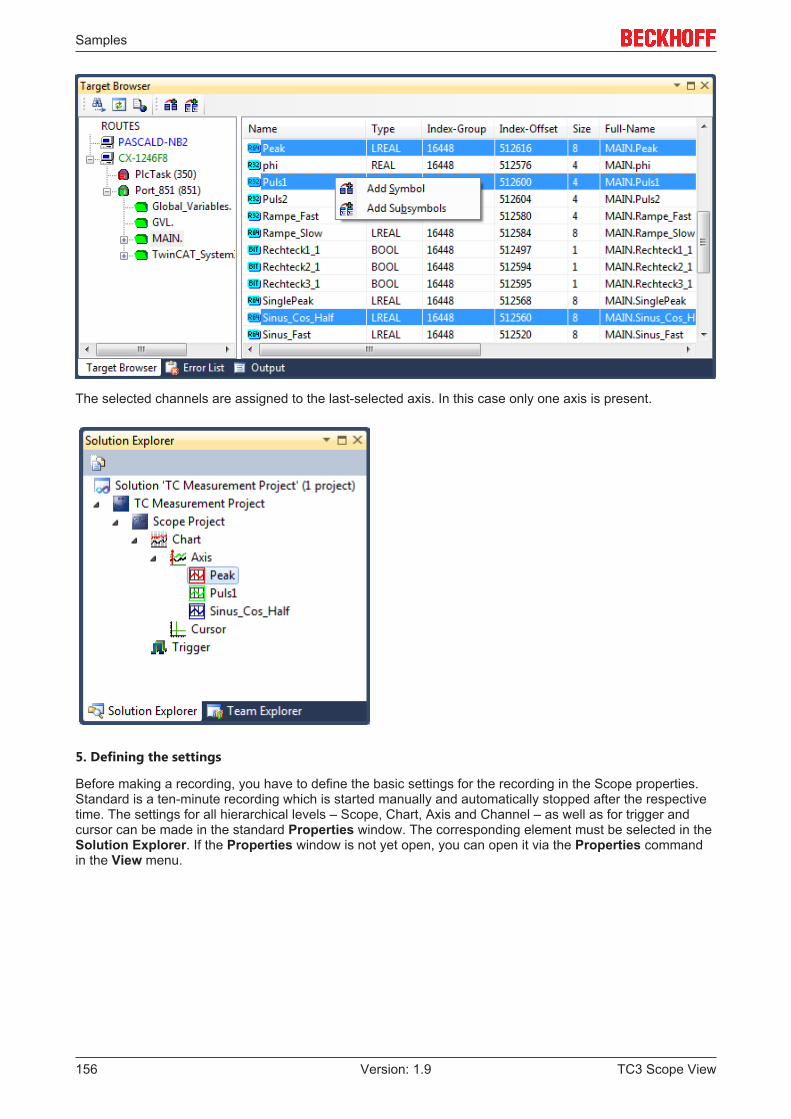
Samples
TC3 Scope View156 Version: 1.9
The selected channels are assigned to the last-selected axis. In this case only one axis is present.
5. Defining the settings
Before making a recording, you have to define the basic settings for the recording in the Scope properties.Standard is a ten-minute recording which is started manually and automatically stopped after the respectivetime. The settings for all hierarchical levels – Scope, Chart, Axis and Channel – as well as for trigger andcursor can be made in the standard Properties window. The corresponding element must be selected in theSolution Explorer. If the Properties window is not yet open, you can open it via the Properties commandin the View menu.
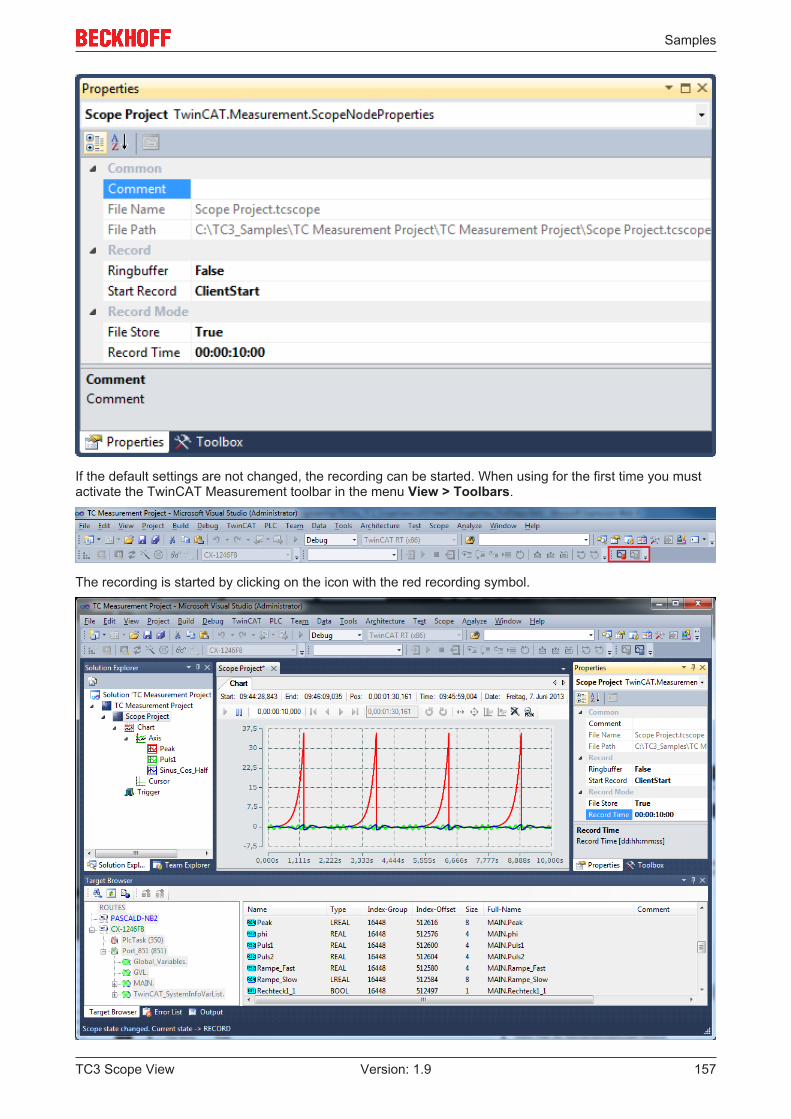
Samples
TC3 Scope View 157Version: 1.9
If the default settings are not changed, the recording can be started. When using for the first time you mustactivate the TwinCAT Measurement toolbar in the menu View > Toolbars.
The recording is started by clicking on the icon with the red recording symbol.

Samples
TC3 Scope View158 Version: 1.9
6. Changing the display
In order to improve the display of the channels in the View, charts and axes can be added even during therecording in TwinCAT 3 Scope View and channels can be shifted within the Scope.
X and Y cursors can also be added and deleted at runtime.
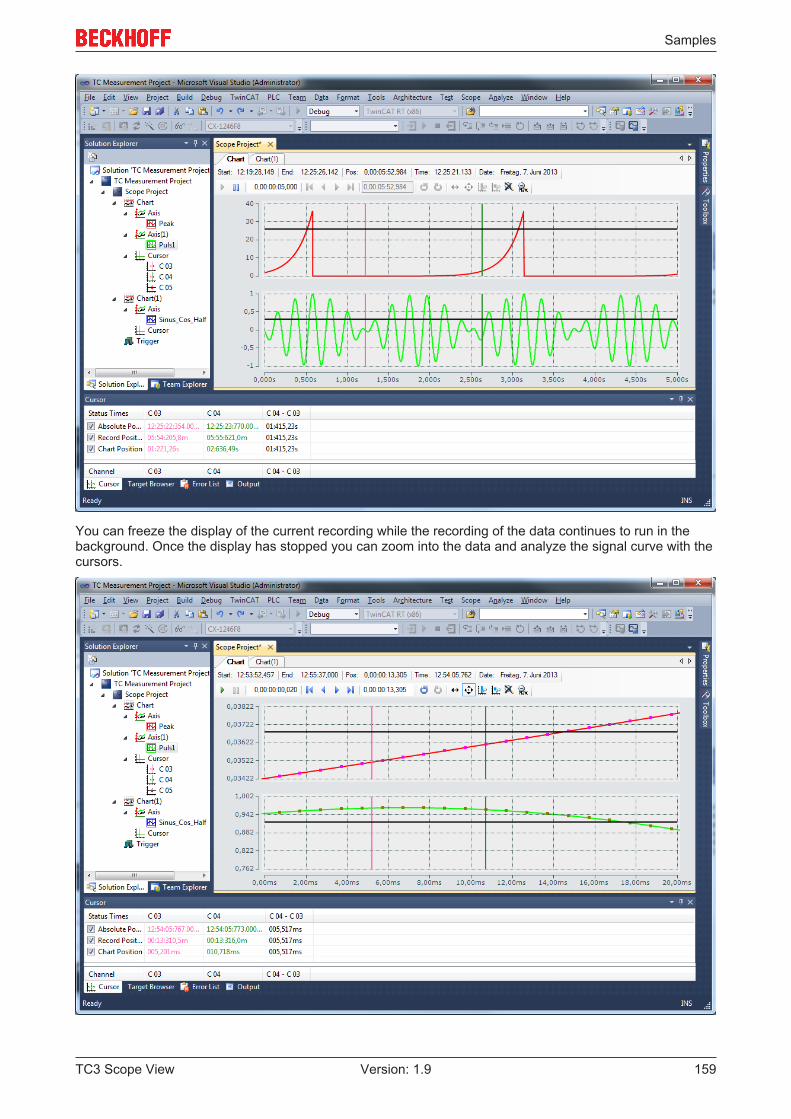
Samples
TC3 Scope View 159Version: 1.9
You can freeze the display of the current recording while the recording of the data continues to run in thebackground. Once the display has stopped you can zoom into the data and analyze the signal curve with thecursors.

Samples
TC3 Scope View160 Version: 1.9
7. Stopping the recording and saving the data
In this case the started recording is stopped automatically on expiry of the recording time of ten minutes.Alternatively, you can end the recording at any time via the Stop button in the TwinCAT Measurementtoolbar. The recorded data are only consistent if you save them as an .svd file via the Save Data commandin the Scope menu.

Appendix
TC3 Scope View 161Version: 1.9
8 Appendix
8.1 How To
8.1.1 Changing common settings at the same time
Multiple selection – changing group-wise
To change the settings of several elements at the same time, mark the elements in the Solution Explorerand edit the settings of all the marked elements in the Properties window. Data that differ between theselected elements are represented as empty fields.
To make multiple selections, keep the [Ctrl] key pressed while selecting the channels. In the case ofsuccessive elements, you can select the first element, keep the [Shift] key pressed and then select the lastelement in order to mark all elements in between.
To select all channels of a scope irrespective of the configuration structure, keep the [Alt] key pressed anddouble-click on the first channel in the Scope configuration.
All elements of the same type can be selected.
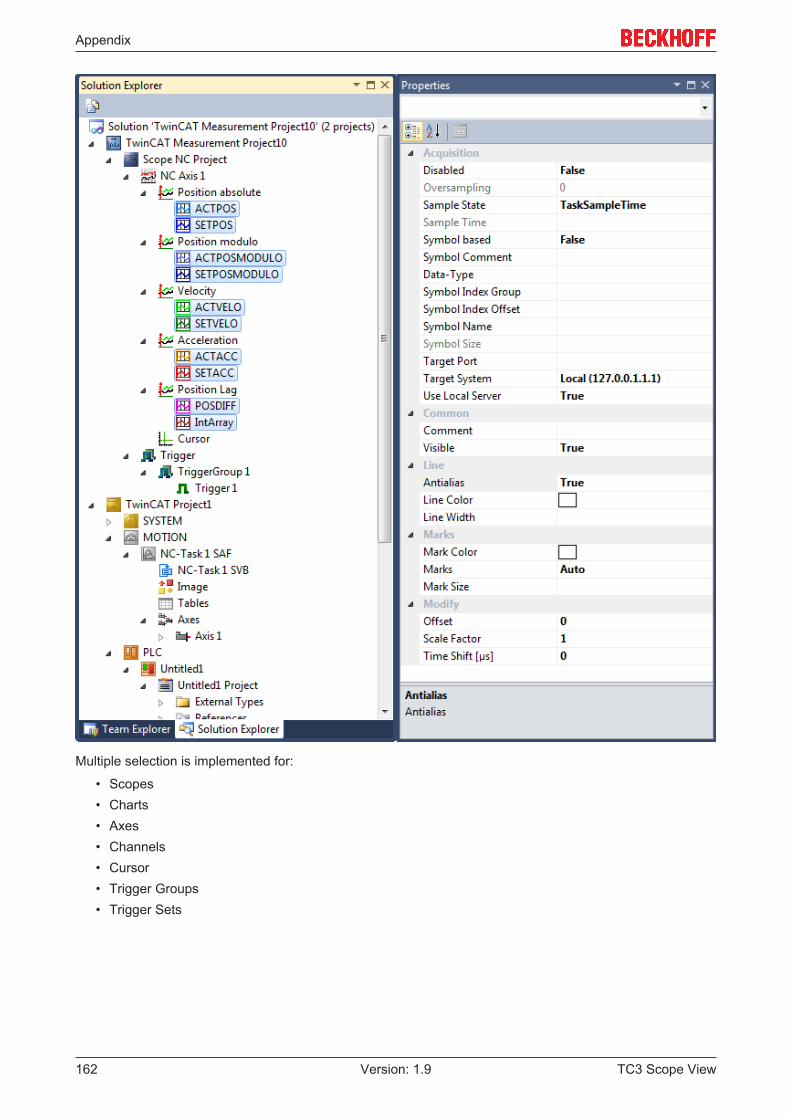
Appendix
TC3 Scope View162 Version: 1.9
Multiple selection is implemented for:
• Scopes• Charts• Axes• Channels• Cursor• Trigger Groups• Trigger Sets

Appendix
TC3 Scope View 163Version: 1.9
8.1.2 Oversampling recordings with the TwinCAT 3 ScopeWith the TwinCAT 3 Scope it is possible to represent oversampling values in a single variable. Since nvalues (n = oversampling factor) are recorded for each cycle when oversampling, theTwinCAT System Manager generates an ADS symbol containing a time stamp for each individual value. If aconnection is made between the ADS symbol and the Scope, the Scope will accept all other settings todisplay the n values in the correct sequence.
So that the ADS symbol is created and can be directly scoped by an EtherCAT terminal (e.g. EL3702 orEL3632), some settings need to be made in the TwinCAT System Manager configuration:
In the EtherCAT process image the ADS tab of the ADS servers must be enabled, and the option Createsymbols must be switched on. The assigned ADS port has to be specified later in the Scope in order to findthe ADS symbols.
The desired oversampling factor should be set in the TwinCAT System Manager for the respectiveoversampling terminal before the configuration is activated.

Appendix
TC3 Scope View164 Version: 1.9
If the configuration was loaded successfully and TwinCAT is in Run mode, the TwinCAT 3 Scope can becalled. The server settings must be defined in the Target Browser of the Scope. The ADS port numberassigned by the TwinCAT System Manager must be entered in the corresponding dialog and added with theAdd, provided the port has not already been entered.

Appendix
TC3 Scope View 165Version: 1.9
AdsPort of Image X (27905) appears in the Scope Target Browser. With this new entry, it is possible tobrowse the EtherCAT Terminals including the desired oversampling terminal. In the oversampling terminal,the variable shown in red with the supplement [T20] should be selected for the Scope recording. In this case20 stands for 20 times oversampling. This number may vary according to the oversampling factor.

Appendix
TC3 Scope View166 Version: 1.9
The INT16 variable can be recorded directly in TwinCAT Scope. In the following screenshot 20-foldoversampling with a cycle time of 1 ms.
8.1.3 Opening .svd files from a network directoryIf a .svd file from the network is to be merged into the solution, the following error message will probablyappear if appropriate preparations are not made.
An unknown Error occured. Error handling .svd file within scope server. Enable and check scope servertracing.
One of the following entries usually appears in the Server Tracing log:
• "ScopeServerTraceSource",Error,8442,"Access to the path '\\remote-PC\SVDs\test.svd' isdenied.",,368,,"16","2014-04-28T07:26:59.9720667Z",,
or
• "ScopeServerTraceSource",Error,8442," Could not find file '\\remote-PC\SVDs\test.svd'.",,3376,,"16","2014-04-28T07:26:59.9720667Z",,
Both errors indicate that the TwinCAT Scope server service has no rights of access to the network directory.
Proceed as follows to assign the required rights to the TwinCAT Scope server (example for Windows 7):1. Right-click on the directory to be enabled, in order to open the context menu. Select the command
Properties, and in the dialog that opens select the command Share in the Sharing tab.
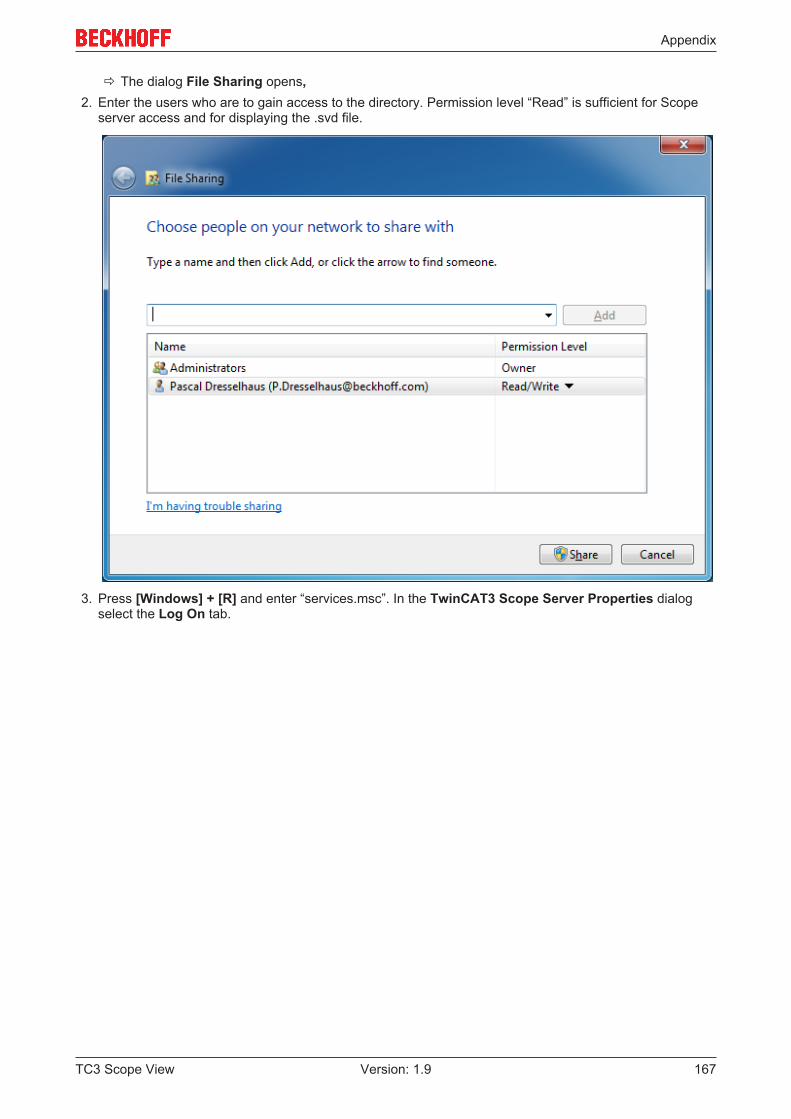
Appendix
TC3 Scope View 167Version: 1.9
ð The dialog File Sharing opens,2. Enter the users who are to gain access to the directory. Permission level “Read” is sufficient for Scope
server access and for displaying the .svd file.
3. Press [Windows] + [R] and enter “services.msc”. In the TwinCAT3 Scope Server Properties dialogselect the Log On tab.

Appendix
TC3 Scope View168 Version: 1.9
4. Enter the account with which you have rights of access to the network directory.
Pay attention to the correct use of your server domain.5. After confirming, restart the service in order to accept the new user data.ð Subsequently, .svd files from the configured network directory can be opened in the measurement
project on this system.
8.1.4 Using old configuration filesThe TwinCAT Scope is a very dynamic product. Nevertheless, old configuration files and data files can stillbe opened in the latest version. If an old configuration file (.sv2 from TwinCAT 2 Scope 2, .tcscopeand .tcscopex from TwinCAT 3) opens with a brand new version in which there have been internal changesdue to new functions, the Error List in Visual Studio displays the following message:
On saving the opened configuration, an updated configuration file will be saved in the project folder.Furthermore, the user will be asked whether he wishes to update the original file. If the new configuration filefrom the project folder or the updated original file is opened again, the warning does not appear in the ErrorList. If the original file is not to be updated and the warning no longer displayed, the warning for the Scopecan be completely deactivated in the Options [ 141] (not recommended!).
Appendix
TC3 Scope View 169Version: 1.9
8.2 Support and ServiceBeckhoff and their partners around the world offer comprehensive support and service, making available fastand competent assistance with all questions related to Beckhoff products and system solutions.
Beckhoff's branch offices and representatives
Please contact your Beckhoff branch office or representative for local support and service on Beckhoffproducts!
The addresses of Beckhoff's branch offices and representatives round the world can be found on her internetpages:http://www.beckhoff.com
You will also find further documentation for Beckhoff components there.
Beckhoff Headquarters
Beckhoff Automation GmbH & Co. KG
Huelshorstweg 2033415 VerlGermany
Phone: +49(0)5246/963-0Fax: +49(0)5246/963-198e-mail: [email protected]
Beckhoff Support
Support offers you comprehensive technical assistance, helping you not only with the application ofindividual Beckhoff products, but also with other, wide-ranging services:
• support• design, programming and commissioning of complex automation systems• and extensive training program for Beckhoff system components
Hotline: +49(0)5246/963-157Fax: +49(0)5246/963-9157e-mail: [email protected]
Beckhoff Service
The Beckhoff Service Center supports you in all matters of after-sales service:
• on-site service• repair service• spare parts service• hotline service
Hotline: +49(0)5246/963-460Fax: +49(0)5246/963-479e-mail: [email protected]

Appendix
TC3 Scope View170 Version: 1.9
8.3 FAQIn this section frequently asked questions are answered in order to make your work with TwinCAT 3 Scopeeasier. If you have further questions, please contact our support (-157)
1. Is it true that "TC3 Scope" in the TwinCAT 3 world is not a product, but a generic term for variousproducts? [ 170]
2. Why are there different product levels for the TC3 Scope? [ 170]3. Can the Scope View Professional be operated with the Scope Server Base? What are the restrictions?
[ 170]4. What do you need a TF3300 Scope Server for, when you can also switch on the “Use local server” op-
tion? [ 170]5. Can the TwinCAT Scope View be integrated into its own visualization? [ 170]6. Is it possible to print out recorded Scope Charts? [ 170]7. Is multimedia documentation available for TwinCAT 3 Scope? [ 170]8. My Scope .svd files are on a network drive. Why can't I open them? [ 170]
Is it true that "TC3 Scope" in the TwinCAT 3 world is not a product, but a generic term for variousproducts?
Yes, “TC3 Scope” is a generic term. The TC3 Scope is subdivided into the Scope View and Scope Serverproducts. This means that a TC3 Scope always consists of the View and Server products. Beyond that thereare also different product levels.
Why are there different product levels for the TC3 Scope?
The Scope is a constantly growing tool for data logging and analysis; however, not every Scope userrequires the full range of functions for his purposes. Therefore, we offer product levels tailored as far aspossible to the application. The currently available product levels are Base and Professional. Base is free oflicense costs and is an outstanding tool for machine commissioning. Professional is very well suited forprocess monitoring in addition to machine commissioning.
Can the Scope View Professional be operated with the Scope Server Base? What are therestrictions?
Yes, Professional View can also be operated with the Base Server. Only the limitations of the Base Serverversion need to be observed. It is also possible, for example, to scope a remote device with the local BaseServer. To do this the Use local server option must be set in the channel settings.
What do you need a TF3300 Scope Server for, when you can also switch on the “Use local server”option?
The TwinCAT TF3300 Scope Server function is required as soon as a Scope Server has to runautonomously on a remote device. The server can thus be controlled, for example from the PLC, without aView being connected.
Can the TwinCAT Scope View be integrated into its own visualization?
Yes, you can integrate Scope Control into your own .NET-based visualization application. The license modelremains identical.
Is it possible to print out recorded Scope Charts?
The currently displayed chart can be printed out by inserting a report in a Scope project. Beyond that, fringedata shown by the cursor, such as channel name, axis name or values, are displayed and added to theprintout.
Is multimedia documentation available for TwinCAT 3 Scope?
Yes, there is a recording of a TwinCAT 3 Scope Webinar on the Beckhoff-Homepage.
My Scope .svd files are on a network drive. Why can't I open them?

Appendix
TC3 Scope View 171Version: 1.9
That is probably because the TwinCAT 3 Scope server service has no rights of access to the networkdirectory. In order to be able to open .svd files, you either need to copy them to the local system or grant theScope server service the appropriate rights. (See section Opening .svd files from a network directory [ 166])
8.4 TwinCAT Scope GlossaryTerm DescriptionScope The Scope forms the highest hierarchical element in a Scope configuration
and manages all recording settings.Scope Server The Scope Server is the logger program of the TwinCAT Scope. A Scope
connects itself to a server in order to record new data or to read an existingfile (.svd).
Scope View The Scope View is the front end of the TwinCAT Scope. From hereconfigurations are created or loaded, the display adjusted and recordingscontrolled.
YT Chart The chart provides a graphic area with time axis. All connected channelsare scaled to the same time segment.
Overview Chart An Overview chart can be displayed within a YT chart. It provides anoverview of the whole recording period with absolute times.
XY Chart The chart provides a drawing area for a channel that is calculated from twovariables. One variable is shown on the X-axis, the other one on the Y-axis.
Array Bar Chart The chart provides the drawing interface for an array data type, theelements of which are assigned to a bar line or a bar.
Axis A (Y-) axis represents the value scaling for connected channels.Channel The channel forms the connection of system variable and graph. Therefore,
there is one setting window for the acquisition and another one for thegeneral settings (colors, marks etc.).
Data Picker This is a mouse pointer tool that is automatically activated in the chartwhen the cursor runs over a data point. Clicking brings up a tool tipshowing the values of the X- and Y-axes, the channel name and theabsolute time for the selected data point.
Target Browser All connected systems and their devices can be simply scanned for systemvariables with the target browser.
Solution Explorer The Solution Explorer is a kind of project manager, among other things forthe measurement projects, which are necessary for a Scope recording.
Measurement Project The measurement project can contain several Scope projects in which theactual recording configurations are created.
Cursor The cursor module serves to display graph and axis values and theirdifferences.
Marks Marks are the actual data points of recorded variables. They can beadjusted via the channel properties.
Trigger Various actions can be triggered with freely configurable trigger groups.Quick View Chart The Quick View chart is available in the Target Browser. It can be used to
provide a quick overview of the current value status before theconfiguration is complete.
Glossary
TC3 Scope View172 Version: 1.9
GlossaryArray Bar Chart
The chart provides the drawing interface for anarray data type, the elements of which are as-signed to a bar line or a bar.
AxisA (Y-) axis represents the value scaling forconnected channels.
ChannelThe channel forms the connection of systemvariable and graph. Therefore, there is one set-ting window for the acquisition and another onefor the general settings (colors, marks etc.).
CursorThe cursor module serves to display graph andaxis values and their differences.
Data PickerMouse pointer tool that is automatically acti-vated in the chart when the cursor moves overa data point. Clicking brings up a tool tip show-ing the values of the X- and Y-axes, the chan-nel name and the absolute time for the se-lected data point.
MarksMarks are the actual data points of recordedvariables. They can be adjusted via the chan-nel properties.
Measurement projectThe Measurement project may contain severalScope projects, in which the actual recordingconfigurations are created.
Overview ChartAn Overview chart can be displayed within aYT chart. It provides an overview of the wholerecording period with absolute times.
Quick View ChartThe Quick View chart is available in the TargetBrowser. It quickly and clearly indicateswhether values are currently supplied.
ScopeThe Scope forms the highest hierarchical ele-ment in a Scope configuration and manages allrecording settings.
Scope ServerThe Scope Server is the logger program of theTwinCAT Scope. A Scope connects itself to aserver in order to record new data or to read anexisting file (.svd).
Scope ViewThe Scope View is the front end of the Twin-CAT Scope. From here configurations are cre-ated or loaded, the display adjusted andrecordings controlled.
Solution ExplorerThe Solution Explorer is a kind of project man-ager, which can also be used for the measure-ment projects that are required for a Scoperecording.
Target BrowserAll connected systems and their devices canbe simply scanned for system variables withthe target browser.
TriggerVarious actions can be triggered with freelyconfigurable trigger groups.
XY ChartThe chart provides a drawing area for a chan-nel that is calculated from two variables. Onevariable is shown on the X-axis, the other oneon the Y-axis.
YT ChartThe chart provides a graphic area with timeaxis. All connected channels are scaled to thesame time segment.