Investigating learners' participation in an astronomy quiz ...
Upload
khangminh22Category
view
0download
0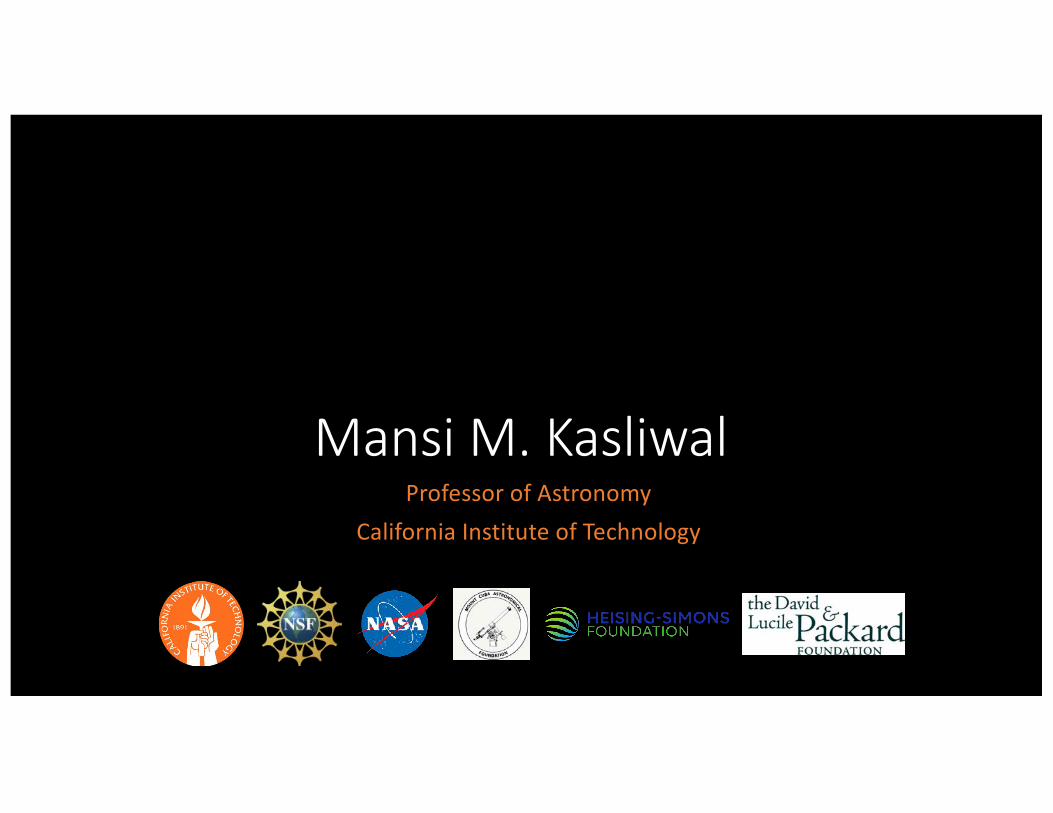
Mansi M. KasliwalProfessor of Astronomy
California Institute of Technology

Kasliwal Research Group
Jacob Jencson(Graduated 2020!)
Viraj Karambelkar(Grad, 2nd year)
Matt Hankins(Now faculty)
Christoffer Fremling(Postdoc)
Kishalay De(Grad, 5th Year)
Igor Andreoni(Postdoc)
Samaporn Tinyanont(Graduated 2020!)
Shreya Anand(Grad, 3rd year)
Undergrads: Andy Tzanidakis, Gokul Srinivasaragavan, Stephanie Kwan, Lindsey Whitesides, Chris Cannella + SURF students
Ragnhild Lunnan(Now faculty)
Nadia Blagorodnova(Veni Fellow)
Dave Cook(Staff Scientist)
Ryan Lau(ITYF Fellow)
Kaustav Das(Grad, 1styear)
Mansi M. Kasliwal / Ay 111

Landscape for multi-messenger astrophysics
LIGO-Virgo Gravitational Wave Interferometers GW170817 & GW190521
IceCube High Energy Neutrino DetectorIceCube-170922A, IceCube-191001A
Mansi M. Kasliwal / Ay 111

Landscape for time-domain astronomy
DSA-2000 3
A B
C
Figure 2. A: Four of the antennas of the DSA-10 located at Cal-tech’s Owens Valley Radio Observatory (OVRO). B: The custom-designed feed attached to an antenna of the DSA-10. C: The front-end electronics enclosure attached to one of the DSA-10 antennas.
such as the VLBA, or with a partner array of DSA antennasinstalled at US university sites. Pre-selected targets wouldthereby form the basis for an all-sky VLBI survey that occurssimultaneously to the primary imaging survey. This same ca-pability can also be used to provide VLBI observations ofgravitational-wave events, and millisecond pulsars for dis-tance measurements.
2. DSA-2000 ARCHITECTURE
The DSA-2000 will be the third iteration of the DSA con-cept, consisting of low-cost antenna/receiver packages linkedby an RF over fiber network to a powerful digital back-end. The concept builds on progress with the DSA-10 (op-erational) and DSA-110 (under construction). The DSA-10makes use of ten commercial o↵-the-shelf 4.5-m dishes andmounts, the latter with manually adjusted azimuth and ele-vation range (Figure 2). These antennas are outfitted withcustom-designed feeds and commercial ambient-temperatureLNAs with noise temperatures of 32 � 38 K, resulting in anoverall system temperature of ⇠ 60 K and aperture e�ciencyof 62%. The DSA-10 antenna and receiver package was builtfor a unit cost of < $4000, including hardware and labor, witha comparable per-antenna digital backend cost.
Fully funded through the NSF MSIP program, the DSA-110 represents a significant evolution from the DSA-10.Consisting of 110 ⇥ 5-m dishes distributed across 2.5 km,each antenna will be serviced by a motorized elevationdrive and a custom-designed LNA, which has been lab-demonstrated to have a noise temperature of 12 K. The finalexpected system temperature is 30 K, with aperture e�ciencyof 70%. The DSA-110 dish package, including receiver,mount and motorized elevation drive are being constructed ata unit cost of < $7500, including hardware and labor. Again,a comparable digital-backend cost per antenna is anticipated.
A few key technological advances over the DSA-110 areproposed for the DSA-2000. The DSA-2000 will progress
Figure 3. A comparison between the DSA-2000 and other extant(normal text) or upcoming (bold font) radio telescopes operating at1.4 GHz. The data were largely obtained from the SKA BaselineDesign Document Version 2.
to a thermoelectrically cooled LNA, motivated by a lab-demonstrated noise temperature of 6 K at �40�C for acustom-designed LNA (Weinreb et al., in prep.). A newwideband feed will be integrated into an improved opticaldesign for the antennas. The baseline specification assumesa system temperature of 25 K, with aperture e�ciency of70%. The mount and drive will progress to a fully motorizedazimuth and elevation drive with limited tracking capability.The expected unit cost for the DSA-2000 antenna/receiverpackage is conservatively estimated to be < $20, 000, in-cluding hardware and labor. The digital backend will en-able three simultaneous modes of operation: a 4000-inputcross correlator, a full-array beamformer, and a partial-arraymultiple-beam system tiling the primary beam.
Construction costs for the DSA-2000 are estimated tobe less than $100 million: (i) dish and receiver package($40 million), (ii) infrastructure, fiber/power network, mon-itor/control ($25 million), (iii) digital backend, includingimaging ($30 million), (iv) continuum data catalog andarchive ($5 million). Detailed costing will be presented inthe Decadal Survey white paper, together with discussion ofpotential sites in California, Nevada, and New Mexico.
The DSA-2000 will provide the US community with aradio camera with unparalleled capabilities for surveys andmulti-messenger science (Figure 3). We look forward to in-put from the community on the baseline design of the DSA-2000 for specific science cases of interest.
References – Abbott, B. P., et al. 2018, LRR, 21, 3 – Con-don, J., et al. 2012, ApJ, 758, 23 – Hallinan, G., et al. 2017,Science, 358, 1579.
LWA; From DSA-110 to DSA-2000(PI Hallinan)
From ROSAT to Spektr-RG(Russian-German Satellite)
From PTF to ZTF(PI Kulkarni)
Mansi M. Kasliwal / Ay 111

Why Infrared?1. Dust extinction
• Classical Novae• White Dwarf Mergers
2. Self-enshrouding• Stellar Mergers• Obscured Supernovae
3. Opacity• Binary Neutron Star Merger• Neutron Star Black Hole Merger
How?To reduce detector cost:ü Software Algorithmsü InGaAs Detectorsü MBE on Si Detectors
To mitigate sky background:ü Spaceü Antarctica
Mansi M. Kasliwal / Ay 111

1. Infrared Overcomes Extinction by Dust
Visible Light Infrared Light
Spitz
er/N
ASA-
JPL/
T. Bo
urke
Mansi M. Kasliwal / Ay 111
Palomar Gattini-IR (PGIR) field of view is 40 times larger than any other current near-infrared instrument
3
Palomar Gattini IR FOV
VISTA
Mansi M. Kasliwal / Ay 111
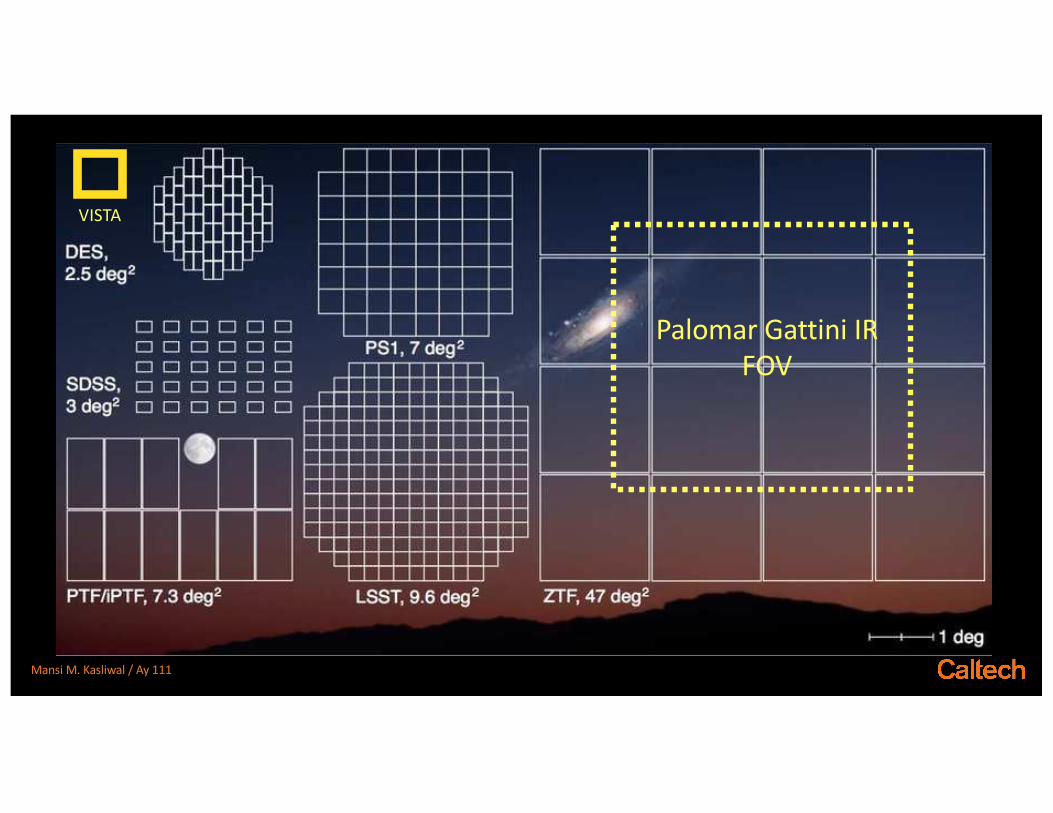
Palomar Gattini IR:The first wide-field infrared surveyor
4
Palomar Gattini IR maps 15,000 sq. deg. every 2 nights to J=15.7 AB mag
Scott Adams Matt Hankins
Mansi M. Kasliwal / Ay 111
In Partnership with Anna Moore (ANU)

Galactic Fast Radio Burst
Palomar Gattini-IR limits on NIR flares from SGR1935+2154 3
ID UT Start UT End Mode Exp. time N Total exposure Duty cycle 3� limit
(s) (s) (%) (mJy/Jy ms)
1 2020-05-01 08:24:38.9 2020-05-01 12:34:53.6 I 1.65 2722 4491.3 29.9 9/16
2* 2020-05-02 07:49:45.5 2020-05-02 12:34:14.1 II 0.84 18009 15127.6 89.7 25/21
3* 2020-05-05 08:20:13.7 2020-05-05 12:31:09.0 II 0.84 15917 13370.3 89.7 23/19
4 2020-05-23 11:23:09.0 2020-05-23 11:38:27.3 III 0.84 1084 910.6 99.9 16/13
5 2020-05-24 06:57:05.3 2020-05-24 07:29:43.4 III 0.84 2310 1940.4 99.9 19/16
6† 2020-05-24 11:09:27.4 2020-05-24 11:34:12.3 III 0.84 1706 1433.0 97.3 21/18
7 2020-05-28 06:13:49.2 2020-05-28 07:13:34.7 III 0.84 4229 3552.4 99.9 18/15
8† 2020-05-31 09:01:30.0 2020-05-31 09:39:32.9 III 0.84 1751 1470.8 64.6 62/52
Table 1. Summary of observing sessions of SGR1935+2154 with PGIR. The Mode column refers the observing configurationof the system during the respective epoch. Mode I indicates the use of the standard observing mode of the survey includingdithers between exposures and lower observing e�ciency. Mode II indicates the fast readout mode discussed in the text. BothMode I and II had the telescope aligned to the default observing grid and the source placed away from the best focused part ofthe field (see discussion of PSF variation in De et al. 2020a). Mode III indicates the fast readout mode with the source placed inthe best focused part of the detector leading to better sensitivity. N denotes the number of images that produced good qualitysubtractions in the session. The duty cycle is a conservative lower limit for the first pixel read out in each detector channel.The limiting flux denotes the median limiting flux in the individual exposures at the location of the source as measured fromthe observed scatter of fluxes in the di↵erence image. Data acquired during epochs marked by * were a↵ected by a bug in thereadout that repeated every 10th exposure in the sequence (i.e. every 9th and 10th exposure were identical), leading to reducedduty cycle. Epochs marked by † were a↵ected by intermittent clouds leading to reduced observing duty cycle. Di↵erence fluxmeasurements and their uncertainties will be released as an electronic supplement upon publication.
exposure time equivalent to the frame readout time of⇡ 0.84 s (see Appendix A for details).Table 1 provides a summary of all the observing
epochs on the source, including the readout mode usedand the placement of the source in the large field of view.While the initial observations were designed to monitorthe source for the total duration of its night time vis-ibility from Palomar (⇡ 4.5 hours below airmass of 2)near the peak of its outburst, subsequent epochs in thesecond half of May 2020 were coordinated with the pub-lished visibility windows of the source with the Insight-HXMT satellite1 and the CHIME telescope (K. Smith,pers. comm.).
3. DATA ANALYSIS
The location of the source in a dense region of theGalactic plane together with the large pixel scale andunder-sampled PSFs of the Gattini observing systempresent several challenges to the data reduction proce-dure, which were modified and adapted from the nomi-nal survey mode. Appendix B provides a detailed sum-mary of the reduction process adopted for this dataset. Figure 1 shows an example triplet of a fast read-out science frame centered at the location of the source,the corresponding reference image and the resulting dif-ference image. We were able to obtain high qualitydi↵erence images in all the epochs, which show only
1Published at http://enghxmt.ihep.ac.cn/dqjh.jhtml
3.6’
Science
3.6’
Reference
3.6’
Di�erence
3.6’
Science
3.6’
Reference
3.6’
Di�erence
Figure 1. Example cutouts of a science (left column), ref-erence (middle column) and di↵erence image (right column)acquired in our observing sequence. North is up and Eastis left in each panel. The top and bottom row show exam-ples of the subtractions with the source placed in di↵erentparts of the focal plane with di↵ering PSFs – the top rowshows the case where the source was placed in the best partof the detector with approximately symmetric PSFs, whilethe lower row shows the same in a poorer region of the focalplane with elongated PSFs. In both cases, the di↵erence im-age produced using ZOGY (Zackay et al. 2016) only showsresidual astrometric and Poisson noise from nearby brightstars, with no statistically significant transient emission de-tected at the location of SGR1935+2154 (yellow circle).
De et al. 2020
Kishalay De
Mansi M. Kasliwal / Ay 111
109 1011 1013 1015 1017 1019
Frequency (Hz)
10°11
10°10
10°9
10°8
10°7
10°6
Flue
nce
F(e
rgcm
°2 )
AB
C
D
F / ∫0.46
F / ∫>0.35
HXMT
PGIRPGIR AJ = 2
BOOTES FRB
X-ray FRB
CHIME FRB
STARE2 FRB

PGIR19brv
PGIR20du
o
PGIR has more than doubled the discovery rate of novae!
PGIR19brv
Discoveries by Palomar Gattini IRKishalay De
(Grad, 5th Year)
Mansi M. Kasliwal / Ay 111

Where are the classical novae?
De et al. 2021a
9
"I’ve often wondered about the CNe(like Fermi, on intelligent life):
Where are they? I guess your answer is: extincted!"
(Bob Williams)
Mansi M. Kasliwal / Ay 111

Null hypothesis probability < 0.01%. Most obscured novae are likely missed in optical searches
10
Rate of Classical Novae: 46 per year
De+ 2021, arXiv: 2101.04045
Kishalay De
Mansi M. Kasliwal / Ay 111

16
P. Tisserand
Karambelkar+ 2021arXiv: 2012.11629
Palomar Gattini IR light curves suggest 149 new R Cor Bor candidates
White Dwarf Merger Products
Viraj Karambelkar(Grad, 2nd year)
Karambelkar et al. 2021
Mansi M. Kasliwal / Ay 111

Spectroscopy of R Cor Bor stars
Mansi M. Kasliwal / Ay 111
Karambelkar et al. 2021
Viraj Karambelkar

1016 cm50 micro arcsecond
North
a b70°
b/a ~ 0.48
SN ejecta(180 d)
Poss
ible
Circ
umst
ella
r Ri
ng
Rring~ 6⨉1017cm
SN 2018hna
WIRC+Pol near-infrared spectropolarimeterat Palomar 200-in (PI Mawet)Tinyanont et al. 2021, Nature Astronomy
Samaporn Tinyanont
Infrared Polarization of Supernovae
Mansi M. Kasliwal / Ay 111

Additional Results from Palomar Gattini IR• Young star FU Ori outburst (Hillenbrand et al. 2021)• 300d period of a Wolf Rayet binary (Lau et al. 2021)
In prep:• Nearby core-collapse supernovae (undergrad Srinivasaragavan, collaborator Sollerman)• Microlensing sample (postdoc P. Mroz)• Galactic X-ray binary (grad Y. Yao)• RR Lyrae light curves (collaborator Freeman)• AGN (multi-wavelength monitoring for collaborators Kara & Gorjian)• Long period Mira variables (SURF project)• Supergiant Fast X-ray Transients (SURF project)• X-ray binaries (De postdoc project, collaborator Soria)• Radio follow-up to probe shocks in novae (collaborator Sokoloski)
Mansi M. Kasliwal / Ay 111

Why Infrared?1. Dust extinction
• Classical Novae• White Dwarf Mergers
2. Self-enshrouding• Stellar Mergers• Obscured Supernovae
3. Opacity• Binary Neutron Star Merger• Neutron Star Black Hole Merger
How?To reduce detector cost:ü Software Algorithmsü InGaAs Detectorsü MBE on Si Detectors
To mitigate sky background:ü Spaceü Antarctica
Mansi M. Kasliwal / Ay 111

2. Infrared Overcomes Self-obscuration
Cred
it: H
. Bon
dHu
bble
Spa
ce Te
lesc
ope
Mansi M. Kasliwal / Ay 111

PI: M Kasliwal, Project Scientist: J JencsonTeam: S Adams, R Lau, S Tinyanont, M Hankins, D Perley, F Masci, G Helou, L Armus, S Van Dyk, A Cody, M Boyer, H Bond, J Bally, O Fox, R Williams, P Whitelock, R Gehrz, N Smith, J Johansson, E Hsiao, M Phillips, N Morell, C Contreras, M Ressler+
SPitzer InfraRed Intensive Transients Survey
• 1690 hours over 6 years with Spitzer/IRAC• 194 galaxies, <35 Mpc• Depth: 20 mag at [3.6] &
19 mag at [4.5]• Cadence baselines
spanning one week to several years
Mansi M. Kasliwal / Ay 111

Phase Space of Infrared Transients in 2014
Mansi M. Kasliwal / Ay 111

Kilonovae
SPIRITS discovered a treasure trove of infrared transients.• Identified 80+ transients:• 50+ known supernovae• 23 eSPecially Red Intermediateluminosity Transient Events (SPRITEs; Kasliwal+ 2017)
• We are missing half 38.5+26-22%
the supernovae in our backyard!(Jencson PhDT 2019)
• 4 Targets will be observed by the James Webb Space Telescope in Cycle 1!
Mansi M. Kasliwal / Ay 111
Jacob Jencson
Jencson PhDT (2019)

Why Infrared?1. Dust extinction
• Classical Novae• White Dwarf Mergers
2. Self-enshrouding• Stellar Mergers• Obscured Supernovae
3. Opacity• Binary Neutron Star Merger• Neutron Star Black Hole Merger
How?To reduce detector cost:ü Software Algorithmsü InGaAs Detectorsü MBE on Si Detectors
To mitigate sky background:ü Spaceü Antarctica
Mansi M. Kasliwal / Ay 111
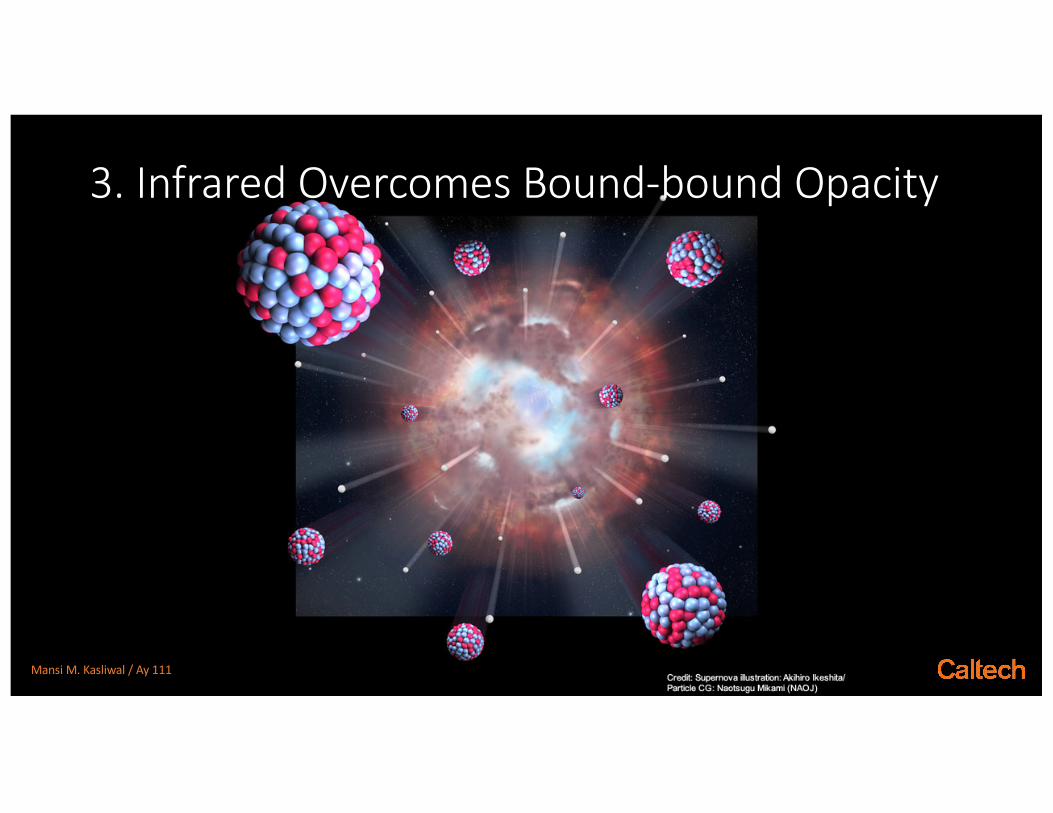
3. Infrared Overcomes Bound-bound Opacity
Mansi M. Kasliwal / Ay 111

The Majestic GW170817
Kasli
wal
et a
l. 20
17c
When two neutron stars merge…
… a black hole is born, a cocoon breaks out,heavy elements are made.
Mansi M. Kasliwal / Ay 111

Mansi M. Kasliwal / Ay 111

A trio of papers in Science: Evans et al. 2017, Kasliwal et al. 2017, Hallinan et al. 2017
Mansi M. Kasliwal / Ay 111

Mansi M. Kasliwal / Ay 111

UVOIR Light Curve
0 2 4 6 8 10 12 14 16 18 20Time since GW170817 (days)
14
16
18
20
22
24
26
28
30
32
Appa
rent
mag
nitu
de (A
B)
UVW2+7F275W+6F336W,U,u+5B,g'+4V+3r',r+2
i,i',I+1z,z'−0J−1H−2Ks,K−3
−18
−16
−14
−12
−10
−8
−6
−4
−2
Abso
lute
mag
nitu
de (A
B)
Evans et al. 2017, Kasliwal et al. 2017c
Surprise # 1: Too Bright and Blue at Early Time
See also:Andreoni et al. 2017Arcavi et al. 2017Cowperthwaite et a. 2017Coulter et al. 2017Drout et al. 2017Lipunov et al. 2017Lyman et al. 2017Pian et al. 2017Soares-Santos et al. 2017Smartt et al. 2017Tanvir et al. 2017Utsumi et al. 2017Villar et al. 2017
Mansi M. Kasliwal / Ay 111

Spectra are the chemical thumbprint
Kasliwal et al. 2017c
Pian et al. 2017
Infrared Confirms that Heavy Elements were Synthesized.Mansi M. Kasliwal / Ay 111

A Site or The Site:Was the production rate of heavy elements enough to explain the observed solar abundance?
after merger. The heavier elements in the second, lanthanide and third peaks only dominateat later time when the ejecta is optically thin and the kilonova is both much too faint andmuch too red for ground-based follow-up (Figure 2).
Figure 2: Left: Abundance distribution of elements synthesized by the r-process in the solar
neighborhood. Note the abundance peaks. Right: Fraction of electron heating contributed by
various sets of elements as a function of time using the solar abundance pattern. While elements
in the first peak dominate at early-time, observing the late-time mid-IR emission is critical to
measuring elements in the second peak, lanthanide peak and third peak. [11, 3]
Therefore, even combining all available ground-based data could not convincingly showthat the kilonova emission requires elements from all three r-process abundance peaks (seegoodness-of-fit for both models; Figure 3) [12].
A&A 615, A132 (2018)A&A proofs: manuscript no. aanda
Fig. 4. Comparison of a low-Ye (= 0.1) matter case, representative for a "tidal" dynamical ejecta, with NIR JHK-band observations(https://kilonova.space/kne/GW170817/). The detailed ejecta model parameters are shown at the top of each panel. The left panel uses heat-ing according to the FRDM nuclear mass model, for the right panel a DZ-type heating rate has been employed (see Sec. 3 in the main text for adiscussion).
Fig. 5. Comparison for a model without lanthanides and third r-processpeak ejecta. The detailed ejecta model parameters are shown at the topof the panel. For this calculation the heating rate of the FRDM nuclearmass model was used (see Sec. 3, main text for a discussion). The prop-erties of this model are characteristic for matter unbound from an accre-tion torus.
(3)
Clearly, which rate is needed depends on which r-processelements are produced. In Fig. 6, we show as solid black linethe required event rate (scaled to an ejecta mass of 0.03 M�)under the assumption that NSMs produce all r-process (in solarproportions) above a limiting nucleon number >A. So if allr-process is produced in NSMs, an event rate of about 560 (0.03M�/m̄ej) yr�1 Gpc�3 is needed. If instead, NSMs should onlyproduce r-process beyond the second peak (A > 130), a rate ofonly 70 (0.03 M�/m̄ej) yr�1 Gpc�3 would su�ce. The early blueemission observed in AT2017gfo, however, is most naturallyexplained with lower-opacity ejecta and therefore argues forthe production of at least some lower-mass r-process material,which would also be consistent with recent theoretical studies(Wanajo et al. 2014; Perego et al. 2014; Just et al. 2015; Wuet al. 2016). This could point to rates between the above twoextremes. From the modelling of the NIR lightcurves alone it
Fig. 6. Needed event rates, scaled to an ejecta mass of 0.03 M�, if NSNSmergers are to produce all r-process (in solar proportions) above a min-imum nucleon number >A (solid black line). Also shown are the esti-mated rates (90% conf.) for NSNS mergers from the population synthe-sis study of Kim et al. (2015), the sGRB rates based on Swift data fromPetrillo et al. (2013) and the LVC estimate based on the first detectedNSNS merger event.
is not possible to distinguish between a pure high-opacity andpure low-opacity case (Figs. 4 and 5), but merger simulationsindicate that at least some low-Ye matter is ejected and this isalso consistent with the broad spectral features that have beenobserved (Kasliwal et al. 2017; Tanvir et al. 2017; Chornocket al. 2017). Therefore, we interpret this first event as strongevidence for a broad range of r-process nuclei being producedand not just –as thought until a few years ago– only A > 130material.Based on the discussed numbers, NSMs could produce all thecosmic r-process without needing an additional production site.But within the uncertainties of rates/ejecta masses additionalcontributors are certainly possible. It has been argued (see e.g.the discussion in Thielemann et al. (2017)) that an additionalsource of strong r-process would make it easier to explain
Article number, page 6 of 10
Fig. 4. Comparison of a low-Ye (=0.1) matter case, representative for a “tidal” dynamical ejecta, with NIR JHK-band observations(https://kilonova.space/kne/GW170817/). The detailed ejecta model parameters are shown at the top of each panel. The left panel usesheating according to the FRDM nuclear mass model, for the right panel a DZ-type heating rate has been employed (see Sect. 3 in the main text fora discussion).
A&A proofs: manuscript no. aanda
Fig. 4. Comparison of a low-Ye (= 0.1) matter case, representative for a "tidal" dynamical ejecta, with NIR JHK-band observations(https://kilonova.space/kne/GW170817/). The detailed ejecta model parameters are shown at the top of each panel. The left panel uses heat-ing according to the FRDM nuclear mass model, for the right panel a DZ-type heating rate has been employed (see Sec. 3 in the main text for adiscussion).
Fig. 5. Comparison for a model without lanthanides and third r-processpeak ejecta. The detailed ejecta model parameters are shown at the topof the panel. For this calculation the heating rate of the FRDM nuclearmass model was used (see Sec. 3, main text for a discussion). The prop-erties of this model are characteristic for matter unbound from an accre-tion torus.
(3)
Clearly, which rate is needed depends on which r-processelements are produced. In Fig. 6, we show as solid black linethe required event rate (scaled to an ejecta mass of 0.03 M�)under the assumption that NSMs produce all r-process (in solarproportions) above a limiting nucleon number >A. So if allr-process is produced in NSMs, an event rate of about 560 (0.03M�/m̄ej) yr�1 Gpc�3 is needed. If instead, NSMs should onlyproduce r-process beyond the second peak (A > 130), a rate ofonly 70 (0.03 M�/m̄ej) yr�1 Gpc�3 would su�ce. The early blueemission observed in AT2017gfo, however, is most naturallyexplained with lower-opacity ejecta and therefore argues forthe production of at least some lower-mass r-process material,which would also be consistent with recent theoretical studies(Wanajo et al. 2014; Perego et al. 2014; Just et al. 2015; Wuet al. 2016). This could point to rates between the above twoextremes. From the modelling of the NIR lightcurves alone it
Fig. 6. Needed event rates, scaled to an ejecta mass of 0.03 M�, if NSNSmergers are to produce all r-process (in solar proportions) above a min-imum nucleon number >A (solid black line). Also shown are the esti-mated rates (90% conf.) for NSNS mergers from the population synthe-sis study of Kim et al. (2015), the sGRB rates based on Swift data fromPetrillo et al. (2013) and the LVC estimate based on the first detectedNSNS merger event.
is not possible to distinguish between a pure high-opacity andpure low-opacity case (Figs. 4 and 5), but merger simulationsindicate that at least some low-Ye matter is ejected and this isalso consistent with the broad spectral features that have beenobserved (Kasliwal et al. 2017; Tanvir et al. 2017; Chornocket al. 2017). Therefore, we interpret this first event as strongevidence for a broad range of r-process nuclei being producedand not just –as thought until a few years ago– only A > 130material.Based on the discussed numbers, NSMs could produce all thecosmic r-process without needing an additional production site.But within the uncertainties of rates/ejecta masses additionalcontributors are certainly possible. It has been argued (see e.g.the discussion in Thielemann et al. (2017)) that an additionalsource of strong r-process would make it easier to explain
Article number, page 6 of 10
Fig. 5. Comparison for a model without lanthanides and third r-processpeak ejecta. The detailed ejecta model parameters are shown at the topof the panel. For this calculation the heating rate of the FRDM nuclearmass model was used (see Sect. 3, main text for a discussion). Theproperties of this model are characteristic for matter unbound from anaccretion torus.
Using nuclear network calculations employing the FRDMnuclear mass model, we derive a lower limit on the ejecta massof �1.5 � 10�2 M� to explain the bolometric luminosity. Due touncertainties in the nuclear physics far from stability, this limitcould potentially be reduced by a factor of up to �5. Even inthis most pessimistic case the real ejecta amount would likely be�1% of a solar mass, which is a substantial amount in a cosmicnucleosynthesis context. Based on this first detected GW-event,the NSM rate (90% conf.) is estimated as 320–4740 Gpc�3 yr�1
(Abbott et al. 2017d), compact object merger rate estimatesbased on SWIFT sGRB data point to �500�1500 Gpc�3 yr�1
(Petrillo et al. 2013) while recent population synthesis studies(Kim et al. 2015) estimate the rate5 as 244+325
�162 Gpc�3 yr�1, whichmeans that within the rate uncertainties, NSMs can well produceall the r-process elements in the MW (Mr � 19 000 M�; e.g.
5 We use the density of Milky Way equivalent galaxies of Abadie et al.(2010) to transform between different units.
A&A proofs: manuscript no. aanda
Fig. 4. Comparison of a low-Ye (= 0.1) matter case, representative for a "tidal" dynamical ejecta, with NIR JHK-band observations(https://kilonova.space/kne/GW170817/). The detailed ejecta model parameters are shown at the top of each panel. The left panel uses heat-ing according to the FRDM nuclear mass model, for the right panel a DZ-type heating rate has been employed (see Sec. 3 in the main text for adiscussion).
Fig. 5. Comparison for a model without lanthanides and third r-processpeak ejecta. The detailed ejecta model parameters are shown at the topof the panel. For this calculation the heating rate of the FRDM nuclearmass model was used (see Sec. 3, main text for a discussion). The prop-erties of this model are characteristic for matter unbound from an accre-tion torus.
(3)
Clearly, which rate is needed depends on which r-processelements are produced. In Fig. 6, we show as solid black linethe required event rate (scaled to an ejecta mass of 0.03 M�)under the assumption that NSMs produce all r-process (in solarproportions) above a limiting nucleon number >A. So if allr-process is produced in NSMs, an event rate of about 560 (0.03M�/m̄ej) yr�1 Gpc�3 is needed. If instead, NSMs should onlyproduce r-process beyond the second peak (A > 130), a rate ofonly 70 (0.03 M�/m̄ej) yr�1 Gpc�3 would su�ce. The early blueemission observed in AT2017gfo, however, is most naturallyexplained with lower-opacity ejecta and therefore argues forthe production of at least some lower-mass r-process material,which would also be consistent with recent theoretical studies(Wanajo et al. 2014; Perego et al. 2014; Just et al. 2015; Wuet al. 2016). This could point to rates between the above twoextremes. From the modelling of the NIR lightcurves alone it
80 100 120 140 160 180 2000.5
1
1.5
2
2.5
3
3.5
>A
log 1
0(R
(0.0
3 M
⊙/m
ej)
[yr-1
Gpc
-3])
first
secondthirdr-process peak
LVC (2017)
Petrillo et al. (2013)
Kim et al. (2015)
Fig. 6. Needed event rates, scaled to an ejecta mass of 0.03 M�, if NSNSmergers are to produce all r-process (in solar proportions) above a min-imum nucleon number >A (solid black line). Also shown are the esti-mated rates (90% conf.) for NSNS mergers from the population synthe-sis study of Kim et al. (2015), the sGRB rates based on Swift data fromPetrillo et al. (2013) and the LVC estimate based on the first detectedNSNS merger event.
is not possible to distinguish between a pure high-opacity andpure low-opacity case (Figs. 4 and 5), but merger simulationsindicate that at least some low-Ye matter is ejected and this isalso consistent with the broad spectral features that have beenobserved (Kasliwal et al. 2017; Tanvir et al. 2017; Chornocket al. 2017). Therefore, we interpret this first event as strongevidence for a broad range of r-process nuclei being producedand not just –as thought until a few years ago– only A > 130material.Based on the discussed numbers, NSMs could produce all thecosmic r-process without needing an additional production site.But within the uncertainties of rates/ejecta masses additionalcontributors are certainly possible. It has been argued (see e.g.the discussion in Thielemann et al. (2017)) that an additionalsource of strong r-process would make it easier to explain
Article number, page 6 of 10
Fig. 6. Needed event rates, scaled to an ejecta mass of 0.03 M�, ifNSNS mergers are to produce all r-process (in solar proportions) abovea minimum nucleon number >A (solid black line). Also shown are theestimated rates (90% conf.) for NSNS mergers from the populationsynthesis study of Kim et al. (2015), the sGRB rates based on Swiftdata from Petrillo et al. (2013) and the LVC estimate based on the firstdetected NSNS merger event.
Bauswein et al. 2014; Shen et al. 2015; Rosswog et al. 2017),
Mr � 17 000 M�� RNSNS
500Gpc�3 yr�1
� �m̄ej
0.03M�
� ��gal
1.3 � 1010 yr
�.
(3)
Clearly, which rate is needed depends on which r-processelements are produced. In Fig. 6, we show as solid black linethe required event rate (scaled to an ejecta mass of 0.03 M�)under the assumption that NSMs produce all r-process (insolar proportions) above a limiting nucleon number >A.So if all r-process is produced in NSMs, an event rate ofabout 560 (0.03 M�/m̄ej) yr�1 Gpc�3 is needed. If instead,NSMs should only produce r-process beyond the second peak(A > 130), a rate of only 70 (0.03 M�/m̄ej) yr�1 Gpc�3 would suf-fice. The early blue emission observed in AT2017gfo, however, ismost naturally explained with lower-opacity ejecta and therefore
A132, page 6 of 10
Figure 3: Model fits to ground-based data in the first few weeks do not yield a better fit to
models including the heaviest r-process elements (Left Panel; ⇠ 10 cm2gm
�1) compared to
models with only lighter r-process elements (Right Panel; ⇠ 1 cm2gm
�1). Late-time mid-IR
observations are needed to distinguish between models. [12]
Spitzer Space Telescope observations detected the GW170817 kilonova at 4.5µm at43 days and 74 days after merger (Figure 4). The 4.5µm luminosity at this late phase and
2
Mansi M. Kasliwal / Ay 111

Direct evidence that the heaviest elements were indeed synthesized!
Kasliwal et al. 2019a
We did strike gold!
+43d +74d
Mansi M. Kasliwal / Ay 111

Cosmic Mines
Credit: J. JohnsonMansi M. Kasliwal / Ay 111

ZTF Promptly Mapped Coarse O3 localizations
LVC O3a Summary: 13 Triggers
BNS: Five triggers(median distance: 227 Mpc)
NSBH: Eight triggers(median distance: 354 Mpc)Median localization in O3: 4480 sq deg
Kasli
wal
et a
l. 20
20
Credit: Leo Singer
Mansi M. Kasliwal / Ay 111

137 Scientists
37 Telescopes
38 Science Programs
100,000 events/night
5603 Supernovae to date
182 Refereed Journal Papers in 5 years
8236 citations
h-index 42
A Dy
nam
ic C
olla
bora
tive
Plat
form
Kasliwal et al. 2019aIn collaboration with UCB, the next generation open-source Fritz is now live
Mansi M. Kasliwal / Ay 111

0.4 0.5 0.6 0.7 0.8 0.9 1.0
Rest wavelength (µm)
Scal
edflu
xF
∏
PGIR 20dsv (Nova)DBSP
PGIR 20dcl (Nova)DBSP
PGIR 20dwf (YSO)DBSP
PGIR 20eig (Nova)DBSP
PGIR 20emj (Nova)DBSP
1.00 1.25 1.50 1.75 2.00 2.25
Rest wavelength (µm)
PGIR 20dci (YSO)TSpec
PGIR 19chp (YSO)TSpec
PGIR 20duo (Nova)TSpec
PGIR 19brv (Nova)TSpec
PGIR 20dcl (Nova)TSpec
Spectrum is Truth
Mansi M. Kasliwal / Palomar Observatory Greenway Lecture 2021

Next Generation Palomar Spectrograph
Mansi M. Kasliwal / Palomar Observatory Greenway Lecture 2021

Follow-Up Follow-Up Follow-Up2,116,846 ZTFalerts inside 13GWevent localizationswithin3daysofmerger
2199ZTFcandidatesselectedbymulti-stepmachinelearning(presented forhumanvetting)
127 ZTFcandidatesselectedandannounced(viaGCNcirculars)
70 remaining after follow-upspectroscopy(Keck,GTC,Gemini, P200,LDT,SALT,APO,HCT,LT)
14 remaining afterfollow-up photometry(LT,LCO,KPED,GIT,LOT,P60,P200,Gemini,Keck,
GTC, LDT,APO,Swift)
0 remaining afternewGWmap/archivalanalysis/detailedinspection
0kilonovae
Kasliwal et al. 2020
Mansi M. Kasliwal / Ay 111

Is GW170817 the norm? 23
0
0.1
0.2
0.3
0.4
0.5
0.6
0.7
0.8
0.9
1
-20.0-19.0-18.0-17.0-16.0-15.0
Maxim
umFractionofBrightKilonovae
PeakAbsoluteMagnitude
FlatEvolution Fading(1mag/day) Median
KasenModelsr-band Bullamodelsr-band Median(withp_terrestrial)
Figure 12. Constraints on the underlying luminosity function of kilonovae represented as the maximum allowed fraction ofkilonovae brighter than a given peak absolute magnitude. Constraints are derived at a 90% confidence level. We show constraintsassuming flat photometric evolution (orange squares) and fading by 1 mag day�1 (green stars). We also show the event-by-eventconstraint based on a median estimate (yellow circles, dotted line). We correct this median estimate by the probability that theGW alert was terrestrial (red circles, dotted line). We compare to a model grid published in Kasen et al. 2017 (dashed blackline) and find the limiting line suggests some kilonovae must either have Mej < 0.03M� or Xlan > 10�4. The limiting line(blue dashed line) for another model grid (Dietrich et al. 2020; Bulla 2019) suggests that some kilonovae must be fainter thanGW170817 with Mej,dyn < 0.005M� or Mej,pm < 0.05M� or � > 30�.
Oates, S., Page, K., Breeveld, A., et al. 2020b, GCN, 27153,1300
11301
Oke, J. B., Cohen, J. G., Carr, M., et al. 1995, PASP, 107,1302
3751303
Patterson, M. T., Bellm, E. C., Rusholme, B., et al. 2019,1304
PASP, 131, 0180011305
Perley, D., & Copperwheat, C. 2019, GRB Coordinates1306
Network, 25720, 11307
Perley, D., & Copperwheat, C. 2019, GCN, 26426, 11308
Perley, D. A. 2019, PASP, 131, 0845031309
Perley, D. A., Ho, A. Y. Q., & Copperwheat, C. M. 2019a,1310
GRB Coordinates Network, 25643, 11311
Perley, D. A., Goobar, A., Kasliwal, M. M., et al. 2019b,1312
GRB Coordinates Network, 24331, 11313
Pian, E., D’Avanzo, P., Benetti, S., et al. 2017, Nature,1314
551, 671315
Piascik, A. S., Steele, I. A., Bates, S. D., et al. 2014, in1316
Society of Photo-Optical Instrumentation Engineers1317
(SPIE) Conference Series, Vol. 9147, Proc. SPIE, 91478H1318
Piro, A. L., & Kollmeier, J. A. 2018, ApJ, 855, 1031319
Pozanenko, A. S., Barkov, M. V., Minaev, P. Y., et al.1320
2018, The Astrophysical Journal, 852, L301321
Rhodes, L., Fender, R., Williams, D., et al. 2019, GRB1322
Coordinates Network, 24226, 11323
Rigault, M., Neill, J. D., Blagorodnova, N., et al. 2019,1324
A&A, 627, A1151325
Roming, P. W. A., Kennedy, T. E., Mason, K. O., et al.1326
2005, SSRv, 120, 951327
Rosell, M. J. B., Rostopchin, S., Zimmerman, A., et al.1328
2019, GRB Coordinates Network, 25622, 11329
Rosswog, S. 2005, ApJ, 634, 12021330
Kasliwal et al. 2020Mansi M. Kasliwal / Ay 111

But what is the rate?
Andreoni et al. 2020d
Igor Andreoni Michael Coughlin
Mansi M. Kasliwal / Ay 111

Why Infrared?1. Dust extinction
• Classical Novae• White Dwarf Mergers
2. Self-enshrouding• Stellar Mergers• Obscured Supernovae
3. Opacity• Binary Neutron Star Merger• Neutron Star Black Hole Merger
How?To reduce detector cost:ü Software Algorithmsü InGaAs Detectorsü MBE on Si Detectors
To mitigate sky background:ü Spaceü Antarctica
Mansi M. Kasliwal / Ay 111

April 26, 2019
GROWTH Team undertook a co-ordinatedsearch mapping the full area with fourdiscovery engines worldwide.
Shreya Anand(Grad 3rd Year)
Mansi M. Kasliwal / Ay 111
Figu
re C
redi
t: Le
o Si
nger

August 14, 2019
0.0 0.1 0.2 0.3 0.4 0.5 0.6 0.7 0.8 0.9 1.0cos µobs
0.01
0.02
0.03
0.04
0.05
0.06
0.07
0.08
0.09
0.10
Mej
(MØ)
Allowed region¡ = 15±
215 Mpc
267 Mpc
319 Mpc
0.0 0.1 0.2 0.3 0.4 0.5 0.6 0.7 0.8 0.9 1.0cos µobs
Allowed region¡ = 30±
215 Mpc
267 Mpc
319 Mpc
90.0 84.3 78.5 72.5 66.4 60.0 53.1 45.6 36.9 25.8 0.0
µobs relative to face-on (deg)90.0 84.3 78.5 72.5 66.4 60.0 53.1 45.6 36.9 25.8 0.0
µobs relative to face-on (deg)
0 1 2 3 4 5 6 7Time since merger (days)
20
21
22
23
i(m
ag)
Ruled out models¡ = 15±, 30±
215 Mpc
267 Mpc
319 Mpc
0 1 2 3 4 5 6 7Time since merger (days)
20
21
22
23
z(m
ag)
Ruled out models¡ = 15±, 30±
215 Mpc
267 Mpc
319 Mpc
Andreoni, Goldstein et al. 2019c
Upper limits suggest that either opacity was too high or the mass ratio was too high.See also Morgan et al. 2020 (independent analysis by DESGW team)
Igor Andreoni Danny Goldstein
Mansi M. Kasliwal / Ay 111

A Radio Search by ASKAP Dobie et al. 2019
ASKAP observations of S190814bv 3
1h06
m00
m0h54
m48
m42
m36
m
�22�
�24�
�26�
�28�
Right Ascension (J2000)
Dec
linat
ion
(J20
00)
0
100
200
300
400
500
600
Flu
xD
ensi
ty(µ
Jy/b
eam
)
Figure 1. ASKAP image of the localisation region of S190814bv centered on 00:50:37.5, �25:16:57.371 observed 2 days post-merger. The 30deg2 field of view covers ⇠ 89% of the localisation region, with 50% (90%) contours shown in red dashed (solid)lines. The large object near the centre of the image is the radio-emitting starburst galaxy NGC253. Note: there is a secondarylobe of the localisation towards the south-east that is outside the ASKAP footprint.
strain the Gaussian shape fit parameters for all sourcesto be the same as the restoring beam.
We selected candidates by identifying sources thatwere significant outliers in both variability metrics cal-culated by TraP: ⌘, which is the weighted reduced �2,and the variability index V (equivalent to the fractionalvariability). This was done by fitting a Gaussian func-tion to the distributions of both metrics in logarith-mic space, with � thresholds chosen to be ⌘ > 1.5�⌘
and V > 1.0�V , equating to values of ⌘ > 2.73 andV > 0.18. The thresholds were adapted from Rowlin-son et al. (2019), which gives approximate recall andprecision rates of 90% and 50% respectively.
This resulted in 285 transient or variable candidates,which was reduced to 89 sources after manual inspectionto remove imaging artefacts and components of complexextended sources.
3.1. Analysis of candidates for possible association
with S190814bv
The 89 variable sources were filtered to remove thosethat were not consistent with the predicted emission ofS190814bv, which should not exhibit more than a singlerise and decline on these timescales (Hotokezaka et al.2016), according to the following criteria:
Mansi M. Kasliwal / Ay 111
Dobi
e et
al.
2019

Neutron Star + Black Hole Merger
Mansi M. Kasliwal / Palomar Observatory Greenway Lecture 2021

Mansi M. Kasliwal / Palomar Observatory Greenway Lecture 2021
Anand, Coughlin et al. 2020
Shreya Anand(Grad 3rd Year)

Could the neutron star be swallowed whole by the black hole?
Foucart et al. 2018
The hallmark signature is a red source that rapidly reddens.
Mansi M. Kasliwal / Ay 111

Infrared: Luminous and Long-lived
Page 12 of 29
Figure 1 | Schematic illustration of the components of matter ejected from neutron-
star mergers. Red colours denote regions of heavy r-process elements, which radiate
red/infrared light. Blue colours denote regions of light r-process elements which radiate
blue/optical light. During the merger, tidal forces peel off tails of matter, forming a torus
of heavy r-process ejecta in the plane of the binary. Material squeezed into the polar
regions during the stellar collision can form a cone of light r-process material. Roughly
spherical winds from a remnant accretion disk can also contribute, and are sensitive to the
fate of the central merger remnant. a, If the remnant survives as a hot neutron star for tens
of milliseconds, its neutrino irradiation lowers the neutron fraction and produces a blue
wind. b, If the remnant collapses promptly to a black hole, neutrino irradiation is
suppressed and the winds may be red. c, In the merger of a neutron star and a black hole,
only a single tidal tail is ejected and the disk winds are more likely to be red.
squHHzHd dynamical v ≈ 0.2c-0.3c
tidal dynamical v ≈ 0.2c-0.3c
disN wind v ≲ 0.1c
1Hutron Star + 1Hutron Star long livHd nHutron star rHmnant
a
squHHzHd dynamical v ≈ 0.2c-0.3c
tidal dynamical v ≈ 0.2c-0.3c
disN wind v ≲ 0.1c
1Hutron Star + 1Hutron StarrHmnant SromSt collaSsH to blacN holH
b
tidal dynamical v ≈ 0.2c-0.3c
disN wind v ≲ 0.1c
1Hutron Star + BlacN +olH blacN holH rHmnant
c
Kasen et al. 2017Kasen et al. 2017
Mansi M. Kasliwal / Ay 111

WINTER @ Palomar + DREAMS @ Siding SpringsInGaAs Semiconductor Technology
The$Wide(field$Infrared$Transient$Explorer
and"surveillance"applications,"offering"extensive"heritage"and"an" intermediate"costDperDpixel" (~3x" lower"than"HgCdTe)."It"has"a"directDbandgap"cutoff"at"1.68km,"which"greatly"simplifies"designs"for"autonomous"instruments"not"seeking"KDband"imaging,"since"instrumental"backgrounds"remain"low"with"only"modest"sensor"cooling"(i.e."dark"current),"and"ambient"temperature"optics."
Using" a" small" demonstration" camera,"we" have" achieved" skyDnoise" limited" photometric" performance"from"InGaAs"sensors"operated"at"T"="D40C"with"a"warm"optical"train8,9,10,11."This"success,"coupled"with"(a)"the"unexplored"phase"space"of"time"variability"in"the"IR,"and"(b)"the"recently"highlighted"importance"of"the"IR"for"studying"electromagnetic"signatures"of"neutron"star"mergers12,13,"motivates"us"to"scale"InGaAs"focal"planes"to"the"large"field"sizes"needed"for"systematic"surveys"of"explosive"or"timeDvariable"sources."""B.1. Electromagnetic$signatures$of$the$r$($process$in$neutron$star$mergers$$
On" August" 17," 2017," the" groundbreaking" discovery" of" both" gravitational" waves" (GW)" and"electromagnetic" radiation" from" a" neutron" star" (NS)" merger" marked" the" dawn" of" a" new" era" in" multiDmessenger"astrophysics14D19."GW170817"lit"up"the"entire"electromagnetic"spectrum,"and"yielded"a"scientific"bonanza" in" fields" as" wideDranging" as" strong" field" gravity," nucleosynthesis," extreme" states" of" nuclear"maner,"the"astrophysics"of"relativistic"explosions"and"jets,"and"cosmology."For"the"first"time,"we"saw"realDtime"evidence"of"rDprocess"nucleosynthesis,"which"yields"half" the"elements" in"the"periodic" table"heavier"than"iron2."Heavy"line"blanketing"from"the"large"density"of"boundDbound"transitions"renders"the"opacity"of" rDprocessDrich"maner"much"higher" than" the" conventional" iron"peak" elements" (Figure" 2)," shifting" the"emergent"spectrum"out"of"the"optical"bands"and"into"the"IR"(Figure"3,"top"panel)12,13."Both"IR"photometry"and" IR" spectroscopy" (revealing" vivid" broad" features)" were" decisive" in" shaping" the" interpretation" that"GW170817"synthesized">10,000"earth"masses"of"neutron"capture"elements15."
Now" that" the" first" unambiguous" rDprocess" site" has" been" identified," an" exciting" opportunity" exists" to"characterize" its" astrophysics." Sensitivity" improvements" expected" soon" for"LIGO"O4" (starting"midD2020)"project"that"NSDNS"mergers"will"be"detected"at"a"rate"of"~1D2"/"month20,"yielding"50D100"events"in"the"next"5"years" to" address" fundamental" questions" such" as" (a)" Are" NSDNS" mergers" the" only" site" of" rDprocess"nucleosynthesis?"(b)"Do"they"produce"the"same"relative"abundance"ratios"seen"in"the"solar"neighborhood?"(c)"Are"the"thirdDpeak"rDprocess"elements"(e.g."Au"and"Pt)"synthesized?"(d)"What"elements"are"made"when"a" NS" merges" with" a" stellar" mass" black" hole" (BH)?" A" less" fundamental" but" still" relevant" question" is"whether"such"an"event"rate"will"saturate"the"ToO"budget"of"large"or"national"observatories."
A" serious" gap" in" worldwide" plans" to" address" these" questions" is" our" lack" of" IR" survey" instruments"matching"the"scale"of"coarse"GW"localizations"(~10"deg2"with"three"advanced"GW"interferometers20)."With"a" rich" suite" of" optical" surveys" spanning" different" scales" (e.g.," ZTF6," PanSTARRS21,"ATLAS22,"DECam23,"HSC24,"LSST3),"we"are"wellDequipped"to"search"for"optical"counterparts"to"NSDNS"mergers,"and"indeed"this"was" how" the" counterpart" to" GW170817" was" discovered14." However" the" emerging" consensus" is" that"GW170817"was"a"gift"of"nature"–" it"was" in"our"backyard" (D=40"Mpc)"and"our" lineDofDsight"was" just"~30"
Page"� "of"�2 15
Figure"1:"Field"of"View"(FoV)"comparison"for"IR"survey"instruments."WINTER’s"FoV"matches"that"of"VIRCAM,"the"world’s"largest"IR"imager,"but"with">2x"higher"fill"factor."WINTER"has"a"coarser"pixel"scale"to"maximize"mapping"speed"for"transient"surveys"while"still"operating"near"Palomar’s"Nyquist"limit."VIRCAM"will"be"decommissioned"in"2020"to"install"4MOST"on"the"VST,"leaving"WINTER"as"the"only"~1○"scale"IR"imager"during"LIGO"O4.
The$Wide(field$Infrared$Transient$Explorer
degrees"from"the"pole."Both"factors"yield"a"bright,"blue"optical"counterpart,"conducive"to"localization"by"
small" optical" telescopes." Theory" suggests" that" this" requires" substantial" serendipity," because" optical"
emission"is"highly"model"dependent"(Figure"2)1,15,25,26,27."It"may"require"a"view"of"polar"regions"with"high"
ejecta"velocity"and"low"opacity."Or," it"may"need"suppressed"optical"opacity"via"neutrinoDirradiated"disk"
winds28."Or," it" could" require" an" extended" survival" period" of" the" hypermassive"NS" remnant" before" BH"
collapse29."Optical"emission"is"never"predicted"for"NSDBH"mergers,"or"high"massDratio"NSDNS"events."Even"
when"optical"emission"is"present,"it"decays"on"~1"day"timescales30."
In" contrast," bright" infrared" emission" (peaking" at" 1.0D1.2km)" from" radioactive" decay" of" neutronDrich"
isotopes"should"be"ubiquitous"and" independent"of"geometry,"opacity," remnant" lifetime"and"mass" ratio,"
and"the"IR"counterpart"remains"bright"for"a"week"or"more."Thus,"a"systematic"and"unbiased"search"for"EM"
counterparts"to"NSDNS"and"NSDBH"mergers"is"optimally"undertaken"in"the"infrared.""
WINTER" will" be" able" to" detect" LanthanideDrich"
kilonovae"throughout"LIGO’s"full"search"volume,"
and" track" their" photometric" evolution" on"
weeklong" timescales." Figure" 3" (bonom" left)"
depicts"the"depth"to"which"WINTER"can"scan"a"20"
deg2"search"region"in"one"night"(shaded"green,"4D
hour"visibility),"or"through"coDaddition"of"3"nights"
(shaded" yellow)" since" the" transient" brightens"during" this" time" in" the" IR."Overlaid"curves"show"
the" JDband" evolution" of" GW170817," but" offset"
from"its"actual"distance"(40"Mpc)"to"100,"150,"and"
190"Mpc"(the"NSDNS"detection"horizon"for"LIGOD
O4)." If" construction" begins" this" year," WINTER"
will"come"online" just"as"LIGO"and"Virgo"achieve"
this"sensitivity"goal"for"the"Advanced"phase20."
WINTER’s" large" FoV" and" negligible" overheads"
are"unique"for"fast"volumetric"mapping"in"the"IR."
The" only" comparable" IR" instruments" in" use" are"
VISTA/VIRCAM"and"UKIRT/WFCAM"(Figure"1)."
Although" these" are" on" larger" telescopes," both"
instruments" are" deep" into" the" overheadDlimited"
regime" (i.e." readout+slew" >" exposure" time)" for"
kilonova" mapping," in" which" case" FoV" becomes"
the"bonleneck."Consequently"WINTER"can"survey"
Page"� "of"�3 15
Figure"2:"Cartoon"depiction"of"electromagnetic"counterparts"to"NS"mergers1,"with"heavy"rDprocess"IR"emission"(red)"
and" light" rDprocess"UV/optical" emission" (blue)."All"models" produce" an" IRDbright" torus" in" the"merger" plane" that"
emits" isotropically"and"would"be" seen"by"WINTER."A"UV/optical"flash" is" sometimes"visible"when" the"merger" is"
favorably"oriented"to"view"squeezed"dynamical"ejecta,"or"when"neutrino"flux"lowers"the"neutron"fraction"yielding"a"
blue"disk"wind"(a)."Mergers"resulting"in"prompt"black"hole"formation"(b,c)"produce"only"red/IR"disk"winds."
Page 12 of 29
Figure 1 | Schematic illustration of the components of matter ejected from neutron-
star mergers. Red colours denote regions of heavy r-process elements, which radiate
red/infrared light. Blue colours denote regions of light r-process elements which radiate
blue/optical light. During the merger, tidal forces peel off tails of matter, forming a torus
of heavy r-process ejecta in the plane of the binary. Material squeezed into the polar
regions during the stellar collision can form a cone of light r-process material. Roughly
spherical winds from a remnant accretion disk can also contribute, and are sensitive to the
fate of the central merger remnant. a, If the remnant survives as a hot neutron star for tens
of milliseconds, its neutrino irradiation lowers the neutron fraction and produces a blue
wind. b, If the remnant collapses promptly to a black hole, neutrino irradiation is
suppressed and the winds may be red. c, In the merger of a neutron star and a black hole,
only a single tidal tail is ejected and the disk winds are more likely to be red.
squeezed dynamical v ¼ 0.2c-0.3c
tidal dynamical v ¼ 0.2c-0.3c
disk wind v ≲ 0.1c
Neutron Star + Neutron Star long lived neutron star remnant
a
squeezed dynamical v ¼ 0.2c-0.3c
tidal dynamical v ¼ 0.2c-0.3c
disk wind v ≲ 0.1c
Neutron Star + Neutron Starremnant prompt collapse to black hole
b
tidal dynamical v ¼ 0.2c-0.3c
disk wind v ≲ 0.1c
Neutron Star + Black Hole black hole remnant
c
(a) (b) (c)
Figure" 3:" Top:" Model" spectra" for" radioactive" decay" of" rD
process"elements"at"t"="2"days,"scaled"to"match"in"J5."Colors"
denote"varying"lanthanide"fractions"as"indicated"in"legend."
Bo;om$ Left:$ Evolution" of" J" flux" for" GW170817" offset" to"
varying" distances" as" indicated." WINTER" will" detect" such"
events" over" 20" square" degrees" in" 4" hours" at" 150" Mpc"
(green),"or"190"Mpc"in"a"12Dhour"map"(yellow)."Bo;om$Right:"Evolution"in"(z"D"J)"color"for"the"models"shown"in"top"panel.
WINTER: In Partnership with Rob Simcoe (MIT)DREAMS: In Partnership with Anna Moore (ANU)
The$Wide(field$Infrared$Transient$Explorer
degrees"from"the"pole."Both"factors"yield"a"bright,"blue"optical"counterpart,"conducive"to"localization"by"
small" optical" telescopes." Theory" suggests" that" this" requires" substantial" serendipity," because" optical"
emission"is"highly"model"dependent"(Figure"2)1,15,25,26,27."It"may"require"a"view"of"polar"regions"with"high"
ejecta"velocity"and"low"opacity."Or," it"may"need"suppressed"optical"opacity"via"neutrinoDirradiated"disk"
winds28."Or," it" could" require" an" extended" survival" period" of" the" hypermassive"NS" remnant" before" BH"
collapse29."Optical"emission"is"never"predicted"for"NSDBH"mergers,"or"high"massDratio"NSDNS"events."Even"
when"optical"emission"is"present,"it"decays"on"~1"day"timescales30."
In" contrast," bright" infrared" emission" (peaking" at" 1.0D1.2km)" from" radioactive" decay" of" neutronDrich"
isotopes"should"be"ubiquitous"and" independent"of"geometry,"opacity," remnant" lifetime"and"mass" ratio,"
and"the"IR"counterpart"remains"bright"for"a"week"or"more."Thus,"a"systematic"and"unbiased"search"for"EM"
counterparts"to"NSDNS"and"NSDBH"mergers"is"optimally"undertaken"in"the"infrared.""
WINTER" will" be" able" to" detect" LanthanideDrich"
kilonovae"throughout"LIGO’s"full"search"volume,"
and" track" their" photometric" evolution" on"
weeklong" timescales." Figure" 3" (bonom" left)"
depicts"the"depth"to"which"WINTER"can"scan"a"20"
deg2"search"region"in"one"night"(shaded"green,"4D
hour"visibility),"or"through"coDaddition"of"3"nights"
(shaded" yellow)" since" the" transient" brightens"during" this" time" in" the" IR."Overlaid"curves"show"
the" JDband" evolution" of" GW170817," but" offset"
from"its"actual"distance"(40"Mpc)"to"100,"150,"and"
190"Mpc"(the"NSDNS"detection"horizon"for"LIGOD
O4)." If" construction" begins" this" year," WINTER"
will"come"online" just"as"LIGO"and"Virgo"achieve"
this"sensitivity"goal"for"the"Advanced"phase20."
WINTER’s" large" FoV" and" negligible" overheads"
are"unique"for"fast"volumetric"mapping"in"the"IR."
The" only" comparable" IR" instruments" in" use" are"
VISTA/VIRCAM"and"UKIRT/WFCAM"(Figure"1)."
Although" these" are" on" larger" telescopes," both"
instruments" are" deep" into" the" overheadDlimited"
regime" (i.e." readout+slew" >" exposure" time)" for"
kilonova" mapping," in" which" case" FoV" becomes"
the"bonleneck."Consequently"WINTER"can"survey"
Page"� "of"�3 15
Figure"2:"Cartoon"depiction"of"electromagnetic"counterparts"to"NS"mergers1,"with"heavy"rDprocess"IR"emission"(red)"
and" light" rDprocess"UV/optical" emission" (blue)."All"models" produce" an" IRDbright" torus" in" the"merger" plane" that"
emits" isotropically"and"would"be" seen"by"WINTER."A"UV/optical"flash" is" sometimes"visible"when" the"merger" is"
favorably"oriented"to"view"squeezed"dynamical"ejecta,"or"when"neutrino"flux"lowers"the"neutron"fraction"yielding"a"
blue"disk"wind"(a)."Mergers"resulting"in"prompt"black"hole"formation"(b,c)"produce"only"red/IR"disk"winds."
Page 12 of 29
Figure 1 | Schematic illustration of the components of matter ejected from neutron-
star mergers. Red colours denote regions of heavy r-process elements, which radiate
red/infrared light. Blue colours denote regions of light r-process elements which radiate
blue/optical light. During the merger, tidal forces peel off tails of matter, forming a torus
of heavy r-process ejecta in the plane of the binary. Material squeezed into the polar
regions during the stellar collision can form a cone of light r-process material. Roughly
spherical winds from a remnant accretion disk can also contribute, and are sensitive to the
fate of the central merger remnant. a, If the remnant survives as a hot neutron star for tens
of milliseconds, its neutrino irradiation lowers the neutron fraction and produces a blue
wind. b, If the remnant collapses promptly to a black hole, neutrino irradiation is
suppressed and the winds may be red. c, In the merger of a neutron star and a black hole,
only a single tidal tail is ejected and the disk winds are more likely to be red.
squeezed dynamical v ¼ 0.2c-0.3c
tidal dynamical v ¼ 0.2c-0.3c
disk wind v ≲ 0.1c
Neutron Star + Neutron Star long lived neutron star remnant
a
squeezed dynamical v ¼ 0.2c-0.3c
tidal dynamical v ¼ 0.2c-0.3c
disk wind v ≲ 0.1c
Neutron Star + Neutron Starremnant prompt collapse to black hole
b
tidal dynamical v ¼ 0.2c-0.3c
disk wind v ≲ 0.1c
Neutron Star + Black Hole black hole remnant
c
(a) (b) (c)
Figure" 3:" Top:" Model" spectra" for" radioactive" decay" of" rD
process"elements"at"t"="2"days,"scaled"to"match"in"J5."Colors"
denote"varying"lanthanide"fractions"as"indicated"in"legend."
Bo;om$ Left:$ Evolution" of" J" flux" for" GW170817" offset" to"
varying" distances" as" indicated." WINTER" will" detect" such"
events" over" 20" square" degrees" in" 4" hours" at" 150" Mpc"
(green),"or"190"Mpc"in"a"12Dhour"map"(yellow)."Bo;om$Right:"Evolution"in"(z"D"J)"color"for"the"models"shown"in"top"panel.
Mansi M. Kasliwal / Ay 111

Why Infrared?1. Dust extinction
• Classical Novae• White Dwarf Mergers
2. Self-enshrouding• Stellar Mergers• Obscured Supernovae
3. Opacity• Binary Neutron Star Merger• Neutron Star Black Hole Merger
How?To reduce detector cost:ü Software Algorithmsü InGaAs Detectorsü MBE on Si Detectors
To mitigate sky background:ü Spaceü Antarctica
Mansi M. Kasliwal / Ay 111

Mansi M. Kasliwal / Ay 111

Why Dome C?
• Sky is 40x Darker • Seeing is fantastic
Log
inte
nsity
Mansi M. Kasliwal / Ay 111

Two Technology ChallengesRoger Smith
Challenge: Affordable DetectorsSolution: Molecular Beam Epitaxy on Silicon
Don Figer (RIT)
Challenge: Thermal NoiseSolution: Fully Cryogenic Telescope System
Mansi M. Kasliwal / Ay 111

Mansi M. Kasliwal / Ay 111
3
Mansi M. Kasliwalv2021-01-24
SurveyBegins
PhDUG Post-Doc
FirstLight
GrantAwarded
R.M.L. J.J.
NASA
NSF-PIRE
R.L.
N.B.
D.C.
S.M.A.
WIRC-POL S.T.
NSF-MSIP
NSF-MSIP
Mt. Cuba HS BSF
K.D.
NSF-MRI
ARC-LIEF
NSF-ATI
Packard
S.K.
C.C.
L.W.
S.P.
M.H.
C.F. I.A.
Multi-Messenger
Event
G.S.
GW190521S.A.
V.K.
Legend
SurveyEnds
Paper
2016 2017 2018 2019 2020 2021 20222015 mid-20s
GROWTHPI
Worldwide
Network ofTransient Follow-
up Telescopes
SPIRITSPI
Space
Mid-IR transientsearch with
Spitzer
ZTFCo-PI
Palomar CA
47 deg2 gri-bandSi camera
120cm telescope
PGIRPI
Palomar CA
25 deg2 J-bandHgCdTe camera30cm telescope
WINTERCo-PI
Palomar CA
1 deg2 yJH-bandInGaAs camera
100cm telescope
DREAMSCI
SSO Australia
3 deg2 yJH-bandInGaAs camera50cm telescope
CryoscopePI
Antarctica
50 deg2 K-darkHgCdTe on Si
100cm telescope

Namaskarनम#कार
Copyright © 2022 FDOKUMEN


![In conjunction with Venus [planetary radar astronomy]](https://static.fdokumen.com/doc/165x107/631a4f09bb40f9952b01f2bc/in-conjunction-with-venus-planetary-radar-astronomy.jpg)