
Point of Care Molecular Diagnostics for Humanity - Caltech ...
304
i Point of Care Molecular Diagnostics for Humanity Thesis by Imran Raouf Malik In Partial Fulfillment of the Requirements for the Degree of Doctor of Philosophy California Institute of Technology Pasadena, California (Defended May 16 th , 2014) 2014
-
Upload
khangminh22 -
Category
Documents
-
view
3 -
download
0
Transcript of Point of Care Molecular Diagnostics for Humanity - Caltech ...

i
Point of Care Molecular Diagnostics for Humanity
Thesis by
Imran Raouf Malik
In Partial Fulfillment of the Requirements for the Degree of
Doctor of Philosophy
California Institute of Technology
Pasadena, California
(Defended May 16th, 2014)
2014

ii
© 2014
Imran Raouf Malik
All Rights Reserved

iii
To my parents

iv
The title of this thesis is in appreciation of people at Bill and Melinda Gates Foundation who provided resources and guidance for the development for this
technology with the purpose of serving humanity. They enabled me to prove that high quality medical technologies can be low cost. I hope they will make it available where
needed.

v
Acknowledgements
I am forever indebted to my parents. They raised me, taught me and supported me throughout my life. They taught me through their personal example. They bore half the globe’s distance from me, my wife and their grandchildren and supported my work for all these years. They taught me to stand steadfast in face of difficulty for the aim to serve humanity. One of the biggest reasons of my wish to excel is to make them happy.
I am also grateful to my wife who lived in difficult conditions during this time. With grown up kids and a huge workload, she supported me in pursuit of my dream to make this technology real. Her parents also supported us during the course of this work. I also acknowledge the support from my brothers. They supported the idea of usefulness of this work and supported me. It was an unusual experience and I learnt much from their expertise and experience. Irfan Malik not only suggested on various fronts but have a direct effect on the status of the project. He has a critical role in making many things better in this project.
I am especially grateful to my advisor Professor Axel Scherer on many accounts. In addition to guiding me in academic fields, he showed great character, perseverance and high morals during the course of this work. I have found people of such high qualities rare in today’s world. Axel maintained a phenomenal and enjoyable atmosphere. It was relaxing and exciting to talk with him. I specially admire his empathy and his focused work to have an impact on global health.
I also am thankful to Caltech as an institution as a whole. There are not many places where this work could be performed in this way. The policies, environment and facilities did help a lot during my research. I learnt a great deal from many excellent professors at Caltech. I could learn about new fields by auditing a lot of course and taking many outside my field of expertise. This indeed helped in building the decision power to select among various options during this work.
One cannot overstate the role of Bill and Melinda Gates Foundation in this effort. The organization has given a new dimension to charity – by prioritizing the needs and using technologies to make world a better place. Special thanks are extended to Gene Walther and Rob Taylor for organizing excellent meetings and supporting our effort. Their vision for making high quality diagnostics globally available is highly appreciated.
Various members of nanofabrication group have helped me. Kate Finigan helped and supported me throughout my studies. Her sincere efforts are deeply admired. Muhammad Mujeeb helped us try various ideas in KNI. Various members worked with me on this project. I would like to thank Xiomara Maderoa, Erika Garcia, Samson Chen, Loc Nguyen, Juan Cardenas, Mohammad Omar Naeem and Aoun

vi
Muhammad who contributed to the project. I also got knowledge and help from many other at Caltech. Habib Ahmed, Sheel Shah, Petros, John Vand helped in important ways.
There are a large number of individuals who helped me throughout my life. I thank all of them.
The role of many teachers has been very useful and motivating. Special thanks are extended to authors of the books and other publications which helped me learn about various fields.

vii
Abstract
Diagnostics of disease at POC (point of care) has been declared one of the Grand Challenge by the Bill and Melina Gates Foundation (BMGF). Infectious diseases constitute a major cause of disease burden and cause more than half a billion Disability-Adjusted Life Years (DALYs) and millions of deaths each year. They have an especially large effect on children under 5 years of age. We have analyzed data from the GBD 2010 (Global Burden of Disease) project to emphasize the damage caused by infectious diseases, and highlight the opportunity of using diagnostic tools to rapidly identify and treat diseases. To motivate the work of this thesis, we quantify the expected impact of appropriate diagnostic technologies.
We have also analyzed the requirements that a diagnostic tool should meet to generate the maximal global impact. We present various existing TPPs (Target Product Profiles) from different organizations and suggest some additions to these existing TPPs. We explain the particular molecular pathology technologies which have the potential to allow deployment of functional products in the developing world for point-of-care pathogen detection, especially in low-resource settings.
We perform a detailed analysis on existing polymerase chain reaction (PCR) systems and describe the problems caused with thermal performance and optical interrogation. We list the requirements that disposable cartridges for such instruments should meet and suggest a metal base design with polymer top. After detailed FEA simulations, we demonstrate that the thermal response can be modeled using a one-dimensional (1D) lumped element system. We show improvements in thermal response due to using a metal base and the effect of fluid height. We also performed thermal-structural simulations to quantify the stresses on the adhesive bonds of metal/polymer cartridges.
Next, we explain fabrication of these cartridges. We show methods to dispense adhesive using a robot and a custom made jig to spread the adhesive during curing. The cartridge was tested with different PCR reagents and we obtained reaction efficiencies approaching those of the commercial real time PCR machines. Our fabrication technique is useful to join dissimilar materials and is production friendly. By developing custom software, we observed the cartridge performance in a continuous manner. We could see the thermal response of cartridges by continuous fluorescence monitoring, and used reflective aluminum which increase light collection efficiency.
We then present a simple and robust new way for thermal cycling. Robust thermal cycling has been a major challenge conducting PCR, especially in point of care situations. Here, we suggest a contact cooling approach, in which the cartridge rests on a thin metal plate with an integrated thin heater constructed from flexible printed circuit board (PCB) material. We use a solenoid to move a metal plate to cool down the sample cartridge during cycling. The metal plate then rests on a larger heat sink to disperse the shuttled heat. Our design is dust and water proof and was verified on a bench-top prototype.

viii
A novel optical design for fluorescence detection during qPCR is also described. We suggest a lateral illumination waveguide geometry with prism coupling that eliminates lenses and is integrated into an injection molded cartridge. The light is homogenized using a light guide, and we quantify the sources of scattered stray light from the chamber edge by performing ray tracing simulations to optimize the precise geometry. The design is tolerant to misalignments and enables easy coupling of LED light into the chamber. As the light collection efficiency is high, the size of the chamber can be very small. We tested real PCR reactions using this concept and observed a rapid integration time, enabling very fast reading.
Sample preparation has been another challenge for all point-of-care (POC) lab-on-chip devices for many years. Here, we propose a new design which is robust, fast, flexible and simple, and uses a sliding seal to move the collected sample between various reservoir chambers. The sample moves on a slider sandwiched between seals that shuttles a DNA binding membrane between different reactions. Thus, size and volumes of reagents can be increased without increasing dead volumes. This design is easily automated, and positive displacement of fluids can work with many reagents without worrying about their characteristics such as foaming. The speed of the sample preparation protocols is high and complex protocols can be ported on this design concept, which we tested on real clinical samples and obtained impressive results. We designed and injection molded devices to test and verify this concept.
Finally, we focus on instrumentation and software required to allow our technology to be used at the POC. We describe our embedded electronics and describe the powerful micro-controller and various high performance ICs that are used to construct a fully functional for sample to answer instrument. We developed various versions of software. The developer software allows us to control our system and bench top setup. Our end user product includes a tablet and cell phone software interface. Software was developed for a windows 8 tablet, windows 8 phone and an Android based devices.
To conclude, we very briefly describe the POC systems that are under development: A portable qPCR system with a separate cartridge design, and a universal sample to answer system that performs qPCR, sample preparation and sample to answer protocols in one box depending on the cartridge.
As per best of our knowledge the cost of this technology is much lower than any other option in its class. The sample to answer instrument is expected to cost less than $500. The test cost is expected to be less than $5. The performance is not compromised. We hope that this work can help bring a transformative change in the practice of pathology especially in the developing world.

ix
Table of Contents 1 Burden of Disease and Importance of POC Diagnostics ___________________________ 1
Introduction ________________________________________________________________ 1
Burden of Disease ____________________________________________________________ 1
Infectious vs noncommunicable diseases ________________________________________ 14
Importance of diagnostics ____________________________________________________ 16
Other benefits of Dx at POC ___________________________________________________ 18
Importance of Nucleic Acid Testing and qPCR ____________________________________ 18
Need for New Technologies and Products _______________________________________ 19
Problems with Typical Commercialization _______________________________________ 20
Availability and Cost of Medicine ______________________________________________ 21
Accuracy of Disease burden Studies ____________________________________________ 21
Expected Impact of POC Diagnostics ____________________________________________ 22
Economic growth is not enough to make the impact _______________________________ 22
Political Domains contributing to health inequity within populations _________________ 22
2 Target Product Profiles ____________________________________________________ 24
Introduction _______________________________________________________________ 24
Existing TPPs _______________________________________________________________ 27
Additional Points ___________________________________________________________ 47
Conclusion ________________________________________________________________ 48
3 Overview of POC Instruments and Disposables _________________________________ 49
Introduction _______________________________________________________________ 49
Overview of Sample of Answer Technology and Innovations ________________________ 49
Product Configuration Concept ________________________________________________ 53

x
qPCR instrument demonstrator ________________________________________________ 55
Universal instrument Design __________________________________________________ 58
System Level Benefits and Comparison with Other Technologies _____________________ 63
Features of Sample Preparation Technology _____________________________________ 64
Features of Reaction Chamber ________________________________________________ 64
Example disposables for different assays ________________________________________ 64
4 Metal-Polymer Cartridge for Quantitative Real Time PCR at Point Of Care – Design and
Analysis ____________________________________________________________________ 66
Abstract___________________________________________________________________ 66
Introduction _______________________________________________________________ 67
Thermal FEA to find thermal response of existing Technology _______________________ 69
Existing Cartridge Based Systems ______________________________________________ 77
Review of Earlier Work in Research Literature ____________________________________ 80
Problems to be solved _______________________________________________________ 80
Checklist for PCR cartridge design for POC _______________________________________ 81
Design and Analysis _________________________________________________________ 82
5 Metal-Polymer Cartridge for Quantitative Real Time PCR at Point Of Care – Fabrication
and Test __________________________________________________________________ 108
Introduction ______________________________________________________________ 108
Materials _________________________________________________________________ 111
Fabrication _______________________________________________________________ 116
Test Setup ________________________________________________________________ 123
Reagents _________________________________________________________________ 126
Results ___________________________________________________________________ 127
Conclusion _______________________________________________________________ 133

xi
6 Low Cost and Low Energy Thermal Cycling For POC PCR ________________________ 134
Abstract__________________________________________________________________ 134
Introduction ______________________________________________________________ 134
Earlier work and problems ___________________________________________________ 135
Thermal control by PCR - Requirements ________________________________________ 139
Basic idea ________________________________________________________________ 139
Configurations ____________________________________________________________ 145
Contact Actuator __________________________________________________________ 147
Advantages _______________________________________________________________ 148
Design and analysis ________________________________________________________ 149
Lumped element analysis for cooling __________________________________________ 149
Contact modification _______________________________________________________ 152
Options for HTR plate _______________________________________________________ 152
Heater Design and Fabrication _______________________________________________ 152
Heater Fabrication Protocol __________________________________________________ 153
Implementation – experimental ______________________________________________ 157
Results ___________________________________________________________________ 160
Conclusion _______________________________________________________________ 160
7 Low Cost, High Performance Optical Design for POC qPCR_______________________ 161
Abstract__________________________________________________________________ 161
Requirements _____________________________________________________________ 161
Early Work and Problems ____________________________________________________ 162
Commercial Machines ______________________________________________________ 162
Commentary ______________________________________________________________ 171
Our Idea – side illumination __________________________________________________ 171

xii
Detailed Design ___________________________________________________________ 174
Filter Choice and options ____________________________________________________ 181
Modelling ________________________________________________________________ 182
Experimental and Test ______________________________________________________ 190
Advantages _______________________________________________________________ 192
Conclusion _______________________________________________________________ 193
8 Filter Selection Program __________________________________________________ 194
Abstract__________________________________________________________________ 194
Criteria / Challenges: _______________________________________________________ 194
Notes ____________________________________________________________________ 195
Specifications _____________________________________________________________ 195
User interface _____________________________________________________________ 197
Multiplex reactions ________________________________________________________ 197
User Interface _____________________________________________________________ 200
Filter Search ______________________________________________________________ 200
9 Robust and Flexible Sample Preparation Design for POC Diagnostics ______________ 204
Abstract__________________________________________________________________ 204
Introduction ______________________________________________________________ 204
Earlier Work ______________________________________________________________ 205
Requirements _____________________________________________________________ 206
Problems with Existing Approaches ___________________________________________ 208
Conceptual Design _________________________________________________________ 208
Advantages _______________________________________________________________ 214
Design and Fabrication ______________________________________________________ 215
Tests on Clinical Samples ____________________________________________________ 222

xiii
Conclusion _______________________________________________________________ 231
10 Embedded Electronics __________________________________________________ 232
Introduction ______________________________________________________________ 232
Overall Design_____________________________________________________________ 233
Main Modules_____________________________________________________________ 233
11 Developer Software ____________________________________________________ 236
Introduction ______________________________________________________________ 236
Desktop Based ____________________________________________________________ 236
DAQ based _______________________________________________________________ 238
12 Embedded Software ___________________________________________________ 247
Requirements _____________________________________________________________ 247
Architecture ______________________________________________________________ 247
User Devices ______________________________________________________________ 250
Firmware Overview ________________________________________________________ 250
Features _________________________________________________________________ 250
Normal Mode _____________________________________________________________ 251
Report and Control Mode ___________________________________________________ 251
Processes ________________________________________________________________ 252
Drivers Description _________________________________________________________ 257
13 End User Software Products _____________________________________________ 260
Requirements _____________________________________________________________ 260
Workflow ________________________________________________________________ 261
Key Methods ______________________________________________________________ 267
Methods for Communication _________________________________________________ 267

xiv
Windows 8/8.1 Application __________________________________________________ 268
Applications for Mobile Platforms _____________________________________________ 270
14 Bibliography _________________________________________________________ 275

xv
Index of Tables
Table 1.1 Metrics to measure burden of disease ......................................................................................... 2
Table 1.2 Sources of Data for Global Health ................................................................................................. 3
Table 1.3 Top ten leading causes of DALYs in the World .............................................................................. 4
Table 1.4 Top ten leading causes of deaths in the World ............................................................................. 4
Table 1.5 Top ten biotechnologies for developing world ........................................................................... 17
Table 2.1 Laboratory Types in US................................................................................................................ 25
Table 2.2 WHO ASSURED for High Impact Diagnostics ............................................................................... 28
Table 2.3 Suggested revised criteria for an ideal diagnostic point-of-care test in low resource settings .. 30
Table 2.4Target Platform Profile (TPP) for a complete POC instrument based on the proposed approach
.................................................................................................................................................................... 33
Table 2.5 Target Platform Profile (TPP) for a complete POC instrument based on the proposed approach
.................................................................................................................................................................... 34
Table 2.6 Assays of Interest and their parameters from literature ............................................................ 35
Table 2.7 TPP for Gates Foundation POC Dx Program ................................................................................ 40
Table 3.1 Challenges and Associated Solutions .......................................................................................... 52
Table 4.1 Thermal Properties of Selected Materials .................................................................................. 69
Table 4.2 Comparison of Thermal Properties ............................................................................................. 70
Table 4.3 Existing commercial PCR systems ............................................................................................... 77
Table 4.4 Key Features of different PCR chambers..................................................................................... 87
Table 4.5 COP 1420R Specific Heat ........................................................................................................... 101
Table 4.6 COP 1420R Thermal Conductivity and Resistivity ..................................................................... 101
Table 5.1 Surface Energies of Various Substrates ..................................................................................... 110
Table 5.2 Reflective Aluminum Coatings .................................................................................................. 111
Table 5.3 STD Assay .................................................................................................................................. 127
Table 6.1 Heat Transfer Modes and Expressions ...................................................................................... 140
Table 7.1 Excitation Simulation Results .................................................................................................... 184

xvi
Table of Figures
Figure 1.1 DALYs (total and % of total) as per income groups [millions] ...................................................... 5
Figure 1.2 Deaths (total and % of total) as per income groups [millions] .................................................... 6
Figure 1.3 % total of DALYs and deaths as per income regions .................................................................... 7
Figure 1.4 DALYs and deaths as per income group [per 1000] ..................................................................... 8
Figure 1.5 Population as per income regions and age groups ...................................................................... 9
Figure 1.6 Total and % Total DALYs and Deaths due to infections as per income groups.......................... 10
Figure 1.7 DALYs by income levels and age groups .................................................................................... 11
Figure 1.8 Deaths by income level and age group ...................................................................................... 12
Figure 1.9 DALYs due to top infectious diseases by income region ............................................................ 13
Figure 1.10 Deaths caused by top infectious diseases by income region .................................................. 14
Figure 1.11 DALYs (millions) and Deaths (thousands) due to noncommunicable diseases ....................... 16
Figure 1.12 DALYs which can be saved with appropriate diagnostics ........................................................ 17
Figure 1.13 Unnecessary Treatments ......................................................................................................... 18
Figure 1.14 Money spent for development of technologies ...................................................................... 20
Figure 2.1 Health Level Systems [41] .......................................................................................................... 26
Figure 2.2 Various TPPs for Different Health Care Levels ........................................................................... 27
Figure 2.3 PanDx Concept Model................................................................................................................ 29
Figure 2.4 Concept developed by Stratos and Halteres for Gates Foundation .......................................... 29
Figure 2.5 Instrument-Cartridge Interface .................................................................................................. 30
Figure 2.6 Bio Ventures TPP ........................................................................................................................ 36
Figure 2.7 PATH TPP for TB Diagnostics ...................................................................................................... 38
Figure 2.8 TPP for NTDs .............................................................................................................................. 39
Figure 3.1 Sample to Answer Steps and Innovations.................................................................................. 50
Figure 3.2 Technical Work Areas ................................................................................................................ 51
Figure 3.3 Innovations, problems solved and advantages .......................................................................... 53
Figure 3.4 Health Center System Concept .................................................................................................. 54
Figure 3.5 Portable System Concept ........................................................................................................... 55

xvii
Figure 3.6 qPCR Cartridge ........................................................................................................................... 55
Figure 3.7 Prototype qPCR Instruments ..................................................................................................... 57
Figure 3.8 Latest qPCR System .................................................................................................................... 58
Figure 3.9 Example sample to answer cartridge ......................................................................................... 60
Figure 3.10 Sample to Answer Cartridge Depicted in Linear configuration ............................................... 61
Figure 3.11 Concept Layout of Sample to Answer System ......................................................................... 62
Figure 3.12 Example cartridges ................................................................................................................... 65
Figure 4.1 CFX Tube Simulation Results ...................................................................................................... 72
Figure 4.2 Cepheid Tube, Heating from One Side ....................................................................................... 75
Figure 4.3 Cepheid Tube, Heating from Both Side ...................................................................................... 76
Figure 4.4 Existing Commercial PCR systems .............................................................................................. 78
Figure 4.5 Heating from Both Sides in Literature ........................................................................................ 79
Figure 4.6 Options for Metal-Polymer Cartridge. (a) Cavity is defined by Adhesive Thickness. (b) Cavity in
Polymer. (c) Cavity in Metal. ....................................................................................................................... 84
Figure 4.7 PCR Cartridge ............................................................................................................................. 86
Figure 4.8 PCR Cartridge Picture ................................................................................................................. 87
Figure 4.9 Simulation for PCR Cartridge with Metal Substrate .................................................................. 90
Figure 4.10 Simulation for PCR Cartridge with Polymer Substrate............................................................. 91
Figure 4.11 Comparison of Transient Thermal Response ........................................................................... 92
Figure 4.12 1D Lumped Model for thermal Design .................................................................................... 94
Figure 4.13 Lumped Model results for Fluid thickness of 250um .............................................................. 94
Figure 4.14 Temperature Spread in Water ................................................................................................. 95
Figure 4.15 Thermal Structural Calculation ................................................................................................ 97
Figure 4.16 Thermal-Structural Simulation Results .................................................................................... 99
Figure 4.17 Stresses and Deformation in Adhesive .................................................................................. 100
Figure 4.18 Thermal Time Constant vs Temperature of COP 1420R (Interpolated data) ........................ 102
Figure 4.19 Auto-Fluorescence of COP 1420R vs Topas and Polystyrene ................................................. 103
Figure 4.20 Cartridge with Seal ................................................................................................................. 105
Figure 4.21 Cartridge Filling Simulation .................................................................................................... 107
Figure 5.1 Dies for Metal Cutting .............................................................................................................. 112
Figure 5.2 Cartridge fabricated by Hot Embossing ................................................................................... 113
Figure 5.3 Cartridge Versions .................................................................................................................... 114

xviii
Figure 5.4 Bonding Area ............................................................................................................................ 115
Figure 5.5 Adhesive application by PAD Printing ...................................................................................... 118
Figure 5.6 Robot based dispensing setup ................................................................................................. 120
Figure 5.7 underfill process ....................................................................................................................... 121
Figure 5.8 First Two Types of Jigs .............................................................................................................. 122
Figure 5.9 UV adhesive Jig. (a) Shows CAD diagram of the assembly. (b) Shows the stencils and base to
align metal and cartridge. (c) Shows a picture of the actual setup .......................................................... 123
Figure 5.10 Test Setup .............................................................................................................................. 124
Figure 5.11 Thermal Setup ........................................................................................................................ 125
Figure 5.12 Amplification Curve ................................................................................................................ 128
Figure 5.13 Melt Curve.............................................................................................................................. 128
Figure 5.14 Continuous Fluorescence Curve ............................................................................................ 129
Figure 5.15 Thermal Response of Cartridge ............................................................................................. 130
Figure 5.16 Amplification Curves for various metal substrates ................................................................ 131
Figure 5.17 Efficiency Calculation Method ............................................................................................... 132
Figure 6.1 Thermal Design of Commercial Machines................................................................................ 135
Figure 6.2 Epistem Thermal System Design .............................................................................................. 136
Figure 6.3 Example Thermal Control Systems ........................................................................................... 138
Figure 6.4 Thermal conductivities of Materials ........................................................................................ 141
Figure 6.5 Basic Concept of Thermal Contact ........................................................................................... 143
Figure 6.6 Order of magnitude of convection heat transfer coefficients .................................................. 143
Figure 6.7 Cartridge Types. (a) Shows cartridge with integrated heater. (b)Shows bare cartridge ......... 146
Figure 6.8 Lumped Models for Various configurations. (a) Shows convection cooled. (b) Shows cartridge
integrated with heater (c) shows bare cartridge with a fixed heated plate ............................................. 150
Figure 6.9 Expected Contact Resistance Range for Cartridge ................................................................... 151
Figure 6.10 Laminate Structure ................................................................................................................ 153
Figure 6.11 Heater Design ......................................................................................................................... 156
Figure 6.12 Test Setup Schematic ............................................................................................................. 158
Figure 6.13 Picture of Test Setup .............................................................................................................. 159
Figure 6.14 CAD Diagram of Contact Cooling Test Setup ......................................................................... 159
Figure 6.15 Temperature Control with Contact Cooling ........................................................................... 160
Figure 7.1 Real Time PCR Machine Optical Design Schematics ................................................................ 164

xix
Figure 7.2 Optical Design Schematics for POC or single reaction vessel Instruments .............................. 166
Figure 7.3 Example Fluorescence detection systems ................................................................................ 167
Figure 7.4 Designs with sandwich designs ................................................................................................ 168
Figure 7.5 In Plane Excitation Designs ...................................................................................................... 169
Figure 7.6 In plane and separate directions for excitation and emission based designs. (a). Uses planar
micro lenses[6] (b). Microfluorimeter with integrated prisms [7]. (c) Gene-Z system [8] ....................... 170
Figure 7.7 Optical Design Concept ............................................................................................................ 172
Figure 7.8 Extension for Multiple chambers ............................................................................................. 173
Figure 7.9 Cell Phone qPCR accessory ....................................................................................................... 174
Figure 7.10 Design Process of Illumination System ................................................................................... 175
Figure 7.11 Angle of excitation rays in chamber (with surface) vs the angle in polymer (normal) .......... 176
Figure 7.12 Distribution of Angles of Rays in water for a uniform input angular distribution ................. 177
Figure 7.13 Light Escape due to Chamber Edge ........................................................................................ 179
Figure 7.14 Exit Angle in Polymer after passing edge for different chamber edge angles. ...................... 180
Figure 7.15 Cut-off Angle below which rays will escape ........................................................................... 180
Figure 7.16 Simulation Setup for Excitation. (a) Shows a rendered diagram. (b) Setup with preview rays
.................................................................................................................................................................. 183
Figure 7.17 Excitation Ray Traces ............................................................................................................. 184
Figure 7.18 Illuminance Display for Light Guide. (a) Inlet Illuminance. (b). Outlet illuminance display ... 185
Figure 7.19 Illuminance Charts. (a) Illuminance at top detector. (b) Illuminance at bottom of chamber 186
Figure 7.20 Stray light as a function of distance from Cartridge Top ....................................................... 187
Figure 7.21 Illuminance at Detector (3mm from top of cartridge) ........................................................... 188
Figure 7.22 Total power incident at detector vs distance from top of cartridge ...................................... 189
Figure 7.23 Detectors on Top and Side ..................................................................................................... 189
Figure 7.24 Optical Bench Setup ............................................................................................................... 190
Figure 7.25 Melt Curve and Derivative for STD Assay ............................................................................... 191
Figure 7.26 Amplification Curve in Cartridge ............................................................................................ 192
Figure 9.1 Sample Preparation Device Concept. (a) Translational Configuration. (b) Rotational
Configuration. ........................................................................................................................................... 210
Figure 9.2 Multiple Functional Elements .................................................................................................. 211
Figure 9.3 Filtration of Blood to Retain Plasma ........................................................................................ 214
Figure 9.4 3D printed design implementation .......................................................................................... 216

xx
Figure 9.5 Design with Pipette tips ........................................................................................................... 217
Figure 9.6 Luer Lock based connections ................................................................................................... 217
Figure 9.7 Injection Molded Cartridge ...................................................................................................... 218
Figure 9.8 Seal using BackUp Ring ............................................................................................................ 219
Figure 9.9 Seal Design FEA. (a) Geometry (b). Moving Rod deformation. (c) Contact status .................. 220
Figure 9.10 Automation Concept .............................................................................................................. 221
Figure 10.1 Block Diagram ........................................................................................................................ 233

1
1 Burden of Disease and Importance of POC Diagnostics
Introduction
In this section we will establish the importance of POC (point of care) diagnostics in healthcare and the
merits of PCR based pathogen and biomarker detection. First, we will provide an overview of the burden
of disease in the world and then we will show the expected impact opportunity of diagnostic
technologies, especially focusing on the comparison between developing world and low income regions.
‘Appropriate’ diagnostics technologies have the potential to revolutionize healthcare in developing
world immediately and in developed world eventually especially for infectious diseases. Molecular
diagnostics (MDx) is also becoming very important in diagnostics and cure of communicable diseases
such as cancer and cardiovascular disease. Everybody in the world will eventually die and nothing in the
world can prevent this. It is estimated that 107 Billion have ever lived on Earth i.e., about 15 dead
people for each living person at the present time. However, the cause of death varies among humans.
The average lifespans also varies in different regions, and the prevalence of disease varies widely as do
the average income levels. Most of these deaths are due to diseases of various kinds. Clearly, the impact
of disease on human population is large, and while everyone will eventually die, diseases clearly lead to
lower quality of life and productivity.
Burden of Disease
To develop a quantifiable metric describing the effect of diseases, the WHO has defined DALYs
(Disability-Adjusted Life Year) [1] [2] [3]as a metric. DALYs are a measure of ‘Burden of Disease’. In
calculation of DALY, YLL and YLD (defined below), an ideal life expectancy is assumed and the years are
counted if mortality or morbidity occurs before that ideal age. According to the WHO, the ideal case is
that the entire population lives to an advanced expected age without death or disability due to disease.

2
The same life expectancy is assumed for all populations - irrespective of race or geography. This life
expectancy from the GBD Study 2010 was assumed to be 86 years [2], and only age and sex are
considered in these calculations. The disability weights (DW) are also the same for all populations.
The present estimated life expectancy of the global population in 2011 was 70 years, and the key
metrics in relation to the burden of disease are defined in Table 1.1.
Table 1.1 Metrics to measure burden of disease
Metric Calculation
DALY : Disability-Adjusted Life Years DALY = YLL + YLD
YLL : Years of Life Lost
due to mortality
YLL= N x L N = number of deaths
L = standard life expectancy at age of
death in years
YLD : Years Lost due to disability
due to morbidity
YLD = P x DW P = number of prevalent cases
DW = disability weight
The disease ‘burden’ groups the ‘causes’ into the following categories.
• Communicable, maternal, perinatal and nutritional conditions
• Non-communicable diseases
• Injuries
Interestingly, problems caused to health by injuries are also included in the disease burden as injuries
can cause death and disabilities and indeed burden the healthcare system. Here, we separate out
communicable diseases (or infections) from the first group since these relate directly (in terms of
immediate application) to our project. Communicable diseases are caused by pathogens, but it should
be noted that many causes are interrelated. For example, nutritional conditions can compromise
immune response, which in turn render a person more vulnerable to infections.
The actual number of infectious diseases is large. A comprehensive list can be found in ‘International
Classification of Diseases (ICD) 10[4] published by WHO (World Health Organization). Some of the most
important infections categorized in the WHO database include Tuberculosis, STDs excluding HIV
(Syphilis, Chlamydia, Gonorrhoea, Trichomoniasis, Other STDs), HIV/AIDS, Diarrhoeal diseases,
Childhood-cluster diseases (Whooping cough, Diphtheria, Measles, Tetanus), Meningitis, Encephalitis,

3
Acute hepatitis B, Acute hepatitis C, Parasitic and vector diseases( Malaria, Trypanosomiasis, Chagas
disease, Schistosomiasis, Leishmaniasis, Lymphatic filariasis, Onchocerciasis, Leprosy, Dengue,
Trachoma, Rabies), Intestinal nematode infections( Ascariasis, Trichuriasis, Hookworm disease), Other
infectious diseases, Respiratory infections( Lower respiratory infections, Upper respiratory infections,
Otitis media, Maternal conditions and Neonatal sepsis and infections.
1.2.1 Global Burden of Disease Project – a super human effort
To estimate the global burden of disease, a massive effort was made [5] [2] in the form of the Global
Burden of Disease Project 2010 (GBD 2010). Data was collected for 291 diseases and injuries in 21
regions and for 20 age groups. 67 risk factors were also considered [6], and a large number of data
sources were used to estimate the disease burden around the globe. The burden of disease is also
strongly correlated with poverty[7]. Key resources to view data for this project are listed below.
Table 1.2 Sources of Data for Global Health
Items Organization Remarks Data Tables, Publications
WHO Data by cause, age, sex, WHO income groups, World Bank regions and UN Millennium Development Goals (MDG) regions
Publications, Analyses Lancet Global Burden of Disease Study 2010
Visualizations, detailed Data, Publications
Institute for Health Metrics and Evaluation (IHME)
Detailed Data by cause, sex, age, country - Search at http://www.healthmetricsandevaluation.org/search-gbd-data
1.2.2 Analysis of GBD 2010 Study
We have analyzed the GDB 2010 study to identify opportunities for the maximum impact of
technological solutions on human healthcare. If each life is assumed to be of equal value, and there are
limited resources, then such a study allows us to focus on some areas which are estimated to have a
bigger impact on health than others. To be concise, we analyze DALYs and deaths due to different
causes and in different regions and age groups. We also select WHO Income groups of our regions for
analysis. The WHO divides the world in Low income, Low Middle Income, High Middle Income and High
Income regions. We take the high income group as a reference for development and compare against it
to find causes and categories in which there are large gaps that can be filled.

4
We use two major groups of causes for comparison. These are ‘infections or infectious diseases’ and
‘noncommunicable diseases’. The leading causes of DALYs in the world are shown Table 1.3 whereas the
major causes of death are summarized in Table 1.4.
2011 Rank Broad Cause DALYs
(000s) %
DALYs DALYs per 100,000
population
1 Infectious diseases (incl. respiratory infections) 624141 22.7 8996 2 Cardiovascular diseases 378875 13.8 5461 3 Injuries 296836 10.8 4278 4 Neonatal conditions 231581 8.4 3338 5 Cancers 223539 8.1 3222 6 Mental and behavioral disorders 198370 7.2 2859 7 Respiratory diseases 134246 4.9 1935 8 Neurological and sense organ conditions 128613 4.7 1854 9 Musculoskeletal diseases 108401 4.0 1562
10 Endocrine, blood, immune disorders, diabetes mellitus 88211 3.2 1271 Table 1.3 Top ten leading causes of DALYs in the World
2011 Rank Broad Causes Deaths
(000s) %
deaths Deaths per
100,000 population
1 Cardiovascular diseases 16586 30.4 239 2 Infectious diseases (incl. respiratory infections) 10066 18.4 145 3 Cancers 7870 14.4 113 4 Injuries 4971 9.1 72 5 Respiratory diseases 3881 7.1 56 6 Neonatal conditions 2420 4.4 35 7 Digestive diseases 2180 4.0 31 8 Endocrine, blood, immune disorders, diabetes mellitus 1901 3.5 27 9 Neurological and sense organ conditions 1351 2.5 19
10 Genitourinary diseases 1107 2.0 16 Table 1.4 Top ten leading causes of deaths in the World
Cardiovascular diseases now cause more deaths then infectious diseases, but infectious diseases are the
leading cause of DALYs globally. The DALYs and deaths as per income regions are depicted in Figure 1.1
and Figure 1.2. We note that as the income increases, the ratio of infectious to non-communicable
5
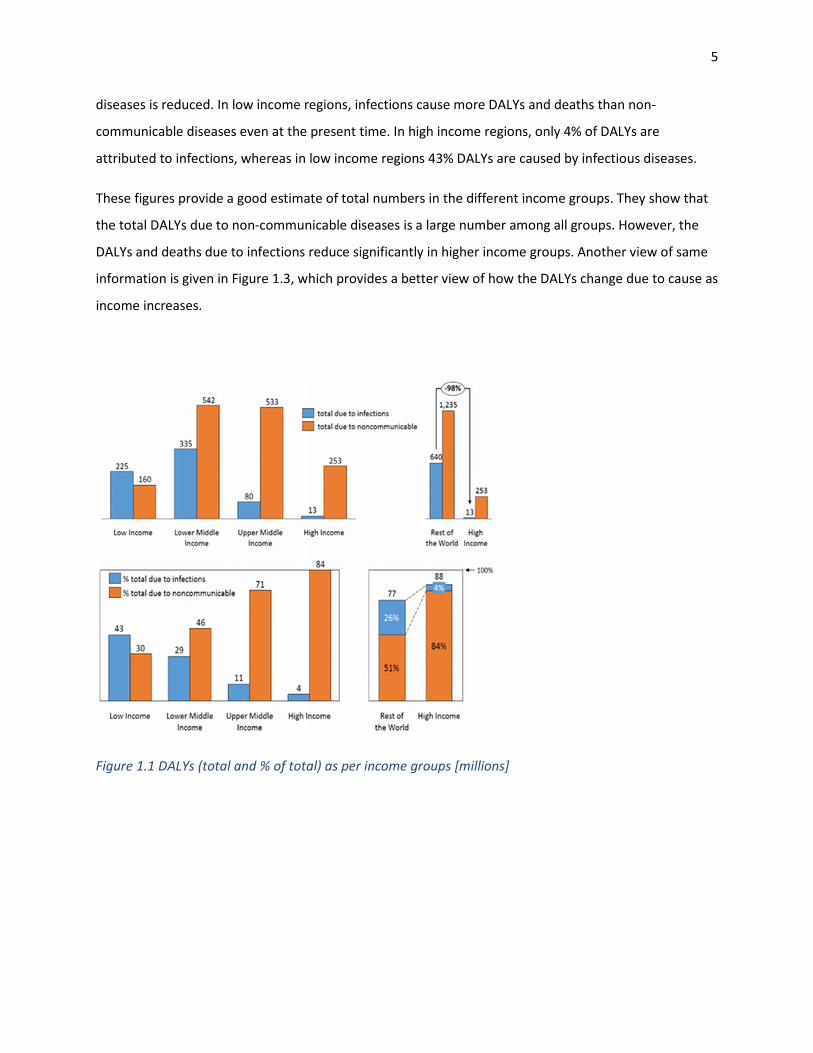
diseases is reduced. In low income regions, infections cause more DALYs and deaths than non-
communicable diseases even at the present time. In high income regions, only 4% of DALYs are
attributed to infections, whereas in low income regions 43% DALYs are caused by infectious diseases.
These figures provide a good estimate of total numbers in the different income groups. They show that
the total DALYs due to non-communicable diseases is a large number among all groups. However, the
DALYs and deaths due to infections reduce significantly in higher income groups. Another view of same
information is given in Figure 1.3, which provides a better view of how the DALYs change due to cause as
income increases.
Figure 1.1 DALYs (total and % of total) as per income groups [millions]

6
Figure 1.2 Deaths (total and % of total) as per income groups [millions]

7
DALYs
Deaths
Figure 1.3 % total of DALYs and deaths as per income regions
DALYs and deaths normalized by population are given in Figure 1.4.

8
Figure 1.4 DALYs and deaths as per income group [per 1000]
Surprisingly, the DALYs due to noncommunicable diseases does not change much among all income
groups! In fact the number of deaths due to noncommunicable diseases increases with income.
However there is a marked decrease in both DALYs and deaths due to infectious diseases.

9
Although the ratio between DALYs caused by non-communicable diseases to DALYs caused by infections
is becoming larger globally, there is a large variation of that ratio in different regions and changes
significantly when going from low to high income regions.
Not surprisingly, people live longer in high income regions than in lower income regions. The population
distribution is depicted in Figure 1.5. We notice that, for lower and lower middle income groups, the
population normalized by total in each group reduces as age increase (implying more young people)
while the opposite is true in high middle and high income groups. In the >70 age category, 35 percent of
these people live in high income regions while only 5% live in low income regions. This shows the
importance of careful analysis of the data. Above 70 year-old non-communicable diseases are very likely
to be related to aging.
Figure 1.5 Population as per income regions and age groups

10
We thus establish that the variation in burden of infectious diseases is much greater than that of non-
communicable disease. More importantly, we find that the infectious disease burden reduces with
income level. This suggests that there is a proven and available methods for reducing the burden of
infectious diseases that are available in high income regions and not in lower income settings.
We now focus attention to infectious diseases only. Figure 1.6 shows total and percent total DALYs and
deaths within different income regions. We also compare high income (our reference) and rest of the
world.
DALYs
Deaths
Figure 1.6 Total and % Total DALYs and Deaths due to infections as per income groups

11
The % total plots show a monotonic decrease in both DALYs and deaths as income levels increase. Also,
we note the huge difference in both totals and % totals between high income regions and rest of the
world. Next, we determine how the disease burden due to infections is distributed by age groups and
income level. DALYs and deaths by income and age groups are depicted in Figure 1.7 and Figure 1.8
respectively. Totals and population normalized data are shown.
Figure 1.7 DALYs by income levels and age groups

12
Figure 1.8 Deaths by income level and age group
These figures show that majority of DALYs and deaths occur in the age group of 0-5 year-old children,
with a major share from lower income groups. The high income group shows 98% and 99% lower DALY
and deaths in such children than the low income group. More children per 1000 under five years of age
die than the people above 70 in low and lower middle income groups. We can specifically characterize
the effect of top infectious diseases in different income groups, and DALYs and deaths caused by top
infectious diseases are depicted in Figure 1.9 and Figure 1.10.

13
Figure 1.9 DALYs due to top infectious diseases by income region

14
Figure 1.10 Deaths caused by top infectious diseases by income region
HIV/AIDS is one of dominant causes in higher middle income environments, while respiratory infections
are major cause for high income groups in addition to low income groups. In all regions, respiratory
infections are the major cause of DALYs and deaths. Moreover, diarrhea kills 2,195 children every day—
more than AIDS, malaria, and measles combined [8].
Infectious vs noncommunicable diseases
If we use the high income region’s healthcare as a reference of what is technically possible, then it is
clear that the largest opportunity for technological impact on overall human health is in infectious
diseases and not in non-communicable diseases, as non-communicable diseases are typically harder to
prevent or cure than the infectious diseases.

15
The major non-communicable diseases are Cardiovascular diseases, Respiratory diseases, Malignant
neoplasms, Digestive diseases, Musculoskeletal diseases, Mental and behavioral disorders, Congenital
anomalies, Genitourinary diseases, Neurological conditions and Diabetes mellitus. The total and % total
DALYs and Deaths caused by such non-communicable diseases are depicted in Figure 1.11. The DALYs
for non-communicable diseases in high income region are much larger than in other regions. This is
partly due to more expense on healthcare, which allows people with certain conditions to live longer.
Note that although total DALYs are higher in high income regions, the death rates are lower. Thus, more
people are living with disability in high income regions. It also shows that even high income regions have
not been able to reduce DALYs in these kinds of diseases like in the case of infectious diseases.
The causes of many top non-communicable diseases, such as cancers and diabetes, are not exactly
known. There are various risk factors associated with, for example, cardiovascular disease, but the onset
of disease occurs statistically with age. Various non-communicable diseases are distributed towards
higher ages and thus may be imminent. In contrast, many communicable diseases are preventable. One
can say that non-communicable diseases do not affect other populations the way communicable
diseases do. For example, a heat patient cannot infect another person, and the disease is more localized
to each individual.
From reference [9] we quote “However, all of the most common causes of NCD death—heart disease,
cancer, stroke, chronic obstructive pulmonary disease (COPD), and diabetes— are linked to unhealthy
behaviors such as tobacco use, physical inactivity, overconsumption of alcohol, and diets that are low in
fruits and vegetables and high in fats”. Therefore NCDs require social and behavioral changes in addition
to technology[10]. The importance of knowing disease presence is very important for both types of
diseases. Various cancers, if diagnosed early can be treated. However, if non-communicable diseases are
not diagnosed in time the damage occurs to only the patient. In case of communicable diseases,
knowing the disease can prevent its spread by taking precautions even for diseases that don’t have a
cure (e.g. HIV). Both communicable and non-communicable diseases can stay in body for long times
without much symptoms but the damage potential of communicable diseases is high because even in
this state, these can be transmitted to other people.
Many of the non-communicable diseases are also much more difficult to cure and treat. For example,
cardiovascular diseases might require surgery, which is much more involved than providing vaccination
or medication in case of infectious diseases. Surprisingly, infectious disease which could be cured by a
pill might kill a person faster than cardiovascular diseases if left untreated. Except for some diseases like

16
HIV, many infectious diseases are inexpensive to treat if the disease is known in time, and it is much
easier to provide a drug than perform surgery. However, for some communicable diseases such as
Hepatitis in advanced stage, liver transplants may be required which is a very involved operation. Even
then, many of the leading infectious diseases, such as Malaria, TB and others, are relatively easy to treat.
The resources needed to cure, treat and manage non-communicable diseases are much more than for
most infections. This is the reason that infections have much less burden in high income countries. Even
with resources, non-communicable diseases remain a big problem. Thus, the “low-hanging fruit” is to
reduce global disease burden by reducing infectious disease burden in in low income areas, as the
resources required for this cause should be much lower than treatment of non-communicable diseases.
Figure 1.11 DALYs (millions) and Deaths (thousands) due to noncommunicable diseases
Importance of diagnostics
Now that we have identified the possibility of making an impact by reducing DALYs and deaths due to
infectious diseases, we should consider various ways to achieve this goal. Technologies which can help
developing world healthcare have been considered before [11], and diagnostics was ranked as the

17
Figure 1.12 DALYs which can be saved with appropriate diagnostics
number one biotechnology to have an impact – even higher than vaccine development. The top ten
technology choices are listed in [11].
Table 1.5 Top ten biotechnologies for developing world
Diagnosing disease has benefits of easier treatment at earlier stage, and can limit the spread of disease
with a significant impact on disease burden. Various organizations, notably BMGF (Bill and Melinda
Gates Foundation), have therefore placed an emphasis on the development of technologies for
diagnostics in low resource settings. In a series of papers [12] [13] [14] [15] [16] [17] [18], they have
estimated the massive impact of improved diagnostics in reducing the burden of infectious diseases
especially targeted towards developing world. Another estimate for the role of improved diagnostics in
given in [19] by Rand Corporation.
Appropriate diagnostics can save millions of DALYs. Figure 1.12 shows an estimate of DALYs which can
be saved by diagnostics for few diseases[20].

18
Other benefits of Dx at POC
There are many other benefits of diagnosing disease with confidence. Even ruling out certain candidate
diseases is of great advantage, as appropriate diagnostics can save a large number of unnecessary
resources spent on inappropriate treatment [21], which can also lead to antibiotic resistance
worldwide. Figure 1.13 shows unnecessary treatments in case of Pneumonia in the developing world.
Figure 1.13 Unnecessary Treatments
Antimicrobial resistance is now declared as a serious threat to public health by WHO[22]. A global report
has been published recently in this regard [23].
Diagnosing at the right time has associated benefits in terms of economics – as many of these diseases
are a result as well as cause of poverty. Democratizing healthcare therefore has many social, cultural
and emotional benefits [24].
Importance of Nucleic Acid Testing and qPCR
Molecular diagnostics is a key segment of the diagnostic technology and is the technology which can
have the biggest impact [11]. In this review of commercialization of microfluidic point of care devices
[25], major technologies are compared for diagnostics. POC diagnostics from a drop of blood has been
reviewed recently [26]. Point of care diagnostics technologies are covered in various papers [27-30].

19
Molecular diagnostics is a key segment of the diagnostic technology and is the technology which can
have the largest impact [11]. In a review of commercialization of microfluidic point of care devices [25],
major technologies for diagnostics are compared. Point of Care POC diagnostics from a drop of blood
has been reviewed recently [26] and technologies are covered in various papers [27-30].
Diagnostics for detection of infectious disease is typically performed via bacterial or viral culture,
Immunoassays and PCR bases assays. PCR based methods typically detect the RNA or DNA signatures of
the pathogen. They can identify specific sequence variations and therefore the exact strain causing a
disease and are specific and most sensitive. PCR based methods, especially quantitative PCR (qPCR),
provide quantitative information which is useful in knowing the bacterial or viral load or to monitor
therapy effect[31]. Another advantage of Nucleic acid tests is the longer life time of DNA. If samples are
being collected to be transported to another place for running these tests, the lifetime of biomolecules
becomes important. Typically, proteins degrade quickly and many immunoassays are not feasible on
transported samples. However, nucleic acids can survive well, even on paper and paraffin samples. In
fact, tissue samples can be transported and analyzed at another location. Due to its sensitivity, PCR can
ideally detect a single nucleic acid molecule. This is very useful in early detection of disease or for
screening. At the present time, PCR based methods are the gold standard for molecular diagnostics of
infectious diseases and are the tests which one would ideally like to have.
Why Automation is Necessary
Automation is necessary in both developing and developed world. For the developing world, top reasons
for automation including the shortage of trained manpower, Human error and chances of corruption,
whereas in the developed world, a different set of limitations prevails. Typically, a shortage of
physicians, a high cost of labor, human error, and making available relatively complex tests at POC (or
pharmacy level) which need CLIA/FDA approval provide advantages for automated systems.
Need for New Technologies and Products
Products designed for the developed world or focused on developed world markets are not necessarily
the best diagnostic tools for the developing world. Mature developed world medical instruments need
to conform to complex regulatory guidelines, resulting from bureaucratic limitations and are focused on
meeting reimbursement strategies that do not apply within developing world settings, where
transportation, logistics and infrastructure are lacking. Many design options cannot be used in the

20
developing world, as complex instruments feasible for developed world laboratory applications might
not meet the harsh environmental conditions encountered in the developing world. Conversely, designs
rejected for developed world can be used in developing world. For example, there is no CLIA waived PCR
test in USA to be used in clinics as commercial and political considerations presently do not favor the re-
adjustment of tasks between physicians and registered nurses in diagnostic settings.
Diagnostics in the developing world clearly demands development of robust instruments that can
survive harsh environment of low resource settings. However, unless a product is developed ‘solely’ for
the developing world, it may not have much chance to make a major impact there. An entity producing
and selling in the developing world will have much better understanding of the market. In this case
incentives are also tied to the targeted market instead of using that market only as a stepping stone
with little if any real interest to support a product in long term. More funding should also be dedicated
for diagnostics technology. Figure 1.14 Money spent for development of technologies, and shows the
distribution of funding for some major infectious diseases.
Figure 1.14 Money spent for development of technologies
Problems with Typical Commercialization
I believe that this thesis provides a very promising approach to low cost technology which can allow
availability of high quality diagnostic in every part of the world. However, I learnt that the business
models and practices are also very important to keep the cost low and availability high.
21
The usual approaches to commercialization will increase the cost and prevent spread of the technology
due to commercial interests of some individuals. Owing to personal experience, I found various potential
problems. Some executives think developing world as very low profit margin and hence not of sufficient
interest for investors. Consultants in business planning have various problems with making costs lower.
They mention that ministries of different countries are in contact and making cost low in one can make
it difficult to sell for high cost in a richer country. Therefore, if a company with such executives has rights
to such low cost technology for global operations than there can be serious problems. The typical
business thinking will not like cost in even most poor countries to go too low. Even worse is that the
company would actually not want to introduce products in such areas since they are both low margin
AND can cause problems for charging high profits in other regions. Many of the executives are actually
interested in getting acquired more than anything and operations in poor countries at low cost can
cause problems in their actual goals.
Availability and Cost of Medicine
Typically, medicine is not expensive by nature. Many infectious diseases can be treated by drugs
available at low cost. Medicine is becoming available for more infectious diseases such as HCV.
However, new drugs can be very expensive. As a recent example, the Hepatitis pills Sovaldi from Gilead
Sciences could cure Hepatitis in tens of millions of people, yet this drug is extremely expensive right
now. It is very surprising to compare the expected cost of a drug that can be produced by a generic
manufacturer at $1 per day for a patient to the price demanded by Sovaldi, which is $1000 per day. This
constitutes a one hundred thousand percent difference in price versus a generic drug price. We can only
hope that, eventually, generic drug manufacturers will find a way to reduce medication costs for
developing world. There already have been very public international confrontations over pharmaceutical
pricing in the case of HIV. Even with lower cost medicine, however, the diagnostics and screening is of
paramount importance, and early detection can increase the effect of available medicines.
Accuracy of Disease burden Studies Unfortunately, the studies to estimate disease burden seem to underestimate effects of disease. There
are regions where epidemiology is not known. Very poor places have less reporting for diseases, and a

22
very recent study estimated the cases of new TB cases in children to be double than what was estimated
earlier[32].
Expected Impact of POC Diagnostics The real impact of our technology, if properly implemented, can be much greater than what is
estimated. If a sample to answer qPCR instrument can be developed so that it costs less than $300, then
many individual physicians can and will purchase it. Accurate diagnostics adds value to clinical practice.
If such an instrument can be placed in every village and is as easy to use as a commercial consumer
electronics instrument, then the impact can be even greater. Functional prototypes will enable
pathologists all over the world to be able to identify many additional uses and add many more places for
this technology to be clinically applied. The associated software can be used for many other purposes
including patient registration, epidemiology, education and tracking of patients.
Economic growth is not enough to make the impact
Economic growth of a region or country is important for good health. However, within low-income and
middle-income countries, macroeconomic growth is not sufficient to make an impact. It has been shown
in large study that economic growth has a quantitatively weak impact on early childhood under-
nutrition [33]. Thus efforts have to be made to really target the populations which suffer due to non-
uniform distribution of wealth and resources. Intertwined global factors have to be addressed to deliver
good health to most vulnerable sectors of society[34].
Political Domains contributing to health inequity within
populations
Following are the political domains suggested that contribute to inequity[34]. According to authors, the
arrangements to improve health are termed inherently political and for power and elites[35].
a. Finance b. Intellectual property c. Trade and investment treaties d. Food e. Corporate activity

23
f. Migration g. Armed conflict
24
2 Target Product Profiles Introduction
Now that we have identified the importance and possible impact of POC Dx, we have to define the
requirements for our product. This is a complex job due to various factors[36]. First, the medical market
is heavily regulated and it is not as easy to introduce new ideas and products into this market as in other
consumer fields. This has caused a bias or predisposed beliefs about new technologies and methods.
Many professional pathologists cannot believe that qPCR machines can cost less than $500, as we claim.
There are other forces which want to maintain that misconception for their own commercial
interests[37]. It is therefore necessary to challenge many of these misconceptions and to develop new
engineering solutions through experience and intuition in determining what is possible and what should
and can be done.
The US market is well understood and POC tests are targeted towards physician offices or at most to be
placed in pharmacies. The statistics of such places are shown in Table 2.1. Although the number of
pharmacies are much fewer than those of physician offices, the number of tests (and the business
revenue) from these places can be significant due to customer base, and supermarket pharmacies are
emerging in an attempt to cater to the customer needs for a one-stop shopping experience. However,
there is no true portable rugged POC place in sight for companies developing molecular pathology
instruments targeting this market. Moreover, the need for a skilled laboratory technician to prepare
samples for such tests precludes the state-of-the-art instruments from being located anywhere except
for centralized health centers and larger laboratories.

25
Type Of Laboratory Number Percent Ambulance 3,894 1.59% Ambulatory Surgery Center 5,517 2.25% Ancillary Test Site 3,155 1.29% Assisted Living Facility 2,551 1.04% Blood Banks 449 0.18% Community Clinic 6,475 2.65% Comprehensive Outpatient Rehab 501 0.20% End Stage Renal Disease Dialysis 5,654 2.31% Federally Qualified Health Center 1,718 0.70% Health Fair 663 0.27% Health Maintenance Organization 654 0.27% Home Health Agency 14,648 5.99% Hospice 3,188 1.30% Hospital 8,914 3.64% Independent 5,856 2.39% Industrial 1,786 0.73% Insurance 49 0.02% Intermediate Care Facility for Individuals with Intellectual Disabilities
1,282 0.52%
Mobile Laboratory 1,503 0.61% Pharmacy 9,740 3.98% Physician Office 120,399 49.33% Other Practitioner 3,738 1.53% Prison 404 0.17% Public Health Laboratory 678 0.28% Rural Health Clinic 1,774 0.73% School/Student Health Service 2,098 0.86% Skilled Nursing/Nursing Facility 14,949 6.11% Tissue Bank/Repositories 61 0.02% Other 22,266 9.10% Total 244,564 100% Table 2.1 Laboratory Types in US
The use of such instruments in the developing world is even more complex. In particular, the extreme
variety of applications, diseases[38], placements, users[39], operators, geographical places and
environments in which these instruments are supposed to be used[40] provides us with a formidable
challenge. Epidemiology and other basic health facts are not known for large areas, and the placement
of such instruments is envisaged to be at various levels as given in Figure 2.1. However, there are many
other places where such systems are needed. For example, it should be possible to carry this system
from home to home (or cottage to cottage) in many parts of the world, where the infection risk is high
and travel difficult for patients. There are areas and diseases where this will be very beneficial. An

26
example is Leishmania in poor populations of India. An application like this is termed ‘Level 0’ or ‘Under
the Tree’ health level by Gates Foundation.
Figure 2.1 Health Level Systems [41]
It is suggested that a separate TPP might be required at the different levels of healthcare [40] depicted
in Figure 2.2. The problem with this approach is linked to the traditional belief that complex nucleic acid
amplification tests such as qPCR are not feasible at lower healthcare levels. Separate TPPs also imply
that different healthcare levels need different diagnostic procedures and techniques and that high
quality test may be screened out from the start to be used at the lower healthcare levels. For example,
in Figure 2.2 qPCR based sample to answer tests are shown only in hospitals. This opinion is largely
biased on past experience and technology available now. We must acknowledge that the best
diagnostics tests are indeed needed at lowest health levels and this is what is actually required.
Acknowledgement of this fact should be part of TPP even if TPP calls for lower standards due to
development time and current technology. This will allow the developers and researchers not to loose
sight of the ideal end goal.

27
Figure 2.2 Various TPPs for Different Health Care Levels
Segregating the TPPs too much also makes a disruptive technology less applicable to many levels. It is
our view that the lowest health level should be targeted from early on. The technology and instruments
for such conditions [42] would have a high chance to be modified for upper health levels. Upper health
levels typically would require more throughput but this can be achieved if the system is designed to be
scalable by adding more random access modules. Developing for most health levels will also save
reworks, modifications and duplication of effort. It should be much more economical in the long run.
Existing TPPs
With a foresight to challenge and add to any of the existing TPPs – their study is indeed a very useful
starting point and reference. These have been prepared by people experienced in the field and after
reviews by professional. Some have been updating for a long time.
The characteristics of ideal tests are often referred to as defined by WHO (World Health Organization).
The acronym ASSURED [43] is well known. In fact this is a very concise set of requirements as give in
Error! Not a valid bookmark self-reference..

28
Table 2.2 WHO ASSURED for High Impact Diagnostics
ASSURED
Affordable by those at risk of infection
Sensitive ( few false-negative results)
Specific (few false-positive results)
User-friendly (simple to perform by persons with minimal training)
Rapid treatment at the first visit and robust use without the need for special reagents
Equipment free ( no large electricity-dependent instrument; portable handheld battery-operated
devices are acceptable)
Delivered to those who need it
The Gates Foundation also performed a major effort to outline specifications of the desired diagnostic
technology [42] and have funded various groups for POC Diagnostics over the past decade. The current
TPP is now targeted to a level 1 system (community health clinics) with higher throughput. Initially the
target seemed to be Level 0. The TPP is changing with time and is dependent on many parameters in
addition to technology. Patents and intellectual property are also factors. PCR is attractive today since
patents covering this technology are expiring soon (compared to isothermal amplification techniques).
This TPP is unique in the sense that it’s targeting a universal diagnostic platform (which they call PanDx).
Gates Foundation envisages this as a platform to which assays can be added by multiple parties in
future. As the cost of the envisioned platform is rather high ($5000-$15,000) the platform should also
support different techniques such as cell counting and ELISA in addition to PCR. The idea is that by
providing a large base of such instruments and engaging diagnostic instrument companies, there will be
enough interest in developing and producing cartridges for different assays. A concept model is given in
Figure 2.3.
Having a universal instrument for all cartridges (current and future) is technically very difficult to
accomplish. Standardized interfaces between cartridge and instrument are tricky to define due to
different domains (optical, mechanical, electrochemical, pneumatic and thermal) involved, as shown in
Figure 2.5. As a result of the complex mechanical design, the large number of different elements and
features, such an approach can severely limit innovation in cartridge design. From our experience, some
innovations require tightly coupled instrument and cartridge functionality which is not possible when

29
many interfaces are fixed. For example if the optics in fixed in the instrument, new and novel optical
concepts may become incompatible with the system.
Figure 2.3 PanDx Concept Model
Figure 2.4 Concept developed by Stratos and Halteres for Gates Foundation

30
Figure 2.5 Instrument-Cartridge Interface
Fortunately, disruptive simple ideas can provide an alternative and modify the TPP. As a result of earlier
experience [44], the Gates Foundation did not invite proposals using PCR amplification since thermal
cycling is typically very power hungry and slow. We proposed a simple solution to the problem by using
our electromechanical relay approach. A description of the requirements for diagnostic instruments
deployable in the developing world, which includes our work as an example, is covered by [20]. A recent
review suggesting additional criteria for point of care diagnostic tests for developing world is given in
[45]. Further requirements are also discussed in literature[46]. The suggested revised criteria for ideal
POC test in resource limited setting is shown in Table 2.3, and the corresponding paper also lists the
diseases for which POC tests are available, which is a surprisingly small set.
Table 2.3 Suggested revised criteria for an ideal diagnostic point-of-care test in low resource settings
SUGGESTED REVISED CRITERIA FOR AN IDEAL DIAGNOSTIC POINT-OF-CARE TEST IN RESOURCE-
LIMITED SETTINGS
Allows a quick clinical decision
Can be used at the clinical point-of-care by health workers
Affordable (low average cost per test)
Rapid (provides result during a clinic visit or within a reasonable waiting time)
Acceptable test efficacy (likelihood ratio times patient notification rate)

31
Cost effective
Another useful TPP is provided in [41] developed by PATH. This TPP is more focused on level 0. It also
signifies the role of the disease targeted. This TPP is for TB where the idea is to treat as close to the
patient residence as possible. TB spreads by aerosols and only 1-10 organisms are sufficient to cause
infection. If people have to travel long distances, they can infect other passengers along the way. The
nature of transport in developing world is different. Buses can be overloaded and the disease can spread
during travel.
Bio Ventures focuses on point of care diagnostics for differential diagnosis of fever in children[47]. They
have taken a well thought of incentive drive program approach (milestone based prize) to have a
sustainable impact. The TPP is targeting Malaria, Bacterial pneumonia, biomarkers, TB and HIV. This TPP
asks for a multiplex assay for a particular population. TPPs for neglected Tropical diseases is given in
[48]. They consider mapping and surveillance.
Comments
All TPPs specify a completely integrated sample to answer system with minimum chance of human
error. They have different focus on diseases and population groups but a properly designed product can
be very close to satisfy all TPPs.
Another important fact is allowance of more options as a result of not targeting FDA approval. In US Cell
phones most probably not be allowed as a device interface. However, cell phone is the only connectivity
available in some places. Having an alternate way to evaluate products is very attractive and can also
save huge amount which would otherwise be spent on FDA approvals. It’s also very difficult to test for
many global diseases in US due to their non-prevalence. For example, the United States has very small
case numbers of TB, Malaria or Dengue.
In fact, Bio Ventures for Global Health [47] has put clinical studies at the actual usage sites and added CE
approval in the plan. There is no mention of FDA approval. There are, however, a large number of
applications of PCR instruments other than detection of infectious diseases. Our analysis shows that
even subsystems, such as sample preparation and qPCR, are both useful within separate instruments for
many applications. For example there are samples which can be directly analyzed in qPCR instrument
[49] [50] [51] [52], and many applications of sample preparation to purify nucleic acids. With new

32
enzymes, such as heme-resistant enzymes[53] these applications may increase. Below, we list some of
the applications.
• Blood Safety
• Organ donor testing
• Surgical Procedure for removing tumors
• DNA Cloning
• DNA sequencing
• Biomarker detection
• Cancer detection
• Forensics (genetic fingerprinting, Parental testing)
• Biosafety
• Gene expression
• Environmental biology
• Food safety
• Bio-pharma production contamination detection
Hidden Issues
Future applications of the technology and products are also very important to consider. The interface to
medical record systems needs to be covered as well. Although the software development can be
deferred, it would allow a better product to be designed if the final desired interface is know from start.
The requirements for software are covered in a later section in this thesis. The standards for product
ruggedness are also not defined in most instrument TPPs. There are applications of the product in which
it will be subjected to rough use. Examples are severe vibrations during travel on unpaved roads, shocks
during transportation, dropping and rough handling. Some guidance can be obtained from military
standards (Milspec ratings) for vibration and temperature testing.
Caltech Proposal to Gates Foundation
Here, we show the technology to develop point-of-care qPCR systems that address all of the needs for
developing world deployment. Such solutions must include sample preparation systems, covered in
Table 2.4 and qPCR technology, covered in Table 2.5.

33
Quick time-to-answer 15 minutes or less (including qPCR assay)
Simple readout
yes / no / invalid test (embedded software interprets results) optional simple quantitative readout of pathogen load / species typing (determined automatically by the instrument)
Low cost to manufacture less than $120 for the complete POC instrument (w/ qPCR module) less than $1 per disposable assay cartridge (includes reagents)
Excellent sensitivity/specificity within 1% of laboratory qPCR (diagnostic gold standard)
Use by minimally trained personnel
yes, collect finger prick or heel stick blood sample or urine sample and insert cartridge into instrument
Wide operating environment up to 40° C / 100% humidity (45° C possible) Easy storage / transport no refrigeration required for system or assay cartridges No laboratory requirements no need for local reagents, water, nor additional equipment
Detect multiple pathogens /Distinguish pathogens, strains and subtypes
yes, including all the high impact diagnostics (ALRI, HIV/AIDS, TB, diarrhoeal diseases, malaria, 3 STIs) and many others, via blood samples (finger prick or heel stick), urine samples, sputum, or swabs Multiplexing capability to distinguish strains/subtypes within one test Multiwell capability for fast, inexpensive tests in parallel
Compact size < 10 X 10 X 20 cm3 (complete POC instrument, incl. qPCR module) Low weight < 3 kg Low power consumption ~ 100 assays per AA battery Robust design / components more like a Land Rover S1 mobile phone than an XYZCycler
Table 2.4Target Platform Profile (TPP) for a complete POC instrument based on the proposed approach
Quick time-to-answer 15 minutes or less (including qPCR assay)
Simple readout yes / no / invalid test (embedded software interprets results) optional simple quantitative readout of pathogen load / species typing (determined automatically by the instrument)
Low cost to manufacture less than $120 for the complete POC instrument (w/ qPCR module) less than $1 per disposable assay cartridge (includes reagents)
Excellent sensitivity/specificity within 1% of laboratory qPCR (diagnostic gold standard)
Use by minimally trained personnel
yes, collect finger prick or heel stick blood sample or urine sample and insert cartridge into instrument
Wide operating environment up to 40° C / 100% humidity (45° C possible) Easy storage / transport no refrigeration required for system or assay cartridges No laboratory requirements no need for local reagents, water, nor additional equipment
Detect multiple pathogens /Distinguish pathogens, strains and subtypes
yes, including all the high impact diagnostics (ALRI, HIV/AIDS, TB, diarrhoeal diseases, malaria, 3 STIs) and many others, via blood samples (finger prick or heel stick), urine samples, sputum, or swabs Multiplexing capability to distinguish strains/subtypes within one test

34
Multiwell capability for fast, inexpensive tests in parallel Compact size < 10 X 10 X 20 cm3 (complete POC instrument, incl. qPCR module) Low weight < 3 kg Low power consumption ~ 100 assays per AA battery Robust design / components more like a Land Rover S1 mobile phone than an XYZCycler
Table 2.5 Target Platform Profile (TPP) for a complete POC instrument based on the proposed approach
The assays identified at that point at given in Table 2.6.
Infectious Disease Pathogen
Sample Type /
Volume Sensitivity Specificity End-notes Comments
ALRI (viral)
respiratory syncytial virus, influenza viruses, parainfluenza viruses, human metapneumovirus
whole blood (0.1-0.5 mL), nasal swab
95-97% 85-90% i, ii a multiwell strategy is low risk; potential also to multiplex
ALRI (bacterial)
Streptococcus pneumoniae, Haemophilus influenzae
whole blood (0.1-0.5 mL), nasal swab
90-95% 85% iii
HIV/AIDS HIV-1 (+ HIV-2 in West Africa)
plasma or whole blood (0.1-0.5 mL)
90% 90% iv
quantitative from plasma RNA; qualitative from whole blood DNA
Diarrhoeal diseases
C. difficile, G. intestinalis, G. lamblia, C. parvum, E. coli
stool swab >95% >95% v a multiwell strategy is low risk; potential also to multiplex
E. histolytica, E. dispar stool swab >90% >90% vi multiplexing within
one sample reservoir is likely the best strategy Malaria
P. falciparum, P. vivax, P. malariae, P. ovale
whole blood (0.3 mL)
>90% >90% vii
TB M. tuberculosis sputum, stool ~90% 90-100% viii MDR/XDR detection is
critical Sexually Chlamydia swab, >90% >90% ix a multiwell strategy is

35
Transmitted Diseases
trachomatis urine (0.5 mL)
best; multiplexing by wavelength will likely result in loss of sensitivity
Neisseria gonnorrhoeae
Treponema pallidum
x
Trichomonas vaginalis
xi
Hepatitis HCV plasma (0.3 mL) >90% >90%
lower limit of quantification is approximately 50 copies
Table 2.6 Assays of Interest and their parameters from literature
The tables for above mentioned TPPs are copied below from respective references for easy comparison
and reference.

36
Figure 2.6 Bio Ventures TPP

37

38
Figure 2.7 PATH TPP for TB Diagnostics

39
Figure 2.8 TPP for NTDs

40
Table 2.7 TPP for Gates Foundation POC Dx Program
Characteristic Optimal Target Minimal Target
Intended Use
Target Setting • Moderate Infrastructure Settings (e.g., Level
I Health Centers / Community Health Clinics)
• Same
Target User • Staff with minimal technical training
• Staff with some formal healthcare expertise
to understand sample handling requirements,
use of results and similar
• Same
Operating Environment • Large temperature range (5-40C)
• Broad humidity (to 95% non-condensing) and
altitude ranges
• Direct sun light to low light
• Dusty conditions
• Intermittent water and electrical access
• Same
Device Characteristics
Platform
• Modular-based instrument approach with
common user interface for all technologies
• One - three instruments
acceptable so long as they meet
performance and cost targets
• Simple set of user interfaces
Design Considerations • Table top instrument (50 x 75 x 50 cm) or
smaller
• Cartridges containing all required test
reagents; no reagents on instrument
• No requirement for water
• Primary power source is UPS on local 110-
220 AC power with rechargeable battery
backup (>8 hrs testing with <2 hrs recharge)
• Other design approaches that
meet assay performance specs and
throughput requirements will be
considered
• Backup battery capacity sufficient
to complete run(s) in progress (e.g.,
up to 90 min)without loss of result

41
Technologies Employed • Qualitative and quantitative protein (Lateral
Flow and ELISA equivalent)
• Qualitative and quantitative nucleic acid
(PCR or equivalent and isothermal qualitative)
• Quantitative chemistry panels (e.g., routine
enzymes)
• Quantification of cells (e.g., CD4, CBC)
• Qualitative protein (one
technology)
• Qualitative and quantitative
nucleic acid (one technology)
• Same
• Same
Demonstration Menu
and Initial Product
Offering
• HIV Therapy Initiation Panel
• HIV 1/2 rapid serological test
• Quantitative determination of HIV viral load
• Quantitative HIV CD4
• Quantitative Liver and Kidney panels
• Qualitative detection of MTB infection and
determination of resistance to first line Rx
• Quantitative CBC determination
• Qualitative detection of malaria infection,
including species distinction
• Same
Expanded Menu
• Reasonable technical path to full menu
(appendix 1)
• Tiered approach in no more than 3 waves of
release
• Same
Clean Water
Requirements
• None
• Same
Sample Handling

42
Sample types, volume
ranges
• Whole blood (20 μL - 100 μL )
• Dried blood spots (20 μL – 100 μL dried onto
matrix)
• Sputum (1-2 mL)
• Saliva (100-2000 μL)
• Urine (50-1000 μL)
• Stool (20-200mg)
• Whole blood (20 μL - 1 mL)
• Dried blood spots (20 μL – 1 mL
dried onto matrix)
• Sputum (1-2 mL)
• Saliva (100-2000 μL)
• Urine (50-1000 μL)
• Stool (20-200mg)
Sample Prep
• Integrated on cartridge
• Time equal to no less than the difference
between testing time and 1 hour
• No specialized equipment, containment or
skills required
• Simple off-board sample
processing (e.g., concentration or
filtration, especially for urine or stool
samples); included within <5 steps
by operator
• Time equal to no less than the
difference between testing time and
2 hrs.
Stability of Valid
Sample (collection to
test initiation)
• 24 hrs without refrigeration
• 8 hours without refrigeration
Performance and Functionality
Test Performance
• Comparable to equivalent FDA approved (or
other established gold standard products if
FDA approved product does not exist)
• Same

43
Analytical Specificity
• No result altering reactivity with potential
interfering substances
• Minimal detection of non-target
analytes that does not alter clinical
decision
• Minimal result altering reactivity
with potential interfering substances
Reagent Stability
• 24 mos at up to 40°C, 95% humidity from
date of manufacture
• Include shipping stress (48hrs at 50°C)
• No cold chain required
• 12 mos at 40°C, 70% humidity from
date of manufacture
• Include shipping stress (48hrs at
50°C)
• Cold chain permissible until
product is shipped from
manufacturer
Time to Result
• Including sample preparation:
• <30 min for NAT
• <15 min for rapid tests
• <5min for chemistry tests
• Including sample preparation:
• <90 min for NAT
• <30 min for rapid tests
• <10 min for chemistry tests
Throughput (tests per
day)
• 50 tests with reported results in 6 hours per
module, or 250 tests per 6 hours per system
• No stat or batch testing within a module
• Max capacity based on avg throughput of
typical assay methodology mix, not highest
throughput needs of molecular-only tests
• Total combined throughput up to
250 tests per day
• Same
Workflow
• Target ≤ 3 operator interface steps
• Not including sample prep
• Target ≤ 5 operator interface steps
• Same

44
EQA, Process Controls
and Surveillance
Measures
• System satisfies local EQA requirements
• Built-in assay process controls and
instrument surveillance mechanisms
• Only valid results to be reported; but all
results should be stored for failure tracking
• Same
Information and Communications Technology (ICT)
Data and
Communication
• Data will be available locally and remotely
• Must permit entry of patient information as
required by the interpretation algorithm and
allowed locally
• Same
Instrument User
Interface-Hardware
Alphanumeric Touch Screen
• Partially configurable so that assay workflow
can be parameterized (including switching
on/off functions or steps);
• ≤ 5 GUI (graphical user interface) pages
Alphanumeric Keyboard
Barcode Reader Wand
Audible Beeper
LED Status Indicators
• Same
Physical Electronic
Data Communications
Interfaces
• USB (1): Removable Storage/Software
Update
• USB (2): Printer Attachment
• Local Ethernet Port (1)
• Bar Code Wand Port (1)
• Same
Wireless Data
Communication
Interfaces
• Mobile Cellular Network (GSM/GPRS)
• GPRS should be able to use Internet File
Transfer Protocol
• Same but no satellite
communication requirement

45
• M2M Satellite Modem (fallback)
• Local Bluetooth
• RFID Reader
Data Import Internal Bar Code Reader
• Cartridge Label 1D/2D Data
External Wireless/USB
• System software update
• Install new assays process
• Reject disapproved Lots
External Bar Code Wand or RFID reader
• Patient ID
• Same
Data Export Electronic Activity Record & Reports
(wireless/printer); for example:
• Dx Test ID #
• Date & Time Stamp
• Result
• Patient meta data
• Lab ID #
Instrument Operational Status
Instrument Maintenance Codes
QA Information
HL7 Compatible
Compatible w/ Health Information
Systems/DHIS2 Implementation
• Same
Data Storage
• TBD
• TBD
Security/Privacy
• HIPAA compliant (to make it attractive to
developed world integrators)
• Same

46
Distribution, Support and Training
Cold Chain
• None at any point in supply chain or storage
• No cold chain required once kit
leaves manufacturer
Maintenance, Service
and Support
• Instrument / module swap out model
• Maintenance/calibration performed in field
by user without specialized training or tools or
requirement for internet access
• No annual preventative maintenance needed
requiring authorized personnel or specialized
training
• Electronic alert sent to support center if
issues arise
• Mean time to failure of at least 18 mos
• Remainder of instrument will continue to
function if one module (other than control
module) fails
• Same, except:
• Internet or specialized training
might be needed for maintenance or
service
• Use of reference standard tool
provided by manufacturer
• Mean time to failure of at least 12
mos
Training
• < ½ day
• Trained lab technician not required to
operate; can be properly operated by
healthcare worker with minimal training
• < ½ day
• Minimally trained lab technician
required for operation
Biosafety
• No need for biosafety cabinet
• Direct disposal or incineration of
consumables
• Same
Cost Considerations
Cost of Consumables
(COGS at scale)
• <$5 USD per assay, for example:
• <$10 USD per assay

47
• TB identification - <$5
• TB Resistance profile <$5
• Malaria with speciation <$4
• HIV VL <$5
• Chemistries <$3
Cost of Instrument
(COGS at scale)
• <$5,000 USD (base system – one console
plus one advanced processor module
• <$15,000 USD (complex system composed of
one console and up to 5 advanced processor
modules)
• <$20,000 (total cost for all
instruments required to satisfy TPP)
Regulatory Considerations
Regulatory
Requirements
• Manufactured pursuant to GMP, ISO
13485:2003; authorized for use by a member
of the Global Harmonization Task Force (GHTF)
• CLIA waiveable or equivalent
• Same
Additional Points
We added following points for our development.
• Develop systems that can be used at level 0 and also provide a way to combine them for higher
throughout at higher level.
• Allow most sample types at least blood, urine, stool, plasma, swabs, dried blood spots, sputum,
and saliva. Consider tissue, forensic, soil and food related samples.
• Compare well to commercial PCR machines in terms of performance like detection limit.
• Allow all major protocols for sample prep and qPCR e.g., HRM, multiplex, MC so that assays can
be easily ported.
• Develop software concurrently for better feedback on the whole solution.

48
Conclusion
Understanding the requirements is critical to have greater chances of success and scale up after the
product in introduced in the market. It’s not trivial to develop a TPP which will serve such a diverse
need.

49
3 Overview of POC Instruments and Disposables
Introduction
This chapter provides an overview of the final systems which use various innovations of our work. The
details of sub-systems or components are explained in later sections. Here we provide an overall view of
the technology and how things fit together.
There are various technologies which are unconventional. Explaining the final systems which combine
these technologies without first explaining each technology in sufficient detail makes it difficult to
explain the entire system in a concise way. Nevertheless, we have attempted to provide a system level
description of the system in this section. For system designers having expertise in the field it should
provide a good overview. It is recommended to review the individual technologies in following chapters
in case more explanation is desired while reading this section.
Overview of Sample of Answer Technology and Innovations
To build a sample to answer system, various components and technologies must function in harmony. A
high level view of the steps involved in such a system are show in Figure 3.1. The accompanying
innovations are shown in red callout boxes. It is important to keep in mind that a full solution is required
for significant impact. Even for trials and field testing, many components which are typically ignored in
academic research are very important. Software development and ergonomic design are examples of
such components.

50
Figure 3.1 Sample to Answer Steps and Innovations
The technical work areas are shown in Figure 3.2. By its nature, this is a multi-disciplinary effort involving
diverse fields. Various processes which effect the design down the line have to be considered from start.
Large scale production is a feature which is particularly important to consider early in the design. Any
design which does not allow rapid scale up of production can be a serious problem in later stages of the
project.
Sample CollectionSample TransportSample Injection
Sample Processing PCRDetection
&Quantification
InstrumentationElectronics & Mechanics
Software, Health IT connectivity&
Medical Information Infrastructure
Assay Design&
Multiplexing
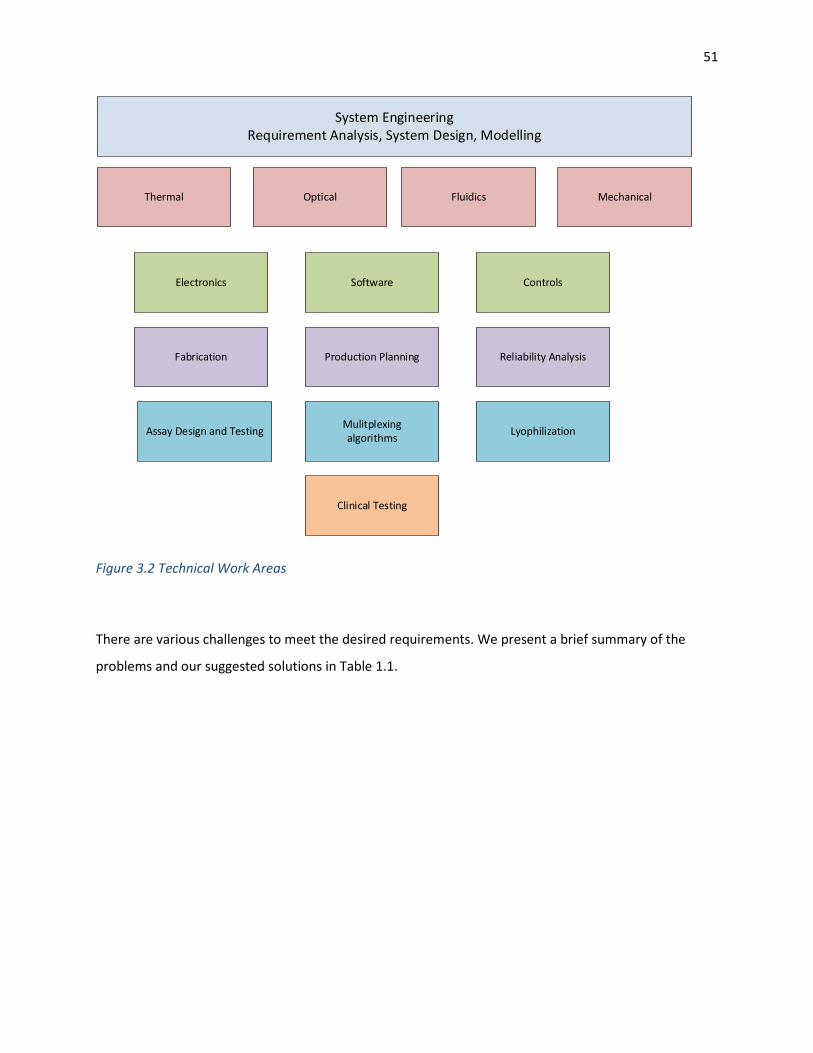
51
Figure 3.2 Technical Work Areas
There are various challenges to meet the desired requirements. We present a brief summary of the
problems and our suggested solutions in Table 1.1.
OpticalThermal
Assay Design and Testing Mulitplexingalgorithms
Electronics Software Controls
Mechanical
System EngineeringRequirement Analysis, System Design, Modelling
Fluidics
Fabrication
Lyophilization
Clinical Testing
Production Planning Reliability Analysis

52
Table 3.1 Challenges and Associated Solutions
Domain Outstanding Problem Solution
Thermal • Power hungry • POC issues
• Dust, moisture • Clogging • Insertion, contact, housing
• Contact cooling • Metal base cartridges
Optical • Lens based optics • Expensive • Ruggedness issues • Alignment • Cartridge alignment • Opto-mechanics
• Expensive filters
• New integrated TIR and light guide design
• Metal base
Sample Preparation
• Valves, pumps, vacuum • Robotics not amenable to POC • Robustness issues • Truly closed system very difficult
Sliding/rotating design for wide variety of samples with high flexibility and multiple samples
Usage • Sample injection • Connectors for POC • Cartridge placement and alignment
Contact cooling Metal base cartridges
Assay Cost • Probe based assays • Expensive • Fragile
• Probe based multicolor • expensive
New technique and algorithms
Multiplexing Complex Optics New optical designs allow low cost multiplexing Simple multi-well designs possible
Instrumentation Expensive, complex, power hungry Innovative and simple but robust and reliable instrumentation
Automation Low performance electronics design World class electronics design
Production Complex and expensive production methods like laser welding, solvent bonding
Low cost well established production method compatibility.
Flexibility and Future Proofing
Most designs don’t work if assay parameters change
Design allows unprecedented flexibility in assay operations and use of current and future assays.

53
The interaction of innovations, problems solved and advantages is given in Figure 3.3.
Metal Polymer Cartridge with integrated Optical
stuructures
Contact Cooling
TIR and Light guide based optical design
Moving element Sample preparation design
Multiplexing and Quantification with single
color
Low cost system – electronics,
communications, interface
THERMAL
OPTICAL
Sample Preparation
Integration
Assay Cost & Robustness
Protability, Size and ease of use
Low energyExtremely robust
FastSystem can be water proof
Low costMisalignment tolerant
Enables lens free designHigh collection efficieny
High performance, Low costFast
Varialbe volumes possibleVery low dead volume
Clogging resitant
Sample to answer disposable is only few injection molded pieces
Enables ~$500 sample to answer qPCR instrument
Robust for use at POC
Allows robust assaysOnly one dye has to be lyophilized
Low cost assays possible
Innovation Problem Solved Advantages over competition
Figure 3.3 Innovations, problems solved and advantages
Product Configuration Concept
Based on these innovations, the design is based on independent modules which can be stacked
together. The sample to answer (s2a) module is a core module which can accept cartridges to run
various assays. Each s2a module can be used as a standalone module as well. We thus have a scalable
solution which can server from Level ‘0’ (no infrastructure) to reference labs. The base module has
elaborate user interface and communication elements. However, even in case of failure of base module,
each s2a module is functional. S2a modules can have multiple interfaces to control and view results.
They can be controlled via base module or mobile devices like cell phones and tablets. A personal
computer can also be used to control them. The s2a module can have limited display and buttons so
that it can still be used independently. The concept is shown in Figure 3.4.

54
Figure 3.4 Health Center System Concept
The s2a module can be taken to remote locations to act as a level ‘0’ module. It can also be used during
travel due to the design of the disposable and the instrument. This can be useful for screening and
diagnosing during travel. We present an example deployment in a village or dispersed community. The
central dispensary or health center can have the few modules stacked with base module which are
being used for screening and regular diagnosis. However, there are cases where the patient should be
diagnosed in his living place. Examples are old, very sick or TB patients who can transmit the disease
during travel. It’s very useful to easily carry the system to the patient. The s2a module can be stacked
with a battery and optional display. Therefore, we don’t need different kinds of systems for different
uses. The example portable system is shown in Figure 3.5.
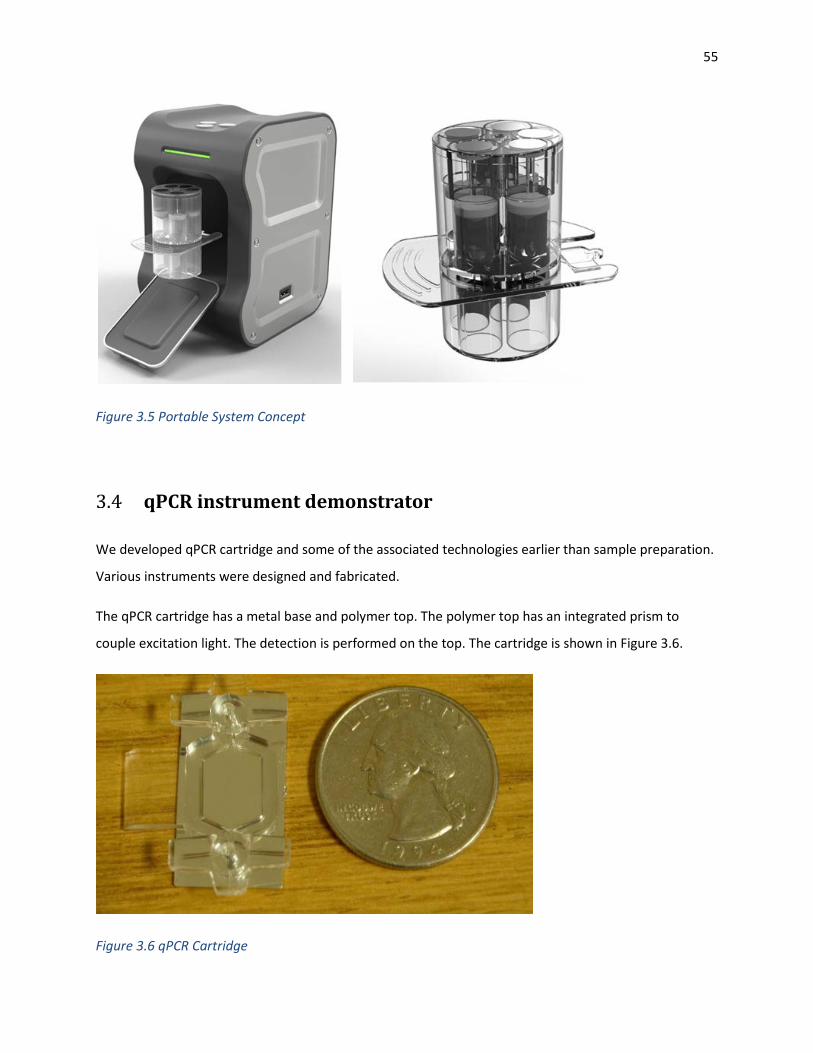
55
Figure 3.5 Portable System Concept
qPCR instrument demonstrator
We developed qPCR cartridge and some of the associated technologies earlier than sample preparation.
Various instruments were designed and fabricated.
The qPCR cartridge has a metal base and polymer top. The polymer top has an integrated prism to
couple excitation light. The detection is performed on the top. The cartridge is shown in Figure 3.6.
Figure 3.6 qPCR Cartridge

56
The housing was largely made using 3D printing. We used Thorlabs cage system brackets and lens tubes
to hold optical components. This is useful as the optical components can be changed and different
optical assemblies can be put in the box without chaining it. The opto-mechanical components from
Thorlabs are already black and have screw threads which help in reduction of stray light. There are also
a variety of detectors and sources which are available to be assembled in this case. We designed various
items to fit in this scheme. We designed circular PCB’s which can hold high brightness LEDs. The light
guide as mounted using laser cut supports which fit into the lens tube system. For detector we designed
PCBs to have one or multiple detectors. Multiple detectors are useful in multicolor real time PCR.
We used two bi-stable solenoids of two types. ERB35 is a bi-stable latching solenoid. This solenoid has a
spring which is useful to apply pressure when the moving plate is used to cool down. ERDI115 is a bi-
stable reversible linear solenoid in which plunger is retained at both position by a permanent magnet.
This solenoid required better tolerance design than ERB35.
Figure 3.7 shows CAD diagram and pictures of one of our designs. The design used our embedded
electronics which has a socket for Wi-Fi or Bluetooth module.

57
(a)
(b)(c)
Light Guide
Detector Tube
Cartridge
Solenoid Moving Plate
Figure 3.7 Prototype qPCR Instruments
To design a system which can used in the field or at least in lab setting by a third party, professional designer was hired. The system is shown in Figure 3.7. The system uses a metal wedge which moves to make a contact with the fixed heater plate. The fixed heater plate has an inbuilt heater. The cartridge is placed on the heater plate under pressure. This mechanism is achieved by springs integrated into the cartridge drawer mechanism. Good contact is crucial for thermal performance of the system. The moving wedge is always in contact with instrument base and has a low thermal resistance paths to heat sinks open to atmosphere. When the wedge is in cooling mode, it’s in contact with both the heater plate and the instrument base. Hence the wedge’s thermal mass is not the limiting factor and the heat can flow to much bigger thermal mass of the instrument base and casing.
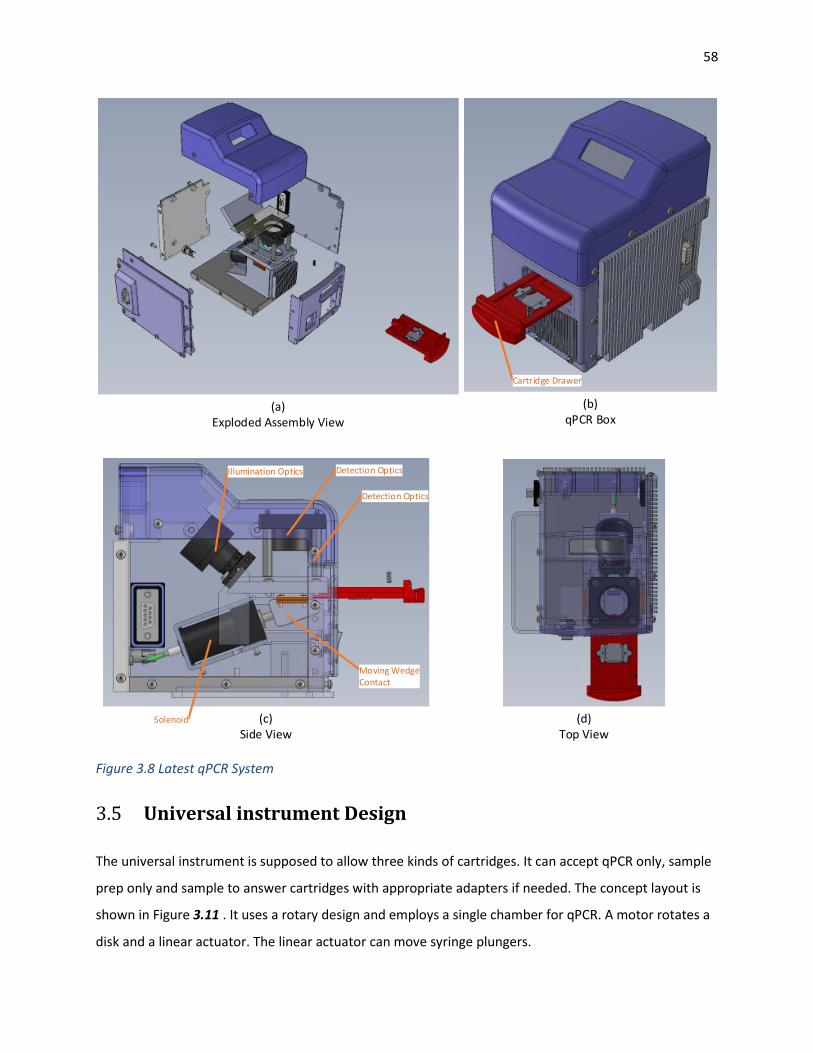
58
(c)Side View
(b)qPCR Box
(d)Top View
(a)Exploded Assembly View
Moving WedgeContact
Solenoid
Detection OpticsIllumination Optics
Detection Optics
Cartridge Drawer
Figure 3.8 Latest qPCR System
Universal instrument Design
The universal instrument is supposed to allow three kinds of cartridges. It can accept qPCR only, sample
prep only and sample to answer cartridges with appropriate adapters if needed. The concept layout is
shown in Figure 3.11 . It uses a rotary design and employs a single chamber for qPCR. A motor rotates a
disk and a linear actuator. The linear actuator can move syringe plungers.

59
An example s2a cartridge for nucleic acid test is shown in Figure 3.9. The top and bottom parts have
syringe type reservoirs which can hold various reagents. The bottom part has the qPCR chamber directly
under the elute buffer cylinder. A disc acts as a seal and is compressed by flexible seals between top and
bottom parts. The disc contains functional elements. In our example only one functional element is
shown i.e., DNA binding matrix. A silica membrane can be used. Rotation of the disc can bring the
functional element in line with the ports of each syringe type cylinder. It may be easier to explain the
operation of the cartridge by depicting it in a linear configuration as in Figure 3.10. This has an additional
tilted syringe type structure with a filter. Such design can be used to get plasma into the first vertical
cylinder after the user puts full blood in the slanted cylinder.
In a typical bind-wash-elute protocol, the sample can be introduced in one cylinder via a port in it. The
cylinder already has lysis and binding buffer. The dna binding membrane is aligned to this cylinder. By
moving the plunger up and down, the binding efficiency is increased. We also get mixing due to moving
the sample through membrane. Next the dna binding membrane is aligned to cylinders containing wash
buffers sequentially. The membrane then aligns to drying cylinder where it is dried. Finally the
membrane aligns to elute chamber. Here the elute buffer fills the cartridge which has lyophilized
reagents while bringing the bound dna into the chamber. Thus all the elute volume is used for PCR.
Figure 3.11 shows the cartridge and cartridge-instrument elements. The qPCR chamber interface to the
instrument is similar to the one explained in qPCR instrument. A motor can rotate the disc and frame on
which linear actuator is mounted. The linear actuated can move syringe plungers. The syringes
reservoirs can be incubated by using heaters.

60
(a)Exploded Assembly
(b)Concept S2a Cartridge
Functional ElementE.g., DNA binding matrix
qPCR chamber
Reagent reservoir
Rotating Disc
Seal
Figure 3.9 Example sample to answer cartridge

61
Sliding Part
Housing
Wash 1 Wash 2
Elute Buffer
Sample injection hole/port
Prefilled Liquid
Filter
Vent + 2nd sample inlet
DNA binding matrix
Figure 3.10 Sample to Answer Cartridge Depicted in Linear configuration

62
Motor
Linear Actuator
Sample to Answer Cartridge
Rotating Disk
Fixed Heat Sink
Bi-stable solenoid
Light Guide
LED
Detector
Moving Plate
Heater
qPCR chamber
Figure 3.11 Concept Layout of Sample to Answer System

63
System Level Benefits and Comparison with Other
Technologies
3.6.1 Cost
The system is lower cost than any other sample to answer systems with similar capabilities. We have
tried to reduce cost for all major components. Low cost takes care of ‘installed base problem’ of
expensive instruments. It also opens up new markets like individuals involved in healthcare.
3.6.2 Flexibility
It’s important to allow a wide variety of assays in the same instrument. Various protocols should be
supported. Our design offers flexibility in number of stages, operations and fluid movement. The system
is also highly configurable. It allows multiple wells (channels) and multiple detection wavelengths. Very
complex protocols are possible. Examples are multi-sample and multi-protocol disposable. It’s also
possible to have nucleic acid and protein tests in one cartridge, however the complexity increases and
cost analysis should be performed for such designs. Very difficult samples are process able in the
system.
3.6.3 Reliability and Low maintenance and calibration requirements
The things which can go bad after repeated use or get out of calibration are avoided. For example
pneumatics is a common way of moving fluids. However, the pneumatic interface from instrument to
cartridge can be non-trivial. The seals can leak after repeated use.
3.6.4 Robust
The technology allows waterproof and dustproof designs. Owing to syringe assisted fluid movement,
operation is possible during travel. Examples are use during travel in a bus in developing world.
3.6.5 Gold Standard techniques and Fast Assay development and porting
The technology uses proven gold standard techniques. Some systems simplify the underlying techniques
so that the system can be used at POC. However, many of these techniques are inferior in performance.
Another advantage of the system is fast adaption of existing assays to our platform. Commonly used
spin column based extraction is very close to our system. Automated liquid handling equipment is
available which can be used in assay development. Protocols used in robotic liquid handlers are similar.

64
Thus porting of existing protocols and development of new protocols can take use mature liquid
handling technology. This is not the case with designs which have difficulty in mapping their protocols to
existing liquid handling instruments.
Features of Sample Preparation Technology
The sample preparation technology provides a new type of liquid handling platform which is portable
and robust. The dead volume does not change much with reagent volumes and number of reservoirs.
Same physical cartridge can be used for different assays as the volumes of reagents can be varied by
syringe tip position. This can also be used to have programmable operations depending on sample input
volume or other conditions. The operation is closed and does not need venting ports open to
atmosphere. There are less restrictions of fluid characteristics. The system can work with harsh
chemicals and foaming liquids. Unconventional functional elements like mixers, chopper and
homogenizers can be integrated into to the system for a wide variety of operations. Multiple passes
from the same functional element are possible in a robust way. Increased binding efficiency is expected
by using this feature. The fluid flow rate and dispense amounts are precisely controllable.
Features of Reaction Chamber
The reaction chamber is tightly coupled with optical and thermal design. However, it has significant
advantages to be used alone as a component in lab on chip systems. The volume of the chamber can be
varied by changing height of the cavity only. Thus interface to instrument including optics can remain
the same. The chamber can be used for qPCR, ELISA, immune-PCR and other detection methods as well.
Rapid thermal response and large optical interrogation areas are provided. Rapid and low cost
manufacturing is possible since the plastic parts are produced by injection molding and bonding is
achieved using adhesives. The design offer mechanically robustness as well. A variety of substrates can
be used owing to the bonding methods. Lyohpilizaition can be efficiently done due to flat surface and
metal substrate.
Example disposables for different assays
We briefly describe few sample configurations for the disposable to show the flexibility of design. Figure
3.12 (a) shows a cartridge for a sample which does not need filtration and can be directly added to lysis

65
buffer. Example of such an assay is STD assay using urine as a sample. Figure 3.12 (b) shows cartridge
which used whole blood as the sample but separates plasma to continue analysis. Various pathogens
including Dengue, Malaria, HCV, HBV and many others can be detected using this design. Figure 3.12 (c)
shows a candidate design for stool sample for polio detection. This design is based on assay be CDC
(Center for disease control) which utilizes six separate reaction chambers. The cartridge can accept stool
as a sample. Due to robust fluid movement, stool can be homogenized or mixed into liquid buffers by
using a homogenizer type functional element. Then the filter functional element can allow only
supernatant to pass to only one cylinder. Next the usual cycle of bind-wash-elute can continue.
(a) Urine Sample – STD Assay(b) Blood Sample – Malaria, Dengue, HCV, HBV
(c) Stool sample – Polio Assay
Figure 3.12 Example cartridges

66
4 Metal-Polymer Cartridge for Quantitative Real Time PCR at Point Of Care – Design and Analysis
Abstract
We report the design, fabrication and testing of metal-polymer hybrid disposable cartridge for qPCR
with capability to perform other biochemical reactions. In the first part we focus on the POC (Point-of-
care) requirements, concept, design and analysis of the cartridge. Practicality is given special weightage
in concept and detailed design. We perform coupled transient FEA simulations to get more realistic data
for the both thermal and structural design. The goal is to find parameter space which gives predictive
view of cartridge robustness in large scale production. We extract important information from FEA
simulations and develop a lumped transient model which can be simulated and optimized by wide
variety of tools. Such detailed simulation and analysis give accurate limits of performance of the fluid
domain and the advantages of the concept. There are compelling advantages of using metal in lab on
chip devices. Metal provide better thermal and optical performance. It also allows ruggedness and ease
of use in POC settings without sacrificing performance. The chip can be placed directly over a flat plate
cycler (slide cycler) without need of special adapters. The polymer part is injection molded with
integrated pillars to allow air gaps and easy filling with a pipette. A novel seal design is presented.
Alternatively the chip can be sealed with an adhesive tape easily due to the designed air gaps and pillar
structure. We show ways to achieve six sigma by design approach to design of POC diagnostic cartridges.
Use of metal allows heating and cooling on the metal side to be much more effective than in the case of
polymer layers which sometimes would need heating and cooling from both top and bottom for best

67
performance. The design also allows freeze dry procedures before bonding and since bonding can be
done at room temperature the reagents do not have to be exposed to solvents (in case of solvent
bonding) or extreme temperatures. The design and analysis provides a guideline for robust design of
rapid cycle PCR cartridges which undergo stresses in short time. The design provides large optical
interrogation area while still having high quality thermal performance. The design lends itself to
production processes like injection molding and adhesive bonding which are both widely used in
industry and are lower cost than many other alternatives.
Introduction
PCR cartridges have been made in a variety of materials, volumes and shapes. They have been reviewed
in [54-64]. Various types have been developed including self-contained [65-69], with analyzers [70, 71]
[70], and with different features[72-81] [82]. Various microfluidic for PCR chips are reviewed in [83].
4.2.1 Applications of PCR cartridges
The PCR cartridges are also useful in themselves without sample prep integration for many applications.
They can be used with other instruments like flatbed cyclers, hotplates and plate readers available at
various locations. There are various regions and places where one can find sufficiently trained
manpower to do sample preparation as the equipment needed to do that can be inexpensive. However,
PCR requires controlled timing which need an instruments. Providing an instrument or even a cartridge
which can use existing equipment can have significant impact.
The samples which don’t contain inhibitors or if the chemistry is available for amplification from raw
sample, then the cartridge itself is sufficient as a full independent system. Some examples are full blood
enzymes[52], [84]and assays using direct samples[50] [51].
If the cartridges provide better speed, cost and ease of use they can also be used in research especially
for labs which require low throughput or need faster speeds than typical commercial instruments. There
are many commercial applications of PCR chips or PCR chips with associated instruments. Such systems
can be used in pharmaceutical manufacturing, cancer surgery and for samples which don’t need much
sample processing.

68
4.2.2 Why PCR cartridges instead of capillaries and tubes
PCR and qPCR reactions are typically performed in PCR tubes in research and clinical labs. There are
many manufacturers to offer PCR and real time PCR machines of various kinds.
Here we are not considering the robotic and automated sample to answer systems. These systems are
very expensive and not many labs can afford them.
Many commercial qPCR machines have been approved for diagnostic tests. The sample preparation for
diagnostic tests typically involves centrifugation and many other manual steps. However the detection
occurs via qPCR (quantitative Polymerase Chain Reaction) in PCR tubes. These tubes are low cost and
widely available. Some suppliers have tubes available with lyophilized reagents as well. However, most
of these are not FDA approved.
There are some fundamental problems with PCR tubes.
i. Due to the shape of the tube, the thermal response is slow. The tube has small surface to
volume ratio. The tubes have to be robust enough so they can be pressed against the wall of
thermal block. Thus the plastic cannot be made very thin. As plastic has very low thermal
conductivity, the thermal response becomes slower.
ii. Since the instruments lump at least 48 wells together the energy required to heat and cool
becomes huge even if a single tube is being used for the reaction. A single test is thus very
energy inefficient. The whole metal block in which tubes are inserted has to be heated and
cooled. Some models like Qiagen Rotogene, BioFire Lightscanner and Lightclcler2.0 use
rotary mechanism and air flow for temperature control. These also are designed to handle
multiple capillaries and need large amount of energy. None of these systems is amenable for
POC individual reaction based systems.
iii. The shape of the tube or capillary limits the design options for optical design. The tubes are
mostly queried from top from a transparent cap. Typically only a small fraction of
fluorescence is captured. In configurations like ‘optics shuttle’ in Bio-Rad CFX or Light
scanner which query each reaction vessel individually, the time on each well can be fast (as
is 20ms in case of Light scanner) but still a number of the chambers have to be queried
increasing the total time.

69
iv. The design of instruments for multiple tubes is not easily translated for integration to
sample to answer systems for POC. POC systems should be able to conduct single test with
high energy efficiency and small footprint.
Thermal FEA to find thermal response of existing Technology
The research literature does not show accurate thermal response for tube and cartridge based systems
which are available. To have a clear idea we modelled the Bio-Rad CFX and Cepheid cartridge for having
thermal response data. Bio-Rad CFX is a popular machine with fast thermal cycling capability in a typical
multiwell qPCR machine using tubes while Cepheid is the most prevalent POC type instrument.
First we list key properties of materials which we will encounter in design and modelling.
4.3.1 Key Properties of Selected Materials
Material Thermal conductivity (k)
Wm K
Specific Heat
kg.J
C°
Thermal diffusivity
(. p
kc
αρ
= )
2ms
Co-efficient of thermal expansion
610.m
m K−
Specific Gravity
Water 0.61 4182 0.143 × 10⁻⁶ NA 1
Aluminum 205 897 8.418 × 10⁻⁵ 22.2 2.72
Copper 401 385 1.11 × 10⁻⁴ 16.6 8.79
COP 1420 0.15 1500 0.0986 x 10⁻⁶ 70 1.014
Polycarbonate 0.19 1170 - 1250 0.144 × 10⁻⁶ 70.2 1.2-1.22
Polypropylene 0.1-0.22 1920 0.096 × 10⁻⁶ 100 - 200 0.946
Table 4.1 Thermal Properties of Selected Materials
A Comparison of properties is given in Table 4.2. All materials are compared to Water except for co-
efficient of thermal expansion which is compared to Aluminum.
Material Ratio of Thermal
conductivity (k)
Ratio of Specific Heat
Ratio of Thermal diffusivity
Co-efficient of thermal expansion
All vs Aluminum
Specific Gravity
Aluminum 336 0.21449 588.6 1 2.72

70
Copper 657 0.092061 776.223 0.747 8.79
COP 1420 0.245 0.358 0.6895 3.153 1.014
Polycarbonate 0.311475 0.29890 1.00699 3.162 1.2-1.22
Polypropylene 0.327 0.45911 0.67132 4.504-9 0.946
Table 4.2 Comparison of Thermal Properties
4.3.2 Bio-Rad CFX
The Bio-Rad low profile PCR tube for qPCR was measured to obtain precise dimensional data. The CAD
file was obtained as a result of this service. Following procedure was adapted to have the required
answers.
i. The simulation is transient thermal only. We don’t consider any material dimensional
change.
ii. Boundary Conditions: The walls of the tube were given a temperature boundary
condition. Thus we assume there is no air gap between the thermal block and the tube
which is the best possible case. We also assume that the thermal block temperature at
every position is equal at the boundary of the block and the tube. It is also assumed that
thermal block thermal mass is much bigger than the PCR tube and we model the
boundary as a constant temperature assuming that any amount of heat can be
provided.
iii. As the reaction occurs in a closed space, we neglected air convection from top of liquid
to the surroundings. This is a valid assumption due to low thermal conductivity of the
tube and presence of large air gap inside the tube between the liquid surface and the
cap.
iv. Natural convection of air is neglected from the outside of the tube which is not in
contact with the thermal block. This is the upper portion of the tube. Natural convection
can speed up heat transfer. This is however a symmetric system and heat is being
applied from sides as well as bottom.
v. Natural convection is neglected inside the fluid as well. Natural convection can speed up
heat transfer. This is however a symmetric system and heat is being applied from sides
as well as bottom.

71
vi. The lid is heated to 105 ° C typically so that condensation of vapor does not occur on the
PCR cap. The effect of lid heating is neglected due to the large air gap. The primary
purpose of heated air lid is to counter condensation of the tube cap.
vii. Heating simulation is conducted from 55 to 95 ° C. initially the system is assumed to at
initial temperature of 55 ° C. this models the condition that the cycler has been at 55 °
for a while so all elements reach 55 ° C.
viii. The walls of the tube are given a boundary condition of temperature jump from 55 to 95
° C. The temp is then held at 95 ° C. The speed of the system may be limited by ramp
rate of the metal block but we are focusing on the liquid reservoir for comparison to
other systems.
ix. For cooling simulation similar procedure is adapter with temperature jump from 95 to
55 ° C.
Following results were obtained
Operation Volume Time for liquid to equilibrate
Heating 25ul ~20 seconds
Heating 50ul >13 seconds
To find out the effect of plastic tube on the heat transfer performance, we change the material of the
tube to Aluminum. Following results are obtained.
Operation Volume Time for liquid to equilibrate
Heating 25ul ~12 seconds
Heating 50ul >23 seconds
We determine the following
• The fluid in the tube takes considerable time to equilibrate even with metal walls. Thus this is
not the optimum geometry if speed has to be increased.
• The polymer wall makes heat transfer considerably slower. Changing walls to metal can save
significant time.

72
The simulation setup and results are shown in Figure 4.1.
(b)(a)
(d) (e)
(c)
(f) (g)
Figure 4.1 CFX Tube Simulation Results

73
4.3.3 Cepheid Smart Tube
The smart tube has extremely thin walls (about 30um) polypropylene. The polypropylene is laser welded
to the cartridge. The cartridge is heated from both sides. This limits the optical interrogation to be
possible only from sides. The concept is provided in Figure 4.2. The system uses ceramic plate heaters.
To maintain good contact and may be for other reasons the cartridge is designed so that its pressurized
when the cap is closed. This is probably to bulge out the walls so that a good contact is made with the
flat surfaces of the heater. This shows another serious consideration of thin wall plastic design i.e., a way
to have good contact with the heating surface.
Heating from both sides is important for any fully plastic based design. Since the Cepheid wall thickness
seems to be thinnest possible practically, it is worthwhile to test effects of heating from both sides
versus a single side. In fact the question of heating from both and single sides has already been
discussed for another geometry with thicker polymer substrate.
The procedure for heating for both sides is as follows.
i. The simulation is transient thermal only. We don’t consider any material dimensional
change.
ii. Initial temperature of the system is set at 55 ° C i.e., all elements are set to 55 ° C.
iii. Both walls of the cartridge are given temperature boundary conditions. The temperature is
set to 95 ° C. This assume that heaters can be at constant temperature and provide the heat
without changing temperature.
iv. The initial condition for the whole system is 55 ° C for heating and 95° C for cooling. This is a
valid assumption due to the configuration of the system. The cartridge is in between two
heater plates and surface to volume ratio is large.
v. Internal convection inside cartridge is neglected. Raleigh number for cartridge is given in
Table 4.4.
vi. Convection to air from side walls is neglected. Two of the walls are very close to the optical
excitation and readout parts of the instrument. The thickness of the cartridge is also small
compared to its length and width.
We also check the performance by heating from one side only. The procedure is the same except
following

74
i. For heating, entire system is given initial condition of 55 ° C. Thus we assume the air
around the cartridge is at 55 ° c and the system has been in this state for long enough to
equilibrate with the surrounding. We keep the temperature of surrounding air at 55 ° C.
we don’t consider heating of the air due to heating of the plate. We also run the
simulation by neglecting the convection to air from top surface.
ii. Natural convection inside cartridge is neglected as Raleigh number is not sufficiently
high.
We obtain the following results
Operation Volume/Tube
Type
Time for liquid to equilibrate
Heating from Two side 25ul <5 seconds
Heating from Two Sides 50ul >13 seconds
Heating from One Side 25ul >15s seconds
Heating from one sides 50ul >25 seconds
We make the following observations
i. Heating and Cooling from one side is much slower than from both sides.
ii. The temperature gradient does not go away even after considerable time if we heat only
from one side.
iii. If the cartridge has to double in volume while keeping the sides length same then the time
increases considerably. Therefore the design is not flexible to increase optical interrogation
area if volume is increased.
Figure 4.2 shows simulation results in the case of heating form one side while Figure 4.3 shows the
results while heating from both sides.

75
(c) (d)
(a) (b)
Chamber
(e) (f)
Figure 4.2 Cepheid Tube, Heating from One Side
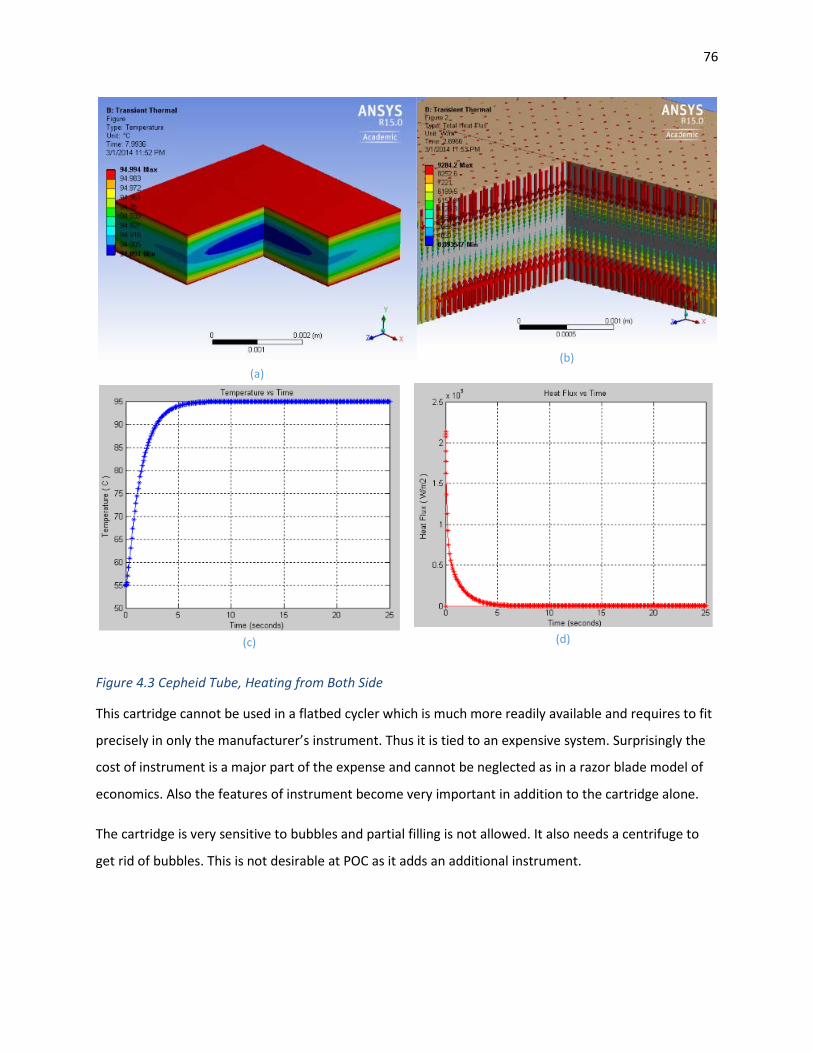
76
(a)(b)
(c) (d)
Figure 4.3 Cepheid Tube, Heating from Both Side
This cartridge cannot be used in a flatbed cycler which is much more readily available and requires to fit
precisely in only the manufacturer’s instrument. Thus it is tied to an expensive system. Surprisingly the
cost of instrument is a major part of the expense and cannot be neglected as in a razor blade model of
economics. Also the features of instrument become very important in addition to the cartridge alone.
The cartridge is very sensitive to bubbles and partial filling is not allowed. It also needs a centrifuge to
get rid of bubbles. This is not desirable at POC as it adds an additional instrument.

77
Existing Cartridge Based Systems
There are few commercial systems that use PCR cartridges in non-integrated fashion. They are listed
below in Table 4.3.Figure 4.4 shows images for these systems with associated disposables.
Company Cartridge Type Remarks Cost Veredus Microchip Too complex High Epistem Tube like Three tube, qualitative results Low DxNA Tube Like Meridian Tube Cepheid Flat chamber Limited by cooling rate
Compatible only to Smart Cycler Limited optical interrogation area
Very expensive
BigTech Cartridge Speed is not high Ustar Tube like Low Mobidiag Tube Like QuantumDx Cartridge Non-optical detection Table 4.3 Existing commercial PCR systems
There are only few commercial instruments which use cartridges instead of PCR tubes. In case of
Cepheid the advantage is performance. In case of Bigtec it’s the portability and cost. However the speed
is not much faster and one can argue if there is some real advantage of having such a machine instead of
an instrument which accepts a single PCR tube with modified dimensions. Both of these instruments
don’t use Peltiers which are very power hungry and one of the main limitations of bringing PCR to POC.
The advantage of BigTec design seems to have lower power consumption then using a peltier. However,
looking at Epistem POC instrument which uses tube like element and Peltier- and stills seems very
portable, the question of using expensive and difficult to fabricate cartridges arises. Epistem mentions
their system to cost $400, the consumable around $0.5 and 30 cycles in 17 minutes. A low cost optical
system can do qualitative tests. With respect to cartridge design, Cepheid and Bigtec systems do not
seem to give major advantage. Rather Cepheid system is very complex and its penetration into
developing world POC is unlikely. Same is case with Bigtec. The cartridge looks more complex than
desired. IP issues seem to drive these designs as well and many options are avoided and various
approaches adapted not on technical merit but IP issues.
One advantage of Cepheid in a clinic is the flexibility and scalability. Individual’s reactions are
independent and can be run independently at different times. This can be an advantage in a busy clinic.
All wells of normal PCR machines are ‘booked’ even if one reaction is running. There are some
companies which have two or three independent blocks but not individual well scalability like Cepheid.

78
Out of these systems a very attractive approach would be to have a system implemented like Epistem
for normal or modified qPCR tubes and try to reduce the cost of optics to have a quantitative
capability.
Epistem
Meridian
BigTech
Ustar
Cepheid
DxNA
Figure 4.4 Existing Commercial PCR systems

79
One advantage of Cepheid in a clinic is the flexibility and scalability. Individual’s reactions are
independent and can be run independently at different times. This can be an advantage in a busy clinic.
All wells of normal PCR machines are ‘booked’ even if one reaction is running. There are some
companies which have two or three independent blocks but not individual well scalability like Cepheid.
Out of these systems a very attractive approach would be to have a system implemented like Epistem
for normal or modified qPCR tubes and try to reduce the cost of optics to have a quantitative
capability.
4.4.1 Heating and Cooling from One Side
Heating and cooling from one side vs both sides in considered in [66]. Two thermocouples were inserted
at the centers of floor and ceiling of the chamber. The chamber height is 750um while the top and
bottom layers were 250um each. The gradient in the chamber was measured and found to be
significant. A thermal guard was used to have better temperature control [85]. A window was made to
allow optical query from the top. Both of these are shown in Figure 4.5. We note that the optical
interrogation area is reduced while chip placement becomes more involved. Polymer chips should make
good contact with heating surfaces which makes system more complex.
(b)(a)
Figure 4.5 Heating from Both Sides in Literature

80
Review of Earlier Work in Research Literature
There have been various PCR cartridges reported in literature [55, 63, 65-83, 86-97], however most of
them have a polymer substrate with heating applied thorough a polymer. The first problem is that to
have efficient heat transfer the walls have to be thin. This makes the walls fragile. For example Cepheid
has the thinnest polymer wall (30um) but each tube is tested individually for pressure seal. Thin walls
may have caused the production cost to go up and the reliability to be a problem.
The second problem is the reduced heat spreading and uneven heating across the surface in some
designs. Especially in peltier based designs the thermal gradients across the peltier surface will persist
due to polymer wall. A heat spreader has been used in some cases []. However, the energy required to
heat and cool then must also take into account the heating and cooling of the spreader. Since a thin
polymer wall will bulge due to pressure developed inside the PCR chamber, a rigid support is needed.
There will be concern of heat transfer and the temperature control of this support as well. For example
in Cepheid cartridge, the cartridge is supported on both sides by rigid plates which does not allow it to
be optically queried from top.
An overlooked feature is the mechanical implementation needed to hold the chip. A fragile chip needs a
rather complex mechanical design to hold the chip, align it and apply pressure to have efficient heat
transfer. In case of optical interrogation sometimes it would need serious alignment requirements (as in
case of Cepheid).
Another neglected area is world to chip and ease of sample injection. Many 2D designs like made from
Silicon substrates inherently are 2D. To have sample injection by untrained personnel outside lab
environment can be very error prone and difficult. A related problem is sealing the cartridge. A PCR tube
has an integrated cap which be pressed to make a seal, however, most of cartridges in lab don’t have a
sealing mechanism to be used at POC. This is in part related to the limitations of design. A sliding
mechanism [86] was used a design to seal the design which could be filled with a pipette. However this
design used several discrete components which can make it expensive in production.
Problems to be solved
We find that following problems need to be solved

81
i. Heating from two sides or thermal guard approach reduces interrogation area and makes
cartridge design and related instrumentation complex.
i. Using films or flat substrates have problems with sample injection. Separate connectors
have to be used for interfacing to pipettes.
ii. Bonding methods. Both laser welding and solvent bonding are relatively complex. Solvent
bonding puts quality constraints on the flatness which requires expertise in injection
molding. Solvent bonding can make it difficult to use lyophilized reagents.
iii. Effect of bonding method on lyophilized reagents.
iv. Lyohpilizaition methods: Ideally the reagents should be lyophilized on some substrate
before bonding. Else there can be lyophilized palettes. Lyohpilizaition once the chip is
assembled and starting from liquid phase is not a good idea. The surface area for
lyohpilizaition process is this case is severely reduced. Note that in case of PCR tubes the
surface area is still relatively large due to wide opening at the end of the tube. However,
most chips have narrow channels for filling which will limit the surface area of lyohpilizaition
process. The chip would undergoes extreme temperatures which can put addition design
constraints on its structural integrity.
Checklist for PCR cartridge design for POC
To have something useful in POC settings new requirements are desired. Overlooking these
requirements can provide a large number of options to be considered. Using these requirements as a
checklist can help weight an idea very early before putting time and effort to make it work.
i. Cost of production and design
ii. Robustness- integrity of the cartridge should be maintained by relatively rough handling
iii. A way to have lyophilized reagents already stored
iv. Ease of sample injection (world to chip), preferably should be easy to fill using a pipette
v. Some solution to bubble problem during filling and other operations
vi. Cartridge insertion and ease of placement in the instrument
vii. Preferably can be used with low cost commercial instrumentation of easy to make setups
like flatbed cycler

82
viii. Ease of monitoring – for optical interrogation
ix. Easy sealing.
x. Testing of new assays should be easy to include more diseases in future
xi. Does not need special equipment like centrifuges etc.
xii. Variable volume design should not be limiting factor.
xiii. Variable volume filling is desirable like a PCR tube
Many technologies which work well in lab will not work reliably in harsh and changing conditions at POC
and especially in remote areas in developing world.
Design and Analysis
Now that we have a good idea about limitations of common PCR cartridges and the problems which
need to be solved, we go forward to solve some of the problems.
4.8.1 Concept
The fundamental ideas of our cartridge design can be summarized as below
i. Use a metal substrate. The metal will offer very low thermal resistance. A very thin coating
on a metal can also act very close to being a metal only substrate as far as thermal
performance in concerned. Metal also acts as a heat spreader.
ii. Use a polymer top for optical viewing and interrogation.
iii. Integrate various structures in the polymer and design for injection molding. Integrate ports
for filling and seals for sealing into the design. Also integrate structures to physically handle
the chip.
iv. Use adhesive bonding. This is cheap and fast. Adhesive bonding puts less constraints on
quality of the injection molding parts like flatness. Adhesive bonding and even UV adhesives
can work by masking some area where lyophilized reagents are present.
v. Do lyohpilizaition on metal substrate which is flat and has very good thermal characteristics
for lyohpilizaition process thus speeding up production speed and reducing time and energy
required.

83
4.8.2 Design
To have a robust design we employ state of the art modeling approaches. The cartridge has to be
designed to withstand stresses due to thermal mismatches, retain optical performance and allow fluidic
filling. There are various parameters which need to be optimized or considered on the bases of ease of
use and practical fabrication constraints as well as availability.
Shape
The basic design consists of a polymer top with metal base. The heating and cooling is done from the
metal side. After considering a various options, the polymer top is injection molded with cavity. The
height of the cavity is 0.5mm. The bonding area is at the periphery of the cartridge. There are pillars and
sealing structures explained later. There have been 2D designs mentioned in literature which use
approaches like LOM (laminated object manufacturing) and lithography. However they have the
difficulty of world to chip connections. If a separate connector is used, the problems of bonding and cost
arises. There are limited commercially available options for connectors which interface easily to pipette
tips and can be sealed easily. The cavity is a rhombus. This is a shape to allow filling without bubbles.
Our design need only one bonding step and still allows 3D features.
There are various options to implement the basic metal-polymer design. Few options are shown in
Figure 4.6.Figure 4.6 (a) shows the cavity etched in metal, (b) shows the cavity in polymer and (c) shows
the cavity in the intermediate layer. In the last case the cavity layer is separate from the polymer top so
there is one additional layer in this case. This can be implemented by using a patterned tape, for
example. However tape adhesives are generally weaker than a cured adhesive in general.

84
Adhesive
Metal
Polymer
(a)
(b)
(c)
Figure 4.6 Options for Metal-Polymer Cartridge. (a) Cavity is defined by Adhesive Thickness. (b) Cavity in Polymer. (c) Cavity in Metal.
The cavity in the metal can be made using etching, embossing and various other processes. Etching was
tried using Aluminum etchant. However, the mirror finish is not retained as a result of the process.
Recovering the mirror finish needs additional processing. In this case the metal has to be at least as thick
as the depth of the cavity. This is a disadvantage as opposed to other two cases in which the metal can
be very thin and whole thickness of metal is used in heat spreading and robustness. It is not trivial to
obtain mirror finish in the lab. Polishing in an etched cavity is more difficult than a flat surface. Amonet
used PVD (physical vapor deposition) to achieve a highly reflective surface. It’s easy to get polished
Aluminum in flat sheets. It’s also easy to cut polished metal in desired shape while retaining flatness by
laser and die cutting. Metals in simple shapes are very cheap.
Using a separate adhesive layer can be implemented by using double sided adhesive tapes. However,
they are typically not as strong compared to cured adhesives. There is also the need to align and hold
under pressure the polymer top, adhesive and the metal. The important point is that the adhesive need
to be as thick as required height of the cavity. In our case the height is 0.5mm. Thus the sides of
adhesives which are exposed to the fluids offers a relatively large as compared to a very thin adhesive
layer. There are ways to circumvent that problem by making the top polymer shaped to reduce adhesive
exposure, however they make the top more complex. It is also more complex to automate the process
of alignment of the adhesive layer. Another important problem with this approach is with optical design
which is explained later in this document. The adhesive adds another layer and interface. The adhesive
should ideally be non-fluorescent but most of the adhesives have auto fluorescence.

85
It’s easy to get mirror finished Aluminum sheets at a reasonable price. One can get a single material
polished sheet or a sheet with coatings
Thermal – use of metal
It is intuitively obvious that metal will offer lower thermal resistance as compared to a similar thick
sheet of polymer. However there are some other important advantages. Metal also acts as a heat
spreader so the entire surface is at uniform temperature. Another important advantage is that metal
acts as a local heat supplier. With polymer base, a separate heat spreader might be necessary. Heat can
be provided to the PCR solution even with a thick metal due to very low thermal resistance. This allows
the solution to reach the temperature of the metal quickly even with one sided heating which is not
easy to achieve with polymer based systems. This fact has been overlooked in many designs. Since the
publications normally do not quantify the thermal gradients in the cartridge, such an artifact can remain
hidden but could still have negative effects on PCR reactions or its efficiency. In some cases the cartridge
was heated on both sides by peltier devices[66]. However such an approach is energy expensive and
normal flat PCR machine cannot be used. Heating from both sides also constraints the region of optical
readout and puts mechanical design and space issues into consideration. Metal also allows a rugged
design.
The cartridge CAD diagrams is shown in Figure 4.7 while the picture is provided in Figure 4.8 .

86
(b)
(a)
Adhesive
Water
Metal
Air Pillar
InletPlatic
Figure 4.7 PCR Cartridge

87
Figure 4.8 PCR Cartridge Picture
Key Features of Different PCR Chambers
Different feature of different PCR chambers are given below in Table 4.4.
Chamber Type Heating Surface to Volume Ratio
Rayleigh Number (Ra)
Sphere of 25ul 0.5
Sphere of 50ul 0.251
CFX PCR Tube – 25ul 1.57
CFX PCR Tube – 50ul 1.544
Cepheid Smart Tube – 1 sided heating 0.81 474
Cepheid Smart Tube – 2 sided heating 1.62
qPCR Cartridge, 0.25mm thick, 25ul 4.24 7.42
qPCR cartridge, 0.5mm thick, 50ul 2.12 59.36
Table 4.4 Key Features of different PCR chambers
4.8.3 FE simulations - Thermal
We run parameterized FE simulations first to know thermal response of the system. We then run
structural simulations to know the specifications needed for adhesives and its thickness.
We compare following cases

88
i. Metal substrate with fluid thicknesses of 25ul and 50ul
ii. COP 1420 substrate with 100um thickness. 100um is considered to be thinnest feasible
substrate thickness for practical applications.
The simulation is setup as following
i. The simulation is transient thermal only. We don’t consider any material dimensional
change for thermal simulations. Since the dimensional change is very small this is a valid
assumption.
ii. Initial temperature of the system is set at 55 ° C i.e., all elements are set to 55 ° C.
iii. Bottom surface of metal substrate is given temperature boundary condition is 95 ° C.
iv. The initial condition for the whole system is 55 ° C for heating. This is an estimate of what
would happen between thermal cycles.
v. Internal convection inside cartridge is neglected. The Raleigh number for this cartridge is
much lower than that required for onset of convection [98] [99].
vi. Convection coefficient of 52
Wm
is assumed for polymer surfaces. The ambient temperature
of air around cartridge for convection is assumed to be 25 ° C.
Figure 4.9 Shows simulation results for cartridge with metal substrate while Figure 4.10 shows results
for cartridge with polymer substrate of 100um thickness.
We note the following
i. There is marked difference is liquid approaching the set temperature in case of metal and
polymer substrates. It shows problems caused by thin polymer substrates.
ii. Heat flux also shows lower heat flowing into the fluid because of polymer substrate which
acts as a resistance to heat flow.
iii. As shown in Figure 4.9 (b), the higher thermal conductivity of water helps in letting the fluid
equilibrate to the temperature of the plate. In contrast this advantage is lost due to polymer
substrate as shown in Figure 4.10 (b).
iv. Heat flux in both cases is essentially in vertical direction.
v. Even in case of metal substrate there remains a gradient for long time in the fluid. This is
since heat is still flowing into polymer. However in metal’s case we have an advantage of
having thermal insulator on top. The more thermal resistance, the better. Fortunately PCR

89
process is robust to these small temperature variations as it’s a kinetic process. The gradient
is much smaller in case of metal substrate.
vi. Thermal uniformity in horizontal direction is very uniform and it can be approximated that
the layers of fluid are uniform temperature.
(d)(c)
(a) (b)
(a)
Fluid
Metal

90
(e) (f)
(g) (e)
Figure 4.9 Simulation for PCR Cartridge with Metal Substrate

91
(a) (b)
Fluid
(c) (d)
Figure 4.10 Simulation for PCR Cartridge with Polymer Substrate
As can be seen the polymer causes significant delay in reaching equilibrium.
4.8.4 Analysis of Data
In Figure 4.11 the results of transient simulations are presented. The temperature for qPCR cartridge is
at its center and at fluid-polymer boundary.
First we compare the cartridge with fluid height of 0.25mm with Cepheid cartridge which is heated form
both sides. The temperature in our cartridge rises faster. However it retains small slope. This is due to
heat transfer into the top polymer. Thus there will be a temperature gradient in the cartridge. The
gradient can be reduced by waiting longer. However, if the reaction is robust to small differences in
temperature then the time can be reduced. For example if 2 °C difference inside the chamber can be
tolerated then the time to reach desired temperature is same for both Cepheid and qPCR cartridge.

92
However, in our case our cooling can be almost as fast as heating. In Cepheid, the cooling is significantly
slower. Also the effect of polymer base is shown. The polymer base increases the rise time.
Figure 4.11 Comparison of Transient Thermal Response
4.8.5 Thermal 1D lumped models
We have verified that a 1D model (in vertical direction) is valid for thermal simulations and modelling by
our 3D simulations. There are various tools to have lumped element modelling applied to our system.
The advantages of such 1D modelling is much higher speed and thus getting results faster for parametric
design.
The parameters were thickness of the fluid, thickness of metal and thickness of the top polymer layer.
Since we need interlayer thermal profile we divided each of the elements into multiple layers. Various
tools were evaluated to conduct this study. We compared Matlab, maple and others. Although there are

93
tools especially designed for thermal modeling, Matlab has features additional to such modeling such as
optimization so it was preferred. Physical modeling toolbox allowed generating various layers and
models of conduction and convection. A script was written for analysis. A block diagram of the model is
shown in Figure 4.12. The system is thus a high order dynamical system. Heat flow or temperature can
be used as excitations. These were applied to the bottom of metal plate as would be done in real
situation. Each material layer has multiple lumped elements thus providing information inside the
layers. We can thus see the thermal gradients in various materials. This model can also simulate
additional elements. For example we have added a heater to the base of metal. This is a model of very
thin heating layer applied to the base of the metal and bonded to metal using an adhesive.
The lumped model allows various configurations of integrated heating and cooling be tried out in much
shorter time than FE analysis. Another advantage of lumped element modelling and using Matlab® is
that the control systems can be tried and optimized to have best possible thermal response. The power
of Matlab for control system design is well known and integrating the cartridge with Matlab in a model
is a very powerful approach to optimization of the whole system. By using numerical optimization
techniques, the ultimate performance which can be achieved via such system can be known. This is
significant since various simple strategies like PID controller can be evaluated against the upper bound
to find out their efficacy and whether it’s appropriate to apply more advanced controllers or not.
There have been various controller strategies applied to improve thermal response of PCR in cartridges,
but most of them were without an upper bound to know the real merit of such techniques.
Using such models allow us to apply arbitrary waveforms as excitation to the system as well. They can
also model the measurement uncertainties, noise and time lags.
The rich theory of optimal and model based control and modern estimation theory can be used in the
design of such systems.

94
Figure 4.12 1D Lumped Model for thermal Design
Figure 4.13 Lumped Model results for Fluid thickness of 250um

95
Temperature spread obtained from1D simulations are show in Figure 4.14.
Figure 4.14 Temperature Spread in Water
The important observations from the results are as follows
i. We can know the time it takes for all fluid layers to come close enough in temperature.
Although we are measuring temperate at the bottom metal surface (or its equilibrated
there), there is still time for all fluid layers to reach the set temperature. To measure this
experimentally is very difficult.
ii. Metal acts as a local heat supplier. Therefore if the temperature is monitored at metal it’s
enough. To briefly explain these effects consider that the top layer of metal is in contact
with the fluid. If heat is applied the entire metal changes temperature much quicker than
the fluid. The heat contained now in the metal can move from layer to layer to the top layer
which is in contact with the fluid and equilibrates with it. If a similarly thick block of polymer
was set at the temperature this would not occur since heat cannot be transferred so quickly
from layer to layer.

96
iii. Having different thicknesses of metal changes the energy required for the whole cartridge.
This becomes important if the chip has to go in a POC instrument which needs to save on
energy. However thicker metal plate increases thermal uniformity horizontally as well in
case the heating and cooling excitation are uneven as in case of TECs.
iv. Heating element can be attached to the metal like a thin film heater or conductive ink. Thus
we would require low energy while achieving thermal uniformity and mechanical
robustness. This approach can also be very fast. However, it makes the substrate more
complex and more expensive than simple metal base.
v. In case of forced air convention cooling (using a fan for example) metal convection
coefficient has an advantage. Therefore metal substrate is better even for air cooled
systems.
vi. The top layer on the top is insulating and cannot supply or pass heat to atmosphere due to
high thermal resistance between layers. Thus it can be made thick as well. Making it thick
will increase mechanical robustness. Since materials like COP have very low auto-
fluorescence, such a design is both mechanically robust while being able to be queried
optically for real time PCR or high resolution melt type analysis.
vii. We would retain the advantages of metal even when we a very thin coating (biocompatible
or having some other function). When the coating is very thin the advantages of metal
would be relevant. Thus we can have an extremely thin polymer coating (having the surface
chemistry of it) which still not contained to make it thick as a substrate layer.
4.8.6 FE simulations – thermal- Structural
We have analyzed the thermal performance of the cartridge and its dependence on various parameters.
However, the cartridge should also maintain structural integrity while the temperature is cycling. This
becomes very important in case of metal substrate as polymers and metal have different thermal
expansion coefficients. Mechanical stresses can place different constraints on the selection of
parameters.
Since we want to use adhesive bonding, the stresses on adhesive become very important. The adhesive
has to sustain large temperature differences. There is a wide variety of adhesives available. Testing all of
these adhesives in not very practical. Thus getting some quantitative information by simulation is very

97
helpful to screen various adhesives in a predictive manner. It also allows robust design by calculating the
margin of safety for operations.
Surprisingly, we could not find a full thermal-structural simulation for PCR cartridges. However, there
may be many designs which are marginal and do not quality for six-sigma design for production and
safety.
The simulations also provide information about high stress points and areas which can guide in the
iterative design of cartridge.
To have a realistic design, we first used thermal simulations as described above. The thermal load
(temperature at each point in space) is applied to a structural simulation. In this way realistic
temperature distribution is applied to various bodies.
There is a complication in this approach due to fluid in the system. Although the thermal simulation can
use fluid as it treated all bodies as incompressible due to small displacements, the structural simulation
has to take into account such deformations. In actual system, the fluid can flow and it’s not a solid body.
As can be seen in Figure 4.7 , the air pillars have air entrapped which will allow fluid to move up as air is
easily compressed in those pillars. Thus the pressure applied by fluid all along can be approximated by a
constant pressure. The pressure can be approximated as vapor pressure of water. We can thus neglect
fluid body by making its relevant parameters for structural simulation such that they don’t affect other
bodies. Ansys® allows to perform this operation. Figure 4.15 how the basic mechanism for such
calculations.
Perform Transient Thermal simulation
1. Neglect Fluid and model its effect by applying vapor pressure
2. Perform Structural Simulations(Static and Transient)
Figure 4.15 Thermal Structural Calculation
One of the problems is to apply correct structural boundary conditions to the cartridge. In actual use we
want to put cartridge over a flat surface. The cartridge is not firmly fixed and is free to move and deform
at a very small scale. However, if we want to somehow constrain the cartridge to disallow rigid body
motion during simulation. This problem is solved by observation of transient thermal simulation. We
note that top of pillars remain at almost the same temperature till end of simulation time. We apply a

98
‘Fixed Support’ boundary condition to top of one pillar. Applying this boundary condition to both pillars
is not realistic to the actual use.
One of the main parameter in structural simulations is the adhesive thickness. Intuitively, a very thin
adhesive layer has to undergo more stress. It is important to know how adhesive thickness changes the
requirements on adhesive performance.
The stresses on adhesive give us quantitative information about required performance. This is of great
advantage since now instead of testing each adhesive on the cartridge, we can get adhesion
performance between simple shaped substrates and use our simulation data to find out which adhesives
are suitable for our application. If a new geometry has to be used, same measured data can be used.
The data for various adhesives which quantifies their performance in not readily available and may have
to be measured. However, tensile strength tests and similar common techniques are useful to get this
data. Flat and small substrates (typically 1inch by 4 inch) are used to get this data. Once measured the
data for a set of substrates can be used in simulation and significant changes can be made to design
without worrying about bonding issue.
The bonding issue in PCR cartridges, especially mass produced are notorious to cause leaks. We thus
provided a predictive way for robust design circumventing lot of expense, time and experimentation.
The results for simulation are shown in Figure 4.16. Note that the cartridge has to withstand
deformations due to forces generated by thermal loads.
Getting correct models for adhesives in not trivial. Both the adhesives mentioned above have glass
transition temperature lower than 95 °C. Thus the correct model might need viscoelastic parameters.
This data is not readily available. Nevertheless, the simulation allows to figure out trends and values
with estimated parameters.

99
(a) (b)
(c) (d)
Figure 4.16 Thermal-Structural Simulation Results
Figure 4.17 shows the shear and normal stress as well as deformation in the adhesive as a result of
thermal loads. Both shear and normal stress decrease with increasing bond line thickness as expected.

100
Figure 4.17 Stresses and Deformation in Adhesive
4.8.7 Choice of COP and its Properties
There are many polymers which have been used in PCR cartridges. Some examples are Polycarbonate,
polypropylene, Topas or COC (cyclic olefin copolymer) and COP (cyclic olefin polymer). COP is about 3
times as expensive as Polycarbonate. However, it has some excellent properties to be used for bio-
diagnostic purposed. COP has low water absorption, excellent optical clarity, low auto-fluorescence, low
surface energy, and low protein binding and good injection molding properties.
COP thermal properties are not readily available so we have provided them here. We notice that many
parameters change with temperature. As temperature rises, the heat capacity increases while thermal
resistance decreases. As thermal time constant is the product of thermal resistance and the heat
capacity, it’s interesting to see that overall thermal time constant increases with increase of
temperature. There is about 10% increase in thermal time constant from 20 ° C to 100 ° C. This non-
linear change has been considered in the simulation.

101
Table 4.5 COP 1420R Specific Heat
Temp C Cp(J/kg K) 51.15 1378.81 80.15 1574.61 110.15 1754.47 119.15 1825.96 128.15 1942.99 135.15 2074.11 142.15 2145.5 170.15 2273.41 205.15 2410.7 240.15 2536.1 275.15 2643.11 310.15 2701.66
Table 4.6 COP 1420R Thermal Conductivity and Resistivity
Temp C K(W/m K) Rth (K m/W) 31.15 0.161 6.211180124 48.15 0.158 6.329113924 80.15 0.172 5.813953488 111.15 0.181 5.524861878 141.15 0.206 4.854368932 171.15 0.215 4.651162791 201.15 0.218 4.587155963 231.15 0.228 4.385964912 261.15 0.235 4.255319149 291.15 0.245 4.081632653 321.15 0.263 3.802281369

102
Figure 4.18 Thermal Time Constant vs Temperature of COP 1420R (Interpolated data)
4.8.8 Bonding
Since metals and polymers have different CTE’s there will be stress on the adhesive bond. This will also
change as a function of the properties of adhesive and its thickness. Metals and the polymers are solids.
However due to the pillars and entrapped air the fluid will move. To model this fluid modulus was set to
extremely low value so that artificial effects of its expansion are not there. A vapor pressure of 13 psi
was used in the chamber which is the vapor pressure of water at 95 °rees.
Such modeling helps in screening adhesives which would be useful for this application and the methods
of their application. It is difficult to find out the stresses which would be developed by other methods.
Figure 4.16 shows the stresses developed which the adhesive bond must survive.
4.8.9 Optical
To enable optical detection for real time PCR, COP has excellent optical properties like very low auto-
fluorescence.
The surface is metal is desired to be smooth and reflective. This is additional advantage of metal. If
polymer substrate is coated with metal then a similar optical performance can be achieved. This allows
the fluorescence which is directed in the downward direction to be reflected upwards.

103
ZEONOR 1420R, 2mm
Topas 8007 COC Polystyrene, 1.5mm
Figure 4.19 Auto-Fluorescence of COP 1420R vs Topas and Polystyrene
Key features of selected polymers are given in [100].
Acronym Water absorption (%)
Optical tranmissivity Visible (%)
Cyclic Olefin (co)polymer COC/COP 0.01 >92 Polycarbonate PC 0.12-0.34 90 Polypropylene PP 0.1 ~50 Polyethylene PE 0.01 low
4.8.10 Design Features of Cartridge
We have established that a thick top does not compromise thermal performance. As such thick top is
easy to be produced via injection molding. Having thin and long features are a problem with injection
molding process [101, 102]. Having very thin walls are thus not much feasible with injection molding and
hence the cost of such designs can be more.
Injection molding also provides us with many desirable features while lowering production and assembly
cost. Injection molding can provide complex 3D features which are not suitable to be produced via
silicon micromachining including lithography techniques. Various other techniques for microfluidics like
LOM (laminated object manufacturing) also don’t provide 3D thick features and to add additional
elements can make the chip much more complex [103].

104
From our previous experience with building cartridge with adhesive tapes, we appreciated the
importance of connectors and the difficulty of putting them as a separate component, as is done with
nanoport connectors.
We thus added ‘pillars’ on each side of cartridge. The pillars act as inlet and outlet. The diameter is
around 1.5mm which fits well to pipette tips. The inlet has slight fillet to allow docking and sealing of
pipette tip. There is flat area (support structure) on the top side of pillars. These are useful to apply
seals, holding cartridges and during processing and fabrication of cartridges.
The support structure on top of pillar is convenient for sealing and acts as a useful place to hold while in
operation and processing. We used these in the jigs for vacuum metallization, plasma cleaning and
adhesive bonding jigs.
Sealing
Although the cartridge can be sealed using adhesive films conveniently we designed a custom seal which
can slide over the cartridge. There is an option of making the closing part an integral part of the
cartridge like a PCR cap. This can be done in production but would make the tooling expensive during
prototyping. However with sufficiently large quantity this is an attractive option and the cartridge can be
sealed like a PCR tube on both or one ends. The seal compresses the rubber. Figure when it slides on the
supports of the pillars. The seals can be made suing a 3D printer. The seals as given in[86] don’t have a
pillar structure for variable fill volume and air volume. Also this design covers some of the top portion
thus reducing area of optical interrogation or optical observation during filling or operation. This can be
reduced by having long channels but that increases the dead volume. Our seal design does not block
area of optical interrogation.

105
Figure 4.20 Cartridge with Seal
Sample injection
If the chip is flat (2D) then one has to be very careful putting in right amount of fluid. The excess fluid or
even the correct amount can come out of the other side due to pressure applied by pipette. The thermal
expansion will put additional stresses if there is no air in the chamber. The pillars not only serve as
convenient connectors but also allow air in them to be compressed thus reducing stresses. Air also acts
as insulator.
The chip allows easy sample injection using a pipette. By injecting the right volume, the fluid fills the
cavity without bubbles. There is an air gap between the fluid and the seals due to the integrated pillars.
This design is more forgiving of casual filling as would be a fully planar chip. Also the temperature at the
seal is reduced due to insulating properties of air.
Lyophilized Reagent Storage
The lyophilized reagents on a polymer substrate has its problems. Polymers have varying degrees of
moisture absorption and reagent absorption as well. To circumvent this problem aluminum deposition is
normally done to reduce the absorption for long term storage of reagents on chip. However in our case
since the lyophilized reagents can reside on the surface of Aluminum, long term storage is effective. The

106
metal plate in a tray lyophilizer would allow very fast heat transfer and lyohpilizaition can be performed
directly on the Aluminum plate before being assembled.
4.8.11 Cartridge Filling Simulation
The cartridge shape should be such as to allow full filling. The contact angle on Aluminum and
unprocessed COP is different. We have to design the chamber shape to allow for variations in
parameters so that filling is reliable in operation.
Following are brief specifications for the simulation
• We used VOF (Volume of Fluid) Methodology to model multiphase flow
• The fluid domains were water and air
• k-e Turbulence model was used with Implicit body force enabled
• Gravitational acceleration was considered
• Surface Tension with wall adhesion is modeled (this can be changed as parameters to ensure
filling with varying specifications)
• Adaptive time-stepping was used
Figure 4.21 shows results of the simulation in animation form.

107
Figure 4.21 Cartridge Filling Simulation
Conclusions
We have studied the limitation of existing systems by accurate simulations. We listed the key
requirements which point of care qPCR cartridges should meet. We then present our concept and do a
simulation guided design. We first do thermal simulations. We used the thermal load to calculate the
stresses which the adhesive has to withstand. We have provided a predictive way to find the correct
adhesives for such applications. The cartridge was also added with many useful design features like
integrated fluidic connectors, supports and sealing ports. By using COP as the polymer material we hope
to have excellent optical performance.
Our design provides a solution to many longstanding and hidden problems. We have provided a way to
heat and cool from one side while still having a mechanically robust design with large optical
interrogation area. Our design is amenable to lyophilized reagent storage as well. Due to mechanically
robust and rigid cartridge, the placement is much easier. Due to metal substrate the heat transfer
performance is expected to be much better as compared to polymer based systems.

108
5 Metal-Polymer Cartridge for Quantitative Real Time PCR at Point Of Care – Fabrication and Test
Introduction
In the first part, we performed simulation based design of the cartridge including simulations for
adhesive bonding. However, it should be mentioned that there are other ways for bonding as well which
can be employed [100].
5.1.1 Bonding Method Selection
We can divide these techniques into polymer to polymer and polymer to metal for our purposes. We
consider polymer to polymer as well since we can coat the metal with a polymer if that is the only
feasible way. Polymers can be joined in a wide variety of ways including direct bonding (adhesive
bonding) and direct bonding ( thermal bonding, solvent bonding, laser welding, ultrasonic bonding,
surface treatment and modification ) and mechanical methods (seals under pressure) [104].
Adhesive bonding has the advantage of joining dissimilar materials as is sort of a universal method
provided appropriate adhesive can be applied. Adhesive bonding is also widely used and is one of the
lowest cost methods. Adhesive bonding can be fast and there are easily automated for production. For
our purposes, adhesive bonding can preserve our design intent of having a simple metal substrate with
reflective surface. Metals in simple shapes are cheap and easily available.
Direct methods can require much more control may be difficult to automate especially when it comes to
small sizes encountered in lab-on-chip devices. Thermal bonding requires precise control [105-108]. The
process parameters have to optimized and the surface quality can still suffer [106]. The minimum

109
feature size can also be a limit in this process. Thermal bonding of COC is also studied and the process
parameters are described [109]. Thermal bonding has another major problem in our case. If the
substrate already has lyophilized reagents, thermal bonding may not be feasible due to the temperature
which the reagents have to go through. Thermal bonding also seems very slow in production and not
feasible for out purposes. Thermal bonding also requires special pressure controlled jigs or presses. The
pressure and temperature may have to be controlled over time and many have to follow a profile. Given
we are interested in producing a large number of cartridges, this is a very expensive preposition.
Solvent bonding[110] has been used for various substrates including polycarbonate(PC),
Polymehtylmethacrylate (PMMA) and cyclic-olefin copolymer (COC) [103]. Various companies now offer
solvent bonding services. Solvent bonding protocols for COC are given in [103].
Solvent bonding has various problems. It can cause surface roughness. We want to preserver optical
quality of our cartridge due to optical design which will be discusses later in the thesis. Solvent bonding
also requires very high quality surfaces. Thus the injection molding has to be high quality. Solvent
bonding also requires pretreatment especially vacuum drying which is not needed for adhesive bonding.
Special precise equipment is needed for solvent vapor or liquid application and special jigs have to be
made to keep the exposed substrates under pressure and temperature profiles. As such it has few of
same problems as thermal bonding. It is also not compatible with our idea of having lyohpilizaition done
before assembly on the substrate. The bond strength of solvent bonding can be very high and an
approach that of bulk material. Solvent bonding has also been shown to preserve narrow channels. For
optical applications, another advantage of solvent bonding is that there is not issue of auto-fluorescence
of adhesives. Solvent bonding can be slow since the parts may have to stay in special jigs till fully
bonded. Solvent absorption in the polymer is another potential problem of solvent bonding. Additional
drying may be needed to get rid of absorbed solvent but this may not be desirable is the cartridge
houses lyophilized reagents.
COC and COP are one of the toughest polymers to bond via adhesives due to their low surface energies.
Table 5.1 shows surface energy of various substrates. Note that Aluminum and Copper have very high
surface energy. It may look counter-intuitive that mirror finish Aluminum is easier to bond then plastic
but adhesive action is mostly chemistry which happens at molecular scale.

110
Substrate Symbol Surface Energy (dynes/cm) or (mN/m)
Aluminum Al 840 Copper Cu 1103 Glass 250-500 Polycarbonate PC 46 Polydimethylsiloxane PDMS 42.1 Polypropylene PP 30 Polymethylmethacrylate PMMA 41 COC/COP 30 Polyethyleneterephthalate PET 43 Teflon (Polytetrafluoroethylene) PTFE 19 Polyvinylchloride PVC 41.5 Table 5.1 Surface Energies of Various Substrates
There is a large variety of adhesives available. Adhesive business runs into billions of dollars annual
globally. We are mostly interested in medical adhesives. At its simplest adhesive tapes were considered.
Such tapes are also available in PSA(pressure sensitive adhesive) formulations [111].However there are
multiple problems with this approach. In general these tapes don’t have bond strength which one can
get using applied adhesives which are later cured. There is inflexibility in thickens of tapes especially at
the lower end. The second is optical consideration. Such tapes add more interfaces to the cartridge. The
overall cost of such a structure may be larger than applied adhesive.
We thus focus attention to clear adhesives for medical applications. Certain figures of merits were
defined. Optical clarity is required. Temperature of operation must sustain PCR process. Water
absorption should be low. The adhesive should be compatible with PCR process. The auto-fluorescence
should be low. In general auto-fluorescence data is not available for these adhesives and hence this has
to test in the lab. However, with optical design, it’s possible to mitigate the effect of auto-fluorescence
of the adhesive.
For our cartridge design it’s important that adhesive bonding works. If adhesive bonding works with
COC/COP then we can be very confident that various substrates with similar geometry can be used and
we thus have a fast and universal method to bond similar and dissimilar materials. Adhesive bonding is
also forgiving of the surface flatness and does not demand strict constrains on injection molding
process. Adhesive bonding also allows a low cost and well established production process.

111
Materials
5.2.1 Metal
We tried various kinds of metals – mainly Aluminum due to its reflectivity in all visual range. Aluminum
is low cost and widely available. It’s not trivial to polish Aluminum in a typical research lab. However,
reflective Aluminum has various uses in optical applications. For example they can be used as reflectors
in lamps. Over the years and due to widespread use of Aluminum, mirror finish Aluminum is easily
available.
We used multiple substrates. . Alloy 1101, mill finished, 0.016” thick were bought from McMaster.
Mirror finish alloys were bought from alumina (Canada).
Of particular interest was reflective Aluminum procured from Anomet®. This company supplies
reflective Aluminum which have categories of anodized or electro polished, PVD (physical vapor
deposition) Aluminum enhanced and PVD silver enhanced. The electrolytic anodizing process generates
a hard oxide surface and provides reflectivity of about 87%. With their PVD processes and application of
multiple coatings, reflectivity reaches to about 95%. The surface is exceptionally durable with a 25 year
warranty. Even then the cost is relatively low. Table 5.2 shows the layer system of these Aluminum
sheets as obtained from website. Note that top layer is an oxide layer system.
(a)(b)
Table 5.2 Reflective Aluminum Coatings

112
Surface flatness has to be maintained for the use of these sheets as substrates for our cartridges.
Various methods were tried including waterjet, steel rule dies, and die cut with special shear die and
laser cutting. Die cut in normal tonnage machines bends the metal. Flattening the metal using a
plenisher deteriorates the optical quality. These sheets are other reflective sheets typically come with a
plastic cover sheet. Using waterjet removes the sheet and also degrades optical finish, most probably
due to high speed water with abrasive. Laser cutting is attractive except that the cover sheet is removed
due to heat. The sheet was cut in desired shape by a shear die which retained the cartridge. This method
is extremely low cost and fast. It also retains the cover film and is better than laser cutting in speed and
cost. Part received after this process did not need much cleaning due to intact cover film which can
simply be removed. It should be mentioned that Aluminum is susceptible to adhesion by organic
compounds due to its high surface energy and cleaning can become an issue if the process of fabrication
lends itself to deposition of organics to the surface. Parts as received by various processes are shown in
and the die to be used in our lab is shown in Figure 5.1.
Figure 5.1 Dies for Metal Cutting
5.2.2 Polymers
We first tried to fabricate cartridges using hot embossing in our lab using a simple mold and by pressing
palettes between platens of a carver press. This technique has been successfully applied to formation
for many devices including channels. However, our cartridge has thick areas as well and voids were
observed as shown in Figure 5.2 . Another problem with this approach is long time needed to produce
the desired quantity. Also note that this is not suitable for making pillars and support structures which
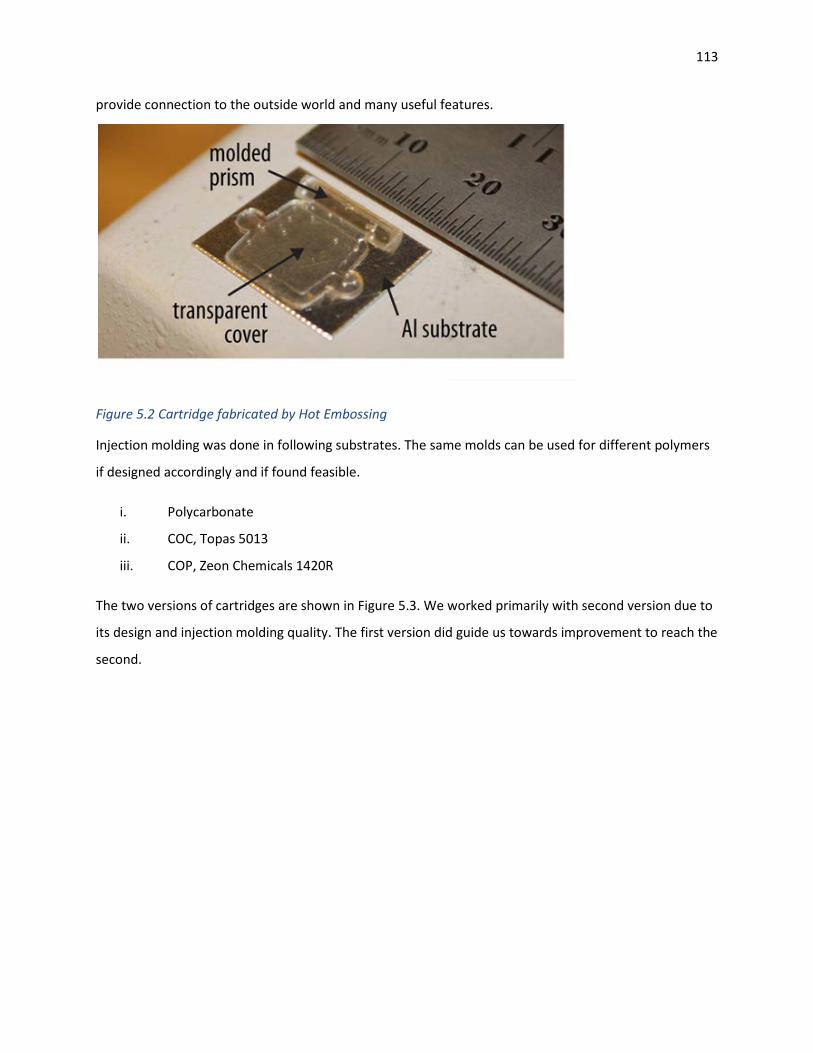
113
provide connection to the outside world and many useful features.
Figure 5.2 Cartridge fabricated by Hot Embossing
Injection molding was done in following substrates. The same molds can be used for different polymers
if designed accordingly and if found feasible.
i. Polycarbonate
ii. COC, Topas 5013
iii. COP, Zeon Chemicals 1420R
The two versions of cartridges are shown in Figure 5.3. We worked primarily with second version due to
its design and injection molding quality. The first version did guide us towards improvement to reach the
second.

114
(b)(a)
Figure 5.3 Cartridge Versions
5.2.3 Adhesives
The selection of adhesive is one of the main efforts in fabrication and design of cartridges. We could not
find an earlier example of this concept for PCR application. Adhesive bonding of COC with metal was
studied in [112]. However the polymer was vacuum coated with Aluminum and thus it was a metal to
metal bond. Metallization of plastics is common process. In our case we had to deposit Aluminum on the
bonding area as shown in Figure 5.4 Bonding Area. A special jig was made the cartridge was metallized
at the desired area. Metallization has further benefit that the adhesive is under the metal and hence
auto-fluorescence problem is reduced. Nevertheless this is an additional step in the manufacturing of
cartridge and it would be more desirable if we can bond polymer directly to metal base or coated metal
base.

115
Figure 5.4 Bonding Area
A rather long list of shortlisted adhesives was selected and many were tried. We describe two of the
most successful ones. They are as follows.
i. Loctite M31-CL Medical Epoxy two part
ii. Dymax 1072-M Medical Light/UV Cure adhesive
Both adhesives are optically clear. Dymax 1072-M is a new adhesive introduced in 2013 so we worked
with Loctite M31-CL for first few years. Dymax 1072 is specially mentioned as COC/COP bonder but has a
long list of compatible substrates including aluminum and many plastics. It’s exceptionally flexible. I has
low auto-fluorescence. It flexibility and rubber like characteristics in cured state are very useful for our
purposes.
To test biocompatibility of both adhesives, we cured them inside PCR tubes and then added PCR
reaction mixtures over them. We then ran them in commercial PCR machines. We did not found any
appreciable change in amplification performance. Commercial real time machines also give rough
comparison between auto-fluorescence of different adhesives. Positive displacement pipettes can be
used to control the dispensing of viscous adhesives.

116
UV adhesives are very attractive in production due to very short cure time. They also have almost
unlimited working time.
Two part epoxies have working time limitations. Once mixed the adhesive viscosity starts changing and
for our deposition technique, we have to cater for it over time.
Fabrication
5.3.1 Cleaning and surface Treatment
Cleaning is very important step in adhesive bonding. The aluminum surface also requires thorough
cleaning. Very thin layers of organic material can deposit which is visually hard to see. To clean
Aluminum substrates we used oxygen plasma for 5 minutes. Thus the substrates received though shear
die cutting have a major advantage as they can be put in plasma just after removing the cover film. They
don’t have to be washed and then put in ultrasonic cleaner. For other cases we put the metal substrates
in water-isopropanol mixture for 15 min in ultrasonic bath. However in production, retaining the cover
film has a major advantage. We also had successful bonding without any cleaning in the case of die cut
parts. However, plasma treatment is recommended. The inline atmospheric plasma built for production
lines are a feasible option for large scale production.
The polymer parts were received from injection molding process. It is possible that there is some form
of organics like mold release compounds still on the surfaces. The parts were put in ultrasonic bath for
15 min in water-isopropanol solution. The parts were air dried and then put in oxygen plasma for 5 min.
the plasma cleans the surface and makes it hydrophilic. Thus adhesives can have a better action. Plasma
treatment changes the contact angle on the surfaces.
We also used plasma treatment on injection molded pieces without washing and achieved bonding.
5.3.2 Patterning
One of the most challenging aspects of fabrication is the adhesive patterning. Various approached have
been used for adhesive bonding. However our case is different in the respect that the bonding area is
much smaller than the cavity. Adhesive printing was used in [113]. Interstitial bonding was used in [114].
Adhesive bonding has been reviewed in []. There are various books on the subject as well []. However to
the best of our knowledge this application is not given a clear solution. We compared various techniques
for this purpose

117
i. Manual application
ii. Screen printing
iii. Spinning (lithographic techniques)
iv. Stamping
v. Pad printing
vi. Cylinder based printing
vii. Robot dispensing
viii. Under fill process
To have a repeatable process the bond line thickness should be consistent. The amount of adhesive
should be same between cartridges. As can be seen in Figure 5.4, there is a large flat area on which
adhesive has to be dispensed but the thickness can be very small.
Initially we tried putting adhesive by a tooth pick and then joining putting the polymer part on top of the
metal with some clamping mechanism. This had low yield and the method was not repeatable.
Screen printing could not apply a thin enough adhesive. There is a minimum thickness of the mesh used
in such operations. Also the technique is not convenient to automate at small scale. The control on
amount of adhesive is also much more difficult. When using adhesives with limited working time, the
mesh would become clogged or has to be cleaned repeatedly.
The adhesive has its own fluidic properties like surface tension and viscosity. Even if the required
amount of adhesive is dispensed on the bonding surface the adhesives don’t remain flat.
In silicon processing applications, epoxies like SU-8 and retain high quality of flatness[115]. However,
our shape does not permit spinning to control thickness unless special adapter are prepared. This will
however, make operation much more complex. Also we want to use adhesives commonly available
without special changes to viscosity. SU8 has been used as an adhesive [116].
Stamping, pad printing and cylinder based printing are adhesive transfer methods.
Pad printing is a widely used stamping techniques which is very fast and accurate. The pad printers are
optimized for inks not adhesives so cleaning of the adhesives after each run is to be ensured in case of
adhesives with finite working times. There is not much flexibility in the thickness of adhesive applied.
For good control the depth of etch on the plates has to be varied. However pad printing is very fast and
precise and deposits the adhesive in one stroke in contrast of robot moving across a path. The plates can

118
be prepared by etching into steel for long life. There are laser pattern able plates also available which
can be used for rapid testing. They are available for different thicknesses of the polymer layer. The
polymer layer controls the thickness of the etch cavity (and hence the adhesive) since the cavity is
ablated by laser. However, viscosity of the adhesive comes in to play. Typically the shapes of pads will
make full contact with the polymer surface if the adhesive is being applied to it. This many not be
desirable so a hollow pad might have to be developed for this purpose. We tried PAD printing in our
effort. However, it was difficult to control adhesive flowing out at undesirable places. This is a serious
problem with M31-CL. Technique similar to PAD printing has been used to bond PMMA chips with
channels [113].Figure 5.5 shows the pad printer and various plates. The Steel plates for the cartridge are
also shown.
Figure 5.5 Adhesive application by PAD Printing
Cylinder based application of adhesive is an interesting option [117]. However, this requires an
elaborate setup and in not amenable to tested in a typical research lab. Also the flexibility to change the
amount of adhesive is limited. For low viscosity adhesives, there may be a problem if one uses this
technique.

119
For quickly and accurately controlling the amount of adhesive, electronically controller dispensers are an
attractive option. They are widely used in industry. Both air pressure driven and positive displacement
types are available. The amount of adhesive can be controlled by regulating the air pressure. The
amount can also be controlled by timing. Thus they provide great flexibility to control adhesive quantity
for adhesives of various viscosities. One can also change the parameters for adhesives which change
viscosity during working time to have consisted amounts dispensed.
However, it’s still a challenge to apply adhesive on the entire area in a consistent fashion manually.
Therefor a 3D fluid dispensing robot was used to have a repeatable amount of adhesive on the
cartridges. The robot also controlled the dispenser to start dispensing at correct locations. Various
pressures, tip sizes were tried to reach a set value. This setup gives lot of flexibility in quickly changing
the amount of adhesives dispensed without changing the setup. The robot was programmed to dispense
in the center line between boundaries of the bond area. The tip was brought close enough to the
cartridge so that the adhesive bead touches the surface. This is important since adhesive has a tendency
to climb up the syringe tip and hence not being deposited. By having speed, pressure and distance
controlled the dispensed adhesive kept on joking the already transferred adhesive and hence the whole
bond line was covered. We used cameras with zoom to see the quality of dispensing in operation. The
system has to be calibrated after change of syringe only. This is also aided by the camera setup. We
changed the air pressure with time for M31-CL. However with UV adhesives, things remained constant.
Figure 5.6 shows the setup for adhesive dispensing. The technique is very repeatable and fairly quick.
Automatic image processing based inspection is possible during production. Image processing tools can
also help in automatic registration after changing tips.

120
(a)
(b) (c)
Figure 5.6 Robot based dispensing setup
Underfill process is also used in semiconductor industry and is an interesting technique [118]. This is
used in flip chip assembly as well. In our case we can have some bumps injection molded as a part of the
polymer part of the cartridge. In under fill process the robot dispenser can dispense in continuous way
to dispense jets along the boundary of the cartridge. The concept of underfill in show in Figure 5.7.
However, in our case the adhesive should only cover bond line and not proceed further into the
cartridge. Since our cartridges had flat surfaces underfill process was not tried.
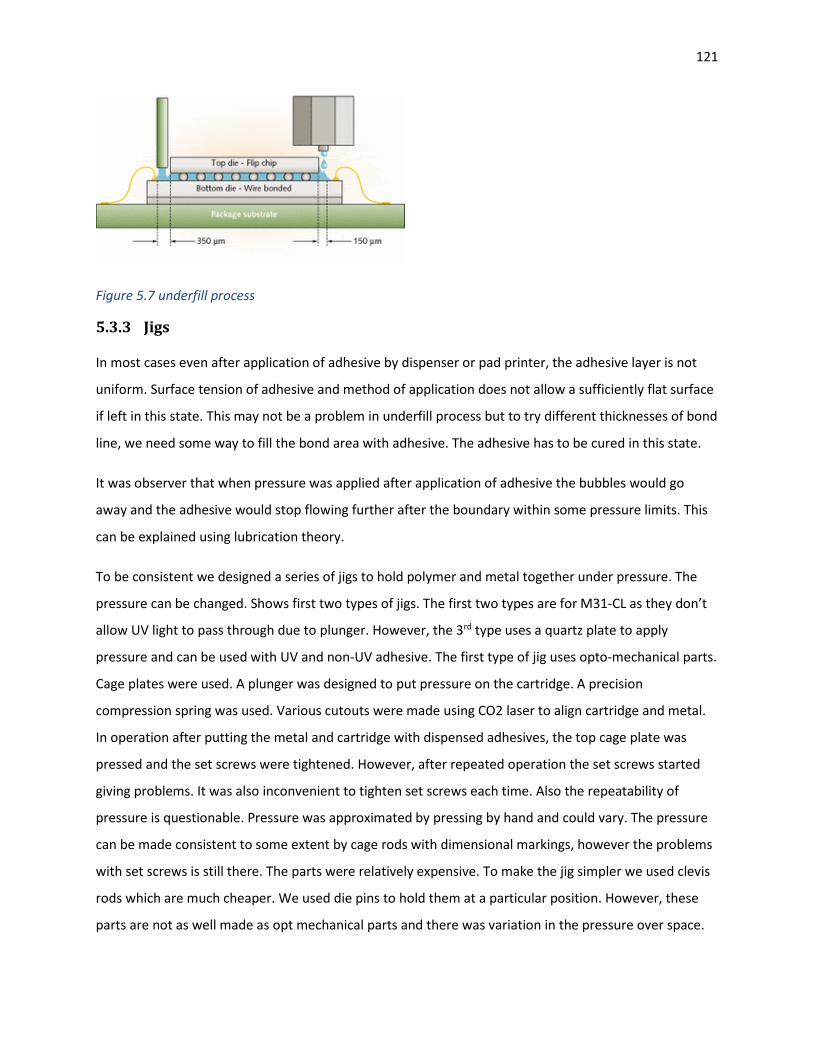
121
Figure 5.7 underfill process
5.3.3 Jigs
In most cases even after application of adhesive by dispenser or pad printer, the adhesive layer is not
uniform. Surface tension of adhesive and method of application does not allow a sufficiently flat surface
if left in this state. This may not be a problem in underfill process but to try different thicknesses of bond
line, we need some way to fill the bond area with adhesive. The adhesive has to be cured in this state.
It was observer that when pressure was applied after application of adhesive the bubbles would go
away and the adhesive would stop flowing further after the boundary within some pressure limits. This
can be explained using lubrication theory.
To be consistent we designed a series of jigs to hold polymer and metal together under pressure. The
pressure can be changed. Shows first two types of jigs. The first two types are for M31-CL as they don’t
allow UV light to pass through due to plunger. However, the 3rd type uses a quartz plate to apply
pressure and can be used with UV and non-UV adhesive. The first type of jig uses opto-mechanical parts.
Cage plates were used. A plunger was designed to put pressure on the cartridge. A precision
compression spring was used. Various cutouts were made using CO2 laser to align cartridge and metal.
In operation after putting the metal and cartridge with dispensed adhesives, the top cage plate was
pressed and the set screws were tightened. However, after repeated operation the set screws started
giving problems. It was also inconvenient to tighten set screws each time. Also the repeatability of
pressure is questionable. Pressure was approximated by pressing by hand and could vary. The pressure
can be made consistent to some extent by cage rods with dimensional markings, however the problems
with set screws is still there. The parts were relatively expensive. To make the jig simpler we used clevis
rods which are much cheaper. We used die pins to hold them at a particular position. However, these
parts are not as well made as opt mechanical parts and there was variation in the pressure over space.

122
Also note that the base in this case was made of laser cut acrylic. During curing of adhesives, we used to
put them in an oven at 75° C. However, since acrylic was under pressure it bent. We put glass slide at
bottom surface to mitigate this effect. Dimensional tolerances and the shape of the clevis pins were a
major problem to cause inaccuracies.
Both the above mentioned jigs are not suitable for automation as they have to be joined in a
complicated way. For automation, a robotic arm should be able to perform the operation of jig in a
rather simple way. We also wanted to have the next jig to allow UV bonding. Figure shows the jig which
allows UV and non-UV bonding. Optical stages are used in this design. They allow excellent
perpendicularity and a very repeatable pressure. The optical stages are available with springe of
different stiffness’s and hence different pressures. A quartz plate was machined to allow good UV and
light transmission. The base was made with optical parts. The stencils were of metal and were laser cut.
Repeated use of intense UV with plastics stencils is not a good idea. This jig is high performance, easy to
use and very consistent. The design also shows way to automate the process in production.
(
(a)
(b)
Figure 5.8 First Two Types of Jigs

123
Figure 5.9 UV adhesive Jig. (a) Shows CAD diagram of the assembly. (b) Shows the stencils and base to align metal and cartridge. (c) Shows a picture of the actual setup
Test Setup
The cartridge was initially tested in a flatbed cycler (GenePro Thermal Cycler, Bulldog Bio). However, the
speed of such systems is extremely slow for our purposes. We also wanted to execute complex assays
like touch down PCR and easy changes in protocols. Building such an application with tools like LabView
is not very productive. Also the real time nature of the system required various sensors to be
synchronized. We thus resorted to writing the code in Microsoft Visual Studio. We selected C# as
programming language. We tried different thermal controllers with profile capability and ramp and soak
features. These controllers are typically made for much slower systems. They do work for our
application but the control algorithms were not in our control and synchronization of other sensors like
optics has to ensure. We thus wrote code for thermal control as well. The software ran on a PC under
Microsoft Windows environment. The great benefit of such a system is its ease of trying different

124
algorithms. Commercial controllers like Watlow are typically PID based only. There are advanced
controllers available from other companies which interface to some of these controllers but this makes
the system complex and can add more hardware. Thus synchronization can become a bigger issue.
Having PC as real time controller also has a big advantage of getting graphing and other libraries to
speed up development.
Figure 5.10 shows the hardware setup for testing the system. This is an elaborate setup to have detailed
information about the cartridge operation. High speed sensor interface modules were used (USB 2414
from measurement computing and TC-08 from Picolog). These provide both Thermocouple and RTD
inputs. USB 2414 can also measure resistance and thus a custom RTD sensor can be used. To generate
PWM, USB 1608G from measurement computing was used. The same module was used to route the
PWM signal so that both heating and cooling can be achieved via the H-bridge. The H-bridge was
implemented by high speed solid state relays with integrated heat sinks.
Controller PC
Universal Interface(TC, RTD,
Resistor, Voltage)
TC Interface
PWM generator
CameraGigE
Fluorometer
High Current H-Bridge
Copper PlateTECWater Block
Photodiode Amplifier
Programmable Motorized Filter
Wheel
Cell Phone ImagingProgrammable
LED Driver
Recirculating Chiller
Coolant
High Power DC Power Supply
Figure 5.10 Test Setup

125
We wanted the actual heating cooling surface to be under darkness. We tried Peltier cyclers with fans
and heat sinks. However this makes the assembly bulky. Also the whole assembly was supposed to be
under a black box on an optical table. We used a water block with circulating chiller. This keeps the
assembly small and quiet. The performance is also very good. Only pipes need to go into the light
blocking enclosure. A picture of the setup is given in Figure 5.11.
Figure 5.11 Thermal Setup
There are problems if we put the cartridge directly on the peltier surface. The temperature profile on
the surface is not uniform. Also we have to somehow attach a sensor. We thus got a metal plate
machined in Copper. The thickness was 2mm. A small whole (1mm diameter) was to allow a thin
thermocouple to reside inside. It’s advisable to apply thermal grease to make good contact with metal
surface inside the hole. Thus the temperature is measured and the whole top surface is available to
place the metal base cartridge. 2mm is a good thickness for heat spreading if copper is being used. The
three components were joined by first placing thermal grease and then using screws with breville
washers to keep all parts in good contact. Figure 5.11 shows the assembly.
The software allowed synchronized information collection from variety of optical sensors. We showed
that Qiagen ESE log can indeed be used for real time. Earlier it was mentioned that it can be used for
end time detection [69]. That may be probably not integrating the instrument with software. In that
setup the cartridge was suggested to be put on a flatbed cycler and fluorescence can be read by ESE log.
However, our setup is much faster and cheaper than a flatbed cycler with full real time capability. It also
does not need an adapter and takes much less bench space. It only uses one peltier while the flat bed
cyclers typically use four elements.

126
We used PID controller. The software allowed assays with arbitrary number of steps. Melting curve
could also be obtained.
The camera was also synchronized to the software. The software can take a picture at annealing time
and thus a history of full images labelled by cycle number can be obtained. The software can also trigger
picture capture via an android phone. An application was developed to take picture at the right time for
the phone. Getting pictures via camera is a good diagnostic tools to track fluid motion, bubbles and
bonding failures if any.
Reagents
We tested following assays on our system
i. STD assay with multiplexing via melt curve
ii. Multiplex Dengue and Malaria Assay though our collaborators at Stanford. This was a probe
based assay.
Following are the assay details
5.5.1 STD Assay
In order to test the thermal and optic system a multiplex real-time PCR assay using melting curve
analysis for identification, designed and characterized at Dartmouth by Ahmad N. Abou Tayoun, was
used.
Sexually Transmitted Disease (STD) panel was tested and optimized using clinical samples and then
tested in our system using synthetic targets. The real-time PCR primers for the identification of
trichomoniasis, chlamydia, gonorrhea, and an internal control, their synthetic target sequences, and
their melting temperatures (Tm) are shown in Table 5.3. All oligonucleotides were synthesized by
Integrated DNA Technologies (Coralville, Iowa).
PCRs controls were conducted with the CFX96 Touch™ Real-Time PCR Detection System (Bio-Rad
Laboratories, Hercules, CA). The same reaction mixture and conditions were then replicated using our in
house POC system. The PCR mixture contained forward and reverse primer concentrations of 100nM CT
(chlamydia), 175nM of NG (gonorrhea), 125nM TV(trichomoniasis) and 150nM IC2 (internal control) as

127
well as 2× SsoFast™ EvaGreen® Supermixes (Bio-Rad Laboratories, Hercules, CA), UltraPure™
DNase/RNase-Free Distilled Water (Invitrogen, Carlsbad, CA) and each template DNA at 4uM in a 50μl.
Primer Target Sequence (5'→3') Tm (°C) Primers C. trachomatis CTn8F TCTGAGCACCCTAGGCGTTT 58.6 ºC CTn8R CGTAACTCGCTCCGGAAAAA 55.3 ºC N.
gonorrhoeae NG3F CCGGAACTGGTTTCATCTGATT 55.2 ºC
NG3R GTTTCAGCGGCAGCATTCA 56.6 ºC T. vaginalis TV1F AAGATGGGTGTTTTAAGCTAGATAAGGT 56.1 ºC TV1R CGTCTTCAAGTATGCCCCAGTAC 57.3 ºC S. oleracea a IC2Fa GGTCGTTACTGGACAATGT 52.1 ºC IC2Ra GAATCCAATGATACGGATGAA 50.1 ºC Target CTn8T TCT GAG CAC CCT AGG CGT TTG TAC TCC GTC
ACA GCG GTT GCT CGA AGC ACG TGC GGG GTT ATC TTA AAA GGG ATT GCA GCT TGT AGT CCT GCT TGA GAG AAC GTG CGG GCG ATT TGC CTT AAC CCC ACC ATT TTT CCG GAG CGA GTT ACG
NG3FT CCG GAA CTG GTT TCA TCT GAT TAC TTT CCA GCG TGA AAG TAG CAG GCG TAT AGG CGG ACT TGC TGT TTT GAC TCG GAA CAA ATT GAA TGC TGC CGC TGA AAC
TV1FT AAG ATG GGT GTT TTA AGC TAG ATA AGG TAT TTT CCG AAG TTC ATG TCC TCT CCA AGC GTA AGT ACT GGG GCA TAC TTG AAG ACG
IC2FaT AAG ATG GGT GTT TTA AGC TAG ATA AGG TAT TTT CCG AAG TTC ATG TCC TCT CCA AGC GTA AGT ACT GGG GCA TAC TTG AAG ACG
Table 5.3 STD Assay
Results
We ran the assay in our cartridges and Bio-rad CFX 96 deep well real time PCR Machine. We cannot
increase the speed beyond a certain point in the machine. Also the machine does not allow continuous
fluorescence monitoring which we found very useful for our purposes.
Figure 5.12 and Figure 5.13 shows the amplification and melt curve for SsoFast Reference Assay (Bio-
rad) for an intercalating dye. We also record the continuous time fluorescence and a portion of it is
shown in Figure 5.14. It is interesting to see that fluorescence change can be observed even during first
cycle.

128
Figure 5.12 Amplification Curve
Figure 5.13 Melt Curve

129
Figure 5.14 Continuous Fluorescence Curve
To verify our modelling we observe the continuous time fluorescence graphs in the plateau phase. This
is show in Figure 5.15. It is interesting to note that the fluorescence increases in a similar pattern as
predicted by modelling. The change is fluorescence gives a good measure of the speed of heat transfer.
In our case it clearly shows the role of liquid and polymer to dictate the thermal speed. Also shown is
the graph of quantity (100 – Temperature) to have a clear view of delays between temperature and
fluorescence measurements.

130
Figure 5.15 Thermal Response of Cartridge
5.6.1 Tests with Different Metal Bases and Efficiency Calculations
We tested with three different types of Aluminum bases. For efficiency calculations we did single rue
efficiency calculations. We found efficiency approaching a value to 2 (that is ideal) in case of Amonet
Miro IV substrates.
Figure 5.16 shows amplification curves for ssoFsat reference Assay (Bio-rad). The efficiencies for S1, S2,
S3, T1, T2, W2 and W3 are 1.83 1.89 1.94 2.02 2.02 1.86 1.89 respectively. This is similar to what we
obtained for same reaction in Bio-rad CFX. Calculating efficiency by single curve methods has the
advantage of coping with various issues which can cause conditions to change in the experimental
setup.

131
Figure 5.16 Amplification Curves for various metal substrates
5.6.2 Efficiency Calculations
5.6.2.1.1 Baseline Correction
Baseline is the background noise level before a significant amplification occurs. In order to find the
correct amplification efficiency this background noise must be subtracted from the fluorescence signal.
The algorithm used to find the baseline is the modified version of the algorithm used in
LineRegPCR.[119]
This modified algorithm use the same comparison of Supper and Slower. Only difference is that instead
of following the algorithm to increase or decrease the tentative baseline value based on the slope value,
we calculate the slopes on all the baseline values ranging from the minimum value in the fluorescence
signal to the start value of exponential region.
Amplification Efficiency
Amplification efficiency is completely based on the algorithm used for LineRegPCR.[119, 120]

132
log(𝑁𝑁𝐶𝐶) = log(𝑁𝑁𝑂𝑂) + log(𝐸𝐸𝐸𝐸𝐸𝐸) × 𝐶𝐶 [120]
Where NC and C are measured fluorescence data and cycle number, respectively.
The algorithm to calculate efficiency is shown in Figure 5.17.
Get baseline subtracted data
Window of Linearity endpoint = SDM Cycle
Set Window of 4 points
Fit to Log(Fc) = Log(Fo) + Log(Eff)xC
If R>bestfit_R
Best fit = Current FitWindow size + 1 If window size < 6
WoL endpoint - 1 WoL endpoint = start point + 3
Yes
Yes
Yes
No
No
Show bestfit ParametersYes
Figure 5.17 Efficiency Calculation Method
5.6.3 Partial filling
We also partially filled the cartridges to see variable volume capability of our cartridge. The camera
based record is a good tool to track fluid movement for such purposes.

133
5.6.4 Bubbles
Left over bubbles did not cause much problem. The bubbles coalesce on sides over time. However, if the
cartridge is in a vertical position we hope strongly that bubbles will rise to the top.
Conclusion
We have shown amplification in a polymer metal cartridge. The thermal speed of cartridge is fast. The
cartridge is robust and easy to handle and place. A large optical interrogation area is available. We
showed reliable bonding using adhesives and suggested a path to high speed automation of the process.

134
6 Low Cost and Low Energy Thermal Cycling For POC PCR
Abstract
We present a novel contact cooling based method for temperature control which is fast, simple, low
cost, low energy and robust. Our technique is especially useful for PCR in Point of care applications. The
methods provides ways to speed up the thermal response. It also allows large volumes to be handled.
Neither the disposable cartridge, nor the fluid in the cartridge needs to be moved. The method allows
complex protocols and melt curve analysis to be performed which many other techniques don’t provide.
We show a proof of principle implementation and various options to further improve the systems.
Introduction
Thermal cycling is fundamental to PCR [121, 122]. There are many other biochemical methods which
require temperature control. Being able to quickly change and control temperature has a wide variety of
applications for lab on chip devices[103]. However, thermal cycling is the application where
temperature has to be rapidly change for many cycles. It was shown many years ago that the speed of
biochemical reaction is not the limit [123, 124] [125] [126] [127]. However, the thermal speed of
available instruments has been limiting the smallest reaction times and not the biochemical reaction
itself. The speed of the instrument in linked to the geometry of the chamber in which PCR reaction
resides. We have already shown that the fluid can greatly affect the thermal speed[128]. We have
already compared the effect of plastic walls and substrates on the thermal response. One of the early
systems for rapid PCR was Light Cycler [129] which allowed amplification in 15 to 30 minutes.

135
Another important thing to note is that PCR is a kinetic process. During assay design annealing
temperature sometimes needs to be adjusted for improved efficiency. Many modern PCR machines
allow gradient capability i.e., the temperature across wells varies and the fluorescence can be measured
thus providing a comparison of the amplification by changing temperature.
Although the fact that thermal system is the limiting factor in PCR speed, it’s surprising that even the
modern machines have not been able to overcome this limitation in genera. It shows the difficulty in
satisfying various requirements for use of PCR in lab and in clinic.
Earlier work and problems
The thermal techniques for various commercial systems are covered in various books[124, 130]. The
reasons for limited speed for PCR instruments is elucidated in [124]. The techniques used for
commercial real time PCR machines can be summarized below from [130].
Technique Example Systems Peltier ABI 7500, Bio-rad CFX Heated Air Roche LightCycler Resistive Heater with air cooling Qiagen rotorgene Peltier with thermal conductive fluid Illumina Eco Direct Heating in combination with electrically conductive polymer
Biogene InSyte
Figure 6.1 Thermal Design of Commercial Machines
Except for direct heating approach by Biogene, other techniques use a large amount of power which is
not entirely directed the reaction mix.
For POC systems, energy consumption is also of paramount importance. Interesting examples are
systems from Epistem and Bigtech. Shows the design of Epistem POC systems. Interestingly it still uses a
Peltier with a heat guide to a fan. There are designs which use resistive heater and a fan to cool down. In
case of Epistem the fan can be external. If fan has to blow air over the reaction vessel, several problems
arise. The first is to design for routing air in an efficient way to cool the system. The second is that the
system is not entirely dust and water proof. Fans do wear out and become clogged. For a low resource
setting environment, this is a major problem. The problem of fans is still there with systems with peltiers
as a lot of heat has to be dissipated causing noise and power consumption.
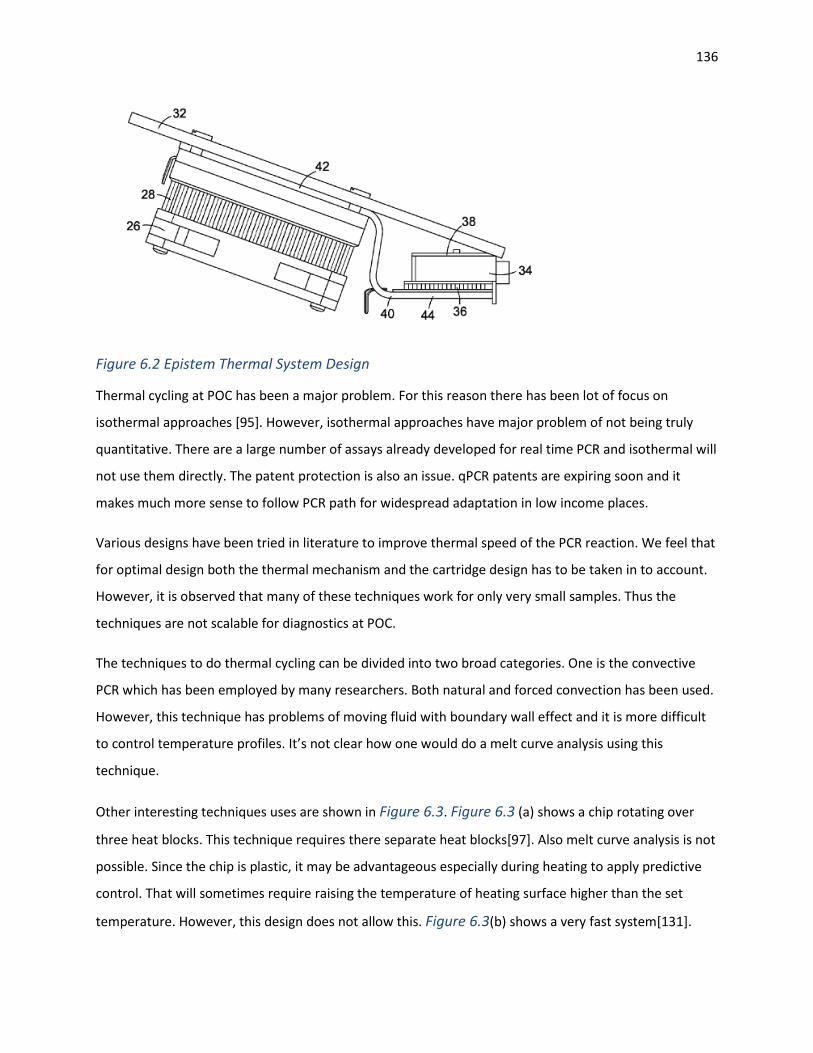
136
Figure 6.2 Epistem Thermal System Design
Thermal cycling at POC has been a major problem. For this reason there has been lot of focus on
isothermal approaches [95]. However, isothermal approaches have major problem of not being truly
quantitative. There are a large number of assays already developed for real time PCR and isothermal will
not use them directly. The patent protection is also an issue. qPCR patents are expiring soon and it
makes much more sense to follow PCR path for widespread adaptation in low income places.
Various designs have been tried in literature to improve thermal speed of the PCR reaction. We feel that
for optimal design both the thermal mechanism and the cartridge design has to be taken in to account.
However, it is observed that many of these techniques work for only very small samples. Thus the
techniques are not scalable for diagnostics at POC.
The techniques to do thermal cycling can be divided into two broad categories. One is the convective
PCR which has been employed by many researchers. Both natural and forced convection has been used.
However, this technique has problems of moving fluid with boundary wall effect and it is more difficult
to control temperature profiles. It’s not clear how one would do a melt curve analysis using this
technique.
Other interesting techniques uses are shown in Figure 6.3. Figure 6.3 (a) shows a chip rotating over
three heat blocks. This technique requires there separate heat blocks[97]. Also melt curve analysis is not
possible. Since the chip is plastic, it may be advantageous especially during heating to apply predictive
control. That will sometimes require raising the temperature of heating surface higher than the set
temperature. However, this design does not allow this. Figure 6.3(b) shows a very fast system[131].

137
However this is not amenable to Point of Care as a droplet is covered with oil. This technique is also not
useful for large volumes. Figure 6.3(c) show a rotating disc is used to move the tubes between three
stages are different temperatures. Each individual tube can have its own temperature. The system is
very complex due retraction of the tubes and then their movement. Examples of very fast thermal
systems are shown in Figure 6.3 (d) [125, 131] and Figure 6.3 (e). Both of these use external pumps
and move fluids to heat and cool. They are complex and bulky for point for care applications.

138
(a)
(c)
(b)
(d)
(e)
Figure 6.3 Example Thermal Control Systems
139
Liquid metal has been used in to have fast thermal response as well[132].
Thermal control by PCR - Requirements
To have a versatile instrument which can run all or most of the protocols, we have to meet certain
requirements. Several techniques described above are not flexible to meet all the demands.
The first requirement is to have the capability to run complex assays with many steps. One example is
touch down PCR [133] which can require changing the annealing temperature many times during the
amplification steps. Convective PCR and fluid heat exchangers are not easily adapted to this application.
The second very important application is the melt curve analysis. Melt curve analysis has various uses
including confirmation of the product[134] [135]. Multiplexing based on melt curve temperature is also
a useful applications. HRM (high resolution melting) is used for genotyping and SNP (single nucleotide
polymorphism).
Programmable ramp rates are provided in most commercial PCR machines. However, by appreciating
that PCR is a kinetic process, its use for POC assays is not critical. A high ramp rate looks to be good
enough to meet the requirement. However, if the ramp rate is too slow, it may cause broadening of gel
bands. Faster ramp rates also lower the total time of PCR amplification.
Although the design of thermal system is closely linked to the design of the cartridge, it would be helpful
if the system allows modern control theory to improve the speed. The design of thermal fluids and
convective heat transfer always fixes the set temperature to which the fluid in the chamber equilibrates.
Thus by newton law of heat conduction, the heat transfer slows down once the temperature differential
is reduced. Electronic controls cannot be employed to improve the response.
Basic idea
It was decided that Peltier should be avoided to save cost and energy. Peltiers also have reliability
issues. They have to be protected from moisture and have limited lifetime.
It was also appreciated that heating can be well controlled using resistive heating. Current can be easily
controlled using electronics. A resistive heater is efficient and can be implemented by a variety of ways.

140
However, it does not have an equivalent in terms of cooling. A peltier has a big thermal mass as
compared to a thin resistive heater or a heater embedded in to chip.
We also note that all the temperatures in PCR cycling are above the maximum operational temperature
of 40 ° C ambient. Thus we conclude that a resistive heater can be used in an energy efficient way for
precise thermal control. The main challenge is to get thermal energy dispersed to the surrounding in an
efficient way.
We consider the primary ways of heat transfer – conduction, convection and radiation. Radiation is not
feasible for cooling our system. Thus we must employ either conduction or convection. Convection can
be further divided into forced or free convection. Shows basic concept of heat transfer with such
mechanisms.
Table 6.1 Heat Transfer Modes and Expressions
Mode of Heat Transfer Governing Law Thermal Resistance
Conduction k
dTq kAdx
= − kLR
Ak= for a wall
Convection
0(int )c fluid
y erface
Tq k Ay =
∂= −
∂
c cq h A T= − ∆
1c
c
Rh A
=
Radiation 4 41 1 2( )rq A T Tσ= −
We note that convection is due to similar phenomena as conduction i.e. molecular collisions. Also from
boundary layer theory the fluid in contact with the hot surface has zero velocity and hence at the
interface heat is being only transferred by conduction. Shows a typical velocity and temperature
profile[136].

141
Heat moves to lower temperature fluid by molecular collisions. If the fluid was static (like a solid body)
then the rate of heat transfer will be slow. Both air and water have low values for thermal
conductivities. Shows thermal conductivities of various materials. (Include liquid metals). The best
efforts for this purpose has been to use liquid metals. However, this is not an attractive approach for
robust systems at POC.
Figure 6.4 Thermal conductivities of Materials
As per newton law of cooling the heat transfer is proportional to the temperature differential.
Convection improves heat transfer due to the movement of fluid near the hot surface. In case of natural
convection buoyancy is responsible for fluid movement. However in case of forced convection we move
fluid by external mechanism. However, in both cases we want the temperature differential to be high.
We achieve that by replacing the molecules which have absorbed heat by molecules which have not.

142
If we see from the hot body perspective, all what we are doing is to provide another material at a lower
temperature. Convection keeps the temperature of that material lower so that heat transfer is faster.
Eventually the heat has to go to atmosphere. Thus our target is to get heat eventually to atmosphere
which can be modeled as an infinite heat sink at a fixed temperature. In convection based designed we
use fluids and let them or make them move to provide a low thermal conductivity path from our heated
object to the material accepting the heat and later dispersing to atmosphere. Thus the heat transfer
from the object to the material and from material to the surroundings can decouple to some extent
from a design point of view.
We note that physics works in favor of getting heat of our heated object to the surroundings. What we
want is to accelerate this process by providing a path from this object for heat to flow to the
surroundings.
We want to have a material which takes in heat and keeps its temperature low. We also want that
material to have good thermal conductivity.
This can be realized with an electromechanical relay like concept. An electrical relay forms a low
conductivity path between two points at different potentials. If we use analogy of current to heat,
voltage to temperature then all we need is a thermal relay. A thermal relay is in fact a low thermal
conductivity part which can make a contact between the hot object and an object of lower temperature.
The difference in the electrical and thermal domains is that the heat can be stored in this contact as
well. In this concept we don’t need any convection. We are providing a very high thermal conductivity
material to absorb heat.
Figure 6.5 shows the basic concept. Notice that thermal contact will also have thermal capacitance in
addition to thermal resistance. This thermal capacitance can be used in our favor. The thermal contact
can either make a path for heat to flow or act as a heat sink itself.

143
Object of Interest
Hot/Cold BodyEnvironmentThermal Mass
Heater (optional)
H/C
Temperature maintaining element/optional
Object of Interest
Heater (optional)
Figure 6.5 Basic Concept of Thermal Contact
The thermal contact is best realized with a moving metallic structure due to its very high thermal
conductivity. The moving metal provides a material in which heat can flow rapidly. Shows typical
convection transfer coefficients.
Figure 6.6 Order of magnitude of convection heat transfer coefficients
For our purpose we are interested to lower temperature of cartridge from 95 to 55 ° C. We calculate
heat transfer in the case of unit area as follows.
> =
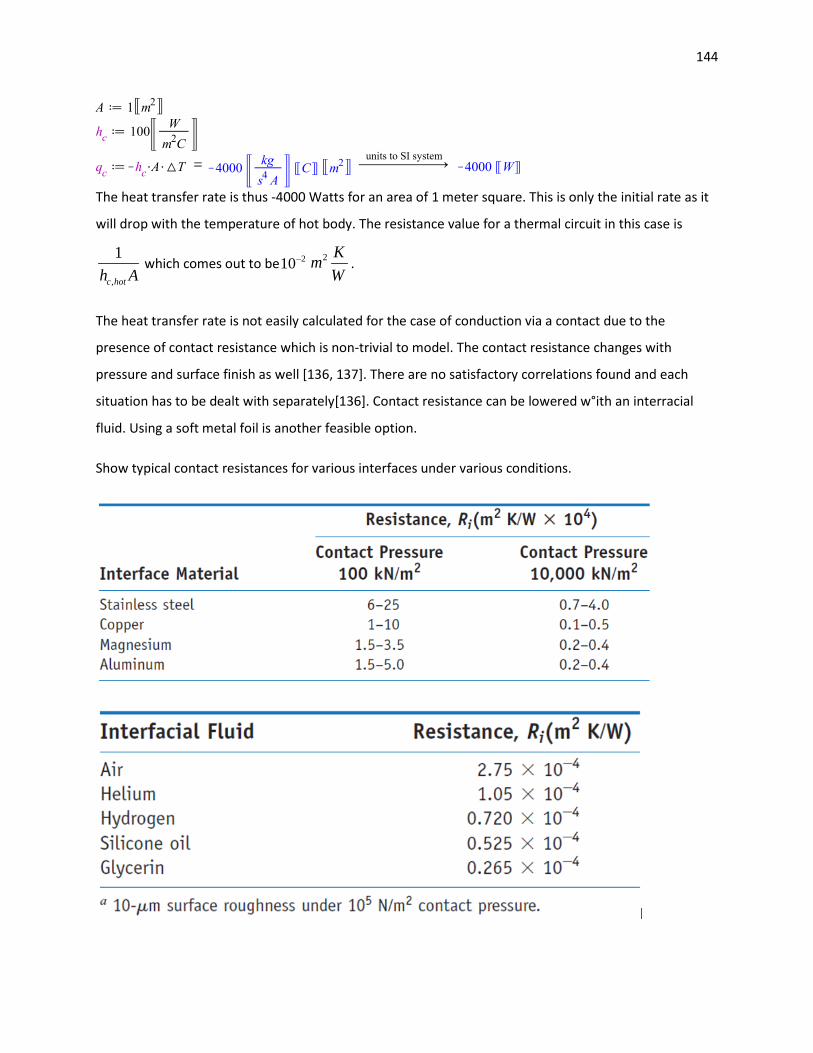
144
=
The heat transfer rate is thus -4000 Watts for an area of 1 meter square. This is only the initial rate as it
will drop with the temperature of hot body. The resistance value for a thermal circuit in this case is
,
1
c hoth A which comes out to be 210− 2 Km
W.
The heat transfer rate is not easily calculated for the case of conduction via a contact due to the
presence of contact resistance which is non-trivial to model. The contact resistance changes with
pressure and surface finish as well [136, 137]. There are no satisfactory correlations found and each
situation has to be dealt with separately[136]. Contact resistance can be lowered w°ith an interracial
fluid. Using a soft metal foil is another feasible option.
Show typical contact resistances for various interfaces under various conditions.

145
Contact resistance changes markedly with contact pressure. There is no way to predict the change in
contact resistance quantitatively.
Nevertheless we note that contact resistance can be lower than what is offered by high quality forced
air convection with many advantages.
In case of forced convection the temperature of cooling fluid is typically kept close to the desired
temperature. In our case this temperature will be 55 ° C. Thus the thermal resistance for convection
heat transfer will be between the temperature of our cartridge and 55 ° C. however, in case of contact
based cooling the temperature at other end of the contact can be much lower.
Configurations
To apply the basic idea to PCR cartridges, several choices have to be made.
The first is placement of the heaters. First we consider the case of cartridge with integrated heaters.
These heaters should be attached to the metal base in our case. They can be placed on sides of the
polymer part or under the metal plate. To have a first order approximation of the time constant for
equilibration we derive the thermal time constant of a rectangular layer to be 21 heightτα
= . We note
that the time constant increase linearly with thermal resistance but quadratic with the height. In this
case height is the direction of flow of heat. Thus with few millimeters the time constant can be in range
of seconds even for Aluminum with α of2
58.418 10 ms
−× . There will be uniformity issues as well.
Therefore, the heather should be placed under the metal substrate. The time constant will be very short
and the temperature uniformity can be very good. In putting the heater under the metal substrate thee
is a disadvantage. The heater also has to be cooled the thermal contact. Hence the mass of the heater
and its thermal resistance to the fluid should be as small as possible.
Another important choice is whether to integrate heather to the cartridge or have it attached to a metal
plate in the instrument. Integrating the heater to the cartridge has the advantage of removing one
temporary contact. However, it can make the cartridge more expensive and complex to fabricate.
Disposable cost should be low and adding the heater can add significant cost. Figure 6.7 Shows both
cartridge types as designed.

146
(a) (b)
Figure 6.7 Cartridge Types. (a) Shows cartridge with integrated heater. (b)Shows bare cartridge
6.6.1 Contact types
A wide variety of contacts can be used for this concept in general. The technique can work at different
size scales as well. Some examples are
• Relays
o Electromechanical Relays - all types
o Relay (solid-solid)
o Mercury relay
o Mercury wetted relay
o Vacuum relay
• Contactor
• Electrical switch
• MEMS switches - electrostatic, electromagnetic, pneumatic etc.
• Actuator based contact which can use following actuation
o SMA (Shape Memory Alloys)
o Electromagnetic
o Electrostatic
• Manual
• Gravity assisted contacts
• Liquid metal - solid contact
• Modifications to contacts

147
o CNT coated
o Nano-structured to improve performance /increase contact area
o Latched
o Sliding
o Liquid Flow
o Variable pressure, distance
• Custom types
o A syringe type filled with liquid metal can work as a thermal contact as well. When the
plunger goes forward the contact is made, when it moves away no contact.
o Patterned /grooved metal contacts to increase contact area
o Sliding metal surfaces with or without wetting
o Controllable contact area, pressure and distance.
• Radiation Assisted/Controlled
o If one body is at a very different temperature then by changing distance or by blocking
radiation by a screen can help in heat transfer. Note that this allows heat transfer
without mechanical contact.
• Convection Assisted
o In this case the hot/cold body may be kept at a temperature by flowing liquid
(e.g., a natural fountain or pump) and a solid contact connected to OOI makes a
contact to this stream.
It is to be realized that the contact resistance reduces with increasing area of the contact. We initially
tried electrical relays with and without modification. Shows one implementation. However, the
mechanical design is not flexible for these parts.
Contact Actuator
It was decided to move a flat metal plate to contact the base of cartridge (in case of integrated heater)
and the back of fixed plate (in case of cartridge with metal base without integrated heater). Keeping in
view the size of the plate, various actuators are readily available. Solenoids and motors can be used. To
conserve energy, we shortlisted solenoids which would only need energy to move but not while holding.
They are available in both rotary and linear configuration and are called bistable solenoids. One type has
a holding magnet on one end and a spring to move to other end when the effect of this permanent

148
magnet is cancelled by an electrical impulse. The other type has permanent magnets on both ends. The
spring helps in applying pressure and gives much easier mechanical tolerance for the design. Rotary
solenoids are also available in bistable configuration. Therefore the energy required for cooling is
drastically reduced. Each cooling cycle only required two electrical impulses for operation. For bistable
solenoids, 100ms is enough for actuation.
Thermal contact can be made to multiple temperature sinks for fast cycling as well. This has been done
but for many applications like melt curve analysis a heater is more appropriate.
We can increase the speed
Advantages
The system allows fast speed yet the design is very simple. The fluid does not have to move. Nor does
the cartridge has to move across contacts or to get convention to its advantage. A real water and dust
proof design is possible as the mechanism can be enclosed and the heat can be dispersed to the casing.
The reliability of system is very high. Solenoids have lifetimes for millions of operation. The lifetimes of
peltiers is in the range of 10 thousand cycles.
The cost of solenoids is much lower. The electromechanical relay has been developed a century ago and
is a widely used component. Custom designs are possible.
Another advantage is the tuning of response. Even with best convention based systems, the heat
transfer slows down when the differential reduces. However, if high speed is desired the contact or the
heat sink can be set at much lower temperature. For example if the heat sink is at zero ° C, heat transfer
will increase. One can think of using ice or other mechanisms to cool down the heat sink.
Accurate temperature control is not needed for heat sink or contact. If we measure the temperature at
cartridge metal surface or the fixed plate, we don’t need to know the temperature of the contact or
heat sink. As PCR temperatures are higher than ambient, this is a useful feature. Both heat sink and
contact can be let equilibrate to the ambient.
In short we are using physics to accelerate a process which is favored by a low energy technique which is
both simple and reliable.

149
Design and analysis
To have quantitative information for predicting performance and for design, we use lumped element
modelling. We used Matlab physical modelling toolbox. We have already established that a 1D model
can be used in design of our flat metal based cartridge.
Lumped element analysis for cooling
We are primarily interested in cooling performance. The performance of cartridge has been covered
already. We want to study effect of ambient temperature and thermal contact on system performance.
Such modelling shows us the distribution of temperatures inside fluid chamber and the effect of
parameters.
We consider various cases. The models are shown in Figure 6.8.
i. Air convection cooled
ii. Thermal contact cooling for cartridge with integrated heater
iii. Thermal contact cooling for a bare cartridge with heater on a fixed plate.
In the last case there are two thermal contacts in the system.

150
Thermal Contact
Heat Sink
Polymer Top
Fluid
Metal Base
Heater
Adhesive
Polymer Top
Fluid
Metal Base
Rc Ambient
Polymer Top
Fluid
Metal Base
Thermal ContactCartridge to Fixed Plate
Heat Sink
Thermal ContactFixed Plate to Heat Sink
Fixed Plate
Rc AmbientRc Ambient Rc Ambient
(b) (c)
Figure 6.8 Lumped Models for Various configurations. (a) Shows convection cooled. (b) Shows cartridge integrated with heater (c) shows bare cartridge with a fixed heated plate
First we compare the thermal resistances of convection and a single contact. Assuming
2100cWh
m K=
4 210A m−= , where A is the area of chip of sides 10 mm x 10mm

151
Then 1
cc
Rh A
= is100 KW
.
Similarly, we calculate the range of contact resistances we can expect. Figure 6.9 shows the expected
range for comparison. Thus from a first order estimate, contact cooling can give similar or better
performance.
Figure 6.9 Expected Contact Resistance Range for Cartridge
Such resistances are useful for getting broad ideas about design, however for transient analysis various
other factors are also important so a full simulation gives more information.
6.10.1 Effect of ambient temperature
The technique is dependent on ambient temperature to some extent. Shows the cooling time as a
function of ambient temperature.

152
6.10.2 Contact resistance
Contact modification
The contact can be modified in a number of ways. Interstitial fluid has been used. A think metal foil can
also help to increase contact area. Coatings can be applied and surfaces can be structured to improve
performance.
Options for HTR plate
A fixed heater place has a distinct advantage of making cartridge simpler and lower cost. The heat
transfer through the system is largely dependent upon the heater as metal offers very low resistance to
heat flow.
There are various ways to implement heater functionality. The figures of merit are thermal uniformity
and least thickness. We especially want to reduce thickness of any polymer layers. The available flex
heaters or kapton heaters have typically two layers of insulation guarding the heater element. This
offered substantial thermal resistance. By looking at flex circuit offerings, embedded resistor laminates
were found. They are available with or without polymer backing. They are flexible and the uniformity of
resistor area is excellent. Adhesives used in flexible PCB industry also are available as thin as 13 microns.
Heater Design and Fabrication
The main suppliers of embedded resistor laminates are Dupont and Ohmega. All metal substrate is
available from Ohmega. However, in that case the electrical insulation has to be ensured and additional
processing steps would be required.
We used Pyralux® APR copper clad resistor laminate. Among the selections APR 02502518NC was
selected as it had thinnest of dielectric and copper. The dielectric thickness is 25 micron. Although,
primarily for having embedded resistor functionality for circuit boards, we found the laminate to be
robust for heating use. Figure 6.10 shows the basic laminate structure.

153
Figure 6.10 Laminate Structure
The heater was designed in Altium Designer. Top and Bottom Layers were used to specify NiCr and the
top Copper layer. Figure 6.11 shows the design of such heater. The side tracks (red) are copper and the
blue area is NiCr. Since all area is filled with NiCr and due to controlled surface conductivity, the heating
is extremely uniform. The inside tracks can be used to connect a sensor deposited over blue area. For
example Platinum can be deposited after deposition of an insulating layer and hence the temperature
can be measured.
Heater Fabrication Protocol
The heater fabrication protocol was developed after experimentation.
CAUTION: All processed should be done under UV-filtered light conditions to prevent poor quality
products from incidental exposure that leads to unexpected polymerization of the photoresists.
Wafer from OmegaPly (Cu-Ni)
6.14.1 Part 1:
Step 1
Apply Photoresist Sheet on the front side of the Copper wafer
The front side of the wafer should be marked in advance.
Effective temperature in laminator: 120 ºC

154
To have a flat and even adhesion, hold the “top leaf” photoresist and the “bottom leaf” copper away
from each other (picture) while feeding into the laminator.
Apply the photoresist on BOTH sides of the copper wafer.
Indication of success: The photoresist (light blue in color) adheres evenly to the copper
surfaces.
Step 2: Expose in UV with Mask 1
Use negative photoresist mask. The pattern should be exposed to UV light.
The first mask’s patterns should expose the copper wires and the heater pad (electrical resistance
region).
Expose the FRONT side of the wafer to UV for 25 seconds.
Indication of success: The exposed patterns should be darkened.
Step 3: Develop the Photoresist
Solution: 2.5 g Sodium Carbonate + 250 mL DI water Temperature: Ambient Dwell for 5 - 6 minutes. Rinse in DI water for 2 - 3 minutes. Indication of success: The red color of copper are visible at parts that were not exposed to UV light (light blue color) whereas the exposed patterns remain unchanged in dark blue color. Step 4: Etch the Copper Solution: 31 g Cupric Chloride + 65 g Ammonium Chloride + 250 mL DI water Temperature: 50 ºC (the hot plate should be put at 90 – 100 ° C) Dwell for 5 - 7 minutes Rinse in DI water for 1 minute Indication of success: The cupric red color should change to grey color of Nickel on uncovered photoresist.
Step 5: Etch the Nickel
Solution: 65 g Cupric Sulphate + 1 mL Sulfuric Acid 98% + 250 mL DI water
Temperature: 95 °C (the hot plate should be put at 180 -190°C)
Dwell for 5 minutes
Rinse in DI water for 2 minutes

155
Indication of success: The grey layer should be stripped off and the green polymer layer should be visible
after blow dried.
Step 6: Strip off the Photoresist
Solution: 8 g Sodium Hydroxide + 250 mL Di water
Temperature: Ambient
Dwell for 2 - 3 minutes
Indication of success: The copper wires and copper pad should be COMPLETELY visible in red color.
Step 7: Blow dry with nitrogen
6.14.2 Part 2:
Step 1: Apply Photoresist Sheet
Same as Step 1 in Part 1 but only on the front side of the chip.
Step 2: Expose in UV with Mask 2
Same as Step 2 in Part 1 except Mask 2 should ONLY expose the copper wires but not the pad because
we want to etch the copper pad.
Step 3: Develop the Photoresist
Same as Step 3 in Part 1.
Step 4: Etch the Copper with special Ammoniacal Etchant
Same as Step 4 in Part 1 except the DWELL time is 4 minutes.
BE CAREFUL not to over etch. When the copper is completely dissolved, and the grey layer is visible, it is
good to take the chip out.
Note: NO nickel etching at this point. (No step 5 in part 1 repeated)
Step 5: Strip off the Photoresist
Same as Step 6 in Part 1.

156
Step 6:
Develop the back Photoresist
Peel off the resist cover sheet on the back of the chip.
Then repeat step 3 until the blue color of the photoresist disappears.
Step 7 Blow dry with Nitrogen
The chip is now ready for testing.
Figure 6.11 Heater Design

157
Implementation – experimental
To test the proof of concept the system was built on optical breadboard. Similar setup was used for this
experiment with additions to the software. Figure 6.12 shows the schematic of the setup and a picture
of the setup is shown in Figure 6.13. SolidWorks design is shown in Figure 6.14.

158
Controller PC
Universal Interface(TC, RTD,
Resistor, Voltage)
TC Interface
PWM generator
CameraGigE
Fluorometer
High Current SSR
Photodiode Amplifier
Programmable Motorized Filter
Wheel
Cell Phone ImagingProgrammable
LED Driver
High Power DC Power Supply
Figure 6.12 Test Setup Schematic

159
Figure 6.13 Picture of Test Setup
Moving Plate
Cartridge
Fixed Plate
Figure 6.14 CAD Diagram of Contact Cooling Test Setup

160
Results
We could successfully cycle temperature while measuring at the fixed plate. This was a proof of concept
demonstration. Various parameters can be improved including the heater design, quality of mechanics
for contact and a secondary heat sink to disperse heat gathered during contact to a much bigger mass
which can always be dissipating to the atmosphere. A ramp rate of about 7 degrees per second was
achieved even with non-optimized system.
The temperature graph with contact cooling and resistive heating is shown in Figure 6.15.
Figure 6.15 Temperature Control with Contact Cooling
Conclusion
We have suggested, designed, simulated and demonstrated a versatile approach to circumvent one of
the major challenges for bring PCR at low resource settings. The method is high performance and
provides many other benefits. Complete dust and water proof design are possible. Cost is low and the
implementation can be exceptionally robust.
0
20
40
60
80
100
120
140
1 15 29 43 57 71 85 99 113
127
141
155
169
183
197
211
225
239
253
267
281
295
309
323
337
351
365
379
393
407
421
435
449
463
477
491
505
519
Fixed Plate Temperature

161
7 Low Cost, High Performance Optical Design for POC qPCR
Abstract
We report development of an optical technique which has the potential to solve long-awaited problem
of high performance fluorescence detection at POC. Our design also works well with lab-on-chip devices.
After thorough study of existing designs, we concluded that there were still shortcomings which does
not allow their adaption to POC with desired features. We performed extensive design, analysis and
simulations to optimize the designs. The performance is verified on bench top with real PCR reagents.
Requirements
The requirements for optical system for POC real time PCR based system are given below.
• Cost should be low
• Size should be small
• The life of the system should be long. The filters or optical elements should not degrade after
use.
• System should not require precise or difficult alignment. This can make production and
maintenance problematic.
• Good light collection efficiency. Should also allow required power to couple to PCR chamber
for excitation.
• Should allow multi-color design for color based multiplexing.
• Integration or observation time should be low to allow fast readings.
• Should be robust to work in presence of bubbles.
• Preferably should work in presence of partial filling of cartridge.

162
Early Work and Problems
It is useful to review the designs used in commercial machines and research literature to find out the
problems. It also helps us to look for opportunities, if any, in those designs. We want to see if existing
designs can be modified to meet our requirements. It can also give us clues into merits and
disadvantages of various approaches in implementing fluoresce detection in real time PCR.
Commercial Machines
We first review the commercial PCR machines. Only few of these machines are for single cartridge based
systems. Most of the machines are for multi-well plates. We have provided optical schematics for the
optical designs of these machines in Figure 7.1 . This is useful as the detailed technical specifications for
the machines which can be useful in optical design are not publically available. However, by having the
optical schematic a broad idea and approximations can be deduced.
We can broadly divide these machines into two types depending on their collection optics. The first type
‘images’ all the reaction wells simultaneously. These typically used a camera (CCD is common). Roche
Lightcycler, Illumina Eco, Thermo Scientific PikoReal, Matecycler and Bio-rad MiniOpticon fall in this
category. This category is not attractive for POC applications where a single reaction well needs to be
observed. In these machines, care has to be taken for optical leakage between wells and typically a
reference dye (such as ROX) is used in all wells for calibration. Using a CCD also makes electronics much
more complex than using individual photodiodes.
The second type detects fluorescence from each reaction individually and hence is time multiplexed.
This is more compatible with POC systems. However, in order to observe multiple reaction vessels, more
time is required. Also these machines require moving mechanical design. Roche Lightcycler, Qiagen
RotorGene, Bio-rad CFX and Biometra TOptical are examples on machines in this category. Interestingly,
all of these use dichroic mirrors or beam splitters in their designs except Rotor-Gene Q. All of the above
move the reaction vessels except Bio-rad CFX and Biometra TOptical which move the optics over the
PCR wells. All of these designs use lenses and various elements which require alignment. The cost and
complexity of these assemblies seems high. The collection efficiency is also not very high since the sharp
cutoff interference filters require normal angle incidence. To collimate the light from the reactions
vessel, a certain distance needs to be maintained for using a lens.

163
Rotor-Gene Q Idaho LightScanner 32
LightCycler
Illumina Eco
Roche LightCycler

164
Bio-rad CFX 96Biometra, TOptical
DxNA
Thermo scientific PikoReal
Bio-rad MiniOpticon Mastercycler ep realplex
Bio-rad iCycler iQ
Figure 7.1 Real Time PCR Machine Optical Design Schematics
An exception is design by DxNA which has LED and detector for each well. However, this design does not
seems scalable for number of multiplex channels.

165
7.4.1 POC Instruments
There are not many available POC real time PCR or sample to answer machines including real time PCR
detection. There are only few fully integrated systems which are available or are in development. The
schematic and diagrams of their optical designs are shown in Figure 7.2. Cepheid has the largest installed
base among all. Its optical system is a side based illumination and detection. The optics needs precise
alignment. Also the shape is fixed. The collection efficiency seems to be low as the fluorescence from
thin sides (about 1mm) is being observed. Most of the fluorescence will be directed in other directions
due to shape of the chamber. By adding an optical read step, 6 seconds are added to the respective
step. This is probably due to integration time required to collect emission signal. There are also multiple
filters and lenses. Interesting, the detection channels use both dielectric and glass absorbing filters.
Enigma Optics is also complex and uses various dichroic elements and filters. Bigtec design used optical
fibers. It is not clear how much of the reaction vessel’s area is being optically interrogated. It also seems
hard to multiplex as it can increase cost and complexity significantly.
The POC instruments in development including Quidel qNAT and Alere, which are funded by Gates
Foundation are also interesting to look at. The Alere platform has a real time fluorescence imaging
module. Although the details are not provided it’s an epi-fluoresence setup and hence most probably
would require dichroic mirrors and filters as in a conventional design. Alere platform uses propriety
Competitive Report Monitored Amplification (CMA) technique[138]. It does not use classic real time
PCR. A mechanical fluorescence background displacement unit is also used adding bulk and complexity.
The cartridge has to be compressed reversibly mechanically for operation. This severely limits the
technique and puts constraints on cartridge design. Image processing is required. A microarray has to be
prepared. We believe this is a complex design and it would be hard to bring its cost and complexity
down. Its advantage over multi-well qPCR based designs are also not clear.
None of these designs seem to have a ‘microfluorometer’ or a system which can be compact and
requires less optical alignment.

166
Enigma BigTech
Cepheid
Alere
Figure 7.2 Optical Design Schematics for POC or single reaction vessel Instruments

167
7.4.2 Research Literature
We now turn attention to research literature. It was figured out that although there has been many lab-
on-chip reactors [60], most of these use either commercial or bulky optical systems. Some of the
researchers used optical microscopes. It seems that a coherent design of cartridge and the optical
design in not done in most cases. One approach is to miniaturize the usual optical design [139].
However, this still remains expensive and the alignment and fabrication requirements of the
conventional optical designs still remain. The benefit of this approach is size reduction but other
parameters don’t change. In fact it should be seen whether optical performance of these designs is
comparable to commercial PCR machines.
Schematics using conventional approaches are shown in Figure 7.3. Usual design was miniaturized[139]
and a camera was used on the bench[140].
(a) (b)
Figure 7.3 Example Fluorescence detection systems
There are few designs which use have excitation and emission in the same direction. The chip is typically
between the source and detector. Figure 7.4 shows main examples from literature. This approach is not
attractive to real time PCR applications. For good thermal response, the height of the chamber should
be low thus making the fluid flat and wide. At least one of the sides of the chip should be used for
heating and cooling. Thus sandwich designs don’t fit into this requirement. The advantage of this
approach can be that whole area of the chip can be optically queried by large area detector. Thus this
approach may work in some assay where temperature control is not required. It may be also used in
case if some other form for thermal control is exercised. Another approach is to make transparent
heaters. Non-directional filters are used[141] in some cases with polarization to reduce bleed though.

168
This technique does have the problem of putting additional requirements on filtration as a large amount
of excitation can reach the detector.
(b)
(c)
(a)
(d)
Figure 7.4 Designs with sandwich designs
The other approach has been to have excitation and emission in different directions. Many designs use
orthogonal directions. Such designs typically don’t require a beam splitter. Some key schematics are
shown in Figure 7.5.

169
(b)
(a)
(d)
(c)
(e)
Figure 7.5 In Plane Excitation Designs

170
Figure 7.6 In plane and separate directions for excitation and emission based designs. (a). Uses planar micro lenses[6] (b). Microfluorimeter with integrated prisms [7]. (c) Gene-Z system [8] Planar micro lenses which are a part of the chip are used[142]. In this design no excitation filter is used.
However, the design was for a channel and not a large reservoir. Making lenses on chip also take chip
area. An objective lens was used which is not good for large area observation. Microprisms were used to
couple light at near critical angle[143]. This design was for evanescent fields and the region of interest
was about 100nm only. A microfluorimeter was demonstrated with an integrated polymer chip [144].
The chip used integrated 45 degree mirrors to guide excitation and another set of mirrors to increase

171
fluorescence collection. The design is for a channel. The mirrors are on all 4 sides of the channel
(chamber in our case). However, the fluid has to have an inlet on at least one side. The optical elements
have to be under the chip and the size of the chip can increase. Hongying Zhu et al. used orthogonal
excitation and a plastic emission filter for fluorescence imaging on cell phone[145]. This design is
difficult to scale up for multiplex applications as it uses cell phone camera and putting multiple emission
filters might not be trivial without causing significant interference. Also this is not a PCR chamber and no
surface is being used for heating. The isothermal platform, ‘Gene-Z’, used a fiber to collect light. Such an
approach is not attractive for POC use as it requires alignment and mechanical considerations [71].
Flatbed scanner was used [146] for gigapixel imaging. A waveguide was used to couple light from sides
to the cartridge. ITO heater was used and one detector per reservoir was used. This design is not
amenable to add more colors to the system.
The lens less imaging systems for POC are also reviewed[147].
Commentary
All the designs for side illumination miss an important point which becomes more relevant for wide and
low height chambers - required for good thermal response in qPCR. The light from LED is not highly
collimated. The first difficulty is to have light in a narrow slit like shape to be extracted from LED optics
with appropriate efficiency. Any ray of light coming out of such narrow slit with little divergence will not
illuminate the fluid once it reaches the polymer due to its higher refractive index. Thus if we use LED
without a slit and very high collimation, most of the light will be trapped inside polymer and will not
illuminate the chamber. Excitation light causes auto-fluorescence of the polymer. The path length is also
not more than the length of the chamber for light which is well collimated.
Our Idea – side illumination
Our basic idea is coupled to design of our chip with a reflective bottom. However, the concept can be
applied in a wide variety of modified applications. Figure 7.7 shows a schematic of basic idea.

172
reflector
Solution
LED
excitation light Reflector
Emission Rays
Filter
Detector
Optics
Collimator
Filter
106
absorbers
111
Polymer Top
Figure 7.7 Optical Design Concept
There are various innovations in this design. The light is sent at an angle so that most of the light does
illuminate the chamber instead of being trapped inside the polymer. The interaction length is also
increased due to multiple reflections. Stray light is reduced due to TIR (total internal reflection) from the
top polymer. In case of polymer bottom, the light can be totally internally reflected. However, we have
shown that polymer can cause significant degradation to PCR speed. A reflective metal surface thus
keeps the light inside the cartridge. It has the benefit that heater of any optical characteristics can be
used. Fluorescence in the downward direction is reflected upwards. The prism can be molded as part of
the chip. The prism can also be on sides thus keeping the top clear for optical interrogation.
A very useful feature is that a large area of the LED beam is coupled to fluid. More so this beam does not
need to be super-collimated. We have already shown that top polymer can be thick without degrading
the thermal response while increasing rigidity and allowing injection molding. Therefore excitation
efficiency can be increased. Since the beam can have large area, various LEDs including high brightness
LEDs and their low cost optics can be used to have very high excitation power levels.
One of the key benefits is that the alignment requirement are very loose. The LED beam can vary in
angle and alignment without causing significant problems.

173
7.6.1 Extension to multiple chambers
The concept is useful for multiple chambers and even arrays of reservoirs as shown in Figure 7.8. Multiple
separate detectors or a FPA (focal plane array) detector can be used. A moving detector can also be
used. Multiple filters can also move or slide for multiplex operation. Multiple static filters is another
option as well.
One of the advantages of this approach is that a single excitation system can be used to illuminate
multiple chambers. A multi-well qPCR cartridge as a separate component or a part of an integrated
cartridge can use this technique. This can also be used for microarrays. In this case coupler can be as
simple as multiple holes in a plate to couple sensor’s pixels with sites in the array.
Coupler
CCD, FPA
Detector pixels
Bottom reflective
surface
Figure 7.8 Extension for Multiple chambers
7.6.2 Use with Cell Phone
The basic idea can help realize a cell phone accessory which can do qPCR, isothermal amplification or
fluorescence detection. The excitation can be separate or the LED of cell phone can be used. Camera of
cell phone is used as a detector. Figure 7.9 shows the schematic of the basic idea.

174
Consumer DeviceCell phone, Digital camera etc
Light Guide / optics
Flash/Light/LED etc
Detector
USB
Electrode+
Electrode-
Heater
+5V
Sample
Switch for controlling Heater / TEC Temperature sensor interface
Temperature Sensor
USB microcontroller/
logic circuit
Excitation FilterEmission FilterCoupling structure e.g., prism
qPCR accessory
Figure 7.9 Cell Phone qPCR accessory
Detailed Design
Detailed design was performed to optimize the system and to know the parameters which are
important.
7.7.1 Difficulty of design
The optimization of this design falls more under ‘illumination engineering’ which has much less
literature than imaging optics. The process, although looking simple can be iterative, time-consuming
and tedious. The merit functions are harder to design. There is a lack of formally trained people. There is
also a lack of algorithms. The field is in its infancy[148]. As per the author
“So, at this time, the field of illumination design tends to be a rather hard discipline requiring the user to gain experience through trial and error, intuition, and the growing amount of literature in the field.” Figure 7.10 shows the design process from the book [148].

175
Figure 7.10 Design Process of Illumination System
7.7.2 Problems with purely side designs
It was considered that side illumination parallel to cartridge be used. In our case the chamber can be
100um-500um thick. A typical length will be 12 mm. Thus the ratio of length to height can be 120. The
die size of chips used in HB (High Brightness) LEDs[149] is typically 2 mm. The surface of the die can be
modelled as lambertian[150]. Ideally light should be collimated in the form of 12mm x 0.1mm beam
with very narrow beam width. Even only considering length of the chamber and some side length for a
total of 15mm and assuming a ray on top, the required collimation of beam is to be better than 0.5
degrees if the ray has to be inside the chamber for its entire length.
This fact is surprisingly not highlighted in most publications.
7.7.3 Light entry
The use of integrated prism is already mentioned. We also reiterate the advantage of light at an angle.
The thickness of the cartridge top can be much more than the chamber height and even then the
chamber can be well illuminated.
The conflicting requirement is the shorter the polymer height, the greater the light interaction can be
due to multiple reflections.
To find out range of useful angles we do the following calculations.
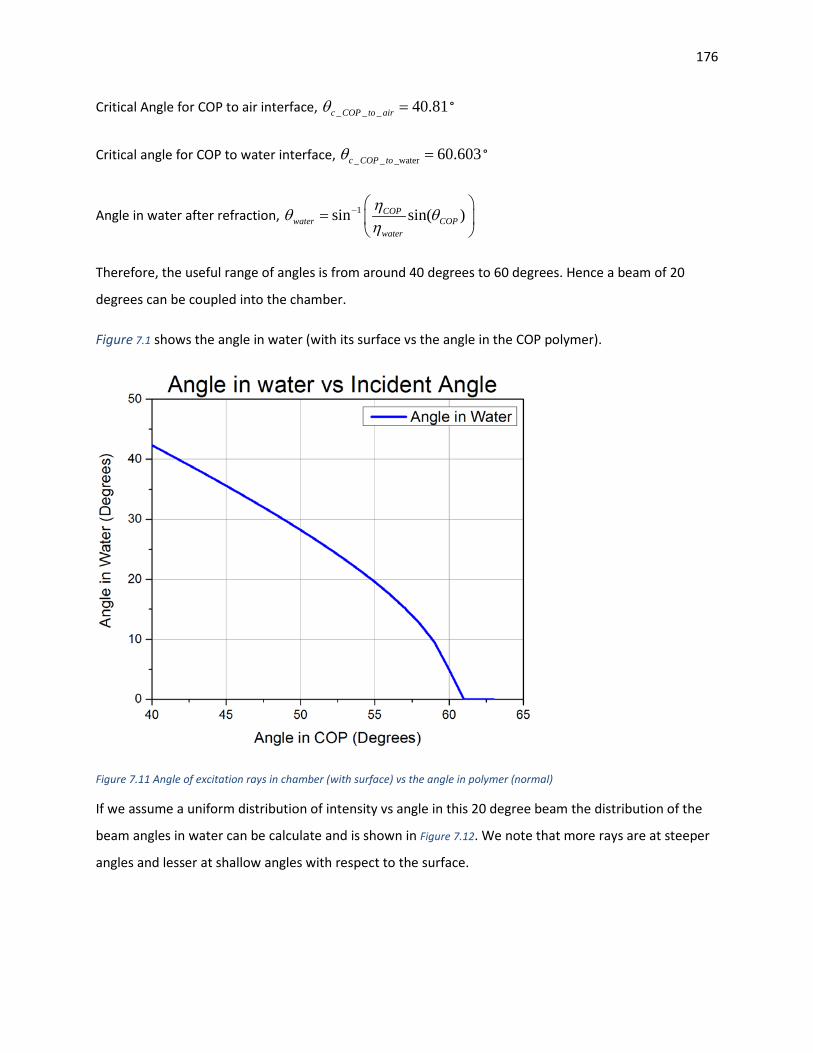
176
Critical Angle for COP to air interface, _ _ _ 40.81c COP to airθ = °
Critical angle for COP to water interface, _ _ _water 60.603c COP toθ = °
Angle in water after refraction, 1sin sin( )COPwater COP
water
ηθ θη
− =
Therefore, the useful range of angles is from around 40 degrees to 60 degrees. Hence a beam of 20
degrees can be coupled into the chamber.
Figure 7.1 shows the angle in water (with its surface vs the angle in the COP polymer).
Figure 7.11 Angle of excitation rays in chamber (with surface) vs the angle in polymer (normal)
If we assume a uniform distribution of intensity vs angle in this 20 degree beam the distribution of the
beam angles in water can be calculate and is shown in Figure 7.12. We note that more rays are at steeper
angles and lesser at shallow angles with respect to the surface.

177
Figure 7.12 Distribution of Angles of Rays in water for a uniform input angular distribution
7.7.4 Coupling into Cartridge
The 20 degree angle is for inside the polymer. If light is introduced at a normal angle from air it will
reduce in beam angle due to COP. The incident allowed beam angle is about 30 degrees.
7.7.5 Light guide design
The chamber is wide and narrow. To have efficient coupling to the cartridge, we should have a beam
which can have 20 degree collimation in the narrow direction. The collimation in horizontal (or larger)
direction is easier due to large size. LED lenses are available with various collimation characteristics.
However, they are not designed to generate beams of these shapes. Light guides or light pipes are
commonly used in LED based lighting. They are also used to relay light in displays which use LEDs as
indicators. Light guide can provide homogenization and collimation as well. They are in various shapes
[148, 151]. If we put an LED right next to the chip, lot of energy will be scattering due to typical wide
beam widths of LEDs.
Another option is to put a slit next to a large collimating lens. However, this will bring a rather large
object in close vicinity of the chip which can limit the observation area. A light guide can while improving
the beam be a narrow structure, which can be used to couple light to the chip.
Another big advantage of light guide is that light guides designs can combine lights from various sources.
This is very useful in multiple excitation sources as required in multiplex real time PCR. A light guide can
bring light from various LED, lens and filter combinations to the chip. Putting multiples lenses near a
small cartridge might not be feasible.

178
The light guide in our case is at least few millimeter in any dimension and the tolerances are also not
critical. Mechanical problems and alignment issues encountered in fiber optics based light coupling is
also avoided. The shape of the beam is well suited for light pipe based design.
There can be various designs of light guides. However a light guide which can be produced by laser
cutting polymers sheets like PMMA are easy and quick to fabricate in our case. We used a simple
rectangular design. This was also done since we used various commercial opto-mechanical components.
7.7.6 Effect of edge
One of our design merits is to reduce excitation light from reaching the detector. Using light at an angle
which would excite the chamber causes an undesirable effect of having some of the light escape the
polymer due to the effect of edge of the chamber.
The conceptual diagram is shown in Figure 7.13. Thus some rays do not stay inside the polymer due to the
edge. Rays undergo refractions and reflections which can cause the angle at exit to fall below critical
angle.
We define following quantities
,exit waterθ = Angle of ray after exit from water to polymer
eθ = Angle of ray in polymer
tθ = Angle of chamber edge with bottom

179
Polymer
Water
Figure 7.13 Light Escape due to Chamber Edge
After some manipulation the angle inside polymer after visiting the chamber through edge can be
written as
( )1
1,
sinsin sin
sin
COP e twater t
waterexit water
COP
η θ θη θ
ηθ
η
−
−
− + =
We can change the angle of chamber edge ( tθ ) to see this effect. We already know the range of angle
for excitation which are useful to illuminate chamber.
The plot for exit angle in polymer after going through chamber edge vs the incident angle in polymer for
different chamber edge angles is show in Error! Reference source not found.. As can be seen the curve
moves up as the chamber angle increseases. Thus lesser chamber angle causes a greater part of the
beam to stary inside polymer. Chamber angles for Figure 7.14 are between 30 degrees to 90 degrees.
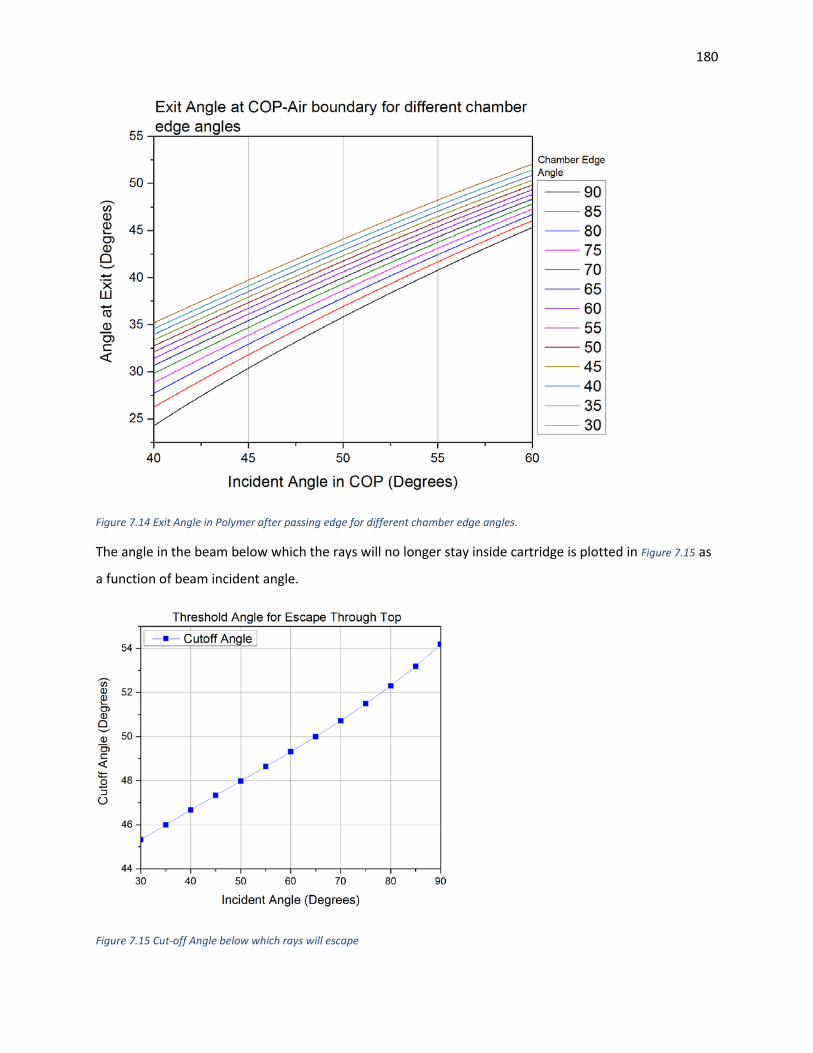
180
Figure 7.14 Exit Angle in Polymer after passing edge for different chamber edge angles.
The angle in the beam below which the rays will no longer stay inside cartridge is plotted in Figure 7.15 as
a function of beam incident angle.
Figure 7.15 Cut-off Angle below which rays will escape

181
7.7.7 Light collection
The light collection efficiency is a very important parameter of optical design. Better light collection
allows faster readings and better signal to noise ratio. It can also help in more flexibility in design.
Intuitively, better collection efficiency can be obtained by recording signal over a larger area and be
close to the cartridge. However, the excitation light can be a problem if the distance to cartridge top is
too near in some cases.
Effect of mirror
The mirror finish in the chamber helps in increasing the collection efficiency by reflecting the downward
directed fluorescence emission. Assuming that fluorescence is emitted Omni directionally and neglecting
edge effect, about fifty two percent of fluorescence rays escape from the top of cartridge with this
simple design. Rest of energy goes through TIR (total internal reflection). There are various ways to
collect this energy as well. However, even with this simple design, a large portion of energy is already
available at a convenient location – top of the cartridge.
Filter Choice and options
A large variety of filters can be used for design. We can broadly classify them as following
1. Plastic filters (used in architectural lighting)
2. Polymer filters
3. Absorbing glass filters
4. Camera Filters (various types)
5. Interference filters
The first four types are non-directional filters and do not need normal beam. Interference filters do need
collimation to maintain the specification. However, they can be used at a tilt to change the pass band or
to act as a dichroic mirror. To collect beam at all angles directly (without collimation or bending) non-
directional filters are required. The glass absorbing filters also have better strong stop band and longer
life. However, the pass band is not as steep as interference filters. Glass absorbing filters have much
more variety in long pass applications than short pass or band pass response.
To find the appropriate filter combinations, we developed filter design software in-house. This is
explained in the filter design software section.
182
7.8.1 Auto-fluorescence problem
The major disadvantage of glass filters in our case is their auto fluorescence. The autofluoroscence can
be significant. Another problem is that the data for autofluoresence is not readily available. This makes
it hard to model and design with such filters.
Modelling
To have an optimized design with all elements included, we decided to use high quality optical
illumination software. We used Synopsys Lighttools and Zemax Optical Studio.
7.9.1 Why ray tracing
Ray tracing software is used in architectural and automotive lighting and many other applications. We
did not find their much use in research publications for lab on chip. However, for a detailed design,
these simulations are immensely valuable. The software programs have accurate models of sources like
LEDs and many other elements.
These simulations give a range of useful data which is extremely difficult to get experimentally. More so
ideas can be tried and results can be obtained without physically assembling and fabricating the optics.
Many manufacturers provide models for their devices like lenses and LEDs which help in selection of
components and gage the performance. These software couple with the 3D modeling software
(SolidWorks in our case) to allow simulation on detailed models and take in to effect the full geometry
for stray light and other calculations. Different parametric studies and optimizations are possible using
these software.
However, they lack certain parameters for our case. Modelling of fluorescence is not direct and models
for fluorescence phenomena are not integrated into these systems. Auto-fluorescence models are also
not available for glass filters and other elements.
7.9.2 Simulations
In actual case, the excitation light excites the fluorophores in the solution and causes emission.
However, a model of excitation vs emission is not available in these software. A full model should divide
the chamber into small volumes and the fluorescence should be in accordance to the light intensity in
that small volume. This can be very complex.

183
We therefore divided the excitation and emission simulations. We set our goals for each design.
However, they both effect each other so the overall goals are also kept in mind.
7.9.3 Excitation Simulation
For excitation simulation, we have various elements to optimize. For a single color case, we have to use
a LED, LED collimation optics, a light guide and the cartridge.
This simulation allows us to quantify stray light (excitation light escaping through the top). It also helps
use to optimize geometry and to add additional elements like absorber to reduce the excitation light
reaching detector. The simulation also shows us excitation efficiency or how much power from LED can
be used to excite the liquid inside chamber. Again the analysis shows various directions the LED light can
go so that we can put optical structures to absorb this unwanted light. Different phenomena like Fresnel
effect can also be modelled.
There can be a wide variety of design for chamber illumination. We show analysis of a simple case. An
Oslon SSL blue LED (Osram Optoelectronics) is used as excitation source. A simple rectangular light guide
is used. The LED directly couples into the light guide. This can be the case if we use non-directional filter
at excitation. Note that the diameter of integrated lens is about the same size as the height of LED. The
setup is shown in Figure 7.16.
(b)(a)
Figure 7.16 Simulation Setup for Excitation. (a) Shows a rendered diagram. (b) Setup with preview rays
Simulation setup parameters and results are given below in Table 7.1.

184
Total LED Power Emitted (after filtration) = 1 Watt
Size of Top detector = 10mm x 10mm
Table 7.1 Excitation Simulation Results
Element Total Power
Incident
Watts
Average Irradiance
2
Wmm
Max Irradiance
2
Wmm
Light Guide Inlet 0.65018 0.023572277 0.093534
Light Guide Outlet 0.65011 0.0235596277 0.024357
Prism Inlet 0.71520 0.0197075367 0.025804
Bottom of Chamber 3.55467 0.0283372685 0.13172
Top Detector (3mm from top) 0.016916 0.0001691513 0.000586
Top Detector (11mm from top) 0.001894 1.895564e-005 0.00015
There are various interesting things to note from simulation results.
More than 65% of LED light is coupled to this simple light guide. Almost all of this power makes it to
other end of the light guide. The prism inlet has more incident power than the light guide outlet. This is
not violating conservation principle but is the way the illumination design calculations are done. If a ray
hits a surface multiple times it’s counted in the same way. In this case this is likely due to some rays
after entering the polymer make their way back to the prism inlet after undergoing reflections. The
bottom of chamber has much more incident power. This is due to multiple reflections. As such it shows
one of the very useful features of this design. Interaction length is increased due to multiple reflections.
One can says that the cartridge sees the light from source 3.5 times. In this calculation, we has assumed
that the rays are not attenuated by fluorophore excitation. To clarify ray traces are shown in Figure 7.17.
Figure 7.17 Excitation Ray Traces

185
Light guide also homogenizes the Light from LED before it enters the cartridge. The illuminance at inlet
and outlet of light guide is shown in Figure 7.18. The pattern at output is much more uniform due to
reflections inside the light guide.
(a)
(b)
Figure 7.18 Illuminance Display for Light Guide. (a) Inlet Illuminance. (b). Outlet illuminance display
The Illuminance for the top detector and at the bottom of chamber is shown in Figure 7.19. The excitation
light escaping and reaching to the top has a non-uniform pattern. Two lines of higher illuminance are
noticeable. This can be used to position detector or filters appropriately. This effect is most likely due to
chamber edge or the cartridge edge.
From the slice charts and the image, the illuminance is quite uniform in the direction orthogonal to
excitation. The illuminance increases are little in the direction of excitation. This may be due to more
chances of getting multiple reflections due to total internal reflection.

186
(b)
(a)
Figure 7.19 Illuminance Charts. (a) Illuminance at top detector. (b) Illuminance at bottom of chamber

187
It is interesting to see the change in escaped excitation light as we move away from the top of the
cartridge. Shows graph of stray light as a function of distance from top of cartridge for a 10mm by 10mm
detection area centered over cartridge.
We can reduce this effect by putting an absorber. The resulting graph is shown Figure 7.20. The stray
light power falls rapidly till the detector is about 6mm. This fact gives us guidance into the distance
which might be useful for filters with high auto fluorescence.
Figure 7.20 Stray light as a function of distance from Cartridge Top
7.9.4 Emission Simulation
The emission simulation is performed by assuming the chamber volume as a volume emitter. The
simulation can be very complex if the excitation in chamber is not be uniform. In that case different sub-
regions can emit with different power. We can try to design a system which excites the chamber with
uniformity. However, we note that this is not an imaging system and the main purpose is to collect light
on a single detector. The non-uniformity is not very important unless the light collection performance is
compromised.
To simplify, we assume chamber as a uniform emitter. We have already shown the results of chamber
illuminance in simulation for excitation light for a simple case.

188
Keeping in view the limitations of software, the bottom surface of chamber is assumed to be a surface
emitter with total power of 1W. We again assumed a detection area of 10mm by 10mm.
Illuminance at detector is shown in Figure 7.21. The pattern is nearly symmetric in all quadrants. The
pattern is also oval shape giving clues in to the design of optics required to guide the light to detector
and the size of aperture which can be used for maximum light collection.
Figure 7.21 Illuminance at Detector (3mm from top of cartridge)
The graph of incident power on the detector as a function from the top of cartridge is shown in Figure
7.22.

189
Figure 7.22 Total power incident at detector vs distance from top of cartridge
It is interesting to see the possibility of putting the detector on side. Figure 7.23 shows two detector
planes for both top and side observation. Interestingly there is a high illuminance line on the side as well
which can be place for single or additional detectors.
Figure 7.23 Detectors on Top and Side

190
Experimental and Test
The concept was tested on optical breadboard. The setup had to work in synergy with thermal control as
well.
7.10.1 Setup
Since stray light is an important consideration the setup has to be carefully designed. We also wanted to
measure the effect of misalignments and parameter changes. We selected Thorlabs lens tubes to house
the optical components. Thorlabs has a unique cage system which allows attachment of various opto-
mechanical subassemblies convenient. Various linear and rotational stages were used. Figure 7.24 shows
the setup on optical bench. The setup allows changing alignments and distances accurately. To test
various filters we used cage compatible filter holders. We used laser cutting to fabricate the light guide
from acrylic sheets. The light guide as held in the lens tube as well.
Figure 7.24 Optical Bench Setup
The instrumentation setup is as explained before. By developing extensive software, we could easily and
quickly change various parameters for our assay. The optical detector was read though in-house
developed electronics which is explained in its section. The electronics had automatic dynamic range
matching. In contrast to various circuits given in literature with fixed dynamic range for the Analog to

191
Digital converter, we could tailor the dynamic range by changing the integration time dynamically
allowing a very wide dynamic range.
We used the assays as described earlier and obtained the melt curve for a duplex assay. Melt curve is
useful in measuring optical performance for intercalating dye based assays as we cover the whole range
of expected signal levels. Melting curve has been suggested to be used for validation of real-time PCR
instruments [152].
With an LED current of 100mA the integration time was less than 100ms for the entire range. That is
very important since it shows that the measurements can be taken very fast and the reaction time does
not need to be increased by much if we are taking measurements. In contrast, Cepheid SmartCycler,
which has independent optics for each cartridge, adds 6 seconds to each cycle for real time observation.
Our optics is updating faster than Qiagen ESE log as well. The measured data after processing is shown
in Figure 7.25. The peaks are distinctively clear.
Figure 7.25 Melt Curve and Derivative for STD Assay
Amplification for Bio-rad reference assays is shown in Figure 7.26.

192
Figure 7.26 Amplification Curve in Cartridge
The fast reading also shows that a rotating filter wheel or a spatially separated design should work well
for multiplexing. We integrated and synchronized the filter position of the filter wheel to do multiplex
measurements. For this purpose we selected motorized filter wheel with very fast switch capability.
Also note that whole melt curve was obtained in 5 minutes with good resolution. Thus the cartridge
thermal response works well to allow fast optical readings.
Advantages
There are major advantages of this design. Precise alignment is not required. This not only simplifies
production but also allows equipment to remain operation with small dimensional change. High power
can be coupled into the chamber with high efficiency. Due to high collection efficiency, the observation
time is exceptionally fast. The design allows using different volumes of chamber without changing the
optics. It also allows ways to have cartridges of different configuration use the same instrument. For
example the optics can be designed so that cartridges with single or multiple wells can be used.

193
Conclusion
We have provided proof of concept implementation for a microfluorometer which meets many of the
desired features. The design is applicable to many applications including multiplex real time PCR and
other fluorescence bases assays like ELISA. The design in robust and well suited to POC instruments. We
also have showed the modelling of the system. We hope that the design can be quickly modified and
updated for changes in configuration using this approach.

194
8 Filter Selection Program Abstract
Fluorescence detection optics can use from a large number of filters from various manufactures[153]
[154] [155]. Filters are one of the most expensive components in typical optical designs. We wanted to
reduce the cost of filters by choosing among various options to reduce cost. Due to the configuration of
our optics, we also wanted to consider non-directional filters. We also considered plastic filters and
camera filters which can be lower cost than the interference filters. Due to a large number of filters
available from various manufacturers, it is difficult and time consuming to search and select the right
filters. If the filter selection can be automated, then we can choose the filters which are most cost
effective. In addition to filters, there are a large number of sources such as LEDs with different spectral
characteristics. It’s very helpful to shortlist the combinations which meet our requirements.
To perform numerical calculations we have to enter numerical data for the following.
1. Fluorophores 2. Excitation sources 3. Excitation filters 4. Emission filters 5. Detectors
Criteria / Challenges:
The filter program finds out certain information that can be a criteria to resolve the challenges of
fluorescence detection.
We have loaded a big amount of data from various sources for the selection of components:
1. Fluorophores/dye data a. From [156]
b. From [113]
c. Alexa Flour dyes from [114] 2. Excitation source:

195
a. LED data from Thorlabs [157] 3. Filters: we have a huge selection available, data sources are:
a. Pubspectra [65] b. Lee Filters c. Hoya Filters [73] d. Thorlabs filters [88]
Notes
1. All the data is normalized for wavelengths from 200nm to 1200nm, with a step of 1nm. 2. Linear Interpolation is used wherever values are not available.
Specifications
The program can do analysis for component selection for both a singleplex and multiplex reaction
8.4.1 Singleplex reaction:
A singleplex reaction consist of a single source, dye, excitation filter, emission filter and detector.
For this reaction following information needs to be calculated
8.4.2 Excitation Efficiency
This gives a measure of how much of the excitation from source is actually useful to excite the
fluorophore.
Calculation: To find out excitation efficiency the program multiplies the spectra of source,
excitation filter and excitation of fluorophore. It finds the area under the curve resulting from
multiplication. Then this area is divided with the area under excitation source spectrum.
𝐸𝐸𝐸𝐸(𝑒𝑒𝐸𝐸𝐸𝐸𝑒𝑒𝑒𝑒𝑒𝑒𝑒𝑒𝑒𝑒𝑒𝑒𝑒𝑒) = ∑ (𝑠𝑠𝑠𝑠𝑠𝑠𝑠𝑠𝑒𝑒𝑒𝑒 × 𝐸𝐸𝐸𝐸 𝐹𝐹𝑒𝑒𝐹𝐹𝐹𝐹𝑒𝑒𝑠𝑠 × 𝐸𝐸𝐸𝐸𝐹𝐹)1200200
∑ 𝑠𝑠𝑠𝑠𝑠𝑠𝑠𝑠𝑒𝑒𝑒𝑒1200200
Where ExF is excitation spectrum of fluorophore.
8.4.3 Emission Efficiency
This gives a measure of how efficiently the emission from Fluorophore is passed to the
detector.

196
Calculation: To find it out the program multiplies emission spectrum of Fluorophore and the
spectrum of emission filter, finds the area of under curve resulting from multiplication, and
divides it by the area under emission spectrum of fluorophore.
𝐸𝐸𝐸𝐸(𝑒𝑒𝐸𝐸𝐸𝐸𝑒𝑒𝑒𝑒𝑒𝑒𝑒𝑒𝑒𝑒𝑒𝑒𝑒𝑒) = ∑ 𝐸𝐸𝐸𝐸𝐹𝐹 𝐸𝐸 𝐸𝐸𝐸𝐸 𝐹𝐹𝑒𝑒𝐹𝐹𝐹𝐹𝑒𝑒𝑠𝑠1200200
∑ 𝐸𝐸𝐸𝐸𝐹𝐹1200200
Where EmF is emission spectrum of fluorophore.
8.4.4 Leakage
It is the amount of excitation that makes its way into the detector.
Calculation: The program finds leakage by multiplying spectra of source, excitation filter, and
emission filter. The area under the curve resulting from multiplication, represents the light that
leaks from source to detector
𝐿𝐿𝑒𝑒𝐿𝐿𝐿𝐿𝐿𝐿𝐿𝐿𝑒𝑒 = � (𝑠𝑠𝑠𝑠𝑠𝑠𝑠𝑠𝑒𝑒𝑒𝑒 × 𝐸𝐸𝐸𝐸 𝐸𝐸𝑒𝑒𝐹𝐹𝐹𝐹𝑒𝑒𝑠𝑠 × 𝐸𝐸𝐸𝐸 𝐹𝐹𝑒𝑒𝐹𝐹𝐹𝐹𝑒𝑒𝑠𝑠)1200
200
Goal: The goal is to minimize leakage as it can have significant effect on the output from
detector, as the light from excitation source is a lot brighter than the light emitted from
Fluorophore. Therefore we have to select filters such that leakage is minimal.
This information is used as a Figure of Merit (FOM) for selecting the filters.
On fixing the source and fluorophore the program allows to search for the best possible
combinations of excitation and emission filters.
A threshold can be applied to all three FOMs, and a resulting list of combination of filters is
presented, whose spectra are plotted so the user can further chose what is best.

197
User interface
1. Select fluorophore 2. Select source 3. Choose filters based on manufacturers for manual calculations 4. Choose filters based on manufacturers for automatic calculations 5. Filter out combinations based on threshold parameters (for automatic calculations) 6. Manual Calculations table 7. Combine graph
Multiplex reactions
A multiplex reaction consist of multiple sources, multiple combinations of excitation and emission
filters, multiple fluorophores, and multiple detectors. Apart from the three FOMs used in singleplex
reaction, there is one new FOM. Excitation efficiency is also different from singleplex reaction.
8.6.1 Excitation Efficiency
For simplicity the program considers that only one excitation filter is used for each source. The
excitation efficiency is calculated for each source and now defines how much of spectrum of a
source is useful for exciting the fluorophores used in a reaction.

198
Calculation: For each source the excitation efficiency is calculated by multiplying together
source spectrum, excitation filter spectrum, and the paired fluorophore’s excitation spectrum.
The area under curve resulting from multiplication is then divided by area under source
spectrum. So the Excitation efficiency per source is calculated by the fowling formula
∑ (𝐸𝐸𝐸𝐸𝐹𝐹 × 𝑠𝑠𝑠𝑠𝑠𝑠𝑠𝑠𝑒𝑒𝑒𝑒 × 𝐸𝐸𝐸𝐸 𝐹𝐹𝑒𝑒𝐹𝐹𝐹𝐹𝑒𝑒𝑠𝑠)1200200
∑ 𝑠𝑠𝑠𝑠𝑠𝑠𝑠𝑠𝑒𝑒𝑒𝑒1200200
Where ExF(k) is excitation spectrum of fluorophore “k” and “n” is the number of fluorophores
8.6.2 Emission Efficiency
Emission Efficiency remains the same as in singleplex reaction, and is calculated for every
fluorophore.
8.6.3 Leakage
In multiplex reaction leakage is similar to the one in singleplex reaction but needs to be
calculated for each detector.
𝐿𝐿𝑒𝑒𝐿𝐿𝐿𝐿(𝐸𝐸) = � (𝑠𝑠𝑠𝑠𝑠𝑠𝑠𝑠𝑒𝑒𝑒𝑒 (𝐸𝐸) × 𝐸𝐸𝐸𝐸 𝐸𝐸𝑒𝑒𝐹𝐹𝐹𝐹𝑒𝑒𝑠𝑠 (𝐸𝐸) × 𝐸𝐸𝐸𝐸 𝐹𝐹𝑒𝑒𝐹𝐹𝐹𝐹𝑒𝑒𝑠𝑠(𝐸𝐸))1200
200
8.6.4 Reciprocal Cross-talk
In multiplex reaction, fluorophores can have overlapping emission spectra, due to which there
is a need that emission filters are selected such that the emission from a fluorophore only
reaches its respective detector. However in practical systems even selecting the best emission
filters combination still results in some cross-talk.
To explain this cross talk let’s consider an example in which we have one source, one excitation
filter, two emission filters and two fluorophores. Now the cross-talk phenomenon can be
approximately quantified as,
�𝜑𝜑1𝜑𝜑2� = �𝐸𝐸11 𝐸𝐸12
𝐸𝐸21 𝐸𝐸22� �𝐼𝐼𝐸𝐸1𝐼𝐼𝐸𝐸2
�+ �𝑏𝑏1𝑏𝑏2�
Where (b1, b2) is baseline caused by the background. [158]

199
Calculation:
In order to calculate this parameter which is an important FOM, first the elements in cross talk
matrix are computed.
Each element of cross talk matrix Emnis defined as the fluorescence reaching to detector “m”
due to fluorophore “n”. So Emn can be calculated by multiplying the spectrum of mth emission
filter with emission spectrum of nth fluorophore.
𝐸𝐸𝑚𝑚𝑚𝑚 = � (𝐸𝐸𝐸𝐸𝐹𝐹𝑒𝑒𝑚𝑚 × 𝐸𝐸𝐸𝐸𝐹𝐹𝑚𝑚)1200
200
Where EmFim is mth emission filter’s spectrum and EmFn is emission spectrum of nth
fluorophore.
Also each element in cross talk matrix is assigned a weight, which can be calculated by this
formula
𝑊𝑊𝑚𝑚𝑚𝑚 = � (𝑆𝑆𝑠𝑠𝑠𝑠𝑠𝑠𝑒𝑒𝑒𝑒𝑚𝑚 × 𝐸𝐸𝐸𝐸 𝐹𝐹𝑒𝑒𝐹𝐹𝐹𝐹𝑒𝑒𝑠𝑠𝑚𝑚 × 𝐸𝐸𝐸𝐸𝐹𝐹𝑚𝑚) × 𝑒𝑒𝐸𝐸𝐹𝐹𝑒𝑒𝑒𝑒𝑒𝑒𝐹𝐹𝑒𝑒𝑠𝑠𝑒𝑒 𝑒𝑒𝑠𝑠𝑒𝑒𝐸𝐸𝐸𝐸𝑒𝑒𝑒𝑒𝑒𝑒𝑒𝑒𝑒𝑒𝐹𝐹 1200
200
× 𝑠𝑠𝑠𝑠𝑠𝑠𝑠𝑠𝑒𝑒𝑒𝑒 𝑝𝑝𝑠𝑠𝑝𝑝𝑒𝑒𝑠𝑠
Where ExFnis the excitation spectrum of nth fluorophore.
Now the reciprocal cross-talk for detector “a” is calculated as
𝑅𝑅𝐶𝐶𝑅𝑅𝑎𝑎 = 𝐹𝐹𝑎𝑎𝑎𝑎
∑ 𝐹𝐹𝑎𝑎𝑎𝑎𝑚𝑚𝑎𝑎=1
Where n is the number of fluorophores
And is basically a ratio showing the percentage of desired signal over total signal received by
detector.

200
User Interface
1. Load all the database 2. Selection panel to select option table for either emission filters, source, fluorophore,
emission filters 3. Table for selection/ calculations 4. Checkbox for automatic calculation 5. Filter out calculation based on either manufacturers or direction 6. Calculations thresholds 7. Save configuration which include selected source, excitation filters, fluorophores,
emission filters 8. Combine graph
Filter Search
Filter search is an add-on feature of this application which allows a user to search filters based on
different parameters. Filters can be find either matching with an ideal filter or a real filter from the
database.

201
8.8.1 Ideal Filter based matching
In filter searching based on an ideal filter, each filter from the database is matched with an ideal
filter of a known start and stop band. User can define the start and stop band of the ideal filter
and thresholds i.e. percentage of area covered by filter in band, percentage of filter area out of
band, total energy out of band.
Percentage of area covered by filter in band
It is defined as how much ideal filter’s area is covered by each real filter from the
database.
Calculation: First ideal filter’s area is calculated by subtracting stop band value from the
start band and multiplying it with 100.
𝐼𝐼𝐼𝐼𝑒𝑒𝐿𝐿𝐹𝐹 𝐴𝐴𝑠𝑠𝑒𝑒𝐿𝐿 = (𝑆𝑆𝐹𝐹𝑠𝑠𝑝𝑝 𝑏𝑏𝐿𝐿𝑒𝑒𝐼𝐼 − 𝑆𝑆𝐹𝐹𝐿𝐿𝑠𝑠𝐹𝐹 𝑏𝑏𝐿𝐿𝑒𝑒𝐼𝐼) × 100
Then overlapping area of each filter is calculated by adding all the values of real filter’s
transmittance curve starting from the start band value to stop band value. Finally the ratio
of this overlapping area to the idea area is calculated which gives us the percentage of
area covered by filter in band.
𝑝𝑝𝑒𝑒𝑠𝑠𝑒𝑒𝑒𝑒𝑒𝑒𝐹𝐹𝐿𝐿𝐿𝐿𝑒𝑒 𝑠𝑠𝐸𝐸 𝐿𝐿𝑠𝑠𝑒𝑒𝐿𝐿 𝑒𝑒𝑠𝑠𝑐𝑐𝑒𝑒𝑠𝑠𝑒𝑒𝐼𝐼 𝑏𝑏𝑒𝑒 𝐸𝐸𝑒𝑒𝐹𝐹𝐹𝐹𝑒𝑒𝑠𝑠 𝑒𝑒𝑒𝑒 𝑏𝑏𝐿𝐿𝑒𝑒𝐼𝐼 =𝑠𝑠𝑐𝑐𝑒𝑒𝑠𝑠𝐹𝐹𝐿𝐿𝑝𝑝𝑝𝑝𝑒𝑒𝑒𝑒𝐿𝐿 𝐿𝐿𝑠𝑠𝑒𝑒𝐿𝐿
𝑒𝑒𝐼𝐼𝑒𝑒𝐿𝐿𝐹𝐹 𝐿𝐿𝑠𝑠𝑒𝑒𝐿𝐿%
Percentage of area out of band
It is exactly opposite to the percentage of area covered by filter in band.
Calculation: First filter’s area is calculated by adding all the values in the transmittance
curve of that filter in the given region of comparison and then the ratio of overlapping area
to this filter area is subtracted from one to get the ratio of area out of band.
overlapping areapercentage of filter area out of band = 1- %filter area
Total energy out of band
It is defined as the filter’s transmittance outside the area of ideal filter.

202
Calculation: Subtracting overlapping area from the filter area gives total energy out of
band.
𝐹𝐹𝑠𝑠𝐹𝐹𝐿𝐿𝐹𝐹 𝑒𝑒𝑒𝑒𝑒𝑒𝑠𝑠𝐿𝐿𝑒𝑒 𝑠𝑠𝑠𝑠𝐹𝐹 𝑠𝑠𝐸𝐸 𝑏𝑏𝐿𝐿𝑒𝑒𝐼𝐼 = (𝐸𝐸𝑒𝑒𝐹𝐹𝐹𝐹𝑒𝑒𝑠𝑠 𝐿𝐿𝑠𝑠𝑒𝑒𝐿𝐿 − 𝑠𝑠𝑐𝑐𝑒𝑒𝑠𝑠𝐹𝐹𝐿𝐿𝑝𝑝𝑝𝑝𝑒𝑒𝑒𝑒𝐿𝐿 𝐿𝐿𝑠𝑠𝑒𝑒𝐿𝐿)%
1.1.1. User interface
8.8.2 Real Filter based matching
As the name suggest in this type of filter searching each filter from the database is matched
with a real filter instead of an ideal filter. The only threshold is difference in this case.
Difference
It is defined as the measure of difference between each filter and the selected real filter.
𝐼𝐼𝑒𝑒𝐸𝐸𝐸𝐸𝑒𝑒𝑠𝑠𝑒𝑒𝑒𝑒𝑒𝑒𝑒𝑒 = �(𝑠𝑠𝑒𝑒𝐿𝐿𝐹𝐹 𝐸𝐸𝑒𝑒𝐹𝐹𝐹𝐹𝑒𝑒𝑠𝑠 − 𝑠𝑠𝑒𝑒𝐿𝐿𝑠𝑠𝑒𝑒ℎ𝑒𝑒𝑒𝑒𝐿𝐿 𝐸𝐸𝑒𝑒𝐹𝐹𝐹𝐹𝑒𝑒𝑠𝑠)

203
User interface

204
9 Robust and Flexible Sample Preparation Design for POC Diagnostics
Abstract
Sample preparation is one of the toughest challenges to bring PCR diagnostics to POC (Point of Care).
We report design and testing of a novel design which can perform complex sample preparation for PCR
at the POC (Point of Care). The design allows different volumes of samples and reagents for different
protocols while not affecting the dead volume. This is extremely useful for different sample types and
protocols. The design also allows different sample preparation steps in the same overall form factor of
the disposable thus potentially allowing a single universal instrument to use a wide variety of
disposables. No discrete valves or on chip pumps are needed. Vacuum or pressurized gas is also not
required to operate the disposables. The design can be injection molded for low cost. A closed sample
preparation system can built based on the design. The design has potential to include the PCR chamber
to enable a full sample to answer cartridge at low cost. The design allows complex fluidic operations
with a simple implementation. It also allows mix and match and on the fly reconfiguration and design
thus resulting in truly modular and customizable design. The design is also useful for wide variety of
applications including fluid manipulation, chemical and biological analysis, food safety, forensics, drug
testing and many others.
Introduction
Sample preparation has been a challenge in design of integrated sample to answer systems[159].
Sample preparation for real time PCR is typically done in laboratory with bench top methods. Such
methods require bulky and power hungry equipment like centrifuges and vacuum manifolds. There are
various steps which have to be done manually. The robotic systems which automate many of these
steps are large, expensive and not geared towards low cost and point of care (POC). There are

205
instruments which enable automation of various steps. However these are very expensive and require
trained manpower and maintenance.
Over years there are many designs and products reported which try to take the sample preparation to
POC. Various reviews for point of care testing are available [26-29, 95] [46, 91, 160] [91, 92] [161] [162]
[163] [164]. Reviews focusing sample processing are also available [159, 165-171] [172] [173] [174].
However, sample preparation still remains a challenge[175]. The biggest remaining hurdles to bring MDx
(molecular diagnostics) to POC are said to be reagent storage, sample prep, and integration with existing
medical infrastructure and electronic record keeping.
Many of these try to tailor the design of chips or cartridges to well established chemistry while others
try to have novel methods for sample preparation. Most of these designs have several constraints and
need external elements which make it difficult to use them at POC in a robust fashion. Another
limitation is that many of these designs are ‘fixed’ for sample type and the volume of sample thus
making it less universal for a variety of assays. Partly due to limitations of 2d designs in chips, the
complexity is high in many cases. The often overlooked thing in many of these works is the cost of
production including assembly difficulty. Thus many of these designs are not easy to produce in large
quantity. Another important element is the filling and sealing of reagents on the cartridge. Many designs
are not amenable to automating this operation with flexibility.
Earlier Work
9.3.1 Commercial
There is no CLIA (Clinical Laboratory Improvement Amendments) waived sample to answer system for
POC applications even in the US. No PCR tests are allowed at physician office. There are various
companies which are working to get sample to answer systems including Cepheid,Luminex, Biocartis,
iquum, enigma diagnostics, incubate, GenePOC, BioFire, Alere, Micronics, stat-diagnostica and Quidel.
Of these Cepheid design requires a lot of power and its deployment in development world POC is
debatable. Gates Foundation has given huge grants to both Alere and Quidel for development of their
systems. Quidel is using technology from Northwestern University which developed this technology
under a Gates Foundation’s grant. Gates foundation has also funded other organizations for
development of sample preparation component for POC Dx program.

206
Some companies have non-integrated offerings. Examples are Ustar, Bigtec, meridian and nanosphere.
There are lab based sample prep only platforms like EZ1 Advanced and QIAcube from Qiagan, MagNA
pure, COBAS Ampliprep, COBAS 4800 from Roche.
There are companies trying to develop systems to be deployed at POC. In first world market they are
mostly targeted towards Physician clinics and pharmacies. After through deliberation Gates foundation
is also inclined toward putting sample to answer systems at Clinical level. It seems that systems which
are as portable as pregnancy test instruments are not a big focus.
9.3.2 Research Literature
Some selected examples of sample prep design can be looked in the references [176-189] [190] [191].
The designs have followed card like approaches which are closer to a 2D design or 3D approaches. Most
of the efforts have used solid phase binding matrix for dna or rna extraction. We could not find a design
which looked promising for our application. Also as the complexity increases, the resources needed to
build the whole system can be out of capability of many research labs. 3D plastic based designs should
be considered make by injection molding. Injection molding is a very common industrial there large
scale production process. However, it’s not common in research labs to have capability of =design and
the production of injection molding parts. Injection molding also has lead times, mostly due to tooling
which makes it expensive and slow. With the complexity of the chip, the cost of tooling can be a critical
factor for a research effort. Search is typically trying to show a proof of concept and due to nature of
plastic and polymers involved with complex designs, alternatives to molding are not trivial. Processes
like machining can be very slow, and typically don’t preserve the surface finish. Such machines also
requires appropriate machines and expertise. Therefore, while evaluation designs from research, it
should be considered if the process for fabrication and design is really useful for the mass production or
is only good for the proof of concept. Another approach by some researchers is to involve industry to
fabricate and help in design of the parts.
Requirements
We are determining requirements for a POC technology which consist of an instrument and a
disposable. We want to use the same instrument for sample prep for a wide variety of assays.

207
The technical challenges for development of chip-compatible sample prep is reviewed[192]. Sample
prep at the POC should eliminate manual steps to ideally allow an instrument to perform all steps after
sample injection to recovery of real time PCR capable solution. To have an impact in the developing
world the system should be low cost, rugged and reliable. The instrument should ideally allow various
sample types to test for various diseases. It should allow different volumes of the reagents and samples
for different panels. A universal instrument which allows testing for a wide variety of diseases by only
changing low cost disposable cartridges can have a huge impact world over. To allow use of different
chemistries (both current and future) the design should allow adjustable steps or operations without
changing the hardware. For example blood and urine can go through different sequences of operations
depending on the target one is looking for. For certain chemistry blood may need to be filtered to
remove the cells while for others this may not be a requirement. Such flexibility makes design of sample
preparation for POC very challenging with typical approaches.
An attractive feature is to be compatible with a large variety of assays already developed for various
diseases. Thus qPCR is an attractive option for detection and quantification due to assay availability.
We can list the requirements for sample prep as follows.
i. Low Cost ii. Easy to automate and optionally allows manual operation as well. Does not require
instruments which are complex, expensive or power hungry. It is important to consider instrumentation with the design of the sample prep disposable.
iii. Allows porting of already developed assays. iv. Freedom to operate – not blocked by patents v. Allow different sample types including
a. Blood b. Plasma c. Sputum d. Urine e. Stool f. Swabs
vi. Allow variable volumes of reagents and samples vii. Allow variety of operations including
a. Filtration b. Bind, Wash and Elute c. Homogenization, grinding, sonication etc.
viii. Allow fluid routing for different protocols ix. Low dead volume x. Easy to fill liquid reagents xi. Dry Reagent storage should be easy xii. Allow integration to qPCR based detection and possibly with other techniques like ELISA

208
xiii. Allow sample prep for both immunoassays and PCR xiv. The cost of disposable should be low. Ideally the disposable in manufactured using injection
molding. xv. Can be used in a wide variety of conditions (like moving vehicles) and easily carried to low
income POC conditions. xvi. Allows easy transfer of prepared samples to tubes or cartridges.
Problems with Existing Approaches
Most of the designs do not fulfil the requirements. Some sample to answer systems are costly and
complex. The commercial sample to answer systems required elaborate instrumentation which is not
feasible for our purposed. For example the instrumentation for Cepheid is expensive and requires
significant infrastructure.
Quidel instrument offers an innovative sample preparation solution. However, it remains to be seen that
the method is efficient and can work in challenging conditions. Adding a new sample prep protocol also
has to redo a large number of assays already available. The cartridge complexity and performance was
not found appropriate for Micronics system. Although the cartridge is integrated, the complexity is high.
Alere system does not use qPCR which brings patent protection problem. Also the design of cartridge
does not seem to accommodate variable volumes easily. The instruments in all cases are expensive for
its widespread use in low income places.
Most methods in Lab on chip applications using solid matrix to bind dna. The widely used bind-wash-
elute protocol is used. New methods are Immiscible Filtration Assisted by Surface Tension (IFAST) [193]
[194]and Biphase Flow[195] and immiscible phase purification[196].
Conceptual Design
We appreciated that in sample prep typically various kinds of fluid interact with some elements with a
function. We call these elements as Functional Elements (FE).
We observed various injection molded fluidic manifolds as well. However, we could not find an
appropriate item which can be directly used.

209
Our fundamental ideas was to move the elements instead of routing fluids though channels and other
ways to stationary elements. In complex designs moving fluids requires valves and pumps which
channels cause dead volumes.
The device consists of a rotating and or moveable structure (MS) which can have various functional
elements (like DNA binding membrane, filters for bacteria or viruses, lysis structures etc.) integrated into
it. The connections to various tubes, reservoirs, processing areas, reagent storage (CS) can be made
simply by moving or rotating the MS.
The MS can replace a number of valves, channels and complex structures. In some cases only rotational
motion is sufficient to operate the systems. This can be done conveniently using a low cost motor.
A large variety of operations can be performed by this design. Several embodiments are described
below.
9.6.1 Concept
For an explanation of the concept, please refer Figure 9.1. Figure 9.1(a) translating MS moving structure
while a rotary design is presented in Figure 9.1(b). The sliding motion can be along curved path as well.
For purpose of explanation, both the implementations are very similar.

210
Sample
Wash Buffer
Wash Buffer
Elute Buffer
DNA Membrane
Other functional element (eg flter, open, mixing, lysis (electric, mechanical, ultrasonic) etc.)Lysis buffer
Sliding Part
Housing
DNA binding matrix
Sample, Lysate, mixture
Wash 1 Wash 2
Elute Buffer
(a)
(b)
Figure 9.1 Sample Preparation Device Concept. (a) Translational Configuration. (b) Rotational Configuration.
In each case the MS can have straight (pass through) channels with functional elements or channel like
structures. Both MS and CS can move in case of this design. Figure 9.2 shows a design with multiple
functional elements in the MS.

211
Sliding Part
Housing
SampleLysis Wash 2
Elute Buffer
Cell Lysis structure
Filter for Cells / Plasma
DNA binding matrixCross Channel
Figure 9.2 Multiple Functional Elements
The structure can be multilayered as well. In one embodiment the CS can also move as shown in fig 3.
This will allow relative positioning of different CSs with respect to each other in addition to their relative
positioning with respect to FEs in the MSs. Alternatively there can be multiple layers of MS as well. The
distinction in MS and CS becomes blur in this case. Multiple thin layers can also assist in complex routing
operations.
9.6.2 Functional Elements and Containing Structures
A wide variety of functional elements can be integrated into the systems. Some examples are Filtration,
Mixing, Binding, Lysis, Cytometry, Analysis, De-bubbler, Di-electrophoresis, Impedance spectroscopy,
Clear Channel and Capillary filling.
The CS can also be of various types. Some examples are
• Syringes with pistons as shown above.
• Custom syringe shapes with custom pistons
• Tubes with pinching mechanism to move fluid
• Planar reservoirs and channels with on chip or external pumps

212
• Pouches
• Blister packs
• Reservoirs with flexible membranes (which can be pressed to move the fluid)
• Pipettes
• Cartridges (to be filled)
• Tubes (to be filled e.g., PCR tubes)
To move fluids various kinds of MM can be utilized. Electrical motion via motors is a robust approach.
Pneumatic pressure can also be utilized.
9.6.3 Sample preparation for PCR
Sample preparation for PCR is explained as follows. The sliding part has one channel with embedded
DNA binding matrix in this case. The sliding part aligns itself to reservoirs/CS containing sample, wash
and elute buffer in sequence. The fluid can move to and fro across the membrane rapidly thus allowing
quick sample preparation and higher performance.
We consider low cost syringes acting as CS as an example. Thus sample obtained from a person using a
syringe can be directly attached to the device. The syringe (or reservoir) attachments can be standard
luer connections. Even in such design the dead volume is very low due to this novel design. It allows
versatile sliding parts for a variety of operations. Also note that no valves are needed as the sliding
structure is acting as a valve. The thickness of the sliding structure can vary.
It's possible to do both manual and automated operation. Since the pistons take the whole volume and
can apply high pressures, this method is very robust and fast. The whole system can be closed to get rid
of any contamination issues.
Fig 5 shows NA extraction operations in which the MS is rotating about an axis. It's still the sliding
motion but arranged differently.
9.6.4 More complex and universal SP
Note that the sizes and relative distances of CS and MM structures do not affect the dead volume.

213
The design allows a truly universal design as we can have a variety of FE both in CS and MM. these can
be used on demand and in a programmable fashion. For example some samples may not need filtration,
in which case the filtration FE does not need to be moved in place. Also multiple lysis options can be
integrated in MS and CS. For tough or gram positive bacteria, one CS can have beads. The sample in this
case can be moved to lysis CS. Alternatively, there can be beads inside the MS.
The design also allows on the fly or field mix and match of modules for SP. For example there can be
standard interfaces for CS's. Say, luer connectors are made standard. Then for a SP operation, the CS
(like syringes) with suitable functionality can be attached. The MS can also be modular and assembled
on spot.
9.6.5 ELISA
Separate ELISA or ELISA with PCR tests can be performed using this idea. If blood is being used as a body
fluid, separation of plasma and cells can be performed using our inventions. The result can be read using
fluorescence intensity.
Having one cartridge to perform both PCR and ELISA tests can simplify a lot of health related problems.
9.6.6 Cell Filtration
It is possible to separate blood serum, plasma and cells using this invention. Different filters can be
moved in place to achieve the separation and further analysis downstream.
The design allows option to keep the cells or to keep the plasma. If cells need to be kept and plasma
needs to be rejected, a FE in the MS can conveniently do this operation. If blood needs to be filtered,
then a side CS can be used. The concept in later case is shown in Figure 9.3.

214
Sliding Part
Housing
DNA binding matrixCan be prefilled with ethanol to enhance binding
Wash 1Wash 2
Elute Buffer
Sample injection hole/port
Prefilled Liquid
Filter
Vent + 2nd sample inlet
Figure 9.3 Filtration of Blood to Retain Plasma
Advantages
The design offers many advantages which are not typically available in existing product.
Adding an operation is adding another stage to the cartridge. The instrument does not need to change
to allow such addition. Thus very different protocols can be ported to our design. The protocols can
vary in number of steps and operations as well. However, in most of other designs, this is not easily
done. Variable volumes are easy to manage and even same size cartridges can be used in some range.
Due to syringe type structures and very low dead volumes, different volumes can be easily
accommodated by just the position of respective syringe tip.
The instrument interface is very flexible and can be such that the cartridges can undergo many design
iterations while the same instrument remains useful.
Clogging is another problem which happens even in Cepheid systems. Our design allows to and fro
movement and positive displacement.

215
The DNA binding efficiency can increase by passing the sample multiple times though the DNA binding
matrix. This is not done in most designs. However, our design let this to happen in a fast and easy way.
Design allows other diagnostic tests as well like ELISA and immune PCR.
The systems can work under vibration and changing attitude like in a vehicle, ship or aircraft. Venting is
not required to move fluids as is the case with many other systems. The system is closed.
Multiple materials can be used in fabrication and integration of system with PCR cartridges or tubes is
easy and well controlled. For movement of fluids across FE in the MS, both positive and negative
pressure can be applied. There is no need to restrict buffers, for example, to be non-foaming.
Design and Fabrication
We designed the system in both linear and rotary configurations. We also varied the sizes of the devices.
We first designed the systems for 3D printing. The surface quality of 3D printing is not appropriate for
moving syringe tips as the surface has layers due to fabrication process. Nevertheless we had some
success in using pipette tips with this approach. We designed the Stationary structure to be printed and
used positive displacement pipette tips glued to the system as well.
We used a Teflon bar with a hole as the sliding part. We also used bars which were printed via 3D
printing. Figure 9.4 shows and example of such a cartridge with 3D printed parts and a Teflon sliding bar.
Design diagrams for top and bottom parts are also shown.
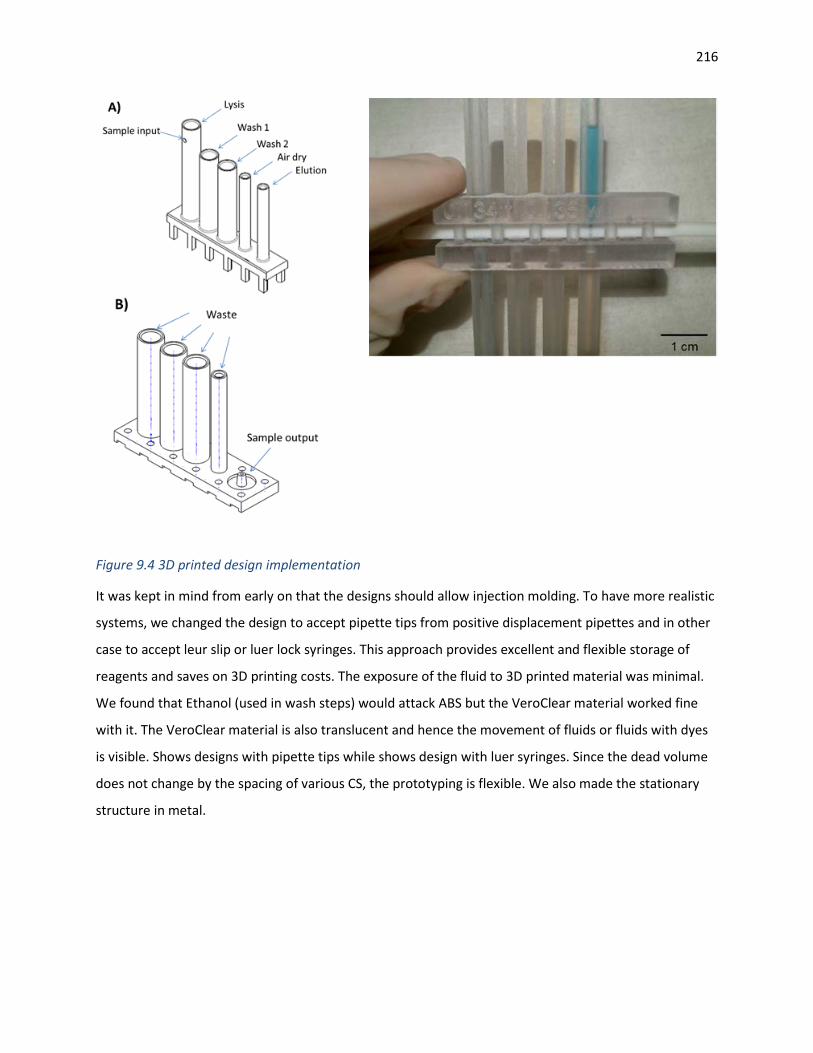
216
Figure 9.4 3D printed design implementation
It was kept in mind from early on that the designs should allow injection molding. To have more realistic
systems, we changed the design to accept pipette tips from positive displacement pipettes and in other
case to accept leur slip or luer lock syringes. This approach provides excellent and flexible storage of
reagents and saves on 3D printing costs. The exposure of the fluid to 3D printed material was minimal.
We found that Ethanol (used in wash steps) would attack ABS but the VeroClear material worked fine
with it. The VeroClear material is also translucent and hence the movement of fluids or fluids with dyes
is visible. Shows designs with pipette tips while shows design with luer syringes. Since the dead volume
does not change by the spacing of various CS, the prototyping is flexible. We also made the stationary
structure in metal.

217
Figure 9.5 Design with Pipette tips
Figure 9.6 Luer Lock based connections

218
9.8.1 Injection Molding
The designs were also injection molded using COP 1420. Injection molding puts several constrains on
design due to the process. After few iterations, the parts had little warpage. The residual stress in the
injection molded parts can be taken care of by annealing. The injection molded parts are show. We used
common syringe sizes to use the available syringe tips.
The design consisted to top and bottom parts with a rod between them. The top and bottom parts can
be bonded using adhesives after the bar is placed in between.
Filling of liquid reagents can be done before bonding by filling from the side which contact the moving
rod. A liquid handling robot can accelerate this process.
Figure 9.7 Injection Molded Cartridge
9.8.2 Seal Design
One of the key features of the design is the moving seal. As the moving bar of disc has to contact the
fixed part at a number of places, friction should be kept low. At the same time there should be enough
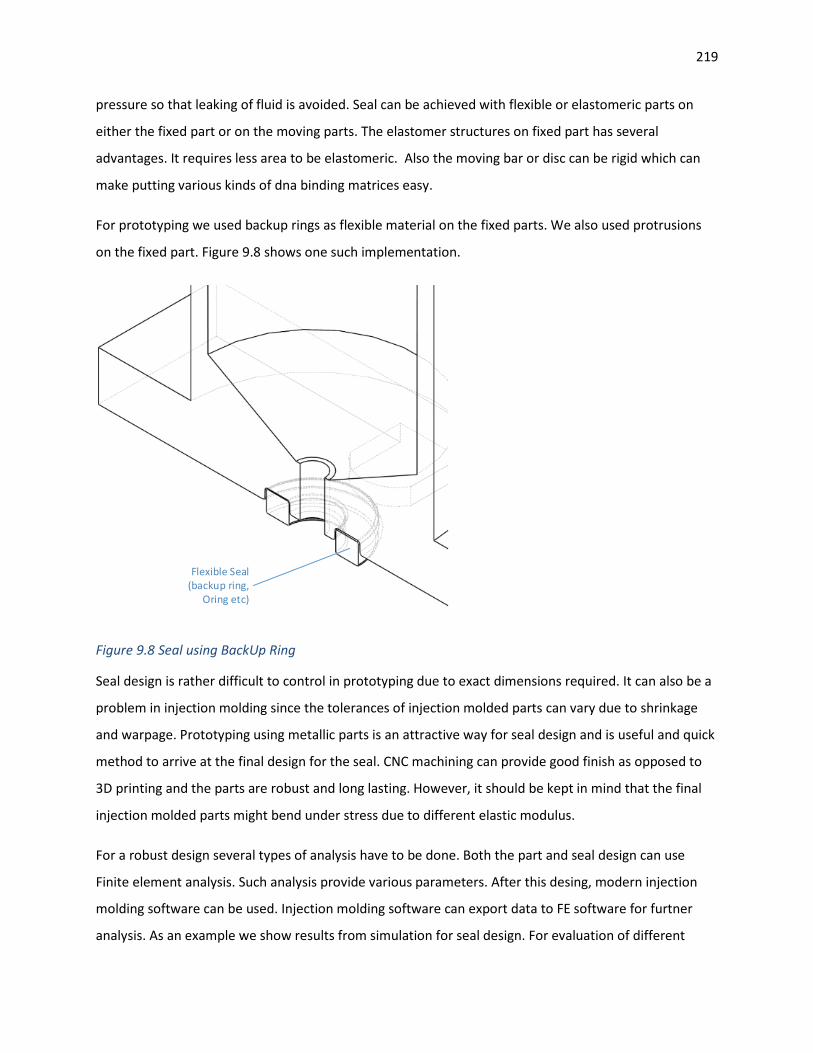
219
pressure so that leaking of fluid is avoided. Seal can be achieved with flexible or elastomeric parts on
either the fixed part or on the moving parts. The elastomer structures on fixed part has several
advantages. It requires less area to be elastomeric. Also the moving bar or disc can be rigid which can
make putting various kinds of dna binding matrices easy.
For prototyping we used backup rings as flexible material on the fixed parts. We also used protrusions
on the fixed part. Figure 9.8 shows one such implementation.
Flexible Seal(backup ring,
Oring etc)
Figure 9.8 Seal using BackUp Ring
Seal design is rather difficult to control in prototyping due to exact dimensions required. It can also be a
problem in injection molding since the tolerances of injection molded parts can vary due to shrinkage
and warpage. Prototyping using metallic parts is an attractive way for seal design and is useful and quick
method to arrive at the final design for the seal. CNC machining can provide good finish as opposed to
3D printing and the parts are robust and long lasting. However, it should be kept in mind that the final
injection molded parts might bend under stress due to different elastic modulus.
For a robust design several types of analysis have to be done. Both the part and seal design can use
Finite element analysis. Such analysis provide various parameters. After this desing, modern injection
molding software can be used. Injection molding software can export data to FE software for furtner
analysis. As an example we show results from simulation for seal design. For evaluation of different

220
materials, data is needed which is not readily available. Ideally the coefficient of friction for different
load conditions should be available for various parts. This is made complex since we can use various
lubricants which will change this value. However, FE is very useful in seal design.
Shows results from a structural simulation. Such analysis shows the deformed shape, the contact status
and the stress each material is undergoing.
(a)(b)
(c)
Figure 9.9 Seal Design FEA. (a) Geometry (b). Moving Rod deformation. (c) Contact status

221
9.8.3 Instrument Interface
Automation of the devices can be done various ways. One is to use a motor with screw to drive the MS
as in case of Figure 9.10. For rotary designs, a stepper motor can be used. Both manual and automated
operations can be provided in one device.
In many cases no complex actuators are needed while still being able to precisely control fluid volumes
and movement.
Figure 9.10 Automation Concept
9.8.4 Advantages of using syringe type CS
The use of syringes in movement of fluids have certain advantages over other techniques. The syringes
are mass produced and are very reliable. They allow movement of all of the fluid inside the cavity. Thus
some biomolecules are not left inside a cavity while movement like in other techniques. Also the
amount dispensed can be very accurately controlled. The CS can be of different volume than the amount
to be dispensed which allows operational and design flexibility using the same cartridge.
Syringes allow high pressure to be applied without failures. This feature allows rapid operation and
many other options (like in lysis, filtration, mixing etc).

222
One option is EOP (Electro-osmotic pumping). This can be used to pump elute buffer with DNA in
cartridge.
Other is to have a membrane which can press down on a reservoir.
9.8.5 Interface to qPCR and other reaction chambers
After sample processing, the required species can be introduced into one or multiple chambers. In case
of qPCR, the last stage’s actuator can push the elute buffer through the membrane.
The design is also useful for convective PCR. In that case the plunger can push and pull fluid back into
the temperature zones. Air or an inert fluid in a narrow channel can be used. As the observation is being
done at one temperature (e.g. annealing temperature), the optics has to observe only one location in
case of one chamber.
Interface can be made to digital PCR as well. In that case the sample has to be distributed among
multiple chambers. We have already shown that our optical design can work with multiple reservoirs or
array style implementations.
Tests on Clinical Samples
The cartridges were tested on Clinical samples in Dartmouth. Even the cartridges were made using 3D
printing, we obtained good results showing the promise of this design. Comparison was made with
Qiagen EZ1 robot. For PCR we used Cepheid Smart Cycler Platform.
9.9.1 Trial 1 - A urine sample from a patient positive for Trichomonas vaginalis (TV)
Protocol
We used the following volumes and extraction protocol using Caltech’s POC system. DNA was also
extracted suing same urine volume with the EZ1 Qiagen Robotic system (the gold standard) for
comparison.
Extraction Lysis and bind 650 µL urine+
500 µL BE + 65 µL Pro. K (let stand 5 min). Add 500 µL ethanol (100%) & Mix
Wash 1 500 µL BW

223
Wash 2 600 µL B5 Air Dry 1 min Elute 100 µL BE at 70° C
After extraction 25 µl reactions were run with primers specific for (TV) using Cepheid Smart Cycler
platform.
After amplification, 4 µl of PCR product was run on gel.
PCR
We tested the presence of Trichomonas by PCR using specifically designed primers and the Bio-Rad
EvaGreen PCR master mix. We performed both melt curve analyses and gel electrophoresis to confirm
PCR specificity. PCR conditions were as follows:
1) 95°C for 5 minutes
2) 35 cycles of :
-95°C for 5 seconds
-55°C for 30 seconds
3) Melt Curve: - 60-90°C, 0.2°C/second
-We used 1, 2 or 3μl input DNA for PCR.
-4μl amplified DNA was run on a gel

224
Observations
Caltech POC system has similar Ct and brighter gel bands than the gold standard EZ1 robot. EZ1 is
optimized for urine samples. Caltech’s system extraction efficiency looks at least as good the EZ1 in this
trial.

225
9.9.2 Trial 2 - A vaginal swab sample from a patient positive for Trichomonas
vaginalis (TV)
Protocol
We used the following volumes and extraction protocol using Caltech’s POC system. DNA was also
extracted suing same urine volume with the EZ1 Qiagen Robotic system (the gold standard) for
comparison.
Extraction
Lysis and bind 650 µL swab + 500 µL BE + 65 µL Pro. K (let stand 5 min). Add 500 µL ethanol (100%) & Mix
Wash 1 500 µL BW
Wash 2 600 µL B5
Air Dry 1 min
Elute 100 µL BE at 70° C
After extraction 25 µl reactions were run with primers specific for (TV) using Cepheid Smart Cycler
platform.
After amplification, 4 µl of PCR product was run on gel.
PCR
We tested the presence of Trichomonas by PCR using specifically designed primers and the Bio-Rad
EvaGreen PCR master mix. We performed both melt curve analyses and gel electrophoresis to confirm
PCR specificity. PCR conditions were as follows:
1) 95°C for 5 minutes
2) 35 cycles of:
-95°C for 5 seconds
-55°C for 30 seconds
3) Melt Curve: - 60-90°C, 0.2°C/second
-We used 1, 2 or 3μl input DNA for PCR.
-4μl amplified DNA was run on a gel

226
Observations
Interestingly, only Caltech system could extract from this sample. This may be due to the design of
Caltech’s system. It is clear in this trial that Caltech’s extraction efficiency is much better than EZ1 robot.

227
It is likely that the concentration of pathogen was much less in vaginal swab sample and Caltech’s higher
efficiency extraction outperformed the gold standard.
9.9.3 Trial 3 - A vaginal swab sample from a patient positive for Chlamydia
trachomatis (CT)
Protocol
We used the following volumes and extraction protocol using Caltech’s POC system.
Extraction Lysis and bind 650 µL swab +
500 µL BE + 65 µL Pro. K (let stand 5 min). Add 500 µL ethanol (100%) & Mix
Wash 1 500 µL BW Wash 2 600 µL B5 Air Dry 1 min Elute 100 µL BE at 70° C
After extraction 25 ul reactions were run with primers specific for (TV) using Cepheid Smart Cycler
platform.
After amplification, 4 µl of PCR product was run on gel.
PCR
We tested the presence of Chlamydia trachomatis (CT) by PCR using specifically designed primers and
the Bio-Rad EvaGreen PCR master mix. We performed both melt curve analyses and gel electrophoresis
to confirm PCR specificity. PCR conditions were as follows:
1) 95°C for 5 minutes
2) 35 cycles of:
-95°C for 5 seconds
-55°C for 30 seconds
3) Melt Curve: - 60-90°C, 0.2°C/second
-We used 1, 2 or 3μl input DNA for PCR.
-4μl amplified DNA was run on a gel

228
Observations
Caltech system successfully extracted Chlamydia trachomatis (CT) from vaginal swabs.

229
9.9.4 Trial 4 - A whole blood sample from a normal patient to evaluate genomic DNA
extraction
Protocol
We used the following volumes and extraction protocol using Caltech’s POC system.
Extraction Lysis and bind 650 µL Blood +
500 µL BE + 65 µL Pro. K (let stand 5 min). Add 500 µL ethanol (100%) & Mix
Wash 1 500 µL BW Wash 2 600 µL B5 Air Dry 1 min Elute 100 µL BE at 70° C
After extraction 25 µl reactions were run with primers specific for (TV) using Cepheid Smart Cycler
platform.
After amplification, 4 µl of PCR product was run on gel.
PCR
We tested the presence of genomic DNA by PCR using primers targeting β-actin and the Bio-Rad
EvaGreen PCR master mix. We performed both melt curve analyses and gel electrophoresis to confirm
PCR specificity. PCR conditions were as follows:
1) 95°C for 5 minutes
2) 35 cycles of:
-95°C for 5 seconds
-55°C for 30 seconds
3) Melt Curve: - 60-90°C, 0.2°C/second
-We used 1, 2 or 3μl input DNA for PCR.
-4μl amplified DNA was run on a gel

230

231
Observations
Caltech system successfully extracted genomic DNA from whole blood. Extraction of both pathogenic
and genomic DNA can be useful in personalized medicine, genetic disease testing and other applications.
Conclusion
We have presented a new closed, robust, manufacturable, flexible and low cost design for sample
preparation. Even with non-optimized system, we could extract dna from clinical samples with
seemingly high efficiency. We hope that this design can outperform most of the current designs and can
a significant contribution to point of care diagnostics worldwide.

232
10 Embedded Electronics Introduction
POC instruments need embedded electronics for operation. Typically electronics is not developed in an
academic setting and external instrument are used to prove the concept.
Among POC instruments, real time qPCR is one of the most intricate due to temperature control and
optical detection for multiple channels. Various operations have to be synchronized and real time
control, data collection and communications must occur. In some cases the optical signal can be weak
and a high quality circuit design should be done.
The real proof of concept of a POC system should include the electronics as bench top electronics can
have different designs and features which are not the optimum to implement in embedded electronics
for POC.
Surprisingly we could not find an off the shelf module having desired features for our optical design
even at the bench. Thus it cannot be always assumed that the embedded electronics and software will
be easily developed for POC qPCR instruments. This is especially true if a highly flexible system is being
developed to work with various signal levels and different cartridge designs.
There are only few point of care instruments with full embedded electronics reported for isothermal
nucleic acid based tests [71] and we could not find full implementation for real time PCR based system
in academic literature.
There are many advanced algorithms which can use the same elements in the instruments for better
performance. For example modern control theory can make thermal performance better which could be
worse if such algorithms are not employed. Modern estimation theory can also help in various
measurements.
Smartphones are not always available or desirable at POC due to various reasons. In some settings they
can be quickly stolen. A fully self-contained simple to use system is very important at POC. In the case of
qPCR, the amplification and melt curves are not something which untrained people should use to decide
clinical outcomes. In such cases the embedded electronics has to run various algorithms. It has to check

233
the validity of reactions and interpret the results. Electronics should be designed to be able to run these
algorithms and have enough resources to allow upgrades for future assays and improvements in
algorithms.
Overall Design
We designed the electronics to have a core system and various other elements depending on the use.
The core system has processing and communication resources. Thus the same processor is used for all
applications. In our case we considered following instrument configurations.
i. POC qPCR instrument ii. POC sample prep instrument iii. POC sample to answer instrument (this is also universal instrument)
We tried to have a single PCB (printed circuit board to have all or most of the electronics to save space
and cost. It also helps in assembly.
Main Modules
The block diagram of the electronics is shown in Figure 10.1.
Bluetooth Module/Wifi Module
Temperature Sensor Interface
MAX31865, MAX31855
LED DriversCAT4109
Optical Detector InterfaceDDC114
Microcontroller
UART Interface
Motion Control & Motor DriversL6470
Encoder Interface
Limit Switch Interface
GPIO Expansion
Heater DriversMOSFETs PWM
UARTs
Power
Keypad InterfaceMAX1688
Display
C
T/C
RTD / Thermistor
Solenoid DriverA4950
Heaters
SPI
MOTORS
Timers
GPIO
Quadrature Encoder Interface
Figure 10.1 Block Diagram
234
10.3.1 Processor
We selected ARM core based processors due to their large penetration and low power consumption.
They are one of the leading products for embedded systems. We selected 32-bit processing. This is done
to allow running complex algorithms at a later stage. Another factor was the availability of tools for
development. This is a very important factor. ARM microcontrollers are available from many
manufacturers in various packages and configuration. We selected LPC1768 from NXP which is a 100
MHz 32 bit microcontroller with on-chip memory and a large number of peripherals.
10.3.2 Optical Interface
This is probably the most trick measurement in the system. Although simple circuits can be used for
fixed configurations [139], these have limited dynamic range. The signal range in real time PCR is not
very large if other parameters are fixed. However, if parameters changing, there can be issues with such
designs. The parameters which can change are reaction volumes, chemistries and reactions types (for
example ELISA vs qPCR). To have the design cover a large dynamic range and be sensitive, it should allow
integration time control.
We selected DDC114 (current to digital converter) from Texas instruments. The book by Bob Pease
helped in selection of this IC[197]. This is a unique IC which allows integration time for current to be
programmed on the fly. Hence our system can have a very large dynamic range. At a fixed integration
time, it has 20 bit resolution which is quite good.
10.3.3 Thermocouple and RTD interface
Lab on chip devices sometimes have integrated sensors. In other cases there can be non-conventional
sensors in the instruments.
There can be non-standard RTDs. For thermocouple cold junction compensation is an issue for POC and
was typically done by measuring temperature by an RTD or thermistor. Again owing to the book, we
found AD7794 (analog front end). This IC has ability to interface both thermocouples and RTDs. The IC
has to be programmed over SPI bus.
During the course of our work, two recent IC from Maxim Semiconductors became available. MAX3865
is an RTD interface where the RTD resistance can be changed by a resistor. MAX3866 is a thermocouple

235
to digital IC with on-chip cold junction compensation. Both of these are available on the electronics to
allow different sensors to be used and tested.
10.3.4 Motion Control
We selected ST L6470 (Fully integrated micro stepping motor driver with motion engine and SPI). This is
a powerful motion control IC for control of stepping motors and allows to run motion control
algorithms.
10.3.5 LED Drivers
CAT4109 and CAT4101 were used as LED drivers. Both are from linear technology. CAT4109 can drive
three separate LEDs with PWM control. CAT4101 can provide higher current drive. Both are linear
devices. We selected them to make use of their low noise.
10.3.6 H-bridges
For bistable solenoids, we selected A4950 which is listed as ‘Full-Bridge DMOS PWM Motor Driver’.
However we used it as an H-bridge.
10.3.7 Schematics
The schematics are attached as Appendix.

236
11 Developer Software Introduction
The user interface for POC diagnostics especially in developing world should be very simple[36] [198]
[39]. However, while developing the system we need detailed information about various elements. The
software should allow to test various hardware options and set test parameters easily.
The software are specially designed in such a way that different instruments can be easily added or
removed from the system. Two types of debugging software are developed for this system. One
software is extended version of the end user applications and the other one is a data acquisition based
software which allows to test and study crucial processes using evaluation boards.
Desktop Based
As mentioned earlier that desktop based debugging software is an extended version of the final
application. Hence it not only contains all the critical methods to perform test but also provides different
hardware controls which are necessary for the test engineers to test each hardware separately. In order
to control hardware special serial protocol is developed which is communicated to the embedded device
and then the embedded device decodes it and sends the necessary commands to each device.
11.2.1 Mode of communication
Embedded device and desktop debugging application can communicate with each other via UART using
RS-232 protocol.
11.2.2 Features
Heater Control
Desktop debugging application allows a test engineer to separately control the connected heater. Test
engineer can “on” or “off” the heater and thus a problem with heater can be easily detected during
debug process.

237
Cooler Control
Similar to heater the cooler can also be controlled via desktop application and thus allows the engineer
to predict whether there is a problem with cooler or not.
LED Control
LEDs connected to the embedded device can also be controlled via desktop application. Test engineer
can on or off each LED connected to each channel. Beside this the value of current flowing through each
LED can also be controlled. This help the engineer to test different current values and there effect on the
fluorescence channels.
DDC Control
In the embedded device the fluorescence is read using photodiode connected to DDC114. This DDC114
are flexible in terms of its integration time and sensitivity. In order to get the optimum performance
from the DDC114 different integration time and ranges can be selected depending upon the condition of
the system. Thus to test these features and to get the optimum performance these parameters can be
adjusted from the desktop application and thus test engineers can study the effect of changes in the
parameters in real-time and thus developed the final algorithm for the embedded device.
Temperature channel selection
Options to select the desired temperature channel are also provided in the desktop application. Test
engineer can select any channel in real-time.
Temperature control parameters
Temperature control parameters such as PID parameters and parameters for custom temperature
control can be selected from the desktop application and thus the temperature controller can be
tweaked in real-time.
Define Assay
Similar to the end user applications assay be defined using desktop application
Load and Run assay
Similar to end user applications assay can be loaded into the embedded device and test engineer can
run it from the desktop application. Real-time graphs and results are shown in the desktop application.

238
Real-time graph
A time base graph panel is shown on the main tab which shows the real-time graphs of all the connected
hardware. This provide help to the test engineer in order to predict any malfunction in a particular
hardware.
11.2.3 Tools Used
1. Visual Studio 2012, 2013
2. Gigasoft .Netcharts
11.2.4 User interface
DAQ based
A DAQ based debugging application is made in C# using WinForms platform. The DAQ application allows
executing QPCR assays with many other related features. The DAQ application allowed faster testing
and development of algorithms such as Temperature control algorithms, dynamic range adjustments
and others. The desktop application integrates a variety of commercial sensors and actuators. Tools such
as Labview and Simulink have limited support for integration of commercial sensors and do not allow as
much customization that can be achieved in developing a WinForms based application. A real-time

239
system is implemented synchronizing multiple connected devices including sensors, temperature
control outputs, cameras and actuators. An interface to connect to our embedded platform is also
included.
11.3.1 Architecture
Hard
war
e D
epen
dent
Pro
cess
es
Temperature Control
Assay Executor
Filter Wheel Control
Assay Execution Data Storage
Third
Par
ty
SDKs
/ Li
brar
ies
Measurement Computing DAQ C#
.NET Serial Port
Conn
ectiv
ity USB USB to RS-232 USB Ethernet / USB
Hard
war
e
Hard
war
e DAQ 2404
Temperature Thermocouples
Heater Cooler + Analog
FluorescenceTEC Various
Peripherals Filter Wheel
Hard
war
e El
emen
ts
USB
APT Motor ActiveX Control
MODBUS Custom Protocol
PicoLog DLL FlyCap SDK
DAQ 1608 DAQ 1208HS Embedded Device Qiagen ESE PDA Flor Picolog TC GigE Cameras
Thorlabs Motion
Controller
PDA Serial Protocol
Real-time PlottingInde
pend
ent
Proc
esse
s
Soft
war
e
Tem
pera
ture
Hea
ter P
WM
Cool
er O
n/O
ff
TEC
PWM
s
Fluo
resc
ence
Fluo
resc
ence
Tem
pera
ture
11.3.2 Parallel Programming
In order to achieve maximum performance, the program is developed using the concept of multi-
threading. Most of the 3rd party libraries used execute in their own threads. Beside this some custom
threads are also created. The purpose of doing multithreading is to speed up the program execution and
to maintain synchronization between the critical methods.

240
Temperature Read Thread
Recursive
Start
Thread sleep
Read Temperature
End
Read Pico Log TC
Read MCC DAQ
Temperature channels
Data Saving Thread
Recursive
Start
Assay Running
Store Assay Data
Yes
Thread sleep
No
End

241
Main Thread
Main feature of this thread is that along with the other execution code, it also execute all the time
critical methods in a timer. The recursion interval of this timer is 0.2 seconds. It keep all the execution
real-time
Execution Timer
Recursive
Start
parameters need update ?
Update parameters
Yes
Execute Assay step
No
Count step time
Count ramp time
Count stable time
Count overshoot
time
Counter for maintaining cooler pulse
width
Count filter wheel delay
Multiplexing ?Yes
Stype = Amplification
?
Update Amplification
graphStep type = Melting ?
Update Melting graph
Yes
Yes
Assay running ?
Yes
No
Update time graph
PID active ?
Execute PID temperature
controller
Yes
Execute TEC controller
Get sensors value
No
No
No
No
End

242
11.3.3 Features
Versatile Engine
The application provides a versatile engine for complex real time automation applications. If offers a
platform where upgrades and customizations can be made relatively quickly and easily compared to an
embedded platform.
Custom Assay
The application allows loading user-defined assays, which can be simply defined in any text editor or
using the windows 8 application. The format of assay is same as in other applications, and assays
defined in other applications are also compatible with the desktop application.
Assay Execution
The application supports executing both singleplex and multiplex assays. The assays are executed in
similar fashion to as in the embedded device, but in desktop application various additional features are
present.
Temperature Channels Selection
Before an assay is started a temperature channel needs to selected, on which the temperature will be
controlled. As multiple sensors are connected to the desktop, data from multiple temperature channels
is available. The two temperature sources are Pico Log Thermocouple and Measurement Computing
Data Acquisition card. Both of these sources have multiple channels available, although data from only
certain connected channels is useful. Therefore a feature is included to define temperature channels,
where the sensor and its channel can be selected and assigned as temperature channel ‘n’ in the
application.

243
11.3.4 Fluorescence Channels Selection
To measure the fluorescence again multiple sensors are connected. These include, Qiagen ESE,
Tetrahertz Technologies PDA-750, and fluorescence can also be obtained from our embedded device.
Fluorescence Sensors/ Channels
ESE has two detection channels and two excitation channels, and excitation channel for detection
channel 1 can be set to either 1 or 2, providing a total of three combinations, and two active
fluorescence channels. Our Embedded device has 4 fluorescence channels, whereas PDA has 1.
Therefore resulting in a total of 7 fluorescence channels to choose from.
Virtual Fluorescence Channels
Now for a multiplex reaction two filter wheels are used, to make virtual fluorescence channels. To
define a virtual channel, the positions of both filter wheels are selected and the sensor to be used is
selected. During assay execution the filter wheels movement and reading sensors is synchronized. The
synchronization uses three parameters.
1. Initial Wait, defines the time to wait at each optical step before fluorescence can be read, this is
because fluorescence takes a little time to reach a stable value.
2. Filter Move Interval, defines the time to wait between each filter wheel move command, this
delay accommodates the time it takes to move the filter and read value from sensor

244
3. Wait per Melt step, is used to provide extra time for temperature to get stable before virtual
channels are read by moving filter wheels.
Assay Speed Indicators
Apart from real-time plotting of data from sensors, to get a measure of the temperature control
performance and speed of assay execution current and previous steps’ Ramp, overshoot and stable time
are displayed. These indicators help in adjusting temperature control and assay execution parameters to
optimize assay speed.
Assay Data Export
To have a record of assay data, which can be used for analysis later, all the assay data including raw data
and graph plotting point is exported in a excel sheet. The assay execution data is saved and exported in
excel sheet in background while assay executes, so that even in a case of a crash data is available for
analysis which can also help in diagnosing the reason for crash. The assay data includes assay description
and information such as total assay execution time which helps in determining assay execution
performance.
Temperature Control
For temperature control two options are available.

245
11.3.4.5.1 Heater and Cooler
The heater is driven via PWM, while the cooler is controlled via a bi-stable solenoid. For
temperature control via heater and cooler, two temperature control methods are available.
These include a custom algorithm which uses a modified proportional control, and PID. PID auto
tuning is also implemented which uses CC tune algorithm.
1. Thermo Electric Cooling
The thermo electric cooling uses a TEC from Thorlabs, it is controlled via two PWMs, one for
each heating and cooling. The temperature control method used for it is again PID with a slightly
different implementation.
11.3.5 Real-time Graphing
For real-time graphing of data from sensors and other information, plotting control Pro-Essentials from
Gigasoft is used. There are three graphing controls in the application. The graph on main tab shows data
from all enabled sensors, and PWM outputs to control temperature, with time on x-axis. Then there are
two separate graph for cycling and melting plots. The subsets to be displayed in the graph are selected
by the user according to requirement.
11.3.6 Camera Integration
GigE USB or Ethernet cameras support is also added to the application. These cameras take snaps at
appropriate times during cycling. The snaps can be analyzed to get a measure of fluorescence at each
cycling step. It also helps to identify any physical issues such as a cartridge leak.
246
11.3.7 Tools Used
The application is made in Microsoft Visual Studio 2012 using C# on .NET 4.5 Framework. Additional
Third-party libraries used are:
Measurement Computing DAQ Managed Library
This library provides interface to DAQ cards. Three DAQ cards are used as shown in the diagram.
DAQ 2404: This DAQ provides analog channels and ports for thermocouples. Its used for
temperature measurement via thermocouples and reading fluorescence from PDA via its analog
interface.
DAQ 1608: This DAQ is used for providing pulse output to Cooler (solenoid) and PWM output to
heater.
DAQ 1208: This DAQ provides two PWM outputs which are used to control TEC heating and
cooling.
Picolog Unmanaged Library
This library is used to read thermocouples attached to PicoLog device, it has 8 temperature
channels.
Flycap SDK
Flycap SDK allows controlling GigE cameras. These cameras can be connected via Ethernet or
USB.
APT Motor ActiveX Control
This activeX control allows sending commands to APT Motor Controller from Thorlabs, in order
to control the filter wheel. The control also provides a user interface showing the status of filter
wheel.
Gigasoft Pro-Essentials
This control is used for real-time scientific plots

247
12 Embedded Software Requirements
• Cost effective solution for running ADx
• Running dynamic assay
• Real-time sampling from sensors
• Fast PWM updates for precise temperature control
Architecture
12.2.1 Hardware Architecture
Bluetooth Module/Wifi Module
Temperature Sensor Interface
MAX31865, MAX31855
LED DriversCAT4109
Optical Detector InterfaceDDC114
Microcontroller
UART Interface
Motion Control & Motor DriversL6470
Encoder Interface
Limit Switch Interface
GPIO Expansion
Heater DriversMOSFETs PWM
UARTs
Power
Keypad InterfaceMAX1688
Display
C
T/C
RTD / Thermistor
Solenoid DriverA4950
Heaters
SPI
MOTORS
Timers
GPIO
Quadrature Encoder Interface

248
12.2.2 Scalability
Scalable Lab System
Embedded ElectronicsModule 1
Interface & Control Electronics
Cell Phone
Embedded ElectronicsModule N
Touch ScreenC
Keypad
Bluetooth
Ethernet
Smart Card Reader
Access Point
WiFi
USB
Printer
Tablet
Computer

249
12.2.3 Software Architecture
Android Windows Phone Windows TabletScalability Host /
Interface Electronics
Desktop (Debug)
Bluetooth Module RS - 232UART
Use
r Dev
ices
CMSI
S Ba
sed
Firm
war
e
Sample To Answer
Apps
/ Fe
atur
esPr
oces
ses LED Control PID Temp
Control Read Sensors Assay Executor
Motion Control
QPCR Sample Prep
Timers and Interrupts
Communication Responder
Serial Protocol
UART Abstraction
CMSI
S Ab
stra
ctio
n la
yer
Driv
ers CAT LED
DriversMCP Digital
POTs
Current to D
ST dSpin Stepper Drive
+Quadrature
Decoder
MAX RTDMAX
TC
CMSI
S Ab
stra
ctio
n la
yer SPI PWM SSP SPISPI
GPIO Expans
ion
I2C
IAP
Configuration and Assay
Store
Report and Control mode
Hard
war
e
Inte
rfac
e CAT LED Drivers
MCP Digital POTs
Current to
D
MAX RTDMAX
TC
ST dSpin Stepper Drive
+Quadrature
Decoder
QEI
LEDs Heater Cooler
MOSFETs
Photodiod
es
RTD and TCs
Stepper Motors and Quadrature
EncodersH.w
ele
men
ts
GPIO
Limit Switch
es
Common

250
User Devices
A single cartridge system can be connected simultaneously to multiple devices over Bluetooth and
RS232. In addition to the scalability host connection discussed in previous chapter, the single cartridge
system can be directly connected to a variety of user devices, without any scalability host.
User applications are made for different platforms including Android, Windows Phone 8, and Windows
8. This allows most smartphones and tablets to be connected to the single cartridge system over
Bluetooth.
Firmware Overview
The microcontroller runs a firmware based on infinite loops design approach, and does not use any
RTOS. The firmware uses Cortex Microcontroller Software Interface Standard library for providing a
hardware abstraction for the microcontroller.
Some of the features of the microcontroller are not abstracted by CMSIS and custom drivers are used
for them, such as In Application Programming, which is used to store assays and configuration
parameters/
For external connected peripherals custom drivers are made to access and configure them.
• CMSIS benefits
• Easy portability among ARM Cortex M series
• Systematic, software design
• Easy to code
• Stable, well tested features
Features
The system is fully capable of running full sample to answer assays, and also provides the functionality
to run QPCR or Sample Prep alone.
The assay execution is dynamic and can run user-defined assays. Some predefined assays are stored in
the system, apart from those, the user can define a custom assay via a user-device such as Windows

251
Tablet and save it on the controller. These assays can be executed independently i.e. without the
intervention of any host / user device.
The systems allows operation in two modes:
1. Normal mode
2. Report and Control Mode
Normal Mode
In normal mode the controller independently runs the selected assay, once it receives the command to
start assay execution from a scalability host or a directly connected user device. All the peripherals are
controlled by the embedded software in order to execute the assay. The assay progress and results are
notified on all connected devices as the assay executes this provides the user devices with data to plot
cycling and melt curves. As the assay execution is independent, in case of loss of communication
between User Device and microcontroller, the last assay data is stored in the microcontroller, which can
be retrieved by any connected user device.
The data stored during assay execution includes, cycling data points and melting curve data points.
Although the melting curve data saved is sampled after every 1 second, whereas if user device is
connected during assay, a smoother melting curve can be generated at user device as the data is
sampled and provided every 100ms to the connected devices
Report and Control Mode
Report and Control mode adds to the flexibility of system, in this mode the controller must be
connected to a host (scalability host or user device). In this mode the host selects/enables the desired
sensors connected to controller. Then the controller sends the most recent buffered values from those
sensors to the host every 100ms. The host can then send commands to the controller in order to control
the Heater PWM, Cooler state, LEDs state, and configure certain sensors parameters. This mode gives
the host flexibility to execute an assay itself by controlling the peripherals connected to microcontroller.
This feature is also useful for research and debugging purposes.

252
Certain error checking and reporting features are implemented in the system, so that if any sensor
develops an error it is reported on the user device which helps in resolving any hardware issues that
arise.
Processes
All the processes on the system are based on timers and interrupts.
10Hz Timer
Slow TC Read Assay Executor
Report to Host
A 10Hz timer with pre-emptive execution is used for assay execution to count the step times, sampling
temperature from Thermocouples and for reporting to host.
The data reported to host regularly after every 100ms includes:
• Melting graph plot points
• All sensors latest buffered values (In report and control mode)
Whereas the cycling graph plot points are sent right at the end of each cycling step.
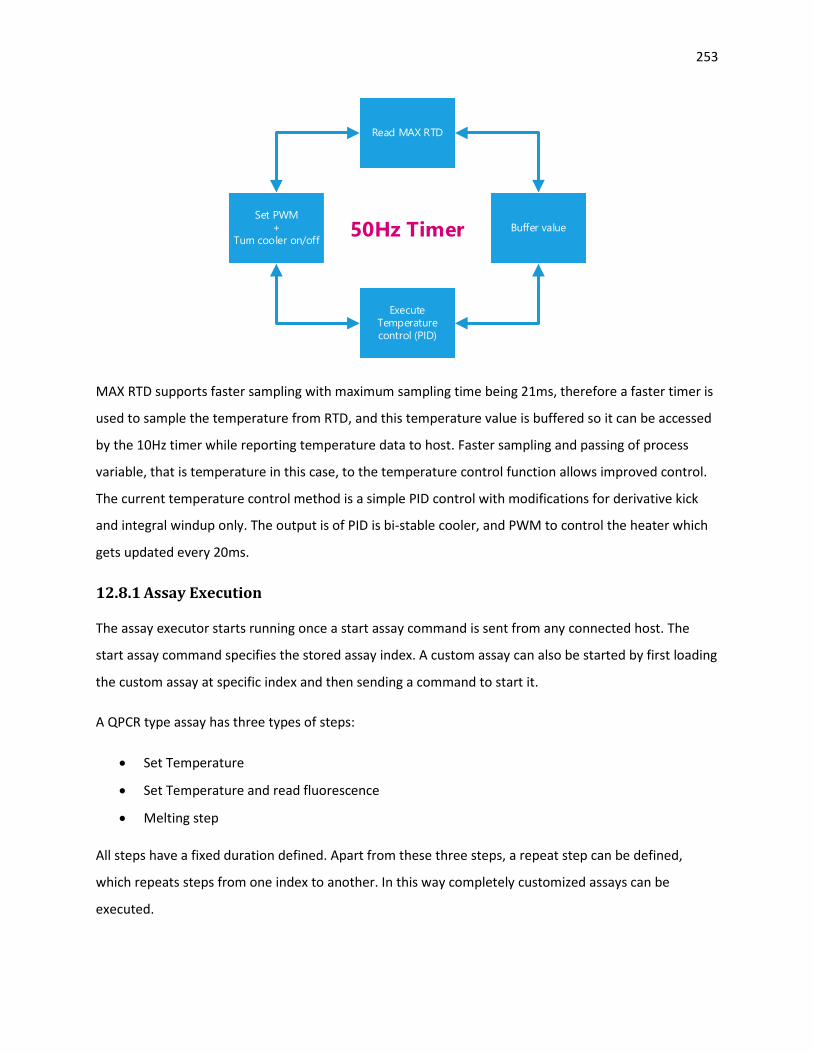
253
Read MAX RTD
Buffer value
Execute Temperature control (PID)
Set PWM+
Turn cooler on/off 50Hz Timer
MAX RTD supports faster sampling with maximum sampling time being 21ms, therefore a faster timer is
used to sample the temperature from RTD, and this temperature value is buffered so it can be accessed
by the 10Hz timer while reporting temperature data to host. Faster sampling and passing of process
variable, that is temperature in this case, to the temperature control function allows improved control.
The current temperature control method is a simple PID control with modifications for derivative kick
and integral windup only. The output is of PID is bi-stable cooler, and PWM to control the heater which
gets updated every 20ms.
12.8.1 Assay Execution
The assay executor starts running once a start assay command is sent from any connected host. The
start assay command specifies the stored assay index. A custom assay can also be started by first loading
the custom assay at specific index and then sending a command to start it.
A QPCR type assay has three types of steps:
• Set Temperature
• Set Temperature and read fluorescence
• Melting step
All steps have a fixed duration defined. Apart from these three steps, a repeat step can be defined,
which repeats steps from one index to another. In this way completely customized assays can be
executed.

254
Assay ExecutorGet Run Command
Load Assay
Step Executor
Last Step?
No
Assay Complete
Yes

255
Step ExecutorStart
Step type = Repeat?
Repeat Step (m to n)
Increase cycle numbers
Yes
Optical?
No
Set temperature
Step time out?
No
Temperature stable? Yes
Count timeNo
Step type = Melting?
Yes
Melt time up?
Yes
Set temperature
Send and store Fluoro
Count time
No
Set temperature
Step time out?
No
Temperature stable?
YesCount time
Last sample?
YesSend and store
Fluoro
No
End
Yes
Yes
Yes
Once a start assay command is received, the assay to be executed is loaded in RAM via IAP. Each step is
executed one by one until end of assay is reached. On a simple set temperature step, the Set Point of
Temperature Control method is set. The time is counted once the temperature reaches close to the Set
Point, and is considered to be stable. The maximum difference between Set Point and current
temperature, before the temperature is considered stable, is defined by a configurable parameter
“Temp Stable Range”. Which can be adjusted increase performance or to decrease overall assay
execution time.

256
If a read fluorescence step, lies in a repeat cycle, then it’s considered that cycling is in progress. In
cycling the temperature is maintained similar to a normal step but right before the start of next step a
the latest buffered fluorescence values for plotting cycling graph are stored in microcontrollers memory
and also sent to the connected host
In a melting step the temperature set point is changed by either one of the policies:
• Temperature is changed every 100ms • Temperature is changed in steps, according to the “melt step value” parameter defined in an
assay
The fluorescence values are reported to the host every 100ms, also the values are stored every second
in microcontrollers memory for retrieval if needed after assay completion.
12.8.2 Communication Handler/Responder
All communication with user devices is done via UART. CMSIS UART abstraction is used to implement
interrupt based communication responder. The communication is done according to a custom Serial
Protocol (see Appendix).
12.8.3 Fluorescence Reading and LED Control
Fluorescence is read by using a photodiode which is connected to DDC114 that a Current ADC. There are
four channels available on the system which allows a multiplex reaction to be run. While measuring the
value for once channel only the respective LED needs to be switched on. The DDC114 is used continuous
reading mode and uses a swing buffer for the four channels.
A match timer with direct external out is used to toggle DDC_CONV input on DDC114, which switches
current integration from channel 1 to 4. Respective channel LED is turned on and rest of the LEDs are
kept off at every match timer interrupt. The duration of match timer, is the time that DDC integrates
current on that channel.
DDC also allows its sensitivity to be configured, in order to increase range or sensitivity. Therefore to
adjust the range, either sensitivity or integration time can be adjusted. These parameters can be saved
in microcontroller.
For better performance, the integration time and sensitivity is dynamically adjusted at run-time. The
following flowchart explains the dynamic range adjustment.

257
Start
Get raw DDC Value
Value saturate?Min
sensitivity?
Min integration
time?
Error Msg
:Adjust LED
Brightness
Reduce Integration
time
yes yes
yes
noReduce
Sensitivity
no
Value low? no
Max integration
time?
End no
End
End
End
yes
Max sensitivity?
yes
Error Msg:
Increase LED
Brightness
End
yes
Increase Sensitivity
End
no
Increase integration
time
no
End
Drivers Description
12.9.1 IAP
A driver for In Application Programming is used to read and write on controller’s flash memory while the
system is running. The controller used has a 512kb Flash memory which is utilized, apart from storing
code, for storing pre-defined and user-defined assays, and configuration parameters.
The configuration parameters data such as:
• LED Brightness settings for 4 channels
• DDC settings
• PID parameters

258
12.9.2 MCP4342
MCP4342 is the digital potentiometer used to set a resistance to control current provided to LEDs via
CAT4109 LED driver. The driver uses CMSIS SPI abstraction to communicate with the digital
potentiometer IC. The driver allows setting resistances, and moving the potentiometer wiper in single
increment or decrement steps.
12.9.3 DDC114
DDC114 is a current ADC, which is used to measure the current from photodiodes. The driver uses
CMSIS Synchronous serial port abstraction to communicate with the DDC. The driver configures and
initializes the DDC, provides sensitivity adjustment and allows reading of values. The values are sampled
from DDC on interrupt, and the sampling frequency depends on the integration time set.
12.9.4 MAX 31865 – RTD
The MAX31865 is an easy-to-use resistance-to-digital converter optimized for platinum resistance
temperature detectors (RTDs). An external resistor sets the sensitivity for the RTD being used and a
precision delta-sigma ADC converts the ratio of the RTD resistance to the reference resistance into
digital form. The MAX31865’s inputs are protected against overvoltage faults as large as Q50V.
Programmable detection of RTD and cable open and short conditions is included.
Converting RTD Data Register Values to Temperature
The ratiometric ADC conversion results found in the RTD Data Registers can be converted to
temperature with a few calculations. First, the Resistance of the RTD needs to be determined with the
following equation:
RRTD= (ADC Code x RREF)/215
And then actual temperature is calculated by the following equation:
𝑅𝑅𝑒𝑒𝐸𝐸𝑝𝑝𝑒𝑒𝑠𝑠𝐿𝐿𝐹𝐹𝑠𝑠𝑠𝑠𝑒𝑒 = �𝑍𝑍1 + �𝑍𝑍2 + (𝑍𝑍3 + 𝑅𝑅𝑅𝑅𝑅𝑅𝑅𝑅)�
𝑍𝑍4
Where,
Z1 = 390830

259
Z2 = 1758
Z3 = 2
Z4 = 115
The above formula is derived from Callendar-Van Dusen equation.
12.9.5 MAX 31866 - TC
MAX 31866 is the interface IC for connecting thermocouples. The driver uses CMSIS SPI abstraction to
communicate with this IC. The driver configures the TC interface IC, provides fault identification, and
reads the temperature values at the maximum available resolution that is 0.25 C.

260
13 End User Software Products
Cell phones have incredible penetration into even low income areas. Using technologies which leverage
smartphone and cell phone networks can be transformative[199] [200].
End user products include software applications for different platforms such as Windows 8, Windows
phone 8 and android. The overall requirements, architecture and major methods are common for all
platforms to make management and future development less time consuming. Still there are few things
that are tailored according to the platform specifications so that the applications can get maximum
benefits from the native platform’s API.
Requirements
1. Two-way communication with embedded software.
2. Standalone software (can be open or closed source)
3. Ability to run and abort assays of all types i.e. qPCR, S2A, SP.
4. Ability to create, edit, delete assays of all types.
5. Show real-time graphs specially fluorescence vs cycles and fluorescence vs temperature graphs.
(software can also show temperature vs time graph but its optional)
6. Ability to show multiple fluorescence channels.
7. Ability to add/ load patients.
8. Management of patients and operators/ admin by either creating a custom EMR system or using
an already developed one.
9. Saving, loading and analysis of each test’s data, graphs and results.
10. Management of patient’s history and symptoms and allow the operator to get suggestions
based on geography and symptoms of the patient.
11. Ability to chat with the available doctor based on geography.
12. Real-time status of running assay i.e. running step type, cycle number in case of cycling.

261
Workflow
The workflow across all platforms is consistent.
13.2.1 Summary
The basic steps to perform a test are given below:
1. Login to the application.
2. Add patient or load patient’s data (personal information, history and diagnosis).
3. Suggest a test based on patient’s history, geography or as advised by the physician.
4. Find the hardware device containing embedded software.
5. Connect to the available device
6. Select test
7. Perform test
Show results and save them for future use
8. Take necessary actions on the basis of the result i.e. suggest a medicine, refer to a hospital or
suggestion for more tests.

262
13.2.2 Detailed Workflow
Sign-in
At the start of each application the user will be prompt by a login screen. User will need to enter
credentials such as username and password. The alternative way to log into the system is via smart card.
Sign-up
If the credentials do not match with the local database or the EMR system’s database then the user will
be asked to sign-up by filling a form. Once the user sign-up, the admin can activate account on behalf of
each user.
Main
Although the main screen is a little different depending on the platform of the application but the
purpose of each main screen is same and that is to present different options to the user such as,
• Options for adding, editing, and loading a patient. (Patient’s Profile)
• Options for performing a test including options for creating, editing and loading an assay. (Test
Panel)

263
• Options for viewing different graphs and assay’s status. (Graphs)
• Options for chatting with a doctor. (Chat)
• Options for Admin settings and records. (Admin Panel)
Patient Profile
Patients profile is further divided into number of options
13.2.2.4.1 Add Patient
User can add a patient into the database after filling a form. Form includes following fields.
1. Name
2. Sex
3. Medical ID
4. Country
5. Notes
User can automatically get patient’s details via barcode or smart card.
13.2.2.4.2 Load Patient
An existing patient can be load into the application either searching by patient’s name of medical ID.

264
13.2.2.4.3 Edit Patient
Patient’s details can be edit at any time provided that the user has privilege to edit it.
13.2.2.4.4 Patient’s History
Application will automatically fetch patient’s history if available. Patient’s history include pas test
records, symptoms, critical allergies etc.
13.2.2.4.5 Diagnosis
Application’s diagnosis algorithm can suggest a test based on patient’s history geography. Beside this a
doctor can also suggest a test to perform.
Test Panel

265
1. First it give options to find and connect to the device.
2. Once connected a job aid will be shown on the screen if the user is relatively new. User can
either skip it or read all the steps.
Options for selecting a test will be shown on the screen, user can load a test of any type saved in the
local memory or can select a default test to perform
3. Once test is loaded into the system, button to perform the test will appear/ enable. User can
click it to start performing the test.
4. User can abort a test midway if there is something wrong.
5. Once test is complete results will be displayed on the screen and will be stored into the
database.
6. After that further actions can be taken accordingly.
Graphs
The graphs panel can show graphs of different types such as temperature curve, amplification curve and
melting curve. User can view different fluorescence channels.

266
Chat
User can chat with a doctor based on the geography and availability. Chat can be either text, voice or
video based again depends on the availability.
Admin Panel
The admin panel include options such as
13.2.2.8.1 Settings
It include different settings depending on the platform, some of the common settings are
• Access level
• Mode of operation
13.2.2.8.2 Admin Information
All the personal details of the user will be displayed under this tag. These details include

267
• Name
• Lab/ hospital name
• Contact number
It also include options to edit personal details and to change password.
13.2.2.8.3 Test Log
All the records about the test performed by the user will be shown under this tag. Every
performed test according to the date will be shown in the form of a table and user can expand
each row to view results and further details such as graphs etc.
Key Methods
13.3.1 Assay Parsing
Each assay is defined as a text which can be easily understand with very less knowledge about the
system. This text base assay is parsed to get the details about each step.
13.3.2 Load to ARM
All the parse assay data is then converted into bytes according to the serial protocol given in
Appendices. This bytes based data is then send to embedded device to take further action.
13.3.3 Serial State Machine
The data received from the embedded device is transferred to this method which decode it byte by byte
so that the application can understand the received data. Received data is decoded according to the
custom serial protocol, details about this serial protocol is given in Appendices.
Methods for Communication
13.4.1 Bluetooth
Applications communicate with the embedded device via Bluetooth. First the application find the device
and then establish a connection to the embedded device. This is a two way communication in which the
application continuously receive data from the embedded device while embedded device can
continuously receive commands and data from the applications. Right now only a single device can

268
connect to an end-user application but the embedded device can simultaneously send and receive data
from PC based debugging software.
13.4.2 Wi-Fi/ Ethernet
Wi-Fi/ Ethernet is use to communicate between the applications and EMR’s data servers. These servers
can be local or world-wide, depend on the complexity of the deployment. Again this is a two way
communication. In case of non-availability of internet the data is stored in the application’s local storage
which can be sync with the main server when available.
13.4.3 Why not Wi-Fi for embedded device?
First the communication between Windows 8 application and embedded device was via Wi-Fi. Now with
the additional communication between EMR servers and application via Wi-Fi, there was a need for an
alternative mode of communication for embedded device since most of the tablets and smart phones
can only connect to a single Wi-Fi hotspot. Thus the other most easily available method was Bluetooth
which was finally used between end-user application and embedded device.
Windows 8/8.1 Application
Microsoft Windows has the biggest share in OS market and with the launch of Microsoft Windows 8 the
line between a PC OS and OS for tablet is blurred which makes it even easier for the developers to
develop one app that can work both on personal computers and tablets simultaneously. Some of the
key benefits of Microsoft Windows 8 over other tablet OS are given below,
13.5.1 Benefits
1. Single OS: The biggest advantage of Windows 8 as mentioned earlier is that user can have a
single OS on personal computers and tablets which makes it easier to develop, use and manage.
2. Multiple users: Tablets are the perfect form to pass around so others can share them. They
are also very personal devices and sharing them properly requires a way to keep others out of
your stuff. Windows has long supported multiple user accounts on a single PC and this can be
leveraged on Windows 8 tablets.
3. Use any peripherals: The Windows ecosystem of third party peripherals is huge, and that
extends onto the tablet. For example, it is easy to connect a 1TB portable hard drive for
handling lots of large files on the go.
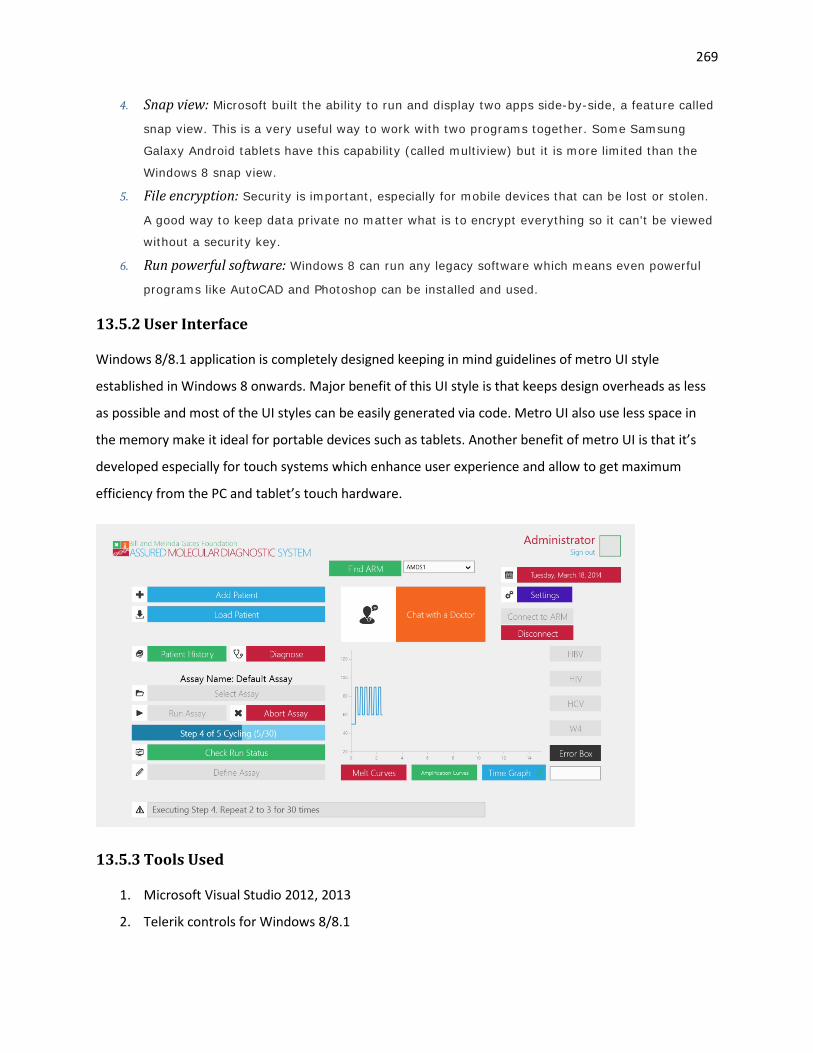
269
4. Snap view: Microsoft built the ability to run and display two apps side-by-side, a feature called
snap view. This is a very useful way to work with two programs together. Some Samsung
Galaxy Android tablets have this capability (called multiview) but it is more limited than the
Windows 8 snap view.
5. File encryption: Security is important, especially for mobile devices that can be lost or stolen.
A good way to keep data private no matter what is to encrypt everything so it can't be viewed
without a security key.
6. Run powerful software: Windows 8 can run any legacy software which means even powerful
programs like AutoCAD and Photoshop can be installed and used.
13.5.2 User Interface
Windows 8/8.1 application is completely designed keeping in mind guidelines of metro UI style
established in Windows 8 onwards. Major benefit of this UI style is that keeps design overheads as less
as possible and most of the UI styles can be easily generated via code. Metro UI also use less space in
the memory make it ideal for portable devices such as tablets. Another benefit of metro UI is that it’s
developed especially for touch systems which enhance user experience and allow to get maximum
efficiency from the PC and tablet’s touch hardware.
13.5.3 Tools Used
1. Microsoft Visual Studio 2012, 2013
2. Telerik controls for Windows 8/8.1

270
Applications for Mobile Platforms
13.6.1 Comparison between Android, WP8 and iOS
iOS Android Windows Phone 8 Market share 14.2% 79% 3.3% Unit Price (average) $635 $268 287 API Closed source Open source Closed source Developer Community (Size)
Big Biggest Medium
Annual growth rate 10.9% 9.5% 46.2% Native development language
Objective-C java C#
13.6.2 Windows Phone 8 Application
Windows phone 8 was chosen as the first mobile platform for our mobile application since it was easy to
port windows 8 application to windows phone 8 considering both follows same development language
and same UI style.
User Interface
Similar to Windows 8, for windows phone 8 same metro UI style and guidelines are followed. To make it
easier for the user similar program hierarchy is used in the windows phone 8 app as in Windows 8. But
one thing is kept in mind that the mobile app should be mobile friendly and gives a user a close feeling
to native windows phone 8 application.

271
Tools
1. Microsoft Visual Studio 2012, 2013
2. Telerik controls for Windows Phone 8
13.6.3 Android Application
Since android is the most used mobile platform with market share of 79%, it was compulsory to develop
an android application for our system so that more users can get benefits from this system. In order to

272
decrease porting time from previous C# based applications (W8 and WP8) to a java (Android) based
application we used xamarin and hence we wrote the android application in the same C# environment.
This not only helped us to decrease porting time but also allowed us to maintain critical methods once
and thus our applications is less prone to logical errors.
User Interface
UI design and development for the android application was little tricky since we need to keep a balance
in style so that the user must feel the android application closer to the applications of other platforms
but at the same time user must feel it as a native android application. Hence same Windows phone 8
color combination and program hierarchy is followed but the UI elements are placed according to
android UI guidelines.

273
Tools
1. Microsoft Visual Studio 2013
2. Xamarin
3. TeeChart for .NET (Xamarin) Chart for Android

274

275
14 Bibliography 1. Murray, C.J.L., et al., GBD 2010: design, definitions, and metrics. The Lancet, 2012. 380(9859): p.
2063-2066. 2. Murray, C.J.L. and A.D. Lopez, Measuring the Global Burden of Disease. New England Journal of
Medicine, 2013. 369(5): p. 448-457. 3. World Health Organziation, W., Metrics: Disability-Adjusted Life Year (DALY). 4. Organization., W.H., International Classification of Diseases (ICD) 10 – online version. 2010. 5. Das, P. and U. Samarasekera, The story of GBD 2010: a ?super-human? effort. The Lancet, 2012.
380(9859): p. 2067-2070. 6. Murray, C.J.L., et al., Disability-adjusted life years (DALYs) for 291 diseases and injuries in 21
regions, 1990?2010: a systematic analysis for the Global Burden of Disease Study 2010. The Lancet, 2012. 380(9859): p. 2197-2223.
7. Kim, J.Y., Data for better health?and to help end poverty. The Lancet, 2012. 380(9859): p. 2055. 8. Liu, L., et al., Global, regional, and national causes of child mortality: an updated systematic
analysis for 2010 with time trends since 2000. Lancet, 2012. 379(9832): p. 2151-61. 9. Jacobsen, K.H., Introduction to global health. 2nd ed. 2014, Burlington, MA: Jones & Bartlett
Learning. xix, 404 p. 10. Organization., W.H., Global status report on noncommunicable diseases 2010. 2010. 11. Daar, A.S., et al., Top ten biotechnologies for improving health in developing countries. Nature
Genetics, 2002. 32(2): p. 229-232. 12. Aledort, J.E., et al., Reducing the burden of HIV/AIDS in infants: the contribution of improved
diagnostics. Nature, 2006. 13. Aledort, J.E., et al., Reducing the burden of sexually transmitted infections in resource-limited
settings: the role of improved diagnostics. Nature, 2006. 14. Girosi, F., et al., Developing and interpreting models to improve diagnostics in developing
countries. Nature, 2006. 15. Keeler, E., et al., Reducing the global burden of tuberculosis: the contribution of improved
diagnostics. Nature, 2006. 16. Lim, Y.-W., et al., Reducing the global burden of acute lower respiratory infections in children:
the contribution of new diagnostics. Nature, 2006. 17. Rafael, M.E., et al., Reducing the burden of childhood malaria in Africa: the role of improved.
Nature, 2006. 18. Ricci, K.A., et al., Reducing stunting among children: the potential contribution of diagnostics.
Nature, 2006. 19. Burgess, D.C.H., Jeffrey Wasserman, Carol A. Dahl, Federico Girosi, Stuart S. Olmsted, Emmett B.
Keeler, Yee-Wei Lim, Julia E. Aledort, Maria E. Rafael, Karen A. Ricci, Rob Boer, Lee H. Hilborne, Kathryn Pitkin Derose, Molly Shea, Christopher Beighley, Mark Steinhoff, Douglas Holtzman, Harry Campbell, Robert Black, Kim Mulholland, Allen Ronald, Sylvie M. Le Blancq, Renee Ridzon, Alan Landay, Jeff Safrit, Rosanna W. Peeling, Nicholas Hellmann, Peter Mwaba, King Holmes, Catherine M. Wilfert, Phillip I. Tarr, Carl Mason, Mark Miller, James Hughes, Lorenz von Seidlein, Jan M. Agosti, Richard L. Guerrant, Terrie Taylor, Alan Magill, Richard Allan, Mark D. Perkins,

276
Peter Small, Christy Hanson, Steven Reed, Jane Cunningham, Christopher Dye, Peter Vickerman, Mickey Urdea, Laura A. Penny, Maria Y. Giovanni, Peter Kaspar, Andrew Shepherd, Penny Wilson, Steven Buchsbaum and Gerry Moeller, Estimating the Global Health Impact of Improved Diagnostic Tools for the Developing World. 2007.
20. Abou Tayoun, A.N., et al., Democratizing Molecular Diagnostics for the Developing World. American Journal of Clinical Pathology, 2014. 141(1): p. 17-24.
21. Okeke, I.N., et al., Diagnostics as essential tools for containing antibacterial resistance. Drug Resistance Updates, 2011. 14(2): p. 95-106.
22. Burki, T.K., Antimicrobial resistance reaches crisis levels. The Lancet Respiratory Medicine, 2014. 2(6): p. 440.
23. WHO, Antimicrobial resistance: global report on surveillance 2014. 2014. 24. Weiss, R.A. and A.J. McMichael, Social and environmental risk factors in the emergence of
infectious diseases. Nat Med, 2004. 10(12 Suppl): p. S70-6. 25. Chin, C.D., V. Linder, and S.K. Sia, Commercialization of microfluidic point-of-care diagnostic
devices. Lab on a Chip, 2012. 12(12): p. 2118-2134. 26. Song, Y., et al., Point-of-care technologies for molecular diagnostics using a drop of blood.
Trends in biotechnology, 2014. 32(3): p. 132-139. 27. Yager, P., G.J. Domingo, and J. Gerdes, Point-of-Care Diagnostics for Global Health. Annual
Review of Biomedical Engineering, 2008. 10(1): p. 107-144. 28. Bissonnette, L. and M.G. Bergeron, Infectious Disease Management through Point-of-Care
Personalized Medicine Molecular Diagnostic Technologies. Journal of Personalized Medicine, 2012. 2(2): p. 50-70.
29. Chan, C.P., et al., Evidence-based point-of-care diagnostics: current status and emerging technologies. Annu Rev Anal Chem (Palo Alto Calif), 2013. 6: p. 191-211.
30. Rogers, M.L. and M.G. Boutelle, Real-Time Clinical Monitoring of Biomolecules. Annual Review of Analytical Chemistry, 2013. 6(1): p. 427-453.
31. Saeed, K.B.A., Real-Time Polymerase Chain Reaction: Applications in Diagnostic Microbiology. International Journal of Medical Students, 2013. 1(1): p. 28.
32. Marais, B.J., H.S. Schaaf, and S.M. Graham, Child health and tuberculosis. The Lancet Respiratory Medicine, 2014.
33. Vollmer, S., et al., Association between economic growth and early childhood undernutrition: evidence from 121 Demographic and Health Surveys from 36 low-income and middle-income countries. The Lancet Global Health, 2014. 2(4): p. e225-e234.
34. Horton, R. and S. Lo, Protecting health: the global challenge for capitalism. The Lancet, 2014. 383(9917): p. 577-578.
35. Ottersen, O.P., et al., The political origins of health inequity: prospects for change. The Lancet. 383(9917): p. 630-667.
36. Senior, K., The complex art of making diagnostics simple. The Lancet Infectious Diseases, 2009. 9(8): p. 467.
37. Gøtzsche, P.C., Deadly medicines and organised crime : how big pharma has corrupted healthcare.
38. Webber, R. and R. Webber, Communicable diseases : a global perspective. 4th ed. 2012, Wallingford, Oxfordshire, UK: CAB International. xi, 327 p.
39. Weigl, B.H., et al., Simplicity of use: a critical feature for widespread adoption of diagnostic technologies in low-resource settings. Expert Review of Medical Devices, 2009. 6(5): p. 461-464.
40. Pai, N.P., et al., Point-of-Care Testing for Infectious Diseases: Diversity, Complexity, and Barriers in Low- And Middle-Income Countries. PLoS Med, 2012. 9(9): p. e1001306.

277
41. Niemz, A. and D.S. Boyle, Nucleic acid testing for tuberculosis at the point-of-care in high-burden countries. Expert Review of Molecular Diagnostics, 2012. 12(7): p. 687-701.
42. Urdea, M., et al., Requirements for high impact diagnostics in the developing world. Nature, 2006.
43. Organization, W.H., Accessible quality-assured diagnostics - 2009 annual report. 2010. 44. A Point-of-Care Diagnostic System for the Developing World. 2005. 45. Drain, P.K., et al., Diagnostic point-of-care tests in resource-limited settings. The Lancet
Infectious Diseases, 2014. 14(3): p. 239-249. 46. Chin, C.D., V. Linder, and S.K. Sia, Lab-on-a-chip devices for global health: Past studies and future
opportunities. Lab on a Chip, 2007. 7(1): p. 41-57. 47. Health, B.V.f.G., Global Health Innovation Quotient Prize: Point of Care, Diagnostics for
Differential Diagnosis of Fever in Children. 2011. 48. Solomon, A.W., et al., A Diagnostics Platform for the Integrated Mapping, Monitoring, and
Surveillance of Neglected Tropical Diseases: Rationale and Target Product Profiles. PLoS Negl Trop Dis, 2012. 6(7): p. e1746.
49. Taylor, B.J., et al., Real-time PCR detection of Plasmodium directly from whole blood and filter paper samples. Malaria Journal, 2011. 10.
50. Krõlov, K., et al., Sensitive and Rapid Detection of Chlamydia trachomatis by Recombinase Polymerase Amplification Directly from Urine Samples. The Journal of Molecular Diagnostics, 2014. 16(1): p. 127-135.
51. Zhang, Z., M. Kermekchiev, and W. Barnes, Direct DNA amplification from crude clinical samples using a PCR enhancer cocktail and novel mutants of Taq. J Mol Diagn, 2010. 12: p. 152 - 161.
52. Nordvåg, B.-Y., et al., [2] Direct use of blood in PCR, in Methods in Neurosciences, S. Gobinda, Editor. 1995, Academic Press. p. 15-25.
53. Trombley Hall, A., et al., Evaluation of Inhibitor-Resistant Real-Time PCR Methods for Diagnostics in Clinical and Environmental Samples. PLoS ONE, 2013. 8(9): p. e73845.
54. Roper, M.G., C.J. Easley, and J.P. Landers, Advances in polymerase chain reaction on microfluidic chips. Anal Chem, 2005. 77(12): p. 3887-93.
55. Liu, R.H., et al., Integrated microfluidic biochips for DNA microarray analysis. Expert Review of Molecular Diagnostics, 2006. 6(2): p. 253-261.
56. Zhang, C.S., et al., PCR microfluidic devices for DNA amplification. Biotechnology Advances, 2006. 24(3): p. 243-284.
57. Zhang, C.S. and D. Xing, Miniaturized PCR chips for nucleic acid amplification and analysis: latest advances and future trends. Nucleic Acids Research, 2007. 35(13): p. 4223-4237.
58. Sabella, S., et al., Disposable plastic microreactors for genomic analyses. Biomedical Microdevices, 2009. 11(6): p. 1289-1295.
59. Zhang, Y.H. and P. Ozdemir, Microfluidic DNA amplification-A review. Analytica Chimica Acta, 2009. 638(2): p. 115-125.
60. Lee, D., P.J. Chen, and G.B. Lee, The evolution of real-time PCR machines to real-time PCR chips. Biosensors & Bioelectronics, 2010. 25(7): p. 1820-1824.
61. Asiello, P.J. and A.J. Baeumner, Miniaturized isothermal nucleic acid amplification, a review. Lab on a Chip, 2011. 11(8): p. 1420-1430.
62. Park, S., et al., Advances in microfluidic PCR for point-of-care infectious disease diagnostics. Biotechnology Advances, 2011. 29(6): p. 830-839.
63. Almassian, D.R., L.M. Cockrell, and W.M. Nelson, Portable nucleic acid thermocyclers. Chem Soc Rev, 2013. 42(22): p. 8769-98.
64. Chang, C.M., et al., Nucleic acid amplification using microfluidic systems. Lab on a Chip, 2013. 13(7): p. 1225-1242.

278
65. Liu, R.H., et al., Self-Contained, Fully Integrated Biochip for Sample Preparation, Polymerase Chain Reaction Amplification, and DNA Microarray Detection. Analytical Chemistry, 2004. 76(7): p. 1824-1831.
66. Kim, J., et al., A disposable, self-contained PCR chip. Lab on a Chip, 2009. 9(4): p. 606-612. 67. Yobas, L., et al., A self-contained fully-enclosed microfluidic cartridge for lab on a chip.
Biomedical Microdevices, 2009. 11(6): p. 1279-1288. 68. Chen, D.F., et al., An integrated, self-contained microfluidic cassette for isolation, amplification,
and detection of nucleic acids. Biomedical Microdevices, 2010. 12(4): p. 705-719. 69. Qiu, X.B., et al., A large volume, portable, real-time PCR reactor. Lab on a Chip, 2010. 10(22): p.
3170-3177. 70. Chung, K.H., S.H. Park, and Y.H. Choi, A palmtop PCR system with a disposable polymer chip
operated by the thermosiphon effect. Lab on a Chip, 2010. 10(2): p. 202-210. 71. Stedtfeld, R.D., et al., Gene-Z: a device for point of care genetic testing using a smartphone. Lab
on a Chip, 2012. 12(8): p. 1454-1462. 72. Wang, J., et al., A disposable microfluidic cassette for DNA amplification and detection. Lab on a
Chip, 2006. 6(1): p. 46-53. 73. Zhang, C. and Zhang, PCR microfluidic devices for DNA amplification. Biotechnology advances,
2006. 24(3): p. 243-284. 74. Christensen, T.B., et al., PCR biocompatibility of lab-on-a-chip and MEMS materials. Journal of
Micromechanics and Microengineering, 2007. 17(8): p. 1527-1532. 75. Sauer-Budge, A.F., et al., Low cost and manufacturable complete microTAS for detecting
bacteria. Lab on a Chip, 2009. 9(19): p. 2803-2810. 76. Kim, J., et al., A PCR reactor with an integrated alumina membrane for nucleic acid isolation.
Analyst, 2010. 135(9): p. 2408-2414. 77. Shen, F., et al., Digital PCR on a SlipChip. Lab on a Chip, 2010. 10(20): p. 2666-2672. 78. Sun, Y., et al., A lab-on-a-chip device for rapid identification of avian influenza viral RNA by solid-
phase PCR. Lab on a Chip, 2011. 11(8): p. 1457-1463. 79. Chen, P.C., et al., Simulation guided-design of a microfluidic thermal reactor for polymerase
chain reaction. Chemical Engineering Research & Design, 2012. 90(5): p. 591-599. 80. Cooney, C.G., et al., A plastic, disposable microfluidic flow cell for coupled on-chip PCR and
microarray detection of infectious agents. Biomedical Microdevices, 2012. 14(1): p. 45-53. 81. Tourlousse, D.M., et al., A polymer microfluidic chip for quantitative detection of multiple water-
and foodborne pathogens using real-time fluorogenic loop-mediated isothermal amplification. Biomedical Microdevices, 2012. 14(4): p. 769-778.
82. Sugumar, D., et al., Rapid multi sample DNA amplification using rotary-linear polymerase chain reaction device (PCRDisc). Biomicrofluidics, 2012. 6(1): p. -.
83. Zhang, C.S., D. Xing, and Y.Y. Li, Micropumps, microvalves, and micromixers within PCR microfluidic chips: Advances and trends. Biotechnology Advances, 2007. 25(5): p. 483-514.
84. Taylor, B., et al., Real-time PCR detection of Plasmodium directly from whole blood and filter paper samples. Malaria Journal, 2011. 10(1): p. 244.
85. Qiu, X., et al., A large volume, portable, real-time PCR reactor. Lab on a Chip, 2010. 10(22): p. 3170-3177.
86. Oh, K.W., et al., World-to-chip microfluidic interface with built-in valves for multichamber chip-based PCR assays. Lab on a Chip, 2005. 5(8): p. 845-850.
87. Shen, K.Y., et al., A microchip-based PCR device using flexible printed circuit technology. Sensors and Actuators B-Chemical, 2005. 105(2): p. 251-258.
88. Zhang, C. and D. Xing, Miniaturized PCR chips for nucleic acid amplification and analysis: latest advances and future trends. Nucleic Acids Research, 2007. 35(13): p. 4223-4237.

279
89. Zhang, Y. and P. Ozdemir, Microfluidic DNA amplification—A review. Analytica Chimica Acta, 2009. 638(2): p. 115-125.
90. Huang, G.L., et al., Sensitive sequence-specific molecular identification system comprising an aluminum micro-nanofluidic chip and associated real-time confocal detector. Analytica Chimica Acta, 2011. 695(1-2): p. 1-10.
91. Niemz, A., T.M. Ferguson, and D.S. Boyle, Point-of-care nucleic acid testing for infectious diseases. Trends in Biotechnology, 2011. 29(5): p. 240-250.
92. Park, S., et al., Advances in microfluidic PCR for point-of-care infectious disease diagnostics. Biotechnology advances, 2011. 29(6): p. 830-839.
93. Qiu, X.B., et al., A portable, integrated analyzer for microfluidic - based molecular analysis. Biomedical Microdevices, 2011. 13(5): p. 809-817.
94. Babikian, S., et al., Microfluidic Thermal Component for Integrated Microfluidic Systems. 2012 Ieee 62nd Electronic Components and Technology Conference (Ectc), 2012: p. 1582-1587.
95. Craw, P. and W. Balachandran, Isothermal nucleic acid amplification technologies for point-of-care diagnostics: a critical review. Lab on a Chip, 2012. 12(14): p. 2469-2486.
96. Fang, X.E., et al., A portable and integrated nucleic acid amplification microfluidic chip for identifying bacteria. Lab on a Chip, 2012. 12(8): p. 1495-1499.
97. Jung, J.H., et al., Ultrafast Rotary PCR system for multiple influenza viral RNA detection. Lab on a Chip, 2012. 12(9): p. 1598-1600.
98. Chandrasekhar, S., Hydrodynamic and hydromagnetic stability. The International series of monographs on physics. 1961, Oxford,: Clarendon Press. 652 p.
99. Getling, A.V., Rayleigh-Bénard convection : structures and dynamics. Advanced series in nonlinear dynamics. 1998, Singapore ; River Edge, NJ: World Scientific. ix, 245 p.
100. Tsao, C.W. and D.L. DeVoe, Bonding of thermoplastic polymer microfluidics. Microfluidics and Nanofluidics, 2009. 6(1): p. 1-16.
101. Osswald, T.A., L.-S. Turng, and P.J. Gramann, Injection molding handbook. 2nd ed. 2008, Munich
Cincinnati: Carl Hanser Publishers ;
Hanser Gardner Publications. xvii, 764 p. 102. Kauffer, P.H., Injection molding : process, design, and applications. Materials science and
technologies. 2011, New York: Nova Science Publishers. x, 292 p. 103. Herold, K.E. and A. Rasooly, Lab on a chip technology. 2009, Norfolk, UK: Caister Academic Press.
<v. 1>. 104. Rotheiser, J., Joining of plastics : handbook for designers and engineers. 3rd ed. 2009, Munich
Cincinnati, Ohio: Hanser Publishers ;
Hanser Publications. xxxii, 592 p. 105. Roy, S., et al., Low-temperature (below T-g) thermal bonding of COC microfluidic devices using
UV photografted HEMA-modified substrates: high strength, stable hydrophilic, biocompatible surfaces. Journal of Materials Chemistry, 2011. 21(38): p. 15031-15040.
106. Sun, Y., Y.C. Kwok, and N.T. Nguyen, Low-pressure, high-temperature thermal bonding of polymeric microfluidic devices and their applications for electrophoretic separation. Journal of Micromechanics and Microengineering, 2006. 16(8): p. 1681-1688.
107. Li, J.H., D. Chen, and G. Chen, Low-temperature thermal bonding of PMMA microfluidic chips. Analytical Letters, 2005. 38(7): p. 1127-1136.
108. Chen, Z., L. Zhang, and G. Chen, A spring-driven press device for hot embossing and thermal bonding of PMMA microfluidic chips. ELECTROPHORESIS, 2010. 31(15): p. 2512-2519.

280
109. Roy, S., et al., Thermal bonding of microfluidic devices: Factors that affect interfacial strength of similar and dissimilar cyclic olefin copolymers. Sensors and Actuators B-Chemical, 2012. 161(1): p. 1067-1073.
110. Mair, D.A., et al., Room-Temperature Bonding for Plastic High-Pressure Microfluidic Chips. Analytical Chemistry, 2007. 79(13): p. 5097-5102.
111. Everaerts, A., et al., Chapter 11 - Pressure sensitive adhesives
Adhesion science and engineering. 2002. 465-534. 112. Nikolova, D., et al., Surface modification of cycloolefinic copolymers for optimization of the
adhesion to metals. Surface and Interface Analysis, 2004. 36(8): p. 689-693. 113. Dang, F., et al., Replica multichannel polymer chips with a network of sacrificial channels sealed
by adhesive printing method. Lab on a Chip, 2005. 5(4): p. 472-478. 114. Lu, C., L.J. Lee, and Y.-J. Juang, Packaging of microfluidic chips via interstitial bonding technique.
ELECTROPHORESIS, 2008. 29(7): p. 1407-1414. 115. Gianchandani, Y.B., O. Tabata, and H.P. Zappe, Comprehensive microsystems. 2008, Amsterdam ;
Boston: Elsevier. 116. Salvo, P., et al., Adhesive bonding by SU-8 transfer for assembling microfluidic devices.
Microfluidics and Nanofluidics, 2012. 13(6): p. 987-991. 117. Kentsch, J., S. Breisch, and M. Stezle, Low temperature adhesion bonding for BioMEMS. Journal
of Micromechanics and Microengineering, 2006. 16(4): p. 802-807. 118. Schwiebert, M.K. and W.H. Leong, Underfill flow as viscous flow between parallel plates driven
by capillary action. Components, Packaging, and Manufacturing Technology, Part C, IEEE Transactions on, 1996. 19(2): p. 133-137.
119. Ruijter, J.M., et al., Amplification efficiency: linking baseline and bias in the analysis of quantitative PCR data. Nucleic Acids Res, 2009. 37(6): p. e45.
120. Ramakers, C., et al., Assumption-free analysis of quantitative real-time polymerase chain reaction (PCR) data. Neurosci Lett, 2003. 339(1): p. 62-6.
121. Altshuler, M.L., PCR troubleshooting : the essential guide. 2006, Norfolk, UK: Caister Academic Press. 80 p.
122. Bustin, S.A., The PCR revolution : basic technologies and applications. 2010, Cambridge ; New York: Cambridge University Press. xviii, 307 p., 16 p. of plates.
123. Wittwer, C.T. and D.J. Garling, Rapid cycle DNA amplification: time and temperature optimization. Biotechniques, 1991. 10(1): p. 76-83.
124. Nolan, T. and S.A. Bustin, PCR technology : current innovations. 3rd ed. 2013, Boca Raton: Taylor & Francis. p.
125. Wheeler, E.K., et al., Under-three minute PCR: probing the limits of fast amplification. Analyst, 2011. 136(18): p. 3707-12.
126. Wittwer, C., G. Reed, and K. Ririe, Rapid Cycle DNA Amplification, in The Polymerase Chain Reaction, K. Mullis, F. Ferré, and R. Gibbs, Editors. 1994, Birkhäuser Boston. p. 174-181.
127. Maltezos, G., et al., Exploring the limits of ultrafast polymerase chain reaction using liquid for thermal heat exchange: A proof of principle. Applied Physics Letters, 2010. 97(26).
128. Elenitoba-Johnson, O., et al., Plastic versus glass capillaries for rapid-cycle PCR. Biotechniques, 2008. 44(4): p. 487-+.
129. Lyon, E. and C.T. Wittwer, LightCycler Technology in Molecular Diagnostics. Journal of Molecular Diagnostics, 2009. 11(2): p. 93-101.
130. Filion, M., Quantitative real-time PCR in applied microbiology. 2012, Norfolk, UK: Caister Academic Press. vii, 242 p.

281
131. Neuzil, P., et al., Ultra fast miniaturized real-time PCR: 40 cycles in less than six minutes. Nucleic Acids Research, 2006. 34(11): p. e77.
132. Maltezos, G., et al., Thermal cycling apparatus. 2011, Google Patents. 133. Don, R.H., et al., 'Touchdown' PCR to circumvent spurious priming during gene amplification.
Nucleic Acids Res, 1991. 19(14): p. 4008. 134. Erali, M., K.V. Voelkerding, and C.T. Wittwer, High resolution melting applications for clinical
laboratory medicine. Exp Mol Pathol, 2008. 85(1): p. 50-8. 135. Yeh, S.-H., et al., Quantification and genotyping of hepatitis B virus in a single reaction by real-
time PCR and melting curve analysis. Journal of Hepatology, 2004. 41(4): p. 659-666. 136. Kreith, F., et al., Principles of heat transfer. 7th ed. 2011, Stamford, Conn.: Cengage Learning. xx,
762 p. 137. Madhusudana, C.V., Thermal contact conductance. Mechanical engineering series. 1996, New
York: Springer-Verlag. xvi, 165 p. 138. Ullrich, T., et al., Competitive Reporter Monitored Amplification (CMA) - Quantification of
Molecular Targets by Real Time Monitoring of Competitive Reporter Hybridization. PLoS ONE, 2012. 7(4): p. e35438.
139. Novak, L., et al., An integrated fluorescence detection system for lab-on-a-chip applications. Lab on a Chip, 2007. 7(1): p. 27-29.
140. Ahmad, F., et al., A CCD-based fluorescence imaging system for real-time loop-mediated isothermal amplification-based rapid and sensitive detection of waterborne pathogens on microchips. Biomedical Microdevices, 2011. 13(5): p. 929-937.
141. Ryu, G., et al., Highly sensitive fluorescence detection system for microfluidic lab-on-a-chip. Lab on a Chip, 2011. 11(9): p. 1664-1670.
142. Seo, J. and L.P. Lee, Disposable integrated microfluidics with self-aligned planar microlenses. Sensors and Actuators B: Chemical, 2004. 99(2–3): p. 615-622.
143. Schumacher, S., et al., Highly-integrated lab-on-chip system for point-of-care multiparameter analysis. Lab on a Chip, 2012. 12(3): p. 464-473.
144. Mairal, T., et al., Microfluorimeter with disposable polymer chip for detection of coeliac disease toxic gliadin. Lab on a Chip, 2009. 9(24): p. 3535-3542.
145. Zhu, H., et al., Cost-effective and compact wide-field fluorescent imaging on a cell-phone. Lab on a Chip, 2011. 11(2): p. 315-322.
146. Gorocs, Z., et al., Giga-pixel fluorescent imaging over an ultra-large field-of-view using a flatbed scanner. Lab on a Chip, 2013. 13(22): p. 4460-4466.
147. Gurkan, U.A., et al., Miniaturized lensless imaging systems for cell and microorganism visualization in point-of-care testing. Biotechnology Journal, 2011. 6(2): p. 138-149.
148. Koshel, R.J., Illumination engineering : design with nonimaging optics. 2013, Piscataway, NJ
Hoboken, New Jersey: IEEE Press ;
Wiley. xxi, 302 pages. 149. Dupuis, R.D. and M.R. Krames, History, Development, and Applications of High-Brightness Visible
Light-Emitting Diodes. Journal of Lightwave Technology, 2008. 26(9): p. 1154-1171. 150. Moreno, I. and C.-C. Sun, Modeling the radiation pattern of LEDs. Optics Express, 2008. 16(3): p.
1808-1819. 151. Moreno, I., Output irradiance of tapered lightpipes. Journal of the Optical Society of America A,
2010. 27(9): p. 1985-1993. 152. Von Keyserling, H., et al., The use of melting curves as a novel approach for validation of real-
time PCR instruments. Biotechniques, 2011. 51(3): p. 179-84.

282
153. Optics in instruments. 2013, Hoboken, NJ: ISTE Ltd/John Wiley and Sons Inc. 154. Liang, R. and Society of Photo-optical Instrumentation Engineers., Optical design for biomedical
imaging. 2010, Bellingham, Wash.: SPIE Press. xvii, 491 p. 155. Demchenko, A.P., Introduction to fluorescence sensing. 2009, New York: Springer. xxvi, 586 p. 156. Qiagen. ESElog
For high-performance fluorescence dection of up to 2 fluorescent dyes. 2012; Available from: http://www.qiagen.com/products/eselog.aspx#Tabs=t3.
157. Pinson S. J, M., et al., Atmospheric pressure plasma cleaning of aluminium. ATB Métallurgie, 2003. 43(1-2): p. 448-453.
158. Li, L. and T.P. Speed, An estimate of the crosstalk matrix in four-dye. Electrophoresis, 1999: p. 1433-1442.
159. Dineva, M.A., L. Mahilum-Tapay, and H. Lee, Sample preparation: a challenge in the development of point-of-care nucleic acid-based assays for resource-limited settings. Analyst, 2007. 132(12): p. 1193-1199.
160. Foudeh, A.M., et al., Microfluidic designs and techniques using lab-on-a-chip devices for pathogen detection for point-of-care diagnostics. Lab on a Chip, 2012. 12(18): p. 3249-3266.
161. Chin, C.D., et al., Microfluidics-based diagnostics of infectious diseases in the developing world. Nat Med, 2011. 17(8): p. 1015-1019.
162. van Berkel, C., et al., Integrated systems for rapid point of care (PoC) blood cell analysis (vol 11, pg 1249, 2011). Lab on a Chip, 2011. 11(24): p. 4279-4279.
163. Peeling, R.W. and D. Mabey, Point-of-care tests for diagnosing infections in the developing world. Clinical Microbiology and Infection, 2010. 16(8): p. 1062-1069.
164. Bissonnette, L. and M.G. Bergeron, Diagnosing infections--current and anticipated technologies for point-of-care diagnostics and home-based testing. Clinical Microbiology and Infection, 2010. 16(8): p. 1044-1053.
165. Wen, J., et al., Purification of Nucleic Acids in Microfluidic Devices. Analytical Chemistry, 2008. 80(17): p. 6472-6479.
166. Esona, M.D., et al., Comparative evaluation of commercially available manual and automated nucleic acid extraction methods for rotavirus RNA detection in stools. Journal of Virological Methods, 2013. 194(1–2): p. 242-249.
167. Yang, G., et al., Comparison of commercial systems for extraction of nucleic acids from DNA/RNA respiratory pathogens. Journal of Virological Methods, 2011. 171(1): p. 195-199.
168. Bogas, V., et al., Comparison of four DNA extraction methods for forensic application. Forensic Science International: Genetics Supplement Series, 2011. 3(1): p. e194-e195.
169. Ph.D., A.D., DNA Extraction and Purification. 2013. 170. Kim, J., et al., Microfluidic sample preparation: cell lysis and nucleic acidpurification. Integrative
Biology, 2009. 1(10): p. 574-586. 171. Price, C.W., D.C. Leslie, and J.P. Landers, Nucleic acid extraction techniques and application to
the microchip. Lab on a Chip, 2009. 9(17): p. 2484-2494. 172. Lee, M. and A. Fairchild, Sample Preparation for PCR, in PCR Methods in Foods, J. Maurer, Editor.
2006, Springer US. p. 41-50. 173. Rådström, P., et al., Pre-PCR Processing of Samples, in PCR Detection of Microbial Pathogens, K.
Sachse and J. Frey, Editors. 2003, Humana Press. p. 31-50. 174. Rodríguez-Lázaro, D., Real-time PCR in food science : current technology and applications. 2013,
Norfolk, UK: Caister Academic Press. vii, 285, A6 p.of plates. 175. Butkus, B., Tools for Point-of-Care MDx Available, but Challenges Still Loom. 2013.

283
176. Mahalanabis, M., et al., Cell lysis and DNA extraction of gram-positive and gram-negative bacteria from whole blood in a disposable microfluidic chip. Lab on a Chip, 2009. 9(19): p. 2811-2817.
177. Podszun, S., et al., Enrichment of viable bacteria in a micro-volume by free-flow electrophoresis. Lab on a Chip, 2012. 12(3): p. 451-457.
178. Hall, R.J., et al., Evaluation of rapid and simple techniques for the enrichment of viruses prior to metagenomic virus discovery. Journal of Virological Methods, 2014. 195(0): p. 194-204.
179. Warkiani, M., et al., A high-flux isopore micro-fabricated membrane for effective concentration and recovering of waterborne pathogens. Biomedical Microdevices, 2012. 14(4): p. 669-677.
180. Hwang, K.-Y., et al., Miniaturized bead-beating device to automate full DNA sample preparation processes for Gram-positive bacteria. Lab on a Chip, 2011. 11(21): p. 3649-3655.
181. Geng, T., et al., Modulating DNA adsorption on silica beads using an electrical switch. Chemical Communications, 2009(7): p. 800-802.
182. Freifeld, A., et al., A New Rapid Method for Clostridium difficile DNA Extraction and Detection in Stool. The journal of molecular diagnostics, 2012. 14(3): p. 274-279.
183. Berry, S.M., E.T. Alarid, and D.J. Beebe, One-step purification of nucleic acid for gene expression analysis via Immiscible Filtration Assisted by Surface Tension (IFAST). Lab Chip, 2011. 11(10): p. 1747-53.
184. Walker, R.E., et al., Optimal swab processing recovery method for detection of bioterrorism-related Francisella tularensis by real-time PCR. Journal of Microbiological Methods, 2010. 83(1): p. 42-47.
185. Kim, D.-J., et al., Plasma Components Affect Accuracy of Circulating Cancer-Related MicroRNA Quantitation. The Journal of molecular diagnostics : JMD, 2012. 14(1): p. 71-80.
186. Byrnes, S., et al., A portable, pressure driven, room temperature nucleic acid extraction and storage system for point of care molecular diagnostics. Analytical Methods, 2013. 5(13): p. 3177-3184.
187. Regan, J., et al., A Sample Extraction Method for Faster, More Sensitive PCR-Based Detection of Pathogens in Blood Culture. The journal of molecular diagnostics, 2012. 14(2): p. 120-129.
188. Pasquardini, L., et al., Solid phase DNA extraction on PDMS and direct amplification. Lab on a Chip, 2011. 11(23): p. 4029-4035.
189. Dimov, I.K., et al., Stand-alone self-powered integrated microfluidic blood analysis system (SIMBAS). Lab on a Chip, 2011. 11(5): p. 845-850.
190. Van Heirstraeten, L., et al., Integrated DNA and RNA extraction and purification on an automated microfluidic cassette from bacterial and viral pathogens causing community-acquired lower respiratory tract infections. Lab on a Chip, 2014.
191. Hartman, M.R., et al., Point-of-care nucleic acid detection using nanotechnology. Nanoscale, 2013. 5(21): p. 10141-10154.
192. Ritzi-Lehnert, M., Development of chip-compatible sample preparation for diagnosis of infectious diseases. Expert Review of Molecular Diagnostics, 2012. 12(2): p. 189-206.
193. Berry, S.M., E.T. Alarid, and D.J. Beebe, One-step purification of nucleic acid for gene expression analysis via Immiscible Filtration Assisted by Surface Tension (IFAST). Lab on a Chip, 2011. 11(10): p. 1747-1753.
194. Berry, S.M., et al., Automated Operation of Immiscible Filtration Assisted by Surface Tension (IFAST) Arrays for Streamlined Analyte Isolation. Journal of Laboratory Automation, 2013. 18(3): p. 206-211.
195. Thomas, P.C., et al., Nucleic Acid Sample Preparation Using Spontaneous Biphasic Plug Flow. Analytical Chemistry, 2013. 85(18): p. 8641-8646.

284
196. Sur, K., et al., Immiscible Phase Nucleic Acid Purification Eliminates PCR Inhibitors with a Single Pass of Paramagnetic Particles through a Hydrophobic Liquid. The Journal of molecular diagnostics : JMD, 2010. 12(5): p. 620-628.
197. Pease, R.A., Analog circuits. Newnes world class designs series. 2008, Amsterdam ; Boston: Newnes/Elsevier. xxiii, 436 p.
198. de Castro, D.G., Challenges for the implementation of routine molecular diagnostics in cancer care. Expert Review of Molecular Diagnostics, 2011. 11(6): p. 549-551.
199. Erickson, D., et al., Smartphone technology can be transformative to the deployment of lab-on-chip diagnostics. Lab on a Chip, 2014.
200. Bastawrous, A. and M.J. Armstrong, Mobile health use in low- and high-income countries: an overview of the peer-reviewed literature. Journal of the Royal Society of Medicine, 2013. 106(4): p. 130-142.
i Bharaj P, et al, Virology J 2009, 6:89-100 ii Chintu C, et al. Lung diseases at necropsy in African children dying from respiratory illnesses: a descriptive necropsy study. Lancet. 2002 Sep 28;360(9338):985-90 iii Ekalaksananan T, et al, Southeast Asian J Trop Med Public Health 2001, 32(3):5143-519; Nascimento-Carvalho CM et al, Scandinavian J Infect Dis 2010 (ahead of print). iv Simple, Sensitive, and Specific Detection of Human Immunodeficiency Virus Type 1 Subtype B DNA in Dried Blood Samples for Diagnosis in Infants in the Field. Ingrid A. Beck, Kathryn D. Drennan, Ann J. Melvin, Kathey M. Mohan, Arnd M. Herz, Jorge Alarcón, Julia Piscoya, Carlos Velázquez, and Lisa M. Frenkel. J. Clin. Microbiol. 2001 39: 29-33 v Calderaro A et al, Diagn Microbiol Infet Dis 2010, 66:261-267; Belanger Sd et al, J Clin Microbiol 2003, 41(2):730-734 vi Liang SY et al, J Parasitol 2010 (ahead of print) vii Mixson-Hayden T et al, BMC Research Notes 2010, 3:88 viii Cordova J et al., J Clin Microbiol 2010;48(5):1820-1826; Luo RF et al, J Clin Microbiol 2010, 48(7):2569-2570; Kumar M et al, Int J Tuberc Lung Dis 2010, 14(7):847-851 ix Hopkins MJ et al, Sex Transm Infect 2010, 86(3):207-211 x Heymans R et al, J Clin Microbiol 2010, 48(2):497-502 xi Diaz N et al, Diagn Microbiol Infect Dis 2010, 67(1):30-36