Maize Market Assessment and Baseline Study for Ethiopia
41
Maize Market Assessment and Baseline Study for Ethiopia July 2003 The RATES Center P.O. Box 1555-00606 Nairobi, Kenya email:[email protected] Center for Regional Agricultural Trade Expansion Support, P.O. Box 1555-00606 Nairobi, Kenya [email protected]
-
Upload
khangminh22 -
Category
Documents
-
view
1 -
download
0
Transcript of Maize Market Assessment and Baseline Study for Ethiopia

Maize Market Assessment and
Baseline Study for Ethiopia
July 2003
The RATES Center P.O. Box 1555-00606
Nairobi, Kenya email:[email protected]
Center for Regional Agricultural Trade Expansion Support, P.O. Box 1555-00606
Nairobi, Kenya [email protected]
Ethiopia maize sector value chain analysis
Market assessment and baseline study for maize-Ethiopia ii
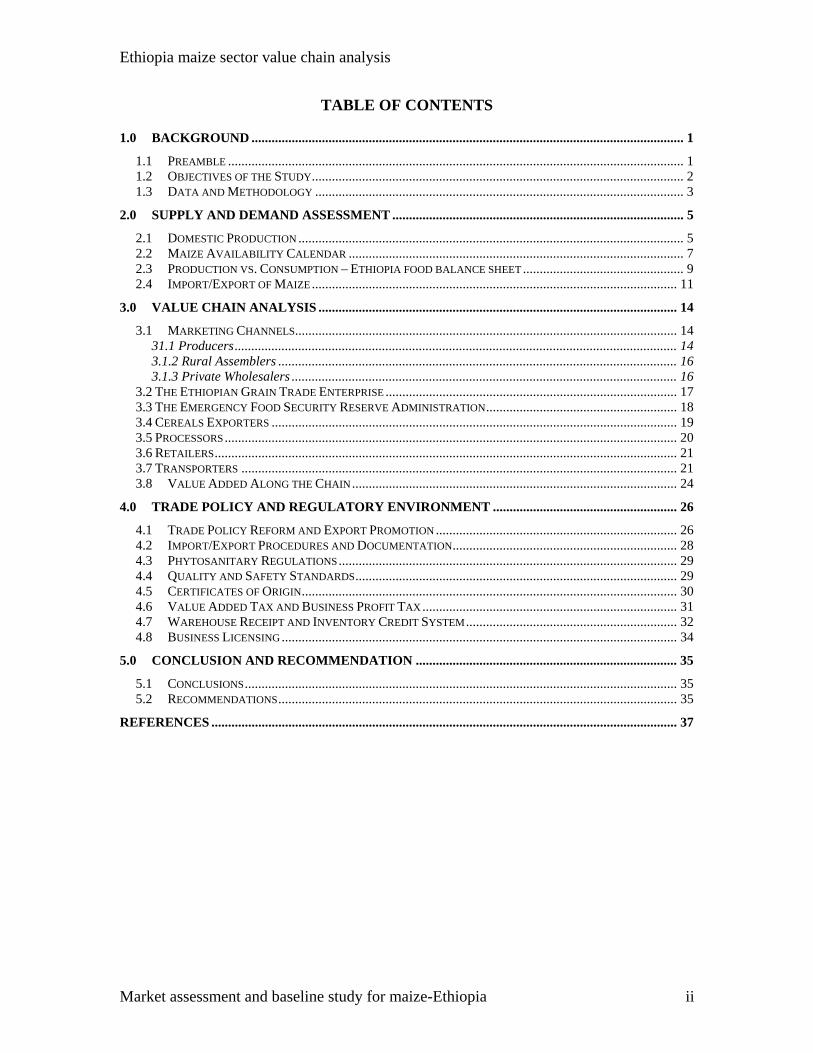
TABLE OF CONTENTS
1.0 BACKGROUND ................................................................................................................................. 1
1.1 PREAMBLE ........................................................................................................................................ 1 1.2 OBJECTIVES OF THE STUDY ............................................................................................................... 2 1.3 DATA AND METHODOLOGY .............................................................................................................. 3
2.0 SUPPLY AND DEMAND ASSESSMENT ....................................................................................... 5
2.1 DOMESTIC PRODUCTION ................................................................................................................... 5 2.2 MAIZE AVAILABILITY CALENDAR .................................................................................................... 7 2.3 PRODUCTION VS. CONSUMPTION – ETHIOPIA FOOD BALANCE SHEET ................................................ 9 2.4 IMPORT/EXPORT OF MAIZE ............................................................................................................. 11
3.0 VALUE CHAIN ANALYSIS ........................................................................................................... 14
3.1 MARKETING CHANNELS.................................................................................................................. 14 31.1 Producers .................................................................................................................................... 14 3.1.2 Rural Assemblers ....................................................................................................................... 16 3.1.3 Private Wholesalers ................................................................................................................... 16
3.2 THE ETHIOPIAN GRAIN TRADE ENTERPRISE ....................................................................................... 17 3.3 THE EMERGENCY FOOD SECURITY RESERVE ADMINISTRATION ......................................................... 18 3.4 CEREALS EXPORTERS ......................................................................................................................... 19 3.5 PROCESSORS ....................................................................................................................................... 20 3.6 RETAILERS .......................................................................................................................................... 21 3.7 TRANSPORTERS .................................................................................................................................. 21 3.8 VALUE ADDED ALONG THE CHAIN ................................................................................................. 24
4.0 TRADE POLICY AND REGULATORY ENVIRONMENT ....................................................... 26
4.1 TRADE POLICY REFORM AND EXPORT PROMOTION ........................................................................ 26 4.2 IMPORT/EXPORT PROCEDURES AND DOCUMENTATION ................................................................... 28 4.3 PHYTOSANITARY REGULATIONS ..................................................................................................... 29 4.4 QUALITY AND SAFETY STANDARDS ................................................................................................ 29 4.5 CERTIFICATES OF ORIGIN ................................................................................................................ 30 4.6 VALUE ADDED TAX AND BUSINESS PROFIT TAX ............................................................................ 31 4.7 WAREHOUSE RECEIPT AND INVENTORY CREDIT SYSTEM ............................................................... 32 4.8 BUSINESS LICENSING ...................................................................................................................... 34
5.0 CONCLUSION AND RECOMMENDATION .............................................................................. 35
5.1 CONCLUSIONS ................................................................................................................................. 35 5.2 RECOMMENDATIONS ....................................................................................................................... 35
REFERENCES ........................................................................................................................................... 37
Ethiopia maize sector value chain analysis
Market assessment and baseline study for maize-Ethiopia iii
Acronyms AMC Agricultural Marketing Corporation Br Birr (Ethiopian local currency) CSA Central Statistical Authority EFSRA Emergency Food Security Reserve Administration EGTE Ethiopian Grain Trade Enterprise EU European Union FAO Food and Agricultural Organization (UN) Ha Hectare MT Metric ton NBE National Bank of Ethiopia QSAE Quality and Standards Authority of Ethiopia Qt Quintal (100 kg) VCA Value Chain Analysis WFP World Food Program
Ethiopia maize sector value chain analysis
Market assessment and baseline study for maize-Ethiopia 1
1.0 BACKGROUND 1.1 Preamble The Ethiopian economy is dominated by agriculture that accounts for over 50 per cent of Gross Domestic Product (GDP), 90 per cent of the export earnings, and 88 per cent of the labour force. It also supplies food to the urban areas and raw materials to the manufacturing sector. A variety of crops are grown seasonally in different parts of Ethiopia, consisting of coffee, cotton, cereals, pulses and oil seeds. The main cash and industrial crops include coffee, pulses, oil seeds, cotton, fruits and vegetables. It is estimated that crop production and livestock husbandry account for over 86 per cent of the agricultural GDP. In Ethiopia, smallholders’ crop production is by far the most dominant sub-sector, accounting for over 97 per cent of the agricultural output. The average farm size is 0.8hectare. About 80 per cent of peasant production is destined for home consumption and seed. Commercial private farming is also being encouraged under the new economic policy, but the absence of a clear land policy has hindered a speedy development of large-scale private farms. Agricultural productivity in Ethiopia is very low compared to other Sub-Saharan African countries. In view of the importance of agriculture, the Government of Ethiopia has designed an agriculture-led industrialization strategy with the view to bringing about sustainable development. The agriculture-led industrialization strategy has accorded the highest priority to agriculture and the rural sector. The main objectives of the strategy are: (i) attaining accelerated growth; (ii) creating a conducive environment for the population to properly enjoy the fruits of development; (iii) progressively improving the country's participation in the global economy in order to reap sustained benefits accruing from globalization; and (iv) laying the foundation for a well-developed market-driven economic system as a way out of perpetual poverty. The Government also believes that the success of agricultural development depends, among other things; on the existence of an efficient marketing system. Cognizant of this, the Government of Ethiopia has placed considerable emphasis on market and marketing issues so as to enhance rapid, sustainable and broad-based economic growth and thereby reduce poverty. As part of furthering the enforcement of market liberalization, market centred agricultural development aims at linking smallholders to both local and international markets through continually improving their productivity and competitiveness. This is aimed at enabling smallholder’s secure reasonable share of benefit from the value adding effect of local and global agricultural marketing system. Critical to the process of promoting agricultural development is Ethiopia’s ability to export her agricultural produce to the regional market, in event of surplus produce. Regional integration initiatives under COMESA Treaty provide such opportunity. COMESA is currently working in collaboration with East African Community through
Ethiopia maize sector value chain analysis
Market assessment and baseline study for maize-Ethiopia 2
support provided by the Regional Agricultural Trade Expansion Support (RATES) Project, focusing on the following commodities – maize and pulses, cotton and textiles, livestock and livestock products, coffee, dairy products, oilseeds, roots and tubers and horticulture. RATES project is funded by the United States Agency for International Development (USAID) seeks to enhance regional maize trade through EAC and COMESA. The project is being implemented by Chemonics International, in collaboration with EAC and COMESA. A key theme of the RATES project is ‘the relaxation of non-tariff barriers (NTB) to facilitate increased cross-border trade in maize’. Its strategic focus is placed on three key factors: a) targeting and providing support to efforts that can be sustained by strategic alliance partners/organizations that are themselves actors within country and/or regional marketplaces; b) designing all of its activities to increase trade flow volume and/or value while at the same time providing the foundation for the sustainability of participating organizations; and c) leading with activities that develop more competitive, transparent regional marketplaces. This report presents the findings of the Market Assessment and Baseline Study for Maize in Ethiopia. The study was commissioned by the RATES project Regional Trade Center (RATES) and conducted by Agridev Consult. 1.2 Objectives of the Study The overall objective of this study is to conduct a market assessment of maize and maize products in Ethiopia including a value chain analysis (VCA) with a view to providing a framework for the development of a strategic plan to improve the value and or the volume of maize marketed in Ethiopia. The specific objectives of the study are the following. • To conduct a VCA starting with production/farm gate and moving through all points
of market transfer and value-added including: producers, traders, grain reserves, parastatals, exporters, and processing companies. Include all primary products and by-products and produce a VCA flow chart.
• To list all “players” along the chain by name, location type of entity and contact information; identify key public and private sector players in cross border movements, including all major producer organizations, cooperatives, and key corporate (commercial) estates if any; all processing companies, status of operation, i.e. dormant, % capacity, and ownership structure.
• To identify and explain all issues, problems and constraints at each transfer point in the chain; i.e. yields, prices, payment systems, transport, quality, frequency of transfers (points of sale); storage limitations; processing limitations (low technology), etc.
Ethiopia maize sector value chain analysis
Market assessment and baseline study for maize-Ethiopia 3
• To identify volume flow between sectors and cover all local use (rural) and consumption of maize and maize by-products, including on-farm retention for different purposes.
• To identify and explain the value change between transaction points adjusting for measurement differences and conversions from one type to another.
• To identify and analyze all trade policies and regulations that govern exports and imports of maize, including periodic export and import bans, food quality and safety standards, sanitary and phytosanitary requirements and pest risk controls, non tariff charges on maize imports, customs clearance procedures.
• To assessment the implementation procedures, for each of the identified regulations, and examine the clarity of roles between various government institutions responsible for the implementation of these rules and regulations.
• To assess the impact of maize trade policies and regulations on cross-country movement and cross border trade of maize.
• To provide insight and perspective on the issues and problem and make recommendations on interventions at “links” in the value added chain that may assist the industry in general and the smallholder farmer in particular to improve on volume and/or value, including identifying issues that will form a base for Regional Maize Trade rules and policy harmonization negotiations with EAC and COMESA.
• To develop a five-year baseline data for volume and value for the period 1998/99-2001-2002, including all components of maize along the chain-seed maize production volumes, farm gate prices, export and local sales by volume and value, local processing volume, values of exports and domestic sales.
1.3 Data and Methodology
This study is largely based on secondary data sources and primary data and information sourced through rapid appraisal method. Secondary data sources, including documents available on the internet were reviewed to collect data on area, yield and production of maize, input utilization, marketed quantity, import/export trends, domestic maize consumption patterns, stock change, on farm retention of maize for different purposes and loss, grain prices at different market levels and for different markets, etc. Informal interviews were conducted with key informants in the major maize producing and marketing areas including Addis Ababa, Shashemene, and Nazret. The purpose of the rapid appraisal survey was to get an understanding of the maize marketing channels and the relative importance of the various participants in terms of volume of flow, gather information on maize production and utilization patterns, types and categories of producers, the types of market participants and the level of their participation, the buying and selling behaviour of the different market players, the buying areas and seasonality of transactions, etc. Interviews were also conducted with grain exporters, processors and cleaners to obtain an understanding of their trade operations, costs and margins as well as technical and policy constraints they face.
Ethiopia maize sector value chain analysis
Market assessment and baseline study for maize-Ethiopia 4
Government policies and procedures, including licensing, taxation, customs, quality and standards, phyto-sanitary requirements and enforcement procedures, were reviewed during the data collection period.
Ethiopia maize sector value chain analysis
Market assessment and baseline study for maize-Ethiopia 5
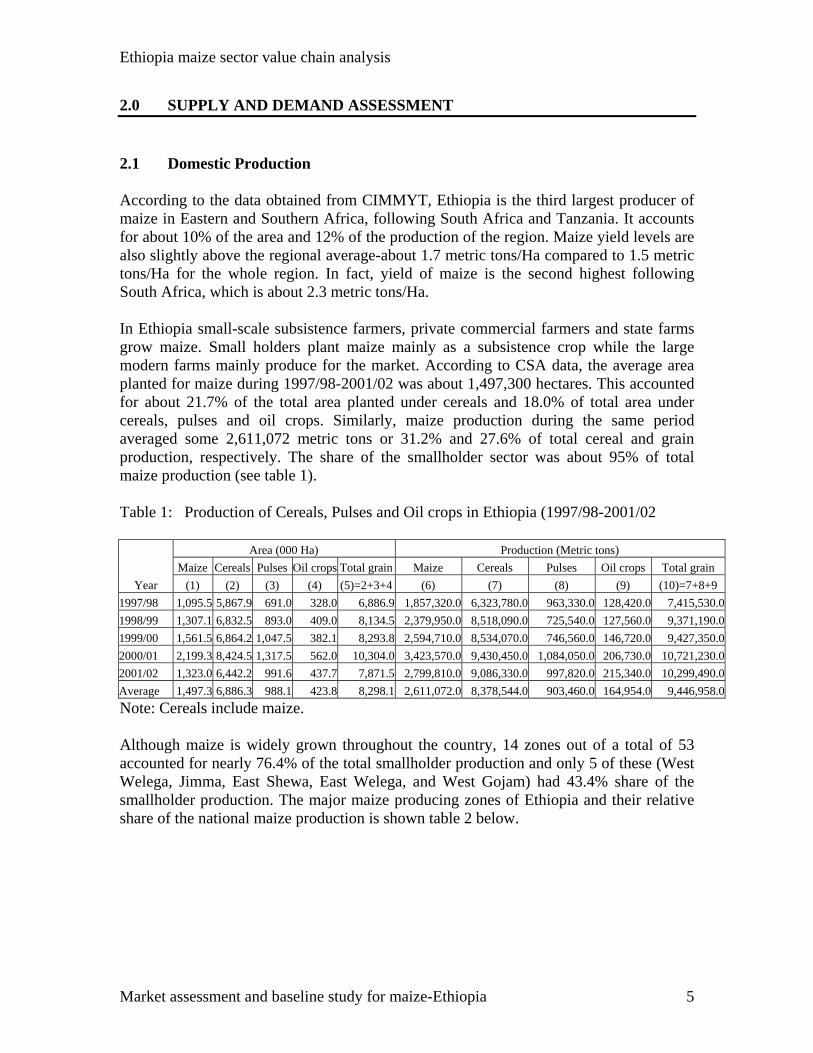
2.0 SUPPLY AND DEMAND ASSESSMENT 2.1 Domestic Production According to the data obtained from CIMMYT, Ethiopia is the third largest producer of maize in Eastern and Southern Africa, following South Africa and Tanzania. It accounts for about 10% of the area and 12% of the production of the region. Maize yield levels are also slightly above the regional average-about 1.7 metric tons/Ha compared to 1.5 metric tons/Ha for the whole region. In fact, yield of maize is the second highest following South Africa, which is about 2.3 metric tons/Ha. In Ethiopia small-scale subsistence farmers, private commercial farmers and state farms grow maize. Small holders plant maize mainly as a subsistence crop while the large modern farms mainly produce for the market. According to CSA data, the average area planted for maize during 1997/98-2001/02 was about 1,497,300 hectares. This accounted for about 21.7% of the total area planted under cereals and 18.0% of total area under cereals, pulses and oil crops. Similarly, maize production during the same period averaged some 2,611,072 metric tons or 31.2% and 27.6% of total cereal and grain production, respectively. The share of the smallholder sector was about 95% of total maize production (see table 1). Table 1: Production of Cereals, Pulses and Oil crops in Ethiopia (1997/98-2001/02
Year
Area (000 Ha) Production (Metric tons) Maize Cereals Pulses Oil crops Total grain Maize Cereals Pulses Oil crops Total grain
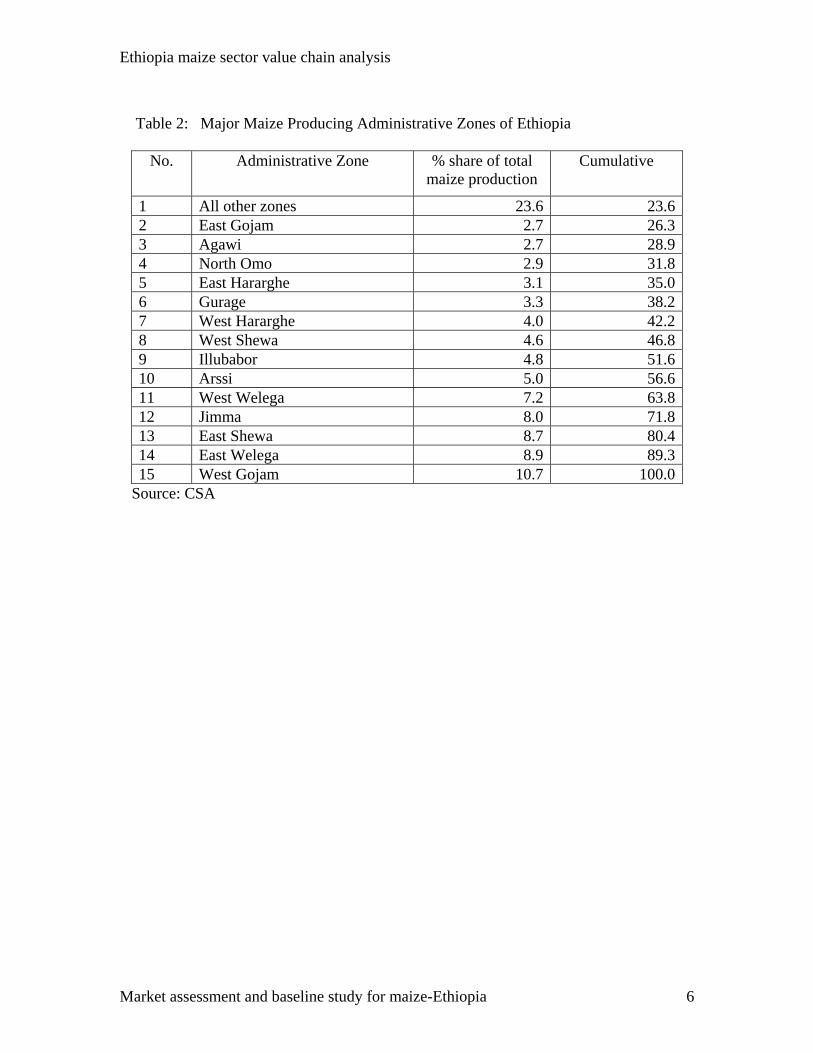
(1) (2) (3) (4) (5)=2+3+4 (6) (7) (8) (9) (10)=7+8+9 1997/98 1,095.5 5,867.9 691.0 328.0 6,886.9 1,857,320.0 6,323,780.0 963,330.0 128,420.0 7,415,530.01998/99 1,307.1 6,832.5 893.0 409.0 8,134.5 2,379,950.0 8,518,090.0 725,540.0 127,560.0 9,371,190.01999/00 1,561.5 6,864.2 1,047.5 382.1 8,293.8 2,594,710.0 8,534,070.0 746,560.0 146,720.0 9,427,350.02000/01 2,199.3 8,424.5 1,317.5 562.0 10,304.0 3,423,570.0 9,430,450.0 1,084,050.0 206,730.0 10,721,230.02001/02 1,323.0 6,442.2 991.6 437.7 7,871.5 2,799,810.0 9,086,330.0 997,820.0 215,340.0 10,299,490.0Average 1,497.3 6,886.3 988.1 423.8 8,298.1 2,611,072.0 8,378,544.0 903,460.0 164,954.0 9,446,958.0Note: Cereals include maize. Although maize is widely grown throughout the country, 14 zones out of a total of 53 accounted for nearly 76.4% of the total smallholder production and only 5 of these (West Welega, Jimma, East Shewa, East Welega, and West Gojam) had 43.4% share of the smallholder production. The major maize producing zones of Ethiopia and their relative share of the national maize production is shown table 2 below.
Ethiopia maize sector value chain analysis
Market assessment and baseline study for maize-Ethiopia 6
Table 2: Major Maize Producing Administrative Zones of Ethiopia
No. Administrative Zone % share of total maize production
Cumulative
1 All other zones 23.6 23.62 East Gojam 2.7 26.33 Agawi 2.7 28.94 North Omo 2.9 31.85 East Hararghe 3.1 35.06 Gurage 3.3 38.27 West Hararghe 4.0 42.28 West Shewa 4.6 46.89 Illubabor 4.8 51.610 Arssi 5.0 56.611 West Welega 7.2 63.812 Jimma 8.0 71.813 East Shewa 8.7 80.414 East Welega 8.9 89.315 West Gojam 10.7 100.0
Source: CSA
Ethiopia maize sector value chain analysis
Market assessment and baseline study for maize-Ethiopia 7
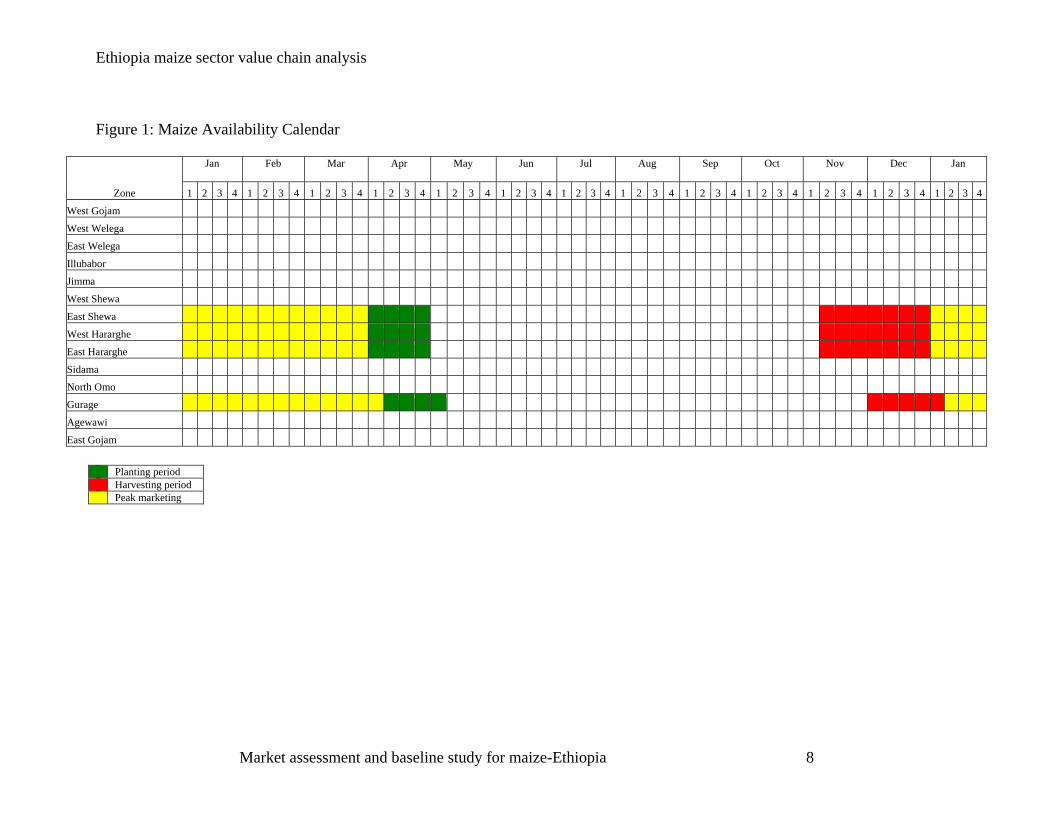
2.2 Maize Availability Calendar The planting period for maize in Ethiopia slightly varies from area to area. In the Eastern and Southeastern parts of Ethiopia, maize planting starts in late March and ends late April. In the Northwestern and Southwestern parts, maize planting commences sometime in early May and ends early June. Although this represents the normal planting pattern, there could be slight variation in the date of planting depending on the early or late onset of rainfall. Harvesting also shows similar variation. In east and southeast Ethiopia, maize harvesting begins early November and ends late December, and in the Northwest and Southwest the harvesting period for maize is normally late December-middle of January. The planting and harvesting periods of maize in the major maize producing areas is shown in figure 1.
Ethiopia maize sector value chain analysis
Market assessment and baseline study for maize-Ethiopia 8
Figure 1: Maize Availability Calendar
Zone
Jan
Feb
Mar
Apr
May
Jun
Jul
Aug
Sep
Oct
Nov
Dec
Jan
1 2 3 4 1 2 3 4 1 2 3 4 1 2 3 4 1 2 3 4 1 2 3 4 1 2 3 4 1 2 3 4 1 2 3 4 1 2 3 4 1 2 3 4 1 2 3 4 1 2 3 4
West Gojam
West Welega
East Welega
Illubabor
Jimma
West Shewa
East Shewa
West Hararghe
East Hararghe
Sidama
North Omo
Gurage
Agewawi
East Gojam
Planting period Harvesting period Peak marketing
Ethiopia maize sector value chain analysis
Market assessment and baseline study for maize-Ethiopia 9
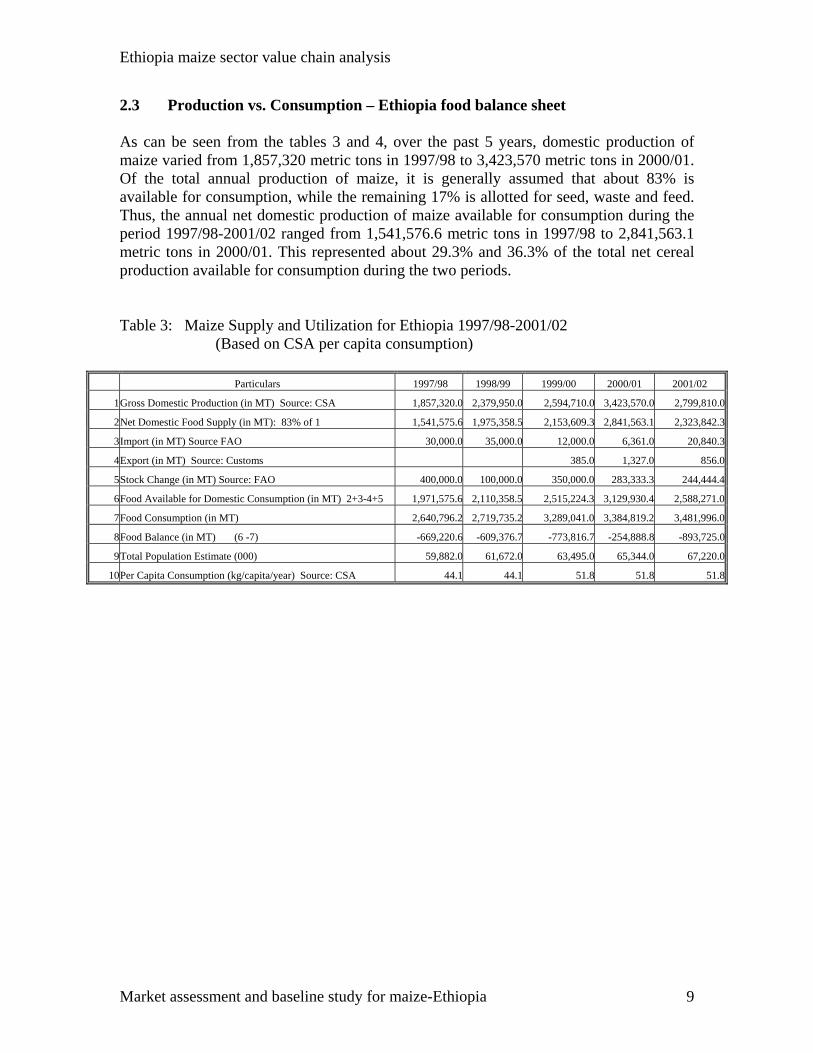
2.3 Production vs. Consumption – Ethiopia food balance sheet As can be seen from the tables 3 and 4, over the past 5 years, domestic production of maize varied from 1,857,320 metric tons in 1997/98 to 3,423,570 metric tons in 2000/01. Of the total annual production of maize, it is generally assumed that about 83% is available for consumption, while the remaining 17% is allotted for seed, waste and feed. Thus, the annual net domestic production of maize available for consumption during the period 1997/98-2001/02 ranged from 1,541,576.6 metric tons in 1997/98 to 2,841,563.1 metric tons in 2000/01. This represented about 29.3% and 36.3% of the total net cereal production available for consumption during the two periods. Table 3: Maize Supply and Utilization for Ethiopia 1997/98-2001/02
(Based on CSA per capita consumption)
Particulars 1997/98 1998/99 1999/00 2000/01 2001/02
1 Gross Domestic Production (in MT) Source: CSA 1,857,320.0 2,379,950.0 2,594,710.0 3,423,570.0 2,799,810.0
2 Net Domestic Food Supply (in MT): 83% of 1 1,541,575.6 1,975,358.5 2,153,609.3 2,841,563.1 2,323,842.3
3 Import (in MT) Source FAO 30,000.0 35,000.0 12,000.0 6,361.0 20,840.3
4 Export (in MT) Source: Customs 385.0 1,327.0 856.0
5 Stock Change (in MT) Source: FAO 400,000.0 100,000.0 350,000.0 283,333.3 244,444.4
6 Food Available for Domestic Consumption (in MT) 2+3-4+5 1,971,575.6 2,110,358.5 2,515,224.3 3,129,930.4 2,588,271.0
7 Food Consumption (in MT) 2,640,796.2 2,719,735.2 3,289,041.0 3,384,819.2 3,481,996.0
8 Food Balance (in MT) (6 -7) -669,220.6 -609,376.7 -773,816.7 -254,888.8 -893,725.0
9 Total Population Estimate (000) 59,882.0 61,672.0 63,495.0 65,344.0 67,220.0
10 Per Capita Consumption (kg/capita/year) Source: CSA 44.1 44.1 51.8 51.8 51.8
Ethiopia maize sector value chain analysis
Market assessment and baseline study for maize-Ethiopia 10
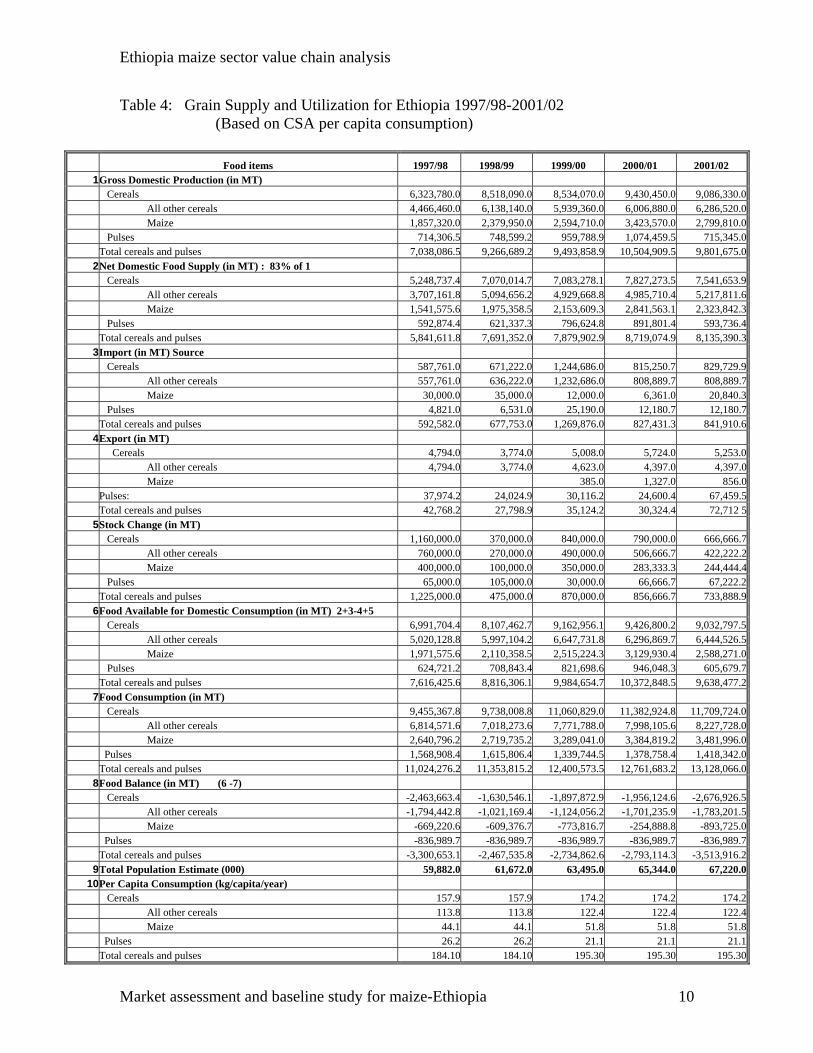
Table 4: Grain Supply and Utilization for Ethiopia 1997/98-2001/02 (Based on CSA per capita consumption)
Food items 1997/98 1998/99 1999/00 2000/01 2001/02
1 Gross Domestic Production (in MT) Cereals 6,323,780.0 8,518,090.0 8,534,070.0 9,430,450.0 9,086,330.0 All other cereals 4,466,460.0 6,138,140.0 5,939,360.0 6,006,880.0 6,286,520.0 Maize 1,857,320.0 2,379,950.0 2,594,710.0 3,423,570.0 2,799,810.0 Pulses 714,306.5 748,599.2 959,788.9 1,074,459.5 715,345.0 Total cereals and pulses 7,038,086.5 9,266,689.2 9,493,858.9 10,504,909.5 9,801,675.0
2 Net Domestic Food Supply (in MT) : 83% of 1 Cereals 5,248,737.4 7,070,014.7 7,083,278.1 7,827,273.5 7,541,653.9 All other cereals 3,707,161.8 5,094,656.2 4,929,668.8 4,985,710.4 5,217,811.6 Maize 1,541,575.6 1,975,358.5 2,153,609.3 2,841,563.1 2,323,842.3 Pulses 592,874.4 621,337.3 796,624.8 891,801.4 593,736.4 Total cereals and pulses 5,841,611.8 7,691,352.0 7,879,902.9 8,719,074.9 8,135,390.3
3 Import (in MT) Source Cereals 587,761.0 671,222.0 1,244,686.0 815,250.7 829,729.9 All other cereals 557,761.0 636,222.0 1,232,686.0 808,889.7 808,889.7 Maize 30,000.0 35,000.0 12,000.0 6,361.0 20,840.3 Pulses 4,821.0 6,531.0 25,190.0 12,180.7 12,180.7 Total cereals and pulses 592,582.0 677,753.0 1,269,876.0 827,431.3 841,910.6
4 Export (in MT) Cereals 4,794.0 3,774.0 5,008.0 5,724.0 5,253.0 All other cereals 4,794.0 3,774.0 4,623.0 4,397.0 4,397.0 Maize 385.0 1,327.0 856.0 Pulses: 37,974.2 24,024.9 30,116.2 24,600.4 67,459.5 Total cereals and pulses 42,768.2 27,798.9 35,124.2 30,324.4 72,712 5
5 Stock Change (in MT) Cereals 1,160,000.0 370,000.0 840,000.0 790,000.0 666,666.7 All other cereals 760,000.0 270,000.0 490,000.0 506,666.7 422,222.2 Maize 400,000.0 100,000.0 350,000.0 283,333.3 244,444.4 Pulses 65,000.0 105,000.0 30,000.0 66,666.7 67,222.2 Total cereals and pulses 1,225,000.0 475,000.0 870,000.0 856,666.7 733,888.9
6 Food Available for Domestic Consumption (in MT) 2+3-4+5 Cereals 6,991,704.4 8,107,462.7 9,162,956.1 9,426,800.2 9,032,797.5 All other cereals 5,020,128.8 5,997,104.2 6,647,731.8 6,296,869.7 6,444,526.5 Maize 1,971,575.6 2,110,358.5 2,515,224.3 3,129,930.4 2,588,271.0 Pulses 624,721.2 708,843.4 821,698.6 946,048.3 605,679.7 Total cereals and pulses 7,616,425.6 8,816,306.1 9,984,654.7 10,372,848.5 9,638,477.2
7 Food Consumption (in MT) Cereals 9,455,367.8 9,738,008.8 11,060,829.0 11,382,924.8 11,709,724.0 All other cereals 6,814,571.6 7,018,273.6 7,771,788.0 7,998,105.6 8,227,728.0 Maize 2,640,796.2 2,719,735.2 3,289,041.0 3,384,819.2 3,481,996.0 Pulses 1,568,908.4 1,615,806.4 1,339,744.5 1,378,758.4 1,418,342.0 Total cereals and pulses 11,024,276.2 11,353,815.2 12,400,573.5 12,761,683.2 13,128,066.0
8 Food Balance (in MT) (6 -7) Cereals -2,463,663.4 -1,630,546.1 -1,897,872.9 -1,956,124.6 -2,676,926.5 All other cereals -1,794,442.8 -1,021,169.4 -1,124,056.2 -1,701,235.9 -1,783,201.5 Maize -669,220.6 -609,376.7 -773,816.7 -254,888.8 -893,725.0 Pulses -836,989.7 -836,989.7 -836,989.7 -836,989.7 -836,989.7 Total cereals and pulses -3,300,653.1 -2,467,535.8 -2,734,862.6 -2,793,114.3 -3,513,916.2
9 Total Population Estimate (000) 59,882.0 61,672.0 63,495.0 65,344.0 67,220.010 Per Capita Consumption (kg/capita/year)
Cereals 157.9 157.9 174.2 174.2 174.2 All other cereals 113.8 113.8 122.4 122.4 122.4 Maize 44.1 44.1 51.8 51.8 51.8 Pulses 26.2 26.2 21.1 21.1 21.1 Total cereals and pulses 184.10 184.10 195.30 195.30 195.30
Ethiopia maize sector value chain analysis
Market assessment and baseline study for maize-Ethiopia 11
Maize Utilization Ethiopia’s average annual cereal consumption during the period 1997/98-2001/02 is estimated at 10,669,370.9 metric tons, of which maize accounted for 3,103,277.5 metric tons or about 29%. According to the CSA, per capita maize consumption has increased from 44.1 kg in 1995/96 to 51.8 kg in 1999/00. This represents an increase of about 7.7 kg or 17% over a period of three years. The increase of maize demand in the urban areas, however, was small-about 5.2% against 23.2% for rural areas (see table 4). Per capita maize consumption in rural Ethiopia is significant-about 57.9 kg- and this accounts for nearly 31.5% of total rural cereal consumption. However, the per capita consumption of maize in urban areas is low-16.1 kg-which is only 13.6% of total urban cereal demand. The major cereals consumed in urban Ethiopia are teff and wheat which account for about 53.2% and 17.8% of total urban cereal demand, respectively. 2.4 Import/Export of Maize As mentioned earlier, maize is one of the most important cereal crops widely grown in Ethiopia. Its performance in terms of yield per unit area is the highest. Availability of improved maize technologies, including improved varieties, fertilizer, improved cultural practices and an aggressive extension and credit program has helped producers to increase their maize production substantially in the 1990s (Mosisa Worku et al, 2001). The potential for further expansion of maize production in Ethiopia is also enormous; for example, maize yields of about 5-6 metric tons/Ha have been recorded on the half-hectare demonstration plots of Sasakawa Global 2000 and on government extension programs. This clearly shows that maize production can be increased significantly by more than 200% using hybrid seed varieties and other existing maize technologies (Mosisa Worku et al, 2001). On the contrary, however, the domestic market for maize is limited, particularly in the urban areas where the purchasing power is relatively better. As a result, maize prices collapse considerably when the country gets bumper harvest like those of 1995/96, 1996/97, 1999/00, and 2001/02. Since 1997, the government was looking for a viable strategy including export promotion of maize to alleviate the problem of maize surplus and price decline (Wolday, 1997). However, not much success was attained to export maize to neighbouring countries directly or indirectly through the WFP. According to EGTE and FAO (FAO Database), the volume of official maize export is estimated to be about 48,000 metric tons in 1996/97, 385.0 metric tons in 1999/00, 1,327.0 metric tons in 2000/01 and 856.0 metric tons in 2001/02. On the other hand, data from the Central Statistical Authority (CSA) shows that there was export of maize in the period 2000-2002, and the volume of maize exported is shown the table below. There was no maize import during the same period.

Ethiopia maize sector value chain analysis
Market assessment and baseline study for maize-Ethiopia 12
Table 5: Export of Maize by Destination
Destination Quantity Exported (MT) Value (birr) 2000 2001 2002 2000 2001 2002
Djibouti 335 1,516 1,208 580,727 2,256,691 1,667,569Iceland 1 . 3,055 Israel 5 420 2,043 7,183Morocco 10,000 . . 12,551,200Netherlands 100 0 . 1,260,930 Pakistan 42 . . 112,615S. Arabia 18 3 . 21,338 26,684Switzerland 30 . . 129,864Turkey 40 80 . 51,262 62,236Yemen 50 358 1,480 104,100 3,363,323 1,362,092Total 385 2,033 12,848 685,247 6,958,642 15,919,443
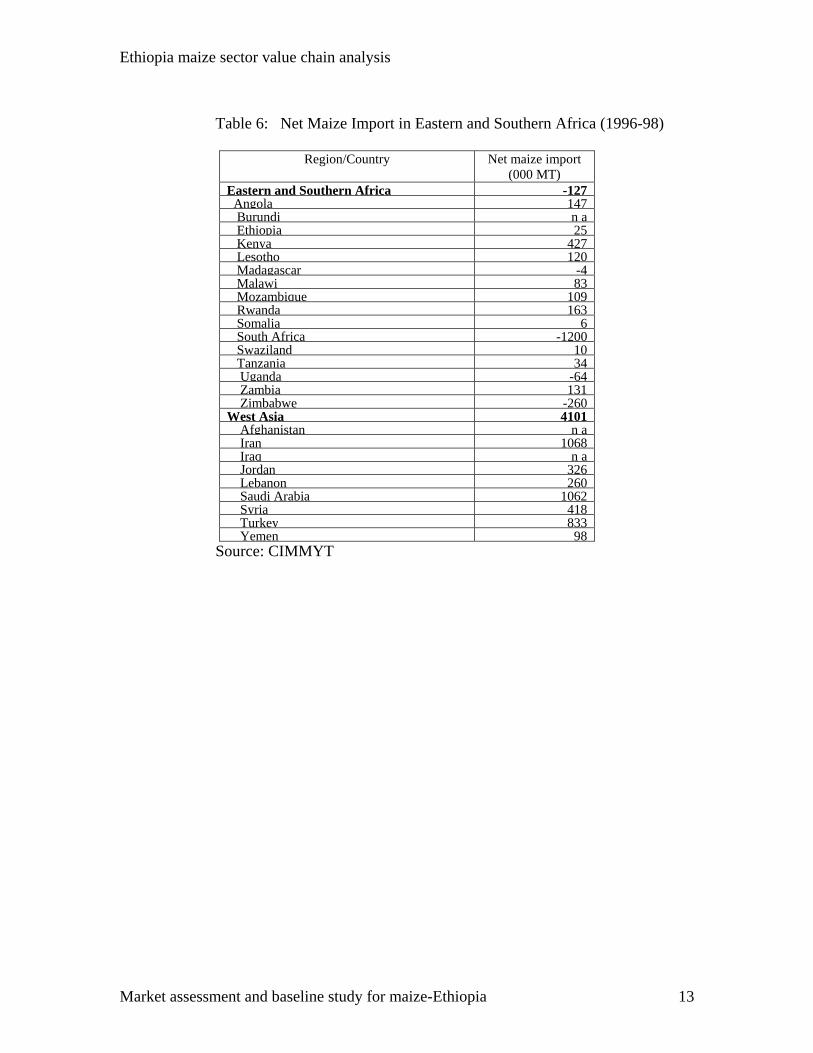
Source: CSA Foreign Trade Statistical Bulletins The volume of maize export recorded in the past is little compared to the potential export market in Eastern and Southern Africa. According to CIMMYT data, although the region as a whole was net exporter of about 127,000 metric tons of maize, many of the countries in the region except South Africa, Zimbabwe and Uganda, are net importers of maize. The two neighbouring countries of Ethiopia-Kenya and Somalia-together imported about 433,000 metric tons of maize annually during the period 1996-98. West Asia, including Afghanistan, Iran, Iraq, Jordan, Lebanon, Saudi Arabia, Syria, Turkey, and Yemen, also imported 4,101,000 metric tons of maize during the same period (see table 6). In both regions-Eastern and Southern Africa and West Asia-where Ethiopia has a location advantage, the volume of maize import was more than 5.0 million metric tons in 1996-1998. About 69% of West Asia’s maize consumption was animal feed. Despite this immense potential, Ethiopia did not take advantage to export large quantities of maize to these regions even when it had production glut in 1995/96, 1996/97.
Ethiopia maize sector value chain analysis
Market assessment and baseline study for maize-Ethiopia 13
Table 6: Net Maize Import in Eastern and Southern Africa (1996-98)
Region/Country Net maize import
(000 MT) Eastern and Southern Africa -127 Angola 147 Burundi n a Ethiopia 25 Kenya 427 Lesotho 120 Madagascar -4 Malawi 83 Mozambique 109 Rwanda 163 Somalia 6 South Africa -1200 Swaziland 10 Tanzania 34 Uganda -64 Zambia 131 Zimbabwe -260 West Asia 4101 Afghanistan n a Iran 1068 Iraq n a Jordan 326 Lebanon 260 Saudi Arabia 1062 Syria 418 Turkey 833 Yemen 98
Source: CIMMYT
Ethiopia maize sector value chain analysis
Market assessment and baseline study for maize-Ethiopia 14
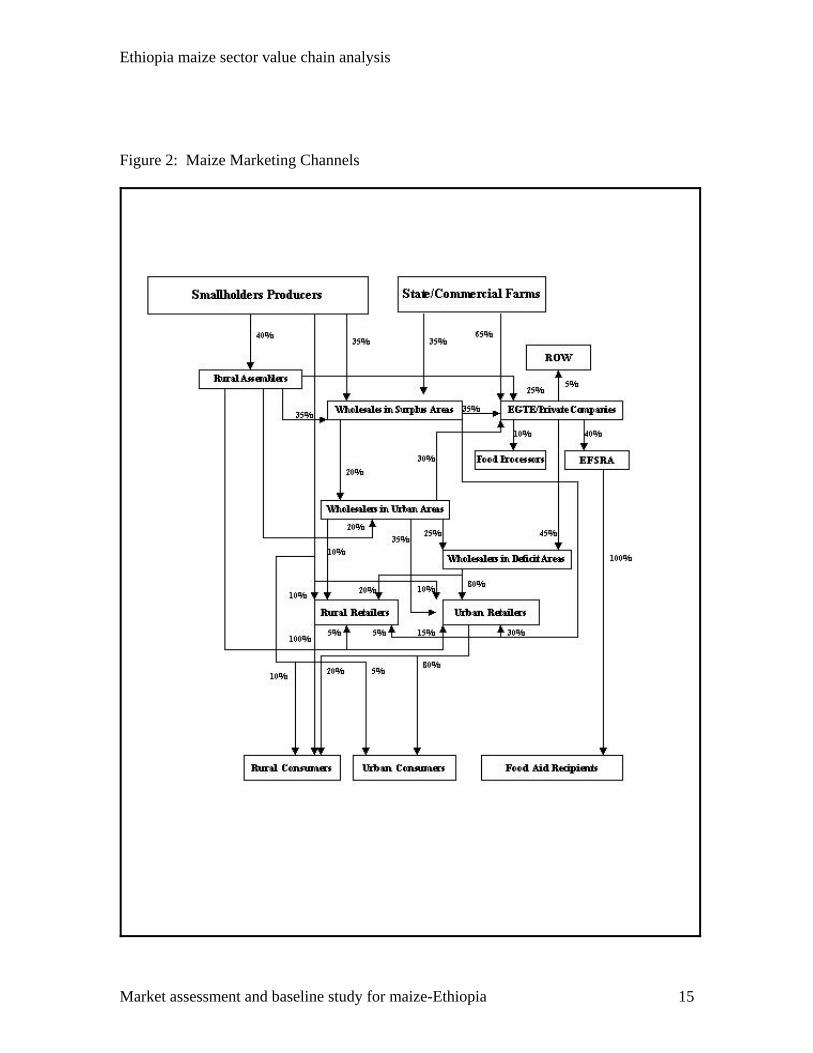
3.0 VALUE CHAIN ANALYSIS 3.1 Marketing Channels Out of the total annual cereal production of about 2.5-3.5 million metric tons, it is estimated that both smallholders and commercial farmers market some 23% or 2.1 million metric tons. Maize accounts for nearly 28.2% of the total marketed quantity. Most of the marketed quantity of maize-94%-comes from smallholders, and the rest is from commercial and state farms. The marketed volume of maize passes successively through a number of channels before it reaches the final consumer. The marketing chain of maize is portrayed in figure 2 below.
31.1 Producers As mentioned earlier, most of the surplus maize-about 95%-is sold by the small farmers who mainly produce for subsistence. According recent studies, grain sales by smallholders beyond 20 km distance is infrequent. Smallholders normally sell most of their produce immediately after harvest for fear of storage loss, and also to meet various cash needs including repayment of loans, payment of taxes and to cover miscellaneous expenses. Maize producers have different market outlets, including rural assemblers (40%) and wholesalers (35%). Until 1990, large-scale farming had been the exclusive domain of state enterprises. Because of the economic policy of the current government, however, private commercial farming has started, but it is at an infant stage. Although a number of investors have obtained land on lease basis, most of them could not fully utilize (and in cases abandoned it altogether) the land because of lack of access to credit, lack of market for their products, particularly maize, and high cost of inputs, etc. Currently their contribution to overall maize production and marketable surplus is small. State enterprises and commercial maize producers sell most of their produce on farm immediately after harvest for lack of credit facilities, storage, etc.
Ethiopia maize sector value chain analysis
Market assessment and baseline study for maize-Ethiopia 15
Figure 2: Maize Marketing Channels
Ethiopia maize sector value chain analysis
Market assessment and baseline study for maize-Ethiopia 16
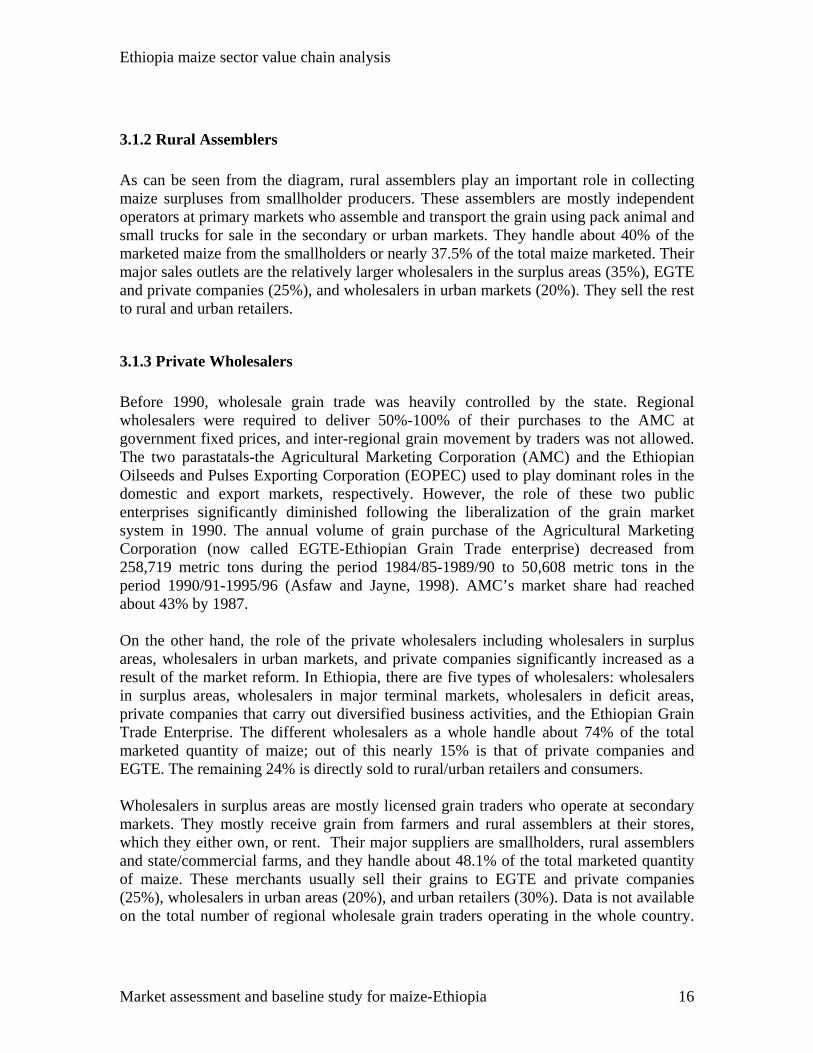
3.1.2 Rural Assemblers As can be seen from the diagram, rural assemblers play an important role in collecting maize surpluses from smallholder producers. These assemblers are mostly independent operators at primary markets who assemble and transport the grain using pack animal and small trucks for sale in the secondary or urban markets. They handle about 40% of the marketed maize from the smallholders or nearly 37.5% of the total maize marketed. Their major sales outlets are the relatively larger wholesalers in the surplus areas (35%), EGTE and private companies (25%), and wholesalers in urban markets (20%). They sell the rest to rural and urban retailers.
3.1.3 Private Wholesalers Before 1990, wholesale grain trade was heavily controlled by the state. Regional wholesalers were required to deliver 50%-100% of their purchases to the AMC at government fixed prices, and inter-regional grain movement by traders was not allowed. The two parastatals-the Agricultural Marketing Corporation (AMC) and the Ethiopian Oilseeds and Pulses Exporting Corporation (EOPEC) used to play dominant roles in the domestic and export markets, respectively. However, the role of these two public enterprises significantly diminished following the liberalization of the grain market system in 1990. The annual volume of grain purchase of the Agricultural Marketing Corporation (now called EGTE-Ethiopian Grain Trade enterprise) decreased from 258,719 metric tons during the period 1984/85-1989/90 to 50,608 metric tons in the period 1990/91-1995/96 (Asfaw and Jayne, 1998). AMC’s market share had reached about 43% by 1987. On the other hand, the role of the private wholesalers including wholesalers in surplus areas, wholesalers in urban markets, and private companies significantly increased as a result of the market reform. In Ethiopia, there are five types of wholesalers: wholesalers in surplus areas, wholesalers in major terminal markets, wholesalers in deficit areas, private companies that carry out diversified business activities, and the Ethiopian Grain Trade Enterprise. The different wholesalers as a whole handle about 74% of the total marketed quantity of maize; out of this nearly 15% is that of private companies and EGTE. The remaining 24% is directly sold to rural/urban retailers and consumers. Wholesalers in surplus areas are mostly licensed grain traders who operate at secondary markets. They mostly receive grain from farmers and rural assemblers at their stores, which they either own, or rent. Their major suppliers are smallholders, rural assemblers and state/commercial farms, and they handle about 48.1% of the total marketed quantity of maize. These merchants usually sell their grains to EGTE and private companies (25%), wholesalers in urban areas (20%), and urban retailers (30%). Data is not available on the total number of regional wholesale grain traders operating in the whole country.
Ethiopia maize sector value chain analysis
Market assessment and baseline study for maize-Ethiopia 17
However, it is estimated that there are 5-200 traders per market depending on the importance of the market (Gebremeskel et al, 1998). In Ethiopia, there now exists a substantial network of private traders who buy, store, transport and sell grain on local and inter-regional markets within the country. There is also a specialized brokers’ market, mainly operating in Addis Ababa that mediates between traders in surplus areas and wholesalers in terminal and deficit markets, processors and private companies. The brokers operating in the main terminal markets normally coordinate inter-market grain flow. The brokers are specialized by route and coordinate grain buying, selling, transporting and pricing activities. The brokers generally do not compete aggressively for regional wholesalers’ business and most of the regional traders are loyal to their respective “client” broker. This situation indicates generally long-term relationships between brokers and regional traders based on trust. The main reasons for using the services of brokers are that they (1) sell grain on behalf of the regional merchants; (2) provide market information; (3) collect and haul back grain sacks; (4) collect and send back money from the sale of grain; (5) identify grain buyers from deficit areas; (6) provide temporary storage services; and (7) arrange transport for transferring the grain. In terms of importance, however, the merchants identified selling grain (62%), providing market information (36%), collecting and sending grain sacks (32%), collecting and sending the money from grain sells (49%) as the major functions of the brokers. wholesalers usually pay a fixed commission amounting to birr 14.2 per metric tons for brokers operating in the terminal markets and other deficit areas (Gebremeskel et al, 1998). According to the study conducted in 1996, some of the wholesale merchants were also engaged in informal cross-border trade with Eritrea mainly in grain export. It was estimated that wholesale merchants exported some 10,200 metric tons to Eritrea, of which 8,224 metric tons was sorghum. Other crops exported include maize 1,300 metric tons, teff 506 metric tons, wheat 150 metric tons and barley 60 metric tons. The major grain exporting market to Eritrea were Gonder which accounted for more than 9,300 metric tons mostly sorghum. The interviewed wholesalers did not report informal exports to other neighbouring countries. 3.2 The Ethiopian Grain Trade Enterprise Following the market liberalization of 1990, the Ethiopian Grain Trade Enterprise, formerly known as the Agricultural Marketing Corporation (AMC) was re-established in October 1999 by the Council of Ministers Regulation No. 58/1999, after it has been amalgamated with another public enterprise called the Ethiopian Oil Seeds and Pulses Exporting Corporation. Its authorized capital is about 112.0 million birr. The objectives of EGTE are the following: • To purchase grain from farmers and sell mainly in export markets, • To contribute towards the stabilization of markets so that they will be encouraged to
increase their outputs, and
Ethiopia maize sector value chain analysis
Market assessment and baseline study for maize-Ethiopia 18
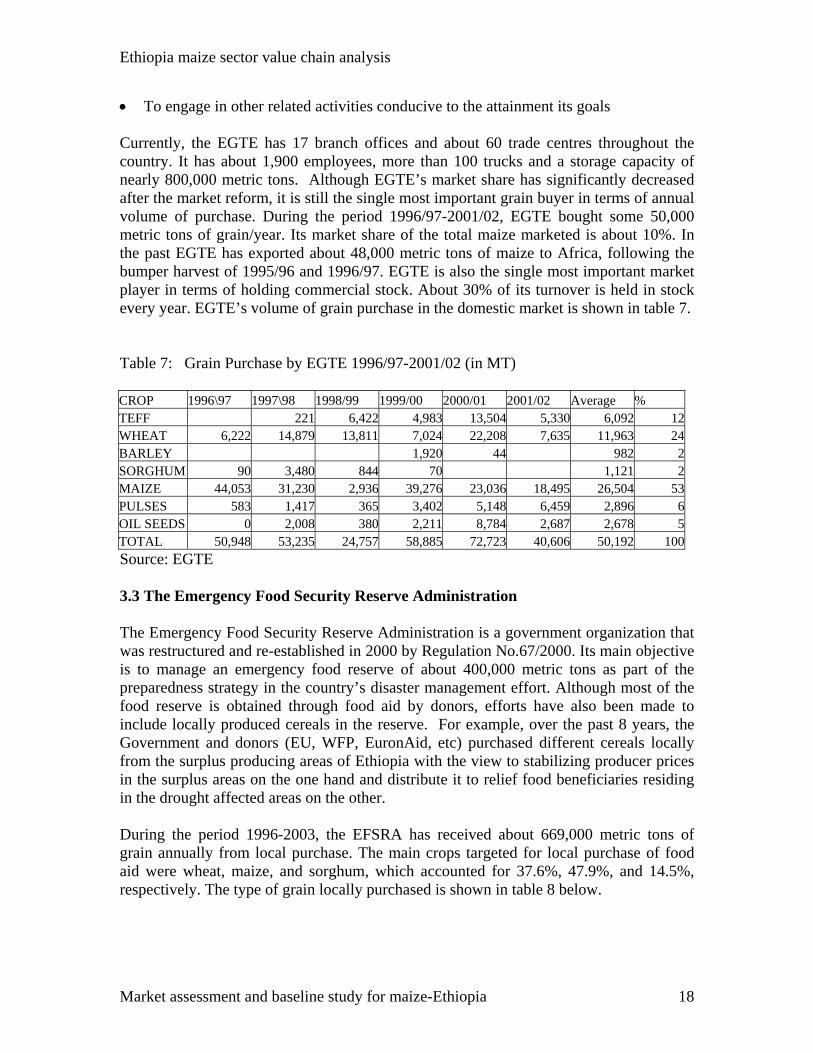
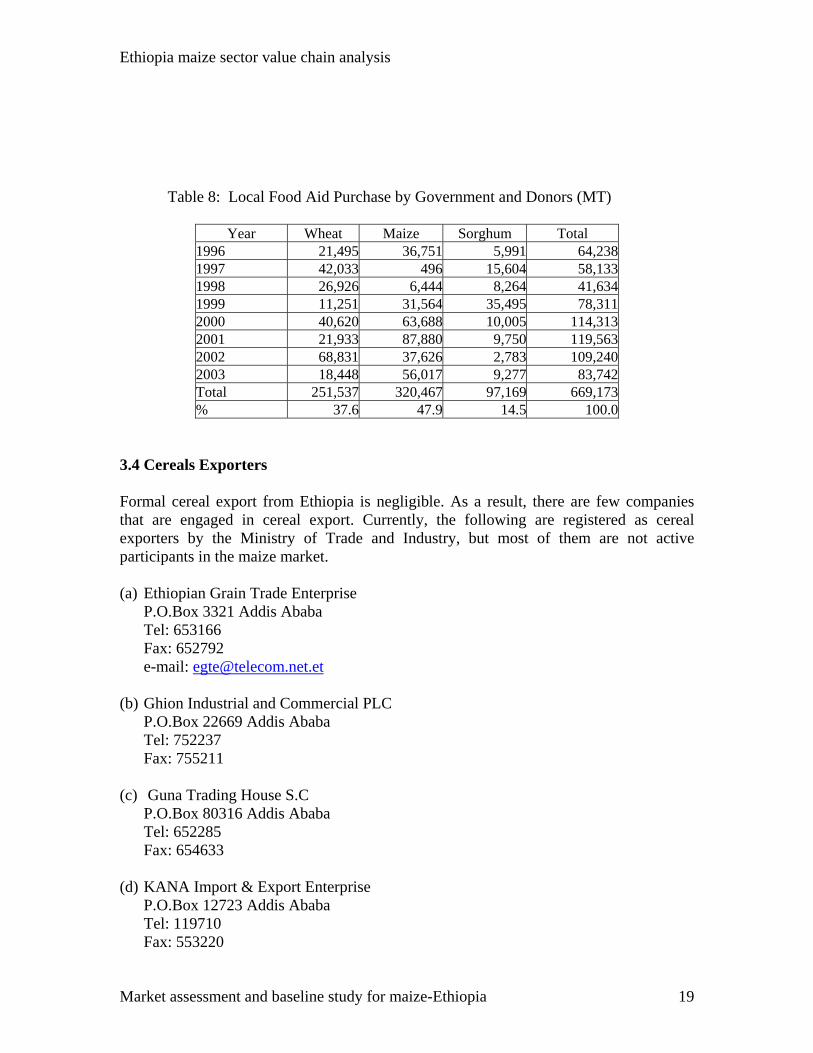
• To engage in other related activities conducive to the attainment its goals Currently, the EGTE has 17 branch offices and about 60 trade centres throughout the country. It has about 1,900 employees, more than 100 trucks and a storage capacity of nearly 800,000 metric tons. Although EGTE’s market share has significantly decreased after the market reform, it is still the single most important grain buyer in terms of annual volume of purchase. During the period 1996/97-2001/02, EGTE bought some 50,000 metric tons of grain/year. Its market share of the total maize marketed is about 10%. In the past EGTE has exported about 48,000 metric tons of maize to Africa, following the bumper harvest of 1995/96 and 1996/97. EGTE is also the single most important market player in terms of holding commercial stock. About 30% of its turnover is held in stock every year. EGTE’s volume of grain purchase in the domestic market is shown in table 7. Table 7: Grain Purchase by EGTE 1996/97-2001/02 (in MT) CROP 1996\97 1997\98 1998/99 1999/00 2000/01 2001/02 Average % TEFF 221 6,422 4,983 13,504 5,330 6,092 12WHEAT 6,222 14,879 13,811 7,024 22,208 7,635 11,963 24BARLEY 1,920 44 982 2SORGHUM 90 3,480 844 70 1,121 2MAIZE 44,053 31,230 2,936 39,276 23,036 18,495 26,504 53PULSES 583 1,417 365 3,402 5,148 6,459 2,896 6OIL SEEDS 0 2,008 380 2,211 8,784 2,687 2,678 5TOTAL 50,948 53,235 24,757 58,885 72,723 40,606 50,192 100Source: EGTE 3.3 The Emergency Food Security Reserve Administration The Emergency Food Security Reserve Administration is a government organization that was restructured and re-established in 2000 by Regulation No.67/2000. Its main objective is to manage an emergency food reserve of about 400,000 metric tons as part of the preparedness strategy in the country’s disaster management effort. Although most of the food reserve is obtained through food aid by donors, efforts have also been made to include locally produced cereals in the reserve. For example, over the past 8 years, the Government and donors (EU, WFP, EuronAid, etc) purchased different cereals locally from the surplus producing areas of Ethiopia with the view to stabilizing producer prices in the surplus areas on the one hand and distribute it to relief food beneficiaries residing in the drought affected areas on the other. During the period 1996-2003, the EFSRA has received about 669,000 metric tons of grain annually from local purchase. The main crops targeted for local purchase of food aid were wheat, maize, and sorghum, which accounted for 37.6%, 47.9%, and 14.5%, respectively. The type of grain locally purchased is shown in table 8 below.
Ethiopia maize sector value chain analysis
Market assessment and baseline study for maize-Ethiopia 19
Table 8: Local Food Aid Purchase by Government and Donors (MT)
Year Wheat Maize Sorghum Total 1996 21,495 36,751 5,991 64,2381997 42,033 496 15,604 58,1331998 26,926 6,444 8,264 41,6341999 11,251 31,564 35,495 78,3112000 40,620 63,688 10,005 114,3132001 21,933 87,880 9,750 119,5632002 68,831 37,626 2,783 109,2402003 18,448 56,017 9,277 83,742Total 251,537 320,467 97,169 669,173% 37.6 47.9 14.5 100.0
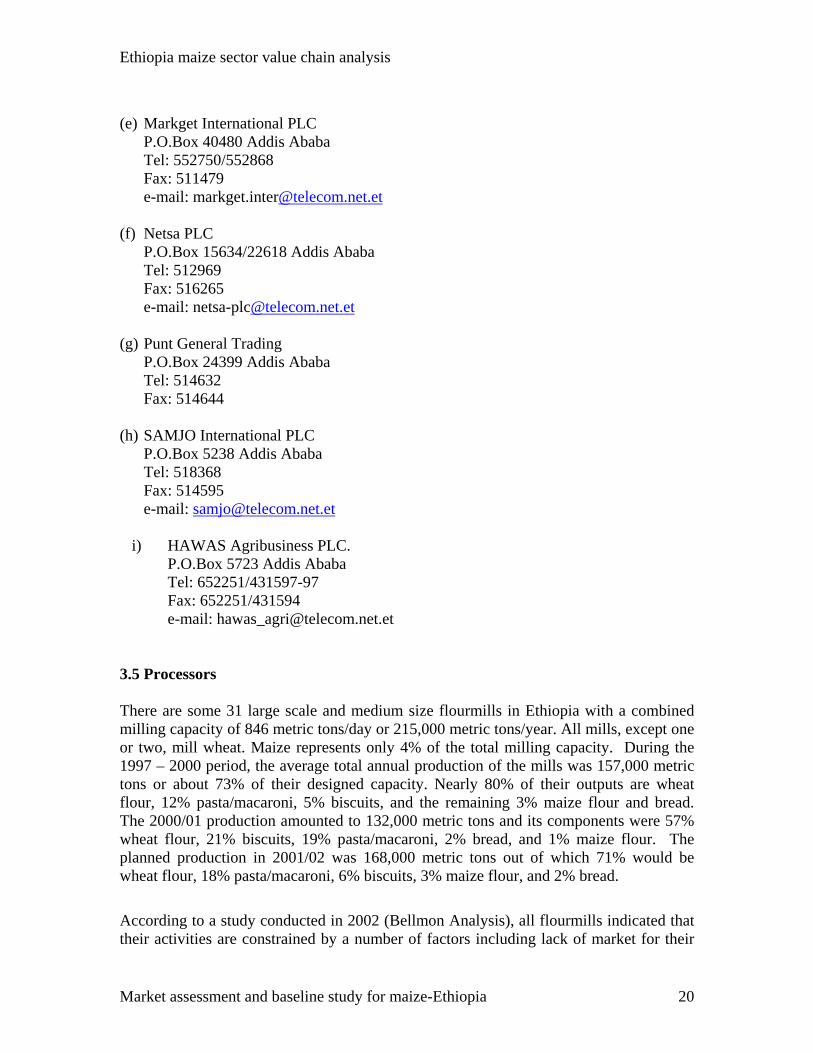
3.4 Cereals Exporters Formal cereal export from Ethiopia is negligible. As a result, there are few companies that are engaged in cereal export. Currently, the following are registered as cereal exporters by the Ministry of Trade and Industry, but most of them are not active participants in the maize market. (a) Ethiopian Grain Trade Enterprise
P.O.Box 3321 Addis Ababa Tel: 653166 Fax: 652792 e-mail: [email protected]
(b) Ghion Industrial and Commercial PLC P.O.Box 22669 Addis Ababa Tel: 752237 Fax: 755211
(c) Guna Trading House S.C P.O.Box 80316 Addis Ababa Tel: 652285 Fax: 654633
(d) KANA Import & Export Enterprise
P.O.Box 12723 Addis Ababa Tel: 119710 Fax: 553220
Ethiopia maize sector value chain analysis
Market assessment and baseline study for maize-Ethiopia 20
(e) Markget International PLC
P.O.Box 40480 Addis Ababa Tel: 552750/552868 Fax: 511479 e-mail: [email protected]
(f) Netsa PLC
P.O.Box 15634/22618 Addis Ababa Tel: 512969 Fax: 516265 e-mail: [email protected]
(g) Punt General Trading P.O.Box 24399 Addis Ababa Tel: 514632 Fax: 514644
(h) SAMJO International PLC P.O.Box 5238 Addis Ababa Tel: 518368 Fax: 514595 e-mail: [email protected]
i) HAWAS Agribusiness PLC. P.O.Box 5723 Addis Ababa Tel: 652251/431597-97 Fax: 652251/431594 e-mail: [email protected]
3.5 Processors There are some 31 large scale and medium size flourmills in Ethiopia with a combined milling capacity of 846 metric tons/day or 215,000 metric tons/year. All mills, except one or two, mill wheat. Maize represents only 4% of the total milling capacity. During the 1997 – 2000 period, the average total annual production of the mills was 157,000 metric tons or about 73% of their designed capacity. Nearly 80% of their outputs are wheat flour, 12% pasta/macaroni, 5% biscuits, and the remaining 3% maize flour and bread. The 2000/01 production amounted to 132,000 metric tons and its components were 57% wheat flour, 21% biscuits, 19% pasta/macaroni, 2% bread, and 1% maize flour. The planned production in 2001/02 was 168,000 metric tons out of which 71% would be wheat flour, 18% pasta/macaroni, 6% biscuits, 3% maize flour, and 2% bread.
According to a study conducted in 2002 (Bellmon Analysis), all flourmills indicated that their activities are constrained by a number of factors including lack of market for their
Ethiopia maize sector value chain analysis
Market assessment and baseline study for maize-Ethiopia 21
output and competition from imported wheat flour. The demand for maize in the urban areas in particular is low to encourage processors to engage in large scale maize processing. 3.6 Retailers Retailers play an important role in delivering the grain to the final consumer. The majority of the retailers are unlicensed, but they handle about 38% of the total marketed volume of maize. 3.7 Transporters In Ethiopia, there are a number of trucking companies and associations including those government owned, so-called party affiliated, and several associations of individual truck owners. Some of the largest Government owned and party affiliated companies that participate in the market are "Dil Transport association (owned by Ministry of Defence and has more than 400 big truck trailers each with 40 metric tons loading capacity), "Trans Ethiopia (Tigray based with more than 200 truck trailers having 40 metric tons loading capacity, each), "Blue Nile" (Amhara based, having more than 150 truck trailers with about 30 metric tons loading capacity each), and "Dinsho" (Oromiya based company with about 100 truck trailers, each having some 25-30 metric tons capacity). Other Government owned and privatized (transferred to entrenched civil servants under the safety net arrangement) include Noah, Abyssinia, Nib, Comet, Shebele, and Bekelcha. Each of these companies has about 50-60 trucks, each with a loading capacity of 25-30 metric tons (Gebremeskel 2001). Other genuinely private large trucking companies include "Alpha" (with about 300 truck trailers, each having 25-40 metric tons loading capacity), "Tana" (more than 300 truck trailers with an average capacity of 30-40 metric tons), "Yetebaberut" (about 250 truck trailers with an average loading capacity of 35-30 metric tons). Normally, most of the trucks owned by the Government, party affiliated companies, and by the large private sector organizations are engaged in the Addis Ababa-Djibouti corridor, transporting dry cargo-mostly fertilizers, relief food, and other merchandise. Transport rates are determined on tender basis. Although the companies compete with one another, the winners usually sub contract some of the business to the other non-winning companies. These companies usually have better organizational capacity to receive cargo directly from ships in Djibouti and transport it into the destinations in the hinterland. Although the big trucking companies are mostly engaged in transporting goods from Djibouti to destinations inside Ethiopia, they also participate in the transportation of goods from region to region. However, the most important players in the transportation of goods domestically are the various transporters' associations that were formed by the individual truck owners. The associations seem to have geographical specialization, but
Ethiopia maize sector value chain analysis
Market assessment and baseline study for maize-Ethiopia 22
are free to transport goods to any direction in Ethiopia. Currently, there are about 40-50 transport associations with a truck fleet ranging from 50 to 200 trucks that are mostly old. Some of the most important associations are the following: • Eastern Ethiopia focused companies- "Misrak" (about 300 trucks with an average
loading capacity of 11-32 metric tons), "Berhan" (about 200 trucks with an average loading capacity of 11-32 metric tons)
• Southern Ethiopia focused companies- "Southern Association" and "Awash Transporters' association"- each having about 200 trucks and truck with trailers (average capacity 11-32 metric tons/truck)
• Northern Ethiopia focused companies- "Northern Transport", Ghion, Bir Wenz associations with more than 200 trucks each
• Western Ethiopia focused associations- "Mirab", "Hibret", "Gibe", "Brothers", etc.- each with about 300 trucks
The role of the private transporters' associations is to coordinate the transportation of goods including searching clients, return journey cargo, etc. They have sub branches in the major markets and they also send out their agents to smaller markets in search of cargo to be transported. They charge some 2%-5% of the transport cost as commission fee from the individual truck owners in order to finance the administrative cost of the associations. In order to avoid payment of higher commission fee, the private truckers report the standard rate (Birr/Quintal/Km), which is the rate that normally prevails during the slack season. According to the transporters associations interviewed, the transport rate varies from season to season. The peak transport season is normally November-February (for dogmatically produced goods) and March-May (for importation of fertilizer and transportation of food aid). The slack season is June-October. During the peak season the average transport rate is about Birr 0.045/Qt/km-Birr 0.050/Qt/km, and the slack season rate is Birr 0.030-0.035/Qt/km. Sometimes, when there is massive inflow of food aid as is the case during serious drought years, the rate can go up to Birr 0.070/Qt/km. As most of the trucks owned by the associations are old, their efficiency is lower compared to the large private and government owned trucks. In the long run, the replacement of these trucks is essential, but the replacement cost may be prohibitive. A truck and trailer with a loading capacity of 30-40 metric tons now costs about Birr 700,000-Birr 1,000,000 including the custom duty which is about 40% of the CIF value. The cargo transport service, unlike public transport, is not regulated. It operates on free market basis. There are no serious government regulations or taxes that hinder its operation. Transporters are required to have their trucks inspected annually at a minimum charge of about Birr 100. As most of the family owned truckers do not keep proper books of account, they annually pay small amounts as profit tax on the basis of the income they declare.
Ethiopia maize sector value chain analysis
Market assessment and baseline study for maize-Ethiopia 23
The main constraints of the sector include: • Low capacity utilization (less than 50%) during the slack season • Poor road maintenance • Low labour skill and poor fleet management • Aging of truck fleet and high maintenance cost • High purchase price of new trucks because of the devaluation of the local currency • High import duty for trucks According to the various studies conducted in the past, the following have been identified as the major constraints of the grain (including maize) marketing system in Ethiopia: (a) Transportation: Ethiopia has low road density compared to other African countries-
0.43 km/1000 km2 of land. It has some 3,665 km of asphalt road, 12,240 km of gravel, and 10,157 km of rural road. More than 75% of the farmers live more than a half-day walk from all-weather road. Transport cost normally accounts for about 66% of marketing cost of grain; and in some cases, transportation cost of maize from a surplus to a deficit area within Ethiopia can be about 200% of the value of the grain (Wolday, 2002).
(b) Inadequate market information: generally, smallholders and private grain traders have no information on prevailing grain prices, supplies, stocks, inter-regional grain flows in other markets and food aid arrivals. Market information to importers and exporters is also almost non-existent.
(c) Presence of too many unlicensed traders: although the law requires that a person should have a valid license to engage in grain trade, in reality there are too many people operating in the market without license. This has provided an un-level playing field in grain trading. As a result, the licensed traders have been forced to return their licenses and continue operating illegally at a reduced scale of operation (Gebremeskel, 1998).
(d) Inadequacy of storage facilities: the storage facilities owned by the different marketing actors, except EGTE, are generally inadequate in terms of capacity and quality. Storage losses due to the inadequacy and poor quality of storage facilities are enormous-about23-33% during a period of 6 months according to some studies (Legesse Dadi et al, 1992).
(e) Lack of access to credit facilities: is one of the most serious constraints for traders. Commercial banks normally require asset collateral such as buildings to extend credit to grain traders and access to inventory credit is totally lacking. Lack of working capital during the peak marketing season has thus been a constraint to the development of an efficient marketing system.
(f) Non-existence of research on grain marketing constraints and opportunities: currently, there is lack of institutional capacity to undertake research on the constraints and opportunities of the domestic and export market, identify the causes, design appropriate policies and advise policy makers to take necessary steps. Generally, marketing is not considered as an integral part of the country’s development process.
(g) Inadequate involvement of the private sector: although the private sector plays a dominant role in the marketing of cereals including maize, its involvement in policy formulation and monitoring is inadequate.
Ethiopia maize sector value chain analysis
Market assessment and baseline study for maize-Ethiopia 24
(h) Inadequate enforcement of contracts: because of the lengthy and expensive legal recourse of enforcing contract, the grain market has not been able to make transition from personalized to impersonal exchange. Most of the exchange is carried out on trust and reputation of the intermediaries.
(i) Lack of universally applicable and enforceable product standards: although the Quality and Standards Authority of Ethiopia (QSAE) has published quality standards for different commodities, transactions in the domestic market are based on visual inspection and assessment. Different organizations have different quality and standard requirements, making the system demand driven. The quality and standard requirements demanded by different agents are seldom related to the requirement of the international market.
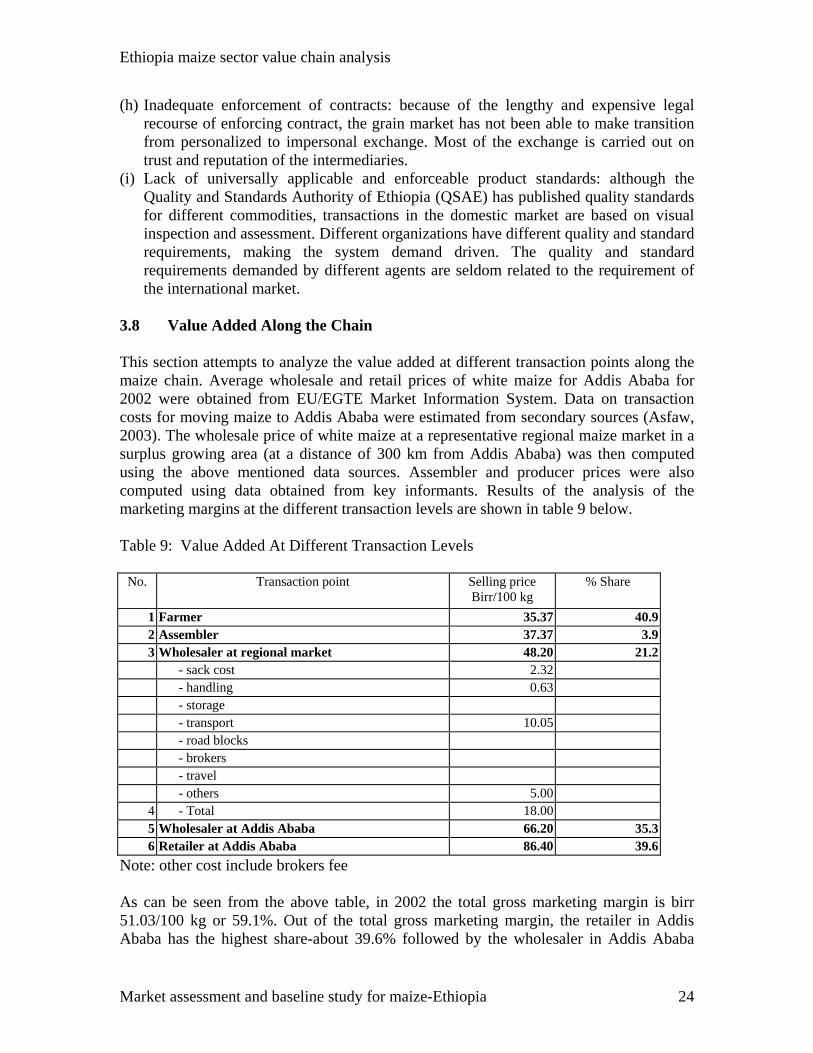
3.8 Value Added Along the Chain This section attempts to analyze the value added at different transaction points along the maize chain. Average wholesale and retail prices of white maize for Addis Ababa for 2002 were obtained from EU/EGTE Market Information System. Data on transaction costs for moving maize to Addis Ababa were estimated from secondary sources (Asfaw, 2003). The wholesale price of white maize at a representative regional maize market in a surplus growing area (at a distance of 300 km from Addis Ababa) was then computed using the above mentioned data sources. Assembler and producer prices were also computed using data obtained from key informants. Results of the analysis of the marketing margins at the different transaction levels are shown in table 9 below. Table 9: Value Added At Different Transaction Levels
No. Transaction point Selling price Birr/100 kg
% Share
1 Farmer 35.37 40.92 Assembler 37.37 3.93 Wholesaler at regional market 48.20 21.2 - sack cost 2.32 - handling 0.63 - storage - transport 10.05 - road blocks - brokers - travel - others 5.00
4 - Total 18.005 Wholesaler at Addis Ababa 66.20 35.36 Retailer at Addis Ababa 86.40 39.6
Note: other cost include brokers fee As can be seen from the above table, in 2002 the total gross marketing margin is birr 51.03/100 kg or 59.1%. Out of the total gross marketing margin, the retailer in Addis Ababa has the highest share-about 39.6% followed by the wholesaler in Addis Ababa
Ethiopia maize sector value chain analysis
Market assessment and baseline study for maize-Ethiopia 25
(35.3%). The market participants at the collection and assembly level get 25.1%, of which only 3.9% goes to the rural assembler. The share of the producer of the amount spent by the consumer is about 40.9%.
Ethiopia maize sector value chain analysis
Market assessment and baseline study for maize-Ethiopia 26
4.0 TRADE POLICY AND REGULATORY ENVIRONMENT 4.1 Trade Policy Reform and Export Promotion Since 1993, the Government of Ethiopia has taken a number of reform measures with the view to dismantling quantitative restrictions and reducing the level of tariff rates. At present, quantitative restrictions are applied only to a few commodities including used clothing, harmful drugs and firearms. Tariff levels have also been significantly reduced as part of the measures taken to stimulate export/import trade; for example, import duty rates (import duty receipts as percentage of CIF import value) in 2002 was almost half of the amount in 1980-12% in 2002 against 23% in 1980. According to the Customs Tariff Amendment No.5 based on the 2002 version of the harmonized system the import duty of selected products is as follows:
• Maize 5% • Pulses 10% • Lint cotton 10% • Wheat 5% • Wheat flour 10% • Oilseeds 5% • Edible oil 30% • Fabrics 35% • Cotton seed 5%
Importers are also required to pay 15% value added tax (VAT) based on the CIF value and import duty. Concerning export, all export duties except those for coffee were totally removed. Although there is not much commercial import of maize, the 15% VAT is considered by many merchants as a serious disincentive to trade in large volumes and a burden to poor consumers who spend a large portion of their income on cereals. Many regional merchants attempt to evade this tax by selling their maize supplies to those who do not request payment against receipts. As part of the trade reform, additional measures taken by the government include abolishment of state monopoly in coffee, pulses and oilseeds export and abolishment of the mandatory approval requirement for export contract by the National Bank of Ethiopia, introduction of foreign exchange retention schemes (10% of foreign exchange proceeds) by the private sector, introduction of import duty rebate scheme, and initiation of bonded warehouse schemes. Despite such measures, however, exporters have not yet realized benefits from these measures, because of administrative problems and lack of transparency of operational rules (Ethiopia: Trade and Transformation Challenges 2003). The Government of Ethiopia has also taken measures to attract foreign direct investment with the view to supplementing domestic savings and investment in various sectors,
Ethiopia maize sector value chain analysis
Market assessment and baseline study for maize-Ethiopia 27
enabling the transfer of technical and managerial know-how, and fostering market access to developed countries. In order to attract foreign direct investment, more sectors that were reserved for nationals have been opened for foreign participation, no performance goals/criteria were set; foreign investors have been exempted from custom duties and import tariffs for all capital equipment and up to 15% of spare parts. They have been exempted from export taxes and they are provided with tax holidays of up to 5 years, etc. Despite such measures, however, Ethiopia has only attracted an insignificant amount of foreign direct investment-0.74% of sub Saharan Africa. According to a recent report, only 59 (worth 3.8 billion birr) out of a total of 311 approved foreign direct investment projects that worth about 15.4 billion birr have become operational during the period 1992/93-2001/02. Even then, only few of the 59 projects focus on the export market. Those few projects that focus on export heavily depend on imported raw materials. In addition to the above-mentioned problems, Ethiopia’s trade facilitation, including customs, clearing and forwarding, insurance services as well as transport and communication is poor. The major constraints identified in this regard are the following:
• Lengthy and slow customs procedures that unnecessarily increase cost and delay transit shipments,
• Dominance of state enterprises in the business of shipping, clearing, forwarding and insurance that impedes competitive environment
• Shortage of telecommunications because of the monopoly of the Ethiopian Telecommunications Corporation
Ethiopia has institutions that oversee the development of the trade sector. The major institutions include the Ministry of Trade and Industry, the Ministry of Foreign Affairs, the Ethiopian Export Promotion Agency, and the Ethiopian Chamber of Commerce. These institutions are entrusted with the responsibility to design and implement trade policy and strategy and to provide support for the promotion and expansion of export trade. However, their effectiveness has been hampered by a number of factors including the following:
• Lack of trained manpower capable of formulating policies • Limited capacity to effectively negotiate trade agreements • Limited institutional capacity to provide market and trade information • Lack of coordination among the different actors • Lack of adequate mechanisms to supervise and monitor trade activities, and • Bureaucratic procedures followed by the institutions, etc.
Ethiopia maize sector value chain analysis
Market assessment and baseline study for maize-Ethiopia 28
4.2 Import/Export Procedures and Documentation The National Bank of Ethiopia has issued directives, titled “Directive to Transfer NBE’s Foreign Exchange Functions to Commercial Banks Directive No. FXD/07/1998”. According to this directive, commercial banks are authorized to allow imports and exports (except coffee) and provide associated services against submission of relevant documents. As regards import, commercial banks are authorized to approve imports of any value, but they have to ensure that values greater than or equal to US$ 1.0 million are done on international competitive bidding. Ethiopian importers are required to have a valid license to engage in import activities. Grain-including maize- is subject to this regulation, but unlike other commodities maize importers are not required to get pre-import permission fro concerned authorities. Other commodities such as pharmaceutical or veterinary medicines, medical supplies, forestry products, chemicals, etc., are subject to government control and importers of such commodities are required to get prior permission from appropriate government bodies. Maize imports can be made using Letter of Credit, cash against document at sight, advance payment, and through suppliers’ credit. For importation of goods (including maize) under L/C arrangement: three copies of proforma invoices showing full description of good (including quantity, grade, quality, volume, measurement, weight, mode of shipment, terms of payment, unit and total price of the good at a named place of delivery, photocopies of valid license, insurance certificate, and clearance certificate from NBE should be submitted to a commercial bank along with an application form. Importers who wish to import commodities on cash against document basis should submit to a commercial bank the following documents: • A purchase order, proforma invoice and valid trade license • A copy of local insurance certificate • An application form along with three copies of invoices approved by chamber of
commerce, two copies of certificate of origin, full sets of shipping documents, two copies of packing list, and clearance certificate from the NBE testifying the settlement of commitment.
The ceiling for importation by advance payment is US$ 5,000 and importers using this mechanism are required to submit a letter of undertaking along with the above mentioned documents. Import applications are valid for 120 days from the date of issue, and applications for import transit, import freight, and other charges are valid only during the month of issue. The NBE directive also authorizes commercial banks to allow export through Letter of Credit, advance payment, or consignment, and the banks are entrusted with the responsibility of ensuring that export proceeds are repatriated into the country. There is
Ethiopia maize sector value chain analysis
Market assessment and baseline study for maize-Ethiopia 29
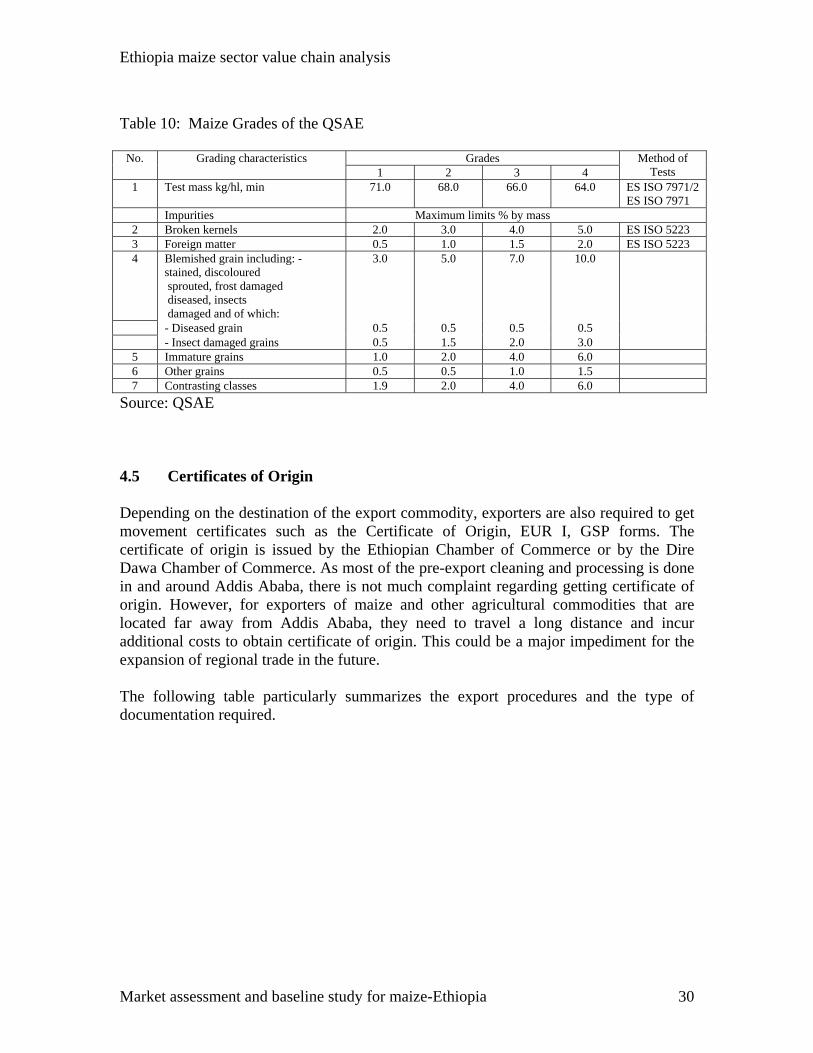
no restriction on the exportation of agricultural products except forestry products, wild animals and birds. For export under L/C mode of payment, the submission of the following documents is mandatory. These include: valid trade license, copy of authorized L/C, 5 copies of Customs declaration, 6 copies of Bank declarations, 2 copies of valid invoices and a copy of sales contract. Similarly, for exports under advance payment, the above-mentioned documents, except copy of L/C are required. For exports under consignment basis, these copies plus first class foreign bank guarantee is demanded by the commercial banks. Export application is also valid for 30 days from the date of issue and export transit, freight and other charges for the month of issue. Foreign exchange for export transit is provided by the commercial banks upon submission of the following documents: two copies of an application form, transit invoice, bill of lading (for C&F and CIF export), insurance policy (for CIF export), original sales contract, and a copy of commercial bank’s credit advice. Likewise, in order to get foreign exchange for export freight, the following documents have to be submitted along with two copies of an application letter: bill of lading, freight invoice, original sales contract, and a copy of commercial bank credit advice. For other charges, an application form, sales contract, invoice, as well as quality certificate, weight certificate, bill of lading are needed when necessary. 4.3 Phytosanitary Regulations Importers are required to have plant importation permit and phyto-sanitary certificate if they intend to import agricultural commodities including maize. To effectively control the sanitary and phyto-sanitary regulations (particularly to regulate noxious weeds and diseases as well as insect pests), the Ministry of Agriculture, Crop Protection and Production Technology and Regulatory Department has offices in some parts of Ethiopia, including Addis Ababa, Nazret, Dire Dawa, and Moyale. It is also making preparations to open new branches at Metama and Humera that are close to the Sudan border. Although most of the formal import of grain (both commercial and food aid) is through the Port of Djibouti, the Department has no branch at Djibouti. On the other hand, export of agricultural commodities including maize is subject to phyto-sanitary inspection to insure that it meets the specifications of the importer. 4.4 Quality and Safety Standards Although it is not mandatory for maize, quality testing and certification is also needed in order to ascertain that the commodity to be exported meets the specifications included in the contract. The Quality and Standards Authority of Ethiopia (QSAE) is authorized to issue export authorization certificate if the consignment meets the required specifications. The Grades and standards of the QSAE are shown in table 10 below.
Ethiopia maize sector value chain analysis
Market assessment and baseline study for maize-Ethiopia 30
Table 10: Maize Grades of the QSAE
No. Grading characteristics Grades Method of
Tests 1 2 3 4 1 Test mass kg/hl, min 71.0 68.0 66.0 64.0 ES ISO 7971/2
ES ISO 7971 Impurities Maximum limits % by mass
2 Broken kernels 2.0 3.0 4.0 5.0 ES ISO 5223 3 Foreign matter 0.5 1.0 1.5 2.0 ES ISO 5223 4 Blemished grain including: -
stained, discoloured sprouted, frost damaged diseased, insects damaged and of which:
3.0 5.0 7.0 10.0
- Diseased grain 0.5 0.5 0.5 0.5 - Insect damaged grains 0.5 1.5 2.0 3.0
5 Immature grains 1.0 2.0 4.0 6.0 6 Other grains 0.5 0.5 1.0 1.5 7 Contrasting classes 1.9 2.0 4.0 6.0
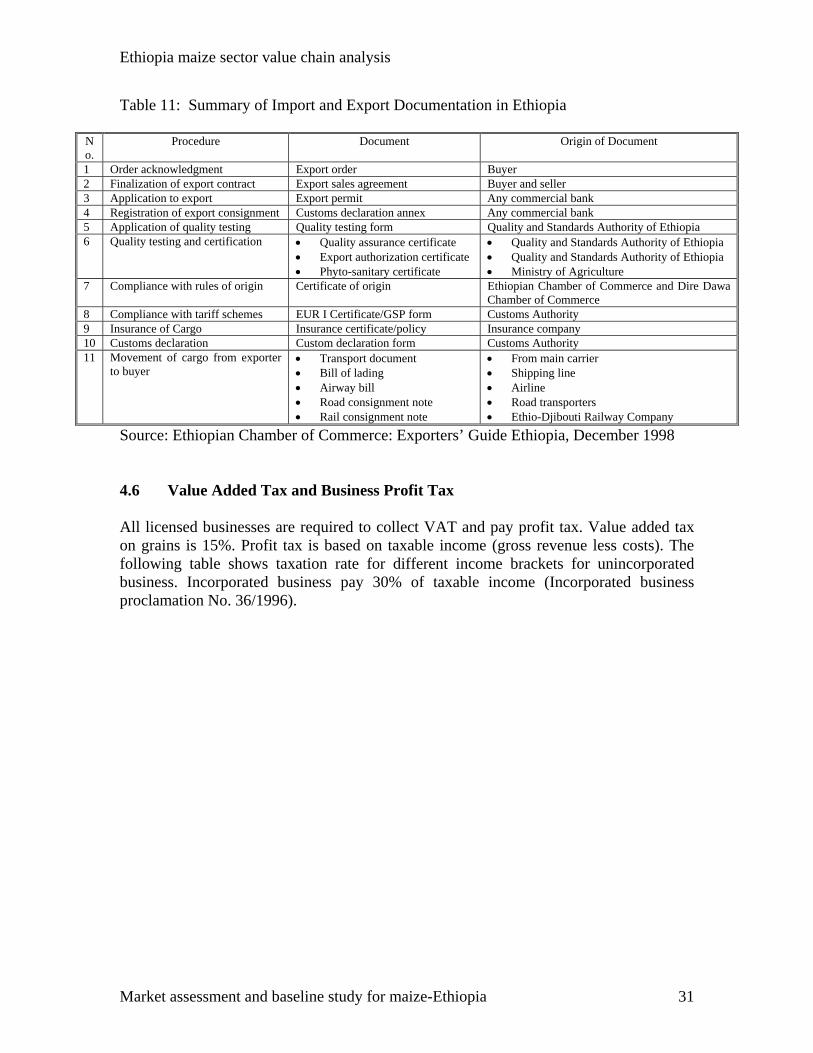
Source: QSAE 4.5 Certificates of Origin Depending on the destination of the export commodity, exporters are also required to get movement certificates such as the Certificate of Origin, EUR I, GSP forms. The certificate of origin is issued by the Ethiopian Chamber of Commerce or by the Dire Dawa Chamber of Commerce. As most of the pre-export cleaning and processing is done in and around Addis Ababa, there is not much complaint regarding getting certificate of origin. However, for exporters of maize and other agricultural commodities that are located far away from Addis Ababa, they need to travel a long distance and incur additional costs to obtain certificate of origin. This could be a major impediment for the expansion of regional trade in the future. The following table particularly summarizes the export procedures and the type of documentation required.
Ethiopia maize sector value chain analysis
Market assessment and baseline study for maize-Ethiopia 31
Table 11: Summary of Import and Export Documentation in Ethiopia
No.
Procedure Document Origin of Document
1 Order acknowledgment Export order Buyer 2 Finalization of export contract Export sales agreement Buyer and seller 3 Application to export Export permit Any commercial bank 4 Registration of export consignment Customs declaration annex Any commercial bank 5 Application of quality testing Quality testing form Quality and Standards Authority of Ethiopia 6 Quality testing and certification • Quality assurance certificate
• Export authorization certificate • Phyto-sanitary certificate
• Quality and Standards Authority of Ethiopia • Quality and Standards Authority of Ethiopia • Ministry of Agriculture
7 Compliance with rules of origin Certificate of origin Ethiopian Chamber of Commerce and Dire Dawa Chamber of Commerce
8 Compliance with tariff schemes EUR I Certificate/GSP form Customs Authority 9 Insurance of Cargo Insurance certificate/policy Insurance company 10 Customs declaration Custom declaration form Customs Authority 11 Movement of cargo from exporter
to buyer • Transport document • Bill of lading • Airway bill • Road consignment note • Rail consignment note
• From main carrier • Shipping line • Airline • Road transporters • Ethio-Djibouti Railway Company
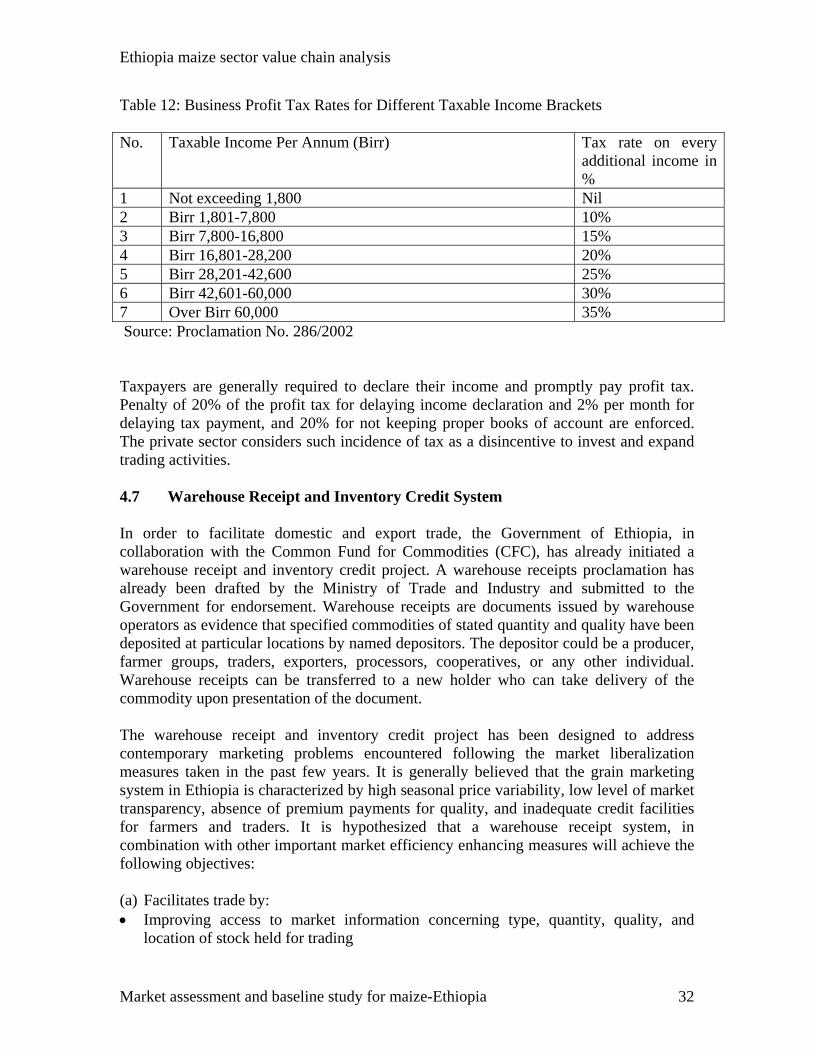
Source: Ethiopian Chamber of Commerce: Exporters’ Guide Ethiopia, December 1998 4.6 Value Added Tax and Business Profit Tax All licensed businesses are required to collect VAT and pay profit tax. Value added tax on grains is 15%. Profit tax is based on taxable income (gross revenue less costs). The following table shows taxation rate for different income brackets for unincorporated business. Incorporated business pay 30% of taxable income (Incorporated business proclamation No. 36/1996).
Ethiopia maize sector value chain analysis
Market assessment and baseline study for maize-Ethiopia 32
Table 12: Business Profit Tax Rates for Different Taxable Income Brackets No. Taxable Income Per Annum (Birr) Tax rate on every
additional income in %
1 Not exceeding 1,800 Nil 2 Birr 1,801-7,800 10% 3 Birr 7,800-16,800 15% 4 Birr 16,801-28,200 20% 5 Birr 28,201-42,600 25% 6 Birr 42,601-60,000 30% 7 Over Birr 60,000 35% Source: Proclamation No. 286/2002 Taxpayers are generally required to declare their income and promptly pay profit tax. Penalty of 20% of the profit tax for delaying income declaration and 2% per month for delaying tax payment, and 20% for not keeping proper books of account are enforced. The private sector considers such incidence of tax as a disincentive to invest and expand trading activities. 4.7 Warehouse Receipt and Inventory Credit System In order to facilitate domestic and export trade, the Government of Ethiopia, in collaboration with the Common Fund for Commodities (CFC), has already initiated a warehouse receipt and inventory credit project. A warehouse receipts proclamation has already been drafted by the Ministry of Trade and Industry and submitted to the Government for endorsement. Warehouse receipts are documents issued by warehouse operators as evidence that specified commodities of stated quantity and quality have been deposited at particular locations by named depositors. The depositor could be a producer, farmer groups, traders, exporters, processors, cooperatives, or any other individual. Warehouse receipts can be transferred to a new holder who can take delivery of the commodity upon presentation of the document. The warehouse receipt and inventory credit project has been designed to address contemporary marketing problems encountered following the market liberalization measures taken in the past few years. It is generally believed that the grain marketing system in Ethiopia is characterized by high seasonal price variability, low level of market transparency, absence of premium payments for quality, and inadequate credit facilities for farmers and traders. It is hypothesized that a warehouse receipt system, in combination with other important market efficiency enhancing measures will achieve the following objectives:
(a) Facilitates trade by: • Improving access to market information concerning type, quantity, quality, and
location of stock held for trading
Ethiopia maize sector value chain analysis
Market assessment and baseline study for maize-Ethiopia 33
• Reducing marketing costs incurred by counter-parties • Building up confidence of trading parties regarding the quantity and quality of stock
traded
(b) Enhances market efficiency by: • Shortening the length of the marketing chain and transaction costs to producers • Reducing post-harvest losses due to poor storage facilities and management • Reducing seasonal price variability and marketing margins to the advantage of
producers and consumers • Enabling producers to defer crop sale until they obtain incentive prices
(c) Eases access to rural finance by:
• Helping the development of a sustainable and efficient credit system • Boosting up the confidence of lenders regarding the security of the inventory
against which they extend loans • Cutting down the cost of supervising and managing loans and reducing loan
delinquency
(d) Mitigates price risks by: • Enabling producers, traders, and lenders secure floor prices by locking in a fixed
future prices • Laying the ground for the development of commodity exchange market
(e) Reduces cost of managing public food reserves by: • Allowing government to base its procurement decisions on more reliable market
data • Transferring the responsibility of holding large stocks at low cost to the private
sector
According to the document obtained from the Ministry of Trade and Industry, there would be three key players in the system, namely: (a) An effective regulatory body that licenses warehouse operators and oversees their
performance. This regulatory body will be composed of the different stakeholders notably the commercial banks and insurance companies as well as governmental organizations and the private sector.
(b) Warehouse operators-public, cooperative as well as traders who wish to participate as
third party stock custodians and are authorized to give warehouse receipt. These players will be screened using stringent licensing criteria including ownership of appropriate storage facilities, adequate insurance coverage for facilities and commodities in store, financial strength and technical competence to undertake warehousing operation.
Ethiopia maize sector value chain analysis
Market assessment and baseline study for maize-Ethiopia 34
(c) Depositors-those who deposit grain with warehouse operators and receive warehouse receipt. Depositors have the option either to transfer the warehouse receipt to a bank and obtain loan against it or transfer it to a prospective buyer.
Initially, the project would focus on few selected crops such as maize, wheat, sorghum, pulses and oil crops, but gradually it would encompass a variety of crops targeted for both the domestic and export markets. If this project is implemented, a large inventory of exportable maize that meets acceptable quality standards can be easily obtained when needed by other importing countries. 4.8 Business Licensing In Ethiopia, commercial registration and business licensing is carried out based on Proclamation No. 67/1997- titled "Commercial Registration and Business Licensing Proclamation". This proclamation came into effect in March 1997 and its objective is to improve business-licensing procedures so as to create conducive business environment and promote free market (Gebremeskel 2001). According to this proclamation, all business licenses (including maize trade) except those for prospecting and mining, banking and insurance services, as well as trade in tobacco products, are issued by the Ministry of Trade and Industry or by the regional Trade and Industry Bureaus. Business license is acquired by submitting an application form that has been prepared by the MOTI for this purpose. However, commercial activities that require specific professional qualification are requested to produce evidence of competence to engage in such activities from an appropriate sectoral ministry. Requirements for export trade license are also simple-application in two copies, principal registration certificate, and passport size photograph. A minimum amount of birr 25 is charged to issue any business license. Although there is no restriction on the type of commodities a business should engage in, it is prohibited to engage in trade activities outside those mentioned in the license. If traders want to diversify their business, they have to submit a formal request for including other commodities to the licensing authority. All license holders are required to renew their business licenses every year and are obliged to pay license renewal charges and business profit tax. Proclamation No. 227/2001 also requires businesses to obtain TIN (Tax Identification Number) from the tax authority in order to renew their licenses. In general, licensing procedures are simple and fast and licensing and renewal fees are minimal.
Ethiopia maize sector value chain analysis
Market assessment and baseline study for maize-Ethiopia 35
5.0 CONCLUSION AND RECOMMENDATION 5.1 Conclusions The potential to increase maize production in Ethiopia is enormous. Studies show that production of maize can be doubled using existing technologies such as improved maize seed varieties, fertilizers and improved cultural practices. Effective domestic demand for maize, however, is limited. Domestic maize consumption is confined to traditional food and beverages and there are no agro-industries that diversify and enhance the utilization of maize. Thus, increasing maize production and market supply without expanding agro-processing and linking the domestic maize market with the international and regional markets is difficult. The main constraint in the Ethiopian maize marketing system is the high level of risks to trading and the associated market thinness. As there are no mechanisms for market stabilization, through either export promotion or commercial buffer stocking, maize prices are highly volatile, making the business very risky. Risk and market thinness are closely related as market thinness exacerbates risk and limits the volume of stockholding and trade, in turn contributing to market thinness. Apart from the thinness of the domestic maize market, there are a range of factors that constrain the efficient functioning of the maize marketing system, including, high marketing costs, transport and communication infrastructure constraints, limited contract enforcement, lack of clearly defined and market wide product standards, poor market information, limited access to credit, lack of access to land and storage facilities, lack of skills on external trade, bureaucratic and costly import/export procedures, lack of incentive to expand domestic and external trade activities, lack of institutional support, etc. In short, the present principal constraint of the Ethiopian maize marketing system is its market thinness which is fundamentally structural in nature-low domestic effective demand, absence of diversified and enhanced utilization of maize through agro-processing and poor link to the regional/international markets. 5.2 Recommendations The following measures should be taken to address the most crucial structural problems observed in the maize marketing system. • Expanding local food aid purchases and engaging in substantial triangular food aid
shipments in collaboration with donors. This would help stabilize the maize market and provide incentive to maize producers and enhance production growth.
• Encouragement of larger traders, including foreign firms, to enter the market, because the present system is characterized by small scale traders who lack the resources and skills to trade in substantial volumes in the domestic and international/regional markets.
Ethiopia maize sector value chain analysis
Market assessment and baseline study for maize-Ethiopia 36
• Providing incentive to the private sector to engage in large-scale agro-processing and storage and handling by easing access to rural and urban land.
• Designing and implementation a viable warehouse receipts and inventory credit system in consultation with the different stakeholders, that is, banks, insurance companies, farmers, traders, brokers, cooperatives, chambers of commerce, and different associations. In addition to enhancing the development of a modern marketing system, a warehouse receipts and inventory credit system will also contribute towards alleviating the thinness of the market, improve quality and standards, improve the management of large volumes of maize stocks, reduce quantitative and qualitative loses, provide market information on the volume, location, and prices of stocks, etc. Thus, the Government has to take immediate measures to implement the project it has already initiated.
• Improving access to local and international market Information through the establishment of a collaborative regional market information systems
• Upgrading the management skills of traders so that they could effectively participate in the domestic and regional/international market
• Creating effective institutions that provide services for the promotion of regional/international trading activities
• Recognizing and encouraging the present unofficial cross border trade taking place in the pastoralist areas
• Reducing transaction costs through road improvement, expansion of telecommunication services
• Improving market infrastructure in urban and rural markets with the view to improving market transparency and food hygiene.
Ethiopia maize sector value chain analysis
Market assessment and baseline study for maize-Ethiopia 37
References
• Asfaw Negassa (2003). The Effects of Marketing Policy Changes on Spatial Grain Market Efficiency: Extension to the Parity Bounds Model and an Application to Ethiopia. A Paper presented at the Harnessing Markets for Agricultural Growth in Ethiopia.
• Bellmon Monetization Study (2003). Draft Report prepared by Agridev Consult.
• Central Statistical Authority. 1997/98-2001/02. Agricultural Sample Surveys for
Main and Small Rain Seasons.
• Central Statistical Authority. 1997/98-2001/02. External Merchandize Trade Statistical Bulletins.
• CIMMYT. 1999/2000 World Maize Facts and Trends. Meeting World Maize
Needs: Technological Opportunities and Priorities for the Public Sector.
• Coulter, Jonathan and Gebremeskel Dessalegn. 2002. Using Warehouse Receipts to Develop Ethiopia’s Agricultural Marketing System.
• Ethiopia: Trade and Transformation Challenges (2003). Summary and
Recommendations Diagnostic Trade Integration Study, Addis Ababa.
• Emerging Market Economics Ltd (2001). Food Marketing Study (Draft).
• Ethiopian Chamber of Commerce (1998). Exporters’ Guide Ethiopia.
• Gebremeskel Dessalegn, T.S Jayne, and J.D Shaffer (1998). Market Structure, Conduct and Performance: Constraints on Performance of Ethiopia Grain Markets. Grain Market Research Project (GMRP), MEDaC, Working Paper 8, Addis Ababa.
• Gebremeskel Dessalegn (2001). Notes on Grain Business Licensing and
Transportation: A short note submitted to the World Bank Market Study Team, Addis Ababa.
• Little, Peter D., Tegegne Teka, and Alemayehu Azeze (2001). Cross-Border
Livestock Trade and Food Security in the Horn of Africa: An Overview.
• Mosisa Worku, Hadji Tuna, Mandefro Nigussie and Abera Deressa. 2001. Maize Production Trends and Research in Ethiopia.
• National Bank of Ethiopia. Directive No. FXD/07/1998: To Transfer NBE’s
Foreign Exchange Functions to Commercial Banks.
Ethiopia maize sector value chain analysis
Market assessment and baseline study for maize-Ethiopia 38
• Wolday Amha (1997). Maize Price Stabilization in Ethiopia: The Export Option
in East Africa. A Paper presented in the Workshop on Regional Cooperation and Trade in the Greater Horn of Africa, Feb 17-19 1997, Nairobi, Kenya.
• Wolday Amha (2002). The Structure and Functioning of the Post PADET’s Grain
Marketing System in Ethiopia. A Paper Submitted to a Workshop Organized by Ethiopian Development Research Institute (EDRI, Addis Ababa.
• World Bank. Working Paper on the Major Components of Rural Development in
Ethiopia