Biogeochemical plant site conditions in stream valleys after winter flooding: a phytometer approach

Farmer Management ofMaize Diversity in the
Central Valleys of Oaxaca, Mexico:CIMMYT/INIFAP
1998 Baseline Socioeconomic Survey
Melinda Smale, Alfonso Aguirre, Mauricio Bellon,Jorge Mendoza, and Irma Manuel Rosas
E C O N O M I C S
Working Paper 99-09

* Melinda Smale is an Economist and Mauricio Bellon is a Human Ecologist with the International Maize andWheat Improvement Center (CIMMYT). Alfonso Aguirre is a Senior Scientist with the Instituto Nacional deInvestigaciones Forestales y Agropecuarias (INIFAP), Mexico. Jorge Mendoza and Irma Manuel Rosas are fieldsupervisors with the project. This baseline survey is part of the project "Maize Diversity Management andUtilization: A Farmer-Scientist Collaborative Approach Project." The project is supported by the InternationalDevelopment Research Centre (IDRC), Canada, and implemented by CIMMYT and INIFAP. The views expressedin this paper are the authors’ and do not necessarily reflect policies in their respective organizations.
Farmer Management ofMaize Diversity in the
Central Valleys of Oaxaca, Mexico:CIMMYT/INIFAP
1998 Baseline Socioeconomic Survey
Melinda Smale, Alfonso Aguirre, Mauricio Bellon,Jorge Mendoza, and Irma Manuel Rosas*
E C O N O M I C S
Working Paper 99-09
CIMMYT (www.cimmyt.mx or www.cimmyt.cgiar.org) is an internationally funded, nonprofitscientific research and training organization. Headquartered in Mexico, the Center works withagricultural research institutions worldwide to improve the productivity, profitability, andsustainability of maize and wheat systems for poor farmers in developing countries. It is one of 16similar centers supported by the Consultative Group on International Agricultural Research(CGIAR). The CGIAR comprises over 55 partner countries, international and regional organizations,and private foundations. It is co-sponsored by the Food and Agriculture Organization (FAO) of theUnited Nations, the International Bank for Reconstruction and Development (World Bank), theUnited Nations Development Programme (UNDP), and the United Nations EnvironmentProgramme (UNEP). Financial support for CIMMYT’s research agenda also comes from many othersources, including foundations, development banks, and public and private agencies.
CIMMYT supports Future Harvest, a public awareness campaign that buildsunderstanding about the importance of agricultural issues and internationalagricultural research. Future Harvest links respected research institutions,
influential public figures, and leading agricultural scientists to underscore the wider social benefitsof improved agriculture, peace, prosperity, environmental renewal, health, and the alleviation ofhuman suffering (www.futureharvest.org).
International Maize and Wheat Improvement Center (CIMMYT) 1999. Responsibility for thispublication rests solely with CIMMYT. The designations employed in the presentation of material inthis publication do not imply the expressions of any opinion whatsoever on the part of CIMMYT orcontributory organizations concerning the legal status of any country, territory, city, or area, or of itsauthorities, or concerning the delimitation of its frontiers or boundaries.
Responsibility for this publication rests solely with CIMMYT.Printed in Mexico.
Correct citation: Longmire, J., and A. Moldashev. 1999. Farmer Management of Maize Diversity inthe Central Valleys of Oaxaca, Mexico. CIMMYT Economics Working Paper 99-09. Mexico D.F.:CIMMYT.
ISSN: 0258-8587AGROVOC descriptors: Oaxaca; Mexico; Maize; Zea mays; Varieties; Biodiversity; Plantproduction; Crop management; Cropping patterns; Innovation adoption; Small farms; On farmresearch; Production economics; Socioeconomic environment; Farm surveys; Research projectsAdditional keywords: CIMMYT; INIFAPAGRIS category codes: E10 Agricultural Economics and Policies
E14 Development Economics and PoliciesDewey decimal classification: 338.16
Contents
Page
iv Team Membersv Summary and Implications for Further Work
1 Introduction
2 Methods2 Site Selection3 Selection of Households4 Survey Content4 Survey Implementation4 Key Definitions
5 Farm, Farmer, and Household Characteristics5 Education, Language, and Experience7 Sources of Income8 Farm Production9 Subjective Yield Estimates and Subsistence Ratios
13 Farmer Management of Maize Diversity13 Variety Choice16 Seed Selection and Storage Practices
19 Measures of Diversity at the Farm and Community Levels
21 Demand for and Supply of Characteristics
25 References

iv
Team Members
Field supervisors Ing Jorge MendozaIng Irma Manuel Rosas
Technicians who Ing Donato Mauricio Bolaños G.interviewed farmers Ing Adriana Zapata R.
Ing Rafael Martinez M.Ing Ana María SolanoIng Candelario Chong V.Ing Rafaella Felix BautistaIng Juan Javier Arellano AmayaIng Leonor Morales BarrosoIng Jose Raúl Cuevas CastellanosIng Hidralba López NevaresIng Cuauhtemoc Cruz NiñoSra Palmira Matías Martínez
Data entry and management Brigida Nuñez Pequeño
Principal investigators Alfonso AguirreMauricio BellonMelinda Smale

Summary and Implications for Further Work
Descriptive data from the sample survey of households in the study communities enable us toprofile the characteristics of: (1) farm households; (2) the maize populations they grow, based ontheir own descriptors and the perceptions of both men (production decision-makers) and women(consumption decision-makers);1 and (3) farmers’ seed selection and management practices.
Farm households♦ Households average between 4 and 6 members, and the mean age for production decision-
makers is about 50 years. All production and consumption decision-makers are Spanish-speaking. Indigenous languages are used more in Mazaltepec and Santa Ana.
♦ By some indicators of wealth (television, refrigerator, electricity, gas stoves), from a globalperspective, survey households are not poor.
♦ Huitzo depends more on local nonfarm income than other survey sites; Huitzo and Valdefloresdepend less on local agricultural production; Huitzo and Mazaltepec depend less on remittances.In San Lorenzo, Santa Ana, Valdeflores, and Amatengo, at least one-fourth of householdsreported that remittances are an important source of income.
♦ All sites except Huitzo reported average per capita maize requirements higher than the nationalmean. The average farm household in the survey communities is a net seller in some years and anet consumer in others. The market for maize appears to be local.
♦ The average farm size in 1996 was 3.5 ha with 3 ha of maize. The mean number of soil types perfarm, as well as the extent of land fragmentation, was lower in Huitzo and Amatengo.Fragmentation seems to be highest in Santa Ana and Valdeflores. Tenure arrangements contrastsharply between communities.
Maize populations♦ Maize populations grown by farm households have been classified based on farmer taxonomy
into 5 classes of Blanco (white-grained) maize, 3 classes of Amarillo (yellow-grained) maize, 1Negro (black or purple-grained) maize, 1 Belatove (pinkish-grained) maize, 1 Pinto (grain ofmixed color), 1 Mejorado (improved) class and a Tepecentle variety. Tepecentle is a distinctmaize race, and all other classes are found within the Bolita racial complex.
♦ Blanco types occupy over 80% of the area and representing two-thirds of the seed lots planted in1997. Improved maize was grown almost exclusively in Huitzo, which has the most irrigatedland. Even in Huitzo, it occupied only 7% of the area in the survey year.
♦ Subjective yield distributions suggest that: (1) improved maize dominates local types; (2) Blancotypes dominate colored-grain types; and (3) consumption partners (women) are significantlymore pessimistic than production partners (men). The yield distributions of Santa Ana aresignificantly different from those of Huitzo, Mazaltepec, and Amatengo.
♦ Farmers in the survey communities grow maize primarily for food or feed rather than grain sales,and they are interested in many characteristics in addition to yield. While they rate improvedmaize well in terms of grain yield and fodder, they rank it as a poor supplier relative to localvarieties. Among the local varieties, Blanco types were rated superior to colored-grain types withrespect to grain yield per hectare, suitability for sale and most consumption characteristics.Amarillo was highly rated for tlayudas, feed, and fodder, and Negro and Belatove have shortergrowing seasons.
v
1 See Methods section for definition of terms.

♦ Although men and women rank the importance of characteristics differently, four of the top fivecharacteristics are the same for both sexes: (1) drought tolerance; (2) resistance to insects instorage; (3) produces “something” even in bad years; and (4) grain weight. Men added grainyield per hectare and women added the taste of tortillas to the set of most importantcharacteristics.
Seed management♦ Farmers know their varieties—they have grown them for an average of over 20 years. The
concept of “own seed” is ambiguous, however, since a large proportion of farmers also combineand replace seed lots (see definition of terms in Methods section). The highest propensity to give,exchange, combine, or replace seed was found in Santa Ana, although these practices were alsoobserved in San Lorenzo and Amatengo. Exchange is primarily local.
♦ As has been found elsewhere in Mexico, the seed selection criteria used by farmers are thoserelated to grain and ear health, grain size, grain filling, and ear size. Less than half of surveyfarmers reported that they separated food or feed grain from seed at harvest time. The mostfrequent form of selection is the continual separation of good ears from those removed every fewdays for preparation of nixtamal. Perceptions differ between men and women regardingresponsibilities for seed management and selection, but women’s role is likely to be substantial inthis separation activity.
♦ There is evidence that farmers are exerting strong indirect selection pressure for resistance toinsect damage in storage, but no direct pressure on husk cover. Husk cover is important as a“first-line defense.”
Maize diversity♦ Farm-level diversity appears to be greatest in Santa Ana and San Lorenzo and least in Amatengo
and Valdeflores, as measured by numbers of varieties per farm and by a Simpson index based onarea shares.
♦ Community-level diversity bears no direct relationship to farm-level diversity because ofdifferences in the scale of measurement. Diversity remains high at the community level in SanLorenzo and is relatively low in Santa Ana.
♦ There is no strong evidence that farmers in these communities recognize a loss of maizepopulations during the past two decades.
Implications for further workSome implications for further work can be drawn from the descriptive data. The multivariateanalyses that follow this baseline summary should provide additional insights.
♦ Given that markets are local, most households both consume and sell maize, and that a smallproportion of the maize they produce passes through the market, enhancing characteristics basedon current market valuation is not likely to affect farmer welfare appreciably. A formal hedonicstudy is probably not warranted.
♦ Like studies elsewhere in Mexico (Perales et al. 1998), this study confirms that in maizeproduction farmers are not motivated strictly by yield per hectare or profitability but by anumber of concerns. In the Central Valleys of Oaxaca, these include consumption-relatedcharacteristics. This does not imply that grain yield per hectare does not matter, but that(1) “yield” has many components on-farm (grain weight; post-harvest production; the lower tailof the yield distribution; drought tolerance), and (2) farmer welfare can be improved by
vi

enhancing other characteristics. The large yield gap between farmers’ expected yields andpotential yields further suggests that addressing agronomic or other constraints may be moreeffective in improving on-farm yields than breeding. Other characteristics may be easier to improvethan grain yield per hectare under farmers’ conditions through participatory breeding techniques, and theymay also contribute to farmer welfare. Appropriate interventions may include development of and trainingin techniques designed to improve storability or agronomic practices.
♦ Farmers rate their own varieties fairly low with respect to several of the agronomic characteristicsthey identify as most important, suggesting that their seed selection practices are not as effectiveas they would want them to be for these traits. They rate them high for consumptioncharacteristics, suggesting that their selection practices for these traits are adequate to meet theirneeds. In other words, the tools of professional breeders and farmer-breeders may be complementary.
♦ While there are differences between men and women in the relative importance of certain maizecharacteristics, they agree on those that are most important. There are no obvious gender implicationsassociated with addressing any one the major characteristics identified by survey farmers through breedingor or other strategies.
♦ There may be a means through simple management methods to increase farmers’ selectionpressures for resistance to insects in storage, including emphasis on husk cover. The effects of directselection, for husk cover need to be tested more fully.
♦ There are likely to be strong gender implications related to the strategies designed to enhanceseed selection and management practices. Women who make decisions regarding seed management,selection, and storage must participate actively in any experiments or tests.
♦ The propensity to exchange, combine, and replace seed lots for the same variety has implicationsfor intra-varietal genetic diversity and for the genetic gains that can be achieved throughimproved methods of mass selection, which depend on retaining seed from the harvest oversuccessive seasons. Additional, focused research is required to understand farmers’ seed managementpractices and their effects on genetic diversity.
♦ Farmers are most likely to continue growing the Blanco types because these maize varietiessupply more of the characteristics they demand than other local classes of maize. This impliesthat encouraging farmers to maintain the Blanco types would cost less in terms of additionaleconomic incentives. There appears to be more than a difference in grain color between Blancoand the other local classes of maize, however. Grain color may “mark” other traits that aresignificant for maintaining diversity in the region. More genetic work is necessary to identifypopulations within and among the classes identified by farmers that are key from a genetic diversitystandpoint as well as a crop improvement perspective.
vii

1
Farmer Management of Maize Diversity in theCentral Valleys of Oaxaca, Mexico:
CIMMYT/INIFAP1998 Baseline Socioeconomic Survey
Melinda Smale, Alfonso Aguirre, Mauricio Bellon,Jorge Mendoza, and Irma Manuel Rosas
Introduction
The varietal and genetic diversity maintained by maize farmers in the Central Valleys of thestate of Oaxaca reflects the way they have managed their landraces for thousands of years.Some of the economic and environmental changes now faced by these farmers, however, maymake growing landraces and managing them as they have in the past less attractive. Becausefarmers have their own immediate concerns, the maize populations they choose to grow arenot necessarily those considered most desirable for the conservation of genetic diversity.
The major underlying assumption in the project initiated by Mexico's Instituto Nacional deInvestigaciones Forestales y Agropecuarias (INIFAP) and CIMMYT and funded by Canada'sInternational Development Research Centre (IDRC) is that the maintenance of key maizelandrace populations and the management practices that shape them are crucial forconserving maize diversity. Maize diversity serves farmers and consumers because itprovides the basis for farmer improvement of varieties as well as improvement byprofessional plant breeding programs, both today and in the future.
On-farm conservation poses serious challenges unless the productivity or quality of themaize produced can be improved without eroding genetic diversity. The goal of this pilotstudy is to determine whether it is possible to identify collaborative plant breeding strategiesthat improve maize productivity whilemaintaining or enhancing genetic diversity.By “collaboration” we refer to a range ofactivities with differing levels ofinvolvement by farmers and professionalplant breeders. We define maize productivitybroadly in terms of yield, stability, or othercharacteristics of interest to farmers. If maizediversity as well as productivity can beenhanced, both the individual welfare offarmers and social welfare will increase. Thiscentral idea is summarized using micro-economic concepts in Figure 1, and theconceptual basis of the project is exploredmore fully in Bellon and Smale (1998).
Figure 1. Social utility and aggregate productiontransformation curve for maize outputs and diversity.Note:Maize output may represent a bundle of attributes rather than
grain yield per hectare. Product transformation curve is for a fixedarea allocated among varieties by farmers in a reference region.
Y= maizeoutput
U(Z,y)Productivity perspective
Unambiguous welfare improvement
Conservationistperspective
Z = genetic diversity

2
To implement the project we need to: (1) identify the crop populations that should beconserved; (2) identify the types of farmers that are more likely to conserve them;(3) identify the participatory plant breeding (PPB) strategy to improve the croppopulations. Addressing the first issue involves identifying the crop populations andcharacteristics with the most potential for genetic gains, the greatest importance tofarmers, and which contribute the most to genetic diversity.
In the initial phase of the project we have conducted research that addresses the first twoquestions. Research consisted of four activities. The first, led by the INIFAP and CIMMYTmaize breeders, included the collection, evaluation, and characterization of maizepopulations from 15 communities in the Central Valleys of Oaxaca. Farmers’ preferencesconcerning these populations were elicited and related to key socioeconomiccharacteristics of the farmers (Bellon et al. 1998). The second effort, led by INIFAP andCIMMYT social scientists, involved a stratified random sample survey of maize-growinghouseholds in 6 of the 15 communities. The third, also implemented by the socialscientists, was a detailed monitoring survey of the seed stock management practices of 24households in the 6 communities (Mendoza, forthcoming). The fourth effort is a series offocus group discussions with male and female farmers in the six communities. Thepurpose of these discussions is to elicit the “rules of thumb” they use in variety choice andplanting decisions, as well as their knowledge and perceptions of their own capacity tomodify maize populations through management practices such as seed selection.
This report presents the descriptive data from the sample survey of households in thestudy communities. The data enable us to profile the characteristics of (1) farmhouseholds; (2) the maize populations they grow, based on their own descriptors and theperceptions of both farm men and farmer women; and (3) their seed selection andmanagement practices. We employ the morpho-phenological characteristics farmers useto classify their varieties to construct Simpson indices of maize diversity at the farm andcommunity level. These indices will be supplemented later by genetic data based on seedsamples drawn from the maize populations of a smaller number of farmers. Since littlemaize is sold by survey households, hedonic pricing methods provide limitedinformation regarding the economic valuation of traits. As proxies for the demand andsupply of characteristics, we use farmers’ assessments of the importance of characteristicsand the extent to which their maize populations provide them. Combined with the resultsof the other research efforts of the initial phase, these data provide a statistical baseline forthe project.
Methods
Site SelectionThe region known as the Central Valleys of Oaxaca was chosen for this pilot projectbecause of: (1) the importance of the major maize race grown in the region (the “Bolitacomplex”; (2) the negligible impact of modern varieties in the zone; (3) the ethnic diversityand agroecological heterogeneity in the zone; and (4), despite the economic importance of

3
labor migration to the local economy, the recognizable emphasis placed by thesecommunities on certain cultural traditions, including culinary practices for maize.Although the Bolita complex has served as the basis of several maize breeding programs inother parts of the country (Ortega-Pazcka 1995), its collection and study in this region hasnot been extensive.
In 1997-98, maize breeders on the project collected, evaluated, and characterized 170samples of maize landraces in 15 communities of the Central Valleys of Oaxaca. All of thecommunities where they collected are located between 1,310 and 1,839 masl. The principalcriteria in site selection were the variation in maize populations and the range of uses byfarm families, known from past work in the region.
In order to select fewer communities among the sites for more detailed socioeconomicstudy and diagnostic work, data from INEGI (Instituto Nacional de Estadística, Geografía,e Informática, 1996) were consulted and local authorities were interviewed regarding thegeneral socioeconomic features of each community. Local authorities provided their ownestimates of the number of households, major sources of income in the community, supplyof infrastructure and transportation, and types of markets. Little variation was apparent indistance to markets or basic physical infrastructure. More pronounced differences wereapparent in the extent of reliance on nonfarm income and income from migrants. Thisinformation was combined with data on ethnicity (INEGI) and on maize yield potentialderived from previous work by INIFAP. Six communities representing contrasts in thesevariables were selected from the 15, as shown in Figure 2. The horizontal axis representsdecreasing dependence on nonlocal sources of income as compared to local agricultural ornonfarm income, including remittances from within and outside Mexico. The vertical axisrepresents location in zones of increasing maize yield potential.
Selection of HouseholdsA stratified random sample of 240 farmhouseholds was drawn with a list frame.A subsample size of 40 was considered theminimum necessary for analysis within eachcommunity, or stratum. Lists were revisedwith the assistance of communityauthorities, excluding producers no longercultivating, or respondents too old,handicapped, or sick to participate ininterviews. Missing or excluded householdswere replaced in a few cases by samplingfrom the remaining list of active producers.The sampling fraction varies by community(from 9% to 27%) and statistics that areaggregated across strata are weighted by theinverse probability of selection (Table 1).
Good
Bad
Mai
ze p
rodu
ctio
n po
tent
ial
Valdeflores
Amatengo
San Lorenzo
AlbarradasHuitzo
Santa Ana Zegache*
Sto. Tomas Mazaltepec
* >30 % indigenous population.
Figure 2. Conceptual representation of survey sites bysource of income, ethicity, and maize yield potential.Sources: INEGI, INIFAP, CIMMYT/INIFAP comunity diagnostic survey.
Increasing dependence on local vs. nonlocal sources of income

4
Survey ContentIn each household, a questionnaire was administered to both the individual who takesprimary responsibility for maize production decision-making (PDM) and the householdmember who assumes primary responsibility for making decisions related to maizeconsumption (CDM). (Definitions are provided at the end of this section, and thequestionnaire in Spanish is available from the authors.) In almost all cases, the PDM andCDM are husband and wife. The PDM questionnaire consists of 8 parts, covering generalhousehold characteristics, taxonomy of maize types grown in 1997, seed sources,production details by maize plot, seed selection and storage, importance of maizecharacteristics and rating of varieties, and perceptions of losses in maize varieties. Of thesetopics, the CDM questionnaire excludes plot details.
Survey ImplementationThe survey was conducted in April-June of 1998, including training and call-backs. A briefpre-test of the questionnaire was conducted by supervisors. Enumerators were trained for 3days including a field test in Santa María Coyotepec.
Production and consumption decision-makers were interviewed separately by teams of onemale and one female maize technician. The survey was implemented with the endorsementof community authorities, who intervened when respondents needed clarificationregarding the purpose of the interviews. Enumerators were supported by three supervisorsand conducted an average of 2 household interviews (4 questionnaires) per day.
While reviewing the data in June, supervisors noted some confusion over the concepts inthe section on seed sources. Few enumerators had used the cards designed to assist them ineliciting the importance of maize characteristics from farmers. During that month, teamsrevisited households and repeated the sections about seed sources and varietycharacteristics. Additional details on seed storage were also collected at that time.
Written questionnaires were edited manually by supervisors and by computer, using aprogram written to test ranges and consistency using SPSS. Supervisors developedclassification systems for maize populations and soil types based on farmers’ perceptions.Data coding and entry were completed in July. Key definitions are reported below.
Table 1. Farm household sample, Central Valleys of Oaxaca, 1998
Effective number of SamplingCommunity farm households fraction Weight
Huitzo 326 0.123 0.1665815Mazalatepec 253 0.158 0.1292795San Lorenzo 447 0.0895 0.2284108Amatengo 146 0.274 0.0746085Valdeflores 320 0.125 0.1635155Santa Ana 465 0.086 0.2376085
5
Key DefinitionsProduction decision-maker (PDM). The household member who claims primary (but notexclusive) responsibility for decisions regarding maize production, such as the areaplanted, crops grown, and plot management. In survey households, the productiondecision-maker is typically but not always male.
Consumption decision-maker (CDM). The household member who claims primary (but notexclusive) responsibility for decisions within the home, including processing of the maizeharvest for consumption. The CDM is typically but not always the wife of the productiondecision-maker.
Maize types or classes. The classification used in this study is based on the criteria farmersuse to differentiate between their varieties: ear size, color, form and grain type, cob type,number of rows, and length of growing period. Farmers differentiated 13 types of maize:(1) Blanco (white); (2) Blanco delgado (white maize with narrow grain); (3) Blanco ancho(white maize with wide grain); (4) Blanco violento (early-maturing white maize); (5) Blancotardío (late-maturing white maize); (5) Amarillo (yellow maize); (7) Amarillo delgado(yellow maize with narrow grain); (8) Amarillo ancho (yellow maize with wide grain;(9) Negro (black or purple maize); (10) Belatove (pinkish) (11) Pinto (mixed color);(12) Mejorado (improved); (13) Tepecentle (a different race from 1 through 12, which belongto the Bolita complex).
Soil types. The classification used in this study is based on the criteria farmers use todifferentiate soils, including: moisture, nutrient content, color, depth, and texture. Eight soiltypes were identified among those described by farmers.
Seed flows refer to seed procurement or the strategies farmers use to save, combine, orreplace the physical unit of seed they will use to produce the varieties grown in the nextseason. An exchange (intercambio) refers to the transfer of seed to another farmer in returnfor seed. A partial change (cambio parcial) refers to the combining of seed saved by the farmerfrom the previous harvest with seed obtained from another farmer, of the same or anothervariety. A total change (cambio total) refers to the replacement of the seed lot of a variety with(a) a new seed lot of the same variety or (b) with a new variety. Case (a) occurs when seedstocks are exhausted due to a poor harvest or when a farmer wants to “renew” the seed bysubstituting it entirely with seed of the same variety grown by another farmer. Case (b)occurs with “adoption” of either a traditional or improved variety.
A seed lot is the physical unit of seed used to reproduce a variety (Louette 1994).
Farm, Farmer, and Household Characteristics
Education, Language, and ExperienceFew statistical differences are observable for household characteristics between surveycommunities. The average size of household is 4 to 6 persons across survey communities.Production decision-makers tend to be 50 years or older, having been responsible for maize

6
Table 2. Household characteristics by survey community, Central Valleys of Oaxaca
San SantaHuitzo Mazaltepec Lorenzo Ana Valdeflores Amatengo All
—mean—Household size 4.85 4.85 5.15 6.07 5.13 4.82 5.25
Production decision-makerAge 51.9 48.5 57.3 55.6 54.7 57.5 54.4
Years as operator 24.7 22.0 27.6 33.6 29.3 30.3 28.3Years education 5.18 * 1.95 + 2.70 2.20 3.18 2.60 3.36
—percent—Spanish-speaking 100 100 100 100 100 100 100With parents 95 10 100 5 100 100 65With children 98 24 100 13 100 100 70
Consumption decision-maker —mean—Age 46.03 39.73 53.13 49.68 50.83 49.43 48.74Years education 5.85 * 4.92 * 2.50 1.48 2.30 1.97 3.06
—percent—Spanish-speaking 100 100 100 100 100 100 100With parents 95 18 100 36 100 100 74With children 95 55 100 89 100 100 91
Services —percent—Electricity 98 100 93 98 95 100 97Gas stove * 98 45 48 23 68 20 51Television * 95 75 65 68 88 53 75Refrigerator * 85 28 15 25 40 15 35Car or truck 23 10 13 5 13 10 12
Source: CIMMYT/INIFAP 1997 survey, 240 total households with 40 households by community.Note: Estimates in “All” category are weighted by inverse probability of selection.
* Significantly higher mean (different percents) with one-tailed t-test (chi-squared test), .05 significance level.+ Mean significantly lower using one-tailed t-test, .05 significance level.
farming decisions for a mean of 28 years (Table 2). Production decision-makers have moreformal education in Huitzo and less in Mazaltepec, with an overall average of 3 years inschool. Consumption decision-makers have the same overall age, but both decision-makersin Huitzo and Mazaltepec have more education than in the other survey communities. InMazaltepec, consumption decision-makers have clearly spent more years in school thanproduction decision-makers, while differences are less evident in other sites.
In all survey sites, both production and consumption decision-makers describe themselvesunanimously as Spanish-speaking. In Mazaltepec and Santa Ana, a minority spoke Spanishwith their parents, and fewer speak Spanish with their children than in other surveycommunities. These results are consistent with those reported by INEGI (Figure 2) except inthe case of San Lorenzo.

7
Sources of IncomeBy some indicators of wealth, based on a global scale, typical farm households in the surveycommunities would not appear to be poor (Table 2). Almost all are served by electricity, andwhile those in Huitzo and Valdeflores are more likely to have televisions, gas stoves, andrefrigerators, a large proportion of farmers have them in each community. Over allcommunities, only 12% have cars or trucks.
Huitzo, where both production and consumption decision-makers are more educated, hasthe lowest reported maize requirements per household and per capita of the surveycommunities (Table 3). In Huitzo, as compared to other sites, households are more likely todepend on local nonfarm employment and less likely to identify remittances andagricultural production as their most important source of income. Households inMazaltepec, which is located in a poorer production zone than Huitzo, report significantlyhigher annual maize needs and depend more heavily on their own farm production orlabor on nearby farms. They are also less likely to rely on remittances as a major source ofincome and to report nonfarm earnings as important.
For all of Mexico (including Mexico City), averaged over 1994-96, estimated per capitaconsumption of maize by the human and livestock population was 235 kg/yr (Calvo et al.1998). Rural households would be expected to consume more maize for food and feed thanurban households, both because of the composition of their diet and other socialobligations. Stated consumption needs may also be higher than actual, since when reportingtheir requirements, household members may have overstated their needs or inadvertentlyincluded some production destined for sale rather than home consumption. On averageover all survey sites, reported maize requirements were over 100 kg higher per annum thanfor Mexico at a national level. All sites except Huitzo averaged higher stated requirements
Table 3. Household maize needs and sources of income by survey community, Central Valleys of Oaxaca
Yield potential
Community
Good Poor Poor Good Good Poor
Huitzo Mazaltepec San Lorenzo Santa Ana Valdeflores Amatengo All
—mean—Maize needs per year 1033+ 2455* 1363 1909 1856 1417 1636 (kg per capita) 227+ 596* 287 353 410 335 354
—percent—Important income sourceLocal agricultural production 70* 100 95 100 85* 98 91Local nonfarm employment 40* 28 30 15* 25 25 27Remittances 3* 13* 23 25 25 38 20
Source: CIMMYT/INIFAP 1997 survey, 240 total households with 40 households by community.Note: Estimates in “All” category are weighted by inverse probability of selection.
* Mean (frequency) significantly higher (different) using one-tailed t-test (chi-squared test), .05 significance level.+ Mean significantly lower using one-tailed t-test, .05 significance level.

8
for maize consumption than the estimated national mean. Most of the very high annualmaize requirements were reported by farmers in Mazaltepec, the community which reliesmost on local agricultural production. In a number of these households, but not in all ofthem, higher figures appear to be associated with livestock production.
Excluding Huitzo and Mazaltepec, the few statistical differences among sites for annualmaize requirements and distribution of income by source are not meaningful in magnitude.The vast majority of households in these communities, whether they are located in better orpoorer maize production zones, confirm that local agricultural production (on their ownfarm or working on other farms) is a major source of income. In addition, about one-quarterof all survey households state that local nonfarm employment is an important source ofincome. For all communities taken together, however, remittances through migration seemnearly as important as local nonfarm employment.
Farm ProductionDespite the emphasis these farmers place on agriculture as a source of income and maize asa daily need, they farm relatively small areas. Of the 32 states of Mexico, only Puebla,Tlaxcala, Mexico, and Hidalgo have both a larger proportion of farmers under 5 ha and agreater dependence on maize in agriculture, as measured by the percent of area planted tomaize (Hernández Estrada 1998). The average farm size in 1996 was 3.5 ha, of which 3 hawere planted to maize (Table 4). Farm sizes and maize areas are smaller in Huitzo andAmatengo than in other communities. The percent of maize area planted to improvedmaize seed in the survey year was significantly different from zero only in Huitzo.
Farm-level soil and moisture conditions vary by site. Soil types were defined based onfarmers’ classification systems (see Methods section). The number of soil types per farmranged from 1 to 6. The mean number of soil types per farm was lower in Huitzo andAmatengo than in the other survey communities, as well as the number of fragments. Here,we use the term “fragments” in referring to plots within parcels on which distinct maizevarieties are grown. Farmers may plant several parcels, with several varieties per parcel.They may also grow the same variety in more than one parcel. The number of fragments onthe farms surveyed ranges from 1 to 9. The highest degree of fragmentation of maize areawas found in Santa Ana and Valdeflores, and the lowest in Huitzo and Amatengo. Onefactor affecting the degree of fragmentation may be access to irrigation: almost no irrigatedmaize area was found in Santa Ana, and Huitzo has the highest percent of farms (85) withsome irrigated maize area. Including all survey communities, 30% of farms had someirrigated maize. The average percent of maize area irrigated per farm was higher in Huitzoand lower in Santa Ana and Valdeflores than in other sites.
Sharp contrasts in land tenure arrangements are evident among survey sites. While allfarmland is privately owned in Santa Ana, almost none is privately owned in Valdeflores,Mazaltepec, or San Lorenzo. In Huitzo, privately owned land represents on average abouthalf of the land farmed by survey households, and in Amatengo it represents about one-quarter. Overall, about 60% of farm households own a team of oxen, while only 2% owntractors. Variation in ownership of oxen among survey communities is considerable, whilethe percent of households owning tractors is negligible in all communities.
9
Differences are evident among communities in type and scale of livestock production.Large numbers of pigs and poultry are raised in Huitzo relative to other communities, andmore sheep are raised and horses are used in San Lorenzo, which is located in the hills.More poultry and cattle are produced in Valdeflores, although the greatest average numberof cattle per household is found in Mazaltepec. Amatengo has a smaller average farm size,less maize area, less pork and poultry production than the other communities, and loweraverage numbers of sheep than the overall average.
Subjective Yield Estimates and Subsistence RatiosDo households meet their maize requirements through their own production? To generateestimates of yield based on farmers’ perceptions, both production and consumptiondecision-makers were asked to report the minimum, maximum, and most frequent yields
Table 4 . Farm characteristics by survey community, Central Valleys of Oaxaca
Yield potential
Community
Good Poor Poor Good Good Poor
Huitzo Mazaltepec San Lorenzo Santa Ana Valdeflores Amatengo All
—mean per farm—Farm size 1996 (ha) 2.44+ 3.91 4.01 3.46 3.87 2.84+ 3.49Percent land privately owned 49.60* 0.00 1.00 100* 0.00 2 7.42* 34.30Maize area 1997 (ha) 1.99+ 3.65 3.02 3.22 3.55 2.76+ 2.99Number of soil types 1.98+ 2.73 2.78 3.08 2.73 2.13+ 2.65Number of fragments1 2.23+ 3.98 3.28 4.08* 4.73* 2.55+ 3.56Percent maize area irrigated 54.2* 15.7 8.10 0.17+ 3.78+ 11.90 14.00Percent maize area 0.14* 0.00 0.04 0.01 0.00 0.00 0.04 in improved seed
Bovines 1.30 2.80* 1.08 1.08 1.83* 0.95 1.45Equines 0.93 1.70* 2.32* 1.20 1.13 1.33 1.47Porcines 2.45* 1.87 0.77 1.95 2.05 0.38+ 1.65Poultry 16.88 6.15+ 12.10 14.55 20.05* 8.98+ 13.78Ovines 3.90 2.42 5.75* 2.30 1.55+ 2.07 3.23
—percent of farms—Own a team of oxen* 43 75 55 43 63 80 60Own tractor 5 0 0 5 0 3 2With any irrigation* 85 40 18 3 20 35 30
Source: CIMMYT/INIFAP 1997 survey, 240 total households with 40 households by community.Note: Estimates in “All” category are weighted by inverse probability of selection.
* Mean (frequency) significantly higher (different) using one-tailed t-test (chi-squared test), .05 significance level.+ Mean significantly lower using one-tailed t-test, .05 significance level.1 Fragments are plots within parcels planted to distinct maize varieties.
10
for the maize varieties they grow.2 Table 5 shows that the expected yields of Blanco maizetypes (including five classes identified by farmers) are higher than the yields of types withcolored grain (including three Amarillo classes, Belatove, Negro, and Pinto), andimproved maize has higher expected yields than Blanco types. The estimated variance ishigher for these maize types as well, but coefficients of yield variation are lower forimproved than for traditional maize types. This result probably reflects in part the factthat most of the improved maize in the survey sites is grown in Huitzo, which has moreirrigation. Production decision-makers estimate higher mean yields and variances thanconsumption decision-makers.
Table 6 shows the average expected yield, variance of yield, and the coefficients of yieldvariation calculated from farmers’ subjective yield distributions. Mean expected yields aresignificantly higher in Huitzo. Although they also appear higher in Amatengo and lowerin Santa Ana, differences are not statistically significant assuming separate variances.Variance of yield is higher in both Huitzo and Amatengo. The coefficients of yieldvariation are similar across the sites and relatively high—they compare, for example, tosome aggregate estimates of the coefficient of yield variation for rainfed maize in southernAfrica (P. Heisey, pers. comm.).
A comparison of expected yields calculated from farmers’ subjective yield distributionsand mean yields obtained in 5 irrigated trials of a sample of varieties collected in each ofthe communities shows a large gap between expectations and yield potential (Taba et al.1997). Breeding for higher yield may be of limited value to farmers if they are not able toattain the advances under their own farming conditions. Agronomic or economicconstraints may influence on-farm yields more than genetic enhancements.
Table 5. Farmers’ yield estimates, by maize type, Central Valleys of Oaxaca
Variance of Coefficient ofMaize type Expected yield yield yield variation
—mean kg/ha—
Blanco 705* 53,6 62* 0.297Amarillo 475 31,618Negro 498 32,302Belatove 447 28,517Pinto 645 3,7547
All colored types 507 32,438 0.341Improved 2,238* 119,447* 0.135+
All maize types 671 48,401 0.310Production partner 779* 61,659* 0.305Consumption partner 540 32,312 0.311
Source: CIMMYT/INIFAP 1997 survey, 240 total households with 40 households by community.Note: Blanco and improved types are compared to all colored types taken together.
* (+) significantly higher (lower) with one-tailed t-test at 5 % level.
2 Since the average number of years farming and growing maize types is about 20 years, these representdistributions over time for each farmer. The distributions reported in Figures 3-5 are cumulative mean yieldscalculated from the triangular distributions elicited from farmers, representing a cross-section.
11
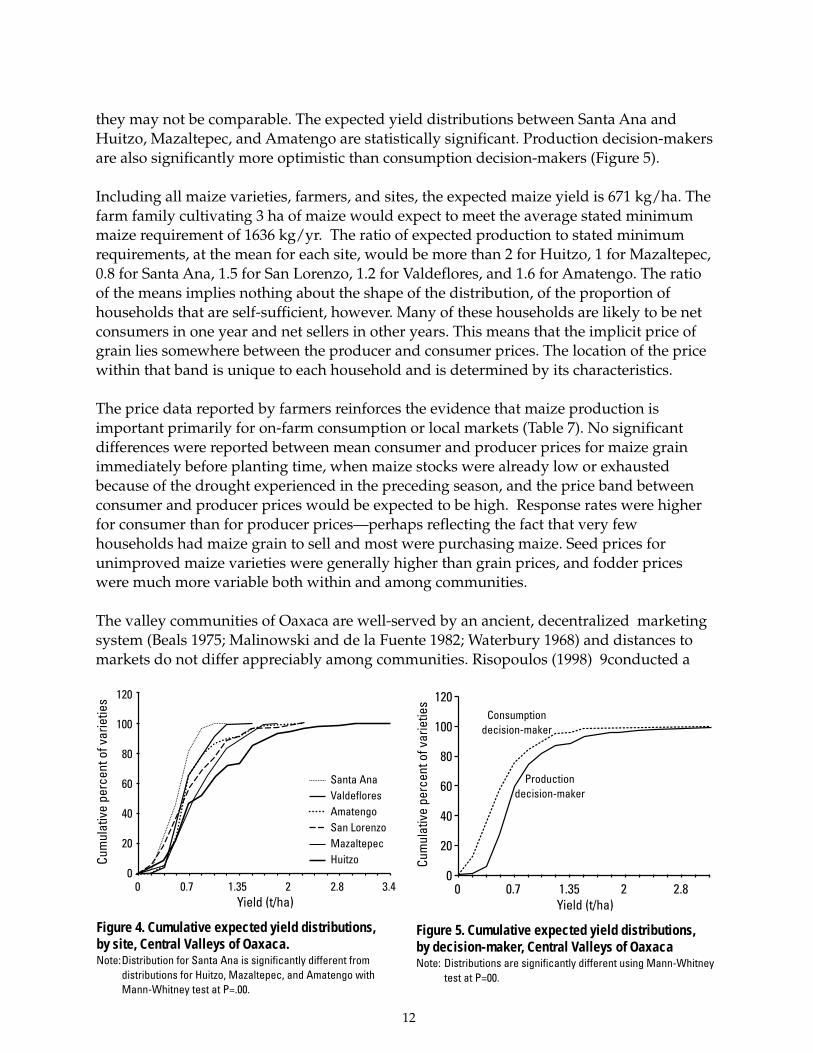
Cumulative yield distributions by maize type, decision-maker, and site are shown inFigures 3-5. Improved maize varieties dominate all other maize varieties in the first-orderstochastic sense; at any yield level, the probability of a yield below that level is less forimproved maize (Figure 3). This implies thatregardless of the farmers’ attitudes towardrisk, a farmer who chooses maize varietieson the basis of yield alone would alwayschoose to grow an improved variety. Thedata show instead that very few growimproved varieties—suggesting that othermaize characteristics play a role in varietychoice. In addition, as shown in Figure 4,Santa Ana has the least favorable yielddistribution; 100% of expected yieldsreported by its farmers, including all classesof maize, fell lower 1.2 t/ha. Althoughsubjective yield distributions are not entirelyconsistent with the yield potentialclassification obtained from INIFAP, becausethey represent distinct underlying concepts
Table 6. Yield estimates by survey community, Central Valleys of Oaxaca
Yield potential
Community
Good Poor Poor Good Good Poor
Huitzo Mazaltepec San Lorenzo Santa Ana Valdeflores Amatengo All
—mean kg/ha, all maize types —
Farmers’ estimatesExpected yield 1,117* 681 677 472 645 818 671Variance of yield 75,076* 54,006 47,766 32,401 38,781 92,287* 48,401Coefficient of yield 0.244 0.308 0.306 0.348 0.259 0.318 0.31 variation
On-farm trialsMean yield 2,189 2,044 2,016 2,743 2,448 2,773 2,359Standard deviation 322 336 263 405 444 392 429Maximum 2,774 2,530 2,618 3,395 3,266 3,237 3,400Minimum 1,606 1,609 1,696 2,178 1,757 2,107 1,246
Source: CIMMYT/INIFAP 1997 survey, 240 total households with 40 households by community, and Taba et al. (1997).Note: Estimates in “All” category for survey data are weighted by inverse probability of selection. Trial data are from samples of 8-13
maize populations per site and in “All” category, 152 populations collected in the Central Valleys. Trials were researcher-managed,with fertilizer and supplemental irrigation.* Significantly higher with one-tailed t-test at 5%. Note that the average coefficient of variation is lower in Huitzo and Valdefloresthan in Santa Ana, but not lower than in other sites.
120
100
80
60
40
20
00 0.5 1 1.5 2 2.5 3.3
Yield (t/ha)
Figure 3. Cumulative expected yield distributionsby maize type, Central Valleys of Oaxaca.Note: Distributions for Blanco, colored-grain, and improved maize
types are significantly different with Mann-Whitney test atP= .00.
Cum
ulat
ive
perc
ent o
f var
ietie
s
Types with colored grain
Improved
All maize varieties
Blancotypes
12
120
100
80
60
40
20
00 0.7 1.35 2 2.8
Yield (t/ha)
Figure 5. Cumulative expected yield distributions,by decision-maker, Central Valleys of OaxacaNote: Distributions are significantly different using Mann-Whitney
test at P=00.
Cum
ulat
ive
perc
ent o
f var
ietie
s
Consumptiondecision-maker
Productiondecision-maker
120
100
80
60
40
20
00 0.7 1.35 2 2.8 3.4
Yield (t/ha)
Figure 4. Cumulative expected yield distributions,by site, Central Valleys of Oaxaca.Note:Distribution for Santa Ana is significantly different from
distributions for Huitzo, Mazaltepec, and Amatengo withMann-Whitney test at P=.00.
Cum
ulat
ive
perc
ent o
f var
ietie
s
Santa AnaValdefloresAmatengoSan LorenzoMazaltepecHuitzo
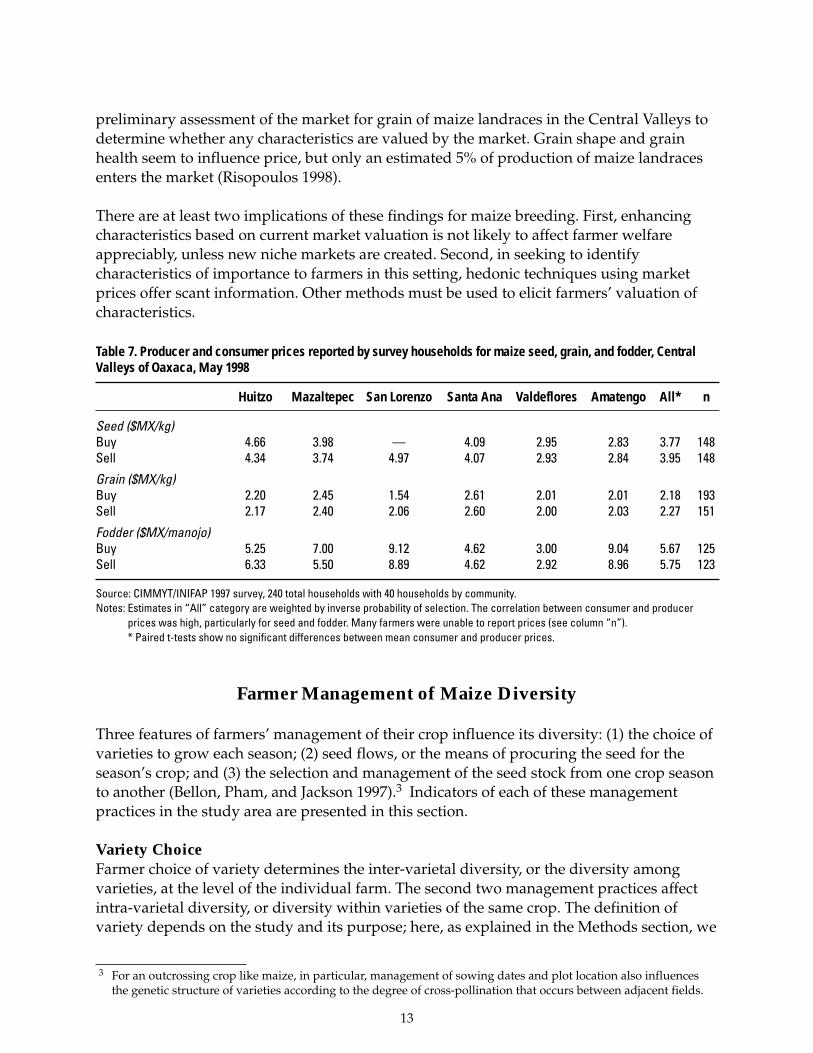
they may not be comparable. The expected yield distributions between Santa Ana andHuitzo, Mazaltepec, and Amatengo are statistically significant. Production decision-makersare also significantly more optimistic than consumption decision-makers (Figure 5).
Including all maize varieties, farmers, and sites, the expected maize yield is 671 kg/ha. Thefarm family cultivating 3 ha of maize would expect to meet the average stated minimummaize requirement of 1636 kg/yr. The ratio of expected production to stated minimumrequirements, at the mean for each site, would be more than 2 for Huitzo, 1 for Mazaltepec,0.8 for Santa Ana, 1.5 for San Lorenzo, 1.2 for Valdeflores, and 1.6 for Amatengo. The ratioof the means implies nothing about the shape of the distribution, of the proportion ofhouseholds that are self-sufficient, however. Many of these households are likely to be netconsumers in one year and net sellers in other years. This means that the implicit price ofgrain lies somewhere between the producer and consumer prices. The location of the pricewithin that band is unique to each household and is determined by its characteristics.
The price data reported by farmers reinforces the evidence that maize production isimportant primarily for on-farm consumption or local markets (Table 7). No significantdifferences were reported between mean consumer and producer prices for maize grainimmediately before planting time, when maize stocks were already low or exhaustedbecause of the drought experienced in the preceding season, and the price band betweenconsumer and producer prices would be expected to be high. Response rates were higherfor consumer than for producer prices—perhaps reflecting the fact that very fewhouseholds had maize grain to sell and most were purchasing maize. Seed prices forunimproved maize varieties were generally higher than grain prices, and fodder priceswere much more variable both within and among communities.
The valley communities of Oaxaca are well-served by an ancient, decentralized marketingsystem (Beals 1975; Malinowski and de la Fuente 1982; Waterbury 1968) and distances tomarkets do not differ appreciably among communities. Risopoulos (1998) 9conducted a
13
Farmer Management of Maize Diversity
Three features of farmers’ management of their crop influence its diversity: (1) the choice ofvarieties to grow each season; (2) seed flows, or the means of procuring the seed for theseason’s crop; and (3) the selection and management of the seed stock from one crop seasonto another (Bellon, Pham, and Jackson 1997).3 Indicators of each of these managementpractices in the study area are presented in this section.
Variety ChoiceFarmer choice of variety determines the inter-varietal diversity, or the diversity amongvarieties, at the level of the individual farm. The second two management practices affectintra-varietal diversity, or diversity within varieties of the same crop. The definition ofvariety depends on the study and its purpose; here, as explained in the Methods section, we
Table 7. Producer and consumer prices reported by survey households for maize seed, grain, and fodder, CentralValleys of Oaxaca, May 1998
Huitzo Mazaltepec San Lorenzo Santa Ana Valdeflores Amatengo All* n
Seed ($MX/kg)Buy 4.66 3.98 — 4.09 2.95 2.83 3.77 148Sell 4.34 3.74 4.97 4.07 2.93 2.84 3.95 148
Grain ($MX/kg)Buy 2.20 2.45 1.54 2.61 2.01 2.01 2.18 193Sell 2.17 2.40 2.06 2.60 2.00 2.03 2.27 151
Fodder ($MX/manojo)Buy 5.25 7.00 9.12 4.62 3.00 9.04 5.67 125Sell 6.33 5.50 8.89 4.62 2.92 8.96 5.75 123
Source: CIMMYT/INIFAP 1997 survey, 240 total households with 40 households by community.Notes: Estimates in “All” category are weighted by inverse probability of selection. The correlation between consumer and producer
prices was high, particularly for seed and fodder. Many farmers were unable to report prices (see column “n”).* Paired t-tests show no significant differences between mean consumer and producer prices.
3 For an outcrossing crop like maize, in particular, management of sowing dates and plot location also influencesthe genetic structure of varieties according to the degree of cross-pollination that occurs between adjacent fields.
preliminary assessment of the market for grain of maize landraces in the Central Valleys todetermine whether any characteristics are valued by the market. Grain shape and grainhealth seem to influence price, but only an estimated 5% of production of maize landracesenters the market (Risopoulos 1998).
There are at least two implications of these findings for maize breeding. First, enhancingcharacteristics based on current market valuation is not likely to affect farmer welfareappreciably, unless new niche markets are created. Second, in seeking to identifycharacteristics of importance to farmers in this setting, hedonic techniques using marketprices offer scant information. Other methods must be used to elicit farmers’ valuation ofcharacteristics.
14
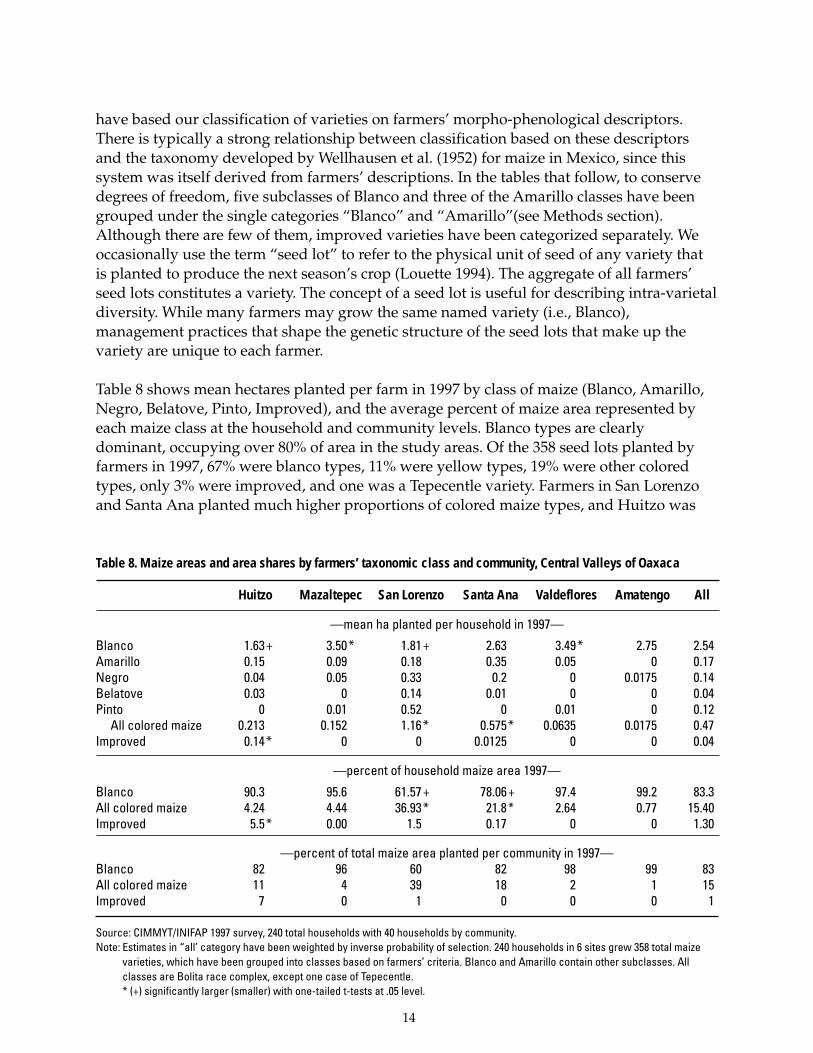
have based our classification of varieties on farmers’ morpho-phenological descriptors.There is typically a strong relationship between classification based on these descriptorsand the taxonomy developed by Wellhausen et al. (1952) for maize in Mexico, since thissystem was itself derived from farmers’ descriptions. In the tables that follow, to conservedegrees of freedom, five subclasses of Blanco and three of the Amarillo classes have beengrouped under the single categories “Blanco” and “Amarillo”(see Methods section).Although there are few of them, improved varieties have been categorized separately. Weoccasionally use the term “seed lot” to refer to the physical unit of seed of any variety thatis planted to produce the next season’s crop (Louette 1994). The aggregate of all farmers’seed lots constitutes a variety. The concept of a seed lot is useful for describing intra-varietaldiversity. While many farmers may grow the same named variety (i.e., Blanco),management practices that shape the genetic structure of the seed lots that make up thevariety are unique to each farmer.
Table 8 shows mean hectares planted per farm in 1997 by class of maize (Blanco, Amarillo,Negro, Belatove, Pinto, Improved), and the average percent of maize area represented byeach maize class at the household and community levels. Blanco types are clearlydominant, occupying over 80% of area in the study areas. Of the 358 seed lots planted byfarmers in 1997, 67% were blanco types, 11% were yellow types, 19% were other coloredtypes, only 3% were improved, and one was a Tepecentle variety. Farmers in San Lorenzoand Santa Ana planted much higher proportions of colored maize types, and Huitzo was
Table 8. Maize areas and area shares by farmers’ taxonomic class and community, Central Valleys of Oaxaca
Huitzo Mazaltepec San Lorenzo Santa Ana Valdeflores Amatengo All
—mean ha planted per household in 1997—
Blanco 1.63+ 3.50* 1.81+ 2.63 3.49* 2.75 2.54Amarillo 0.15 0.09 0.18 0.35 0.05 0 0.17Negro 0.04 0.05 0.33 0.2 0 0.0175 0.14Belatove 0.03 0 0.14 0.01 0 0 0.04Pinto 0 0.01 0.52 0 0.01 0 0.12 All colored maize 0.213 0.152 1.16* 0.575* 0.0635 0.0175 0.47Improved 0.14* 0 0 0.0125 0 0 0.04
—percent of household maize area 1997—
Blanco 90.3 95.6 61.57+ 78.06+ 97.4 99.2 83.3All colored maize 4.24 4.44 36.93* 21.8* 2.64 0.77 15.40Improved 5.5* 0.00 1.5 0.17 0 0 1.30
—percent of total maize area planted per community in 1997—Blanco 82 96 60 82 98 99 83All colored maize 11 4 39 18 2 1 15Improved 7 0 1 0 0 0 1
Source: CIMMYT/INIFAP 1997 survey, 240 total households with 40 households by community.Note: Estimates in “all’ category have been weighted by inverse probability of selection. 240 households in 6 sites grew 358 total maize
varieties, which have been grouped into classes based on farmers’ criteria. Blanco and Amarillo contain other subclasses. Allclasses are Bolita race complex, except one case of Tepecentle.* (+) significantly larger (smaller) with one-tailed t-tests at .05 level.
15
essentially the only community in which improved maize was grown. Even there, improvedmaize was planted to only 7% of the area in 1997. In all communities taken together, farmersplanted on average of 2.5 ha of Blanco types, about one-sixth of a hectare each of Amarillo,Negro, and Pinto types, and very small amounts of Belatove and improved maize.4
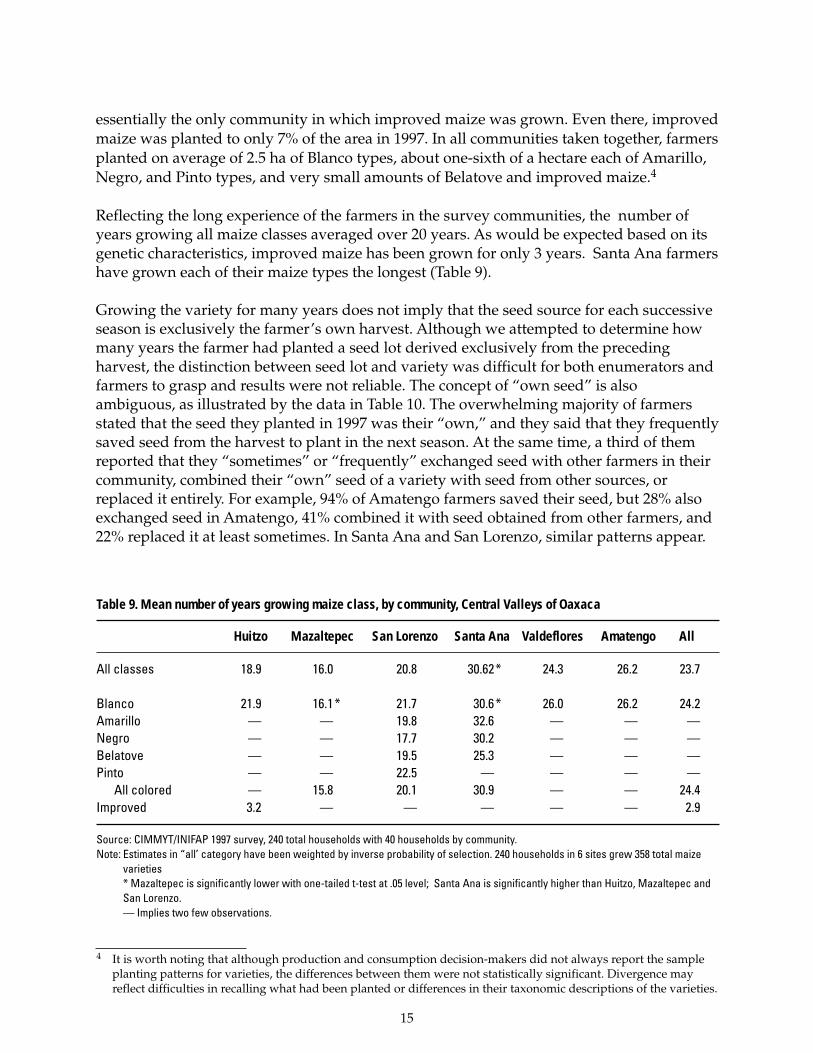
Reflecting the long experience of the farmers in the survey communities, the number ofyears growing all maize classes averaged over 20 years. As would be expected based on itsgenetic characteristics, improved maize has been grown for only 3 years. Santa Ana farmershave grown each of their maize types the longest (Table 9).
Growing the variety for many years does not imply that the seed source for each successiveseason is exclusively the farmer’s own harvest. Although we attempted to determine howmany years the farmer had planted a seed lot derived exclusively from the precedingharvest, the distinction between seed lot and variety was difficult for both enumerators andfarmers to grasp and results were not reliable. The concept of “own seed” is alsoambiguous, as illustrated by the data in Table 10. The overwhelming majority of farmersstated that the seed they planted in 1997 was their “own,” and they said that they frequentlysaved seed from the harvest to plant in the next season. At the same time, a third of themreported that they “sometimes” or “frequently” exchanged seed with other farmers in theircommunity, combined their “own” seed of a variety with seed from other sources, orreplaced it entirely. For example, 94% of Amatengo farmers saved their seed, but 28% alsoexchanged seed in Amatengo, 41% combined it with seed obtained from other farmers, and22% replaced it at least sometimes. In Santa Ana and San Lorenzo, similar patterns appear.
Table 9. Mean number of years growing maize class, by community, Central Valleys of Oaxaca
Huitzo Mazaltepec San Lorenzo Santa Ana Valdeflores Amatengo All
All classes 18.9 16.0 20.8 30.62* 24.3 26.2 23.7
Blanco 21.9 16.1* 21.7 30.6* 26.0 26.2 24.2Amarillo — — 19.8 32.6 — — —Negro — — 17.7 30.2 — — —Belatove — — 19.5 25.3 — — —Pinto — — 22.5 — — — — All colored — 15.8 20.1 30.9 — — 24.4Improved 3.2 — — — — — 2.9
Source: CIMMYT/INIFAP 1997 survey, 240 total households with 40 households by community.Note: Estimates in “all’ category have been weighted by inverse probability of selection. 240 households in 6 sites grew 358 total maize
varieties* Mazaltepec is significantly lower with one-tailed t-test at .05 level; Santa Ana is significantly higher than Huitzo, Mazaltepec andSan Lorenzo.— Implies two few observations.
4 It is worth noting that although production and consumption decision-makers did not always report the sampleplanting patterns for varieties, the differences between them were not statistically significant. Divergence mayreflect difficulties in recalling what had been planted or differences in their taxonomic descriptions of the varieties.

16
In Huitzo, replacement is probably more related to the practice of growing improved maize,as indicated by the higher proportion of farmers purchasing their seed in 1997. In Huitzo,Mazaltepec, and Valdeflores, the practices of exchange and combination seem rarer, and innone of the survey communities did many farmers appear to be exchanging seed beyondthe confines of their own community. Giving seed to other farmers was most frequentlyreported in Santa Ana, and less in Huitzo than in the other communities. Similar strategiesof mixing, combining, and replacing the seed lots for traditional varieties have beenreported in Mexico by Louette (1994) for the community of Cuzalapa in the state of Jalisco,and Aguirre (1999) for southeast Guanajuato.
Why do farmers in these communities pursue these strategies? Table 11 shows the mostfrequent explanations they offered. If the seed planted in 1997 was not their “own” seed, thesource was typically a neighbor or family member in the same community. When seed isgiven to other farmers, it is generally given to family, friends, or neighbors in exchange formoney or seed. Farmers usually exchange seed when they are looking for something new,given there is sufficient seed to exchange. They combine seed lots for experimentation or tocomplement inadequate seed supplies. Full replacement occurs when seed has been lostdue to a poor harvest and/or storage problems.
Seed Selection and Storage PracticesAs has been found in other studies of maize seed selection in Mexico, the most commonseed selection criteria used by farmers are those related to grain and ear health, grain size,grain filling, and ear size (Table 12; e.g., SEP, 1982). The only significant difference of
Table 10. Seed sources, exchanges, and replacements, by community, Central Valleys of Oaxaca
Huitzo Mazaltepec San Lorenzo Santa Ana Valdeflores Amatengo All
—percent of all maize classes grown in 1997—Source of seed in 1997 Own 80.2* 94.8 86.7 97.5 86.2 85.2 89.7 Bought 19.8* 3.1 0.6 1.9 12.6* 9.1* Exchanged 0 0 9.1 0.6 0 1.1
Seed of variety has been 12.9* 28.9 30.6 56.1* 23.9 28.4 34.8given to other farmers
Save seed frequently 76.2 96.8* 76.7 98.1* 88.2 94.3* 87.1
Exchange seed In community 3 7.3 32.1* 77.1* 12.9 28.4* 36.9 Outside community 1 2.1 5.7 12.7* 1.2 5.7 6.3
Combine own seed with 5 14.6 41.4* 61.1* 5.7 40.9* 35.6seed from other sourcesfor same maize class
Replace seed 27.5 13.5* 50.0* 75.8* 20.7 21.6 30.8
Source: CIMMYT/INIFAP 1997 survey, 240 total households with 40 households by community.Note: Estimates in “all’ category have been weighted by inverse probability of selection. 240 households in 6 sites grew 358 total maize
varieties.* Differences significant with pairwise chi-squared test at .05 level.

17
opinion between production andconsumption decision-makers was foundfor the criterion of ear weight. The findingthat consumption decision-makers are morelikely to identify ear weight as an importantselection criterion may be related toprocessing or to their perceptions of therelationship between ear weight and yieldof masa (maize dough).
The criteria identified by farmers ensurehealthy seed and germination, and are likelyrelated as well to the maintenance ofideotypes (Louette and Smale 1998).Farmers exert direct selection pressure onear characteristics but only indirect pressureon related plant characteristics, since only aminority mark plants for selection in thefield (Table 13).
Less than half of farmers reported that theyseparated food or feed grain from seed atharvest time. The most common form ofselection was the continual separation ofgood ears from those removed every few
Table 12. Maize selection criteria, production andconsumption decision-makers, Central Valleys ofOaxaca
Percent of decision-makersusing criterion
Criterion ProductionConsumption
Ear size 93.9 90.9Ear health 92.9 100Ear weight 64.5 80.2Well-filled ear 84.1 88.9Number of rows 35.9 37.0Good husk cover 17.1 9.1Thick husk 6.7 3.4Healthy husk 15.4 14.5Grain size 94.0 91.8Uniform grain 78.5 89.6Healthy grain 96.6 98.4Size of cob 57.2 43.7Color of cob 15.2 19.2
Source: CIMMYT/INIFAP 1997 survey, 240 total households with 40households by community.* significant difference at 5 percent level, chi-squared test.
Table 11. Most frequent explanations for seed exchanges and replacements Central Valleys of Oaxaca
Practice Most frequent explanation
Source of seed in 1997“Own” If not “own” seed, obtained from neighbor or familyBought in same communityExchanged
Seed of variety has been Given to family, friend or neighbor in same communitygiven to other farmers in exchange for money or seed
Exchange seed+In community When looking for seed and there is sufficient seedOutside community to exchange, generally in own community
Combine own seed with To try new seed or because of seed lossseed from other sourcesfor same maize class+
Replace seed+ Primarily because of seed loss
Source: CIMMYT/INIFAP 1997 survey, 240 total households with 40 households by community.Note: Estimates in “all’ category have been weighted by inverse probability of selection. 240 households in 6 sites grew 358 total maize
varieties.+ Practice sometimes or often.

18
days for the preparation of nixtamal (maize grain soaked in lime prior to grinding). Thisimplies that no global selection occurs; at no point in time do farmers compare all of theplants in the field or all the ears from the harvest (D. Soleri, pers. comm.). The potentialimportance of the continual separation (apartar) activity in seed selection has been raised byRice, Smale, and Blanco (1998) based on work in the Sierra de Santa Marta and was studiedin greater detail during the monitoring survey conducted in these communities (Mendoza,forthcoming). Some revision of seed stocks occurs immediately before planting, and themajority of farmers try to avoid dipping into their seed supply for food as their grain storesrun low.
Selection activities at harvest and immediately before planting appear to be accomplishedby both production and consumption decision-makers, often in combination with othermembers of the household (Table 14). As might be expected, perceptions of responsibilities
for setting aside seed ears as grain isconsumed differ between production andconsumption decision-makers.Consumption decision-makers claimgreater responsibility for this seed selectionactivity, as well as for withdrawing seedfrom stocks when food stores are low.
Most families store their seed, combinedwith or separated from food and feed, in aroom, passage, or designated area of thehouse. Some store their seed in a crib (troje).Typically, the ears are piled loosely. Lessoften, they are shelled and the grain isstored in bags or sacks or metal drums.
Table 14. Perceptions of responsibilities for maize seed selection practices, production and consumption decision-makers, Central Valleys of Oaxaca
Decision-maker responsible for practice
Practice Respondent Production Consumption Other*
At harvest, separate seed Production decision-maker 11.9 4.4 83.7 from food or feed Consumption decision-maker 15.1 22.6 62.3Put aside good ears when + Production decision-maker 8.5 12.5 79.0 removing for food or feed Consumption decision-maker 8.7 69.2 22.1Use seed set aside for food + Production decision-maker 6.7 28.6 64.7 when food stocks are low Consumption decision-maker 3.7 93.8 2.6
Make final selection at Production decision-maker 23.8 13.2 63.0 planting time Consumption decision-maker 16.9 34.4 48.7
Source: CIMMYT/INIFAP 1997 survey, 240 total households with 40 households by community.* Both or combinations of household members.+ Significant difference between perceptions of decision-makers, at 5 % with chi-squared test.
Table 13. Maize seed selection practices, CentralValleys of Oaxaca
Percent of farmersPractice reporting practice
Select plant in field 2.2At harvest, separate seed 41.7
from food or feedPut aside good ears when 66.7 removing for food or feedUse seed set aside for food 21.1 when food stocks are lowMake final selection at planting time 26.2
Source: CIMMYT/INIFAP 1997 survey, 240 total households with 40households by community.
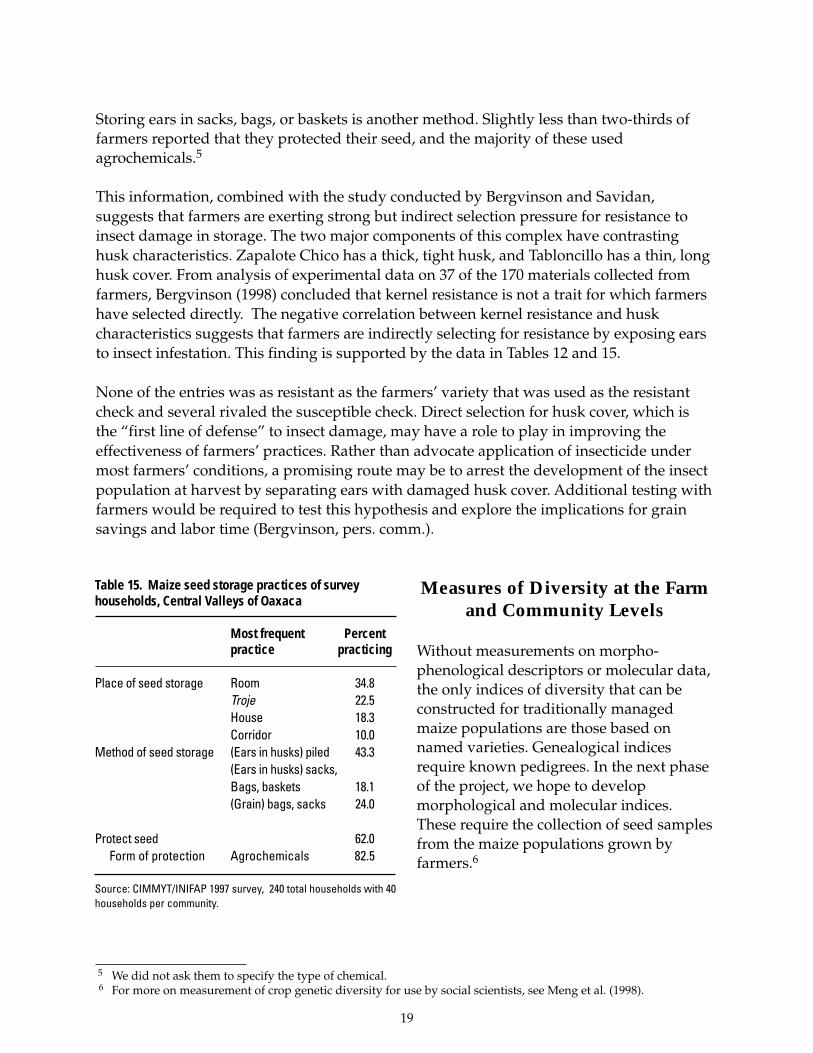
19
Storing ears in sacks, bags, or baskets is another method. Slightly less than two-thirds offarmers reported that they protected their seed, and the majority of these usedagrochemicals.5
This information, combined with the study conducted by Bergvinson and Savidan,suggests that farmers are exerting strong but indirect selection pressure for resistance toinsect damage in storage. The two major components of this complex have contrastinghusk characteristics. Zapalote Chico has a thick, tight husk, and Tabloncillo has a thin, longhusk cover. From analysis of experimental data on 37 of the 170 materials collected fromfarmers, Bergvinson (1998) concluded that kernel resistance is not a trait for which farmershave selected directly. The negative correlation between kernel resistance and huskcharacteristics suggests that farmers are indirectly selecting for resistance by exposing earsto insect infestation. This finding is supported by the data in Tables 12 and 15.
None of the entries was as resistant as the farmers’ variety that was used as the resistantcheck and several rivaled the susceptible check. Direct selection for husk cover, which isthe “first line of defense” to insect damage, may have a role to play in improving theeffectiveness of farmers’ practices. Rather than advocate application of insecticide undermost farmers’ conditions, a promising route may be to arrest the development of the insectpopulation at harvest by separating ears with damaged husk cover. Additional testing withfarmers would be required to test this hypothesis and explore the implications for grainsavings and labor time (Bergvinson, pers. comm.).
Measures of Diversity at the Farmand Community Levels
Without measurements on morpho-phenological descriptors or molecular data,the only indices of diversity that can beconstructed for traditionally managedmaize populations are those based onnamed varieties. Genealogical indicesrequire known pedigrees. In the next phaseof the project, we hope to developmorphological and molecular indices.These require the collection of seed samplesfrom the maize populations grown byfarmers.6
Table 15. Maize seed storage practices of surveyhouseholds, Central Valleys of Oaxaca
Most frequent Percentpractice practicing
Place of seed storage Room 34.8Troje 22.5House 18.3Corridor 10.0
Method of seed storage (Ears in husks) piled 43.3(Ears in husks) sacks,Bags, baskets 18.1(Grain) bags, sacks 24.0
Protect seed 62.0Form of protection Agrochemicals 82.5
Source: CIMMYT/INIFAP 1997 survey, 240 total households with 40households per community.
5 We did not ask them to specify the type of chemical.6 For more on measurement of crop genetic diversity for use by social scientists, see Meng et al. (1998).

20
Table 16. Numbers of varieties per household and Simpson index of varietal diversity, by community, CentralValleys of Oaxaca
Maize class Huitzo Mazaltepec San Lorenzo Santa Ana Valdeflores Amatengo All
Mean number of 1.26 1.21 2.13* 1.98* 1.11 1.10 1.59varieties plantedper household in 1997
Percent households + 26.3 18.8 68.8 65.0 10.0 8.8 40.2growing more thanone variety
Household level 0.083 0.069 0.321* 0.27* 0.032 0.059 0.170Simpson index ofvarietal diversityCommunity level 0.314 0.450 0.767 0.315 0.603 0.516 0.593Simpson index ofvarietal diversity
Source: CIMMYT/INIFAP 1997 survey, 240 total households with 40 households by community.Note: Estimates in “all“ category have been weighted by inverse probability of selection. 240 households in 6 sites grew 358 total maize
varieties, which have been grouped into classes based on farmers’ criteria. Blanco and Amarillo contain other subclasses. Allclasses grown by farmers belong to the Bolita complex, except for one case of Tepecentle.* Significantly higher with one-tailed t-test at 5% level.+ Significant differences by community with chi-squared test at 5% level.
Table 16 shows several diversity indices based on the taxonomic classes used by surveyfarmers (see Methods section). Classes consist of five Blanco (white-grained) varieties, threeAmarillo (yellow-grained) varieties, Negro (black- or purple-grained), Belatove (pinkish-grained), Pinto (mixed color), and Mejorado (improved). The mean number of thesevarieties grown simultaneously by farmers averaged 1.6 over all survey communities in1997, and is greater in San Lorenzo and Santa Ana than in the other sites. The percent offarmers growing more than one variety varies greatly among the sites, from less than 10%in Amatengo to almost 70% in San Lorenzo.
Varietal diversity measured at the household level says little about diversity when assessedat the community level. The Simpson index, commonly used in the ecology literature(Magurran 1988), captures to some extent the “evenness” in the spatial distribution ofpopulations as well as their “richness” (number).7 When this index is constructed at thehousehold level, San Lorenzo and Santa Ana stand out as more diverse than the othercommunities. The picture changes when the same index is measured at the communitylevel. In Santa Ana, only one of the four Blanco types is grown by all farmers, although theyalso grow several colored types. All four are grown more uniformly across the farms ofMazaltepec and Valdeflores, despite the fewer number of varieties cultivated by individualfarmers. The community-level index for Santa Ana is similar to that of Huitzo, wherefarmers generally grow one Blanco type and some improved maize, with very smallamounts of the colored maize types. San Lorenzo, however, ranks relatively high on all themeasures reported in Table 16. Almost all of the different maize classes identified among thesurvey sites can be found in San Lorenzo.
7 The Simpson index used here is constructed as 1-Σipi2, where pi is the proportion of maize area planted to a maize
class. The index ranges between 0 and 1.
21
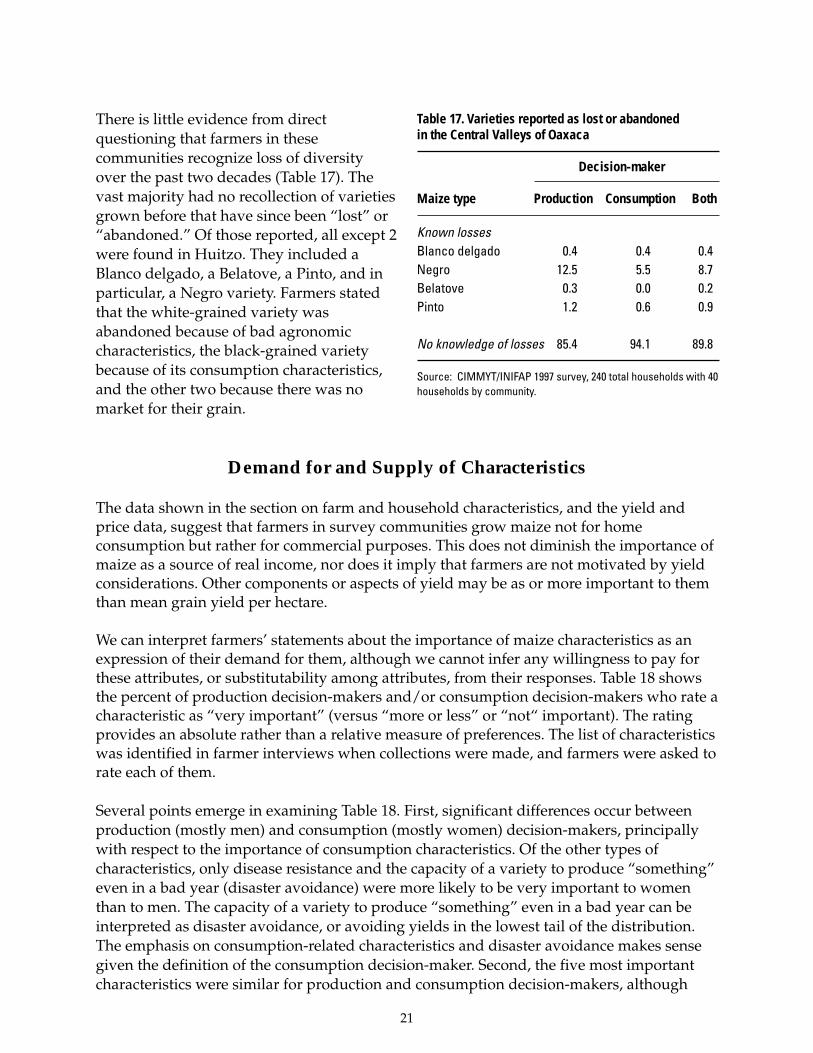
There is little evidence from directquestioning that farmers in thesecommunities recognize loss of diversityover the past two decades (Table 17). Thevast majority had no recollection of varietiesgrown before that have since been “lost” or“abandoned.” Of those reported, all except 2were found in Huitzo. They included aBlanco delgado, a Belatove, a Pinto, and inparticular, a Negro variety. Farmers statedthat the white-grained variety wasabandoned because of bad agronomiccharacteristics, the black-grained varietybecause of its consumption characteristics,and the other two because there was nomarket for their grain.
Demand for and Supply of Characteristics
The data shown in the section on farm and household characteristics, and the yield andprice data, suggest that farmers in survey communities grow maize not for homeconsumption but rather for commercial purposes. This does not diminish the importance ofmaize as a source of real income, nor does it imply that farmers are not motivated by yieldconsiderations. Other components or aspects of yield may be as or more important to themthan mean grain yield per hectare.
We can interpret farmers’ statements about the importance of maize characteristics as anexpression of their demand for them, although we cannot infer any willingness to pay forthese attributes, or substitutability among attributes, from their responses. Table 18 showsthe percent of production decision-makers and/or consumption decision-makers who rate acharacteristic as “very important” (versus “more or less” or “not“ important). The ratingprovides an absolute rather than a relative measure of preferences. The list of characteristicswas identified in farmer interviews when collections were made, and farmers were asked torate each of them.
Several points emerge in examining Table 18. First, significant differences occur betweenproduction (mostly men) and consumption (mostly women) decision-makers, principallywith respect to the importance of consumption characteristics. Of the other types ofcharacteristics, only disease resistance and the capacity of a variety to produce “something”even in a bad year (disaster avoidance) were more likely to be very important to womenthan to men. The capacity of a variety to produce “something” even in a bad year can beinterpreted as disaster avoidance, or avoiding yields in the lowest tail of the distribution.The emphasis on consumption-related characteristics and disaster avoidance makes sensegiven the definition of the consumption decision-maker. Second, the five most importantcharacteristics were similar for production and consumption decision-makers, although
Table 17. Varieties reported as lost or abandonedin the Central Valleys of Oaxaca
Decision-maker
Maize type Production Consumption Both
Known lossesBlanco delgado 0.4 0.4 0.4Negro 12.5 5.5 8.7Belatove 0.3 0.0 0.2Pinto 1.2 0.6 0.9
No knowledge of losses 85.4 94.1 89.8
Source: CIMMYT/INIFAP 1997 survey, 240 total households with 40households by community.

22
men included grain yield per hectare and women included instead the taste of tortillas. Forall respondents taken together, the most important five characteristics were, in decreasingorder of importance: (1) drought tolerance; (2) resistance to insects in storage; (3) disasteravoidance; (4) grain weight; and (4) the taste of tortillas. Third, most of these are agronomicrather than consumption-related characteristics. Fourth, while only 6 characteristics wererated very important by over 50% of production decision-makers, the same percentage ofwomen rated 14 characteristics as very important. In general, more characteristics seem to“matter” to women than to men. This same pattern was found in the voting results from theon-farm demonstrations (Bellon et al. 1998). Finally, feed, forage, and sales of grain orfodder are not ranked by the majority of farmers as very important. Nor are managementconsiderations, or “costs” of production.
Table 18. Demand for variety characteristics, Central Valleys of Oaxaca
Percent of decision-makers ratingcharacteristic as “very important” Top 5 characteristics
Characteristic Production Consumption Both Production Consumption Both
AgronomicGrain weight (kg/almud)+ 76.3 76.6 76.4 3 4 4Grain yield (kg/ha) 52.8 66.1 59.4 5Length of growing period 46.5 46.9 45.7Produces “something” even in bad years * 63.8 89.8 76.8 4 2 3Drought tolerant 91.1 89.9 90.5 1 1 1Resistant to lodging 25.1 51.4 38.2Weed tolerant 26.7 39.8 33.2Disease resistant * 31.5 61.4 46.4Cold tolerant 22.9 34.7 28.8Resistant to insects in storage 79.7 75.5 77.6 2 5 2Shells easily 16.4 31.4 23.9
Consumption-relatedNumber tortillas/almud * 26.4 63.5 44.9Good for nixtamal 40.0 61.0 50.6Taste of tortillas * 50.8 78.4 64.6 3 5Good for atole * 34.0 60.2 47.1Good for nicuatole 1.7 17.7 9.7Good for tamales * 14.9 38.4 26.6Good for tejate 26.7 39.8 26.6Good for pozol * 8.3 25.4 16.9Good for tlayudas 27.5 50.7 39.1Good for forage 30.9 51.4 41.2Good for feed 37.1 50.0 43.1
ManagementGood for sale 32.4 53.6 43Produced with little labor 37.4 43.5 40.3Produced with few purchased inputs 48.2 57.5 52.9
Source: CIMMYT/INIFAP 1997 survey, 240 total households with 40 households by community.Note: An almud is a commonly used volume measurement used in marketing grain or seed.
* Significant difference between perceptions of decision-makers, with chi-squared test at 5% level.

23
Table 19. Supply of variety characteristics, by maize type, Central Valleys of Oaxaca1
Percent farmers rating maize type as “very good”
Characteristic Blanco Amarillo Negro Belatove Improved
—Mean reported by farmers—-
AgronomicGrain weight (kg/almud)+ 3.96 3.96 3.94 3.87 4Expected grain yield (kg/ha) 705 * 475 498 445 2238 *Days from emergence to flowering 78 72 68 69 101Days from emergence to harvest 126 121 111 + 115 + 149 *
—Percent farmers rating maize type as “very good”—Produces “something” even in bad years 74 66 70 78 14Drought tolerant 39 49 34 27 5Resistant to lodging 40 53 47 32 33Weed tolerant 30 20 13 18 19Disease resistant 38 34 18 27 5Cold tolerant 51 22 9 14 29Resistant to insects in storage 19 22 9 14 29Shells easily 74 77 84 86 52
Consumption-related —Mean reported by farmers—-Number tortillas/almud 46 39 40 37 58
—Percent farmers rating maize type as “very good”—Good for nixtamal 93 88 84 86 19Taste of tortillas 95 90 95 91 19Good for atole 94 63 43 44 14Good for nicuatole 68 28 29 13 14Good for tamales 93 88 65 78 14Good for tejate 49 24 9 9 5Good for pozol 81 70 40 51 24Good for tlayudas 86 93 83 83 14Good for forage 78 93 55 65 81Good for feed 86 99 90 87 14
ManagementGood for sale 90 62 31 27 10Produced with little labor 5 4 6 5 14Produced with few purchased inputs 2 1 0 0 14
Source: CIMMYT/INIFAP 1997 survey, 240 total households with 40 households by community.Note: An almud is a commonly used volume measurement used in marketing grain or seed. There are few observations for Belatove and
improved maize.* (+) Significantly higher (lower) with one-tailed t-test at 5% level.1 Includes both production and consumption partners.
8 Among the six major characteristics, there are no significant differences in the assessment of maize types betweenproduction and consumption decision-markers, except for expected yield per hectare.
How well do the varieties farmers grow supply the characteristics they demand? Table 19shows farmers’ quantitative estimates of yield components and cycle length as well as thepercent rating the maize type as “very good” for the characteristic.8 Although the smallnumber of observations in the category of improved maize makes the numbers less reliablethan for other categories, it is evident that except for expected grain yield per hectare andfodder, improved maize is a poor supplier of all characteristics relative to any of the

24
traditional varieties. Improved maize has a longer growing cycle and is grown primarily inHuitzo, which has more irrigated maize. Among the traditional varieties, the five Blancovarieties (collapsed into one category, “Blanco“) dominate the types with colored grain(Amarillo, Negro, Belatove) with respect to grain yield per hectare, suitability for sale, andmost consumption characteristics. Of the major characteristics demanded, the traditionalvarieties supply tortilla flavor well. They produce similar grain weight. All are ratedrelatively low with respect to drought tolerance, very low with respect to insect resistancein storage, and relatively better in terms of disaster avoidance.
Why are the maize varieties with colored grain still grown? The dominance of Blanco typesin maize area is consistent with its dominance in terms of characteristics of importance tofarmers. Amarillo maize is rated high for the production of tlayudas, fodder, and feed—although these characteristics are not so important. Grain color seems to “mark”agronomic features such as duration of growing cycle; Negro and Belatove havesignificantly shorter growing cycles than Blanco or Amarillo. They may be grown as ameans of coping with the risk of crop failure in growing seasons of variable length andgrown in small quantities in order to assure a seed supply. As the area planted to Amarillo,Negro, Belatove, and Pinto types declines, the supply of local seed may also constraindemand.

25
References
Aguirre, J.A, 1999. Análisis regional de la diversidad del maíz en el sureste de Guanajuato. PhDthesis. Universidad Nacional Autónoma de Mexico, Facultad de Ciencias, Mexico, D.F.,Mexico.
Beals, R. L. 1975 . The Peasant Marketing System of Oaxaca, Mexico. California: University ofCalifornia Press.
Bellon, M. R. 1996. The dynamics of crop infraspecific diversity: A conceptual framework at thefarmer level. Economic Botany 50, 26-39.
Bellon, M.R., J.L. Pham, and M.T. Jackson. 1997. Genetic conservation: A role for rice farmers. In N.Maxted, B.V. Ford-Lloyd and J.G. Hawkes (eds), Plant Conservation: the In Situ Approach.Chapman and Hall, London, pp. 263-289.
Bellon, M. R. and M. Smale. 1998. A Conceptual Framework for Valuing On-Farm Genetic Resources.CIMMYT Economics Working Paper, in press. Mexico, D. F.: CIMMYT.
Bellon, M.R., M. Smale, A. Aguirre, F. Aragón, and H. Castro. 1998. Identifying maize landraces forparticipatory breeding: Does gender make a difference? Paper presented at the workshop“Strategic Research on Gender Issues in Rice-Based Household Economy”, IRRI, Los Baños,Laguna, Philippines, August 23-28, 1998.
Bergvinson, D. 1998. Annual Research Progress Report 1997. Maize Entomology. Mexico, D.F.:CIMMYT.
Calvo, R., P. Aquino, P. W. Heisey, and F. Carrion. 1998. Part II of CIMMYT World Wheat Maize Factsand Trends, 1998. Mexico, D.F.: International Maize and Wheat Improvement Center(CIMMYT).
Hernández Estrada, M. I. 1998. Tipología de productores agropecuarios. Ponencia presentada en elSeminario “Los pequeños productores rurales: Las reformas y las opciones, Colegio deMéxico, México, D.F., September 10.
INEGI. 1996. La agricultura en Oaxaca. VII Censo Agropecuario 1991.Louette, D. 1994. Gestion traditionnelle de variétés de maïs dans la réserve de la Biosphère Sierra de
Manantlán (RBSM, états de Jalisco et Colima, Mexique) et conservation in situ desressources génétiques de plantes cultivées. Thèse de doctorat, Ecole Nationale SupérieureAgronomique de Montpellier, Montpellier, France.
Louette, D. and M. Smale. 1998. Farmers’ Seed Selection Practices and Maize Variety Characteristics in aTraditionally-Based Mexcian Community. CIMMYT Economics Working Paper 98-04. Mexico,D.F.: International Maize and Wheat Improvement Center (CIMMYT).
Magurran, A. 1988. Ecological diversity and its measurement. Princeton, Princeton UniversityPress.
Malinowski, B., and J. de la Fuente. 1982. The Economics of a Mexican Market System. London:Routledge and Kegan.
Mendoza, J. Forthcoming. Participation of Farm Women in the Management and Selection of MaizeSeed in the Central Valleys of Oaxaca. Tesis de licenciatura.
Meng, E. C. H., M. Smale, M. Bellon, and D. Grimanelli. 1998. Definition and measurement of cropdiversity for economic analysis. In M. Smale, M. R. Bellon, and P. Pingali (eds), Farmers,Gene Banks and Crop Breeding. Norwell, MA, Kluwer Academic Publishers and CIMMYT,pp. 19-31.
Ortega-Paczka, R. 1995. Origen de la agricultura e importancia de los valles centrales de Oaxaca.In M. A. Vásquez Dávila (ed), La Tecnología Agrícola Tradicional. Oaxaca, México, InstituoIndigenísta Interamericano/CONACYT, pp. 189-200.
Perales R., H., S.B. Brush, and C.O. Qualset. 1999. Agronomic and economic competitiveness ofmaize landraces and in situ conservation in Mexico. In M. Smale (ed.), Farmers, Gene Banks,and Crop Breeding: Economic Analysis of Diversity in Wheat, Maize, and Rice. Norwell, Mass.:Kluwer Academic Publishers.

26
Rice, E., M. Smale, and J.-L. Blanco. 1998. Farmers’ use of improved seed selection practices inMexican maize: Evidence and Issues from the Sierre de Santa Marta. World Development(September).
Risopoulos, J. 1998. Assessment of the potential for conducting a hedonic pricing study for maizelandraces produced and marketed in the Central Valleys, State of Oaxaca, Mexico. CIMMYTInternal document.
SEP (Secretaría de Educación Pública). 1982. Nuestro maíz—Treinta Monografías Populares. ConsejoNacional de Fomento Educativo, Secretaría de Educación Pública, Tomo 1 y 2, México.
Taba, S., F. Aragón, J.M. Hernandez, J. Díaz, H.C. Garcia, and A. Aguirre. 1997. In situ conservationof maize biodiversity in the Central Valleys of Oaxaca, Mexico: results and workplan.Internal document. Mexico, D.F.: CIMMYT and INIFAP.
Waterbury R.G. 1968. The traditional market in an urban setting: Oaxaca , Mexico. PhD thesis. LosAngeles: University of California..
Wellhausen, E.J., L.M. Roberts, and E. Hernandez X. 1952. Races of Maize in Mexico: their Origin,Characteristics and Distribution. The Bussey Institution. Cambridge: Harvard University.

27
Recent Economics Working Papers
98-01 Institutional Change and Discontinuities in Farmers’ Use of Hybrid Maize Seed and Fertilizer inMalawi: Findings from the 1996-97 CIMMYT MoALD SurveyM. Smale, A.Phiri, and contributors
98-02 An Economic Analysis of the Abonera Maize Production System in the Atlantic Coast ofHondurasG. Sain and D.Buckles
98-03 Optimal Search in Ex situ Collections of Wheat Genetic ResourcesD. Gollin, M. Smale, and B. Skovmand
98-04 Farmers’ Seed Selection Practices and Maize Variety Characteristics in a Traditionally-BasedMexican CommunityD. Louette and M. Smale
98-05 A Conceptual Framework for Valuing On-Farm Genetic ResourcesM.R. Bellon and M. Smale
98-06 A Regional Analysis of Maize Biological Diversity in Southeastern Guanajuato, MexicoJ.A. Aguirre Gómez, M.R. Bellon, and M. Smale
99-01 Adoption of Maize Conservation Tillage in Azuero, PanamaA. Pereira de Herrera and G. Sain
99-02 Maize Production and Agricultural Policies in Central America and MexicoG. Sain and M.A. López–Pereira
99-03 Cereal Crop Productivity in Developing Countries: Past Trends and Future ProspectsP.L. Pingali and P.W. Heisey
99-04 Adoption and Use of Improved Maize by Small-Scale Farmers in Southeast GuatemalaG. Saín and J. Martínez
99-05 Sources of Productivity Growth in Wheat: A Review of Recent Performance and Medium- toLong-Term ProspectsR.M. Rejesus, P.W. Heisey, and M. Smale
99-06 Changing Competitiveness of the Wheat Sector of Kazakstan and Sources of FutureProductivity GrowthJ. Longmire and A. Moldashev
99-07 Genetic Change in Farmer-Recycled Maize Seed: A Review of the EvidenceM.L. Morris, J. Risopoulos, and D. Beck
99-08 The Private and Public Characteristics of Maize Land Races and the Area Allocation Decisionsof Farmers in a Center of Crop DiversityM. Smale, M.R. Bellon, and J.A. Aguirre Gómez
CIMMYT Research Report
No. 4 Maize Technology in Malawi: A Green Revolution in the Making?P.W. Heisey and M. Smale
No. 5 The Global Wheat Improvement System: Prospects for Enhancing Efficiency in the Presence ofSpilloversM.K. Maredia and D. Byerlee, Editors
CIMMYT World Facts and Trends
CIMMYT World Maize Facts and Trends, 1997/98Maize Production in Drought–stressed Environments: Technical Options and Research ResourceAllocations
CIMMYT World Wheat Facts and Trends, 1998/99Global Wheat Research in a Changing World: Challenges and Achievements
Copyright © 2022 FDOKUMEN