Magnetic ordering in NdRhSn
12
Journal of Magnetism and Magnetic Materials 301 (2006) 359–370 Magnetic ordering in NdRhSn Kazimierz La ˛ tka a , Roman Kmiec´ b , Jacek Gurgul c , Andrzej W. Pacyna b , Micha" Rams a , Tobias Schmidt d , Rainer Po¨ttgen d, a Marian Smoluchowski Institute of Physics, Jagiellonian University, Reymonta 4, 30-059 Krako´w, Poland b Henryk Niewodniczan´ski Institute of Nuclear Physics, Polish Academy of Sciences, Radzikowskiego 152, 31-342 Krako´w, Poland c Institute of Catalysis and Surface Chemistry, Polish Academy of Sciences, Niezapominajek 8, 30-239 Krako´w, Poland d Institut fu¨r Anorganische und Analytische Chemie, Universita¨t Mu¨nster, Corrensstrasse 36, 48149 Mu¨nster, Germany Received 6 May 2005; received in revised form 1 July 2005 Available online 11 August 2005 Abstract The stannide NdRhSn was synthesized from the elements in a sealed tantalum tube. The structure was investigated on the basis of X-ray powder and single crystal data: ZrNiAl type, P ¯ 62m, a ¼ 741:3ð1Þ, c ¼ 412:90ð9Þ pm, wR2 ¼ 0:0266, 354 F 2 values and 14 variable parameters. The neodymium atoms fill distorted hexagonal channels within the three-dimensional [RhSn] network. The magnetic and electronic properties of NdRhSn have been studied by means of AC and DC magnetic susceptibility measurements as well as 119 Sn Mo¨ ssbauer spectroscopy. A transition from a paramagnetic to a ferromagnetic state was found at T C ¼ 10:3 K. r 2005 Elsevier B.V. All rights reserved. Keywords: Stannide; Intermetallic compound; Crystal structure; Magnetism; Mo¨ssbauer spectroscopy 1. Introduction The RERhSn stannides with the light rare earth (RE) elements cerium, praseodymium, and neody- mium have first been reported by Routsi et al. [1]. Preliminary susceptibility measurements indicated intermediate valence for CeRhSn and Curie–Weiss paramagnetism with positive Weiss constants for PrRhSn and NdRhSn. No magnetic ordering was observed down to 4.2 K. A recent reinvestigation of the whole series of RERhSn stannides [2], however, showed some inconsistencies concerning the lattice parameters of CeRhSn, PrRhSn, and NdRhSn. These different lattice parameters most likely result from different compositions of the samples investigated by Routsi et al. [1]. A further discrepancy is the recently observed ferromagnetic ordering in NdRhSn at 10.3 K [3]. Herein we report on a detailed structural, magnetic, and 119 Sn Mo¨ssbauer spectroscopic study of NdRhSn. ARTICLE IN PRESS www.elsevier.com/locate/jmmm 0304-8853/$ - see front matter r 2005 Elsevier B.V. All rights reserved. doi:10.1016/j.jmmm.2005.07.009 Corresponding author. Tel.: +49 251 83 36001; fax: +49 251 83 36002. E-mail addresses: ufl[email protected] (K. La ˛ tka), [email protected] (R. Po¨ttgen).
-
Upload
independent -
Category
Documents
-
view
0 -
download
0
Transcript of Magnetic ordering in NdRhSn

ARTICLE IN PRESS
0304-8853/$
doi:10.1016
�Correspfax: +4925
E-mail a
pottgen@u
Journal of Magnetism and Magnetic Materials 301 (2006) 359–370
www.elsevier.com/locate/jmmm
Magnetic ordering in NdRhSn
Kazimierz Łatkaa, Roman Kmiecb, Jacek Gurgulc, Andrzej W. Pacynab,Micha" Ramsa, Tobias Schmidtd, Rainer Pottgend,�
aMarian Smoluchowski Institute of Physics, Jagiellonian University, Reymonta 4, 30-059 Krakow, PolandbHenryk Niewodniczanski Institute of Nuclear Physics, Polish Academy of Sciences, Radzikowskiego 152, 31-342 Krakow, Poland
cInstitute of Catalysis and Surface Chemistry, Polish Academy of Sciences, Niezapominajek 8, 30-239 Krakow, PolanddInstitut fur Anorganische und Analytische Chemie, Universitat Munster, Corrensstrasse 36, 48149 Munster, Germany
Received 6 May 2005; received in revised form 1 July 2005
Available online 11 August 2005
Abstract
The stannide NdRhSn was synthesized from the elements in a sealed tantalum tube. The structure was investigated
on the basis of X-ray powder and single crystal data: ZrNiAl type, P62m, a ¼ 741:3ð1Þ, c ¼ 412:90ð9Þpm,
wR2 ¼ 0:0266, 354 F2 values and 14 variable parameters. The neodymium atoms fill distorted hexagonal channels
within the three-dimensional [RhSn] network. The magnetic and electronic properties of NdRhSn have been studied by
means of AC and DC magnetic susceptibility measurements as well as 119Sn Mossbauer spectroscopy. A transition from
a paramagnetic to a ferromagnetic state was found at TC ¼ 10:3K.
r 2005 Elsevier B.V. All rights reserved.
Keywords: Stannide; Intermetallic compound; Crystal structure; Magnetism; Mossbauer spectroscopy
1. Introduction
The RERhSn stannides with the light rare earth(RE) elements cerium, praseodymium, and neody-mium have first been reported by Routsi et al. [1].Preliminary susceptibility measurements indicatedintermediate valence for CeRhSn and Curie–Weissparamagnetism with positive Weiss constants for
- see front matter r 2005 Elsevier B.V. All rights reserve
/j.jmmm.2005.07.009
onding author. Tel.: +49251 83 36001;
1 83 36002.
ddresses: [email protected] (K. Łatka),
ni-muenster.de (R. Pottgen).
PrRhSn and NdRhSn. No magnetic ordering wasobserved down to 4.2K. A recent reinvestigationof the whole series of RERhSn stannides [2],however, showed some inconsistencies concerningthe lattice parameters of CeRhSn, PrRhSn, andNdRhSn. These different lattice parameters mostlikely result from different compositions of thesamples investigated by Routsi et al. [1]. A furtherdiscrepancy is the recently observed ferromagneticordering in NdRhSn at 10.3K [3]. Herein wereport on a detailed structural, magnetic, and119Sn Mossbauer spectroscopic study of NdRhSn.
d.
ARTICLE IN PRESS
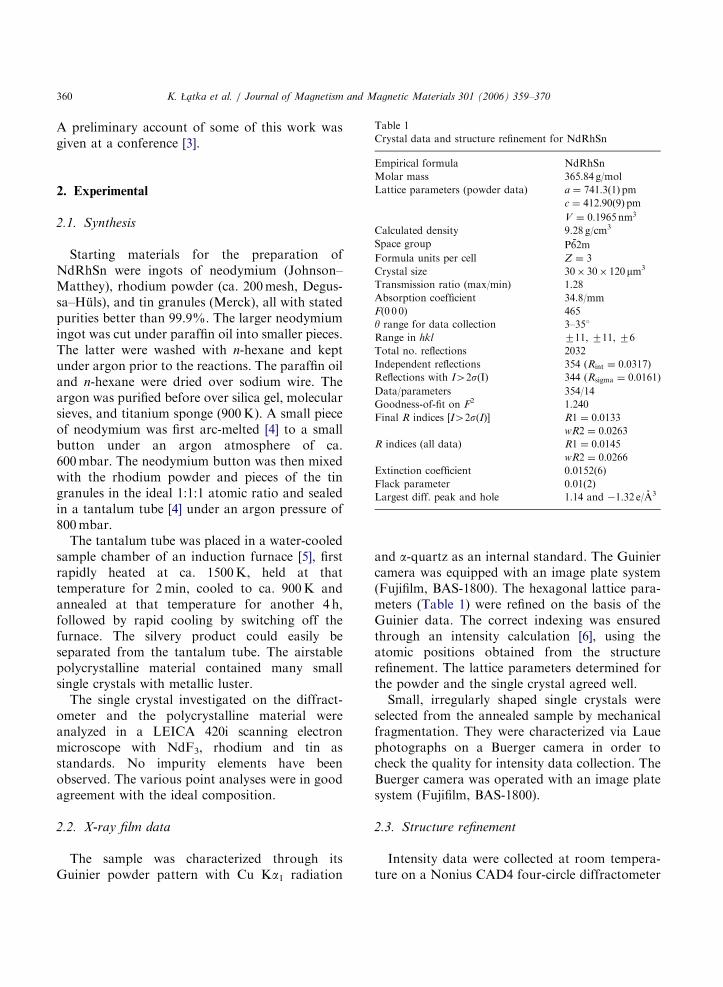
Table 1
Crystal data and structure refinement for NdRhSn
K. Łatka et al. / Journal of Magnetism and Magnetic Materials 301 (2006) 359–370360
A preliminary account of some of this work wasgiven at a conference [3].
Empirical formula NdRhSn
Molar mass 365.84 g/mol
Lattice parameters (powder data) a ¼ 741:3ð1Þpmc ¼ 412:90ð9Þpm
V ¼ 0:1965nm3
Calculated density 9.28 g/cm3
Space group P62m
Formula units per cell Z ¼ 3
Crystal size 30� 30� 120mm3
Transmission ratio (max/min) 1.28
Absorption coefficient 34.8/mm
F(0 0 0) 465
y range for data collection 3–351
Range in hkl 711, 711, 76
Total no. reflections 2032
Independent reflections 354 (Rint ¼ 0:0317)Reflections with I42s(I) 344 (Rsigma ¼ 0:0161)
Data/parameters 354/14
Goodness-of-fit on F2 1.240
Final R indices [I42s(I)] R1 ¼ 0:0133wR2 ¼ 0:0263
R indices (all data) R1 ¼ 0:0145wR2 ¼ 0:0266
Extinction coefficient 0.0152(6)
Flack parameter 0.01(2)
Largest diff. peak and hole 1.14 and �1.32 e/A3
2. Experimental
2.1. Synthesis
Starting materials for the preparation ofNdRhSn were ingots of neodymium (Johnson–Matthey), rhodium powder (ca. 200mesh, Degus-sa–Huls), and tin granules (Merck), all with statedpurities better than 99.9%. The larger neodymiumingot was cut under paraffin oil into smaller pieces.The latter were washed with n-hexane and keptunder argon prior to the reactions. The paraffin oiland n-hexane were dried over sodium wire. Theargon was purified before over silica gel, molecularsieves, and titanium sponge (900K). A small pieceof neodymium was first arc-melted [4] to a smallbutton under an argon atmosphere of ca.600mbar. The neodymium button was then mixedwith the rhodium powder and pieces of the tingranules in the ideal 1:1:1 atomic ratio and sealedin a tantalum tube [4] under an argon pressure of800mbar.
The tantalum tube was placed in a water-cooledsample chamber of an induction furnace [5], firstrapidly heated at ca. 1500K, held at thattemperature for 2min, cooled to ca. 900K andannealed at that temperature for another 4 h,followed by rapid cooling by switching off thefurnace. The silvery product could easily beseparated from the tantalum tube. The airstablepolycrystalline material contained many smallsingle crystals with metallic luster.
The single crystal investigated on the diffract-ometer and the polycrystalline material wereanalyzed in a LEICA 420i scanning electronmicroscope with NdF3, rhodium and tin asstandards. No impurity elements have beenobserved. The various point analyses were in goodagreement with the ideal composition.
2.2. X-ray film data
The sample was characterized through itsGuinier powder pattern with Cu Ka1 radiation
and a-quartz as an internal standard. The Guiniercamera was equipped with an image plate system(Fujifilm, BAS-1800). The hexagonal lattice para-meters (Table 1) were refined on the basis of theGuinier data. The correct indexing was ensuredthrough an intensity calculation [6], using theatomic positions obtained from the structurerefinement. The lattice parameters determined forthe powder and the single crystal agreed well.Small, irregularly shaped single crystals were
selected from the annealed sample by mechanicalfragmentation. They were characterized via Lauephotographs on a Buerger camera in order tocheck the quality for intensity data collection. TheBuerger camera was operated with an image platesystem (Fujifilm, BAS-1800).
2.3. Structure refinement
Intensity data were collected at room tempera-ture on a Nonius CAD4 four-circle diffractometer

ARTICLE IN PRESS
Table 2
Atomic coordinates and anisotropic displacement parameters (pm2) for NdRhSn
Atom Wyckoff site x y z U11 U22 U33 U12 Ueq
Nd 3f 0.58638(5) 0 0 71(1) 83(1) 92(1) 41(1) 81(1)
Rh1 2d 2/3 1/3 1/2 89(1) U11 107(3) 45(1) 95(1)
Rh2 1a 0 0 0 78(2) U11 66(3) 39(1) 74(1)
Sn 3g 0.24901(5) 0 1/2 65(1) 71(2) 76(2) 36(1) 70(1)
Ueq is defined as one third of the trace of the orthogonalized Uij tensor. U13 ¼ U23 ¼ 0.
Table 3
Interatomic distances (pm) in the structure of NdRhSn,
calculated with the lattice parameters taken from X-ray powder
data
Nd: 4 Rh1 304.2(1) Rh1: 3 Sn 283.6(1)
1 Rh2 306.6(1) 6 Nd 304.2(1)
2 Sn 324.3(1) Rh2: 6 Sn 276.9(1)
4 Sn 337.8(1) 3 Nd 306.6(1)
4 Nd 386.9(1) Sn: 2 Rh2 276.9(1)
2 Nd 412.9(1) 2 Rh1 283.6(1)
2 Sn 319.7(1)
2 Nd 324.3(1)
4 Nd 337.8(1)
Standard deviations are given in parentheses. All distances
within the first coordination spheres are listed.
K. Łatka et al. / Journal of Magnetism and Magnetic Materials 301 (2006) 359–370 361
with graphite monochromatized Mo Ka radiation(l ¼ 71:073 pm) and a scintillation counter withpulse-height discrimination. Scans were taken inthe o/2y mode. An absorption correction wasapplied on the basis of psi-scan data followed by aspherical absorption correction. Relevant crystal-lographic data and details for the data collectionare given in Table 1.
The data set showed high Laue symmetry andno systematic extinctions. The space group P62mwas found to be correct during the structurerefinement in agreement with the previous inves-tigations [2]. The atomic parameters of CeRhSn [7]were taken as starting values and the structure wasrefined with anisotropic displacement parametersfor all atoms using SHELXL–97 (full-matrix least-squares on F2) [8]. Refinement of the correctabsolute structure was ensured through the refine-ment of the Flack parameter [9,10]. The occupancyparameters were refined in a separate series ofleast-squares cycles. Since all sites were fullyoccupied within two standard uncertainties, theideal occupancy parameters were assumed again inthe final cycles. A final difference Fourier synthesisrevealed no significant residual peaks. The atomicparameters and interatomic distances are listed inTables 2 and 3. Further details on the structurerefinement are available.1
2.4. Magnetic properties
Detailed magnetic measurements were made inAC and DC modes using a 7225 Lake Shore AC
1Details may be obtained from: Fachinformationszentrum
Karlsruhe, D-76344 Eggenstein-Leopoldshafen (Germany), by
quoting the Registry no. CSD–415369.
susceptometer/DC magnetometer and by means ofa SQUID magnetometer MPMS XL5 on apowdered sample.Magnetization investigations of NdRhSn were
performed in a wide temperature range 2–300Kand up to 50 kOe magnetic field. The bulk ACmagnetic susceptibility measurements were under-taken employing a Lake Shore 7225 susceptometeroperating in the temperature range 7–15K. The in-phase w0ðoÞ and out-phase w00ðoÞ components wererecorded simultaneously as a function of tempera-ture with internal frequencies changing from 5 to5 kHz. The oscillating field strength HAC waschanged in eight steps from 0.01 to 25Oe, (thestrength of H0) to 0, 50, 100, 200, 500, 1000, and2000Oe.Additionally, for a better characterization of the
sample, another set of measurements was done.The second and third harmonics of the ACsusceptibility w2, w3 were investigated with HAC ¼

ARTICLE IN PRESS
K. Łatka et al. / Journal of Magnetism and Magnetic Materials 301 (2006) 359–370362
1Oe and f ¼ 140 or 125Hz as a function oftemperature.
The field dependence of the magnetization wasregistered in a SQUID magnetometer (QuantumDesign) at T ¼ 2:3K, where the virgin curve wasobtained first after zero field-cooling of thesample. The magnetic field was varied between�15 and 15 kOe.
The application of an external magnetic fieldtogether with the studies of the higher harmonicsallowed a better determination and understandingof the observed phase transition.
2.5. 119Sn Mossbauer spectroscopy
The local properties of NdRhSn were investi-gated by means of Mossbauer spectroscopyemploying the 119Sn gamma resonance23.875 keV transition. The experiments were per-formed using a conventional constant-accelerationspectrometer of the Kankeleit type in transmissiongeometry. The velocity scale was calibrated with a57Co(Rh) source and a metallic iron foil at roomtemperature. The Ba119mSnO3 source was kept at atemperature close to 4.2K while the temperatureof the absorber was varied between 1.85K androom temperature. Special care was taken tooptimize the absorber thickness by Czjzek’smethod [11] resting on numerical solution of theequation obtained from the condition to getmaximal value of the ratio of observed effect toexperimental error. The g-rays were detected usinga 3 cm thick NaJ(Tl) scintillation counter. Apalladium foil of 0.05mm thickness was used asa critical absorber for tin X-rays to reduce thebackground intensity of the spectra.
Since the tin site has a rather low symmetry(m2m), the spectra were analyzed by means ofleast-squares fitting procedures using a full hyper-fine interaction Hamiltonian [12] within theLorentz approximation. The fitting routine pro-vides the isomer shift dIS, the quadrupole couplingconstant DEQ ¼ eQV zz, the y and j angles whichdefine the direction of the magnetic hyperfine fieldHhf with respect to the main axis of the electricfield gradient (EFG) tensor and the asymmetryparameter Z ¼ ðVxx � V yyÞ=V zz. Some resonancespectra were additionally analyzed employing the
Wivel and Mørup method [13] which takes intoaccount a broad quasi-continuous distribution ofthe magnetic hyperfine fields Hhf . Then, thespectra were least-squares fitted with 60 values ofHhf , giving the probability distribution curveF ðHhf Þ.
3. Results and discussion
3.1. Crystal chemistry
The single crystal structure refinement clearlyconfirms the hexagonal ZrNiAl [14–16] typestructure for NdRhSn. Refinement of the occu-pancy parameters gave no hint for mixed siteoccupancy in the crystal investigated. Further-more, the single crystal and powder lattice para-meters match very well. This is a strong indicationfor a different composition of the sample origin-ally investigated by Routsi et al. [1]. The deviationin composition might also account for the differentmagnetic behavior. The crystal chemical peculia-rities of the RERhSn stannides have been dis-cussed in detail in our earlier work on the crystalchemistry and chemical bonding of RERhSn(RE ¼ Ho–Yb) [2]. For details we refer to thismanuscript.
3.2. Magnetic properties
The results of our magnetic measurements aredisplayed in Figs. 1–8. The temperature depen-dence of the zero-field cooled DC magneticsusceptibility and inverse susceptibility are pre-sented together on the left- and right-hand scale ofFig. 1, respectively. As one can see, the hightemperature region (above 100K) of the magneticsusceptibility recorded in an applied field of 1 kOewell obeys a modified Curie–Weiss law given bythe formula: w ¼ w0+C/(T�yP). The followingparameters were obtained from the fitting proce-dure: a temperature independent factorw0 ¼ 5.7(2)� 10�4Oe emu/mol, a Curie constantC ¼ 1.53(1)Oe emuK/mol and a paramagneticCurie temperature yP ¼ �6.7(6)K. From the C
value, an effective magnetic moment meff ¼3:50ð1ÞmB was extracted which is only slightly

ARTICLE IN PRESS
0 50 100 150 200 250 300
0
10
20
30
40
50
60
70
Temperature [ K ]1/
χ [1
03 g/
cm3 ]
0
1
2
3
4
5
6
7
8
9
10
χ [1
0-3 c
m3 /
g]
Fig. 1. Temperature dependence of the DC magnetic suscept-
ibility (left-hand scale) of NdRhSn recorded in an external
magnetic field of H0 ¼ 1kOe, and reciprocal magnetic suscept-
ibility (right-hand scale) where the solid line is a result of the
fitting procedure in the paramagnetic range.
Fig. 2. Magnetization vs. external magnetic field for NdRhSn
at T ¼ 2:3K. The inset shows the enlarged hysteresis loop of
the mass magnetization.
Fig. 3. Temperature dependence of the zero-field cooled (ZFC)
and field cooled (FC) DC mass susceptibilities of NdRhSn
measured in a static field of H0 ¼ 5:4Oe. The inset displays the
derivative dw=dT , which has a sharp minimum at TC ¼
10:6ð3ÞK.
K. Łatka et al. / Journal of Magnetism and Magnetic Materials 301 (2006) 359–370 363
smaller than the theoretical value for a free Nd3+
ion described by meff ¼ g mB [J (J+1)]1/2 ¼ 3.62 mB.This result gives us a hint that there is no magneticmoment localized on the rhodium atoms. Thesmall negative value of yP is indicative forantiferromagnetic correlations. However, the sus-ceptibility curve shows a sharp rise at lowtemperatures and eventually a tendency towardssaturation, which suggests a ferromagnetic order-
ing in NdRhSn. Indeed, the presence of suchinteractions is further confirmed. The temperatureindependent factor w0 is of the same order as foundin other RTX compounds [12,17].Fig. 2 presents the magnetization (in Bohr
magnetons per formula unit) as a function of themagnetic field at T ¼ 2:3K, i.e. well below theCurie temperature. The virgin curve was measuredafter cooling the sample from the paramagneticstate in the ZFC mode. The narrow hysteresisloop, shown in the inset, shows a coercive fieldof about 0.75(1) kOe and a remanence of13.1(1)G cm3/g. The magnetization curve doesnot saturate even at the highest available magneticfield of H ¼ 50 kOe, but an almost saturationeffect is seen with an extrapolated (1/H-0)moment of 1.55(2) mB/Nd. This value is far belowthe maximal value of 3.27 mB/Nd according to thetheoretical moment gJ [18]. However, we need toconsider that this moment has been determinedfrom magnetization measurements made on apowder sample. This can play an essential rolesince the magnetic anisotropy of Nd intermetallicsis usually large.The temperature variations of FC and ZFC
mass susceptibilities measured at a static fieldH0 ¼ 5:4Oe are compared in Fig. 3. The Curietemperature of TC ¼ 10:6ð3ÞK was obtained from

ARTICLE IN PRESS
0
2
4
6
8
7 8 9 10 11 12 13 14 15
7 8 9 10 11 12 13 14 15
0
1
2
3
4
Hac = 1 Oe
f : 5 Hz 25 Hz 48 Hz 75 Hz 140 Hz 375 Hz 1 kHz 5 kHz
χ' [
10-3
cm
3 /g]
χ'' [
10-4
cm
3 /g]
Temperature [K]
Fig. 4. Zero-field susceptibilities w0 and w00 recorded simulta-
neously as a function of temperature with internal frequencies
ranging from 5Hz to 5 kHz.
0
2
4
6
8
10
12
14
7 8 9 10 11 12 13 14 15
7 8 9 10 11 12 13 14 15
0
1
2
3
4
5f = 140 HzH ac:
0.01 Oe 0.1 Oe 1 Oe 2 Oe 5 Oe 7 Oe 10 Oe 25 Oe
χ' [
10-3
cm
3 /g]
χ'' [
10-3
cm
3 /g]
Temperature [K]
Fig. 5. Zero-field susceptibilities w0 and w00 recorded simulta-
neously as a function of temperature with different amplitudes
of oscillating fields HAC at an internal frequency f ¼ 140Hz.
K. Łatka et al. / Journal of Magnetism and Magnetic Materials 301 (2006) 359–370364
the kink of the wðTÞ curve recorded in ZFC modeand determined by the minimum of the derivativedw=dT (see inset of Fig. 3). This temperature wellcorresponds to the inflection point of the FCsusceptibility curve.
In order to get more information on the natureof the observed transition, additional measure-ments were performed. The AC method waschosen because it is very well suited for a precisedetermination of magnetic phase transitions andtheir dynamics. The results of our AC suscept-ibility w ¼ w0 � iw00 measurements for NdRhSn areshown in Figs. 4–8. The position of the individualw0 maxima at T ¼ 10:3ð1ÞK do not changesignificantly with rising frequency (see Fig. 4).This is in a contrast to the imaginary part w00 whichreflects different energy losses in the magneticallyordered system depending on frequency. Such
losses are characteristic for systems with a netmagnetic moment, i.e. ferromagnetic, ferromag-netic canted systems or spin glasses [19 andreferences therein]. More significant changes arevisible on the real and imaginary parts of themagnetic susceptibility measured with differentoscillating field amplitudes HAC (Fig. 5). Withrising HAC the maxima of both amplitudes w0 andw00 strongly increase and shift towards lowertemperatures. These peak shifts can be connectedwith some intrinsic domains or cluster phenomena[19]. Fig. 6 illustrates the influence of the externalbias DC magnetic field H0 up to 1 kOe on the w0
and w00 components. It is seen that an increase ofthe field strength has a visible influence on thetransition peaks. At H0 ¼ 2 kOe the transition isalmost destroyed. This phenomenon is character-istic for ferromagnetic-like transitions as well.

ARTICLE IN PRESS
0
2
4
6
8
7 8 9 10 11 12 13 14 15
7 8 9 10 11 12 13 14 15
0
1
2
3Hac = 1 Oe
f = 140 HzH0:
0 Oe 50 Oe 100 Oe 200 Oe 500 Oe 1 kOe 2 kOe
χ' [
10-3
cm
3 /g]
χ'' [
10-4
cm
3 /g]
Temperature [K]
Fig. 6. Temperature dependence of w0 and w00 susceptibilitiesmeasured after zero-field cooling (ZFC) with increasing
temperature and back in field cooling (FC) process (with
decreasing temperature from the paramagnetic state) at
different magnetic fields H0 and with an internal frequency
f ¼ 140Hz.
0
1
2
3
4
5
7 8 9 10 11 12 13 14 15
7 8 9 10 11 12 13 14 15
-5
-4
-3
-2
-1
2nd harmonicHac = 1 Oe
f = 140 Hz
χ' 2 [1
0-7 c
m3 /g
]χ'' 2
[10-7
cm
3 /g]
Temperature [K]
Fig. 7. Temperature dependence of the susceptibility signal
registered for the real and imaginary parts of the second
harmonic where the fundamental frequency was f ¼ 140Hz.
Data were collected after ZFC with an oscillating field
HAC ¼ 1Oe.
K. Łatka et al. / Journal of Magnetism and Magnetic Materials 301 (2006) 359–370 365
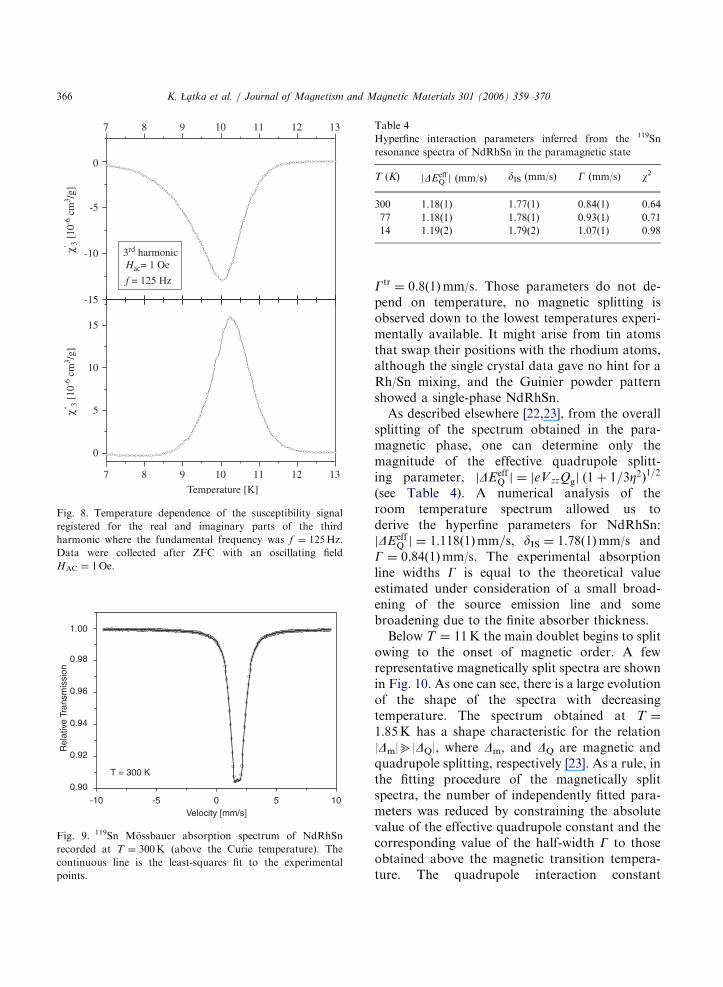
It is generally accepted that non-vanishingvalues of higher harmonic susceptibilities (w2 andw3) are a direct signal for the appearance of aspontaneous magnetic moment [19,20]. Hence, thenon-zero values observed near TC for bothharmonics as illustrated in Figs. 7 and 8 supportadditionally the ferromagnetic character of thephase transition under study. The w2ðTÞ measure-ments were performed with a fundamental fre-quency f ¼ 140Hz to avoid a coincidence of thesecond harmonic signal with higher harmonics ofthe power supply current (50Hz). Another char-acteristic feature of the susceptibilities w1 (funda-mental), w2 and w3 is their asymmetric shape whichis best seen at the real part of w3 (Fig. 8). Again,
such an asymmetric shape is typical for ferro-magnets [21].
3.3. 119Sn mossbauer spectroscopy
The 119Sn resonance spectrum of NdRhSnobtained at room temperature (i.e. in the para-magnetic phase) is shown in Fig. 9. As expected forthe non-cubic point symmetry of the tin site, thespectrum shows a quadrupole splitting and couldbe fitted with two components. The first quadru-pole doublet (about 90% of the total absorptionarea) corresponds to the main phase. The secondcomponent (about 10%) corresponds to an un-identified phase with hyperfine parameters:|DEQ|
tr¼ 2.5(1)mm/s, dIS
tr¼ 1.88(2)mm/s and
ARTICLE IN PRESS
-15
-10
-5
0
7 8 9 10 11 12 13
7 8 9 10 11 12 13
0
5
10
15
3rd harmonic Hac= 1 Oe
f = 125 Hz
χ'' 3 [1
0-6 c
m3 /g
]χ' 3
[10-6
cm
3 /g]
Temperature [K]
Fig. 8. Temperature dependence of the susceptibility signal
registered for the real and imaginary parts of the third
harmonic where the fundamental frequency was f ¼ 125Hz.
Data were collected after ZFC with an oscillating field
HAC ¼ 1Oe.
-10 -5 0 5 10
0.90
0.92
0.94
0.96
0.98
1.00
Rel
ativ
e Tr
ansm
issi
on
Velocity [mm/s]
T = 300 K
Fig. 9. 119Sn Mossbauer absorption spectrum of NdRhSn
recorded at T ¼ 300K (above the Curie temperature). The
continuous line is the least-squares fit to the experimental
points.
Table 4
Hyperfine interaction parameters inferred from the 119Sn
resonance spectra of NdRhSn in the paramagnetic state
T (K) jDEeffQ j (mm/s) dIS (mm/s) G (mm/s) w2
300 1.18(1) 1.77(1) 0.84(1) 0.64
77 1.18(1) 1.78(1) 0.93(1) 0.71
14 1.19(2) 1.79(2) 1.07(1) 0.98
K. Łatka et al. / Journal of Magnetism and Magnetic Materials 301 (2006) 359–370366
Gtr¼ 0.8(1)mm/s. Those parameters do not de-
pend on temperature, no magnetic splitting isobserved down to the lowest temperatures experi-mentally available. It might arise from tin atomsthat swap their positions with the rhodium atoms,although the single crystal data gave no hint for aRh/Sn mixing, and the Guinier powder patternshowed a single-phase NdRhSn.As described elsewhere [22,23], from the overall
splitting of the spectrum obtained in the para-magnetic phase, one can determine only themagnitude of the effective quadrupole splitt-ing parameter, jDEeff
Q j ¼ jeV zzQgj ð1þ 1=3Z2Þ1=2
(see Table 4). A numerical analysis of theroom temperature spectrum allowed us toderive the hyperfine parameters for NdRhSn:jDEeff
Q j ¼ 1:118ð1Þmm=s, dIS ¼ 1.78(1)mm/s andG ¼ 0.84(1)mm/s. The experimental absorptionline widths G is equal to the theoretical valueestimated under consideration of a small broad-ening of the source emission line and somebroadening due to the finite absorber thickness.Below T ¼ 11K the main doublet begins to split
owing to the onset of magnetic order. A fewrepresentative magnetically split spectra are shownin Fig. 10. As one can see, there is a large evolutionof the shape of the spectra with decreasingtemperature. The spectrum obtained at T ¼
1:85K has a shape characteristic for the relation|Dm|b|DQ|, where Dm, and DQ are magnetic andquadrupole splitting, respectively [23]. As a rule, inthe fitting procedure of the magnetically splitspectra, the number of independently fitted para-meters was reduced by constraining the absolutevalue of the effective quadrupole constant and thecorresponding value of the half-width G to thoseobtained above the magnetic transition tempera-ture. The quadrupole interaction constant

ARTICLE IN PRESS
-10 -5 0 5 10
0.88
1.00
Velocity [mm/s]
T = 1.85 K
0.92
1.00
T =7.00 K
0.93
1.00
T = 8.00 K
Rel
ativ
e Tr
ansm
issi
on
0.94
1.00
T = 8.50 K
0.92
1.00
T = 8.75 K
0.91
1.00
T = 9.00 K
Fig. 10. Temperature evolution of the absorption spectra for
NdRhSn measured between 1.85 and 9K. Continuous lines
were obtained by applying the fitting procedures under an
assumption of broad and quasicontinuous distributions of Hhf .
For an explanation, see text.
K. Łatka et al. / Journal of Magnetism and Magnetic Materials 301 (2006) 359–370 367
|DEQ| ¼ |eVzzQg | was calculated from the knownmagnitude of jDEeff
Q j ¼ jeVzzQgj ð1þ 1=3Z2Þ1=2
(Table 4) and the fitted asymmetry parameter Z.Both possible signs of DEeff
Q were checked. Theremaining parameters, i.e. the polar angles y andj, the magnetic hyperfine field Hhf and the isomershift dIS were varied independently.
At this point it is necessary to make a fewremarks. The unit cell of NdRhSn contains threeformula units with three crystallographicallyequivalent tin positions. The local symmetry ofthe tin sites has two mutually perpendicular mirrorplanes (site symmetry m2m), where one plane lies
in the ab-basal plane and the second one is parallelto the crystallographic c-axis. With each mirrorplane one can associate the direction of theprincipal axis perpendicular to this plane. There-fore, one of the principal axes of the EFG tensorhas to be parallel to the c-axis and the two othershave to lie in the basal plane, with one of themparallel to the cross section of the mirror planes.Then, with each of the three tin positions in theunit cell are associated three different principalsystems of axes of the EFG tensor, which areequivalent after rotation around the c-axis by 1201.As a consequence, there are three magneticallyinequivalent tin positions in the magneticallyordered state, and in turn, one can expect threemagnetic components associated with generallythree different polar angles in the magneticallysplit Mossbauer spectrum. If we assume a collinearmagnetic structure, all three components shouldhave the same relative intensities, magnitudes ofthe hyperfine field and quadrupole parameters.Only when Hhf is parallel to the hexagonal c-axis,there is a single component in the resonancespectrum, irrespective of the direction of theEFG principal axis Vzz (see extended discussionin Ref. [22]).An attempt to analyze the data with only one
magnetically split component in the whole experi-mental region below TC did not give a satisfactoryfit. However, the spectra could be effectively fittedwith one y and j value assuming a distribution ofmagnetic hyperfine fields. After applying a multi-component analysis it was possible to describe thespectra accurately. An approach of the Wivel andMørup method [13] has been applied. Due to poorresolution of the spectra our fits were made with aconstrained value of the angle j. The probabilitydistribution curves F ðHhf Þ as a function oftemperature are shown in Fig. 11. The temperatureincreases from 1.85 (top spectrum) to 11K(bottom spectrum). The dominant component ofthe spectra corresponds to the broad maximum ofF ðHhf Þ at large values of Hhf , visible at lowtemperatures. The width of this contributionincreases with increasing temperature. High tem-perature distribution functions show only minormaxima at the low-field end but they can beassociated with the occurrence of a non-magnetic

ARTICLE IN PRESS
Fig. 11. Temperature evolution of the field distribution
function, F ðHhf Þ, obtained from computer fits at various
temperatures for NdRhSn. Temperature rises from 1.85 (top
spectrum) to 11K (bottom spectrum).
Table 5
Hyperfine interaction parameters inferred from the low temperature
T (K) /HhfS (kOe) DEQ (mm/s) Z dIS
1.85 67(5) �1.04(4) 0.93(3) 1.7
4.2 67(5) �1.05(4) 0.90(3) 1.7
6 63(6) �1.03(4) 0.96(3) 1.8
7 59(7) �1.04* 0.93* 1.8
8 48(1.6) �1.04* 0.93* 1.8
8.5 42(1.1) �1.04* 0.93* 1.8
8.75 37(1.8) �1.04* 0.93* 1.8
9 33(9) �1.04* 0.93* 1.8
9.25 21(5) �1.04* 0.93* 1.8
9.5 18(5) �1.04* 0.93* 1.8
10 4(3) �1.04* 0.93* 1.8
11 — �1.04* 0.93* 1.7
*Parameters kept constant during the fitting procedure.
K. Łatka et al. / Journal of Magnetism and Magnetic Materials 301 (2006) 359–370368
component being an artifact of the fittingprocedure.During the numerical analysis special attention
was paid to the estimation of the polar angles andthe sign of DEQ. The best results were obtained fora negative value of DEQ, j ¼ 901 and y close to901. It means that the magnetic hyperfine field Hhf
points to the direction of the V yy axis. Themagnitudes of the hyperfine parameters inferredfrom the analysis described above are listed inTable 5.If we would like to discuss the neodymium
magnetic structure, one needs to know the exactorientation of the principal axes system of theEFG tensor in the crystallographic structure.Unfortunately, there are a few possible orienta-tions of the principal axes of the EFG tensor. If wechoose the V yy axis pointing along the c-axis andthe Vzz axis lying in the ab-basal plane, ourMossbauer results could be interpreted in arelatively simple way. That particular choice ofthe alignment of the principal EFG axes systemcould be supported by the results of detailedMossbauer spectroscopic studies of the isostruc-tural compounds URhSn and GdNiAl [22,24]. Inthat instance the derived values of the polar angles(j ¼ 901 and yE901) would imply that thedirection of the magnetic hyperfine field wouldbe parallel to the c-axis. In this case, one can
119Sn resonance spectra of NdRhSn
(mm/s) y (deg) j (deg) G (mm/s) w2
9(1) 98(2) 90* 0.84* 2.05
9(1) 95(2) 90* 0.84* 2.92
0(1) 90(10) 90* 0.84* 2.98
0(1) 98* 90* 0.84* 1.04
1(1) 98* 90* 0.84* 0.92
3(1) 98* 90* 0.84* 0.58
2(1) 98* 90* 0.84* 0.96
0(1) 98* 90* 0.84* 0.64
0(1) 98* 90* 0.84* 0.72
0(1) 98* 90* 0.84* 0.87
0(1) 98* 90* 0.84* 1.14
9(1) — — 0.84* 3.05

ARTICLE IN PRESS
K. Łatka et al. / Journal of Magnetism and Magnetic Materials 301 (2006) 359–370 369
expect only one component with well-defined polarangles, which was confirmed. To go further, thedistribution of Hhf one can prescribe to a helicalmagnetic ordering of the Nd magnetic moments. Ifone supposes that the Nd moments lie on a coneclose to the c-axis, changing azimuthal angles fromplane to plane, it should result in differenttransferred hyperfine fields seen by the diamag-netic tin atoms and in consequence to a distribu-tion of Hhf . As a matter of fact, the resonancespectrum registered at the lowest experimentaltemperature T ¼ 1:85K (see Fig. 10) can besatisfactorily described in terms of a singlemagnetic component with constraint polar anglesj ¼ 901 and y ¼ 901 confirming that at least in thelow temperature region the directions of the Ndmagnetic moments are close to or even within thecrystallographic c-axis.
The temperature dependence of the averagedmagnetic hyperfine field /Hhf(T)S (Fig. 12) can bewell described in the frame of the molecular fieldapproximation by a Brillouin function with J ¼
9=2 . The resulting fit gives the estimation for theCurie temperature TM
C ¼ 9:9ð2ÞK which is onlyslightly smaller than that obtained from themagnetic AC measurements, TC ¼ 10:3K. Theabsolute value of the saturated magnetic hyperfinefield |Hhf(0)|is 67(1) kOe.
Fig. 12. Temperature dependence of the averaged magnetic
hyperfine fields derived from computer fits to the 119Sn
Mossbauer spectra for NdRhSn. The continuous line represents
the Brillouin function (least-squares fit).
The value of the tin isomer shift (dis ¼1:80mm=s, see Table 5) is almost temperatureindependent and is typical for tin atoms inintermetallic systems as for example observed inGdRhSn [12].
4. Conclusions
Usually, a transferred magnetic hyperfine fieldat the tin site can be treated as a good measure of anet magnetic moment of the tin neighbors, becausetin does not have its own magnetic moment. Aninterpretation of the 119Sn data requires a goodknowledge about the local crystallographic struc-ture of the tin site. Characteristic features of theNdRhSn structure are the Nd–Rh and Sn–Rhplanes stacked along the c-axis. Thus, the tinatoms are placed exactly in the middle betweenNd–Rh planes. The relatively large magnetichyperfine fields in the 119Sn Mossbauer spectracould suggest that the Nd–Rh planes are generallycoupled ferromagnetically along the c-axis, but thedistribution of Hhf could result from a slightlynon-collinear magnetic structure. Magnetic mea-surements suggest that the whole magnetism inNdRhSn is connected with the neodymium mag-netic moments.The knowledge of the quadrupole interaction
constant DEQ (155Gd) and the asymmetry para-meter Z as obtained from 155Gd Mossbauerspectroscopy on GdRhSn [12] provide valuableinformation concerning the quadrupolar terms B0
2
and B22 in the Stevens expansion of the crystal field
Hamiltonian : SBmn Om
n . Their estimates can bederived from two simple relations:
B02½K � ¼ �ajhr
2i4f90:2DEQð155GdÞ
B22 ¼ ZB0
2
where aJ is the appropriate Stevens factor, /r2S4f
is the mean squared radius of the 4f wave functionexpressed in atomic units and DEQ, related to the155 Gd nuclei, is expressed in mm/s. If B0
2 is theleading term in the crystal field Hamiltonian, itssign gives an information about the single ionmagnetic anisotropy. Since the measured quadru-pole interaction constant of GdRhSn is negative

ARTICLE IN PRESS
K. Łatka et al. / Journal of Magnetism and Magnetic Materials 301 (2006) 359–370370
(DEQ ¼ �2.642mm/s) [12] , one should expect anegative value of B0
2 for isostructural RERhSncompounds with light rare earths like Nd (aj o 0).In turn, for a negative value of the B0
2 parameter,magnetic ordering along the c-axis is preferred, asconfirmed in fact by our results.
Precise DC and AC magnetic measurementsshowed that NdRhSn undergoes a ferromagnetictransition at TC ¼ 10:3K, in good agreement withMo ssbauer spectroscopy results where the esti-mated transition temperature TM
C ¼ 9:9ð2ÞK (seeFig. 12) can be identified with the appearance ofthe magnetic splitting of the main component (i.e.below T ¼ 11K, see Mossbauer part above). Allobtained results are self-consistent supporting anon-collinear ferromagnetic ordering of the Ndmagnetic moments which can be tentativelyascribed as a helicoidal one.
Acknowledgments
We thank Dr. R.-D. Hoffmann for the intensitydata collection and the Degussa-Huls AG for a giftof rhodium powder. This work was supported bythe Deutsche Forschungsgemeinschaft throughSPP 1166 Lanthanoidspezifische Funktionalitaten
in Molekul und Material and by Poland’s Com-mittee for Scientific Research grant under contractno: 1 P03B 084 28.
References
[1] Ch.D. Routsi, J.K. Yakinthos, H. Gamari-Seale, J. Magn.
Magn. Mater. 117 (1992) 79.
[2] R. Mishra, R. Pottgen, R.-D. Hoffmann, H. Trill, B.D.
Mosel, H. Piotrowski, M.F. Zumdick, Z. Naturforsch. 56b
(2001) 589.
[3] K. Łatka, R. Kmiec, R. Kruk, A.W. Pacyna, M. Rams,
T. Schmidt, R. Pottgen, Nukleonika 48 (Suppl.) (2003) S35.
[4] R. Pottgen, Th. Gulden, A. Simon, GIT-Laborfach-
zeitschr. 43 (1999) 133.
[5] D. KuXmann, R.-D. Hoffmann, R. Pottgen, Z. Anorg.
Allg. Chem. 624 (1998) 1727.
[6] K. Yvon, W. Jeitschko, E. Parthe, J. Appl. Crystallogr. 10
(1977) 73.
[7] K. Łatka, M. Rams, R. Kmiec, R. Kruk, A.W. Pacyna,
T. Schmidt, G. Kotzyba, R. Pottgen, D. Johrendt, Acta
Phys. Polon. B 34 (2003) 1225.
[8] G.M. Sheldrick, SHELXL-97, Program for Crystal Structure
Refinement, University of Gottingen, 1997.
[9] H.D. Flack, G. Bernadinelli, Acta Crystallogr. A 55 (1999)
908.
[10] H.D. Flack, G. Bernadinelli, J. Appl. Crystallogr. 33
(2000) 1143.
[11] G. Czjzek, Mossbauer Spektroskopie: Optimale Absorber-
dicke, unpublished.
[12] K. Łatka, R. Kmiec, R. Kruk, A.W. Pacyna, T.
Fickenscher, R. Hoffmann, R. Pottgen, J. Solid State
Chem. 178 (2005) 2077.
[13] C. Wivel, S. Mørup, J. Phys. E 14 (1981) 605.
[14] P.I. Krypyakevich, V.Ya. Markiv, E.V. Melnyk, Dopov.
Akad. Nauk. Ukr. RSR, Ser. A (1967) 750.
[15] A.E. Dwight, M.H. Mueller, R.A. Conner Jr., J.W.
Downey, H. Knott, Trans. Met. Soc. AIME 242 (1968)
2075.
[16] M.F. Zumdick, R.-D. Hoffmann, R. Pottgen, Z. Nat-
urforsch. 54b (1999) 45.
[17] N. Harish Kumar, L. Menon, C.R. Venkateswara Rao,
S.K. Malik, P. Raj, A. Sathyamoorthy, K. Shashikala,
Solid State Commun. 109 (1999) 345.
[18] A. Szytu"a, J. Leciejewicz, Handbook of Crystal Structures
and Magnetic Properties of Rare Earth Intermetallics,
Boca Raton, CRC Press, 1994.
[19] K. Łatka, R. Kmiec, A.W. Pacyna, R. Mishra, R. Pottgen,
Solid State Sci. 3 (2001) 545.
[20] K. Łatka, R. Kmiec, A.W. Pacyna, T. Fickenscher,
R.-D. Hoffmann, R. Pottgen, Solid State Sci. 6 (2004)
301.
[21] H. Negishi, H. Takahasi, M. Inoue, J. Magn. Magn.
Mater. 68 (1987) 271.
[22] R. Kruk, R. Kmiec, K. Łatka, K. Tomala, R. Troc, V.H.
Tran, Phys. Rev. B 55 (1997) 5851.
[23] G. Czjzek, Mossbauer spectroscopy of new materials
containing gadolinium, in: G.J. Long, F. Grandjean
(Eds.), Mossbauer Spectroscopy Applied to Magnetism
and Materials Science, vol. 1, Plenum Press, New York,
1993 (Chapter 9).
[24] J. Gurgul, Thesis, Institute of Physics, Jagiellonian
University, Poland, 2002.