HJP BRICKS ONLINE ORDERING SYSTEM
122
Page | i HJP BRICKS ONLINE ORDERING SYSTEM ZIWEWE NYASHA DESIRE (R141730P)
-
Upload
khangminh22 -
Category
Documents
-
view
0 -
download
0
Transcript of HJP BRICKS ONLINE ORDERING SYSTEM

Page | i
HJP BRICKS ONLINE ORDERING SYSTEM
ZIWEWE NYASHA DESIRE
(R141730P)

Page | ii
By
ZIWEWE NYASHA DESIRE
Submitted in partial fulfilment of the requirements for the degree of
BSc (HONS) INFORMATION SYSTEMS
Department of Computer Science and Information Systems in the
Faculty of Science and Technology at the
Midlands State University
Gweru
OCTOBER, 2017
Supervisor: Mr. M. Giyane

Page | iii
ABSTRACT
This project focused on the development and implementation of an online ordering system
for HJP Bricks private Limited. The main aim was to eliminate some manual processes in the
ordering and selling of bricks at the organisation. The feasibility study was done with major
focus on technical, economic, and operational feasibility. Costs involved in the development,
maintenance and use of the system were estimated and weighed against the benefits. The
results of the feasibility study were satisfactory since the constraints were within the
organisation and the developer’s capacity. Risk analysis was also carried out and the results
showed that the project was less risky. A project work-plan was developed following the
favourable feasibility study and risk analysis. The project was planned where activity
sequence and time allocation were determined. Using defined methodologies in data
gathering, analysis of the system was carried out to determine if the organisation really need a
new system. Information systems related problems were identified and also the weaknesses
of the current system. The common problems affected data integrity, consistency,
completeness and reliability of an information system at the organisation. The design of the
solutions to the determined problems was done. All data-flows, processes, inputs, outputs and
relations between entities in the new system were determined. The design includes system
design, physical design, database design, architectural design and interface design. The high
level design was converted into low level design and the design specifications were converted
into working solutions. The solutions passed through different levels of testing from unit
testing to integration testing. Different testing cases were determined and the system was
tested to remove bugs. Verification and validation were done to determine if the right product
was build and if it was built correctly. The system security mechanisms were formulated and
some recommendations were given. For user training, a user manual was provided so that the
use of the system will be easy.

Page | iv
DECLARATION
I, Ziwewe Nyasha Desire, hereby declare that I am the sole author of this dissertation. I
authorize the Midlands State University to lend this dissertation to other institutions or
individuals for the purpose of scholarly research.
Signature: ……………………………………………. Date: ………………………………..

Page | v
APPROVAL
This dissertation entitled “HJP Bricks Online Ordering System” by Ziwewe Nyasha
Desire meets the regulations governing the award of the degree of BSc Honours
Information Systems of the Midlands State University, and is approved for its contribution
to knowledge and the literary presentation.
Supervisor’s Signature: ……………………………………………….
Date: …………………………………………………………………..

Page | vi
ACKNOWLEDGEMENTS
For help in the preparation of this document, designing and developing the HJP Bricks
Online Ordering System I am indebted to all the departmental staff of Computer Science and
Information Systems at the Midlands State University who contributed to the knowledge that
I have gained and to my understanding of everything that I have included in this document as
I was developing my system. I also express my sincere gratitude to all the personnel at the
HJP Bricks at Gweru plant for they helped me to understand their current system and by
answering a variety of questions I had. Special thanks go to the following people for being
my pillars of excellence and making my project a memorable one:
Mr. M. Giyane, my project supervisor who helped me throughout my project with the
provision of clear guidance and encouragement during tough times of the project.
Special thanks to you Mr. M. Giyane for making my project a success.
Mr and Mrs E Munanga and Family for your unconditional love and support when I was
going through my project.
My parents and other relatives who showed me their care during the course of the
project.
To my sisters and brothers including but not limited to Melody, Oziwell, Rejoice and Mercy
Ziwewe, I would like to say thank you for your continual support and prayers which you gave
as I was sailing through with my project. To my friends Bright and Prince I want to say thank
you for showing me the value in friendship as you shed off ignorance and fear which I had
before, I really appreciate your consistency and solid support. Takudzwa, Tichaona and Tino
I didn’t forget to thank them for the value of their indirect contribution. Above all I want to
thank the Lord my God, for being my shepherd, and guiding me through the good and tough
times.

Page | vii
DEDICATION I dedicate this work to my family members with sincere gratitude to brother Oziwell, sister
Rejoice, sister Melody and Mr and Mrs E Munanga and my friends for working tirelessly to
afford me the foundation upon which my achievement is built. These people are special for
they could give consistency and solid support without giving up. I say special thanks to you
all and may the dear Lord bless you.

Page | viii
TABLE OF CONTENTS
Contents ABSTRACT ............................................................................................................................ iii
DECLARATION..................................................................................................................... iv
APPROVAL ............................................................................................................................. v
ACKNOWLEDGEMENTS ................................................................................................... vi
DEDICATION........................................................................................................................ vii
LIST OF ACRONYMS ........................................................................................................ xvi
LIST OF FIGURES ............................................................................................................. xvii
LIST OF TABLES ................................................................................................................ xix
CHAPTER ONE: INTRODUCTION PHASE ...................................................................... 1
1.1 INTRODUCTION ............................................................................................................ 1
1.2 BACKGROUND OF THE STUDY ................................................................................ 1
1.2.1 Background of the organisation ................................................................................. 1
1.2.3 Organisational structure ............................................................................................. 1
1.2.3 Vision statement of the organisation ......................................................................... 2
1.2.4 Mission statement ...................................................................................................... 3
1.3 PROBLEM DEFINITION ............................................................................................... 3
1.4 AIM .................................................................................................................................. 3
1.5 OBJECTIVES .................................................................................................................. 3
1.6 Methods and Instruments ........................................................................................... 4
1.7 JUSTIFICATION ............................................................................................................. 4
1.8 CONCLUSION ................................................................................................................ 5
CHAPTER TWO: PLANNING PHASE ............................................................................... 6
2.1 INTRODUCTION ............................................................................................................ 6
2.2 BUSINESS VALUES ...................................................................................................... 6
2.2.1 Shareholder Values .................................................................................................... 6
2.2.2 Employee knowledge ................................................................................................ 6
2.2.3 Channel Partner value ................................................................................................ 7
2.2.4 Customer values ........................................................................................................ 7
2.2.5 Supplier value ............................................................................................................ 7
2.2.6 Managerial values ...................................................................................................... 8
2.2.7 Societal values ........................................................................................................... 8
2.3 FEASIBILITY ANALYSIS ............................................................................................. 9

Page | ix
2.3.1 Technical feasibility .................................................................................................. 9
2.3.1.1 Technical Expertise ............................................................................................ 9
2.3.1.2 Hardware requirements ...................................................................................... 9
2.3.1.3 Software ........................................................................................................... 10
2.3.1.4 Overview of technical feasibility ..................................................................... 10
2.3.2 Economic feasibility ................................................................................................ 10
2.3.2.1 Benefits ............................................................................................................ 11
a) Intangible benefits.................................................................................................... 11
b) Tangible benefits ..................................................................................................... 11
2.3.2.2 Costs ................................................................................................................. 12
a) Tangible costs .................................................................................................... 12
Intangible costs ............................................................................................................ 12
2.3.2.2.1 Development costs ........................................................................................ 12
2.3.2.2.2 Setup costs ................................................................................................ 13
2.3.2.2.3 Operational costs ....................................................................................... 13
2.3.3 Cost-Benefit Analysis .............................................................................................. 14
2.5.2.1 Return on capital employed (ROI) ................................................................... 15
2.5.2.2 Average rate of return (ARR) .......................................................................... 15
2.5.2.3 Payback period ................................................................................................. 15
2.5.3 Social feasibility ...................................................................................................... 16
2.5.4 Operational feasibility ......................................................................................... 16
2.4 RISK ANALYSIS .......................................................................................................... 17
2.4.1 Technical risks ......................................................................................................... 17
2.4.1.1 Mitigation ......................................................................................................... 17
2.4.2 Operational risks ...................................................................................................... 18
2.4.2.1 Mitigation ......................................................................................................... 18
2.4.3 Financial risks .......................................................................................................... 18
2.4.3.1 Mitigation ......................................................................................................... 18
2.4.4 External risks ........................................................................................................... 18
2.4.5 Risk management .................................................................................................... 19
2.4.5.1 Risk planning ................................................................................................... 19
2.5 STAKEHOLDER ANALYSIS ...................................................................................... 19
2.5.1 Management ............................................................................................................ 20
2.5.1.1 Negative impacts ........................................................................................ 20
2.5.2 Employees ............................................................................................................... 20

Page | x
2.5.2.1 Negative effects ............................................................................................... 20
2.5.3 Customers .......................................................................................................... 20
2.5.3.1 Negative effects .......................................................................................... 21
2.5.4 Shareholders ................................................................................................... 21
2.5.4.1 Negative impacts ........................................................................................ 21
2.5.5 Suppliers ......................................................................................................... 21
2.5.6 General conclusion............................................................................................. 21
2.6 PROJECT WORK PLAN .............................................................................................. 22
2.6.1 Gantt chart ............................................................................................................... 23
2.7 CONCLUSION .............................................................................................................. 24
CHAPTER THREE: ANALYSIS PHASE .......................................................................... 25
3.1 INTRODUCTION .......................................................................................................... 25
3.2 INFORMATION GATHERING METHODOLOGIES ................................................ 25
3.2.1 Questionnaire ........................................................................................................... 25
3.2.1.1 Advantages ....................................................................................................... 25
3.2.1.2 Disadvantages .................................................................................................. 26
3.2.1.3 Results .............................................................................................................. 26
3.2.2 Interviews ............................................................................................................ 26
3.2.2.1 Advantages ....................................................................................................... 26
3.2.2.2 Disadvantages .................................................................................................. 26
3.2.2.3 Results .............................................................................................................. 27
3.2.3 Direct observation .................................................................................................... 27
3.2.3.1 Advantages ....................................................................................................... 27
3.2.3.2 Disadvantages .................................................................................................. 27
3.2.3.3 Results .............................................................................................................. 27
3.3 Analysis of existing system ............................................................................................ 27
3.3.1 Inputs ....................................................................................................................... 28
3.3.2 Processes .................................................................................................................. 28
3.3.3 Outputs..................................................................................................................... 28
3.4 Process analysis .............................................................................................................. 28
3.4.1 Activity diagram ...................................................................................................... 29
3.5 DATA ANALYSIS ........................................................................................................ 29
3.5.1 Context diagram ...................................................................................................... 29
3.5.2 Dataflow Diagram ................................................................................................... 30
3.6 WEAKNESSES OF THE CURRENT SYSTEM .......................................................... 31

Page | xi
3.7 EVALUATION OF ALTERNATIVES ......................................................................... 32
3.7.1 Outsourcing ............................................................................................................. 32
3.7.1.1 Advantages of outsourcing .............................................................................. 32
3.7.1.2 Disadvantages of outsourcing .......................................................................... 32
3.7.2 Improvement ............................................................................................................ 33
3.7.2.1 Advantages of improvement ............................................................................ 33
3.7.2.2 Disadvantages of improvement........................................................................ 33
3.7.3 In-house development .............................................................................................. 33
3.7.3.1 Advantages of in-house development .............................................................. 33
3.7.3.2 Disadvantages of in-house development ......................................................... 34
3.7.4 Decision ................................................................................................................... 34
3.8 REQUIREMENTS ANALYSIS .................................................................................... 35
3.8.1 Functional requirements .......................................................................................... 35
3.8.1.1 Use case Diagram ............................................................................................ 36
3.8.1.1 Maintenance ..................................................................................................... 36
3.8.2 Non-functional requirements ................................................................................... 36
3.8.2.1 Usability ........................................................................................................... 37
3.8.2.2 Error handling .................................................................................................. 37
3.8.2.3 Security issues .................................................................................................. 37
3.8.2.4 Efficiency and throughput................................................................................ 37
3.8.2.5 Technical constraints ....................................................................................... 37
3.9 CONCLUSION .............................................................................................................. 38
CHAPTER FOUR: DESIGNING PHASE .......................................................................... 39
4.1 INTRODUCTION .......................................................................................................... 39
4.2 SYSTEM DESIGN ........................................................................................................ 39
4.2.1 Description of the system ........................................................................................ 39
4.2.2 Context diagram of the system ................................................................................ 40
4.2.3 Data flow diagram of the proposed system ............................................................. 40
4.3 ACHITECTURAL DESIGN.......................................................................................... 41
4.4.2 Client machines ....................................................................................................... 42
4.3.3 Server ....................................................................................................................... 43
4.4 PHYSICAL DESIGN ..................................................................................................... 43
4.5 DATABASE DESIGN ............................................................................................... 44
Source: Ricardo (2011) ..................................................................................................... 44
4.5.1a External level ......................................................................................................... 44

Page | xii
4.5.1b Conceptual level .................................................................................................... 44
4.5.1c Internal level .......................................................................................................... 45
4.5.2 Database Tables ....................................................................................................... 45
4.5.3 The enhanced entity relationship diagram ............................................................... 46
4.6 PROGRAM DESIGN .................................................................................................... 47
4.6.1 Package diagram ...................................................................................................... 47
4.6.2 Class Diagram.......................................................................................................... 48
4.6.3 Sequence diagram .................................................................................................... 49
4.7 INTERFACE DESIGN .................................................................................................. 50
4.7.1 Menu design ............................................................................................................ 51
4.7.1.1 Main menu ....................................................................................................... 51
4.7.1.2 Sub menus ........................................................................................................ 51
4.7.2 Input design ............................................................................................................. 52
4.7.3 Output design ........................................................................................................... 54
4.8 PSEUDO CODE ............................................................................................................ 55
4.8.1 Customer registration .............................................................................................. 55
4.8.2 Login ........................................................................................................................ 55
4.8.3 Order ........................................................................................................................ 55
4.8.4 Add product ............................................................................................................. 56
4.9 SECURITY DESIGN ..................................................................................................... 56
4.9.1 Physical security ...................................................................................................... 56
4.9.2 Network security...................................................................................................... 56
4.9.3 Operational security ................................................................................................. 57
4.10 CONCLUSION ............................................................................................................ 57
CHAPTER FIVE: IMPLEMENTATION PHASE............................................................. 58
5.1 INTRODUCTION .......................................................................................................... 58
5.2 CODING ........................................................................................................................ 58
5.3 TESTING ....................................................................................................................... 58
5.3.1 Black-box testing ..................................................................................................... 58
5.3.2 White box testing ..................................................................................................... 59
5.3.3 Levels of testing....................................................................................................... 59
5.3.3.1 Unit testing ....................................................................................................... 60
5.3.3.2 Integration testing ............................................................................................ 60
5.3.3.3 System Testing ................................................................................................. 60
5.3.3.4 Acceptance testing ........................................................................................... 61

Page | xiii
5.3.4 Validation ................................................................................................................ 61
Fig 5.6 Password strength validation screenshot .............................................................. 63
5.3.5 Verification .............................................................................................................. 65
5.3.5.1 Advanced search .............................................................................................. 65
5.3.5.3 Reporting.......................................................................................................... 67
5.3.5.4 Notification ...................................................................................................... 67
5.3.5.6 Database querying ............................................................................................ 69
5.3.5.7 Audit trail ......................................................................................................... 70
5.4 INSTALLATION ........................................................................................................... 71
5.4.1 User training ............................................................................................................ 71
5.4.2 File conversion ........................................................................................................ 72
5.4.3 System Changeover ................................................................................................. 72
5.4.3.1 Direct changeover ............................................................................................ 72
5.4.3.1.1 Strengths of direct changeover .................................................................. 72
5.4.3.1.2 Weaknesses of direct changeover ............................................................. 72
5.4.3.2 Parallel changeover .......................................................................................... 73
5.4.3.2.1 Strengths of parallel changeover ............................................................... 73
5.4.3.2.2 Weaknesses of parallel changeover .......................................................... 73
5.4.3.3 Pilot changeover ................................................................................................... 73
5.4.3.3.1 Strengths of pilot changeover ................................................................... 74
5.4.3.3.2 Weaknesses of pilot changeover ............................................................... 74
5.4.3.4 Phased changeover ............................................................................................... 74
5.4.3.4.1 Strengths of phased changeover................................................................ 75
5.4.3.4.2 Weaknesses of phased changeover ........................................................... 75
5.4.4 Selection and justification ....................................................................................... 75
5.5 MAINTENANCE........................................................................................................... 76
5.5.1 Structured maintenance ........................................................................................... 76
5.5.1.1 Preventive maintenance ........................................................................................ 76
5.5.1.2 Adaptive maintenance .......................................................................................... 77
5.5.1.3 Corrective maintenance ........................................................................................ 77
5.5.2 Unstructured maintenance ........................................................................................... 77
5.5.3 User manual ............................................................................................................. 77
5.5.4 System review.......................................................................................................... 78
5.5.5 System backup service............................................................................................. 78
5.6 RECOMMENDATIONS ............................................................................................... 78

Page | xiv
5.6.1 Recommendations to users ...................................................................................... 78
5.6.2 Recommendations to the Information Technology personnel ................................. 79
5.6.3 Recommendations to the management .................................................................... 79
5.6.4 System objectives versus solutions.......................................................................... 79
5.6.5 Suggested improvements ......................................................................................... 80
5.7 CONCLUSION .............................................................................................................. 80
REFFERENCE LIST ........................................................................................................... 81
APENTIX A: USER MANUAL .......................................................................................... 85
General Requirements of the System ............................................................................... 85
User interfaces and their interaction ................................................................................. 85
User Login ........................................................................................................................ 86
Wrong details .................................................................................................................... 86
Change password .............................................................................................................. 87
Modifying database data ................................................................................................... 88
Adding and editing bricks................................................................................................. 88
Salesmen audit .................................................................................................................. 89
Exporting data................................................................................................................... 89
Advanced searching .......................................................................................................... 90
Conclusion ........................................................................................................................ 90
APPENDIX B: INTERVIEW GUIDELINE USED FOR THE RESEARCH ..................... 91
Section 1: Interview details .............................................................................................. 91
Section 2: Interview questions .......................................................................................... 91
APPENDIX C: QUESTIONNAIRE CHECKLIST ............................................................. 92
Observations ..................................................................................................................... 94
Inputs............................................................................................................................ 94
Processes ...................................................................................................................... 94
Outputs ......................................................................................................................... 94
Entities involved .......................................................................................................... 94
APPENDIX F: SNIPPET OF CODE ................................................................................... 95
User Login ........................................................................................................................ 95
Add products..................................................................................................................... 95
Order ................................................................................................................................. 96
Dashboard with charts ...................................................................................................... 97
Displaying database data (products) ................................................................................. 99
HTML design sample (signup page) .............................................................................. 100

Page | xv
CSS setting sample ......................................................................................................... 101

Page | xvi
LIST OF ACRONYMS ARR…………………………………………………………………..Annual Rate of Return
CBA……………………………………………………………..…….Cost-Benefit Analysis
CD………………………………………………….…………………………….Compaq Disk
CSV…………………………………………………………...….….Comma Separated Values
DBMS……………………………………………………….....Database Management System
DFD…………………………………………………………….………….Data Flow Diagram
EER…………………………………………………....Enhanced Entity Relationship Diagram
FTP…………………………………………….……………….………..File Transfer Protocol
HTML……………………………………………………….…Hyper Test Mark-up Language
HTTP………………………………………….…………………Hyper Test Transfer Protocol
IP…………………………………………………………………………...…Internet Protocol
IT……………………………………………………………..……….Information Technology
MSU…………………………………………………………..….....Midlands State University
PDF…………………………………………………………...……….Portable Document File
PHP……………………………………………………......Personal Home Page Pre-Processor
R.O.I……………………………………………………….......………..Return On Investment
SQL………………………………………………………….…….Structured Query Language
USB……………………………………………………………………….Universal Serial Box

Page | xvii
LIST OF FIGURES Fig 1.1 Organisational structure……………….……………………..………………………..2
Fig 2.1 Gantt chart………………………………………………………………...………….24
Fig 3.1 Activity diagram of the current system…………………….…………………...........29
Fig 3.2 Context diagram of the current system………………………………………………30
Fig 3.3 Data flow diagram of the current system……………………….……………………31
Fig 3.4 Use case diagram ……………………………………………..……………………..34
Fig 4.1 Context diagram of the new system…………………………………………………40
Fig 4.2 Data flow diagram of the new system…………….…………………………………41
Fig 4.3 System Architecture……………………….…………………………………………43
Fig 4.4 Physical setup of the system…………………………………………………………43
Fig 4.5 Three levels architecture……………………..………………………………………44
Fig 4.6 Enhanced Entity relationship diagram…………..………………..………………….47
Fig 4.7 Package diagram of the new system…………………………………………………48
Fig 4.8 UML class diagram…………………………………..………………………………49
Fig 4.9 Sequence diagram of the system……………………….…………………………….50
Fig 4.10 Main menu………………………………………………………………………….51
Fig 4.11 Sub menu 1………………………………………………...……………………….52
Fig 4.12 Customer login form………………………………………………………………..53
Fig 4.13 Customer registration form…………………………………………………………54
Fig 4.14 Input form for adding products…………………………………………………….54
Fig 4.15 Output table for products…………………………………………….……………..59
Fig 5.1 Black box………………………………………………………………...…………..59
Fig 5.2 White box…………………………………………………………………………….60
Fig 5.3 Levels of testing………………………………………...……………………………60

Page | xviii
Fig 5.4 Omission validation check screen shot…………………...………………………….61
Fig 5.5 Input type validation screen shot…………………………………………………….62
Fig 5.6 Password strength validation screen shot……………………………………………63
Fig 5.7 Password verification screen shot……………………………………………………64
Fig 5.8 Input validation screen shot………………………………….………………………65
Fig 5.9 Login security screen shot……………………………………...……………………66
Fig 5.10 Maximum order validation screen shot………………………….…………………66
Fig 5.11 Advanced search page ……………………………………………..……………….66
Fig 5.12 Export data page……………………………………………………………………67
Fig 5.13 Product report………………………………………………………………………67
Fig 5.14 Dashboard screen shot ……………………………………………………………..68
Fig 5.15 User account management screen shot……………………………………….…….68
Fig 5.16 Security enforcement screen shot…………………………………………………..69
Fig 5.17 Adding products to the database…………………………………………………..69
Fig 5.18 Deleting database data……………………………………………………………...70
Fig 5.19 Editing products from database...…………………………………………………..70
Fig 5.20 Audit trail screen shot………………………………………………………………71
Fig 5.17a Direct changeover…………………………………………………………………72
Fig 5.17b Parallel changeover……………………………………………………………......73
Fig 5.17c Pilot changeover…………………………………………………………………...74
Fig 5.17d Phased changeover………………………………………………………………...75
Fig 5.18 Structured maintenance……………………………………………………………..75
Fig 5.19 Unstructured Maintenance………………………………………………………….77

Page | xix
LIST OF TABLES
Table 2.1 Cost of hardware resources needed………………………………………….……10
Table 2.2 Tangible benefits………………………………………………………………..…11
Table 2.3 Development costs………………………………………………………………...12
Table 2.4 Setup costs……………………………………………………………………..…..13
Table 2.6 Payback period of the project………………………………………………….…..16
Table 2.7 Project work plan……………………………………………………………….....23
Table 3.1 Comparison of methodologies…………………………………………………….35
Table 4.1 Comparison of client server versus stand-alone application………………………41
Table 4.2 Customer details…………………………………………………………………...44
Table 4.3 User cart…………………………………………………………………………...44
Table 4.4 Products table……………………………………………………………………...45
Table 4.5 Admin Table ………………………………………………………………………45
Table 4.6 Payments…………………………………………………………………………..45

Page | xx
LIST OF APPENDICES
Appendix A: User Manual….…………………………………………………………….….73
Appendix B: Interview checklist …………………………………………………………….79
Appendix C: Questionnaire check list……………………………………………………..…80
Appendix D: Observation score sheet………………………………………………………..82
Appendix E: Snippet of code………………………………………………………………...83

Page | 1
CHAPTER ONE: INTRODUCTION PHASE
1.1 INTRODUCTION
This chapter will outline the aim of the research outlining the drivers of the system
development process and the fore mentioned solutions. In this phase, the issues relating to
information systems are outlined. The background information of the HJP bricks pvt ltd and
its industrial environment are well outlined. The problem definition of the organisation in
relation to information technology are included in this introductory phase.
1.2 BACKGROUND OF THE STUDY
The aim of this project was to develop an online ordering system of the HJP Bricks. The
motives were driven from the information systems related problems at the organisation. The
main focus was to automate the ordering of bricks and report generation. A computerised
system was found as a suitable solution to the problems and weaknesses of the current
manual system. The researcher found it necessary to develop a system that allow online
ordering of bricks.
1.2.1 Background of the organisation
HJP is a brick selling company which was build and start working in August 2004. The name
HJP was derived from the initials of the founders’ names Honest and James Panganai. HJP
Bricks is located in the Midlands Province in Gweru district under Mambo location. This
company sells bricks of different types and sizes. The bricks include common burnt, sand
lime, clay burnt and concrete bricks. The organisation went through a phenomenal evolution
process. The company survived the times of economic hardships of 2008 when it was close to
shut down. In 2008 the work-force was reduced to five people. HJP Bricks rebounced in 2009
and enjoyed a rapid growth and increased its work-force to thirty-five in 2017. Currently the
organisation is building two plants in Harare and Bulawayo.
1.2.3 Organisational structure
According to Jacobides (2007), organisational structure shows the relationships,
accountability and authority within a defined setup. Levels of authority determines the
channels of communication, span of control and chain of command. There are many types of
organisational structures which can be used by organisations. Types of organisational
structures include functional structure commonly known as bureaucratic structure. In
functional structure, the functions divide the company based on their specialty for example

Page | 2
production, marketing, human resources and Information Technology departments
(Jacobides, 2007). More so there are divisional structures were the organisations’ leaderships
are structured according to different projects or products. There is also a matrix structure in
which employees have multiple superiors and reporting lines. Workers report to a divisional
manager and also have project managers for some specific projects. HJP Bricks adopted a
functional structure where there are the production, marketing, finance and the Human
Resource management departments. An Organisational structure is represented using an
organisational chart. An organisational chart is a pictorial tool used to depict the
organisational structure. The organisational chart for HJP Bricks is shown in fig 1.1.
Fig.1.1 HJP Bricks Organogram
Source: Ozdem (2011)
1.2.3 Vision statement of the organisation
A Vision statement is defined as an account which shows the desired destination by an
organisation in a specified time frame (Ozdem, 2011). A vision statement is used as a
yardstick by an organisation. HJP Pvt ltd vision statement is to be the dominant figure in
providing building material in the province and country as a whole.
DIRECTOR
production manager
staff
marketing manager
staff
Planning Officer
staff
finance manager
staff
General manager
Page | 3
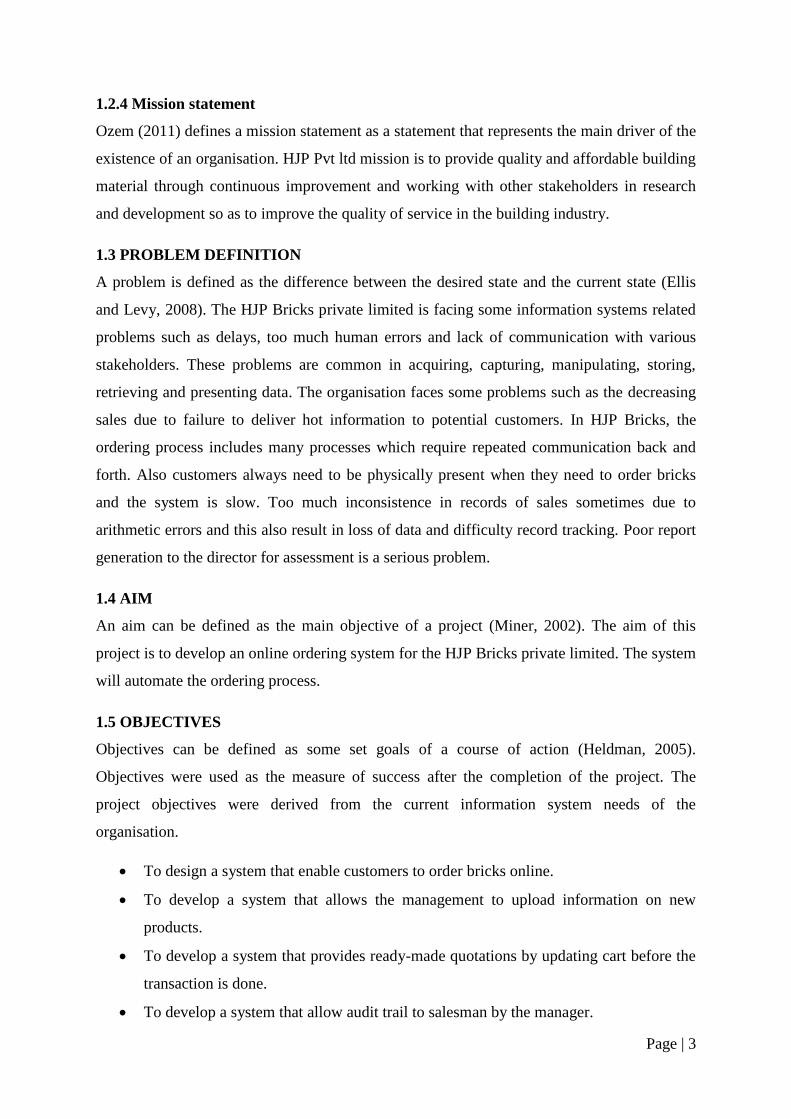
1.2.4 Mission statement
Ozem (2011) defines a mission statement as a statement that represents the main driver of the
existence of an organisation. HJP Pvt ltd mission is to provide quality and affordable building
material through continuous improvement and working with other stakeholders in research
and development so as to improve the quality of service in the building industry.
1.3 PROBLEM DEFINITION
A problem is defined as the difference between the desired state and the current state (Ellis
and Levy, 2008). The HJP Bricks private limited is facing some information systems related
problems such as delays, too much human errors and lack of communication with various
stakeholders. These problems are common in acquiring, capturing, manipulating, storing,
retrieving and presenting data. The organisation faces some problems such as the decreasing
sales due to failure to deliver hot information to potential customers. In HJP Bricks, the
ordering process includes many processes which require repeated communication back and
forth. Also customers always need to be physically present when they need to order bricks
and the system is slow. Too much inconsistence in records of sales sometimes due to
arithmetic errors and this also result in loss of data and difficulty record tracking. Poor report
generation to the director for assessment is a serious problem.
1.4 AIM
An aim can be defined as the main objective of a project (Miner, 2002). The aim of this
project is to develop an online ordering system for the HJP Bricks private limited. The system
will automate the ordering process.
1.5 OBJECTIVES
Objectives can be defined as some set goals of a course of action (Heldman, 2005).
Objectives were used as the measure of success after the completion of the project. The
project objectives were derived from the current information system needs of the
organisation.
To design a system that enable customers to order bricks online.
To develop a system that allows the management to upload information on new
products.
To develop a system that provides ready-made quotations by updating cart before the
transaction is done.
To develop a system that allow audit trail to salesman by the manager.

Page | 4
To create a system that allows stakeholders to send their suggestions and opinions
concerning the operations of HJP.
To develop a system that automatically generates order reports to the manager.
To design a system that allows the director to blacklist untrusted customers.
1.6 Methods and Instruments
Instruments are the technologies which are going to be used in the development process
including the development environment (Edward, 2003). Developers opt for different tools
because of reasons such as experience, personal preference, availability and nature of the
product. In this project preferred technologies include the following. Dreamweaver cs6 and
PHP Runner are the coding environments used to write php, cascading style sheets (css),
Hypertext mark-up language (HTML) codes. Xampp was used for database management in
which Apache and MySQL services were the most needed. The operating system used is
windows 8 on an HP laptop model 255. A chrome browser was used for testing and searching
for online help. The security mechanism required an antivirus to protect the system in which
AVG antivirus being the favourite. Internet connection was one of the most needed resources
for research purposes.
In data collection, different methods were used. These methodologies are interviews,
questionnaires and observations. The methodologies were used to collect qualitative and
quantitative primary data. A detailed account of the methodologies is given in chapter three.
Secondary data was collected on the table were pamphlets and the internet were the most
used sources of secondary data.
1.7 JUSTIFICATION
Justification outlines the worthiness of the system in addressing the current problems and if it
can add value to the organisation according to Cooper (2005). In justification, the system may
increase the market base of HJP through web advertising, consistence in data capturing and
record keeping. The system will reduce the risk of fraud at all levels of the hierarchy due to
comprehensive data capturing and report generation as well as record keeping. Strict
authentication on the system makes it more powerful in preserving the integrity, consistence
and completeness of data. Audit trail will help in supervision of salesmen activities in
database data modification. The system will cover a wide geographical area in spreading
information about the bricks on sale. More so a reduction in human effort, error reduction and
the generation of comprehensive reports with consistent format can justify the worth of the

Page | 5
new system. The manager can easily see the contribution to sales for all types of bricks. The
system will notify the manager about bought products which are not yet taken by the
customers. The level of bricks not collected will be provided in form of charts which allow
him to notify customers in-order to free the space on the premise.
1.8 CONCLUSION
The background of the study, organisational structure of HJP Bricks private limited and the
way it operates. Proposed solutions were outlined and justified in this chapter which shows
that the system may be add value to the organisation. Given the aforementioned methods and
instruments for executing the plan, a detailed plan may need to be carried out which is
outlined in the next chapter. The main focus is on planning and stressing the main activities
to be carried out and to determine their sequential order. The allocated time for each activity
will also be shown in the form of a workplan and a gantt chart.

Page | 6
CHAPTER TWO: PLANNING PHASE
2.1 INTRODUCTION
Chapter one introduced this project as a whole. It also outlined information technology and
communication related problems encountered by HJP Bricks. Problem definition outlined the
need of a new system. To develop that system, a plan was needed. This chapter focuses on
the project feasibility taking into account the organisational values and resources. The
feasibility study was conducted and the results were positive. A risk analysis was also done
and the results showed that the project is less risky. A work-plan will be outlined following
satisfactory results of the feasibility study and the risk analysis.
2.2 BUSINESS VALUES
Steward (2006) mentioned that business values are the expected benefits or gains from a
course of action taken in regard of the business. In this context the business values to be
considered comes as a result of the operation of the new system. The significance of the
system to the success of the organisation and also the attainment of organisational needs need
to be analysed. The effects of the HJP Bricks online ordering system to both internal and
external stakeholders is going to be determined in this chapter through cost and benefit
analysis to see if there is a positive move or not.
The HJP Online brick ordering and selling system’s anticipated gains are as follows:
2.2.1 Shareholder Values
Alexander and William (2011) define shareholders as the residual owners of the company
who can claim profits as well as suffer loss. By the introduction of the new systems they must
be better off for the system to be considered a success.
Increase the market base through wide coverage which may increase sales.
Efficiency in business processes which may widen the margin of safety.
Appreciation of the value of shares on the market.
2.2.2 Employee knowledge
The introduction of the new system may result in a raised motivation level of the
workforce due to technological advancement.

Page | 7
Employee workloads may be reduced because some of the activities which are
currently done by them will be then taken by the system itself and the customers will
sometimes do it themselves.
2.2.3 Channel Partner value
According to Steward (2006) a channel partner is a company or an entity that partners with a
manufacturer or producer to market and sell the manufacturer's products, services, or
technologies. This is usually done through a co-branding relationship. Channel partners may
be distributors, vendors, retailers and consultants. The new system will add value to the
current and future channel partners of the HJP Bricks in different ways.
There will be smooth flow of information.
There may be technological integration with channel partners which may improve
business processes in terms of speed, accuracy and reliability.
There may be value addition to the products and services which may increase
profitability.
2.2.4 Customer values
Throughput is going to increase because some of the processes will be eliminated
such as sending enquiries and preparation of quotations since ready-made solutions
will be available on the website.
Response time in ordering will solely depend on the strength of user network and
speed of the machines since queuing will be eliminated
Customers do transactions on their own over the web and pay online which allow
them to work on their time rather than to be limited by the premises’ opening and
closing of doors.
2.2.5 Supplier value
Suppliers provide raw materials and or finished products. They will benefit in the following
manner.
Just in time supply can be justified due to clear processing and communication.
Suppliers will also benefit if HJP suppliers can sell more since they are the source of
the products.

Page | 8
2.2.6 Managerial values
Managerial values are the anticipated benefits of the system to the management which comes
as a result of the use of the new system (Steward, 2006). Some of the expected managerial
benefits are outlined below.
The management may gain trust from various stakeholders due to increased efficiency
and effectiveness in HJP operations.
Security will be increased since access to the system will be restricted for those
without access privileges.
The management can easily manage transactions since most of the work will be done
electronically.
There may be reduction in errors because of automation and at the same time the
employment of data constraints in capturing details may help in managing datatypes
and all information about an individual may lessen the burden to the management in
handling those error corrections.
It may reduce the amount of resources needed in terms of stationary and time and the
requirements will be easily estimated long before which may reduce their planning
efforts.
Improved security, response time and consistence in the organisation concerning
transaction processing through the use of private authentication credentials for
customers and the management to protect data from unauthorised access.
Reports may be generated so easily in a consistent manner.
Transactional stationary costs may be saved significantly in the sense that e-resources
are diminishable and it promotes simultaneous access.
Auditing may be a great value addition element to the management since they can
monitor database data modification.
2.2.7 Societal values
If the system resulted in growing of the organisation, employment will be created
which will benefit the local community.
The society will benefit if the Greening of IT technology is followed.
Creation of employment is a significant societal value.

Page | 9
2.3 FEASIBILITY ANALYSIS
According to Stuhlman (2006), feasibility can be described as the attainability of some
objectives with given resources in a specified time frame. Feasibility study is concerned with
the determination of the attainability of a project. Feasibility can be subdivided into
operational, economic and technical feasibility.
2.3.1 Technical feasibility
This is more concerned with the capacity of the available technical resources and instruments
in the development, maintenance and support the system in an effective and efficient way
within a specified time period (Stuhlman, 2006). The power of the developer to come up with
a right product at the right time using the available resources is a serious issue of concern in
technical feasibility study. Technical feasibility can be categorised into two sub categories
namely technical expertise and hardware and software constraints.
2.3.1.1 Technical Expertise
Heldman (2005) defined technical expertise as the level of technical knowhow in a project
team. Project success has a bearing on technical expertise. This project requires enough
knowledge in PHP programming language and MySQL. A range of skills are needed in
interface designing, query settings and testing. Technical expertise stretches from the
developer to the users. The ability of the developer to produce the required product in time
within the budget can be used as a measure of technical success. The salesmen and the
managers of the HJP Bricks are familiar in working with some computerised systems.
2.3.1.2 Hardware requirements
These are the development tools that are employed by the developer in the development and
maintenance of the new system (Hay, 2003). Hardware are the physical tools that were used
in the development process and are still needed maintenance. The organisation need to
acquire in order to ensure that all the needed resources are available in time. For the success
of the system there is need for computer hardware, electricity, software, internet connections
and other consumables. The power source must be reliable that is less interruptions. A server
is needed and one machine connected to the server in-order to access the system files. The
system need to run on a 64-bit processor with at least 64 GB RAM and at least 500GB Hard
drive. An external disk is needed for backup.
Page | 10
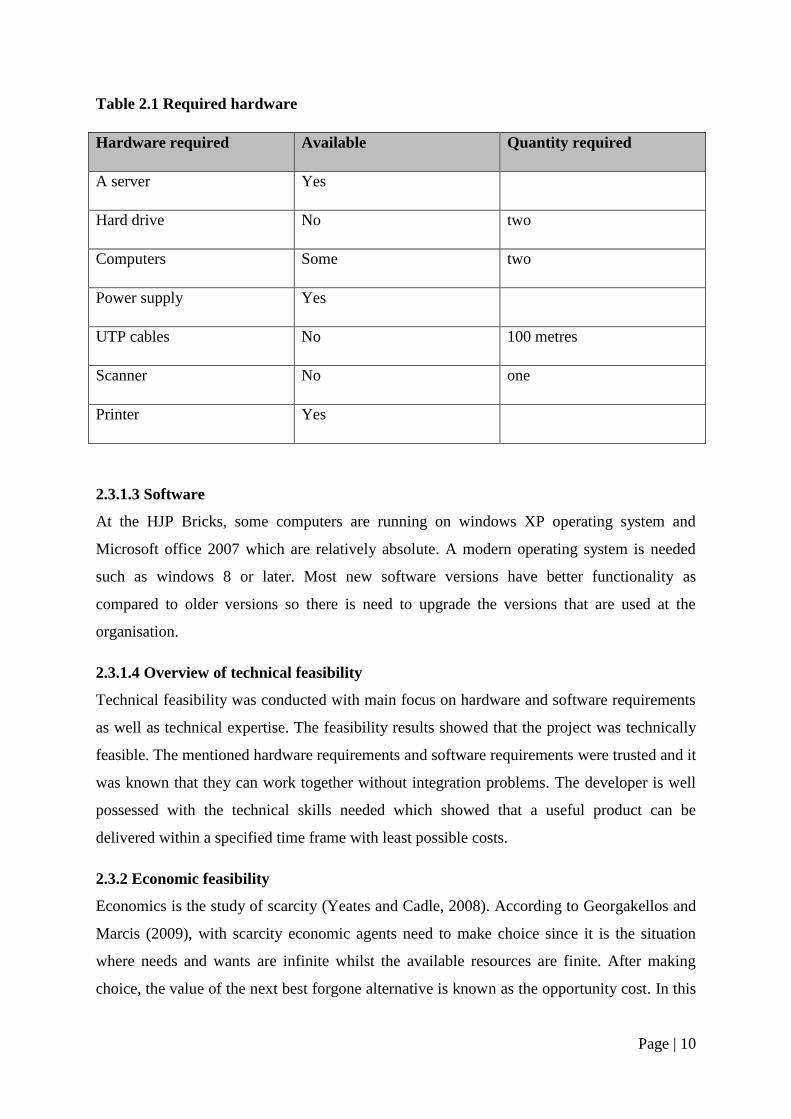
Table 2.1 Required hardware
Hardware required Available Quantity required
A server Yes
Hard drive No two
Computers Some two
Power supply Yes
UTP cables No 100 metres
Scanner No one
Printer Yes
2.3.1.3 Software
At the HJP Bricks, some computers are running on windows XP operating system and
Microsoft office 2007 which are relatively absolute. A modern operating system is needed
such as windows 8 or later. Most new software versions have better functionality as
compared to older versions so there is need to upgrade the versions that are used at the
organisation.
2.3.1.4 Overview of technical feasibility
Technical feasibility was conducted with main focus on hardware and software requirements
as well as technical expertise. The feasibility results showed that the project was technically
feasible. The mentioned hardware requirements and software requirements were trusted and it
was known that they can work together without integration problems. The developer is well
possessed with the technical skills needed which showed that a useful product can be
delivered within a specified time frame with least possible costs.
2.3.2 Economic feasibility
Economics is the study of scarcity (Yeates and Cadle, 2008). According to Georgakellos and
Marcis (2009), with scarcity economic agents need to make choice since it is the situation
where needs and wants are infinite whilst the available resources are finite. After making
choice, the value of the next best forgone alternative is known as the opportunity cost. In this

Page | 11
project the budget constraint must be considered so that rational decisions can be made. It is
more concerned with the economic costs benefits derived from developing and
implementation of the new system by the organisation. The assessment is done through Cost-
Benefit analysis in which benefits are weighed against costs.
2.3.2.1 Benefits
Benefits are the gains that are enjoyed by an organisation following a course of action
(Horngren, Harison and Bamber, 2004). Benefits are put into sub categories namely tangible
and intangible benefits.
a) Intangible benefits
According to Oliver and Horngren (2009), intangible benefits are the benefits which can not
be quantified but sometimes can be indirectly given monetary value. They are difficult to
measure but lack of these benefits will lead to significant costs to the organisation. Some of
the intangible benefits are as follows;
The use of a computerised system will may boost employee morale.
Reduction in the margin of error such as arithmetic errors.
Reduction in workloads for employees due to online ordering.
Quality and consistent reports will be generated.
Robust security to protect data through authentication, backup and validation.
b) Tangible benefits
Tangible benefits can be defined as the paybacks of a project that have a quantifiable value
(Oliver and Horngren, 2009). They are usually given monetary values. The business may
have some benefits from the use of the system. Table 2.2 shows the anticipated tangible
benefits.

Page | 12
Table 2.2 Tangible benefits
Benefit Year 0 US$ Year 1 US$ Year 2 US$
Reduction in stationary
costs
2500 2500 2500
Reduction in storage costs 1500 1500 1500
Increased productivity 6000 6500 7000
Reduction in labour costs 3000 3000 3000
Total 11300 13500 14000
2.3.2.2 Costs
Horngren et al. (2004) define costs as the esteem that is paid to acquire, convey, accomplish
or to attain something. The HJP Bricks online ordering system is associated with
development and implementation. The expenses are grouped into tangible and intangible
costs.
a) Tangible costs
Tangible costs can be defined as the expenses incurred during the course of a project that can
be quantified (Oliver and Horngren, 2009). Tangible costs have absolute monetary values
directly assigned to them. The business incurs some costs during the development and
implementation of the system.
Intangible costs
According to Oliver and Horngren (2009), intangible costs are the expenses which can not be
quantified but sometimes can be indirectly given monetary value. They are difficult to
measure but existence of these costs will lead to significant reduction of the margin of safety.
2.3.2.2.1 Development costs
Development costs are the costs incurred during the development of the system. These
include consumables, labour and raw materials.

Page | 13
Table 2.3 Development costs
Description Costs (US$)
Labour 2000
Hardware requirements 11500
Software requirements 500
Total 14000
2.3.2.2.2 Setup costs
Setup costs can be defined as the incurred expenses during integration of the system to the
operational environment. They include setting up of the hardware in the workplace,
installation and file conversion.
Table 2.4 Setup costs
Description Costs (USD$)
Physical setup 1100
Installation 400
File conversion 200
Total 1700
2.3.2.2.3 Operational costs
Operational costs are the costs that are incurred during the use of the system. They are
directly linked to the system requirements such as labour, network subscription, maintenance
to mention but a few.
Page | 14
Table 2.5 Operational costs
Description Year 0 (US$) Year 1(US$) Year 2(US$)
Hardware maintenance 650 700 1200
Software maintenance 550 480 600
Stationary and computer
consumables
1810 1320 1300
User training 1290 1000 400
Total operational costs 4300 3500 3500
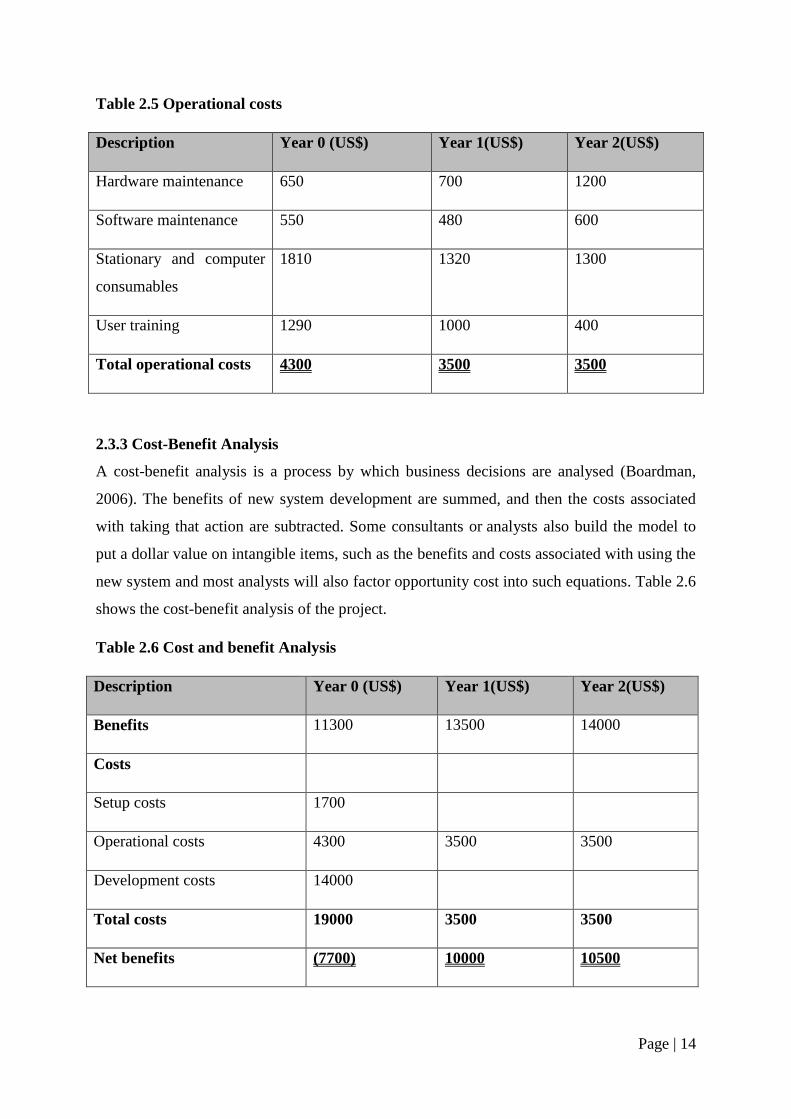
2.3.3 Cost-Benefit Analysis
A cost-benefit analysis is a process by which business decisions are analysed (Boardman,
2006). The benefits of new system development are summed, and then the costs associated
with taking that action are subtracted. Some consultants or analysts also build the model to
put a dollar value on intangible items, such as the benefits and costs associated with using the
new system and most analysts will also factor opportunity cost into such equations. Table 2.6
shows the cost-benefit analysis of the project.
Table 2.6 Cost and benefit Analysis
Description Year 0 (US$) Year 1(US$) Year 2(US$)
Benefits 11300 13500 14000
Costs
Setup costs 1700
Operational costs 4300 3500 3500
Development costs 14000
Total costs 19000 3500 3500
Net benefits (7700) 10000 10500

Page | 15
2.5.2.1 Return on capital employed (ROI)
Return on investment (ROI) measures the gain or loss generated on an investment relative to
the amount of money invested (Joshua, 2015). ROI is usually expressed as a percentage and
is typically used for personal financial decisions, to compare a company's profitability or to
compare the efficiency of different investments. The formula for calculating ROI and the
calculation on this project is shown below.
𝑅. 𝑂. 𝐼 =(𝑇𝑜𝑡𝑎𝑙 𝑏𝑒𝑛𝑒𝑓𝑖𝑡𝑠 − 𝑇𝑜𝑡𝑎𝑙 𝑐𝑜𝑠𝑡𝑠)
𝑇𝑜𝑡𝑎𝑙 𝑐𝑜𝑠𝑡𝑠∗ 100
=(38800 − 26000)
26000∗ 100 = 49.23%
The above calculation confirm a positive return on capital investment meaning that the
project is favourable concerning this method of project appraisal.
2.5.2.2 Average rate of return (ARR)
Average rate of return (ARR) is the ratio of capital employed to average rate of return for an
accounting period according to Joshua (2015). It can be calculated using the following
formula.
𝐴𝑣𝑒𝑟𝑎𝑔𝑒 𝑝𝑟𝑜𝑓𝑖𝑡
𝐶𝑎𝑝𝑖𝑡𝑎𝑙 𝑒𝑚𝑝𝑙𝑜𝑦𝑒𝑑∗ 100
(7700) + 10000 + 10500
314000
× 100
4600
14000× 100 = 32.86%
The project can be considered worth and taken since it showed a high average rate of return.
2.5.2.3 Payback period
Payback period can be referred to as the time it take for a project to breakeven and normally
projects with a shorter payback period are preferred (Stuhlman ,2006). Basing on the above
information the payback period can be calculated as follows.

Page | 16
Table 2.7 Payback period.
Year Annual cash flows Cumulative cash flows
0 (19000) (19000)
1 11300 (7700)
2 13500 3600
3 14000
4 3100
5 3100
The investment has a payback period of 1 year 7months which justify the worthiness of the
project since the time needed to recover initial costs is very short.
2.5.3 Social feasibility
The HJP Bricks online ordering system may affect the society in various ways. Social
feasibility mainly focuses on both negative and positive impacts of the system to the
organisation and stakeholders (Cadle, 2008). Some of the foreseen impacts of the system are
outlined as follows:
The workforce is less likely to resist the system since preliminary results of
the research shows that they are hungry for a new system.
It may challenge other companies to improve their technology services.
The project will create jobs for different qualified experts and general workers
in the organization
2.5.4 Operational feasibility
Cadle (2008) defines operational feasibility as the process of determining whether the
proposed system will become a reality in business operations. Concerning operational
feasibility the system will be a success if coded and managed properly since it can substitute
the current system and may give the expected benefits. Users may be provided with adequate
training and supplementary documents to be provided so that they can operate the system
without facing challenges. The system is going to be developed with user friendly commands,

Page | 17
sound and meaningful user interfaces. The system will allow customers to view available
products in stock and place their order online and can also make payments anytime
anywhere. According the gathered information the results are as follows:
The company’s directors showed interests in the development of a computerised
system. They may provide maximum support to the use of the system. They promised
to mobilise staff to increase commitment to work with the system provided the system
is developed correctly.
The system may be supported by the reliability of internet service providers as well as
electricity supply.
Using the system does not need technical expertise but just computer literacy since
the users do not need to worry about internal functioning of the system but only
results.
2.4 RISK ANALYSIS
Risk can be defined as the probability of the occurrence of an adverse effect and its
associated impact (Adder, 2008). There are different categories of risks namely technical
risks, financial risks and external risks.
2.4.1 Technical risks
The probability of loss incurred through the execution of a technical process in which the
outcome is uncertain (Zahirul, 2005). Untested engineering, technological or manufacturing
procedures entail some level technical risk that can result in the loss of time, resources, and
possibly harm to individuals and facilities. Technical risk is measured as an expected value
derived from prior experience that led to undesirable results. Technical risks that may evolve
include the following;
Malicious software such as viruses, logic bombs and Trojans.
Input errors
Fraud
Employee harm
Power cuts
Software failure
2.4.1.1 Mitigation
Backup facility for data to survive hardware and software failures.

Page | 18
Strong validation scheme to check input.
Audit trail mechanism was developed to ensure that the manager can see database
activities of users.
2.4.2 Operational risks
Operational risk summarizes the risks a company undertakes when it attempts to operate
within in a certain way (Ader, 2008). According to Zahirul (2005), operational risk is the risk
not inherent in financial, systematic or market-wide risk. It is the risk remaining after
determining financing and systematic risk, and includes risks resulting from breakdowns in
internal procedures, people and systems.
2.4.2.1 Mitigation
Adequate user training with compliment of user manual.
Proper research was done for possible future changes and user requirements analysis.
2.4.3 Financial risks
Financial risk is any of various types of risk associated with financing, including financial
transactions (Zahirul, 2005). The development of a new system is associated with some
financial risks. Often it is understood to include only downside risk, meaning the potential for
financial loss and uncertainty about recovering costs. The risk analysis was done and it
showed that the project is associated with less financial risks.
2.4.3.1 Mitigation
Appropriate budgeting schemes were used and need to be continuously revised.
Cash-flow forecasts were done with the help with forecasting agents.
2.4.4 External risks
According to Adder (2005), external risks are the risks that are produced by a non-
human source and are beyond human control. They are unexpected but happen regularly
enough in a general population to be broadly predictable. In other words these are the risks
that are external to the project and the project manager can not control. Good examples of
external risks are changes in government legislation, changes in strategy from senior
managers, and the economy.

Page | 19
2.4.5 Risk management
Risk management is the process of identification, analysis and acceptance or mitigation of
uncertainty in investment decisions (Allan, 2011). Essentially, risk management occurs any
time a project manager analyses and attempts to quantify the potential for losses in an
investment and then takes the appropriate action in relationship to investment
objectives and risk tolerance. Risk management starts with proper risk planning.
2.4.5.1 Risk planning
According to Allan (2011) risk management plan is a document that a project
manager prepares to foresee risks, estimate impacts, and define responses to issues. It also
contains a risk assessment matrix. Risks can be dealt with in different ways namely risk
avoidance, mitigation, transfer and acceptance.
Risk avoidance- these are the planned activities done to prevent or minimise the
chances of the occurrence of an adverse effect. A deep stakeholder analysis to avoid
resistance was carried out.
Risk mitigation - A systematic reduction in the extent of exposure to a risk and/or the
likelihood of its occurrence. Also called risk reduction. For example user involvement
throughout the development process to avoid misunderstanding.
Risk transfer – this is when the costs associated with risks are transferred to another
entity so that the organisation will not bear the risks. Insurance was taken as the best
way to transfer risks of hardware destruction.
Risk acceptance - A risk management method used in the business or investment
field. Accepting risk occurs when the cost of managing a certain type of risk is
accepted, because the risk involved is not adequate enough to warrant the added cost
it will take to avoid that risk.
2.5 STAKEHOLDER ANALYSIS
Stakeholders are the individuals groups that have direct interest in the business (Cameron,
Seher and Grawley, 2010). According to Cameron et al (2010), stakeholder analysis is the
process of identifying the individuals or groups that are likely to affect or be affected by a
proposed action, and sorting them according to their impact on the action and impact the
action will have on them this information is used to assess how the interests of those
stakeholders should be addressed in a project plan, policy program, or other action.
Stakeholder analysis is a key part of stakeholder management. Stakeholders include but not

Page | 20
limited to shareholders, management, customers, government, competitors, suppliers and
employees.
2.5.1 Management
Management can be defined as the drivers of the organisation who plan, lead and control
organisational activities (Cadle and Yeats, 2008). The management will be better off as per
results of the research. Managers have a clear and accurate report on audit trail, sales, orders
and user management. Since the introduction of the new system will result in costs reduction
and sales increase this means the profits will go up. Profitability is used as a strong measure
of business success. Employee motivation as a result of an automated system will allow the
manger to hold a wide span of control.
2.5.1.1 Negative impacts
The management are likely to face some novel challenges as a result of using the new
system. This will require extra effort.
Management may face resistance to change from employees.
Change management maybe a tough task for the management.
There is need to change the strategic plan.
2.5.2 Employees
Employees are the day to day workers who frequently interact with the new system (Fleming,
2005). As per research, employee work will be reduced because of automation. More so
increase in profitability may strengthen their bargaining power for higher wages.
2.5.2.1 Negative effects
Some employees may feel insecure since some of their responsibilities will be taken
by the system.
Some employees are likely to lose their jobs.
There is also need for realignment in the work place which may demotivate other
employees.
2.5.3 Customers
According to Faria (2001), customers are one of the most important stakeholders who are
seen as the cash cows of the organisation. Due to the introduction of the online ordering
system, customers’ effort during the ordering process may be reduced. Some processes that
needed more physical effort will be eliminated by the system such as sending enquiry, wait

Page | 21
for quotation and then place order. Customers will get ready made quotations by just adding
products to a shopping cart. Customers will do orders with the comfort of their homes so they
are saved on transport costs. They are also able to manage their orders.
2.5.3.1 Negative effects
Some customers do not have internet access so it will be a challenge for them to use a
new system
2.5.4 Shareholders
Shareholders are the owners of the business capital. They are categorised into ordinary and
preference shareholders. Ordinary shareholders can be defied as the residual owners of the
business (Faria, 2001). Preference shareholders have a first preference in receiving dividends
over ordinary shareholders. Shareholders have interest in business since they are worried by
their capital and profitability since they share profits or losses. The results of the research
show that the system will reduce costs and widen the margin of safety. This guarantees
profitability. Their business will improve in technology which will make it easier for
integration and majors. The market share values of their shares will go up in the stock
exchange.
2.5.4.1 Negative impacts
The introduction and maintenance on the new system will require extra funding which
will reduce their dividends in the short term.
2.5.5 Suppliers
Suppliers are the sources of raw materials, finished and semi-finished products (Edward,
2003). HJP Bricks buys raw materials and some bricks from suppliers such as Simason
Bricks and Sino. If the use of the new system results in increased sales, it means also HJP
Bricks will require more inputs from its suppliers which will increase their sales.
2.5.6 General conclusion
Stakeholder analysis was done to determine positive and negative impacts of the new system
to different stakeholders. It shows that stakeholders have different interests in the business
and also the impacts of the systems to them are different. From the above analysis one can
conclude that the system will leave all stakeholders better off since the value of the positives
outweighed the negative impacts.

Page | 22
2.6 PROJECT WORK PLAN
A project work plan is a part of project management which shows project activities with their
associated durations. A work-plan shows the interdependence and precedents of activities in a
project (Harold, 2003). When developing a project work plan there is need to subdivide the
project so that the order in which various activities are taken can be clear and also time
allocation.
The work plan for this project is shown below.
analysis
This concerned with various activities and structures in the organisation and how the
new system will integrate with the current system. If the results of the analysis are not
clear the project’s objectives need to be revised.
Designing
This is where the specification are taken by the designer and try to produce how the
product may look like and how information will flow into, out and within the
organisation.
Coding
This is where code snippets are developed basing on low level designs to produce
functional solutions.
Testing
Validation and verification processes are done at this stage in which the tester asks
himself if he is building the right system and if the system is build right. More
emphasising user specifications.
Training
The organisational staff require adequate training so that they can easily adapt and
interact with the new system.
Implementation
This is when the actual product is introduced into the working environment and
configured.
Review meetings
These meetings are held between the management, developers and other users to
determine the progress and success of the project.

Page | 23
Table 2.8 Project work plan
Activities Starting date Ending date
Proposal 01-03-2017 31-03-2017
Introduction 01-04-2017 28-04-2017
Planning 01-05-2017 30-05-2017
Analysis 01-06-2017 30-06-2017
Designing 01-07-17 31-07-2017
Coding 01-08-2017 30-09-2017
Testing 01-08-2017 16-110-2017
Implementation 01-10-2017 17-10-2017
2.6.1 Gantt chart
According to Fleming (2005), a Gantt chart is an activity bar chat indicating scheduled
activity dates and durations frequently augmented with activity floats. The afore mentioned
data can be represented by a Gantt chart as follows showing time allocation from the start of
the project

Page | 24
Project activities are going to be carried out in a sequential order since they are depended on
each other. Most activities will not start before the completion of their preceding activities
although there are some activities that need to be carried out concurrently such as coding and
testing. Documentation is an on-going process from introduction to maintenance.
2.7 CONCLUSION
In conclusion, the feasibility of the project was determined and the results showed that the
project can move to the next stage. Various feasibility areas such as economic, social,
technical feasibilities showed positive results. Risk analysis determined the likeliness and
impact of some adverse effects to the organisation. The cost benefit analysis showed results
which were well above the break-even point and this supports the worthiness of the project in
adding value to the HJP Bricks pvt ltd. The risk values show that the project is less risk. This
chapter outlined the overall plan of the project mentioning various activities that were carried
out. The order and time allocation of the activities were outlined which gives a clear picture
of the structure of the project. Project planning was followed by the analysis of the current
system. The next chapter clearly outlines the analysis which was done. Data gathering
methodologies were used to fetch both primary and secondary data in-order to analyse the
system. The main aim was to determine the input, output and processes involved in the
system.

Page | 25
CHAPTER THREE: ANALYSIS PHASE
3.1 INTRODUCTION
The previous chapter was focusing on planning. Its output was taken as input by the analysis
phase. Planning stage determined the feasibility of the project in terms of economic, social
and technical aspects and the results were satisfactory. The analysis of the existing system
which mainly focused on current processes and their sequence, the flow of information and
its weaknesses were outlined. Research is the key to understanding the aspects in the
organisation so this chapter outlined the information gathering methodologies used. Basis for
choice among alternatives on the method of coming up with a new system and its justification
was mentioned in this chapter.
3.2 INFORMATION GATHERING METHODOLOGIES
Information gathering methodologies are the strategies and methods for obtaining necessary
information about the problems and needs of the research (George, 2012). Different
methodologies were used to obtain information from different stakeholders including
customers, workers, the management and Information Technology personnel. This was done
in order to have information from different angles of view and try to eliminate the effect of
bias. These methodologies include questionnaires, interviews and direct observation.
3.2.1 Questionnaire
A questionnaire is a question bank containing structured questions which is handed to a
responded that can feel in his time and then the researcher will later collect them and compile
the outcome (George, 2012). It can contain both closed questions and open ended questions.
Closed questions are used to have a concrete answer where a responded chose among
alternatives. Open ended questions allow the responded to further explain in detail for better
understanding. The questionnaires were deployed to the aforementioned stakeholders and
then collected the answers for analysis. They offered the following advantages and
disadvantages.
3.2.1.1 Advantages
Questionnaires responses were relatively easier to analyse.
They allowed the respondents to take time in answering rather than rushing to answer
misunderstood questions because they answered without the researcher waiting.
They consumed less time even the target population was bigger.

Page | 26
They allowed the respondents to answer some relatively sensitive issues which they
can not talk direct to the researcher.
3.2.1.2 Disadvantages
When some questions where omitted, it became more difficult for the same responded
to answer those questions.
Questionnaire made it difficult to not allow further probing for explanation or asking
for clarity if a question is not understood.
Stationary consumption was relatively high.
Delays resulted because different stakeholders answer them at different times and
some of them answered in the last hour and some ignored.
3.2.1.3 Results
The researcher was provided with deep information on how the reports are generated. This
was vital since the information is difficult to obtain using other methodologies as an outsider.
3.2.2 Interviews
George (2012) defined an interview as a conversation between the interviewer and the
interviewee where questions are answered and answered for research purposes. These include
face to face one on one or a group interview. The researcher used one on one interviews for
different stakeholders including the receptionist, management and regular customers of HJP
suppliers. The researcher chose to use interviews because they offer the following advantages
although some few disadvantages.
3.2.2.1 Advantages
They promoted instant two way communication which was relatively faster for that
small sample.
Interviews allowed the interviewer to learn from gestures and postures which
enhanced a deep understand.
They also allowed the interviewer and interviewee to probe for further explanation
where they needed enough understanding.
3.2.2.2 Disadvantages
Some offices were inaccessible which limited knowledge acquiring.
Some interviewees felt insecure and didn’t give sensitive information.
Page | 27
3.2.2.3 Results
During interviews, the interviewer further information which shows positive relationship with
the outcome from questionnaires. Processes involved in the system are time consuming. The
results showed that the new system is really needed.
3.2.3 Direct observation
Direct observation is also called an observational study where the researcher visits the
operational environment to personally acquire information (George, 2012). The researcher
visited HJP premises to collect information whilst operations are done normally on day to day
basis. This was employed to complement questionnaires and interviews. Observations have
their own advantages and disadvantages as follows.
3.2.3.1 Advantages
They addressed problems associated with responded bias as the stakeholders were
unaware that they are under observation so they performed normally.
They were more appropriate where it was difficult to use interviews and
questionnaires.
3.2.3.2 Disadvantages
Outcome solely depended on the ability of the observer.
It was difficult to observe all areas such as the actual processing of a system.
3.2.3.3 Results
Direct observations were used and contributed their advantages to form a combined
advantage. Limitations of one methodology were covered up by its compliments. Use of
these methodologies gave the researcher a better understanding of the system in which the
analysis are outlined below. Generally observations results showed the system is slow in
processing orders and it include too many processes.
3.3 Analysis of existing system
Using the information gathered, it was clear that HJP suppliers are a leg behind concerning
modern technology. The organisation uses a manual system in capturing, processing, storing
and disseminating information although they have few computers in their premises. The
receptionist, sales person and the management have computers on their desks were they keep
some files and share these files using memory sticks.
Page | 28
When a customer places an order, they record it manually. After a transaction has been made,
the sales person record it in the computer. The soft copy and the hard copy are then sent to
the management for reporting. If that same customer place another order, the sales person
checks in the computer and if records for previous order which was not delivered. The
information is send to the manager who then determine if the customer is worth to receive a
credit. Less trusted customers only buy with cash.
3.3.1 Inputs
Customer details
Enquiry
Order details
Stock details
3.3.2 Processes
Customer registration
Ordering
Stock adding
Order processing
Payment processing
3.3.3 Outputs
Customer details
quotation
Order details
Payment details
Sales details
3.4 Process analysis
Dennis (2011) defines process analysis as the process of conveying the details of how change
takes place through a series of interconnected steps. In this case, the researcher is concerned
with transaction processes and managerial processes that take place at HJP organisation.
Processes can be represented using an activity diagram as follows.

Page | 29
3.4.1 Activity diagram
An activity diagram is a diagrammatical representation of workflows in stepwise activities
that shows concurrency, choice and cycles (Ader, 2008). Fig 3.1 is an activity diagram of
HJP Bricks current system.
Fig 3.1 Activity Diagram of the current system
3.5 DATA ANALYSIS
Data analysis is the process of determining the type of data and the direction of flow of data
from process to process and its storage as agued by Ader (2008). This illustrates the
relationship between different processes and their associated data and data storages. In the
dataflow diagram the interconnection of processes and their sequence are illustrated. Data
analysis can be shown by using data flow diagrams and context diagram as shown below.
3.5.1 Context diagram
According to John (2000), a context diagram is a high level diagrammatical representation of
a system which shows the boundary between the system and its external environment. It also
defines how the external entities interact with the organisation and inputs and output to and
from the external environment. The context diagram of HJP suppliers is shown in fig 3.2.

Page | 30
Fig 3.2 context diagram of the existing system
3.5.2 Dataflow Diagram
A dataflow diagram (DFD) is a diagrammatical representation of data channels, related
processes, data sources and data sinks (John, 2000). Data channels marks the source and
destination of data with directions being shown, data sources are usually entities who provide
an organisation with data and the data sinks marks the final destination of data usually files.
The data flow diagram of HJP suppliers is illustrated below.

Page | 31
Fig 3.3 Data flow diagram
3.6 WEAKNESSES OF THE CURRENT SYSTEM
A weakness can be defined as the difference between the current state and the desired state.
HJP suppliers’ manual system has some weaknesses which were identified during
information gathering. Some of the main weaknesses are outlined below.
Inadequate security on sensitive data which lead to unauthorised access and loss of
important information.
The manual system is very slow in processing transactions
Poor communication system between regular customers and the organisation
Difficulties in tracking applications, registration and previous transactions in time of
need.

Page | 32
Most of the processes are labour intensive.
3.7 EVALUATION OF ALTERNATIVES
To come up with a new system in an organisation, a decision must be made on which
alternative to put resources. There are generally three alternatives that give reach to a new
system namely outsourcing, improvement of the existing system and in-house development.
These alternatives are given in detail below.
3.7.1 Outsourcing
Baldwin (2006) defines outsourcing as a strategy that is used by organisations in acquiring a
new system which involves hiring of specialists in the field of software development and give
them a contract. Project planning, control and product delivery are done by the external
project manager. A ready-made system can be bought from the market which is called off-
the-shelf system development which is a type of outsourcing. There is also total outsourcing
where an external developer is given a contract to develop a customised system under their
own roof. Total insourcing can be described as contracting a system developer from outside
who then develop a system under the customer’s roof. Advantages and disadvantages of
outsourcing are outlined below.
3.7.1.1 Advantages of outsourcing
Outsourcing offloads workload from the internal personnel to outsiders.
Outsourcing is relatively faster in delivery of a system since the work is given to
specialists with experience and skills and their focus will be on the system
development.
3.7.1.2 Disadvantages of outsourcing
There may be communication, coordination and participation problems if a system is
developed away from the customer.
More competent developers are relatively expensive to contract.
There may be maintenance problems since the organisation will highly dependent to
the external developer.
Cultural problems may result, the producer and the customer may have different
norms and belief which makes it difficult for the developer to understand and adapt to
the organisational culture.

Page | 33
If the external developer lack trust may leave vulnerabilities to the system for
unethical aim such as hacking.
Due to the following disadvantages, the developer has removed outsourcing from
development candidates. The value of the disadvantages has outweighed the merits so the
developer will go on to analyse improvement of the existing system and in-house
development.
3.7.2 Improvement
Improvement is the modification of the already existing system. The source code of the
existing system is altered to add or change functionality and appearance by a programmer
who is familiar with the language used. This will be easy if the existing code is well arranged
and commented properly. It has some advantages and disadvantages as follows.
3.7.2.1 Advantages of improvement
It a faster method in delivering services to the user provided the existing code is
clean since documentation of the system will be readily available.
Less costs to be incurred as compared to other methods.
3.7.2.2 Disadvantages of improvement
Some of the weaknesses in the existing system may be incorporated in the new
system.
It is difficulty to work with code that has been by another programmer so it efficiently
works if the core programmer did not change.
Problem tracing and fixing will be difficult which will be costly in the long term.
3.7.3 In-house development
According to Brian et al (2009), in-house development is a strategy when internal existing
personnel develop a new system. The developer and end users belong to the same
organisation. The development methodologies are determined by the organisational
standards. This has some advantages and disadvantages as outlined below.
3.7.3.1 Advantages of in-house development
System maintenance will be cheaper and faster in the long term since the developers
will be readily available unlike in the case outsourcing where the organisation will
over rely on external developer.

Page | 34
Effective and efficient stakeholder analysis especially the internal hence reduced risks
of system rejection at the end.
Using existing personnel who are under salary will be relatively cheaper.
Effective communication, coordination and cooperation since the development will be
carried out under the roof of the organisation.
Internal developers usually offer better user training which will lubricate acceptance
and diffusion of a technology.
Low chances of facing integration problems with existing software since internal
personnel possess adequate knowledge.
3.7.3.2 Disadvantages of in-house development
In-house developers may lack some specialised skills which will deter quality and
speed of development.
Development may greatly affected by internal politics.
If users lack trust towards the internal team, resistance to change may greatly affect
continuity.
3.7.4 Decision
Basing with the above evaluation of three alternatives, the researcher preferred to use in-
house development because of the following reasons.
Upgrading of the existing system applies when there was already a working computer
system so in this case HJP suppliers are using a manual system.
In-house development promotes great understanding between the organisation and the
developer which enhance cooperation and coordination.
Maintenance will be easier in case of in-house development.

Page | 35
Table 3.1 Costs of alternatives
Alternative Costs (US$) Total costs(US$)
In-house development 14000 14000
Outsourcing Transport costs 200
15800
Contractual costs 1000
Development costs 15000
Improvement 15600 15600
In-house development was found as the best solution. This is because it is better than others
concerning qualitative benefits as well as being quantitatively cheaper.
3.8 REQUIREMENTS ANALYSIS
Requirements analysis is a process of determining the actual expectations of the system as
mentioned by Hay (2003). The support which will be given by the system to the organisation
is the main focus. Needs of various stakeholders which must be satisfied by the system are
outlined at this stage. The new system is expected to meet the following.
Improvement in the registration in terms of speed and efficiency.
Better record keeping which facilitate easy tracking of the records.
Provide accurate reports with visual aids.
Enhanced business to customer communication and customer relationship
management.
3.8.1 Functional requirements
According to Dhillon (2006), functional requirements usually point to the capabilities of the
system in performing business processes. Weaknesses of the existing system gave a guide to
the required functionality basing on the business processes at HJP suppliers. This comprises
of calculation modules, user support and the management support. Customers will register,
manage account, place an order, manage order and make payment to approved orders. The
admin will add notices, manage users, accept or reject order, add stock and view reports or
sales.

Page | 36
3.8.1.1 Use case Diagram
A use case diagram is a behaviour diagram that is used to describe system actions (use case)
that are performed by that system according to Gemino and Parker (2009). Each and every
case should provide observable results relating to various stakeholders. In other words it is a
diagrammatical representation of relations of processes and associated actors within a system
or subsystem. Fig 3.4 is a use case diagram of the current system of the HJP Bricks pvt ltd.
Fig 3.4 Use case diagram
3.8.1.1 Maintenance
Maintenance is an on-going process which is oriented at locating and fixing errors as they
occur and make the system adapt to new business changes as argued by Dhillon (2006). The
system must be flexible enough to make maintenance easier. Other users must not be allowed
to access the system they must only be provided with data that allow them to do their day to
day work. Technical user manual will be there to help the maintenance personnel in accessing
the system.
3.8.2 Non-functional requirements
Non-functional requirements are the constraints that must be covered by the system. They
include processing speed, ease of use, design and communicativeness. The following are
some of the aspects need to be addressed on non-functional requirements.

Page | 37
3.8.2.1 Usability
The system must promote easy of navigation.
It must be communicative that is the naming of commands and menus must be
understandable.
User friendliness must be prioritised.
3.8.2.2 Error handling
The system must handle errors in data capturing that is it must alert the user with a
good response in case of an error.
Calculations must be done in such a way that they represent reality in business
processes such as negative values for stock must be forbidden and when the
warehouse is out of stock, customers must be alerted.
3.8.2.3 Security issues
The system must offer security functionality through:
Access levels- different users are restricted to other views that is everyone is
presented with his own functional level data.
Data capturing must ensure that the logged user is the one who is recorded.
Use of passwords to give privilege in data access
Users are restricted from accessing the system files.
3.8.2.4 Efficiency and throughput
Efficiency is the measure of input output ratio. An efficient system requires less resources
and effort to deliver some functionality than inefficient ones. Throughput is the count of
transactions that are processed at a given time. The system must:
Improve the speed in transaction processes.
Promote concurrency in registration and making order.
Reduce human effort and consumables such as stationary consumption.
3.8.2.5 Technical constraints
Throughout the development process, technical experts are needed so as to conquer technical
problems.
More technical experts are needed to support the development of modules and system
testing.

Page | 38
Maintenance of the system needs at least one person who was involved in the
development of the actual product.
3.9 CONCLUSION
The analysis phase clearly outlined the weaknesses of the existing system, choice among
development alternatives and requirements of the system. This chapter shows what the new
system must address and what should be done. Through in-house development, the next
chapter will show the design specifications and he structure of the actual product outlining
interface design, database design and physical setup. Using the gathered data the developer
will effect choice to address mention problems and requirements.
Page | 39
CHAPTER FOUR: DESIGNING PHASE
4.1 INTRODUCTION
The previous chapter mainly focused on analysis of the existing system and information
gathering methodologies and analysing the system. This phase focuses on various designs
namely database, architectural, system, interface and physical design. The physical
architecture setup will be outlined in this chapter. Modified context and dataflow diagrams
will also be presented. The interfaces are also designed which meet the functional
requirements of the HJP Bricks online ordering system.
4.2 SYSTEM DESIGN
System designing can be defined as determining the system components which include
architecture, modules and interfaces that may provide the required functionality (Whitten,
Brentley and Dittman, 2004). The main objective is to develop an effective and efficient
system which is reliable and easy to maintain.
Efficiency- an efficient system use less resources and time with minimum effort from
the user.
Effective- effectiveness deals with fitness for purpose producing the most desirable
results. A well designed system must be effective enough in meeting user
requirements.
Maintainability- this deals with the ease of modification, integration and portability. A
well designed system is easy to use in different platforms and it allows the integration
of new modules.
Reliability- reliability is all about the availability of the service when it is needed and
its consistency in producing desirable results.
4.2.1 Description of the system
The HJP Bricks online ordering system allows customers to register online and use their
credentials to access their accounts. The user cart allows them to manage their orders and it
allows reversal action. The sales manager will view the pending orders and the payment
methods then decide to confirm order so that the transaction will proceed or to reject. If the
order is confirmed, it then moves to delivered orders. The salesman will see the sales level in
form of bar chats as well as the stock level. Users are also notified is bricks are not stocked so
they can pay for them they can just place an order so that the sales person will decide the
right level to buy from manufactures.

Page | 40
4.2.2 Context diagram of the system
According to Alexander (2011), a context diagram is a high level diagrammatical
representation of a system which shows the boundary between the system and its external
environment. It also defines how the external entities interact with the organisation and inputs
and output to and from the external environment. The context diagram of HJP suppliers is
illustrated in fig 4.1.
Fig 4.1 Context diagram of the proposed system
4.2.3 Data flow diagram of the proposed system
A dataflow diagram (DFD) is a diagrammatical representation of data channels, related
processes, data sources and data sinks (Alexander, 2011). Data channels marks the source and
destination of data with directions being shown, data sources are usually entities who provide
an organisation with data and the data sinks marks the final destination of data usually files.
The data flow diagram of HJP suppliers is illustrated in fig 4.2.

Page | 41
Fig 4.2 Dataflow diagram of the proposed system
4.3 ACHITECTURAL DESIGN
Architectural design is the most initial design where subsystems are identified and the
establishment of a framework of subsystem control and communication. The very first step is
to determine whether the system is a client server or stand-alone application. Server-based
computing refers to a technology in which applications are implemented and managed on the
server rather than the client as defined by Hennessy and Patterson (2006). Upgrading of
system hardware, application deployments, data backups and technical support are carried out
in a server-based environment.
On the other hand there is stand-alone system. This is a system which deploys local services,
use them and then terminate when they are no longer needed. Stand-alone applications need

Page | 42
no remote service. Table 4.1 shows the comparison of a server based application and a stand-
alone application.
Table 4.1 comparison of Client server versus Stand-alone architecture
Client Server Application Stand-alone application
Cost Very high Low
Control and security Very high High
Ease of development High Low
Room for future
development
Very high High
From the above comparison, the preferred architecture is a client-server based architecture.
Fig 4.3 shows the preferred network architecture.
Fig 4.3 System architecture
Source: Ricardo (2011).
4.4.2 Client machines
Client machines are types of machines that are connected to other machines which are the
servers to use their services and different resources. These are also called requesting machine
which can serve data and run some applications provided by the server. These requesting

Page | 43
machines varies from desktops, laptops and palmtops in which the users are supplied with
interfaces of the client such as windows, unix, linux and they are connected over a network to
the server (Connolly and Begg, 2005). .
4.3.3 Server
A server is a computer program that provides services to other programs within the same
computer or in other computers through a network. A machine containing that program can
also be called a server. It that provides certain services to requesting machines which are its
clients connected over a network. The server machines can sometimes be dedicated or can
also be used for various purposes. All the HJP Bricks transactional data and website relate
data will be stored in the server.
4.4 PHYSICAL DESIGN
Hennessy and Patterson (2006) define physical design as the determination of the technical
setup of the computer environment and how hardware and software operates. The physical
location of hardware and the way in which the devices are connected is also outlined. The
setup will include wired and wireless network. Some computer will be connected on a switch.
A wireless router is also needed so that other devices will be wirelessly connected.
Fig 4.4 The Physical setup of the system
Source: Hennessy and Patterson (2006)

Page | 44
4.5 DATABASE DESIGN
Dietrich and Urban (2011) defines the term database as a collection of organised data that
easy to access and manage. Database design is the logical designing of data structures that are
used to store data. In an electronic database, data is organised into rows and columns. The
database schemas in the tables that contain the data can be represented using class diagrams
and enhanced entity relationship diagrams (EER). The database view levels are illustrated in
fig 4.5.
Fig 4.5 Three level architecture
Source: Ricardo (2011)
4.5.1a External level
The external level can also be termed the user view level which shows the highest level of
abstraction. The main function of this level is to allow user interaction with the database and
simplify user views (Ricardo, 2011). This is usually achieved through user forms, tables and
graphs for reports. The structured query language is used to echo database data and provide it
to the users.
4.5.1b Conceptual level
This level shows the actual database data and the relationships among the stored data
(Ricardo, 2011). The table attributes and data-types describe the type of data that can be
stored in each cell. Queries are also defined and their relationships outlined in this level.

Page | 45
4.5.1c Internal level
The internal level shows the lowest level of abstraction and it shows how database data is
actually stored (Connolly and Begg, 2005). This level shows the data definition, Meta data
and access path for the database. This is also known as the physical level of the database. It
deals with data compression and encryption methods if they are used in database queries.
Complex low level data structures are dealt with in this level determining the data that must
be kept in the database.
4.5.2 Database Tables
Table 4.2 Customer Details
Field name Data type Description
Name Varchar(25) Actual name of the user
Surname Varchar(25) Surname of the user
Email address Varchar(30) Unique identifier
Customer id Auto increment (pk) Primary key
Password Varchar(30) Key to personal profile
Table 4.3 User Cart
Field name Data type Description
Cart id Auto increment (pk) Primary key
Customer id Int not null Foreign key
Order details Varchar (50) Description of the order
Payment status Default : pending Payment status
Date ordered Current time stamp Recorded automatically
Price Currency Price of each product
Total cost Currency Value of the cart

Page | 46
Table 4.4 Products table
Field name Data type Description
Product name Varchar (20) Name of the product
Product id Auto increment Primary key
Category Varchar(20) Product category
Price Currency Price of the product
Amount Int not null The stock level
Table 4.5 Admin table
Field name Data type Description
Id Auto increment Primary key
Name Varchar (20) Real name of the admin
Surname Varchar(20) Actual surname of the admin
Username Varchar (20) Unique
Password Varchar (20) Private credential
Table 4.6 Payments
field name Data type Description
Customer id Int not nul Foreign key
Cart id Int not null Foreign key
Total payment Currency Total amount paid
Balance Currency The amount due
Date paid Current time stamp Time of transaction
4.5.3 The enhanced entity relationship diagram
An enhanced entity relationship diagram is a diagrammatical representation of entities with
attributes and relations (Dietrich, 2011). It is the extension of the original entity relationship
diagram. They depict what is stored in the database of an organisation. An entity is an object
class which are in form of tables in the database. Enhanced entity relationship diagrams
shows how the entities are going to interact on the proposed system.

Page | 47
4.6 PROGRAM DESIGN
Program design describes how the system will actually work and it models the processes
involved (Ralph and Wand, 2009). The process interrelationships and process sequence are
also outlined at this stage. Package, class and sequence diagrams are used at this stage to
show how the system will work.
4.6.1 Package diagram
A package diagram can be described as a diagrammatical representation of the module
relationships and their role in achieving system objectives. It shows the importance and
relationships of components of the HJP Bricks online ordering system. Below is a package
diagram which shows module inter-dependants of the HJP Bricks online ordering system
showing how they will interact with all the users.
Fig 4.6 Enhanced Entity Relationship Diagram of the system

Page | 48
Fig 4.7 Package diagram of the system (Ralph and Wand, 2009)
4.6.2 Class Diagram
A class diagram is a type of static structural diagram that designates a system structure
showing its classes and their attributes as well as operations and the relationships between the
objects (Scott, 2009). The class diagram can be viewed as the main building block of object-
oriented modelling. A class diagram is used for both general conceptual modelling of the
application, and for detailed modelling that translates the model into a programming code.
They can also be used for data modelling. The objects in a class diagram represent main
elements interactions in the application and the classes that need to be programmed.
In system designing a number of classes are identified and clustered together in a class
diagram so as to help determine the relationships between them. With comprehensive
modelling, the classes of a conceptual design are usually split into a number of subclasses.

Page | 49
Fig 4.8 UML class diagram
4.6.3 Sequence diagram
Brently (2004) defines a sequence diagram as an interaction diagram which shows how
system objects operate with one another whilst specifying their order. It shows objects
interaction arranged in time sequence. A sequence depicts the objects and classes that are
involved in the scenario and the communication sequence between the objects needed in
carrying out the functionality on different scenarios. They are typically associated with use
case realisations in the logical view of the being developed system. Sequence diagrams can
be sometimes named event diagrams.
Sequence diagrams display, as parallel vertical lines (lifelines), different processes and or
objects that live simultaneously and some horizontal arrows representing the messages
exchanged between them preserving the order in which they occur. This simplifies the
specification of runtime scenarios in a understandable graphical manner. The sequence
diagram of the HJP Bricks online ordering system is as follows.

Page | 50
Fig 4.9 sequence diagram
4.7 INTERFACE DESIGN
An interface can be defined as the go between external entities with the system (Brently,
2004). Interfaces allow the interaction of users and the database and other system contents.
Well-designed interfaces have ease of navigation and usually allow two way
communications. Interface design is the process of determining and simulating the structure
of the system interfaces which are suitable for the system so as to meet its objectives.
The HJP bricks online ordering system’s interface design shows the nature of input that is
accepted and the output structure. Interface design will clearly show the relationships
between different interfaces and the stages which can be followed to do a certain transaction.
Interface design should be:
Easy to learn without need of technical expertise
Communicative with understandable language
Allow reversal actions such as back, cancel and reset
Fast in responding.

Page | 51
4.7.1 Menu design
A menu can be described as a list of options that are presented to the user of a computer
system (Written et al., 2004). It may be a system's entire user interface, or partial of a more
complex system. Users choose options from a menu through the use of an input device. Some
of the input methods need linear navigation, the user moves a cursor or just pass from one
menu item to another until getting the selection.
4.7.1.1 Main menu
Fig 4.10 shows the main menu which interact with users in the first position.
Fig 4.10 Main menu of the system
4.7.1.2 Sub menus
When users click “products” they will see the list of bricks that are currently available in
stock. This is shown in fig 4.11.
BANNER
HJP
About us
Products
Order now
FAQs
Conduct us
|Home |Products |Order now |FAQs |Conduct us
Powered by [email protected]
Latest Items

Page | 52
Fig 4.11 Sub menu 1
4.7.2 Input design
When users need to update database data, they insert input into the system through input
forms (Written et al, 2010). These input forms need to be carefully designed so that data
validation will be done correctly. Invalid input must be detected and not accepted and the
user must be alerted. System users create their accounts and use some credentials in login, the
data that is entered must be checked for validity. The input entered will determine the access
level of the user so the interface must be linked properly. Below are some HJP Bricks online
ordering system input form.
Photo
View
Add to cart
List of our products HOME
SETTINGS
LOGOUT
CONTACT
Home | products | order | contact | FAQ

Page | 53
Fig 4.12 Customer Login form.
This input form accepts input that already exists in the database. Only registered customers
are allowed to proceed after login. Users can be alerted in case of an error.
Fig 4.13 Customer registration form
Customers sign up using the form above imputing their details so that they are stored into the
database. Password is designed in a way that it hides the characters for security reasons. Re-
enter password is just there for confirming the user password selected.
Customer Login form
Email Address*
Password*
Sign in
Sign up
CUSTOMER REGISTRATION
Sign Up
First Name
Surname
Email address
Mobile number
Password
Confirm Password

Page | 54
Fig 4.14 Input form for adding products in the database.
When admin login into his account he/she can add products for sale through the above input
form. Name and category fields are designed with drop down menus so that the admin can
select from the list. This is done to ensure only products which are provided by the company
are selected to reduce room for typing errors. The choose file field allow the uploading of the
image of the product.
4.7.3 Output design
When the system inputs are received they are processed so as to produce outputs. The output
will be available to the users in form of reports and tables. The structure of the tables will be
as follows.
Product Table
10 Records per page search
Name Description Category Origin Price Quality image Action
Edit Delete
Showing number of entries previous next
Fig 4.15 Output table for products
ADD BRICKS
Name:
Category
Origin
Price:
Number
Image
Reset ADD

Page | 55
4.8 PSEUDO CODE
Pseudo ode can be described as an English simplified language. Developers use pseudo code
to represent what it takes to communicate with the compiler. This code is then converted into
compiler understandable code. Pseudo code is intended for human reading not machine
reading (Furman, 2010). It omits the essential details that allow machine reading. Pseudo
code just outlines the basic principles for the algorithm. The pseudo code for different
modules of the HJP Bricks online ordering system is as follows.
4.8.1 Customer registration
Check if user is registered, if not then redirect to “sign up”
If user didn’t enter all required data then alert user
If password one and password two are different then alert user there is a password mismatch
Insert user data into the database if required fields are filled with valid data
Else
Give an error message
4.8.2 Login
Select user in the database
If user is found then go to user account
Else
Give alert message
4.8.3 Order
Check if the user is logged in
If user is logged in then add selected products to user cart
Update cart including new products
Calculate new value of the cart
Else
Give an error message

Page | 56
4.8.4 Add product
Prompt user to fill product details
If input fields are empty, alert user
Insert product details into database
Calculate the number of products added in database
Alert the user that the product was successfully added
Else
Give Error in adding product
4.9 SECURITY DESIGN
Write and Jim (2009) defines a computer security as the protection of a computer system to
prevent data loss, physical hardware damage and unauthorised access to information.
Security designing includes determining the security need of a computer system and
implement possible solution. Security design can be physical or network level.
4.9.1 Physical security
Physical security guide computer systems from unauthorised access, direct sunlight, water
and physical damage (Write and Jim, 2009). These can be achieved by employment of
physical guards and physical locks. A good computer setup includes dedicated desks where a
CPU is set into its drawer.
4.9.2 Network security
Network security deals with the implementation of policies that govern the use of a network
(James, 2012). The policies guide against unauthorised access, excess use, denial of service
and modification of network resources. Every network user must be trained and must be
aware of the policies being implemented. When using the internet, the browsing sessions
must be secured and emails to be filtered. The network basically needs a unique name and
password and the password must be alpha-numeric and at least eight characters so that it will
become difficult to trace. Network clients need to be monitored closely and if any mysterious
action is detected, counter measures must be took as soon as possible.

Page | 57
4.9.3 Operational security
Operational security deals with making sure that system operations are not interrupted or to
guide against any adverse effects (James, 2012). Users must feel secured when using the
system. The use of unique credentials is the first and foremost security mechanism in use.
Users feel that their accounts are safe and no one can alter them. The database security key is
only known to the database administrator who will make sure nothing is modified directly
unless there is need to do so. System validation also work as a safety mechanism since all
user input will be valid. No user actions will interfere with the actions of another even where
there is concurrent database modification. Some of the operational security key points are
listed below.
The system will assure that in order table, order_details table and product table, the
salesman will not make modification to price, quantity and id to reduce the chances of
fraud by changing prices and total costs to some customers.
Salesman users will have access to their own data and cannot edit members’ data.
The system will allow audit trail which will allows the manager to monitor and review
the salesman data modification in case of fraud.
4.10 CONCLUSION
The designing phase well outlined how the new system will operate in the work environment.
Different levels of designing were outlined such as database, architectural, physical and
product design which shows the skeleton of the system as a whole. Relationships between
various entities were outlined in this chapter as well as the dataflow and processes involved.
The security mechanism were outlined which will help to preserve data integrity and
correctness. The design specifications are then achieved through the use of programming
codes. When the code is developed it is followed by implementation. The system will be
introduced to the working environment. The next chapter focuses on implementation of the
new system. Implementation comprises of testing, installation, conversion, changeover and
user training.

Page | 58
CHAPTER FIVE: IMPLEMENTATION PHASE
5.1 INTRODUCTION
This chapter concentrates on implementation of the system under development. System
implementation consists of various levels of testing, training, installation and file conversion.
Areas which need corrections can be identified as quick as possible through testing so that
they are corrected. The system will start to work once the developer is satisfied.
5.2 CODING
Coding can be defined as the writing a programming language using the programming
platform so that the compiler will understand (Hartmann, 2009). This is done in developing
systems, applications and software. The code is the language which builds and controls the
behaviour of a programme. The HJP Bricks online ordering system was build using the Php
and Html. See appendix for some of the code used.
5.3 TESTING
System testing include any activity that is done with the aim of detecting any errors and
capability of a system (Ehmar, 2010). Various types and levels of system are conducted so
that the effectiveness and efficiency of a system in meeting requirements specification is
determined. System testing is an on-going process from coding to installation and
maintenance. There are two types of testing namely black-box and white-box testing as
mentioned below.
5.3.1 Black-box testing
According to Ehmar (2010), black-box testing can be defined as a software testing method
that examines an application’s functionality without looking into its internal organizations or
code workings. This testing method can be applied almost in every level of system testing
that is unit testing, integration testing, system testing and acceptance testing. Black-box
testing consists of high level testing and suit every stage of testing.
Black-box testing does not require specific knowledge of the internal code structure and
knowledge about the programming language used. The system testers are worried by input
output relationship not how the output is being processed. Test cases are developed around
system specifications and user requirements. These test cases are usually derived from the
external software descriptions which include specifications, user requirements and design

Page | 59
parameters. The test designer selects both valid and invalid input parameters to determine the
input-output relationship. Black-box testing is illustrated in fig 5.1.
Fig 5.1 Black box
Source: Ehmar(2010)
5.3.2 White box testing
This is a method of system testing that tests the interior structures of a system application.
This can also be referred as to clear box or glass box testing (Ehmar, 2010). This type of
testing requires more knowledge in the programming language used that is the tester must
possess enough knowledge in the programming language. White-box testing can be applied at
different stages of testing namely unit, integration and at system level. White box testing can
be used to test faults within a module or unit, faults lying between different units during
integration, and faults between subsystems during the system level test. It can uncover some
errors and help to clean code since unused code can be detected. Fig 5.2 illustrates white box
testing.
Fig 5.2 White box testing
Source: Ehmar (2010)
5.3.3 Levels of testing
There are several levels of system testing which describes the modularity of the test. Fig 5.3
shows the different levels of testing.

Page | 60
Fig 5.3 Levels of testing
Source: Kolawa (2009).
5.3.3.1 Unit testing
Unit testing is when individual units of code are examined in order to determine if they are
fit for purpose (Kolawa, 2009). Unit test can be viewed as the smallest testable slice of a
system application that can form the basis for component testing. Unit tests are usually done
on small sections of code during coding and can also be done by white box testers when the
system is partially functional. Each test case is set independently from others. They are
usually run by programmers so as to ensure that their code meets intended design and
behaviour.
5.3.3.2 Integration testing
According to Kaner (2003), integration testing is a process where individual modules are put
together and tested as a group. The main aim is to detect faults that result in integration.
5.3.3.3 System Testing
Kanner (2003) defines system testing as an activity of examining the functionality and
compliance of an integrated system as a whole. The main aim is to determine whether the
system meets the specified requirements.

Page | 61
5.3.3.4 Acceptance testing
This is a level of software testing that is used to determine whether the system is acceptable
for delivery (Rodriguez, 2014). Testers test the system so as to determine its compliance with
business requirements. Users are also involved in this level of testing. This was done in two
ways that is beta and alpha testing.
Alpha testing
Alpha testing can be described as a simulated system testing which is done by the
potential users or a specialist independent testing team at the development site (Dustin,
2002). This is often used as a form of internal system-acceptance testing since it works
with the potential users.
Beta testing
According to Dustin (2002), beta testing is a software testing technique which is usually
after alpha testing that can be taken as a way of external user acceptance testing.
Developers release beta versions to a limited targeted audience who are outside the
coding team named beta testers. The software under construction is exposed to groups of
different people for further testing who will help to reduce bugs. These Beta versions can
be provided to the general public.
5.3.4 Validation
Validation testing is a process by which developers examine the system under development
whether it meets the business requirements specification (Black, 2008). It gives the answer to
the question, “are we building the right product?” Validation ensures that the product meets
the client’s needs.
Fig 5.4 shows a warning message which appears when the user leave empty fields on the
registration form which reads please fill this field. The form will not be submitted if the field
is filled.

Page | 62
Fig 5.4 Omission validation screen shot.
Fig 5.5 is an input type validation screenshot which shows a warning message when a user
enters non email input. This is done to ensure corectiness of user details.
Fig 5.5 Input type validation screenshot
When the user enters a week password, the system will alert him/ her that the password is too
short it must contain at least eight characters. The form can’t be submitted if the password is
not lengthened. This is shown in fig 5.6.

Page | 63
Fig 5.6 Password strength validation screenshot
More so the system have a security mechanism by which it checks the confirmed password to
determine if the user is aware of what he enters as a password. The system will compare the
passwords entered and is case sensitive.
Fig 5.7 Password match validation screenshot
Furthermore data-type validation was done to ensure allowable data-types are the only to be
submitted into the database. Fields including name and surname must contain only
alphabetical characters and a hyphen (‘) character. Fields like contact number only allow
numeric values and a plus sign (+). The error message which will appear is shown in fig 5.8
when a user enters non numeric values on the conduct number input field.

Page | 64
Fig 5.8 Data-type validation screenshot
On the security issue, the system requires intact credentials so that the user can access his/ her
account. Incorrect details will be detected and the system will not specify the exact field with
no a database match. Fig 5.9 shows the error message which will appear when user enters
incorrect credentials.
Fig 5.9 Login security screenshot
When making order, the system ensures that no numbers below one are entered and the
maximum number of items in the database is the maximum that can be ordered. Fig 5.10
shows the system forbidding the user to enter a number greater than two which is the number
of bricks in the database.

Page | 65
Fig 5.10 Maximum order validation check
5.3.5 Verification
According to Black (2008), system verification can be described as a set of steps that are
taken to check the correctness of the system. Verification is a continuous process which was
done in every development stage to check whether the activity outcomes are in line with the
requirements specification. A sample of data was used to test if the system performs as
needed.
5.3.5.1 Advanced search
The system was tested to determine if it allows dynamic search in database elements. The
user can specify the records with match to the search items. The specifications include less
than, greater than, equal to, not equal to, between, not between, empty and not empty. If
between is chosen, another search box will appear which marks the maximum value. Search
items can be printed separately and can be exported to excel files, CSV and word documents.

Page | 66
Fig 5.11 Advanced search page screenshot
Concerning search, the verification results were all satisfactory.
5.3.5.2 Exporting data
Database data can be exported to other formats such as Microsoft word documents, excel
sheets and Comma separated values (CSVs) as shown in fig 5.12. The system will allow
users to specify if they want to export the current page or all records in that table. Exporting
can also be done to only selected fields by checking associated checkboxes.
Fig 5.12 Export data page

Page | 67
5.3.5.3 Reporting
The system produces reports from the database which allow easy identification of data
elements. Sum, average, minimum and maximum values can be calculated automatically. The
manager can also search for a certain type of products, price or date and the summaries will
be automatically calculated. The summary include average, maximum, minimum and sum.
Fig 5.13 Product report
5.3.5.4 Notification
The system haves a dashboard in which when the manager log into the system he or she will
be notified on stock level, and transactions report in form of charts. The manager will be
notified concerning the number of products left in stock. Colour zones in charts shows the
minimum and maximum desirable levels. The charts can also respond to searches and
selection for example the manager can search for a certain type of transaction and the chart
will present only the needed data. Fig 5.14 shows how the charts will be presented.

Page | 68
Fig 5.14 Dashboard screenshot
5.3.5.5 Security enforcement
The system allows users to edit their details only which shows the account management
security level. They can not edit their id which is the primary key.
Fig 5.15 User account management
The Salesmen can not edit products price, product id and product name to avoid case of
overcharging and fraud. They can edit on description and origin of the bricks.

Page | 69
Fig 5.16 Security enforcement screenshot
5.3.5.6 Database querying
The system allows the manager to add, delete and edit products in the database with its
properties excerpt the product id. Fig 5.17, fig 18 and fig 5.19 shows adding, deleting and
editing bricks respectively.
Fig 5.17 Adding products to the database

Page | 70
Fig 5.18 Deleting database data
Fig 5.19 Editing products from the database
5.3.5.7 Audit trail
The manager can view database activities done by salesmen. The activities include login,
adding, editing, deleting. If the activity results in data modification, the system will record the
old value and the new value for assessment by the manager. The Internet Protocol (IP)
address of the user will also be recorded.

Page | 71
Fig 5.20 Audit trail screenshot
From the above information concerning verification, one can conclude that the system meets
the requirements specification. The system was thoroughly verified and the results were
satisfactory. It was determined that the system is ready for installation.
5.4 INSTALLATION
System installation is an act of making a computer program ready for execution on the
business according to Gagne (2012). After all other stages in the development process which
makes the product functional are successfully completed, the system will be introduced to the
actual operating environment. Installation generally involves code being copied from the
installation files into new files on the local computer or server for easier access by the
underlying operating system. The installation process involves user training, file conversion
and changeover.
5.4.1 User training
User training is a process of equipping potential users of the system with adequate knowledge
to use the developed system (Faria, 2001). The time consumed by the training process
depends on the technology literacy level of the trainees. Training can be seen as an on-going
process since the system functionality is subject to modification. The initial training process
need to be done using workshops for easier and better understanding. The physical training is
complimented by a detailed user manual (see appendix). The user manual is there to allow

Page | 72
free space in learning to use the system since it contains a series of steps and instruction is
using the system.
5.4.2 File conversion
According to Laudon and Laudon (2010), file conversion is the process of migrating data and
processes from one platform to another. File conversion depends on the results of the testing
process. Since the system testing produced satisfactory results, the system is ready to receive
the data sources.
5.4.3 System Changeover
According to Ferguson and Hebels (2003), system changeover is the process of substituting
an old system for a new one. There are various changeover strategies which are direct, pilot,
phased and parallel run. Each strategy will be appropriate in its favourite conditions.
5.4.3.1 Direct changeover
Direct changeover is a changeover strategy in which a new system will start to work after the
abandoning of the old system (Ferguson and Hebels, 2003). There will be a clear demarcation
line on the operating periods between the systems. This is illustrated in fig 5.21a.
Time
Fig 5.21(a) direct changeover
Source: Ferguson and Hebels (2003)
Direct changeover has some strengths and weaknesses as follows.
5.4.3.1.1 Strengths of direct changeover
Direct changeover is resource conservative.
It is the only solution if there is total failure of the old system
5.4.3.1.2 Weaknesses of direct changeover
Direct changeover is the most risky strategy especially when working with critical
data. The consequences of new system failure are very high.
The strategy is limited in comparing the outputs of the two systems given the same
inputs whilst some problems will escape the testing process before implementation.
OLD SYSTEM NEW SYSTEM

Page | 73
If not communicated properly, the system will lead to workforce demotivation.
The strategy requires more careful planning and training before implementation.
5.4.3.2 Parallel changeover
According to Piper (2013), parallel run is a changeover strategy that entails the running of the
new and the old system concurrently for a specified period of time to determine the
capabilities of the new system. The old system will cease to work once the client is satisfied
by the new system. Fig 5.21(b) illustrates parallel changeover.
Time
Fig 5.21(b) Parallel changeover
Source: Piper (2013)
Strengths and weaknesses of this changeover strategy are listed below.
5.4.3.2.1 Strengths of parallel changeover
Parallel run strategy gives room for outcome comparison between two running
systems.
Parallelism reduces the risk of data loss in case of system failure which makes it more
appropriate when working with more critical data.
Parallel run is more user friendly since it allows them to adapt to the demands of the
new system whilst using the old system.
5.4.3.2.2 Weaknesses of parallel changeover
Parallelism require extra effort and resources since there will be duplication of work
hence it’s more costly.
5.4.3.3 Pilot changeover
Pilot changeover involves the implementation of a system at a pilot level and new pilots
depend on the success of the system on a preceding pilot (Cooper, 2005). This is illustrated in
fig 5.21(c).
NEW SYSTEM
OLD SYSTEM

Page | 74
Time
Fig 5.21(c) Pilot changeover
Source: Cooper (2005)
5.4.3.3.1 Strengths of pilot changeover
Pilot run is cheaper as compared to parallel run.
Pilot implementation is less risky as compared to direct changeover since failures can
be detected at a pilot site before contaminating the whole business.
5.4.3.3.2 Weaknesses of pilot changeover
Pilot changeover is not appropriate where the old system has already failed.
Pilot implementation maybe time consuming as compared to direct changeover.
The problem of biased results may result. A system may work well at a pilot stage but
as workload increases it may fail.
5.4.3.4 Phased changeover
In phased changeover the system is introduced in phases whist the old system is still in
operation (Piper, 2013). It may be by function until the whole system replaces the old system.
Small parts of the system are introduced to the working environment and if they are
successful then new parts will be integrated. Phased changeover is shown by an illustration in
fig 5.21 (d).
OLD SYSTEM NEW SYSTEM

Page | 75
Time
Fig 5.21 (d) Phased changeover
Source: Piper (2013)
Phased changeover has its own strengths and weaknesses as outlined below.
5.4.3.4.1 Strengths of phased changeover
Phased changeover is less risky since the system will be implemented in phases.
Phased changeover involves less cost than parallel changeover.
5.4.3.4.2 Weaknesses of phased changeover
Phased changeover consumes time in implementation which makes it unsuitable n
case of urgency.
5.4.4 Selection and justification
As outlined above, the strategies have their own favourite conditions where they can be
implemented. The developer considered the suitability of the changeover strategies for
selection of the strategy to use in the implementation of the HJP Bricks online ordering
system. Parallel changeover became the favourite strategy because of the following reasons:
The organisational members of HJP Bricks Ltd are using a manual system so they
need ample time to adapt and gain trust to the new system so the systems need to be
run parallel.
The system will work with critical data which is costly to recover when lost so there is
need for a less risky strategy which is parallel changeover.
KEY
Old system phases New system

Page | 76
5.5 MAINTENANCE
Software maintenance is an art of correcting, modifying and improvement of system
components so as to make sure it is in its best condition (Penny and Amstrong, 2003). This is
done to meet day to day business requirements. Maintenance can be structured or
unstructured. Structured maintenance comes in many forms namely preventive maintenance,
corrective maintenance and adaptive maintenance.
5.5.1 Structured maintenance
Structured maintenance can be described as a document led maintenance system where
organised and known procedures are followed (Hartmann, 2009). Structured maintenance is
basically formed by three different types namely preventive, adaptive and corrective
maintenance. Maintenance follow a series of steps as illustrated in fig 5.22.
Fig 5.22 Structured Maintenance.
Source: Hartman (2009)
5.5.1.1 Preventive maintenance
According to Penny and Amstrong (2003), preventive maintenance is defined as the art of
maintaining a certain level of service for a system. This is done to make sure that any faults
are foreseen before they occur and preventive measures are taken. Software bugs are detected
prior to occurrence and counter measures are taken. Regular checks on the computer system
Problem Identification
Planning
Analysis
Diagnosis
Modification
Testing
Delivery

Page | 77
both hardware and software need to be carried out so that the system will stay near to
perfection.
5.5.1.2 Adaptive maintenance
Business environments are always changing which derive business objectives to change
hence systems need to be adjusted to suit new business objectives. Adaptive maintenance is a
form of maintenance that is aimed at system modification to meet new business
environmental needs (Hartman, 2009).
5.5.1.3 Corrective maintenance
When the system gets problem, corrective maintenance is the applicable approach. Corrective
maintenance is a maintenance form which aim to correct already occurred problems.
5.5.2 Unstructured maintenance
Unstructured maintenance is the answer to a problem when the system needs a speedy and
dirty modification (Hartman, 2009). A Quick repair may be needed for the organisation to
continue with its normal way of doing business. This calls for unstructured maintenance.
Unstructured maintenance best suit where there is miner problems or just malicious code
modification. The users submit a request for change to the developer who then tests the
condition of the system and modify the system. Change may also be as a result of a change in
the business strategy. Unstructured maintenance is shown in fig 5.18.
Fig 5.23 Unstructured maintenance
Source: Penny and Amstrong (2003)
5.5.3 User manual
According to Selic (2009), a user manual is a booklet or piece of writing that is produced by
system developers for the system users. Users refer to the manual so that they can be able to
use the system. It contains a series of instructions that when followed correctly, users can get
familiar at a faster pace. For user manual see the appendix. This is issued to supplement oral
user training.

Page | 78
5.5.4 System review
In system review, developers are interested in determining whether the new system if fit for
purpose. System reviews are done periodically when the system is its operating environment
(Penny and Amstrong, 2003). Errors and omissions are the drivers of system review where
they are located and fixed. System review is an on on-going process which helps to maintain
the system in its best form.
Major reasons of taking system reviews are as follows.
To determine whether the testing results were not biased.
To ensure the proper use of the system by different type of users.
To follow the development route taken by the system to determine if local standards
were surely followed.
To check the maintainability, flexibility and portability of the system.
5.5.5 System backup service
A system backup must be readily available so that any loss of data may be compensated as
early as possible. This is needed to keep data safe and maintain its integrity. Problems may
arise from hardware or software failures. Common threats come in various forms such as
malicious software from hackers which may disturb the smooth-flow or business data.
External drives, cloud memory, memory sticks and compact disks can be used to store crucial
data. The backing up of data need to be done at regular intervals. Some of the copies need to
be kept outside the organisation’s premises so that the data may survive physical destruction
such as fire.
5.6 RECOMMENDATIONS
According to Laudon and Laudon (2010), if the system is ready for execution, it is advised
that the system must be implemented and start help the organisation in managing and
processing the transactions. Users are urged to consult the user manual before using the
system and if they need clarification, they must consult the Information Technology
personnel.
5.6.1 Recommendations to users
Users must keep their credentials confidential and safe to avoid malicious data
modification by hackers.
Users are recommended to report any unusual behaviour of the system to the
Information Technology personnel.

Page | 79
Users must follow the Information Technology (IT) policy of the organisation.
5.6.2 Recommendations to the Information Technology personnel
The IT department must make sure they provide users with required explanation and
training so that they enjoy the benefits of the system.
System modification must be well planned and documented so that errors may be
tracked more easily.
They must make sure the system source files are kept safe.
5.6.3 Recommendations to the management
The management must provide adequate training to new organisational
members as part of induction.
Proper punishments must be awarded to those who try to maliciously use the
system
5.6.4 System objectives versus solutions
In generally the HJP Bricks online ordering system is working properly since it manages to
do the following.
To design a system that enable customers to order bricks online - customers can order
bricks online- they are notified if bricks are out of stock.
To develop a system that automatically generates order reports to the manager -
Reports with summaries are presented giving maximum, minimum, sum, average
values and can be printed or exported to other formats such as excel, word, pdf and
CSVs.
To design a system that allow the director to blacklist untrusted customers – Customer
accounts can be deactivated by the manager.
To develop a system that allow the management to upload information on new
products - The manager can see and manage the stock levels by adding, editing and
deleting products.
To create a system that allows stakeholders to send their suggestions and opinions
concerning the operations of HJP - The general public can leave a recommendation or
complain on the site or ask questions.

Page | 80
To develop a system that provides ready-made quotations by updating cart before the
transaction is done - customers can manage their orders through user cart where they
can pay online and can see delivered and pending paid orders.
To develop a system that allow audit trail to salesman by the manager - Audit trail is
provided by the system where the manager can see who modified which item showing
the old and new values.
The system produces a chart that shows the level of stock in premises which has
already paid for but just occupying space so that the manager can take action in time.
The system will assure the availability of service since salesman can just enter details
in excel sheets or word documents if the system is temporarily down and this data will
need not to be entered manually but just importing it.
5.6.5 Suggested improvements
Given that the HJP Bricks online ordering System is correctly installed and start working,
there are some recommendations for further improvement as listed below.
A wide variety of payment methods need to be added to make work easier for remote
customers.
A mobile version of the system need to be developed so that the site maybe easily
accessible even without internet connection.
5.7 CONCLUSION
In conclusion, the system can finally replace the current system following the outlined
methods and steps. There is need to conduct training workshops to users and provide them
with user manuals. The coding process developed the interfaces and other functional code
that is provided in the appendix. The testing effort applied helped in detecting and correcting
errors and to prevent some future common errors. Various screen shots provided shows how
the system will operate and interact with users providing two way communication. Various
changeover strategies were mentioned outlining their strengths and weaknesses and parallel
changeover come as the preference. Maintenance strategies were outlined which will help the
organisation to keep the system functional in the best way. Training procedures outlined
which must be followed so that organisational members become familiar with the system
more quickly and the training is supplemented by a user manual. Finally the chapter outlined
performance of the system in relationship to objectives.

Page | 81
REFFERENCE LIST
Ader, H.J. (2008). Phases and initial steps in data analysis
Allan, M. Malz, D (2011). Financial Risk Management: Models, History, and Institutions
Alexander, K. William, N. Sweet, E. (2011). Systems Engineering: Principles and Practices
Bentley, T. D. (2004 ) Systems Analysis And Design Methods (6 th Edition), Tata McGraw-
Hill, New Delhi.
Black, R. (2008). Advanced Software Testing. Santa Barbara: Rocky Nook Publisher.
Boardman, N. E. (2006). Cost-benefit Analysis: Concepts and Practice (3rd ed.). Upper
Saddle River, NJ: Prentice Hall.
Cadle, J. and Yeates, D. (2008) Project Management for Information systems 5th
edition,
Pearson Education Limited.
Cameron, B. G., Seher, T. and Crawley, E. F. (2010). "Goals for space exploration based on
stakeholder network value considerations." Acta: Astronautica
doi:10.1016/j.actaastro.2010.11.003.
Connolly, T. M. and Begg, C. E. (2005). Database Systems: A Practical Approach to Design,
Implementation, and Management (4th ed.). Addison-Wesley.
Cooper, D. (2005). Computer Studies For A Level (Second ed.). Coventry, United Kingdom:
theteacher.info Limited.
Coronel, C., Morris, S. and Rob, P. (2011). Database Systems: Design, Implementation, and
Management (9th ed.). Cengage Learning.
Dietrich, S. W. and Urban, S. D. (2011). Fundamentals of Object Databases: Object-Oriented
and Object-Relational Design. Morgan & Claypool Publishers. .
Dustin, E. (2002). Effective Software Testing. Addison Wesley
Edward, J. B. (2003). Concepts for Automating Systems Integration
Ehmer, K. M. (2010). Different Forms of Software Testing Techniques for Finding Errors
Ellis, T. J. and Levy, Y. (2008). A framework of problem-based research: A guide for novice
researchers
Elmasri, R. and Navathe,S. B. (2011). Fundamentals of Database Systems (6th ed.).
Pearson/Addison Wesley.

Page | 82
Faria, A. J. (2001). The Changing Nature of Business Simulation/Gaming Research:
Simulation & Gaming
Ferguson, S. J. and Hebels, R. (2003). Computers for Librarians: An Introduction to the
Electronic Library (Third ed.). Wagga Wagga, New South Wales: Chandos Publishing.
Fleming, Q. (2005). Earned Value Project Management (Third ed.). Project Management
Institute.
Furman, B. J. (2010). “Notes on Algorithms, Pseudocode, and Flowcharts". engr.sjsu.edu.
Georgakellos, D. A. & Marcis, A. M. (2009). Application of the semantic learning approach
in the feasibility studies preparation training process. Information Systems Management
Harold, K. (2003). Project Management: A Systems Approach to Planning, Scheduling, and
Controlling (8th ed.). Wiley
Hartmann, A. K. (2009) Practical Guide to Computer Simulations, Singapore: World
Scientific
Hay, D. C. (2003). Requirements Analysis: From Business Views to Architecture (1st ed.).
Upper Saddle River, NJ: Prentice Hall
Heldman, K. (2005) Project mananager’s Sportlight on Risk Management. Harbor Lights
Press: New Jersey.
Hennessy, J. L. and Patterson, D. (2006). Computer Architecture: A Quantitative
Approach (Fourth ed.). Morgan Kaufmann
Horngren, C. T., Harrison, W. T., and Bambe, L.S. (6th
Ed)(2004) Accounting. Prentice Hall:
New York
Jacobides, M. G. (2007). The inherent limits of organizational structure and the unfulfilled
role of hierarchy: Lessons from a near-war. Organization Science
James, G. (2012). "Intel Trusted Execution Technology: White Paper
Justin, Z. (2013). Algorithms in Writing for Computer Science (second edition). Springer.
Joshua, M. P. (2015) Return on Investment for Open Source Hardware Development. Science
and Public Policy
Kaner, C. (2003). Measuring the Effectiveness of Software Testers
Kolawa, A. (2009) Unit Testing Best Practices

Page | 83
Laudon, K., and Laudon, J. (2010). Management Information Systems: Managing the Digital
Firm. (11 ed.). New Jersey: Prentice Hall.
Miner, J. B. (2002) Organisational behaviour: Foundations, Theories and Analysis. Oxford
University Press: UK.
Oliver, M. S. and Horngren, C. T. (2009) Managerial Accounting. Prentice Hall: New York.
Ozdem, G. (2011). An Analysis of the Mission and Vision Statements on the Strategic Plans
of Higher Education Institutions. Educational Sciences
Penny, G. and Armstrong A. T. (2003) Software Maintenance: Concepts and Practice. World
Scientific Publishing Company
Piper, T. (2013). Cambridge International AS and A Level Computing Revision Guide.
Delhi, India: Cambridge University Press.
Ralph, P. and Wand, Y. (2009). A proposal for a formal definition of the design concept.
Ricardo, C. (2011). Databases Illuminated (2nd ed.). Jones & Bartlett Publishers
Richard, H. and Thayer, E. Y. (2000). Software Engineering Project Management (2nd ed.).
Wiley-IEEE Computer Society Press
Rodriguez, I., Llana, L. and Rabanal, P. (2014). A General Testability Theory: Classes,
properties, complexity and testing reductions.
Scott W, A. (2009) UML 2 Class Diagrams
Selic, B. (2009). "Agile documentation, anyone?" In: IEEE Software
Stuhlman ,D. (2006). Helping you turn data into knowledge. Stuhlman Management
Consultants. Chicago.
Stuhlman, D. (2006). Helping you turn data into knowledge. Stuhlman Management
Consultants. Chicago.
Stuward, D. (2006). Measuring the Business Value of Information Technology. Intell Press
Teorey, T., Lightstone, S. and Nadeau, T. (2005) Database Modeling & Design: Logical
Design, 4th edition, Morgan Kaufmann Press

Page | 84
Treglia, J. and Delia, M. (2017). Cyber Security Inoculation. Empire State Plaza Convention
Center, Albany, New York
Whitten, J., L. Bentley, L, D. and Dittman, K. C. (2004). Fundamentals of system analysis
and design methods
Wright, J. and Jim, H. (2009) Computer and Information Security Handbook. Morgan
Kaufmann Publications Elsevier Inc
Yeates, D. and Cadle, J. (2008) Project Management for Information Systems. Prentice Hall:
New York.
Yeates, D. and Wakefield, T. (2004) System Analysis and Design. London: Prentice Hall.
Zahirul, H. (2005). Handbook of Cost and Management Accounting. Spiramus Press

Page | 85
APENTIX A: USER MANUAL
User manual is there to provide guidelines to the user on how to use the system in an efficient
and effective manner. Users must read and understand the following guidelines before using
the system.
General Requirements of the System
The HJP Online ordering system requires every user to undergo training on how to use the
system and acquaint with the system before using the system. After training and familiarizing
with the system the user has to be added into the system by the administrator to enable him
or her to use the system.
A user should have the correct login details, that is, the username and password in order to
gain entry into the system. Access level rights determine the levels in the system that can be
accessed by a certain user and action to be performed.
The system is built on the following technology:
PHP MySQL technology with apache webserver
Dream weaver cs6 2017 and Phprunner and xampp
User interfaces and their interaction
The window below is the home page for the HJP Bricks Online Ordering System.
Fig A.1 HJP Home page
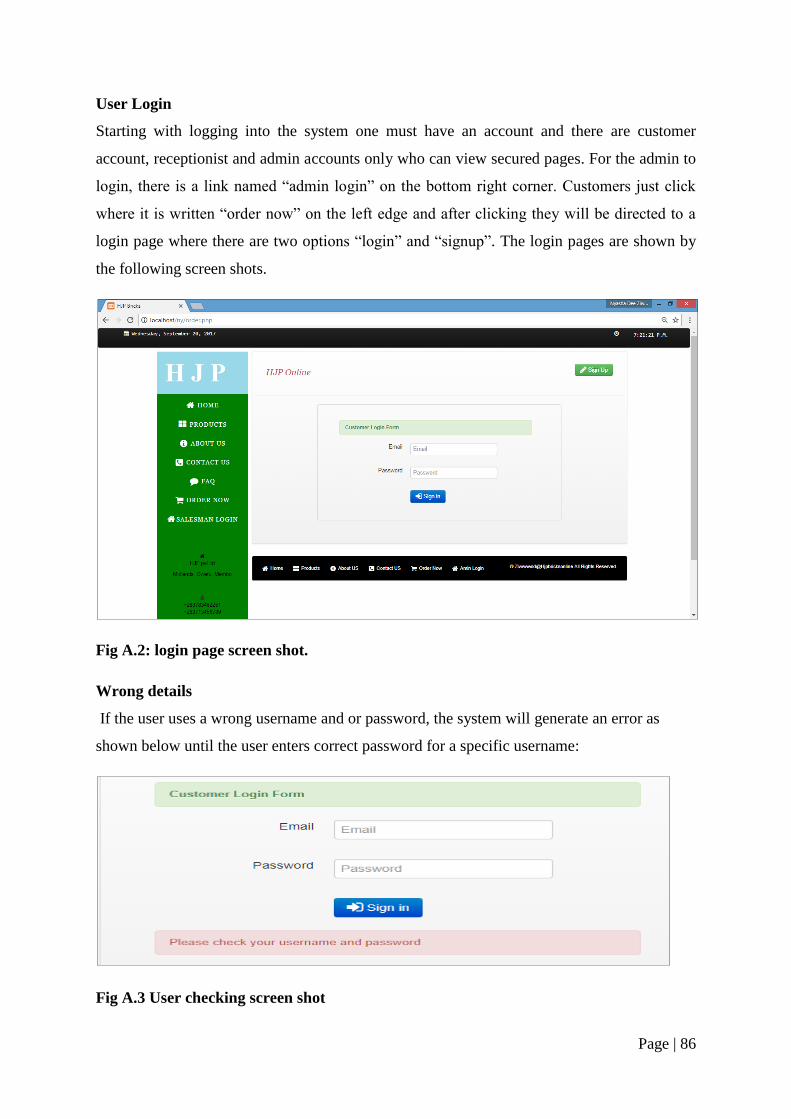
Page | 86
User Login
Starting with logging into the system one must have an account and there are customer
account, receptionist and admin accounts only who can view secured pages. For the admin to
login, there is a link named “admin login” on the bottom right corner. Customers just click
where it is written “order now” on the left edge and after clicking they will be directed to a
login page where there are two options “login” and “signup”. The login pages are shown by
the following screen shots.
Fig A.2: login page screen shot.
Wrong details
If the user uses a wrong username and or password, the system will generate an error as
shown below until the user enters correct password for a specific username:
Fig A.3 User checking screen shot

Page | 87
The salesman enters his/her credentials on the fields provided for salesman login while the
manager clicks where it is written admin login. When logged in one is transferred to the
secured page where he or she can change password, view the records in the database for
transactions.
Fig A.4 Salesmen home page
Change password
If one decides to change password valid credentials namely username and old password must
be entered and the new password must match the confirm password and the a message will
pop up alerting that the password was successfully changed else an error message is shown.
Fig A.5 Change password

Page | 88
Modifying database data
The manager and the salesmen do the rest of their job in their accounts including adding,
editing, printing, exporting, importing, searching, deleting. This is shown by fig A.6.
Fig A.6 Database data modification
Adding and editing bricks
The manager can add bricks by just clicking a button named “Add Products” and complete
the fields requested. To edit the products the manager just click edit and change the necessary
fields.
Fig A.7 Adding and editing bricks

Page | 89
Salesmen audit
The manager just click salesman audit and the view details of salesman actions from logging
in, deleting, adding and editing showing old and new values and the IP addresses.
Fig A.8 User auditing screen shot
Exporting data
For exporting data to Microsoft word documents, excel sheets and CSV one has to click
where it is written export results on the top right corner. They can also select a few items and
export them. The export page is shown in fig A.9
Fig A.9 Exporting data screenshot

Page | 90
Advanced searching
To search type of data the user must click where it is written advanced search and specify the
conditions on the advanced search page. Specifications include equals, contains, between,
more than, less than and their opposites by checking the NOT checkbox. If between is
selected another textbox will appear and a date calendar on the field date.
Fig A.10 Advanced search page
Conclusion
Conclusively, the user manual clearly outlines what shall be done by different groups of users
in order to effectively and efficiently use the system. Users must follow what is provided in
the user manual and understand then perform various actions. If users face problems they
must ask the information technology personnel.

Page | 91
APPENDIX B: INTERVIEW GUIDELINE USED FOR THE RESEARCH
The following are some of the open ended questions faced by organisational members of the
HJP Brick Sellers during the interview:
Section 1: Interview details
a) Name of interviewer ………………………………………
b) Department of interviewee ………………………………………
c) Position of the interviewee ………………………………………
Section 2: Interview questions
1. For how long have you been at this organisation?
……………………………………………………………………………….
2. How do you do as an organisation in processing orders?
……………………………………………………………………………….
3. May you briefly explain your system in terms of input, processes and outputs?
……………………………………………………………………………….
4. What are the processes involved in selling bricks?
………………………………………………………………………………..
5. How long it take to process the information for ordering and purchase?
………………………………………………………………………………..
6. Is the current system secure and to what extend?
……………………………………………………………………………….
7. Is it a good idea to develop an online ordering system?
………………………………………………………………………………..
8. Do you think there is a need for improvement and what are your suggestions?
…………………………………………………………………………………
9. How long it take to produce reports?
………………………………………………………………………………….
10. How do you communicate with direct stakeholders and known customers?
………………………………………………………………………………….
11. Are there any repetitive information system related problems at the organisation?
………………………………………………………………………………….
12. What are the modes of payment you accept?
………………………………………………………………………………….
Date……………………../ interviewer’s signature………………………………….

Page | 92
APPENDIX C: QUESTIONNAIRE CHECKLIST
QUESTIONNAIRE FOR THE HJP BRICKS ONLINE ORDERING SYSTEM
I am Ziwewe Nyasha Desire, a student at the Midlands State University doing
Information Systems Honours degree. One of the requirements in order to attain the degree
is a project report with a running software system. This questionnaire is prepared to collect
information which will help in the development of the HJP Online ordering system. I kindly
request for your positive responses to answer the questions involved. I promise to keep the
provided information private and use it only for academic purposes.
1. For how long does it take to process orders…………….... hours
2. What are the various processes involved in the current system
…………………………………………………………………………………
…………………………………………………………………………………
………………………………………………………………………………….
3. Tick where applicable
i. Are you satisfied with the current system?
ii. Are you satisfied with the services offered?
If answer is no, add some reasons and explanation if any.
………………………………………………………………………………....
………….………………………………………………………………………
4. Are you in favour of the new online ordering system?
If answer is no, add some reasons and explanation if any.
………………………………………………………………………………..
.....................………………………………………………………………....
5. What are your expectations in the new system?
..............................................................................................................................
..............................................................................................................................
..............................................................................................................................
6. Are the previous changes done and faced resistance and why if any?
…………………………………………………………………………………
…………………………………………………………………………………
…………………………………………………………………………………
Ye
s
No
Ye
s
No
Ye
s
No

Page | 93
7. Are there any other technologies you wish to be integrated with the new
system?
…………………………………………………………………………………
…………………………………………………………………………………
8. Do you think the new system will be a competitive tool?
Date …………………….Time……………………. Thank you for your cooperation
Ye
s
No

Page | 94
APPENTIX E: OBSERVATION SCORE SHEET
Observations
Inputs
…………………………………………………………………………………………………
…………………………………………………………………………………………………
…………………………………………………………………………………………………
…………………………………………………………………………………………………
…………………………………………………………………………………………………
…………………………………………………………………………………………………
Processes
…………………………………………………………………………………………………
…………………………………………………………………………………………………
…………………………………………………………………………………………………
…………………………………………………………………………………………………
…………………………………………………………………………………………………
…………………………………………………………………………………………………
Outputs
…………………………………………………………………………………………………
…………………………………………………………………………………………………
…………………………………………………………………………………………………
…………………………………………………………………………………………………
…………………………………………………………………………………………………
…………………………………………………………………………………………………
Resources used
…………………………………………………………………………………………………
…………………………………………………………………………………………………
…………………………………………………………………………………………………
…………………………………………………………………………………………………
Entities involved
…………………………………………………………………………………………………
…………………………………………………………………………………………………
…………………………………………………………………………………………………
…………………………………………………………………………………………………
Site……………………. Date …………/…………../…………. Signature…………………

Page | 95
APPENDIX F: SNIPPET OF CODE
The HJP Online ordering system was developed in php language with PHP MySQL
technology. The system has many modules with many pages of codes. The system files
comprises of hundreds of pages of code. In this document, few code samples are given.
User Login
<?php error_reporting(0); include ('connect.php');
if (isset($_POST['go'])) {
$username = $_POST['username'];
$password = $_POST['password'];
$result = mysql_query("SELECT * FROM tb_user WHERE username = '$username' AND
password = '$password'") or die(mysql_error());
$row = mysql_fetch_array($result);
$numberOfRows = mysql_num_rows($result);
if ($numberOfRows == 0) {
echo " <br><center><font color= 'red' size='3'>Please fill up the fields
correctly</center></font>"; }
else if ($numberOfRows > 0) {
session_start();
$_SESSION['id'] = $row['user_id'];
header("location:product.php");
}} ?>
Add products
<?php error_reporting(0), include ('connect.php');
if (isset($_POST['go'])) {
$name = $_POST['name'];
$description = $_POST['description'];
$category = $_POST['category'];
$originated = $_POST['originated'];
$price = $_POST['price'];
$quantity = $_POST['quantity'];
//image
$image = addslashes(file_get_contents($_FILES['image']['tmp_name']));
$image_name = addslashes($_FILES['image']['name']);
$image_size = getimagesize($_FILES['image']['tmp_name']);
//
move_uploaded_file($_FILES["image"]["tmp_name"], "upload/" . $_FILES["image"]["name"]);
$location = "upload/" . $_FILES["image"]["name"];

Page | 96
mysql_query("insert into tb_products
(name,description,category,originated,price,quantity,location)
values
('$name','$description','$category','$originated','$price','$quantity','$location')")
or die(mysql_error());
header('location:product.php');
}?>
Order
<?php
$query = mysql_query("select * from tb_products") or die(mysql_error());
while ($row = mysql_fetch_array($query)) {
$id = $row['productID'];
$qty = $row['quantity'];
$category = $row['category'];
$query1 = mysql_query("SELECT *,SUM(qty) as qty FROM order_details WHERE productID =
'$id' AND status = 'Delivered'");
$row1 = mysql_fetch_array($query1);
$total_qty = $qty - $row1['qty']; ?>
<li class="span3">
<div class="thumbnail">
<img data-src="holder.js/300x200" alt="">
<div class="alert alert-success"><div class="font1"><?php
echo $row['name']; ?></div></div> <hr>
<a href="#<?php echo $id; ?>" data-toggle="modal"><img src="admin/<?php echo
$row['location'] ?>" class="img-rounded" alt="" width="180" height="110"></a>
<p> <a> Price: $<?php echo $row['price']; ?></a></p>
<?php if ($total_qty > 0) { ?>
<a href="#add<?php echo $id; ?>" data-toggle="modal" class="btn btn-success"><i
class="icon-shopping-cart icon-large"></i> Add to Cart</a>
<?php } else { ?>
<span class="label label-important">Out of Stock</span> <?php } ?>
<?php include ('order_modal.php'); ?> <?php }
if (isset($_POST['order'])) {
$member_id = $_POST['member_id'];
$quantity = $_POST['quantity'];
$price = $_POST['price'];
$product_id = $_POST['product_id'];
$total = $quantity * $price;
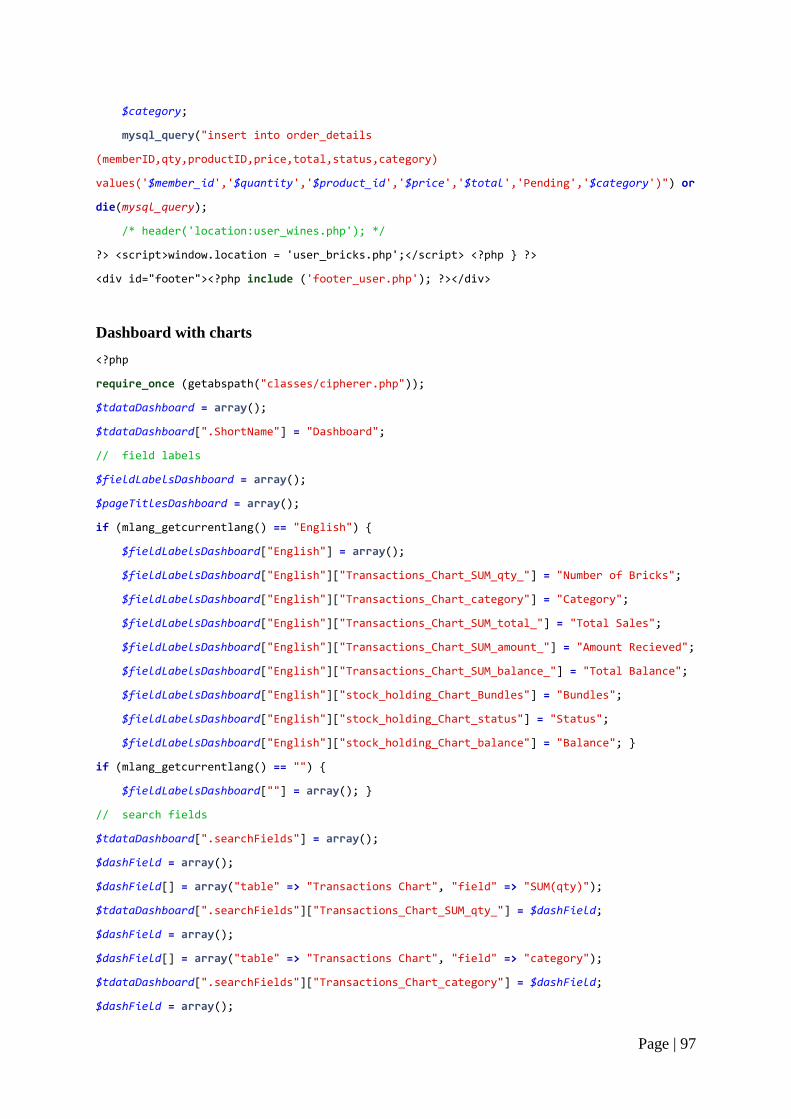
Page | 97
$category;
mysql_query("insert into order_details
(memberID,qty,productID,price,total,status,category)
values('$member_id','$quantity','$product_id','$price','$total','Pending','$category')") or
die(mysql_query);
/* header('location:user_wines.php'); */
?> <script>window.location = 'user_bricks.php';</script> <?php } ?>
<div id="footer"><?php include ('footer_user.php'); ?></div>
Dashboard with charts
<?php
require_once (getabspath("classes/cipherer.php"));
$tdataDashboard = array();
$tdataDashboard[".ShortName"] = "Dashboard";
// field labels
$fieldLabelsDashboard = array();
$pageTitlesDashboard = array();
if (mlang_getcurrentlang() == "English") {
$fieldLabelsDashboard["English"] = array();
$fieldLabelsDashboard["English"]["Transactions_Chart_SUM_qty_"] = "Number of Bricks";
$fieldLabelsDashboard["English"]["Transactions_Chart_category"] = "Category";
$fieldLabelsDashboard["English"]["Transactions_Chart_SUM_total_"] = "Total Sales";
$fieldLabelsDashboard["English"]["Transactions_Chart_SUM_amount_"] = "Amount Recieved";
$fieldLabelsDashboard["English"]["Transactions_Chart_SUM_balance_"] = "Total Balance";
$fieldLabelsDashboard["English"]["stock_holding_Chart_Bundles"] = "Bundles";
$fieldLabelsDashboard["English"]["stock_holding_Chart_status"] = "Status";
$fieldLabelsDashboard["English"]["stock_holding_Chart_balance"] = "Balance"; }
if (mlang_getcurrentlang() == "") {
$fieldLabelsDashboard[""] = array(); }
// search fields
$tdataDashboard[".searchFields"] = array();
$dashField = array();
$dashField[] = array("table" => "Transactions Chart", "field" => "SUM(qty)");
$tdataDashboard[".searchFields"]["Transactions_Chart_SUM_qty_"] = $dashField;
$dashField = array();
$dashField[] = array("table" => "Transactions Chart", "field" => "category");
$tdataDashboard[".searchFields"]["Transactions_Chart_category"] = $dashField;
$dashField = array();

Page | 98
$dashField[] = array("table" => "Transactions Chart", "field" => "SUM(total)");
$tdataDashboard[".searchFields"]["Transactions_Chart_SUM_total_"] = $dashField;
$dashField = array();
$dashField[] = array("table" => "Transactions Chart", "field" => "SUM(amount)");
$tdataDashboard[".searchFields"]["Transactions_Chart_SUM_amount_"] = $dashField;
$dashField = array();
$dashField[] = array("table" => "Transactions Chart", "field" => "SUM(balance)");
$tdataDashboard[".searchFields"]["Transactions_Chart_SUM_balance_"] = $dashField;
$dashField = array();
$dashField[] = array("table" => "stock holding Chart", "field" => "Bundles");
$tdataDashboard[".searchFields"]["stock_holding_Chart_Bundles"] = $dashField;
$dashField = array();
$dashField[] = array("table" => "stock holding Chart", "field" => "status");
$tdataDashboard[".searchFields"]["stock_holding_Chart_status"] = $dashField;
$dashField = array();
$dashField[] = array("table" => "stock holding Chart", "field" => "balance");
$tdataDashboard[".searchFields"]["stock_holding_Chart_balance"] = $dashField;
// all search fields
$tdataDashboard[".allSearchFields"] = array();
$tdataDashboard[".allSearchFields"][] = "Transactions_Chart_SUM_qty_";
$tdataDashboard[".allSearchFields"][] = "Transactions_Chart_category";
$tdataDashboard[".allSearchFields"][] = "Transactions_Chart_SUM_total_";
$tdataDashboard[".allSearchFields"][] = "Transactions_Chart_SUM_amount_";
$tdataDashboard[".allSearchFields"][] = "Transactions_Chart_SUM_balance_";
$tdataDashboard[".allSearchFields"][] = "stock_holding_Chart_Bundles";
$tdataDashboard[".allSearchFields"][] = "stock_holding_Chart_status";
$tdataDashboard[".allSearchFields"][] = "stock_holding_Chart_balance";
// good like search fields
$tdataDashboard[".googleLikeFields"] = array();
$tdataDashboard[".googleLikeFields"][] = "Transactions_Chart_SUM_qty_";
$tdataDashboard[".googleLikeFields"][] = "Transactions_Chart_category";
$tdataDashboard[".googleLikeFields"][] = "Transactions_Chart_SUM_total_";
$tdataDashboard[".googleLikeFields"][] = "Transactions_Chart_SUM_amount_";
$tdataDashboard[".googleLikeFields"][] = "Transactions_Chart_SUM_balance_";
$tdataDashboard[".googleLikeFields"][] = "stock_holding_Chart_Bundles";
$tdataDashboard[".googleLikeFields"][] = "stock_holding_Chart_status";
$tdataDashboard[".googleLikeFields"][] = "stock_holding_Chart_balance";
$tdataDashboard[".dashElements"] = array();

Page | 99
$dbelement = array("elementName" => "Transactions_Chart_chart", "table" => "Transactions
Chart", "type" => 1);
$dbelement["cellName"] = "cell_0_1";
$tdataDashboard[".dashElements"][] = $dbelement;
$dbelement = array("elementName" => "stock_holding_Chart_chart", "table" => "stock holding
Chart", "type" => 1);
$dbelement["cellName"] = "cell_0_0";
$tdataDashboard[".dashElements"][] = $dbelement;
$tdataDashboard[".shortTableName"] = "Dashboard";
$tdataDashboard[".nType"] = 4;
$tableEvents["Dashboard"] = new eventsBase;
$tdataDashboard[".hasEvents"] = false;
$tdataDashboard[".tableType"] = "dashboard";
$tdataDashboard[".addPageEvents"] = false;
$tables_data["Dashboard"] = & $tdataDashboard;
$field_labels["Dashboard"] = & $fieldLabelsDashboard;
$page_titles["Dashboard"] = & $pageTitlesDashboard;
?>
Displaying database data (products)
<?php include ('connect.php');
$query = mysql_query("select * from tb_products") or die(mysql_error());
while ($row = mysql_fetch_array($query)) {$id = $row['productID'];
$query1 = mysql_query("SELECT *,SUM(qty) as qty
FROM order_details WHERE productID = '$id' AND status = 'Delivered'");
$row1 = mysql_fetch_array($query1);
$total=$row['quantity'] - $row1['qty'];
$query2 = mysql_query ("UPDATE product set quantity = '$total' where productID = '$id'");?>
<tr class="warning">
<td><?php echo $row['name']; ?></td>
<td><?php echo $row['description'];?></td>
<td><?php echo $row['category']; ?></td>
<td><?php echo $row['originated']; ?></td>
<td style="text-align:right;"><?php echo number_format($row['price'],2); ?></td>
<td style="text-align:center;"><?php echo $total; ?></td>
<td><a href="<?php echo $row['location'] ?>" target="_blank"><img src="<?php echo
$row['location']; ?>" class="img-rounded" width="50" height="40"></a></td>
<td width="160">

Page | 100
<a href="#delete_product<?php echo $id; ?>" role="button" data-target =
"#delete_product<?php echo $id;?>"data-toggle="modal" class="btn btn-danger"><i
class="icon-trash icon-large"></i> Delete</a>
<a href="edit_product.php<?php echo '?id=' . $id; ?>" class="btn btn-success"><i
class="icon-pencil icon-large"></i> Edit</a></td>
<!-- product delete modal --> <?php include ('delete_product_modal.php');?>
<!-- end delete modal --> </tr><?php } ?> </tbody> </table>
HTML design sample (signup page)
<div class="modal fade" id="myModal" tabindex="-1" role="dialog" aria-
labelledby="myModalLabel" aria-hidden="true">
<div class="modal-dialog"> <div class="modal-content"> <div class="modal-header">
<div class="alert alert-info"><strong><center>Add Product </center></strong></div></div>
<div class="modal-body"> <form method="post" enctype="multipart/form-data">
<hr><div class="control-group"> <label class="control-label" for="inputEmail">Name:</label>
<input type="text" name="name" class="form-control" placeholder="Name" required></div>
<div class="control-group"> <label class="control-label"
for="inputPassword">Description:</label>
<div class="controls"> <input type="text" class="form-control" name="description"
placeholder="Description" required> </div> </div>
<div class="control-group"> <label class="control-label"
for="inputPassword">Category:</label>
<div class="controls"> <select type="text" name="category" class="form-control"
placeholder="Category">
<option>block</option>
<option>standard</option>
<option>timber</option>
</select></div></div>
<div class="control-group"> <label class="control-label"
for="inputPassword">Origin:</label>
<div class="controls">
<input type="text" name="originated" class="form-control" placeholder="Origin" required>
</div></div>
<div class="control-group"> <label class="control-label" for="inputPassword">Price:</label>
<div class="controls"> <input type="number" step="10" name="price" class="form-control"
placeholder="Price" required min="100"></div></div>
<div class="control-group"> <label class="control-label"
for="inputPassword">Quantity:</label>

Page | 101
<div class="controls">
<input type="number" name="quantity" placeholder="Quantity" class="form-control" required
min="1"></div></div>
<div class="control-group"><label class="control-label" for="input01">Image:</label>
<div class="controls"> <input type="file" name="image" required accept="image/jpeg,
image/png"></div></div>
<div class="modal-footer"> <button name="go" class="btn btn-primary">Save</button>
<button type="button" class="btn btn-default" data-dismiss="modal">Close</button>
</div></div></div></form>
CSS setting sample
body { background: #fff; font-family: Arial, Helvetica, sans-serif;font-size: 13px;
line-height: 1; margin: 0; min-width: 960px;padding: 0; }
#background {margin: 0; padding: 0; }
#page { margin: 0 auto; overflow: hidden;padding: 0 10px;width: 1200px;}
#sidebar {background-color: green; float: left; margin: 0 10px 0 0; padding: 0;width:
230px;}
#sidebar a.logo { display: block; margin: 0;padding: 0;}
#sidebar a.logo img {border: 0; display: block; }
#sidebar div { margin: 0; padding: 0;}
#sidebar ul { margin: 0;padding: 0;}
#sidebar ul li {list-style: none; margin: 0;padding: 0;}
#sidebar > ul {padding: 18px 10px 0;}
#sidebar > ul li {height: 20px; margin: 0 0 28px;text-align: center;}
#sidebar > ul li a {color: white; font-family: Georgia, serif; font-size: 16px; height:
22px;letter-spacing: 1px; margin: 0; padding: 0; text-decoration: none; text-transform:
uppercase; width: auto;}
#sidebar > ul li a:hover {background-color: green; color: #ebcdd4;}
#sidebar > ul li.selected span {background: url(../images/brace-left.png) no-repeat bottom
left; display: inline-block; margin: 0;padding: 0 0 0 20px;}
#sidebar > ul li.selected a {color: #ebcdd4;display: inline-block;padding: 0 20px 0 0;}
#sidebar .contact {background-color;}
#sidebar .contact ul li {padding: 15px 10px;text-align: center;}
#sidebar .contact > ul {padding: 0 0 10px;}
#sidebar .contact ul ul li {color: #000;line-height: 18px;padding: 0;}
#sidebar .contact ul li span {background: url(../images/icons.png) no-repeat; display:
block; margin: 0 auto 10px; padding: 0;text-indent: -99999px; width: 21px;}
#sidebar .contact ul li.address span { background-position: -8px -198px; height: 22px;}

Page | 102
#sidebar .contact ul li.contactInfo span {background-position: -8px -240px;height: 19px;}
#sidebar .contact ul li.mail span {background-position: -8px -279px;height: 17px;}
#sidebar .contact ul ul li a {color: #7d7c7c;text-decoration: none;}
#sidebar .contact ul ul li a:hover {color: #000;}
#sidebar .connect { background: #202958;padding: 20px 0;}