Ordering Conference Proceedings - National Sea Grant Library
691
-
Upload
khangminh22 -
Category
Documents
-
view
1 -
download
0
Transcript of Ordering Conference Proceedings - National Sea Grant Library


Ordering Conference Proceedings
Copies of annual proceedings &om the second through thc eleventh are available from theTexas Sea Grant College Program. Please note that thc tenth annual proceedings contains acunmlative index aud that no copies of the Grst annual proceedings are stiH available for pur-chase. Prices for early Proceedings follow: second through eighth, $10; ninth, $12; tenth andeleventh, $15. Please make chedm payabic to Texas A804f University and mail with yom orderto Tesns Scn Grant CoHege Pb!gnun, Texas AkM University, Collele Station, TX77$43A115.
This twelfth proceedings may be purchased by a $15 check made payable to the Universityof Horida. Phase request SGR-92 and mail your check and order to the Florida Sea GrantKhtaasion Pruiisvnn, G022 McCarty HaH, University ot Florida, Gainesviile, FL 32605.

LOAN COPY ONi.Y
Twelfth Annual Conference
Tropical and Subtropical FisheriesTechnological Society of the Americas
Proceedings
from the first joint conference with
Atlantic Fisheries Technological Society
November 9-11, 1987Orlando, flor/da
compiled byW. Steven Otwell
Seafood Technology SpecialistRorlda Sea Grant Extension Program
Food Science and Human Nutrition DepartmentInstitute of Food and Agricultural Sciences
University of Florida, GainesvIIIe
The Tropical and Subtropical Fisheries Technological Society of the Americas is a profes-sional, educational association of fishery technologists interested in the application of scienceto the unique problems of production, processing, packaging, distribution, and utiTization oftropical and subtropical fishery species.
These papers are compiled and reproduced with limited editions and without formal reviewby the Florida Sea Grant College Program. Content is the sole responsibiTity of the author{s!.The Conference intent is to compile preliminary results from ongoing research and advisoryservices to facilitate communication between regional investigators, industries, and govern-ment entities. Reproduction in this Proceedings does not preclude supplementation and fur-ther publication of work in reviewed journals or similar publications.
florlda Sea Grant College ProgramG022 INcCarty Hall, University of florida, Gainesville, FL 32611
June 1988
Price: $15.00
TABLE OF CONTENTS
Purincation and Chmucterhation of Phenoleddases in Crustaceans: Shrimp and LobsterMaurice R Marshall, Benjamin K Simpson, Obdulio Ferrer, and 8'. Steven Otwell
A Comptehemdve Overview of the Use and Testing of Sodium msulgte on ShrhnpMartha Hudak-Roos and W. Steven Otwell 13
The Qmmtltative Detennlnatiou of EDTA in Fr«sen CrawnshMeganne W. Finerty and Midutel W; Moody
Intramuscular Collagen of Fresh and Fr«am Atlaatic Cod ~ morhua!C G. IVY'on and T.A. Gill 32
In Vitro Uphl Oxidatiou of Sure«plasmic Reticulum by in Situ Concentrations «f Feand Cu
Eric A. Decker and Herbert O. Hultin 53
BS
Devdopmeut of a Swimming Ctub Fishery in EcuadorXathleen M. Castro and Joseph T. DeAltens
Effects of Processing on the Quality and Tenderness oi'the Hesh of the Conunon Whelk Buccinu taufatum L!
L T. Adambounou, J. Lavallee, and F. Casttzigne
Evaluation of a Contaiueriaed System l'or the Relaying of Polluted Chuns Men;enariameiceutrut!
William D. DuPaul and Michael J. Oesteriing
Effect «f Shipping Shucked Oysters Long Distance on Drain Weight audFree Liquor Content
Guneun R Hackney and Lisa X Sanders
quid Loss in Shucked East and Gulf C«ast Oysters during StorageDavid W. Cook, Tuujyi Chai, Cameron R Hackney, JK Steven Otwell, Dorm Ward,
and Roy E. MartinAn Ec«nomic Analysis of the Gulf of Mexico SheliSsh Proceming Industry
Walter R Xeithly, Jr�Keineth J. Roberts, and Charles M. Adams
Imp«rtant Considerations ln Opthnizing the Formulation of Surimi-Based ProductsChong M. Lee, Jon-Shang Chen, and Xang H. Chung
ModlticaNeu of Functional Properties of Surfmi by Changes in Prote'm CompositionJohn S. French
107
121
135
151
176
181
Eifect «f C~ Modtdied Atmesplmre with Ptessurization on the Keeping Quahty ofCod Hllets at ~
F. M. Bartlett and E. G. Bligh 64
Par@ication of Omega' Fatty Acids Irom Fish Oils Using HPLC; An OvenmwJudith Xrzynowek, Daniel L. D'Entremont, Laurie J. Panunzio, and Richard S. Maney 74
Health Messay:s About SeafoodJoyce A. Nettleton 78
Nomenclature aml Labeling of Hshety Products: A Marlethg MenuuaDonai'd R. Maher, James R Brooker, and Mary J. Snyder
The Golden Crab Geryon fennen! Hsherj of Soutlieast FloridaRobert B. Erdman and Norman J. Blake 95

The Production of Surimi fthm Pacilc%biting Merhtcciusproductus!Ramon Pacheco-Aguilar and David L Crawford
Studies on Flow and Gel Forming Behavior of Squid Surhni in Relation to FormulationJ. M ICE
US. Fishery B!~!ducts: A Selective Update and RevievvSusan H. Goldhor and Joe M. Regenstein
Recovery of Protein Rom Medmniatl Shrimp Peeler Elluents: MicrobiologicalQuality of Eiituent and Recover Protein
BHan E. Perkins and XbnberlyP. Harper
Freeze-Thaw Concentration of SbeNhh Ectxact and Its Havor ProfileCharles N. Jayaralah and Chong M. Lee
Characterization of Minced Meat Recovexed than Bine Crab By-ProductsKeith l'K Gates, Jacdle G. EuDaly, Arnanda H. Parker, and Carole A. Greene
The Menhaden Surimi Demons@ation HaaL A Progress ReportMakobn B. Htde and Anthony P. Bimbo
Interaction of Frozen Storage Temperature and Food Additives with Cod Filetand Frame Mace
Jorge Toro, Tim Hwang and Joe M Regenstein
'Ihe Bene5ls of Canngenmn as a Seafood Processing AidCharles K Bullens, James J. Modlissewski and James J. Navarrtr
Meclmnciai Properties of Fish Gels Made Iroan Mized Species Without Added SodiumCMoride
X Vareitsis, E. M. Buck and H. O. Hultin
Nathnml Marine Fisheries Service Saltonstall-Kenn~ S-K! Fnndinip TecimicalPeer Revtevv of National Priority Proposals
Paul Comar
Qusllty Changes Occuning in Hybrid Striped Bass Skmless Fillets and in Headedand Gutted Hybrids During Iced Stomps
Michael Jahncke, Malcom B. Hale and Janet A. Gooch
Thermal Processing Studies of Paci5c HakeBoey Chee Cheong and Marvin A. Tung
On Board Fish Handling Systems for Offshore WetBsh Trawiers: "Work Smarter,Not Harder"
8'. X Rodman
Polyphosphate Determination in Shrimp Using High Perfonnance UquidChromatography
Melissa Sturno, Maunce R Marshall, and IK Steven Otwell
K~nes of Commerchd aml Scientifk Imia!romance irom Cold Water Fish IntestinesRobert D. Riley, Kelly M. Sledr, Jon B. Bj amason, and Jay Fax
Biochemical Fish Quality Evaluation with Recommended MethodsP.J. Ke and B. G. Burns
Determination of Minimal Tem peratunn for Histamine Ptetuction by Five BachniaC M Chen, M R Marshall, J.A. Koburper, W S. Otwell, and C. I. 8'ei
Xenobiotic Residues in CrawIsh &ocambarusclarbi! Edible TIssueJ. D. Madden, M W. Finerty, and R M, Gnrder
194
213
252
270
279
298
308
309
321
332
359
421
A Statistical Review of the Interstate Sbdllsh Sanitathm Conierence'sSampgng Prot«el for Satisf Shipping Conditions
Alvin P. Buinosek
Property and Potentbd Uses of Oyster Shucking Waste WaterChyuan-Yuan Shiau and 7'uujyi Chai
Prelbninary Assessments of Mullet Carcass Bypr«lucts Geaeratedby tbe HoUoany Process
Bnan E. Perkins, Michael H. Eky, Chord C Holloway, and Melvin V. Xilgore, Jr. 405
Quality of Pnviously Frozen Oysters Rcpackcd for the Fresh ~Cameron R Hackney, Thomas E. Ripen, and Lisa K Sanders
Gamma ItvutBatkn of Vibno choierae in Ctaylsb Pnxarnbanls clanbi Gerard!Robert M. Grodner and AIthur Hinton, Jr. 429
ControUed Fresh Well-Water Closed Soft Crab Shedding SystemWayne Wescott
An Kconomic Analysis of the 1986 Alabama Mu8et Roe IndustryWaViam Hosking, Bnan Z. PeNns Richard K Wallace, and Hugh A. Swingle
Harvest and Preservation ota Shrimp Bycatch: Caunonbail Jcilynsh Stomolophus meleagns!
Yaowen Huang Paul Christian, and Dan Colson
Development and Evaluation of Skinless, Boneless Pink Sahnon ProductsCbuks Crapo, Elisa Elliot, Jerry BabMt, Kermit Repond, and Paul Peyton
Developments in El@@eared Sesf«uisJames R B'rooker and Robert Nordstrom
Texbnu and &mac-Thaw Staiai~ of Surbni Gals Prepared with a Combinationof Atbmtic Pollock and Whlbs Hake
J. M. 1$n
Effect of Bnvdetvxl Cellulose on the Texture and Water Binding Propertiesof Surlmi-Based Mxhtcts
%Sun Yoon, C M. Lee, and K.H. Chung
Tezture-ModifIing Elfect of Nonlsh Protein in Surimi GeiX H. Chung and C.M. Lee
Cluuges in the Fatty Acid and Audno Acid Pro@as af Fish MinceDuring Surbni Processing
Henry Leibovitr, Richard D. Monzen, and Chong M. Lee
Seleory Analysis of Edible Hsh OilsJanet A. Gooch and Sylvia B. Galloway
Electrophotetic ldentincation of Shrimp Using Various Ptutein I' ctntction SystemsHaejungAn, Maunce R. Marshall, W. Steven Otwell, and Chen~ Wei
Species Identi5cation of Isoel«Wc FocusmgXellie Haynes
Avoidance Costs Due to Public Awareness of Ciguatera Fish Poisoningsin Finds and Havnm
Myles Raizin and Malcobn Meabum
Enhanced Isolation of Plesiornonasshigeltoidct Using an Enriciunent Techniqueaad Factors Intluencing Its Bccmauy from Raw Oysters
Susan M. Freund, John A. Koburger, W. Steven OtweN, and Cheng-i Wei
475
505
516
525
535
541
554
567
583

The Meet of Eactk Acid Starter Cultures oa Hsh Spoilage IhicteriaS. M Rose, F. Jd.' BaItlett, and E. G. Bligh
Nudeoside Phosphayhme and Its Role ia Fish SpoilageT.A. GiN, Mare Surette, and Stephen MacLean
A Rapid Color Test Strip for Es5mating Hsh FreshnessKwan Mong and Tom Gill
Performmice Characteristks of FDA's Sampling Plans for Deempositioaof Hsh aad Seafood
Alvin P. Rainosek
596
627
Model Seafood Surveillance ProgramF. Spencer GaIret and Mmtha A. Hudak-Roos
Contrlbutioa of Cathepsia C to tbe Fermentatioa of Hsh Sauce Prepared&em CapeBu Mullotus viliosus! aad Squid Hepatopancreas
Nongnuch Raksakulthai and Norman Haard 658
Fractlonatioa of Fatty Acid Ethyl Esters Using Supeteriticai Huld Carbon DioxideSflliam B. Nilsson 671
Spathl Patterns of Adnadaace tor ~niter Goldeu Crab Geyon fennen"l and Red Crab G. quirtquedens! ia the Eastern Gulf of Mexko
WiNam J. Lindberg FrankLockhart, Hamet Perry, and Richand 8'aller 671
FeaslbQity of Using StxesatStrala hleasurements for Least&«st Formulationof Surimi4ased Foods
Tyre Lanier
Surimi Studks on White Hake Uiophyct's tenuis!E. G. Bligh and K Spencer
Effect of Washing oa Soluble Protein Content la Dark and Ordinary Musck TissuesObtained from Athaatk Maihaden
D. P. Green and T. C. Lanier
672
672
672
The Meets of Various Salts oa the Textural and Chemical Changes in FroxeuGad«id and Non~old Fish Mlncea
Karl Ragnarsson and Joe M. Regenstein
Recent Progress in the Development of a Receptor Based Bi«sensor for Detectionof Maine T«sins
L. V. Sick and P. B. Travis
673
673
Edendiug Storage Ufe «f &ash Tropical Hsh by Blanching Combined with Storage in~ Mixtures
L J. Toledo-Flows and R R Zall
Effects of Phosphates, NaCI, Water Conteat, aad Process Temperatures oa Textureof Surhni Gels
Vivian M. Higgins, Tyre C Lanier, Jae R Park, and Jose Monteiano
Meet of Redfeed Coatent Upon tbe Frequency of Degradatlon of Spawning FemaleCapnn during Storage Prior to Freexiag, during Frozen Storage, during Thawing
David R L $7tite
674
674
Abstracts
The foQowing abstracts represent conference presentations not submitted as full lengthpapers. The Tropical/Subtropical Fisheries Technological Society encourages pubIicatiou ofall presentations, but publication is an author's option.

Preliminary Report oa Applicability of Conunercial Micro KIts ln DetecthigFecal CoNorms in Seafoods
Bohdan M. Slabyj, Susan A. Ismail and Stefanie 0. Slabyj
Microtiaaa Changes ia Post-Harvest Shellstock OystersAngela D. Ruple arui David W. Cook
Shoto ghana spp.! Haadliag, Ptvuxssiag aad Storage CharaclaristicsKurt A. Wilhelm and Barbarit L. Jobe
Caliiriasetric Denataratioa Kinetics of Surimi as ANected by Sugar and/or SaltJae Park and Tyre Lanier
SiomeHcal Test Materials from Menhaden Oil
Jeanne D. Joseph, Sylvia B. Galloway, and Robert Kfer
FIshtlroc A Computerised Informatioa SystemMartha Hudak-Roos 677
Proyess ia the Development of Moaodomd Antibodies to Semi-PnriiledMaltotordn Extracts Irom Gambieidiscus toracus
Ronald C Lundstrcrm, Cluistopher Martin, Debra A. Adams, Debra J. Rhoades,and Lowell V. Sick
IIIuminatioa Stadhn for ImIwuved Inspection Systems for Detectloa of PhocimeinaJ. H. Mac¹il, J. C WarnboI'd and H.J. Sorter 678
Product@a of Hsh Hydrates for Agricultural ApplkationsRobert J. Learson, Vincent G. Ampola, Biuton L Tinker, and Robert Van Twuyver 675
Nlhcts of Hsh Hydrolysate oa Greaihoiise Grovva Capsicum putescens "Jalapeno"Amul Purohit, Michael Potter, Ronald Athanas, and Robert J. Learson

PURIFICATION AND CHARACTERIZATION OF PHENOLOXIDASES INCRUSTACEANS: SHRIMP AND LOBSTER
Maurice R. Marshall, Benjamin K. Simpson , Obdulio Ferrerand W. Steven Otwell
Food Science and Human Nutrition Department, University ofFlorida, Gainesville, FL 32611
Department of Food Science & Agric. Chem., MacdonaldCollege of McGill Univ., St. Anne de Bellevue, P.Q., Canada
H9X 1CO.
Facultad de Agronomia, Universidad del Zulia, Maracaibo,Venezuela.
INTRODUCTION
Phenoloxidases' PO! from crustacean species shrimp,lobster and crab! have been studied in some detail in thislaboratory Marshall et al. 1984; Ferrer et al. 1986;Simpson et al. 1987!. It has been suggested by variousresearchers that PO's are responsible for: melanosis Wagner and Finne, 1986!, sclerotization hardening! aftermolting Cobb, 1977!, wound repair in the integument, andmay be indirectly involved in the calcification of thecuticle Stevenson, 1985!.
Mel'anosis or blackspot is a dark discoloration which isunattractive to consumers and reduces the market value ofcrustaceans. In a study by Koburger et al. �985!,melanosis developed in lobster abdomens stored on ice at4 C. An intense blackening of the epidermis occurred withthe dark pigment migrating into the muscle tissue. In somelobsters, the appearance of melanosis was obvious after 2days of storage, while other lobsters took up to 5 days toblacken. Sulfiting agents have been used to preventmelanosis in shrimp. However, consumer and governmentconcerns about the safety of sulfites added to foods havetriggered a search for suitable alternatives. At this time,no suitable alternative other than bisulfite has been found Taylor and Bush, 1983; Otwell and Marshall, 1986! .
The solution to this problem may lie in theinvestigation of kinetic and other properties of thepurified enzyme s! to obtain a better understanding of thebiochemical basis of phenoloxidase action and the melanosisphenomenon. The present paper describes kinetic and someother properties of PO from crustaceans two species ofshrimp and one species of lobster! which undergo melanosisto varying degrees.

MATERIALS AND METHODS
t a tion e o oxid se:
The method used for extracting PO was a slightmodification of one described previously Simpson et al.,1987!. Extraction involved stirring the shrimp powder in0.05 M sodium phosphate huffer pH 7.2, containing 0.5 MMacl! with 0.22 "Hrij 35" at a ratio of 1:3 w/v! for 3 hat 4 C. The homogenate was centrifuged at 8,000xg � C! for30 min and the clear supernatant was fractionated with solidammonium sulfate. The fraction precipitating betveen 04 to40% saturation vas collected by centrifugation at12,500xg � C! for 30 min. The precipitate was redissolvedin extraction buffer and dialyzed against 3 changes of 6 Lof 0.05 M sodium phosphate buffer pH 7.2!.
For lobsters the crude PO extract was prepared byhomogenizing Waring blender! lobster cuticle with 0.05 Mpotassium phosphate buffer �:4 w/v; pH 7.2! for 2 min four homogenizations of 30 sec each! at 4 C. The homogenate
Dihydroxyphenylalanine DOPA!, CNBr-activated Sepharose4B and bovine pancreas trypsin type III! were purchasedfrom Sigma Chemical Company. Para-amino benzoic acid PABA!was purchased from Fisher Scientific Company and standardlow molecular weight markers for polyacrylamide gelelectrophoresis were obtained from Bio-Rad. The shrimpobtained from Key West, Florida, were kept on ice andtransported <1 day! to the laboratory. The carapace wasremoved and rapidly frozen in liquid nitrogen, comminuted toa fine powder in a Waring blender, and then stored at -30 Cuntil needed. Lobsters Panulirus argus! were obtained fromthe Florida Keys and maintained in tanks with flow-throughsea water circulation at the Whitney Marine Laboratory,Marineland, FL. Water temperature was not controlled, andvaried according to the season. - Every month, during the1985-86 season, 2-3 lobsters vere selected at random for POanalysis; a total of 26 lobsters were analyzed for seasonalvariation of PO levels. PO levels were also measured . inlobsters �4 specimens! at different molt stages: molt newly molted lobsters!, postmolt, intermolt and premolt asdescribed by Stevenson �985!. The different molt stageswere determined by morphological changes in the epidermis,by the hardness of the exoskeleton, by following thedevelopment of setae in the pleopods and by the appearanceof an ecdysial line along the branchiostegites, which ischaracteristic of a premolt lobster Travis, 1954!. Abdomensof the lobster were removed and immediately frozen andstored at -20 C. Only cuticle on the dorsal surface of theabdomen was used for the PO determinations.

was then centrifuged at 10,000g for 20 min at 4 C. Thesupernatant crude extract! was filtered through Whatman 0 1filter paper and stored at -20 C until assayed <24 h!.
n't ch m a h
The dialyzed ammonium sulfate fraction was pumped �2mL/h! onto a column packed with Sepharose 4B-p-aminobenzoatematerial. Unbound material was thoroughly washed off thecolumn using extraction buffer and PO was eluted with 0.05 Msodium phosphate buffer pH 6.5, containing 1.0 M NaCl! ~The affinity fraction was dialyzed against 6L of 0.05 Msodium phosphate buffer, pH 6.5. This technique was used topurify shrimp PO.
tein De e 'nation:
Protein content of the crude extract was determinedusing the biuret method Clark and Switzer, 1977!: 1 mL ofthe crude extract was placed in a test tube and 4. mL ofbiuret reagent added, vortexed for a few seconds, andallowed to stand for 30 min at room temperature. Theabsorbance was then measured at 540 nm using aspectrophotometer. Bovine serum albumin BSA! was used asthe standard protein.
he o o dase 'v't
PO activity was quantified by spectrophotometricanalysis of the chromophore generated at, 475 nm under thefollowing conditions: 0.1 mL of the crude enzymaticpreparation, 2.8 mL of 5 mM DL-8-3,4-dihydroxyphenylalanine DL-DOPA, substrate! in 0.05 M phosphate buffer pH 6.5!,with and without trypsin at 25oC Savagaon and Sreenivasan,1978!. PO actj.vity was defined as moles of DL-DOPAtransformed min under the test conditions' The assay ofshrimp PO activity, the influence of pH and the effect oftemperature on the activity and / or stability of PO, wereinvestigated using the spectrophotometric proceduredescribed previously Simpson et al., 1987!, with DOPA assubstrate.
t' ro e 'es heno o idases:
The kinetic parameters, V x and K ' were estimated at25 C by the least squares method of Johansen and Lumry�961! using DOPA �.5 mM to 4.0 mM! as substrate. The"physiological efficiencies" V ax/K '! of the shrimpenzymes were determined using tVe procedure by Pollock�965! and Mihalyi �978!.
e t ho es's and olecu ar wei ht determ' ation:
RESULTS AND D1SCUSSION
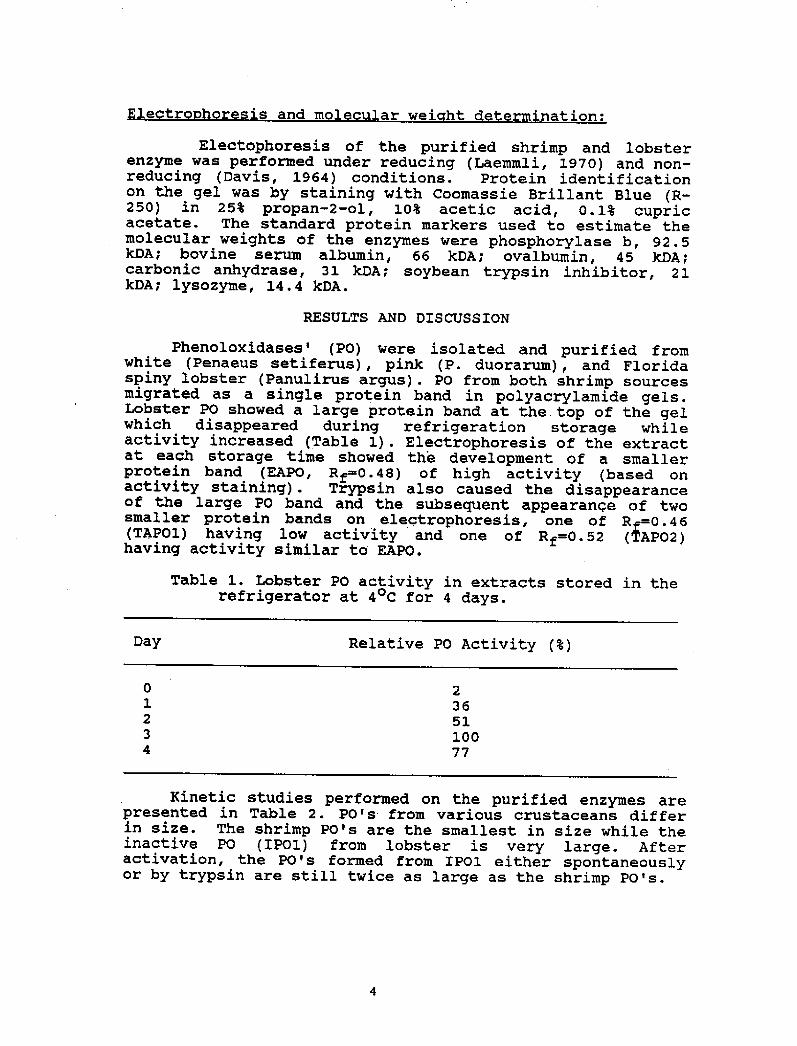
Phenoloxidases' PO! were isolated and purified fromwhite Penaeus setiferus!, pink P. duorarum}, and Floridaspiny lobster Panulirus argus!. PO from both shrimp sourcesmigrated as a single protein band in polyacrylamide gels.Lobster PO showed a large protein band at the. top of the gelwhich disappeared during refrigeration storage whileactivity increased Table 1!. Electrophoresis of the extractat each storage time showed the development of a smallerprotein band EAPO, Rf~0.48! of high activity based onactivity staining!. Trypsin also caused the disappearanceof the large PO band and the subsequent appearanCe of twosmaller protein bands on electrophoresis, one of R+=0.46 TAPO1! having low activity and one of Rf=0.52 'TAPO2!having activity similar to EAPO.
Table 1. Lobster PO activity in extracts stored in therefrigerator at 4 C for 4 days'
Relative PO Activity �!Day
236
5110077
Kinetic studies performed on the purified enzymes arepresented in Table 2. PO's from various crustaceans differin size. The shrimp PO's are the smallest in size while theinactive PO IP01! from lobster is very large. Afteractivation, the PO's formed from IPO1 either spontaneouslyor by trypsin are still twice as large as the shrimp PO's.
Electophoresis of the purified shrimp and lobsterenzyme was performed under reducing Laemmli, 1970! and non-reducing Davis, 1964! conditions. Protein identificationon the gel was by staining with Coomassie Brillant Blue R-250! in 25% propan-2-ol, 104 acetic acid, 0.14 cupricacetate. The standard protein markers used to estimate themolecular weights of the enzymes were phosphorylase b, 92.5kDA; bovine serum albumin, 66 kDA; ovalbumin, 45 kDA;carbonic anhydrase, 31 kDA; soybean trypsin inhibitor, 21kDA; lysozyme, 14.4 kDA.
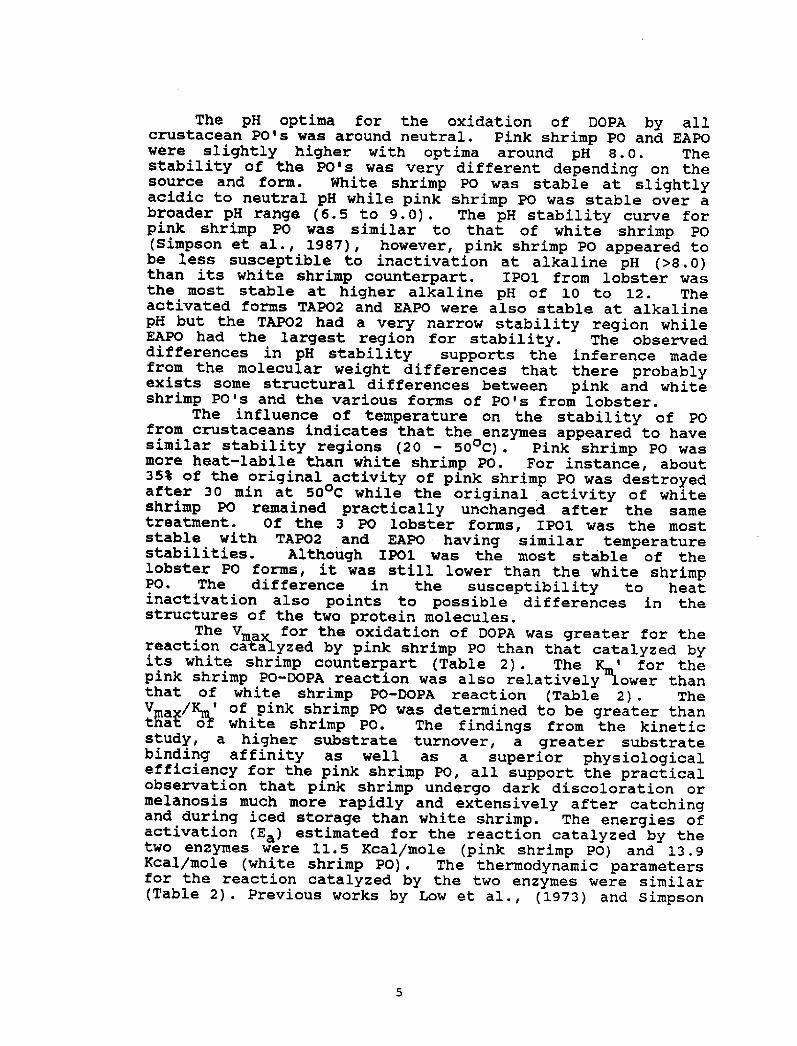
The pH optima for the oxidation of DOPA by allcrustacean PO's vas around neutral. Pink shrimp PO and EAPOwere slightly higher with optima around pH 8.0. Thestability of the PO's was very different depending on thesource and form. White shrimp PO was stable at slightlyacidic to neutral pH while pink shrimp PO was stable over abroader pH range �.5 to 9.0!. The pH stability curve forpink shrimp PO was similar to that of white shrimp PO Simpson et al., 1987!, however, pink shrimp PO appeared tobe less susceptible to inactivation at alkaline pH >8.0!than its white shrimp counterpart. IP01 from lobster wasthe most stable at higher alkaline pH of 10 to 12. Theactivated forms TAP02 and EAPO were also stable at alkalinepH but the TAPO2 had a very narrov stability region whileEAPO had the largest region for stability. The observeddifferences in pH stability supports the inference madefrom the molecular weight differences that there probablyexists some structural differences between pink and whiteshrimp PO's and the various forms of PO's from lobster.
The influence of temperature on the stability of POfrom crustaceans indicates that the enzymes appeared to havesimilar stability regions �0 - 50 C!. Pink shrimp PO vasmore heat-labile than white shrimp PO. For instance, about354 of the original activity of pink shrimp PO was destroyedafter 30 min at 50 C while the original activity of whiteshrimp PO remained practically unchanged after the sametreatment. Of the 3 PO lobster forms, IP01 was the moststable vith TAP02 and EAPO having similar temperaturestabilities. Although IP01 was the most stable of thelobster PO forms, it was still lower than the white shrimpPO. The difference in the susceptibility to heatinactivation also points to possible differences in thestructures of the two protein molecules.
The Vma for the oxidation of DOPA was greater for thereaction catalyzed by pink shrimp PO than that catalyzed byits white shrimp counterpart Table 2!. The K ' for thepink shrimp PO-DOPA reaction was also relatively "lower thanthat of white shrimp PO-DOPA reaction Table 2!. TheV a /K ' of pink shrimp PO vas determined to be greater thantRaK of white shrimp PO. The findings from the kineticstudy, a higher substrate turnover, a greater substratebinding affinity as well as a superior physiologicalefficiency for the pink shrimp PO, all support the practicalobservation that pink shrimp undergo dark discoloration ormelanosis much more rapidly and extensively after catchingand during iced storage than white shrimp. The energies ofactivation Ea! estimated for the reaction catalyzed by thetwo enzymes were 11.5 Kcal/mole pink shrimp PO! and 13.9Kcal/mole white shrimp PO!. The thermodynamic parametersfor the reaction catalyzed by the two enzymes were similar Table 2!. Previous works by Low et al., �973! and Simpson

O O IO
O~ ~
O aO
0 0I R R
O
Icl' F! Olg ~
Q
O0 0
I R RO
O IO O ~ E
CO CLI OQ ~ ~
OA
Q0 0
I R R0
H
Q ChLh
'CL
O OCl Lh
I ~ ~O Lh
O 4 O
0!I I
C4III Q
C4R co
Lh
IO
O O OLh
~ ~Lh Pl
Pla mP1 ~ ~ I +
~ 00 RU0
LLI
06
U0 A4
C LLI
~ 6ALLI
ILI
G4
LII
g g40
2 K
g
Ql LIJC4C40Q
8
U 0
8
O
ALLI OV
f4 Xg tdIII 8 8
0 w 0 0R
Q
0 co 0 0R
0 ~ 0 0R ~ R R + I
LhCO Lh & gl
4COI
O O O OCh W Ch
Pl W LhI
e
QLII g
0 g LLI0
0
O O ULLI
C4IIICQ
C4
Ql0
6 0
0
N'aIII
4L
8 0
V VLLI CL

and Haard �984! have shown that 'free energy' values forreactions catalyzed by homologous enzymes are similar, andit may be assumed from these observations that the freeenergies of activation for reactions catalyzed by homologousenzymes are relatively fixed. However, the relativecontributions by 'entropy' and 'enthalpy' to 'free energy'were different for the two phenoloxidases. Entropy appearedto be more important in lowering the free energy barrier inthe case of pink shrimp PO, while for white shrimp PO,enthalpy was relatively more important.
Thermodynamic parameters were not performed on the 3lobster PO forms IPO1, TAPO2, and EAPO!. However, K ' andE values indicated that all three forms were different intPieir ability to catalyze the PO-DOPA reaction Table 2!.Of interest is the comparison between TAPO2 and EAPO interms of K ' and Ea. For the DOPA catalyzed reaction itappears that TAPO2 is more suitable for this reaction,however, TAPO2 being activated by trypsin is unlikely to benaturally present in the lobster sheila Because PO isphysiologically important in molting and sclerotization,DOPA may not be the most appropriate substrate for thisenzyme. N-acetyldopamine and 3,4-dihydrobenzoic acid havebeen reported as tanning agents and may be the actualsubstrates for EAPO Pryor et al. 1946; Pryor, 1962!;neither substrate was examined in this study.
There was a wide variation in the specific activity ofPO in the shell of the lobsters tested Table 3!. Additionof trypsin to the PO crude extract increased the PO activityfrom 2-fold to over 120-fold in some cases. Values rangedfrom 0.01 to 0.80 and from 0.32 to 37.00 mmoles of DL-DOPAmin mg protein for free active and trypsin-activatedPO's, respectively Table 3!. An increase in the levels oftrypsin-activated PO inert PO or prophenoloxidase! wasobserved during the period from May to September Table 3!,which were the warmest months of the year.
During the course of this study, it was observed thatlittle molting occurred during the cold months while mostmolting took place in the summer. A relationship betweenmolting and water temperature has been observed by Travis�954!, and it, was found that molting is directly correlatedwith water temperature. Thus, a relationship between moltcycle and PO levels could exist. It is known that PO isinvolved in tanning the cuticle in the case of a moltinganimal, the newly forming cuticle! by catalyzing theformation of quinones which form cross-links with cuticularproteins Stevenson, 1985; Andersen, 1979!. Therefore, thelevels of free PO activity endogenously activated PO orEAPO! should be higher during the warm months May-Septemberperiod! when lobsters molt more frequently. However, thiswas not the case as shown in Table 3. Unlike inert PO,there was no increase in free PO activity during the May-

Table 3. Free PO and Trypsin-Activated PO TAPO!Specific Activity in Cuticle Extracts of LobstersCollected During the 1985-86 Season
PROTEIN SP. ACT SP. ACT*CONTENT TAPO FREE PO
TAPO
ACT.FREE PO
ACT.
EU/mL** EU/mL EU/mgmg/mL EU/mgSAMPLE
*Phenoloxidase activity
**EU enzyme units! are expressed in mmoles DL-DOPA/min
10-01-85
10-08-85
10-21-85
10-29-85
01-08-86
01-20-86
01-21-86
10-22-85
.10-23-85
12-12-85
12-16-85
04-19-86A
04-19-86B
04-19-86C
05-15-86A
05-15-86B
05-15-86C
06-16-86A
06-16-86B
06-16-86C
06-16-86D08-20-86A
08-20-863
09-16-86A09-16-86B
0.35
2.370.30
0.54
0.59
0.87
0.17
0.07
0. 14
0.94
0.27
3 ' 320.493.70
7.54
8 ' 88
2.800.06
0.17
0.11
0. 1110.77
7.41
6.722.22
0. 15
0.17
0.05
0.14
0 ' 04
0.050. 03
0.01
0.03
0.050.03
0.03
0. 02
0. 05
0.06
0.19
0.05
0.0020.02
0.020.02
0.09
0.06
0 ' 06
0.04
0.50
0.84
0.64
0.66
0. 31
0.28
0.28
0. 190.24
0.40
0 ' 40
0.40
0.32
0.48
0.40
0.24
0.33
0.19
0.28
0.30
0.210.46
0.41
0.380.36
0.70
2.820.470.82
1.90
F 110.610.37
0.58
2 ' 35
0.68
8.30
1.53
7.71
18 F 85
37.00
8.48
0.320.61
0.37
0.52
23 ' 4118.07
17.68
6.17
0.30
0.20
0.08
0 ' 21
0.130. 18
0.11
0.05
0.13
0.13
0.08
0.08
0.06
0.10
0.15
0.79
0.15
0.010.07
0.07
0.100.200. 15
0. 16
0. $1

September period. This was contradictory because theprophenoloxidase must become activated before it canefficiently act on the substrate.
A closer evaluation of Tab3,e 3 revealed that there wasone lobster which had a high free PO activity during thesampling from May-September. This lobster vas in thepremolt stage, as determined by the presence of the newcuticle beneath the old one. The new cuticle looked likethe old one same color and spots!, but was very thin,uncalcified and very fragile, having no hardness. The partof the cuticle farmed at this stage may have been theepicuticle. It was hypothesized that IPO1 was beingactivated at this premolt stage in order to provide thecross-linking agents quinones! for the cuticlesclerotization tanning!. To confirm these results, severalother lobsters at the premolt stage were selected andanalyzed for trypsin-activated inert PO's orprophenoloxidases! and free PO activity as previouslydescribed. The premolt lobsters were identified by lookingfor the development of the setae on pleopods under thedissecting microscope, by the state of development of theepidermis, and by the appearance of an ecdysial line alongthe branchiostegites. Such a line becomes visible 3-4 daysor 2-3 veeks before ecdysis in the summer months and coldmonths, respectively Travis, 1954!. The lengthening of thepremolt stage in the winter months may be due to a decreasein the rate of physiological activities associated vithmolting.
Phenoloxidase activities for lobsters at differentmolting stages are presented in Table 4. An activation ofphenoloxidase in premo3.t lobsters, especially in the latepremolt stage vas observed. Free and trypsin-activated POactivities vere identical at the late premolt stage,suggesting the occurrence of a fully activatedphenoloxidase. This was confirmed by analysis of the exuviaof newly molted lobsters where addition of trypsin to the POextracts did not af'feet the PO activity levels, indicatingthe existence of a fully active PO. Hovever, lobsters inearly premolt and other stages did not present a fullyactivated prophenoloxidase Table 4!.
CONCLUSIONS
In conclusion, PO's from different shrimp speciesexhibit different. kinetic and thermodynamic properties whichcould in part explain the differences in susceptibility ofthese species to me3,anosis. Activation of PO occurs inFlorida spiny lobster and not in shrimp. The kineticproperties of the various PO forms also indicate uniquedifferences between them. PO activity also appears to berelated to molting.

Table 4 ~ Free PO, Trypsin-Activated PO Levels andProtein Content in Cuticle Extracts from Lobstersat Various Molting Stages
TAPO FREE*PO
FREE PROTEIN
PO CONTENT
TAPO
EU/mL** EU/mL mg/mL EU/mg EU/mg
*Specif ic activity, EU/mg protein**
EU enzyme units! are expressed as mmoles DL-DOPA/min
10
Newly molted 1Newly molted 2Newly molted 3Newly molted 4Newly molted 5Newly molted 6Postmolt 1
Postmolt 2
Postmolt 3
Postmolt 4
Postmolt 5
Postmolt 6
Intermolt 1
Intermolt 2
Intermolt 3
Early premolt 1Early premolt 2Early premolt 3Early premolt 4Early premolt 5Early premolt 6Late premolt 1Late premolt 2Late premolt 3
0. 11
0.06
0.07
0-05
0.08
0.23
0.47
0 ' 38
0.21
0. 07
0. 10
0.08
1.98
5-14
3.27
3 ' 49
7.60
3.30
7 ' 67
5 ' 52
5 ' 31
1.82
0.96
0.93
0. 02
0.04
0.01
0.04
0.02
0 F 01
0.02
0.05
0.02
0.03
0.01
0.03
0 F 01
0.04
0.10
0. 12
0. 09
0.04
0.09
0.10
0.11
2.05
1.24
0.88
0. 21
0. 19
0.20
0.23
0.21
0.55
0.33
0.35
0.38
0.27
0.25
0 ' 20
0.43
0.39
0 ' 26
0.13
0.24
0. 11
0.26
0.33
0 ' 27
0.30
0 ' 14
0.18
0.52
0.32
0.35
0.22
0.38
0.42
1.42
1.09
0.55
0.26
0.40
0 ' 40
4.60
13.18
12.57
26.85
31.67
30 F 00
29.50
16.72
19.67
6.07
6.86
5.17
0. 10
0.21
0. 05
0. 17
0. 10
0.02
0.06
0.14
0.05
0.11
0.04
0.15
0.02
0.10
0.38
0 ' 92
0.38
0.36
0.35
0.30
0.41
6.83
8.86
4-89

REFERENCES
Andersen, S.O. 1979. Biochemistry of the insect cuticle.Ann. Rev. Entomol. 24:29.
Clark, J.M. and Switzer, R.L. 1977. In Ex erimental
Cobb, B.F., III. 1977. Biochemistry and physiology ofshrimp: effect on use as food. In o d'n s o the
0 e t e d in o ess n a d ma ket'n ot 's . pp. 405-411. Tropical ProductsInstitute, London.
Davis, B.J. 1964. Disc electrophoresis-II. Method andapplication to human serum proteins. Ann. NY. Acad.Sci. 121:404.
Ferrer, O.J., Marshall, M.R. and Koburger, J.A. 1986.Biochemical basis for accelerated melanosis in the
t. nu ~ ubt o . F's . echno . Co f. of thegggj c~a. 11: 7.
Johansen, G. and Lumry, R. 1961. C. R. Trav. Lab. Carlsberg.32:182-214 '
Koburger, J.A., Miller, M., and Otwell, W.S. 1985. Thawed 'i
0 tro . 's . ec o . o f.oner~<~. 10: 201.
Laemmli, U.K. 1970. Cleavage of structural proteins duringassembly of the head of bacteriophage T4. Nature.227:680-685.
Low, P.S., Bada, J.L. and Somero, G.N. 1973. Temperatureadaptation of enzymes: roles of the free energy, theenthalpy, and the entropy of activation. Proc. Natl.Acad. Sci. 70:430-432.
Marshall, M.R., Otwell, W.S ,, and Walker, B. 1984.Preliminary study on --the isolation and activation ofpolyphenoloxidase from deep sea crab {get~on sp.!. In
~ kJ'sh. Co . e 'c . 9:118.
Mihalyi, Z. 1978. In "Application of proteolytic enzymes toprotein structure studies" ~ 2nd. ed. pp 57-59. CRC.Press, Boca Raton, FL.
11

Otwell, W.S. and Marshall, M.R. 1986. Screening alternativesto sulfiting agents to control shrimp melanosis. In
1 th. An ua Tr . Sub o . 'sh.as. 11:35.
Pollock, M.R. 1965. Purification and properties ofpenicillases from two strains of Bacillus lichenformis:a chemical, physicochemical and physiologicalcomparison. Biochem. J. 94:666-675.
Pryor, M.G. 1962. Sclerotization. In "ComparativeBiochemistry." Volume IV!: Constituents of life PartB!. M. Florkin and H. S. Mason, Editors. AcademicPress, New York.
Pryor, M.G., Russell, P.B., and Todd, A.R. 1946.Protocatehuic acid, the substance responsible forhardening of the cockroach ootheca. Biochem. J. 40:627.
Savagaon, K.A., and Sreenivasan, A. 1978. Activationmechanism of pre-phenoloxidase in lobster and shrimp.Fishery Technol. 15:49.
Simpson, B.K. and Haard, N.F. 1984. Purification andcharacterization of trypsin from Greenland cod Gadus~! . 1. Kinetic and thermodynamic characteristics.Can. J. Biochem. Cell Biol. 62:894-900.
Simpson, B.K., Marshall, M.R. and Otwell, W.S. 1987.tB'
Purification and some properties. J. Agric. Fd. Chem.35'918-921.
Stevenson, J.R. 1985. Dynamics of the integument: In Theo o o C stacea Volume 9 : In ument i ments
and o o l c ss s. D.E. Bliss and L.H. Mantel,Editors. Academic Press, New York.
Taylor, S.L. and Bush, R.K. 1983. Prepared forInternational Food Additives Council. Washington D.C.
Travis, D.F. 1954. The molting cycle of the spiny lobsterZ4laboratory-maintained individuals. Biol ~ Bull. 107: 433.
Wagner, T. and Finne, G. 1986. Evaluation of alternativesto sulfiting agents as melanosis inhibitors in rawshrimp. In P eedin s o t e 1 th. An ual Tro
tro . F sh. Tech ol. C nf. of the Amer'cas. 11:23.
12

A COMPREHENSIVE OVERVIEV OF THE USE AND TESTING OFSODIUM BISULFITE ON SHRIMP
Martha Hudak-Roos3289 Frederic StreetPascagoula, MS 39567
Dr, V, Steven QtwellUniversity of Florida
467 Pood Science BuildingGainesville, FL 3261!,
Sulfites in various forms, especially sodium bisulfite, have beenadded to foods for centuries. One of the earliest recorded uses was thedisinfection of wine vessels with sulfur dioxide in early Roman times.Since then, the use of sulfites have been extended to a variety of foodproducts, including seafoods.
Sodium bisulfite is used in the shrimping industry to controlmeIanosis on shrimp, Melanosis, commonly known as "blackspot," is adiscoloration of the surface of the shrimp. This discoloration is causedby naturaLly occurring enzymes reacting in the presence of oxygen. Theenzyme system is thought to involve a poLyphenoloxidase. The reactionstarts from the time the shrimp are removed from the water and continuesthrough refrigeration or ice storage, Although harmless, blackspot isextremely ob.jectionable to consumers and will result in a lower price forthe product.
The use of sodium bisulfite to control discoloration was learnedfrom the potato industry in the 1958's when shrimp vessel harvest beganto expand. A recommendation to use a 1.25% sodium bisulfite dip for oneminute was introduced in 1956 Camber et al!. Working aboard shrimpvessels in Key Vest, Florida, Camber used a variety of concentrations,1,25 to 15/,and time intervals, 1 to 15 minutes, to develop thisrecommendation. This recommendation was the basis for Food and DrugAdministration's FDA! prior sanctioned use for sulfiting agents onshrimp Federal Register 1959!.
A 1.254 dip is equivalent to 125 grams of sodium bisulfite in 18liters of water or 1 pound. of powder per 18 gallons, A basket of headedand rinsed shrimp is placed into this dip for one minute. The shrimpshould then be drained and rinsed and, then stored in ice, By the priorsanction, all shrimp thus treated must be labeled such.
REGULATIONS
In addition to the FDA's prior sanction for the use of sodiumbisulfite on shrimp, five other sulfiting agents have been listed by the

FDA as Generally Recognized As Safe GRAS!. This GRAS status indicatesthat these sulfiting agents may also be used to control blackspot inshrimp. In addition, sulfiting agents may also be used as GRAS inlobsters, scallops, dried cod, and clams, Sulfites may not be used inany food source recognized as a source of Vitamin B1, such as crabs Pippin, 1986!.
Thus, the FDA has established that six sulfiting agents may be usedon seafood that is not a recognized source of Vitamin 81. In addition tothese regulations, the FDA has established requirements for the use ofsulfiting agents called Good Manufacturing Practice Guidelines GMPG!.So far, only one GMPG exists, and this GNPG is for sulfite use on shrimp Federal Register, 1985!. Very simply, the GAG states that sulfiteresiduals as sulfur dioxide on the raw edible meat portion must be lessthan 188 parts per million ppm!, If the residual value is greater than188 ppm, the product is actionable and subject to seizure. If theresidual value is less than 188 ppm, the product must be labeled ascontaining sulfites, i.e., "Sodium bisulfite added as a preservative" or"Sulfite pre-ent as a preservative." Shrimp products containing lessthan 188 ppm sulfur dioxide on raw meat and, not labeled as cpntainingsulfites are considered misbranded,
This information reflects the current state of U.S, regulatoryaffairs. However, due to the widespread, public health concern, thesulfite situation is under very close scrutiny in the U.S. and many othercountries. The U.S. FDA is reviewing GRAS status of all food additivesand may rescind the GRAS status for some additives. The use of sulfiteshave already been banned for raw vegetables and fruits and there existsthe possibility that this ban may be extended to the seafood industry.In addition, the FDA has sampled other seafoods, possibly to establishGMPGs for other sulfited fishery products.
Foreign requirements, as developed by the Codex AlimentariusCommission of the Pood and Agriculture Organization of the United Rationsand the Vorld Health Organization, differ slightly from the U.S.requirements, Nations that use the Codex Alimentarius guidelines willrequire less than 188 ppm sulfur dioxide on raw edible meat and less than38 ppm on cooked meat Codex, 1984!. Io current guidelines for residualsulfur dioxide on cooked meat exists in the U.S.
HEALTH RELATED ASPECTS
As previously mentioned, sulfites are found in a variety of foodproducts. From potatoes, dried fruits and vegetables to wine, sulfiteshave a variety of uses, Sulfites are used as antimicrobial agents, toprevent discoloration, to inhibit enzymes, as antioxidant and reducingagents, and as bleaching agents. The differing sulfited products alsoexhibit varying degrees of residual sulfur dioxides, with shrimp at 188ppm sulfur dioxide at the lower end of the range and dried fruits at 3888ppm sulfur dioxide at the higher end.
14

Keeping in mind the wide range of products, uses, and concentrationsof sulfiting agents, it is easy to understand how sulfiting agents havebecome suspect in causing allergic type reactions when present inconsumed foods. This public health problem has grown into a majorconcern since the 1984 report of several deaths associated withconsumption of fresh salads containing sulfites. It is this highlyemotional public health concern that has caused the U.S. government toreevaluate the GRAS status of sulfiting agents. However it should benoted that none of the reported fatalities have been definitivelyassociated with shrimp.
The FI!A has kept record of sulfite consumer complaints by producttypes Table 1!, Table 1 indicates that "seafood" has been responsiblefor approximately lM of adverse reactions to sulfite.
Table 1. Sulfite Adverse Reactions by Associated Product Type
Count PercentageProduct Type
27,513.5
277136
Of the 97 seafood sulfite complaints, 58 were reported as Type Oneor severe, for a 60'X report figure. Others were reported as Type Two moderate!.
Research into the allergic reactions brought on by sulfited foodconsumption has been on-going at the University of Wisconsin's FoodResearch Institute by Dr. Steve Taylor Taylor and Bush, 1986!. Hisresearch has brought to light some important conclusicns:
1! There is no evidence that the current usage level of suifitesrepresents a health hazard to the majority of the U.S.population,
2! Reproductive processes are not adversely effected by sulfites,nor do suliites elicit carcinogenic response in chronic feedingstudies,
I Salad Barl OtherI lion-salad bar fruits and vegetables,
fresh excluding potatoes!j WineI Seafoodt Potatoes, other than freshI Fresh Potatoesl Fruit, driedI Baked goods
DrugsI BeerI Fruit and vegetable juiceIOther alcoholic beverages
135188
97
5551413528141413
13.419.7
9.65.5F 14,13,52 ' 81,41,41 ' 3

3! Sulfite sensitive individuals represent a small percentage ofthe tota1 population. Of the greater than 9 million asthmaticsin the U.S. population, only about 2ey of these are severeasthmatics and about 8'4 of the severe asthmatics are sulfite-sensitive asthmatics, and
4! Some sulfited foods do not elicit asthmatic attacks in confinuedsulfite-sensitive individuals. One of these foods is shrimp,
CURRENT SULFITE RESEARCH
Current research indicates that there is no superior alternative tothe 1,25'4 one-minute sodium bisulfite dip for control of blackspot Otwell and marshall, 1986!. If this dip is applied correctly, then theproduct should not only have little or no blackspot, but should alsocontain less than 188 ppm sulfur dioxide Finne et al, 1986>. The onlyexception to this is the addition of the sodium bisulfite to the brineaboard freezer boats. This type of dip may not yield product with 1essthan 1$$ ppm residues. If the product was incorrectly treated andcontains greater than 188 ppm sulfite residue, then reclamation of theproduct might be possible by thawing, peeling and washing in water for 39minutes or by high intensity heat cooking Marshall et al, 1986!.
TESTING PQR SVLFITES
Shrimp suspected of being treated with sulfites will often be testedby processors and regulatory agencies. Testing of shrimp can be done ona quantitative, on a semi-quantitative, or on a qualitative basis.
There are three different quantitative tests used most often fardetermining sulfite residue on shrimp. Only one of these, the Nonier-Villiams method, is approved for use in determining U,S. regulatorycompliance. The Nonier-Villiams analysis is an Association of OfficialAnalytical Chemists' AOAC> approved final action procedure. This methodis long, tedious, and expensive. !t requires a complicated distillationapparatus with a sulfur dioxide gas collector, The product is placedinto the reaction flask with water and acid and refluxed for 1 hour and45 minutes. After refluxing, the solution in the sulfur dioxide gascollector is titrated from pink to yellow with a base solution and avalue is calculated. The PDA has slightly modified and optimized theofficial method for ease in use. This modification was collaborativelystudied by the HFPA in 1987. The results of the collaborative studyrecommend that the method be adopted official first action for thequanitation of sulfites. The report is currently under review prior topublication in the "Journal of the AOAC."
Another quantitative method is the ion chromatography method Cooperet al, 1986; Kim and Yim, 1986!, This method is much more rapid butrequires an extremely expensive, sensitive piece of equipment. Thismethod has not been approved as an official regulatory compliance method.
The thi.rd quantitative test is a rapid distillation method DeVrieset al, 1986!. Again, this test requires a sensitive, moderately
16

expensive piece of equipment, but takes approximately only 18 minutes torua. This method also has aot been approved as an official regulatorycompliance method, but attempts are underway to examine the feasibilityof a collaborative study for such approval.
There are a variety of semi-quantitative and qualitative testsavailable. The ma]ority of these tests were not designed for shrimp andconsequently require further examination before routine use by theshrimpiag industry. These methods include:
1! The p-rosaniline test, which is an AOAC Section 28,191!recognized method far detection of eulfites on ground beef.This method requires a spectrophotometer. Attempts to modifythis method for use with shrimp have not been successful.
2! The micro-diffusion test, which is very similar to the p-rosaniline test. This test uses a reaction vessel called aConway diffusion dish. Experiences with this method indicatethat it gives low values. In addition, this method requiresuse of a mercury compound which is not recommended for foodprocessing facilities.
3! The eazyme test kit i,e., Nanneheim Boehriager!, is relativelyinexpensive. However, this kit requires the use of anultraviolet spectrophotometer, which can be expensive tooperate and maintaia. I'urther research is currently beingconducted in the U.S, to adapt this kit for use with shrimp.
4! Iodate - Iodide titret kits i,e., Chemetrics, Inc,! whichemploy a standard chemical reaction within a disposable glasscell. Again modifying this kit to use with shrimp haspresented problems and does not appear promising,
5! Drop count and titration kits i,e., Lamotte! which aremanufactured specifically for the waste water treatmentindustry. These kits require a water solution for their use, soapplication to the shrimping industry is limited,
6! lon electrodes which specifically measure the sulfur dioxideion. Initial studies on these electrodes were extremelydiscouraging Vood et al, 1976!. However, studies continue, anda possibI.e application may be developed in the near future.
7! A permanganate distillation method that requires an aciddistillation of the product Hudak-Roos et al, 1986!. Thesulfur dioxide gas formed is carried into a permanganatesolution. If the product contains less than 189 ppm, thepermanganate retains its color. If the product contains greaterthan 188 ppm, then the permanganate becomes a clear colorless!solution. Nore expensive and time consuming than the belowmentioned malachite green test, this test permits greatersensitivity. An attempt was made to seek AOAC approval of this

method through a collaborative study. However an accurateevaluation of the study was compromised because of thedisparity in Nonier-Villiams values among participants. Thistest was not put forth for AOAC approval and furthercollaboration was halted in order to more closely examine othermethods.
Although these tests are available, most facilities qualitativelytesting for sulfites use one of two methods: test papers or a malachitegreen test,
Sy far, the most common method of testing is to use test papers orstrips. These test papers are distributed by a variety of manufacturersand are inexpensive to use. Hach vial of test strips contains acomparison chart for determining approximate values. Some of these chartsrange from 8-400 ppm, others range from 8-1000 ppm. The strip is applieduntil moist to either the peeled meat or the peeled minced meat. Thiswet test paper is then compared to the chart on the vial and a valuedetermined.
Table 2. Sulfite Test Strips, Brand A
Level <ppm! 5 Nore X Less % Correct
848 � 58
80 � 110188 � 218
29
261
94 854 1'749 2544 54
At the critical range of 80-110 ppm a correct value was obtainedless than 3K of the time, and rarely was a non-sulfited product detectedas such. In terms of buying decisions, 48% of the time product in the180-210 ppm range would be accepted, while 29% of the time product in the0 and 40-50 ppm level would be rejected.
18
Experience with these test strips at industry workshops conducted inSeptember, 1986 have shown that their accuracy is extremely limited Tables 2-4!, The workshop participants, the majority of ~hich wereindustry guality Control personnel, applied each of two different brandsof test strips to two different shrimp forms: raw peeled and raw peeledminced. The tests were conducted during three workshops by a total of 21groups of two or three each industry participants,
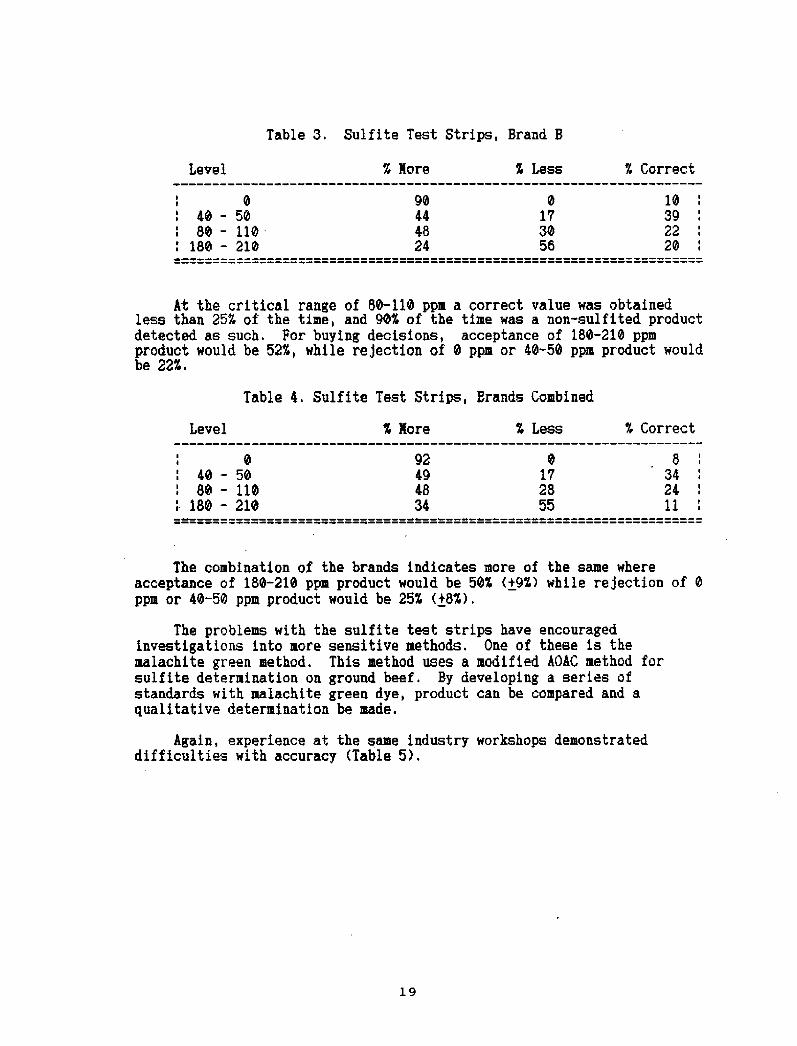
Table 3. Sulfite Test Strips, Brand E
Level Z Nore Z Correct
At the critical range of 88-118 ppm a correct value was obtainedless than 25Z of the time, and 98Z of the time was a non-sulfited productdetected as such. For buying decisions, acceptance of 188-218 ppmproduct would be 52Z, while rejection of 8 ppm or 48-58 ppm product wouldbe 22Z.
Table 4. Sulfite Test Strips, Brands Combined
Z Nore Z Less Z CorrectLevel
The combination of the brands indicates more of the same whereacceptance of 188-218 ppm product would be 58Z <+QZ! while rejection of 8ppm or 48-58 ppm product would be 25Z tBZ!,
The problems with the sulfite test strips have encouragedinvestigati.ons into more sensitive methods. One of these is themalachite green method. This method uses a modified AOAC method forsulfite determination on ground, beef. By developing a series ofstandards with malachite green dye, product can be compared. and aqualitative determination be made.
Again, experience at the same industry workshops demonstrateddifficulties with accuracy Table 5!,
19
848 � 58
88 � 118188 � 218
848 � 5888 � 118
188 � 218
98
4824
924948
34
817
3856
8
172855
183922 I28
8342411

Table 5, Kalachite Green Test
% <188 ppmLevel X 88 ppm
15II
25
55II
68
85
7548 � 58
88 � 118 45
I 188 � 218
Using this example, product in the 188-218 ppm range would be accepted,4M of the time. Product at 8 and 48-58 ppm would be rejected 2M of thetime. While better than either brand of suLfite test strips, this method,can also lead, to a great number of faulty buying decisions.
The use of food additives, while sometimes necessary, can createmany problems and complications for an industry. Such is the case withsodium bisulfite on shrimp. Properly applied, sodium bisulfite can helpproduce a high profit, esthetically pleasing product. Misapplied, it cancreate regulatory compliance problems and possible serious public healthconcerns. Through industry efforts in education, research, anddevelopment of new methodology, the use of sulfites on shrimp maintainsregulatory approval while providing reasonable consumer protection.

BIBLIOGRAPHY
1. Camber, C, I., Vance, K. H. and Alexander, J. E. 1957. The use ofsodium bisulfite for the control of blackspot in shrimp. In:"State of Florida Board of Conservation," Technical series f28,E. Mitts, Director, The Marine Laboratory, Virginia Key, FL.
2, Federal Register, 1959 Nov, 28!, Sulfiting Agents: Final Rule�GRAS Status �4 FR 9368! ~
3, Pippin, Howard. July 1986, Letter to Narjorie Lewis, LewisFinancial Services, Inc, FDA Center for Food Safety and AppliedNutrition, Division of Regulatory Guidance.
4. Federal Register, 1985 Jan, 23!, Notice to Shippers, Distributors,Packers, and Importers of Shrimp Containing Sul.fites. 58 �5!,p, 2947-3386.
5, Food and Drugs Code of Federal Regulations 1985. Title 21, Fart182. Office of the Federal Register, National Archives andRecords Service, General Services Administration, Washington,D.C.
6. Recommended International Code of Practices for Shrimp or Prawns,1984. Codex Alemintarius Commission. Food and AgricultureOrganization of the United Nations/World Health OrganizationFood Standards Programme. Vol. B, 2nd Edition,
7, Taylor, Steve and Robert Bush. June 1986, Sulfite as FoodIngredients. !n: "A Scientific Status Summary by the IFTExpert Panel on Food Safety and Nutrition."
8. Otwell, W. Steven and Narty Marshall. April 1986. ScreeningAlternatives to Sulfiting Agents to Control Shrimp Nelanosis,In: "Studies on the Use of Sulfites to Control ShrimpNelanosis Blackspot!." Florida Sea Grant College TechnicalPaper 46 '
9, Finne, Gunnar, Tom Wagner, Bernard QeWitt, and Roy Nartin. 1986.Effect of Treatment, Ice Storage and Freezing on ResidualSulfite in Shrimp. Journal of Food Science; 51�!, pgs, 231-232.
18. Narshall, Narty, W, Steven Otwell and Roy Nartin. April 1986.Influence of Washing and Cooking on Sulfite Residuals onTreated Shrimp. In: "Studies on the Use of Sulfites toControl Shrimp Nelanosis Blackspot!." Florida Sea GrantCollege Technical Paper 46.
21

11. A.O.A.G. l985. "Official Methods of Analysis," 14th ed. Associationof Official Analytical Chemists, Vashington, D,C.
12. Cooper, P,, N. Marshall, J, Gregory aad V. Otwell, 1986, IonChromatography for Determining Residual Sulfite on Shrimp,Journal of Pood Science, 51�!, p. 924-928.
13. Kim, H. J. and Y. K. Kim. 1986, Analysis of Free and TotalSulfites in Food by lon Chromatography with ElectrochemicalDetection. J. Food Sci. 51;1368-1361.
14. DeVries, J., H. Ge, J. Ebert, J, Nagausoa, and N, Ogawa, 1986.Analysis for Total Sulfites in Foods by Using RapidDistillation Followed by Redox-Titration. Journal of theAssociation of Official Analytical Chemists. 69�!.
15. Vood, B, J,, S, Badgen, aad S. Garrett, 1976. Sodium bisulfite andIts Residual Use in Controlling Black Spot on Shrimp. FirstAnnual Tropical and Subtropical Pisheries Technology Conferenceof the Americas. 1:383-394.
16. Hudah-Roos, N,, B, J, Vood, and J. Carey, Screening of SodiumBisulfite on Shrimp: A Modified Noaier-Villiams Approach,Eleventh Anaual Tropical and Subtropical Fisheries TechnicalConference of the Americas, 11:1-6.
17. Food Chemical News, 1985. 1' ppm Action Level for Sodium Bisulfiteon Shrimp Sought by iPI, Jan. 7, p, 15.
18, Pood Chemical Mews, 1985, FDA to Raise Action Level ia Shrimp from4e to 188 ppm, Jan. 21, p, 2.
19, Pinne, Gunnar and R. Niget. 1985, The Use of Sulphitiag Agents inShrimp -U.S. Regulations for Domestically Produced andimported Products. lnfofish Marketing Digest, Xo. 4.
28. Iichelsoa, Raazell aad Bruce Gox. Stop Shrimp Blackspot. April 1977,Marine Advisory Bulletin, Texas A 5 N University, TANU-SG-77-584,
22

Misganne W. Finerty and Michael W. MoodyLouisiana State Univeristy, Department of Food Science
and Louisiana Cooperative Ext~sion ServiceBaton Rouge, IA 70803
Crawfish production and prying, limited to at, most Navemberthrough June, needs to supply meat to a year round market. Inorder to meet the danae for crawfish meat when fresh crawfish isunavailable, the hepatapancreas is was%% fram the tail meat andthen the tail meat is frozen. Properly packaged and frozen tailmeat usually retain good quality. However, unpredi~e bluishgray discolcratian may ~mar when the tail meat is thawed andzeheated. ~ disceloration is unappetizing althaugh harmless.Citric acid dips prior to packaging and freezing have been
'CI YGRAS generally reg~ as safe!. Hce~er, citric acid cancausing taughening and bleaching of tail meat without alwayspreventing the discoloraticm. A previaus study Maz Ilail, 1986!shawed that tzeatmerrt of tail meat. with 14 citric acid and, 0.1%EOZK or 0.2% ED' alane was more effective in pvwenting bluing.
Discolazation in canned cooked shrimp, canned cooked crWneat andatoned cooked clams has been effectively controlled with EDIA dips,which has been approved by the U.S. Food and Drug Administration.Modifications of the Daxbey procedure has been used as theanalytical method for each of these products. Since calciumdisodium EDZK is a food additive ~ated for use urder 21 CFR172.120, it is necessazy to submit a food additives petition asdescribed in 21 CPR 171.1. Therefoxe, the abjectives of this studywere to modify existimg pzacechxees for the accurate determinationof residual concentratian of calcium disodium EVZA, in crawfish tailmeat, which would ~art a food additives petitian providing forthe use of EOZL in frozen ~ish tail meat.
EOZL is a sequestering agent used to prevent discoloration, off-flavor fozmatian and texture deterioration struvite formation!caused or promoted by the presence of divalent catians. The basisof this method is to add a divalent metal ion, nat present orpresent in low concar~ations in the tail meat being analyzed, thatcan be determine colorimetrically. The metal chosen is nickel.Nickel has a good affinity for EDTA and has several properties that
developed methods for detaneining nickel concentrations. TheDazbey �952! procedure based on these propert,ies was modified forquantifying EDI'A in canned cooked crab+mt and canned cookedshrimp. Since then znaoeraus researchers have improved theprocedure. The procedure developed herein is modifications of theDarbey procedure based on sugpmtions reported in Marczenko �976! .
23

made a nickel derivative usia@ dimethylglyoxime H2Dm! pwhich is a rather specific compound that can be separated framinterfering substances. If the ~ion is carried out twice,copper and cobalt can be eliminated. Qximas, such as dim~ylglycecim, are more selective than the more sensitive dio~nes: l-�-pyridylazo! -2-naphthol PAN! and pyridine-2-aldehyde-2~inolylhJJ9razane PAHQ! . The reaction is:
~ H-.0 0
HgC~ ~Ni
HgC~
0 0
H!CA%OH
H3C~GH+ Ni~
Ni HDm! 2H2Dm
%his zeactian releases two protons, which cambine with the anianicpart of the nickel salt to produce an acid. 'Ihe solutian is thenacidic and the camplex is insoluble in this solutian. The Ni HDm! 2caaplex is a pir3c flcemQent precipitate in neutral or ammmiacalmediums, and is soluble in chloroform and other nonpolar organicsolvents. After the cceplex is decamposed in the presence of 0.5NHCl, the chloroform layer discarded, and the nickel reacted withHen, an axidaM, and ammonia, I'Ni Dm�], a red-brawn, watersoluble complex forms.
Additional steps are needed to eliminate interfezences fram otherianic species: gn9zaxylamim is added to eliminate the manganeseand copper fram forming HDm! 2 complexes; the primary extractionwith dimethylglyoxime followed by chloroform extinction eliminatesinterference fram capper, ~t, iran, chramium, aluminum andmanganese; endogenous EVZK eliminates intezf~~~ fram iron lI!,~t and ccyper ians; and finally potassium acid tartrateeliminates interference fram phosphates.
24
Samples of 25 grams tail meat are blended at high speed with 75 mLsaturated NaCl for 60 sec. Bath water and tail meat controls arespiked with CaNa2EDIA � to 25 mg per sample! to be runsimultaneausly. 'Ihe hamogenate is centrifuged at 2500 zpm l020 xg! for 20 min. The supernatant is decanted into another ~ifugebottle. The residual tissue is zeextracted with 50 mL saturatedNaCl, centrifuged, decanted, ra~~acted with 50 mL distilledwater, centrifuged, and decanted. %he supernatants are combinedinto anott~ 250 mL centrifuge battle.

'Ihe NiEDIA complex is formed by adding 7.5 mL NiSO4 �3.3 g/LNiSO4.6H20! to the pooled supernatant solutions, and sha~g or
'mg well. 'Ihe complex requires 10 min to form, but is stable.In order to zeneve mocess nickel, add 2 to 5 mL conamtratedammonia to the controls and 5 to 8 mL to the other samples untilthe pH is at1east 10, and precipitate the nickel by a~'zxy 8 mL1.54 VCR and, mbdzg well. Spin solution in GSA rotor at 5000 zpm�040 x g! for 20 min. The sqpezxmtant is fil~ thraucg WhatmanNo. 40 paper into a 500 mL Erhlenmeyer flask. Discard precipitate.Interfering fans are removed by reacting the filtrate with 5 mL 20%patmsium sodium acid tartrate, and 4 mL 10% NH2QH.HCl hydraxylamine hydra~oride! . The ions are formed by the additionof at least 3 mI concentrated HCl to free ions! untilappzmcimately pH 1. Ihis solution is relatively stable.'ice ians are derivatized with 5 mL 1.54 IXCR. Zn order tosolubilize the derivative, at least 5 mL concentrated NH3 areneeded to reach at least pH 9. This solution is extracted 3x withCHC1 3 50 mL! in 500mL ~au atozy f unnel . If an emulsian f orms,filter thzaugh glass wool. Discazd aqueous fractian. Washchlorofozm extract with 25 mL NH3/water �:50! and discard aqueauswash.
Shalm chlorofarm extract with 20 mL 0.5N HCl and 15 mL 0.5N HClcollect aqueous layers in 50 mL or 200 mL volumetric flask. Alarger volume of hydzachloric acid may be used if the dilution isto 200 mL, but all samples must be treated the same. 'Zhe size offlask depends an the amount of EVZL- expected. All samples andcctntrols were diluted to 200 mL except where noted in this study.In ozder to detect Ni baund by EDIA, 1 mL 1.54 ERGO, 2 mL 4%patassium p~maQfate must be p~mna9, fresh!, and 5 mLcancentrated ammonia are adcM in this whence, mixup wellbrien additians. Dilute to volume. Within 10-30 min theabsorhence was read at 445 nm against water.
l. Detaaninatian of Linearity of Standard% Solutians
%he abave procedure was used with aqueous solutians containing 100mL water and 0, 0.25, 0.5, 0.75, 1.0, 1.25, 1.50 mg nickel acarrectian factor must be used to determine the mnaunt of nickel inthe nicke1 sulfate solution!; and 0, 5.0, 10.0, 20.0 mgCaNa2EDIA.2H20. 'Ibis was the calculated ~ of expectedresidues. Triplicate samples were analyzed. The average valueswere platted in Figure 1. These lines dettenstrate the linearityand the relative concentrations of Nicke1 and CaNa2EDI'A useful forthis assay. Tables 1 and 2 shaw the mean values and the stardan9deviations for the nickel and ED' sMx3ards. Table 3 shows the+ectivity ratio of EDEMA to nickel. Approximately 2 moles ofCaNa2EDI'A react with 1 mole of nickel.
25

TAKZ l. Mean Absorbance of Nickel Standards
0.0034
0.04530.0099
0 ' 0680
0.0668
-0.0075
0.1105
0.2499
0.3464
0.3732
0
0 ~ 25
0.50
0.75
1.0
TMKK 2. Naan Ahsozbance of CaNa2EDZL.H20 In Kpmous Soluticn
0 5 1020
0.4102
0.51100.7541
0.7016
0.1006
0.0363
0.06230.0398
TABIE 3. Reactivity Ratio of CaNa2EDLA to Nickel
85 HX Qgy@ggh. 2H20 ~a2EI~~~H2~OCKZmo e le
0.00
0. 150.220.34
0.45
0 0.250.500.75
1.00
3.66
8.0510.1013.46
16.82
17.56
12. 8813.07
13.16
2.53
1.85
1.88
1.89
2. ReM."avery Study
26
'Ehe same mount of CaNa2EVZL.2H20 �, 5, 10, 15, 20 mg! was addedto both tail meat and aqueous solutians. The tail meat washcxnxIenized as descxihed in the pmcedure. The ague~ soj.utionwas reacted with nickel sulfate and continued through the remainderof the procedure. 'I%a raw data is presented in Table 4. 'Theconcentrations used to calculate the recovery were aibt oned framthe regression line for the standard curve in Figure 1, which is
the tail meat samples were used to interp~late the actueouscxmcentration. The 4 reccvmy is then calculated as the differencein the ED' in the aqmeus controls divided by the concentratian ofEDZA added to the tail meat and multiplied by 100.

d P O0 Z CVl-0QJ
R CVC!O
33NV880SGV
27

P~&~S 0 HK VJ.O3 ~N H ~~
IQ O O tQO Pl
lQhl CV N
3DNV88QSGV
28

TABLE 4. Absozbance of CaNa2EDZA.2H20 in Tail Neatand Ac@caus Solutions
Tail Neatts S.D. 1
Aceous SolutionUnits S.D. 1
CaNa2EDZK.2H20
0.4102 �.1006!0.5110 �.0363!0.7571 �.0623!0.7016 �.0398!
0.0680 � ~ 0178!0.1805 �.0046!0.4541 �.0330!0. 5264 �. 0457!
0
510
K�
S.D. is the starward deviation of the mean of at. least 3 values.
XAHLE 5. Recovery of CaNa2EDZA fram Crawfish Tail Neat
hR&%%% X~NL'K'Units CaNa2EDZA. 2H20
AQUEOUSCaNa2EDZA. 2H20
0.41
0.54
0.73
0.0
5.0
10.0
15.4
19.5
24.18287
3. Residue Study
~ 25 gram +/- 0.2! samples of crawfish tail meat were dippedinto 1000 mL solutions containinp 0, 0.1, 0.2, or 0.4%CaNa2EDZL.2H20. three samples were not dipped as contzols. Thesesamples were analyzed using the above proce5uva. The absortmncezeedizxIs were used to detemaine the concentration ~ on theregressed line in Figure 2. 'Ihe anhydrous concentrations weredetermined by multiplying the dihydrate concentration by 0.91226�74.3/410.3! . These values are shawm in Table 6.
TABLE 6. Anhydrous CaNa2EDZK Res~ in Crawfish Tail Meat
Qga2Z~A.2H20 ~ EZ-25 le ' lion
29
0.0
0.1
0.2>0.2
urmrashed
-4.288
2.098
8 ' 7588.758
7.161
-171
84350350
286
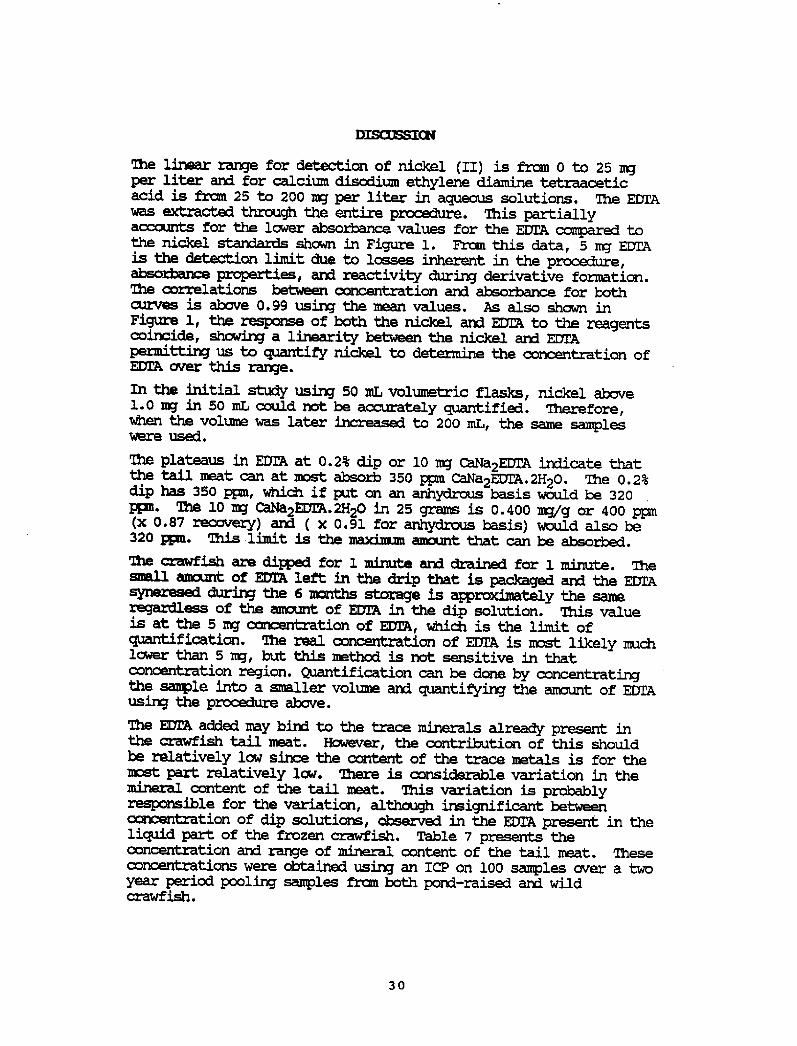
'%he linear range for detection of nickel Il! is fzesn 0 to 25 mgper liter and for calcium disodium ethylene diamine 4~aceticacid is fram 25 to 200 mg per liter in aqueaus solutions. The ZDIAwas extzacted thzmxg the entire procedure. This partiallyaccounts for the lawer absorbance values for the ZDTA compared tothe nic3aL st.mdards shawm in Figure 1. Fram this data, 5 mg EDIAis the detection limit due to losses inherent in the procedure,abscchance properties, and reactivity during derivative formatian.'Ble cozrelatians between concentration and absorj:mnce for bathcurves is abave 0.99 using the mean values. As also shawm inFigure 1, the respanse of bath the nickel and ED' to the reagentscoincide, showing a linearity between the nickel and ZDIAperaatting us to quantify nickel to deb~maine the concentration ofZOZL aver this range.
In the initial study using 50 mL volumetric flasks, nickel abave1.0 mg in 50 mL cauld nat be accurately quantified. Therefore,when the volume was later increased to 200 mL, the same sampleswere Used,
The plateaus in ZOIA at 0.24 dip or 10 mg CaNa2EDIA indicate thatthe tail meat can at most absorb 350 ppm CaNa2EOZL.2H20. The 0.2%dip has 350 pgm, which if put an an anhydrous basis would be 320ggn. 'Hle 10 mg CaNa2EDZA.2H20 in 25 gree is 0.400 mg/g or 400 ppm x 0.87 recavezy! and x 0.9l for anhydrous basis! would also be320 ppn. This limit is the maximum amaunt that can be absozbed.
'Ihe crawfish aze dipped for 1 minute and drained for 1 minute. The~ amaurrt of EVER lett in the drip that is packaged arxl the ED'synezesus5 during the 6 months storege is approximately the sameregaxdless of the amount of EVE in the dip solutian. This value
at the 5 mg cancentratian of EDZL, which is the limit ofquarrtification. 'Xhe real concentration of EDZK is most likely muchlower than 5 mg, but this method is nat sensitiveconcentzation region. Qumtification can be done by concAmtratirxythe sample into a smaller volume and ~ifying the amaunt of ZDI'Ausing the prceeduze abave.
The EDI'A added may bind to the trace minerals already present inthe ~ish tail meat. Hawever, the contribution of this shouldbe relatively low since the content of the tzace metals is for themost part relatively law. 'Khan is console variation in themineral content of the tail neat. 'This variation is probablyrespansible for the variatian, although insignificant betweenconcerrtratian of dip solutions, observed in the EDZK p~~t in theliquid part of the frozen crawfish. Table 7 presents theoancentration and range of mineral content of the tail meat.concerrtzations were obtained using an ICP on 100 samples aver a twoyear period pooling samples frcn both pond-raised and wildcrawfish.
30

TABLE 7. 5KNERAL CCHTENT OF CRAWFISH TAIL NEAT
Darbey, A. 1952. Colorimetric Determination of the Sodium Saltsof Ethylenediaminetetraacetic Acid. Anal. Chem. 24�!:373-378.
' ~
Deteznunation of Elements," Marczenko, Z. ed.! . Halsted Press,New York.
Marshall, G. 1986. Personal camtmnication. ?auisiana StateUhiversity, Departement of Food Science, Baton Rouge, IA 70803.
Partial m~ort far this project was from the Louisiana CrawfishResearch and Praanticm Board, Baton Baoge, Louisiana.
31
Cobalt
Co@mrIran
Nickel
~'A~U7QZgparts per million
as is
0. 569
3. 354
17.37
0.967
RANGE
parts per millionas is
0.000-1.335
0.820-5.753
1.711-21.04
0.000-2 ' 141

INTRAMUSCULAR COLLAGEN OF FRESH AND FROZEN ATLANTIC COD GADUS MORHUA!
C. G. Walton and T. AD Gill
Canadian Institute of Fisheries TechnologyTechnical University oi Nova Scotia
P. 0 ~ Box 1000
Halifax, Nova ScotiaB3J 2X4
INTRODUCTION
Frazen storage is an important method af fish preservation, how-ever, freezing and prolonged frazen storage result in deterioration oftexture, flavour, and colour Shenouda, 1980!. Loss of ~ater holdingcapacity, and a spongy, rubbery, or fibrous texture are sametimes ob-served in products held at high frozen storage temperatures. Productalteratians have been attributed to the effects of interrelated physi-cal, chemical. and enzymatic changes Shenouda, 1980!.
There has been a great deal of research directed toward under-standing the toughening phenomenon. Reduced extractabil.ity of myo-fibrillar proteins after frozen storage has been confirmed. However,the molecular basis of toughening remains unclear King, 1966; Dyerand Morton, 1956; Dyer et al. 1956; Dyer and Dingle, 1961!.
Int'crest in collagen as a protein contributing ta the toughnessof frozen-stored fish stems from the resistance of muscle cells tohomogenization after irozen storage. This resistance is the basis ofthe "Cell Fragility Test" Love, 1958! which related toughness and re-sistance to homogenizatian. Love et al. �965! suggested that anincrease in the strength of the sarcoplasmic reticulum or othercementing agent was responsible for the ability of the cells to with-stand disruptive forces. It is suggested here that the collagen layerof the cell wall endamysium! may be the cementing agent responsiblefor cell strength.
Early reports by Connell �962!, and Banks �965! state that de-naturation or changes in the connective tissue elements of the musclelikely cause certain textural defects. Tanaka �965! noted the sarco-lemma af Alaskan pollack became tougher with frozen storage althoughna work detailing the changes in connective tissue resulting fromfrozen storage has been reported Connell, 1968!. Sikorski et al.,�984! acknowledged that collagen may be involved in the toughening ofthe fish muscle with frozen storage.
Intramuscular collagen consists of the myocammata and fibrils ofcollagen extending from the myocommata. These fibrils, composed afthe same collagen as faund in the myocommata Love, Lavety and Garcia,1972!, are part of the call wall endomysial collagen! and connect themyocomma to form a continuous muscle structure. Factars which must beconsidered when studying cod connective tissue are seasonal
32

variations, age, Love et al., 1976! and sampling region within thefish Love, 1970!.
The objective of the present study was to determine the effectsof frozen storage on collagen by chemical and microstructural methods.
METHODS
Fresh whole cod was purchased locally within two days of landing,and held on ice throughout rigor-mortis. Fish were measured, weighedand filleted. One fillet from each fish was frozen at -30 C, theother analysed immediately'. Frozen fillets were held at -12 C for 5weeks prior to analysis. Tissue pH and water content were determinedas indicators of the nutritional status of the fish Love, 1960; Love,1969!.
Myofibrils were prepared from fresh and frozen tissue Olson etal., 1976! and incubated at 10 C with bacterial collagenase Type VII:Sigma Chem. Co.! in a buffered CaCI2 solution. Treated and untreatedsamples were fixed for scanning electron microscopy SEM! in 2.5Xglutaraldehyde in Sorensons phosphate buffer pH 7.0. Samples weresubsequently frozen in liquid freon and freeze dried. Gold, in anargon atmosphere, was used to sputter coat tha samples. Scanningelectron microscopy was performed using JEOL Model JAX-35 ElectronProbe X-ray Microanalyzer with an accelerating voltage of 25KV.
Tissue was dissected to separate the myocommata and myotomal tis-sue containing endomysial collagen Love and Lavety, 1972!, however,residual myotomal tissue remained attached to the myocommata. Dis-sected tissue was placed immediately into a O'C solution of 0.6 MNaCI, 0.5 M Tris pH 7.4 containing protaase inhibitors �0 mM athylen-ediamine tetraacetic acid, I ~ 0 mM phenylmethylsulfonyl fluoride, 2.0mM N-ethylmaleimide, 10 mM pepstatin, 1.0 mM sodium azide!. Tissuesuspensions were held in an ica«water bath while the dissections werecompleted. The extraction scheme is depicted in Figure 1.
Dissected tissue was dispersed in 20 volumes of salt solutionusing a Waring blender equipped with a baffle Dyer, et al., 1950!.The solution was blended for four 30 second periods, each followed bya 30 second rest period. Samples ware stirred at 4 C overnight fol-lowed by centrifugation �000 xg, 15 min! and insoluble material re-extracted with 10 more volumes wet weight! of salt solution. Thesetwo salt axtractions separated salt soluble myofibrillar, sacroplasmicand collagenous protein from salt insoluble protein Figure 1$! in thepellet.
After washing the salt-insoluble pellet several times with colddistilled water, it was suspended in 10 volumes wat weight! of cold0.5 Macatic acid and disrupted for 15 sac using a Polytron Model PT10-/35 Brinkman Instruments, Raxdale, Ont.!. The sol t ion was stirred
33

A Dissected tissue Myocommata, myotomal tissue!
0.6 M NaCl extractio~ saltsoluble
EsaltAcetic acid extractio~ acid
soluble preci itation
resolubilizatio
FPepsin extraction � ~ pepsin ~ 'salt
soluble preci itation
resolubilizatio
34
Figure l. Extraction scheme � Sequential protein solubilization andcollagen fractionation

at 4 C overnight and centrifuged at 1000 xg for 15 min to separateacid soluble and insoluble protein. Acid soluble collagen wasprecipitated by the slow addition of crystalline NaCl to 2 M andallowed to settle overnight Figure 1E!.
Acid insoluble tissue Figure 1C! was suspended in 10 volumes wet weight! of 0.5 M acetic acid containing 1 mg ml pepsin SigmaNo. P-7125! to give about 1 mg enzyme to 100 mg protein. Extractionand precipitation were performed as for acid soluble protein Figure1F!. Salt-precipitated protein was collected by centrifugation at1000 xg for 15 min, washed 2-3 times in cold distilled water to removesalt, and resolubilized in 0.5 M acetic acid Figures 1G and H!.
Protein content, was calculated at each stage of the extractionprocedure Lowry et al., �951!. Bovine serum albumin Sigma FractionV! was used as a standard and protein content expressed as mg BSA-protein per ml.
Hydroxyproline content was determined by the Woessner �961!method in order to quantitate collagen content throughout the proced-ure. An hydroxyproline level of SZ was assumed for calculation of thecollagen content of each fraction. This figure was determined for codskin collagen in a previous study Young and Lorimer, 1960!.
Sodium dodecylsulfate polyacrylamide gel electrophoresis SDS-PAGE! using 7.5Z polyacrylamide gals containing 1.4Z bisacrylamidecrosslinker was used to monitor the isolation and purification process Porzio and Pearson, 1977!. Samples were prepared in the presence andabsence of the disulfide reducing agent, 2-mercaptoethanol ME!.Collagen peptides were identified by' their staining characteristicswith Coomassie Blue R250. Apparent molecular weights were determinedusing standard heavy molecular weight marker proteins Bio-Rad Labs.,Richmond, CA!.
Insoluble fractions were examined with the scanning electronmicroscope after each solvent extraction in order to see the effectsof frozen storage and changes during the extraction process. Sampleswere prepared as described for myofibrils.
RESULTS AND DISCUSSION
Condition of Fish
Fish used were between 50 and 70 cm in length and were landed inMarch and August. Table 1 gives the average tissue pH and water con-tent and establishes that the fish caught in March were poorlynourished'
Myofibrils
Homogenization resulted in fragmentation of individual myofibrilsin fresh muscle but not in frozen. Muscle fibres prepared from frozen
35

tissue were resistant to shear as illustrated in Figure 2. The fib-rous surface matrix of intact frozen muscle cells loses its porousappearance after frozen storage Figure 3!.
Table 1. pH and moisture levels of cod used in the study
Fish Condition
average pH percent moisture
March fish �!*August fish �!*
7.15
6.9085.6
83.5
*Figures in parantheses represent number of individualswhile data represent overall averages of duplicate analysesof each individual fish
Digestion of the frozen cells with bacterial collagenase clearlydisrupted the sheath surrounding the cell Figure 4!. This indicatesthat the collagen surrounding each muscle cell remained intact afterfrozen storage suggesting that perhaps the endomysial collagen is atleast in part responsible for the resistance to fragmentationexhibited by frozen muscle fibres.
Solubility
Protein Table 2! and collagen Table 3! solubilization was re-duced after the cod had been frozen stored at -12'C for 5 weeks. Sea-sonal variations are evident in collagen extractability as noted byLove et al. �976!.
Collagen of the fish caught in March, during the period of star-vation, is 31K salt soluble and that of the fish caught in August,when fish are well nourished, is 54X salt soluble. Love et al. �976!report collagen of cod is more highly crosslinked during periods ofstarvation, consequently reducing salt solubility as noted in thepresent study.
Scanning Zlectron Microscopy
36
Following removal of salt soluble protein in 0.6 M NaCl, the in-soluble material Figure 1B! was visualized using scanning electronmicroscopy SEM!. Collagen fibres isolated from fresh tissue weredistinct and smooth. After frozen storage, material appeared to bedeposited/associated with the fibres resulting in a loss of the dis-tinctly fibrous appearance Figure 5!. One explanation for this couldbe the migration of water soluble sarcoplasmic proteins to the surfaceof the cell wall as a result of freezing/frozen storage. Ice crystaldamage to the sarcoplasmic membrane may result in "leakage" of theseproteins and subsequent deposition on the cell surface. Following

Figure 2. Scanning eLectron micrographs of myofihrilsprepared from A! fresh and B! frozen cod muscle.Markers 100 aa.
37

Figure 3 ~ Scanning electron micrographs of cell surfaceultrastructure from A! fresh and 8! frozen codmuscle. Markers 3..0/m.
38

Figure 4. Scanning electron micrographs of frozencod muscle cells A! control, 8! incubated withcollagenase. Mar.'-ers lcm.
39

4"8
0 4W
lg
0
4 00
g
M0 44
0
Ql ~A5L
C Sll50 tdM
~ Q
8
001 Il
C
I
e0 9
Q ~
01 91S 4W r.
V
4 8
0 00 '8
6 8
40

acid solubilization Fig 1C!, thickened fibres were still apparent inthe residue of the frozen sample Fig 6!.
Table 2. Protein solubility of fresh and frozen cod tissue using asequential solubilization procedure.*
~Radon s|mnExtraction
Medium C A B
97.5 87.8
1.85 5.32
0.52 6.12
0.91 0 ' 75
salt
acid
pepsininsoluble
*Protein solubility in each extraction mediumshown as a percentage of total protein in allsteps.A � fresh cod, landed FebruaryB � fresh cod, landed AugustC - irozen cod, landed August
Table 3 ~ Solubility of fresh and frozen cod collagen using asequential solubilization procedure.*
Extraction
Medium~Radon s iud
A B A B C
54.27 35.80
41.03 39.0
4.51 24.8
0.20 0.36
*Collagen solubility in each extraction mediumshown as a percentage of total collagen recoveredin all steps.A � fresh cod, landed MarchB - fresh cod, landed AugustC � frozen cod, landed August
SDS-PAGE
Collagen bands stained with Coomassie blue R-250 appeared as r'edbands on the gels. All other proteins stained blue. Micko andSchlaepfer �973! noted the metachromasy, characteristic of collagenand McCormick et al. �979! reported that all bands staining red weresensitive to collagenase.
Electrophoresis of salt soluble protein recovered from isolatedmyocommata, with adhering cellular protein, resulted in bandingpatterns which were similar to those of muscle fibres from which the
41
saltacid
pepsininsoluble
97.9
1.540.47
0.079
88.3
1.34
10.11
0.22
92.46
3.47
3.74
0.06
65. 77
5.32
28.8
0.06
83.7
14 ' 7
1.54
0.070
31.03
55.60
13.09
0.27
81.8
17.0
1.14
0.086
80.7
14.2
4.70
0.41

Figure 6. Scanning electron micrographs of acidinsoluble myocommata from A! fresh and B! frozen codtissue. Markers 1.0~.
42
myocosesata had been removed Figure 7A!. After frozen storage, a highmolecular protein was present in both samples and appeared as a bandbarely entering the gel Figure 7B!.
SDS-PAGE of the salt insoluble frozen myotomal/endomysial andmyocommatal tissues revealed an increase in high molecular weight HMW! non-collagenous proteins and loss of intermediate �0-200 kdal!molecular weight species after frozen storage Figure 8!. Myocommataltissue also contained unique intermediate molecular weight speciesafter frozen storage. Two possibilities exist to account for thesehigh and intermediate molecular weight salt insoluble proteins: �!covaLent interactions among non-collagenous proteins; or �! interac-tion of collagen and myofibrillar or sarcoplasmic proteins resultingin high molecular weight complexes which are unable to induce meta-chromasy.
Type I collagen appears as one or two dimers and two monomerswith calcuLated molecular weights of 200,000 and 96,000, respectively Miller and Gay, 1982!. Purified acid soluble endomysial collagen ex-hibited this banding pattern and no difference between the fresh andfrozen samples were apparent. This implies no covalent changes occur.in collagen which remains soluble in acid after frozen storage Figure9!.
Acetic acid extracted a range of collagenous poIypetides from themyocommata Figure 10!. Several peptides with molecuLar weights lessthan the typical monomers appeared in both fresh and frozen samples aswell as HMW collagen dimers and trimers. After frozen storage, theseHMW complexes are not depolymerized with lengthy exposure to acidicconditions thus appearing more stable than similar polymers in thefresh samples. This suggests that the effect of frozen storage onmyocommataL acid soluble collagen is crosslink production or stabili-zation.
The effect of frozen storage on non-collagenous acid soluble pro-tein of the endomysium and myocossnata shows an increased proportion ofHMW protein. An example of this is shown in Figure 11 displayingdensitometer scans of acid soluble endomysial protein from fresh andfrozen tissue. No HMW protein, including myosin, was present in thefresh sample in contrast with the frozen sampLe which is 27Z HMW pro-tain greater than 150,000 daltons!. These complexes are stable inthe presense of SDS, urea, and mercaptoethanol MK! suggesting cova-lent protein aggregation has occurred during frozen storage. The saltinsoluble protein banding pattern is different than that of acid solu-ble protein. The presence of unique intermediate molecular weight IMW! protein after acid extraction suggests that acid labile bondsare responsible for some of the HMW protein aggregates of the salt in-soluble tissue data not shown!.
SDS-PAGE of the frozen, acid insoluble myocommata displayed highand Low molecular weight L8V! proteins which were not present in thefresh sample Figure 12!. This would imply association of high and
43

Figure 7. Densitometer scans of SDSelectrophoretic gels of salt solublemyotomal protein from A! fresh and B! frozen cod myotc, s.
Figure 8. Densitometer scans ef SDSelectrophoretic gels of salt insolublemyotomal protein from A! fresh and B!frozen cod tissue,= Fig. lb! .

Figure 9. Densitometer scan of an SDSelectrophoretic gel from acid soluble freshendomysial protein. Red staining collagenbands are indicated by arrows.
Figure lO. Densitometer scan of an SDSelectrophoretic gel from acid soluble freshmyocommatal protein. Red staining bandsare indicated by arrows.
45

Figure ll. Densitometer scans of SDSelectrophoretic gels. Acid solubleendomysial protein from A! frozen and B! fresh tissue Fig. 1f! . Arrow repre-sents 150,000 dalton'
Figure 12. Densitometer scans of SDSelectrophoretic gels. Acid insolublemyocommata Fig. lc!, A! fresh B! frozen.Red staining collagen bands are indicatedby arrows.

low molecular weight protein with the collagen matrix and that theseinteractions are resistant to breakdown in acid.
Pepsin released monomers and dimers as well as many lower molec-ular weight peptides from the myocommata. Unlike the endomysium, myo-coamatal pepsin soluble collagen is not influenced by the presence ofa disulfide reducing agent.
The banding pattern of the frozen pepsin soluble myocommatal pro-tein is qualitatively similar to that of the fresh. Hovever, the pro-portion of LMW collagenous peptides in the frozen sample is fargreater Figure 14!. These peptides are not the result of pepsinactivity on native collagen, being less significant in the freshsample. This implies cleavage of intact collagen peptides is alteredby frozen storage.
Purification of the pepsin soluble extracts of both tissues bysalt precipitation, resulted in a significant loss of hydroxyprolinein the salt supernate. A greater percentage of collagen extractedfrom the frozen samples did not precipitate Table 4!. A greaterquantity of non-precipitable co1.1agen in the frozen sample suggestsincreased pepsin sensitivity after frozen storage, resulting in smallcollagen peptides.
Table 4. Pepsin soluble collagen remaining in the salt supernate as apercentage of pepsin soluble collagen.
Fresh Frozen
98.9
98.9
69.1
82.4
47
Pepsin treatment of acid insoluble tissue, from both the myo-commata and endomysium, fresh and frozen, resulted in many collagenpeptides ranging in molecular weight from 230,000 to 17,000 suggestingcollagen cleavage by pepsin. Fresh and frozen, pepsin soluble endomy-sium revealed 3 major collagen components in addition to the twomonomers observed in the acid soluble fraction. These additional com-ponents, designated x and y and the dimers 5x, y MW 190,000!, suggestthat an additional collagen type exists within the endomysium Figure13A!. Several HMW bands appear in the fresh pepsin soluble sample inthe presence of a disulfide reducing agent and appear as an HMW pro-tein band barely entering the gel in the absence of MR Figure 13B!.In the frozen pepsin soluble sample, a dimer is associated by di-sulfide bonding as evidenced by reduction with MR Figure 13C and D! ~This suggests breakdown during frozen storage or extraction of the HMWcomplexes resulting in lover MW crosslinked complexes which migrate asdimers �00 kdal.!.

Figure l3. Densitometer scans of SDSelectrophoretic gels of pepsin solubleendomysial protein. A!fresh tissue, withME; B! fresh tissue, without MZ; C! frozentissue, with ME; D!frozen tissue withoutNE. All bands stained red.
48

Figure 14. Densitometer scans of SDSelectrophoretic gels of pepsin solublemyocommatal protein A! fresh, B! frozen.
Figure 15. Densitometer scans of SDSelectrophoretic gels of pepsin insoluble Pig. ld! endomysial material A! fresh B! frozen � peak "S" .is composed of
bands indicated by arrows.

The electrophoretic pattern of the pepsin insoluble residue Figure ID! from the fresh endomysium, showed a similar banding pat-tern to pepsin soluble collagen Figure 15!. Frozen endomysium dis-played the same banding pattern as the fresh with the addition of sev-eral major HMW bands �70,000 to 300,000 daltons! representing 25K ofthe protein on the gel. These additional high molecular weightspecies appear as a result of crosslinking during frozen storage, oran increased stability of naturally occurring crosslinks.
Insoluble residue from fresh and frozen myocoszaata did not appeardifferent and was composed oi a range of collagenous proteins with Iowmolecular weights to trimers.
CONCLUSIONS
Collagen in the endomysium and myocosmata of Atlantic cod is pri-marily salt soluble. Acid and pepsin soluble collagen is also presentin smaller amounts, indicating the presence of acid labile and acidstable crosslinks, respectively. Pepsin sensitivity within the colla-gen chains is evident. Polymerized peptides remaining after pepsinextraction appear on SDS gels as minor components implying extensivelycrosslinked collagen.
A series of LMW collagen peptides exist within the myocommatasuggesting the presence of more than one type of collagen within thisstructure. The endomysium also revealed the presence of more than asingle .type of collagen. Endomysial collagen' was different from themyocoszaata and exhibited disulfide bonding.
Insoluble collagen of the endomysium displays HMW complexes afterfrozen storage and HMW complexes of acid soluble myocommata becomemore stable. Salt soluble collagen decreased as a result of frozenstorage. Crosslink production or stabilization during frozen storageis implied by these results. Pepsin sensitivity is increased as a re-sult of frozen storage. Evidence for this includes the presence of acovalently bonded dimer in pepsin soluble endomysial collagen as wellas an increase in the proportion of LMW collagenous proteins in pepsindigests of. myocomaata recovered from frozen muscle. Also, the portionof pepsin digested myocommata and endomysium which is not precipitatedby salt increases if prepared from frozen fish, indicating increasedlevels of LMW collagen peptides.
Electron micrographs demonstrated thickened collagen fibres fromfrozen stored cod suggesting the possibility that associated materialmay prevent solubilization of cellular proteins by acting as a barrierto solvent entry. These changes are likely reflected in toughening ofsarcolemma, reduced protein extractability and are probably the basisfor Love's cell fragility test. Further research using several timeand temperature storage periods is necessary to determine the quanti-tative relationship to sensory evaluation of toughness.
50

REFERENCES
2.
3.
4.
6.
7.
8.
9.
10 '
13.
14.
15.
Banks, A. 1965. Technological Problems in the Control ofDeteriorative Changes in Frozen Fish Requiring more Knowledge from"Fundamental Research in the Technology of Fish Utilization".R. Kreuzer ed!. p. 89.
Connell, J. J. 1962 ' Recent Advances in Food Science. Vol. 1. London: Butterworths! p. 136 '
Connell, J. J. 1968. The Effect of Freezing and Frozen Storageof the Proteins of Fish Muscle from "Low Temperature Biology ofFoodstuffs". Hawthorne, J. ed!. Pergamon Press p. 333.
Dyer, W. J. and J. R. Dingle. 1961. Fish Proteins with SpecialReference to Freezing in "Pish as Food". p. 275.
Dyer, W. J., H. V. French and J. M. Snow. 1950. Proteins in FishMuscle I. Extraction of Protein Fractions in Fresh Fish. J. FishRes., Bd. Can. 7�0 85.
Dyer, W. J., and M. L. Morton. 1956. Storage of Frozen PlaicePillets. J. of Fish. Res. Bd. Canada. 13�29.
Dyer, W. J., M. L. Morton, D. I. Fraser and E. G. Bligh. 1956.Storage of Frozen Rosefish Fillets. J. Fish. Res. Bd. Canada13� 69.
King, F. J. 1966. Ultracentrifugal Analysis of Changes in theComposition of Myofibrillar Protein Extracts Obtained from Freshand Frozen Cod Muscle. J. Food Science 31:649.
Lavety, J. and R. M. Love. 1972. The strengthening of codconnective tissue during starvation. Comp. Biochem. Physiol.41A:39.
Love, R. M., K. Yamaguchi, Y. Creac'h and J. Lavety. 1976. TheConnective Tissues and Collagens of Cod during Starvation. Comp.Biochem. Physiol. 55B:487.
Love, R. M., J. Lavety and N. G. Garcia. 1971. The ConnectiveTissue of Fish. VI Mechanical Studies on Isolated Myocosinata.J. Food Tech. 7:291 '
Love, R. M. 1979. Toward a Valid Sampling Technique in "TheChemical Biology of Fishes". Academic Press. p. 1.
Love, R. M. 1969. In: Freezing and Irradation of Fish. R.Kreuzer ed!. Fishing News Books!, London. p. 40.
Love R. M. 1960. Water Content of Cod Gadus callarias L.!Muscle. Nature. 185:692.
Love, R. M. 1958. Measurement of toughness in cold-stored fish.Nature. pp. 108-109.

16. Lowry, O. H., N. J ~ Rosebrough, A. l.. Farr, and R. J. Randall.1951 ' Protein Measurement with the Folin Phenol Reagent. J ~Biol. Chem. 193:265.
17. McCormick, P. J ~ , ST Chandrasekhar, and A. J. T. Millis. 1979.Direct Visualization of Collagens and Procollagens inPolyacryloamide Geist Anal. Biochem. 97:359-366.
18. Micko, S. and V. W. Schlaepfer. 1978. Metachromasy of periferalnerve collagen on polyacrylamide gels stained with CoomassieBrilliant Blue R250. Anal. Biochem. 88:566.
19. Miller, ED J. and S. Gay. 1982. Collagen: An overview. In"Methods in Enzymology". Vol. 82, part A, p. 3.
20. Olson, P. G., P. C. Parrish, Jr., and M. H. Stromer. 1976.Myofibril fragmentation and shear resistance of three bovinemuscles during postmortem storage. J. Food Sci. 41�! 1036.
21. Porzio, M. A. and A. M. Pearson. 1977. Improved Resolution ofMyofibrillar Proteins with Sodium Dodecyl Sulfate-PolyacrylamideGel Electrophoresis. Biochem. Biophys. Acta. 490:27.
22. Shenouda, S. Y. K. 1980. Theories of Protein Denaturation duringfrozen storage of fish flesh. Advances in Food Research. 26:275.
23. Sikorski, Z. E., DE N. Scott and D. H. Buisson. 1984. The Roleof Collagen in the Quality and Processing of Pish. CRC. CriticalRev. in Food Sci. and Nutrition. 20��01.
24. Tanaka, T. 1965. Electron Microscopic Studies of Toughness inFrozen Fish. The Technology of Fish Utilization. R. Kreuzar ed! ~ p. 5.
25. Voessner, J. F. 1961. The Determination of Hydroxyproline inTissue and Protein Samples Containing Small Proportions of thisAmino Acid. Arch. Biochem. Biophys. 93:440.
26. Young, E. G., and J. W. Lorimer. 1960. The Acid-soluble collagenof Cod Skin. Arch. Biochem. Biophys. 88:373.
52

IN VITRO LIPID OXIDATION OF SARCOPLASMIC RETICULUM
BY IN SITU CONCENTRATIONS OF Fe AND Cu
Eric AD Decker and Herbert Q. Hultin
Massachusetts Agricultural Experiment StationDepartment of Food Science and Nutrition
Marine Foods LaboratoryUniversity of Massachusetts
Gloucester, Massachusetts 01930, U.S.A.
INTRODUCTION
Lipid oxidation is a major pathway of chemical deterioration infrozen fish muscle which leads to decreased quality. An enzyme foundin winter flounder Pseudo leuronectes americanus! is an activecatalyst of lipid oxidation at temperatures as low as -20 C Apgar andHultin, 1982! ~ This enzymic system, which is located in the sarco-plasmic reticulum Borhan et al., 1984!, catalyzes lipid oxidation inthe presence of iron and NADH and is stimulated by the presence of ADP McDonald and Hultin, 1987!. The ability of copper to interact withthis enzyme system is not well understood.
Halliwell and Gutteridge �986! have suggested that a low molecu-lar weight pool of soluble iron chelates are capable of stimulatinglipid oxidation in vivo. Thirty percent of the iron of winter flounderis found in the water-soluble press juice! fraction Kramer, 1987! ~Addition of the soluble metals with a molecular weight less than .10,000daltons as the sole source of metal to a model system con<aining 0.1 mMADP and 0.5 mg sarcoplasmic reticular SR! protein resulted in stimula-tion of lipid oxidation after 6 days Kramer, 1987!.
The purpose of this paper was to determine the soluble and lowmolecular weight LMW! Fe and Cu concentrations of winter flounder andAtlantic mackerel Scromber scrombrus! muscle and to determine if theseconcentrations of Fe and Cu could promote lipid oxidation. Varyingconcentrations of NADH and ADP were also tested to see their effects onSR-catalyzed lipid oxidation at in situ Fe and Cu concentrations.
MATERIALS AND METHODS
Winter flounder and Atlantic mackerel were obtained from fishprocessors in Gloucester, Massachusetts. The fish were immediatelyiced and used within 24 hr. Mackerel were frozen by placing whole in a-80 C freezer and thawed by p1,acing under running tap water. Nicotin-amide adenine dinucleotide, reduced NADH! and adenosine-5 -diphosphate ADP! were obtained from Boehringer Mannheim Biochemicals. BakerInstra-analyzed nitric acid and Gold-label magnesium nitrate used formetal determinations were purchased from 3 AT. Baker. All other

chemicals were reagent grade. All glassware used in metal determina-tions were acid washed.
Sarcop1.asmic reticulum was isolated from flounder muscle using themethod of Borhan et al. �984! except that the minced tissue was homo-genized three times at 30 s intervals, the resulting homogenate wasadjusted to pH 7.3, the ratio of supernatant:45X sucrose:20X sucroseused for the discontinuous sucrose gradient was 50:9:3 and the gradientwas centrifuged for 60 min. SR protein was determined using the Lowryprocedure as modified by Markwell et el ~ �978!.
A "press juice" representing the soluble components of floundermuscle was prepared by centifuging coarsely cut up tissue at 15,000 rpmin a type 19 rotor �2,000 x g! for 15 hr in a Beckman L5-65B prepara-tive ultracentrifuge at 5 C. The LMW fraction of the press juice wasisolated by ultrafiltration using an Amicon Stirred Cell Nodel 52. Thefiltrate was collected until the press juice volume was reduced by onehalf. YM series membranes with molecular weight cutoffs MWCO! of10,000, 5,000 and 1,000 were used to isolate the LMW fraction. The LNWfraction �0,000 MWCO! of aged flounder muscle was isolated after stor-ing the fillets on ice for 6 days.
Iron and copper concentrations of the press juice and the LMWfractions were performed on a Perkin-Elmer 3030B Atomic AbsorptionSpectrophotometer with a HGA-400 Graphite Furnace accessory. Iron con-centrations were determined at 248.3 nm with a slit width of 0.2 nm.Pretreatment temperature was 1400 C with a ramp time of 5 s and a holdtime of 20 s. Atomization temperature was 2400 C for 4- s with the gasflow shut off. All samples for iron determination contained 0.5 mgXmagnesium nitrate. Copper contents were analyzed at 324.8 nm with aslit width of 0.7 nm, a pretreatment temperature of 1200 C with a ramptime of 5 s, a hold time of 20 s and an atomization temperature of2300 C for 4 s with stop flow. Both iron and copper samples contained0.2X nitric acid.
SR-catalyzed lipid oxidation in a model system was measured bydetermining the production of thiobarbaric acid-reactive substances asdescribed by NcDonald and Hu1.tin �987!. The model system contained0.5 mg SR protein in 5 mN histidine, 0.12 N KC1 buffer, pH 6.8 withvarying concentrations of metals, ADF and NADH. All reactions were runfor 20 h at 6 C in triplicate unless otherwise indicated.
RESULTS AND DISCUSSION
Iron concentrations of the press juice and LMW fractions fromflounder and mackerel are listed in Table 1. Flounder and mackerelwhite muscle had very similar levels of iron in the press juice and theLMW fraction. Approximately IOX percent of this water-soluble iron wasfound to have a molecular weight of 1,000 daltons or less. Storing

Table 1. Tron concentrations ppb! of the water-solublefractions of mackerel and flounder muscle.
Flounder MuscleFresh A edMuscle Fraction
Press Juice<10,000 daltons<5,000 daltons<1 000 daltons
347
3343
48
33
Mackerel White MuscleFresh Frozen -80 C!
400 718
38 54
49 3742 36
Press Juice
<10,000 daltons<5,000 daltons<1 000 daltons
Mackerel Red MuscleFresh Frozen -80 C!0
2356 2244
206
Press Juice
<10,000 daltons
Fillets stored an ice for 6 days.
Table 2 shows the copper concentration of press juice and the LMWfractions of flounder and mackerel muscle. The LMW copper in floundermuscle was found in 2 fractions. Approximently 60X of the copper wasbetween 1,000 and 10,000 daltons and the remaining 40X was less than1,000 daltons. These 2 fractions represented approximately 37X of thetotal soluble copper. Storing flounder fillets on ice for 6 d did notchange the copper concentration in the press juice or the LNW fraction.The total soluble copper concentration of mackerel white muscle wasvery similar to flounder muscle. The LNW copper of mackerel whitemuscle had,a molecular weight of less than 1,000 daltons and represent-ed approximently 40X of the total soluble copper. Freezing themackerel resulted in an increase in the copper concentration of thepress juice. The soluble copper concentration of the mackerel redmuscle was approximately 3 times as high as in flounder and mackerelwhite muscle. The concentration of LNW copper in red muscle wassimilar to the concentrations found in white muscle and flounder, butthis only represented about 10X of the total soluble copper. Althoughcopper tends to be found in lower concentrations than iron in fish
55
flounder muscle on ice for 6 d did not cause any changes in the ironcontent of the press juice or the LMW fraction. Freezing the mackerelmuscle resulted in an increase in the iron concentration of the pressjuice. Mackerel red muscle had approximately 6 times as much iron inthe press juice and about 4 times as much iron in the LMW fraction asflounder and mackerel white muscle. The LNW iron of the red musclealso represented about 10X of the total soluble iron. Freezing hadvery little effect on the total soluble iron of the mackerel red muscle.
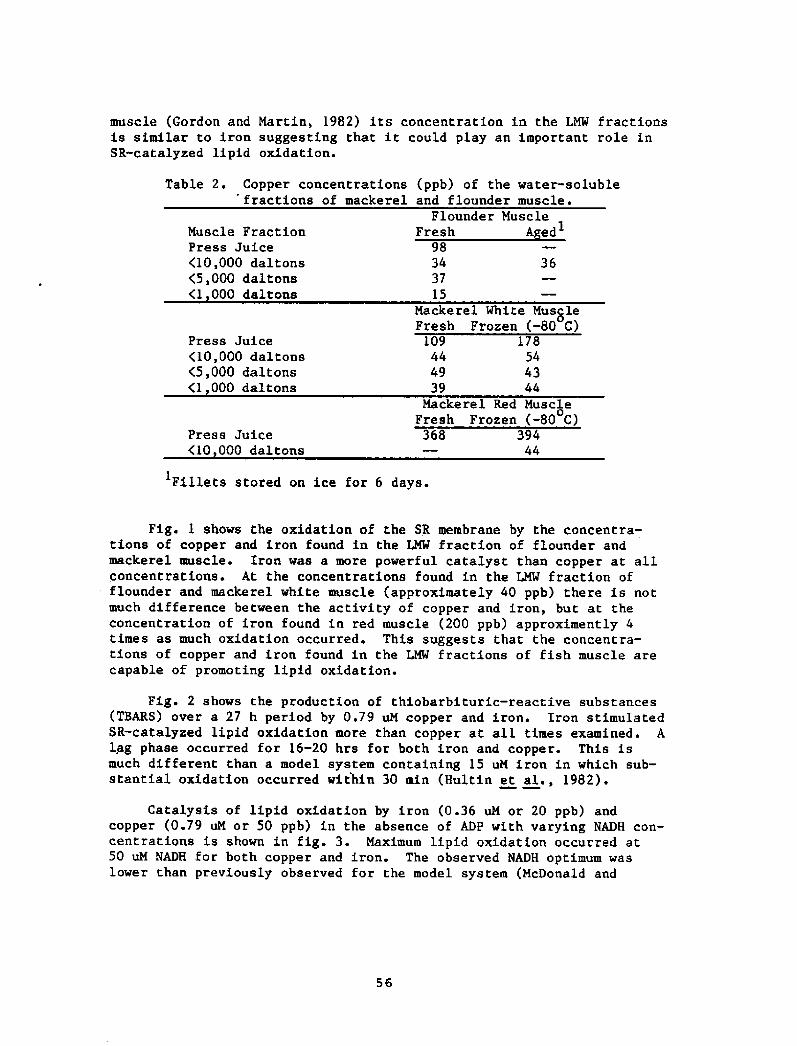
Table 2. Copper concentrations ppb! of the water-solublefractions of mackerel and flounder muscle.
Flounder Muscle
Fresh A edMuscle FractionPress Juice
<10,000 daltons<5,000 daltons<1 000 daltons
983437
15
36
Mackerel White MuscleFresh Frozen -80 C!
178544344
1094449
39
Press Juice
<10,000 daltons<5,000 daltons<1 000 daltons
Mackerel Red MuscleFresh Frozen -80 C!
0
39444
368Press Juice
<10,000 daltons
Fillets stored on ice for 6 days.
Fig. 1 shows the oxidation of the SR membrane by the concentra-tions of copper and iron found in the LMW fraction of flounder andmackerel muscle. Iron was a more powerful catalyst than copper at allconcentrations. At the concentrations found in the LMW fraction of
flounder and mackerel white muscle approximately 40 ppb! there is notmuch difference between the activity of copper and iron, but at theconcentration of iron found in red muscle �00 ppb! approximently 4times as much oxidation occurred. This suggests that the concentra-tions of copper and iron found in the LMW fractions of fish muscle arecapable of promoting lipid oxidation.
Fig. 2 shows the production of thiobarbituric-reactive substances TBARS! over a 27 h period by 0.79 uM copper and iron. Iron stimulatedSR-catalyzed lipid oxidation more than copper at all times examined. Alag phase occurred for 16-20 hrs for both iron and copper. This ismuch different than a model system containing 15 uM iron in which sub-stantial oxidation occurred within 30 min Hultin et al., 1982!.
Catalysis of lipid oxidation by iron �.36 uM or 20 ppb! andcopper �.79 uM or 50 ppb! in the absence of ADP with varying NADH con-centrations is shown in fig. 3. Maximum lipid oxidation occurred at50 uM NADH for both copper and iron. The observed NADH optimum waslower than previously observed for the model system McDonald and
56
muscle Gordon and Martin, 1982! its concentration in the LMW fractionsis similar to iron suggesting that it could play an important role inSR-catalyzed lipid oxidation.

C 0 cg44J
cU
V 0 V
O CQX
CLCL
o o o o oOl Ol W N I!
SUVBJ S3 lOKU
C>'a
c5
0
0~ I
cccW
a
8 C'a
C>
6 44 C4
chic4J0
cj
V
57

ypg sar.oeu
O 'tl
'U glIIII4
X
C!
0
CV
O 4
4J
0 9
8
58

Chr
o
E 8
N
Cl
z
serac saao~U
b08
41
O 0U
0 4Jaj
Oj
0
8 C 04JC V 0 O 00j
cjj
59

Hultin, 1987!. The conditions for the two experiments differed in ironconcentration �.36 uM vs. 150 uM!, assay time �0 h vs. 30 rain! and bythe presence of a NADH regeneration system in these experiments, but anoptimal NADH concentration existed for lipid oxidation in both cases. Atthe optimal concentration of NADH the iron activity was much higher thanthe copper activity, but as the NADH concentration was increased or de-creased the difference between the two activities decreased. This
suggests that at NADH concentrations other than optimal, copper couldhave an important role in SR-catalyzed lipid oxidation.
The effect of ADP concentrations on copper- and iron-cataLyzedenzymic lipid oxidation is shown in fig. 4 ~ Maximal activity was ob-served at an ADP concentration approximately equal to the metalconcentration �.36 uM Fe or 0 ' 79 uM Cu!. This agrees with other ob-servations in our laboratory where optimal enzymic lipid oxidationoccurred when iron:ADP concentrations were 1:1 Frickson, 1987!. Ironwas a more powerful catalyst than copper at the optimal ADP concentra-tion and it remained more effective at all ADP concentrations examined.Iron-catalyzed SR oxidation fluctuated more with varying ADP concentra-tions than copper-catalyzed lipid oxidation suggesting that ADP is moreimportant in iron-catalyzed enzymic lipid oxidation. ADP could be stim-ulating the Fe-catalyzed lipid oxidation by maintaining the ferric ionin a soluble, mobile state. This again suggests that copper could bean important catalyst of SR-stimulated lipid oxidation when in situ ADPconcentrations are not optimal..
Table 3 shows the stimulation of SR-catalyzed lipid oxidationusing the LMW fractions of flounder and mackerel muscle as the solesource of iron and copper. Very little oxidation occurred in thepresence of the LMW fractions. Only the LMW fraction of mackerel redmuscle catalyzed any substantial oxidation in 5 days' The lack ofactivity could be due to the presence of antioxidants in the LMW frac-tions or it could be due to the chelation of the metals to compoundswhich prevent metal-enzyme interactions or change the oxidation-reduction potential of the metals.
Table 3. Lipid oxidation of flounder SR in the presence of lowmolecular wei ht fraction of flounder and mackerel.
nmol TBARS m SR roteinMetal Source 1 da 5 da sFlounder LMWF
�0 ppb Fe; 20 ppb Cu!Mackerel LMWF white muscle!
�0 ppb Fe; 30 ppb Cu!Mackerel LMWF dark muscle!
�20 ppb Fe; 30 ppb Cu!20 ppb FeCl350 ppb CuS04
60

00
C4
Ojj
C>
Q V
Q 0 04JV J'a 0 4
a e o e o @Cll N
SUVGj. S3 lOWU
U
r O Cjjj
CI
jjj
a
C>
0
V0 C!
g 4
C 04J0 qjCl
C 0 «544J
8 V 0
A jjjjC
W 'UCV
CO
4.'4
cjj

The iron and copper concentrations found in the low molecularweight water-soluble fraction of winter flounder and mackerel whitemuscle muscle were very similar. At this concentration �0 ppb! ironproduced slightly higher levels of TBARS than copper. Mackerel redmuscle contained approximately 4 times as much LMW iron but had aboutthe same concentration of LMW copper as flounder and mackerel whitemuscle. The concentration of iron found in the LMW fraction of redmuscle was a much more effective catalyst of SR-stimulated lipid oxida-tion than the concentrations found in flounder and mackerel white muscle.
Lipid oxidation catalyzed by both copper and iron showed optimalconcentrations of NADH and ADP, but iron was more strongly inhibitedthan copper when NADH and ADP were not at optimal levels. This sug-gests that even though iron is a more powerful catalyst than copperunder optimal conditions, copper could be an important contributor toin situ lipid oxidation.
REFERENCES
Apgar, M.ED and Hultin, HE 0. 1982 ' Lipid peroxidation in fish musclemicrosomes in the frozen state. Cryobiology 19:154.
Borhan, M., Shewfelt, R;L. and Hultin, H.O. 1984 ' Sarcoplasmic reticulumfrom flounder muscle having improved lipid peroxidative activity.Anal. Biochem. 137:58 '
Erickson, N.C. 1987. Private communication. University of GeorgiaExperiment Station, Griffin, GA.
Gordon, D.T. and Nartin, R.E 1982. Vitamins and minerals in seafood ofthe Pacific northwest. Ch. 21. In "Chemistry and Biochemistry ofMarine Food Products" R.E. Martin, G.J. Flick, C.E. Hebard and D.R.Ward Eds.!, p. 429 AVI Publishing Co., Westport, CT.
Halliwell, B. and Gutteridge, M.C. 1986. Iron and free radicalreacti,ons: two aspects of antioxidant protection. TIBS 11, 372.
Hultin, H.O., McDonald, R.E. and Kelleher, S.D. 1982. Lipidoxidation in fish muscle microsomes. Ch. 1 ~ In "Chemistry andBiochemistry of Narine Food Products" R.E. Martin, G.J ~ Flick, C.E.Hebard and D.R. Ward Eds.!, p. 1-12 AVI Publishing Co., Westport,CT.
Kramer, K.M. 1987. Form of iron in flounder muscle and its relation tosarcoplasmic reticular lipid oxidation. M.S. Thesis, Univ. ofMassachusetts, Amherst.
62

Markwell, M.A.K., Hass, S.N., Bieber, L.L. and Tolbert, N.E. 1978.Modification of the Lowery procedure to simplify proteindetermination in membrane and lipoprotein samples. Anal. Biochem.87:206.
McDonald, R.E. and Hultin, H.O. 1987. Some characteristics of theenzymic lipid peroxidation system in the microsomal fraction offlounder skeletal muscle. J ~ Food Sci. 52, 15.
63

EFFECT OF C02-02 MODIFIED ATMOSPHERE WITH PRESSURIZATION ON THEKEEPING QUALITY OF COD FILLETS AT 2'C
F AM. Bartlett and E.G. BlighCanadian Institute of Fisheries Technology
Technical University of Nova ScotiaP. O. Box 1000
Halifax, Nova ScotiaB3J 2X4
INTRODUCTION
The highly perishable nature of fresh fish is well known. Theprimary cause of spoilage of unfrozen lean fish is the growth and met-abolic activities of bacteria. The most common spoilage bacteria offish, and other fresh muscle foods, are gram-negative, aerobic psy-chrotrophs, especially Eseudomonas ~s . Ogrydziak and Brown, 1982!.Such bacteria are capable of causing deterioration of fish with theproduction of obnoxious odours and off flavours, during refrigeratedstorage.
Recently there has been increased interest by the fishing indus-try in modified atmosphere M.A.! packaging using a carbon dioxide C02!-enriched environment to extend the shelf life of refrigeratedfresh fish. Carbon dioxide gas is a relatively safe and effectivebacteriostatic agent which has been used for the preservation of freshmeats, poultry and produce since the 1930's Baker et al., 1986;Wolfe, 1980!. A number of studies have reported that a CO2-enrichedatmosphere can have a beneficial effect on the shelf life of variousseafoods. Barnett et al. �982! found that Pacific salmon stored inan atmosphere containing 90'X C02 were still acceptable up to 21 daysat O'C. Rock cod fillets in 80I C02 had lower levels of ammonia andtrimethylamine TMA!, as well as lower bacterial numbers, in compari-son to samples stored in air Mokhele et al., 1983; Brown et al.,1980!. Cod Cann et al., 1983!, haddock Stansby and Griffiths,1935!, swordfish Lannelongue et al., 1982!, turbot Gauthier et al.,1986!, shrimp Layrisse and Matches, 1984! and crab Parkin and Brown,1983! have also been reported to have improved keeping quality �0-200K! under C02-enriched storage conditions.
A previous study by our lab Woyewoda et al., 1984! was unable toshow such a significant improvement in the shelf life extension of codfillets using modified atmosphere storage. Inadequate exposure of thefillets to the gas mixture may have been a factor. In this study weattempted to maximize the surface area of the fillets exposed to thegas mixture by placing them on support pads. In addition, an initialpressurization treatment was evaluated in an attempt to accelerate theuptake of C02 by the fish flesh.
64

MATERIALS AND METHODS
Fresh Atlantic cod Gadus morhua! fillets were purchased from alocal fish plant the day after catching. They were packed in 10 lbpolyethylene containers surrounded with ice and immediately transport-ed to the laboratory < I h!. Upon arrival, each fillet was trimmedto a weight of approximately 200 g, washed under cold, running tap wa-ter and drained.
Modified Atmos here
The fresh fillets � per bag! were placed on a porous nylon pad�4 x 15 x 0.5 cm! and put in a cryovac barrier bag �0 x 24 cm; 3 milpolyethylene/1 mil nylon with oxygen transmission rate � 88 cc/24 h/100 in2/mil thickness at 25 C, 50Z RH; carbon dioxide transmissionrate 549 cc/24 h/100 in /mil thickness at 25'C, 50Z RH!. Each pack-age was evacuated and sealed with vacuum sealer, back flushed with a60Z C02R20Z 02:20Z N2 gas mixture, inflated and resealed. Half of theMA packaged fillets were subjected to a pressurization treatment,while the inflated bags ware packed in ice, using a retort to facili-tate maximum absorption of the gas mixture by' the fillets. The filletswere pressurized at 45 p.s.i. above normal atmospheric pressure total4 atmospheres! for 1 h. Control fillets were similarly packaged inbarrier bags except that they were filled with air and not pressuri-zed.
All of the bags were stored at 2al C until assessed for qualityat 0, 2, 5, 7, 9, 12 and 15 days.
Microbiolo ical Anal ses
A single bag from each treatment was selected at random each sam-pling day. Thirty gram samples were excised aseptically from each ofthree fillets per bag, diluted in sterile 0.1Z peptone with 0.5Z NaCI w/v! and stomached for I min in a model BA 6021 Stomacher A. J.Seaward; Edmunds, England!. Serial dilutions were prepared and platedin duplicate on Plate Count Agar Difco, Detriot, MI! with 0.5Z NaCIto enumerate total aerobes, anaerobes and psychrotrophs. Lactic acidbacteria were enumerated on MRS agar Difco! with 0.5Z NaCI.
All plates were incubated at 21'C. for 72 h except for the psych-rotroph plates which were held at 7 C for 10 days. The anaerobeplates were incubated in Gaspak anaerobic jars BBL; Cockeyville, MD!.
Trimeth lamina Anal sis
Fifty gram samples were removed from each of three fillets pertreatment and extracted wiht 7.5Z trichloroacetic acid TCA! and anal-yzed for trimethylamine according to the method of Dyer �945!.
Surface H Determination
Surface pH measurement of the fillets were obtained using an
65

Orion surface pH electrode and Acument pH meter. pH values were ob-tained for at least two sites on each side of the fillets.
Dri Measurement
The volume of fluid released upon storage of the fillets wasmess~red by pouring the liquid into a graduated cylinder as each bagwas opened. Drip was expressed as a percentage of the initial weightof the filletd'.
Raw alit Gradin
Raw fillets were judged for overall' acceptability by four expertgraders on each sampling day according to the following scheme:
1. excellent
2. highly acceptable3. low acceptability4. reject
Taste Panels
An informal taste panel evaluation of the fillets was carried outby four expert graders. On each sampling day, two fillets from eachpack were removed, wrapped in plastic film, placed in 1 lb cardboardpackages and stored at -30'C until evaluated approximately one weekafter the 15th day!. For each session the fillets were thawed, wrap-ped in aluminum foil and baked at 230'C for 15 min. Each panelist re-ceived four samples, along with a fresh reference sample R!. Thereference samples were untreated fillets frozen at -30 C on day 0 ofthe study. The panelists were asked to compare the samples to thereference on the basis of flavour and overall acceptability.
RESULTS AND DISCUSSION
Those fillets stored in the presence of the C02-enriched modifiedatmosphere MA/MAP! were found to have significantly lower total aero-bic plate counts TAPC! than the controls packaged in air Fig. 1!.The TAPC of the controls exceeded 10~ colony forming units per gram cfu/g! after 5 days at 2'C, while the MA/MAP stored fillets required15 days to reach this level. The TAPC for the pressurized and non-pressurized MA stored fillets were not statistically different whichsuggests that the pressurization treatme'nt did not enhance the bacter-iostatic effect of the C02 gas.
The psychrotroph counts results not shown! were similar to theTAPC for each group of samples indicating that those counts obtainedat the mesophilic temperature were representative of the numbers ofbacteria capable of growth during the storage of the fish at 2'C.
The major safety concern with the use of modified atmosphere pac-kaging is the potential it has for creating conditions favourable foranaerobic bacteria. The growth and toxin production of Clostridiumbotulinum is of particular concern Hintlian and Hotchkiss, 1986!.
66

2 4 6 8 10 12 14 16STORAGE DAYS
FIG. l. Total aerobic bacterial counts on cod fillets at 2 C. ~ , Nodifiedatmosphere with pressurization NAP!; g , modified atmosphere NA!;p , air control AC!.
Q 0 2 4 6 8 10 12 14 16STORAQ E DAYS
FIG. 2. Anaerobic bacterial counts on cod fillets at 2 C. ~, Nodifieda mosphere with pressurization NAp! g mod'f' ~ t h mo i ied atmosphere NA!;
air control AC! .

The results for the anaerobic bacterial counts showed that those fil-lets stored in the presence of 60X CO2:20X 02:20X N2 MA/MA! had lowercounts than the control fillets on each sampling day Fig. 2!. Thereduction of anaerobic counts was probably a result of the bacterio-static effect of C02 and the relatively high concentration of 02 �0X!which was used.
A number of studies of meat, poultry and fish stored under modi-fied atmosphere conditions have noted a shift in the microflora fromprimarily gram-negative bacteria to a the predominance of a gram-posi-tive flora, especially' lactic acid bacteria Lannelongue et al., 1982;Enfors et al., 1979; Sanders and Soo, 1978!. The lactic acid bacteri-al LAB! counts were generally found to be lower for the fillets pack-aged in the CO2-enriched environment than the controls Fig. 3!. How-ever, the LAB counts of the MA/MAP fillets increased steadily after 5days and their numbers at 9 days 10 cfu/g! was at the same level astheir total aerobic counts at 9 days. These results indicate that themicrobial flora of the MA/MAP samples had indeed shifted towards apredominance of LAB during the latter part of the storage period.Conditions which are selective for the growth of LAB can be beneficialsince members of this group are capable of inhibiting the growth ofother types of bacteria which contribute to spoilage Roth and Clark,1975!. It has been suggested that high numbers of LAB contribute tothe beneficial effect of C02 on the shelf life of meat and seafood.
Chemical analysis of fish quality consisted of the measurement oftrimethylamine TMA! production. TMA is a bacterial breakdown productof trimethylamine oxide TMAO!. Based on an unacceptability level of15 mg TMA-N/100 g Voyewoda et al., 1984! the control fillets wereconsidered spoiled at day 9 while the MA/MAP fillets took at least 15days to reach this level Fig. 4! ~
One of the theories concerning the mechanism by which CO2 inhib-its bacterial growth, is the formation of a weak organic acid carbon-ic acid! on the surface of the flesh which lowers the substrate pH Stathan, 1984!. This was not found to be the case in this study.Measurement of the surface pH failed to show any dramatic decrease inpH which might account for the bacterial inhibition by C02 Fig. 5!.This is probably a result of the high buffering capacity of the fishflesh.
Storage of fish muscle in high concentrations of CO2 has beenreported to cause excessive drip Fey and Regenstein, 1982; Villemureat al., 1986!. Fish stored in the presence of 60X CO2 did have higherdrip losses, particularly on day 12 and 15, than the controls Fig.6!. However, at no time during this study did the drip exceed 5 per-cent of the total weight, and would not be considered excessive.
The raw quality grading overall acceptability! was consistentwith the TMA values. The control fillets were judged to be spoiledafter 9 days, while the MA/MAP fillets were acceptable up to and in-cluding day' 15 Fig. 7!. The taste panel assessments data not shown!of the samples were also in agreement with the raw grading scores andTMA values.
68
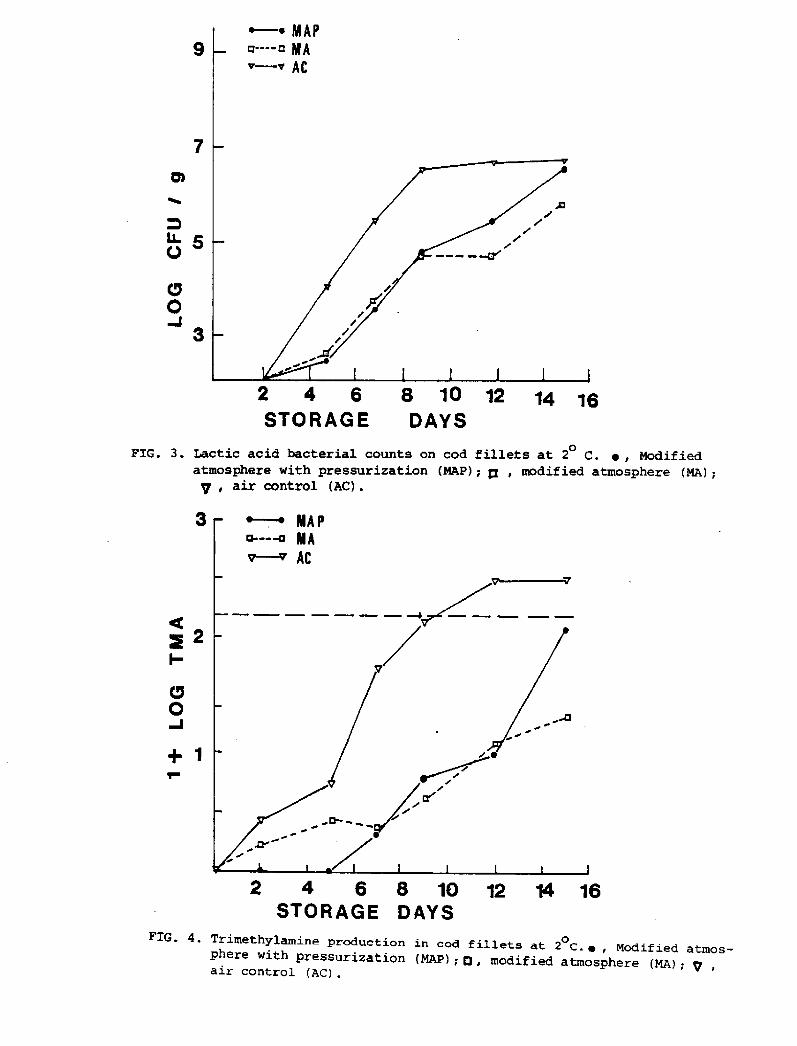
0
0 3 2 4 6 8 10 12 q4STORAGE DAYS
0FXG. 3. Lactic acid bacterial counts on cod fillets at 2 C. ~ , Modifiedatmosphere with pressurization NAP!; p , modified atmosphere W!;
a ir contro 1 AC ! ~
2I-
Q
0 2 4 6 8 10 12 A 16STORAGE DAYS
FIG ~ 4 Trimethylamine production in cod fillets at 2 C. ~, Nodified atmos-0
phere with pressurization MAP!; g, modified atmosphere MA!;air control AC!.

2 4 6 8 10 12 14STORAG E DAYS
FXG. 5. Surface pH values of cod fillets at 2 C. ~ , Modified atmosphere with0
pressurization MAP!; g, modified atmosphere NA!; y, air control AC!
10
~a
a~ 2 4 6 8 10 12 14 16STORAGE DAYS
FIG. 6. Drip production as percentage of initial weight of cod fillets at 2 C.~, Modified atmosphere with pressurization NAP!; p, modified atmosphere NA!; y, air control AC! .
70

4 Q
4 6 8
STORAGE DAYS
FIG. 7. Raw quality grading of cod fillets at 2 C l � excellent; 2 � highly ac-ceptable; 3 � low acceptable; 4 - reject! . e Modified atmosphere withpressurization MAP!;g , modified atmosphere NA!; ~, air control AC! .

CONCLUSIONS
The M.A. of 60X CO2:20X 02: 20X N2 was effective at reducing tot-al aerobic bacterial counts.
The M.A. did not appear to enhance the growth of anaerobic bac-teria.
2.
Lactic acid bacteria appear to predominate in M.A. packaged fil-lets.
3.
Trimethylamine production was inhibited by the M.A.4 ~
M.A. did not cause a significant decrease in surface pH of fil-lets or result in excessive drip ~
Sensory evaluation generally confirmed the beneficial effect ofthe M.A. as indicated by reduced bacterial counts and TMA produc-tion.
6.
There was no significant difference between pressurized and non-pressurized M.A. packaged fillets.
7.
REFERENCES
Baker, R.C., R.A. Qureshi and J.H. Hotchkiss 1986. Effect of ele-vated level of carbon dioxide containing atmosphere on the growthof spoilage and pathogenic bacteria at 2,7 and 13'C. PoultrySci. 65:729-737.
Barnett, H.J., F.E. Stone, G.G. Roberts, P.J ~ Hunter, R.W. Nelsonand J. Kwok 1982. A study in the use of high concentration of C02in a modified atmosphere to preserve fresh salmon. Mar. Fish.Rev. 44�!:7-11.
2.
Brown, W.D., M. Albright, D.A. Watts, B. Heyer, B. Spruce andR.J. Price 1980. Modified atmosphere storage of rockfish
Food Sci. 45:93-96.
Cann, D.C., G.LE Smith and N.C. Houston 1983. Further studies onmarine fish stored under modified atmosphere packaging. Aberdeen:Ministry of Agriculture. Fisheries and Food.
Dyer, W.J. 1945. Amines in fish muscle I. colorimetric determina-tion of trimethylamine as the picrate salt. J. Fish. Res. Bd.Can. 6:351.
Enfors, S.O., G. Molin and A. Ternstrom 1979. Effect of packagingunder carbon dioxide, nitrogen or air on the microbial flora ofpork stored at 4'C. J. Appl. Bacteriol. 47:197-208.
6.
7.
Gauthier, S., R.E. Simard and J. Amiot 1986. Conservation en vracdu fletan du Groenland {Reihardtius hi o lossoides! sour atmos-phere modifiee. Can. Inst. Food Sci. Technol. J. 19{5!:249- 253.
72
Fey, M.S. and J AM. Regenstein 1982. Extending shelf life of freshwet red hake and salmon using C02-02 modified atmosphere andpotassium sorbate at 1'C. J. Food Sci. 47:1048-1054.

9.
10.
12.
13 '
14.
15.
16.
17.
18.
19.
20.
21 ~
Hintlian, C.B. and J.H. Hotchkiss 1986. The safety of modifiedatmosphere packaging. A review. Food Technol. 40:70-76.
Lanngelongue, Meg G. Firms, M.O. Hanna, R. Nickelson and C.Vanderzant 1982 ' Microbiological and chemical changes during~ torsga o! swordfish ~X1 hiss gladius! steaks in retail packagescontaining C02-enriched atmospheres. J. Food Prot. 45:1197-1203.
Layrisse, M.E. and J.R. Matches 1984. Microbiological and chemi-cal changes of spotted shrlnp Pandalus ~lat ceres! stored undermodified atmospheres. J. Food Prot. 47�!:453-457.
Mokhele, Ksg A. Johnson, E. Barrett and D.M. Ogrydziak 1983. Mi-crobiological analysis of rock cod Sebastes ~s .! stored underelevated carbon dioxide atmospheres. Appl. Environ. Microbiol.45�!:878-883.
Ogrydziak, DE M. and W.D. Brown 1982. Temperature effects in modi-fied atmosphere storage of seafoods. Food Technol. 36:86-96.
Parkin, K.L. and W.D. Brown 1983. Modified atmosphere storage ofdungeness crab Cancer ~ma later!. J. pood gci. 48:378 374.-
Roth, L.A. and D.S. Clark 1975. Effect of lactobacilli and carbondioxide on the growth of Microbacterium thermos hactum on freshbeef. Can. J. Microbiol. 21:629-632.
Sanders, E.H. and H.M. Soo 1978. Increasing shelf life by carbondioxide treatment and low temperature storage of bulk pack freshchickens packaged in nylon/surlyn film. J. Food Sci. 43:1519-1523.
Stansby, M.E. and F.P. Griffiths 1935. Carbon dioxide in handlingfresh fish haddock}. Ind. Eng. Chem. 27:1452-1458.
Stratham, J ~ A. 1984. Modified atmosphere storage of fisheriesproducts: The state of the art. Food Technol. Austral. 36�!:233-239.
Villemure, Geg R.E. Wimard and G. Picard 1986. Bulk storage ofcod fillets and gutted cod Gadus morhua! under carbon dioxide at-mosphere. J. Food Sci. 51�!:317-320.
Wolfe, S.K. 1980. Use of CO- and C02-enriched atmospheres formeats, fish and produce. Food Technol. 34�!:55-58.
Woyewoda, A.Deg E.G. Bligh and S.J. Shaw 1984 ' Controlled andmodified atmosphere storage of cod fillets. Can. Inst. Food Sci.Technol. J. 17:24-27.
73

PURIFICATION OF OMEGA - 3 FATTY ACIDS FROM
FISH OILS USING HPLC.' AN OVERVIEW
Judith Krzynowek, Daniel L. D'Entremont,Laurie J. Panunzio and Richard S. Maney
National Marine Fisheries Service, NOAA, NEFCGloucester Laboratory, 30 Emerson Avenue
Gloucester, MA 01930
INTRODUCTION
The National Marine Fisheries Service NMFS!, and the NationalInstitutes of Health NIH! have entered into a joint research venturewhich is anticipated to span the next decades The agreement assuresresearchers, who are studying the therapeutic value of fish oils, asource of fish oils and fish oil concentrates produced and qualitycontrolled/quality assured by the NMFS Charleston SC Laboratory. TheNMFS laboratories at Gloucester, MA and Seattle, WA were tasked to finda method for the production of highly purified fractions of the twoma]or fatty acids of interest to the medical community, eicosapentaenoicacid EPA! and docosahexaenoic acid DHA! ~ This paper offers someconsiderations for the separation of the ethyl esters of these and threeother fatty acids at !90X purity using reverse phase high performanceliquid chromatography.
RESULTS AND DISCUSSION
The stationary phase of choice for the separation of fatty acideaters is a hydrocarbon C18! bonded to a solid support Scholfield,1975, Wille et al, 1987, Tokiwa, 1981, Bascetta et al, 1984!. Columnsprepacked with this packing are available through several suppliers.Columns 1 and 2 Table 1! are examples of the columns obtained from twodifferent suppliers. Columns with small pore size solid support, suchas Column 1 with 8 micron pore size, have greater resolution and higherpurity of eluted fractions than columns with larger pore sizes such asColumn 2 with 20-30 micron pore size. Purities are given as percent ofthe total fatty acids as determined by capillary GLC analyses.Therefore, impurities in the fractions are other fatty acids.
Solvent choice depends on desired purity and end use of the elutedfractions Ethanol and water are the solvent system chosen for thisresearch, because they are food grade materials. This is aconsideration for an end product which might be consumed by humans. The
74

Table 1. Purity of eluted EPA/DHA fractions from a feedstock of57X EPA/31X DHA using different solvent systems onan analytical column.
XEPA/XDHASolvent
Column 1
8pColumn 2
25@
99/8997/87
THF/NeOH/H20EtOH/H20
99/9598/92
The greater the concentration of EPA, and DHA in the feedstock, thehigher the purity of the elured EPA and DHA Table 2!. We are workingwith a feedstock which has been highly concentrated in EPA and DHA byurea fractionation at the Charleston Laboratory and contains almost 50XEPA and 25X DHA. When using a feedstock furnished by the SeattleLaboratory, which has been cycled through their super -critical C02system and is 79X EPA or 79X DHA, purities of close to 100X can berecavered.
Table 2 ~ Purity of eluted EPA/DHA using THF:methanol:water as thesolvent system on an analytical column with differingpurity of feedstock.
XEPA /XDHAFeedstock Kluant
32/1957/31
79X EPA79X DHA
99/8299/89
99.9X EPA96X DHA
75
solvents require no special handling or waste disposal measures and donot oxidize. If, however, none of these considerations is of impart toa particular application, tetrahydrofuran THF!, methanol, and water willyield higher purity fractions of EPA and DHA Table 1! ~ THF ispotentially explosive and requires special OSHA considerations for itssafe handling and waste disposal, is toxic, as is methanol, and oxidlzesreadily, which is undesirable when in contact with fish oil which isprone to rapid oxidation-

If purity is of. paramount importance, peak slicing isrecommended. The back sides of the eluted peaks yield the highestpurity. This is definitely the case with DHA Figure lb!.
Time
i so min.
Figure l. HPLC separation of fish oil concentrate �8X/24X, EPA/DHA!using ethanol:water on a.! analytical columnn, b.!preparative column, and c.! production column.
76

The first portion of the eluant can be discarded in favor of the higherpurity eluant at the end of the separation. Yields are sacrificed topurity in this mode of collection. Yields of about 70X are the normwhen collecting the entire peak.
The column size and loading will depend on productionrequirements. Five fatty acids have been successfully separated onanalytical, preparative, and production scale columns Figure 1!.Production requirements for the analytical scale are 20mg of fish oil ata flow rate of 3ml/min with a run time of 25 min. On a preparativecolumn, 10 grams can be loaded at a flow rate of 50ml/min with a runtime of 65 min. On a large column, 60g were successfully separated at250ml/min. with a run time of 180 min.
This report is intended as an overview of the possibilities forHPLC in the production of high purity fractions of EPA and DHA. Capitalequipment costs for fully automated sample injection and fractioncollection systems range from $28K to $120K. There are obviously a widerange of options, including the imaginative deployment of multiple smallsystems, to achieve desired production goals.
Bascetta, E., Gunstone, F.D., and Scrimgeour, C.M., 1984. Thepurification of fatty acid methyl esters by high pressure liquidchromatography. Lipids, 19�0!:801 -803.
Scholfield, C.R., 1975 ' High performance liquid chromatography of fattymethyl esters: Preparative separations. Anal. Chem. 47 8!:1417-1420.
Tokiwa, S ~ , Kanazawa, A. and Teshima, S., 1981. Preparation ofeicosapentaenoic and docosahexaenoic acids by reversed phase highperformance liquid chromatography. Bull. Jap. Soc. Sci. Fisheries,47�!:675.
Wille, H.J., Traitler, H., and Kelly, M., 1987.Production of polyenoicfish oil fatty acids by combined urea fractionation and industrialscale preparative "HPLC". Revue Francaise de CORPS GRAS, 34�!:69-73.

HEALTH MESSAGES ABOUT SEAFOOD
Joyce A. NettletonNutrition Consultant, P.O. Box 39, Arlington Heights, HA 02175
INTRODUCTION
Enthusiasm about the health benefits associated with consuming omega-3fatty acids from seafoods has generated media attention, marketingflamboyance and new product development, especially fish oil concentrates�-7!. Processors and retailers, usually hesitant to tout health benefitsof foods are finding health a handy hook for promoting seafood B!.Nutrition has never had it so good 9!. Nutrition information and healthmessages are currently flourishing in a sea of regulatory leniency andpublic confusion. Yet, in spite of or perhaps because of the hype, wherethere is still mass misunderstanding of basic nutrition issues, asfundamental as total fat intake for example, seafood is enjoyingunprecedented publicity and vigorous demand. It is the latest "healthf ood" �0!.
By and large, consumers seldom select foods primarily for their healthbenefits. Quality and convenience consistently outrank nutrition asreasons for a purchase decision. Yet new awareness of the fact thateating seafood is good for you, wider availability of fresh seafood andimproved seafood retailing are all contributing to an increased demand forseafood in supermarkets and restaurants. Presumably, bold health claimsare also strengthening the demand for seafood products and supplements�1!.
OBSERVATIONS
Health Claims: Health claims are an important aspect of communicatingnutrition and health information. The permissive climate surroundinghealth claims for foods follows the much ballyhooed Kellogg's bran cerealcampaign �2!. With the endorsement of the National Cancer Institute,which has no jurisdiction over food labels, nutrition or health claims,Kellogg's advertised its bran cereal as an aid to deterring some forms ofcancer. Although many dispute the quality of the data suggesting aprotective effect of dietary fiber against certain cancers, this widelypublicized advertising with its attendant controversy had at least threeeffects. First, it focussed attention on the possible benefits of wisefood choices. In a sense, it made the gravel road between food and healtha paved pathway. Second, it undermined the authority of the FDA toregulate health claims by sidestepping the usual approval procedures andinvolving another federal agency, The National Cancer Institute. Third.The Kellogg controversy hastened the publication of proposed regulationsfor health messages on food labels.
78

In August, the FDA proposed regulations which set forth criteria forevaluating health claims and information on food labels and point-of-purchase materials �3!. This proposal recognizes the need for greaterdissemination of health and nutrition information pertaining to food.
Advertising Messages: Advertising is a key factor in product marketing.Advertising and labeling communicate image and information about aproduct. Product attributes may be conveyed indirectly by association ordirectly with statements or comparative data. Statements about healthbenefits and nutritive value are frequently misleading or untrue. Takethe example of this ad �4!. Often what is unsaid is as important as whatis stated. Some statements capitolize on consumer confusion or ignorance.For example, the claim that a product is made using only vegetable oilbelies the fact that the oil may be highly saturated or constitutes morethan fifty percent of the energy value of the food.
While the nutritional merits of unprocessed seafood obviate the need foradvertising subterfuge, nevertheless, seafood advertising shares thetroubles of other product categories when it comes to nutrition confusion.Sometimes the facts are wrong, as in the previous example. Sometimes theissue is misunderstood �5!. And sometimes freedom of expression justtells half the story �6!.
Marketing Magic: Marketing magic is another facet of health messages. Anoft repeated bit of folklore regarding omega-3s is that they are presentin cold water fish 8, 1/!. This wi~dom presumably comes fromromanticizing the Eskimo environment or marketing Arctic fish. The factis. all fish and shellfish have some omega-3s. Some have more than othersand some have higher proportions than others even if when the total fattyacid content is fairly low. A person wishing to choose fish for theirabundance of omega-3s however, will find the greatest amounts in theoiliest fish, no matter whether the fish lives in marine or fresh water orboth, as illustrated by tuna, rainbow trout and salmon.
The relationship between total fat content and omega-3 fatty acid contentis illustrated in these scatter diagrams of finfish from the NorthernHemisphere and the Southern Hemisphere �8, 19!.
Experts! Authority figures and experts, like everyone else, make mistakes�0!. Quotes are taken out of context; source material may be out-of-date: and inappropriate extrapolations or conclusions may be drawn �1! ~And if you' re not careful, the fish gets thrown in with the veal �0! ~Understandably, consumers are conf used.
Wishful Thinking and the Application of Imaginary Data: There iscurrently a good deal o'f wishful thinking about omega-3s which is aided bythe application of imaginary data. The publicity being given to fish oilsupplements is an ideal case in point �, 16!. Its advertising ismisleading, the citation of data selective and biased, and it substitutes
79

wish for information. In their rush to cash in on the good news generatedby the Eskimo studies and other clinical data, fish oil promoters havedecided we do not have to to wait for controlled studies. They aresatisfied with results from clinical trials on small numbers of subjects.They have no qualms extrapolating from epidemiological data, some of itvery weak. to giving advice to individuals for the management of bloodcholesterol.
Fish oil supplements are marketed mainly on the assumption that taking themwill lower a person's cholesterol level �6!. In some individuals itmay. In others however, fish oil supplements may have no effect on bloodlipids and in still others they may actually be accompanied by an increasein cholesterol levels. You do not hear about these possibilities from thefish oil f loggers. And we have very little information about the long termeffects of fish oil in diets as rich in total fat as ours.
The sellers of fish oil supplements have also eschewed the need to definea safe and effective dose. Can everyone benefit'? Are benefits availableonly with high doses as some studies suggest? Is long term consumptionsafe in the presence of other medications especially anti-coagulants andaspirin'? Let's face it. caution doesn't sell.
As promising as omega-3 fatty acid research appears. worrisome safetyissues have not been resolved. Processing techniques exist to removevirtually all nasty chemicals that may be present in fish oils. especiallythose from fish liver, but different brands vary in the amount ofundesirable residues that may be present. They also differ in how theyhave been refined. Here is what FDA has found �2, 23!.
These data make it clear that the assumption of adequate refining may notbe justified. The problem with many nasty residues and contaminants isthat just as fish do, we store them in our liver. Amounts that seemvanishingly small on an individual dose basis, may accumulate with longterm supplement use. Presently. a purchaser of fish oil preparations hasno way of knowing whether or not he is enriching his own contaminantreserves.
The FDA studies have also shown that label information is inadequate inother ways. In nearly all samples analyzed the amount of EPA and DHA wasdemonstrably below the level stated on the label, in some instances asmuch as one third below. It would appear that regulatory standards andcareful monitoring are in order.
Guilt by Association: Mhen facts are missing, perhaps a little fear willdo the trick. Call it guilt by association. Fear generated byunsubstantiated claims about the safety of our seafood supply undermineconsumer confidence as surely as reassuring nonsense about nutritional orhealth value. The difference is that the falsity works in differentdirections.
80

Last June. The Coast Alliance, a non-profit public interest group, issueda report with a press release that began:
"The almost unmonitored and unchecked polluting of New England' scoastal waters poses a serious threat to the nation's fish eaters and� ultimately- the sea itself and the life that inhabits it" �4!.
This alarming statement achieved its purpose: the attraction of mediaattention with press articles and media interviews. The issue quickly andquietly died- But how many people turned away from seafood. all seafood~Just when people are re-thinking their red meat consumption they are beingfrightened about the safety of the fish supply.
Let me emphasize that I decry as loudly as anyone the use of any waterwaysas sewers and I recognize the potential threat to health of theseextremely nasty substances but we have very little evidence to suggestthat eating fish will make you ill. In fact. the evidence is just theopposite.
'What is objectionable about this sensationalism is that there is noevidence that people in America are getting ill from the chemicalsunfortunately being dumped into our waterways. We may be living onborrowed time, no doubt. but there is a quantum leap between chemicals inthe waters and illness from eating cooked fish muscle.
Unquestionably people get ill; very ill, from eating seafoods harvestedfrom contaminated waters. But the contaminants that we know make
people sick come from raw sewage. Without doubt, the seafood preparationguaranteed to do the trick is eating such seafood raw. But that is a farcry from a "serious threat to the nation's fish eaters."
SUMMARY AND CONCLUSIONS
In summary. people are becoming aware of the benefits of eating sefood.thanks in part to health claims, advertising, journalism, and retailingactivities. All these endeavors can benefit From awareness of facts,including what we know and don'0 know; refusal to endorse or commissionmythology and wishful thinking. and the avoidance of sensationalismmasquerading as truth.
What to Dos To protect against false claims and misleading or fraudulentadvertising, we as health professionals must ensure that the seafoodbusiness has:
81
1. a clear understanding of the nutrition issues being addressed
2. an understanding of the complexities underlying both health andmarketing issues
3. the facts
Where data do not exist. the seafood industry can support efforts tocommission the appropriate research. They must resist the temptation toinvent the facts they seek or wish.
Lest I leave you with the impression that all seafood and health messagesare fraudulent or misleading, here are some examples that have avoided thepitfalls mentioned above.
l. Responsible !ournalism �S, 26!;2. Facts �7, 28!:3. Health by association �9!:4. Appropriate use of experts.
After all, the data support the health claim implied in the bumper stickerfrom the Massachusetts Division of Harine Fisheries: "Is health yourwish'P Rat more fish."
82

REFERENCES
1. Burros, M. 1985. High-fat fish: Healthful and tasty. The New YorkTimes. May 9.
2. Bishop. J.E. 1985. Eating fish reduces heart-attack risk.researchers assert. The Wall Street Journal. May 9.
3. Winick. M. 1985. Why you should learn to love fish. Woman's Day.December 3.
1986. Glamour Magazine.4.
1987. Wall advertisement in Long Island seafood shop. October.8.
9. 1986. Advertisement for Fishery Products. More fish, lesscalories.
10. 1986. Table tent from University of Maine. Sea Grant. Fish isbrain food.
11. Hales. D. 1986. How fish can save your life. Parade Magazine.November, 9.
1984. Advertisement f or Kellogg's Bran Flakes. October.12.
13. 1987. Food labeling: Public health messages on food labels andlabeling. Federal Register 52: 28843, August 4.
14. 1987. Advertisement f or catf ish. Seaf ood Business.September/October.
15. 1986. Advertisement for fish sausages. Seafood Business.November/December
1987. Advertisement for new Proto-chol. Seafood Business.16.
17, 1986. Living off the fat of the sea. Consumer Reports. June.
18. Hepburn, F.H., J. Exler, J., and J.L. Weihrauch., 1986. Provi-sional tables on the content of omega-3 fatty acids and other fatcomponents of selected foods. J. Am. Diet. Assoc. 86:788-793.
83
5. Rovner, S. 1986. Fish oil's new fame. Washington Post. March 26.
6. 1986. Advertisement f or Proto-chol. Boston Globe. October 26.
7. 1986. Advertisement f or MaxEPA. American Health. November.

19. Nettleton, J. 1985. Seafood Nutrition: Facts, Issues and Marketingof Nutrition in Fish and Shellfish. Osprey Books, Huntington, NY.
20. Brody, J.E. 1987. Separating fats from fiction. The Good HealthMagazine, New York Times Magazine, March 29.
21. Jenkins, N.H. 1986. More on fatty fish. The New York Times,June 4.
22. Plakas, S.M. and A.M. Guarino. 1986. Omega-3 fatty acids: Is thenews all goo' Proceedings of the Eleventh Annual Tropical andSubtropical Fisheries Technological Conference of the Americas 11:275-283
23. Guarino, A.M. 1987. Composition of commercially available fish oilcapsules. J.Am. Oil Chem. Soc. 64: Abs.
24. Coast Alliance. 1987. Press release. Washington. D.C. June 24.
25. Brody, J.E. 1987. Personal health column. The blew York Times.February 4.
26. 1987. Fish oil supplements: Helpf ul or harmful'? GoodHousekeeping, p.70. January.
270 1986. Advertisement for Fishery Products. Flounder continentalsupreme: Waist watcher's dream.
28. Hackman. E. 1987. Shellfish: Heart healthy and low in salt.Richmond Times-Dispatch, March 1.
29. 1987. Creamless salmon mousse and Japanese shellfish soup arelow in Fat and high in nutrients. The New York Times, November 1.

NOMENCLATURE AXD LABELIXG OF FISHERY PRODUCTS
A MARKETIXG DILEMMA
Donald R, Maher, MMFSNational Seafood Inspection Laboratory
Pascagoula, MS
James R, Brooker, NMFSOffice of Trade and Industry Services
Washington, DC
Mary J, Snyder, PDACenter for Food Safety and Applied Nutrition
Washington, DC
This paper will describe the nomenclature problems that ind~stry,government and consumers have in properly identifying fishery products innational and international trade. It also will discuss the steps takenby the Rational Marine Fisheries Service <XMFS!, the Food and DrugAdministration <FDA!, and the Rational Fisheries Institute <%PI! toaddress the nomenclature problem.
PROBLEM IDEMTIFICATIOX
The lack of standardized market name nomenclature in the interstatemarketing system has created confusion at all levels of the market stratafrom processor to the ultimate consumer. The confusion is caused byseveral reasons. The main reason is the variation in common market namesused for a given species from different areas or regions of the countrv.Another problem arises when industry markets a less commercially knownspecies using an existing well-established market name of a moredesirable fish which has a higher value in the market, Still anotherproblem is created when, in some instances, state regulatory authoritieshave authorized the use of a well-established market name <applied andrecognized to a species from another state or region! to be applied to aspecies from a totally different family or genera harvested and marketedin their state,
When such products enter interstate comerce, they are consideredmislabeled by FDA and subject to seizure and legal action as misbrandedproducts. Purther, the lack of standardized market names createsconfusion in the orderly worldwide marketing of United States producedand processed seafood.
PDA POLICY AjtD PROCEDURES FOR DETERMINING ACCEPTABLE COMMON OR USUALMANES FOR FISHERY PRODUCTS
Current provisions of the Pederal Pood, Drug and Cosmetic Act and theFair Packaging and Labeling Act offer guidelines as to the names bywhich fishery products or other foods may be designated. The Act
85

require the label to bear a statement of the identity of the food by itscommon or usual name and prohibits labeling which is false or misleadingin any particular. Where there are no established common or usual namesin the United States, the label must bear an appropriately descriptiveterm informativeLy revealing the identity and nature of the food,FDA considers the question of what constitutes "the common or usualname" or "an appropriate descriptive term" for a food as a name or termin general usage and readily understood by the ordinary individual orconsumer in the United States. Often the common name associated withits systematic biological classification or the common market nameapplied to the species in the country of origin, for an imported fish,is helpful in determining what does constitute an appropriatelydescriptive non-misleading name. Neither the common name applied byichthyologists nor the common name used in another country may be used,however, if it conflicts with the common or usual name used by consumersfor another species in the United States or if it is in any waymisleading to United States consumers.
In qpnsidering whether or not a designation may be misleading, FDA looksto the courts for clarification and guidance as well as to the Act andits regulations. The comments of the Supreme Court of the United States,June 2, 1924, provide such cLarification and guidance. The Courtsaid,"... The Statute is plain and direct. Its comprehensive termscondemn every statement, design, and. device which may mislead ordeceive. Deception may result from the use of statements nottechnically false or which may be literally true. The aim of thestatute is to prevent that resulting from indirection and ambiguity, aswell as from statements which are false. It is not difficult to choosestatements, designs, and devices which will not deceive, Those whichare ambiguous and liable to mislead should be read favorably to theaccomplishment of the act..."
FDA in considering the question of what constitutes an appropriate labeldesignation for a seafood, must determine appropriateness based on thebasic facts in each instance. Actually determining an acceptable namewhere none previously exists is not easy. It is much easier, however,than the problems encountered when FDA is called upon to settle acontroversy concerning the name to be used throughout the United Stateswhen the same fish is known by a different name in different parts ofthe country.
Another problem arises when people wish to market a Less well known orless commercially acceptable fish under the name of a more desirablefish. Vhen called upon to settle controversies or when asked forguidance in developing acceptable names for seafood, FDA looks toseveral areas for resource material. The main resource for nomenclatureof fish found in this country is currently the 4th editfog <1988! ofCommon and Scientific Names of Fishes from the United States and Canada,published by the American Fisheries Society. Should the fish not be
86

indigenous to lorth America, or if it is some other type of seafood,recognized experts such as those at the Smithsonian Institution inWashington, D.C. or the Rational Marine Fisheries Service may becontacted.
Also, the FDA refers back to previous correspoadeace relatiag to thespecific issue ia which a precedence has been established for aparticular species.
Vhea workiag with controversial problems, it would be desirable to havean established standardized market name for every type of fisheryproduct. However, since this luxury is not yet available, each issuemust be decided on a case by case basis on its owa merit. To illustratethis yoiat, FDA often receives requests to label fish other thanLut anus cam chanus as "Red Snayper," The name "Red Snapper," however,has been preempted by many years of consistent consumer usage as meaningonly the fish Lut anus c echaaus. Because of the high esteem ia whichthis fish is held by consumers and the relatively limited catch,numerous attempts have been made to substitute other less exyeasive fishfor this syecies. Substituted, less desirable species have includedother members of the family Lutjaaidae, groupers, and a number of VestCoast roohffsh of the genus ~gehast s. The gest Coast rochftsh have,until recently, been distributed locally and thus have been beyond thereach of the Federal Pood, Drug and Cosmetic Act ~ Some of the states onthe Pacific coast have officially sanctioned. "Pacific Red Snapyer" or"Pacific Snappers" as an alternative name for such members of Sebastesgenus. These fish are quite different from Lut anus cam echanus RedSnapper! in appearance, flavor and texture, and. are generally regardedas inferior by consumers familiar with Lut anus cam chanus. Thecurrent policy of FDA is that the labeling or sale of any fish otherthan Lut anus cam echanus as "Red Snapper" constitutes a misbranding inviolation of the Federal Food, Drug aad Cosmetic Act. Further, labeliagof rockfish as "Pacific Red Snapper" is acceptable only in those VestCoast states which have sanctioned that term,
Economic deceytion is aot the only problem connected with misaamedseafood. Sometimes issues of public health are very much involved,As reported in the FDA Consumer July-August 1982 issue> ia l982, theHealth Department of Ulster County, XY, reported to FDA a double mysterywhen it asked the agency to assist ia an apyarent incident of foodpoisoniag. The first questioa: Vhy did two men become ill shortly aftereating a fish dinner at a restaurant'? The answer: The two weresuffering from scombroid poisoning, a severe gastric illness resultingfrom eating fish containiag high quantities of the comyound histamine,After the diagnosis, the Health Department placed the large lot of fishstill remaining at the premises of the dealer who had supplied therestaurant under embargo. Aa analysis of the fish from the restaurantand the dealer showed the presence of histamine, with the sample fromthe restaurant containing the highest amount. The second question thea
87

arose: Vhy did the fish shown on the menu as "Red Snapper," an oceandelicacy, have high levels of histamine, unusual for this kind of' fish'?The answer: It was not "Red Snapper," but Nahi-Nahi in a fish taken offthe Pacific coast of South America. Nahi-Nahi is so predictably high intoxic histamine that FDA samples and examines each lot imported into theUnited States or automatically detains it upon entry.
The FDA found that the fish mislabeled "Red Snapper" had been shippedfrom Ecuador and, processed in Panama. Had the fish been labeledNahi-Nahi, it would never have made it ashore since FDA has an automaticdetention for Nahi-Nahi from Bcuador.
Vhile consumer usage has given a narrow meaning to some common fishnames, other names have come to identify more than one species. Anexample is the term "Sardine," Commercially the name "Sardine" has cometo signify almost any small, canned clupeoid fish, To avoid confusion,FDA recommends that all "Sardines" bear labels showing the place whereproduced and the nature of the ingredients used in preserving andflavoring the product. Thus, a small fish of the clupeoid family, caughtupon or near the shores of Norway and packed in oil, or smoked and packedin oil, is properly labeled with the phrase Norwegian Sardines in Oil,"or Norwegian Smoked Sardines in Oil" with the type of oil beingdesignated. It also is suggested that the particular fish to which theterm sardine is to be applied should be placed upon the label, forexample, "Pilchard," "Herring," etc. Also, not all fish of the familyClupeidae are entitled to be called "Sardines," Nany members of thisfamily have well established identities of their own, i.e, Scotchherring, Polish herring, Alewives or River herring, and others. FDAwould regard the labeling of these other fish as "Sardines" asmisbranding and in violation of the Federal Food, Drug and Cosmetic Act.
In addition to its regulations, FDA also issues policy statements toprovide and identify appropriate designations for seafood, These policystatements are issued as official "Compliance Policy Guides and ImportAlerts," To date they have been issued to cover caviar, crabmeat, commonor usual names of crustaceans, capelin versus smelt and red snapper.
A number of seafood items are also covered by standards of identity,or common or usual name regulations. Standards of Identity exist forvarious styles of pack of oysters, salmon, shrimp and tuna. Common orusual name regulations have been established for Pacific whiting,bonito, crabmeat, Greenland turbot and several other seafood items.
Vhen interested parties wish to receive an opinion from FDA as to anacceptable name to use for a seafood item <or any other food item underFDA jurisdiction!, they may ask for an informal opinion. Generally thisonly involves correspondence between the party and either one of the FDAfield offices or the Division of Regulatory Guidance in the Center forFood Safety and Applied Kutrition formerly the Bureau of Foods!, Amore formal response may be requested in the form of an advisory opinion
88

which will carry the designation of official ageacy policy, Anyone mayfile a citizen's petition to establish a new regulation such as aStandard of Identity. More likely in the case of seafood names, apetition may be filed to propose or amend an existing regulation for acommon or usual name. Often there is a difference of opinion about theappropriate commoa or usual name of a food. Por example, a newengineered seafood, such as imitation crab, may not have a common aame,or a species of seafood which has aot previously been offered as food inthis couatry may not have an English name, !n such cases, PDA welcomessuggestions for appropriate common or usual names. These suggestionswould most likely be ia the form of a citizen's petition, The namessuggested should be descriptive of the food and aot be misleading ordeceptive. The names should represent the new food rather than besuggestive of the name of aaother already accepted food,
NATIONAL MARINE FISHERIES SERVICE POLICIES AND PROCEDURES FORDETERMINING COMMON OR USUAL NAMES POR FISHERY PRODUCTS.
Currently individuals or firms caa request guidance from the NXFS iaestablishing an acceptable or preferred common name for a speciesdescribed by its scientific name. After the request is made, the NMFSwill check to see if the species is listed ia the American FisheriesSociety's "List of Commoa aad Scientific Names for Fishes from the UnitedStates and Caaada," or in FDA's precedeace letter files. If the speciesis not listed in these sources, the iMPS will work with PDA's Divisionof Regulatory Guidance to determine an acceptable common or usual nameaad/or market name for the species,
To date, NMFS policy has been to eacourage'the industry to voluntarilycomply with all federal and state laws and regulations as they relate toproperly labeled fishery products, In an effort to aid the industry tocomply with such laws ia the most equitable manner, the agency continuesto develop closer working relationships with FDA in all areas of foodsafety and labeling,
THE NATIONAL IDENTIFICATION AND LABELING PROGRAM PLAN POR PISH ANDFISHERY PRODUCTS
The increasing demand for both foreign and domestic fishery productswill only continue to aggravate an already existing nomeaclatureproblem. For example, at the consumer level, where acceptance of fisheryproducts is of major importance, fishery product labeling can beconfusing and sometimes misleading, Furthermore, the majority ofconsumers will not be likely to spend the time to inform themselves aboutthe increasing number of species now available ia the retail marketplace,
!n view of these current and certainly inevitable future difficulties,the Natioaal Marine Fisheries Service NMFS!, the National Fisheries
89

Institute IFI!, and the Food and Drug Administration FDA! haveundertaken a comyrehensive project that will aid in resolving futurenomenclature problems. The primary objective of this project is todevelop aa imyroved nomenclature system and standardize market names forfishery products.
The final result of the project will be to implement an improved seafoodproducts identification program which should yield two importantbenefits:
�! A plan designed to build consumer familiarity andacceptance of seafood products which will promoteseafood consumptioa, and
�! a plan which will provide a comyrehensive identity andlabeling framework which will yrovide the tools needed forvoluntary compliance by both industry and government,
The national program on seafood product ideatification has the followingcomponents:
I. HPS, FDA and USDA Study Grouy � Coordination aad Regulatory Task:
Through an established Interagency Study Group at the agency'sheadquarters levels, review aad propose resolutioas to complexseafood labeling issues for consensus decision making by XXPS,FDA and United States Deyartment of Agriculture USDA! policymakers.
There is no specific budget for the study group and the issuesto be addressed will be those provided from various sources asidentified.
RfFS Contact Person: James R. BrookerNational Marine Fisheries Service1825 Connecticut Aveaue, K.V.Vashington, DC 28235
II. Official List of FDA/NFS Approved Market Names for FishesDevelopment Project:
Develop, publish, distribute aad maiatain a list of acceytablemarket names of food fish syecies for use by government, industryand consumers,
CURREfT STATUS:
Vork on the list is almost completed and is scheduled for release asa joint FDA/INFS Interim Guideline in the Federal Register early
90

1988 as a notice of availability for use aad comment by allinterested parties. It is proposed at this time to be available forpublic comment and use for a period of six months.
Contact Persons: Donald R. Maher, INFS Project Leader, EatioaalSeafood Inspection Laboratory Pascagoula, NS
Mary Snyder, FDA Project Leader, Divisioaof Regulatory Guidance, Center for FoodSafety and Applied Nutrition, Vashington, DC
Mibility Data Bank � Research Project:
Test the major U.S. food species aad establish edibility profilesfor each species. Publish the profiles for industry and consumeruse aad publish the protocol and test methods as the formalmethodology for determining the edibility characteristics ofspecies. The edibility profiling of species is carried out at theRFS technology laboratories in Gloucester, MA, Charleston, SC, andSeattle, VA,
CURRKfT STATUS:
Work has been completed on about 188 species, and others are beingcompleted as species are identified and made available for testing.
Contact Person: John Vekell, Project Coordinator, SeattleLaboratory, Seattle, VA
Universal Product Code for Seafood � Development Project:
Develop and implement a staadard nomenclature aad numbering systemfor random weight fish aad fishery products sold at retail forinclusion ia the Universal Product Code System.
The project is being executed uader a multi-year PY86, 87 aad 88!S-K Grant NA 85AAHSK145, by iFI's I'ational Fisheries Education aadResearch Foundation.
CURRHT STATUS:
Vork on schedule with coatract requirements.
Principal Investigator: Robert Collette, XFI, Vashingtoa, DC
Technical Moaitor; James R, Brooker, IMFS, Washington, DC
As part of this program the project leaders for the "Official List ofFDA/USDC Approved Market Names for Fishes" have provided the Foundation
91

a draft list for food fish containing some 1888 commercial food fish, ofworld wide distribution, which are marketed in the United States.
COXCLUSIOX
The National Marine Fisheries Service considers that the successfulcompletion of all phases of the Ifational Identification and LabelingProgram Plan for Fish and Fishery products will �! provide a systemcontaining the framework and tools necessary for increasing consumerawareness and wider usage of fish and fishery products, �! will provideboth industry and government with a tool for orderly marketing throughstandardized market names and eliminate conflicts between governmentregulatory agencies and industry in interstate commerce, �! willprovide a mechanism for authorizing and approving market names for fishand fishery products traded in national and international commerce and�!,most importantly, the program will provide the ultimate consumerwith properly identified products in the retail market.
While the competitive nature of the food. industry will continue toproduce nomenclature problems, the successful completion and publicationof the "National Identification and Labeling Manual for Fish and FishervProducts" should provide both government and industry with the toolsrequired to resolve these problems.
92

APPENDIX 1
PRINCIPLES DEVELOPED AND USED BY FDA AND K%FS 15 SELECTING ACCEPTABLECO� ON MARKET NAMES
The principles developed by the NMFS and FDA ia selecting common aadmarket names for each species are listed ia order of priority asfollows:
1, The list shall be a compeadia of existiag scientific, common aadmarket names for food fish, shellfish and fishery products only.Common and scientific names shall aot be originated for thislist,
2, The "American Fisheries Society's AFS! List of Common andScientific Names of Fishes and Aquatic Invertebrates fromthe United States and Canada" shall be the primary authorityfor scientific and common names of fishes aad shellfish. Iathe absence of an AFS assigned. scientific and common name otherauthorities will be used in the followiag priority of use:
o FAO Species Catalogues aad/or SpeciesIdentification Sheets.
o Source country primary authority for scientific andcommon names of fishes,
3. The Food aad Drug Administration and the NMFS jointly shall bethe authority for the market names of fish aad fishery products.
4. The National Oceanographic Data Center shall be the authorityfor the twelve �2! digit Taxonomic Code assigned to eachspecies.
5, Market names shall reflect broad, current, and appropriate usageof vernacular nomenclature in the labeling of food fish,shellfish and fishery products that will add to stability andthe universality of names applied to food fish and fisheryproducts,
6. Market names are established for a! individual species, and b! species grouped together that are recognized in trade andcommerce, and by consumers as having similarities, such asedibility characteristics, that make them indistinguishablefrom each other as products for human food purposes.
93

V. k market name representing multiple species will apply oaly atscientifically discrete levels of taxonomic classification,however, it may also comprise multiple species classified in twoor more families aad/or genera.
8. Individual species within a family or genus for which a marketname has beea established may be identified more precisely bythe addition of a "modifier" to the market name when conditionsor unique characteristics warrant more precise identificationof the product. Reasons and conditions for more preciseidentification follow:
o Prior grandfather! labeliag regulations,
o Demonstratively significant characteristics for foodpurposes! which distinguish one species ia commercefrom other closely taxoaomically! related species.
9. Species for which there are no acceptable aad assigned commoanames in the English language will bear the market name ia usefor other taxonomically similar species until such time as amore precise market name is assigaed. Reasons aad conditionsdetailed in Item 7 shall prevail in assigning more precisemarket names.
18. Fish and fishery products iateaded for use as food may beareither the assigned market name or the complete common name ofthe species on the label.
94

THE GOLDEN CRAB GERYON FENNERI! FISHERY OF SOUTHEAST FLORIDA
Robert B. Erdman and Norman J. Blake
Department of Marine ScienceUniversity of South Florida
St. Petersburg, FL 33701
INTRODUCTION
The golden crab, ~Ge ron fenneri Manning and Holthuis, 1984! is alarge brachyuran inhabiting the continental slope off the southeastUnited States including the eastern Gulf of Mexico. Prior to itsdescription in 1984, studies in the eastern Gulf of Mexico by Otwell,Bellairs and Sweat �984! examined the potential development of a trapfishery for this species in depths exceeding 210 meters' Various trapdesigns were tested along with methods of on-board handling andprocessing Sweat and Otwell, 1983!; Bellairs and Otwell, 1983!.Particularly attractive was the reported high meat yield of male crabs,ranging from 17 to 23 percent of total body weight.
Interest in the commercial exploitation of golden crab led to threevessels two from Alaska and one from New England! initiating a fisheryalong the west coast of Florida during late 1984. Male crabs werebutchered, cooked and blast frozen at sea. The final product ofclusters. cocktail claws and split legs were delivered frozen to themarket. However, because of marketing problems, compounded by distancesin excess of 100 miles to the fishing grounds, gear loss and the absenceof information on the distribution and biology of this species,commercial operations in the eastern Gulf of Mexico ceased by mid-1985.
In late 1985, continued interest in the commercial potential for G.fenneri led to the initiation of exploratory fishing and research inBermuda Luckhurst, 1986!, South Carolina Wenner and Ulrich, 1986!,Georgia D. Harrington, personal communication! and Florida.Additionally, in late 1985 a small commercial fishery developed alongthe southeast Florida coast with the catch delivered live to a local
market in Ft. Lauderdale, Florida.
In February 1986, se began a study of the bfology of ~Ger on fennerfas collected from this southeast Florida fishery. Reproductive biology,size and weight relationships. trap design and catch per unit effortwere examined to ascertain additional information relative to the studyof this potentially valuable species.
METHODS
Gear previously utilized by the eastern Gulf of Mexico golden crabfishery consisted of deep water long lines of between 30 and 60 trapsattached to a ground line connected via a float line to large floats andradar reflectors on the surface Otwell, Bellairs and Sweat, 1984!.
95

This method requires the capability to retrieve upwards of one mile ofline from depths in excess of 250 meters. Trap designs have includedDungeness crab pots, King crab traps, New England and Florida lobstertraps and plastic Fathoms Plus trays Otwell, Bellairs and Sweat, 1984;Weaner aad Ulrich, 1986!. Three or four trap lines were fished withsoak times averagiag 24 hours between set and retrieval.
Because of the close proximity to shore less thea 10 miles! ofwater depths in excess of 200 meters, the small fishery that hasdeveloped ia southeast Florida employs a differeat strategy inharvesting golden crab. Four to six large traps are attachedapproximately 140 to 180 meters apart to a grouad line which is fittedwith concrete weights on each ead. The large traps called Neilsentraps, measure approximately 6' x 3' x 3' and are made from steel roundstock covered with 2".x 2" nylon stretch mesh Figure 1!. Traps arefitted with 5" diameter escape riage and a large side door providingaccess to the center bait well and easy removal of the catch. Four tosix strings of traps may be fished, with each string reset immediatelyafter it is pulled.
As the present fishing grounds are ad!scent to commercial shippinglanes aad affected by variable currents associated with the Gulf Stream,trap lines are deployed without a surface float system. Lorancoordinates are recorded during deployment along with bottom profilesand relative position using shoreline landmarks. Soak time varies fromthree to six days depending on market demaad. This allows the fishermento pursue other commercial opportunities. Trap recovery involvesgrappling for the ground line, with the vessel moving from offshore toonshore and the grapnel dragged perpendicular to the ground liae.
Samples were collected monthly during the period February 1986through Jaauary 1987 from fishing depths ranging from 215 to 230 meters.Total numbers of crabs caught per trip were recorded in threecategories: females, market size males in excess of 130 mm carapacewidth CW!, and small males less than 130 mm CW. Crabs were randomlyselected from the catch, packed in crushed ice and returned live to thelaboratory.
For each crab, carapace width CW, the distance between the fifthlateral spine tips! and carapace length CL, midline distance from thediastema between the rostral teeth to the posterior carapace edge! wererecorded to the nearest millimeter. Weight was recorded to the nearestgram and missing appendages noted. The presence of eggs in pleopodswere noted and moLt stages were estimated according to a modification of
G. maritae; see Manning and Holthuis, 1981!. Weight-width relationshipsof animals in the intermolt stage aad with no appendages missing werecalculated using a log-log transformation expressed in the form 7 aX
96

97

RESULTS
Throughout the study period, the catch of male crabs greatlyoutnumbered females. Size frequency distributions of 508 males and 347females examined Figure 2! indicates a unimodal distribution for eachsex, with no suggestion of distinct year classes. Males areconsiderably larger than females, with overlap between the largestfemales and smallest males. Carapace vidth of males ranged from 111 to190 mm with a mean of 158 mm, vhereas females ranged from 89 to 156 mmwith a mean of 123 mm. Animals less than 89 mm CW vere not collected,possibly due to bias from trap design and the use of escape rings. Thenarrow range of fishing depths also precluded the collection ofinformation on segregation of sex and size with depth as has beenreported for other ~Ge ron species Byers and Wilke, 1980; Intes and LeLoueff, 1976; Haefner, 1978!.
Monthly size frequency distribution of female crabs is shown inFigure 3. The incidence of ovigerous females collected throughout thestudy period indicates an annual reproductive cycle with a single broodof eggs produced each year. Oviposition begins in late August andcontinues through early October. Eggs are carried for six months untillarvae hatch during late March and early April of the following spring.Eggs are dark purple following deposition, gradually becoming dark brownprior to hatching. Size range of ovigerous females examined ranged from96 to 147 mm CW.
Figure 4 shows the monthly size frequency distribution of malecrabs. Monthly mean carapace widths ranged bet~san 152 and 162 mm;however, the incidence of smaller males decreased beginning in July1986. This decrease in small males coincided with the fitting of alltraps with 5" diameter escape rings. Although data collected precludedstatistical analysis, it was apparent from the overall catch of bothsexes that fewer females and small males were present in traps fittedwith escape rings.
Weight frequency distributions of 262 males and 136 non-ovigerousfemales is shown in Figure 5. Weight of male crabs, ranging from 230 to1930 g with a mean weight of 1116 g 'and greatly exceeded that offemales. Mean weight of females was 449 g, ranging from 207 to 880 g.Although weights of both sexes show a unimodal distribution, the greaterincidence of females in a narrower range of weight classes is due ta thegreat increase in mass associated with developing ovarian stages. Thelargest male examined was 190 mm CW and weighed 1930 g while the largestnon-ovigerous female was 156 mm CW and weighed 800 g.
Weight on carapace width relationships were calculated separatelyfrom each sex, the relationship for 262 males illustrated in Figure 6,is described by WT ~ 5.27 x 10 > CW3 ~ 328!. The relationship for 136females is WT 5.599 x 10 4 CW2 812! as shown in Figure 7.
98

Qltd'a QJ0
5g 0
h p
05C Ch
O
'0Ql
Q V4 Q
QG M0V
Clf'a 0P~
99
tO O A OCV
3ON388flOOO IN3083d
d C8
CW �0
0 00
0
Cl
IA 00'Q
VcQ
4
S
'a5 C
QJQ
0! 8~ H4J 4JC
00

25
25
25
25
25
~ 0 VIGEROUS
Figure 3. Monthly size frequency distributions of femaleGereon fenneri including number of individuals and meancarapace width. Ovigerous females are shaded.
100
25
8
80 90 100 110 120 130 140 150 160
CARAPACE WIDTH rnm!
FEB 1986N%28
C W%1 25.25
MAR
N%30
0 W =1 24.25
APR
N%32
CW 126.00
MAY
N%25
CW%125.70
JUNE
NR32
CW 126.80
JULY
N% 29
MW % 1 28.40
AUG
N% 34
CW %114.80
OCT
N%46
CW %116.0
NOV
N%28
CW = 125.20
OEC
N% 34
CW K 124.50
JAN 1987
N%29
CW% 1 19.50

25UJ
Q 25
AUG25
25
Figure 4. Nonthly size frequency distributions of male~Ger on fenneri including number of individuals and meancarapace width.
lOl
25
O
110 'f20 150 140 150 150170150 150
CARAPACE WIDTH mm!
FEB 1986
N=30
CW = 160
MAR
N=40
CW=152
APR
N= 45
CW= 155
MAY
N=94
C%= 155
JUN
N=47
CW =152
JUL
N=49
CW= 159
N= 49
CW= 160
QCT
N=53
CW= 162
NOV
N=52
CW = 160
OEC
N~49
CW= 158

O O O OlO O ClO O
O O
ajCQjW
O O
O O CVOO Ol
102
30N388flQOO LN3083d
O O O O CjlO O O O O CO
at8Qj
Sat 0aj
CQj
g co
0
g
aj~ +
aj 0 ataj
'0 4 rttjj0 0
ajaj
JJaj' ajaj co w
t ajW W 'Q
4JJ g ttjjj0
'U ajaj aj
4JV
aj aj
0 6aj U 0

1950
1750
1550
E 1350
1150I-
g 950~ 750
550
350
150 90 100 110 120 130 140 150 160 1TO 180 190CARAPACE WIDTH mm!
Ff.gure 6. Weight on carapace width relationship for 262 malearran fenneri as described by WT = 5.27 x 10"> CW !.
103

900
800
700
E 600
500
X < 400LU
Q soo
200
100 90 IOO 110 120 130 140 150 160CA RA P AC E W I DT H mm!
Figure 7. Weight on carapace width relationship for 1� femaleGeryon fenneri as described by WT 5.599 x 10 CW ! .
104

DISCUSSION
Ger~on fenneri is considerably larger than G. maritae and G.
fennari attain a maximum size in exoese of 190 mm CW end weight up to2000 g, interest in nozzseroial utilization is warranted. At present,the small fishezy for this species is unregulated. with no closedseason, quota or minimum size limits on harvestable animals. In thesoutheastern Florida fishery, only males greater than 130 mm CW areutilized, and all females and small males returned to the water.Considering the annual reproductive pattezn of females and the slowgrowth associated with organisms of large size from this deep waterenvironment, the voluntary practice of selective harvest is undoubtedlyof benefit in protecting the potential longevity of this fishery.
The strategy employed by the golden crab fishermen of southeastFlorida has proven successful in providing a sufficient amount ofproduct to local markets. The use un-buoyed trap lines with few largetraps and long soak times has resulted in the development of a smallscale local fishery, with fishermen able to pursue other commercialopportunities rather than fish crab exclusively. The close proximity ofthe fishing grounds to shore permits delivery of live product thuseliminating on-board processing and storage. This in turn reduces thecost per trip on the basis of fuel, labor and processing equipment.Live product is also more attractive to the consumer, who is able topurchase whole live crab oz freshly butchered and cooked clusters ratherthan pre-cooked, frozen crab.
The full commercial potential of this species will remain unknownuntil such biological data as population density, reproduction patternsand geographical distribution, which are still under study, arecollected and fully analyzed. Additionally, future research shouldcontinue to address gear development, trap design and the use of escaperings. Although the small southeast Florida fishery has been relativelysuccessful, the longevity and potential expansion of the fishery forthis valuable species remains unknown and over-capitalization byfishermen wishing to enter this fishery should be discouraged.
REFERENCES
1. Bellaizs. J ~ J. and W.S. Otwell. 1983. Preliminary observationsfrom on-board handling of deep-sea crabs Ger~on sp.! harvestedfrom the Gulf of Mexico. Proceedings of the 8th Annual Tropicaland Subtropical Fisheries Technological Conference of the Americas.8:63-72.
2. Byezs, C.J. De B. and C.G. Wilke. 1980. Quantitative stock surveyand some biological and morphometric characteristics of the
lBulletin of South Africa. 13:9-19.
105

Haefner, P.A., Jr. 1978. SeasonaL aspects of the biology,distribution aad relative abuadance of the deep sea red crab Ger~on
Atlantic. Proceedings of the National Shellfish Association.68:49-61.
3.
L'ates, A. and P. Le Loueff. 1976. Etude du crabs Rouge profuad
Oceanographique, Abdijan. Document Scientifique. 7:101-112.
4.
Luckhurst, B. 1986. Discovery of deep-water crabs Ger~on sp.! atBermuda � A new potential fishery. Proceedings of the Gulf aadCaribbeaa Fisheries Institute, 37th Meetiag, November 1984. pp.209-211.
5.
6. Manaing, R.B. aad L.B. Holthuis. 1981. West African BrachyuranCrabs Crustacea: Decapoda!. Smithsonian Contributions to Zoology.306:1-379.
7. Manaiag, R.B. and L.B. Holthuis. 1984. ~Ge ron fenaeri, a newdeep-water crab from Florida Crustacea: Decapoda: Geryonidae!.Proceedings of the Biological Society of Washington. 97:666-673.
8. Otwell, W.S., J. Bellairs and D. Sweat. 1984. Initial developmentof a deep-sea crab fishery ia the Gulf of Mexico. Florid Sea GrantReport No. 61. 29 pp.
9. Sweat, D. and W.S. Otwell. 1983. Experimental gear for harvestingdeep-sea crab Ger~on sp.! from the Gulf of Mexico. Proceedings ofthe 8th Aaaual Tropical and Subtropical Fisheries TechnologicalConference of the Americas. 8:73-74.
LO. Wenaer, E.L. and G. Ulrich. 1986. Exploration for golden crab,Geryon fenneri, in the South Atlantic Bight: distribution,population structure and gear assessment. Final Report Year 1.South Carolina Wildlife and Marine Resources Department. 58 pp.
ACKNOWLEDGEMKNTS
106
This article was partially developed under the auspices of theFlorida Sea Grant College Program with support from NOAA. Office of SeaGrant, U.S. Department of Commerce, Grant No. R/LR-B-LS. The authorswish to thank Dick, Rich and Dave Neilsen of Ft. Lauderdale, Florida fortheir invaluable assistance in collecting the material examined andtheir continued iaterest ia developing a fishery for this species.

DEVELOPMENT OF A SWIMMING CRAB
FISHERY IN ECUADOR
Kathleen M. Castro and Joseph T. DeAlteris
Department of Fisheries, Animal 6 Veterinary ScienceInternational Center for Marine Resource Development
University of Rhode IslandKingston, R.I. 02881
INTRODUCTION
During the last decade, Ecuador's fisheries have beendominated by the explosive growth of the shrimp farmingindustry. In 1983, Ecuador became the world's leading producerof farmed shrimp with an estimated 36,600 mt, production Sonu,1985!. However, this increase in shrimp production has beenaccompanied by several depressions in the trend caused byenvironmental changes and technological problems. Since shrimpis Ecuador's leading non-petroleum export commodity thisdecrease has caused considerable concern and promoted thedevelopment of hatchery operations, as well as a search foralternative fisheries.
In 1986, a project was initiated by the University of RhodeIsland URI! with their Ecuadorean counterpart, Escuela SuperiorPolitecnica del Litoral ESPOL! to investigate the potential forthe development of a fishery for underutilized species ofswimming crabs. Based on previous field observations andconversations with commercial and artisanal fishermen, itappeared that swimming crabs were a non-utilized by-catch of theshrimp trawlers and artisanal fishermen. No information on theidentification, life history, abundance and distribution ofthese crabs was available in Ecuador, nor were these crustaceansconsidered in previous investigations for the development ofalternative fisheries of underutilized species FAO, 1978; Moranand Lopez, 1984; U.S.Dept. of Commerce, 1982.!
Callinectes sa. idus, a member of the Portunidae family orbetter known as the blue crab, is the basis for the thirdlargest fishery of the United States which in 1985, producedmore than 83,200 mt of hard crab with a landed value of 60million dollars Vondruska, 1986!. Demand exceeds the supply ofdomestic crab meat and USA processors have supplemented theirsupply with imported crab meat from Brazil, Venezuela and Mexico W.F.Conley, personal communication!.
107

PHASE I
conduct a preliminary resource survey of coastal andestuarine waters,study the abundance a distribution of swimming crabsin Guayas Estuary,determine the catchability of the swimming crabs inthe Guayas Estuary using a variety of fishing gear.
a!
b!
c!
PHASE II
a! develop processing technology b! investigate potential markets for the product
Phase I is nearing the end of its first year ofinvestigation, preliminary results are summarized in thesequel. Phase II initiation is dependent on the results ofPhase I.
MATERIALS AND METHODS
Ecuador extends 950 kms along the western coast of SouthAmerica between the latitudes of 1 00'N to 3 20'S McPadden,1985! . The configuration of the coastline is irregular,terminating in the Guayas Estuary and the Gulf of Guayaquil Figure 1!, the largest estuarine system on the Pacific coast ofSouth America Murray, 1975!. The ocean is defined assub-tropical with water temperatures exceeding 25 C and saltcontent below 33.5 ppt. The climate, however, is consideredtropical and is divided into two distinct seasons. The wetseason is characterized by heavy rainfall and extends fromDecember through April. The dry season is cooler and includesthe period from May through November.
The preliminary resource survey was conducted during thedry season month of July, 1986. Seven locations were chosen assampling sites along the Ecuadorean coast covering the 3 majorestuarine systems: Esmeraldas Esmeraldas River!, Bahia deCaraquez Chone River! and the Guayas Estuary Guayas River! . Atotal of 41 trap samplings were made in these areas. Biological
108
Several basic criteria must be satisfied before asuccessful crab fishery can be established Van Engel, 1974!:the species must be present in consistent levels of highabundance; the species should be vulnerable to fishing gear; thespecies must be relatively large, easy to handle, transport,process and market; and the product must have consumeracceptance and potential market. In order to evaluate each ofthese criteria the project was divided into two phases with thefollowing objectives:

10
N S14
34 81' W 80' 79050
Figure 1. Map of Ecuador showing the three study areas.
3. 09

and environmental data were recorded and crabs were identified
according to available keys Williams, 1974; Garth 6 Stevenson,1966! .
Experimental fishing for Callinectes spp. crabs wasconducted in the Guayas Estuary during the wet season January!and the dry season June-August! of 1987. Sites were chosen inthree areas based on expected salinity differences in the upper,middle and lower estuary Figure 2! . Four types of fishinggears were randomly fished at each site: Chesapeake Bay stylecrab traps Van Engel, 1962!, trotline, gillnet and lift nets.Five Chesapeake Bay style baited crab traps were constructed oflocally available galvanized rectangular mesh wire with a meshopening of 2.5 x 5 cm. Each trap measured 65 x 65 x 52.5 cm andhad four entrance funnels. A smaller trap with a mesh size of2.5 x 2.5 cm was also employed during the January sampling tocapture juveniles, ho~ever, use of these was discontinued due tothe possible exclusion of the larger animals. Two 30 mtrotlines baited every 2 m were fished twice per hour. Thesewere constructed of 1 cm diameter, hard lay nylon and anchoredat both ends. Five baited lift nets were constructed with asquare iron frame, covered with 1.2 cm webbing. These werelifted twice per hour. Two 30 m gillnets with 7.6 cm stretchedmesh were constructed of soft lay polyamide twine. Traps,trotlines and lift nets were baited for each set with locallyavailable species. These included Chloroscombrus or uesta,Selene erviance and Scomber 'a onicus. All gears were fishedsimultaneously for 3 our periods. Unit fishing effort isexpressed as gear-hour which represents one unit of gear with aone hour soak.
All crabs collected were identified, measured carapacewidth! and weighed. Carapace width refers to the distancebetween the tips of the longest, cephalothorax spines. Generalappearance of the crabs were noted including sex, maturity, andloss and regeneration of appendages. Environmental dataincluding sediment type and bottom and surface temperature,salinity and dissolved oxygen levels were recorded.
110

Figure 2. Map of Guayas Estuary showing the samp3.ingsites.
111

RESULTS AND DISCUSSION
Resource Survey
The existence of five species of Portunid crabsinhabiting the coastal and estuarine waters of Ecuador assuggested by Williams �974! was confirmed during theseinvestigations. Callinectes toxotes and Callinectesarcuatus were captured zn estuarine areas while samples of
Portunus as er and Cronius ruber werehermen working in offshore areas. initial
indications suggest that these latter three species are notof sufficient size or quantity to support a fishery.However, the apparent abundance and size of the twoCallinectes species suggests the presence of a largeunexploited resource in Ecuador.
Callinectes toxotes was the largest of the swimmingcrabs found in the Guayas Estuary and have been describedas the largest species in the genus Williams, 1974!. Thelargest specimen captured measured 22 cm in width, andweighed 660 gr. The average size of C.toxotes captured was14.5 cm, with average weight of 211 gr. Callxnectesarcuatus, a smaller species, had mean carapace widths of10.3 cm and weights of 60 gr. Average carapace width andweight for both species for each area are summarized inTable 1.
DRY SEASONWET SEASON
ARCTOXTOXSITECW WT CW WTCW WT CW WT
UPPERGUAYASESTUARY
14.7 19811.9 113
MIDDLEGUAYASESTUARY
13. 4 21915.1 320 11.3 69.5
LOWERGUAYASESTUARY
15.3 250 9.1 48.7
112
Table l. Average Carapace Width CW! in cm and Weight WT! in grfor Callinectes toxotes TOK! and Callinectes arcuatus ARC! CrabsCaptured by Site and Season.

Abundance and Distribution
A detailed investigation of the abundance anddistribution of the Callinectes spp. in the Guayas Estuary
observations to date have indicated that the speciesdistribution found in Ecuador is similar to that describedby Norse and Estevez �977! along the Pacific coast ofColumbia, where C.toxotes dominated the less salineestuarine areas but was replaced by C. arcuatus in thehigher salinity areas with some overlap in intermediate andhigh salinity areas Figure 3!. They suggest thatsalinity plays an important role in the distribution of theCallinectes species and describes both as being euryhaline.
A spatial and tempora.l shift of the speciesdistribution occurred during the wet season, presumablyfollowing the shift of the salinity structure of theestuary due to increased fresh water input, from therivers. At the beginning of the wet season while salinitywas still high �9 ppt! large populations of C. arcuatuswere found in the middle estuary. At, the end of theseason, salinity dropped �5-17 ppt! and the populationconsisted entirely of C. toxotes. No shift in species
~ ~ ~ppt!, although there was an indication of sizedifferences. No data is available for the wet season 1987for the lower Guayas estuary.
If C. toxotes and C. arcuatus follow a similar pattern
distribution by sex and maturity can be expected. Matingwould occur in She fresher areas of the estuary, withfemales later migrating to estuary mouths to spawnresulting in the dispersion of the larvae into the offshorehigh salinity waters Hail, 1984! . Little data isavailable on the spawning habits of C. toxotes, althoughWilliams �974! mentions that the distribution of ovigerous
Preliminary results indicate differential distributionof C. toxotes by sex and maturity in the three sites duringthe two seasons Figure 4! . In the wet season, immaturemales and females dominated the population in the upperestuary; while mature males and females were found in themiddle estuary. During the dry season, mature males andfemales dominated in the upper estuary; while mature maleswere found in the middle estuary and the lower estuary.Preliminary data are insufficient to verify female

Figure 3. Species Composition in the Guayas Estuary.
114

Figure 4. Sex and Maturity of Callinectes spp. crabs inthe Guayas Estuary.
115

migration to higher salinity areas for spawning. Thereappeared to be a greater number of immature females in theupper estuary during the wet season, and a larger number ofmature females during the dry season. Very few ovigerousfemales have been captured to date.
The majority of the C. arcuatus captured were males;principally mature males were found in the middle Guayasestuary, and mature and immature males were found in thelower estuary. Very few females were captured whichsuggests their absence from the estuary areas sampled.Dittel and Epifanio personal communication! in theirinvestigations in Costa Rica, have captured mostly femaleC. arcuatus but, their sampling has been conducted offshore~ ~~
The offshore waters were not sampled but literaturesupports the theory that C. arcuatus and C. toxotes mayform large breeding populations in coastal watersthroughout, the year Rosales, 1976! and that the estuarinephase of the life cycle is a growth phase as suggested forC. latimanus in Ghana Kwie, 1974!. Paul �982! found thatzn Mexico, the female C. arcuatus continue their migrationout of the estuary and continue spawning on the continentalshelf.
Catchability
The blue crab in the United States may be subject tothe most diverse kinds of fishing gear for any singlespecies Haefner, 1985! . Gears can range from a simplebaited hand line to the 50 kg crab dredge used in thewinter months in the Chesapeake Bay. Only a few gears haveproven to be economically practical on a commercial basis Sholar, 1979!: crab traps 80%! trotlines �0%! anddredges �0%! . 1n Ecuador, there are technological,social, cultural and environmental factors that, must beconsidered in the selection of the appropriate harvestinggear. The final recommendations for the most appropriateharvesting gear will be a compromise between these factorsas well as catch per unit effort or performance data foreach gear type in the Guayas Estuary.
Catch per unit effort for each gear type by site andseason are summarized in Table 2 ~ Environmental conditions
caused great variability in the CPUE for some gears. Thetrotlines and lift nets worked best when fished in quietwaters such as protected mangrove areas or during slack
116

tides. Traps performed well until current reached speeds 'causing them to "walk" or vibrate. The Guayas estuary hasa tidal range of between 4 and 5 meters and tidal currentsoften reach speeds of 2-3 knots. Gillnets could only beplaced in carefully selected sites due to debris in thewater, boat traffic or currents.
Table 2. Catch per Unit Effort CPUE! by Gear Type and Size.
WET SEASON DRY SEASON
LRG MESHTRAPS
UPPERGUAYAS . 27 �!ESTUARY
SML MESHTRAPS
LRG MESH GILLNET LIFTNET TROTLINETRAPS
.094�! .77�23! 1.03 8! .49�5! .85�0!
MIDDLEGUAYASESTUARY
~ 82 �! ~ 95 �! .23 8! 1.5�0! .92{8!.55 �2!
LOWERGUAYASESTUARY
.37 �31! .42 �! .67 �0! .08 �!
AVERAGECPUE . 62 �1! . 70 {7! .56 �16! .59 �0! . 89 �5! . 73 �2!
Note: Number of Rep locates are zn cated by parenthesis.
If the assumption is made that the catch rate will beconstant during the entire fishing time, ignoring effectsof gear saturation, and species interaction, CPUE's can beextrapolated into expected daily catches for an artisanal
117
Traps and gillnets as passive gear offer the advantageof "self-fishing." Unless theft is a major problem in thearea, these gears can remain unattended until the fishermanreturns to remove the catch. US fishermen use a 24 hoursoak for the traps, replacing the bait. each time the trapis lifted. A 24 hour soak is not recommended for thegillnet since tidal currents and debris tend to cause thenet to tangle. The trotline and lift nets must becontinuously fished to harvest, the crabs and the fishermanmust remain the entire time with the gear. Therefore, ashorter total fishing time is recommended. CPUE may varydepending on soak time chosen for these gears.

fishermen working from a non-motorized vessel such as acanoe, and for a small scale commercial fishermen with amotorized vessel less that 6 m in length Table 3!.
Table 3. Expected Catch
SMALL SCALE COMMERCIAL LEVELARTISANAL LEVEL
24 134 TRAP 100 24 13508 58 LIFTNET 100 8 5848 43 TROTLINE 1600m 8 376
12 43 GILLNET 1600m 12 374
TRAP 0LIFTNETS 10TROTLINE 200mGILLNET 200m
At present. a very small local market exists forCallinectes spp. crabs. They are captured by handlines orlift nets by artisanal fishermen and vendors sell them onthe streets of Guayaquil for 20 to 100 sucres each �0-50cents US! . Demand for swimming crab increases during theclosed season of the preferred red mud crab, Ucidescccidentalis, and prices up tc 500 sucres eac~h 2.50 00!are common. Crab processors from the United States andJapan have visited Ecuador during this past year and a newEcuadorean crab processing facility "Jaiba Azul", hasrecently received funding to begin operations.
It is difficult to ascertain the resource potential ofCallinectes s . from this preliminary study, although theresults do offer some encouragement. Crabs were captured inall of the areas fished, although variability in the catchrates was due in large part to the exploratory nature of theinvestigation. From the preliminary data obtained thus far,the Callinectes s . crab resource is sufficient to sustainan artisanal level fishery. However, it is recommended thatmore detailed investigations be conducted before any largescale commercial level fishery be established for thisresource.
ACKNOWLEDGEMENTS
Support for this project was provided by U.S. AIDthrough a cooperative agreement with the InternationalCenter for Marine Resource Development ICMRD! at URI toprovide fishery development support services to lesser
118
GEAR UNITS SOAK TIME CATCH GEAR UNITS SOAK TIME CATCH hrs! hrs!

developed countries. The authors gratefully acknowledge theactive participation and assistance of the Escuela SuperiorPolitecnica del Litoral ESPOL! located in Guayaquil,Ecuador. We also extend a special thanks to Ing. BernardoZapata and Tec. Daniel Castillo for their invaluableassistance in the collection of the samples in the field.
REFERENCES
FAO, 1978. Fishery Country Profile, FID/CP/ECU Rev. 2
Garth, J.S. and W. Stevenson, 1966 ' Brochure of thePacific Coast of America. Brachyrhyncha: Portunidae. AllenHancock Mana r. Mar. Biol. 1, 1-154.
Haefner, P.A. 1985. The Biology and. Exploitation of Crabs.In The Biology of Crustacea, Economic Aspects: Fisheriesand Culture, Vol. 10. Editor: D. Bliss and A. Provenzano.Academic Press. Pp 111-165.
Hail, W.R. 1984. Delaware Blue Crab. University of DelawareSea Grant College Program 411.
Kwei, E.A. 1978. Size Composition, Growth and SexualMaturity of CD latimanus Rathbun in Two Ghanian Lagoons.Zool. J. Linn. Soc., 64, pp. 151-175.
McPadden, C. 1985. A Brief Review of the Ecuadorean ShrimpIndustry. Publication of the Instituto Nacional de Pesca,Ecuador, funded by the Overseas Development Administration,UK, pp. 42-68.
Moran, F. and E. Lopez. 1984. Investigacion y Desarrollode Nuevos Productos Pesqueros en el Ecuador. Rev. Lat. Tec.Alim. Pes . Lime Peru, 1, 1-32.
Murray, S., D. Conlon, A. Siripong and J. Santoro. 1974.Circulation and Salinity Distribution in the Rio GuayasEstuary, Ecuador. In Estuarine Research, Vol II, Editor: J.Cronin, Academic Press, NY, pp. 345-363.
Norse, E., and M. Estevez. 1977. Studies on the PortunidCrabs from the Eastern Pacific I' Zonation AlongEnvironmental Stress Gradients from the Coast of Columbia.Marine Ecolo , 40, 365-373.
119

Paul, R.F. 1982. Abundance, Breeding and Growth of C.arcuatus Ordway and C. toxotes Ordway in a Lagoon System onthe Mexican Pacific Coast. Estuarine Coastal and ShelfSci., 14, 13-26.
Ponce, J. and I.N. Dobrea. 1986. El Fenomeno El Nino y susImplicaciones Agrometerologicas. ERFEN Estudio Regionaldel Fenomeno el Nino!, Boletin 416.
Rosales, F.J. 1976. Contribucion al Conocimiento de laFauna de Acompanamiento del Camaron de Alta Mar Frente a laCosta de Sinaloa, Mexico. In Las Memorias de la Reunionsobre los Recursos de Pesca Costera de Mexico, Veracuruz,Mexico, pp. 25-80.
Sholar, T.M. 1979. Blue Crab Fisheries of the AtlanticCoast. 1n Proceedings of the Blue Crab Colloquium GulfStates Marine Fisheries Commission No. 4 7. August 1982.Editor H Perry and W.A. Van Engel. pp. 111-127.
Sonu, S.C. 1985. Ecuadorean Shrimp, Culture and Exports,Marine Fisheries Review, 47, pp. 52-55.
United States Department of Commerce, 1982. AnnualFisheries Report for Ecuador, National TechnicalInformation Service ITA-83-01-003.
Van Engel, W.A. 1962. The Blue Crab and the Fishery inChesapeake Bay. Pt. 2. Types of Gear for Hard CrabFishing. Commercial Fisheries Review , 24, pp. 1-10.
Van Engel. W.A. 1974. Underutilized Crustaceans of theChesapeake Bay and Chesapeake Bight. Manuscript forPresentation at Fish Expo, 1974. Norfolk, Virginia. 6 pgs.Vir. Inst. Mar. Sci., Gloucester Pt., Virginia.
Vondruska, J. 1986. US 1985 Fish Landings: The Blue CrabMarket 1984-1985. Marine Fisheries Review , 48, pp. 38-41.
Williams, A.B. 1974. The Swimming Crabs of the GenusCallinectes, Fish. Bull. US, 72, 685-798.
120

EFFECTS OF PROCESSING ON THE QUALiTY AND TENDERNESS OFTHE FLESH OF THE COINION WHELK BUCCINUM UNDATUM L.!
L.T. Admnbounou
University of Quebec in RimouskiDepartment of Biology and Health science
300 des Ursulines. Rimouski Quebec}, Canada CSL 3A1
Lavallhe. 3. and Castaigne. F.Department of Food Science and Technology
Laval University. Sainte-Foy Quebec!. Canada, C1K 7P4
ABSTRACT
Three different cooking methods and six cooking times, mechanicaltenderization and ten different salt solutions are investigated in anattempt to improve tenderness and shelf-life of whelk Buccinum undatumL. ! flesh. Tenderness. as evaluated by the Universal Testing MachinellNSTRON}, was significantly influenced both by the duration and themethod of cooking Sheeffe Test P < 0. 05 ! . Samples tenderizedmechanically by 200 g and 400 g loads were significantly more tender thanuntreated control and significantly less tender than hand tenderizedsamples P < 0.05!. Brines giving the lower microbial counts at 10~Cstorage were NaCI �%! and MgCI2 �4!. NaCI �%!. MgCI2 {24! and KCI�%! and NaCI 85!. But there were no significant differences between theten brines investigated P < 0.05!.
INTRODUCTION
The common whelk Buccinum undatum L.! is a carnivorous marinesnail widely distributed throughout the North Atlantic and Arctic Oceans.It provides a locally important. fishery on the atlantic coasts of Canada,particularly in the St-Lawrence estuary. on the east and south coasts ofBritain, and on the coasts of Normandy and Brittany. Santerelli and Gros 'l986! estimated the French landings of whelk at 4 000 metric tons peryear, with a commercial value of 17 millions french francs in 1983; Quebeclandings are estimated at 300 metric tons per year with a commercial valueof 100 000$ Can. D.F.O. 1985!.
ln Quebec. the commercial forms of whelk are: untreated whelk livein the shell!: canned whelk {whelks are removed from the shell, cannedand heat treated!; and brined whelk with about 84 NaCI! or preservedwith vinegar. One of major characteristic of whelk is tough flesh textureand the consumer commonly complains of this. Like most gastropods. thelocomotor activity of whelks is assumed by a pedal muscular organ. Suchactivity is energetically expensive {DaSilva and Hodgson. 1987! and impliesa high degree of sophistication of the muscles. The organization of pedalmuscles probably affects the tenderization modes during the processing.
121

Studies on the fine structure of the pedal musculature of gastropods arefew and to date have been carried out either on terrestrial snails Rogers.1969! or on whelk Hunt. 1976; DaSilva and Hodgson. 1987!.
Salt. or sodium chloride NaCI! is the most frequently used compoundin food processing, and has been use for centuries for flavoring and as abacteriostatic or bactericidal agent. The preservative effect of salt isprimarily due to its ability to lower water activity by drawing water fromtissue. In recent years sodium chloride consumption has become a majorissue in the food industry, primarily because the sodium ion seems closelylinked to human hypertension Freis, 1976: Altschul and Grommet. 1980!and because the average consumption of sodium is 10-20 times thatnecessary for physiological balance NAS, 1980!. Sodium compounds occurnaturally in many foods. including meats, fish. dairy products. grains, andvegetables. For the health of persons suffering from hypertension orother sodium related disorders FDA �982!, AMA �972! and several otherprofessionnal groups Shank et al ..1983! have made formal recommendationsconcerning the use of sodium chloride. Some studies have been madeconcerning the optimization of functional and economic parameters whensodium chloride NaCI ! levels in processed foods are reduced byreplacement with other chloride salts Marsh. 1983. Maurer. 1983, Terrell.1983!.
It is known that some parameters such as: age Snowden et al .. 'I978!;muscle composition Marsh et alee 'l974, Marsh, 1977, Olson et Parrish.1977!, conservation processes TBouton et al .. 1973!. cooking time andtemperature Bouton et al.. 1981, Robertson et al. 1984, Findlay et Stanley.1984! influence the toughness of animal muscle and therefore its texture.
The purpose of this paper is to report the effects of cookingmethods, time/temperature parameters, enzymatic treatment and mechanicaltenderization on the toughness of whelk flesh, as evaluated by theUniversal Testing Machine. Some work was also done to evaluate theeffect of partial replacement of sodium chloride by other chloride salts onthe shelf-life of brined whelk.
MATERIALS AND METHODS
~gam lin: Live walks bought from local commercial fishermen Pecherie Bocard of Matane, or Poissonnerie Lucien Doucet of Bic! werekept in cold storage �'C! until experimentation. Only live whelks withtotal shell length of 7-9 cm. as mesured with a vernier, were selected forexperimentation as showed on the diagram of figure 1. Preliminary studies Adambounou et al. ! showed no significant difference between thetenderness of the pedal muscle of the samples of this group; whileSantareili and Gros �986! reported the relationship between the age andshell length of the whelk.
122

123

Cookin methods: three cooking methods were investigated:
1! Boilin in water: About twenty whelks weighing approximately of1 500 g were boiled in 1 000 g water �004C! for fixed times �0, 20.30. 40. 50 or 60 minutes!. Cooked whelk were removed from theshells with a table fork, and pedal muscles sampled with a knife,washed and brined in a glass jar with warm sodium chloride solution 85 and 80 C!. cooled at ambient temperature �5 C! and stored at4 C until evaluation of tenderness by Instron.
2! Ten minutes recookin followed b ressure cookin for varioustimes .About l 000 g of whelk were boiled in l 000 g of water forten minutes and the flesh removed from the shell with a table forkPedal muscles were sampled with a knife, washed and brined withwarm 8$ sodium chloride solution 804C! in glass jars and pressurecooked �214C, 15 Ibs! for fixed times �0. 20, 30, 40. 50 or 60minutes!. cooled at ambient temperature about 254C! and stored at44C until evaluation of tenderness.
3! Pressure cookin 121 C 15 I s 1 500 g of sample were pressure30. 40, 50 or 60 minutes!. Whelk
were picked from the shell. brined in glass jars 85 NaCI. 804C!cooled at 25 C and stored at 4 C for tenderness evaluation.
A control was prepared according to the cooking method �! and thebrine solution was replaced by distilled water.
Mechanical tenderization. Live whelk were obtained by breaking theshells with a hammer. Pedal muscles were selected, washed and kept indilute sodium chloride solution �,9%! at 04C for 48 hours beforemechanical tenderizing. with the apparatus shown in figure 2. The effectof two weights �00 g and 200 g!, falling from a height of 80 cm wasinvestigated; for comparison hand tenderizing was performed with a woodenmaliet as used in the home for meat tenderizing. The samples werewashed. slightly brined NaCI solution 0,9% and 804C! and pressure cookedfor an hour �21 C, 15 Ibs! in glass jars. They were cooled at 254C andstored at 44C until evaluation of tenderness.
Enz matic tenderization. 1 500 g of whelk were boiled �004C! in1 000g of water for 10 minutes, removed from the shell with a table forkand the pedal muscle incubated at 804C for fixed times �5, 30 or 45minutes! in enzyme solutions of various concentrations �5, 30 or 45 g/I!.The two enzymes investigated were crude papain powder type II and crudeficin Sigma Chemical Co. Ltd!. Pintauro. 1979. reported that the optimumtemperature of these enzymes was from 65 C to 80'C. Samples were thenbrined 84 NaCI, 804C!, cooled �54C! and stored �4C! until tendernessevaluation.
l,24

Figure 2. Experimental apparatus used for mechanical tenderizing.
Tenderness evaluation. Compression measurements were made usingan Instron Universal Testing Machine! Model TMS equipped with a 2 000g load cell. For each treatment. thirty cylinders of 1.1 cm diameter wereselected in the horizontal axis of pedal muscles with a circular knife andcut to 1.5 cm length. To eliminate sample mouvement during compressionmeasurements, cylinders were placed in a plexiglass block drilled accordingthe size of samples. The initial peak referred to as firmness was obtainedby compressing cylinders to 904 of the original iength. Preliminaryinvestigations on calibration of Instron showed that 20 cm/min. is theoptimal speed for both the crosshead and the chart Lavaliere et al.. 1987!.The method used was similar to the Instrumental Texture Profile Analysiswith only the initial peak. referred to as firmness, being used Breeene,1975. Findlay and Stanley. 1980! Figure 3!.
125

Figure 3. Typical deformation curve observed on Instron.
Microbial "anal sis. To evaluate the effects of different brines on theshelf-life of whelk, a total plate count using P.C.A. was made on thesampie prepared as in cooking method �!, stored at 10 C for 60 days.The plating were done on triplicate.
Ex erimental lan and statistical anal sis. Complete Random Factorialexperimental design was followed, and all analyses shown in theexperimental diagram Figure 1! and microbial analyses were done induplicate and the entire experiment repeated twice. Data were analysed bystandard parametric analysis of variance technique. Degrees ofsignificance were evaluated by the Scheeffe test Kirk. 1968!.
RESULTS AND DISCUSSION
Effect of en z metic treatment. The influence of enzymeconcentration on whelk toughness is shown in figures 4 and 5. Thecombination of 15 minutes incubation time and 15 g/I papain gave aacceptable tenderness of whelk Figure 4!. The tenderness of whelk fleshincrease significantly P < 0,5! with increasing papain concentration.whereas increasing the time of incubation decreases tenderness. In the
126

case of ficin. increasing either incubation time or enzyme concentrationincreases significantly the firmness of whelk Figure 5!. After 15 minutesincubation, both enzymes papain or ficin! rendered whelk flesh moretender. as compared to untreated samples Figures 4 and 5!. The increasein firmness as function of duration of thermal treatment agrees with theresults of Martens et al �982!. This change of texture depends of thecomposition of muscle Khan. 1977! . Enzyme treatment decreasespigmentation and this appearance might possibly influence the consumer.
0. 850,80 o.0. 0, 700 65 rn
.60~ 55~ 50
Figure 4. Influence of papain concentration andincubation time on whelk flrmness. 0.850.800.750.700. 65 u'0.600.550.50
Figure 5. Influence of ficin concentration andincubation time on whelk firmness.

Effect of cookin time. For the three caoking methods investigated.the compression values of whelk decreased significantly after 20 minutesand after 40 minutes Table 1!. There is no significant difference between10 and 20 minutes, nor between 30 and 40 minutes, nor between 50 and 60minutes P < 0.05!. However in the case af cooking method �!, thedifference was not significant between 40 and 60 minutes. These findingagree with those af Bouton and Harris �972!. These results indicate theionger the cooking time, the more tender whelk flesh becomes. This isnot the case for enzyme treated flesh, where restructuration phenomena ofhydrolysed tissue constituents probably take place with the duration ofincubation.
Table 1. Influence of cooking tiases on whelk tendernessfor different cooking methods.
i! Pireese in hPa�! Osforsation aoc41ee tn ttPa
any scans in tns ease norltontal ltns sltn ease superscrtpt are nots stentf xoantlydtfferent soneffe Nutiple Ranee Test! at p t 0.0$.
Effect of cookin method. The results obtained for the firmness anddeformation modulus. indicate no significant difference P < 0.05! betweenthe three cooking methods for 10 minutes cooking time Table 2!. For 30and' 40 minutes. cooking in boiling water made whelk significantly P < 0.05! more tender than cooking methods 2 and 3. For 50 minutes,pressure cooking method 3! gave the best results for the firmness anddeformation modulus. According to these results Tables 1 and 2! .decorticating whelks before pressure caoking increased firmness of samples.Between 30 and 40 minutes cooking whole whelk in boiling water gave themost tender flesh. In the pressure coaking method with decorticatedwhelks. the increase of fiesh toughness could be related to the increasingrigidity of myofibrillar structure which is a function of cookingtemperature Boutan and Khan, 1975!. In the case of cooking method �!.
128

the shell could reduce the effect of temperature on denaturation ofmyofibrillar proteins by reducing the rate of heat transfer.
Table 2. Infiuence of cooking methods on whelktenderness for different times.
>! 1 = shale sheik oook xn soiling eater2 " -ahois sheik oook in a Pressure cooker
preoooked lO ein, deoortioate and oook in a pressure oooker
any scans in sacs vertioal lane eith sacs supersortpt ara note signif ioantly dtf fa-rent Sohef fe .tultiple Range Test! at P c O.OS.
Effect of sodium chloride. Table 3 shows the effect of sodiumchlori e in coo ing water on w efk firmness. These results agree withthose of others who have demonstrated the use of salt to improve foodtexture or as a binding agent Marsh. 1983!. Sodium chloride interacts withproteins and others constituents to improve the texture of foods Whitingand Richards. 1978!.
Mechanical tenderization. The results obtained from mechanicaltreatments indicate no significant difference between the 200 g load and400 g load Figure 6!, but both treatments rendered whelk fleshsignificantly more tender than untreated control and sighificantly lesstender than hand tenderized P 0.05!. There were no visual differencesbetween the mechanically tenderized whelk and the untreated controls.
129

Table 3. influence of NaCI in the cooking water on whelk tenderness.
+! l pressure cooking in a glass jar with water only.2 pressure cooking in a glass jar with HaC1 84.
any scans in the sass vertical line with sacs superscript are notesignificantly different Sheff ~ INIltiple Range Test! at P 0,05.
O.BO
0.70
0.20
0.10
0.00
Figure 6. Effect of mechanical treatments on whelk firmnessA - control. B - Stroked with 200 g weight. C - strokedwith 400 g weight. D - hand hammering.
130
0.60
0.50
cn 0. 40
0.30
STINDIRD DEVIITION
TREINENT

Effect of various brines on whelk shelf-life. As shown in figure 7,the maximum shelf-life is seven days. The microbial count increasesexponentialy from 7 days to 30 days and becomes stable thereafter. Theexponential proliferation of microorganisms could be related to osmoticphenomena: the extraction of water from tissue by the salt involves thediffusion of water soluble nutrients into the brine. and this provides themedium supporting the typical pattern of microbial growth. No significantdifference was observed concerning the preservatif effect of the ten saltsinvestigated. In other words. sodium chlot ide could be partialy replacedeffectively by any of the other salts. This agree with the finding ofvarious authors Marsh, 1983, Seman et af. 1980, Seperich et ~al 1983!.
7Qla
S
5
30
O4YS IH STOR4GK IO 'C!
7. Effect of different salts on total microbial counts PCA!for whelks stored during a 60 days period at 1goC.
6Z NaC1 + 2X CaC1; g 4L NaC1 + 4X KC1;6X NaC1 + W KCl; � � � 4'L NaC1 + 2'X MgCl + 2'X KCl;
22% NaCl + 6'X MgC1; ~ 2L NaCl + 47 MgCl + 2X KC1;8X NaC1; 2X NaC1 + 6X KCl;6X NaCl + 2'X MgCl ; g 2X NaCI + 4'L KC1 + 2X MgCl
4�
0

CONCLUSiON
Optimal tenderizing of whelk can be obtained by cooking in boiling waterfor 30-40 minutes. Tenderness is better if whelk is mechanicallytenderized. Enzymatic tenderizing reserves some surprises effectiveconcentration of enzyme, overall cost for industrial production and finalappearance of the productj. Some correllation with sensorial tests areneeded before final conclusions can be drawn. The microbiai testconducted in this work confirmed the possibility of partial replacement ofsodium chloride by other chloride salts without affecting the duration ofshelf-life of brtned whelk.
REFERENCES
1. A.M.A. 1979. American Medical Association concepts of nutritionand health. Councilor or scientific affairs of A.M.A.. J.Am. Med.Assoc. 242 �1!: 2335.
2. Adambounou. T.L.. J. Levelly. and F. Castaigne. 1986. Optimisationde la tendret4 de la chair de buccin Buccinum undatum L. !. SessionPoster. 29e Congris de l. C.S.T.A.
3. Altschul. A.M. and J. K. Grommet. 1980. Sodium intake and sodiumsensitivity. Nutr. Rev. 38: 393.
Bouton. P. E. and P. V.. Harris. 1972. The effect's of cookingtemperature and time on same mechanical properties of meat. J.FoodSc. 37: 140-143.
5. Bouton. P. E., P.V. Harris, and R. I. Baxter. 1973. A comparison ofthe effects of some post-slaughter treatments on the tenderness ofbeef. J. Food Technol. 8: 39.
P .
6. Bouton, P. E., P. V. Harris, and G. Ratcliff. 1981. The effect ofcooking temperature and time on the shear properties of meat. J ~Food Sci. 46: 1082.
7. Breene. W.H. 1975. Application of texture profiie analysis toinstrumental texture evaluation. J. Texture Studies. 6, 53-82.
8. DaSilva. F.M. and A.N. Hodgson. 1987. Fine structure of the PedalMuscle of the whelk Bullia Rhodostrowa Reeve: correlation withfunction. Comp. Biochem. physiol. Vol.87A. No 1. pp. 143-149.
9. Department of Fisheries and Oceans. 1985. L'industrie des pechesmari t i mes du Q uhb ec. FS. 23-71/1985F. Ministhre desApprovisionnements et Services du Canada.
132

F.D.A. 1982. Food Labeling. Declaration af Sodium content of Foodsand Label Claims for Foods on the Basis of Sodium Content. Fed.Regist. 47: 26580-26589.
10.
Findlay, C.J. and D.W. Stanley. 1984. Texture-structure relationshipin scallops. J. of Texture studies. 75-85 ~
Freis. E.D. 1976. Salt. volume and the prevention of hypertensioncirculation 53 �!: 589.
12.
Hunt, S. 1972. The fine structure of the smooth muscle in thehypobranchial gland of the gastropod Buccinum undatum L. Tissueand cell. 4�! pp. 479-492.
13.
Khan. A.W. 1977. Some factors causing variation in the texture ofsimilar muscles from comparable animals. Meat Sci. 1. 169-176.
14.
Kirk, R. E. 1968. Experimental design: procedures for the behavioralsciences. Brooks-cole, Belmont. Calif. 577p.
15.
Lavallb!. J.. F. Castaigne. and L.Adambounou. 1987. evaluation de latendret4 de la chair de buccin par Instron. Presentation orale. 55eCongas de 1'ACFAS. Annales de l'ACFAS. Vol.55. pp.247.
16.
Marsh. B.B. 1977. Symposium: The basis of quality in muscle foods.J. Food Sc. 42�!: 295-299.
17.
Marsh. B.B., N.C. Lect. and M.R. Dickson. 1974. The ultrastructureand tenderness of highly cold-shortened muscle. J. Food Technol. 9.141.
18.
Marsh. A.C. 1983. Processes and formulations that affect the sodiumcontent of foods. Food Technol. 37�!: 45-49.
19.
Martens. H.. E. Stabursvik and Martens. 1982. Texture and colourchanges in meat during cooking related to thermal denaturation ofmuscle proteins. J. Texture Studies 13: 291-309.
20.
Maurer. A.J. 1983. Reduced sodium usage in poultry muscle foods.Food Technol 37�!: 60-65.
21.
N.A.S. 1980. Towardhealthful diets, National Research Council, Natl.,Aced. of Sci.. Washington, D.C.
22.
23.
Pintauro. N. D. 1979. Food Processing Enzymes: Recent developments.Food Techno. rev.no 52. p.231. Nayes Data Corporation.
24.
133
Olson, D.C. and F.C.J.R. Parrish. 1977. Relationship of myofibriifragmentation. index to measures of beef steak tenderness. J. FoodSc. 42�!, 506-509.

25. Robertson, D., P.E. Ratcliff, P.E. Bouton. P ~ V. Harris. and W.R.Shorthorse. 1984. Effect of cooking temperature and animal age onthe, shear properties of beef and buffalo meat. J. Food Sc}. 49�!1163-1166.
26. Rogers, D. C. 1969. Fine structure of smooth muscle andneuromuscular junctions in the foot of Helix aspersa. Z. Zellforsh 99,315-335.
27. Santarelli. L. and P. Gros. 1986. Modhlisation bioeconomique de lap4cherie de buccin Buccinum undatum L.: Gastropoda! du port deGranville Manche Ouest . Rev. Trav. Inst. P8ches marit., 48 l et 2!:23 32.
28. Seman, D.L.. D.G. Olson and R.W. Mandigo. 1980. Effect of reductionand partial replacement of sodium on bologna characteristics andacceptability. J. Food Sci. 45: 1116.
29. Seperich. G.J. and G.H. Ashoor. 1983. The effect of partial and totalreplarement of sodium chloride with calcium chloride in a bolognaproduct. Progress report to the American Meat Inst. from Ariz. StateUniv. Tempe.
30. Shank, S.F.. L. Larqen, F.E. Scarbrough. J.E. Vanderveen, and A.L.Forbes. 1983. FDA Perspectives on sodium. Fd Technol. 37�!: 73-77.
31. Snowden, J. McK., P.E. Bouton, and P.V. Harris. 1978. Influence ofanimal age on the mecanical properties of restrained, heat-treatedcoltagenous tissue. J. Food Sc. 43�! 178-201.
32. Terrel. R ~ N. 1983 ~ Reducing the sodium content of processed meats.Food Technol. 37�!: 66-71.
33. Whiting, R. C. and J.T. Richards. 1978. Influence of divalent cation onpoultry meat emulsions and sausages. J. Food Sci. 43: 312.
A KNOWLEDGMENTS
The authors would like to express their appreciation to Mr AlexanderStrachan of Department of Biology and Health Science f' or his help in thepreparation of the manuscript. This work was supported in part by theNational Science and Engineering Research Council and InstitutionnalResearch Fund of the University of Quebec in Rimouski.
134
EVALUATION OF A CONTAINERIZED SYSTE'I
FOR THE RELAYING OF POLLUTED CLANS MERCENARIA MERCENARIA!
William Ds DuPaul and Michael J. OesterlingVirginia Institute of Marine Science
School of Marine Science
College of William and MaryGloucester Point, VA 23062
INTRODUCTION
Bivalve molluscs are well-known for their ability to bio-concentrate polluting microorganisms and their equal capability tocleanse themselves when placed in unpol1uted environments. This latterfact has led to the development of entire industries based upon takingshellfish from marginally polluted water and ei.ther moving them toapproved harvesting areas for natural cleansing termed relaying! orsending them to onshore depuration facilities where water quality can berigorously contro11ed.
Of the two processes, depuration has received the greater emphasisfrom scientists, industry and regulatory agencies as evidenced by thevolume of information available for examp1es see Arcisz & Kelly 1955,Furfari 1966, Haven et al. 1978 and Neilson et al. 1978!. The reasonsfor this include the shorter periods of time involved to depu.".atecompared to relaying �8-72 hours versus 15 days or longer! ~ ease ofoperation and product recovery, and a greater assurance for a cleansedproduct. Relaying, on the .other hand, has received only limitedattention, despite the fact that it is widely practiced in both theoyster and hard clam industries Blogoslawski and Stewart 1983!.
The relaying of hard clams Mercenaria mercenaria! from marginallypolluted waters to approved harvesting waters for natural cleansingrepresents a multi-million dollar fishery in Virginia. By law, relayinghas been confined to direct on-bottom placement of clams in approvedareas. This process is extremely inefficient and prone to productlosses as high as 30K owing to mortality associated with handling.predation, stressful environmental conditions and inherently poorrecovery procedures. This loss is significant considering thatapproximately 25 million clams were harvested and relayed in Vir iniaduring 1986 Virginia Marine Resources Commission!.- Containerizedrelaying offers a potentially superior alternative to natural relaying.However, prior to 1987, it had not been approved by the VirginiaDepartment of Health due to lack of documentation on effectivepurification of hard clams within containers. All previouscontainerized relaying experiments have been conducted using oysters Crassostres vair inica or C. iree!.
One of the earliest studies to employ containers in a relayingstudy was conducted using oysters C. vair inica! in Bilosi gay Cook aad
135

Childers 1968!. While containerization demonstration was not anobjective of the study. their use of 30 x 18 x 3-inch racks covered with1-inch wire mesh yielded valuable data on the potential for containerrelaying. When racks with 6-inch legs to support the rack off-bottomwere compared to racks placed directly on a mud bottom, no significantdifferences were found and cleansing was complete by the eighth day.Similarly there was no difference between oysters held in racks andoysters placed directly on mud bottom. However, clear sing was notcompleted until the tenth day, indicating that cleansing may proceedfaster in racks.
Quayle and Bernard �976! used wire-mesh baskets to demonstratecoliform bacteria purification of Pacific oysters Crassostrea ~i as!.Open top galvanized iron mesh baskets 62 x 62 x 30 cm �4 x 24 x 12 in!,containing approximately 55 kilograms �21 pounds! of oysters were used.Within 48 hours of being placed on the bottom, the oysters reached anequilibrium with ambient bacteriological conditions. Ninety percent ofthe original bacterial load was eliminated within 24 hours and anadditional 8X reduction experienced by 48 hours after being placed inapproved harvesting waters. Oysters sampled from varying depths withinthe basket should no statistically significant differences betweensamples. The authors suggested that containerization offered aneconomical alternative to traditional on-bottom relaying.
Supan and Cake �982! determined the effects of containerizedrelaying on oyster C. vair inica! survival and purification undervarying environmental conditions, differing seasons and differentloading configuration; and, to investigate various designs of rafts.racks, trays and other containers for commercial relaying. Theycategorized their container systems as suspension relaying, on bottom longline! relaying, or rack-relaying. Successful cleansing varied, butaccording to the authors, commercial quantities of oysters inmultilayers could eliminate indicator bacteria.
In an effort to document the effectiveness of bacterial cleansin
of hard clams when held in containers, a series of experiments wereconducted during 1985 and 1986 Kator and Rhodes, unpublished data!.This project had two main objectives: document the bacteriologicalcleansing of containerized hard clams in a commercial setting anddemonstrate the commercial advantages of containerized relaying overtraditional on-bottom relaying. In this paper the authors willsummarize the bacteriological results and concentrate on the resultsthat relate to advantages over traditional relaying.
MATERIALS AND WKTHODS
The full-scale commercial container relaying experiments wereconducted in cooperation with an established industry relayer using thetraditional on-bottom method. Containers were built of expanded steel,diamond shaped mesh �.54 cm along longest axis! supported on a
136

framework of 2.54 cm L-shaped steel bars. The containers measured 1.2 x1.2 x .3 m � x 4 x Ift! and vere fitted with 2, 15.2 x 15 ' 2 cm � x 6in! wooden skids on the bottom to support the container off the bottom.The container was constructed with a hinged edge midway across the topto permit one half of the top to be raised. The free edge of the topwas fitted with a hasp closure to facilitate a seal for the container.
Results from the preliminary packing experiment indicated that hardclams representative of the size to be relayed littlenecks andcherrystones! should not be packed more than 15.2 cm � in.! deep Katorand Rhodes' unpublished data!. Packing to this depth, each containerheld approximately 4500-5000 hard clans.
During the 1986 relaying season, five experiments vere conductedutilizing naturally contaminated hard clams. Containers were deployedon approved bottom adjacent to ongoing bottom relaying operations. Onthe day of deployment, clams were randomly selected and returned to thelaboratory for bacterial analysis. Mater temperature and salinity weremeasured and a vater sample taken for bacterial analysis. After aminimum of 14 days purification time, bagged clam samples were retrievedfor analysis and the container returned to the bottom. Xf, uponanalysis, the bagged clams met a product standard of 50 fecal coliformper 100 g of meats, then the remainder of the clams in the containerwere released for sale.
Once a container was zeleased for sale, all clams were removed and
counted to determine mortalities. Clams vere separated into thefollowing categories:
1. Marketable - no shell damage; still alive2. Dead Clams � shells with both valves intact and attached;3. Broken Clams, Old - broken shells with both valves attached, no
meat inside; assumed damaged at time of harvest or packing incontainers.
4. Broken Clams, New - broken shells with both valves attached,with meat inside; assumed damaged during reharvestingoperation.
RESULTS AND DISCUSSIGN
Results of the bacterial analysis Kator and Rhodes, unpublisheddata! for the five deployments of the relaying container indicated thateffective depuration vas accomplished. When containers vere carefullydeployed and clams exposed to favorable water quality, a productstandard of 50 fecal coliforms/100 g meats was met.
Water temperatures fluctuated during the course of the experimentsbetween a low of 17.5 C �3.5 F! on Nay 6 ~ 1987 and a high of 29.5 C 85.1 F! on July 29, 1987. Salinity ranged from 18 and 22 ppt.
0
Recovery data for 5 experiments using naturally polluted clams are
137

presented in Table 1. Results of each individual experiment will bediscussed separately prior to summarization.
Experiment I, Nay 6-27, 1986
The total number of clams held within the container was 4,835.This included 585 clams held in bags for microbiological analysis.Twenty-one days after initial placement, 4250 clams were released tomarket. For this experiment, distinctions between dead clams and oldbroken clams were not made. The significance of distinguishing deadfrom broken old and new! is an indication of mortality that can beattributed directly to handling initial harvest, placement in containeror harvest from container! and other sources of mortality smothering incontainer or unexplained!. Excluding bagged clams for microbiological
0analysis, total mortality was 3.89X. Mater temperature �7.5 C! andsalinity �8.0 ppt! were recorded during this experiment.
Experiment 2, June 10-30, 1986
Container loading, deployment and retrieval went smoothly. A totalof 4615 clams �85 held in sample bags! were loaded into the container.Upon release, 4030 clams were marketed. For this experiment,mortalities were separated into dead clams �3!, old broken clams �14!and new broken clams �1!. Total mortality excluding bagged samples!was 4.23X. Of this total mortality, 3.21X could be attributed tohandling effects.
Experiment 3, June 24-July ll, 1986
Results from this experiment are very similar to the previous one.A total of 4645 clams. including sample clams, were held in thecontainer. At the end of 17 days 4060 clams were retrieved. Dead clamsnumbered 64; old broken clams, 90; and new broken clams, 31. Totalmortality, excluding samples' was 4.36X. Mortality from handling was2.85X.
Experiment 4, July 15-August 1, 1986
During the initial loading and deployment of the container, amechanical problem caused the clams within the container to shiftposition on two occasions. Each time this happened the container had tobe reopened, the bagged clams for microbiolog,ical analysis wererepositioned and remaining clams redistributed. The increased handlingwas reflected in higher mortalities. Additionally. this sampling, periodexperienced the highest water temperatures �9.0 C � 29.5 C! ~0 0
potentially stressing the clams and adding to the mortality. A total af4723 clams were held in the container. Seventeen days later 4138 werereleased for sale. Total mortality was 6.84X. The number of dead clamsincreased to 123, about double the previous experiment; old broken clamsincreased to 151 �7X higher than the previous experiment!; and there
138

4J
4 0X
4 QjC «5C 0
0cCO
ech
«rj
CO
0 CQl
~ 05
«Q~ R C«QC~ rC
«QQI
«Q 8QI80
0W 0 0
'0 0Qj al
V Vaj ca
4J
cd aj
A 0 4
4Jaa rt
aj 4J4
0 0
O OO LA O Cl Illcrj
O n4 C CQj QI
A0 04
O AO
IO
CV
QIO ~
cO
~ ~
139
QQ MC rc
~ rI ~Mm cd
4JC «d 0X X
QI CQj ra
W 5 QlO 4A
'a
O C ala Ql&
W 0 QlO
a al8
W cd ajO Ql ra«ar a
Crj
alcd 8 Ql
aj0M alR cDC7
8QQ «Q 0
0 V~ rt 0
«Q 00 48 Qc al I«Q Pe gj CM ~ O
0W 0QI
al8«Q
'0 V 0 Ce 0CI
0 C
W V C «QQI
r«Q8«d
V cdQICI
Ql
'0 QIC
0V
CC «Q0'rI ~
VC 0rI
«Q~ rc cd
QQaj 4
IVIr0
W 0~ rc
«d
4 cQ0 C8 .rt
QQ cdQI
caC«Q
e
0 V
QiC
V~ rttl 0C
0Ql4 N«d
8 'ZQQC
V
CQJ Qj
A«d

were 30 new broken clams similar to the previous experiment! . Handlingmortality increased to 4 ~ 07X mainly on the basis of old broken clams ~The higher number of old broken clams was attributed to the containershifts during initial deployment.
Experiment 5, August 5-August 28, 1986
This experiment was also beset with complications caused byunusually heavy rainfall. For a six-day period August 11 � August 17!,the relaying site and surrounding area experienced heavy rainfallassociated with a passing tropical depression. As a possibleconsequence, sampled clams failed to reach acceptable fecal coliformlevels and, therefore, were not released for sale. The entire containerwas left on the bottom for an additional 7 days, after which more clarrswere sampled for microbiological analysis. After this additionalcleansing time, the acceptable fecal coliform level was achieved and theremaining clams released for sale. However, this entire procedureincreased the amount of handling, disturbance and increased the lengthof time that the clams were held �3 days!. Together, the increasedhandling and length of holding, combined to yield the highest totalmortality and handling mortality. Initial clam container stocking was4526. After 23 days and the removal of 2 samples, 3881 clams weremarketed. Total mortality for the period was 8.03X. Dead clamsnumbered 114, old broken clams 207 and new broken clams 18. Handlingmortality w'as 5.33X.
The use of containers for relaying clams clearly is superior todirect on-bottom relaying in terms of recovery rate and ease ofrecovery. Over the course of the container experiments, average totalmortality was 5.5X. During the 1986 relaying season, the adjacent on-bottom relayed clam loss was 22X personal communication, Roy DavisSeafood!. The term "loss" as opposed to mortality is used whenreferring to on-bottom clams because a distinction cannot be madebetween clams that actually died and clams that failed to bereharvested.
This difference in losses amounts to sizeable sums of money whenlarge numbers of claros are involved. Over toe course of a season alarge scale relaying operation can relay 8 million clams. Using thesimplest of economic evaluations employing only total gross sales losswithout taking into account labor or other operating expenses themagnitude of this monetary loss may be illustrated. A comparison basedupon 8 million relayed clams can be made between a totally containerizedoperation with a 5.5X loss sric';i t <>;..i.'i.'.-.' . -!ii i r ir iiri~r~tiorr with a 22Xloss. A 5.5X loss from 8 million clams represent a loss of 440,000clams; at 22X, 1,760,000 clams are lost; a difference of 1,320,000clams. If we assume a $0.15 per clara sales price, the on-bottom
140

operation had a total gross sales loss of $198,000 greater than t?econtainerized operation.
Other benefits would accure from conta'nerization, one of whichwould be labor reduction a" =oharvesting. Current on-bottomreharvesting requires extensive man-hour expenditures usia either handtongs shaft tongs! or patent tongs. With a container, close to 5000clams can be harvested in a matter of a few minutes. The actual savingsin time and labor expense must be examined more closely in order toobtain a more accurate accounting.
An out rowth of the ease of recovery would be a more efficientbusiness plan in terms of sales planning or in meeting unforeseen salesopportunities. 3y knowing the. number of clams needed to meet a day' ssales, it would be a simple matter of harvesting the required number ofcontainers. Additional sales requests could be quickly met merely oyincreasin- the number of containers harvested.
An additional benefit from containerization comes from the overall
appearance and condition of the clams' On-bottom clams, as a result oftheir physical contact with the sediment, can become discolored shellsdarkened! and ta'ce on a gritty taste. On the other hand, containerizedclams, since they never come in direct contact with the sediment, havecleaner, whiter shells and none of the grit problem associ"ted withclams taken directly from the bottom. These points, in themselves,could be used as marketing tools, perhaps resulting in a premium pricebeing received for containerized clams.
In conclusion, containerization of relayed clams can reduce clamlosses and hence, increase revenues. In addition, containerization canoffer to the market a superior product in appearance and taste, whilesatisfying health and regulatory requirements.
141

LITERATURE CITED
Arcisz, M. and C. B. Kelly. 1955. Self-purification of the softclam, ~N a arenazia. U.S. Public Health Report 70:605-614m
Becker, R. E. 1977. A basket relaying study off the coast ofAlabama: reduction of coliform bacteria as a function of time and
basket loading. In, Milt, D. S. ed!. Pzoceedings 10th AnnualNational Shellfish Sanitation Workshop. UaS. Dept. Health L'duc.Welfare, FDA, 174-181.
Blogoslawski, W. J. and M. E. Stewart. 1983. Depuration andpublic health. J. World Maricul. Soc. 14:535-545.
Cook, D. W. and G. M. Childers. 1968 ~ Depuration of Biloxi Bayoysters by relaying. Minutes of the Gulf States Marine FisheriesCommission, March 26, 1968, Panama City. FL. 18 pp.
Furfari ~ S ~ A. 1966. Depuration plant design. U. S. Dept. HealthEduc. 6 Welfare, FDA, 119 pp.
Haven, D. S. ~ F. 0. Perkins. R. Morales-Alamo and N. M. Rhodes.
1978. Bacterial depuration by the American oyster Crassostreavair inica! under controlled conditions. Volume I. Biological andtechnical studies. Virginia Institute of Marine Science, SpecialScientific Report No. 88. 160 pp.
Katoz ~ H. and M. Rhodes. 1986. Unpublished results. VirginiaInstitute of Marine Science, Gloucester Point, Va.
Neilson, B. Je a D. S. Haven, F. 0. Perkins, R. Morales-Alamo and M.Rhodes. 1978. Bacterial depuration by the American oyster Crassostrea vair inica! under controlled conditions. Volume II.Practical considezations and plant design. Virginia Institute ofMarine Science, Special Scientific Report No. 88. 48 pp.
Quay1.e. D. B. and F. B. Bernard. 1976. Purification of basket-held Pacific oysters in the natural environment. Proc. N.Shellfisheries Assoc. 66:69-75.
Supan, J. E. and E. WE Cake, Jr. 1982. Containerized-relaying ofpolluted oysters crassostrea vair inica [Gmelinl! in mississippisound using suspension, rack and onbottom-longline techniques. J.Shellfish Res. 2�!:141-151.
Virginia Marine Resources Commission. 1986. Landin s Statistics.
142

ACKNOWLRDGEHKNTS
This work is a result of research sponsored in part by the NationalSea Grant Co11ege Program of the National Oceanic and AtmosphericAdministration, U.S. Department of Commerce, under Grant No. NAG1AA-D-00025 to the Vir=inia Graduate Marine Science Consortium and theVirginia Sea Grant Calle e Program. The U.S. Government is authorisedto produce and distribute reprints for governmental purposesnotwithstanding any copyright notation tnat may appear hereon.
Contribution No. 1436 from the Virginia Institute of 'iarineScience, School of Nari.ne Science, College of William and I~ary,Cloucester Point, Virginia 23062.
143

REFRY>T OF SHIPPING SHUQGG! OYFHGtS LONG DISTANCE
M ISAIM @EIGHT AND FREE LIQUOR CONTENT
Cameron R. Hackney and Lisa K. Sanders
Virginia Polytechnic Institute and State UniversitySeafood Agricultural Experiment Station
102 S. King St., P.O. Box 369Hampton, Virginia 23669
A major problem facing oyster processors is free liquor or drainweight. Free liquor in shucked oysters ranges from near zera to greaterthan thirty percent �,4,6,7,9!. The current national standard for freeliquor content of shucked oysters is a maximum of 5X within 15 minutesafter shucking 8!. This standard is not enforced because it is wellestablished that oysters will lose more than 5X �,6,7!. Also, this isan in-plant standard and it cannot be utilized in the market place.Concerns over adulation of oysters with added water has lead toreconmendations of a 15X drain weight standard.
The Shellfish Institute af North America SINA! conducted a study onthe effect of seasonal variations, geographic area of harvest, NaCllevels, total solids, and storage time on free liquor content;. Onefactor not considered in the SINA study vas the effect that vibration,caused by trucking shucked oysters long distances to markets, has on freeliquor content.
Shellfish processed in one state are often repacked in another.Shellfish for repacking are usually sold by weight rather than volume.Thus, processors often pack a 7 pound pack per gallon. Processors fromthe Gulf area claim that the oyster drain weight decreases because ofshipping. The loss is reported to vary between 10-20X. Of course,repackers want to know of the lass in weight is real. The objective ofthis study was to determine if shipping shucked oysters by truck for longdistances affects drain weight and free liquor content.
The oysters were bought at a processing plant. Twenty-one jars werepurchased for each trial. The oysters vere shucked by hand and vashed byblowing. In this process air is injected from the bottom of the tank toagitate the oysters to remove grit and shell particles adhering t;o theoysters. After 10-15 minutes the air was shut off and vater wasconstantly added and allowed to overflow the tank. The shell particlesand grit settled to the bottom of the tank and the foam generated by theagitation was carried away in the overflow, The oysters remained in thetank for approximately 15 minutes after the air was shut off. Theoysters were removed and packaged without added water into either 12ounce or 16 ounce glass jars. The oysters were taken to the laboratoryin ice.
144

Seven of the jars were tested upon arrival at the laboratory forfree liquor content, drain weight, pH, total solids, NaCl content andmicrobiological quality. Free liquor content, drain weight, pH and totalsolids was tested by AOAC procedures �!. The analyses were done intriplicate.
Sodium chloride was determined by the method of Hackney, et al. �!.Por this procedure, ten grams of oyster homogenate were transferred to aflask and diluted with 50 to 70 mls of distilled water. This was
titrated with 0.171 N silver nitrate solution �9.063 g/L! using 10 to 25drops of O.SX dichloroflurescein in ethanol as an indicator. Agitationwas necessary to keep the oyster homogenate in solution. When salmonpink color developed the titration was stopped. When one gram of oysterhomogenate is used each ml of silver nitrate solution is equal to 0.1 gof NaCl per 100 ml.
Microbiological analysis included testing for aerobic plate count,coliforms, fecal coliforms, and E. cali by Standard Methods �!. For theAPC the appropriate dilution was pour plated with plate count agar andincubated for 5 days at 20 C. Coliforms were enumerated by the 5 tubemost probable number MPN! technique using lauryl sulfate broth andincubation at 35 C for up to 48 hours. An inoculum from all positivetubes was transferred to E.C. broth and further incubated at 44.5 C for.
an additional 24 hours to test for fecal coliforms. E. coli was
determined by streaking each positive EC tube to cosine methylene blueagar and testing suspect colonies by IMViC �!.
The remaining 14 packs were divided into two equal lots. Sevenpacks were placed in ice and held at the laboratory. The other sevenjars were pLaced in ice and shipped round trip by refrigerated truck.The truck traveled a distance of between 1000 and 2000 miles and was gone4-7 days. When the trucked samples arrived back at the laboratory all 14packs were analyzed for free liquor content, drain weight, pH, NaClcontent, total solids and for microbiological analysis as describedabove. This study was repeated 7 times. In two of the trials, oystersfrom the Gulf Coast Louisiana! which had been transported, to Virginiafor repacking, were obtained and tested as described.
Statistical analyses were performed by the method of Snedecor andCochran �0!.
RESULTS MD DISCUSSION
It is common practice to process oysters in one state and repackthem in another state. These oysters are often sold by weight.Processors have long claimed that at certain times the oysters may loseconsiderable weight during shipping. According to processors, oystersfrom the Gulf Coast are particularly prone to losing weight duringshipping. The weight loss has been blamed on vibrations encounteredduring shipping. The results of this work showed that the weight loss isa real phenomenon; however, the loss was due to the age of the oystersafter packing and not vibrations encountered during shipping Table 1;compare control at day 0 vs stored samples!. Statistical analysis of the
145

7 trials with 7 replicates in each trial could not detect significantdifferences in free liquor content, pH, total solids and microbiologicalnumbers in samples which had been held in the laboratory and samplesshipped for up to one week for distances of over 1000 miles Tables 1, 2,3, 4, 5, 6!. However, there were significant differences p! O.G1!before and after storage with respect to X free liquor, aerobic platecounts and pH, especially with the Gulf Coast samples Trials 6 and 7 ofeach of the tables!.
This work clearly points out the importance of keeping the timeinterval between processing and repacking as short as possible. Prom aneconomic standpoint, older product will have a decreased drain weightwhich could affect profits, especially if a packer is repacking oystersprocessed on the Gulf Coast. The oysters processed in Virginia, did notlose as much weight as oysters processed in Louisiana and thus regionaldifferences are important.
Table l. Effect of storage and shipping on the 1 free liquid of shuckedoysters .
Transportedby Truckc
ControlTriala Day 0
Control
not shipped
a each number is mean of 7 replicates per trialcontrols were held in ice at GoCsamples were shipped in ice on round trip run of 1000-2000 miles
146
6.30
6.30
11.97
15.50
8.003.52
2.50
5.556.02
11.93
11.68
6.6315.G6
14.73
11.21
4.57
11.68
13.13
4 ' 63
11 ' 3414 F 11

Table 2. Effect of storage and shipping on the X total solidsof shucked oysters
Control
not shippedTransported
by TruckcControl
Day 0Triala
a each number is mean of 7 replicates per trialb controls were held in ice at 0 Cc samples were shipped in ice on round trip run of 1000-2000 miles
Table 3. Bffect of storage and shipping on the pH of s3aacked oysters
Control
not shippedControl
Triala Day 0Transported
by Truckc
each number is mean of 7 replicates per trialcontrols were held in ice at 0 C
samples were shipped in ice on round trip run of 1000-2000 miles
147
1
2 3
4 5 6 7.12.07
12.09
7.95
9.00
12.09
13.51
13.11
6.82
6.80
6.67
6.86
6.38
6.16
6.32
12.1512.20
7.88
8.34
11.67
14.49
14.24
6.50
6.40
6.526.60
F 14
5.545.77
12.36
12.19
7.68
8.40
11.84
14.17
13.93
6.36
6.38
6.57
6.63
6.12
6.03
5.89

Table 4. Effect of storage and shipping on the aerobic plate count ofshi eked oysters
Transportedby Truckc
Control
not shippedbControl
Triala Day 0
a each number is mean of 7 replicates per trialcontrols were held in ice at 0 C
samples were shipped in ice on round trip run of 1000-2000 miles.numbers are given in logarithm of the colony forming units per gram
Table 5. Effect of storage and shipping on the coliform counts/gram ofs&icked oysters
Control Transportednot shipped by Truck
ControlTrials Day 0
a each number is mean of 7 replicates per trialcontrols were held in ice at 0 C
samples were shipped in ice on round trip run of 1000-2000 miles
148
4.80
4.90
3.964.92
5.30
5.31
45
23
22 9 044
23
5.35
4. 79
5.94
5.12
5.93
8.26
6.92
10
27
84
22
1500
43
4. 94
5. 03
5.80
4.74
6.34
7.13
6.87
15
26
7 357
525
23

Table 6. Ef f ect of storage and shipping on the Rscherichia colicounts/100 g of shucked oysters
Control
Day 0Control
not shippedbTransported
by TruckcTriala
a each number is mean of 7 replicates per trialcontrols were held in ice at 0 C
samples were shipped in ice on round trip run of 1000-2000 miles
1. American Public Health Association. 1984. Compendium of Methodsfor the Microbiological Examination of Foods. Am. Pub. Hlth,Assoc. Washington, Dc.
2. Association of Official Analytical Chemists. 1980."Official Methods of Analysis of the Association of OfficialAnalytical Chemists. Washington, DC.
3. Feiger, E.A., Novak, A.F., and Bailey, M.E. 1958.Composition of Gulf oysters, Manual of Seafood Merchandising.
4. Galtsoff, P.S. 1964. The American Oyster, Crassostrea~vir inicegmel,in. U.g. Government Printing Office,Washington, DC.
5. Hackney, C., Sanders, Lvg Rippen, T., and Reily, L. 1988.Improved Method for Determination of Salt in Oysters by DirectTitration of Chloride Ion. J. Food Sci. 53:
6. Hoff, J.Ceg Beck, W.J., Erickson, T.Meg Vasconcelos, G.J., andPressnell, W.M. 1967. Time-temperature effects in thebacteriological quality of stored shellfish. II. Bacteriologicalchanges in shucked Pacific oysters and Olympia oysters. J. FoodSci. 32:125-128.
7. Novak, A.Fvg Pieger, E.A., and Liuzzo, J.A. 1962. Free liquidcontent. of Gulf oysters and suggested change in standards. U.S.Fish and Wildlife, Bureau of Commercial Fisheries, FisheryIndustrial Research. 2:1-3.
149
110
10
0
00
1000
60
670 0 0 0 00 170 0 030 0

8. Office of the Federal Register. National Archives and RecordsService, General Services Administration. 1985. Codes of FederalRegulations. Food and Drugs. U.S. Government Printing Office,Washington, DC'
9. Sidwell, V.D., Loomis, A.L., and Grodner, R.N. 1979.Geographic and monthly variations in composition of oysters,Crasscsrrea ~vir inica. Marine Fisheries Review, March ,13-17.
10. Snedecor, G. and Cochran, W. 1967. "Statistical Methods" 6thed. The Iowa State University Press, Ames, Iowa.
This work was supported by a grant from the Gulf and South AtlanticFisheries Development Foundation Incorporated Tampa!.
150

LIQUID LOSS IN SHUCKED EAST AND GULF COAST OYSTERS DURING STORAGE
David WE CookGulf Coast Research Laboratory, P. 0 ~ Box 7000
Ocean Springs, MS 39564
Tuu-jyi ChaiUniversity of Maryland, P. 0. Box 775
Cambridge, MD 21613
Cameron R. HackneyVirginia Cooperative Extension Service, P. O. Box 369,
Hampton, VA 23669
W. Steve OtwellUniversity of Florida, 467 Food Science Building
Gainesville, FL 32611
Dorm R. WardTexas A 6 M University, 442 Kleberg Center
College Station, TX 77843
Roy E. MartinShellfish Institute of North America, 2000 M Street, N.W.
Washington, D. C. 20036
INTRODUCTION
Oysters have traditionally been sold by volume with the mostcommon retail packs being 10, 12 and 1b fluid ounces. To protect theconsumer from the fraudulent practice of substituting water foroyster meats in the container, the Code of Federal Regulations CFR![1] describes the processing, draining and packing requirements.However, because processing plants are not under continual inspectionand because there are no National Standards applied to the oysterafter they leave the plant, it is impossible to insure that the CFRrequirements are adhered to.
A different approach to protecting the consumer would be toestablish a market level standard for the maximum amount of drainedliquid allowable in packs of oysters. Any such standard should benational in scope because oysters harvested in one region may beshucked and packed in another region. To set such a standard,adequate knowledge of liquid loss by oysters packed under CFRrequirements is necessary. That data should evaluate regional,seasonal and environmental effects on liquid loss during storage.
Several studies �, 3, 5, 6] have been conducted on liquid lossfrom shucked oysters during storage. That data, however, has
151

limited to studies on oysters harvested from a fewharvested during one season of the year, oystersunknown or unreported sources, oysters by unreporteddata which included only a few time points.
generally beenareas, oystersharvested fromprocedures and
This study was undertaken to determine the appropriateness ofthe proposed 15X drained liquid standard for oysters at the retailmarket level.
METHODS
To censure that this research would be applicable to theindustry, all harvesting, shipping, shucking and packing procedureswere those normally used in the industry with the exception that CFRprocessing requirements were adhered to as near as possible.Regional differences in the liquid loss were evaluated by testingoysters packed in three East Coast and six Gulf Coast plants ~ Inthis study, only oysters harvested in the region of the plant wereprocessed at that plant. Seasonal differences were tested bysampling oysters at the same plane at intervals of approximately sixweeks from March through December, 1986.
On each sampling day the plant was visited, checked to see thatthe oysters being processed were harvested from the area where theplant was Located and that the processing met the CFR requirements.None of the data reported here was gathered from oysters which hadbeen processed with blowing.
Thirty five containers of oysters were then collected and packedin crushed ice until they were examined. Oyster packs were 12 oz.size in all plants except plant A which used 10 and 12 oz. size andplant D which used 16 oz. size. An initial drained liquid contentand count of meats was measured on 5 containers within fifteenminutes after packing where possible. In some cases, thesemeasurements could not be made in the plant, but were done within 3hours, when the oysters were returned to the laboratory. The drainedmeats were homogenized and analyzed for pH, total solids and salt.Samples were collected and archived for glycogen analysis. Allanalytical procedures followed those outLined by AOAC [4]. At threeday intervals for LB days after packing, 5 containers were removedand examined for X drained liquid, count and pH.
152
In spite of limited scientific data, several states havepromulgated market level standards for free liquid in oysters Maryland, 5X; New York, 10X; Florida, 15X!. The InterstateSheLlfish Sanitation Conference and The National Conference onWeights and Measures have adopted a national market standard of 15Xfree liquid but the groups have no regulatory authority and must relyon individual states to promulgate and enforce reguLations.

Attempts were made to sample each plant at 6 week intervals,thus collecting 7 samples during the study period. Unfortunately,some samples could not be collected because of the unavailability ofoysters from the desired source at that time.
RESULTS AND DISCUSSION
Pigure 1 presents drained liquid D.L.! data from East Coastplants. Plant A was in Virginia and plants B and C ia Maryland.Data was combined over all samples and replicates for each storageday. The heavy bars represent one standard deviation aad thewhiskers extend to the maximum and minimum values recovered for that
day. The mean for each day are connected so that the trends can beobserved. The number in parenthesis above the whisker on day-0represents the percent of samples above 5X and the numbers above thewhisker on other days represents the percentage above 15X.
Mean day-0 XD.L. ranged from 3.3 at plant B to 6.6X at plant C.The large percentage of samples exceeding 5X on day-0 was attributedto the fact that the measuremeats were made 1 to 3 hours afterpacking aad/or that the drain time for the oysters was not the full 5minutes. During storage the oyster packs decreased in drained liquidbefore they began to increase. At day-18, mean XD.L. were 7.8, 2.6and 4.8 at plants A through C, respectively. Similar treads inliquid loss had been reported for Chesapeake Bay oysters [2].
In East Coast region, data was collected on 700 containers ofoysters representing 20 separate lots. Of these, only 6 containers�.86X! exceeded 15X D.L. with the highest value being 20.9X. One ofthese containers was encountered oa storage day-15 and 5 at day-18.
An entirely different picture was obtained with Gulf Coastplants Figure 2!. Plants P, G, and H were located in Louisiana.Plant I was located in Mississippi but processed Louisiana oysters.All plants averaged below 3X drained liquid 15 minutes after packingaad only a small percentage exceeded 5X. There was a rapid increasein XD.L. during the first three days of storage followed by acontinual but more gradual increase. At day-18, the mean D.L. rangedfrom 6.6 at, plaat E to 9.8X at plants P and G. In these 4 Gulf Coastplants, 26 lots of oysters consisting of 908 containers were tested.Ten containers �.1X! exceeded 15X DE L. with the highest valuereached being 17.1X. One of those containers was encountered at day-12 and the others at day-15 aad 18.
Oysters harvested in Florida plant D! and Alabama plant E!showed the same trend in liquid loss as did the other Gulf plants,i.e. large initial liquid loss followed by a steady increase Pigure3!. At plant D, the mean day-0 D.L. value was 6 ' 3X by day-6 the meanD.LE exceeded 15X and by day-18, the mean was 20.7X. The highestD.L. value recorded was 33.1X. Plant E data consisted of only four
153

0 as
OO
C W 00 a0 W
ol5JJ
0 $
a'0
~ QClWg
� OW0I 4 V 0
0l0I C
00 0l 4Cl W
0 8 u
l54
1 a%
0l00
0 a04
0l 04 4J0l R
C a0 0JJ
V 't7
V�a0
~ 0W
a04l�
Q ~I0
C'0 a00I W
lJR a00
W O0
4J8 t800 a04JC Co V
0I 0Caa W
Clj
C a0
0I
0 a0a0
0l0 ~
S'0 4JC 00

12
O 8 0 3 6 9 12 IS 18 0 3 6 9 12 15 18PAYS OAYS
Figure 2. Percentage of drained liquid X D.L.! in containers ofoysters packed in Gulf Coast plants. Data for each day of storagewere combined over samples and replicates. See text for explana-tion of figure.
155

alu OJ
QJcd M
6C cd
'0 cdcd
00 cd 'C0 cd
Ccd
e 8u Q
0 cd
4j0
Cd CLCccd
dCC 4
Qcd u
cd
Q WV 0
C W 4
OD~ C +
0 W
aalw0
~ 0 CQ
U cdu cd
0 cd C~a m
C~ g edc ~ QjC
8cd cd 0'4 JD W'g cd
u
Q~ Su
cd Wl00 CJcd u Q4 uCcaC cdcd MV F4 ~
dCcd 'C cdf4 C u cd
0~ ~
cd'U C
I+ dc
0OOM '0M W C
cd
CO cl' O % A COCV CV ~ e�
10
156

samples, two of which had very high XD.L. and two of which had verylow XD.L. Although the mean for that plant was less than 15X, almost50X oi the samples exceeded 15X D.L. during the latter portion ofstorage. Possible reasons for these plants differing from other Gulfplants will be discussed later.
These data suggest a regional difference in liquid loss fromoysters during storage. These differences are emphasized in Figure 4whi.ch presents the mean XD.L. for each plant averaged over samplesand replicates for each day minus the initial day-0! XD.L. Drainedliquid values below 0 indicate that the oysters were absorbing someof the liquid ia the container. East Coast plants A, B, and C!showed slight declining levels of D.L. from day-0 to day-6 and thenincreasing levels from day-12 to day-18. In contrast, all Gulfplants D through I! show the greatest increase in D.L. between day-0and day-3 with approximately linear increase in D.L. after day-3.
The data from the East Coast plants did not suggest any seasonaltread in D.L. However, a plot Figure 5! of mean day-15 increase inXD.L. for each sample suggests a seasonal trend among Gulf plants.
Ia the Gulf Coast region it was found that the percent salt wasnegatively correlated to the XD.L. When this information wasincluded in the statistical analysis, it was clearly shown that themean of XD.L. for samples 1-3 were significantly larger than themeans for samples 5-7. Sample 4 was not significantly different fromany other sample means. Thus, the spring and early summer oystersfrom the Gulf Coast might be expected to show higher D.L. than latesuszaer and fall samples'
The noted correlation between salt concentrations and XD.L. mayhelp to explain the large D.L. values at plants D and E. Samples 2and 6 at plant E had high salt content �.50%! and low D.L., whereassamples 1 and 3 had low salt content �.21%! and high D.L. Saltdata are not yet available from all samples from plant D, but samples3 and 4 which had the lowest D.L. had very high salt values. Oystersfrom the other samples at plant D were archived and will be analyzedfor salt content. That data will be useful in assessing plant Ddata.
It should also be noted that the oyster beds ia Florida andAlabama were significantly disturbed by a hurricane about 6 monthsbefore the March samples were collected. That event weakened theoysters and may have contributed to the high DE L. in sample 1 fromplants D and E.
To summarize, these data have demonstrated that a regionaldifference existed in the rate at which oysters lost liquid andwithin the Gulf Coast region, there were seasonal differences inliquid loss. Further, withia the Gulf Coast region, there was aainverse correlation in salt content and liquid loss.

0 4 O Cccl4J
0 0
0c4
CO~We
4O
0CLIOCIc54JC
5
Cl
cll
V C
1'0 %
158
CV 0 Cvf
Cl!4JC ~ccl M
CIlcg
CICI V
Cll PeICI CIJcll0 0 0
C0 ccl
cll ccl4J IllcclV
'0C N
cCI cll
dl 0V 'tJCll 8
ceo
4~ Ill
CIJIc0 cclCCI
IIl04J cllccICIO QIC cICI
40
4 c4III 04JCCI> «cl0 'C

20
'
4~ ml
4g
10
12345671 2 323467
45g
1 2 3 4 5 6 71 2 3 4 5 2 3 4 5 6 7
159
SA NIPLE
Figure 5. Mean percentage increase in drained liquid % D.L.! ineach sample of oysters during l5 days of storage. Data averagedover replicates.
Dates3/07-37264/16-5/015/29-6/267/05-8/079/05-9/220/10-11/291/07-12/17

Table l. Observed percentage and estimated probability ofoysters packed under CFR requirements exceeding15X drained liquid.
EAST COAST REGION GULF COAST REGION
EXC. P-D!OBSERVED ESTIMATE OBSERVED ESTIMATE OBSERVEDDAY
O.OX 0 ~ OX O.OXO.OX O.OX
O.OX 4.4X 1.9XO.OX O.OX
O.OX O.OX 8.1X 0.7X
O.OX O.OX 2.0X
O.OX O.OX 6.7X12
1.0X O.OX 10.0X
5.0X18 l. 2X 8.8X
160
- Excluding data from plant D.
11. 7X
14.4X
18.3X
20.1X
18.6X
12.4X
19.6X
21.9X
26.6X

Considering these factors, let us now look at the appropriate-ness of a 15X drained liquid standard for retail market leveloysters. Table 1 shows the observed percentages and statisticallyestimated probability of oysters packed under CFR requirementsexceeding 15X drained liquid.
Since plant D produced oysters that exceeded the 15X D.L. on afrequent basis, one may draw the conclusion that there is somethingdifferent about the operation of that plant. However, otherresearchers [3] have observed that oysters harvested fromApalachicola, Florida reefs in the spring lost up to 28.1X liquidduring 7 days of storage. These findings indicate oysters from thatarea may warrant further investigation.
ACRNOWLEDGEMENTS
This research represents a portion of a larger project entitledMolluscan Shell, fish Market Standards which was developed by Roy E.Martxn of the Shellfish Institute of North America SINA! and whichwas funded in part by the National Marine Fisheries Service NMFS!under the S/R program.
REFERENCES
Code of Federal Regulations, 21:161.130. U. S. GovernmentPrinting Office, Washington, D.C.
Kramer, A., Willis, B. H., Edge, R., Smith, H. R., Tubman,A. W., Lee, C. F., and Tompas, C. 1962. The "Government-Industry Oyster Research Program, Part III, Processing Studies."Journal of the Association of Official Agricultural Chemists,45�!:1011-1037.
2 ~
Miles, B. J. 1979. "Free Liquid Content of Oysters Harvestedfrom Apalachicola Bay During the Month of March, 1978."Proceedings of the Fourth Annual Tropical and SubtropicalFisheries Technological Conference of the Americas, Texas A 6 MUniversity, College Station, TX, p. 38-47.
3.
Official Methods of Analysis, 13th Ed., Association of OfficialAgricultural Chemists, Washington, D. CD
161
East Coast oysters rarely exceeded 15X DE L. and there should beno problem with East Coast plants which process East Coast oystersmeeting the 15X standard. Data from the Gulf Coast region suggestthat under certain conditions, oysters may not be able to meet the15X standard. This data was greatly influenced by results from plantD. When plant D data was removed, 98X of the samples could meet the15X standard after 9 days of storage and 90X could meet the standardafter 15 days of storage.

5. Rychener, J. H., Rhodes, M., and Woodward, 8. 1985. "OysterFree Lzquxd Content and Related Physical and ChemicalCharacteristics." Proceedings of the Tenth Annual Tropical andSubtropical Fisheries Conference of the Americas, Texas A & MUniversity, College Station, TX, p. 275-290.
6. Waters, M. E., Wood, 8. J., and Haines, G. J. 1978. "OysterDrip Loss Part I, Variability of Drip Loss in CommerciallyShucked Oysters from Gulf States." Proceedings of the ThirdAnnual Tropical and Subtropical Fisheries TechnologicalConference of the Americas, Texas A & M University, CollegeStation, Tx, p. 116-225.
162

AN ECONOMIC ANALYSIS OF THE GULF OF MEXICO
SHELLFISH PROCESSING INDUSTRY'
Walter R. Keithly Jr.Center for Wetland ResourcesIouisiana State University
Baton Rouge, LA 70803
Kenneth J. RobertsCenter for Wetland Resources 6Cooperative Extension Service
Louisiana State University
and
Charles M. Adams
Dept. of Food and Resource EconomicsUniversity of Florida
INTRODUCTION
Among National Marine Fisheries Service statistical reportingregions New England, Mid-Atlantic, South Atlantic, Gulf of Mexico,Pacific, and Alaska!, the Gulf of Mexico region hereafter referred to asthe Gulf region! has traditionally been the largest contributor to thetotal value of U.S. processed fishery products. With annual employmentin this region's processing sector exceeding 16 thousand full-time andpart-time workers, approximately 25 percent of the U.S. processed fisheryvalue is attributable to the Gulf region.
Shellfish products, averaging about three-quarters of the total Gulfregion processed fishery value, represent the bulk of production byvalue! among processing establishments.s The information and relatedanalysis in this report pertain to the shellfish processing sector.Specifically, industry stability, size, sales concentration, anddiversification among establishments in the region are examined.
A more complete understanding of the Gulf of Mexico's shellfishprocessing sector, while appealing from a theoretical viewpoint, isessential from a practical viewpoint. This is because industry andgovernment efforts aimed at evaluating market legislation, managementalternatives, and long-term trends all require an understanding of theprocessing sector. Mandatory seafood inspection and generic promotion ofseafood provide prospects for change within the seafood sector. Theobjective of this paper is thus to furnish an analysis of the Gulf regionshellfish processing sector to enable sound evaluations of such prospects.
The following information and discussion is directed toward totalshellfish processed value and.key species shrimp, oysters, and bluecrabs!. It is derived from unpublished processed fishery productsstatistics provided by the National Marine Fisheries Service. In achievingthe overall goal of this study, the authors focus on the pattern ofconcentration and stability among processing establishments. This isbecause concentration and stability can affect a! the ability of
163

processors to acquire raw material, b! entry of new processing firms, c! sales growth, and d! addition and/or deletion. of species fromcompany offerings.
The paper is organized as follows. Background information on theGulf region seafood processing sector is given first, using availablepublished data. Following this background information, a discussionpertaining to the stability, size, concentration, and diversificationamong Gu1.f region shellfish processing establishments is provided. Thepaper concludes with a discussion of implications of the analysis whichcompanies, agencies, and trade groups may wish to consider when trying toestimate the impacts of regulatory and market changes.
BACKGROUND INFORMATION
The Gulf region seafood processing sector has been experiencinggrowth in, both the number of establishments and the value of processedproducts Table 1!. The number of establishments, averaging 392 annuallyduring 1971-74, increased to 412 during 1976-80, and rose again to 473during 1981-85. More than 16 thousand seasonal workers were employedannually by, these 473 establishments Table 1!.
The total value of processed products increased from an annua1.average of about $421 million during 1971-75 to almost $1.3 billionduring 1981-8S, or about 200 percent. Much of this increased value canbe attributed to inflation, i.e., the upward trend in prices throughoutthe U.S. economy. If one removes the upward trend in value caused onlyby inflationary effects+ this gives the value in what is referred to asreal or deflated terms. Expressed in this manner, the total value of theGulf region processed fishery products increased slightly less than 40percent between 1971-75 and 1981-85, from $308 million to $422 million.
Shellfish have consistently averaged at 1.east three-quarters of thetotal value of processed products in the Gulf region Table 1!. Themajority of shellfish processing, at Least by value, originates from theprocessing of shrimp Table 2!. Shrimp, oysters, and blue crabs accountfor more than 9S percent of the Gulf region shellfish processed value Table 2!. Stone crabs, spiny lobsters, scallops, and crawfish comprisemost of the remaining processed value.
The value of Gulf region processed shrimp products increased from anannual average of $279 million during 1971-75 to $822 million during1981-85, or almost 200 percent �5$ after removing inflation!. Therewas, however, a sLight decline in the deflated Gulf region processedshrimp value between 1976-80 and 1981-85 which is somewhat unexpectedgiven the rapid increase in shrimp imports. Many of these imports are,however, already canned which requires little or no additional domesticprocessing. Also, the deflated price of the processed product may havedeclined slightly in recent years, largely the result of increasedimports. Gulf region processed oyster value increased about '175 percent,but less than 30 percent �8.7$! after removing inflation. Only marginalgrowth, however, was observed between 1976-80 and 1981-85, indicatingthat most of the increase in real value occurred during the decade of the1970's. The largest relative growth in processing among the three keyGulf region shellfish species is that related to blue crab activities.From an annual $12.4 million dollar industry during 1971-75, revenues
164

lll 04
l4 '0 4I
IJa
u IJ
0 4Cc
Ih NVl 'H4' Ccl
'0 CP
4lIJ0 VP4 00
4P
ClIJ0 4
W 0
W 0
r 4r 40
Cl0
Vl IN
0
W C
COI
Oc
SlJJIJ
0 Cc
r W Clr N
a Sl'ptW
lc00 IJ4CO 4JJCJ
0 ~ I4 0 IJ
00C
0 lcCc
O NIM ca ca NIIII Clhl ~
CPd l4
40
0 0W 4 4
'0 ~4P CPu cp4
W 0 IP'0ICl car Oc
rl 4l4 c0C0 0Sl cu4 gcCQ Cl
CPcJIIcc0 CJ
4
W 0u 0a4J
d'pl0 ~u 4PCl r404 4elIS 4l44 4ICu ICcaIU4 4INrac u
JJdW 4l
0 g4 4Pa cupa
4 4
0 icl4
'0 Cl
44 0 4Cc
4l
0VJ
W 0IS4 4u ~ 0u40
0 044P
~ IIJ0 4 CcCl
W 04
u ac0 tu
O'4 4P4a >
04~ 4
0
CO
I II CO MI I %40I W IclII I IIIIIIIIIIIIIII CP 00~ 4 00
0
IIIIIIIII ill&II Pl hlIIIIIIIIIIIIIII aIIIIII
0
d 4 OlC 40 4cl 8 ll Clu 400a 4 4Cl 4 Cc Il304lwSl IJrc44 4a 4 r 8Ndcuu4 W4I 0 rl Iu00W w tOClm 4CIC 45 N ISISCl Cl ClIJ r JJ0 u cc 00Cc d 0'cS4 c00 ea 0Sl '0 c0 0'IJ dr 44 m 0a IJ 4 IS
4 Cca4'8 SIIJ 4 44 0 4P
r Cp 04P0C
Cl r '04I44 4.A'0
Nc CcV l4 IJ OcCJ 4 C'4 .64 ac 44 4 Cl4 .c0 ll Sl
4l K 4 Sl0 'TC u Ku 0004 *Cl CP c0a aa 444 CclSl .6 ~ mO Sl Slg .4O 0 4 W0 Cl 0
4 0u 4 0IJ g .cc 00IS Sl c4 Cllla 4'c0 sl0 4CP 4l 0 !w r00c 00 4 C4C4Sl 00 48 Cl IJ NCC 4 IS4 Sl cSCp .4 csIJ
4 gu4 CPac 00u0 Oca
4 4 N44 Sl NCl ClIS 4 IJlS 044 >
165

Table 2. Gulf of Mexico Processed Shellfish Value for Individual Speciesand in Total, 1971-85 �-yr. average!.
Value of Processed ProductsTotal
Shellfish
Blue
Crabs OystersTime Period Shrimp
Million dollars
12.4 b 8.9!
1971 - 75 avg. 18.8
�3.6!
1976 - 80 avg. 25.0
�2.4!
41.4
�3.8!1981 - 85 avg.
Source: Processed Fis~erF Products, Annual ~Summer various issues!a
Total shellfish values exceed the horizontal summation of individualcomponents in the table because of inclusion of shellfish speciesother than shrimp, oysters, and blue crab.
bNumbers in parentheses refer to the deflated value i.evp correctedfor inflation! of processed products with 1967 representing the baseyear i.e., 1967 = 1.00!.
cThe 1981-85 average blue crab value reported here is less than thatprovided in Processed Fishers Products, Annual ~Scorner . Thisdifference reflects errors in the data base from which statisticsreported in Processed F~ishe Products, Annual ~Summer are derived.This correction was not carried over to total shellfish processedvalues.
166
32.3
�6.3!
52.0
�7.5!
279. 0
�05.3!
597.9
�96.2!
822.1
{276.0!
315. 4
�31.4!
679.3
{336.5!
957.7
�21.3!

from blue crab processing activities increased more than 230 percent �5$after removing inflation! to $41.4 million annually during 1981-85.
The ability of the Gulf region shellfish processing sector tomaintain the long-term growth trend established during the past severalyears will depend on at least two factors. Demand for seafood and valueadded processing must first remain strong. Second, processors must beable to secure adequate raw material supplies. Shrimp processors, forexample, have probably turned increasingly to imports in their processingactivities in order to supplement relatively stable domestic supplies.Prochaska and Andrew �974!, in fact, have shown that Florida shrimpprocessors have traditionally relied heavily on imports. Gulf regionoyster and blue crab processing activities, on the other hand, appear torely almost, if not entirely, on domestic production. Most of the rawmaterials in these activities are of Gulf origin and there has beenlittle tendency to secure oysters and blue crabs from import sources.The ability to expand real processing revenues in these activities,assuming there is no increase in real price, will therefore depend uponmore domestic landings and better utilization of landings.
STRUCTURAL CHARACTERISTICS
Structural characteristics of the Gulf of Mexico shellfish processingsector are presented in this section of the report. These characteristicsare grouped according to �! stability among establishments in theindustry, �! establishment size and changes over time, �! concentrationamong establishments in the shellfish processing industry, and�! diversification among establishments in the industry.
Industry Stability
Industry stability can be measured in a number of ways. One way isby analyzing patterns of entry and exit among establishments in theindustry. These patterns are presented for the Gulf region shellfishprocessing sector in Table 3.
The total number of Gulf region shellfish processing establishments,as indicated in Table 3, increased by more than one-hundred between 1970and 1985 �10 to 411!. This increase occurred during a time period whenthe number of establishments processing the most valuable Gulf regionshellfish species, shrimp, declined in number �26 to 114!. Establishmentsprocessing blue crabs showed the greatest relative and absolute increasesin number; 94 in 1985 compared to only 56 in 1970. The number of oysterprocessing establishments increased only marginally during 1970-85, from174 to 185.
There is, as indicated in Table 3, considerable movement within theGulf region shellfish processing industry. This movement is the resultof entry and exit as establishments add and delete species from processinglines or, in the extreme, begin or cease all shellfish processing activitiesThis movement is considerably more than what would be anticipated whenobserving only the 1970-85 change in number of processing establishments.Among establishments processing shrimp, for instance, the average five-yearentry rate was roughly 57 percent, while the exit rate exceeded 60 percent.The 1976-1980 period appears to be the most volatile, possibly the result
167

40IO o
lcQc
CSll
0
~ 0 ~ 4 Q40
u 0
o
I ICrl
I0'
CClCl
C Q
0W ChCV
u 0cv
JJd u 0
f
4uIC
Cl
CI
ISIII40 W 040
C ClcrJ0'Pt4I
0
W O W 0
ClO 0
Q 4 Qu CQ 4I
0 Ilail
u C 4I0'Q
a Q 0CI
Q QkNI
C
u C
4 0CQ
ISN
NN 0Isl Cl
IJW Il0 00
C4I Nu AIS CJ04
Q
a 0 IJ0
Qu 0
I
O Ch IrlrCh
00I
O 00Ch
~ rI40I
Ch 40
4I
I0
~ 44 Q
A OvQ a~ 4 4
C
0 Ilail0 Cl
Q
~ 0 d C4
'C7
Q N'
0
QQ IJ
Q C QA 0 alN
CN A Q0'Q Q m4 Ck
g CC
N M 0IJ u IJ~ 8
C W
u 'N SlND~
'C N 0a Q u
40 ClE'wa Au
Na N~Q QrcIJ ~'cr 0Qu C.aIS
'UCpuN e 0 IS
4 Q u 40 N IJ IJ ~I0 a ISSl N QQ IJ NIJ Q IS mOA QA
a44 N 'N 'crQ l4 Cst d SlN IJAQal il NN'4 4
Q QQUAA SI u NN 'Cl C 00 NCl CWW
C 0 Sl~CA slI0 0 IS J0IJ0uW
'0 0 Q44IJISQ IQ~ H
W Sl000C~ A
0 IJIJ0
u lc
C Q
44Q Q04
A il
0 4l
Q
u IJ'0 0
IH Q
A 4l
0
4 0 SIcJ0 4
Q'0 IJC QJ0IS
C lcZl
16B

of rising energy costs and a recession towards the end of the decade. Ofthe original 126 establishments processing shrimp in 1970, only 45, orslightly more than one-third, also processed shrimp in 1985 not shownin Table 3!.
The rate of movement among Gulf region establishments processingoysters has averaged about 75 percent over a five-year period, with therate of entry �7.6 percent! slightly exceeding the five-year rate ofexit �5.5 percent!. Exit and entry among establishments processingoysters exceed that for shrimp, likely the resuLt of two factors. First,oyster processing activities tend to be less capital-intensive thanshrimp processing activities which, theoretically, would allow for moremobility in the oyster processing sector. Second, there tends to beconsiderable annual variation in the Gulf region oyster harvest which canimpact processing activities. Unlike shrimp, this variation is notmitigated to any large extent by using imported oysters in processingactivities. Fifty-aine of the 174 companies processing oysters in theGulf region in 1970 were also processing oysters in 1985 not shown inTable 3!.
Ninety-four establishments processed blue crabs in the Gulf regionin 1985; only 19 of these same establishments were also processing bluecrabs in 1970. The average five-year rate of entrance 85.1$! hasgreatly exceeded the rate of exit �8.7$!, explaining the large increasein establishments processing blue crabs.
The total Gulf region shellfish processing sector, as would beexpected based on the discussion of the individual shellfish species, canbe characterized by considerable movement in terms of entry and exit.Only 128 of the 310 establishments processing shellfish in 1970 continueddoing so in 1985. Overall, the five-year entry rate has equalled about10 percent compared to a 61 percent exit rate with a net result of about100 more establishments between 1970 and 1985. While the total number ofshellfish processing establishments increased by more than 100 between1970 and 1985, establishments processing key species shrimp, oysters,and blue crabs! increased by onLy 37, i.e., shrimp -12, oysters Il, andblue crabs 38. Hence, the majority of growth in the number of shellfishprocessors between 1970 and 1985 can be attributed to the processing of"non-key" species such as scallops, clams, etc.
Establishment Size
Establishment processing revenues associated with key shellfishspecies and total shellfish are presented in Table 4. Also presented arerevenues for establishments entering and exiting processing activities.Total shellfish processing revenues per establishment have increased froman average of $947 thousand annually during 1971-75 to $2.2 millionduring 1981-85, or about 135 percent. After removing inflation, however,establishment revenues have increased by only about 10 percent. Deflatedestablishment revenues from the processing of shellfish during the1981-85 period $754.8 thousand! were, in fact, below those earned duringthe 1976-80 period $883.5 thousand!. New processing establishments, aswould be expected, have sales below the industry average. Establishmentswhich exit the seafood processing industry have annual sales below theindustry average and, in fact, have sales below the average of entering
l69
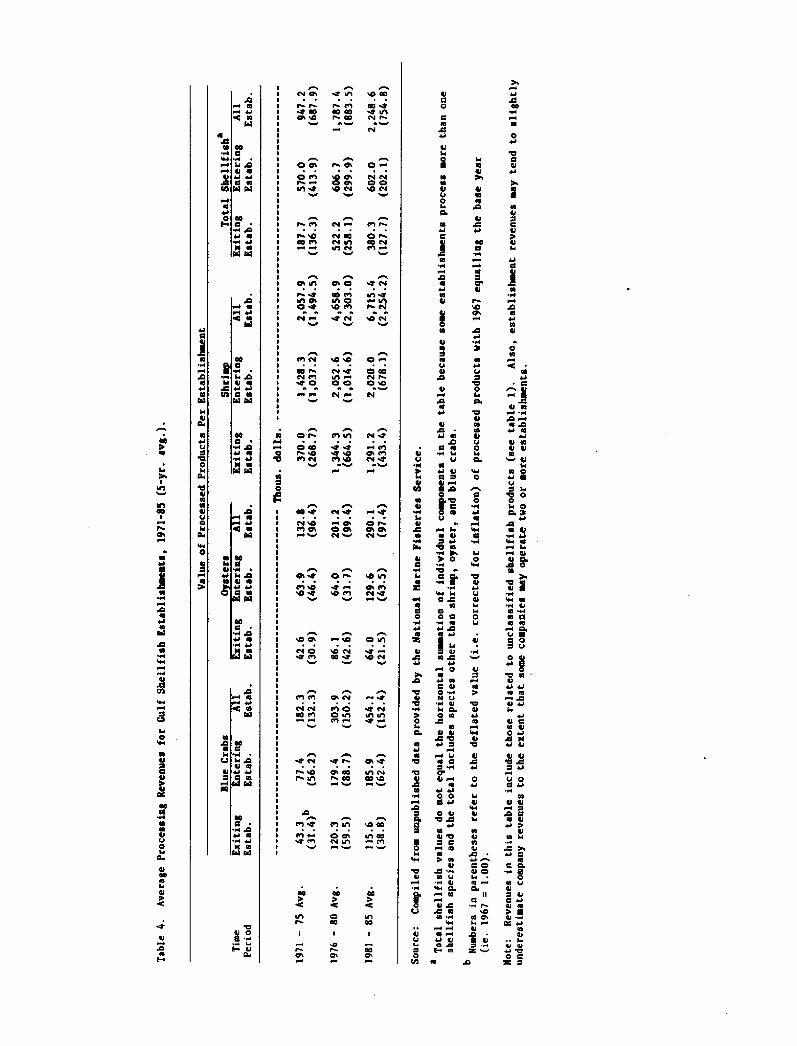
00krACIS~ JNfal N
C40IJ
AS
0CO
~ I0 CJ04kk
0 0 C 0 4 CI4
Al4
00d
d
~ rAC4
0
AC40
0IS
pds
a
00
004
0
IJCISl
0 IJ0As
NwIv0
NIJ'Cl0l4
ld l0
CIS W 0
U
Cllk004
Cl0
W 4
lhCII ~ JUC
W 00W
44JISNS
'CIClIJCl
0 IJAI4
NIAS
000
Cl~ JICI440a
4 4CJ~ I
III04J40 ~ I4
~ 0C4 40 CJ0040 00
Cl
'O 0
4
00C 4 sd0 ~~ J IJCNS NI
ClC4r sd
4kC CC00 Isl
~ r 4AI0 4IJ
Cd CNS 00
ld 44J
C 4NS
C4 AC0q 4PS CN
00C ~~ r aSI4Nl CsC
pN Ct
O OIO Flsh 40
W sgdl Cssi
W 40Ih 04O 40N W
CIC N00N Csl40 O
OrO sdPl N
N 40
NO
CC N00 CII
h4 40I
Nl 00
N WN 00N IhIh N
00 ChIh Osd CII% N
N%Ih WO ON w
OUIN ws
O >
III 00 sh
04 40~ 4 00
O 04N Ih
0 wN INO Osd N
00 N
ls Nsd N
O wO 00NrO 40N
N rC
OC'
CSI CslN 40
IO N
Ih NCO sd
sh 00W ~
0
CO
4
As0 a
C 0 UAI
'0 00
044
0ld
sd d C Asd
W
0SJ
aa 44IJ0
C0 sr
40kk
V 0
0I gsWO ASC0 0
0NC Cl0 WIC lk'r Cl
4 As0 4
0 0AS '0
0'0 WIJ 4J0 0a 4J0 ClS0 ASIJ
C d4
0
04
0 AS4~ IW
4J 00 JS
C 00 O40 w04IIC sd4 Os
0 C U4
0Pt
4 ACIC~ J0 Sl0 00
4g0014 0
As 8ASIS CJW 4
0CI 04AS 0
gW 4
CJ44 a4 40
58
IS~ I~ JW JS
0 CIs Cs0 4JACIJ 00 0'0 ASdCJ 0CS IJ
0AC dSI 0
U40 4
~ J C4C CilQ0IS IJCl0C IJIUCl
0~ ~ IlV V0 C

establishments. For example, while revenues among all shellfish processingestablishments averaged about $2.2 million annually during 1981-85,revenues among entering establishments averaged only $602 thousand.Revenues among exiting establishments averaged just $380 thousand. Thisinformation indicates that stability in the Gulf region shellfish processingsector is directly related to establishment size with larger establishmentsexhibiting greater stability.
Average per establishment revenues from shrimp processing activitiesgreatly exceed those earned from either oyster or blue crab processing.Establishment reveaues from the processing of shrimp have more thantripled from the 1971-75 average $2.06 million! to the 1981-85 average $6.72 million!. In real terms, establishment revenues from the processingof shrimp have increased from an annual average of $1.49 million during1971-75 to $2.25 million during 1981-85, or about 50 percent. Deflatedreveaues for the 1981-85 period $2.25 million! are, however, slightlyless than those earned duriag 1976-80 $2.30 million!. This decreasecould be a result of a slight decline ia processed poundage, failure ofshrimp product prices at wholesale to keep pace with general priceincreases, increased competition amoag companies, or combinations of theabove.
Establishment revenues from blue crab processing have increased froman average of $132 thousand during 1971-75 to $454 thousand during1981-85, or about 240 percent. In real terms, however, establishmentrevenues associated with blue crab processing have increased only about15 percent, from $132.3 thousand to $152.4 thousand. Enteriag andexiting establishments have much smaller operations than those observedfor the blue crab processing industry as a whole when revenues are usedas a proxy for size of operation.
Average establishment revenues from the processiag of oysters tendto be the smallest among major shellfish species processed in the Gulfregion. While establishment revenues from the processing of oysters havemore than doubled between 1971-75 and 1981-85, from $132.8 thousand to$290.1 thousand, establishment revenues from the processing of oystershave remained virtually constant when evaluated in real terms.
Industry Concentration
Industry concentration can affect a company's ability to acquire rawmaterials aad market the finished product. Concentration is also thoughtto be related to company research expenditures, innovation, and promotion.One of the more frequently used iadices of industry concentration is themeasure of industry output in relation to the largest companies in theindustry. This index is applied to the Gulf region shellfish industryand the results are provided in Table 5.
Although more than 400 establishments processed shellfish productsin the Gulf region during 1985, five of these establishments, or aboutone percent, accounted for almost 30 perceat �9.6g! of the total shellfishprocessed value. The largest 10 establishments represented slightly lessthan 50 percent of the 1985 total shellfish processed value, while thelargest 50 establishment accounted for more than 80 percent of the total.Stated somewhat differently,'12.2 percent �0 establishments! of the
171

Table 5. Concentration in the Gulf of Mexico Shellfish ProcessingSector in Total and for Individual Shellfish Species, 1970and 1985.
Percenta e of Processed ValueLargest nProcessingEstab.
Total Shellfish1970 1985 1970 1985 1970 1985
Blue Crab1970 1985
48.4 42.4 26.9 22.5 35.6 33.7 36.8 29.6
65.9 57.6 41.9 35.8 57.6 53.4 51.6 46.4
86.2 73.6 57.8 52.4 73.7 72.0 66.0 62.2
99.8 93.3 81.9 78.3 94.6 93.7 85.5 82.2
n = 5
n=10
n = 20
n = 50
Number ofEstab. 56 94 174 185 126 114 310 411
Source: Compiled from unpublished data provided by the National MarineFisheries Service.
aEstablishments are ranked from the largest to the smallest on the basisof sales of individual shellfish species and in total.
172
Note: To the extent that some companies may operate more- than one processingestablishment in the Gulf region, the numbers in this table willtend to underestimate the degree of concentration in the industry.Multi-establishment companies in the Gulf region are, however, notthought to be common.

shellfish processing establishments accounted for more than 80 percent ofthe Gulf region shellfish production by value in 1985.
Among individual shellfish species, the five largest blue crabprocessors in 1985 contributed 42.4 percent of the value of blue crabproduction, while the five largest oyster processing establishmentscontributed 22.5 percent of the total value of oyster processing, and thefive largest shrimp processors accounted for 33.7 percent of the totalshrimp processing activities. Caution should, however, be exercised whenusing this measure of concentration to compare level of concentrationamong the different shellfish processing activities. This is because ofthe different number of establishments associated with each activity.Overall, however, the oyster processing sector appears to have the leastdegree of concentration in the Gulf region while the blue crab processingsector has the largest degree. This is not to infer, however, thatlarger companies in any sector can control the market in any way. Theymust compete on a national level with many other processors in otherregions of the country and possibly even in the international market.
Because of the change in number of processing establishments between1970 and 1985, it is difficult to assess the absolute change in concen-tration through time. A few general statements can, however, be made.It appears, for example, that the large increase in establishmentsprocessing blue crabs has notably lessened concentration in that industry.There also appears to be less concentration in both the oyster and shrimpprocessing sectors in 1985 than in 1970. Such a finding in the shrimpprocessing sector is somewhat different than what would be anticipated inlight of the fact that the number of shrimp processing establishmentshave declined in number. Industry concentration in the total shellfishprocessing sector appears to have declined in association with an increasein number of establishments.
Industry Diversification
Sixteen different shellfish species were processed in the Gulfregion in 1985, including four types of crabs, two types of shrimp, twotypes of scallops, oysters, spiny lobster, crawfish, clams, squid, conch,turtle, and unclassified shellfish. While the majority �74! of the 411establishments processed only one species, many 84! processed twospecies, some �5! processed three species, and five establishmentsprocessed ten or more species. While the industry in total processed anaverage of 1.45 shellfish species per establishment, the largest tenestablishments by value! processed an average of 6.6 shellfish speciesper establishment during 1985. The largest 20 and 50 establishments,processed an average of 4.9 and 3.7 species per establishment, respectively.It can be concluded that, in general, there is a strong positive relationshipbetween the size of the establishment and its diversification in terms ofthe number of shellfish species processed.
IMPLICATIONS
The previous analysis provides several implications which companies,agencies, and trade groups may wish to consider when trying to estimateimpacts of change. Consider, for exampLe, the rapid rate of turnover i.e., entry and exit! in the Gulf region shellfish processing sector.
173

Shrimp processing is the more stable of the industry sectors. Ability tosuccessfully adapt to regulatory and market changes is more likely forshrimp firms. Oyster dynamics indicate more entry and exit. Additionalregulatory and market changes will impact the documented instability inthe oyster sector. Developing and successfully implementing a mandatoryseafood inspection program is likely to be much more difficult and costlyin a situation where there is considerable instability in the industry.
The structure of the Gulf region shellfish processing sector willfurther add to the complexity and cost of a mandatory seafood inspectionprogram. A large proportion of shellfish processing activities, asmentioned, is concentrated among a relatively small number of establishments.The remaining establishments are large in number but relatively small insize. A mandatory inspection program designed to monitor processingactivities at each establishment will be quite costly due only to thesheer number of Gulf region shellfish processing establishments. This isespecially true in, say, the oyster processing sector where there is thegreatest number of establishments and a relatively low degree of concentration.If the monitoring program is sponsored by the Federal government, thetaxpayers will be forced to cover the costs of an inspection program. Ifindividual processing companies are forced to cover monitoring costs, itis likely that some of the smaller companies would be forced to ceaseprocessing activities due to an inability to cover inspection costs.Such a situation is especially likely to occur if an inspection programdoes not result in an increase in demand and, hence, the price of seafood.The oyster and blue crab processing sectors, as opposed to the shrimpprocessing sector, will have a particularly difficult time coveringmonitoring costs due to their relatively small scale of operations. Thiswould likely lead to increased concentration in these particular sectors.
The previous analysis also indicates that the Gulf region shellfishprocessing sector is well suited for a generic promotion program. Sincethe industry is comprised of a large number of relatively small companieswith a large degree of turnover, it is evident that most of these companiesdo not have the financial resources needed to develop a successfulpromotion program on their own. A generic promotion program utilizes theresources of all, or at least the majority, of the companies in theindustry by instituting a check-off program whereby each company isassessed a small fee in relation to its output or saless. Revenues fromthis check-off program are then, used to increase demand for an industry'sproduct through promotion. This increased demand can enhance the Gulfregion processing sector through the expansion of processing activities using either domestic or imported raw materials!, an increase in theprice for the processed product, or some combination of the above. Withrespect to particular sectors within the Gulf region shellfish processingindustry, the oyster sector may be the most suited and in the most needof a generic promotion program. This is because their small scale ofoperation and large degree of turnover would make it very difficult for'many of the individual companies to successfully develop their ownpromotion programs. Also, deflated revenues in this sector have remainedvirtually constant during the past 15 years. The relatively large size as measured by sales! and stability of shrimp processors, on the otherhand, suggest that many of these companies have the resources to developand implement promotion programs of their own. However, the decline in
174
real revenues in this sector between 1976-80 and 1981-85 suggests thatthis sector may be able to benefit from a generic promotion program.
FOOTNOTES
iThis project was supported by the I,ouisiana Sea Grant College Program,a part of the National Sea Grant College Program, maintained by NOAA,USDC.
2The Gulf region includes the coastal states from Texas though Alabamaand the west coast of Florida.
sAn establishment, or plant according to National Marine FisheriesService terminology, is a unique processing entity. It is possible thattwo or more establishments may be under sole ownership of a companyTo be considered a processing establishment, as opposed to a wholesalingestablishment, some physical change of the product must be made. Thischange can range from, say, the heading of shrimp to producing soups orgumbos. Activities such as the repacking of shrimp from 100 pound boxesto five pound containers or the boxing of oysters are not consideredprocessing.
4Deflated or real values throughout this report are obtained by dividingthe current value by the Consumer Price Index using 1967 as the baseyear. Thus, deflated or real values reported throughout this paperrepresent the value of the product expressed in 1967 dollars.
sTurnover, or entry and exit, can result from three factors. First,existing establishments can add or delete species from their productlines. Second, establishments can change ownership which results inboth an exit the previous owner! and an entrance the new owner!.Finally, establishments that cease operations are recognized as an exitand new processing facilities are recognized as an entrance.
sAs the "Fish and Promotion Act of 1986" is written, the assessment islevied on the first receiver of the product. This first receiver isoften a processor.
REFERENCES
1. Prochaska, F. J. and C. O. Andrew. "Shrimp Processing in theSoutheast: Supply Problems and Structural Change." Southern
2. United States Department of Commerce, Processed Fisher ProductsAnnual Summa various issues from 1970 through 1985!.
17S


IMPORTANT CONSIDERATIONS IN OPTHVIIZING THE FORMULATION OFSURMI-BASED PRODUCTS
Chong M. Lee, Jon-Shang Chen and Kang H. ChungDepartment of Food Science «nd Nutrition
University of Rhode bland, Kingston, R.I. 02881
liA:CO] Ilsfal1 aM
'Ihe paper deals with formulation optimization of surimi-based pmducts withfocus on the selection of ingredients and optiinization techniques. Surimi is a sourceof the most functional pmtein among proteins available in the present market. It isnot only an excellent source of protein, but also can be used as a camer of vitalnutrients such as omega-9 fatty acids. According to our recent animal feeding study Gerber and Lee, 1987!, a red hake QJgggg~ ghggg! surimi protein showed thehighest biological quality among known dietary pmtcins and was equally as good asegg protein in terms of protein efficiency ratio PER!, i.e. 3.0 compared to 2.5 forcasein. It was also found that there were no significant changes in omega-3 fatty acidcontents in the fish mince after washing, a main step of surimi pmoming, and thatwashing caused concentration of myofibrillar pmtcins in the washed mince,resulting in an impmvcment of essential amino acid profile Leibovitz ct al, 1987!. Asfor omega-3 fatty acids, the level in thc finished mince was not significantlydifFeient fmm that in the original mince, although there werc soine losses duringwashing. Such an insignificant change was due to thc concentration efFect ofwashing Lcibovitz et al, 1987!. This suggests that surimi has potential to become animportant commeicial protein ingredient to bc used as a source of functionality aswell as nutrition. It means that surimi will play an important role in formulatedproducts where sunni is used as a main ingredient of protein source. The purpose ofthis paper is to discuss how various types of commercial ingredients interact withsurimi pmtcin; how they affect the textural pmpertics; what an: factors whichinfluence the textural pmperties of ingredient-added surimi pmducts; and fromabove information, how one can optimize formulation of surimi-based pmducts.
In manufacturing a variety of surimi-based formulated pmducts, various types ofingredients are incorporated into surimi. A study of the physicochemical propertiesof ingredients during thermal gelation and the ingredient-matrix interaction isimportant to understanding thc gel-strengthening and texture-modifying effects ofingredients. The information from this type of study will be utilized in formulationoptimization with the aid of appropriate optimization techniques. The important roleof formulation technology in surimi-based formulated products is in thc optimizationof texture and physical pmpcrtics thermal and freeze-thaw stability!, as well as inthe development of ncw formulated products such as high protein formula A highpmtcin sunni product receives attention from manufacturers since bringing thelevel of protein to that in the natural pmduct may ease the imitation labelingrequirement by satisfying nutritional equivalency proposed by the Food and DrugAdministration FDA!.
176

'Ilic commercial ingredients may be classified as below acccording to theirfunctions to which their properties best fit.
Gel stxengthening: starch, both native and modified � - 10%!, protein � - 1%!Texture-modifying: pmtein ! 1%!, cellulose � - 4%! and fat/oilFreeze-thaw stabilizing: modified starch � - 10%!
~: The selection of starch is determined by the formulation needs, primarily gelstrength and freeze-thaw stability requirements. Both umnodified and modifiedstaxches possess gel strengthening ability, although these are considerablevariatians among starches. Those gel-strengthening starches include potato,corn�5% amylopectinc! and wheat starch which yielded a good swelling and highviscosity upon gclatiniztition. and fortned a relatively fixm gcl at mom tcmpcxIeue IGm and Lee, 1987!. An excessive additian of starch > 8% on a surimi weight basis!resulted in a sticky and samcwhat cheese-like textuxe with short of elasticity and bite,although the texture still remained firm Chen, 1987!. Modified starch, mostlyhydxoxypmpylatcd, has a good fieeze-thaw stabilizing pmperty. This type ofmodified starch did not undergo xctmgradarian and was nat subject to freezesyneresis. This was supported by a microstructure analysis which showed thataddition of modified starch kept the ice ~ gmwth to a minimum during fmzcnstorage Lce and Kim. 1987!.
Qggia: The selection of pmtcin should be based an its texture-modifying propertiesrather than gel-strengthening properties. Addition of nonfish pmtcins ofnonmyofibrillar nature always tends to reduce gcl strength in terms of cohesivenessand rigidity in molded pxxxhcts and rubberines in fibcrized pmducts. Such areduction in gel strength and rubberiness leads to modification of texture, and oftenresults in an immvemcnt of sensory quality. A certain type of nonfish protein,especially wheat gluten, prcvcnts surimi gcl fmm getting cxccssivcly rubbery duringfmzen storage, although it is not as effective as modified starch. As to therelationship of funcnonal pmperties of nanfish pxotcin ta suximi gel properties,them was strong correlation r = 0.97! between the water binding abfiity of nonfishprotein during heating termed "thermal hydration" ! and the cohesiveness ofnanfish protein-incorporated surimi gel Chung and Lce, 1987!. Unlike theconventianal method which determines water binding in a cold state, themeasurement of thermal hydration is dane after thc sample is heated to simulate theactual cooking process. 'Ilmefore, the water binding value obtained by this methodcorrectly reflects a true gelatian behavior of the protein during thexmal pmcess.
Qggttlggp: Cellulose is a kind of biopolymer that is chemically inert and thermallystable and is able to absorb water as much as seven times its weight Miller, 1986!.Owing to this unique physical pmperties, ceHulosc has been used in a variet offormulated pmducts where water binding is less affected by beat txcatmeut. CcHuloseis avaliablc in a powder fortn and, in the surimi-based products, unlike starch itreduced gel strength slightly due pmbably to thc lack of swelling power. Howcvcr, ithas a desirable tcxtuxe-modifying properties. Addition at 1-2% levels significantlyimproved the fmzcn-storage quality of products by keeping them from gettingexccessivley rubbery and drying during extended frozen storage Yoan et al, 1987}.Since modified starch alone tends to yielded a starchy and less moist texture, acombined use of rnadified starch and cellulose is recommended. Cellulose alsocontributes as a fiber a nutritional benefit, especially where formulation calls for acomplete nutrition.
1.77

~@jl: Addition of fat or oil tends to weaken the gel texture, thus reducing rubberyand chewy texture. The extent of such a textural modification depends largely uponthe hardness solid fat contents! of fat and the dispersion of fat or oil. In contrast tofat dispersion in the comminuted meat protein gel, a more uniform dispersion isexpected with low solid fat or oil Lee and Abdollahi, 1981!. 'Ihe addition of fat wasfound to improve a freeze-thaw stability by preventing the development of asponge-like texture due to fieeze syneresis Lee and Toledo, 1977!.
In selecting a formula, one needs information on: what the product requireinents arein terms of: form of product, texture requirement, freeze-thaw stability, andingredient level minimum and maximum level!. These factors are interrelated toone another. Understanding of functional properties and behavior of ingredients isprerequisite to a proper formulation based on a multi-ingredient system.
Several techniques can be used to achieve an optimum formulation. They arestepwise optimiziition, linear programming Bender et al, 1982; Evans, 1982; Saguy,1983!, and response surface methodology Giovanni, 1983; Gacula and Singh, 1984!.
determined in a single ingredient system. For additional ingredients, the optimumlevel of the second ingrdient is determined at a constiuit combined level using afraction curve, and simiiariy for the next ingredient in a stepwise fashion. Becausethis method works on a limited number of variables, and the optimum level isdetermined on a one-~ne basis, this technique is used as a screening technique.
For Qexibility and versatility in data analysis, a computer-aided optimization isbeing widely used in the manufacturing industry which is involved with formulation.The techniques include linear programming and response surface methodology.These techniques have been successfuHy used in formulation optimization, wherecost, ingredient availability, target composition, and sensory quality are the maindecision variables.
series of multivariate equations that is consisted of objective function, independentvariables and a set of constraints. It can be effectively used when a specific objectivefunction needs to be minimized or maximized, for instance where a minimum cost oran increase of one of ingredients to a maximum is required. Two examples are givenbelow with step-by-step procedures.
Xl = surimi; X2 = nonfish protein; X3 = starch; X4 = water
Maximize � > 0.15 X1! + 0.87 X2! + 0.0 X3! + 0.0 X4!

Camuuuua:weight: Xl + X2+ X3+ X4 = 96 salt+ flavor = 4!
moisture: 0.76 XI! + 0.08 X2! + 0.15 X3! + 1.00 X4! = 78%gel fannability cohesiveness index!: 1.0 X1! - 0.1 X2! + 0.25 X3! + - 1! X4! w 50 kg
X1=65-70%; X2=6-8%; X3=3-4%;X4=15-20%
Ezggltjgg.: at 4 and 6 for loop and iteration number, xespectively.
5ghgigg,: Xl = 66.7%; X2 = 7.9%; X3 = 3.5%; X4= 17.8% --! protein level 16.9%
~ Note: Coefficients for gcl foxmability cohesiveness index! axe given as relativefunctianality contributed by each ingredient and obtained from the slape campxessive force, kg/% ingxedient! of a curve, changes in gel cohesiveness as afunction of % ingredient in surimi.
- targeted for a cost less than $1.00/lb.
1.20 X1! + 0.30 X2! + 0.50 X3! + 0.0 X4! -> minimizewhere X2 is fxozen raw egg white
Camamiata:Moisture: 0.76 X1! + 0.88 X2! + 0.15 X3! + 1.00 X4! = 78%
Gcl formability: 1.0 X1! + 0.03 X2! + 0.25 X3! + -I! X4! ~ 50 kg
X1= 65-70%; X2= 15-20%; X3 =4-8%; X4= 10-15%
5ghgjM: Xi =65; X2=15; X3=4; X4=11-!minimumcost =$0.845
Source: Lee �987!
In addition to deciding objective functian and identifying independent variables,establishing the appropriate constraints, especially the ingredient's ability tocontribute to gel foxmatian, are critical to obtaining a workable solution. Obtainingthe working coefficients for each ingredient in the gel formability contraint isessential to the successful solution of a linear programming. It is also equallyimportant to use the right method for evaluation of gel properties which performswith sensitivity in a cansistent manner.
3 : It is a statistical method designed far theoptimizatian of variable-dependent systems where various indcpcndent variable factors! aKcct thc response variable Evans, 1982; Saguy, 1983!. Unlike thepreviously mentioned stepwise aptinuzation, this method runs on a three dimensionalbasis. RSM enables one to determine the interrelationships amongvariables with respect to the response variable. A step-by-step procedure of RSM is tafirst identify the factors, usually two, and one response variable; define the range offactor levels, usually three or more; execute the experiment and obtain response dataat varying levels of factors; obtain a quadratic rcspanse surface by least-squareregxession: using coefficients from multivariate equations; lacate the optimumcombination of factar levels which yields an optimum response.
179

1. Bender, F.E, Kramer, A. and Kahn, G. 1982. Linear programming and itsapplications in food industry. Food TechnoL 36�!: 94.
2. Chen, J-S. 1987. Optimization in the fonnulationm of suiimi-based extrudedproducts. MS. Thesis. University of Rhode Island, Kingston.
3. Chung, K.H. and Lee, C.IVL 1987. Texture-modifying effect of various commercialproteins on surimi gel. 1st Joint Conference of Tropical and Subtropical FisheriesTechnology and Atlantic Fisheries Technology, Oriando, FL. Nov. 9-11.
4. Evans, L.B. 1982. Opthnization theory and its application in food processing. FoodTechnol. 36�!: 88.
5. Gacula, hLC Jr. and Singh, J. 1984. Response surface designs and analysis. In"Statistcal methods in food and consumer reseasrch", Academic Press, Inc.
Orlando, Chap. 7, p. 214.
6. Gerber, L. and Lee, C.M. 1986. Unpublished data. Department of Food Science andNutrition, University of Rhode Island, Kingston.
7. Giovanni, M 1983. Response surface methodology and product optimization. FoodTechnol. 37�1!: 41.
8. Kim, J.M. and Lee, CM 1987. Effect of starch on textural properties of surimi gel.J. Food Sci. 52: 722.
9. Lee, Col. and Toledo�R.T. 1979. Processing and ingredient influences on textureof comminuted fish mince. J. Pood Sci. 44: 1615.
10. Lee, CM. and Abdollahi, A. 1981. Effect of physical properties of plastic fat onstructure and material properties of fish protein gels. J. Food Sci. 40: 1755.
11. Lee, C2vL aud Kim, J.M. 1987. Structural analysis of gel reinforcing andfreeze-thaw stabilizing properties of various starches in surimi gels. Intern.Meeting of Scanning Electron Microscopy, Hamilton, Ontario.
12. Leibovitz, H., Morizen, R.D. and Lee, C.M. 1987. Changes in the fatty acid andamino acid profiles of fish mince during surimi processing. 1st Joint Conference
of Tropical and Subtropical Fisheries Technology and Atlantic FisheriesTechnology, Orlando, FL. Nov. 9-11.
13. Miller, W.B. 1986. Cellulose in reduced-caloriebaked goods. Bakers Digest. July.
14. Saguy, L 1983. Optimization methods and applications. In "Computer-aidedtechniques in food technology" Saguy, L, Ed.!, Marcel Dekker, Inc., New York,Chap. 10, p. 263.
15. Yoon, KiSun., Lee, C.M. and Chung, K.H. 1987. Effect of powdered cellulose on thetexture and water binding properties of surimi-based products. 1st JointConference of Tropical and Subtmpical Fisheries Technology and AtlanticFisheries Technology, Orlando, FL. Nov. 9-11.

MODIFICATION OF FUNCTIONAL PROPERTIES OF SURIMI BYCHANGES IN PROTEIN COMPOSITION
John S. French
Fishery Industrial Technology CenterSchool of Fisheries and Ocean Sciences
University of Alaska
INTRODUCTION
Surimi, as a minced, washed fish muscle preparation is primarily composedof myofibrillar proteins ~ The nature of these proteins, especiallymyosin, determine the properties of the surimi. This paper discusses someof the changes that occur in these proteins during surimi processing.
The physiological organization of muscle myofibrils involves a molefraction of 0.17 myosin �0-55X w/w!!, 0.62 actin �5-20X!, 0.10tropomyosin �-4Z!, and 0-10 troponin �-4X!. The myosin forming thethick filaments and the actin with tropomyosin and troponin forming thethin filaments Goll, et al., 1977! ~ Tropomyosin and troponin are wraopedaround actin in a helical ribbon and regulate the calcium dependenthydrolysis of ATP and the interaction between the thick and thin filamentsduring contraction. Whereas actin is virtually spherical in shape, mostof the myofibrillar proteins have a high degree of alpha-helicalstructure. In addition ionic bonds have a ma!or role in thepolymerization of tropomyosin, the association of troponin and tropomyosinwith actin and the dimerization of myosin Asghar, et al., 1985!.
In addition to data on protein structure, there is general agreement thatstimulation of actomyosin ATPase activity requires the presence of thema!or regulatory proteins Goll, et al., 1977! ~ There is a directrelationship to the remaining ATPase activity, the extractability ofsurimi proteins, and the gel forming ability of surimi Okada and Tamoto,1986! ~ Thus it appears that gel forming ability is highly sensitive toenzyme denaturation and conformational changes in addition to overallprotein composition.
METHODS
from Alaska Pacific Seafoods, Kodiak, Alaska as part of an AlaskaFisheries Development Foundation sponsored study. Pollock were caught inShelikof Strait and held in either slush ice or refrigerated seawater RSW!. Surimi samples were the highest grade products SA grade!.
Differential extraction of Alaskan pollock or surimi was carried out asdescribed previously French, 1987b! ~ Samples were blended with eithercold distilled water or phosphate buffered 0 ' 5 M sodium chloride, pH 6 ' 8,
incubated for 60 minutes at 4 C and centrifuged 10 minutes at 30,000 x g-0
Pro te in con cen tra t i ons we r e de ter mined by the Coomas s i e Blue bindingmethod of Bradford �976! using bovine serum albumin as the standard.
Polyacrylamide gel electrophoresis SDS-PAGE! was performed in thepresence of 0 ~ 2X SDS Laemmili, 1970! using 12K acrylamide. Filtered
0soluble protein samples were denatured by heating 5 minutes at 95 C in thepresence of SDS and 2~ercaptoe thanol. Liquid chromatographic analysiswas carried out on a BioRad HPLC using a UV detector at 280 nm and a model3392A reporting integrator. Separation was by molecular exclusionchromatography on a 25 cm BioRad TSK 400 column- I socratic cond it ionawere maintained at 0-10 M sodium sulfate 0-05 M phosphate buffered to pH
06.8 at a flow rate of 0.7 ml/min and a column temperature of 25 C.
Proximate analysis and rheological tests on pollock surimi were performedby the standard me thods Cheng, et al-, 1979; Hamann and Webb, 1979;Monte j ano, e t al., 1985! . The punch tests were done on a Food Checker Sun Kagaku Co., Tokyo! ~ Surimi sausage s were cooked wi th either a 20minutes presetting at 40 or 60 C followed by 20 minutes at 90 C, or 400 0
minutes at 90 C with no presetting, after addition of 2 5K salt to0
partially thawed surimi ~
RESULTS
Changes in extractability of pollock muscle proteins have been studied atvarious stages in the conversion of pollock to surimi and cooked kamabokoincluding holding conditions of the fish, washing the mince, presettingand cooking the kamaboko.
Total protein extractability and the relative water and saltextractabili ties of myofibri liar proteins changed with holding time andwhether the pollock were held in ice or refrigerated seawater. HPLCanalysis has been used to separate water circles! and salt squares!extractable myofibrillar proteins from pollock fi1lets after holding inslush ice open symbols! or refrigerated seawater closed symbols! for upto seven days are shown in Figure 1 ~
It has been shown French, 1987a,b! that the stiffness and the waterbinding potential of surimi are related to the amount of water extractabletropomyosin remaining in surimi after washing. Stiffness was inverselycorrelated to tropomyosin content with a correlation coefficent of -0.68and water binding potential directly related with a correlationcoefficient of 0 ' 87 '
To study the effects of added salt and cooking on surimi, samples wereblended with distilled water in the presence or absence of 0.5 M sodium
0chloride and centri f uged as above or the samples were cooked at 90 C f or40 minutes and centrifuged. The proteins extracted into the supernatantwere analysed by HPLC. The extrac tabi li ty of myosin, actin and
1B2
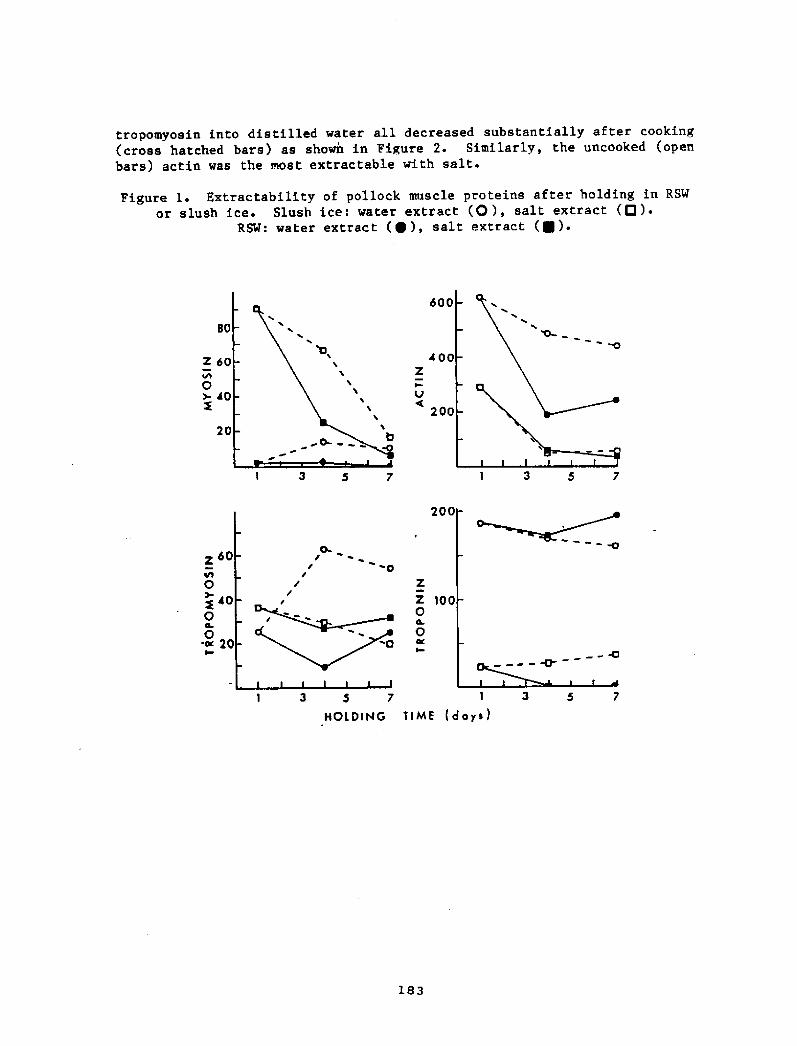
tropomyosin into distilled water all decreased substantially after cooking cross hatched bars! as shown in Figure 2- Similarly, the uncooked openbats! actin was the most extractable with salt.
Figure 1 ~ Extractability of pollock muscle proteins after holding in RSWor slush ice. Slush ice: water extract �!, salt extract Q!.
RSW: water extract ~ !, salt extract g !.
600
80
4002IV
200
20
I 3 1 3 5 7
200
l83
Z 60
0> j0X
Z60
g400 00.~ 20I
Z
Z 1000
0
1 3 5 7 1 3 5 7
HOLDING TlhAE days !

Figure 2: Effects of salt and cooking on extractability of pollock muscleproteins. Uncooked surimi: open bars ~
Cooked surimi: cross hatched bars'
20%
l0% water salt water salt water saltMyosin Actin Tropornyosin
To study the effects of presetting in addition to cooking on proteinextractability, surimi samples were prepared with 2.5X salt and allowed to
0set at 4, 40, 60, or 90 C ~ The low temperature samples were not cooked0
whereas the remaining samples were cooked at 90 C. Substantial changeswere seen in five of the salt extractable proteins, as shown in Figure 3.
184
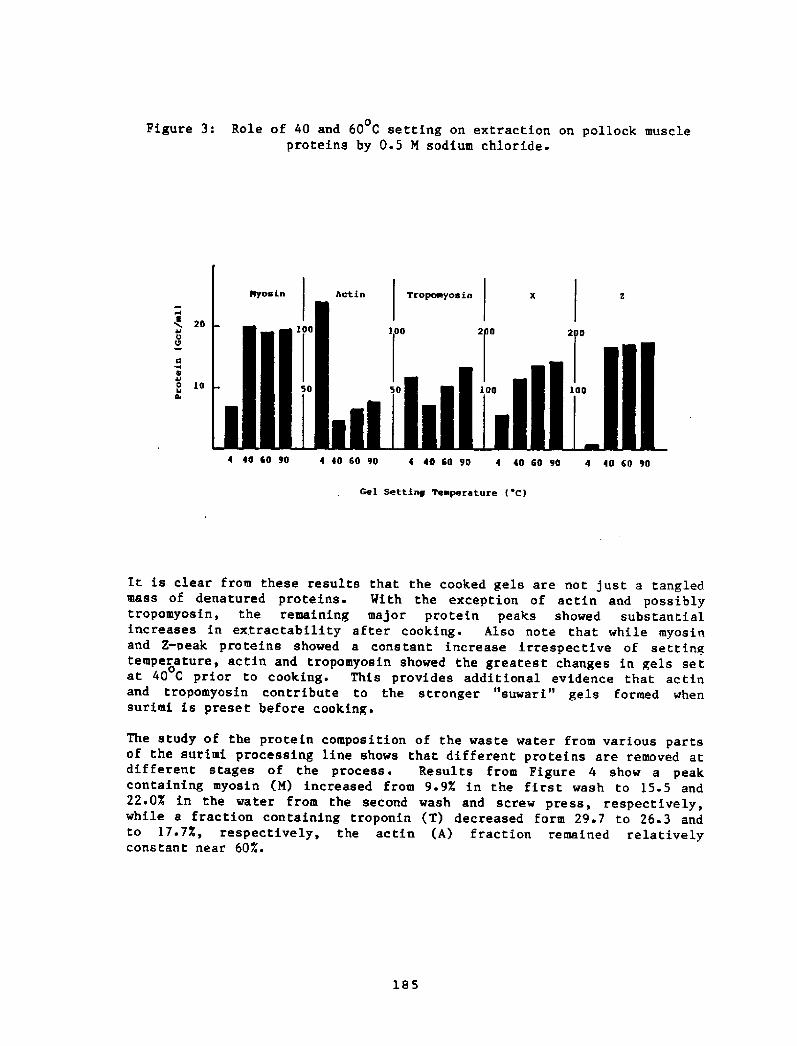
Figure 3: Role of 40 and 60 C setting on extraction on pollock muscle0
proteins by 0.5 N sodium chlorid.
2004J
Q C e4I
0 10 ~ 40 60 90 4 40 60 904 40 60 90 ~ 40 60 90 4 ~ 0 60 90
Gel SettinS Teapereture C!
It is clear from these results that the cooked gels are not just a tangledmass of denatured proteins. With the exception of actin and possiblytropomyosin, the remaining major protein peaks showed substantialincreases in extractability sf te» cooking. Also note that while myosinand 2-peak proteins showed a constant increase irrespective of settingtemperature, actin and tropomyosin showed the greatest changes in gels se t0at 40 C prior to cooking. This provides additional evidence that actinand tropomyosin contribute to the s tronger "suwar i" gels f armed whensurimi is preset before cooking.
The study of the protein composition of the waste water from various partsof the surimi processing line shows that different proteins are removed atdifferent stages of the process. Results from Figure 4 show a peakcontaining myosin M! increased from 9.9X in the first wash to 15.5 and22.0X in the water from the second wash and screw press, respectively,while a fraction containing troponin T! decreased form 29 ' 7 to 26.3 andto 17.7X, respectively, the actin A! fraction remained relativelyconstant near 60X-

Figure 4: Distribution of pollock muscle proteins in waste water duringsurimi manufacturing.
060
~ 6
0 40
~4 20 NATNATNATNATNA'TNATDISCUSSION
Actin and myosin, and their interaction as actomyosin, are critical forthe formation of surimi protein gels Asghar, et al ~, 1985! ~ The natureand the degree of the dependency on actin is not fully resolved and theresults presented here indicate roles for other myofibrillar proteins-Much of the conflicting data relating to the roles of these minor proteinsmay be due to the impurity of the preparations and possible denaturationof proteins during the isolation of individual proteins Rowlerson, etal., 1985!- Sano and coworkers �986! report that natural actomyosinisolated from Alaskan pollock consisted of myosin heavy chain, lightchains, actin, tropomyosin, troponin and other unidentified minorcomponents' Croaker actomyosin has also been shown to contain proteincomponents other than actin and myosin Wu, et al., 1985!. Even "pure"myosin preparations often show 5-10X impurities Egelandsdal, et al-,1985! when analysed by SDS-PAGE. These relatively small amounts becomesignificant when compared to tropomyosin or troponin being only 4-6X eachin native muscle Goll, 1977! or water extractable tropomyosin being 2-7Xof the protein in pollock surimi French, 1987b!- The degree oftropomyosin degradation in fish muscle minces during thermal processinghas been related to the gel texture Cheng, et al., 1979!. Paramyosin has
186

also been shown to have significant effects of the stretching strength ofkamaboko when added at the 5X level Sano, et al., 1986!- The gelcharacteristics of actomysin with varying ionic strengths are reported tobe different from that of myosin alone Asghar, et al., 1985!.
There are four major types of intermolecular attractions which dictate thefundamental structure of a protein system whether iu a functioning fish
0 0muscle at 5 C or surimi gel at 90 C. These are covalent bonds, mostfrequently seen as disulfide linkages; ion pairs, such as those inpolymerized tropomyosin; hydrogen bonds, such as those that stabilizealpha-helical structures; and hydrophobic bonds, usually seen in theinterior of water soluble proteins McGilvery, 1983!. Disulfide bonds areprobably of limited significance in fish protein gels since gel strengthincreases when disulfide bond reducing agents are presents There is goodevidence that both ion pairs and hydrophobic bonds are important in bothnative muscle and cooked muscle gels Asghar, et al ~ , 1985! ~ Hydrogenbond formation is an enthalpy driven process with a negative change inentropy Cantor and Schimmel, 1980!. Therefore, as the cookingtemperature rises, hydrogen bonds will break and the alpha-helical andbeta-sheet structures will become less important- On the other hand, ionpair formation is strongly entropy driven and greatly increases as thetemperature rises- For example, the free energy driving the associationof magnesium ions with ATP will become 1 ' 7 kcal more favorable when heatedfrom room temperature �5 C! to 90 C Cantor and Shimmel, 1980!.
o 0
Hydrophobic bond formation is generally entropy driven but is oftenassociated with a large change in heat capacity also Tanford, 1980!.Therefore, at gel setting temperatures, hydrophobic portions of themyofibrillar proteins will tend to associate with other hydrophobicportions but the extent this occurs will depend on the exact nature of theprotein structures involved. Thus the thermodynamic forces causing ofgelation of surimi proteins are entirely consistent with the good ionicbonding agents tropomyosin and troponin forming ion pairs and hydrophobicbonds between the remains of the thin filaments and myosin. To maintainthese interactions surimi should contain the proper ratios of theseconstituents.
REFFRENCES
Asghar, A., K. Samejima and T. Yasui ~ 1985. Functionality of muscleproteins in gelation mechanisms of structured meat products. CRC Crit.Rev. Food Sci. Nutr. 22, 27-105.
Bradford, N- 1976- A rapid and sensitive method for quantitation ofmicrogram quantities of protein utilizing the principle of protein-dyebinding. Anal. Biochem. 72, 248-262.
187

Cantor, C.R. and P.R. Schimmel. 1980. Bio h sical Chemistr art I:The conformation of biolo ical macromolecules. W.H. Freeman and Co. San
Francisco.
Cheng, C.S., D-D. Hamann and N.E. Webb. 1979. Effect of thermalprocessing on minced fish gel texture. J. Pood Sci. 44, 1080-1086.
Engelandsdal, B., K. Fretheim and 0. Harbitz ~ 1985 ' Fatty acid salts andanalogs reduce thermal stability and improve gel formability of myosin.J. Food Scil 50, 1399-1402.
French, J.S. 1987a. Relationship of protein composition to water holdingproperties of pollock surimi ~ J- Food Sci- in preparation! presented atPacific Fisheries Technologists Meeting, Vancouver, B.C.!.
French, J.S. 1987b. Postmortem changes in muscle protein structure asfish quality indices. in Kramer, D.E. and J.T. Liston Eds.! SeafoodQualit Determination. Elsevier Publishingp Amsterdam- in press!-
Gall, D-E-, R-M- Robson and M-HE Stromer- 1977- Muscle proteins, in:Whitaker, J.R. and S.R. Tannenbaum Eds.! ~ Food Proteins ~ AVI Publishing,Westport CT, 121-174.
Hamann, D.D. and N. B. Webb. 1979 ' Sensory and instrumental evaluation ofmaterial properties of fish geist J. Texture Studies 10, 117-130.
Laemmli, U.K. 1970. Cleavage of structural proteins during the assemblyof the head of bacteriophage T4. Nature 227, 680-684.
McGilvery, R.W. 1983. Biochemistr a Functional A roach, 3rd ed. W.B.Saunders Co-, Philadelphia-
Montejano, J.Gep D.D. Hamann and T.CD Lanier. 1985. Comparison of twoinstrumental methods with sensory texture of protein geist J ~ TextureStudies 16, 403-424 '
Okada, M. and K. Tamoto. 1986 ' Introduction to Surimi Manufacturin~Teohnolo . Overseas Fishery Cooperation Foundation. yokoyo, Japan.
Rowlerson, As p P.A. Scapolo, F- Mascarello, E- Carpene and A- Veggetti ~1985. Comparative study of myosins present in the lateral muscle of somefish: species variations in myosin isoforms and their distribution inred, pink and white muscle- J ~ Muscle Res ~ Cell Motilit 6, 601-640.
Sano, T., S.F. Noguchi, T. Tsuchiya and J.J ~ Matsumoto. 1986.Contribution of paramyosin to marine meat gel characteristics- J. FoodSci. 51, 946-950.
188

Tanford, C- 1980. The H dro hobic Effect: Formation of micelles andbiolo ical membranes, 2nd ed. John Wiley, New York.
Wu, MAC., T.C. Lanier and D-D. Hamannn. 1985. Rigidity and viscositychanges of croaker actomyosin during thermal gelation ~ J ~ Food Sci- 50,14-19 6 25.
189

THE PRODUCTION OF SURIMI FROM PACIFIC WHITING
Meclucclus McuductuslRamon Pacheco-Aguilar and David L. Crawford
Oregon State University � Seafoods Laboratory250 � 36th Street
Astoria, OR 97103
INTRODUCTION
Washing with water is the initial step in the conversion ofIinced fish flesh into what the Japanese refer to as suriai.Mechanical dehydration is carried out to produce a white,odorless and bland flavored product: to reaove substances thatproaote protein denaturation during frozen storage; and toenhance the functional properties of suriii proteins. Suriei isan interjsediate that is used as a raw material to prepare a widevariety of gel-type food products; it possesses excellent frozenshelf life providing a year round base for production ofsuriai-based shellfish products, fish sausages and fish has Buck and Fafard, 1985; Lee, 1984!.
In the conventional process. ainced fish is washed with twoto eight tiaes its voiuae in fresh water froa one to severaltiaes depending upon the species and freshness of the fish Lee.1984!. This procedure results in a high quality suriii, butrequires large aaounts of water and produces low yields andconsiderable water soluble waste aaterials. Suriai showingstrong gel-foraing characteristics is required to produce therubbery and turgid texture that is highly accepted in Japaneseproducts Okada et al., 1983!. Since textural preferences ofU.S. consumers vary markedly from those of Japanese, thegel-strength required for suriai-based products designed fordoaestic acceptance could be considerably less. This canaarkedly alter the species. raw aaterial conditions. andprocessing requirements for a suriai interaediate that wouldproduce textural characteristics accepted by doaestic consuaers.The objectives of this study were to evaluate aodifications inthe conventional suriei processing and to convert species ofunderutilized fish into a suriai intermediate. Efforts weredirected towards: a! utilizing Pacific whiting, b! reducing theaaount of water required in the washing unit operation, c!optiaizing the yield of washed product, and d! evaluating thegel-foraing ability of suriisi thus produced.
190

METHODOLOGY
In preliminary studies intended to optimize fleshrecoveries, ten different washing regiaes were evaluated inwhich water-flesh ratios, number of exchanges, dewateringtechniques between exchanges screening/pressing!, and pH of thewashing water were varied. Recovery of total solids andprotein, and changes in washed and dewatered minced fleshcoaposition aoisture, protein, lipids, ash, and TMAO! were usedas criteria to evaluate washing regiae efficiency. Washing atreduced pH was carried out by adjusting the first exchange of a1:1 water-flesh mixture to an acidic pH in the range 4.9-5.8with phosphoric acid. followed by a second exchange usingpotable water. The pH of the acidic dewatered aince wasadjusted to neutrality with a solution of sodiua carbonate. Acryoprotectant mixture of sorbitol, sucrose, and polyphosphates�%, 4%, and 0.5%, respectively! was added into the suriaiformulation. The final suriai moisture was adjusted to 77% withan ice-water aixture. Teaperature during the mixing operationwas constantly held under 10 C. Prepared surimi �00 g units!was packed into polyethylene lined cardboard boxes, frozen andheld at -30 C. For the preparation of fish gels, partially
0
thawed suriai was cut into saall pieces and chopped; ice wasadded to keep the batter temperature at 5 C and to bring the
0
moisture content to 82.5%. Based upon the weight, 2.5% sodiuachloride, 5% egg white and 5% potato starch were added to yielda batter with a aoisture content of 74%. The batters were
packed in glass tubes �0 X 150 aa!, sealed and cooked at 90 Cfor 60 minutes.
Texture profile analysis TPA!, expressible water EW! andfolding test FT! determinations of heat-set gels were carriedout to evaluate the gel-foraing ability of suriai froa the 3:1water:flesh ratio, one exchange and the 1:1 water-flesh ratio.low pH water pH 5.0-5.3! first exchange, potable water secondexchange, washing regimes. TPA of gel samples of uniformgeometry and weight were aeasured using an Instron UniversalTesting Machine at 50% aaxiaua compression. Results weredefined in teras of hardness, elasticity, cohesiveness,gumminess and chewiness Abbot, 1972!, FT was conducted byfolding a gel slice between thumb and index finger; if nocracking occurred along the fold, the slice was folded againperpendicular to the first fold. Rating scale for the test wasbased upon the degree of cracking occurring along the folds Kudo et al., 1973!. A Laboratory Carver Press was used todetermine EW Lee and Toledo, 1976!. Unifora gel samples werepressed at 1000 psi for 20 seconds on Whataan Sl filter paperbetween plexiglass plates. The wetted area on the filters was
191

measured using a planiaeter and the amount of EW expressed as caof wetted area per unit weight of product,
RESULTS AND DISCUSSION
Single exchanges in potable water produced superior solidsand protein recoveries to those observed for aultiple exchangesutilizing the saae total aaount of water. A single exchange of.a water:aince ratio of 3.0 produced the highest recoveries�3.32 and 74.07% of flesh solids and proteins, respectively!.Mashing at r'atio 1.0 under acidic conditions followed by apotable water wash at ratio 1.0 produced recoveries super ior orequal to all of the wash regimes of equal total water voluae�3.02 and 76.2% of flesh solids and proteins, respectively!.Mashing under acidic conditions resulted in the most efficientreaoval of the original content of TWAO and lipid in muscle 91.4 and 31.1%, respectively!. Superior removals wereaccomplished since acidic conditions favored the extraction ofaaines and produced greater pressures during screw-pressing dueto the altered physical characteristics of the flesh. Pressingbetween multiple potable water exchanges showed better removalsof TMAO, lipids and ash than single exchanges involving only onepressing operation or aultiple exchanges involving screening inbetween. Water requirements were reduced >80%! and yield wasiaproved by up to 34% over the conventional process.
Addition of potato starch and dry egg white into the gelforaulation overcaae the lack of gel-foraing ability of suriaisamples without aasking the effect of washing treatments.Suriai gels from potable water washed surimi were easilyassigned the aaxiaua grade SA according to the folding test;surimi gels produced from the low pH washing regime fellapproxiaately equally within the A and 8 grade. An average gradeof A-8 was assigned to thea. Suriai gels from both washingregiaes were equal p>0.05! in EW, TPA revealed no significantdifference in gel hardness p>0.05! between treatments. Gelsderived from low pH treatment yielded poorer elasticity andcohesiveness p<0.01! than gels from the potable watertreatment. Gels with lower elasticity and cohesiveness producedlower folding test grades. No significant difference betweentreataents was found in guaainess or chewiness p>0.05!.
The study suggests that less water could be required insuriai processing, thus reducing the waste water aanageaentproblems and increasing the low yield recoveries associated withsuriai production. Washing under acidic conditions near theisoelectric point of flesh proteins reduced proteinfunctionality soaewhat over that observed for flesh wash'ed in
192

potable water. This effect was deterained for gel attributesconsidered aost iaportant for the fabrication of food productsthrough restructuring procedures: elasticity and cohesiveness.The low moisture content oi' the washed and pressed flesh froathe washing regimes evaluated would allow considerableflexibility in formulating surimi interaediates oi' optiauI« anduniform aoisture contents. This study could establish atechnical base for suriai process optiaization and productforaulation and to prove the feasibility of suriai productionfrom Pacific «thiting.
REPERENCES
Abbot, J.A. 1972. Sensory assessment of food texture. FoodTechnol. 26�}: 40.
Buck, E.M. and Fafard, R.D. 1985. Development of a frankfurteranalog froa red hake suriai. J. Food Sci. 50�!: 7.
Kudo, G., Okada, M. and Miyauchi, D. 1973. Gel-foraing capacityof washed and unwashed flesh of soae pacific coast species offish. Marine Pisheries Review 35�2!: 10.
Lanier, T.C., Lin, T.S., Liu, Y.M. and Hajsann. D.D. 1982. Heatgelation properties of actoayosin and suriai prepared fromAtlantic croaker. J. Food Sci. 47�!: 1921.
Lee. C.M. and Toledo, R.T. 1976. Factors affecting texturalcharacteristics of cooked coaeinuted fish auscle. J. Pood Sci.41�!: 391.
Lee, C.M. 1984, Suriai process technology. Food Technol. 38�1!:69.
Okada ~ M., Miyauchi, D. and Kudo, G. 1973. "Kawaboko" � Thegiant aaong Japanese processed fishery products. MarineFisheries Review 35�2!: 1.
193

STUDIES ON FLOW AND GEL FORMING BEHAVIOR
OF SQUID SURIMI IN RELATION TO FORMULATION
J. M. Kim
Department of Food ScIenceUnfverslty Of Maine
Orono, ME 04469
INTRODUCTION
L'fttle Is known about the faod uses af North Atlantic squid,although It Is being described as a major underutfflzed marfne species.It has been used as an Important saurce of food fn Mediterranean andoriental countrfes. In few other cauntrfes of the world Is the squid asmuch utilized and appreciated in varfous forms of food as In Japan,whereas it has been limited for marketability In the United Statesbecause of a tough, rubbery texture. Most consumpt'fan of squid in theU.S. centers around certain ethnic graups. The tack of a damestfcmarket means that virtually all North Atlantic squfd are befng consignedfor export.
Recently, U.S. markets for squid are growing as cansumers becomeaware af fts versatility as a food and there have been numerouspublications on squid In the United States dealing with TMAO degradationfor quality factor, textural characterization, squid pratefncancentrate, the use fn meat emulsion, and tentacle protein.
The characteristic tough texture of squid Is caused by the peculfarstructure of the tissue. The mantle Is camposed af several layers ofmuscle fibers and connective tissue. Each fibrous muscle layer circumferential muscle fibers! fs about 200-500 um thick and campasedof very slender f'fbers, each about 5 um In dfameter. Between everyother layer, a narrower layer rad'fal muscle f lbers! consisting of shortfibers runs perpendicularly to the cfrcumferentfal muscle fibers. SquIdcontains a relatively large amount of col lagen, up to about 11$ of thetotal protefn ln the case of the muscle of ~ ~gyp~. Therefore,ft is bel feved that the col lagen plays a slgnlf icant role In thetextural changes durfng cooking.
Squfd 'fs readily distributed throughout the world oceans, yet ft isone of the least expensive pratefn foods. In ordinary f lsh, the rat'Ioof edible parts to the whale is roughly 40-70$ and the ratio In squid 'Isas large as 80$ trunk 50$, arms 3�!. Squid meat is equal to fish meatfn prateln content �6-20$! and amino acid composition, and can becons'fdered an excellent source of protein.
The flesh of raw squid fs tough and rubbery fn texture, butchopping with salt In a silent cutter produced a soupy texture.Apparently, the squid prote'In Is so soluble 'fn the presence af salt thatmost of the squid goes inta solution ieavlng very Iittfe mater'Ial forstructure or texture. Eventually soft and mushy fish sausage productswere obtaIned ~
194

The purpose of thfs study was �! to investigate the relationshipof composfte characteristics with rheological properties of squId sur'Imisol and gel 'In relation to ingredients and formulation and �> toexamine the correlation of textural properties with gel grossmicrostructure before and after frozen storage of the gel.
MATERIALS AND METHODS
Preparatfon of surlmfFresh skinned and cleaned North Atlantic squfd ~g f~~! was
purchased trom a local supplier and processed fnto surfml withfn 24 hr.The mantle was passed through a mincer with a die having 5 mm diameterperforatfons. The minced meat was washed four times with fcemhflledwater using 1 part squid meat to 4 parts water W/W!. The minced meatwas allowed to settle for 10 mfn followed by removal of washfng water.After the fourth washing and draining, the slurry was dewatered bycentrffugatfon at 3000 xg. The meat pelfet was chopped in a silentcutter wfth sugar, sorbftol, and sodium trlpolyphosphate �$, 4$, and0.2$, W/W, respectively> and subsequently packed fn cryobags to bestored at -20 C until used.
Preparation of surlml solAll of the thawed surlmf overnight in a refrfgerator! was chopped
with 25 W/W! salt except sod'Ium algfnatemontafnfng paste, whfch waschopped wIth 1$ salt in a silent cutter for 3 min and a calculatedamount ot fcemhffled water was added to adjust the final moisture levelto 785 and chopping was continued for 5 mfn. At this point, ingredientswere added and chopping was continued 4 min more. Twelve types ofsamples were prepared with different ingredients fncorporated as shownfn Table l.
XI
XI I
195
I
III I I
IV
VVl
VI I
V I I IIXX
Tabfe 1. Formulations of surfmi sof/gel prepared.
Squid surlmf without any IngredientSquid surimf, 2$ celluloseSquid surlmf, 1.4$ Na-algfnate, 0.6S CaS04Squid surlmf, 1$ cellulose, 0.7f Na-alginate, 0.3$ CaS04Squid surlmf, 6$ freeze-thaw stabie modified starch MS>Squid surlmi, 2$ soy protein concentrate, 6$ MSSquid surlmf, 2$ dr'Ied egg white powder, 6$ MSSquid surfml, 2$ cellulose, 6$ MSSquid surfmf, 1.4$ Na-algfnate, 0.6$ CaS04, 6'$ MSSquid surlmi, 1$ celfufose, 0.7$ Na-alglnate, 0.3'5 CaS04,
6$ MSBlended surimf:2 parts squid with 3 parts Atlantic
pollock, 6$ MSBlended surimf:1 part squfd wfth 4 parts Atlantic
pollock, 6g MS

Evaluation af flow behavior af surfml solFor the measurement of viscosity, a small portion of ihe resultfng
paste was placed fn a 150 ml plastic cup wfthout any large air pockets.In less than 2 mfn after campletlon of chapping, a measurement was madeby a Brookf lefd vfscometer at 1, 2.5, 5, 10, 20, 50, and 100 rpm using aA spindle � mm dla and 30 mm depth!, except the paste containingsodium alglnate. Vlscasfty measurements on the sodium alglnate-containing paste were perfarmed after the paste was left for 24 hr 'ln arefrfgerator. Consistency, flow behavior, and flufdfty Indfces wereobtained from shear stress vs shear rate.
Measurement of textural propertiesThe chopped surlmf paste was extruded into 30 mm d'fameter cellulose
cas'lngs and caoked at 90'C for 40 mfn In a water bath followed bycooling In running tap water for 20 min. The prepared gels were feftovern'lght at room temperature and cut fnto cylindrical shapes �0 mmdiameter and 25 mm long!.Texturaf properties measured were compressive farce, percent expressiblemafsture and penetration force as an fndex of cohesiveness, waterholdfng abflfty and f lrmness. Detailed procedures are mentioned Inanother paper of these praceedfngs. Gel samples were subJected to threefreezeWhaw cycles to evafuate the changes ln texture during acceferatedand adverse conditions af frozen storage. Samples frozen at -20'C forfive days were thawed and equilibrated to room temperature beforetexture measurement was performed for campressfve force, percentexpressible mofsture, and penetration force.
Light microscopic studySmall surlml gel blocks were frozen ln Ifquld nitrogen and
sectloned at 5-8 um w'1th a cryamicrotame. Prepared sections weremounted on slides and stained for examfnatfon.
RESULTS AND DISCUSSION
Flow curves af the surfmi sols containing various Ingredients areshown In Flg. 'f. As more 'fngred lents were added, the surlmf sols becameless pseudoplastlc, indicated by a moderation of the flow curve Fig. 1!as welf as by an increased and a decreased flow behavior fndex andconsistency index, respectively Tabfe 2!. This fs attributed to thefact that 6'$ modified starch was fncorporated with the addition of Ice-chflled water to adJust the moisture level to 78$. When other'fngredients were incorporated, again, more calculated water was addedfor the moisture adjustment. This indicates that flow behavior of thepaste ls malsture-dependent. Squid surfmf chopped with salt becamesaupy ln texture and actually cauld be poured from one contaIner toanother. Sodium algfnate slgnif fcantly 'fncreased viscosity of thesuriml paste Fig. 1!. This was because calcium 'tons react w'fth thecarbonyl lc groups of the algfnates and crasslink the molecufes. Thus,Increasing the molecular weight and viscosity. Flow curves of Atlanticpollock surfml paste prepared with and w'fthout starch are illustrated InFig. 1 to compare with the soupy texture of squid sur'lmi paste preparedwfth var'fous Ingred'fents.
196

IX
VVIII
VIIVI
I 5 M-1
SHEAR RATE sec !Flg. $. Flew curve of squid surlml solsconta ining various ingredients.
197

Table 2. Flow behav'lor, cons'lstency, and fluidity fndlces ofsurfml sol containing various ingredients.
3.203.183.043.063.083.643.524.023.80
0.3130.3'I 40 ~ 329
0.3270.3250.2750,2840.2490.263
0.3250. 3290. 3440.3360.3330.2960.3010.1540.173
IV
Vl
Vll
Vill
IXX
pollockpollock with6$ modified starch
n = f lo~ behavior index; K = consistency index; F = fluidityIndex K !.
Starch used fn this study ls a blend of potato and tapioca starches about 1:6 ratio, W/W! and modlffed by hydroxyalkylation for freeze-thawstabflfty. In F'lgs. 8a-8c, bigger granules are potato starch andsmaller ones, tap'loca. Intact starch granules before cooking showcharacteristic maltese cross fn polarized I Ight Flg. 8d!. Muscleassociated collagen can still be seen even though preparat'ion of surfmiand surlml paste fnvolves a vigorous chopp'lng In a silent cutter Fig.8c!. Apparently, squid muscle fibers are not solubfllzed by choppingwith salt Figs. 8a-8c! and when v'lewed between crossed polars, thestained fibers show polarization color Ffg. Bd!. M'lcrocrystall Inecellulose also shows bright blrefrlngence in polarized lfght. Aftercooking at 90'C for 40 mfn, starch and fibers fost maltese cross andbirefr'lngence F'lg. 9g!. Cellulose, however, stfll retained itscrystallinity after cooking and show bright b lrefringence even duringthe freeze-thaw cycles Figs. 9g, 10g, and 11g!.
During heat-induced gel format'ion, squfd surlmi gel preparedwithout starch showed extreme shrinkage and expelled large amounts ofwater from the gel matrix, resulting fn many broken areas on the surfaceof the gef. Incorporation of 6$ modffled starch improved the problemassociated with thermal shrinkage of squid muscle protein holding themofsture in the gel during cooking and eliminated the broken areas onthe surface of the gel. The effects of various Ingredients with orwithout starch on compressfve force, percent express'lble moisture, andpenetration force on squfd surlmi gets before and during successivefreeze-thaw cycles are shown ln Ffgs. 2-7. Although Type f-IV gelsprepared without starch expelled large amounts of water during cooking,percent expressfble moisture was still significantly high before andafter freezing of the gel Fig. 4! as ev'ldenced by many afr cells beforefreezing Figs. 9a and 9b! and by many areas of fce crystals duringsuccessive freeze-thaw cycfes Figs. 10a, 10b, 11a and 1fb!.fncorporation of the freeze-thaw stable modif led starch loweredcompressive Ffg. 3! and penetration Ffg. 7! forces, while improving
198

N l%
I II III IV
TYPES OP GELS
Flg. 2. Effect of various lngr edlents withoutstarch on compresstve force of surlml gel duringf reez~haw cycl es.
CC0l4 4
V' VI VII VIII IX X XI XII
TYPES OP GELS
Flg. 3. Effect of various lngredlents with 6'5 modlf ledstarch on compressive force of surlml gel duringf reez~haw cycl es.
199
M
~2RlNCl4XOv I
OQc 4
C0
U 0
PRBBEB-THAW I l 2 3CYCLE

%1%
>38
o25R
RBBKB-TEA'SN 1 2CYCLE
~28
M
~15
C4
~18
XI XII IV
TYPES OF GELS
F'fg. 4. Effect of various Ingredfents rfthoutstarch on 5 expressible moisture of surlml gelduring freez~hav cycles.
P 4
cc 2
V VI VIX VIII Ix X XX XXXTYPES OF GELS
Flg. 5. Hfect of varfous Ingredients vfth 6$ modl fledstarch on 5 expressfbfe moisture of surfml gef durfngf reez~har cyc I es.
200
C4
f4Cfl
O X
PRBBZB-THAR 6 1 2 3CYCLE

W IHHI%
O'~8.80
0 ~8.6
N RN 4IllOc
E II XXE IV
TYPES OF GZLS
Flg. 6. Effect of various lngredlents w1thoutstarch on penetration force of surllmf gel during
freez~how cyc 1 es.
<6.6
C4O
V VX VXX VEIX IX X XX XIX
TYPFS OF GELS
Flg. 7. Effect of various ingredients with 6g modifiedstarch on penetration force of sur'fml gef duringf reez~haw cyc1es,
201
oN ~g
Oc
pg $.2R
I4
I'RBEXE-THAW 5 1 2 3CYCLE
FREEZE-THAW I 1 2 3CYC Ji E

Squid surlmi pastes prepared with various ingredients. CG:collagen; CS: cellutose; EP: excessively gelatinized potatostarch; MC: muscle associated collagen; MF: muscle fibers;MP: muscle protein; PS: potato starch; SP: soy protein con-centrate; TS: tapioca starch. a! Type Vl; b! Type Vill; c! Type XI; d! same as Fig. Bb, but photographed Inpolarized light.
202

percent express'Ibie mo'Isture Fig. 5! by preventing air eel I farmatlancaused by the Increased volume of swallen starch, which resulted ln adecrease fn the volume af the gel matrix. This reduced the space forafr cell farmatfon Ffg. 9c-9e!. There were relatfvely fnsfgnlflcantchanges In compressive Fig. 3! and penetration Flg. 7! forces durfngfreeze-thew cycles In the gets prepared wfth the modified starchcampared to the ones prepared without the starch. By holding the waterabsorbed from the gel metr'Ix during caoklng, modified starch controlledthe moisture mlgratfan and thus fce crystal formation dur'Ing freezing Figs. 10c-10e and 11c-1'fe!. Control of fce crystal farmatlon, I.e.,percent expressible moisture during freeze-thaw cycles wassynergistically supparted by soy prateln concentrate and cellulose Flg.5!. Mere about this phenomenon will be mentioned later. Accordingly,the water holding ability was 'improved by the Incorporatfon of freeze-thaw stable modlf led starch Fig. 5!. Decreased compressive andpenetratlan forces before freezing caused by the incorporation of starchmay be explained by two reasans: 1! prolonged heating af squid meatcauses excessive shrinkage af the muscle fibers such that the fibersbecome hardened and densely packed as shown In Figs. 9a-9e; 2! starchgranules fn squid protein tend to be gelatinized and salubllfzedexcessively dur'Ing cook'Ing due to the large amount of water resultingfrom dehydration af squid muscle tfssue. Thus, malecular arrangementwithin the gelatinized starch embedded fn the squid gel Is loose enoughto lower the gelmtrength.
On the other hand, gel-strengthening ability of starch In fishproteins gel has been well known. The camposlte gel-reinforcing effectof starch In fish protein gel Is due to starch granules embedded fnprotein gel metr'Ix which, when swollen, exerted pressure an and drewmofsture from the matrix. This caused the gel matrix to become morecampact and firm. There fs a competition for water between starchgranules and f Ish protein system during cooking. Water binding In theprotein gel reduced the availability of water for the geiatfnizat'Ion ofstarch more so In the fish prote'In gel than In the squid protein gei.This was evfdenced by the difference In water holding ab 11 Ity among TypeV, Type XI, and Type XII geis. Addlt'Ion of pallock surlml to squidsurfmf slgnlf Icantly reduced percent expressible moisture <Type XI!.Increasing 'In pollack surlml further decreased In percent expressiblemoisture Type XII, Fig. 5!. In this way, swollen starch In fishprateln gel acts as an elastic mass, whereas that In squid protein daesnot. This also reflected the difference fn the shape of the gelatlnfzedstarch. As can be seen In F'Ig. 9c, there are many excessivelygelatinized potato starch granules In Type V gel as evidenced by thesalubflization and the leaching of part of the gelatinized starch. Ineantrast, there are few excessively gelatinized potato starch granules'In Type XI gel Fig. 9f!.
When squid gels prepared without freeze-thaw stable modif led starchwere subjected to successive freeze-thaw cycles, they shawedsignificantly Increased freeze-thaw lnstabilfty such that the gei becamemore brittle as Indicated by great decreases in compressive <Fig. 2! andpenetration Fig. 6! forces, and Increases In percent expressiblemoisture Ffg. 4!. Type II and III gels even did not show break pa'Intsat 9� deformatlon far the measurement of compressive force after secondfreeze-thaw cycle Fig. 2!.
203

Fig. 9. Sur'imf gels prepared with various Ingredfents. GC: gelati-nizedd collagen; GP: gelatinized potato starch; GT: gelati-tapioca starch; SM: shrinked collagen or muscle fibers. a!Type I; b! Type II; c! Type V; d! Type Vl; e! Type Vill
f! Type Xl; g! same as Ffg. 9e but photographed in po-larfzed fight.
204

205

Soy protefn concentrate SP! dfd not demonstrate gel-strengthenfngability as much as egg white Figs. 3 and 7!, but shawed good waterhalding ability Fig. 5! as Is vlsualfzed In Figs. '10d and 11d bycontrolling fce crystal formation dur'fng freeze-thaw cycles. Thfs mayexpla'fned by the fact that SP fmbibed water from the protein gel matrix,swelled during cooking F'Ig. 9d!, preserved fts orfg'fnaf structure Figs. 10d and 11d! during freeze-thaw cycles, and held mofsture wiihfnthe structure to prevent fce crystal grawth. However, It d'fd notreinforce gel strength like an elastic mass of gelatinized starch due toloosely arranged fnternal structure as 'fs shown in Ffg. 9d. Gefprepared with egg whfte EW! and starch Type VII! demonstrated thehighest cohesfveness Fig. 3! and firmness Fig. 7! with good waterhold!ng abff Ity Flg. 5! except those prepared with pallock surfmi.Although sodium afg Inatemontafn Ing paste was h'fghi y pseudopfastlc Flg.1!, fts heat-induced gels Types III, IV, and X! did not show greatergel strength compared to others Fig. 2-7!. ThIs may be explained bythe fact that gel formed by lon exchange between sodium and calcium, Inother words, fnsoluble calcium alglnate formed from sofubfe sodiumalglnate apparently fs not stable at the cooking conditIons used ln thisstudy. Furthermore, gel matrix of the calcium alglnate In the paste fsdisrupted during cooking by the excessive shrinkage of,squid protein.
lt has been claimed that mlcracrystallfne ceIlulose MC! helpsprevent mo'fsture migration and also fnhiblts the Irreversibleaggregation of prote'In and ather saffds during cooking and frozenstorage of foods. MC alone fn the gel Type II! cauld not control theaggregatfon of squfd protein leading to the formatfon af many areas ofair cells Ffg. 9b! and high percent expressible moisture beforefreezing of the gel. MC was not very helpful In the preventfan of Icecrystal growth Figs. 10b and 11b! resulting ln high percent expressiblemoisture during freeze-thaw cycles Flg. 4!. MC, fts role as a physicalbarrier to aggregation of protein and moisture m'fgratian, cannot play aslgnlf'fcant role alone lf the protein shrinks excessively. If used with6$ modified starch Type VIII!, MC synergistically demonstratedslgnlf'fcantly law percent expressfble moisture befare and during freeze-thaw cycles Fig. 5!. After a third freeze-thew cycle, MC stillmalntafned Its homogeneous state of the system durfng drastic phys'Icalchanges ln the gei Ffg. 11b and 1le! and demonstrated brfghtbfrefringence fn palarfzed light Flg. ilg!. Being located In air cellsor in ice crystal area, MC physically can prevent the free watermigration upon thawfng. Results af percent expressibfe moisture beforeand during the freeze-thaw cycles and microstructure of gels Types Vland VIII! suggest that absorptfan of water from surrounding gef matrix,retafnment of the absorbed water, and preservation af lts originalstructure are essential for an ingredient to provide a freeze-thawstabfl lty.
Squfd suriml gels prepared with those ingredients discussed so far Types I-X! had poor textural propertIes and would not be acceptedcommercially. In an attempt to Improve texture, varlaus levels afAtlantic pallock surfmf were added to squid surfmf with 6'$ modffIedstarch. Formulations prepared with more than 6� pollock surfml TypesXI and XII! provided desirable texture for compressive force FIg. 3!,percent expressible moisture Fig. 5! and penetratIon force Fig. 7!.Textural propertfes were supported by the gel microstructure before
206

Flg. '10. Surimi gels after first freeze-thaw cycle. CP: col lapsedpotato starch; tC: ice crystal. a! Type!;�! Type 1 l; c!Type V; d! Type V I; e! Type V I I 1; f ! Type X 1; g ! sameas F'lg. 10e, but photographed in polarized light.
207

208

Flg. 11. Surlml gel s after th'lrd freeze-thaw cycle. a! Type I; b!Type I I; c! Type V; d! Type VI; e! Type Vl I I; f! TypeX I.
209

Fig. 9f! and during successive freezeWhaw cycles Figs. 10f and 1'If!.
In summary, 1! there Is no significant difference in solcharacteristics among squid surlmi pastes containing various lngred'fentsexcept those containing sodium alglnate; 2! sadlum alglnate containingsol showed slgnlf fcantly higher consistency and lower flow behaviorindices than EW, MC, and SP cantaln lng sol; 3! incorporation of starch'fn the squid gel decreased compressive and penetration forces due taexcessive gelatinization of starch granules; 4! alglnate gel matrix didnot demonstrate the gel-strengthening ability prababiy due ta excessiveshrinkage of squid protein; 5! ln arder ta reinforce gel strength, aningredient must absarb moisture fram gel matrix, swell to exert pressureon The surrounding gel matrix, and malnta'in internal structure to someextent ta be able to act as an elastic mass In the gel matrix; 6! Inorder to act as a physical barrier ta freely moving water and to providea freezeWhaw stability, 'Ingredient must withdraw moist'ure from geimatrix during cooking and retain its orig lnaI state of structure and theabsorbed water within the structure during drast'Ic phys'Ical changes dueto successive freeze-thew cyclesi 7! squid surlml gei prepared wIth marethan 6� poi lock surlml and 6$ mod'if led starch had commercial lyacceptable texture; 8! structure study reflected the textural propertiesof gels.
REFERENCES
1. Ananymous. 1987. Technical information. Protan, Inc. North Hampton,NH.
2. Anonymous. 1987. Product description. Bulletin G«34. FMCCorparatlon, Philadelphia, PA 19103.
3. Kahn, L.N., Berk, Z., and Parlser, E.R. 1974. Squid proteinisolate: effect of pracesslng conditions on recovery yields. J.Food Scl. 39:592.
4. Klm, J.M. and Lee, C.M. 1986. Effect of various combinations ofprotein and starch on freeze-thaw stabll'fty of suriml gels.Presented at 31st Atlantic Fisheries Technological Conference,Halifax, NS, Canada, August 17-20.
5. Klm, J.M. and Lee, C.M. 1986. Mechanisms of gel relnfarc'fng effectof starch In fish protein gel. Paper Na. 460, presented at 46thAnnual Meeting af Inst. af Food Technalogists, Dallas, TX, June 15-18.
6. Klm, J.M. and Lee, C.M. 1986 Compartsan of var'faus commercialstarches for their effects on freeze-thaw stability of surlmi gets.Paper No. 461, presented at 46th Annual Meeting of Inst. of FoodTechnologists, Dallas, TX, June 15-18.
7. Klm, J.M. and Lee, C.M. 1987. Effect of starch on texturalproperties of surlm'I gel. J. Food Scl. 52�!:722.
8. Kim, J.M., Lee, C.M., and Hufnagei, L.A. 1987. Textural propertiesand structure of starch-reInforced surlml gels as affected by heat-
210

setting. Food Mlcrostruct. 6:81.
Kolodzlejska, I., Sikorskl, Z.E., and Sadowska, M. 1987. Texture ofcooked mantle of squid Illex argentfnus as influenced by specimencharacteristics and treatments. J. Food Scl. 52�!:932.
9,
Lang, E.R. and Rha, C. 198'I. Determination af the yield stress ofhydrocol lofd dlsperslons, J. Text. Studies 'I2�!:47.
10.
Lanler, T.C. 1986. Functional properties of surlml. Food Technol.40�!:107.
Leach, H.W. 1965. Gelatlnfzatlan af starch. In "Starch: Chemistryand Technolagy," vol. 1, R.L. Whistler, E.F. Paschal I eds.!,Academic press, New York, p.289-307
12.
Lee, C.M., Lee, T.C., and Chlchester, C.O. 1974. The patential useof squid as a protein resource. In "Fishery products", R. Kreuzer Ed.!, Fishing News Books! Ltd. Surrey, England, p.243.
13.
Lee, C.M. and Kfm, J.M. 1985. Texture and freeze-thew stabf I 'Ity ofsurfmi gels In relation to fngredlents and formulation. In"proceedings of the International sympasfum on eng'Ineered seafoodincluding surimf." R.E. Mart'In and Collette ed.!, NatfonafFlsherles Institute, Washington, D.C., p.168.
14.
Lee, C.M. and Kim, J.M. 1986. The refatfanshfp of compositecharacterfstlc ta rheolaglcal properties of suriml sol and gel. In"Food engfneerlng and applications, vol. 1," M. Lemaguer and P.Jelen eds.!, Elsevier Applfed Scfence publishers, London and NewYork, p. 63,
15
Martin, R.E., Fl lck, G.J., Hebard, C.E., and Ward, O.R. 1982.Chemistry 8 biochemistry of marine food products, AVI Publishingcampany, Westport, CT.
16.
17. Martin, R.E. 1986. Developing approprfate nomenclature farstructured seafood products. Food Technol. 40�!: 127.
Matsumoto, J.J. and Okuyama, E. 'f958. On the solub'fifty in water ofthe fibrous proteins of the squid muscle;phasemontrast andelectran microscopic study. Bull. Tokai Reg. Fish. Res. Lab. 24:81.
18.
Matsumoto, J.J. 1958. Some aspects on the water-salubfe protefns ofsquid muscle. Bull. Takal Reg. FIsh. Res. Lab. 20:65.
19.
Matsumota, J.J. 1958. Studies on muscle proteins of the squid.Bull. Tokai Reg. Fish. Res. Lab. 23:51.
20.
21.
Nftfsewojo, P. and Huttfn, H.O. 1986. Characteristics of TMAO22.
211
Matsumoto, J.J. 1959. Identity of M-actomyosfn from aqueaus extractof the squid muscle with the actomyosin-I fke prote'In from saltextract. Sul I. Jap. Soc. Sci. Fish. 25�!:38.

degrading systems fn Atlantic shart f lnned squid ~
Okada, M. and Yamazakf, A. 'f957. Enhancing effect of starch onJel ly strength of fish meat Jel fy. 1. Enhancing effect andgelatfnlzatian of starch. Bull. Jap. Soc. Scf. Ffsh. 22:583.
23.
Otwell, W.S. and Hamann, D.D. 1979. Textural characterlzatfon ofsquid ~gg g~~ ~~!: scann lng electron micrascopy ofcooked mantle. J. Food Scl. 44:1629.
24.
25. Otwel I, W.S. and Hamann, D.D. 1979. Textural characterlzatfan ofsquid ~g py~ 4,!: instrumental and panel evaluatIons. J.Faod Scl. 44 f636.
26. Saffle, R.L. 1973. The use of squid In meat emulsions. J. Food Scf.38:551.
27. Stanley, D.W. and Hu Itfn, H.O. 1982. Quality factors fn cookedNarth Atlantic squid. Can. Inst. Food Scl. Technol. J. 15�!:277.
28.
Tsuchlya, T., Shlnohara, T., and Matsumoto, J.J. 1980. Physfco-chemfcal propert'Ies of squid tropamyosln. Bull. Jap. Soc. Scl.Fish. 46�!:893.
30. Wu. M.C., Hamann, D.D., Lanler, T.C. 1985. Rhealogfcal andcalorimetric fnvestlgatlons of starch-fish protein systems durIngthermal processing. J. Text. Studies. 16:53.
3'I . Wu, M.C., Lanler, T.C., and Hamann, D.D. 1985. Thermal transftlonaf admixed starch/f fsh protein systems dur'Ing heatfng. J. FoodSc'I. 50 'I>:20.
32. Yamanaka, H., Shlamf, K., and Kikuchl, T. 1987. Agmatfne as apotential 'Index for freshness of common squid Todaradespacff lcus!. J. Food Scf. 52�!:936,
Yang, T.C.S. and Yang, A.P.P. 1986. Squid tentacle protein:extractfon and fts effects on the quality of Atlantfc pollocksurlml gels. Can. Inst. Food Scl. Techno!. J. 19�!:158.
33.
34. Yosh ltamf, B., Kamlya, S., and Konno, K. 1984. Heavy meromyosfnfrom squfd mantle muse'le. Bull. Jap. Soc. Scf. Fish. 50 9!:1555.
ACKNOWLEDGEMENTS
This work was supported ln part by the Maine AgriculturalExperiment Stat lan under project No. ME 08911 and ME 08553. MafneAgricultural Experiment Station ContrIbution No. 1233.
212
Tanaka, T. 1958. Histolaglcal and hfstachemical study an processIngthe squid meat - I. Histological prapert'Ies of the squid meat.Bull. Tokaf Reg. Fish. Res. Lab. 20:88.

U.S. FISHERY BYPRODUCTS: A SELECTIVE UPDATE AND REVIEW
Susan H. Goldhor
Center for Applied Regional Studies67 Highland Avenue, Cambridge, MA 02139
and
Joe M. RegensteinCornell University, Ithaca, NY 14853-5601
In this paper we would like to discuss three types of fish byproductutilization, two of which originated in Northern Europe and the third inCanada, and all of which are being actively developed and commercialized inthis country today. Our three topics are: composting of fish wastes with peat;fish protein hydrolysis; and utilization of fish meal in dairy cow rations.Each represents a very different approach towards the handling of fishprocessing plant wastes and industrial fish, and each of these approaches willmake sense for some processors and fisheries.
Com ostin fish wastes with eat: On the surface, composting fish wasteswith peat is the simplest, of the three technologies under discussion and,indeed, of all fish waste disposal methods, with the exception of dumping whichis becoming both economically and environmentally unacceptable. Compostingrequires minimal capital investment, no engineering, and little training on thepart of the operator. It is particularly attractive for three reasons. First,if properly handled it offers a completely clean method of waste disposal,generating no leachate and very little odor. Second, it produces an odorless,organic, nitrogen enriched soil amendment, which is saleable to home gardeners,highway departments, and others. Third, it is capable of handling not onlystandard finfish processing wastes but also extremely intransigent wastes whichare unacceptable for rendering, such as those from dogfish or shellfishprocessing. On the other hand, composting, like many biological technologies,can be quite variable. Experienced operators get a "feel" for building andmaintaining workable piles and can diagnose and cure most problems.Inexperienced operators are advised to start small and use an experiencedconsultant.
The initial work on composting fish, shellfish, and seaweed wastes with peatwas done by Dr. Sukhdev Mathur of Agriculture Canada and his group Nathur,1986!. Dr. Nathur's group has made two major contributions. First is the useof peat with which to compost fish. Under aerobic conditions, rotting fishgenerate significant quantities of ammonia, while sphagnum-dominated peats havehigh exchangeable acidity which permits the peat to adsorb ammonium ions up to3X of dry weight. Air-dried peat also has an enormous water absorbing capacity� up to thirty times its dry weight � and this is a key point in preventingleachate. Their second major contribution is the design of a compost pilewhich is self-aerating and thus saves the labor and equipment costs associatedwith turning or mixing.
Mathur's work was subsequently repeated and extended by Joan Brooks Brooks,1986! of the University of Naine, who showed that even dogfish wastes could beeffectively handled by this technology. At the end of the composting periodalmost all of the wastes have disappeared; the small amounts of bone, fin, or
213


3. Each fish layer must have compost starter inoculum added to it. This maybe purchased commercially. After the first batch has composted, a portion of itmay be used to start subsequent piles.
4. Experimental piles should be monitored for temperature; this is generallydone by burying a thermistor in the pile. The temperature should rise tobetween 45oC and 65 C in a pile of this size. Composting is complete when thetemperature falls to near ambient; generally eight to fourteen weeks in theNortheast. Variations exist with the material composted and with the weather;composting has been carried out in cold, wet weather but not in winter.
5. Peat used for composting must have a water content of 30 to 60K; if thewater content is lower than this, the pile could combust.
This technology is said to be in commercial use in Quebec. At least twoMaine processing companies one handling dogfish and one packing sardines! areinvestigating and developing composting as an environmentally innocuous andpotentially profitable means of waste disposal.
Maine has been a center for research on fish processing waste composting.One of the most active workers over the past year has been Phil Averill of theMaine Department of Marine Resources DMR!, who has concentrated on developingalternatives to peat for composting with fish. Currently, Maine envisionslarge scale regional composting centers where most processors would bring theirwastes; only a relatively small number of isolated processors would do theirown composting. One area of interest to the Maine DMR at this time is thematerials handling aspects of such centers, where extremely large pilesrequiring turning and aerating would be built, and where stocks of carbohydratesources would be maintained.
Among the questions currently being asked by composting researchers,including those mentioned above, the authors of this paper, and others, are:
"Can composting be done outdoors in Northern winters?
+What problems arise from composting indoors?
Can sawdust, manure, pomaces, etc. replace some orall of the peat?
+Can the process be speeded up?
"Can a higher ratio of fish to other components becomposted?
"What are the size limits of a static pile using pipes for aeration?
Fish rotein h dro| sis: Like composting, fish protein hydrolysis FPH! isan old technology which started out as a simple, low capital cost method forwaste utilization. However, unlike composting, this technology has developedand expanded enormously, and has become complex and costly in some
215

applications. Balancing this increase in cost is an increase in value of theend products, which are finding new market niches in this country SeafoodManagement Corporation, 1986!.
All hydrolysing technologies use proteolytic enzymes to digest the fishprotein and liquefy the mass of gurry. The major differences lie in theenzymes used, the extent to which digestion is controlled, the separation ofone or more components of the hydrolysate, and the methods used to stabilizethe final product.
The direct ancestor of FPH was fish silage, a product developed in Norwayduring World War II. For silage, the fish is ground and then preserved byacidification, usually with organic acids such as formic. The proteolyticenzymes in the fish are active at the levels of acidity used, and graduallydigest and liquefy the fish. This technology is related to the ancient processby which fish sauces are produced; however, fish sauce is preserved duringautolysis by salting rather than acidification.
Fish silage is still manufactured; in fact, the advantages which suited itto wartime Europe make it, a useful technology for Third World countries andsmall fish processors. The equipment can be quite simple. All it takes is agrinder, a wooden tub, paddies and acid-proof storage containers. If the properamount of acid has been added, fish silage may be stored for years with no odoror spoilage. Fish silage of this sort can be further processed into a highquality fertilizer or utilized as a livestock feed of rather mediocre quality Raa, 1982; Windsor and Barlow, 1981; Winter, 1983!.
In the next stage of complexity, heat can be added to one or more steps.Heat added to the digestion stage speeds up liquefaction. Heating also permitsoil to be separated off. An additional advantage of the heat applied for oilseparation is that it is sufficient to inactivate the enzymes. One reason whythe primitive silages are poor feedstuffs is that they tend to be overdigested,since the viscera provide a mix of enzymes which continue to work on theprotein present until a significant proportion of single amino acids and evennon-protein nitrogen is generated. Stopping the digestion at a set point,before digestion has progressed too far, gives a product which is both ofhigher nutritional value, and more consistent from batch to batch.
Many wastes lack viscera entirely and, even when viscera are present, thequantity and quality of their enzymes varies. Thus, some of the most recenthydrolysis technologies involve the use of commercially available proteases.These provide limited, consistent, highly controllable digestions. Sincedigestion occurs so rapidly, spoilage is not a problem and digestion may becarried out at a neutral pH. When the process is completed, the product may bestabilized by drying or by acidification. Particularly if the product is to bedried or concentrated, equipment costs for this process can be quite high, andplant design becomes both complex and expensive American Composite Technology,1986; Windsor and Barlow, 1981!. In addition to controlling digestion by theuse of specific enzymes under set conditions of time, pH and temperature,recent advances include the use of anti-oxidant and anti-mold ingredients toimprove palatability and shelf-life.
Hydrolysates are still minor products in the U.S. compared to, say, fishmeal, but they are increasing rapidly. They are also extremely variable
216

compared to a commodity like fish meal. Because hydrolysates are so new and sovaried, it is appropriate to list the unique qualities which specifichydrolysates can offer the marketplace.
«Palatability enhancement for a wide range of monogastric species, rangingfrom cats and dogs to salmon.
«Improved digestibility for very young animals.
«No antigenic reactions in the immature gut.
«High solubility.
«A choice of oil contents.
«A choice of wet, semi-moist, or dry product forms.
«A choice of peptide size ranges.
«Extremely high protein contents.
«Low ash contents.
Sprayability.
To processors, hydrolysis offers the advantages of being environmentallybenign, of having lower capital costs than fish meal, and of having potentiallyhigher profits than fish meal. However, there are disadvantages as well. Someof the emerging markets for hydrolysates are small and hard to locate and/ordefine. Nachinery and engineering are less well defined and harder to locatethan that for older, better known technologies. Offal may need to be separatedinto streams in some operations. And, as with many other byproducts, the ruleof "garbage in; garbage out" still holds true.
At this time there is probably more commercial work on hydrolysates in theU.S. than there is academic research. However, Dr. Robert E. Levin of theUniversity of Massachusetts in Amherst, and the senior author, under contractto the New England Fisheries Development Foundation, looked at a cross-sectionof variables in hydrolysis technology. Basic hydrolysis procedures are notcomplex. However, the fact that there are so many potential variables inhydrolysis, and that each of them affects the suitability of the product forits end market � plus the fact that these markets are young and still changingrapidly � creates complexity in hydrolysis.
Much of the more general aspects of what was learned from the above projectwill be published by the Foundation in the form of a "how-to-do-it" handbookfor fish processors and other non-specialists Goldhor, 1988!.
The major investment and interest in North American commercial fishhydrolysing has been in producing a feed ingredient for the booming salmonaquaculture industry. However, industrial approaches vary. There are single-minded companies like some aquaculture feed or fertilizer companies or aCalifornia company which opened a plant about a year ago to produce a spraydried, enzyme hydrolysed whitefish product aimed at the weaner pig market and
2l7

patterned after a classic French product made by Soprapeche. At the other endof the spectrum are companies like Bioproducts Oregon!, which produces a widevariety of aquaculture feeds and pet food palatability enhancers, and whichhydrolyses a number of feed stocks, or Stinson Canning Company Maine! whichhas mounted an impressive R & D operation resulting in a group of imaginativenew products, ranging from a moist baby pig product acidified by alactobacillus fermentation, to pet food palatability enhancers, to a productwhich is mixed with dry ingredients and extruded under heat and pressure toproduce a dairy cow supplement.
Pish meal for dair cows: The first mention of proposed U.S. research onfeeding fish meal to cattle was at the Boston AFT conference two years ago.Since that time, support for this project has come from the New EnglandFisheries Development Foundation, the Center for Applied Regional Studies,Cornell University, the International Association of Fish Meal and OilManufacturers, and the Zapata Haynie Corporation.
Why feed fish meal to dairy cattle? The answer to this question lies in thenature of the rumen. The rumen of a cow or sheep is best viewed as an enormousvat full of culture medium for a zoo of microorganisms. The cow eats grass,the microbes digest its cellulose and protein, and the cow gets her proteinfrom the bodies of the microbes. This arrangement worked well up untilrecently; however, for a modern, high producing dairy cow, the microbialprotein produced on a grass diet is inadequate in both quantity and quality.Such a cow needs high quality rumen undegradable protein sometimesinaccurately called "by-pass protein" ! which will pass through the rumen andarrive intact in the gut where it can go to the cow instead of to the microbes.
Fish meal is a particularly good source of such protein. Only 30 to 40X offish meal degrades in the rumen, which is less than most other protein sourcesfed to cattle. Current thinking in the field holds that the portion of fishmeal that is rumen degradable has an amino acid profile particularly useful forstimulating bacterial growth, and a slow rate of release helpful in maintainingrumen nitrogen levels, while the portion of fish meal which is digested in thegut has an amino acid profile which complements that provided to the cow by therumen microorganisms. Fish meal also appears to increase the efficiency withwhich cows utilize their feed. inst impressive, all of these benefits areconferred by feeding low levels of fish meal averaging one pound per cow perday- There are close to ten million dairy cows in the U.S. so that even ifonly, say, a quarter of those cows got a pound of fish meal for a quarter ofthe year, that would account for close to 250 million pounds of fish meal peryear at a time when sales to the poultry industry have been declining. Indeed,this has been the economic rationale behind our work on this project.
The British have been feeding fish meal to dairy cows for about a decade butBritish fish meal, British dairy cow diets, and British milk are all differentfrom ours. Two years ago, when we started this project, most U.S. dairynutritionists knew almost nothing about fish meal and were very suspicious ofit. The major fears were first, that fish meal would be unpalatable to cattleso that they would go off feed, and second, that fish meal would taint themilk. We are pleased to report that work by Drs. David Barbano and CharlesSniffen at Cornell has just been completed which demonstrates that even
218

quantities of fish meal significantly higher than those recommended for diaryfeeding will not taint milk. A relevant point here is that the use of the anti-oxidant, ethoxyquin, in fish meal is a relatively recent improvement. Some ofthe earlier animal feeding experiments were done with unprotected meals whichhad turned rancid.
It is true that even good quality fish meal is unpalatable to cows when itis first introduced. Once cows become used to it, however, they seem to likeit. The problem is that while they are getting used to it, milk productiondrops dramatically. After we had learned this � the hard way � we startedrecommending that cows be introduced to fish meal at least two weeks beforethey started the lactation cycle. This way, if they do cut down on feed, itdoes not affect milk production.
Although fish meal is a more consistent product than hydrolysates, it is farfrom uniform. Fish meal is made from different types of fish or fishprocessing wastes with widely differing oil and ash contents; the stick wateror solubles pressed out of the initial cooked presscake may or may not bereturned to the meal, and no two plants in the U ~ ST seem to use precisely thesame method of drying the meal.
Two years ago, visiting British fish meal specialists suggested that thebest meal to feed to dairy cows was a whitefish meal with no solubles addedback. The reasoning behind their suggestion was, First, that the long chainpolyunsaturated fatty acids of fish oil are toxic to rumen microbes, whilewhitefish meal is extremely low in oil. Second, solubles, because they would beexpected to literally be soluble in the rumen, do not add to the'rumenundegradable protein, so they should be eliminated. These reasons were logical� so much so that we ought to have been suspicious. But, since the major U.S.fish meal is a high oil, high-to-moderate solubles menhaden meal, we enteredthe arena believing that a potential opportunity for a specialized ruminantmeal made of whitefish processing wastes might exist here. However, whenCornell researchers, Drs. D.E. Hogue and M.L. Thonney, supplemented theirearlier work in feeding menhaden meal to sheep and cattle with feeding trialsusing whitefish meal, no advantages and some potential disadvantages were seen Hogue and Adam, 1982; Thonney and Hogue, 1986; Thonney et al., 1987!.Meanwhile, we had become curious about the bypass value of fish meal. Was itreally as uniform as implied by standard feed tables, which list a singlevalue? Samples of fish meals were solicited from the U.S. industry whichresponded more generously than analytical capabilities could handle. Rumendegradability was measured by Dr. C.J. Sniffen's laboratory at Cornell using avariant of the method of Krishnamoorthy Krishnamoorthy et al., 1983! and thevalues differed enormously. In general, although not invariably, meals with ahigher bypass value had a higher oil content. In fact, E.R. Orskov, at theRowett Research Institute in Aberdeen, Scotland, had seen this earlier Orskov,1982!, but his work had escaped our notice. It also turns out that the Britishdo not feed mainly whitefish meal to cattle but, rather, intermediate oilherring meals'� !
We then obtained, from the Zapata Haynie corporation, meals with and withoutadded solubles. There was no consistent relationship between solubles contentand rumen degradability except in meals which had been vacuum dried, thegentlest drying method. Our current theory is that the more common, harsher
2lg

drying methods impart a reasonable degree of rumen undegradability to thesolubles.
There are still a number of challenges remaining and we are still involvedwith trying to solve them.
1. Fitting fish meal to the economics and management practices of U.S. dairyfarms. Fish meal is by far the most expensive source of protein a dairy farmercan use. It is not economical for all cows, all the time, on all diets, andunder all management practices. We need to find out when it is economical andget that information to farmers, nutritionists, extension agents, and feedmanufacturers. In general we believe that highly rumen degradable diets, suchas those high in alfalfa, hay, and their silages will benefit the most fromfish meal.
2. Solving the fish oil problem. The polyunsaturated fatty acids in fishoil are toxic to the rumen microorganisms, in such a way that although milkproduction may not be affected, butterfat production may go down. The reasonsare not understood, although a number of theories exist. We have just startedto work on ways to diminish or eliminate the butterfat depression by changingthe cow's diet while continuing to feed a reasonably high oil meal.
3. Working with the fish meal industry. In Great Britain and Scandinavia,fish meals are labelled and sold as specialty products � not as a genericcommodity. We believe that this is the right approach. Ruminant feed marketswant to know accurate oil levels and rumen undegradability as well as totalprotein, ash, etc. They also want. meals selected for 1'ower oil content andmoderately high undegradability. We believe that such selection and labellingwill exist in this country within two to three years.
REFERENCES:
American Composite Technology. 1986. Fish Waste Handling Systems for NewEngland: Engineering Specifications. New England Fisheries DevelopmentFoundation, 280 Northern Ave, Boston, MA 02210.
Brooks, J. LE 1986. Composting fish and shellfish scrap with peat. Report,Department of Civil Engineering, University of Maine, Orono, ME 04469.
Goldhor, S. H. 1988. Fish Protein Hydrolysis: A User's Guide. New EnglandFisheries Development Foundation, 280 Northern Ave, Boston, MA 02210.
Hogue, D. E. and Adam, A. A. 1982. Protein sources for young rapidly growinglambs. Proc. Cornell Nutr. Conf., pp. 103-106.
Krishnamoorthy, U., Sniffen, C.J., Stern, M.D., and Van Soest, P.J. 1983.Evaluation of a mathematical model of rumen digestion and an in vitrosimulation of rumen proteolysis to estimate the rumen-undegraded nitrogencontent of feedstuffs. British J. Nutr. 50:555-568.
Mathur. S. P., Daigle, J.-Y., Levesque, M., and Dinel, H. 1986. The
220

feasibility of preparing high quality composts from fish scrap and peat withseaweeds or crab scrap. Biol. Agric. and Hortic. 4:27-38.
Orskov, E. R. 1982. Protein Nutrition in Ruminants. Academic Press, NewYork, p. S8.
Raa, J. and Gildberg, A. 1982. Fish silage: a review. CRC � CriticalReviews Series in Food Sci. and Nutr. 16:383-419.
Seafood Management Corporation. 1986. New Markets for Maximizing New EnglandFisheries Byproduct Values. New England Fisheries Development Foundation, 280Northern Ave, Boston, MA 02210.
Thonney, M. L. and Hogue, D. E. 1986. Fish meal or cottonseed meal assupplemental protein for growing Holstein steers. J. Dairy Sci. 69:1648-16S1.
Thonney, M. L., Fox, D. G., Duhaime, D. J., and Hogue, D. E. 1987. Fishmeal and apple pomace for growing cattle. Proc. Cornell Nutr. Conf., pp. 106-114.
Windsor, M and Barlow, S. 1981. Introduction to Fishery By-Products. FishingNews Books, Ltd., Farnham, Surrey, England.
Winter, K. A. and Feltham, L. A. W. 1983. Fish silage: the protein solution.Contribution 1983-6E, Agriculture Canada, Research Branch, P. 0. Box 1210,Charlottetown, Prince Edward Island, ClA 7M8, Canada.
221

RECOVERY OF PROTEIN FROM MECHANICAL SHRIMP PEELER EFFLUENTS:MICROBIOLOGICAL QUALITY OF EFFLUENT AND RECOVERED PROTEIN
Brian E. Perkins
Alabama Sea Grant Extension Service3940 Government Boulevard
Mobile, AL 36693
and
Kimberly P. HarperBiology Department
University of South AlabamaMobile, AL 36688
Protein was recovered from mechanical shrimp peeler effluent by HC1precipitation and centrifugation. Percent recovery of solids was 1X � 2Xof the untreated effluent by weight and was predictable from untreatedeffluent turbidity. Total aerobic plate counts of bacteria recoveredfrom the protein and unprocessed shrimp were 10 5 � 10 6 CFU/g,approximately 1.5 logs higher than peeled shrimp and untreated effluent.The acid precipitation and centrifugation process reduced effluent totalorganic nitrogen, biochemical oxygen demand, and turbidity by 45.0X,53.8X, and 92.4X, respectively, compared with the untreated effluent.
INTRODUCTION
Disposal of seafood processing effluents is one of the most seriousproblems facing Bayou La Batre seafood processors. Currently, mostseafood processing effluents are directed to the Bayou La Batre municipalsewage treatment plant, which also receives domestic sewage. The BayouLa Batre municipal sewage treatment plant was designed and constructed toprovide tertiary treatment for 1 million gallons per day � MGD!.However, best estimates indicate that seafood processors send over 2million gallons of effluent to the sewage treatment plant each day duringpeak months Polysurveying, 1986! ~ Added to that amount is another600,000 gallons of domestic sewage per day.
The sewage treatment plant does not have adequate capacity to treatbetween 2.5 MGD and 3 MGD, and has been forced to bypass any volumes ofdomestic sewage and seafood processing effluents which it receives thatare in excess of 1 MGD. This situation led to regulatory actions bystate and federal environmental agencies, which stipulated that Bayou LaBatre municipal and seafood processing effluents achieve compliance withNational Pollution Discharge Elimination System NPDES! limitations byJune 30, 1988.
222

Several solutions were proposed by the City of Bayou La Batre andeffected processors. The final alternative resulted in the formation ofBJV, Inc., composed of three shrimp processors. BJV has funded a $1Million project currently underway! to construct a new seafoodprocessing effluent collection and outfall line to serve the needs of itsprincipals and the other 15 seafood processing plants located along theroute of the outfall line. While this method of disposal will improve onthe present arrangement by segregating seafood processing effluents fromdomestic sewage, it will not provide any treatment of the seafoodprocessing effluent beyond in-plant screening of solids. The effluentwill be treated as a wastewater, not as a processing stream whichcontains recoverable byproducts. Prior research has shown that seafoodprocessing effluents generated by plants which operate mechanical shrimppeelers contain substantial amounts of recoverable shrimp protein CRESA,1971!, Johnson and Lindley, 1982!, Johnson and Gallanger, 1984!, Mauldin and Szabo, 1974!, Meyers and Sonu, 1974!, Perkins, 1977!, Perkins and Meyers, 1977!, Soderquist, 1973!, Toma and James, 1975!, Toma and Meyers, 1975!.
METHODS
Fifteen collections of mechanical shrimp peeler effluent were madefrom June 23, 1987 through August 17, 1987. The effluent was derivedfrom a Laitram Model A mechanical shrimp peeler.
All liquid effluent samples were collected in 2 gal Nalgene carboyswhich had been previously sanitized with a solution of 1600 ppm sodiumhypochlorite and rinsed with deionized water.
Samples of mechanically peeled raw shrimp tail meat were taken oneleven occasions. Since the peeled shrimp meat was a portion of themechanical peeler discharge flow, it was included in the Nalgene carboysalong with the liquid effluent. The carboys containing either liquideffluent or the liquid effluent/peeled shrimp combination were placed onice in an insulated styrofoam cooler.
Raw head-on shrimp samples were taken on four occasions during thelast seven collections. Samples were collected by hand previouslysanitized in 400 ppm RPH solution! from the mechanical shrimp peeler feedhopper. The shrimp were placed in sterile Nasco Whirl-Paks, sealed, andplaced on ice in an insulated styrofoam cooler.
Potable influent city water! samples were taken on three occasionsduring the last seven collections. Samples were collected by fillingsterile Nasco Whirl-Paks from a thawing tank fill pipe. Filled bags weresealed and placed on ice in an insulated styrofoam cooler.
All samples were immediately transported by automobile to thelaboratory �2 miles from the sample collection location!. This tripusually took 20 minutes. Because the amount of time required for samplecollection averaged 15-20 minutes, none of the samples were more than 45
223

minutes old upon arrival at the laboratory. All samples were immediatelyre-iced upon arrival at the laboratory, and held on ice until analyzed.
Note: Throughout all succeeding methods, all laboratory glassware,plastic ware , and stainless steel implements were sterilized prior touse.
Preci itation and Centrifu ation
Carboys containing liquid effluent or the liquid effluent/peeledraw shrimp combination were shaken to assure uniformity of liquideffluent. The liquid effluent/peeled raw shrimp samples were firstscreened on a 5 - mesh stainless steel screen to remove peeled rawshrimp. Peeled raw shrimp samples were placed in sterile Nasco Whirl-Paks and re-iced!. A 2,000 ml aliquot of each liquid effluent sample wasmeasured in a graduated cylinder and transferred to a 4,000 ml glassbeaker. A magnetic stirring bar was inserted, and the sample beaker wasplaced on a magnetic stirrer.
Initial pH measurements were taken with an Orion Model 201 digital pHmeter, and the values recorded. A 50 ml buret containing 1.0 N Reagent�Grade HCl C.A.S. Reg. 7647 � 01 � 0! was positioned over the samplebeaker. The magnetic stirrer was turned on and set to operate at a slowspeed. Slow drop-by-drop! addition of the hydrochloric acid wasinitiated. The pH was continually monitored until a pH in the range of4.65 � 4.80 was reached, at which point addition of hydrochloric acid wasdiscontinued. Values for final pH and amount of hydrochloric acid addedwere recorded.
200 ml aliquots of acidified liquid effluent samples were immediatelytransferred to sterile 250 ml centrifuge bottles which had beenpreviously tared on a Nettler Model PK � 3600 digital scale, and theweights recorded. Filled centrifuge bottle weights were taken andrecorded.
Bottles of acidified liquid effluent were centrifuged at 7,000 rpmfor 1 min at 40 F in a Sorvall Model RC-5B centrifuge. Supernatantfractions were pooled, placed in sterile containers, and returned to icedstorage. Weights of centrifuge bottles containing precipitate were takenand recorded. Precipitate fractions were pooled, placed in sterilecontainers, and returned to iced storage.
Measurements for turbidity of both liquid effluent and supernatant clarified wastewater! were taken on fourteen of the sampling dates andthe readings recorded. Turbidity measurements were made with a HachModel 2100 A turbidimeter which had been previously calibrated withstandard tubes.
224

Total K 'eldahl Nitro en Ammonium Nitro en and Biochemical Ox en Demand
Subsamples of liquid effluent, supernatant clarified wastewater!,and precipitate were collected on each of the fifteen sampling dates,placed in sterile Nalgene plastic bottles, and stored in a -20 Cfreezer. Subsamples were maintained at -20 C until after three orfour sampling runs had been completed.
The frozen subsamples were removed from frozen storage, iced in aninsulated plastic cooler, and transported to a commercial chemistrylaboratory in Pascagoula, MS �5 minutes away! on four occasions. Thesubsamples were allowed to thaw overnight in a 38 F refrigerator. Allsubsamples were subjected to Total Kjeldahl Nitrogen and AmmoniumNitrogen analyses according to standard methods AOAC, 1980!.Subsamples of liquid effluent and supernatant were subjected toBiochemical Oxygen Demand analyses on three occasions. BiochemicalOxygen Analyses were conducted according to the standard Winkler AzideModification EPA, 1983!.
Analyses for total aerobic plate count and fecal coliforms wereconducted on the following samples for the indicated collections:
Collection Numbers Sample Types
All sample handling and preparation, total aerobic plate count, andfecal coliform methods conformed to standards prescribed in the F.D.A.Bactarinln ical ~Anal tical Manual A.O.A.C., 1984!.
RESULTS AND DISCUSSION
Preci itation and Centrifu ation
Percent recovery of solids from the peeler effluent stream wascalculated by the following formula:
225
Total Aerobic Plate Count and Fecal Coliforms
1-15
1-15
1-15
1,2,4-159,11,13,15
9,11,13
Liquid EffluentSupernatantPrecipitatePeeled Raw ShrimpRaw Head-On ShrimpMunicipal Water
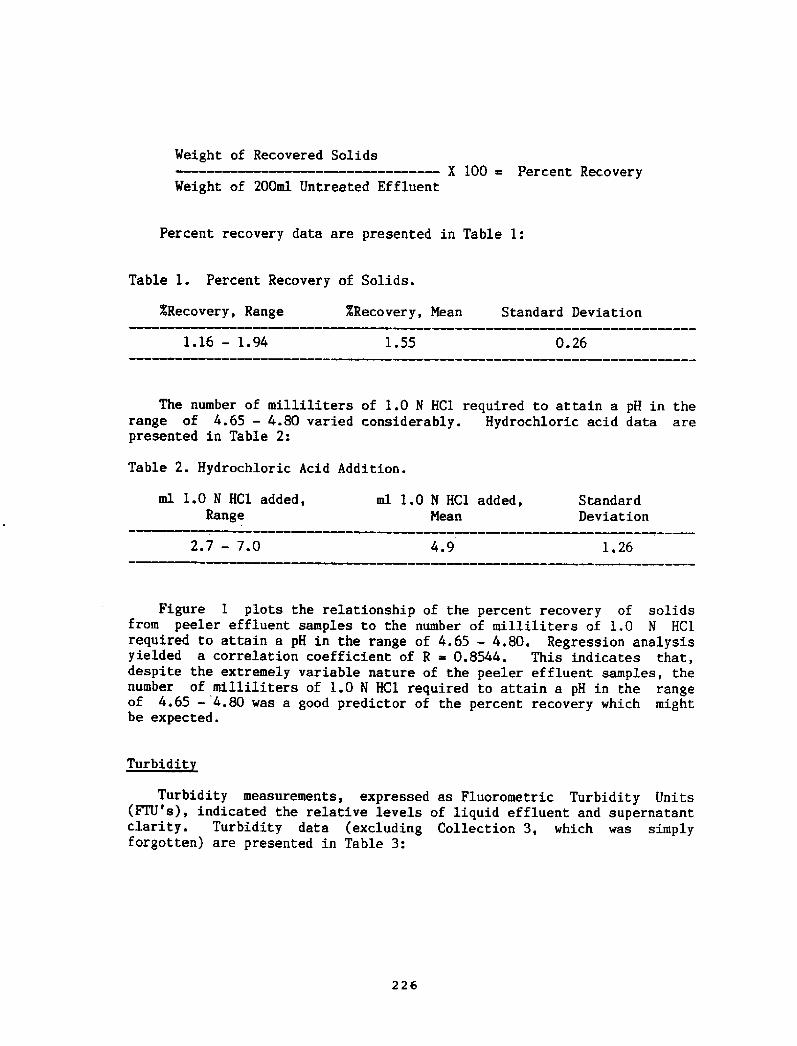
Weight of Recovered SolidsI 100 ~ Percent Recovery
Weight of 200ml Untreated Effluent
Percent recovery data are presented in Table 1:
Table 1. Percent Recovery of Solids.
%Recovery, Range XRecovery, Mean Standard Deviation
1.16 � 1 ~ 94 0.261.55
The number of milliliters of 1.0 N HCI required to attain a pH in therange of 4.65 � 4.80 varied considerably. Hydrochloric acid data arepresented in Table 2:
Table 2. Hydrochloric Acid Addition.
ml 1.0 N HC1 added,Range
ml 1.0 N HC1 added,Mean
Standard
Deviation
2.7 � 7.0 4.9 1.26
Figure 1 plots the relationship of the percent recovery of solidsfrom peeler effluent samples to the number of milliliters of 1,0 N HCIrequired to attain a pH in the range of 4.65 � 4.80. Regression analysisyielded a correlation coefficient of R ~ 0.8544. This indicates that,despite the extremely variable nature of the peeler effluent samples, thenumber of milliliters of 1.0 N HC1 required to attain a pH in the rangeof 4.65 � 4.80 was a good predictor of the percent recovery which mightbe expected.
Turbidity measurements, expressed as Fluorometric Turbidity Units FPU's!, indicated the relative levels of liquid effluent and supernatantclarity. Turbidity data excluding Collection 3, which was simplyforgotten! are presented in Table 3:
226

Table 3. Turbidity.
Standard DeviationRange Mean
42.82.8
92.4
15.61.6
5.6
20 � 75
1.5 � 7
75 � 98
Peeler Effluent, PTUSupernatant, FTUPercent Reduction
The extreme variability of the peeler effluent and supernatantturbidity data note large standard deviations! illustrates very well thevariable conditions under which shrimp are mechanically processed. Thepeeler effluent turbidity data simply indicate that at any given time, anunscheduled "grab sample" can yield turbidity readings which may vary byas much as 3.75 times. A composite flow vs. time! sampler would help toalleviate this variability. Likewise, supernatant tubidities whichresult from subjecting variable peeler effluent samples to precipitationand centrifugation may vary by as much as 4.6 times.
However, percent reduction of turbidity
PEELER EFFLUENT TURBIDITY � SUPERNATANT TURBIDITY!
PEELER EFFLUENT TURBIDITYX 100
227
data reflect that, regardless of the peeler effluent turbidity value, theturbidity of the supernatant will be reduced to a mean value which isonly 1.6X of the effluent. The consistency of this capability to reduceturbidity by a mean of 92.41X is supported by the rather low standarddeviation of 5.61.
Figure 2 plots the relationship of peeler effluent turbidity to thepercent recovery of solids from peeler effluent samples. Regressionanalysis yielded a correlation coefficient of R 0.80. Althoughturbidity is a slightly less accurate predictor of percent recovery ofsolids from the peeler effluent than the number of milliliters of HC1added Figure 1!, it provides an estimate of the range of recoverablesolids.
Figure 3 plots the relationship of peeler effluent turbidity to thenumber of milliliters of 1.0 N HCl required to attain a .pH in the rangeof 4 ' 65 � 4.80 Collections 1,2,4-15! ~ Regression analysis yielded acorrelation coefficient of R = 0.8775. This indicates that turbidity isa very good predictor of the amount of HC1 required to attain a pH in therange of 4.65 - 4.80. More importantly the use of turbidity measurementsto predict the amount of HCl necessary for isoelectric precipitationwould provide an effective method of on-line process control for a pilotor production � scale effluent treatment and byproduct recovery system.

Figure 1. Percent Recovery of Shrimp Solids due to Additio~ f HCl.
a V
Z
4
4 1.3 :. Recovered of Solids228

Figure 2. The Effect of Effluent Turbidity on Percent Recovery
QV3l~ l,7
Q 2Q 4C gQPeeler Effluent Turbidity FTL~!
229


The results of Total Kjeldahl Nitrogen TKN! and Ammonium Nitrogenanalyses, plus calculated Total Organic Nitrogen TON! values Calculatedas TON TKN � Ammonium!, are presented in Table 4:
Table 4. Nitrogen.
Precipitate,ppm
Untreated
Effluent, mg/1Supernatant
mg/1
46 � 188
118.7
40.2
9094 � 25, 20015,913
4,228.6
81 � 675
233.9
139.2
RangeMean
Std. Dev.
TKN
1-6
4.3
1.6
1-9
4.9
2.1
7 � 3710
475.1
1,132.5
RangeAmmonium Mean
Std. Dev.
80 � 666
229
137.6
45 � 181
114.3
38.7
9068 � 25,17415,394
4127
RangeMean
Std. Dev.
TON
231
Total Kjeldahl Nitrogen values were extremely variable, as evidencedby the wide ranges and large standard deviations listed in Table 4. Thevariability in untreated effluent TKN was probably due to uneven productflow with constant water flow! through the mechanical shrimp peelers.Supernatant fraction and precipitate fraction TKN values were equallyvariable. This was a logical result since those two fractions werederived from the untreated effluent.
Ammonium Nitrogen, an indicator of age or degree of spoilage inshrimp, varied somewhat more than did TKN. This is to be expected sincethe age and quality of shrimp encountered during the processing seasonwould likewise tend to vary.
Mean percentages of TKN recovered as total organic nitrogen fromuntreated effluent, supernatant, and precipitate samples were 97.8X,96.4X, and 97 ' 3X, respectively. Although standard deviations ofcalculated mean TON values for untreated effluent, supernatant, andprecipitate samples were large, the percentage of TKN recovered asammonium nitrogen exceeded 4.5X on only 2 occasions. This means that, in43 of 45 instances, TON values were no more varible than theircorresponding TKN values.
Precipitation and centrifugation proved an effective method forrecovering TON from mechanical shrimp peeler effluents. Table 5 presentsTON data for untreated effluent and supernatant samples, plus percentreduction of TON values:

Table 5. Percent Reduction of Peeler Discharge TON.
Standard DeviationRange Mean
Untreated Effluent, mg/1 80 � 666Supernatant, mg/1 45 � 181Percent Reduction 29.3 � 72.8
229
114.3
45. 0
137.7
38.7
13.7
Biochemical Ox en Demand
Biochemical oxygen demand BOD! determinations were conducted . onthree occasions to provide another indication of the effectiveness ofremoval of organic matter from shrimp peeler effluent. The results arepresented in Table 6:
Table 6. Biochemical Oxygen Demand.
Range Nean Standard Deviation
Untreated Effluent, mg/1 1800 � 2600 2066 461.8Supernatant, mg/1 800 � 1000 933 115. 5Percent Reduction 44.4 � 61.5 53.8 8.7
These data suggest that roughly half of the demand for oxygenremained in the supernatant following percipitation and centrifugation.This is consistent with prior work in the area of shrimp proteinprecipitation Perkins, 1977!. The investigators are unsure why thisreduction cannot be exceeded. Perhaps the isoelectric precipitationrange pH 4.65 � 4.80! was too selective. The need for furtherexperiments to examine the effectiveness of a two � phase precipitationand centrifugation process appears to be in order.
Total Aerobic Plate Count.
Total aerobic plate count APC! determinations were conducted for allliquid samples, the various fractions derived after precipitation and
232
These data suggest that roughly half of the available TON was leftbehind in the supernatant following precipitation and centrifugation.This is consistent with prior work in the area of shrimp proteinprecipitation Perkins, 1977!. The investigators are unsure why thismean percent reduction cannot be exceeded. Perhaps the isoelectricprecipitation range pH ~ 4.65 -4.80! was too selective. The need forfurther experiments to examine the effectiveness of a two � phaseprecipitation and centrifugation process appears to be in order.

centrifugation, plus raw head-on and peeled raw shrimp samples. Theresults, expressed as LoglO APC, are presented in Table 7.
Table 7. LoglO Total Aerobic Plate Count.
Range, Logl0 APC/mlUntreated Mean, Log10 APC/mlEffluent Standard Deviation
3.11 � 5.00
4.12
0.56
Range, Log10 APC/mlSupernatant Nean, LoglO APC/ml
Standard Deviation
0.30 � 2.83
1.51
0.51
Range, Logl0 APC/gPrecipitate Mean, LoglO APC/g
Standard Deviation
4.98 � 6. 865.70
0.51
Range, Log10 APC/gMean, Logl0 APC/gStandard Deviation
4.52 � 5.525.06
0.50
Raw
Head-on
Shrimp
Range, Log10 APC/gMean, LoglO APC/gStandard Deviation
3. 78 � 5. 04
4.300.42
Peeled
Raw
Shrimp
233
All municipal water APC determinations were negative no growth!.Several trends can be noted based on the LoglO APC data. Mean log 10
APC/ml of the supernatant fraction was 2.61 logs less than the mean log10 APC/ml of the untreated effluent from which it was derived.Correspondingly, mean log10 APC/g of the precipitate fraction was 1.58logs greater than the mean loglO APC/ml of the untreated effluent fromwhich it was derived. These data indicate that the precipitation andcentrifugation process concentrates colony forming units in theprecipitate fraction while reducing their numbers in the supernatantfraction.
The mean log10 APC/g of the precipitate fraction was only 0.64 loggreater than the mean log10 APC/g of raw, head-on shrimp, and was withinthe same order of magitude �0 5 !. Likewise, the mean log10 APC/g ofthe peeled raw shrimp was only 0.1.8 log greater than the mean logl0APC/ml of the untreated effluent in which it was contained. Mean logl0APC/g of peeled raw shrimp and mean loglO APC/ml of untreated effluentwere also within the same order of magnitude �0 !.
Figure 4 plots the relationship of untreated effluent log10 APC/ml toprecipitate loglO APC/g. Regression analysis yielded a correlationcoefficient of R = 0.8775. These data indicate that there is a definite,linear relationship between log10 APC of untreated effluent samples andthe logl0 APC of solids precipitated from them. This is especially
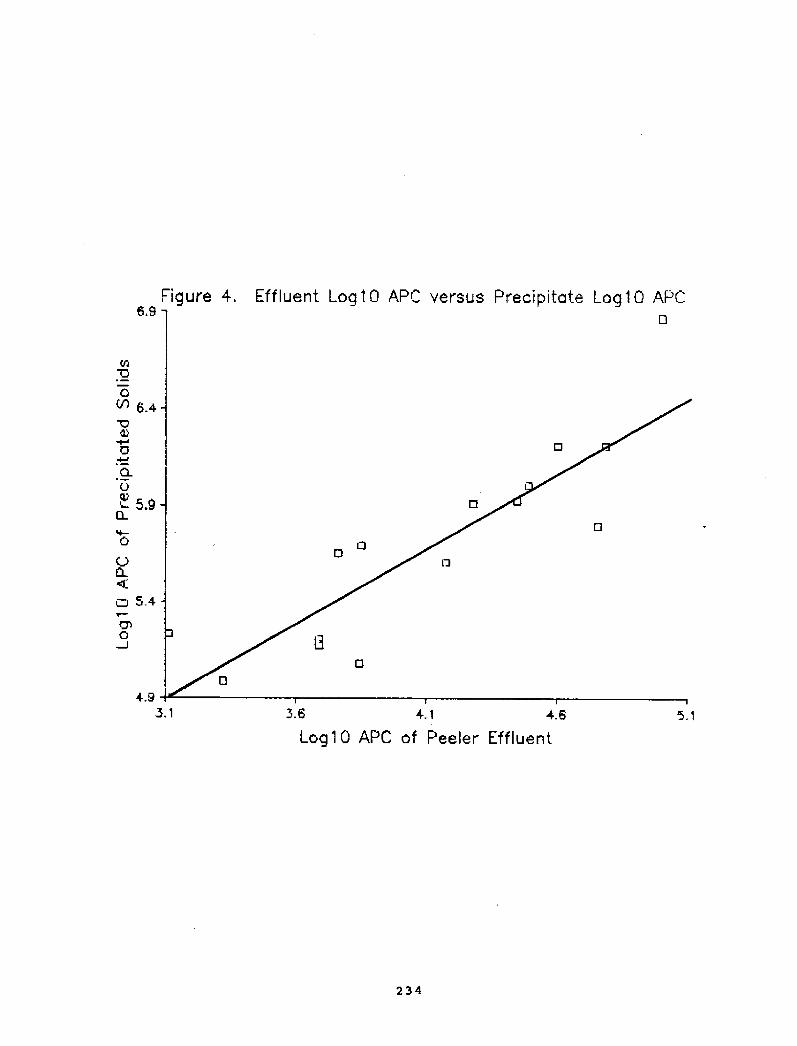
Figure 4. Effluent Log� APC versus Precipitate Log]0 APE6.9
0
GV! 64
Q CLU i 5.9
CL
V CL
u 5-4
0 49 3.1 3.6 4. '! 4.6Log10 APC of Peeler Effluent
234
Fecal Coliforms
Fecal coliform determinations were conducted for all liquid samples,the various fractions derived after precipitation and centrifugation,plus raw head-on and peeled raw shrimp samples. Fecal coliform rangesare presented in Table 8:
Table 8 ~ Fecal Coliform Ranges,
Range, Fecal Coliforms/ml or /100gSample Type
Untreated Effluent 0 � <18
Supernatant
Precipitate
Raw Head-On Shrimp
Peeled Raw Shrimp
0 � <1.8
0 � 1700
<18 � 3500
<18 � 20
All municipal water fecal coliform determinations were negative nogrowth!.
Fecal coliform counts for untreated effluent samples ranged from 0�<18/ml. Specifically, counts of 0 were noted on 5 occasions, and countsof <1.8/ml were noted on 7 occasions. Otherwise, counts of 4/ml, 7.8/ml,and <18/ml were each noted on one occasion.
Fecal coliform counts for supernatant fractions ranged from 0<1.8/ml. Specifically, counts of 0 were noted on 6 occasions, and countsof <1.8/ml were noted on 9 occasions. This represents a slightimprovement over untreated effluent fecal coliform counts.
Fecal coliform counts for precipitate fractions ranged from 0 � 1700.Specifically, counts of 0 were noted on 3 occassions, counts of <18/100gwere noted on 4 occasions, counts of 18/100g were noted on 3 occasions,and counts of 45/100g were noted on 3 occasions. Otherwise, counts of20/100g and 1700/100g were each noted on one occasion. Discounting the
235
remarkable when consideration is given to the widely variable � logs!range of APC values noted in the untreated effluent.
Figure 5 plots the relationship of untreated effluent log10 APC/ml tosupernatant logl0 APC/g. Regression analysis yielded a correlationcoefficient of R ~ 0.8185. These data indicate that there is also alinear relationship between log10 APC of untreated effluent samples andthe log 10 APC of the supernatant remaining after precipitation andcentrifugation. The data contained in Figures 4 and 5 provide goodmodels for predicting rates of recovery of colony forming units in theprecipitate and supernatant fractions following precipitation andcentrifugation of peeler discharge samples.

Figure 5. EffIuent Log� API" versus Supernatant Log 1 0 Al C3q
2.5
C Q
2
4 QVl
~ !.5Q
9CL
c> 3.1 36 4.1 4.6Log'l0 APC of Peeler Effluent
236

one high count of 1700/100g, these data suggest a slight reduction inquality from untreated effluent fecal coliform counts.
It should be noted that the precipitate fecal coliform count of1700/100g occurred on the same collection date �7/27/87! when a fecalcoliform count of 3500/100g was noted in a sample of raw, head-on shrimp.This leads the investigators to assume that raw product contaminated vithfecal coliforms will logically produce precipitated shrimp protein whichis also contaminated with fecal coliforms.
Fecal coliform counts for raw, head-on shrimp samples of <18/100g,45/100g, 110/100g, and 3500/100g were each noted on one occassion. Thesedata serve to provide a base of understanding about the wide diversity inquality of raw product entering the mechanical shrimp peeler.
Fecal coliform counts for samples of peeled raw shrimp ranged from<18/100g � 20/100g. Specifically, counts of <18/100g were noted on 9occasions, and counts of 18/100g and 20/100g vere each noted on oneoccasion. Obviously, passage of shrimp through a mechanical peeler atthe rate of one pound of shrimp per 8.6 gallons of water! serves toreduce the amount of fecal coliforms found in the final product.
RECOMMENDATIONS
Based on the results of this initial bench-scale project, thefollowing recommendations are made:
Reductions in supernatant TON, BOD, and turbidity are significantenough to warrant continued experiments to increase theeffectiveness of the precipitation and centrifugation process.
Precipitated shrimp byproduct, quality is sufficient to varrantcontinued recovery efforts.
Scale-up to a pilot plant installation to recover largerquantities of solid material from mechanical peeler effluent.
Assess quantity and quality of solid materials recovered frompilot � scale recovery system.
Assess effectiveness of reduction of organic matter frommechanical shrimp peeler effluent by pilot � scale recoverysystem.
Assess market potential of recovered solid materials by allowingkey food research and development laboratories to further testsamples.
Determine economic viability of the pilot � scale effluenttreatment and byproduct recovery system.
237

ACKNOWLEDGEMENTS
Alabama Department of Economic and Community Affairs forproviding project funding.
Auburn University/Alabama Cooperative Extension Service forproviding matching funds.
- Dr. A.M. Guarino, Chief, U.S. Food and Drug AdministrationFisheries Research Branch for providing laboratory facilities.
Angelo DePaola, U.S. Food and Drug Administration Fishery ResearchBranch for assistance with all aspects of project design andperformance.
The cooperating shrimp processor for allowing sample collection.
� Micro-Methods Laboratories of Pascagoula, MS. for conduct ofnitrogen and BOD analyses.
Ms. Cecelia Formichella for conducting the processor survey.
Dr. Merrill MacPhearson, U.STFisheries Research Branch foranalysis.
Food and Drug Administrationassistance with statistical
LITERATURE CITED
AOAC. 1980. Official Methods of the Association of Official AnalyticalChemists. 13th Edition. Arlington, VA.
AOAC. 1984. Bacteriological Analytical Manual of the Division ofMicrobiology. Center for Food Safety and Applied Nutrition, U.S.Food and Drug Administration. 6th Edition. Arlington, VA.
CRESA. 1971. Pollution Abatement and By-Product Recovery in Shellfishand Fisheries Processing. EPA Water Pollution Control ResearchSeries. 12130 FJQ 06/71. U.S. Government Printing Office.Washington, D.C. 85pp.
EPA. 1983. Methods for Chemical Analysis of Water and Wastes.Cincinnati, OH.
238
The contributions of the following organizations and individuals aregratefully acknowledged:

Johnson, R.A. and S.M. Gallanger. 1984. Use of coa ulants to treatseafood rocessin wastewaters. Journal WPCF. 56 8!: 970 � 976.
Mauldin, A.F. and A.J. Szabo. 1974. Shrimp Canning Waste TreatmentStudy. EPA Environmental Protection Technology Series. EPA660/2-74-061. U.S. Government Printing Office. Washington, D.C.130pp.
Meyers, S.P. and S.C. Sonu. 1974. Nucleotides and amino acids inshrim blanchin water. Feedstuffs 46:23.
Perkins, B.E. 1977. Recovery of proteinaceous by-products from shrimpcannery effluents. Masters Thesis. Louisiana State University.Department of Food Science. 94pp.
and a lication ofPerkins, B.E. and S.P. Meyers. 1977. Recoveror anic waste from the Louisiana shrim cannin industr
Proceedings: Eighth National Symposium on Food Processing Wates.EPA � 600/2-77- 184. pp.292 � 307. EPA. Cincinnati, OH.
Polysurveying. 1986. City of Bayou La Batre Industrial OutfallCollection System: Flow Requirements and Financial Schedules.19pp. Polysurveying. Mobile, AL.
Soderquist, M.R. 1973. Canned and Preserved Fish and SeafoodsProcessing Industry Development Document for Effluent LimitationsGuidelines and Standards of Performance. EPA Contract ¹68-01-1526. U.S. Government Printing Office. Washington, D.C.
Toms, R.B. and W.H. James. 1975. Nutritional evaluation of roteinfrom shrim canner effluent shrim waste rotein . J. Agric.Food Chem. 23:1168 � 1171.
Toma, R.B. and S.P. Meyers. 1975. isolation and chemical evaluationof rotein from shrim canner effluent. J. Agric. Food Chem.23:632 � 635 '
239
Johnson, R.A. and K.L. Lindley. 1982. Use of h droc clones to treatseafood rocessin wastewaters. Journal WPCF. 54 �2!: 1607�1612.

FREEZE-THAW CONCEN'.PRATION OP SHELLPISH
EXTRACT AND ITS PLAVOR PROPILE
Charles N. Jayarajah and Chong M. LeeDepartment of Food. Science and Nutrition
Uaiversity of Rhode IslandKingston, RI 02881.
INTRODUCTION
Shellfish flavor imparts distinctive taste tosurimi-based products, soups and. souces. Eowever, the method.currently followed in the extraction process often resultsin the loss of aromatic and flavor-giving compounds. Theflavoring agents presently marketed are in either natural orartificial versions. Natural flavor extracts are often usedin combination with artificial source to achieve maximumefffect. Due to consumer preference, natural flavor extractsare added, as a principal constituent.
The first and, one of the most important stages ofextraction process is the selection of cost efficient aadrelatively abundant supply of raw materials, Shellfishwaste weighing thousands of pounds are generated. fromseafood, processing plants annually Eood et al, 1976!.Lippincott and Lee 1984! reported that meat of lobsterbodies comprising 14% of the overall flesh is oftendiscarded. as waste. These bodies also resulted in wastedisposal problem. The meat of these bodies are suitable forflavor extraction process. In an earlier work done byEayashi et al �981! on omission aad addition tests ofsensory analysis stated that the characteristic taste ofshellfish is contributed by 44 water soluble extractivecomponents. The major water soluble extractive componentsof shellfish are amino acids, aucleotides, organic bases,sugars, organic acids and minerals Konosu et al, 1978,Eayashi et al. 1978 and. Eayashi, 1979!. The commercialnatural flavorings at present are produced by a traditionalevaporatioa technicpxe which culminated in the developmentof an off-flavored and dark product. To overcome these drawbacks as well as to meet the ever increasing demand fornatural shellfish flavors, a non-thermal process wasdeveloped.. Freeze-thaw concentration and. freezeconcentration processes were compared to determine thepossibility of recovering shellfish notes in thepreconcentrate. Although one is concerned with the retention
240

of all the flavor givt.ng components ia the preconcentrate,in this paper only the important amino acids are~antitatively identified. to evaluate the feasibility of theapproach.
MATERIALS AND METHODS
Lobster bodies ! were collected fromshellfish processing plants and were frozen stored. until areasonable quantitity was reached. A flov diagram of themethod, followed is shovn in Fig. 1. These bodies vere thawed.in water to fascilitate the removal of carapace aad sandysubstances. The carapace removed. body vas vashed in a jetstream of water to discard the unwanted entrails. Thecleaned. bodies were ground, at moderate speed, vithout theperforated. cutting plate. This procedure enables water toget in contact vith increased meat area. The minced. bodiesvere combined with water weighing half the weight of minceand steam � cooked for 20 minutes. This step destroys spoilagecausing eazymes and may also help in reducingmicroorganisms. The cooked. mince vith vater was filteredthrough a cheese cloth and the filtrate vas collected. Thisproduct vas referred to as the first extract. The reteatatecontaining minced meat vas pressed. in a hand press using apressure of 2000 psig to recover the juice from the meat.The juice from this step vas combined with the first extractto obtain final pool of extract. The pooled extract wascentrifuged at 4500 rpm in a refrigerated centriguge for 10miautes. The supernatant vas collected and. f~rther subjectedto freeze-thaw concentration and freeze concentrationprocesses.
% solute X volume of con.% solids recovered -----------------
% solute X feed volumeX 100
241
In the feed vas frozenin different size blocks at varying temperatures. The frozenblocks vere thawed. on the next day at different timeintervals. The partially thawed blocks vere filtered undervacuum pressure. The resulting concentrate vas referred, to asfreeze- thav concentrate. ln t , the feedvas crystallized by dry ice ia isopropanol cooling medium.The slurry was cenrtrifuged and. the concentrate vas separatelycollected, from ice crystals. This vas referred to as freezeconcentrate. The recovery rate for flavor givingconstituents was calculated by using erpxation as follovs:

LOSSTER SOOIES
Carapace L Entrail ~
0,5 x «eter
PARTIAL STEArl COOL
FILTER
EXTRACT I Q5U.-QN ~T
~tteet L Shel!
ACT II
SEDIINNT
SO%NATANT
FREEZE-THAW CONCEN
tTRACTION
CRVSTALLIZE
tCENTRIF USE
FREEZE CONCENTRATE
t%I%RAIC ARATION
Water
CONCENTRATEO %ICE
Fig. 1-Flow chart of flavor recovery process,
242

Chemical analysis
Proximate analysis vas done according to AOAC �975! onraw body flesh, feed stream, freeze concentrate andfreeze-thaw concentrate. Total protein nitrogen content ofthe products vas obtained by Kjeldahl method.. Non-proteinnitrogen content vas also determined by Kjeldahl methodafter precipitating the protein with 10% trichloroaceticacid..
Amino acid analysis
Acid hydrolysed as well as the non � hydrolysed portionsof flesh, feed and concentrates vere analysed for aminoacids by Perkin-Elmer computerized. HPLC unit equipped witha reverse phase cation exchange column.
RESULTS AND DISCUSSION
The proximate analysis results obtained for rav lobsterflesh. feed. stream, freeze concentrate and freeze-thawconcentrate are shown in Table 1.
Table.1-Proximate composition of sample
The total protein. nitrogen content of flesh vas 13.56%.Out of this non-protein nitrogen portion constituted, 5.33% ofthe total protein nitrogen. The fat content of feed andconcentrates vas very much lower than the flesh. This has anadded advantage as it has been reported that the flavorcomponents with fat in aqueous medium undergo hydrolysis
243
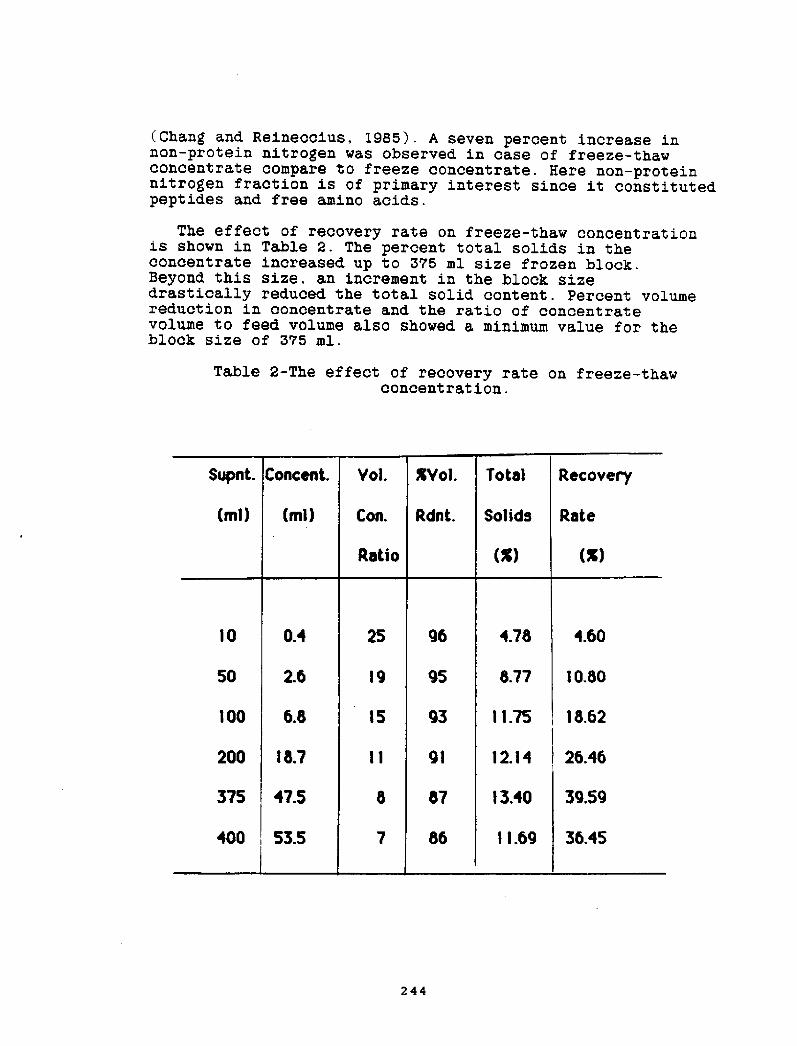
Chang and. Reineccius, l985!. A seven percent iacrease innon-protein nitrogen was observed in case of freeze-thawconcentrate compare to freeze conceatrate. Here non-proteinnitrogen fraction is of primary interest since it constitutedpeptides and free amino acids.
The effect of recovery rate on freeze-thaw concentrationis shown in Table 2. The percent total solids in thecoacentrate increased up to 575 ml size frozen block.Beyond. this size, an increment in the block sizedrastically reduced the total solid content. Percent volumereduction ia concentrate aad the ratio of concentratevolume to feed volume also showed a minimum value for theblock size of 375 ml.
Table 2-The effect of recovery rate on freeze-thawcoacentration.
244
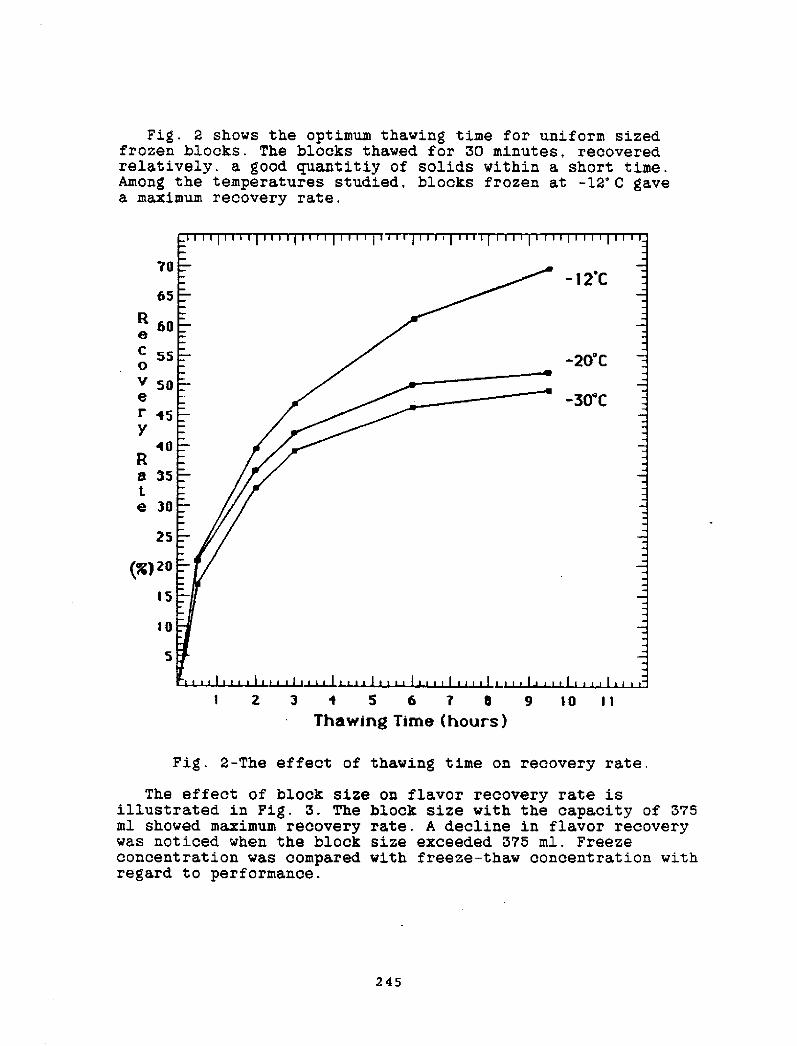
Fig. 2 shows the optimum thawing time for uniform sized.frozen blocks, The blocks thawed. for 30 minutes, recoveredrelatively. a good. quantitiy of solids within a short time.Among the temperatures studied, blocks frozen at -12' C gavea maximum recovery rate.
65
"60e ~ S50
v' 50
e r t5IQ
R 8 3'5e 30
g! 20
15 2 3 f 5 6 7 I 9 10 I 1Thawing Time hours!
Fig. 2-The effect of thawing time on recovery rate.
The effect of block size on flavor recovery rate isillustrated in Fig. 3. The block size with the capacity of 375ml showed maximum recovery rate. A decline in flavor recoverywas noticed, when the block size exceeded. 375 ml. Freeze
concentration was compared with freeze-thaw concentratio~ withregard. to performance.
245

For this purpose, the concentrate from the freezeconcentration was recrystallized five times to reach arecovery rate closer to the value of freeze-thaw concentratedone under optimum conditions. Freeze-thav concentrationshowed. a tvo fold increase in total solid, content vithsubstantially reduced water content.
R 10
e C 30V
30rYn
R20
0 iS
tg! 10
600500200 300 i00
Block Size ml!
Fig. 3-The effect of block size on recovery rate.
The HPLC profile of acid, hydrolysed, lobster body fleshis presented in Fig. 4. The number of major amino acids'quantified vere 18. The most abundant amino acid in lobsterbody muscle vas glutamic acid� followed by aspartic acid�lysine. arginine. leucine, alanine, proline, glysine,isoleucine. valine, phenyl alanine. threonine, tyrosine,serine, methionine and histidine. The least abundant vastaurine. Among these only three amino acids namely,glycine. arginine and glutamic acid are reported to play akey role in producing shell fish-like taste Take et al,1964 and Hayashi et al, 1981!.
The ~antitative data, of these three acid hydrolysedamino acids from the flesh, crude water extract,supernatant and sediment are shown in the form of bardiagram in Fig. 5. The water soluble extract vas observedto recover 20% of glycine, 10% of arginine and 8% of
246

NQ.Time
2000
1800
1 600
. 1<OOCh
1200
~ 1000
800
O eoO
400
200 TA TH G 0 GL VA I L TY LY HIAS SE PR AL ME LE PH AH AR'
Fig. 4-Amino acids of acid hydrolysed lobst;er body muscle.
247

glutamic acid from the lobster body meat. A 10% decreasein the levels of all three amino acids was noticed. in thefeed vhen it vas compared vith extrat. The sedimentcollected from the centrifugation step, as such contains aslightly reduced quantities of amino acids to that offlesh. 20
1 800
1600
r +00
S 1200
800
600
oo
H QX7JRACT SUJET'. SKD.300
250
g 200 t'6
gI 1@Or
100 I
8 50
Fi~ phraser SUP.
Fig. 5-The important flavor giving amino acids of samplesanalysed.
248

The bar diagram of fig. 5 also, illustrates the amountof hydrolysed amino acids obtained from non-proteinnitrogen fractions of flesh, extract, feed. and sediment.Glycine vas the predominant amino acid of the threequantified. Camien et al �951! analysed. aon-proteinnitrogen fraction of lobster muscle and reported thatglycine vas the most abundant amino acid. Reduced levels ofarginine and, glutamic acid vere noticed. This could, meanthat these amino acids were present in the form of proteinnitrogen and glycine in free and short peptide chaias.
The performance of freeze conceatration and freeze-thawconcentration in terms of retaining amino acids are shova in
in fig. 6. ! 000900
800
YL100
'5 coo
400
500
200
1oo
FR COH j.R-TH C. FR. CO@ if'-TH. C.
Fig. 6- Comparison of freeze-thaw concentration and. freezeconcentration processes.
Freeze-thav concentration was observed to concentrate 10times of that of freeze concentration method. The bar chart ofhydrolysed fraction of concentrates shows a 15 fold. increasein glutamic acid.
CONCLUSIONS
Among the three main processes currently used, namely �!
249
freeze concentration, where vater is separated in ice form�! membrane separation, where water is removed in li~idstate as water and. �! evaporation with water removal in thegaseous state as vapour, the former two are suitable forshellfish flavor extraction process. The freeze-thawconcentration process vhich vas developed in thi.s studyrecovered. fairly highly levels of flavor giving constituentscompare to freeze concentration. The freeze-thawconcentration method, is diferent from the continuous freezeconcentration technique with regard to ice crystallizationand solid phase separation process. In the former techniquethe solid phase transfer is accomplished by slow melting ofa large ice block, vhereas the latter one is performed, byconti.nuous formation of small ice crystals from the waterphase. A prelimiary study conducted with plate and. framereverse osmosis membrane separation unit vhich is of thetype used by Ohya et al �981!, indicated that a relativelygood quantity of water could. be separated Jayarajah andLee, 1986!. Considering the fact that the demand. forsurimi-based products vill increase in the years to come, anincreased requirement for a good natural flavoring agent isantici.pitated,.
REFERENCES
AOAC. 1975. Official Methods of analysis, 12th ed.. Assoc.Off. Anal. Chem, Washi.ngton, D. C.
Camien, M, N., Sarlet, H., Duchateau, D and Florkin, M. 1951Non-protein amino acids in muscle and blood, of marine andfresh water crustacea. J. Biol. Chem. 193: 881-885.
Chang, Y, T., and Reineccius, G, A. 1985. Isolation of flavorcomponents in model systems by counter current continuousdialysis. J. Agric. Food Chem. 33: 1168-1173.
Hayashi, T.. Yamaguchi, K., and Konosu, S. 1978. Studies onflavor components in boiled crabs-II. Bull. Japan Soc. Sci.Pish. 44�2!: 1357 � 1362.
Hayashi, T.,Asakawa, A. and. Konosu, S. 1979. Studies on flavorcomponents in boiled crabs-III. Bull. Japan Soc. Sci. Fish45�.0!' -1325-1329.
Hayashi, T., Yamaguchi, K., and Konosu, s. 1981. Sensoryanalysis of taste active compounds in the extract of boiledsnow crab meat. J. Food Sci., 46: 479-493.
Hood, L. F., Eall, R. R., and Convay, R. L. 1976. Conversionof minced. clam vash water into clam juice: Waste handling orproduct development? Food Prod. Dev. 10- 86-88
Jayara!ah, C. N. , and Lee, C. M. 1986. Concentration of
250

flavor components from lobster extract by a plate and. framereverse osmosis unit unpublished. data!.
Konosu, S., Yamaguchi, K., and Hayashi, T. 1978. Studies onflavor componets in boiled crabs-I. Bull. Japan Soc. Sci.Fish. 44�!- 505-510.
Lippincott, R. K., and, Lee, C. M. 1984. Mechanical extractionof meat from lobster and crab bodies. Aust. Fish 3: 51-52.
Ohya, H,. Negishi, Y., Kamato, K, Matsui, K and Inove, H.1981. Prediction method for the life of reverse osmosismembranes. vol I Turbak, K. K. ed.! ACS Symp. Ser. 153.-113 � 130.
Take. T.. Honda, R., and Otsuka, H. 1964. Studies on the tastysubstances of various foods part 2!. J. Japan Soc. FoodNutr. 17- 268-274.
Authars would. like to thank the National FisheriesInstitute NFI! for providing a scholarship fund to supportthis study.
251

CHARACTERIZATION OF MINCED HEAT RECOVERED
FROM BLUE CRAB BY-PRODUCTS
Keith W. Gates, Jackie G. EuDaly, Amanda H. Parkerand Carole A. Greene
The University of GeorgiaMarine Extension Service
P. 0. Box Z
Brunswick, GA 31523
INTRODUCTION
Recovering and marketing products of higher value fromfishery wastes can reduce rising disposal costs while increasingprofits and employment for the nation's seafood industry. Theblue crab industry which yearly generates approximately 180million pounds of crab by-products has been particularlyvulnerable to waste disposal problems Murray and DuPaul, 1981!.Steam-processed blue crabs yield approximately 104 picked meat, byweight. Remaining by-products are discarded or further processedas crab meal which sells for $100 to $150 per ton Murray andDuPaul, 1981!. Mechanical extraction of minced meat from crabpicking by-products could recover an additional 15 to 204 ediblemeat. Nationally, annual recovery of minced crab meat couldapproach 30 million pounds Thompson, 1985!. Minced meatcurrently sells for $0.70 to $1.00 per pound and is used as anextender in deviled crab, seafood stuffings, soups, and chowders.
Grey-to-brown appearance and high microbial levels limitmarketability. Minced meat produced in Georgia is packed in ring-sealed, five-pound plastic tubes and pasteurized in hot water,which further darkens the product. High tube-failure rates haveforced processors to freeze meat for wholesale distribution.Processors market meat with poor knowledge of nutritional,sensory, and storage qualities. Improved quality would increasemarket demand, and new products could expand sales throughproduction of white and claw meat analogs.
The following describes pre'Iiminary findings of a Sea Grantresearch project to improve quality and appearance of minced bluecrab meat. Yields, chemical, sensory, microbiological, and nutri-tional qualities were determined for meats extracted from picking-room by-products. In-plant methods to reduce microbial loads wereinvestigated. Low-temperature pasteurization and chemicaladditives were evaluated for potential reduction of heat-relateddarkening or "blueing." Chemical, sensory, microbiological, andnutritional changes in mixed minced meat and minced claw meat weremonitored monthly during frozen storage at less than -4'F -20'C! ~
METHODS
Hinced meat was extracted from picking-room by-products ofmechanically-backed C. and K. Lord Backing Machine, Cambridge,MD!, hand-picked, steam-retorted blue crabs using a Baader 694
252

deboning machine. Drum perforations were 1.3 nm. Two cooperatingblue crab processors provided plant time and equipment for theproject.
Picking-room by-products were separated into four componentsto evaluate extracted meat types and yields for the followinga
1. Mixed minced meat � recovered from all picking-room by-products except claws
2. Minced white meat � recovered from "slabs" removed by thepickers first dorsal cut, containing only white bodymeat
3. Minced leg meat � recovered from separated legs and swiraninglegs
4. Minced claw meat � recovered from separated claws
Chemical and nutritional parameters determined in duplicatefor minced meat samples includeds percent moisture, percentKjeldahl protein, percent ash, and percent fat Williams, 1984!.Microbiological quality was assessed through duplicate standardplate counts, MPN total coliforms, MPN K. coli, and MPN coagulasepositive staphylococci analyses Food and Drug Administration,1978' Speck, 1984!. An ACS Spectro Sensor was used to read mincedmeat Hunter L, a, b color values Hunter and Harold, 1987!.
A trained fiv~nember sensory panel determined appearance,flavor, odor, and textural characteristics of extracted mincedmeat Cardello, 1981I Civille and Szczesniak, 1973I Civille andLiska. 1975> Gates et alee 1984ag Jellinek, 1985!. Sensoryprofiles were developed for unpasteurized and pasteurized mincedmeat samples:
i. ~glue in c ba abviaus biueing is g. 1004 blueing is 6.
2. Wet-to-dr a earance~ 0 is dry, 6 is free 1 iquid drainingfrom sample.
3. Amnonia odors 0 is none detectable, while 6 is the odor offree amnonia that would strongly irritate the nose and eyes.
4. Cooked-crab adora 0 is none detectable, 6 is an overwhelmingcrab aroma reminiscent of the odors evolved from steamingcrabs.
5. Putrid< 0 is none detectable, 6 is the odor associated withrotten meat.
6- Fish or TMA odors 0 is none detectable, while 6 indicatesthe "fish" odor associated with old fish that are getting"off" and are barely edible.
253

Cereal odori 0 is none detectable, while 6 indicates astrong cereal-bread-yeasty aroma.
7 ~
Moistnessc The perceived degree of oil and/or water in thesmnple during chewing. 0 is a very dry sample, 6 indicatesfree liquid readily oozing from the sample.
Fibrousnesse The perceived degree number x size! of fibersevident during mastication. 0 is no fibers evident, 6indicates many large fibers.
2 e
Adhesivenesss The force required to remove mater ial thatadheres to the mouth during the normal eating process.
3 ~
0 ~ no adhesion
3 ~ cream cheese6 ~ peanut butter
4. Ghewinessa The length of time required to masticate a sampleat constant rate of force to reduce it to a consistencysuitable for swallowing.
0 Rye bread2 Jujubes4 Black cow candy6 Tootsie rolls
Particle sizes Average size of particles detected duringmastication.
0 smooth
chalky2 ~ gritty3 ~ grainy4 ~ coarse6 ~ chunky
6. Cookedmrab tastes Relative strength of crab taste.0 ~ none detected, 6 ~ overwhelming crab taste.
~Astrin entp 0 none detected. 6 the feeling of pure alum.7.
8. Sournessa Relative strength of acidic components, 0 ~ nonedetected, 6 pure lemon juice or vinegar.
~Rancldit 6 The after taste associated with country ham. 0none detected, 6 ~ objectionable rancidity old country ham!.
9.
Freezerburnc The taste associated with a stale refrigeratoror freezer that has been used to store food. 0 ~ none
detected, 6 ~ overwhelming taste.
10.
254
Taste and textural profiles were evaluated for pasteurizedminced crab meats

11. Old-seafood flavort The aromatics associated with cooked
seafood that is getting "off" but still acceptable. 0none detected, 6 overhweiming taste of seafood that hasdeveloped strong off flavors and is barely edible.
Bacterial levels in mixed picking-room by-products wereevaluated during four hours of iced- or room-temperature storageto determine the most effective holding condition and maximumacceptable storage period before extraction.
Effects of low-temperature pasteurization, 177'F 80.5 C!,and blueing inhibitors on minced meat color were determined formixed minced and minced white meat samples pasteurized in eight-ounce aluminum cans. The following buffer deveioped by theNational Marine Fisheries Service was used in the additive portionof the study Waters, 1971!.
Na MPOH3lfiH!I!NaC
20.79 g16.64 g21.99 g
Sodium phosphate, citric acid, and sodium chloride were diluted toone liter with deionized water to complete the buffer. Five low-temperature pasteurization treatments of minced white meat andmixed minced meat were evaluated at 177 F 80.5'C!I
1. 8 ounces �26.8g! of minced meat
2. 8 ounces �26.8g! of minced meat plus 64 ml buffer
3. 8 ounces �26.8g! of minced meat plus 64 ml buffer wellmixed
4 ~ 8 ounces �26.8g! of minced meat plus 91 ml buffer
5. 8 ounces �26.8g! of minced meat plus 91 ml buffer wellmixed
Bufferiwas either poured into a can of meat without mixing orthoroughly stirred into the meat prior to sealing. Meat waspasteurized for three hours at 177'F 80.$'cj to Ftii 37 i5Cool ing was 1.5 hours in an ice slurry at 37.44F �'C!. Threecans of meat were composited for duplicate chemical,microbiologica'I, color, and sensory analyses.
255
Pasteurization times, temperatures, and F-values weredetermined f' or meat packed in five-pound plastic tubes using aDigitec temperature recorder linked with an IBM-XT Gates et alee1984b !. Initial pasteurization temperatures were reduced to 1E2'F 83.3 C!. because processors noted excessive blueing of meatpasteurized at 186'F 85.5'C!. Product color was evaluated by thesensory panel and by Hunter L, a, b color values Boon, 1975IStrasser et alas 1971' Waters, '1971!.

Mixed minced meat and minced claw meat used for the frozen-storage study were packaged in 5 mil, low-density, polyethylenetubes containing approximately one pound of meat. Tubes weresealed at each end with steel rings, pasteurized in a hot waterbath at 182'F 83.3'C! for 180 minug~s, and cooled in an iceslurry for 90 minutes. The mean F $5 value was 44. Meat wasblast-frozen at -11.2'F -24'C!. !amples were held in a walk-infreezer at less than 4 F -20'C!. Chemical, sensory,microbiological, and nutritional changes were monitored monthlyfor nine months to date. Three tubes of meat were composited forduplicate analyses'
Chemical, sensory, microbiological, color, and nutritionaldifferences in minced meat smnples were statistically comparedusing Personal Computer SAS Joyner, 1985' Sasser, 1985!.Differences among means were determined using the GLM procedureand Duncan's multiple-range test Joyner, 1985!. In the remainderof' the paper, "significant" refers to statistically significantdifferences among means at the 0.05 level.
RESULTS AND DISCUSSION
Minced meat yields based on uncooked green crabs were'
3.18413.89410. 714
2.6A6. 394
minced white meatmixed minced meatmixed minced meat less "slabs"minced leg meatminced claw meat
76.63459.45440.44438.Opt
minced white meat
mixed minced meatminced leg meatminced claw meat
Mean proximate analyses of the four meat types are presentedin Table 1. Minced leg meat had signif icantly higher moisturelevels than minced white or claw meat. Moisture contents ofminced leg and mixed minced meat were significantly greater thanminced claw meat. Minced white meat moisture content wassignificantly less than that of minced leg meat. Minced leg meathad significantly lower ash content than other meat samples.Minced claw protein levels were significantly greater than mixedminced meat. Fat levels were low for all minced meats, but clawmeat had significantly less fat than leg meat which hadsignificantly lower fat levels than white or mixed minced meat.Mixed minced meat had significantly greater moisture-free ashcontent than other meats. Leg meat had significantly greatermoisture-free protein levels than mixed or white minced meat.
256
Total recoverable minced meat was approximately 224 of an uncookedcrab's weight. Yields based on by-product type as the startingpoint were<

Table 1. Mean Proximate Analyses with Duncan's Analyses ofDifferences Among Means for Minced Crab Meat*
ANALYSESANALYSES
Moisture Heat AshMeat
Protein MeatHeat Fat
Meat Hoistur~ree Ash Heat Moisture-Free Protein
+Means with the same letter are not significantly different at the0.0 level
Tab le 2 presents mean Hunter color L, a, b results for thefour meat types. Mean L values are significantly different fora» minced meats. Order of decreasing whiteness is< white,mixed, claw, and leg. Mean Hunter a values show mixed minced tobe significantly more red than other meats. Blue components bvalues! of mixed and ~hite minced meat are significantly greaterthan blue components of claw and leg meat.
Table 2. Mean Hunter Go'lor L, a, b Values with Duncans Analysesof Differences Among Means for Minced Grab Meat*
NEAT L MEAT a MEAT b
* Means with the same letter are not significantly different atthe 0.0 level
Mean sensory appearance and odor ratings for minced meatsamples are reported in Table 3. Leg meat appeared to be signifi-cantly more wet than white meat. Leg meat had significantly
257
LegHi xed
White
Claw
G'law
White
LegMixed
Mixed
White
LegC 1 aw
White
Hixed
G law
Leg
81.54A81.02AB78 F 29 BC77.99 G
18.54A16.79AB16.75AB14.91 B
».48A9. 40B8 ' 53B8.36B
61. 43A54.96B46.25G41.21D
Mixed
LegG 1 aw
White
Mixed
White
Claw
Leg
WhiteNi xed
LegG law
LegClawNixed
White
4.88A3.11B2.87B2.49B
2 ' 39A2.04AB1.85AB1.57 BC
1. 73A1. 12A
0. 29B0. 13C
90. 71 A84 ' 23AB79.31 B77 ' 42 B
Mixed
White
C 1 aw
Leg
13-06A12.34A
5 ' 25B4.70B

stronger ammnia odors than white meat. No significant differ-ences were determined for cooked crab or putrid odors. Leg meathad significantly greater TMA odor ratings than other minced meat.White meat cereal odor was significantly less intense than othermeats.
Table 3. Mean Hedonic Appearance and Odor Ratings with Duncan'sAnalyses of Differences Among Means for Minced CrabMeat*
HEDONIC RATINGHiEDONIC RATING
Aslnonla OdorMeat Wet-Or A earance Meat
Cooked-Crab Odor Putr>d OdorMeat
TMA Odor Cereal OdorMeatMeat
*Means with the same letter are not significantly different at the0.0 level
Textural prof iles of minced meat determined by the sensorypanel are presented in Table 4. Claw and leg meat weresignificantly more moist than white meat. Claw meat was rated assignificantly more fibrous than mixed minced meat. No significantdifferences were determined for adhesiveness or chewiness. Whiteand claw minces had significantly larger particle sizes than mixedminced meat.
Mean hedonic flavor prof iles for the four minced meats areshown in Table 5. Mixed mince meat had a significantly greaterastringent feeling than other meat. Claw meat rated significantlyhigher old-seafood flavors than other minces. No significantdifferences were determined among minced meats for sour, rancid,or freezer-burn flavors.
258
LegC law
Mixed
White
C I aw
LegWhite
Mixed
LegC I aw
Mixed
White
4.07A3.57AB3.00 82.50 C
3 ' 29A2 ' 64A2.57A2.57A
1. 43A0 ' 5780.3680. 148
LegMixed
C 1 awWhite
LegClaw
Mixed
White
Claw
Mixed
LegWhite
1.93A1 ~ 14AB
1.07AB0.43 8
0. 29A0. 14A
0. 14AO.OOA
3 ~ 57A3.43A3.14A1.938

Table 4. Mean Hedonic Textural Ratings for Pasteurized MincedMeat with Duncans Analyses of Differences Among Means*
HEDONiC RATING HEDONIC RATINGHEDONIC RATING
Neat Ho stness Heat Fibrousness Neat Adhesiveness
article
SizeNeat Chewiness Meat
* Means with the same letter are not significantly different atthe 0.0 level
Table 5. Mean Hedonic Flavor Ratings for Pasteurized Minced Meatwith Duncan's Analyses of Differences Among Means+
HEDONIC RATING
Heat Cooked-Grab TasteHEDONIC RATING
Meat Astrin ent Taste
Meat Rancid TasteSour TasteMea't
Neat Freezer-Burn Taste Meat Old-Seafood Taste
o.67a0.50AB0. 'I 7AB0 F 00 B
*Means with the same letter are not significantly different atthe 0.05 level
Mi~ced me!t exhibited excessive microbial levels, rangingfrom 10 to 10 organisms per gram Figure 1!.
259
C 1 aw
LegMixed
White
White
C 1 aw
LegMixed
LegMixed
White
C I aw
M I xed
LegC 1 aw
White
C 1 aw
LegMixed
White
3.58a3.33A3.o8aBF 25 B
1 ~ 92A1. 33A1. OOA
o.83a
3. 33A2.92A2.58a2.42a
O. 17A0 ~ OOA
O.OOAO.OOA
O.OOAO.OOA
O.OOA
O.OOA
Claw
White
LegMixed
3.00A2.67AB1. 92AB1 ~ 75 B
Mixed
LegClaw
White
ClawNixed
LegWhite
C 1 awHixed
LegWhite
LegC 1 aw
White
Mixed
White
C 1 aw
LegHixed
2 ' 33A1. 08B1.O8B0.92B
0. 50A0. 17A0. OOA
O.OOA
2.o8a2.00a
1. 75a1. 58A
2.58a2.50A1. 58AB0.83 B

PASTEURITZD AD UNPASTBURlZED lGNCED CRkB REST
AER08IC PLATE COUNTS
'IO UW'AVERRED PA5lflgI2EDThfAneNT OF WCKD I%AT
~ cuw ~ exm K2I Lse RZI mlm
Figure 1. Mean minced meat aerobic plate counts before and afterpasteurization
Pasteurization at 182'F 83.3'C! F185 44! reduced platecounts to less than 3,000 organisms per gram Figure 1! ~ No totalcoliform, E. coli, or coagulase positive staphylococci weredetected in pasteurized meats. Hourly clean-up and sanitation ofthe Saader machine improved product qualityT however, by-productmicrobial levels increased rapidly when held in the picking roomat room temperature. Extraction within 1.5 hours of pickingsho~ed little increase in the microbial population of mixed by-products. Delayed extraction beyond 1.5 hours required icing ofpicking-room by-products within plastic bags at a ratio of 2> 1ice-to-product to control microbial growth Figure 2!. Sy-producttemperature dropped below 40'F �.4'G! within 70 minutes of icing Figure 3!.
Pasteurization at 182'F 83.3'C! effectively reducedmicrobial levels for all minced meats Figure 1!T however, meatsdarkened following pasteurization. Hunter color L, a, b valuesbefore and after pasteurization are presented in Figures 4, 5, and6, respectively. Hunter L or whiteness decreased f' or allpasteurized meats Figure 4!.
Hunter a or redness decreased for all pasteurized samples Figure 5! ~ Hunter b values decreased for all pasteurizedsamples, indicating increased levels of blueing Figure 6!.
260

CRILB PICKNG BYPRODUCT lQCROBQL LIPID
ROOM TEMPERATURE VS ICED STORAGE
IE+07
I K+00
IE+OS 0 I 2 4TIME SI HOURS
~ PLATE COUNTS ROOM TEMPER'ATURK! + KNIKROCOCL2 MOM TEA%%TURK!o PLATE COUNTS ICEO! ~ KNTBLOCOCL2 CKO!
Figure 2. Mean microbial levels of mixed picking-room by-productsheld on ice and at room temperature
PiCKiNG BYPRODUCT TNCPERAVURE PROPKR
HEU! ON ICE AND AT ROOM TEMPERATURE
120 100 200 2'
1IME H MIIAIIESROOM TEMPERATURE � RN ~TURK � ICKO SYPROOUCTICEO SYPROOUCT � SYPRLNUCT AT ROOM TEMP. - - SYPROOUCT AT ROOM TEMP.
Figure 3. Temperatures of mixed picking-room by-products held onice and at room temperature for four hours
261

lBBITBR L COLOR DATA FOR MlNCBD KELT
SLACK~0, CREY~SO, WHITE~100
10
Figure 4. Mean Hunter L color values for leg, claw, mixed, andwhite minced meat before and after pasteurization at182'F 83.3 C!
HUM.'BR a COLOR DATA FOR LGNCBD REJLT
ORKEEP � ~ REO ~ +
Figure 5. Mean Hunter a color values for leg, claw, mixed, and~hite minced meat before and after pasteurization at182'F 83.3'C!
262

HUNTER b COLOR 9k' FOR MINCED i%ATSLUK ~ �, YELLOW ~ +
12
10
Figure 6. Mean Hunter b color values for leg, claw, mixed, andwhite minced meat before and after pasteurization at182 F 83.3'C!
Hunter color L, a, b values for minced white meat and mixedminced meat pasteurized at 177'F 80.5'C! and 182 F 83.3'C! arepresented in Figures 7 and 8. respectively. Minced white meatpasteurized at 177 F 80.5'C! was significantly more white andless blue than meat pasteurized at 182'F 83.3 C! as indicated byHunter L and b values, respectively Figure 7!. White minced meatblended with 64 ml of buffer was significantly whiter thanuntreated ~hite minced meat when both were pasteurized at 177'F 80.5'C!. Unpasteurized white minced meat was more red or hadgreater a values than all pasteurized white meat. All treatedwhite minced meat except for the unblended sample containing 64 mlof buffer exhibited less blueing or higher b values than untreatedmeat pasteurized at 177'F 80.5'C!. There was no significantdifference between unpasteurized white minced meat and meattreated with 91 ml of phosphate buffer.
Mixed minced meat pasteurized at 177 F 80.5'C! wassignificantly whiter as indicated by greater Hunter L values thanmeat cooked at l82'F 83.3'C! Figure 8!. Hunter b values showedsignificantly more blueing at 182'F 83.3'C! than at 177 F 80.5 C!. Mixed minced meat treated with buffer and pasteurizedat 177'F 80.5'C! was significantly whiter than untreated meatpasteurized at the same temperature. Mixed minced meat treatedwith phosphate buffer was significantly more red thanunpasteurized mixed minced meat.
263

lGNCED %HITE LOW TEMPERATURE/kDDlTÃR PkSTSUEKATIONMEAN HUNTER COLOR
10
MfXED ~ P$1 P$1$ P$E PSEM
IEXED ISCE0 1K' 1$EATQENI$ggi L-1$E ~ e-1$E ~ b-1$2~ 1.-177 ~ e-177 ~ b-177
Mean Hunter L, a, b color values of mixed minced meatpasteurized at 182'F 83.3 G! and 177'F 80.5'C!,including added buffers at 177 F 80.5'G!i mixed ~unpasteurized, P~ixed pasteurized, PB1 64 mlphosphate buffer, PB1M 64 ml buffer mixed, PB2 ~91 ml phosphate buffer, PB2M ~ 91 ml phosphate buffermixed
Figure 8.
264
P$1 P$1M P$2 P$EM
MPIEQ wHIK ICAT 1$EAllaNT5
PP L I77 Q 177 8 b-177Figure 7. Mean hunter L, a, b color values of minced white meat
pasteurized at 182'F 83.3'C! and 177'F 80.5'C!,including added buffers at 177'F 80.5'C!i white ~unpasteurized, Pwhite ~ pasteurizedi PB1 ~ 64 ml phos-phate buffer, PBlM ~ 64 ml buffer mixed, P82 91 mlphosphate buffer, P82M ~ 91 ml phosphate buffer mixed
MKBD lQNCED L0% TJQQ'BRKTURE/ADD1TDtE Pk.'3TlHHKhlTLONQEAN HUNTER COLOR

Pasteurized minced meat was separated into three significantlydifferent leve'Is of increasing blueing by Hunter b valuess �!meat blended with phosphate buffer, �! meat treated withphosphate buffer without blending, and �! untreated meat.Pasteurization at 177'F 80.5'G! effectively reduced bacterialpopulations. Total aerobic plate counts for pasteurized mixedminced and minced claw meat ranged from none detected to 160organisms per gram. No total coliform, E. col i, or coagulasepositive staphylococci were detected.
Mixed minced and minced claw meat stored at less than W'F -20'C! exhibited no significant differences in the followingparameters during nine months of frozen storageI �! proximatecomposition, �! blueing, �! wet-to-dry appearance, �! aIIsIIoniaodor, �! cooked-crab odor, �! TMA odor, �! cereal odor, 8!perceived moistness, 9! f ibrousness, 10 ! adhesiveness, 11!chewiness, �2! particle size, �3! cooked-crab taste, �4!astringent taste, or �$! sourness.
The sensory panel rated minced claw meat significantly moreputrid in the ninth month of frozen storage than meat evaluated inmonths zero through seven Figure 9!. Claw rancidity wassignificantly greater in month nine than all other samples Figure9!. Figure 10 shows minced claw freezer-burn levels to besignificantly greater in month nine than levels found in monthsone through three. Old-seafood flavors were significantly greaterin month nine than all other sampled months. Mixed minced meatrancid levels were significantly greater at months six and nine offrozen storage. Old-seafood flavor levels peaked for mixed mincedmeat during month nine of the frozen-storage study.
lQNCRO CIA AND lGXED RBfCRD FROZEN STORAGB
S V SS 4 $0
~ CUN, WTW! OÃR + INCI, FIII MOPo CUW, INCSI FURR t Imggl, S1NCO FUN%
Mean minced claw and mixed minced meat hedonic odor
and flavor ratings that were significantly differentduring nine months of frozen storage
F igure 9.
265

HINCRD CLAW AND KXBD MlNCRD FROZBN STOMGB
HEDONC FIANT
0 0 I 2 0 4 4 4 7 4 4
~ CLJN, FSEEZK~mI FUMC8 + ISNCED. FCEZ6I-eLSSI FLAVOR04W. QD-SEAFDM FUN% 4 ISNCED, OLD-SfAFOOD FLIC%
Figure 10. Mean minced claw and mixed minced meat hedonic flavorratings that were significantly different during ninemonths of frozen storage
l6NCBD CLkW kgb MiXRD lGNCRD PROZRN STOMGB
~ ~ cmoa TSLTss
~ V ~~ L 0 4
~ ~Ta a Rdml
x ~T+ D immI s Immi
Mean Hunter L, a, b values determined for minced clawand mixed minced meat during nine months of frozenstorage
Figure 11.
266
Both claw and mixed minced meat darkened with time asindicated by decreasing Hunter L values Figure 11!. Significantnegative regressions were determing between time and Hunter Lvalues. Claw and minced meat had r values of 0.41 and 0.48,respectively.

CONCLUSIOHS
Blue crab picking-room by-products were separated into fourcomponents prior to extraction with a Baader 694 machine. By-product types weres �! "slabs," the portion of hand-picking by-product containing only white body meatI �! mixed by-product thatincludes all picking-roam by-products but clawsi �! separatedlegs< and �! separated claws. Minced meat yields based on theweight of an uncooked green crab were8 white meat, 3m 18%I mixedminced meat. 13.894 10.714 if slabs are separated!I minced leg,2.62CI and minced claw, 6.394. Total recoverable minced meat isapproximately 224 of an uncooked crab's weight. Yields based onby-product type as the starting point were8 76.63, 59.45, 40.44,and 38.074 for "slab," mixed, leg, and claw by-products,respectively.
Four meats with distinct chemical compositions, colors,flavors, and textures were extracted. Leg and mixed minced meathad the highest moisture contents. Ash contents were low, rangingfrom 1.574 for leg meat to 2m 144 for mixed minced meat, indicatinglittle shell contamination. Fat content was low, ranging fromOa 124 to 1.734. Mixed minced and white meat had significantlyhigher fat contents than minced leg or minced claw meat. Mincedclaw had the highest protein content, 18.544. "Slabs" produced adry, white, textured mincey mixed by-product produced a moist,golden-brown minceI legs produced a smooth, flavorful, dark-brownmeaty and claws produced a highly-textured, less-flavored, chewy,brown mince.
MI!ced me~t exhibited excessive microbial levels, rangingfrom 10 to 10 organisms per gram. Hourly clean-up andsanitation of the Baader machine improved product quality>however, by-product microbial levels increased rapidly when heldin the picking room at room temperature. Extraction of by-products within 1.5 hours of picking showed little increase in themicrobial populations of mixed by-products. Delayed extractionbeyond 1.5 hours required icing of picking-room by-products withinplastic bags at a ratio of 28 1 ice-to-product to control microbialgrowth. Iced by-product temperature dropped below 40'F �.4'C!within 70 minutes.
Reduced pasteurization temperatures signif icantly improvedthe appearance of minced meat and effectively reduced microbialpopulations. Initial reduction of pasteurj~ation temperaturesfrom 186'F 85.5'C! to 182'F 83.3'C! F ldI5 44! improved theappearance of pasteurized meats. However, all minced meats stilldarkened following pasteurization at 182'F 83.3 C! as indicatedby Hunter L values. Pasteurization of minced slab meat and mixedm ncad meat at 177 F 80.$'c F Ig 383 significantlyimproved appearance of pasteurizd meats. Both minces weresignificantly more white and less blue than meat pasteurized at1824F 83.3'C! ~ The addition of citric-acid-phosphate buffer tominced slab and mixed minced meat pasteurized at 177'F 80.5 C!produced pasteurized product that was significantly whiter and
267

less blue than nonWuffered meat cooked at 177'F 80.5'C!.Buffered meats were not significantly darker or more blue thanunpasteurized minced slab or mixed minced meat as indicated byHunter L, a, b color values.
I.ocal processors adopted a five-pound, ring-sealed, low-density, polyethylene plastic tube for pasteurized minced meats.Bag failure rates approaching 504 during shipping and handlingrequired processors to blast-freeze pasteurized products. Monthlychemical, microbiological, and sensory monitoring of frozen mincedclaw and mixed minced meat showed initial sensory deterioration inboth meats at nine months of a continuing frozen-storage study.
LITERATURE CITED
Boon, D. D. 1975 ' Discoloration in processed crab meat. A.Review. J. of Food Sci. 40a756-761-
Cardello, A. 1981. Psychophysical basis for the classificationof fish by flavor, texture, and appearance. Gordon ResearchConference on the Chemical Senses, Andover, NH.
Civille, G ~ V. and Szczesniak, A. S. 1973. Guidelines totraining a textural profile panel. J. of Textural Studies.4I204-223.
Civille, G. V. and Liska, I. H. 1975. Modifications andapplications to foods for the General Foods sensory textureprofile technique. J. of Textural Studies. 6> 19-31.
Food and Drug Administration. '1978. Bacteriological AnalyticalManual. pp. IV-1 t IV-10, V-1 to V-6, XI-1 to XI-7.Association of Official Analytical Chemists, Washington, DC.
Gates, K. W., EuDaly, J. G., Parker, A. H., and Pittman, L. A.1984a. Nutritional and quality changes in frozen breadedshrimp within the wholesale-retail marketing chain. GeorgiaMarine Science Center Technical Report Series No. 84-2.
Gates, K. W., EuDaly, J. G., Parker, A. H., and Pittman, L. A.1984b. Microcomputers improve quality and safety for bluecrab heat processing. Georgia Marine Science CenterTechnical Report Set les No. 84-3.
Hunter, R. S. and Harold R. W. 1987. The Measurement ofAppearance. John Wiley and Sons, New York, NY.
Jellinek, G. 1985. Sensory Evaluation of Food, Theory andPractice. Ellis Horwood, Chinchester, England.
Joyner, ST P. 1985 ' SAS/STAT Guide for Personal Computers. SASInstitute, Inc., Cary, NC.
268

Hurray, T. J. and DuPaui, W. D. 1981. Feasibil ity of crab mealprocessing in the Chesapeake Bay region. Special Report inApplied Marine Science and Ocean Engineering No. 248, July'I 981 ~ V ir g in i a Inst i tute of Mar ine Sc i ence, G 1ouces ter, VA.
Sasser. M. 1985. SAS Procedures Guide for Personal ComputersVersion 6. SAS Institute, Cary, NC.
Speck, H. LE '1984. Compendium of Methods for the MicrobiologicalExamination of Foods. American Public Health Association,Washington, OC.
Strasser, J. H., Lennon, J. S., and King, F. J. 1971. Blue CrabMeat II. Effect of chemical treatments on acceptability.Specia'I Scientific Report � Fisheries, No. 630 ' U. S. Dept.of Conenerce, Washington, DC.
Thompson, B. G. 1985. Fisheries of the United States. 1984.Current Fisheries Statistics No. 8360. U. S. Dept. ofComnerce, Washington, DC.
Waters, M. E. '1971. Blueing of Processed Crab Meat. I. Astudy of processing procedures that may cause blue dis-coloration in pasteurized crab meat. II. Identificationof some factors involved in the blue discoloration of
canned crab meat Callinectes sa Idus!. SpecialScientific Report - Fisheries, No. 33. U. S. Dept. ofConiserce, Washington, OC.
Williams, S. 1984. Official Methods of Analysis of theAssociat Ion of Official Analytical Chemists, FourteenthEdition. Association of Official Analytical Chemists,Arlington, VA.
ACKNOWLEDGEHENTS
The authors greatfully acknowledge Lewis Crab Factory, Inc.and Sea Garden Seafoods, Inc. for supporting the project,providing deboning machinery, pasteurization baths, and neededplant time. We wish to thank the O' Brien Corporation for use oftheir ACS Spectro Sensor.
The technical assistance of the following individuals wasgreatly appreclateds Andy Amason, Jack Amason, David Lewis, andLura Relihan.
This work is the result of research sponsored by NOAA Officeof Sea Grant, Department of Comnerce, and the University ofGeorgia under Federal Grant gNA84AA-D-00072, Project gR/SS-10.The U. S. Government is authorized to produce and distributereprints for governmental purposes notwithstanding any copyrightnotation that may appear hereon.
269

The Menhaden Surfmi Demonstration Plant-A Progress Report
Malcolm B. HaleNational Marine F i sheri es Servi ce
Charleston, SC 29412
Anthony P. BimboZapata Haynie Corporation
Reedville, YA 22539
INTRODUCTION
Menhaden landings comprised approximately 40% of the total volumeof U.S. commercial ff sheries landings in 1986, but accounted for lessthan 3.5% of the ex-vessel value NMFS, 1987!. With the exception of asmall fraction used for bait, the menhaden harvest is used only for theproduction of fish meal and oil. Continuing economic pressure bycheaper vegetable-based products has encouraged increased efforts todevelop higher valued products for direct human food use of menhaden Hale and Ernst, 1986!. Both Lanier et al. �983! and Regier et al. 1985! have reported on laboratory and small pilot scale investigationsof surimi production from menhaden. With a rapid growth in demand andimports, surimi was targeted as a potential food use of menhaden. Theremarkable growth in the V.S. supply of surimf products in recent yearsis shown in Figure 1.
120
100
80
INILI.IONPOUNDS 60
40 1977 1979 1981 1983 1985 1987YEAR
Figure 1. United States supply of surfmi products, 1975-1987.
270

R 8 0 Contracts
2-year, $2 million menhaden surimi project was awarded to the ZapataHaynie Corporation. About $1.3 million in U.S. Government funds wassupplied for the contract, with technical monitoring performed by theNational Marine Fisheries Service. Zapata Haynie Corporation providedin excess of $600,000. The functional and financial responsibilities ofthe two parties were specified as follows:Zapata Haynie, Inc. must provide:
An appropriate physical site with immediate access to freshsupplies of Atlantic menhaden.
An appropriate food grade building with walls, floors, drainsetc. meeting sanitation standards for food fish plants.
Refrigerated holding facilities for menhaden between delivery andprocessing.
A plate freezer of sufficient capacity to freeze surimi blockproduction.
Frozen storage facilities to hold surimi products at a temperatureof -IO F -23'C! or lower.
Utilities installations to support plant operations.
Amounts of fresh food grade menhaden to meet surimi productionrequi rements; harvested, handled, and delivered according to spe-cified procedures.
An acceptable means for the disposal/utilization of both solidwastes and processing waste waters.
Government funds may be used for:
The purchase of fish processing equipment.
U.S.
Installation and maintenance of processing equipment.
In response to industry needs and the opportunity for true economicgrowth, the U.S. Congress designated increased FY 1985 funding formenhaden research and development in the conversion of whole menhadeninto surimi and minced forms. The National Marine Fisheries Service incooperation with industry was directed to use the funds to achieve thefollowing objectives: I! determine the economic and technical feasibi-lity of producing menhaden surimi, �! produce developmental quantitiesof test menhaden surimi material for formulation and evaluation of endproducts by food scientists, and �! determine onboard and inplant pro-cedures necessary to maintain menhaden quality for human consumption.

Plant operating expenses.
* Collection of data required for technical and economic evaluationof the process and products.
* Storage and distribution of menhaden surimi samples.
* Preparation of interim and final reports.
Conductfng public access/technology transfer activities.
Project overhead costs'
The contract calls for a plant capable of producfng at least I tonof surimi per 8-hour day. Although the contract spells out the stepsneeded to produce surimi, it recognizes that the processing requi rementsto make a quality surimi from menhaden are not well defined and pre-scribes a flexible plant design to allow evaluation of a number ofdifferent processing options through experimental runs. The contractrequires that at least 30 tons of menhaden surimi be produced under U.S.Department of Commerce fnspection and that samples be made available forpublic distribution.
THE PROCESS
A top quality, food-grade processing facility was constructed byZapata Haynfe Corporation on a site adjacent to their fish meal and oilplant at Reedvf lie, Vfrgfnfa. Fresh Atlantic menhaden are supplied byeither a small bait purse seiner, modified to quickly chill and hold thefish below 40'C using a recirculating fce water spray system, or byboats of the Zapata Haynie fishing fleet. On the decks of the Zapataboats, the fish are chilled and held in slush ice in 35 cubic foot insu-lated containers. On one boat, the EARL J. CONRAD, the containers areconnected to a circulating refrigerated water system. All fish for thesurimi plant are pumped directly from the water to the insulated storagecontainers, bypassing the main fish hold. The containers are taken off'the vessel with a crane and are trucked from the dock to a refrfgeratedholding room adjacent to the processing area in the surimi plant. Plantchilled water can be circulated through the containers during theholding period. When required for processing, the individual containersare hoisted and dumped into a water-filled tank where the ice is removedby flotation. The fish are lifted from the tank by an inclined conveyorto a belt scale which weighs them as they are transported into the pro-cessing area.
272

In the processing area the fish are partially hand sorted as timepermits on the feed belt leading to the two Baader 331 filletingmachines. Solid waste from the fi 11eters and rejected fish are conveyedfrom the building and trucked to the fish meal plant. The butterflyfillets backbones removed! are washed with chilled water in a rotarywasher before they are fed to the mechanical deboner. Initially thedeboned mince was washed three times in the batch wash tank followed byrotary screening and refining. In July an inline washing system wasinstalled. Menhaden mince is fed into the wash system by a Moyno pumpwhile chilled water is metered in at a 5 to 1 ratio of water to mince.Static mixers inside a series of stainless steel retention loops providegood contact between the water and mince for extraction of soluble pro-tein and color bodies. The slurry exits to a decanter centrifuge forrecovery of the washed mince.
The washed mince is refined and then dewatered in a screw press.It is mixed with cryoprotectants �% each sugar and sorbitol plus 0.2$polyphosphate! in a cutter-mixer to produce the surimi . The surimi isextruded into polyethylene bags and formed into blocks in metal trays.Some 1 and 2-kg blocks as well as the standard 10-kg blocks are pro-duced from each batch. The formed blocks of surimi are frozen in aplate freezer and then stored in a holding freezer at -30 F -34'C!.
OPERATIONS
First Year
gu pment was ordered and installed and much of the basic work onharvesting methods was done during the spring and summer of 1986. Plantconstruction was completed in early October. After several shake downruns, a decision was made to produce and store frozen fillets for useduring the winter. A full-scale production run was made in Novemberwhich demonstrated the 1 ton per day capacity of the plant.
The winter work provided the opportunity to test the administrativestructure of the project as well as the operation of the various piecesof equipment. Most batches run during the winter, with frozen fillets,were small and the press was not operated until near the beginning ofthe 1987 fishing season. The deboner, washing cycle, and refiner wereextensively tested.
1 The mention of trade names does not imply endorsement by NationalMarine Fisheries Service, NOAA.
273

Cur rent Year
Initially, lab studies were made to determine the best qualitysurimi that could be produced from the white flesh of the menhaden. Theresults from those runs were averaged and used as the initial benchmarkfor menhaden surimi. The first extended production runs were made inJune and were followed by more experimental runs alternated with produc-tion runs. All production runs are federally inspected and a11 productfor distribution bears the U.S. Department of Commerce inspection seal.
Other types of equipment and procedures were evaluated includingBeehive and Yield Master deboners, replacing the refiner with astraine~, smaller screen sizes in the deboner, and different washcycles. In late July, we began testing the Alfa Laval inline washsystem and decanter centrifuge. Most of the fat is removed with theliquid phase from the centrifuge. The solids are refined and dewateredbefore mixing with the cryoprotectants.
RESULTS AND DISCUSSION
Many of the equipment tests were inconclusive, but some changeswere indicated and results from the inline washing system lookpromising. Surimi quality is at least as good as that from the batchsystem, yields are improved, water use is reduced, and there is a defi-nite savings in labor. The inline wash system has remained in operationsince late July.
The sur imi process is essentially an isolation of the muscle pro-tein of the fish from the other components of the flesh. Changes inprotein, fat and ash through the processing steps are shown moisture-free basis! in Figure 2. There is an increase in proteinthrough the process but the level drops in the surimi block because ofthe addition of 8% cryoprotectants �4% dry basis!. These are carbo-hydrates and thus are not reflected in the ash content.
Data collected so far indicates that residual fat in the surimi isrelated to the fat content of the starting material. In Figure 3 the 5fat in the frozen surimi block is plotted versus X fat in the whole fishfrom which it was made. However, more data points from fatty fish areneeded to confi rm this positive correlation. Of more significanceperhaps is the question of what fat level is acceptable in the finalproduct. The menhaden surimis produced at Reedville have exhibitedexcellent gel strengths. Based on some earlier work at the CharlestonLaboratory, the fatty acid profile in the residual lipids is similarto that of the fish fi'tlet lipids and should have positive nutritional
274

80
70
PERCENT OF 50GRY NATTER 2010
0
WHOLE RLLET ININCK WASHED REFINED PRESSED SURIMI
LOCATION IN THE PROCESS
Figure 2. Changes in protein, fat, and ash content dry basis! throughthe menhaden surimi process.
4.0
3.5
3.0
2.5% FAT
SURIMI 2.0
1.5
1.0
0.5
0.0 7 9 11 13 15 17'Yo FAT IN WHOLE FISH
Figure 3. Fat content of surimi versus fat content of whole menhaden.
275

Table 1. Omega-3 fatty acids and lipid content of two menhaden surimisprocessed at NMFS, Charleston.
Species:
Form:
5 Total Lipid:
Atlantic Menhaden Gulf Menhaden
Fi 1 1 ets Surimi Fi I1ets Surimi
0.93 0.54 4. 61 1. 85
Omega-3 Fatty AcidsArea X: 40. 3 30.440.7 26 ' 5
gm/100 gm Tissue: 0. 29 0. 16 1.26 0.42
There have been wide fluctuations in yields for menhaden surimi atthe Reedville plant, as shown in Figure 4. This has been due to largevariations in fish size and also to experimental changes in equipmentand procedures. Mechanical sorting befo~e fi1leting should improveyield significantly. The goal is to improve yields without sacrificingqua 1 i ty.
The primary quality problem is color, assuming that the surimi isto be used in analog products. Changes in instrumental color valuesthrough the process are shown in Figure 5. Washing removes blood andpigment., increasing the lightness L value! and decreasing the red color a value!. Significant changes in the L and a values also occur whenthe surimi is cooked into a kamaboko gel. The yellowness b value!remains essentially unchanged through the processing steps, however.
A 400-lb sample of menhaden surimi from the Reedvi lie plant wasprocessed at Sea Fest Products in Motley, Minnesota into a crab analogproducts The color was darker than desired but the flavor was accep-table and the texture of the product was very good.
Samples of menhaden surimi are currently available from SurimiProject, Zapata Haynie Corporation, P.O. Box 175, Reedvi lie, Virginia22539. The product may be obtained free for evaluation or product deve-
276
value. This is indicated by the data in Table 1. The calculations ofgrams of fatty acid per gram of tissue are based on the method ofWeirauch et al. �977!. We did not measure whole fish fat levels, butthe level in these Atlantic menhaden fillets was low. The fat levels inthe gulf menhaden fillets and surimi were higher, but there were nosignificant flavor changes during 6 months of frozen storage at -20'C.

80
70
PERCENT YIElD
RAW FISH BASIS 60
40
30
20
10 FILLET IINCK RKFINKD PRESSED SURIMILOCATION IN THE PROCESS
Figure 4. Range of yields versus menhaden surimi process step.
70
60
HUNTER 40COLOR VALUES 2010 0MINCE WASHED REFINED PRESSED SURIN KAMABOKO
MINCE LOCATION IN THE PROCESS
Figure 5. Changes in Hunter color values through the menhaden surimiprocess
277

lopment, but the recipient must pay shipping charges by overnight airexpress! and is asked to provide feedback information on product appli-cations and results.
Some additional contract money was provided to continue operationof the processing line through the fall, to test the use of higher fatfish. The current contract runs through January. It is anticipatedthat Congress will appropriate money for the additional work that isneeded during the next fishing season. This would include:
* Determine methods to improve the color of the surimi and ways tof urther reduce fat content.
* Determine the flavor stability of the surimi and the need toremove additional fat.
* Establish reproducible specifications for menhaden surimi.
* Optimize yields at acceptable quality levels.
* Evaluate Atlantic mackerel as a surimi source.
* Evaluate gulf menhaden as a surimi source.
REFERENCES
1. Hale, M. and R. Ernst, Jr. 1986. Processing menhaden for conven-tional food pr oducts, minced intermediates and surimi . Proc. 11thAnn. Trop. Subtrop. Fish. Tech. Conf. Amer. pp. 293-304.
2. Lanier, T., T. Akahane, and R. Korhonen. 1983. Exploration ofmenhaden as a resource for surimi production and use in simulatedshellfish products. Proc. 8th Ann. Trop. Subtrop. Fish. Tech. Conf.Amer. pp. 222-233.
3. Nati onal Mari ne Fisheries Servi ce. 1987. Fi sheri es of the UnitedStates, 1986. Current Fishery Statistics No. 8380. U.S. Dept.Commerce, NOAA, NMFS.
4. Regier, L., R. Ernst and M. Hale. 1985. Processing requirementsfor the preparation of minced intermediates or surimi from menhaden.Proc. Intl. Symposium on Engineered Seafoods, Seattle, WA.
5. Wei rauch,J., L. Posati, B. Anderson and J. Exler. 1977. Lipid con-version factors for calculating fatty acid contents of foods. J.Amer. Oil Chem. Soc. 54:36-40.
278

INTERACTION OF FROZEN STORAGE TEMPERATURE
AND FOOD ADDITIVES WITH COD FILLET AN! FRAME MINCE
Jorge Toro, Tim Hwang, and Joe M. RegensteinDepartment of Poultry and Avian Sciences
and Institute of Food Science
Rice Hall, Cornell University, Ithaca, NY 14853-5601
INTRODUCTION
As the Northeast U.S. examines its alternatives for the use of itsfishery by-products, the need to produce human grade products from thesewastes becomes obvious. The simplest alternative in many cases may bethe production of mince or mechanically deboned fish flesh from variousfilleting wastes. This would reduce the waste generated by 15 to 30K andwould produce a more valuable product that could help offset the cost ofremoving the remaining waste. The available by-product raw material willvary from the very white mince of the V- or J-cut of a fillet to the veryred frame mince obtained by deboning the fillet rack assumed to beheaded and gutted!. The latter, however, contains much more iron andpossibly more omega-3 fatty acids. The nutritional availability of ironand the actual content of omega-3 fatty acids in various minces are bothareas that require further research.
One of the obvious uses of this redder fish mince would be in themanufacture of red meat-like products. In this case the presence of theiron would be of great nutritional benefit as iron is one of thenutrients that is often lacking in the American diet including many pre-menopausal middle and upper class females and red meats are one of ourbest sources of this nutritionally important mineral. Thus, it becomesimportant to establish the effect of switching from red meat to mincedfish on the iron status of potential consumers.
The frame mince, although excellent for many new food productdevelopment efforts, is difficult to store frozen. Particularly thegadoid minces, i.e., those from cod, haddock, hake, whiting, pollock, andcusk, undergo a textural change that leads to a toughening of the fishmeat. The texture is often characterized as "spongy" or "cottony'� " Thetextural change is believed to be due to a series of chemical changesinitiated by enzymes specific to gadoids and a few other species! thattakes the naturally present trimethylamine oxide TMAO! and converts itto dimethylamine DMA! and formaldehyde FA!. The FA is a reactivecompound that is believed to then go on to crosslink the proteins,causing the undesirable texture changes.
Previous work in our laboratory has indicated that the measurementof DMA, however, does not always follow the observed texture changeswell, particularly in the presence of additives. Thus, we have developedvarious tests that specifically follow the textural changes; theseinclude instrumental texture measurements, human panel textureevaluations, and protein functionality tests that can under somecircumstances predict textural behavior. For example, with cod minces,the expressible moisture of the raw fish predicted the human panel
279

determined binding scores of cooked product quite well for a large numberof different salts.
From work with surimi, researchers have identified compounds thatseem to protect surimi from texture changes during frozen storage. Thesechemical additives are often generically referred to as cryoprotectants,i.e., materials that prevent changes during freezing. Surimi differsfrom mince in that most of the soluble compounds have been washed outand, thus, the level of compounds like TMAO is much lower. However, itis possible that, the same cryoprotectants would have a beneficial effectif they were added into mince as is or to mince which has been washedonce simply to reduce the level of soluble components. Some of thesecryoprotectants might also be appropriate ingredients for furtherprocessed final products that may be made from the mince and, therefore,their presence in the mince might not provide a barrier to the furtheruse of the mince.
The reactions leading to texture changes occur at different rateswhen fish is stored at different temperatures. The colder thetemperature the slower the reaction. However, the reaction of TMAO toform DMA and FA does have a measurable rate down to -29oC or so. Thus,long term cold storage below that temperature is recommended, but iscurrently not commonly practiced in this country. Discussions of thepossible benefit of making extra-cold storage available to the fishingindustry are occurring in the Mid-Atlantic region. Some newertechnologies, such as the use of a stored energy carbon dioxide system i.e., making dry ice at night and using the cold during the day! mightmake lower temperature cold-storage economically feasable, by permittingmore of the energy needs to be met in the evening when electricity ischeaper. Lowering of the day-time electricity demand would also help theeconomics of such a system.
We are also studying the possibility that minces stored at -40 C orso for a few months will not undergo as rapid a change in texture atnormal cold storage temperatures -15 to -20oC! as would mince placeddirectly into normal cold storage.
In the work presented here, we have attempted to take a look atvarious food-type additives added to cod fillet and frame mince that werethen stored at different temperatures -7, -20 and -40 C!. Among theadditives tested were:
1. Sorbitol. This compound is often used as a cryoprotectant withsurimi. It is not as sweet. as sugar, the other compound normally foundin surimi.
2. Polydextrose. This compound has been proposed for use as acryoprotectant by Dr. Lanier's group at North Carolina State. It is lowerin calories and less sweet than sorbitol.
3. Starch. Starch is a traditional ingredient in further processedsurimi. Preliminary data from our lab suggests that this compound doeshave a cryoprotectant action. See appendix I for a copy of this report.!Also, some of the further processed minced fish products which we havedeveloped require starch as an ingredient. Starch of the four compounds
280
tested in this study would also be expected to meet with the least amountof consumer resistance with respect to labeling etc.
4. Soy Protein Isolate. We have chosen to examine an extremelyfunctional soy protein with no detectable flavor contribution to themince.
METHODS AND MATERIALS
Samples preparatian
Very fresh cod estimated to be less than three days old on arrivalin Ithaca! was obtained from Connolly Bros. in Boston. Both fillet trimand frames were shipped. The heads were removed from the frames.
The fish samples fillets and frames! were minced using a Bibundeluxe model 15 mechanical deboner with 5 mm holes. The fillets were donebefore the frames.
Half of each type of mince was washed with tap water with a ratiowater to fish of 2:1 v/w!. The mince was agitated for 10 minutes whilebeing kept at 4 C. The water, after washing, was drained out and furthermoisture was removed by pressing the washed mince in cheesecloth. Thesesamples are referred to as washed fillets and washed frames. The otherpair of minces are referred as non-washed fillets and non-washed frames.
The following additives were used in this study. Starch 806 Amaizo;Hammond, Indiana!, isolated soy protein Ardex SP6 Archer Daniels NidlandCo.; Decatur, Illinois!, polydextrose FCC Pfizer Inc.; New York, N.Y.!,and sorbitol N.F., F.C.C. Pfizer Inc.; New York, N.Y.!. Each additivewas added to samples of the various minces so that the final additiveconcentration was 2X w/w.
These additives were selected because:
1. These additives have been extensively studied and are known to have abeneficial effect on the water retention properties of food systems.Water retention deteriorates during the usual frozen storage of fish.
2. The change in texture associated with the frozen-storage of fish hasbeen associated with physical changes of some of the fish muscleproteins. Some of the additives utilized sorbitol, polydextrose! areconsidered to possess cryoprotectant properties and are utilized withthat objective at the industrial level mainly in the surimi industry!.
One oz. Nalgene jars were filled to the top with minced fish samples;trying as the cups were packed to avoid air pockets. Each sample was thenfrozen at -20oC in a large walk-in freezer and transferred to freezers at-7, -20 and -40oC and stored for 90 days. Samples were taken at days 2,10, 60 and 90. The samples were then thawed in a cold room at 10oC for 24hr, and analyzed for cook loss, expressible moisture, human texture panelevaluation of springiness and cohesiveness of raw product, and textureprofile on the Instron Universal Testing Machine! to determine hardness,cohesiveness, and springiness.
281

Cook loss of the samples was measured by cooking the mince, whilestill in the cup, for 15 minutes in boiling water. The samples weredrained, cooled to room temperature, and weighed. The weight difference,expressed as a percentage of the starting weight, is the cook loss.
Expressible moisture was measured by taking 0.8 to 1.0 g of raw fishand placing it on preweighed Whatman 1 filter paper. The sample was incontact with Whatman No. 5 paper and three additional layers of WhatmanNo. 3 were used. The sample and the filter paper were put into a Sorvallpolycarbonate centrifuge tube and centrifuged in the RC2B refrigeratedcentrifuge at 4oC SS-34 head! for 10 minutes at 3,000 rpm. The weightgain of the filter paper divided by the starting weight of the fish isthe percentage expressible moisture.
The human raw texture panel evaluated a 1/4 pie shaped piece of themince removed from the cups. Springiness and cohesiveness were measuredon a 11 point scale with 0 representing the absence of any springiness orcohesiveness and 10 representing an extremely springy or cohesive sample.
The General Foods Texture Profile on the Instron involves placingthe minced fish sample removed from the plastic cup between two parallelplates. The upper plate is lowered onto the sample which is thencompressed to 65X of its original height. The instrument reverses andreturns to its original position. It then goes through a secondcompression cycle. The chart records the amount of force on the upperplate as a function of the time during the compression/relaxation cycle.From these curves, the brittleness fracturability during the firstcompression!, hardness maximum compression force on the firstcompression!, the instrumental cohesiveness change in area under thecompression part of the curve for the second compression divided by thatfrom the first compression!, and the instrumental springiness distanceon the second curve from the beginning of compression until the maximumforce is reached! were measured. The cohesiveness is a measure of thepercentage of work needed to compress the sample during the secondcompression in comparison to the first compression. The springiness is ameasure of how much height the sample recovered between the first andsecond compression elasticity!. With all of the samples studied, nobrittleness peak was observed. In addition, if the sample adheres to theupper plate an adhesion value can also be calculated. However, thisvalue depends heavily on the nature of the surface of the upper and lowercompression plates. A small amount of adhesion was observed with thefish samples, but the detailed results will not be reported.
RESULTS AND DISCUSSION
A storage temperature of -15 to -20oC is most commonly used in thefish industry. Thus storage at -20oC represents the best commercialstorage conditions. At &OoC, the biochemical reactions that affect theorganoleptic acceptability of the fish are theoretically stopped. Otherchanges should be minimized. However, we have observed on variousoccassion that some changes, such as in expressible moisture, can stilloccur even at this temperature. Thus although this temperature canusually be considered as an invariant control; caution must be exercisedin interpreting results which are compared to samples stored at thistemperature. At -7oC we are looking at an abuse temperature. Thistemperature would be expected to highlight any changes observed with the
282

different samples within a reasonable amount of time. Generally thiswould be a condition that is worse than might be expected in evenmediocre frozen storage conditions. However temperature variation infrozen storage may be even more important than the actual temperature.These studies do not address this important point.!
The first property examined with each sample was the cook loss.These are shown in Table I and 2.
The washed minces had a much greater cook loss, with the filletspossibly having a bit more cook loss than the frames. This suggests thatthe original moisture removal may not have been as complete as comparedwith the original material. Within the time-frame of the experiment andbecause of the high variability of the measurement, no differences as afunction of time are obvious except possibly for the non-washed filletsat -7 C where a peak at day l0 is observed. Limitations in theavailability of sample prevents one from establishing whether anydifferences actually exist for the different temperatures, but theabsence of change at the higher storage temperature would suggest thatchanges would not be observed at the lower temperatures. In all casesthe soy protein isolate and starch have the lowest cook loss. In thecase of the washed fillets the results are particularly obvious and alsoto some degree in the washed frames. The starch would be expected togelatinize on cooking, which should certainly aid in holding moisture.
The next series of experiments involve the expressible moisture ofthe raw mince. These are shown in Table 3 and 4 ~
The difference between the expressible moisture for the washed andnon-washed samples seem to reflect moisture differences of the same orderof magnitude as the cook loss data, i.e., the actual difference is aboutthe same although the actual amount of expressible moisture is aboutdouble that of the cook loss. The soy protein isolate again seems tosuggest some benefit in minimizing expressible moisture changes. Unlikethe cooked samples, the starch shows no particular benefit. This is notsurprising since the starch effect would only be expected in cookedsamples after gelatinization.
The results of the raw human texture panel work is shown in Tables 5and 6. The change in texture is clearly indicated after 60 days and 90days. With washed frame mince the best improvement in quality is seenwith the polydextrose. Soy protein seems to aggravate the texture changeslightly. In general the non-washed minces did surprisingly better thanthe washed frame minces at -7oC. This was certainly an unexpectedresult. The process of washing may have disrupted the fish more and theprobably presence of more water in the washed samples might have alsoinfluenced the effectiveness of the various additives.
The same pattern of washed doing more poorly than unwashed is seenwith the fillets. With fillets, at 60 days but not at 90 days thepolydextrose seemed to have the greatest beneficial effect. We alsoagain see that the soy protein was detrimental to the quality of the rawmince.
The General Foods Texture Profiles on the Instron on shown in Tables7 and 8. Notice that the hardness of the washed frames and fillets were
283

TABLE 1. COOK LOSS FOR FRAMES
TIME
Days!WASHED FRAME MINCE
10 60 90
T -7 -20 -40 -7 -20 -40 -7 -20 -40 -7 -20 -40
N 20.2 19.4 23.4S 14.3 15.0So 22 F 4 24.7P 14.5 17.8
NON-WASHED FRAME
9060
-7 -20 -40T -7 -20 -40 -7 -20 -40 -7 -20 -40
Each value represents the mean of 3 sub-samples of the same batchof fishy T, temperature in degree Celsius; N, no additives; S,starch; So, isolated soy protein; and P, polydextrose. Eachadditive at 2X w/w.
284
NS
Sop
7.4 6.04.9 5.85.1 5.05 ' 8 10.1
7.6
5.1
3.66.7
22.2
15.417.1
25.6
11. 1
7.7
8.7
10.9
19.3 23.013.8
16.022.7
4.33.03.7
5.8
22.5 24.215.5 16.8
18.1 19.825 ' 1 27 ' 4
6.5
6.73.1
8.0

TABLE 2. COOK LOSS FOR FILLETS
TIME
Days!WASHED FILLETS
60 9010
-7 -20 -40 -7 -20 -40-7 -20 -40T -7 -10 -40
23.9N 26.3 25.8S 18.2 17.6So 19.4 17.4P 27.8 28. 7Sr 25.9 26.5
T1ME
Days!NON-WASHED FILLETS
60 9010
-1 -20 -40 -7 -20 -40 -7 -20 -40T -7 -10 -40
4.2 1.63.2 5.50.3 0.84.1 3.31.2 G.B
6.214.1 � 7.7
9 7 � 3 3
11.9 - 4.415.2 � 11.215.2 � 7.9
Each value represents the mean of 3 subsamples of the same batchof fish. T, temperature in degree Celsius; N, no additives; S,starch; So, isolated soy protein; P, polydextrose; and Sr,sorbitol. Each additive at 2X w/w.
285
NS
SoP
Sr
2.62.5
1.63.6
1.7
24.4
19.9
15.822.8
24.9
24.919.2
18.3
28.6
27.1
14.1
B.B
11.8
14.9
13 ' 4
25.820. 1
17.7
29.4
26.1
24.0
16.4
17.6
26.322.6
11.7
6.32.2
11.911.4
24.7
16.017.0
25.823.3

TABLE 3. EXPRESSIBLE MOISTURE FOR FRAMES
906010
-7 -20 -40 -7 -20 -40 -7 -20 -40T -7 -20 -40
47.0
46.1N 43.9 46.2 43.0 44.2S 46.0 49.8 � 47.2So 43.6 � 42.6 43.6P 44.8 43 ' 8 � 47.8
TIME
Days!NON-WASHED FRAME
9010 60
T -7 -20 -40 -7 -20 -40 -7 -20 -40 -7 -20 -40
Each value represents the mean of 3 subsamples of the same batchof fish. T, temperature in degree Celsius; N, no additives; S,starch; So, isolated soy protein; and P, polydextrose. Eachadditive at 2X w/w.
286
N 37.7 38.3 35.9S 404 40 ~ 5 39 ~ 8So 35.0 40.0 34.9P 37.6 40.0 36 ~ 2
39.8
42.7
35.3
39.4
TINE
Days!WASHED FRANK
51.2
45.844.7
47.4
43.0
44.5
38.839.6
46 ' 2 45.746.7 47.546.4 44.746.4 48. 2
40.643.1
41.240. 7

TABLE 4. EXPRESSIBLE MOISTURE FOR FILLETS
TIME
Days!WASHED FILLETS
60 9010
T -7 -20 -40 -7 -20 -40
42.9
TINE
Days!NON-WASHED FILLETS
906010
-7 -20 -40 -7 -20 -40T -7 -20 -40 -7 -20 -40
32.5 36.140.2 41.636.4 33.239.4 37.337.3 29.8
Each value represents the mean of 3 subsamples of the same batchof fish. T, temperature in degree Celsius; N, no additives; S,starch; So, isolated soy protein; P, polydextrose; and Sr,sorbitol. Each additive at 2X w/w.
287
N 41.6 42.2 42.3S 48.9 44.9 47.4So 41.2 37.4 42.5P 40.1 42.4 42.6Sr 40.4 42.4 37.3
1
N 34.2 34.3 38.7S 38 ~ 0 404 390So 29.4 28.2 31.8P 37.0 36.9 34.3Sr 34.5 31.0 33.5
43.148.042.341.345.2
48.445.739 ' 946.239.8
50.944.8
43.146.344.9
37.243.937.340.842.4
37.140.639.133.437.1
45.3
50.644.247.742. 7

TABLE 5. HUMAN RAW TEXTURE PANEL EVALUATION OF FRANZ MINCES
TINE Days!
WASHED FRAMES
10 60 90
-20 -7 -20 -7 -20
SiN
Co
1.0 2.3 1.8 6.0 3.2 7 ' 2 3.1
1 ~ 0 2.0 1.0 5.2 2.7 5.7 2.0
SiS
Co
1.8 2.0 1 ~ 5 5.2 6.9 3.03.0
1.3 1.0 1.0 5.2 2.2 5 ' 2 1.7
SiSo
Co
2.5 1.5 2 ' 5 3.05 ' 7 7.7
1.82.0 1.0 5.2 6.2 1.7
SiP
Co
1.5 1.8 1.3 6.7 2.05.0
1.01.0 1.0 4.2 4.7 1.2
TIME Days!
FRANZ NON-WASHED
906010
-7 -20 -40
2.22.7Si 1.0
N Co 1.03 ' 31.3 1 ~ 5
1.0 1.0 1.52.22.8
2.23.0Si 2.5 1.6 1.3
Co 1.3 1.3 1 ' 0
Si 1.3 1.3 2.3
Co 1.0 1.0 1.5
2.8
2.22.22.5
3.73 ' 8So
3.23.0
2.02.81.0Si. 1.0
P Co 1.0 1.72.01.0
288
Each value represents the mean of 4 subsamples of the same batchof fish. T, temperature in degree Celsius; Si, springiness; Co,cohesiveness; N, no additives; S, starch; So, isolated soyprotein; and p, polydextrose. Each additive at 2X v/w.

TABLE 6. HUMAN RAW TEXTURE PANEL EVALUATION OF FILLET MXNCES
TIME Days!
FILLETS WASHED
60 9010
-7 -20 -40 -7 -20 -7 -20 -7 -40
Si 4.8 2.5
4.0 1.8
4 ' 3
Co
SiS
Co 3.5
Si 5.3
4.8
3.5
SoCo
Co 2.8 3.7
SiSr
Co
3.5
2.8
TIME Days!
NON-WASHED FILLETS
6010
-20-20 -7-7 -20 -40 -7
1.81.81.51.0 1.0 1.3 1.3
1.0 1.0 1.3 1.3
1.3 1.3 1.5 1.3
1.0 1.5 1.5 1.0
1.5 1.8 1.8 1.5
1.0 1.8 I ~ 8 1.0
1.0 1.0 1.3 1.0
1.0 1.0 1.5 1.3
1.0 1.0 1.0 1.3
I ~ 3 1.3 1.0 1.3
Si
Co 3 ' 31.0 I ~ 5
3.02-31.3SiS
Co 2.31.31.8
3.32.31.0SiSo
Co 3.82.01.3
2.31.01.0
2.3Co 1.0 1.0
2.31.0 1.8SiSr
Co 1.81.5 1.5
Each value represents the mean of 4 subsamples of the same batchof fish. T, temperature in degree Celsius; Si, springiness; Co,cohesiveness; N, no additives; S, starch; So, isolated soyprotein; P, polydextrose; and Sr, sorbitol. Each additive at 2Xw/w.
289
2.8 2.5 3.5
I ~ 8 1.5 2.0
3.3 4.3 3.8
2.0 2.4 2.3
3.5 3.0 3.3
2.5 1.8 1.8
2.5 2.3 2.5
2.0 1.0 1.5
2.0 1.0 1.3
1.5 1.0 1.3
2.5 1.5
1.5 1.3
2 ~ 8 2.0
2.0 1.3
2.5 1.3
2.0 1.3
4.0 1.3
1.3 1.0
1.8 1.0
1.0 1.0
3 ~ 2
3.0 3.2
5 ' 2
3.7
5.7 2.5
4.0 2.0
4 ' 7

TABLE 7. TEXTURE PROFILE ANALYSIS OP FRAME MINCES
TIME Days!
MASHED FRAMES
90602 10
7--20 -40 -7 -7 -20
1.90 1.6064.78 39.45
.85 .52
Si 4.83N Hl 13.80
Co .35
2.20 1.38.08 22.8
.76 .9
1.6927.94
1.04
2.23 1.61144.80 60.80
.81 .46
Si 4.30 4.07S Hl 23.80 11.81
Co ~ 25 .44
1.6727.64
.94
2.1494.50
.81
1.82 1.3855.31 28.48
~ 87 .75
1.95 1.6269 ' 63 33.30
.87 .60
Si 3.90 1.35So Hl 11.55 22.25
Co .16 .76
1.7642.16
1.01
2.26171.73
.77
1.3
Si 2.45 1.31P Hl 12.55 15.67
Co .66 ~ 67
1.59- 23.36
.97
2 ' 07114.80
.71
1.87 1.5155.40 36.05
.88 .67
TIME Days!
NON-|2tASHED FRAMES
906010
-7 -20
1 ~ 2518.63
.79
1.2530.76
.42
1.189.39
~ 61
SiN HI
Co
.755.91
.50
1.2314.49
.91
1.2929.11
.46
Si .90 .93 .93S Hl 10.02 10.75 10.68
Co .50 .50 .43
1.3059.93
.47
1.7016.93
.77
1.3838.34
.59
1.2363.85
.43
1 ~ 1923.65
.65
SiSo Hl
Co
.98 1.0918.74 15.62
.43 .53
1.2721.30
.59
Si .84P Hl 7.94
Co .49
1.0611.18
.81
.706.20
~ 46
.736.68
.46
1.1942.36
.43
290
Each value represents the mean of 3 subsamples of the same batchof fish. T, temperature in degree Celcius; Si, springiness mm!;Co, cohesiveness work!; Hl, maximum compresion force on the firstcompression cycle Newtons!. N, no additive; S, starch 806; So,isolated soy protein; and P, polydextrose; Each additive at 2w/w. The samples were compresed 65 X of their original height ineach of the compression cycles.

TABLE 8. TEXTURE PROFILE ANALYSIS OF FILLET MINCES
TIME
Days!WASHED FILLETS
906010
-7 -20-7 -20 -40
291
Si 1.31 1.46N Hl � 26.10
Co .61 .74
Si 1.42 1.42S Hl 25.60 17.65
Co .69 .67
Si 1.53 1.50So Hl 29.12 25.00
Co .47 .65
Si 1.19 1.25P Hl 18.30 17.45
Co .59 .66
Si 1.16 1.11Sr Hl 14.30 14.56
Co .55 .53
1.4
23. 2.7
1.4
19.9.7
1.521. 1
.8
1.2
16.6.6
1.116.9
.5
1.33 1.2425.47 21.62
.81 .79
1.31 1.526.37 26.01
.79 .95
.9428.10
.69
1.26
26.19.66
1.27 .98
16.73 21.95~ 77 .60
1.9587.21
.59
2.40113.21
1.00
1.84
109.270.58
1.4470.08
.43
1.84
44.321.02
1.7649.89
.78
1.83
64.31.86
1.6745. 43
.70
1.3438.28
.67
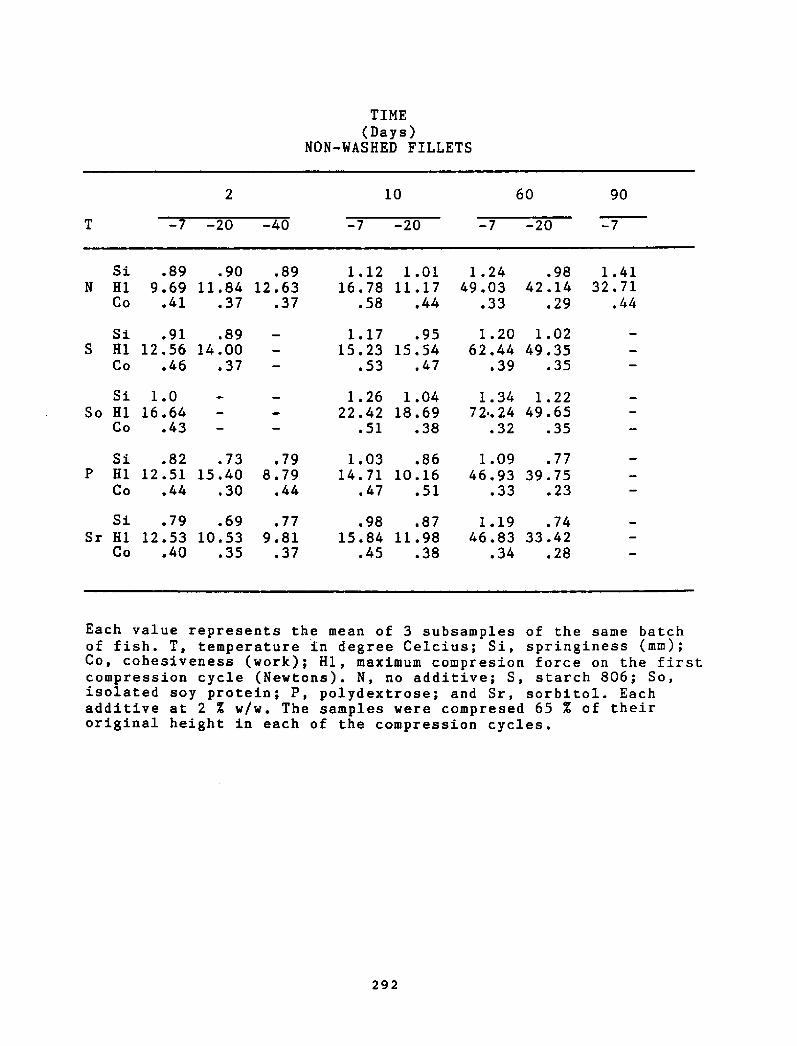
TIME
Days!NON-WASHED FILLETS
6010 90
-20 -40 -7 -20 -7 -20
Si .89 .90 .89N Hl 9.69 11.84 12 ' 63
Co .41 .37 .37
1. 12 1.01
16. 78 11. 17
.58 .44
1.2449.03
.33
1 ' 4132.71
.44
.9842.14
.29
1.20 1.02
62.44 49.35
.39 .35
Si .91 ~ 89S Hl 12.56 14 .00
Co .46 .37
1.17 .95
15.23 15.54
.53 .47
Si 1.0So Hl 16.64
Co .43
1.26 1.0422.42 18.69
.51 .38
1.34 1.2272.24 49 ' 65
.32 .35
1.09 ~ 7746.93 39.75
.33 .23
Si .82 .73P Hl 12.51 15.40
Co .44 .30
.79
8.79.44
1.03 .86
14.71 10.16~ 47 .51
Si .79 .69Sr Hl 12.53 10.53
Co .40 .35
.77
9.81~ 37
.98 .8715.84 11.98
.45 .38
1.19 ~ 7446.83 33.42
.34 .28
292
Each value represents the mean of 3 subsamples of the same batchof fish. T, temperature in degree Celcius; Si, springiness mm!>Co, cohesiveness work!; Hl, maximum compresion force on the firstcompression cycle Newtons!. N, no additive; S, starch 806; So,isolated soy protein; P, polydextrose; and Sr, sorbitol. Eachadditive at 2 X w/w. The samples were compresed 65 X of theiroriginal height in each of the compression cycles.

higher than those for the unwashed. Generally sorbitol seems to be amongthe lower samples, while the soy protein is generally among the additivesgiving the greatest hardness. In general the springiness was helpedslightly by the additives with polydextrose followed by sorbitol havingthe greatest beneficial effect. Cohesiveness of the non-washed filletsseems to be the lowest, while cohesiveness seems to be highest for the 'washed frames.
CONCLUSIONS
The results to date are consistent with the observation that a hightemperature is detrimental to the storage of the mince. The length ofstorage time used in these experiments does not permit one to distinguishbetween -20 and -40oC. The detrimental effect of washing on the fleshwas unexpected while the beneficial effects of polydextrose is at leastwhat one might have expected. With respect to whether thecryoprotectants used for surimi would work with minces, it was hoped thatthey would but little experimental evidence existed, and the results todate suggest that they do not function the same way. The results of Xuand Regenstein �986! agd this work both suggest that starch, ifbeneficial works only on the cooked material. The results in this worksuggest that further studies of the role of additives with cooked and rawtexture are in order. Other work, currently coming out in an informalreports from South Africa and with gums from Holland suggest that thebenefits of additives are less than the benefits of improved temperatureof storage.
Overall these results indicate that the problem of stabilizingminces is sufficiently different from those encountered with surimi thatresults from one system to the other cannot be extrapolated, but ratherthat mince requires its own experimental work.
Acknowledgements
We wish to thank Seafood Management, Cos Cob, CT, the New EnglandFisheries Development Foundation, Boston, MA, and the New York Sea GrantInstitute for support of this work.
REFERENCE
Xu, X. and J.M. Regenstein. 1986. Preventing Textural Changes in FrozenGadoid MInces with Corn Starch. Appendix 1 of Regenstein, J.M. andC.E. Regenstein. 1986. Using Frozen Minced Fish. InternationalSymposium on Engineered Seafoods Including Surimi. Seatttle, WA., p.74-83.
293

THE BENEFITS OF CARRAGEENAN AS A SEAFOOD PROCESSING AID
CHARLES W. BULLENS, JAMES J. MODLISZEWSKI, AND JAMES J. NAVARROMarine Colloids Division of FMC Corporation2000 Market Street, Philadelphia, PA 19103
INTRODUCTION
Carrageenan is a natural chondrus seaweed extract classified as GRAS�1 CFR - 182.7255! in accordance with FDA regulations. Applicationsusing specially formulated carrageenan have been developed to enhancethe quality of processed seafood. Seafood analogues, from surimi,benefit from using carrageenan as a binder which also serves tocustomize texture and provide freeze/thaw stability. Thawed raw shrimpcan be returned to their natural moisture level by infecting a brinesolution containing carrageenan which then entraps moisture normallylost during cooking thereby enhancing sensory benefits.
RESULTS AND DISCUSSION
Seafood anglo ues
Seafood analogues are an ever increasing new application which usessurimi washed, minced fish! as the main food matrix component.Diverse products, such as fabricated shrimp, lobster and crab legs havefound great acceptance by the consumer today.
Transportation of finished products is in the cooked, frozen state.Problems occur upon thawing due to ice crystal formation which dehy-drates and denatures the protein matrix structure resulting in exces-sive moisture loss and poor taste.
Additional problems occur due to utilization of inferior quality surimiwhich contains enzymatically denatured protein with poor binding/strength characteristics. Using carrageenan based systems help improvetextural qualities providing increased firmness, better shape retentionafter cooking and improved storage stability of the seafood analogue.
Carrageenan's unique property of complexing with proteins helps producebetter textured, more organoleptically acceptable products. In addi-tion, carrageenan's ability to entrap moisture in a gel matrix helps tocontrol the detrimental effect of ice crystal formation during frozenstorage.
294

An experimental seafood analogue formula using karine Colloidscarrageenan-based stabilizer is displayed in Table 1.
Table l. Experimental Seafood Analogue Formula
CONCENTRATION X!INGREDIENTS
50.0-60.00Surimi
Optional ingredients: Proteins, humectants, colorants
The ex erimental rocedure for re aria the seafood anglo ue is
described below:
l. Add pre-weighed frozen -20 C! surimi to a vacuum cutter/mixer and
process until a paste is formed.
2. Add ice water and continue to mix until uniform*.
3. Add dry ingredients except the NaC1 and mix.
4. When uniform, add NaC1 last and mix until product reaches a consis-
tent paste texture dough-like!.
5. Deaerate mixture and carefully fill into casings ~ 25 mm.!.
6. Seal ends, taking care to remove any trapped air.
7. Place filled casings into a water bath of ~ 85'C for 40 minutes.
8. After cooking, cool with a tap water spray and then refrigerate
overnight ~ 4'C!.
9. Product can then be evaluated for textural and organoleptic proper-
ties.
+ Note: Process temperature should be controlled to below 10'C
preferrably 5'C!.
295
Carrageenan-based StabilizerPotato starch
NaCLFlavors, PreservativesMater Ice!
0.2-1.0
4 ' 0-8.0
2.0
q.s.
to LOOK

Processed Shrim
Raw shrimp go through a freeze/thaw cycle before processing whichresults in drip loss and changes in texture. Unaided processing of theshrimp results in additional moisture loss during cooking and coolingas well as additional texture changes reducing the organoleptic accept-ability of the product.
In]ecting a brine solution containing carrageenan into the shrimp afterthe raw product is thawed aids the shrimp in maintaining its naturalmoisture content. As the shrimp cooks and cools, carrageenan forms aunique matrix which prevents additional moisture loss. The yielddepends upon the amount of brine injected and the size of the shrimp.Yield increases of 20 percent have been achieved in experimental trialsusing carrageenan solutions.
Carrageenan also serves to improve the texture and organoleptic appealof the shrimp due to its moisture retentive properties.
Figure 1 illustrates how Gelcarin. SA 911 carrageenan functions duringthe injection, cooking, and cooling process.
Figure l. How Gelcarine SA 911 Works
100-
Solution 60-IThickness
RelativePercentage!
30-I
30 60 90 120 140 150 170 150 120 90 60 30
Brine Temperature in the shrimp 'F
296

A Gelcarine SA 911 particles disperse in brine and are injected inshrimp
8 Gelcaria SA 911 particles absorb moistureC Gelcarin SA 911 particles begin to unravelD Gelcarin SA 911 starts forming network entrapping moistureE Gelcaria SA 911 gell network controls purge aad maintains yieldThe formula for preparing a brine solution containing carrageeaaa forinjection is displayed in Table 2.
Table 2. Brine Formula For Injecting Shrimp toReplace Ten Percent Moisture Loss
CONCENTRATION X!INGREDIENTS
Gelcarine SA 911 carrageeaanSodium chloride
Water
Ice
3.2
1.569.8
25.5
100.0Total
Note: Ten pounds of the above formulation would be injected into 100pounds of shrimp resultiag ia a finished weight of 110 pounds.
1. Dissolve the sodium chloride in the water and add ice. Solutiontemperature should be maintained below 5'C.
2. Agitate the brine and disperse Gelcarin SA 911.
3. Maintain brine containing carrageenan at a temperature below 5'Cwith agitation during injection.
Additional trials are recommeaded to customize aad optimize theexperimental formulas and procedures.
Marine Colloids and Gelcarin � FMC trademarks
O 1987 FMC Corporation
297
The procedure for preparing a brine solution containing carrageenan isdescribed below.

iFZELNICAL PROPERTIES OF FISH GELS l"1ADE FROM NIXED SPECIES thtITHOUTADDED SODOM CHLORIDE
K. Vareltzisp E.Yi. Buck, and H.O. HultinDept. of Food Science and Rutrition, University of Massachusetts
Amherst, iiA 01003
INTRODUCTION
There has been much interest, in recent years, in the traditiona1Japanese process of making fish eels and as a result, a significantindustry has developed, and is continuing to develop, relative to theproduction of surimi and various seafood analogs.
One of the unique properties of fish protein is its ability toform highly elastic gels. It has generally been thought that 2.5 to 37sodium chloride must be added to the minced fish prior to gel formationin order to attain the desired elasticity. Ve have recently found andreported however, that it is possible to produce excellent protein galsfrom certain fish proteins without added sodium chloride. Thenutritional advantages of such a process are obvious.
In this study we investigated the affect on gel quality of addinga species previously demonstrated to produce good gels in the absenceof sodium chloride, namely red hake ~Uro h cis ~chose, ro a specieswhich did not possess this property to the same extent, winter flounder
NATKRIALS AND i"imiHODS
Red hake and winter flounder were purchased from day boatsoperating out of Gloucester, Massachusetts during the period Octoberthrough December, 1986. The whole fish were transported on ice to theUniversity of Massachusetts at Amherst where they were hand skinned andfilleted on the same day, then held on ice overnight.
The boneless fillets were ground through the 1/4" plate of a tablegrinder. iiixing of species was done immediately after grinding byvigorously mixing by hand for 1 min. In those cases where a slurry wasused, the appropriate amount of red hake was blended with 100 ml nfdistilled water for 1 min. The slurry obtained was then added to theflounder mince which was already being mixed in the bowl of a Hobartmixer set on high. Mixing was continued for 1 min. An equivalentamount of distilled water was mixed into red hake and flounder controlsprior to further processing. Washing was accomplished by placing one
298

volume of minced fish in an aluminum container with three volumes oficed distilled water. The washing process was repeated two more times.The third wash contained 0.15K iVaCl to facilitate de-watering.
De-watering was accomplished by placing the cheese cloth wrappedmince on the bed of a hydraulic press and applying pressure graduallyover the next 2 min, until the gauge read 15,000 psi. lt was then heldat that pressure for an additional 15 min.
The de-watered mince was removed from the presa and made into gelsfollowing a 2 hr chill period at 2 C. Cryoprotectants were not addedsince no storage was involved.
Gel Production
Gels were made in 220g batches using a Cuisinart Food Processorfor chopping. The well-chilled mince was placed in the bowl of thefood processor which had been previously chilled to -25 C. It waschopped at high speed for 2 min. This procedure ensured that thetemperature of the fish paste was kept below 15 C at all times. Nosodium chloride was added to any of the gels in this process.
The resulting pastes were immediately transferred to a handsausage stuffer and stuffed into nylon cylinders �.1 cm x 13 cm!. Theends were stoppered with cork and the cylinders were immersed firstinto a 40 C water bath for 30 min. and then into a 90 C water batn for20 min. The cylinders were removed from the second water bath andcooled by placing in a mixture of ice and water for 20 min.
The mechanical properties of the gels were determined by threedifferent procedures.
Fold-Test. This procedure involved folding a 3 mm thick by 2.1 cmdiameter slice of gel first in half and then into quarters, if possible Kudo et al. 1973!. A score of 5 AA grade! was awarded to a gel slicethat could be folded into quarters without cracking at the fold lines.iso cracks on folding in half was equal to a 4 A grade!. Some crackingwhen folded in half was equal to a 3 B grade!. Breaking in half whenfolded in half was equal to a 2 C grade! and breaking of the sliceinto fragments from finger pressure was equal to a 1 D grade!. Valuesreported are the average of four slices per ~el.
Warner-Bratzler Shear. A Warner-Bratzler Shear Model 2000!equipped with a dial calibrated in 0.02 lb. increments to 10 lbs. wasused to shear gel cylinders perpendicular to their long axes. Valuesreported are the average of five measurements per sample.
Instron. Duplicate specimens, 1.5 cm in length by 2.1 cm indiameter were cut from each gel perpendicular to the long axis of thecylinder and tested on an Instron Universal Testing Machine Model TM!.
299

RESULTS AIG! DISCUSSION
The first experiment was conducted to determine the effect on gelproperties of mixing species, and the effect, if any, of holding mixedminces before washing. The effect of mixing species after separatewashings was also investigated.
The pH and percent moisture contents of the initial minces used inexperiment 1 are shown in Table l. All values are in expected rangesand are typical of those recorded for the other experiments. In theinterest of saving space, these values will not be reported again. Itshould be noted that the moisture content of the mince from mixedspecies shows an additive effect.
TABLE 1. pH AND PERCENT MOISTURE CONGAS OFINITIAL NINCES. EXPERIIKVZ 1.
%%d
MoistureTreatments
Red Hake 7.05 84.6Flounder 1 6.83 78.1Fl+RH25� min.! ' 6.79 80.2
1. Nixture of 75%%d flounder and 25%%d red hakemince held 0 time after mixing and beforewashing.
In subsequent experiments, only the moisture, fold test, andpercent deformation values will be reported since they are the mostsignificant, however, in Table 2 all mechanical properties measured areshown.
Flounder gels were approximately twice as hard or rigid as redhake gels as measured by shear force or Instron deformation values.Rigidity of mixed gels appears to be greater than that which can be
300
The deformability modulus, which is a measure of the resistance of thegel to deformation, or hardness, was .calculated by methods described byJohnson et al. �980!. The deformation recovery was also determinedfrom a compression-decompression cycle using a deformation rate of 1cm/min. in both directions. The gels were subjected to 60%%d deformationsince beyond this level specimens fractured. The recovery is expressedas a ratio between recovered and total deformation multiplied by onehundred.

accounted for from additive effects alone. The greatest effect wasachieved by mixing minces and holding for 30 min. prior to washing.
Measures of elasticity fold test and Instron percent recovery!also do not show simple additive effects, however, in this case resultsare skewed towards the characteristics of the red hake.
Best results for elasticity were obtained by washing mincesimmediately after mixing no holding! or mixing species after separatewashings.
TABLE 2. PERCEiVT NOISTURE AIR bKCHAÃICAL PROPERTIES OFGELS-~Iffy 1. 25Ã RED HAKE .
Lbs. FoldX Shear Defor- Test
Treatments Vioisture Force mation Score Recover
1. PV post-wash! indicates species were mixed after each wasseparately washed and dewatered, rather thanbefore.
Our original hypothesis was that perhaps an enzyme catalyzedreaction was involved in the ability of the fish proteins to form goodgels in the absence of iVaCl. The data shown from Experiment 1 areconsistent with this hypothesis.
In our next experiment we examined the effect of adding smalleramounts of red hake, and the effect of holding mixed minces for varioustimes before washing, since if an enzyme was involved, one would expectto see a change with time of holding. The results are shown inTable 3.
Holding time apparently affected moisture content as evidenced bythe decrease with time. As might be expected, fold test scores alsodecreased with time. Although fold test scores did not reach those ofthe red hake control, both 0 and 30 min. holding produced scores betterthan that of flounder alone.
301
Red Hake 80.8Flounder 74.0Fl+RH25� min.! 76.3Fl+RH �' min.! 75.3Fl+RH>>PW � min.! 75.5
1.243.28
2.77
3.052.44
11.8
29.0
20.524.8
22.5
4.0 6o.32.0 50.04.0 70.33.5 58.9
4.0 68.5

Five percent added red hake decreased the hardness of the mixedspecies gel at 0 time, however, hardness is apparently restored withholding.
As the concentration of red hake added to the mixture is reduced,mixing becomes a very critical process. This is particularly truesince much of the enzymic activity in red hake muscle has beendemonstrated to be associated with particulate fractions. Thus, insubsequent experiments the slurry procedure, described earlier, wasused to facilitate distribution.
TABLE 3. HECRUGCAL PROPERTIES OF GELS CONTAIiJIi<G
SX RED HAKE - EXPERIJKVZ 2.Fold
Test
Score DeformatinnlioistureTreatments
In our next experiment we investigated the effects of using evensmaller amounts of red hake, specifically, 5, 2, or 1X, without anyholding period after mixing and before washing. The results are shownin Table 4.
The I moisture content of gels was significantly increased at alllevels of added red hake as was fold test score. The elasticity asmeasured by the fold test score was superior at the 5X level ofaddition. It should be noted that at the 5X level � time! slurrymixing produced a superior gel �.5! as compared to hand mixing �.0,Table 3!.
302
Red Hake
Flounder
Fl+RH5 O min.!Fl+RH5�0 min,!Fl+RH5�0 min.!
78.5
76.176.273.569.9
4.0
2.5
3.0
2.8
2.5
11.8
29.020.5
24.8
22.5
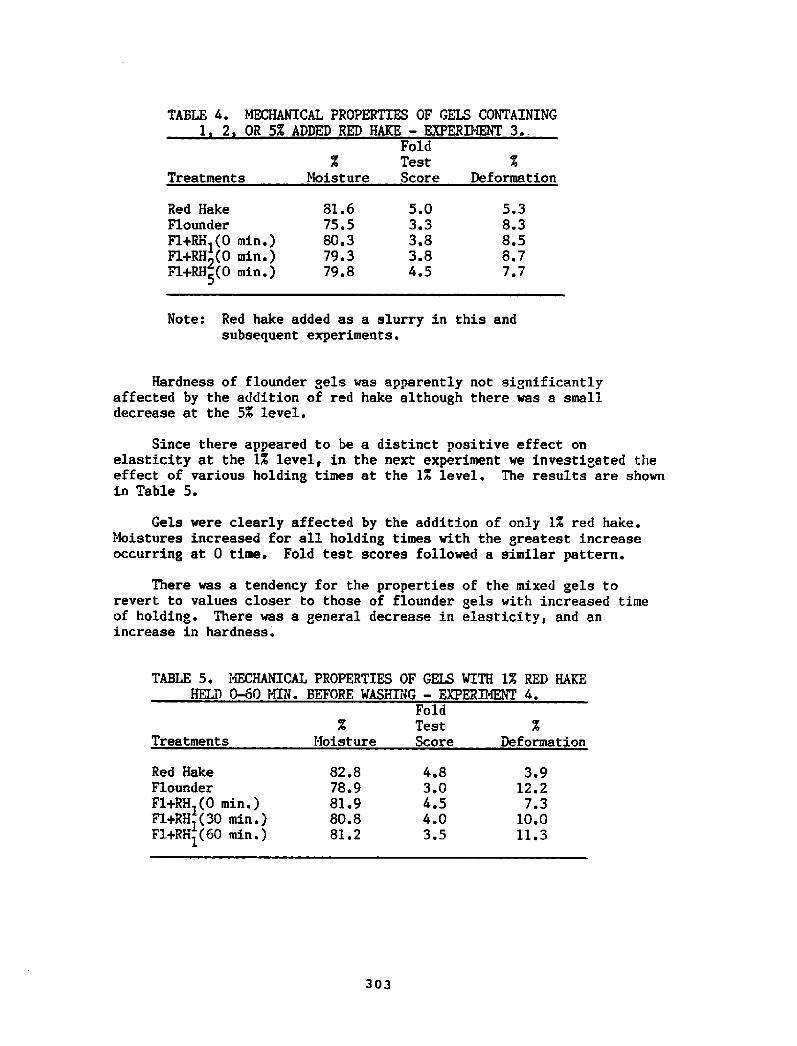
TABLE 4. MECHANICAL PROPERTIES OF GELS CONTAINING1 2 OR 5X ADDED RED HAKE � EXPERXHENT 3..
Fold
Test
Score Deformation
XMoistureTreatments
5.3
8.3
8.5
8.77.7
Note: Red hake added as a slurry in this andsubsequent experiments.
Hardness of flounder gels was apparently not significantlyaffected by the addition of red hake although there was a smalldecrease at the 57 level.
Since there appeared to be a distinct positive effect onelasticity at the 1X level, in the next experiment we investigated theeffect of various holding times at the 1X level. The results are shownin Table 5.
Gels were clearly affected by the addition of only 1X red hake.Noistures increased for all holding times with the greatest increaseoccurring at 0 time. Fold test scores followed a similar pattern.
There was a tendency for the properties of the mixed gels torevert to values closer to those of flounder gels with increased timeof holding. There was a general decrease in elasticity, and anincrease in hardness.
TABLE 5. iKCHQiICAL PROPERTIES OF GELS WlTH 1X RED HAKEHELD 0-60 MIN. BEFORF, WASHING � EXPERli"EiT 4.
Fold
x Test XtIoisture Score DeformationTreatments
303
Red Hake
Flounder
Fl+RH1� min.!Fl+RH2� min.!Fl+RH5� min.!
Red Hake
Flounder
Fl+RH1� min.!rl+RH>�0 min.!Fl+RH1�0 min.!
81 ' 6
75.5
80.3
79.379.8
82.8
78.9
81.9
80.8
81.2
5.0
3.3
3.83 ' 8
4.5
4.83.04.54.03.5
3.912.2
7.3
10.0
11.3

These results suggest that if what we are seeing is an enzymiceffect, then it occurs relatively quickly since major changes are seenat 0 time.
Finally, in our last experiment we investigated the effect ofholding a mince made-up of red hake only, for 0-60 min. beforeprocessing,
As may be seen in Table 6, moisture contents and fold test scoresdid not change significantly with holding, although there was someincrease in hardness. This suggests that the results obtained in theforegoing experiments were due to an interaction of the red hake withthat of the flounder.
TABLE 6. FKCHANICAL PROPERTIES OF RED HAKE GELSHADE FRY HIVE CES HELD 0-60 IG:N. BEFORE WASHING
EXPERIMENT 5.FoldTest
Hoisture Score DeformationTreatments
Red Hake � min.! 82.8 5.0 3.2Red Hake �0 min.! 82.9 4.8 3.9Red Hake �0 min.! 82.3 4.8 3.8
It has been previously reported that good fish gels could beformed in the absence of salt if the muscle tissue was first washed
Hennigar et al. 1987!. This phenomenon was found to be speciesdependent, with red hake yielding the best eels, scoring 5 on the foldtest scale. Also, the ability to form these gels was not related tothe amount of contractile protein present.
The data reported here demonstrate that a small amount of red haketissue can significantly modify the properties of gels made fromflounder without added salt. It is suggested that something other thanthe red hake protein itself is causing this effect.
304
The ability of red hake to form good gels in the absence of saltmay be related to its ability to decompose Zi"IAO to DiIA and FA, sincered hake has a very active system for TiIAO breakdown. It lies beenreported that there is more than enough enzyme activity in red hakemuscle to accomplish desired results Parkin and Hultin, 1982! and thiswas evidenced by the small amount of muscle used in this study. In

practical terms then, efficiency of mixing may be at least as importantas the amount of muscle used.
In summary, small amounts of red hake tissue can significantlymodify the properties of gels produced without salt from floundermuscle. Generally, there is a greater effect on elastic properties ofthe gel than on hardness. Differences in hardness observed srrggestthat the properties of fish protein gels may be selectively modified,perhaps to give a wider range of physical properties than is nowavailable. And finally, it would be expected that the phenomenonreported here would also occur in the presence of salt.
REFERENCES
1. Hennigar, C. J., Buck, E. 1f., Hultin, H. 0., Peleg, Yr., andVareltzis, K. 1987. The Effect of Washing and Sodium Chloride onthe Mechanical Properties of Fish and Beef Nuscle Gels. Submittedto J. Food Sci.!
2. Johnson, E. A., Segars, R. A., Kapsalis, J. G., Normand, N. D., andPeleg, H. 1980. Evaluation of the compressive deformabilitymodulus of fresh and cooked fish flesh. J. Food Sci. 45: 1318.
3. Kudo, G., Okada, N., and iiliyauchi, D. 1973. Gel-forming capacityof washed and unwashed flesh of some Pacific coast species of fish.radar. Fish. Rev. 35: 10.
4. Parkin, K. L., and Hultin, H. 0. 1982. Fish muscle rnicrosornescatalyze the conversion of trirnethylarnine oxide to dimethylamineand formaldehyde. FEBS Lett. 139: 61-64.
305

%AT IOIkL MAR I IE F ISHER I ES SERVICESALTOXSTALL-KEHEDY S-K! FUND IIG:
TECHIICAL PEER REVIEW OF RATIONAL PRIORITY PROPOSALS
Paul ComarRational Marine Fisheries Service, SOAA,National Seafood Inspection Laboratory,
P. O. Drawer 1207, Pascagoula, NS 39568-1287
IITRODUCTIOlf
The Saltoastall-Kennedy S-K! kct mAes available to the Secretaryof Commerce up to 38 percent of the gross receipts collected under thecustoms laws from duties oa fishery products. The Secretary must use aportion of these funds each year to mike available grants to assistpersoas in carrying out research and development projects which addressaspects of Uaited States fisheries, including, but not limited to,harvestiag, processing, aad associated infrastructures. This includesboth the camaercial and recreatioaal sectors of U.S. fisheries. For FY87, 47.4 million was appropriated for the S-K program. ApproximatelyN59,008 was committed to fund the second aad third years of previouslyapproved multi-year projects, and about 4758,008 was placed in theFisheries Promotioaal Fund established by the Fish aad Seafood Promotionkct of 1986. Therefore, about $6,1 million was used to fund newfisheries research aad development projects.
The Rational Marine Fisheries Service RIFS! identifies fisheriesfuadiag priorities in consultation with a wide cross section of the U.S.fishiag industry. Priorities are identified on a regioaal basisaccording to specific fisheries. These fuading priorities are listed byregion annually in the Federal Register with a deadline for submission ofproposals to address the needs. Priorities which cross regionalfisheries bounds or include all fisheries or regions are listed asnatioaal priorities. One portion of the entire proposal review,evaluation aad approval proces is the technical peer review, which iscoordinated through the various Regional Offices. This paper describesthe process of the technical peer review for those proposals within thenational priorities designation,
METHOD
Over the past three years an average of 43 proposals have beenbmitted annually addressing national priorities as listed in the
Federal Register. These proposals are received, checked forcompleteness and grouped under major headings by the S-K office iaVashingtoa, DC. The proposals are then sent to the WAIFS, XationalSeafood Inspection Laboratory ISIL! in Pascagoula, XS which coordinatesthe technical peer review.
kfter receipt and review of the proposals at I'SIL, a list ofcompetent reviewers for each proposal is assembled. Through its conduct
306

of the technical peer review over the past several years, the IISIL hascompiled a list of qualified aad committed reviewers who can assess thetechnical merits of individual proyosals. Because funding priorities aremodified somewhat in the annual Federal Register solicitation, newreviewers are added and some experienced S-K reviewers may aot be askedto participate as necessary to address current year priorities. Usuallythree to five reviewers are selected aad asked to review each proposal.The proyosals are reviewed for technical merit by %IFS staff members fromthe Vashington Office of Trade aad Industry Services; National SeafoodInspection Laboratory, Pascagoula, IS; Resource Utilization Laboratoriesia Gloucester, Mk; Charleston, SC; and Seattle, VA. Additional reviewersexperienced ia the field of each proyosal are scientists andprofessionals associated with other Federal agencies, universities andother qualified groups. During the 1987 S-K process, there were 76reviewers who participated in the national yriorities technical yeerreview. Gare is taken to ensure no conflict of iaterest by those takingpart in the review.
As detailed in the Federal Register solicitation, the proyosals areevaluated under five general criteria:
1! Babism descriptioa and conceptual approach to resolve it;2! Souadness of project design/technical apyroach;3! Project management; experience/qualificatioas of personnel;4! Project monitoring aa'd evaluation; aad5! Project cost.
A standardized resyoase/scoresheet is completed by each reviewer on eachyroposal. Reviewers provide responses to specific questions and theascore the proposal up to a set maximum point value in each of the fivecriteria. The response/scoresheets are returned to the BASIL - nearly2M in the 1987 S-K process.
The BASIL preyares a synopsis of each reviewer's comments along withthe reviewer's techaical score total for each yroyosal, A comprehensivebriefing book is yrepared, assembled and printed by the XS!L whichincludes among its various sections these synoyses and a further singlestatemeat oa the technical merit each of proyosal synthesized fromthe reviewer comments.
,Bach regional review office conducts its owa technical review ofyroyosals submitted for fuadiag under the Federal Register listiag ofregional priorities. Vhat has just been described is the process used toconduct the yeer review of yroposals which address national priorities.The followiag comments in this section are added to complete the pictureon the final decision making process on actual funding of proposals.
After the technical evaluation, each reviewing office solicitscomments from the fishing industry, consumer representatives, andothers, as appropriate, to rank the yrojects filed with the office.
307

This review is carried out by correspondence or by formal meetings ofindustry representatives. The reviewers rank each project in terms ofimportance or need for funding and provide recommendations on the levelof funding XNFS should award to each project and the merits and benefitsof funding each project. The recommendations are submitted to theAssistant Administrator for Fisheries, who determines the number ofprojects to be funded based on the recommendations provided, consistencyof projects with the identified fisheries objectives, and the amount offunds available for the program. The Department of Commerce reviews allrecommended projects and funding before final authority is given toproceed on the project.
DISCUSSIOX
Through the Saltonstall-Kennedy Act, the %PS is able to fundproposals to develop, support, and benefit the U.S. fishing industry,Several million dollars is available to projects which address theestablished needs and priorities of the industry. The entire S-K reviewprocess helps ensure funding of the very best proposals of high technicalmerit and importance to the industry. The S-K program as a whole can beonly as good as the technical review of proposals by qualifiedprofessionals in the various priority areas. The technical review fornational priority proposals as outlined in this paper is conducted toensure that the cream rises to the top.
It would be most difficult at a panel meeting to review and digestthe many response/scoresheets generated � again nearly 280 from the198'7 national priority proposals. The briefing book of reviewercomments, scores and recommendations prepared by ISIL is used to describethe technical merits of proposals to an industry review panel. Through .the cooperation of ISIL with the %PS Vashington Office of Trade andIndustry Services, a solid review package is assembled and presented tothe industry panel so that it can make infonaed funding recommendationsto the agency.
REFHREICES
1. Federal Register. Part VII. Department of Commerce, Vol. 52, Ro.186. pp. 28962-2N72. June 3, 1987,
308

guality Changes Occurring in Hybrid Striped Bass Skinless Filletsand in Headed and Gutted Hybrids During Iced Storage
Nichael Jahncke, Malcolm B. Hale and Janet A. GoochNational Narine Fisheries Ser vice
P.O. Box 12607Charleston, SC 29412
INTRODUCTION
The pond culture of hybrid striped bass has great potential inSouth Carolina. Personnel at the South Carolina Marine ResourcesDivision have been able to produce, under intensive management, approxi-mately 7400 pounds of hybrids per acre in 18 months personal communi-cation, T.S. Smith, 1987!. Little information, however, is available onthe sensory characteristics of hybrid striped bass. This information isnecessary if hybrids are to be successfully marketed in the UnitedStates.
The objectives of this research were to determine the 1! sensorycharacteristics, and 2! to monitor the changes in sensory charac-teristics, TBA values and total aerobic plate counts of iced hybridstriped bass skinless fillets and iced headed and gutted HIG! hybrids.
MATERIALS AND METHODS
Collection of Sa lese s use 1n this study were cultured in ponds at the Waddell
Hariculture Center near Bluffton, S.C. The fish averaged 36.0 cm infork length FL! and 765 g in weight. The fish, which were immediatelyiced after harvesting, were processed commercially and transported tothe National Marine Fisheries Service Laboratory in Charleston, S.C.
Stora e of Sam lessi xty y r ass were divided into two treatments and prepared as
skinless fillets or headed and gutted fish H8G!. The skinless filletswere rinsed with clean water, placed on styrofoam trays and over wrappedwith saran. These trays were then covered with ice, placed in drainagetrays, and stored in a refrigerator. The headed and gutted fish wererinsed, placed in an insulated chest, from which melt water was allowedto drain, covered with ice and stored in a refrigerator. Samples wererandomly selected and evaluated beginning at one day of iced storage.
P were trained, using several species of fresh marinefish as standards, according to the flavor and texture profile method ofKapsalis and Hailer �980!. An unstructured 15 cm line scale, however,was used instead of a 0-7 category scale, since an unstructured scalegenerates data which can be analyzed by standard statistical methodswhich assume a normal distribution.
309

Place a vertical mark across the horizontal 11ne according to your judgeamntas to the intensfty of the attribute. Hark only the attr1butes you detect.
AbsentTOj
.Strong
TFI Absent Strong
AbsentSueetness
Strong
Strong
StrongEarthy
StrongAbsentRancfdfty
Cents:
Table 1. Flavor Profile Score Sheet
Color
N te
Soft
Flakiness
Very FlakySl ght
Chariness
Very ChewySl ght
Fibrous
Very FibrousSl ght
Itof stness
Very HofstSl ght
Cents t
Table 2. Texture Profile Score Sheet
310
Place a vertfcal mark across the horizontal 11ne according to your Judgementas to the 1ntensity of the attribute, Your eoments are encouraged.

nl on
.The fnftfal or early total impact ofador.
Total Odor Intensft TOI ..
.The fnftfal or early total impactof flavors.
Total Flavor lntensft TFI .
The basic taste sensation of whfch thetaste of sucrose fs typical.
Snaetnass..
.The taste sensation produced by acids.The taste of vfnegar or lexon are typf-cal examples.
Sourness. .
~Earth e ~ .The flavor associated wfth slfghtlyundercooked bo1 led potato, soil, ormuddy fish.
~Rants ds t The flavor assocfated with strong, oxi-df zed rank, acrid flavor.
~hatt -hrtn......... A combination af the taste sensatfansof sodfum chlor1de and the other saltcompounds faund fn ocean water.
Sh liras hs The flavor assocfated w1th any cookedshellfish, such as labster, clam, crab,ate eral l nn
Table 3. Definitions of Sensory Terms for The Flavor of Fish
ure e n on
Col or n ~ ~ ~ ~ ~ ~ ~ ~ . The perceived degree of darkness of theflesh, 1gnorfng any concentrated dark
. lateral lines.
Hardness ~ ~ a ~ e ~ ~ ~ ~ ~ .The percefved farce required tocampress the sample using the malarteeth.
Flakiness......... . The perceived degree of separatfon ofthe sample 1nto individual flakes whenmanipulated wfth the tongue against thepalate.
Olewfn'ass ~ ~ 4 ~ ~ ~ ~ ~ ~ . The total perceived effort required toprepare the sample to a state ready forswallowing.
Ff brausness. ~ . ~ ~ . . The perce1ved degree number x sfze! off1bers evident during mastication.
~ ~fest st ness. . The perceived degree of ofl and/orwater fn the sample during chewing.
Table 4. Definitions of Sensory Terms for the Texture of Fish

Individual fillets n-3 fillets/treatment! were randomly placedinto boil-in bags with drainage pockets, and cooked to an internal tem-perature of 70'C. A six member trained sensory panel determined theflavor and texture profiles of the fillets. The score sheets are shownin Table 1 and 2, and the description of the sensory terms is presentedin Table 3 and 4.
upi i cate, on homogeni zed cookedfillet samples, by the method of Woyewoda et al., �986!.
determined on the same day that sensory andTBA analyses were performed..The microbiological analysis consisted oftotal aerobic plate counts TAPC!. Fifty gram samples in triplicate!,were aseptically removed from three raw skinless fillets and three rawH86 fish. These samples were serially diluted and plated on standardplate count agar. The plates were incubated at 20'C for 48 hours AOAC,1985!.
Statistical Evaluation
Statistical Analysis System SAS Institute Inc., Cary, NC! was usedto do a two way analysis of variance on the results. Fisher's LSD Testwas used to further evaluate the samples whenever the F test was foundto be significant.
RESULTS AND DISCUSSION
Table 5 shows the proximate composition of raw and cooked hybridstriped bass fillets.
Table 5. Proximate Compositions weight percent of tissue sample!of Raw and Cooked Hybrid Fillets
Moisture
Raw Cooked
75.93 72.45
AshProtein at
Raw Cooked
1.07 1.11
Raw CookedRaw Cooked
19.38 21.40 2.56 2.76
312
e and ash of the raw and cooked fillets were deter-mined in duplicate by standard AOAC �985! procedures. Lipid was deter-mined in duplicate by a chloroform-methanol extraction method Smith etal., 1964!.

I H I 5
o a 2 i S S ieOivs Ql ICK
Figure 1. Total odor intensity score f' or cooked fillets prepared fromiced skinless fillets or iced headed and gutted fish.
eP H
5 s
I
5C
4 I I 2 4 4 I IO I2 I 4OATS QI ICE
Figure 2. Total flavor intensity scores for cooked fillets preparedfrom iced skinless fillets and iced headed and guttedfish.
313

The sensory results fndicated that initially the fillets had a mildtotal odor intensity TOI! Figure 1! and total flavor intensity TFI! F1gure 2! with moderate sweetness Tables 6 and 7!. The fillets hadno shellfish flavor. The dark flesh did, however, have a slight earthyflavor Tables 6 and 7!. The texture scores indicated that the filletswere moderately flaky, slightly fibrous, moist, soft and easy to chew Tables 6 and 7!.
Iced storage had no significant effect on any texture scores Tables 6 and 7! P > 0.05!. Iced storage d1d, however, have an effecton flavor profiles Ffgures 1, 2, and 3, Tables 6 and 7!, TBA values Figure 4! and total aerobic plate counts Figure 5!.
Figure 1 ind1cates that, at 6-7 days of iced storage, TOI scoresincreased signiffcantly in cooked f11lets prepared from iced skinlessf1llets and in cooked fillets prepared from HAG f1sh P < 0.05!. At 9days of iced storage, TOI scores for cooked fillets prepared from icedskinless fillets were significantly higher than TOI scores of cookedfillets prepared from HAG f1sh P < 0.05!. Figure 2 shows that TFIscores increased significantly at 5 and 13 days of iced storage forcooked f11lets prepared from iced skinless fillets and for cookedfillets prepared from iced H8G fish respectively P < 0.05!. Inaddition, at 5 days of iced storage, cooked fillets prepared from icedsk1nless fillets had significantly higher TFI scores than cooked filletsprepared from H8G fish P < 0.05!.
These higher odor and flavor intensity scores were primarily due toa combination of bacterial growth Figure 5! and rancidity development Figures 3 and 4!. The TAPC for raw skinless fillets and raw HSG fish1ncreased throughout iced storage Figure 5!. The bacterial counts onthe skinless fillets were always higher than the HAG fish, as additionalprocessing and larger cut surface area may have provided a better taediumwith more surface for growth.
Figure 3 indicates that at 7 days of iced storage, the sensorypanel noted a significant increase in rancidity of cooked fillets pre-pared from iced skinless fillets P < 0.05!. In contrast, there was agradual but not sign1ficant increase in rancidity scores of cookedfillets prepared from HAG fish P > 0.05!. Similarly, at 6 days of' icedstorage, TBA values were s1gnificantly higher in cooked fillets preparedfrom skinless fillets P < 0.05!, but not for cooked fillets preparedfrom HSG fish P > 0.05! Figure 4!.
In addition, after five days of iced storage, sweetness scores haddecreased significantly for cooked fi'tlets prepared from iced skinlessfillets Table 6! P < 0.05!. Sweetness scores in cooked fillets pre-pared from HAG fish also decreased, but not significantly Table 7! P > 0.05!. Earthiness scores, on the other hand, increased graduallybut not significantly duri ng iced storage P > 0.05!. Earthiness scores
314

Table 6. Flavor and Texture Profile of Cooked Fillets Prepared fromIced Skinless Fi'tlets Mean + S.D.; 15 cm Descriptive Scale!
ays on Ice
Flavor Profile
Sweetness
Sourness
Earthy
Sa 1 ty-b ri ny
Shel 1 f i sh
Texture Profile
Color
Hardness
Flakiness
Chewiness
Fi brousness
Moistness
3.3+1.7ab I 6pl 2b 2.0+1.9b
1.3+1.2a
I 6+I 8b
2.4+1.3'
2.3+F 8
1.5+0.8
0.0+0.0
3.7+1.6a
0.4+0.4 0.7+0.4
1.5+1.5 1.8+1.2
1.8+0.7 1.6+I.I
0.0+0.0 0.0+0.0
2.1+1.5 1.8+2.0
1.5+0.7 1.8+1.2
0.0+0.0 0.0+0.0
6.5+1.1 5.8+0.9
4.6+2.1 4.9+1.2
5.6+1.8 4.7+2.8
3.4+1.6 5.8+2.0
3.0+1.3 4.1+0.9
9.0+1.2 8.0+2.3
5. 3+1. 0 5. 8+1. 0
3.1+1.3 3.8+1.8
3.7+1.4 4.5+1.3
3.5+1.3 3.8+1.7
3.3+1.3 3.1+0.7
5.6+1.0
3.8+1.5
4.2+1.4
3.0+1.3
2.8+1.0
8. 0+1. 48. 0+2. 4 8. I+1. 9
315
Means within the same row with the same superscripts are not statisti-cally different P > 0.05!.

Table 7. Flavor and Texture Profile of Cooked Fillets Prepared fromIced H8G Fish Mean + S.D.; 15 cm Descriptive Scale!
ays on ce
13
Flavor Profile
Sweetness 2.5+1.2 2.1+1.6ab
1.4+0.7a 2.2+1.5aSourness 0. 5+1.1 0.7+0.6
Ea rthy 1. 4+1. 5 1. 3+1. 3
Salty-briny 1. 5+1.3 1. 5+1.1
Shel l f ish 0.0+0.0 0.0+0.0
Texture Profile
0.8+1.0
Fi brous ness 3.4+1. 7 4. 0+0. 9
7. 3+2. I B. I+1. 7 7. 8+2. 3Moi stness 7.6+2.08.3+2.2 7.6+1.8
Means within the same row with the same superscripts are not statisti-cally different P > 0.05!.
316
Color
Hardness
Flakiness
Chewiness
5.9+1.0 5.1+0.9
4.6+2.0 4.2+0.7
5.9+I.l 5.0+1.0
3.0+1.1 4.5+1.6
2.3+1.3 b 1.6+1.1 2.0+0.9 b 1.4+1.2
l. 6+1. 9 I. 6+1. 3 1. 8+I. 4 2. 5+2. 0
l. 5+1. 0 1.8+1. I l. 2+0.8 1. 4+I. I
0.0+0.0 0.0+0.0 0.0+0.0 0.0+0.0
4.8+0.7 5.4+1.1 4.9+1.5 5.6+1.1
3. 4+1. 0 3. 9+0. 9 4. 7+1. 5 3. 9+1. 8
4. 7+2. 3 4.8+3. I 5. I+I. 2 5. 5+2.2
3. 6+1.6 3.8+I. 4 4. I+0. 4 3. 9+1. I
2.9+1.0 2.9+2.1 2.9+0.9 3.3+0.7
4 4 2 4 4 4 ld t2DAYS OH ICK
Figure 3. Rancidity sensory scores for cooked fillets prepared fromi ced skinless fillets and iced headed and gutted fish
e2
E
I n RI
a r 2 4 4 4 I 1 l 2 l 4DAYS 04 ICE
Figul e 4 ~ TSA values for cooked fillets prepared from iced skinlessfillets and iced headed and gutted fish.
317

of cooked fillets prepared from skinless fillets were also higher, butnot s1gnificantly higher, than earthiness scores for cooked f111ets pre-pared from H8G fish P > 0.05!. This earthy flavor was primarily asso-ciated w1th the dark red muscle fibers of the lateral line. The redmuscle fibers have been shown to contain more lipid than the whitemuscle fibers George 1962, Thurston and MacMaster, 1960!.
Tables 6 and 7 show that at 5 and 7 days of iced storage, sournessscores increased significantly fn cooked fillets prepared from skinlessfillets and in cooked fillets prepared from H&G fish P < 0.05!. Thisincrease fn sourness scores may have been a result of bacterial activity F1gure 5!. At 13 and 16 dyes of 1ced storage, the study was ter-minatedd, since TAPC were 10'/g and spoilage odors were present in boththe iced raw skinless fillets and iced raw H&G fish respectively Figure5!.
CONCLUSIONS
1. TOI scores increased significantly, at 6-7 days of iced storage,fn cooked fillets prepared from skinless fillets and in cookedfillets prepared from H8G fish P < 0.05!.
2. At 9 days of iced storage, TOI scores of cooked fillets preparedfrom skinless fillets were significantly higher than TOI scores ofcooked ffllets prepared from H&G f1sh P < 0.05!.
3. TFI scores increased significantly at 5 days of iced storagefor cooked fillets prepared from iced skinless fillets and at13 days of iced storage for cooked f i 1 1 ets prepared from H8Gfish P < 0.05!.
4. At 5 days of iced storage, cooked fillets prepared from icedskinless fillets had significantly higher TFI scores than cookedfillets prepared from H8G fish P < 0.05!.
5. TBA values and rancidity sensory scores increased significantly at6 and 7 days of feed storage, respectively in cooked fillets pre-pared from iced skinless fillets P < 0.05!.
6. There wer e no significant changes in TBA values or rancidity sen-sory scores fn cooked fillets prepared from H&G fish P >0.05!.
7. Sweetness scores of all samples decreased during 1ced storage.
8. Earthiness scores of all samples fncreased gradually, but notsignificantly, during iced storage P > 0.05!.
9. There were no significant changes in texture scores of any samplesduring iced storage P > 0.05!.
318

6+6
2
O O 2 4
Figure 5. Total aerobic plate counts for iced raw skinless filletsand iced raw headed and gutted fish.
319
4
mJ
w 3
O O 16 12 ll lS
OIYS ON ICE

10. At 13 and 16 days of iced storage, respectively TAPC were 10 /gand spoilage odors were evident in raw skinless fillets and in rawH8G fish.
REFERENCES
1. AOAC. 1985. "Official Methods of Analysis" 14th ed. Associationof Official Analytical Chemists. Washington D.C.
2. George, J.C. 1962. A histophysiological study of the red and whitemuscles of the mackerel. Amer. Mid. Nat. 68:487.
3. Kapsalis, J.G. and 0. Mailer. 1980. Consumer and instrumentaledibility measures for grouping of fish species. Final Report,U.S. Army Natick RSD Laboratories. Dept. of Comnerce, NationalTechnical Information Servi ce Report PB82-150921.
4. SAS/STAT. 1985. "Guide for Personal Computers." Version 6.Editfon. SAS Institute Inc., Box 8000, Cary, N.C.
5. Smith, P. Jr., M.E. Ambrose, and G.M. Knobl, Jr. 1964. Improvedrapid method for determing total lipids in fish meal. Comner. FishRev. 26�!:1.
6. Smith. T.S. 1987. Personal communicatfon.
7. Thurston, C.E., and MacMaster, P.P. 1960. Variations in chemicalcomposition of different parts of halibut flesh. Food. Res. 25:229.
8. Woyewoda, A.D., S.J. Shaw, P.J. Ke and B.G. Burns. 1986.Recommended laboratory methods for assessment of fish quality.Canadian Technical Report of Fisheries and Aquatic Sciences.No. 1448.
320

THERMAL PROCESSING STUDIES OF PACIFIC HAKE
Boey Chee CheongFisheries Division, Primary Production Department
Republic of Singapore
and
Marvin A. TungCanadian Institute of Fisheries Technology
Technical University of Nova ScotiaHalifax, Nova Scotia
B3J 2X4
INTRODUCTION
Pacific hake t arlucc us productus! is an underutilized fishresource in British Columbia. In 1982, the ddmestic catch was only15K of the annual total allowable catch while the national andco-operative fisheries of Poland, the USSR and Japan exceeded theirannual total allowable catch in Canada's 200 mile exclusive economiczone. Co-operative fishing, where domestic boats transfer their catchat sea to foreign vassals for processing and export, does employCanadian fisherman but, does not realize the potential profitsassociated with post harvest production and marketing of value addedproducts.
The Pacific hake fishery in British Columbia occurs in two areas,the primary area is in offshore waters west of Vancouver Island alongthe edge of the continental shelf and a smaller secondary stock occursin the Strait of Georgia which runs between Vancouver Island andmainland British Columbia. The fish in Georgia Strait have a slowergrowth rate Stocker, 1981! with an average weight of 580 g ascompared to 1080 g for offshore stock Buechler and Proverbs, 1983!.
Pacific hake in Canadian waters are known to be infested with twospecies of Kyxosporean protozoan parasites: Kudos ~th rsitis and Kudospaniformis Kudos ~th .rsitis has keen found in hake harvested inoffshore waters west of Vancouver Island and in Georgia Strait;however, Kudos paniformis has keen found only in the offshore stock Kabata and Whitaker, 1981!. Tsuyuki et al. �982! associated thepresence of Kudos pan formic with mushiness in the cooked texture ofPacific hake. They found that the muscle tissue of fish infested withonly Kudos ~th rsitis contained an enzyme with a strong proteolyticactivity in the acid range. The acid protease was heat labile and didnot lead to an unacceptable mushy texture upon cooking. However,
321

musola tissue of wast toast hake infested with Kudos geniyormte aloneor together with Kudos ~th rsitis demonstrated strong protaolyttoactivity in both acid and neutral ranges. Muscle with proteolyticactivity in the neutral pH range would become mushy during slowcooking and the enzyme concerned was relatively heat stable with anoptimum activity at 50-60'C. Willis �949! hypothesized that theproteolytic activity was highly localized within pseudocysts and whileliving, the host removed the enzyme by blood circulation. But, afterdeath of the host, the active proteolytic enzymes diffused from thecyst to the adjacent muscle fibers and damaged the texture of theflesh.
If Pacific hake is to be utilized for human consumption it iscritical that the cooked fish has acceptable textural qualities. Theobjective of this work was to study the textural properties of Pacifichake after quick heating by thermal processing in cylindrical and thinprofile cans.
METHODS
Fish used in these experiments were obtained in three lots fromtwo sources. West coast offshore samples, caught by a Polish midwatertrawler, had been frozen on board, sealed in polyethylene bags andstored in paperboard cartons. Once obtained, the fish were stored at-29'C for later filleting ~ Fish obtained from Georgia Strait werestored on board in refrigerated seawater tanks at -1.1 C for up to 3days prior to landing on shore. The first lot was then stored at-29'C awaiting further processing while the second lot was kept on icein a O'C cold room for up to four days prior to the completion offilleting. Both frozen sample lots were thawed in running tap watermixed with ice before filleting on both sides of the body. The pairedfillets were cleaned, placed into barrier bags Cryovac Division,W.R. Grace 6 Co. of Canada Ltd kg Mississauga, ON!, vacuum packed andstored at -29'C.
Kabata and Whitaker �981! reported that the two species ofmyxosporean parasites in Pacific hake could be identified bydifferences in the shape and size of their spores. In this study, theoccurrence and severity of parasitic infestation were evaluated by wetmount microscopic examination of fish muscle tissue using a lightmicroscope E. Leitz Wetzler! under phase contrast illumination at amagnification of 40GX. The parasite spore intensity was evaluated byobserving the average number of spores in three randomly selectedfields. Severity of parasitization was arbitrarily categorized on thebasis of the average number of spores per field as: light, less than6; medium, 6 to 19; heavy, 20 to 29; and very heavy, greater than 29.
322

Three containers were used in the canning operations, three-piecetinplate half �07x200.5! and quarter-pound �01x106! salmon cans andtwo-piece aluminum quarter dingley �05x76x21.3 mm! cans. The fill.weights were 175, 85 and 85 g, respectively. The half-pound salmoncans were vacuum seamed and processed in a pilot scale vertical steamretort Patterson Boiler Works I.td., Vancouver, BC!, whereas thequarter-pound salmon and dingley cans were sealed at atmosphericpressure and processed in an F8C 500W water immersion pilot scalesterilizer FMC Corporation, Hadera, CA!.
Thirty heat penetration histories were recorded for each can typeto determine the processing times required to commercially sterilizethe fish. Temperature measurements in the tinplate cans were madeusing Ecklund non-projecting thermocouples O.F. Ecklund, Cape Coral,FL! with Teflon insulated copper/constantan leads Type TT-T-24, OmegaEngineering Inc., Stamford, CT!. Thermocouples of the same type wereintroduced into the aluminum cans using Ecklund pouch packing glandsand the environmental temperature in the retort was also monitoredusing type T thermocouples. All the thermocouples were calibrated ina circulating oil bath against an ASTN thermometer at each processingtemperature.
Temperature measurements were recorded at one minute intervals ona Kaye Ramp II Scanner/Processor data logger Kaye Instruments Inc.,Bedford, HA! and stored on digital tape Columbia Data Products Inc.,Columbia, HD!. The centerpoint temperature history data were analyzedusing a microcomputer to evaluate the heating and cooling rate indices fh and fc!, and the heating and cooling lag factors jh and j c! foreach teat can. The lag factors were adjusted to correct for theeffects of the non-proj ecting thermocouple receptacles and Stumbo'sformula method Stumbo, 1973! was then applied to calculate estimatesof the process times to achieve a target process lethality, Fo, of 6min at an initial product temperature of O'C and retort temperaturesof 115, 120 and 130'C for each test pack. Estimates of the processtimes were then calculated as 3 standard deviations above the meanestimated process time determined for the individual test packs. Thisapproach acknowledged the variabilities in the retort heatingconditions and the can-to-can differences in the product, providing astatistically based level of probability that. the target lethalitywould be delivered to the product during processing Tung and Garland,1978!.
Fish samples from each lot were canned in three differentcontainer types at processing temperatures of 115, 120 and 130'C.Only fish with light or medium levels of parasite infection were usedto ensure homogeneity in raw material quality. Weight loss duringprocessing was assessed by comparing the weight of the cooked fish,after draining over a sieve /$10 mesh size, 2.0 mm! for 2 min, to theoriginal product weight.
323

Mechanical textural analyses were completed in duplicate using anInstron 1122 Universal Testing Machine Instron Corporation, Canton,MA! equipped with a standard Kramer Shear-compression test cell. Thenumber of blades in the Kramer cell was reduced from 10 to 4 and the
cell capacity was also reduced for the experiments. The crossheadspeed was set at 50 mm/min, the chart speed at 100 mm/min and thesensitivity at 100 kg full scale. A 25 g sample of white muscle fromthe cooked fish was separated from the skin, bones, dark muscle andblood vessels, flaked and packed in the cell for each test. Thoroughflaking of the fish improved the homogeneity of the test sample andincreased the randomness of the fiber orientations with respect to theshearing blades. The compression cycle was terminated when the bladespassed through the bottom of the cell. The force curve was examinedto determine the hardness and firmness of each sample. Hardness wasmeasured as the peak force observed and firmness as the slope of theinitial straight line portion of the curve.
RESULTS AND DISCUSSION
Microscopic examination of the tissue samples revealed that fishharvested in west coast offshore waters were infected by two speciesof ~tr aos ores, Kudos ~th rsitis and Kudos paniformis wh,ereas thosefrom G !gaia Strait wsr'e infected only by Kudos ~th rsitis Am.ong theoffshore hake n 281!, 42.3Z had mixed infection, 35.6Z were infectedonly by K. panifomais, li.pg ware infected only by K: ~th rsitis and7.1Z were non-infected, whereas 76.9Z of the fish sampled from GeorgiaStrait were parasitised only by K. ~th rsitis and the rest were freefrom infection. The severity of parasitization is indicated in Table1 in terms of parasite spore intensity. In most of the mixedinfection cases, both parasites had low spore intensities and veryoften, the number of spores observed in a selected field under themicroscope was only one or two. Tissue samples had to be examinedrepeatedly in order to confirm mixed infection. Heavily infected fishwith a high spore intensity could usually be identified withoutdifficulty due to the presence of infected muscle fibers which variedin color from yellowish white to dark brown or black. The variationin the color of the infected muscle fiber was thought to be due todefensive mechanism of the fish in which melanin granules weredeposited around the infected fibers Kabata and Whitaker, 1981!.Occasionally the presence of black pseudocysts did not coincide with ahigh spore intensity in the same tissue sample as most of the sporeswere deformed, probably due to melanin deposition, and confined withinthe pseudocysts. The west coast offshore fish fillets with highparasite spore intensity tended to show softness in texture and themuscle could be easily teased apart when the tissue sample wasprepared for microscopic examination. For the purpose of this study,only fish with light and medium levels of infection, in terms ofparasite spore intensity, were used.
324
Table 1. Occurrence and severity of parasitization of Pacific hakeharvested in offshore waters west of Vancouver Island andin Georgia Strait
A. Fish samples from offshore waters west of Vancouver Island n 281!
TYPES OF PARASITIZATIONPARASITE SPORElNTENSITYa MixedbSingle Total
K. ~th rsitis K. ganitormis
100 119
TYPES OF PARASITIZATIONPARASITE SPOREINTENSITYa MixedbSingle Total
K. ~th rsitis K. paniformis
26514
I
280 363
L:<5, M:6-19, H:20-29, VH:>30Parasite spore intensity based on counting of K. ganitormis spores.
325
None
Light L!Medium M!Heavy H!Very Heavy VH!
B. Fish samples from Georgia Strait n-363!
None
Light L!Medium M!Heavy H!Very Heavy VH!
6015
8
17
67
307
15
20169
45
1532
281
83265
14I

The heat penetration parameters were calculated from the center-point temperature histories Table 2!, and Stumbo's formula method wasused to generate the process times used in experiments Table 3!. Asexpected the process time decreased as can thickness decreased andretort temperature increased.
The mean observed weight losses of the fish were 27.3, 21.2 and19.7X for half and quarter-pound salmon and quarter dingley cans,respectively. Retort temperature was significant p<0.05! inincreasing weight loss only when processing in half-pound salmon cansat 115'C as compared to 120 and 130'C, and this increase was small about 11! in absolute terms.
Figure 1 shows typical force-deformation curves observed duringthe study and the results of the textural analyses of the differentfish, packages and retort temperatures are summarized in Tables 4 and5. The textural properties of Strait frozen SF!, Strait chilled SC!and West Coast offshore WC! samples packed in half-pound salmon canswere not. significantly p>0.05! different for different retorttemperatures. Samples processed at 120 and 130'C in quarter-poundsalmon and dingley cans were significantly p<0.05! harder and firmerthan those processed at 115'C. Similarly, WC samples processed at130'C were harder and firmer than those processed at 115 or 120'C.The texture of SC samples was unaffected by retort temperature.
The fish type had a significant p<0.01! influence on texturewith the WC samples exhibiting the greatest firmness and the SCsamples the least. Fish caught at different times in Georgia Straitwhich were infected only with thc myxosporean parasite, K. ~th rsitisbut subjected to different postharvest handling conditions exhibitedsignificantly p<0.01! different textural characteristics. Theprocessed SC fish texture was considered soft but not mushy whentested organoleptically. The softness may be a consequence of thetime delay until initial freezing, the number of freezing cycles orthe condition of the fish at harvest. For example, Dunaj ski �979!reported that the texture of fish muscle could change during spawningseason.
West coast offshore fish samples were parasitized with eitherlight or medium infections of K. Kaniformis alone cr together with K.~th rsitis. The presence of K. Kaniformie apparently did not causemushiness in the cooked texture of canned west coast offshore hake.The muscle protease s! associated with Pacific hake muscle tissueinfected with K. Ksniformis is relatively heat stable with an activityoptimum at 55-60 C Tsuyuki et al., 1982!. The heating rates were sorapid in all three container types that the duration of time in thattemperature range was l,ess than one minute. Patashnik et al. �982!
326
Table 2. Heat penetration parameters for Pacific hake inthree types of containers
MEAN VALUES
STANDARD DEVIATIONS!CONTAINER TYPE
fc min! min!
Half pound salmon
Quarter pound salmon
0.79
�.24!Quarter dingley 9.03
�.18!
Table 3. Process schedules of Pacific hake processed in differentcontainers and at different retort temperatures
OPERATOR'S PROCESS TIME min!CONTAINER TYPE
Retort temperature 'C!115 120 130
76. 1 56. 5 41.4
25. 857.9
23.5 13.0
*Fo 6 min, Initial temperature O'C
327
Half pound salmon
Quarter pound salmon
Quarter dingley
20.34
�.08!
16.67
�.68!
33.96
�.51!
17.71
�.42!
7.10
�.71!
2.65
�.77!
1.72
�.43!
1.23
�.08!
1.38
�.11!
1.07
�.20!

328
�8 ! 3380'
E
4J
X
Vl
Cl
VF4
'Q 00 0 0
0 O5 0
'U I
8 0 4 0

O O OO O
O
N N
IA N
N
N N O IAN O
O
O
0lm
O O O O O
IA
N N
I0ON N N
OlIA
0 Oo
m mO
N mO O
+O O
Ch «IN NC4 N
g O O Ol mN
IA
I0
O ID IAN
Ch OOOl ONN
I0I0 «I
IA 40
0l rtIA«l
Ch 0l C3 N
I N
N m
Ill
ChN
O 0l
O mm m
IO
N
mCh
«I Ch
O
N N IA4I IA
oIA0l O«I ChI0 IA
N
N IAIA«l
IAN
ON
O O m
ClhI0 III
C 4lN 0 I
Cl0
329
IJ
VCL'D Cl
4lIJ0CL
I
IC4lI
IllILI
0IIi
I
I III ~III
I
CSIOIIA
IA CO o
CQ «IN m
o o O ON N
4lCll
CJIA
4l0
4 O
C 0 hl4l0CJ4I
4I
4I
CI
4lI CLX 4l

Table 5. Summary of F values from an analysis of variance of thetextural properties of thermally processed Pacific hake
F-VALUESOURCETEST
1/2 lb Salmon 1/4 lb Salmon 1/4 Dingley
Fish Type F!Retort Temp T!FT
84.96**
0.27 n.s.0.22 n.s.
164.65**16.11**
1.77 n.s.
67,28**8.40**
1.90 n.s.
Hardness
Fish Type F!Retort Temp T!FT
113.82**
0.51 n.s.
0.53 n.s.
214.18**
10.78**
0.98 n.s.
78,67**7. 6 1**
1.40 n.s.
Firmness
Fish Type F!Retort Temp T!FT
3. 51+7.60**
0.73 n.s.
0.10 n.s.1.28 n.s.2.34 n.s.
0.21 n.s.0.24 n.s.2.21 n.s.
Weight Loss
** significant at p<0.01* significant at p<0.05
n.s. not significant p>0.05!
found that the enzyme s! was completely inactivated by heating at 70'C for10 min. This suggests that rapidly heating Pacific hake to an internaltemperature higher than 70'C inactivated the enzyme during cooking.
In conclusion, Pacific hake harvested from Canadian waters andthermally processed exhibits acceptable texture when heavily parasitizedfish are eliminated from the raw material supply and good postharvesthandling practices are observed. Further studies are necessary toestablish optimum process schedules for each container type based on otherquality attributes such as color, flavor and appearance of the finalproduct.
ACKNOWLEDGEMENTS
330
Financial support for this work was provided by the CanadianInternational Development Agency under the Asean-Canada Fisheries PostHarvest Technology Project and by the British Columbia Hinistry ofAgriculture and Fisheries. The use of facilities at the Department ofFisheries and Oceans Laboratory and the supply of fish arranged by CrestPackers Ltd. of Vancouver were invaluable to the project.

REFERENCES
Buechler, G.N. and Proverbs, T.B. 1983. A short: history of theBritish Columbia Pacific hake fishery with an extensive review ofactivities in 1981 and 1982. Field Service Branch, Department ofFisheries and Oceans, Vancouver, BC.
Dunajski, E. 1979. Texture of fish muscle. J. Texture Studies10:301 '
Kabata, Z. and Whitaker, D.J. 1981. Two species of Kudoa Myxosporea: Multivalvulida! parasitic in the flesh of Merlucciusproductus Ayres, 1855! Pisces: Teleostei! in the CanadianPacific. Can. J. Zool. 59:2085.
Patashnik, M., Groninger, H.S., Barnett, H., Kudo, G. and Koury, B.1982. Pacific whiting, Merluccius productus: 1 Abnormal muscletexture caused by myxosporidian-induced proteolysis. MarineFisheries Review 44�!:1.
Stumbo, C.R. 1973 ' Thermobacteriology in Food Processing, 2nd Ed.Academic Press Inc., New York, NY ~
Stocker, MD 1981. Groundfish stock assessments off the West Coast ofCanada in 1981 and recommended total allovable catches for 1982.Canadian Manuscript Report of Fisheries and Aquatic Science No.1626.
Tsuyuki, H., Williscroft, S.N., Kabata, Z. and Whitaker, D.J. 1982.The relationship between acid and neutral protease activites andthe incidence of soft cooked texture in the muscle tissue ofPacific hake, Mercluccius productus, infected and held for varyingtimes under different pre-freeze chilled storage conditions.Fisheries and Aquatic Sciences, Canadian Technica1. Report, No.1130.
Tung, M.A. and Garland, T.D. 1978. Computer calculation of thermalprocesses. J. Food Sci. 43:365.
Willis, A.G. 1949. On the vegetative forms and life history ofchloromyxum thyrsites Gilchrist and its doubtful systematicposition. Australian J. Sci. Res., Ser. B., 2:379.
331

ON BOARD FISH HANDLING SYSTEMS FOR OFFSHORE WETFISH TRAWLKRS"Work Smarter, Not Harder"
by
W.K. Rodman, F. Eng.Engineering Services
Fishery Development DivisionDepartmeat of Fisheries and Oceaas
P.O. Box 550
Halifax, Nova Scotia, CanadaB3J 2S7
ABSTRACT
Fish handling equipment and procedures employed on board threerepresentative offshore trawlers were observed and analysed usingelementary time-and-motion techniques and a video tape record ofobservations. These observations and analyses were used to develop animprovement strategy and to subsequeatly design a new fish handlingsystem. This prototype system was iastalled on board the trawler, the"Cape Huater" �6 m LOA! and its performance was evaluated. Results ofthis conversion have beea very positive with a considerable increase inproductivity and improvements in crew comfort. Pour other trawlers havebeen converted to similar systems as a direct result of this work.Quality improvement evaluations are currently under investigation.
INTRODUCTION
Recent technological advancements on fishing vessels have focussedprimarily on the ship's structure aad sophisticated electronicequipment. Hull design, deck layout and detection equipment havecontributed to much-improved catch efficiency. The processing andstowage systems, however, have received much less atteation.
The increasing international demand for premium quality fishproducts provides ample inceative to improve fish handling systems thatcan impact directly on fish quality.
A previous study entitled, "Dockside Grading Project - CansoSeafoods" Canadian Industry Report, Fisheries and Aquatic Sciences No.148! hae showa that there was a direct correlation between rapidhandling and Increased Grade A landings. Figure l shows therelationship between t' he percentage of fish assessed to be Grade A atdockside and lag time; that is, time between the codend being landed andiced storage. This curve suggests that a reduction in lag time of onehour for example, could result in as much as a 20X increase in thepercentage of Grade A fish landed. Low crew productivity and systemsthat failed to consistently handle fish in an efficient and gentlemanner were seen as an opportunity to enhance landed quality and toimprove the utilization of our finite fishery resources.
332

METHOD
A contract was awarded to A. Orlic Associates Ltd. of Halifax, NovaScotia, to investigate present on board fish handliag practices, systemsin use and to recommend possible improvements.
Between June and December 1984 three trips were made on boardtypical offshore trawlers employing different fish handling systems,procedures and equipmeat. Qualified observers prepared detailed logs,iacludiag time-and~tion data and made video tape records of thei.robservations. This data was aaalysed aad the results were presented toan industry Review Committee which had been formed to oversee and guidethe study. These consultations resulted ia a design strategy for a newfish handling system. A. Orlic Associates Ltd. then prepared a detaileddesign of a prototype system for installation and evaluation aboard atypical offshore trawler. This system was installed on board the "CapeHunter", aad the prototype fish handling system's performance, in termsof productivity and landed quali.ty, was aaalysed.
CURRENT COMMERCIAL PRACTICE
The following summarises the results of the analyses performed onthe fishing trawlers "Cape Charles" �5 m LOA!, "Cape Fame" �0 mLOA! and "Hillsboro" �1 m LOA!.
A! Manual Gutting
Two procedures were observed in use under commercial conditions andanalysed in terms of productivity.
The 1-Step method, as the name implies, involved the entire guttingprocess being performed by one man. A variety of individual techniqueswere observed with varying gutting rates in the range of 6. 3 to 11. 2fish/man~nute. It was noted that the "best" gutters were all of asimilar height and when casually observed, they did not seem to beworkiag any harder. Upon close examinati.on of their technique, however,it was evident that there were few, if any, wasted movements. Theseindividuals had learned to work smart which resulted in reduced effortand improved performances
Utilising the 1-Step method, the average worker performanceobserved was 8.8 fish/maa~iaute
The 2-Step method consisted of two distinct operations. The firstworker selected, oriented, and cut the throat and opened the belly ofthe fish. The fish was then deposited into a holding bia where asecond worker removed the gut cavity contents. Two of the vesselsinvestigated employed this process aad achieved a combined gutting ratein the range of 7.1 to 7.9 fish/man-minute-
Utilising the 2-Step method, the average worker performanceobserved was 7.5 fish/man-minute.
B! Machine Gutting
Gutting machines were employed oa board two of the vessels toprocess cod and pollock. Other species, such as haddock and halibut,were manually gutted as were cod and pollock judged to be outside theset operating range of the gutting machines.
333

The machines utilized on board both vessels were theKronborg-Jutland MK III auComatic gutters.
The guttiag rate observed for the machines was in the range of 17.8Co 26,0 fish/machine~inute, for an average rate of 21.9fish/machine~nate. This was approximately 73X of the machine'stheoretical capacity.
There was some criticism of the gutting machine's performance asthe cuts were not always straight and clean, and Chere was somerequirement to inspect and remove bits and pieces of viscera notcompletely removed by the machine~uttiag process. This problem wasattributed to inadequate maintenance and/or poor adjustmenC.
ERGONOMICS
Generally speaking, ergonomics was not a prime consideration whenthe surveyed vessels were originally designed and equipped. Manual andand machine-gutting stations were located within the available spacewith interconnecting conveyors and chutes installed to establish a flowof fish through the processing area. Crew members were required Covirtually "insert" themselves into their work stations. As a result,productivity was low aad fish were often "forked" and thrown from onestation to another.
The gutting machine operators were crowded and required to selectfrom a bin of unsorted fish. Often the layout required the operator tobend and twist each time a fish was processed. The result was afatiguing work pattern which tended to reduce productivity.
STRATEGY TO IMPROVE THE ON SOARD FISH HANDLING SYSTEM
A Review Coozsittee, composed of industry representatives andvarious fishery professionals, was formed to review the analyses, videotapes and raw data gathered by Che observers, and to formulate astrategy to design a new' fish handling system that would enhance crewproductivity and fish quality. The strategy agreed upon was as follows'-
1. Optimize the use of automatic gutting equipment.
It was agreed that the new system should attempt to fullyutilize automatic gutting machines since they offered the mostpotential to rapidly gut large numbers of fish.
In theory, the automatic gutting machine offers aniacrease ia guttiag rate �0 fish/minute! over the manual1-Step method of more than 340X.
It had been observed that when fish were machine~utted,it was often accessary to inspect the gut cavity and remove anybits and pieces aot completely removed by the machine. TheCommittee was of the opinion Chat if the operators processedoaly appropriate species within the correct size range and ifthe machines were well-adjusted and maintained, then theperformance of the equipment would be acceptable. This opinionwas corroborated to a large extent by the Tarry Research
334

Station assertion that their fish handling system, whichcentered around the Kronborg-Jutland Nark III/s machines, hadbeen very successful and that, the gutting machines inparticular, had performed very well.
2. Utilize the 1-Step manual gutting method.
Since not all fish captured are suitable for machinegutting, either because of physical structure or size, it wasconsidered essential that a significant manual gutting capacitybe designed into the system.
The 1-Step method of gutting offered a productivityimprovement in the order of 17Z over the 2-Step method and didnot require any additional crew handling or facilities.
Using the 1-Step method, by-catch could be segregated bythe manual gutters and immediately processed.
The 1-Step method also allowed for a good deal offlexibility as workers could be added or redeployed at will tooptimize throughput as required.
3. Design the individual work stations using sound ergonomicdesign principles .
It was the recommendation of the Review Committee thatevery effort be made to improve the quality of the workingenvironment and to minimize the need for the workers to lift,throw and bend in order to accomplish their tasks.
It was also felt that worker attitude could be improved bymaking the process area as bright and attractive as possible.
4. Eliminate multiple or repeated handling of fish
The Review Coazaittee agreed that multiple handling of fishwas damaging as well as wasteful.
The immediate 1-Step method of gutting by-catch, forexample, was an opportunity to reduce double handling and tobegin the bleeding process as soon as possible.
5. Utilize conveyors, chutes, mechanical washers, flumes, etc., toensure a gentle, steady and uniform flow of fish.
Essentially, this strategy focussed on means of conveyingfish from one station to another in a reliable, steady andgentle manner. Previous layouts often required fish to bethrown and/or forked from station to station, which resulted inthe puncturing and crushing of flesh. Inappropriate slopes inthe receiving areas and conveyors that did not self-feedrequired human intervention and clearly did not contribute toan efficient system.
335

COSTI BENKF IT
It was estimated that the new fish handling system could increaseat:-sea productivity by as much as 19-56X. This estimate was obtained bycomparing the likely performance of an integrated and ergonomically
� l00
O ~ 80~ 60
~ 40
I 20 0 0 i 2 8 0 5Maximum Lag Time hours!
Figure 1. Relationship 8etween Percentage of Grade AFish at Dockside and Lag Time.
Source: Dockside Gradin Pro ect - Canso Seafoods.ana an ndustry eport o s eries and
Aquatic Sciences jh . 148.
336

designed system with those rates actually measured at-sea on board thethree analysed trawlers.
The benefits of improved productivity are considered to have twodistinct aspects. The first is an enhanced work environment and workthat is less physically demanding. Its value is almost intangible andso no attempt was made to quantify it in terms of dollars and cents.The benefits in terms of enhanced quality are very real but aredifficult to isolate and quantify. It was estimated, however, that byreducing the handling time' Figure 1!, a significant improvement inlanded quality was likely and if the incidence of rough handling couldbe reduced, then improved yields and higher product grades were likely.Modest improvements in these two areas alone could 3ustify anexpenditure in the order of $150,000 with a payback period of about oneyear.
On this basis, it was decided to proceed with a prototype systemand to evaluate its performance.
VESSEL SELECTION
The "Cape Hunter" was selected as the test vessel for the followingreasons.
1. The "Cape Hunter" is one of nine vessels in the Fox class.
2. The captain and crew were supportive of the goals of qualityenhancement and improved crew productivity. The ReviewCossaittee was therefore confident that the new system would begiven a fair trial,
3. The vessel was already fitted with two automatic guttingmachines and so the crew were experienced in the machines'operation and maintenance.
4. The Fox class represented a real challenge as there was verylittle room to install a completely integrated system. It wastherefore evident, that if we were able to achieve a measure ofsuccess on this vessel, then deriving similar benefits on otherclasses would be considerably less difficult.
"CAPE HUNTER" � ORIGINAL LAYOUT
The original layout is shown in Figure 2.
In October 1985, a trip was made on board the "Cape Hunter" inorder to document the existing fish handling system's performance.
Several "bottlenecks" and opportunities for improvement were notedas outlined belo~.
1. The gutting machine operator was crowded between two manualgutting stations.
2 ~ The gutting machine operator was compelled to handle unsortedfish.
337

Figure 2. Original Processing Layout; "Cape Hunter".
Figure 3. Prototype Processing Layout; "Cape Hunter".
338

3. The gutting machine operator was forced to stoop and twist inorder to select fish.
4. Machine-gutted fish were often poorly washed as the fish weredeposited into the washer at the washer discharge conveyor.
5. The receiving bin was poorly configured and inadequately slopedto empty itself and feed the incline conveyor to the processingarea.
6. Sy-catch was repeatedly thrown and allowed to warm up while theprimary species was processed.
7. Trash fish had to be moved by hand to the fish grinder fordisposal.
8. The lighting was inadequate and harsh shadows were common inthe work areas.
The following tables summarize the productivity performance of the"Cape Hunter' s" processing deck operations in the "before" condition.
It should be noted that the gutting machines were not utilized toany significant extent on this trip.
"CAPE HUNTER" - PROTOTYPE LAYOUT
The prototype layout is shown in Figure 3 ~
The modifications began, however, in the receiving bin. The binwas reconfigured and sloped at the expense of some loss in holdingcapacity to ensure that the incline feed conveyor would be self-feeding.
339

The Review Committee decided to adopt the l-Step gutting methodwhich had been observed to be more productive. The manual guttingstations were positioned upstream of Che automatic gutting machines sothat the manual gutters could remove all desirable by-catch aad fishbeyond the set operating range of the gutting machines.
The manual gutting boards were hinged on one end to facilitate crewaccessibility and mounted on slides to accommodate either right orleft-handed workers. Four workers could be comfortably accommodatedusing the four gutting boards which were adequately sized and arrangedto accommodate up to eight workers on an intermittent basis.
The heights of the delivery/selection conveyor, gutting Cable andflume to the wash tank were convenient so that fish did not have to bepicked up or otherwise lifted on a continuous basis. By-catch, whenselected by a worker, was gutted and placed in a by-catch holding binlocated beside the worker and above the wash tank. By-catch was heldthere until the maia species had beea processed, at which time thealready gutted aad bled by catch could be dumped automatically into thewash tank for washing and delivery to the fish hold.
Xt has subsequently been recommended that a system of spray nozzlesbe installed over the by-catch bin in order to assist washing andcooling.
Fish which remained on the delivery/selection belt were conveyed toa commoa storage hopper located between the gutting machine operators.The operators were simply required to orient and slide the fish alongthe hopper edge into the gutting machiae in a smooth, non-liftingmotion.
Undesirable by-catch which accumulated in the hopper could then bedumped into a grinder by simply opening a sliding gate.
All gutted fish were flumed or dropped into a swirl tank washerwhich washed the gutted fish in large quantities of clean sea waterbefore the rolliag action of the boat deposited washed fish onto cheincline conveyor leadiag to the fish hold. As the fish were lifted outof the wash tank, they were gently rinsed with clean sea water, prior tobeing delivered Co the fish hold.
RESULTS AND DISCUSSION
After completion of the prototype fish handling system in July1986, two trips were observed to evaluate the new system in terms ofcrew productivity. The following suizaarizes the performance of the CapeHunter's processing deck operation in the "after" condition.
340

following details the results of the observations.
The reconfigured receiving bin was able to accommodate thecontents of the codends and reliably delivered fish to theincline conveyor supplying the processing area.
The 1-Step gutting method resulted in approximately a 30Ximprovement in productivity.
2 ~
This improvement in gutting rate was below the assumed figureof 8.8 fish/manwinute; however, the crew were still ad]ustingto the new system and had not fully learned to use the 1-Stepmethod. Further improvements are anticipated as the crewbecomes more familiar with the method.
30 The machine gutting rate decreased by approximately 12X,however, the utilization of the gutting machines increased bymore than 41X.
The gutting machine did not perform well as it was necessary toinspect and clean machine~utted fish. The inspection ofmachine-gutted product increased from 5X to approximately 28Xof effort.
4.
5. The overall system throughput increased by approximatel,y 50X.
This increase throughput was due primarily to the virtualreplacement of hand gutting by the higher output guttingmachines.
CONCLUSIONS
341
The new fish handling system has been in constant use since theconversion of the "Cape Hunter" was completed in August 1986. Crewcoiinents have been very positive and National Sea Products Ltd. haveconverted four other vessels to similar systems.
Refinements including improved automatic gutting machines, abashingequipment, inspection stations and the introduction of fish chillingequipment are presently under consideration.
Subjective assessment of improvements in the quality mix of fishlanded by the "Cape Hunter" are very positive and estimated to be in therange of 5-10'. Dockside grading and plant utilization data arecurrently being analysed in an attempt to quantify the value of "CapeHunter" landings versus conventionally equipped vessels.
REFERENCES
1 ~ M.R. Desantis, R. Hoge, P.C. Fahie and 0. Lemon. 1980. DocksideGrading Project - Canso Seafoods. Canadian Industry Report ofFisheries and Aquatic Sciences No. 148.
2. A. Orlic and Associates. 1985. On Board Fish Handling System forOffshore Wetfish Trawlers. Fisheries Development Branch Pro!ectReport No. 93.
3. A. Orlic and Associates. 1987. Time and Motion Analysis for OnBoard Fish Handling System � Cape Hunter. Draft Report!.
342

POLYPHOSPHATE DETERMINATION IN SHRIMP USING HIGH PERFORMANCELIQUID CHROMATOGRAPHY
Melissa Sturno, Maurice R. Marshall,and W. Steven Otwell
Food Science and Human Nutrition Department,University of Florida, Gainesville, FL 32611
INTRODUCT10N
Polyphosphates POP! application in the seafoodindustry is expanding and includes both the fresh andprocessed market. Treatment reduces thaw-drip loss, resultsin improved texture and quality, and improves particlebinding. POP are also used to soften underskins, thereby,facilitating peeling and increasing yields in the shellfishindustry Steinhauer, 1983!.
Tripolyphosphate TPP! is the predominant phosphatespecies used in the seafood industry, although hexameta-phosphate may also be incorporated Schwartz, 1987!.Hydrolysis of POP, either enzymatically and/ornonenzymatically, readily occurs during fresh and frozenstorage Sutton, 1973; Reddy and Finne, 1986; Reddy andFinne, 1985; Tenhet et al., 1981b! forming orthophosphate OP! whi0h cannot be differentiated from the naturallyoccurring phosphate.
Existing procedures for POP determination in foods arenot designed for quick and sensitive detection. Thin layerchromatography {TLC! is generally used for polyphosphatedetection in both meat and seafood Gibson and Murray, 1973;Tenhet et al.; 1981a; Reddy and Finne, 1986!. Although highperformance liquid chromatography HPLC! has been used forPOP detection in other chemical sectors, it has not beenmodified for application in the seafood industry. Fitchettand Woodruff �983! developed a procedure for POPdetermination of sequestering agents in detergents!involving an anion-exchange column and UV detection. AnHPLC procedure which could simplify phosphate detection inseafood would have potential for widespread use in researchand routine analysis by expanding their potentialapplication, while discouraging abusive application. Themain objectives of this study were to develop an HPLC, ionchromatography IC! technique for the detection oforthophosphate, pyrophosphate and tripolyphosphate levels inshrimp.
343

MATERIALS AND METHODS
Double-distilled deionized water was used in allsolution and extraction formulations. Reagent-gradechemicals were used unless otherwise stated. All equipmentused was acid washed to remove any residual phosphate.
Fresh, headed, untreated, pink shrimp were receivedfrom Tampa, FL on various occasions. Samples were placed inquart-size plastic containers and stored at -20 C untiltreated. Prior to treatment, the desired sample size wasretrieved from storage, placed in Whirl-Pak bags and thawedunder running water. The shrimp were peeled, deveined andthen treated. Shrimp were dipped in various concentrations�%, 1 ~ 0%, 1.5%, or 2.0% w/v, TPP! for 6 min at roomtemperature. Commercial dip applications were 3% TPP for 6min.
Commercial food-grade phosphates were donated by FoodMachinery Corporation FMC!. Disodium hydrogen phosphate OP! and tetrasodium pyrophosphate PP! assayed at 100%purity and were employed directly in standards. Sodiumtripolyphosphate TPP! was purified using a water/ethanolrecrystallization method Greenfield and Cliff, 1975!, whichgave a reported assay of !99.8% and was then incorporatedinto standards.
o a 0 s
HPLC was performed using a Dionex ChromatographicSystem, 2010I following the procedure of Fitchett andWoodruff �983! with a few modifications. The system wasequipped with a Dionex Reagent Delivery Module withmicromembrane reactor, a 50 ul injection loop, a DionexUV/VIS detector and a Dionex strip chart recorder. A DionexHPIC AS-7 anion-exchange column was the separator column,and HPIC AG-7 and HPIC NQ-1 were guard columns. Eluent flow rate: 0.05 ml/min! was 0.075 M HNO3. Post. columnderivatization PCD! with a ferric nitrate solution � gFe NO3�.9H20/ L solution, with 2% v/v! HC104, flow rate;0.06 ml/min, Fisher Scientific!. Detection was at 310 nmwith the detector set at 0.02 absorbance units AU!, fullscale.
344

na s'
Sample extracts were prepared by homogenizing 2 g ofshrimp with 150 mL of water for 30 seconds using a Polytron,speed setting 7, followed by a 15 min centrifugation at10,000 x g at. 4 C. The supernatant was then passed througha C-18 Sep-Pak {Waters! filter acetonitrile activated!.The sample was diluted 9:1 sample:acid! with 0.75 M HNO3and injected twice through a 0.45 m filter Gelman!.
Peak heights were measured and compared to standardcurves using linear estimation to determine phosphateconcentrations. The following equation was used todetermine the phosphorus content of the shrimp:
mg P/100 g shrimp = mg species/L! mL H20/gshrimp! mole fraction P!�00!.
a 's
Statistical analysis was performed using SAS �982!General Linear Model {GLM! procedure. Student's t test wasused for comparison of means, unless otherwise noted.
RESULTS AND DISCUSSION
HPLC with conductivity detection was able to resolvestandard aqueous solutions of OP, PP, and TPP. However,when standards were placed in shrimp extracts, no resolutionoccurred between OP and the solvent front. Since hydrolysisof polyphosphates ultimately produce OP, resolution of OP isessential. Various attempts to modify chromatographicconditions were unable to resolve OP from the solvent front.
An HPLC postcolumn derivatization procedure wasdeveloped for phosphate detection in shrimp. Nitric acid at0.075 M HN03 was chosen as the eluent for determiningpolyphosphate residuals on shrimp Figure 1!. TPP waseluted in 11 min compared to 15 min when 0.065 M HNO� wasused as eluent. The limitation of using the 0.075 M et.uentwas that PP was not baseline resolved from OP Figure 1!. Amajor advantage of using postcolumn reaction was that nointeraction occurred between the shrimp extracts and thederivatizing reagent. Secondly, postcolumn derivatization
345

showed a good linear relationship with concentration foreach species of polyphosphate OP, PP, and TPP! Figure 2!,and limits of detection were as low as 10 ppm.
Recovery of total P added was directly influenced bythe added species of phosphate Table 1!. At combined hightreatments of all three species and at all high TPP levels,total recovery of P added was approximately 94 � 96%. WhenTPP was low in the combination treatments, recoveries werereduced to 904 Table 1!.
Table 1. Total phosphorus recovered from combinations ofpolyphosphate species added to shrimp duringextraction.
4 Recoveriesa
Total POP TPPpp
Means of 4 observationsLow L! and High H! levels: L"-OP, H-PP, andL-TPP 20 ppm; L-PP 15 ppm; H-OP = 75 ppm;H-TPP 150 ppm.
omet ' ethod
The HPLC procedure was compared to the standard AOACspectrophotometric method for quantifying total P. Asignificant difference p�.05! between both methods wasobserved; the spectrophotometric method assayingconsistently higher P than HPLC Table 2! . The average Pdetermined by the HPLC method was approximately 86% of whatwas determined by the spectrophotometric method. However,
346
LbL
H H H L LH
L
H H L
H L L
L L L LH H H H
9090
91
9096
979496

Table 2. Comparison of HPLC with AOAC spectrophotometricmethod for determining total P in shrimp.
P content mg/100 gm shrimp!a
SpectrometricHPLC
Control
Treated
11/. 9101.8 3. 6
175.7 6.0
6 ' 8
202.5 15.2
Means s.d., n 6.
The Duncan Multiple Range test was performed on thedata to assess any significant differences betweentreatments. TPP treatment levels of 1.04, 1.5% and 2.0% allresulted in significant alpha 0.05! differences inabsolute P levels as compared to the untreated sample and toeach other. The variation in levels resulted from theuptake of PP and TPP species Figure 3! from the treatmentsolution. No TPP was detected in untreated shrimp Figure3!. Baseline levels intrinsic OP! in all treatments weresimilar. Upon storage, one could expect to observe anincrease in the OP component of treated samples resultingfrom TPP hydrolysis.
Shrimp muscle uptake of TPP was observed to beconcentration dependent, which agrees with the findings ofSpinelli et al. �968!. TPP at the low level treatment�.54 TPP! was detectable, the level of total P did notdiffer significantly from an untreated sample. This findinghas been previously reported by Tenhet et al. �981b!.Assuming the TPP component has not, yet hydrolyzed, HPLCwould be able to identify a low treatment, where a lesssensitive procedure may not.
347
the spectrophotometric method does involve an acid digestionstep which would liberate organic phosphates. This step isnot used for the HPLC procedure.

s 0 d Sh Foe o e
The rate of TPP hydrolysis correlated well with therate of OP and PP production as determined by comparing theslopes of the lines see Figure 2!. This reinforcesprevious reports that TPP hydrolysis results in PP and OPspecies levels, in combination or ultimately as OP, whichare equal in total P content of the initial TPP species.After 8 weeks of storage, approximately 354 of the initialTPP present still remained.
o a
The rate of TPP hydrolysis under refrigeratedconditions was greatly increased, as compared to frozenstorage. Following 3 days of refrigerated storage, no TPPremained, although an amount of PP was still present Figure5!. This agrees with Sutton's �973! observations that TPPwas not detectable in cod muscle 30-40 hours aftertreatment. Complete hydrolysis to OP was observed on thefourth day of analysis after treatment. The rate of TPPdisappearance was not significantly different than the rateof formation of OP and PP.
CONCLUSIONS
A faster procedure to identify potential phosphatetreatment on shrimp has been developed using HPLC. Thebenefits of this procedure include isocratic elution, andshort analysis time and quantitation. Furthermore, thisprocedure has the potential for application in other seafoodproducts, such as scallops and fish fillets.
Recovery studies of added species seem to suggest adegree of interaction between them. The proposed procedurewas successful in identifying phosphate treatment. It wasalso effective in monitoring the breakdown of TPP in shrimpmuscle under refrigerated and frozen conditions. Under
348
Significant hydrolysis of TPP was observed over each 2-week analysis period P<0.05! Figure 4! which resulted in aconcurrent increase in OP levels. PP seemed to increaseslightly and then remain constant. However, variations inthe detection of PP could have resulted due to poorresolution from OP, but combined standard curves suggestthat the variation in PP levels detected are notsignificant. This suggests that the rate constantresponsible for TPP hydrolysis may be of similar magnitudeto the rate constant responsible for PP hydrolysis, whichagrees with Sutton's �973! report on the rate constants incod muscle, but contradicts Reddy and Finne �986!.

refrigerated conditions, breakdown of TPP to OP was completeafter 4 days of storage while frozen storage samples stillhad approximately 354 of the initial TPP after 8 weeks.
REFERENCES
Fitchett, A.W. and Woodruff, A. 1983. Determination ofpolyvalent anions by ion chromatography. Liq.Chromatog. 1 l!.
Gibson, D.M. and Murray,C.K. 1973. Polyphosphates andfish: some chemical studies. J.Food Technol.8:197-204.
Greenfield, S. and Clift, M. 1975. Preparation of puresamples. In "Analytical Chemistry of the CondensedPhosphates." p. 186. Pergamon Press, New York, NY.
Reddy, B.R. and Finne, G. 1985. A preliminary procedurefor the detection of condensed phosphates in shrimpusing thin-layer chromatography. Proceedings of theTenth Annual Tropical and Subtropical FisheriesConference of the America's 10th Year, New Orleans, FL.149-156.
Reddy, B.R. and Finne, G. 1986. Hydrolytic and enzymaticbreakdown of food grade condensed phosphates in whiteshrimp ' s! held at, differenttemperatures. Proceedings of the Eleventh AnnualTropical and Subtropical Fisheries Conference of theAmerica's 11th Year, Tampa, FL. 201-212.
SAS. 1982. "SAS User's Guide: Statistics". SAS Institute,Inc., Cary, NC.
Schwartz, B. 1987. Personal contact. FMC Corporation.Philadelphia, PA.
Spinelli, J., Pelrog, G. and Miyauchi, D., 1968.Irradiation of Pacific Coast fish and shellfish. 6-Pretreatment with sodium tripolyphosphate. Fish.Ind. Res. 4,37.
Steinhauer, J.E. 1983. Food phosphates for use in themeat, poultry and seafood industry. Dairy and FoodSanitation. 3�!:244-247.
Sutton, A.H. 1973. The hydrolysis of sodium triphosphatein cod and beef muscle. J. Food Technol. 8:197-204.
349

Tenhet, V., Finne, G., Nickelson II, R., and Toloday, D.1981a. Penetration of sodium tripolyphosphate intofresh and prefrozen peeled and deveined shrimp. J. FoodSci. 46:344-349.
Tenhet, V., Finne, G, Nickelson II, R., and Toloday, D.198lb. Phosphorus levels in peeled and deveined shrimptreated with sodium tripolyphosphate. J. Food Sci.46:350-352.
350

Enzymes of Commercial and Scientific Importance fromCold Water Fish Intestines
Robert D. Ri.ley, Kelly M. Sledz, Jon B. Bjarnason, and Jay W. Fox*University of Virginia School of Medicine
Microbiology DepartmentCharlottesville, VA 22908
*To whom correspondence should be sent
INTRODUCTION
Trypsin is a proteolytic enzyme found in the digestive tract ofmany organisms. This enzyme is a member of the serine proteinase classof proteolytic enzymes Fersht, 1985!. The active site of the serineproteinases has been shown to contain three critical residues for catal-ysis: serine 195, histidine 57, and aspartate 102. These residuescomprise the catalytic triad of this proteinase class Fersht 1985!.Trypsin demonstrates a rather limited specificity for peptide bondhydrolysis. The primary sites of trypsin cleavage are carboxy toarginyl and lysyl residues
Enzymes generally have temperature and pH optima at which they aremost active. The optimal temperature for enzymatic reactions inhomothermic organisms is usually regulated via the maintenance of aconstant body temperature. At this temperature, normal metabolicprocesses are possible. However, in the case of poikilothermicorganisms organisms which do not regulate their own body temperature!the body temperature is dependent upon the ambient environmentaltemperature. In poikilothermic organisms adaptation has occurred whichallows for normal metabolic processes to take place at the temperatureof the environment at which the organism inhabits. It has beendemonstrated that poikilothermic organisms which inhabit coldenvironments often have ehzymes which have greater catalyticefficiencies as compared to homologous enzymes isolated from homothermicorganisms Hochachko and Somero, 1987!.
The Atlantic cod Gadus morhua! is found off the coast of NewEngland, primarily inhabiting waters where the temperature is approxi-mately 4 C. Consequently, the enzymes of the cod must be capable offunctioning reasonably well at lower temperatures. However, whenconsidered in light of Arrhenius's law, one would expect a decrease incatalytic activity of the enzyme at lower temperatures. In this studywe report on the temperature dependence of catalysis by cod trypsin aswell as its temperature stability. This data is also compared to thatfound for the homologous enzyme, bovine trypsin. Finally, our datasuggest that the higher activity of the cod trypsin at lower tempera-tures, as compared to the bovine enzyme, is related to a decrease instructural stability.
351

RESULTS AND DISCUSSION
Following a modification of the method of Simpson and Haard�984b!, we have isolated four trypsins from homogenized pyloric ceca ofthe Atlantic cod. The ma]or modifications involved two additional chro-matography steps following affinity chromatography on Benzamidine-Sepharose 6B. The first was anion exchange chromatography on a Mono-Qcolumn Pharmacia! and the second by hydrophobic interactionchromatography on a Spherogel-TSK phenyl-SPW column. Purity of theenzymes was determined by native and SDS PAGE Pharmacia PhastGelelectrophoresis!. Only the major trypsin isolated by this procedurewill be discussed.
The enzyme we isolated was classified as a trypsin on the basis ofseveral experimental procedures. The enzyme bound to the p-aminobenza-midine Sephrose affinity column and demonstrated, esterase activity ontosyl arginine methyl ester TAME! Worthington Enzymes, 1977! andamidase activity on benzoyl-DL-arginine p-nitroanilide BAPA! Erlangeret aI., 1961!. These hydrolytic reactions were inhibited by PMSF andaprotinin. The molecular weight of the ma]or trypsin was estimated bySDS PAGE to be approximately 24,000. By isoelectric focusing PharmaciaPhastGel electrophoresis! the isoelectric point was estimated to be 6.5.
The amino acid composition of the protein was determined foLlowinghydrolysis of the protein in 6N HC1 and derivatization of the resultantamino acids with phenylisothiocyanate Table I!. Heinrikson andMeredith, 1983!. The N-terminal amino acid sequence was determined onan Applied Biosystems 470A gas phase sequencer with an on-line 120 PTHamino acid analyzer Table II! Hunkapiller et al., 1983!. A sequencehomology search was performed using the FASTP program of Lipman andPearson �985!. The results of the homology search are shown in TableIII.
Figure 1 shows the relationship of the catalytic activity ofbovine trypsin and cod trypsin to temperature. The temperature optimumfor the bovine trypsin is approximately 5-10 C higher than that of thecod trypsin. The cod trypsin appears to lose activity at a lowertemperature than the bovine. However, at low temperatures, the codtrypsin is significantly more active than the bovine.
352
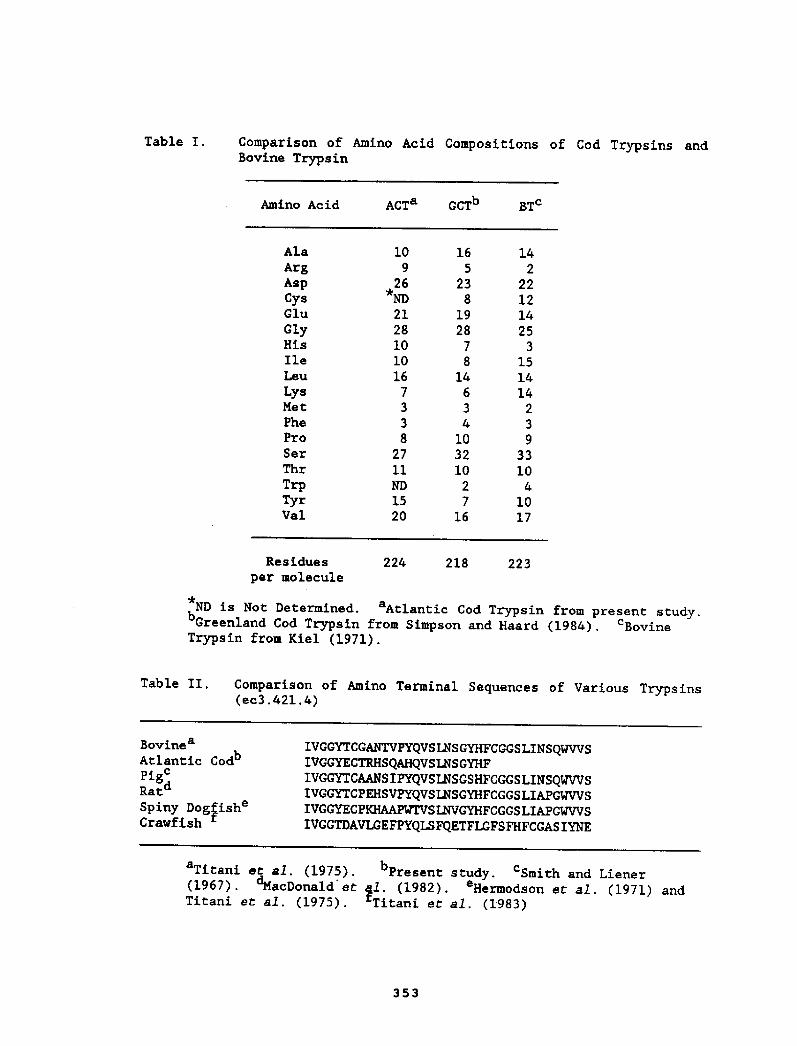
Comparison of Amino Acid Compositions of Cod Trypsins andBovine Trypsin
Table I.
ACTa GCTb BT'Amino Acid
224 218 223Residuesper molecule
*ND is Not Determined. Atlantic Cod Trypsin from present study.Greenland Cod Trypsin from Simpson and Haard �984!. Bovine
Trypsin from Kiel �971!.
Table II. Comparison of Amino Terminal Sequences of Various Trypsins ec3.421.4!
BovinesAtlantic CodpigcRat
Spiny Dog isheCrawfish
IVGGYTCGANTVPYQVSLNS GYHFCGGSLINSQWVVSIVGGYECTRHSQAHQVSLNS GYHFIVGGYTCAANSIPYQVSLNSGSHFCGGSLINSQWVVSIVGGYTCPEHSVPYQVSLNSGYHFCGGSLIAPGWVVSIVGGYECPKHAAPWTVSLNVGYHFCGGS LIAPGWVVSIVGGTDAVLGEFPYQLSFQETFLGFSFHFCGAS IYNE
Titani et al. �975!. Present study. Smith and Liener�967!. MacDonald et gl. �982!. Hermodson et al. �971! andTitani et al. �975!. Titani et al. �983!
353
Ala
ArgAspCysGlu
GlyHisIleLeu
LysMetPheProSerThr
TrpTyrVal
109
26*ND
2128101016
7 3 38
2711
1520
16
523
819
2878
14
6
3
10
3210
27
16
14 222
1214
25 315
14
14 2 3 93310
4
1017

Table III. Comparison of Trypsin Sequences by FASTP
82.5% identity in 228amino acid overlap
Pig, trypsinogen:
74.7% identity in 229amino acid, overlap
Rat, trypsinogen II precursor:
73.44 identity in 229amino acid overlap
Rat, trypsinogen I precursor:
66.5% identity in 227amino acid overlap
Spiny dogfish, trypsinogen:
41.5% identity in 236amino acid overlap
Crayfish, trypsin I:
70.3% identity in 37amino acid overlap
Cod, Gadus morhua, NH2-terminal:
280
240
200
~ 160
120
80
40
0 10 20 30 40 50 60 70 80Temperature C
Figure 1. Turnover Number of Cod Trypsin ~ ! Compared to x! Bovine Trypsin. The kcat was determined using TAME asthe substrate while incubating the trypsins for 5 minutes atvarious temperatures, then reading spectrophotometricallytheir change in absorbance at 247 nm.
354
Sequences are compared to bovine trypsinogen Lipman and Pearson, 1985!

The temperature stability of the cod and bovine trypsins was exam-ined by a set of experiments. The first experiment was designed toobserve the rate of loss of esterolytic activity with time at a constanttemperature �5 C!. As can be observed in Figure 2, the loss of activ-ity of the cod trypsin was faster than bovine trypsin. In the secondexperiment the trypsins were incubated at various temperatures for 30minutes followed by esterolytic activity assay. Over the temperaturesassayed the cod trypsin had lost approximately 50% of its activity atthe 48 C incubation temperature whereas the bovine trypsin appeared tobe stable over the temperature range tested Figure 3!. In the thirdexperiment the melting points of the trypsin were assayed for by thechange in the intrinsic fluorescence of the proteins. The enzymes wereplaced in thermostated quartz cells in the fluorometer and the tempera-ture raised at a constant rate. As can be seen in Figure 4, the T forthe cod trypsin is approximately 52 C and the T for the bovine trypsinis approximately 58oC.
2.00
1.75
1.50
'f.25
1.00
0.75
0.50
0.25
20 40 60 80 100 120
Incubation Time Min.!
Stability Over Time of Cod ~ !enzymes were incubated at 45 Cby assay of their rates of
Change in absorbances were
Figure 2. Comparison of theand Bovine Trypsin x!. Thefor various times followedhydrolysis on TAME at 25 C.measured at 247 nm.
355

100
80
60e0
I g 40
20 10 20 30 40 50 60 70Incubation Temperature C
Figure 3. Comparison of the Thermal Stabilities of Cod ~ ! and BovineTrypsin X!. The enzymes were incubated at various temperatures for 30minutes and then assayed for their rate of hydrolysis of TAME at 25 C.Change in absorbances were measured at 247nm.
o 350
a 348
346
~ 344
342
340
338 $0 20 30 40 50 60 70 80Temperature 'G
Figure 4. Thermal Denaturation of Cod ~ ! and Bovine Trypsins x! . Theenzymes were subjected to increasing temperatures at a rate of l C/min.The temperature was measured in the cuvette. The excitation wavelengthwas 280nm and the change in the maximum emission wavelength wasdetermined. The T of denaturaton for the cod trypsin is approximately52 C while for bovine trypsin it is approximately 58 C.
356

All of the data we have presented in this paper demonstrate thatthe cod trypsin is thermally less stable than the homologous bovineenzyme. The interesting question is whether the decrease in thermalstability of the cod trypsin is related to its higher enzymatic activityat lower temperatures compared to the bovine enzyme. One possibleexplanation may rest in the fact that at lower temperatures mostproteins become less flexible. Nevertheless, a certain amount of flexi-bility is often important in enzymatic reactions where the enzyme mustbind substrate s!, carry out the catalysis, and then release the prod-uct s!. One can envision that all of these steps necessitate somestructural flexibility on the part of the enzyme for optimal contacts tobe made. At the lower temperatures, the optimal contacts may berestricted due to decreased structural flexibility. Therefore, enzymeswhich maintain a high degree of activity at lower temperatures may infact be able to do so as a result of their overall increased flexi-bility. This increased relative flexibility is reflected in their lowerthermal stability as is the case observed for the cod trypsin. Exactlywhat changes in the structure of the enzyme give rise to these catalyticproperties are currently under investigation in our laboratory.
Finally, we wish to point out the commercial relevance of thisresearch. Just as finding enzymes which maintain their activities athigher temperatures is an important endeavor in microbiology, biochem-istry, and food science so is the search for enzymes which carry outcertain reactions at lower temperatures; temperatures at which lessthermal energy is necessary to put into the reaction system resulting ina more economical process. Also certain industrial enzymatic processes,due to lability of the reaction, would perhaps be best performed atreduced temperatures yet with a reasonable catalytic efficiency.Enzymes such as those isolated from cold adapted organisms may be usefulin this role. Furthermore, the investigation of these enzymes willhopefully lead to the structural understanding of this cold activity andallow for the application of these structural rules to genetic engineer-ing of other enzymes with altered temperature dependent catalytic effi-ciencies.
ACKNOWLEDGEMENTS
This work was supported by a grant to JWF from the Virginia Gradu-ate Marine Science Consortium.
REFERENCES
Erlanger, B. F., N. Kokowsky, and W. Cohen. 1961. Arch Biochem95:271-278.
Fersht, A. 1985, n t e a d M cha 'sm. W. H, Freeman andCompany, New York. pp. 17-22, 27-30.
357

Heinrikson, R. L., and S. C. Meredith. 1984.136:65-74.
Hochachko, P. W., and G. N. Somero. 1984. o ca da tatPrinceton Univ. Press, Princeton, N.J. pp. 355-449.
Hunkapiller, M. W., R. M. Hewich, W. J. Dreyer, and L. E. Hood. 1983.91:399-413.
Press, New York. pp. 249-275.
Lipman, D. J., and W. R. Pearson. 1985. ~S e ~ 227:1435-1440.
257:9724-9732.
Simpson, B. K., and N. F. Haard. 1984a.62:894-900.
Ce
Simpson, B. K., and N. F. Heard. 1984b.75B:613-622.
Titani, K., L. H. Ericsson, R. G. Woodbury, and K. A. Walsh. 1915.
Titani, K., T. Sasagawa, R. G. Woodbury, L. Ericson, H. Sorsam, M,
1977. ed. Decker, L. A, Worthington BiochemicalCorporation, New Jersey. pp. 221-224.
358
Hermodson, M. A., R. W. Tye, G. R. Reeck, H. Neurath, and K. A. Welsh.1971. +Q!~e ~ 14:222-224.

BIOCHEMICAL FISH QUALITY EVALUATION WITH RECOMMENDED METHODS
P.J. Ke and B.G, Burns*
Department of Biochemistry Food Science Program!Memorial University of Newfoundland
St. John' s, Newfoundland Canada AlB 3X9 *Halifax Laboratory, Fisheries & Oceans Canada!
ABSTRACT
Biochemical methods for fish quality, evaluation have been reviewedand selected, and in most cases, tested for applicability to Atlanticspecies. The recommended procedures published in Canadian TechnicalReport of Fisheries and aquatic Sciences No. l448, 1986! have beensummarized and discussed. The results from both physical grading andbiochemical tests have been compared for various quality operations inthe field and laboratory. The biochemical fish quality assessment isspecific, ob]ective and reliable with the over-all error for no more than16X by using the recommended methods. The guidelines of selecting biochemicalquality parameters have been also discussed and recommended. The gradingstandards of various fish products can be determined correlated by applyingthe described procedures.
INTRODUCTION
Fish and seafood products are relatively unstable in fresh, frozen,and other forms of preparations. Quality changes occur readily for avariety of reasons. Accurate measurement of biochemical composition andfreshness quality are important from both economic and processing efficiencyaspects. In the laboratory, fish may be considered a biological-chemicalentity. The meat is composed of about 70-80X water, 16-20X protein, 1-15X fat, and traces of inorganic salts and minerals. Kreuzer, 1971!.The first. component, water, is the life-giving substance surrounding andsuspending other molecules and acting, as the medium in which biochemicalreactions take place. The fat content of fish is relatively low andalthough fat oxidizes during, storage to produce off-flavours. The lipidsin fish may be considered as the body fluid for biochemical quality analysis,and becomes more important during frozen storage Martin et al., 1982!.The remaining component, therefore, which is responsible for the decreaseof quality is protein.
Protein is an ordered array of very large molecules and predominantlyof structural function. However, one protein class, the enzymes, is veryactive in quality indicating reactions. The delicate state of enzymeequi.3.ibrium and control maintained by body regulators fails when anorganism dies and from that point enzymatic reactions proceed unhindered.Not only are these by-products foul smelling and putrid to the taste, butin fish some may produce undesirable texture denaturation and discolorations.
While living, all organisms have protective mechanism barring theentrance of bacteria. When life processes stop, bacteria quickly invadethe body and secrete powerful enzymes to begin the digestion of tissues.
359

Therefore, at death, fish enter a state of uncontrolled enzymatic proteindegradation from both natural and bacterial sources which results in theaccumulation of peptides, amines, ammonia and other nitrogen containingcompounds. While this chaotic state is undesirable for preservation, astudy of the levels of quality indicating compounds sakes it possible todevelop various biochemical methods for the assessment of objective fishquality Ke, et al., 1981 6 1984!.
RECOMMENDED lABORATORY METHOD
Table l. Selected biochemical method for assessment of fish quality»
Method Description
Trimethylamine TMA! Extrac t. /photometry Dyer, 1959;Regenstein, 1982!
Total Volatile base TVB-1!N 0 II TVB 2!
Direct with MgO Botta, 1982 & 1984!MgSO4 Distil. Montgomery, 1960!
Hyposanthine HX-1! Enzymatic/photometry Spinlli, 1964;Burt, 1977!HPLC Burns, 1985! HX-2!
Thiobarbituric Acid Reactivesubstrates TBARS!
Distil./photometry Ke, 1984!
Peroxide Value POV!
Carbonyl Value CV!
Free Fatty Acid FFA!
Extraction/titration AOCS, 1971!
photometry Waternabe, 1974!
MGP-titration Ke, 1978!
360
To perform biochemical assessments accurately and with confidence,and to be able to compare results between testing, facilities, it is necessarythat standard procedures be used. This recommendations of twenty-onelaboratory methods is an attempt to compile such a standard. The procedureshave been drawn from current literature and experience and have beentested by HaLifax Laboratory, Fisheries and Oceans Canada for theirvalidity or appropriateness. Results of such testing were considered inthe outlining of methodology.
The procedures have been divided into sections of proximate composition,quality indices of refrigerated or fresh storage, quality indices offrozen storage lipid and non-lipid related! and physical attributes.Each method is followed. by applicable references where additional informationmay be obtained regarding any aspect of the procedure, its application orinterpretation. A brief of above selected methods have been listed inTable 1. The complete text of these laboratory methods for assessment offish quality has been published by Fisheries & Oceans Canada Woyewoda &Ke, 1986!.

Extraction/photometry Dingle, 1967!Extractable Protein Nitrogen EPN!
*Summarized from "Recommended Laboratory Methods for Assessment of FishQuality by Woyewoda et al., 1986. Can. Tech. Report Fish. Aquatic Sci.No. 1448.
For the proximate composition which is also important for variousobjective quality assessment of fish, eight procedures such as the contentsof bone, salt, ash and fats, and the measurements of proteins, moistureand pH, have been also specified and recommended with those qualityindices in the same publication Woyewodn & Ke, 1986!.
RESULTS AND DISCUSSION
In the national quality enhancement program from 1981, ~ariousgrading operation at the selling points by the recommended physical andsensory evaluation for fresh fish have been conducted Some of thesesample have been collected and analyzed in our laboratories by variousbiochemical methods. The selected results have been summarized in Table2.
Table 2. Comparison of the Selected data of grading data of thedata of the fresh groundfish
Grade at v v at o X
a e od
A Excellent! 16
28A/B 12
B Acceptable! 1014
13
R Rejected! 15 13
361
Dimethyl Amine DMA!
Formaldehyde FA!
G/P Value
photometry Costell, 1974; Dingle, 1977!
photometry Costell, 1973; Connell, 1975!
HPLC Burns, 1985!

For various fish products, a comparison of overall errors betweenphysical and biochemical quality assessments have been listed in Table 3.Some of these data were calculated from the limited experiments. Thusthese results can just give you some information and comprehensive workshould be made to develop the better guideline and standards for variousfish products.
Table 3. Comparison of the overall error between physical and biochemicalquality grading.
Products
Physical Biochemical
va U&t
Frozen Cod Fillet
Frozen Herring BLock
Fresh scallop
Frozen crab meat
Frozen squid
Fresh sea cucumber
15
21 13
13
16
20
>30 12
Various quality parameters which are sensitive and reproducible, andtheir changes as a function of quality deterioration and keeping time, canbe selected and applied to fish quality evaluation. Comprehensive reviewson quality indicators have been initiated in our laboratory. The mostuseful quality parameters are total volative bases, total volatile acids,extractable proteins, hypoxathine, trimethylamine, dimethylamine, thio-barbituric acid-reactive substances, free fatty acid, peroxide, carbonyl,pH, dielectric behaviour, polyene index and texture index, etc.
In order to develop standards for fish quality grading, the followingrules must be considered when selecting quality parameters for the laboratoryevaluation:
�! Two or more of indicators from the recommended quality indicatingreactions should be selected.
�! Two of the three types of quality changes; bacterial, enzymatic and
362
The three grades, A excellent!, B acceptable! and R rejected! wereused for this evaluation for iced fish at the dockside and the sellingpoints. The reliability of biochemical examination for Crade A fish andon the determination between grade A or B, were better than the physicalgrading results. When the quality changes further, it seems that bothphysical grading and laboratory analysis can given about same resultsvith relative deviations of about 15X.

chemical reactions aust be covered froa above indicators selection.The amor reacting co|sponents are proteins, fats, waters, and indicatingcompounds. At least Ceo of these components stust be related byabove selected ~o or sore quality reactions.The parame ter o f a group o f indicating compounds such as TVB, FFAvould give better reliable results than froa single coepound.
Figure 1
SCIENTIFIC QUAUTY GRADINGFOR FISH
363

A brief procedure for selecting quality indicators and developingthe grading standards has been shown in Figure 1. The selected examplesfor biochemical evaluation of fish quality have been listed in Table 4for your information and comparison.
Table 4. Selected quality indicators for some fish quality assessment.
Selected Quality ParametersFish
In addition to the grading operation, it can be concluded thatphysical grading can be employed satisfactorily for fresh groundfish andshellfish with less than 15X error on an accept/regect grade and 28X onquality differential evaluation. The Biochemical quality examinatons havedemonstrated much better sensitivity and reproducibility Table 2 and 3!,with the overall error no more than 16Z. Therefore, biochemical fish qualityevaluation could be satisfactorily employed for developing quality guide1ineof fish for various field grading operations. Those methods would alsoprovide a useful ob!ective fish quality evaluation to meet the requirementsfrom the fish inspection and industry.
REFERENCES
Kreuzer, R. 1971. Fish inspection and quality control. Fishing NewsBooks Ltd., London, U.K.
Martin, R.E., G.J. Flick, D.R. Ward 1982. Chemistry and Biochemistry ofmarine products. Avi Publishing, Westport, Connecticut.
Connell, J.J. 1980. Advances in fish Sciences and Technology FishingNews Books Ltd., London, U.K.
Ke, P.J., B.G. Burns, and A.D. Woyewoda 1984. Recommended proceduresand Guideline for quality evalutation of Atlantic Short-Fined Squid.Internal. J. Food Sci. Technol. 17:276-281.
Ke, P.J., B. Smith-Lail and A.B. Dewar 1981. Quality improvementinvestigation for Atlantic Ocean crab. Can. Tech. Report Fish.Aquatic Sci. No. 1002.
Woyewoda, A.D., S.J. Shaw, P.J. Ke and B.G. Burns 1986. RecommendedLaboratory methods for assessment of Fish Quality. Can. Tech.Report Fish. Aquatic Sci. No. 1448. �43 pages!.
364
Fresh Cod
Frozen Cod fillet
Fresh mackeral
Frozen mackeral
Fresh crab meat
Fzozen squid
Fresh sea cucumber
P 6 G value/FFA/TVB
TBARS/EPN/TVB/TMA
FFA/TVB/T BARS
TBARS/FFA/HX
FFA/TMA/EPN
TVB/FFA/TBARS
TVB/TMA

DETERMINATION OF MINIMAL TEMPERATURES FOR HISTAMINEPRODUCTION BY FIVE BACTERIA
C-M. Chen, M.R. Marshall' J.A. Koburger, W.S. Otwell andC.I. Wei. Department of Food Science and Human Nutrition,
University of Floridai Gainesville> FL 32611
Introduction
Scombroid poisoning, one of the most common foodbornediseases in the U.S. Taylor, 1986!i is caused by theingestion of spoiled scombroid fish which contain unusuallyhigh levels of histamine. The so-called scombroid fishysuch as tuna, mackerels and skipjack are frequently involvedbecause they possess large amounts of free histidine intheir muscle Lukton and Olcotti 1958!. By enzyme action<
. histidine is converted to histamine by microbial histidinedecarboxylase. The Food and Drug Administration hasestablished a defect action level for histamine, 50 mg per100 g canned tuna Federal Register, 1982!.
The bacteria that possess large amounts of histidinedecarboxylase mainly belong to the familyEnterobacteriaceae. Other bacteria, such as Vibrio>Clostridxum and Lactobacillus have also been reported to
1980; Taylor, 1986!. Hovever, Proteus ~orcpanii, Kiebsiella
bacteria that have actually been isolated from incriminatedfish involved in scombroid outbreaks'
During fish processingi bacterial histamine formationis controlled primarily by low temperatures. In the retailmarket> tuna fish are usually covered with ice or simplyplaced on ice to prevent spoilage' However< storage underthese conditions for long periods of time can result inmicrobial growth and conversion of histidine to histamine.A better understanding of the lower temperature limit forbacterial growth and histamine production is thereforeimportant to control fish quality and safety. This studywas undertaken in tuna fish infusion broth TFIB! todetermine the low temperature limits of the five mostimplicated histamine-producing bacterial strains.
365

Materials and Methods
Bacteria
Five strains of histamine-producing bacteria,Klebsiella pneumoniae 111-5 and T, Proteus morccanii 11USC-2
Dp mart em nt ~oFood mxcrobxology and Toxicology, Universityof Wisconsin at Madison! were used. The cultures weremaintained on trypticase soy-histidine �%! agar slants andstored at refrigeration temperatures.
Media and rowth conditions
Trypticase soy broth-histidine medium TSBH! was usedas the preinoculum broth. It contains per liter: 30 gtrypticase soy brothy 1 g histidine monohydrochlorideF and5 mg pyridoxal hydrochloride. The final pH of TSBH wasadjusted to 6.8 before sterilizing for 15 min at 121 C.
Tuna fish infusion broth TFIB! was prepared from freshtuna muscle by homogenization with 2 volumes of distilledwater wt./vol.!F steaming at 100 C for 1 hr, filtration,
osupplementation with 1% glucose F and sterilization at. 121 Cfor 15 min Taylor et al., 1979!. The final pH was 5.7.
Before assaying, the bacteria were activated in TSBHand incubating at 28 C for 24 hr. Aliquots of 0.2 ml weretransferred into another fresh preinoculum broth andincubated for an additional 18 hr.
A 0.2 ml aliquot of the activated bacterial culture wasinoculated into 70 ml of TF1B in duplicate Erlenmeger flasksand incubated at different temperatures � F 5 F 7 F 100 0 0
15 and 25 C! in a constant temperature refrigerated waterbath shaker with a shaking speed of 100 rpm. At varioustime intervals �F 24, 48, 120, and 240 hr!, aliquots wereremoved from each sample for aerobic plate count APC! andhistamine analysis. A blank TFIB was used as a control.
APC was conducted using a spread plate method Specky1984! of serial dilutions of the bacterial cultures in 0.9%saline. Plates were spread on aerobic plate count agar andincubated at 28 C for 24 hr. Duplicate samples and platecounts were used throughout.
366

Histamine anal sis
Quantification of histamine was accomplished by amodified ion-moderated partition high performance liquidchromatography method developed by Gill and Thompson�984!. A hp 1090 liquid chromatograph equipped with hp85B personal computer> hp 9121 multichannel integrator andhp 7470A plotter were used. The chromatographic column wasa custom-packed IMP type HPX-72-0 OH-form! with a columndimension of 300 X 7.8 mm. A guard column packed with thesame material was also used. The chromatographic conditionswere: flow rate, 0.8 or 1.0 ml per min; detector wavelengh,210 nm; peak width, 0.5 min; chartspeed< 0.2 min; andinjection volume< 20 pl. The mobile phase, 0.01 N NaOH pH11.5!, was prepared fresh daily using HPLC grade water andfurther filtered through a 0.45 pm millipore filter.
Histamine standard solutions were prepared bydissolving 165.6 mg histamine dihydrochloride in 100 ml of6% perchloric acid PCA!-30% KOH solution pH 7! to obtainan equivalent 100 mg% histamine stock solution. Histamineworking standards of 0.1, 0.2< 0.4, 0.8, and 1.0 mg% wereprepared from the stock standard. For HPLC analysis> aninjection volume of 20 ul was used.
Five-ml aliquots of TFIB from the duplicate cultureflasks at each incubation period were mixed with10 ml of 6% PCA solution and homogenized with a polytronhomogenizer at setting 5 for 1 min. The homogenate wascentrifuged and the supernantant filtered with a Whatman 4 1filter paper. The filtrate was then brought to 10 or 25 mlwith a 6'% PCA solution followed by pH adjustment to 7.0 witha 30% KOH solution. Potassium perchlorate precipitate wasremoved by filtration and the final extracts were filteredagain with 0.45 gm filter paper before subjecting to HPLCanalysis. The concentrations of histamine in TFIB werecalculated according to the formula:
ClxVl V2X10 xl/0.936
C2MW
concentration of histamine derived fromchromatographed standard curve mg/ml!; C2= finalconcentration of histamine nmoles/ml!; Vl= the volume ofthe first filtrate �0 or 25 ml!; V2= total TFIB volumeremoved at each time interval; 0.93= the extraction recoveryrate; MW= molecular weight, of histamine �11.55!. Eachhistamine sample was analyzed three times by HPLC.
367

Results and Discussion
Growth and histamine production of the five teststrains at different temperatures are shown in Figures l-5.
eTFIB at 3 C even after 10 days Fig. 1!. Althoughbacterial growth occurred at 5, 7 and 10 C, no histamine0 0 0
gas produced. When the temperature was raised to 15 or 25C< this bacterium showed a normal growth pattern with the
logarithmic phase occurring in the first 48 hr and thestationary phase thereafter. Large quantities of histamine,about 340 nmoles of histamine/ml< were produced within 24 hrat 25 C. Thusf the minimal histamine productiontemperature for this bacterium was 15 C.
Similar patterns of bacterial growth and histamineproduction occurred for K. neumoniae T Fig. 2! However>this organism produced hxstamzne at hand 10 C After 5days. Again, at elevated temperatures< histamine productionwas greatly increased. As incubation proceededs the rate ofproduction decreased.
Although K. pneumoniae 111-5 and T showed similar2.
produce histamine in TFIB is strain specific. For strainT i the lowest temperature for histamine production was 7
while it is 15 C for strain 111-5 ~ Behling and Taylor�982! found that K. pneumoniae T was able to produce
m ~ n ltsuggested the lower temperature limit for histamineproduction to be 7 C.
store histamine was produced by strain 111-5 than strainT at 25 C by day 5. Thereforei the histamine-producinga!stem of K. pnenmoniae p2 appeared to be more tolerant to
n~
m """"'broader temperature range than strawn 113-5 for histamineproduction.
0 Growth of p. ~mor anii 110SC-2 was inhibited at 3 and 5C Fig. 3!. Although bacterial growth was apparent, no
histamine was produced at 10 C. The minimal temperature0
for strain llOSC-2 to produce histamine was l5 C. Smallamounts of histamine �8.8 nmoles/ml! were produced after 48hr. Behling and Taylor �982! also showed that 15 C was
368
10
3 PC
5 C
7 C
IO 'C
I5 oc
35 4C
700
600
3 ocE
SOD
~00
c
300
200
5 4C--e--
Oc-"a"
IO CCh-
15 C
35 4C
100
T i IIIe hr!
369
0
z o L4I
QIS
Figure 1. Time and temperature related growth and histamineproduction of Klabaialla ~naunoniaa ill-i in tunaf ish infus ion bro th.

10
3E
0z 8
0 5ClCl
7 C
1D C� Ch-
15 dc
t5 4C
700
800
e 500|5
400
C
aa0
~ Z00
3 C
5 4C
7 4C
1D C
15 C
t5 C100
Time hr!
370
Figure 2. Time and temperature related growth and histamineproduction of |tlebeiella pneuuoniae T> in tunafish infusion broth.

10
3 oC
aZ g
a IQ a
Cl
5 C
3 4C
iO 4-
is 4c
zs 'c
700
5
500
400
C
300
Zoa
3 C
s 4c
4C
ia 'cCb-
ls c
zs 'c100
T i me hr!
37l
Figure 3. Time and temperature related growth and histamineproduction of Ptotaua ~aot anti 110SC-2 in tunafish infusion broth.

the lower temperature limit for this organism to producesubstantial histamine levels > 2.5 umoles/ml!. Xn thepresent study, P. morcianii 110SC-2 showed the highesthistamine-producing capability among the five culturestested at 25 C. A level of 655 nmoles/ml was detected at
0
48 hr; it declined to 527 nmoles/ml after 5 days.
No bacterial growth and histamine production wasobserved for P. mor anii JN incubated at 3 C throughout the10 days Fig. 4!. At CP only limited growth occurredafter 10 daisy however> this bacterium started to grov after48 hr at 7 C. At 7 CP histamine production was 85nmoles/ml after 5 days. Behling and Taylor �982! reportedthat P. ~mot' anii JN and 110SC-2 had a lower temperaturelimit for histamine production of 15 C. However> Arnold etal. �9S0! reported P. morc anii JN was able to producehistamine at 7 C after 4 days. Thus> our results support0
the7latter report> although a larger bacterial inoculum�0 /ml! vas used in their study. At. 15 and 25 C,histamine production increased until day 5 and 2,respectively> and then levels decreased.
The psychrotrophic bacteriumg H. alvei T , vas the onlyorganism able to multiply at 2 C � lg 57 .IIis.tamineproduction did not occur until the growth temperature washigher than 15 CP although bacterial growth was readilyapparent at temperatures below 5 C. At 15 C, only anegligible amount of histamine 8.1 nmoles/ml! was detectedafter 10 days. Higher histamine levels were produced at20 C vhile at 25 C P about 300-400 nmoles/ml of histaminevere produced in 5 days.
Histamine production by H. alvei T was less and slowerwhen compared to the other four bacMeriil strains. Behlingand Taylor �982! reported the lover temperature limit forproduction of histamine by H. alvei was 30 C. Arnold etal. �980! found that H. alvei was able to produce histamineat 19 C under aerobic> microaerophilic or anaerobicconditions after 3 days.
Histamine-producing organisms are believed to producehistamine during the stationary or death phase of growth
T and 111-5 as well as P. morc anii JN and 110SC-2 attemperatures above 15 CWo not support this hypothesis.Enhanced histamine production occurred during the rapid
372

10
3 C
R 0z 6
0 0 VIR
5 C
7 C
la 'C
15 CCll0
25 4C
700
600
a 50005C
400a
+ a300
ZO0
4e
5 C
7 4C
la c
l5 C
25 C100
T i me hr!
373
Figure 4. Time and temperature related growth and histamineproduotion of Proteus ~mor anii JM in tuna fishinfusion broth.

]0
R
Ke
Q Qcn 7
2 C
5 C
2 Co
10 4C0
15 4C
20'C
25 C
700
SOO
oa 400
5 4C
5 C
7 C0300
50
ZQO
10 C
15 C
20 ClQO
Z~ C
T i 51e hr!
374
Figure 5. Time and temperature related growth and histamineproduction of Hafnia alvei TS in tuna fishinfusion broth.

growth stage with maximal histamine levels were found at thestart of the stationary or death phase. Ienistea �971!suggested that some bacterial strains possess histaminaseand thus limit histamine accumulation in TFIB. Omura et al.�978! indicated that histamine at 0.05 N in culture mediumdepressed histidine decarboxylase activity. This phenomenonmay have occurred in this study. Further research isneeded.
At low temperatures> histamine production did notcorrespond to bacterial growth. Although bacterial growthoccurred at temperatures below 10 C, histamine was not0
w � "'alvei T . H. alvei TH grew well at tepmeraturesas low as!o and 3 C, however, histamine was not detected until thetemperature was above 15 C. Thus, low temperatures mayinhibit the activity of histidine decarboxylase andtherefore affect histamine production. Further study on therelationship between histidine decarboxylase activity andhistamine formation by histamine-producing bacteria at lowtemperatures is warranted.
The low temperature limit for bacterial growth of thefive test strains is 3 C for H. alvei T8, 5 C for K.2" �"110SC-2 and JN. Noreoverf the low temperature limit for"potential" histamine production appears to be 7 C for K.
~ ~ ~and p. ~mor anti 110HC- and 20 C for H. alvei T . To
8better maintaxn tuna quailtyf the use of a temperature lowerthan 3 C is recommended.
Acknow3.edgement
This project is supported by the US Department ofCommerce grant number NA86WC-H-06106 '
375;-

References
Arnold, S.H. and BrownP W.D. 1978. Histamine ?! toxicityfrom fish products. Adv. Food Res. 24: 114.
Ar'nold P S H P Price, R.J. P and Brown P W. D. 1980. His tarn incformation by bacteria isolated from skipjack tuna,Katsuwonus ~elamis. Bull. Jpn. Soc. Sci. Pish. 46 i 991.
BehlingP A.R. and Taylor. S.L. 1982. Bacterial histamineproduction as a function of temperature and time ofincubation. J. Food Sci. 47: 1311.
Food and Drug Administration. 1982. Defect action levels forhistamine in tuna; availability of guide Fed. Regist.470: 40487.
GillP T.A. and ThompsonP J.W. 1984. RapidP automatedanalysis of amines in seafood by ion-moderatedpartition HPLC. J. Food Sci. 49: 603.
Xenistea> C. 1971. Bacterial production and destruction ofhistamine in foods and food poisoning caused byhistamine. Nahrung 15: 109.
Lukton, A. and OlcottP H.S. 1958. Content of free imidazolecompounds in the muscle tissue of aquatic animals. FoodRes. 23: 611.
Omura, Y.P PriceP RE J., and Olcott> H.S. 1978. Histamine-forming bacteria isolated from spoiled skipjack tunaand jack mackerel. J. Food Sci. 43: 1779.
SpeckP N.L. 1984 ' Compendium of methods for themicrobiological examination of foods. APHA. Washington,DE CD
TaylorP ST L. 1986. Histamine food poisoning: Toxicology andand Clinical Aspects. CRC Crit. Rev. Toxicol. 17: 91.
Taylor, S.L.P Guthertz P L.S.P LeatherwoodP N., and Ellen, R.s � '"
an incident of scombroid fish poisoning. Appl. Environ.Nicrobiol. 44: 447.
376


3 ponds the first year and 2 pards the second year in differentParMms cxmxties!. Party pound ~es were taken at each site atthe beginning, peak and end of the seasan. SeRiumnt and water werestapled in the ~mrirans of each samplirg site at each time period foreach of the 2 seasons. Crayfish were deheacLed and Smediately thehepatapamxeatic tissue was separated fram the abdcanina1 ~e. Thetl
ttmttltt&l' tt ~
One gram samples of abclauinal macle ar hspatopancreatic tissue wereII W ~&tM
tice was ~inued at 13~ far 1 to 3 hours until cxmplete. Simul-tanemaly, National Rmaax of Shmdards R3S! ~~er and bcvtrm tissuestandards, National Reseals> Cauncil af Canada lobster hepatopmcxeasstandard and reagent Mazda were li3aswise cligested. Diyasta werefiltered through Rmtmmn N'o. 42 paper and diluted to 50 mL with glassdistilled water.
Seiimsnt san@les were dried to cmstant weight at 110aC, nm~igbeX andesbmd in a maffle oven at 400aC. 'Ihe pncedLnm of Je~ �974! andSrichr and Jadcsca �974! as written in Rags �982! was used.Sediment standards, samples and blanks were digested with 1 mL aquaregia and 10 mL hydmflmaM acid far 500 mg ~es by stamlingavernigiht foU.awed hy sh&dag far 12 hours. 'Ihe digested ~es wereydakly solubilized with a suffic6ent quantity of saturated baric acidsolMLcn far the total saeple «a6ght including the baric acid to he 100grssse 'Ihe cUJgssbRR sahp3.es were c8gped tightly, left at 85klient
litt. tll ~' . I'Ihe water samples were filtered through Mhatman No. 42 paIxe. Allsamples far the ICP were pm'~ in triplicate.
~ tatttl t td ~ aatttttttt
~ filtered di~ ware analyzed an an Applied Reemmch Lebczatary Sunland, Calif.! Hach& 34100 Irxh~vely Coupled Plasma Eniseian
lt I I I tttlwas ccatzolled by soMeaze fhan Applied Reseev& Laharatexy used an aQEC PDPl103 cxaqpubm. ~ weights of all digested samples, amuate to0.1 mg, were entered into tbe aaopzbmr. Therefore, the printoutreported the results for the sediment, hepatcpmmreas, and abdcminalmacle as sg/kg and the water as ~ Reagent blanlas, and stanchrdswere analyzed simultaneously with the samples. The samples werearranged in the autasampler such that the water samples were analyzed
378


THKZ l. XI!IHQKSCN QF MEANS KR MEZZ STANCES
~ SSS S D !d0.055�.005!
NBS S.D. ! d13.4�.9!AS 1.82
<1.00fa! <0.10
<0. 10CR <0.020
<0. 020
CD N/A
28.2
13.34.37.5
2.01<0.20
N/A
0.27�.04!
0.088�.012!
3.5�.4!
0.69�.27!
193 �0!
268 8!
0.34�.08!
10.3 �.0!
0.16�.002!
0.7 2.3�.3!4.3
<0.1 1..4�.3!2 0
154 177 �0!150
l. 03 �. 19!
2.3 �. 1!
852�4!
V N/A
2W 138
94130�3!
N/A MKhNS NUZ ARLLY2ZD PCR PZ NATXCI BUREAU QF SZANDLMS CRNATZCNAL HMRKX CXlRZL OF GLNMR.
l WIW.Hem axxemtzatian of tziplicates detezmimed in duplicate in axe
lebaratazy.Nsan acexentzaticn detezndhml hy the Natianal Buzeau of Stardazds.
dStandazd deviation lcm the men.~IV ll ll
Less than values aze BLe 86 an detectian limits and dilutian zatio of~ese
380-
CU 198
191FE 278
251.PS <2.50
<2.50
Hl 10.4
9.8H" <1.00
<1*00
NI N/A
SSD S D !d26.3 24.6�-2!38.9
24.7 26.3�.1!26.4
1.17 2.4�.6!3 ' 15
<0.25 0.42�.05!2.12
370 439�2!384
159 186�1!157
N/A
67.2
59.2158157
U..36
<2.5017. 1
1.6.3<1.00<1.00
4.38
0.554.0
2.0
849769
63.0�.5!
195�4!
0.48�.04!
17.5�.2!
0.057 .015!

LA
CO LA Lh 10 CO Lh~e~rLCL H LA Pl LA Plh w ce w ee H&LAW I FlLAI I I Ch I I
H LA 0 Co Lh Pln Lh CO CO H Hh 0 W P4 m wLO W CO CO 'lO WPl hl H ~ H te
Lh LO m LA Lo LAcO LA ce 0 H hLA LA h Ch H 0H H Co 0 LCl Wrt ~ ce H c% cll
AO
10 pl ~ ~6 + '4
~ ~ h CoCh LA ~ H
II
COO I OCo Pl Lh ~
~ ~ Lh m~ Lh
0H 0 ee mO Co Ch ~
~ ~ s hPl H Pl MPl Pl H H
gQa5
~~LO ~0 HLOh~COLAeechHH LA LA h ~ h Ch
~ Q ~ ~ Q ~te ~ 00 I 0 ~HO I I 0 I 0I I OOOO
Lll Lll 0 0 H 0 eLAOHH ~ HOLo H ~ ~ 0 ~ Ce
~ ~ QQVQ ~LAOVV VO
0~cumno ioeOl Ch LA h H Lh ChOj H H & ~ 04 Pl
~ ~ ~ ~ Q ~ ~mooo V Qo
LO ~~~h
Ch ~ % Ch CO LDLO LA + ~ ~ 'O
~ pj Ch + ~ ~H I eel!HOHO I I II LAO<0 I
LA ~ LA O LA LA~ ~ e Q
~ V HhH ~le~y~y LA
ceLAHmH&m
~ % ~LA Ch~ h ~ Q ~ ~
h H Co t4 IA h
&PIWH OI CilI
Q ~ ~ ~I ch Lhm
~ I I ILO LO O r4I %Oh
00cueCO ~ ~ ~
~ hl H Ol
0 Ch rCO m LO Iee CO cO W
~ ~ ~ ~LA W LO LCL
h C%W O
~ ~Pl ChI I
h LAC% OH CO
~ ~H Pl
CO hLA LA
~ ~fe LAI
0 00 0
0 ~
V V
Ch hl h
~ ~ ~e e LAI I I
000OOO
~ t ~
VVV
pl mLh LAH LA
~ ~C4 LO
LO LALA LO
~ ~H Pl
n ce LhCil LO O
~ ~ ~te Ol Pj
LAPl ~~000
~ LA hO Hh
~ ~I Pl LA
LOLA I~ Pl lA LA
4' 0 n nI ~ OO
LO 0 ~ ~P! VOO
~ MVCe~ aaP LA
Ph 04 CoLhonCOLA ~ LA ce
~ Q ~ ~PIVQ+
~0Pl O4~0 Pl'40 ~ Ch
~ OWm H ~I I 0
OOOOh
~ ~ H0 0 ~V VQ
LA H Al LALO W Lh C%0lhhPI
~ ~ ~ ~&HO~I I I I
LA O O OP�000 HAH
~ ~ ~ sOOOOVVVV
LA ceCo 0Pl Ch
~ ~0 CoI I
LA LAPl Pl0 0
~ ~0 0y V
Pl H~ Cri
O4 LOI
0 ILA O
~ LA
V H
CoLCL ce
~ Ch
0O ~~
~ Lh LA
~ ~I eO
0 I I000
~ 00~ ~
VHH~v V
00 Lh n
~ ch Cil~ ~
V cew
O~
H 0
I LA0 I00
~ 0H ~V H~v
0O Co
~ 0
V ~
c% m LA LO
~ ~ ~ ~HWLOmce ol H g0I I I I
QOOQLA LA LA LA
~ ~ ~ ~
VVVV
Pl 0 LO HLO LO Lh Co
~ ~ ~ ~hhLOm
O~
HQ
84~R
hlCilh W CO LC! 0Co LO pl W H Co Ceh & H Co LO 0 P!
~ ~ ~ ~ ~ ~ ~0000HHO
Pl Pl'LI' CO0 A
~ 00 ce
4 0 H
3
a O
382
R
W Co
CO O
g P4
Ra
OR OR HOBH Q
53
ORR H0 OX H
~ I4
&0
~ 4
LA H Fl LO ~ ~HOLh~ W Pl W LA H CO
~ ce a8 IOLh&HH'4!~ ~ LO Lh ~ ~ ~ ~ m
LA Pl Pl ~ a5 Pl ~~ ~ ~ O Pl lO fe ~ ~LCLAHO ~ M ~ mFlch I I I I
I I ee w hw o ~ oooo'4 % h I W LA CO N LA A Pl h 0 0 0 0 h 64mLOLAe1nWLO I OLAWchWWWWWLO
~ h ~ h LO fe < 0 H A I R ~ ~ ~ ~ CLL LACh ~ R ~ I I ICOSI I 0 I OOOO ~ ~
hLACu~LA~Cu V V V VWWm
Mal 04~co ce~ce 0LohH Lh~~~ ~~ ~OPS Ce h LA P4ChFlCh & 0 LO Wr LhWCOru
~ ~ ~ ~ LO Lh h e LA n Ce ~ ~ LA m W cn WLh LA m A LA H Ch LA % m m Fl O ~ ~ ~ ~ ~w H m H LA LA & w ch de & pt v H & & p4 ce

aCI cCI
l0 ~ ~~~~~m t1 Ch h Ih Ch c0
~ ~ rl ~ 6 Ih ~L0 Oi ~ N ~ ~ Ch6 R l0 Ih L0 0 L0I I
OQ I I I I Iooei0ec ce e e ch e e e
~ ~ m ~ ~ m ~0 0 ~ Ch CO ~ 0V VLOL0&L004
~ 4I
Ch ~lh hn n Ih h
~ CO ~ ~tl ~ Oi t4Ol Pl CO WIr4 I I
lh I 0 C4Ih LO Ih 0
~ Ch ~ ~L0 ~ Ih RW Ch W W
c4I
LhcO~chICIOW IA c4chechw&LohwLA0 CO Fl + R IA ~ ~ 0 Lh e ~ LA Ch ~ Pl CC ~
~ ~ g ~ ~ ~ ~ Ch p! ~ ~ ~ ~ g ~ ~ g ~ r mh e ~ e 0 10 IO CO 0 0 Oi h h h IA Ch ch Lh d fVReihnc oia ~ Rewrqc4+eewcvrI I W I ~ I I cO I ~ I I I I I I I I I I
co & I e IA e co I ch IA e c4 ch co e pl w ch M LAc0 A h LO I 0 el 0 0 I Ih e W O e & CO c
~ m ~ Ch ~ ~ 0 ~ h CIl L0 ~ ~ ~ h ~ ~ ~ ~~ Ih ~ LA e Lh h ~ Ch Pl ~ ~ N e Ch ~ m R Oi 0
h cv e n ~ Lh ee e ru ~ co co w m ru m Lh e ru ch
IALopllh CCLA LA Loeo&plwewemLO m W 0 W e lh r e W LO 0 C ~ e cO ~ Lh CO
~ ~ ~ ~ Q ~ ~ P! ~ h ~ ~ s m ~ ~ LO ~ ~ m0 m 0 0 ~ Ih 6 ~ h ~ 4 h m CC '0 e 0 m Ch 0w c4 w cfi IA h w IA IA p! w A w w pl w w w e w
O
~e e Ih cO IhO ~ m Pl IA CO R 0 00 0 W n LA h CC IA LA
s V ~ ~ ~ ~ h ~ ~I hlC4 Oel ~ ecto
VO I I I I &VVI 000 00 I I I
oeoo oo Roo0 ~ ee ee MIAIA~ Q ~ ~ ~ ~ CIl ~ ~
A V 0 0 O O ~ Ol C4V~VV VV &VV
OOOO '00&<8 eel AOOOOOO OeAOI hPI ChIAIA
~ ~ ~ ~ ~ ~ QPj Cg Ch g e ~r4664 Ro i . ~ ~ ~ . ~ 0404VVVV Yves& OA &VV
rt ~IA hlCh 'O ~ ~
~ e4h L0C% L0 6 h
I II Inn
Ol Ol A OIh Ol ~ ~
~ ~ g +c 0iae
chLOIOeLAL0nco e 0 c
~ ~ ~ ~ ~ ~ ~0 OI Pl Ch CO Ol WWA&lhW&IA
IA CO W lh Wm C I n ~
~ R e ~ pfrl ~ ~RaW W CO W W
oeo~ Q ~
IA ~ CCC4 glh
A5
W W ChL0 h ee
~ ~~ 0 Cil
I II QO
'IO IA IAW PIC%
~ ~~ 00
avv
~ CVl0 AII OC ~ C%0 II 0
e IAICl CCt4 ~
~ O0 V
t0 10 e Ol10 e 10 W
~ ~ ~~ Olcl R
WWC%IAI I I
C% Ih 0 h0i e oi pl'L0 Ch e A
~ ~ ~ ~OP!RIA
~ ~el OL0 NI I
PhIA C
~ ~IO L0
OOOOOOOO
~ ~ 4 ~
VVVVI I I I
OOOOooaa~ ~ ~ ~
A W r4 AVVVV
hrlhlh 0 ceCl e Oi
~ ~ ~000
er
e c%~ 0
0 8
CiW PlPlAhhl0CIA ~ ~
~ ~ e CIlWr WCC
IO rf0 Ol
~ ~
Ol W
Q ~IA lhC% Pl
~ PlO I0 IIA 0CC Ih
~ COQ ~V 0
0 Ih OW t4
~ 0Q ~V W
Oi ~00ch 0
~ R
0 I n0 I0 0e o
0 ~V 0
0O h
0 ~V W
C nm lhe h
~ ~IA IhI I
CO COF1 O0 IA
~ ~
&Oee IA w
~ C4 ~C4 V IAI I I
COO O0 Lh Lh
~ ~~ hl CC
&VV
C% 0 Oh0 a
~ ~
Mi V VI I
Ih 0 0CO 0 O
~ ~~ R R
Pl V V
CO Ch Ph IO& c% co eCC 00 0 A
~ ~ ~ ~
I I I II0 0 Oi Ch& hI e IclIA co co e
~ ~ ~ ~000~
RoaW IA Lh
~ ~~ CC N
WV V
eOOeoa
~ ~~ + Q
IA V V
LO Cr4 c0 e giCh CO lV Pl
~ ~ ~ ~Oe~~
Ch L0h Ch
~ ~c4 e
0 H Q0 Rm Klh Pea Rlh ala<V< COP k<OI-'I COP 0<O
0 0
383
O IA ~~cI co 0
~ IO AO R Oi
a ~I 60
a Ilh 0 0C% IA IA
CLI C4Q ~ ~Voa~v V
0
Al Al A~ hh
Q ~ ~voa
0O ~~
~~~~~~ e 0 Pl0 0 0 0 0 0 ~ co eQQQQQQQCOQ
~ ~ ~ ~ ~ ~ V ~ ~I
VVVVVVO I II I I I I 000
ooaoaaeoo000000 ~ ee
~ ~ ~ ~ ~ ~ Q ~ ~WWAAWWVOQVVVVVV~VV
0ooaoooo'oh0 0 0 0 0 0 e co IA
~ ~ ~ ~ ~ ~ ~ Q gRRARRAO ~ ~VVVVVVVWW

CO O CO~ ~
~ R LCIIA CO 0
I ICILIA I
~ e'IC W Ch& W Pl
Pl 0 Ch f4 IA~ Cq ~ ~
~ C4 ~ 0 hP! 0 Ol Ol &C ACORNI I I I I
C %COD~ ~
~ ~ ~I WAla&LA W & W W
OIA O R O~ ~ ~ ~
0 Pl W WA 0 Lh W
I I I I& Ch 0 COIA Pl ~ Ol
~ ~ IA ~ee C C40weve
Ple Lhw e ol
~ ~ ~Ol Pl C%c c c4I I I
IA Ol MC
~ ~ ~e co w
n c c~ Pl W
~ ~CO W Ch~ CO &I I I
IA CO LAPl& Lh
~ 0pl e ~O PO CO
LO
W LO
I I0 e
c4 eIA e
~ ~LO WOl W
W 00 0I
4L Ch CO Ch Lh LAOe& ~ ~
~ ~ ~W LO A & Ole w e IA w
Ol EhLA ~ e
c4 w eIA W
IA IA C4~ CO K
Ip! ~ ~n CW IA W
0 0mv m'0
~~ IAM&COWIA t4Pl LA
~ ~ 000 II I 0
0000 0 r4tE R ~
~ ~ 000 v
0LA C4 O
Ol V ~~ ~ 0
00 y
Ple CO
0 I I0 0
0 V V
0IA
IP4I
PlPlPl
0
0
m m
0m
gP 4
8
mm
0
dl eIA ~
~ LAIA II 0
% 0Pl ~
~ t0NI V
e IACh ChIA ~
00
LO Plo e
~ ~
'0 m0
C m Qeeg 4
'0 0C4LLI 4
m m 4~ ~
I- I4 C4 0~ov
,~ 0 +mW4~4L~ W~m 4LLI b I.-R~ 0
m~ y
SOI g 4L
4 QM +RO
ewee ol wp! e ol
~ ~ ~000I I I
aoo000
~ ~ ~000VVV
CO
a~ 0
I0 I
0 0 y
0 O ~
V ~I u
0 I0 0
~ Q
y C4
o O IA~ Pl
y pl
IAPl
0 0 00 y
C4 ~IA IA
~ QH 0 ~
~ IIAW II coo
ch ~ ePf 6 ~
~ 8 LOIPg
c
~ ~' ~
Al Pl OIALIlo~
~ ~ ~co ol e 0A Pl Ol ~I I ILO
C4h Ch IF4 Ol Pl e
~ ~ ~ eC4 CO C% ~
e ~ IAown
~ ~ ~Plch % ~
e Lh coFl IAW Ch
~ ~0 0
PlW IOLOP! WW IA W
~ ~ ~000
W ICl C4 0 C% Pl LIlLA O ~ e & LA R
~ ~ pf ~ ~ ~ ~co w LIl w co e coCOCOOIChW&W
O~0IA ~ IA
~ + ~ ~~o PlnS ~ ee C WLOLhV % V C% CO e ~
I I ~ ~ LAe000&LA IIAIAICl I I 00
~ ~ ~ e Lh 0 0ee CV r4 C Lh ~ ~V V V ~ ~ f4C4~~~Pl Fl V V
oaoIll IA IA Ch OI Ol &
~ ~ re LAIC LOC4 COAL ~ ~ ~ ~V V VLCl&W&
O ~ O~LA C4 a ~
~ ~CO~ ~ 4 0C% 0 ~ hl R ~ C4VIAEVC4 V Pl ~I ~ I ~ I I IA
ar oeoo IIA I LA I OOO
~ ch ~ e ~ ~ 0Al OI C4 IA t4 & ~y ~ y ~ y Very
0 0 0 0IA 'e LA W 0 O e
~ 0 ~ pa ~ ~ e~ Q ~ Q C4 ~
VLAVWVVCQ
co e~~LrlIAWhl&W
~ A A ~ CO W~ ~ Q ~ ~
C4 C4 r4 Pl Pl 0 0~ I WCI I IAt
el IC4II ocoaac
CO ~ 0 R ~ 6 COLA Pj ~ ~ 44 o ~
~ W l% IA W IA Ch
O R O CO C% Oe a Lo w n 0 eCO ~ ~ ~ a ~ ~
~ c coeLA+rW r4 W W C4 C4 Ol
Pea I7:LCIgLA WIL RN 5LCI><OI'ICOP><OW C00
4I I
I LLl�
m
< m~ 0
I4 mA4 ~mmme ~ ILL
4 I4m g~
4 4
4~~4'5W g+ 04
~ LLLa>
~ e s ~ +m ~~mcus+
m ~q$Aa ev
Ch~A 4
S4 48'g I4 IILV4 4l cNm~4'5%
~ 0 ASCAN+ m ~c Mme
M.4M ~ g
048ge-Iw 4 4CW4~m 40 WW 4'CI m~
~ I'V LLI.o44vos
V I4CCI~ ~g m~ ibmm g~W I4m$3 cv mI40, ~mW4m 4 oI4 Q Clm O I4 4 LLIC~CLI LLI 90 5g&
M gWVOlg 4L4M
>4%ev 4 m 4I4 cow~m ~R 4
m w404
cz o~<0
v m4W 4AOWSO ~
BP two4 OQR
384

actual values, there a~eazs to be ~ accumulating effect in thecrayfish tissue.
! I! !in the standazds. 'Ihe two Basin sites with 50 mg/Jag have highcmmntnaticns in the scdimaxxt. 'Ihe levels of cobalt in the water werebelow 10 ug/L the first year and less than 190 ~ the secand year.'IRxe ixxxeased cxeamtzatian of cobalt in the water was resp~sible forthe inczeaseR amcentratian of cobalt in the tissues far the secctndyear»
%he dstezminatians far cadmium in stanclazds ~ well with thosezeparted by the smrae. The axa:met of ~um in the water was belier10 nfl 'Ihezefaze, the water did not cantxMxba significantly to theacaosxxtzatian of zesidues found in the tissues.
M~xt �976! analyzed ~yegg ~~~ akxrimp! and ~K]gg,gemma~ yzaln! far heavy amhQs. ~ g. ~ca~ had 7 malay ac@par in the
VI» . »»! 92 ! .. »II!!C5 in the Cxole bcdy. I yggggga had 2.80 mg/fag C5 in the whole body.IN . ! !»» Y ! ~!»»»»»»L
hllS !»!»»!» .! ~ ! . »»y !»
!»» ! !»»»! d!!pL'otlLLns»
~espie, Nt al. �977! cIetezxLIned the cachdum uptake br ggggggg~QEE~RS NZRiBQLIIN Gizazd! in Erie, New Yark. ~ species wasckmseax sinoe it is an Syartaxxt link in aquatic food webs. ~um-109 chl~ was dissolved in water at l~ up to 1 ~ C5.anhsals were mcaxitozed far 190.5 houzs, at which poixxt the xMencxxxxNxtraticax in the cxayfish mgmsed to 1 ~ was 534.4 zg/kg withI/ ! I» ~ »»!» ~ » VI!drin!dng water and 13 zg/!xa in food watt xMght! aze aaasideredbamLzdms to human health Ajax., 1962! . ~mr pezudasible limits far
! ~!» ~Wfatal ar Louisiana zegulatary agama.
Ray �984! zepazbad that the base zesidue level far ~um in theNorth Atlantic surface water is 40-60 agfL and scmNxwbat higher inestuarine and coawtal watezs.
The lower sedizMNxt ~xaxxextratian of aopper in the pcml ~es resemble~! H 4 ' »!
the Basin swnples mme closely zesekke the cceoexxtzation in the riverstaxx9azd. 'IRxe values for cqpper in the crayfish tissues aze lawer thanthose anticipateR if the values in the standazds are typical ofphysiolcjgical levels.
385

far bath paar in aU. saqQes, there was na significant accutlmlation orconcentrate of cappy fxcej the water by the crayfish.
yt vf~could be used as a good biological manitcr of heavy metal pollutian.Cupric ice wes dispersed in the water. Cuyric ice cancentzatian,detel~ed using an electrode, for the aMamn, claws and thorax wasacebined to dsteradne the abreast of acumLQ.aticll. 'Ihe acculaulatian inbody parts was 86 ug/animal Cree elgasuze to 3 ~ for 48 hours.Bexnazd and Ray �979! used X-ray fluoresced to monitor heavy metalsin tklanecic fatty material hepatopemxeas! and tail bLlscle of crayfishfxcbm marsh ponds, rice fields and the Atchafalaya River Basin at~lhcixla, Louisiana. Of the capper, nickel, chzclnium, arsenic, lead,zinc end bura' monitaxed, anly capper, zinc and iron wexe faund in
yyy y
'Ihe quaQtificaticEl of bREcuxy residues is difficult to intezjpt%ft Ouranalysis of the lelvmry in the river sample was apgealdmately ten-foldthe values zeparted by MBS, however, mr values agree quite well withthe estuarine stencaazd. 'I%ere was zm quantification of mev~r by theMS in the tissue sal~. However, the ccmentzatians of mezcuxy inmr samples are in the same zange as that far the bovine and cysbirstandaxds. Ail of the water samples far both years bed less than 10ug/L bshe
king, et al. �987! zepaxted that p. ~yZQQ, in ~ hady wow
zeparted 0.070 to 0.560 mg/kg mrcuxy in the whale animal usingi~gg~ gQQgg in a canhuainated paxtim of the Wiscansin River,~ peg~, pulp, ~:zine and caustic soda plants aze located.Cate ament of nickel residues in the cnxyfish tissues was greater thanthose reported by Rinoan, et al. �987! and Sbe&eIy �978!. 'Iha emurrtzeported in the sedilmnts falls within the range zeL orbed in thelitexetLme Table 4! Rh3dlamj, 1979! . Rm ccbb entzatian of nickel inthe water was less than 30 ug/L far both yeexs.
~ element of lead in the Basin sedimmt sabples was less than thatfound in the river sediment standard. Since the estuarine stmdard wasquantitated to 106 mg/lap aa~zed to the NBS quantification at 28, thea~ values in the sediment aze probably lalch lower than thosereported. 'Ibe ineccuzacy in the analysis of lead ibpedes makingcanclusicm about the quantity of lead in the tibmmles. Howmrer, sincethe quantity of lead in crayfish tissues are lower than the valuesobtained far the analysis of lead in the stmxhzds and the standazdsweze quantified at 0-11 mprkg far a xi~ed 0.5 bg/kg lead in oysters,
386

TMKZ 4. TRACE EXZRKNT XSFZEPT OF SOZLS
pzecaBsq the parenthesis is the men valuefauna in Lindsay �979!2rmNxe' preaeiizg the parwxthsmis is the mean valuefaunel in Kir!dna �979!
387
AsBa09QoCll
Sgl
71~ 000 �0, 000-300, 000!6�. 1WO!500 �00-3500!0.5�.01M.7!8 �WO!20�-100!0.03�.01M.8!40�-5000!10�-200!320g000�30~000 350~000!

the zelative armunt of lead is vezy lmr. The level of lead in thewater was less than 10 ug/L in all samples far the two years.
Bernazd and Boy �977! zeporbld that g. ~~~ in Louisiana had thefollowing zanges: ~9 mg/kg CLl; <0.1-3 mg/lag Ni; O.l mug H'g, As,Cd; arxR <0 ~ 1-0.9 ~ Eb in the hspatoparxzeatic tisme. Theoancemttxatians of mme, arsenic, lead and cadmium were higher inthis study than this eazlier study. 'Ibe cancentratians of copper andnicIaal residues zepazted by N&ght �976! were higher for prawns arrishrimp than those obtained, in this study.
~ values far anhhmay and silicon in the standazds were natquantified by either the NBS ar NBC of Canada. 'Ihera<aze, little canbe said about the values obtained. %be amount of ax~cay in all~t! ~ 'Ih. 92cansideL~y mme variatian in the alxhmdmQ. mscle and se!Umlmt.
variatian of values in the sedinent. Other possible ezplanatians arethat. the aneunt of ~imaay in the water may be a better variable, orthe type of soil may affect the zelease of ant&any.
Silicon is a major oa~nent of sail. ~ upbear Basin UB!, lowerBasin LS! and VezuMicn Pax&lh VER! sites had lever levels ofsilicon, since the sediment is primarily azganic matter oa~red to
!!!the sesqQes with mace zesiduss ~ ather metals. 9%a pands, CrawleyRice Statim CRS!, St. I4aztin's Parish {SIN!, and Acadia Parish AP!,had mme silicon and less of the athar mstaIs in genera. since there isless aeganic matter to sequestle the amh6a. Even thigh the levels ofmetals varied fzcsL cas year to the nsmd: in the two Basin lccatians, theBasin sites had mxee metal zesidues than the pand sites.Van~ analyses in the saignant staLndmds agreed well with the NBS.The unusually high values in the sediment of the two Basin locationsand KH far the first paar may be due to axxze inhstrial effluerrt boundto the sarment such that it could be easily hydrolyzed. 'Ihe peakseasan upper Basin UB! ~es and the late seasca VER pand water~es had agyrcocbaately 40 ug/L vanadium. 'Ihe abdominal mascle fmn
'!
and UB had hiIgher levels of vanadium than the others.
An attempt was made to discern changes in the residue levels due to thetime of seasan, and thezefare maturity of the animal. H'amber, theezdzela matuze at. different rates in different sites deperxbng on the
!tF ~ ~ t!, !'
388


parathion. Xn addition, the Pckee~ of these chemicals did notsignificazztly inneemie during the molting cycle of crawfish.
%petto arxl AliMma �987! analyzed ggg~i b~crLi and Oraonectes!Id! ! ddd ~Y ddd
copper, cadmium and nickel. aha oc~ levels in the bepatopan-czeatic tissue and abdcminal muscle were appzcodmately ten-fold higherin these animals caught in unpolluted water than in this study. The~um canxzztrations were similar heta~n the studies when both areput on a dzy mahPzt basis. 'Qm aanmzztration of nickel in this studywas slightly higher than their ~es fzcza unpolluted waters, but muchlower than their samples fzcia polluted waters when put on a dry weightbasis far cciaparisce.
CXKXQSXC5S
~ish in 6 local~s were a~led at 3 diffezezxt times durizig 2seezams. 'Ihexe was no significant diffezencm in the concentration of~ residues in the abdcminal zszscle and hepatcyanczeatic thisuesheber locaticms ar bedizen times of seas' or betsmen wild and yond-zaiIe5 crayfish. 'Bare ms no ex@relation when amies were separatedby locaticmz bsbeen the crayfish with the hig41r ccmcentzaticns ofmehLl, zesizhms in the tissues azxi the hLcgmr of metal
ld I ~ .. ~, ~ Id ld! ~dd.
higher cxamezztzwtica of scca stale in VER aid. US tissue samples mightI Ha Id ~ ~ ddd II
tl ddd~ ccamsztzatians of ~ resichzes were similar to those reported by
Id d. I
Anon. �962! Drinkinc~ water sttmchmhs. US Dept. Health, Eduction and.filelfaxe. Pub. 956:61.
Bernard, LK and Rcjj, EN �977! %stale in Louisiana crayfish Q'.g~g! dstezmi'ned by x ray fluarwszsnce analysis. Ihz Limhprist, OV ed! Presbyter ~ish 3 Papers fzcm the third izztezzMLtianalsymposium an fzesiaater czayfish at the University of Eimpia, Finland.University of Exyia, Finland, pp357-361.
Day, P.R. 1965. Particle fractionation and particle-size analysis.W C.A. Black ed.! . Mirthechs of Soil Analysis. Am Sac. Agmn.Monogram ph 5'o. 9, ppS45-567.
390

Near York, Near Yaek, p68.
!! ! !!~!eggy!. Bull. Emriztm. CcethmL. Taxicol. 24:916-920.
Qillespie, R, Reisine, T, Sesame, ET �977! Cadmium uptake by thecrayfish Orcongg~ ggg~~guus g~!ituus Girard! . Envion. Res.l3: 364-368.
Hsrxriak, RD, Evezett, TR �965! Toxicity to the Zauisiana red crawfishof aces pesticidea used in rice cultures. J. Econ. Entom. 58:958-961.
Sogldms, SP, Hartin, MH, %ms, SZ �985! Heavy metals in isop:ds fromthe supra-littctral zcme on the smxthezn ahem of the ssvazn estuary,UK. Environ. Pollut. 9B:239-254.
Zpctl, R, Taylor, M, Simikiss,E �983! Nstal&ixxUng proteins in theMll !. W
Bicchea. Ehysiol. 74C:51-54.
Page, AL �982! Methods of Soil Analysis Part 2: Chemical andMiav&iological Pecgmeties, 2nd ed. American Society Agvcexsay and SoilScience Soci~r of America, ~7.
Rmmxa, 0 �984! ~um in freshwater ecasystme. Ezperisntia 40:2-14.
A ~ ! !~!!
Stinsm, MD, Eaten, lX �983! Ocmentzatians of lead, ~um, mzcuzyI ! ~~ Sa!l!!!!l! lallaal ! a ~
Ianna receiving uzhan runoff. Arch. Environ. Ca@tan. Teed.col. 12: 693-700.
Wright, DL �976! Heavy ~s in animals fzaa tha ~~MLat ~ England! ~ Marine Polit. BuU.. 7: 36-38.
Partial support. far this ~set was ~ the tcuisiana CrawfishResearch and Pzme&an Boazd, Baton Rouge, Zcuisiana.
391

PROPERTIES AND POTENTIAL USES OF OYSTER SHUCKING WASTE WATER
Chyuan-Yuan Shiau and Tuu-jyi ChaiSeafood Science and Technology Division
Horn Point Environmental LaboratoriesUniversity of Maryland
Cambridge, MD 21613
INTRODUCTION
Oysters are commonly marketed fresh, shucked or in the shell. Rawoysters are first shucked, then washed, drained and packaged. In thisprocess, a large quantity of waste water is generated. It is esti-mated that the annual production of 50 million pounds of oyster meat inthe USA vill generate 55 million gallons of waste water or 2 millionpounds of soluble solids Kramer et al. 1962a!. The soluble solidscontain proteins, flavor components and other nutrients. This largeamount of soluble solids lost in waste water creates a serious environ-
mental pollution problem and tedious task for the seafood industry.The recovery of these soluble solids for human consumption can benefitboth the industry and public health.
Recovery of other seafood processing vastes has been attempted.Potential products from effluents of surf clam and quahog processingindustries have been studied by Barnett and Lin �981! using foam frac-tionation. Protein and flavor components from clam processing washvater have been isolated and characterized Hang.et al. 1980; Joh andHood, 1979!. Removal of suspended solids from tanner crab, salmon andshrimp waste waters has been studied using hydrocyclone system Johnsonand Lindly, 1981!. Recovery of functional protein from clam effluentprocessing vith direct acid precipitation, ultrafiltration, microgasdispersion flotation and ion exchange chromatography has been evaluated Jhaveri, 1984!.
Little information has been reported about the potential use ofoyster processing waste for human consumption. The recovered productsof this oyster ~aste under sanitary conditions and good quality controlcan be processed for oyster broth, oyster-flavored concentrates orpowder and oyster sauce. It can also be processed for oyster-flavoredingredients for use in formulated foods such as chips, snacks, and ad-vanced fabricated seafoods. Further fermentation of recovered concen-
trate can be a more effective approach in processing the oyster wasteinto high quality flavor ingredients and food condiments. This reportdescribes the composition, methodology and quality assessment of re-covered concentrate from the oyster processing waste water. The poten-tial use for human consumption of the final products processed from theoyster waste has been evaluated.
392

MATERIALS AND METHODS
ster li uor sa les. Raw oysters were harvested from ChoptankRiver and Nanticoke River in Maryland. The oysters were shucked in thelaboratory to determine the yield of oyster meat and waste liq~or.Oyster processing waste water was obtained from a large local oysterprocessing plant. Commercial oyster sauces of various brands werepurchased from supermarkets in New York City and Cambridge, MD.
Concentration methods. Flash evaporation was applied to concen-trate the oyster liquors to a paste at a temperature below 40'C.Millipore oellican ultrafiltration with membranes of 10,000 nominalmolecular weight limits were used to concentrate the waste water to 10to 20 fold concentration.
Permentation. Ten percent salt was mixed into the recovered wasteliquor concentrates and incubated at 15'C, 25'C and 35'C for fermenta-tion with and without the addition of Aspergillus oryzae purchased asmalted rice form, commercially named "koji-!.
assessment. Waste water quality including pH, totalsolids, total suspende solids, chemical oxygen demand COD! and con-ductivity were determined according to the standard procedures US EPA1979!. Microbiological analysis was performed as the procedures de-scribed in FDA method �984!. Heavy metals were measured by atomicabsorption spectrophotometry.
Chemical anal sis. Moisture, lipid, ash and salt were determinedaccording to the AOAC method �984!. Total nitrogen and non~roteinnitrogen separated from TCA precipitate fraction were determined byK]eldahl method. Patty acid composition was determined by gas chroma-tography of total lipid prepared from chlorofo~thanol extraction.SDS~el electrophoresis was performed for the determination of proteinprofile according to the Imthod described by Chai and Foulds �974!.Amino acids were analyzed by an amino acid analyzer. Nucleotides andrelated components were determined by anion exchange chromatography Hayashi et al., 1978!. Volatile base nitrogen VB-N! was measuredwith the method used by Gould and Peters �971!. Amino nitrogen wasanalyzed according to the method described by Cobb et al. �973!.Glycogen was determined using phenol-sulphuric acid extraction de-scribed by Dubois et al. �956!.
RESULTS AND DISCUSSION
The ield and composition of shell li uor and bled li uor
Freshly harvested oysters were shucked in the laboratory to de-termine the yield of shell liquor which originally existed inside theshell and the yield of bled liquor after shucking. As shown in Fig. 1
393

Oysters �30!
Shell liquorOyster meat
1931 g 8.4 g/oyster! 464 g
�'C!
Sled liquor731 g �8X!
Oyster meat1200 g �2X!
Figure l. Yield of oyster meat and liquor
Table I. Composition of oyster neat, shell liquor and bled liquor
Shell liquor Sled liquorOyster meatComposition Z!
96.3197. 3880.99
19. 01
13. 68
isture
3. 692. 62Total solid
Protein 1.841. 05
l. 22l. 22l. 60Ash
0 ~ 730.720.54Salt
394
shall liquor and bled liquor occupied about 20X and 30X respectivelyof the initial oyster meat volume drained meat plus liquor generatedduring shucking!. The total waste liquor including both shell liquorand bled liquor which was released from oyster neat at I hr storageafter shucking accounted for 50X of the initial oyster meat volund.Shell liquor and bled liquor contain 2.6X and 3.7Z total solids and1.1Z and 1.8X of protein respectively Table I!. During processing,proteins in oyster liquor would be lost by shucking, washing aad blow-ing. Xn the U.S.A., oyster neat production is about 50 million poundsa year, and about 50 million pounds of liquor aad l. 5 million pounds ofprotein would be lost in the waste water.

Both liquors contained about 0.7X aad 1.2X salt respectively. Thesalt content in liquor was higher than in oyster meat. Kramer et al.�962b! indicated that the salt content of sheLL Liquor was consideredto be a reasonably close approximation to the actual salinity of thewater where the oysters were harvested. However, our results showedthat shell liquors had a lover level of salt than that of the oystergrowing water I.IX!.
Based on the result of SDS gel electrophoresis, both shell liquorand bled liquor had an identical protein profile which vas similar tothat of the oyster swat Fig. 2!. During storage, the protein pattern,of drained liquor collected at different storage time of 15 ad.n aad 2hr was not changed. There were about 36 bands which appeared on theSDS-polyacrylamide gel. By comparison to the marker proteins, themolecular veights of ma!or proteins were in four groups of 22,000,32,000, 43,000 and 58,000 Daltons with the preliminary protein rangingfrom 20 to 25,000 Daltons.
The ualit aad eom osition of o ster rocessin waste water
In commercial oyster shucking plants, the shell liquor and bledliquor were mixed in the oyster pot. This mixed liquor formed originalwaste water and was collected when the oysters were first drained forweight determinatioa. The original waste water was composed of shellliquor, bled liquor aad rinse water. After draining, the freshlyshucked oysters were normally washed in a blowing tank with 5 to 6volumes of water resulting ia a large quantity of wash water vithcertain amounts of soluble solids. It has been reported that theoyster lost about 14X solids to the wash ~ater Kramer et al. 1962b!.Caravan and Thomas �981! also indicated that much vaste was generatedin the blowing process. Both original waste water aad wash water wereused for recoveriag byproduct in this study as they would otherwise besources of pollution.
The original waste water contained 0.65 � 2.24X of total solidsand 0.24 � 0.96X of protein Table 2!. Due to the dilution with water,the total solids and protein in original waste water is lower thanthose of shell liquor and bled liquor Table 1!, but higher than thoseof wash water. The original waste vater also had higher COD, conduc-tivity, VB-N, aerobic aad anaerobic count than those of vash water.Based on protein content, the recovery of the byproducts from originalwaste vater seesmd to be much more potential than wash water.
The parameters and compostion of both liquors varied depending onoyster quality, storage time, season, post harvest treatment and shuck-iag processing method. As shown in Table 2, the waste water in Naycontained higher total solids, protein-N, nonprotein-N, ash and saltthan those in February.
395

Figure 2. Stained SDS-polyacrylamide gel after electrophoresis:A-S,shell liquor; C-F, bled liquor collected at 15 and 120 minintervals of storage; and G-K, oyster meat of differentsamples.
396

Table 2. Quality assessmeat and composition of oyster plant waste water
i ina water Wash waterFeb. Nay Dec. Feb.Parameter l4tay De c.
7.41O. 65
6. 792. 24
7.510. 24
7 ~ 36l. 12
7.160. 33
7. 380. 59
714
1,8903.3328,250
1,5216,50G
339
930
371
1,080704
1,440
12,2123.12
3,4220. 87
7,9982. 34
1,8300. 31
2,2470. 58
3,2540. 77
l. lx 1040
0. 240. 210. 15
8.4x10⁵G
0. 960.86
0.76
6.9x10²². 5x10²
0.11
0.08
7.5x1030
G. 240.21
G. 14
1.2x1059.0xlol
0. 450.490. 43
l. 7x1050
0. 190. 12
0. 10
Characterisation of o ster waste paste
Oyster liquor was concentrated to paste by flash evaporation andthe composition was analysed. The approximate composition was 55.2Xmoisture, 4.2X total N, 3.7X protein-N, O.SX noa~rotein-N, 0.35Xamino-N, 0.3X lipid, 15.9X salt, 1.5X glycogen and 6.1Z ~alt Table 3!.The final recovered waste paste contained lower organic matter thanthat of oyster meat except for ash and salt. Particularly, the pastehad much lower level of lipid and glycogen than that of oyster meat.Zt has been reported that only 2.4X glycogen lost into bled liquor fromoyster Kramer et al., 1962b!. Lipid lost in liquor may have the samesituation. The high content of salt in concentrated paste indicatedthat most of the salt~ontent solid release into the oyster liuqor.The result agrees with that observed by Kramer et al. �962b!.
The amino acid anaLysis showed that the concentrated oyster pastehad a full spectrum of amino acids data not shown!. The predominateamino acids, ia descending order, were aspartic acid, histiN,ne,glutamic acid, leucine, argiaine, alanine and praline. However, thepredominate aid.no acids in oyster meat were glutamic acid, arginine,alanine, aspartic acid, methioniae, serine, lysine, glycine and Luecine Burnette et al. 1979!.
397
pHTotal solids X!Total suspended
solids mg/l!COD mg/l!Conductivity tahoe/cm!VS-N mg X!Aerobic count
PFU/ml!Anaerobic count
PFU/mL!Fungi PFU/ml!Crude protein X!Ash X!Salt X!
2. 2x10 2. 6x 1 06 l. 2x10 2. 5x10 4. 7x 1 05 4. 5x10

Table 3. Approximate composition of oyster waste paste and oyster meat
ncentrated Oystermeat
et Wt. basis Dry Wt. basis
Composition X!
CMP, AMP, Hyp and Ino were the major nucleotides and rel,atedcomponents which vere similar to freshly shucked oyster except that AMPvas slightly reduced and Hyp was increased Table 4!. AMP and CMP alsohad been detected as predominate nucleotides in boiled crab meat byHayashi et al. �978!. AMP, GMP and CMP were considered as taste-active components to boiled snow crab meat Hayashi, et al. 1981!.
Table 4. Nucleotides and related compounds of oyster vaste pastes andoyster neat ynole/g!
ommercial
oyster meatNucleotide and
related compoundres oyster
meatquor
paste
4. 36
0. 621. 0'3
0. 08
1. 311. 17
0. 79
I. 69
yti ine ~nop osp ateAMP - Adenosine 5 ~onophosphateGMP - Guanosine 5'~nophosphateUMP � Uridine 5'~onophosphateIMP � Inosine 5'~nophosphateADP - Adenosine 5'MiphosphateIno � Inosine
Hyp � Hypoxanthine
398
MoistureTotal-NProtein-N
Nonprotein-NAnd.no-N
LipidAsh
Salt
Glycogen
CMPAMP
GMP
UMPIMPADP
Ino
Hyp
55 ~ 154. 18
3.67
0. 510 ' 35
0.28
15.90
6. 1.41.54
9. 328. 18
l. 140.78
0. 62
35.45
13. 693 ' 43
82.862. 18
1.94
0. 240. 16
1. 57
1. 190. 482.74
1. 66
0. 19
0. 19
0. 300.010. 33
0.25
12. 7211. 32
1. 400. 93
9. 16
6.94
2. 8015 ~ 98
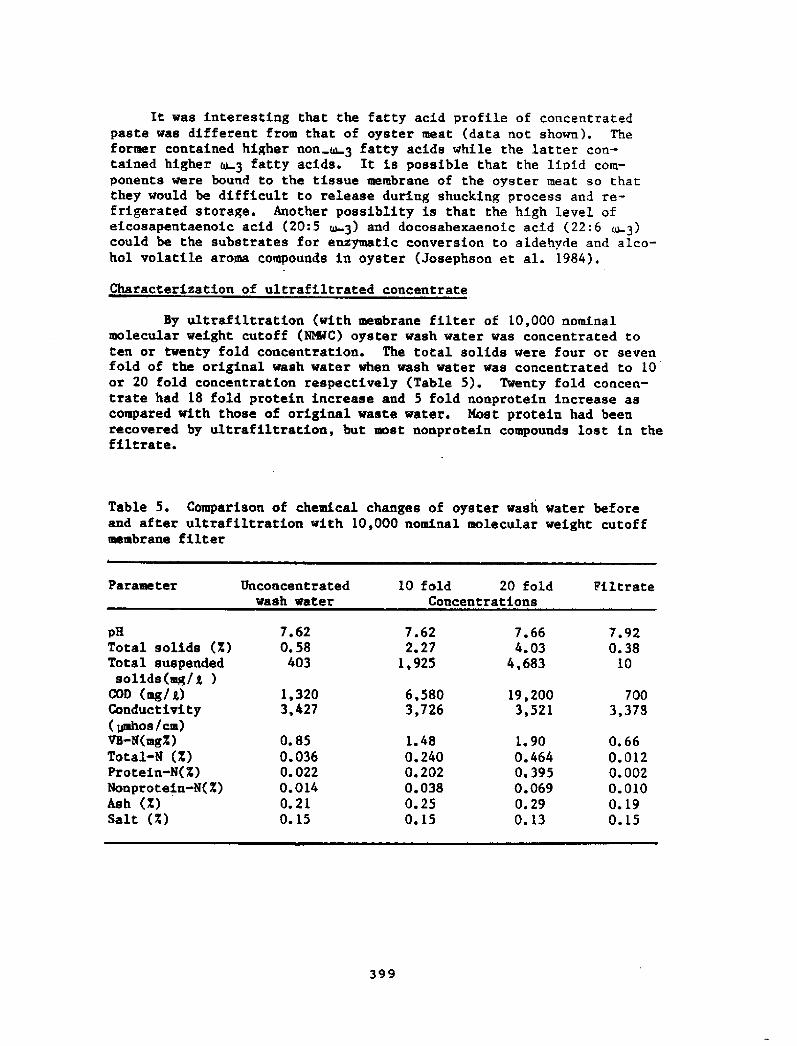
It was interesting that the fatty acid profile of concentratedpaste vas different from that of oyster meat data not shown!. Theformer contained higher non m 3 fatty acids while the latter con-tained higher m 3 fatty acids. It is possible that the lioid cora-ponents were bound to the tissue membrane of the oyster meat so thatthey would be difficult to release duriag shucking process and re-frigerated storage. Another possiblity is that the high level ofeicosapentaenoic acid �0:5 z 3! and docosahexaenoic acid �2:6 ~3!could be the substrates for eazymatic conversion to aldehyde and alco-hol volatile aroma compounds ia oyster Josephsoa et al. 1984!.
Characterization of ultrafiltrated concentrate
Table 5. Comparison of chemical changes of oyster wash vater beforeand after uLtrafiltration with 10,000 nominal molecular ~eight cutoffmembrane fiLter
Unconcentratedvash water
10 fold 20 fold FiltrateConcentrations
Parameter
7 ~ 620,58
403
7 ' 622.27
1,925
7. 92
0. 3810
pHTotal solids X!Total suspended
solids mg/g, !COD mg/i!Conductivity yahos/cm!VS-N mgX!Total-N X!Protein-N X!Nonproteia-N X!Ash X!Salt X!
7. 664. 03
4,683
6,5803,726
1%3203,427
19,2003,521
700
3,378
1. 48
0. 2400. 202
0.038
0. 25
0. 15
0. 85
0.0360. 022
0. 014
0. 21
O. 15
0. 66
0. 012
O. 002
0. 010
0. 19
0.15
1. 90
0. 464
0. 395
0.069
0. 29
0. 13
399
By ultrafiltration with membrane filter of 10,000 nominalmolecular weight cutoff NtMC! oyster wash water was concentrated toten or twenty fold concentratioa. The total solids vere four or sevenfold of the original wash water when wash water was concentrated to 10or 20 fold concentration respectively Table 5!. Twenty fold concen-trate had 18 fold protein increase and 5 fold nonprotein increase ascompared with those of original waste water. Most protein had beenrecovered by ultrafiltration, but most nonprotein compounds lost in thefiltrate.

Ultrafiltration treatment reduced COD and total suspended solidsfrom 1,320 mg/ g and 403 mg/g, to 700 and 10 eg/ E respectively, Zn andCu accumulated in concentrates, indicating that these two heavy metalseight bind to the protein in the waste liquor Table 6!. Nevertheless,as compared to the heavy metals in oyster meat, waste liquors containedlower heavy eetals Surnette et al. 1979!.
Table 6. Metals ia original liquor and wash water
Metal Ori iaal li uor Washed water ! Uacoacentrated Concentrated Unconcentrated Concentrated
G. 340. 020. 03
0. 037. 74
<0. Ol
3. 25G. 04G. 07
0 ~ 0764. 2
<0. 01
6. 800. 100. 17
0.27248
<0.01
0. 97<0.01
0. 05
0. 0534. 9
<0.01
CuCdPb
CrZa
Utilisation. Oyster waste concentrates contain an adequate amount ofproteins and nonproteia nitrogen compounds. These components and otherflavor constituents not yet identified are flavor potentiators whichmake oyster waste concentrate a potential flavoring agent. Oystersauce prepared from concentrated oyster broth with other ingredientshas been widely used world~de for centuries. Three brands of com-mercial oyster sauce were chemically analyzed aad found to containvariable amounts of major components Table 7!. Oyster waste concen-trate can be prepared by addition of other ingredients to make oystersauce. Other products such as oyster broth and oyster flavor ingre-dieats can also be prepared. The wash water was concentrated to 3times its original solid content by steam-Jacketed kettle. The con-centrate has been prepared into oyster broth which has been accepted bysensory evaluation data now shown!. Pish sauce, a naturally fermentedfish Juice prepared from whole small fish containing over 20Z salt, isa strong flavoring food condiment widely used ia Southeast Asia.
400
To enhance flavor intensity, feramntation was applied on oysterliquor concentrate. A temperature of 15'C and addition of 10Z NaC1were found to be the optimum conditions for fermntation. Duringfernmntation, pH was decreased by 1 to 2 units at 3 months and was thenstable uatil 6 months Table 8!. Non~rotein N and volatile base Nwere increased as fermentation progressed. The increase ia these typesof N components would enhaace the flavor and odor of the products.

Table 7. Characteristics of commercial oyster sauce products
ProductsATest
Table 8. Chemical evaluation of oyster waste concentrate duringfe~ntation
Storage time month!Test
5. 395.31
0. 100. 50
0. 044. 68
0. 3013.60
The chemical evaluation of oyster waste concentrate during fer-mentation with the addition of As er illus o zae Ko!i fore! is shownin Table 8. The addition of "kogi" to the concentrate significantlyaccelerated hydrolysis when compared to that, observed without additionof "ko]i" Table 9!. In a week of incubation, there was a significantincrease in the rate of digestion as Judged by the nonprotein-N andamino-N. The product possessed oyster flavor in the early stage offermentation. After the first week of fermentation, the digestiongradually slowed and a more soy sauce-like sweet taste developed in the
401
pHMoisture Z!Total-N Z!Nonprotein-N Z!Protein-N Z!VS-N mg Z!Lipid Z!Ash Z!S lt Z!Price $/oz!
pHMoisture Z!Ash Z!Total-N Z!Protein-N Z!Non~rotein-N Z!Va-N mg Z!
6.5287. 89
9. 070. 41
0.44G. 034.13
4. 97
51.50
1 ~ 11
0.29
0.8221.21
0.7410.9710.36
8.13
5.6187.14
9.270. 44
0.400.047.70
4.56
75. 47
2. 870. 77
F 1028. 42
4. 295. 60
4. 8222. 60
7.8389. 68
9.240. 11
0. 090. 012. 10
5.3889 ' 49
9.170. 100.070. 033.70
5. 20
40. 32
2. 02
O. 50
1. 5214. 70
2. 1511. 94
7. 91
12. 90
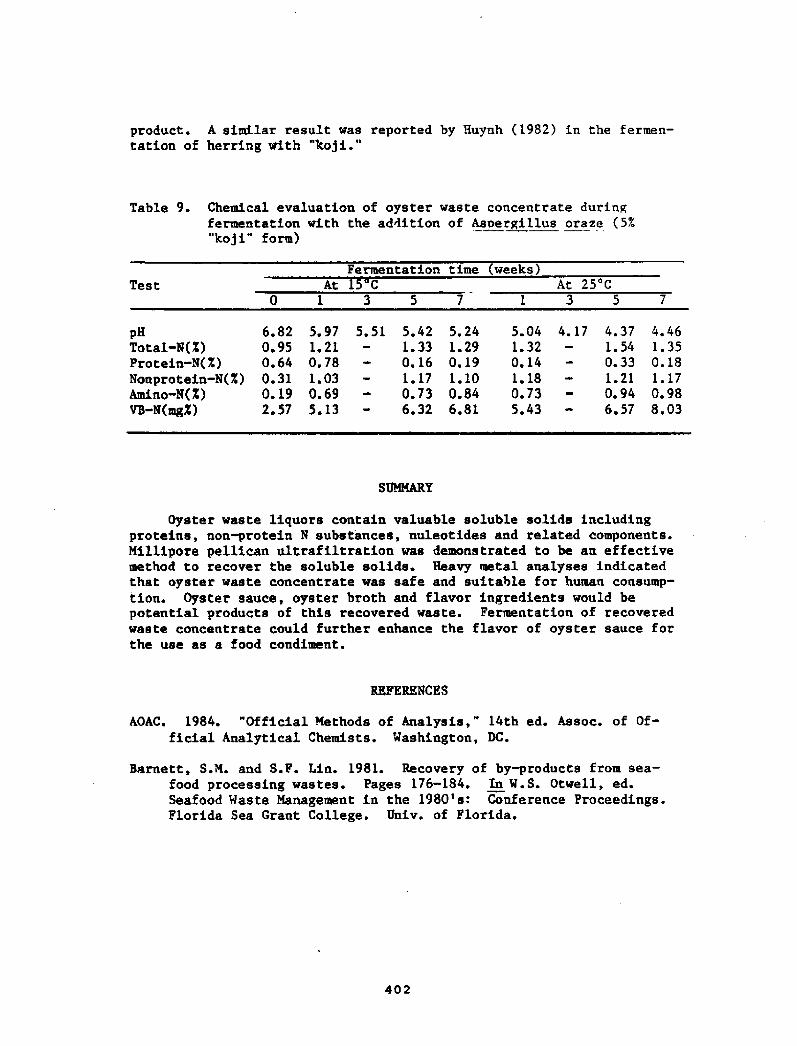
product. A similar result was reported by Huynh �982! in the fermen-tation of herring with "ko!i."
Table 9. Chemical evaluation of oyster waste concentrate duringfermentation with the addition of Asnergi11us oraze �X"ko]i" form!
ermentation time weeks!At C At 25'C
0 1 3 5 7 1 3 5 7Test
5. 51
Oyster waste liquors contain valuable soluble solids includingproteins, non~rotein N substances, nuleotides and related components.Millipore pellican ultrafiltration was demonstrated to be an effectivemethod to recover the soluble solids. Heavy metal analyses indicatedthat oyster waste concentrate was safe and suitable for human consump-tion. Oyster sauce, oyster broth and flavor ingredients would bepotential products of this recovered waste. Fermentation of recoveredwaste concentrate could further enhance the flavor of oyster sauce forthe use as a food condiment.
REFERENCES
AOAC. 1984. "Official Methods of Analysis," 14th ed. Assoc. of Of-ficial Analytical Chemists. Washington, DC.
Barnett, S.N. and S.F. Lin. 1981. Recovery of byproducts from sea-food processing wastes. Pages 176-184. In W.S. Otwell, ed.Seafood Waste Management in the 1980's: Conference Proceedings.Florida Sea Grant College. Univ. of Florida.
402
pHTotal-N X!Protein-N X!Nonprotein-N X!Amino-N Z!VB-N mgX!
6. 82 5. 970. 95 1 ~ 210. 64 0. 78
0.31 1 ~ 030.19 0.69
2.57 5.13
5. 42 5. 24l. 33 l. 290. 16 0. 19
1. 17 1. 100.73 0.84
6.32 6.81
5.04 4. 17l. 320. 14
1. 180. 73
5. 43
4. 37 4. 461 ~ 54 l. 350. 33 0. 181.21 1.170. 94 0. 98
6. 57 8. 03

Buraette, J.A., G.J. Flick, D.R. Ward and R.W. Young. 1979. Comparisonof composition and selected enzyme activities in Crassostreavirgiaica and Crassostrea pi~as, Eastern and Korean oysters. J.Food Protection. 42:251-255.
Caravan, R.E. and F.B. Thomas. 1981. Assisting North Carolina seafoodprocessors ia meeting water pollution requirements. Pages 10-25.In W.ST Otwell ed. Seafood Waste Management in the 1980's. Con-ference Proceeding. Florida Sea Grant College. Univ. of Florida.
Chai, T. and J. Foulds. 1974. Demonstration of a missing outer meat-brane protein in tolG mutaats of Escherichia coli. J. Mol. Biol.85:465-474.
Cobb, III, B.F., I. Alaniz and C.A. Thompson. 1973. Biochemical aadmicrobial studies oa shrimp. Volatile nitrogen aad amino nitrogenanalysis. J. Pood Sci. 38:431-436.
Dubois, M., K.A. Giles, J.K. Hamilton, P.A. Rsbers and S. Fred. 1956.Colorimetric method for determination of sugars and relatedsubstances. Anal. Chem. 28:350-356.
Food aad Drug Admiaistration. 1984. Bacteriological Analytical Manual.6th ed. Association of Official Analytical Chemists. Washington,DC.
Gould, E. and J.A. Peters. 1971. On testing the freshaess of frozenfish. Pishiag News Ltd., London.
Hang, Y.D., E.E. Woodams and G.F. Parsons. 1980. Isolation and chemi-cal evaluation of protein from clam wash water. J. Food Sci.45:1040-1041.
Hayashi, T., K. Yamaguchi aad S. Konosu. 1978. Studies oa flavorcomponents ia boiled crabs II. Nucleotides and organic bases inextracts. Bull. Jpn. Soc. Sci. Fish. 44:1357-1362.
Hayashi, T., K. Yamaguchi and S. Koaosu. 1981. Sensory analysis oftaste-active components in the extract of boiled snow crab meat.J. Food Sci. 46:479-483.
Huynh, M.D. 1982. Fish sauce production through fermentation: A methodto utilize fishery waste. Technical Report No. 8. FisheriesTechnology Division, B.C. Research. Vancouver, Canada.
Jhaveri, S.N. 1984. Evaluation of processes for recovery of functionalproteins from clam processing effluent. Ph.D. Dissertation.University of Rhode Island.
403

Joh, Y. and L.F. Hood. 1979. Preparation and properties of dehydratedclam flavor from clam processing wash water. J. Food Sci, 44:1612-1614.
Johnson, R.A. and K.L. Lindley. 1981. Removal of suspended solidsfrom seafood processing waste waters. Pages 116-122. In:W.S. Otwell, ed. Seafood Waste Management in the 1980's:Conference Proceedings. Florida Sea Grant College. Univ. ofFlorida.
Josephson, D.B., R.C. Lindsay and D.A. Stuiber. 1984. Biogenesis oflipidMerived volatile aroma compounds in the emerald skiner Notropis atherinoides!. J. Ag. Food Chem. 31:326-330.
Kramer, A., B.H. Willier, R. Edge, H.R. Smith, A.W. Tubman, C.F. Leeand C. Toompas. 1962a. The government industry cooperative oysterresearch program. Part I. History and methodology. J. Assoc.Offc. Anal. Chem. 45:262-275.
Kramer, A., B.H. Willier, R. Edge, H.R. Smith, A.W. Tubman, C.F. Lseand Toompas, C. 1962b. The government industry cooperativeoyster research program. Part II. Native oyster studies. J.Assoc. Offc. Anal. Chem. 45:565-577.
U.S. Environmental Protection. 1979. Method for Chemical Analysis ofWater and Wastes. U.S. Environmental Protection Agency. Cincin-nati, Ohio.
ACKNQf LEDGEMENT
This work was supported in part by a Sea Grant Pro]ect of GrantNo. NA 86-AA-D-SG006 funded by the National Sea Grant Program, NOAA.
404

PRELIMINARY ASSESSMENTS OF MULLET CARCASS BYPRODUCTSGENERATED BY THE HOLLOWAY PROCESS
Brian E. PerkinsAlabama Sea Grant Extension Service
3940 Government BoulevardMobile, AL 36693
and
Michael H. Eley, Clifford C. Holloway, and Melvin V. Kilgore, Jr.Johnson Research Center, Biotechnology Laboratory
The University of Alabama in HuntsvilleHuntsville, AL 35899
ABSTRACT
Female roe mullet carcasses were digested in the HollowayProcessor, a pressure chamber, by using saturated steam at 60 psig�00 o F! with continuous mixing for 30 minutes. The resulting liquid soluble! and solid flesh, bone, and viscera! byproducts contained on awet weight basis! 6.25X and 15.7X protein, respectively. These twobyproducts possess good potential for further refinement into feed andfertilizer ingredients.
INTRODUCTION
Processing of female roe mullet produces average roe and gizzardyields of 17X and 1X by weight, respectively. Over 1.35 million poundsof female roe mullet carcasses were generated by Alabama processors in1986 '
A small amount �X! of the female roe carcasses found their way intohuman food channels, although their overall poor quality usuallyprecluded this as a viable outlet. Traditional outlets for female roemullet carcasses have included landfilling or freezing for future use ascrab bait.
Landfilling of carcasses has become quite unpopular. Manymunicipalities and operators of private sanitary landfills have closedtheir gates to any type of seafood processing waste. Others have imposedsubstantial surcharges, which have made landfilling uneconomic. In thecase of roe mullet processors in southern Mobile County, the nearestsanitary landfill is 50 miles away. The daily 100-mile round trip haslikewise proven an economic hardship. Thus, no female roe mulletcarcasses were landfilled by Alabama processors during 1986.
405

Over 1.2 million pounds of carcasses were placed in frozen storageby Alabama's mullet roe processors in 1986. Crab bait is worth only 6cents � 7 cents per pound, and frozen mullet must sometimes be held forup to 6 months before requests from crab fishermen are received. Withfrozen storage costs averaging 12 cents/Lb for six months, economiclosses of 5 cents � 6 cents/lb are not unusual.
A cooperative project was undertaken by the Johnson Research Centerand the Alabama Sea Grant Extension Service with funds provided by theAlabama Department of Economic and Community Affairs, Science,Technology, and Energy Division, under Contract No. ADECA-1EX � WWS-8607.The project objectives were to:
Evaluate the effectiveness of the Holloway Process forof female roe mullet carcasses.
treatment
Quantify chemical composition of recovered materials.
for feedDetermine economic potential of recovered materialsand fertilizer applications.
METHODS
The Hollowa Processor
Sam le Collection and Processin
Five sample collections were made during the period from November 4,1986 through December 4, 1986. The mullet had been netted along the Gulf
4as
Diagrammatic representations of the Holloway Processor are presentedin Appendix Figures 1 and 2. The patented process was developed by UrbanWaste Resources UWR! of Birmingham, Alabama for the treatment ofmunicipal solid waste MSW! and sewage sludge. The process includes apressure steam pretreatment of HSW, with water or sewage sludge as thewetting agent, to yield a sterile cellulosic fraction and recyclablemetals and glass. The process can potentially reduce the amount ofprocessible materials currently being landfilled about 80X by weight and90' by volume Urban Waste Resources, No Date!.
Energy to run the Holloway Process consists of electricity used tooperate the loading conveyor and processor agitator �40 V, 3 phase! andto operate the boiler water pump and air induction fan �20V, singlephase!. Process energy also consists of saturated steam. The boiler isa 30 bhp package boiler fueled by No. 2 fuel oil. The boiler is operatedat 100 psig, but the process steam is regulated down to 60 psig at theprocess unit. The quantity of steam used is measured by metering theboiler feed water. The saturated steam at 60 psig �00 F! is injecteddirectly into the process chamber.

Coast and brought to a processing plant in the Mobile area. The roesacks and gizzards were removed at the processing plant, and theremaining carcasses were transported from the fish processing plant tothe University of Alabama in Huntsville UAH! in 55-gallon drums in ice.After arriving in Huntsville, the ice and water were drained from thefish, and the fish were weighed before processing. The average weight ofeach fish carcass was 1.38 lb. A total of 2,556 pounds of fish wereprocessed.
For processing at UAH, the Holloway Process unit was preheated, andthe whole carcasses were loaded into the process unit. No water or othercomponents were added since the moisture content of the fish wassufficient for processing. The process unit was sealed, and saturatedsteam was directly injected into the process unit containing the fishcarcasses, with gentle agitation to insure uniform heat distribution.The steam was continously injected, and agitation maintained during theheat-up period to 55 psig, and during the cook cycle, which lasted 30-60minutes after reaching 55-60 psig.
At the end of the cook cycle, the process unit was depressurized,and the unit contents were removed by draining into 55 gallon drums. Ina cooking time of 30 minutes or more, the fish carcasses were cookedcompletely to a fine stew with fish scales and vertebrae being the onlyidentifiable pieces. All of the material passed through a 1/2" screen.
The collected material was weighed and filtered through a 120-meshscreen to separate liquid and solid fractions. Small quantities of theliquid fraction were further separated into an oil layer and an aqueouslayer by centrifugation. Generally, oil was collected by decanting fromthe top of the liquid fraction. Samples of liquid and solid fractionswere collected in sterilized mason freezer jars. All samples were storedat -20 o F until analyzed.
Electricity and fuel oil consumptions were recorded for eachprocessing run. Steam usage was also monitored and recorded.
Total K 'edahl Nitro en Ammonium Nitro en and Moisture
Five TKN analyses were performed on samples of fish liquid and fishsolids. All TKN analyses were performed according to standard methods AOAC, 1980! and EPA, 1983!.
Three Ammonium Nitrogen analyses were performed on samples of fishLiquid and fish solids. Ammonium Nitrogen analyses were performedaccording to a standard method AOAC, 1980!.
Three moisture determinations were performed on samples of fishsolids. Moisture analyses were performed according to a standard method EPA, 1981!.
Total Or anic Carbon
Samples of fish solids and fish liquid were analyzed for TotalOrganic Carbon TOC! on two occasions. ALL TOC analyses were conducted
407

on an Astro Model 2001 analyzer UV/persulfate decomposition with IRdetection! according to Method ¹EPA-415.2 EPA, 1983!.
Chemical Ox en Demand
Chemical Oxygen Demand COD! determinations were conducted on twooccasions on samples of fish solids and fish liquid. All CODdeterminations were performed according to Method ¹KPA-410.1 EPA, 1983!.
Elemental Anal sis
Elemental or mineral! analyses were conducted on two occasions onsamples of fish solids and fish liquid. Elemental composition wasdetermined by the Inductively Coupled Plasma ICP! technique according toMethod ¹EPA-200.7 EPA, 1983!.
Small amounts of oil recovered from fish liquid samples wereanalyzed for fatty acid composition. Extracts were prepared from thefish oil, and methyl esters of the extracts were analyzed on a Hewlett-Packard Model ¹5890-A GC � Flame Ionization detector using a 30 m X 25 mmcapillary column according to instructions in the GC � FI operationmanual Hewlett � Packard, No Date!.
RESULTS AND DISCUSSION
Appendix Figure 3 provideds a schematic representation of averageenergy and material flows. For processing, the amount of steam requiredto pre-heat and cook the fish averaged 500-600 pounds per batchoperation. Thus, steam usage averaged about 1 pound per pound of fish.During processing, about 50X of the steam was condensed into the finalproduct, and the remaining 50X of the steam was vented to the atmosphereduring depressurization.
The amount of electricity used averaged only 1-2 KWH per batchoperation. The amount of ¹2 fuel oil consumed by the boiler, whichoperated at 80X efficiency, averaged 5-6 gallons per batch. Based oncurrent prices of electricity and fuel oil, total energy costs averaged$5 per batch, or about 1 cent per pound of fish.
This cost, although small, can be reduced by increasing the quantityof fish per batch. Steam consumption was reduced to only 0.62 pounds ofsteam per pound of fish when 861 pounds of fish were processed. Reduced
408

steam usage also resulted in less aqueous liquid and higher solids yieldsin the products.
Energy consumption, both as electricity and fuel oil, averaged l160Btu per pound of fish. By increasing the quantity of fish per batch to861 pounds, energy consumption was reduced to 750 Btu per pound of fish.
Material Recoveries
A combined total of 2,556 pounds of mullet carcasses were processedin five batch runs. The smallest quantity processed was 263 pounds, thelargest quantity processed was 861 pounds, and the average was 511 poundsper run. A watery fish stew was initially obtained from the test runs.The material showed an increase in weight of 50K � 60X over the originalfish weight due to the steam condensate.
Liquid and solid fractions were obtained after filtering on a 120-mesh screen. The yield of filtered solids obtained varied from one runto another, but was in the range of 200-300 pounds per run. The yield ofthe liquid fraction also varied from one run to another, but wasapproximately equal to the original weight of the fish processed.
The liquid fraction could also be separated into an oil layer and anaqueous layer upon centrifugation. The oil represented 0.5X � 1.0X ofthe liquid fraction. The aqueous layer also contained some additionalsuspended solids that precipitated during centrifugation.
The results of Total Kjedahl Nitrogen TKN! and Ammonium Nitrogenanalyses of fish solid and.fish liquid samples are presented in Table I.Calculated Total Organic Nitrogen TON! and protein contents are alsopresented in Table 1. Total Organic Nitrogen was calculated as TONTKN - Ammonium!. Protein was calculated as Protein ~ TON x 6.25!.
Table 1. Nitrogen Contents.
Fraction TON ProteinAmmonium
Fish Range,ppm 6,300-32,400 177-198 6,114-32,217 38,212-201,356Solids Mean,ppm 25,305 186 25,119 156,996
Std Dev 10,854 7.6 10,855 67, 847
Fish Range,mg/I 10,000-10,750 224-291 9,743-10,494 60,894-65,588Liquid Mean,mg/I 10,250 257 9,993 62,455
Std Dev 300 24 296 1850
Results from four out of five fish solid TKN analyses performed werein very good agreement, ranging from 26,400 ppm through 32,400 ppm. One
409

low data point TKN ~ 6,300 ppm! lowered the mean TKN to 25,305 ppm. Thelow value may have resulted from high percent moisture in the fish solidfraction analyzed, or simply from analytical error. Fish solid fractionammonium data, however, agreed very well. These data yield a calculatedmean fish solid protein content of 15.69X on a wet weight basis.
Results from the five TKN analyses performed on fish liquidfractions were very close. Fish liquid ammonium data likewise agreedvery well. These data yielded a calculated mean fish liquid proteincontent of 6.25X on a wet weight basis.
Moisture
The results of moisture determinations for fish solid fractions arepresented in Table 2:
Table 2. Moisture.
Mean, X Standard DeviationRange, X
59.0 � 61.9 60.17Fish Solids 1. 53
Total Or anic Carbon
The results of Total Organic Carbon TOC! determinations for fishsolid and fish liquid samples are presented in Table 3:
Table 3. Total Organic Carbon.
Range, mg/g Mean, mg/g Standard Deviation
Fish Solids 118 � 149 134 21.9
27 � 35 5,7Fish Liquid 31
The TOC data for fish solids and fish liquid samples exhibited muchless variability than did the corresponding TKN values. TOC may beextrapolated to represent the total amount of organic material present bythe formula: Total organic material = TOC x 2!
Therefore, fish solid and fish liquid samples contained calculatedmean organic contents of 26.8X and 6.2X, respectively. Noting the close
410
Table 1 lists fish solid mean protein concentration as 15.69X on awet weight basis. That figure translates to a mean of 39.4X on a dryweight basis. Actual dry-weight protein contents would have beengreater, but one poor TKN data point caused the mean percent protein ofall other fish solid samples to be lowered from 18 ' 6X on a wet weightbasis and from 46.8X on a dry weight basis.

agreement between percent protein and percent organic matter contained infish liquid samples, it appears that almost all of the organic matter inthe fish liquid was composed of soluble proteinaceous materials.
Chemical Ox en Demand
The results of Chemical Oxygen Demand COD! analyses for fish solidand fish liquid samples are presented in Table 4:
Table 4. Chemical Oxygen Demand.
Range, mg/g Mean, mg/g Standard Deviation
468439 � 497Fish Solids
Fish Liquid
41.0
3.374.6 � 79.3 77
COD values for fish solid and fish liquid samples were quitereproducible note small standard deviations!. Furthermore, the ratio ofmean fish liquid COD to total COD �7 mg/g!/�45 mg/g! .141 was verynearly equal to the ratio of mean fish liquid TOC to total TOC �1mg/g!/�65 mg/g! .187. The relative proximity of these two ratiosillustrates that the COD analyses and TOC analyses are mutuallysupportive, and indicates a high degree of reliability in both data sets.
Elemental Anal sis
411
Elemental analysis indicated that the various products derived fromsubjecting mullet carcasses to the Holloway Process are good sources ofnutritive elements which contain low concentrations of toxic minerals.The results of elemental analysis of fish solid and fish liquid samplesare presented in Appendix Table 1.
Nany of the ranges were variable, probably due to the small numberof analyses performed. However, the values in Appendix Table 1 provideapproximations of elemental concentrations which can be found in fishsolids and fish liquid.
The fish liquid was quite similar in appearance to commerciallyavailable fish emulsion fertilizer. The ratio of Nitrogen to Phosphorusand Potassium in the commercial fish emulsion is 5:1:1. The ratio of TONto Phosphorus and Potassium in the mullet fish liquid derived from theHolloway Process was 20:1:4. This indicates that the fish liquid is anutrient-rich product with good potential for further refinement into acompetitive commercial liquid horticultural fertilizer.
Fish emulsion fertilizer is used to a lesser extent as an ingredientin rations fed to aquacultured larval crustaceans. The nitrogen orprotein! content is of primary interest in this application. Dietary
protein supplements reduce the degree of cannibalism in larval crustaceanrearing tanks, thereby increasing overal3. production. However, theconcentration of Potassium in the mullet fish Liquid may preclude its useas an ingredient in larval crustacean diets. Further research would benecessary to determine its suitability for that application.
The fish solids vere quite similar in appearance to canned catfoods. The mean Sodium content was 805 mg/1,000 grams, or slightly morethan the Sodium content found in raw mullet flesh �00 mg/1,000 grams!.The mean Iron content was 486 mg/1,000 grams, which was substantiallymore than is normally found in raw mullet flesh �7 mg/1,000 grams!.The authors believe that the carbon steel wall of the Hollovay Processorcontributed to the elevated level of Iron noted in the mullet fishsolids. The mullet fish solids also contain significant amounts ofdietary Calcium �,303 mg/1,000 grams!. Thus, the types and amounts ofminerals found in the mullet fish solid fraction indicate that it hasgood potential for inclusion in canned pet foods.
The ratio of Total Organic Nitrogen to Phosphorus and Potassium inthe mullet fish solids was 18:1:2. Additiona3. drying would yield afertilizer � grade meal which would be excellent for lawn � greeningapplications. The rather low Phosphorus and Potassium contents vouldalso allow the mullet fish solids to be used in catfish feed formulationsas a supplement or replacement for menhaden meal.
The results of fatty acid analyses performed on sub � units of fishoil recovered from fish liquid samples are presented in Appendix Table 2.All values totalled 99.88X of the weight of fatty acids present.
The predominant fatty acid found in mullet fish oi3. samples was17:1, which represented 64 ' 9X of the total fatty acid content. Althoughthis is basically consistent with prior research on mullet fatty acidcomposition Deng et al, 1976!, the previous study dealt with raw mulletflesh, and noted that 17:1 fatty acids were present as only 10.7X of thetotal fatty acid content. Another study NMFS, 1987! failed to find 17:1fatty acids present in concentrations greater than 1X in raw mulletflesh. They postulated that such a wide variation may have been due todifferences in diets consumed in various geographic locations.
The second most prevalent fatty acid noted in the present study was15:1, which accounted for 15.6X of the total fatty acid content. Neitherof the prior studies Deng et al, 1976! NMFS, 1987! reported thepresence of any 15:1 fatty acids. Several research efforts Gruger,1967! Deng et al, 1976! NMFS, 1987! indicate that mullet are, uniquelyenough, composed of a large percentage of odd carbon � chained fattyacids which vary according to maturity, size, sex, and the availabilityand nature of the food supply. Thus, extremely variable mullet fattyacid contents do not appear unusual.
The third fatty acid found in oil extracted from the mullet fishLiquid was 16:1, which accounted for 6.8X of the total fatty acidcontent. One prior study NMFS, 1987! identified 16:1 fatty acids as the
412

second most prevalent in mullet, with 16:1 contents ranging between 4.1Xand 18.0X of the total fatty acid content. The percentage of 16:1 fattyacids noted in the present study falls within the range noted in theprior study, although its degree of importance is reduced somewhat.
CONCLUSIONS
Based on the results of the research presented in this report, theauthors offer the following conclusions:
The energy costs for digesting mullet carcasses in the HollowayProcessor are minimal � cent/lb!.
Screened solids resulting from digestion of mullet carcasses inthe Holloway Processor occupy only half of the volume of theoriginal mullet carcasses.
The liquid fraction resulting from digestion of mullet carcassesin the Holloway Processor is equivalent in weight to the weight.of the original mullet carcasses.
The oil fraction derived from the mullet fish liquid wasrecovered at the rate of 0.5X � 1.0X.
The protein and mineral contents of the mullet fish liquidfraction indicate that it has particularly good potential forfurther refinement into a commercial liquid horticulturalfertilizer.
The protein and mineral contents of the mullet fish solidfraction indicate that it has particularly good potential forinclusion as an ingredient in canned pet foodds. Additionaldrying to a meal would allow its inclusion in various aquaculturerations.
The oil fraction contained substantial amounts of 17:1, 15:1, and16:1 fatty acids. Although these predominant fatty acids are notthe same as the predominant mullet fatty acids reported by otherresearchers, the natural variability of mullet fatty acidcomposition makes it difficult to hypothesize any commerciallyviable use for mullet oil.
413

ACKNOWLEDGEMENTS
The contributions of the following organizations and individuals aregratefully acknowledged:
Alabama Department of Economic and Community Affairs, Science,Technology, and Energy Division, for providing project funding.
Auburn University/Alabama Cooperative Extension Service, forproviding matching funds.
Robert Chen, A 4 A Seafood, for providing samples.
Brenda D. Lukefahr, UAH, for assistance with sample processing andanalysis.
W. H. Tippins, Jr., UAH. for assistance with sample collection andprocessing.
- Tim Hester, UAH for assistance with sample processing andanalysis.
LITERATURE CITED
AOAC. 1980. Official Methods of the Association of Official AnalyticalChemists. 13th Edition. Arlington, VA.
Dang, J.C., F.T. Orthoefer, R.A. Dennison, and M. Watson. 1976. ~Li idsand ~fact acids in sullen ~Mu il ~ce halus: Seasonal and locationalvariations. J. Food Sci. 41:1479-1483.
EPA. 1981. Procedures for Handling and Chemical Analysis of Sediment andWater Samples. Cincinnati, OH.
EPA. 1983. Methods for Chemical Analysis of Water and Wastes. EPA600/4-79-020. Cincinnati, OH.
Oils: Their Chemistry, Technology, Stability, NutritionalProperties, and Uses. pp. 3 � 30. AVI Publishing Company.Westport, CT.
Hewlett � Packard. No Date. Operations Manual for Hewlett � PackardModel 85890-A Gas Chromatograph � Flame Ionization Detector.Hewlett � Packard Corporation.
414

NMFS. 1987. Proximate and Fatty Acid Composition of 40 Southeastern U. S.Finfish Species. NOAA Technical Report NMFS 54. NTIS.Springfield, VA.
Urban Waste Resources. No Date. The Holloway Processor: An EconomicAlternative to Landfill and Burning MSW. Urban Waste Resources,Inc. 1141 Regent Dr., Birmingham, AL 35226.
ACKNOWLEDGEMENT STA~T
415
This
Departmentopinions,those ofDOE It
material! was prepared with the support of the U.S.of Energy DOE! Grant No. DE FG-44-80R410074. However, anyfindings, conclusions, or recommendations expressed herin arethe authors s! and do not necessarily reflect the views of

Appendix Table 1. Elemental Anaylsis.
Range 26.0 � 45.3 .04 � 3.76Mean 35.6 1.9Std Dev 13 ' 6 2.6
ZN
Range .04 � .08 .01 � .35Mean .06 .18Std Dev .03 .24
CD
Range 4.58 � 26 ' 4 .08 � 6.87Mean 15.5 3.48Std Dev 15.4 4.8
Range .59 � .63 ~ 02 � .14Mean .61 .08Std Dev .03 .08
NI
Range 257 � 716 16.4 � 17.].Mean 486 16. 8Std Dev 324 0.5
Range .98 - 1.76 .01 - .02Mean 1.37 .015Std Dev .55 .001
Range 350 � 539 60.2 � 72.8Mean 444 66 ' 5Std Dev 134 F 9
MG
Range 1032 � 1574Mean 1303Std Dev 383
CA
Range 2467 � 2476 2153 � 2169Mean 2472 2161Std Dev 6.4 11.3
416
RangeMean
Std Dev
RangeMean
Std Dev
Fish Solids
mg/kg
1229 � 1563
1396
236
650 � 960
805
219
Fish Liquidmg/1
76. 5 � 165
120.862.6
382 � 617
499166
572 � 823
698177

WeightXFatty Acid
Antesiso
3 OH
IsoIso 2 OH
Iso FIso
AnteisoA8
2 OH
Iso EIso
Anteisotrans
cis
64.48Iso
cis 10
cycloIso 3 OH
Iso F
trans 11
cyclo2 OH
.46
.01
.75
.35
.82
.01
.02
99.88Total
417
Appendix Table
9:0
10:0
11 0
11 0
12:1
12:0
13:1
13:0
12:114:0
13:0
14:1
14:0
15:1
15:015:0
15 115 1
15:0
14:016:116:016:016:1
16:1
16:0
17:1
17:1
17:016'0
18:1
18:1
19:0
18:0
2. Mullet Oil Fatty Acids.
.02
.01
.01
.02
.01
.06
.02
.08
.55
.01
.02
.08
1.69
15.48
.09
.03
.05
.041.13
.53
6.18
.05
.94
.56
.06
5.26

IL'0
lgIZ W
CO
O
CIK
C4
CC0COGO
O
0 K
0
Z 0
0 ~Z g
co~ Y+ CO
+co Cl
418
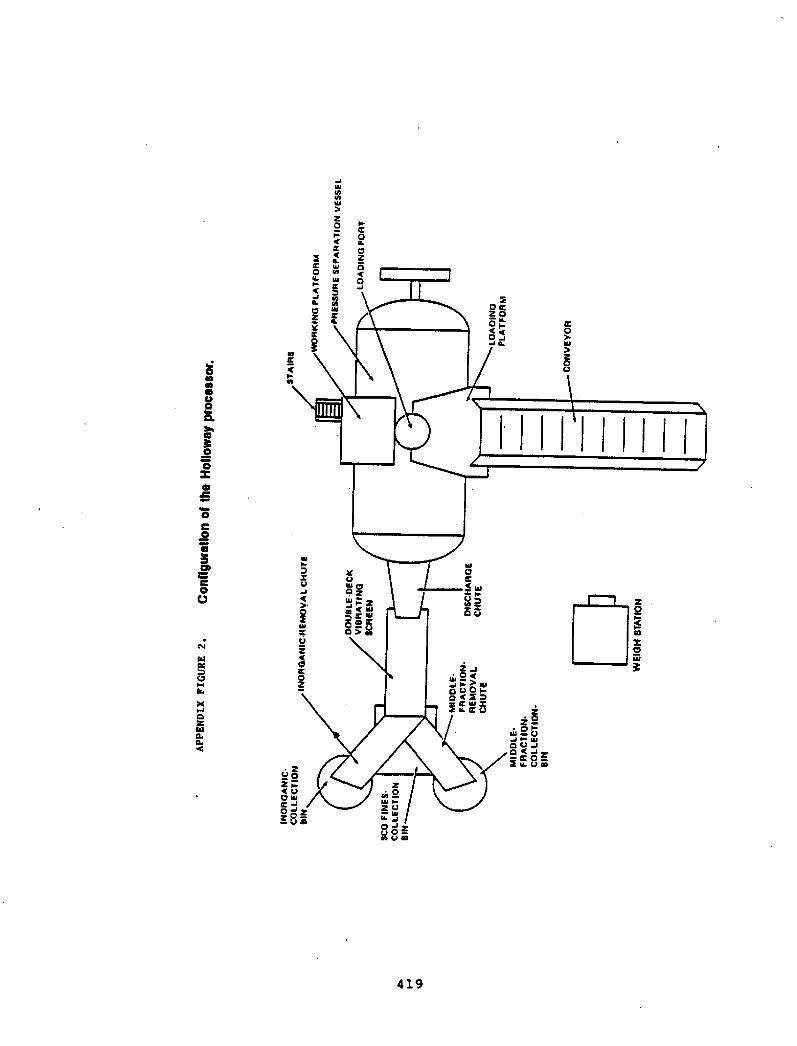
Q ZEI Q a.
IZ
Im0
0 00
C
0 0X 4I
0 C 0
C 0U
PCM CIX W
Oe VX CQ
C Q Z Or>QQ-Ye v &
4L9

Appendix Figure 3. Average Energy and Material Flows.
5-6 gal 4'2 F 1 2 KWH electricity
ish "Stew
516 lb
Fish Liquid
420
511 lb
Mullet Carcasses
256 lb StearaVented DuringDepressurization
250 lbFish Solids
511 lb
Aqueous Liquid
511 1b
Steam
5 1bFish Oil

QNLZtY QF PKLVIOUSLY FROZEN OYSTERSREPACKI FOR THE FRESH MARKET.
Cameron R. Hackney, Thomas E. Rippen and Lisa K. Sanders
Virginia Polytechnic Institute and State UniversitySeafood Agricultural Experiment Station
102 S. King St., P.O. Box 369Hampton, Virginia 23669
There are advantages to freezing oysters and repacking them for thefresh market when demand is high. The demand for oysters is seasonal,with the highest demand occurring during Thanksgiving and Christmasholidays. The price is of course very high at this time. If oysters arebought at lower prices during October and early November and frozen, theycan be thawed and repacked to meet the holiday demand.
Prior to 1986, repacking of previousl,y frozen oysters was notpermitted by Part II of the National Shellfish Program's Manual ofOperations FDA 1986!. The public health explanation given is "Ifshellfish are thawed during repacking, high bacterial counts andaccelerated product deterioration may result". However, in realityfreezing usually decreases the number of bacteria in a product. Certainchanges do occur during freezing of oysters. Frozen oysters may darkenduring storage and the drained weight is decreased Desrosier andTressler, 1977!. Packaging is an important consideration in the freezingof oysters. The packaging material must lend itself to freezing and mustbe impervious to moisture and oxygen transfer. Of course freezing shouldnot be used as a means to salvage oysters near the end of their expectedshelf-life. In order to have a good product, the oysters should befrozen as soon after shucking as possible.
The objective of this research was to compare the quality ofpreviously frozen oysters to fresh during storage and to determine if itis preferable to freeze oysters before or after blowing.
Oysters were purchased either fresh or frozen from a localprocessor. The oysters were shucked at anyone of several locations andbrought to a central location for freezing. Fresh oysters were obtainedfrom the same lots as the frozen oysters. They were brought to thelaboratory in one gallon containers, drained, repacked in 12 ounce jarsand used in shelf-life studies. For freezing, one half gallon of theshucked oysters were drained, and transferred to 3 ml-thick poly bags.The bags were impermeable to oxygen. Air was squeezed from the bags andthe bags were sealed. The bags were laid flat and the maximum thicknesswas less than 3 inches. The bags were frozen at -40 C and were frozen in
421

less than two hours. The bags of oysters were allowed to stay overnightat -40 C and were then shipped frozen to the laboratory, where they wereheld at -20 C until thawing and repacking. Lot 1 was stored frozen for2, 6, and 8 months before testing. Lots 2-5 were held for 1-3 monthsbefore testing.
Shelf-life studies
Fresh oysters were tested at approximately 2 day intervals for 12-13days for their sensory and microbiological quality. In addition thesamples were analyzed for pH. Raw and cooked samples were subjected tosensory analysis by a 9 member trained panel. The raw samples wereplaced into odorless, clear glass containers and the panelists were askedto evaluate them for odor, appearance and texture. The cooked sampleswere individually wrapped in aluminum foil and steamed for 15 minutes.The samples were evaluated for odor, appearance, taste and texture. Thepanelists used a 9 point scale ranging from excellent 9! to inedible �!.
The aerobic plate counts of the oysters were determined by theprocedures of APHA �984!. The oysters were drained and blended withoutliquor and the appropriate dilution was pour plated with plate count agarand incubated for 4 days at 20 C. The pH of the samples was determinedon the undiluted homogenate.
Frozen oysters were thawed in ice water and the drain weight andfree liquor content vere determined by the procedure of AOAC �!, usingsterile skismers. Samples included oysters that were blown prior tofreezing and non-blown oysters. The oysters that were blown beforefreezing were drained two minutes and reweighed. The drained oysterswere packed into 12 ounce jars for shelf-life studies described above.
A portion of each sampleafter freezing, and freshprocedures of the AOAC �980!Hackney et al. �988!.
of non-blown, blown before freezing, blownsamples was tested for total solids byand for NaC1 content by the method of
Statistical analysis was done by the method outlined by Snedecor andCochran �967!.
RBSULTS AND DISCUSSION
The quality of previously frozen oysters was compared to fresh
422
Non-blown oysters were blown prior to repacking. One gallon ofoysters vere added to 35 1 of water in a plastic carboy. The water waschlorinated to 50 ppm. Air was pumped into the carboy from the bottom.The oysters were agitated in the blow tank for 10 minutes; then air wasshut off. Fresh water was added and alloved to overflow the tank for anadditional 15 minutes. The wash water was clear before oysters wereremoved. The oysters were collected, drained and weighed to determineweight gain. The oysters were then packed into 12 ounce jars for shelf-life studies as described above.

oysters over the expected shelf-life of the products. The oysters wereeither blown before or after freezing. The non-blown oysters weresignificantly p>0.05! higher in total solids and NaC1 than the blownoysters Data not shown!. However, when the non-blown oysters were blownin the laboratory after freezing, there was no significant difference ineither NaC1 or total solids content. Also, there was no significantdifference between the frozen and fresh oysters p <0.05X! with respectto NaC1 and total solids.
The previously frozen oysters were evaluated in eight differentstorage trials. Trials one through four were from the same batch ofoysters stored for different periods of time over 10 months. Trialsfour through eight were from different batches of oysters processed ondifferent days. Since there were no differences between trials for thepreviously frozen, repacked oysters during storage, the trials werecombined. There was no significant difference p <0.05'! in the APC ofthe previously frozen oysters over storage Pigure 1!. The mean APC wassignificantly p�.05! higher for the fresh oysters, indicating thatfreezing was lethal to some of the bacteria. The initial count of theoysters that were frozen non-blown and blown in the laboratory afterthawing, was lower. The wash water was chlorinated and this may haveaffected the counts.
The initial pH of the frozen oysters was significantly lower thanthat of the fresh oysters Pigure 2!. It is well known that salutes areconcentrated during freezing, which can lower pH. The pH values of thepreviously frozen oysters remained about the same throughout storage; andthe pH value of the oysters blown after freezing actually increased although not significantly! during storage. This is the oppositepattern usually observed with oysters and may have been due to acidproducing bacteria being sensitive to freezing andjor chlorine.
The overall sensory scale for raw oysters is a combination of theodor, appearance and texture scores. The overall sensory score was verysimilar, for the fresh and previously frozen oysters Pigure 3!. Thepreviously frozen oysters were a little darker, but not significantly so.The oysters which were frozen non-blown and later blown in the laboratorywere lighter then the oysters blown before freezing. When the oysterswere tested with a calorimeter, using the LAB scale, the laboratory blownoysters had higher L values and lower 8 values. Unfortunately this testwas only performed during the last two trials and there wasn't enoughdata for statistical analysis.
The overall cooked sensory score, which was a combination of theodor, taste, texture and appearance scores, for the steamed oysters wasalso quite similar to the fresh and previously frozen oysters anddifferences were not significant p<0.01! Pigure 4!. This indicatesthat the previously frozen oysters would be acceptable to the consumer.
This work indicates that previously frozen oysters would be anacceptable product from a microbiological and sensory standpoint. Thequick freezing method used in this study minimized the darkening oftenencountered with previously frozen oysters and a gentle blowing in 50-100ppm chlorine could serve to lighten the color. The shelf-life of the
423

Figure l. Overall mean of the aerobic plate counts for previouslyfrozen and fresh oysters during storage
Each data point is the mean of 8 replicates
424

Figure 2. OveraLl mean of the pH of previously frozen and fresh oystersduring storage
Each data point is the mean of S replicates.
425
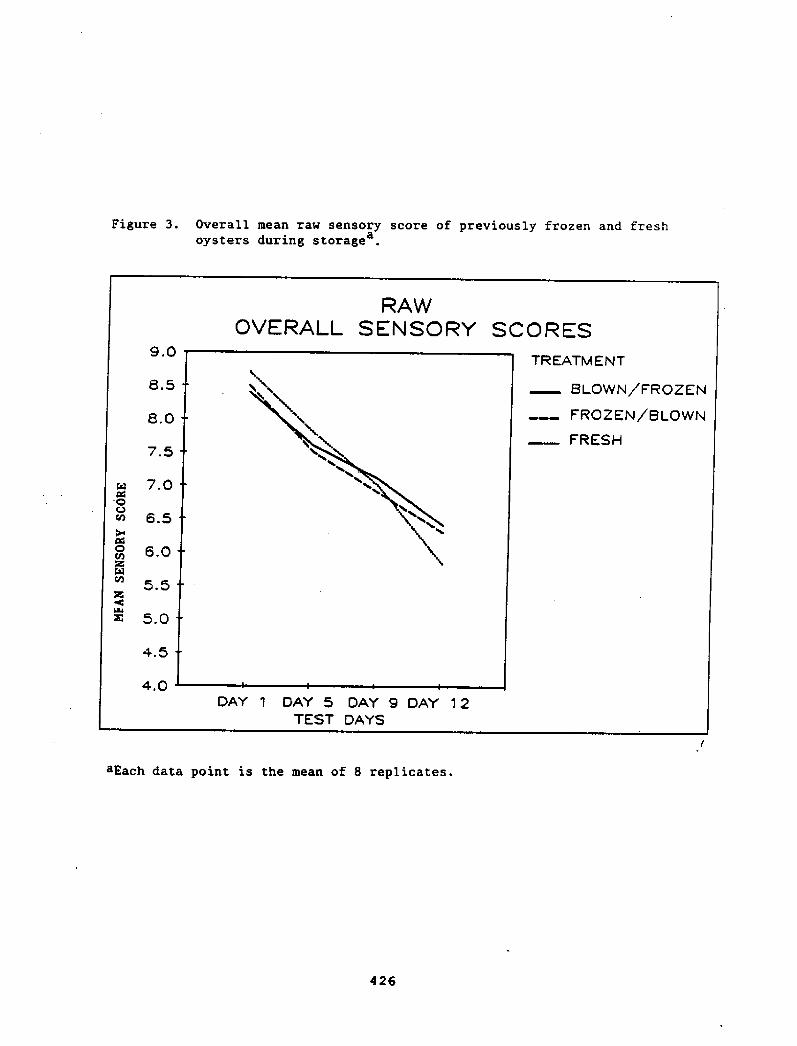
Figure 3. Overall mean raw sensory score of previously frozen and freshoysters during storage a
aEach data point is the mean of 8 replicates.
426

Figure 4. Overall mean sensory score of previously frozen and fresh cooked! oystersa.
aEach data point is the mean of 8 replicates.

previously frozen oysters was similar to that of fresh oysters. It is,of course, important that only fresh product be frozen for laterrepacking.
The issue of labeling was not addressed by this investigator. TheFDA Compliance Guide 7120.06 does define a fresh product andinterpretation of this guideline may require that oysters that werepreviously frozen and later repacked for the fresh market be so labeled.
1. American Public Health Association. 1984. Compendium of Methodsfor the Microbiological Examination of Foods. Am. Pub. Hlth, Assoc.Washington, Dc.
2. Association of Official Analytical Chemists. 1980. "OfficialMethods of Analysis of the Association of Official AnalyticalChemists. Washington, DC.
3. Desrosier, N.W., and Tressler, D.K. 1977. "Fundamentals of FoodFreezing". AVI Publishing Co., 'Westport, CT.
4. Food and Drug Administration, Shellfish Sanitation Branch. 1985.National Shellfish Sanitation Programs Manual of Operations, partII, Sanitation of the harvesting and processing of shellfish. U.S.Dept. of Health and Human Services. Government Printing Office,Washington, Dc.
5. Hackney, C., Sanders, L., Rippen, T., and Reily, L. 1988.Improved Method for Determination of Salt in Oysters by DirectTitration of Chloride Ion. J. Food Sci. 53:
6. Snedecor, G. and Cochran, W. 1967. "Statistical Methods" 6thed. The Iowa State University Press, Ames, Iowa.
This work was supported by a grant from the Gulf and South AtlanticFisheries Development Foundation Incorporated {Tampa!.
428

GR%% IRRADIATION OF VIBRIO �K!LERM" IN CRAYFISH POOCAI!!fBARUS CLARKZIGERS!RD!
Ro!bert N. Grodner and Arthur Hintan, Jr.Department of Focd Science
Louisiana State University Experiment StationLauisiana State University Agricultural Center
Baton Rouge, Zauisiana 70803
INTRCGUCTION
Altlxmgh freshwater crayfish may be found in every state in theUnited States, Lauisiana graws, pnxx.sses, and consums 90% of allcrayfish produced for human cnnemptian �! . Today the demand forcrayfish in Louisiana and the surrounding Sauthern states is increasing�!. Most ccimnercially processed crayfish is marketed as hand peeledtailmeat �! . The taiImeat may be frozen, but it is usually stored atlaw temperatures abave freezing. 'tfhen the crayfish meat is properlyhamQe4, it has a shelf life of apprcncimately ane week �! .
The refrigerated shelf life of nest seafaods can be increased byusing pasteurizing levels of irradiation . Dosm of 100 to 1000 kraddestroy 90 to 99% of spoilage organisms present �!. A langer shelflife would rmm that fresh crayfish could be stored for langer periodsof tine and marjceted at greater distances fran its source.
Crayfish are ~nmted fran rivers, bayous, m!!amps, lakes orshallow ponds built especially for crayfish prcducCian �! . I f thewater fran which the crayfish is taken is contaminated, there is achance that the crayfish neat may harbor pathogens. Crabs taken frcmcontaminated waters were responsible for 11 Vibrio cholerae infecticcsin looisiana in 1978 !. Microorganisms o~fecal orrgrn haveisolated frcl! crayfish waters, whole crayfish, and crayfish taiJzmat
�!- The purpose of this study was to determine the ef facts ofpasteurizatian levels of irradiation and cold storage on the survival ofV. cholerae in nansterile and sterile crayfish banc!genates.
HM'.ERIiU!S AND NETHCGS
Crayfish tailmeat hanogenate was prepared by blending 3 parts freshcrayfish meat with ane part sterile saline to form a sncoth paste.haregenate was then inoculated to produce a final canamtratic!n of 10Vibrio cholerae 01/g !biotype altar, sercvar Znaba, looisiana Strain85875! . the sterile crayfish seat hcmcgenate was pre!mred in the sanamanner, except the crayfish ruat was sterilized at 121 C for 15 minutesbefore blending. The inoculated samples were placed in 250 ml Nalqenebottles, packed in ice and transferred to the L.S.U. Nuclear ScienceCenter.
429

Irradiatian of the samples was performed by placing the Nalgenebottles cantaining the samples in a watertight chamber filled with iceand sealed. The chamber was then lowered into the 18 ft deep and 6 ftdiarteter lead lined pit which was filled with water. pravidL'Ilg theeffective radiation shield. The Colbalt-60 saurce dose rate was 1650rad per minute. The samples were exposed to 25, 50 and 100 Krad basedon the number of rads emitted per minute as a function of tilre to attaL'nthe desired dosage. The samples were then rmmecl, packed in ice ardtransferred to the Food Science Department for analysis and examined forthe presence of Vibrio cholerae at 0, 7, 14 and 21 days after coldstorage at -8, 0 or 4 C. Control samples were treated in the samemanner, except that the irradiation treatments were emitted. The numberof V. cholerae surviving was calculated by deterlnining the averageneer of V. cholerae recavered fran triplicate samples subjected to the88HK irradLatLan treatment aIld cold storage
Becasezy nmthodology far V. cholerae an crayfish neat hcncgenatesinclndsd zez7nery frtsn a 8 8 hr alkaline peptane water APN! enrichmentand isolation thiosulfat~itrate-bile salts-slime TCBS! and gelatinagar. After incubation at 35 C, suspect V. cholerae colonies grawing an
iran agar IUA! and lysine iran agar LIA!, and serologically withPolyvalent and Inaba Vibrio cholerae 01 antiserlm.
After irradiatian the samples were stared. at 4, 0, or -8 C for 21days. The nuInber of V. cholerae surviving the irradiation treatment andthe cold storage were enumerated at 0, 7, 14 and 21 days respectively�! ~
IrraI3iatian of V. cholerae in sterile and nonsterile samples wereperformed in triplicate.
RESETS AM! DISCUSSION
Effect of irradiation. In the nansterile hcmogenate each 25 kraddose of Lrra&atLan produced a 1 to 3 log reductian in the number of V.cholerae/g m~averlsd Figure 1! . The nonsterile unirradiatedhcaegenates' initial V. cholerae population of 4.g x 10 /g was reducedto l. 66 x 10 /g by 25 krad. Only 8. 01 x 10 V. cholerae/g wererecovered frcm the hcmegenates treated with 50 kraS. No V. choleraewere recaverad fran the nonsterile hcmo8penates treated with 100 krad.
In the sterile hanoyenates, V. cholerae seined naze susceptibleto the irradiation than in the nonsterile hcxnogenates. There were3. 67 x 10 V. cholerae/g recavered fxpn the hmvgenates which werenot irradiated, but only 4. 4 x 10 /g were recovered fran thehmegenates treated with 25 krad. No V. cholerae were recovered franthe hcaeymates treated with 50 or 100 krad.
430
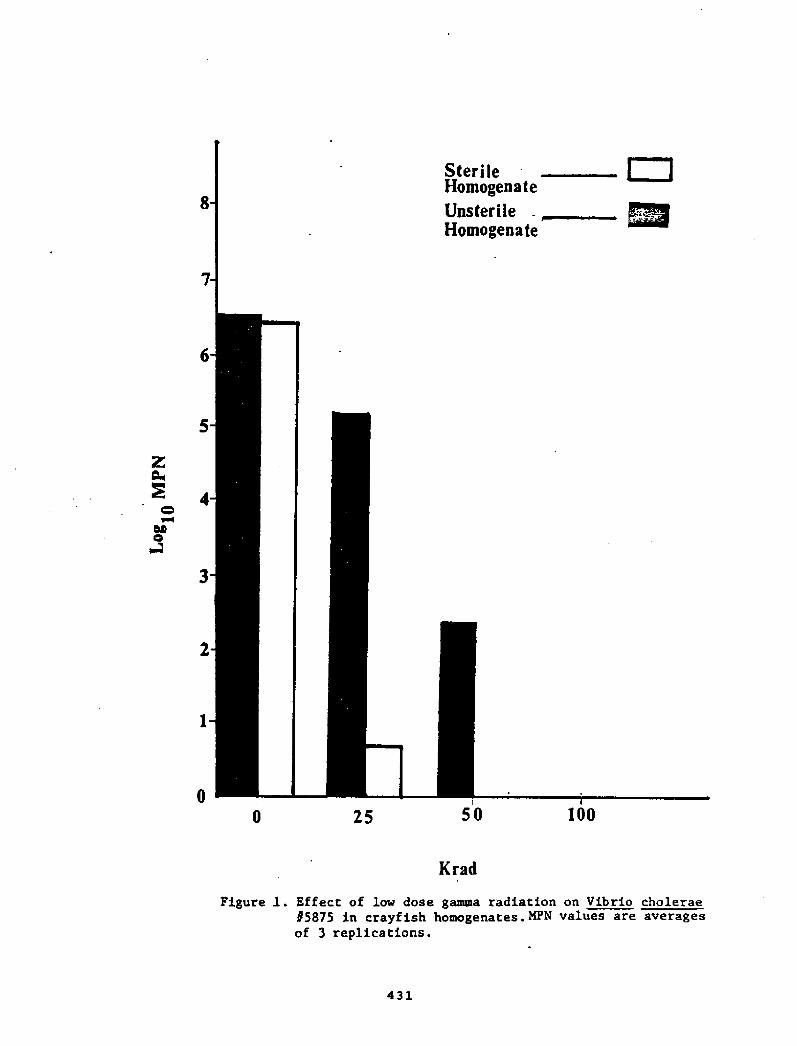
3
1005025
Krad
431
Figure l. Effect of low dose gamma radiation on Vibrio choleraef5875 in crayfish homogenates. MPN values are averagesof 3 replications.

2114
Days of storage
432
Figure 2. Survival of Vibrio cholerae 85875 in unirradiatedand irradiated unsterile crayfish homogenates storedat 4C. MPN values are averages of 3 rep3 ications.

Effect of time. Vibrio cholerae were not able to survive for 21days m the nonsterile hanogenates stored at 4 C Figure 2! . Theorganian was able to survive for 14 days in the nonsterile hanogenatestreated with 0, 25, or 50 krad. After 14 days there was a largedecrease in the V. cholerae population.
Qn day 0, 4. 3 x 10 V. cholerae/g were recovered fr<an the6
unirradiated nonsterile hanogenates, and an day 14, 5. 6 x 10 wererecovered. No V. cholerae were recovered fran the unirradiatednonsterile samples co~day 1. The number of V. cholerae recovered franthy nansterile hcmogenates Peated with 25 krad decreased fran 1.66 x10 /g on day 0 to 3.87 x 10 /g on day 14 before decreasing to 0 on day21. The nansterile hanogenates treated with 50 krad showed resultssimilar to those obtained with the hmegenates treated with 0 krad or 25krad. Though there was a decline in the V. cholerae papulatian an day7, appraximately 8. 0 x 10 V. cholerae/g were isolated f rem thehcxegenates an day 0 and an day 2l.~i~cholerae were re1mvered franthe hmegenates an day 21.
After 21 days there was anly a slight debase in the V. choleraepapulation of the sterile crayfish hceegenates treated with 0 krad or 25krad md stored at 4 C Figure 3!. On day 0, 3.63 x 10 V. cholerae/gweze recqmazed fran the unirzadiated sterile hcsmgenates. Here were6.0 x 10' V. cholerae/g recovered an day 7. The populatian of thecholera organisms ~lined to 3.13 x 10 /g on day 14 and declinedfurther to 9.11 x 10 /g an day 21.
The survival pattern of the organism in the sterile hanogenatetreated with 25 krad was similar to the survival of the arganism in thesterile unirradiated hem~enate. The V. cholerae populatian numbered4.4 x 10 /g on day 0 and 1.33 x 10 V. thol~eras g were zwcom zed cn day21.
Vibrio cholerae were able to survive for 21 days in the nansterilehamgenates stored at 0 C figure 4!. In the hanogenates treated with 0krad ar 25 krad the V. cholerae papulatian dec~mK apprgximately 1 logcycle aver the 21 day storage period. There were 4.3 x 10 V, cholerae/grecovered pan the ncmstezile unirradiated hamgenates on dray, and6.25 x 10 /g were r4mmered on day 21. The number of V. choleraereccwered fran tip nonsterile hamgenates treat@8 with 25 krad M~easeZfran 1 ~ 66 x 10 /g on day 0 to 4. 86 x 10 /g on day 21. In thehmegenates treated with 50 krad and V. cholerae population decreasedfran 8.01 x 10 /g an day 0 to 5.0 x 10 /g on day 21.
'?he V. cholerae also appeared to survive well in the sterilecrayfish ~enate stored at 0 C Figure 5! . The initial population of3.� X 10 /g in the unirradiated hamgenate deer~ slightly to 1.16 x10 /g after 21 days of storage. The V. cholerae poqplation of thehcaegenate treated with 25 krad decrease frcxn 4.40 x 10 /g on day 0 to1.33 x 10 /g on day 7. On day 14, 3.0 x 10 V. cholerae/g wererecovered, and 2.67 x 10 V. cholerae/g were recaverec on~ay .?l.
433

14 21
Days of storage
434
Figure 3. Survival of Vibrio cholerae 85875 in unirradiatedand irradiated sterile crayfish homogenates storedat 4C. 8PN values are averages of 3 replications.

14
Days of storage
Figure 4. Survival of Vibrio cholerae f5875 in unirradiatedand irradiated unsterile crayfish homogenates storedat OC- M'N values are averages of 3 replications.
435

CO
0
14
Days of storage
Figure 5. Survival of Vibrio cholerae 05875 in unirradiatedand irradiated sterile crayfish homogenates storedat OC. MPN values are averages of 3 replications.
436

'Ihere were relatively small changes in the V. cholerae populationof the nonsterile $cmxyenates stored at -8 C for 21 days Figure 6! . Onday 21, 1.14 x 10 V. cholerae/g were recovergd frcm the unirradiatednansterile hcxnogenates which contain 4.3 x 10 V. cholerae/g on day 0.The number of V. cholerae reccpered fxan the hcamgenatgs treated with 25krad deczeased fr~a. x 10 /g~ day 0 to 9.2 x 10 /g on day 21. Onday 0, there were 8.01 x 10 V. cholerae/g recovered fram thehavcvganates treated with 50 krad, and~8. 5 x 10 V. cholerae/g wererecovered on day 21.
There was a decline in the number of V. cholerae recovered frcxn thesterile hcaegenates stored at -8 C for 21 days Figure 7! . The V.
0 schal ae population of the unirr~ted hanogenates decreased frcm 3.63x 10 g on day 0 to only 8.5 x 10 /g an day 21. On day 0, although 4.4x 10 V. cholerae/g were recovered frcm the sterile hcaepenates treatedwith 2E krone V. cholerae were recovered fran these hzazvlenates after14 or 21 days of storage.
Effect of t atuze T.he survival of V. cholerae in unizradiatedand irradiated sterzle haex9enatse stoned at 4 or 0 C was very similar.The organism was able to survive for 21 days in the sterile hanogenatesstared at both temperatures. In sare cases there were slight increasesand decvMUnes in the V. cholerae pop,Qation, but the number of orcynismsrecovered during storage never varied nore than 1 log cycle fran thenumber of organisms recovered on day 0.
The arganism did not survive as well as in the sterile halogenatestored at -8 C. The number of V. cholerae recavered fran the frozenhmegenates declined by over 3 log cycles dur~ storage at -8 C. Thehmngenates treated with 25 krad contained 4.4 x 10 V. cholerae/g on
ar 21.
~ ~ ~ ~
Up to day 14, there was anly a slight difference in the number ofV. lerae reared fran the nanSterile hmegenateS StOred at 4, 0,or � C. Usually the number of arganians recovered fran the naneterilehanogenates stored at the different temperatures differed by less than 1log cycle.
On day 21, no V. cholerae were recovered fzcm the nonsterilehasxlenates stored at 4 C, hut the om2anism was recovered frcm thehanogenates stored at 0 or -8 C. The possible reasan for this isdiscussed below.
Survival in nonsteri1e and sterile tes. In fresh crayfishneat Shcroccccus, St ococcus, ~cane are the predavinantgenera of microorganisms present �! . After eight days of storage at0 C, Pseudmemas becomes the daninnnt genera, but after eight days at5 C Achranobacter beccmes the daninant genera. At the end of the
groups accost for almost 100% of the microbial population.
437

14 21
Days of storage
438
CO
0
Figure 6. Survival of Vibrio cholerae 45875 in unirradiatedand irradiated unsterile crayfish homogenates storedat -8C. MPN values are averages of 3 replications.

0
21
Days of storage
Figure 7. Survival of Vibrio cholerae 85875 in unirradiatedand irradiated sterile crayfish homogenates storedat -8C, NPN values are averages of 3 replications.
439

In the sterile hmmyeaates the natural microbial flora and thenaturally ocrurring enzyme of the crayfish meat had been destroyed.The V. cholerae placed in the nonsterile crayfish meat had to canpetewith the crayfish's natural microflora to survive. Fresh crayfish meathas a total aerobic plate count TPC! CF 1.6 X 10 organisms/g. After24 days of storage at 0 C, the TPC increases to 3.2 x 10 $g, and after24 days of storage at 5 C the TPC increases to 2.8 X 10 organisms/g�! .
In the unirradiated sterile and nonsterile homogenates stored at4 C and the survi~ pattern of V. cholerae was similar up to day 14.Qn day 21, 9.11 x 10 V. choleraegg were recovered frcm the unirradiatedsterile hcxnogenates, but no V. cholerae were recmrered from theunirradiated nonsterile hamcjenates. Si~mar results were seen in thesterile and nonsterile ham~nates treated with 25 krad. At 4 C, thep@tchrotro~c micnmrganisms in the crayfish's natural microflora wereable to grow. This cxxapetitive inhibition was probably responsible forthe decline in the nuaher of V. cholerae recovered fran the hanogenates.
Vibrio cholerae ~ able to survive for 21 days in nonsterilehanogenates stored at 0 or -8 C. The lower temperatures retarded thegnash of the psy~trophs which outgrew the V. cholerae at 4 C.
'%bere was a large difference in the survival of V. cholerae in thesterile and nonsterile haa~enates stored at -8 C. The V. choleraepopulaticn of the ncesterile hanogenates remained relatively staETeduring the 21 days of storage. The proteins of the sterile hcaogenateshad been denatured by the sterilization treatment. Native proteins are
because they have a greater effect on the rate of crystallization in thefood �! . Native proteins bind nore water malecules and red' the rateof crystallization. Less dehydraticn of the bacterial cells is producedand the microorganisms can survive longer in the food.
These results indicate that V. cholerae can survive for sane tirein crayfish tissues stored at low taaperatures. Pasteurization doses orirradiation may be successfully used to destroy this pathogen incrayfish.
1. Bamazt, G. 1979. Basic Food Microbiology. AVI Publishing Co.,Westport, Conn.
2. Cox, N. A. and R. T. Lovell. 1973. Identification andcharacterization of the microflora and spoilage bacteria infr~ter crayfish Procanb-~ clarkii Girard! J. Food Sci.38:679-681.
440

3. Grodner, R, N. and A. F. Ncnrk. 1975. Nicrobiological guidelines
Louisiana State University, Division of Continuing Education,Baton ~, LA.
4. Hinton, A., Jr. 1983. Irradiation of Vibrio cholerae in shrimp Panaeus setiferus!. Ph.D. Thesis, Louisiana State University,
Baton Rouge, IA.
5. Louisiana Nonthly Norbidity Report. Sept. 1978. Dept. of Healthand Human Resources. New Orleans, LA.
6. Noody, N. W. 1980. The Crawf ish. louisiana CooperativeExtensions Service. Sea Grant Publication, LSUTL-80-002.
7. Raj, H. and J. Liston. 1961. Survival of bacteria of health ofsignificance in frozen seafoods. Food Technol. 15:429-433.
441

A STATISTICAL REVIEV OF THE INTERSTATE SHELLFISHSANITATION CONFERENCE'S
SAXPLIN ' PROTOCOL FOR SATISFACTORY SHIPPING CONDITIONS
Alvin P. RainosekNOAA, National Marine Fisheries Service,National Seafood Inspection Laboratory,
P. 0. Drawer 12K, Pascagoula, XS 3%68-1297
INTRODUCTION
At the 1986 Annual Meeting of the Interstate ~hellfish ='an"-.atio-:..Conference ISSC!, a sampling protocol for the microbiological analysis<Fecal Coliform, E. Coli and Aerobic Plate count> and acceptance ofshellfish shipments was adoyted. This protocol appears in Appendix A ofthe National Shellfish Sanitation Program NSSP> Revised Xanual � Part II<effective January, 1988!. Prior to mandatory implementation, however,the ISSC at its 1987 Annual Meeting decided to refer the protocol to asubcommittee for additional study of its oyerational feasibility andstatistical reliability. This subcommittee will report it findings atthe 1988 ISSC Annual Xeeting.
When evaluating any sampling yrotocol, several ma!or issues shouldbe addressed. One, is the sampling protocol feasible, practical, costeffective, etc' This is primarily a managerial/administrative decisionand is not considered in this payer. Also not considered is thedefinition of a lot, what constitutes a laboratory samyle <e.g., how manyoysters make up a sample!, and how will the samples be selected from alot'? Vhat is presented, however, is a statistical review of thediscriminatory power <performance/operating characteristics! of thismulti-phase, multi-stage samyling protocol. That is, how well will thisprotocol identify shipments of varying microbial quality~ Suchinformation should be available and understood as part of the decisionmaking process regarding the acceptability of the protocol for theintended puryose. The initial draft of this paper has been reviewed byFDA staff in the Division of Microbiology, the Shellfish SanitationBranch, and the Division of Mathematics.
This statistical review is provided for the first and secondshipment conditions as outlined in Appendix A of the NSSP Revised ManualPart II. Probabilities were calculated by using either the binomial orthe trinomial probability distributions under the following twoassumptions: �! the number of samples analyzed is less than 1M of allyossible samples within an entire lot, and <2! the test results forE, coli and Aerobic Plate Count are independent. Derivations of allprobabilities presented are available upon request,
442

FIRST SHIPNEXT SANPLIXG � FECAL COLIFORN FC! A3'D E. Cali EC!
~Ste 1 � Analyze 2 randos sasnlss of shellstoch or shuchel Orcduc-'.for K. Decision rule � If one or both samples exceed 23$ NPN FC,::o toStep 2 EC!; otherwise, the lot is considered satisfactory.
Ste 2 � Far those samples in Step 1 exceeding 239 XPK FC. analyzefor E . Decision rule � If one or both samples exceed 238 NPZ C, notifyhe dealer, etc., and. go to Second Shipment Sampling; othe~iso, '.h
is considered satisfactory,
For Steps 1 and 2 combined i.e., FC then EC!, what is the chance! «111 1 d~tf
all possible samples in the lot that exceed 238 MPK EC~
Let p = the actual percent of all possible samples inthe lot that exceed. 23$ NPI EC
P<EC! = the probability <in percent! that the lot willbe found satisfactory for EC
p P<EC! 2 P<EC! P<EC!
~Et ~lt tl . 1 Et Eh 1 1 1«1 I Eand when 30% of all possible samples in the lot have EC levels exceeding11 111, 92h 11 h tl 1 1 ill h 1 t 1
The above table can also be used to determine the Likelihood that FCscreeni will r uire testi for EC. For example, suppose that 3$% ofall possible samples in the shipment <lot! exceed 238 NPN FC, then thereis a 49% chance that none of the two samples wiLl require testing for EC or a 51% chance that at least one of the two samples will requiretesting for EC!.
For First Shipment Sampling, it may be of interest to have P EC!values for different sample sizes <i.e., 1, 3, etc!, For selectedsample sizes, this information is presented in Appendix l.
FIRST SHIPNEKT SANPLIEG � AEROBIC PLATE COUNT APC!
Analyze the two samples selected in Step l above for APC. DecisionruLe � If one or both samples exceed 5$8,8$8/g APC, notify shipper statefor investigative and corrective action,
443
0 188.$ 35 42.25 98,2 4$ 36,$
10 81.8 45 30.215 72.2 5$ 25.$2$ 64.8 55 28.225 56,2 68 16.$
I 38 49.8 65 12.2
78 9.$75 6.28$ 4.885 2.298 l.$95 8.2
108 $.8

What is the chance that the lot will be found satisfactory for APCassuming various percentages of samples in the entire lot that ac.uallyexceed 508,808/g APC?
q = the actual percent of all possible samples inthe lot having APC levels exceeding 580,888/g
Let
P<APC! = the probability in percent! that the lot willbe found satisfactory for APC
The P<EC! probabilities given on page 2 apply to APC as well.That is, when q = p, then P<APC! = P<EC>. For example, whenq = 3N, the probability that the lot will be found satisfactory forAPC is 49.8%.
FIRST SHIPMENT SAXPLIXG � CHANCE OF LOT ACCEPTANCECOB'SIMRII'G BOTH EC AID APC
What is the probability when considering both tests <FC/EC andAPC!, that the lot will be found satisfactory assuming various values ofp and q? This will occur when neither EC nor APC nor bath> exceed theirtolerances. The probabilities <rounded to whole percentages! that thelot will be found. satisfactory when considering the results of both theEC and APC tests for various values of p and q are given below again,p = the actual percent of all possible samples in the lot exceeding 238NPX EC and. q = the actual percent of all possible samples in the lotexceeding 588,800/g APC>:
1Exam le Inter retation: Vhen p = 2K <i,e., 2M of all possiblesamples in the lot have EC levels exceeding 238 NPZ! and when g = 1% i.e., 1% of all possible samples in the lot have APC levels exceeding588,888/g!, there is a 52'L chance that the lot will be found satisfactoryfor both EC and APC. Gr, there is a 48K chance that either the EC teator the APC teat or both> will exceed their toierances,
444
p8 180 81
10 81 6620 64 I 5230 49 4040 36 2950 25 2060 16 1378 9 788 4 398 1 1
188 8 8
28645241312316
10 6 3 18
38 48 58 6049 36 25 1640 29 20 1331 23 16 1024 18 12 818 13 9 612 9 6 4
8 6 4 34 3 22 1 1 11 8 8 88 0 8 8
78 88 98 1809 4 1 87 3 1 06 3 1 84 2 1 83 1 8 82 1 8 81 1 8 81 0 8 88 8 8 88 8 8 88 8 8 8

SECOND SHIPMENT' SAXPI,IXG � FC AK BC
~Ste 1 � Analyze 5 randon sasples of shellstock or enacted prodoc.for FC. I!ecision rule � If any sample exceeds 338 XPI FC or 2 or moresamples exceed 238 MPN FC but are less than or equal to 338 MPH FC, :o ;:=Step 2 EC!; otherwise, the lot is considered satisfactory. ."oat:sampling plan represents a 3-Class plan where n = 5, c = 1, m = 2:8, andX = 338.
Ste 2 � For those samples in Step 1 exceeding 238 XPN FC, analy=efor B . ecision rule � If any sample exceeds 338 XPX BG or 2 or moresamples exceed 238 XPB BC but are less than or equal to 338 XPZ BC,initiate action as indicated in Appendix A of the NSSP Revised XanualPart II; otherwise, the lot is found satisfactory. Mote: Same 3-Classsampling plan as in Step 1 above.
For Steps 1 and 2 combined FC then BC!, what is the chance thatthe lot will be found satisfactory for BC'?
Let p< = the actual percent of all possible samples in the lothaving EC MPX levels greater than 238 but less than orequal to 338
p> = the actual percent of all possible samples in the lothaving BC leve].s exceeding 338 MPB
P EC! = the probability in percent> that the lot will be foundsatisfactory for EC
The P BC! probabilities assuming various values of p and. p are givenin the following table.
p2
38 35 4815 28 255 18
445
2 8 1885 98
18 9215 8428 7425 6338 5335 4348 3445 2658 19
7V 5975 5778 5363 4V55 4147 I 3438 2738 2123 161'7 1112 7
44 33 2443 32 2348 29 2835 25 1729 21 1424 16 1119 12 814 9 518 6 3
7 4 24 2 1
17 12 816 11 714 18 612 8 5
9 6 47 4 25 3 13 22 1

nizam le Inter retation. For Second Shipment Sampling PC then iC!and when p = 25Z i.e., 25Z of all possible samples in the lot have iCXPN levels greater than 238 but less than or equal to 338!, and whenp2 = 18Z i.e., 18Z of all possible samples in the lot have EC XPXlevels exceeding 338!, there is then a 34Z chance that the lot will befound satisfactory for iC.
SZCOND SHIHENT SAXPLING � AFC ANALYSIS
knalyxe the 5 random samples for APC. Decision rule � Ii any sharpieexceeds 1,588,888/g or if 3 or more samples exceed 588,888/g but are ;e =-than or equal to 1,588,888/g, notify the shipper state for investigativeand corrective action. Note: This sampling plan represents a 3-Classplan where n = 5, c = 2, m = 588,88/g, and I = 1,588.888/g
Vhat is the chance that the lot will be found satisfactory for APC?
Let q> = the actual percent of all possible samples in the lo.having APC levels greater than 588,808/g but less thanor equal to 1,580,000/g
q2 = the actual percent of all possible samples in the lothaving APC levels exceeding 1,500,888/g
P<APC! = the probability in percent! that the lot will be foundsatisfactory for APC
The probabilities <in percent! that the lot will be found satisfactoryfor APC for various values of q and q are given in the following table:
15 28 38 35 48
Eixam le Inter retation: Por Second Shipment Sampling APC! andwhen q = 25Z ii.e., 25Z of all possible samples in the lot have APClevels exceeding 588,888/g but are less than or equal to 1,588,888/g!,and when q2 = 18Z <i.e., 18Z of all possible samples in the lot have APC
446
Ri 8 5 10
8 188 77 595 99 77 59
18 99 77 5815 97 75 5728 94 72 5425 98 68 I 5138 84 63 4735 76 57 4148 68 58 3545 59 42 2958 58 35 23
44 3344 3344 3243 3148 2937 2734 2429 2825 1628 1215 9
242423222119161318
5
17 12 817 12 816 11 716 11 714 18 613 8 511 7 4
8 5 36 3 24 . 2 12 1

levels exceeding 1,588,888/g!, there is a 514 chance that the 'ot wil; b-fouad satisfactory for APC.
SECOND SHIPNBXT SAXPLIKG - CHAKE OF LOT ACCBPTAKECOXSIDBRIIG BOTH K AK APC
Vhat is the probability when considering both tests FC/ECand APC!, that the lot will be found satisfactory assuming variousvalues of p>, p2, q~ and q2 , This will occur when neither EC nor APC nor both! exceed their tolerances. These probabilities can be easilydetermined by multiplying the second shipmeat P K! and P APC!probabilities given above, Two examples follow;
piggy~: Let pr = 154, p2 = 2N, ~ = 1W, and q = 15K. Thenthe chance that the lot will be found satisfactory when considering boththe EC aad kPC test results is given by 8.25! 8.44! = 11%.
t . Ith h I 1 h= 5 I I htsamples exceeding 238 MPX BC but less than or equal to 338 XPI K,p2= 2K of all possible samples exceeding 338 %PI K, q = 1N of allpossible samples exceeding 588,888/g APC but less than or equal to1,588,888/g kK, aad q2= 15K of all possible samples exceeding1,588,888/g APC, there is aa 11% chance that the lot will be fouadsatisfactory for both EC and APC.
Por reference purposes, when considering the twc tests ~se ratel<1! for pj = 15% and p2 = 2N, there is a 25'L chaace that the lot will befound satisfactory for EC, and, �! for q = 1W and q = 15%, there is a44'4 chance that the lot will be found satisfactory for APC. Vhenconsidering the two tests ~to ether, the separate probabilities aremultiplied; thus, .25!<.44! = 11%.
Exam le 2: Let @ = 1N, p2 = 5%, q = 15%, aad q2 = 1%, Then thechance t at the lot will be found satisfactor7 when considerins bath theEC and kPC test results is given by 8.78! 8.57! = 4K .
Vhen considering the two tests separately: �! For p> = 1M aadp2 = 5'L, there is a 7Ã chance that the lot will be found satisfactory,and �! for q> = 15% and q2 = 1W, there is a 575 chance that the lotwill be found satisfactory,
FIRST AR! SBCOID SHIPMBIIT SAXPLING COMBINED � BC
Suppose First Shipment Sampling two samples analyzed! is to beapplied to a certain shipmeat. Vhat is the probability, denoted byP <both!, that both this shi ent as well as the next shi meat from thesame shipper Second Shipmeat Sampling � five samples analyzed! will be
t C. 5:5 h I Cinitiating SSRA action as aoted in Appendix A of the 1ISSP Revised ManualPart II.
447

For various values of p the actual percent of all possible samplesin the lot having EC exceeding 238 XPR under First Shipment Sampling!,and for Second Shipment Sampling, ~ the actual percent oi all possiblesamyles in the lot exceeding 238 MPR EC but less than or equal to 338 MPREC! and p2 <the actual percent of all possible samples in the lotexceeding 338 MPR EC!; P both! can be determined by using the FirstShipment P<EC! and Second Shipment P EC! probabilities given above, .&woexamples follow:
Example 1: Let p = 5N, p~= 3M, and p2 = 2W', thenP<both! = �-8.25!�-8.12! = 66'X. Rote: This calculation assumes that thetwo shipments from the same shipper are independent.
III ttl .'tf 6 fl dt h =5 f llsamples exceediag 238 MPR EC, aad the second shipment has p = 38% of allpossible samples exceeding 238 XPR EC but less thaa or equa te 338 MPREC and y2 = 2Ã of all possible samples exceeding 338 XPR EC, then there
6 6 h hhtth t lll 6 f 6 I f 55.
jjxam~~le: Let y = 2N, p> = 15%, and p2 = 1', thenP<both! = �-8.64!�-8.4'P! = 19%.
litt t: If 6 ll t 5 I = 6th f ll fsamples exceeding 238 XPR EC, and the second shipment has yi = 15% of allpossible sample exceeding 238 MPR BC but less than or equal to 338 MPR EC
- and p2 = 1Ã of all possible samples exceeding 338 MPR EC, then there isa 19% chance that both shi ents will be found unsatisfacto for EC.
SECORI! SHIPMERT SAXPLIRG - URSATISFACTORY CORDITIORS OF SHIPMENT
SSRA notifies shipper and state of origin by telephone. For producton hand and aypears satisfactory, apyly the same sampling plans used for~ft <d f hl t. 5, ll Ih hhprobabilities given above for satisfactory conditions of shipmeat applyto this case as well,
CORCLUSIOR
Amoag the several issues that should be considered when adoyting asamyling plaa for ayylication in practice is its statisticalreliability, The performance/operating characteristics of the ISSC'ssampling protocol for satisfactory shiyping conditions presented in thispaper should enable responsible authority to judge the statisticalacceptability of this protocol for the iatended purpose.
448

APPHDIX 1
For first shipment sampling, the probabilities that a shipment willbe found satisfactory for E. cali <EC! using samples sizes of 1, 2, 3, 4and 5 are given below.
bet p = the actual percent of all possible samples in the lothaving EC levels exceed,ing 238 llPX
n = the number of random samples <sample size! of shellstoc~or shucked product selected from the lot and analyzed
P<EC! = the probability <in percent! that the lot will be foundsatisfactory for EC i.e., none of the n samples willexceed 230 MPR EC!
n=5
P EC!
n=2P EC!
'n=3
P EC!n=4
P EC!
n=1P EC!
449
8 518152825383548455855686578758885
95188
188.895,898.085.080.875.870.865.068.055.058.845.848.835.830.825.820.815.818,8
5.80,0
100,898.281,872,264.056 ' 249 ' 042 ' 236.830.225.820.216,812,2
9 ' 86.24.82.21.80.20.0
180,085.772,961 ' 451- ~ 242 ' 234 ' 327.521. 616.612.510.86 ' 44 ' 32.71,68.88 ~ 30.10.1
8.0
188,881.565.652,241.831.624.817.913.8
9.26.24.12.61.58,88,48,28.18 ~ 18.18.8
188,877,459.844,432.823,716,811,6
7.85.83.11,81.88.5
8,28,18,18.1
8,18.18.8

CONTROLLED FRESH WELL-WATER CLOSED SOFT CRAB SHEDDING SYSTEM
Wayne WescottUNC Sea Grant College Program, Marine Advisory Service
P.O. Box 699, Manteo, N.C. 27954
The shedding of blue crabs has become a multimilliondollar industry along the U ~ S ~ East Coast. The NorthCarolina industry alone grew more than 700 percent between1983 and 1986 with landings rising from 87,570 pounds to596,468 pounds.
Crabbers shed blue crabs in three types of systemsfloating, flow-through and closed recirculating.
The oldest method of shedding soft crabs is thefloating shedder --- a floating box that allows water toflow in and out. It is placed near the shoreline, and crabsare shed in the box.
Although inexpensive, floating shedders are difficultto woz'k, dependent on good quality water, and subject towave action and temperature fluctuations. Poor waterquality, strong waves and temperature changes can causemortalities.
In an onshore flow-through system, shedding boxes arebuilt on land and water is pumped from a nearby creek orbay. This is a more expensive system, and it also can beaffected by poor water quality and temperature changes.
Secause the cost of waterfront property is expensive,its availability is limited and water quality is variable,crabbers are turning to closed recirculating systems.
Pre
These systems do not control water temperature, requireconstant monitoring and need 20 to 30 days start-up time forbacteria to grow before peelers can be shed. Bacteria areneeded to convert harmful ammonia from crab wastes! intoharm'less nitrate.
450
reservoisk imme r sshedding
sent recirculating systems use shedding t rays, ar, mechanical filters, biological filters, protein
pumps and plumbing to provide suitable water forcrabs.

UNC Sea Grant, working with commercial shedd rs,developed a temperature-controlled, we LL-water sheddingsystem. Thas system can be used anywhere suffaceut waliwater is available. It uses cool groundwater and heatingelements to regulate water temperatures between 70 F and 75F ~
This system requires Little monitoring for ammonia,nitrate or nitrite. It needs no biologicaL f ilters, protein8k immer or pre I iminary start-up because we l I wate r is usedto replace water that is continuously drained from thesystem. The continuous dilution prevents the buildup ofharmful substances'
TEMPERATURE CONTROLLED FRESHWATER SYSTEM
Figure I iLlustrates a typical closed freshwatershedder used for an onshore flow-through system. The traysare lighted for night work. They are plumbed with twocontrol vaLves and drains per tray, an aerator at each valveto add oxygen, a rubber hose on each aerator to reduce sprayon the crabs, and a screen on each drain to keep premoltand soft crabs out.
Water is pumped from a reservoir that is supplied by awell. PVC pipe, measuring L L/2 inches, supplies the waterfrom the reservoir to the shedding trays, and a 3-inch PVCpipe returns it to the reservoir.. A valve is added to thereturn line to drain the system if necessary.
The fresh welL-water reservoir reduces the problems ofwater quality, oxygen content and water temperature. Avariance in any of these factors can cause crab mortalities.
Other systems have maintained suitable oxygen -levels,and some have attempted to manage water quality. But nonehave successfully managed all three factors.
To maintain water quality, theallows water to seep into the groundin the bottom of the reservoir. This
need for nitrifying bacteria.
fresh well-water systemthrough holes driLledseepage eliminates the
451
Inexpensive test kits can be purchased to monitor waterquality. If problems arise, the water can be diluted or

452

completely replaced to eliminate problems. Zt zs not asimportant to reuse tne water as it xs to have good wace r forthe crabs ~
Co a I liter
two aerators
MODIFICATIONS
The freshwater recirculating system has several designmodifications. It requires the use of a groundwater welI.pump to supply the reservoir and a circulating pump Losupply the shedding boxes.
Other items needed are a 220-volt power line for the3000-watt elements, a thermostat to control the elements,a thermostat to control the well pump, a mercury switchor water level-control switch to maintain the water level
in the reservoir, a valve to drain the system, an overflowdrain in the reservoir and a filter box.
These modifications help maintain the proper waterquality, oxygen content and temperature to successfully shedcrabs any time peelers are available.
THE FILTER
To build the filter frame Fig. 2!, use 1-by-10 inchlumber. The frame i s 45 I/2 inches long, 18 inches wide and10 inches deep. The freshwater filter is nailed against theshort side of the 4-by-8-by-4 foot plywood reservoir belowthe return line from the shedding boxes and about 4 inchesfrom the top.
453
Oxygen is added to the water as it returnsbox, as rt passes through the filter box and byin the supply line of each shedding box.
The water temperature of groundwater rangesto 65 F. This is too cold for crabs to shed. To
water to the ideal shedding temperature of 72 F,watt heating elements, like those in a hot waterused. To cool the water temperatures in June, JuAugust, well water is added to the reservoir.
from 55 F
warm the
four 3000�
heater, arely and

The bottom is covered with window screen that may benailed or stapled to the trame. To provide strength andsupport, a layer of crab pot wire is nailed or stapled underthe screen.
the topL ter
rack
Two layers of insulation are placed in the top of theframe. A third layer is also cut and used as a spare. Twicea week the top layer of insulation is removed, replaced bythe spare and cleaned in a washing machine with regulardetergent. The clean layer of insulation becomes the newspare.
of insulation is also
y ~
454
Then two layers of l-inchconditioning insulation are cutof the frame. A snug fit shouldthrough the insulation insteadalong the edge.
Every two weeks the bottom layeremoved and cleaned the same wa
thick foam rubber air
to fit snugly withinforce the water to fi
of passing through a c

HEATING ELEMENT
A homemade heat xng device shown in Figure 3, us ing four3000-watt elements like those xn a hot water neater, isinserted underwater in tne reservoir r.
These elements are at tached to 4-by-44-by-6 inch boxsteel box. The elements are sealed with waterproof caulkingor by welding. Or crabbers can buy an equivalent heatingelement at their local hardware store.
The element is mounted lengthwise in the reservoirabout 2 feet from the bottom. The element should be coveredby water at all times.
455
The heating device is activated by aon a probe near the reservoir bottom. Whentemperature reaches 72 F the elements arethermostat.
thermostat switchthe water
turned off by the

The well pump has a manual switch for start-up and athermostat to activate the pump if the water gets too hot,To prevent the heating elements from burning up, a waterlevel switch is used to activate the pump if water level inthe reservoir drops because of leakage.
THE RESERVOIR
The reservoir in Figure IV is buiLt of I/2-inch plywood4 feet wide, 4 feet deep and S feet long. It is buried inthe ground 2 feet to allow gravity drainage from theshedding tables . The ground also re inforces the box so thatin most cases it does not need to be braced with 2-by-4 inchboards.
4S6

Six Co eignt 1 1/2-inch holes are drilled in Cne bottomoi the reservoir to allow leakage into the ground.
The 1 1/2-inch PVC pipe intake is inserced in a 5-inchperforaLed sewer pipe covered with one ton of rock. Thereservoir should have an overflow drain in case excess freshwater is added when Cooling, and it should be covered Cokeep out trash.
It should be noted that 110 volts are required Cooperate the pumps and lights. A separate line of 220 voltsis necessary to supply the heating elements.
reservoir shown in Figure IV can store up to 600of water. That should be enough water for eight toing tables. If you' re considering a larger system,
need to make adjustments in the size of ther ~
HOW THE SYSTEM WORKS
The well pump f ills the reservoir and remains on unt i 1the desired water level in the reservoir and shedding traysis achieved. Initially this should take about two hours orless if your we1,1 has a pumping capacity of 10 gallons ofwater per minute or more.
The circulating pump forces water to the sheddingtables. The heating device is activated only after it iscomplete ly s ubmerged in wa ter.
Water is pumped from the reservoireturns through the filter box to theconstantly seeps from the reservoir threservoir. The water level switch actto replace lost water. Groundwater isgood water quality.
If the water temperature falls beunit automatically warms cool water totemperature rises above 75 F, the pumpmore cool groundwater to bring the terncooling operation makes an overflow pirelease of excess water.
457
The
gallons15 shedd
you willreservoi
r to the boxes andreservoirs Waterrough the holes in theivates the well pumppumped in to ensure
low 70 F, the heating72 F. If the waterautomatically adds
perature down. Thispe necessary for

Freshwater systems require at least two pumps, twothermostats, a water control, mercury switch and heatingunits. These devices will increase the electric bill.
Also keep in mind that peeler crabs used in this systemmust be captured in waters with saliniLies of 15 ppt orless. Peeler crabs co11.ected from water with highersalinities may suffer total mortality unless artificial saltis added to bring salinity within 15 ppt of the level wherethe crabs were caught.
Some people question the stress of fresh water uponblue crabs, but experience has proven it is not a factor. Infact, the largest soft crab shedding facility between NorthCarolina and Mexico successfully sheds soft crabs in serosalinity.
458
If you have a successful floating shetnrough system or closed recirculating sysit. The freshwater shedding system is forshed crabs in cold and hot weather or for
poor surface or no natural surface supply
dder sys tom, flow-tem, don't changthose who want to
those who have
nearby.

AN ECONOMIC ANALYSIS OF THE 1986 ALABAMA MULLET ROE INDUSTRY
William Hosking, Brian E. Perkins, and Richard K. WallaceAlabama Sea Grant Extension Service
3940 Government BoulevardMobile, AL 36693
and
Hugh A. SwingleAlabama Department of Conservation and Natural Resources
Marine Resources DivisionP.O. Box 189
Dauphin Island, AL 36528
Alabama processors converted 2.05 million lbs of roe mullet intofive products roe, gizzards, whole male fish, carcasses for humanconsumption, and carcasses for bait! valued at $1.75 million, andemployed 140 land-based personnel during the October � November 1986season. Analyses of domestic and overseas product and value flows arepresented.
INTRODUCTION
The Autumn of 1986 saw many newcomers enter the Alabama mullet roeindustry. The previous year's strong prices up to 75 cents per/lb offemale roe mullet! provided incentive for additional Gulf Coast fishermento direct their efforts toward roe mullet. Consequently, roe mulletgillnetted from Louisiana through Florida were processed in Alabama.Several new mullet roe processing facilities also opened their doorsduring 1986.
The Alabama Sea Grant Extension Service gathered the followingpoundage and value data as part of a larger project conducted incooperation with the Alabama Department of Conservation and NaturalResources, Marine Resources Division. Funds for the overall project wereprovided by the National Marine Fisheries Service through the MarineFisheries Initiative.
459

METHODS
The data presented in this report were collected from five Alabamamullet roe processors. In some instances, processors provided access totheir purchase and sales receipts. In other cases, processors simplyprovided total product volume and value statistics for the variouscommodities purchased and sold.
RESULTS
Roe mullet purchased by Alabama processors were caught by fishermenin four Gulf Coast states. Total poundage and contributions fromindividual states are listed in Table I:
Table I. 1986 Sources of Roe Mullet Processed in Alabama.
% of TotalState Pounds
905,263644,210463,158
40,000
Louisiana
Alabama
Florida
Mississippi
44.1
31.4
22.5
2.0
2,052,631 100.0
460
The number of fishermen responsible for the above production has provenimpossible to ascertain.
Prices paid to fishermen for "95% pure" female roe mullet rangedfrom 75 cents/lb to 90 cents/lb. Therefore, roe mullet fishermen werepaid between $1.54 million and $1.85 million during the seven- weekseason. Based on an average seasonal price of 82.5 cents/lb, the meantotal price paid to fishermen was $1.69 million.
Although Alabama processors paid for "95 % pure" female roe mullet,the collected statistics indicate that the previously reported total of2,052,631 lb was actually composed of 1,650,000 lb of female mullet and402,631 lbs of male mullet. This translates into 19.6% males and 80.4%females.
Upon arriving at the processing facilities, the mullet wereseparated by sex. The whole round! male "white roe" mullet werepurchased by Egyptian buyers at an average price of 21 cents/lb. The402,631 lb of male mullet generated a total gross profit of $84,552 forAlabama processors during 1986.
The female roe mullet were then split and stripped of roe sacks andgizzards. Roe sack and gizzard yields averaged 17% and 1%, respectively.Based on 1.65 million lb of female roe mullet, total roe and gizzardproduction was 280,000 lb and 16,500 lb, respectively. All gizzards and

female roe sacks were purchased by Taiwanese buyers. Gizzards vere soldfor an average of $1.60/lb, and yielded a 1986 total gross profit of$26,500. Female roe prices ranged from $2.40/lb for less-than-2-ounce orbroken roe and up to $7.00/lb for 7-8 ounce roe. The mean sale price forall sizes of mullet roe was $5.50/lb, and generated a total gross profitof $1.54 million for Alabama processors during 1986.
The remaining 1,353,500 lb of female roe mullet carcasses weredisposed of by either of two methods. Some of the carcasses �%%u, or83,500 lb! were of extremely high quality, and were sold to 5 or 6smaller mullet smoking operations for 25 cents/lb, and yielded the mulletroe processors a total gross profit of $20,875. The value added by thesmaller mullet smoking firms could not be ascertained.! However, themajority of the carcasses 94K or 1.27 million lb! were sold as crab baitfor a mean of 6.25 cents/lb, and generated a total gross profit of$79,455.
The 1986 Alabama mullet roe production and gross income statisticsare summarized in Table 2:
Table 2. 1986 Alabama Mullet Roe Industry Products, Production, andGross Income.
Product Type Total Production, lb Mean Value, $/lb' Gross Income, $
5.50
.21
1.60.0625
.25
Mullet RoeMale Mullet
Gizzards
Bait CarcassesFood Carcasses
280, 000402,631
16,5001,270,000
83,500
],,540,00084,55226,50079,45520,875
2,052,631 1,751,382
461
The gross income values are not exactly multiplicative due to rounding ofmean $/lb values.
The five Alabama mullet roe processors employed an approximate totalof 140 land-based personnel. Those personnel were manual laborers whowere paid at or slightly more than minimum wage $3.35/hour!. The manuallaborers were responsible for loading and unloading refrigeratedtransport trucks, splitting mullet, removing roe and gizzards, andpackaging roe and other secondary products for transportation or storage.The 140 manual laborers were paid a total of $131,320 in wages by thefive processors. That figure translates into $938 per employee, or anavera'ge processing labor cost of 6.4 cents/lb of roe mullet.
As was previously mentioned, Alabama processors paid a mean total of$1.69 million for roe mullet during 1986. That price was FOB plant, andno additional freight costs were borne by the processors on the

Table 3. 1986 Alabama Mullet Roe Industry Production Expenses.
Expense Type Pounds Mean $/lb Expenses Expense, $
1,693,420131,320
59,2808,2107,800
2,052,6312,052,631
520,0002,052,631
520,000
Cost of Mullet
Labor ExpenseFrozen StoragePackagingTransportation
.825
.064
.114
.004
.015
TOTAL 1,900,030
462
purchasing end. Likewise, no additional freight costs were paid by theprocessors on the selling end. Primary products female roe sacks andgizzards! and a portion of the secondary products whole, round malemullet! were purchased at the plants by Taiwanese and Egyptian buyers.Consequently, any additional freight costs were borne by the foreignbuyers.
Several processors sold their byproducts bait carcasses! to Floridabuyers as the carcasses were produced. The bait carcasses vere purchasedon site, and no additional freight costs were borne by the processors.The same was true for processors who sold high-quality carcasses to localmullet smoking operations. The food carcasses were purchased at theprocessing plants, and no additional freight charges vere incurred by theprocessors.
Several other processors stored their byproducts in a frozen storagefacility in dovntown Mobile. Approximately 520,000 lb of mull tcarcasses had to be transported from the processing plants to thewarehouse in downtown Mobile. Based on an average shipping cost. of $150per 10,000 lb, a total transportation cost of $7,800 was paid by Alabamaprocessors.
The 520,000 lb. of mullet carcasses vere held in frozen storage forvarious periods of time ranging from 5 � 7 months. Based on an averagecharge of 2 cents/lb/month, Alabama processors incurred total frozenstorage expenses of $59,280. That figure translates to an average of11.4 cents/lb of stored mullet carcasses.
All primary products, secondary products, and byproducts verepackaged for transportation and storage. The usual packages were poly-lined 20-kilogram cardboard boxes, although sub-units of female roe sackswere additionally packed in individual plastic bags and 1-kilogram paperboxes. Packaging costs averaged .4 cent/lb. Therefore, it cost a totalof $8,210 to package the 2.05 million pounds of mullet products.
The 1986 Alabama mullet roe production expense statistics aresummarized in Table 3:

Appendix Figure 1 provides a schematic representation of 1986Alabama roe mullet industry product and value flows. The total expenseand total gross income figures calculated in Tables 3 and 2,respectively, indicate that, based on a mean purchase price of 82.5cents/lb of roe mullet, the 1986 Alabama roe mullet industry suffered a$148,648 mean net loss. Given that prices as low as 75 cents/1b and ashigh as 90 cents/lb were paid for roe mullet, the overall 1986 Alabamamullet roe industry economic situation actually could have rangedanywhere between a $5,299 net profit and a $302,596 net loss.
The $148,648 mean net loss was probably the result of severalprocessors who profited, several who broke even, and several moreprocessors who operated at a loss. This presumption is based on severalsituations which presented themselves during the October � November 1986roe mullet season:
Several firms discontinued processing once the price for "95 Xpure" female roe mullet escalated beyond 80 cents/lb.
Several firms, with specific contractual agreements to fulfill,had to continue processing regardless of exvessel price.
The lang-term frozen storage of mullet carcasses imposed anadditional expense of $67,080, which contributed roughly 45Xtoward the overall industry mean net loss.
Some processors felt that their "counts" were off. Theyexpected a greater percentage of 7 � 8 oz roe the product ofgreatest dollar value! than they actually recovered. Thus,their total gross profit and average price per lb of roe wereboth less than they anticipated.
CONCLUSIONS
Based on the data collected during the course of this project andpresented in this report, the authors offer the following conclusions:
Processors generally paid too much for roe mullet.
Too many male mullet were purchased at female roe mulletprices.
Exported mullet roe was of smaller size.
Too much expense was incurred for long-terra storage of baitcarcasses.
The mullet roe industry, as a whole, operated at a loss.
463

ACKNOW' D GENTS
The authors wish to express their appreciation to the followingindividuals and organizations for their support and cooperation.
The National Marine Fisheries Service, Marine FisheriesInitiative, for providing project funding.
The Auburn University/A3.abama Cooperative Extension Service,for providing matching funds'
The members of the Alabama roe mullet industry, for providingdata and statistics.
Mr. E. Moret Smith, for assistance with data collection.
464

APPEIDIX F!6URE l. 1986 ALA8AHA ROE %LLET INOUSTRTPROOF% ANO VALUE SCIIEHAT I C

HARVEST AND PRESERVATION OF A SHRIMP BYWATCH:
Yaowen Huang, Paul Christian and Dan ColsonThe University of GeorgiaMarine Extension Service
P. 0. Box Z
Brunswick, GA 31523
INTRODUCTION
Jellyfish have been highly valued as a salted, dried seafoodcceeedity in the Orient for centuries. In 1985, the world harvestof jellyfish was 182,662 metric tons. These were primarily caughtfrom the Indian, Northwest Pacific. and Western Central PacificOceans by countries including Thailand, indonesia, Malaysia, thePh i I lippines, and China FAO, 1987 !. The species caught in theseareas belong to the genus ~gho iiema. Among them. g. escuienta isthe most conmon species for processing Mayer, 1910' Davidson,9777
~R � 'years, jel l yf i sh have been gaining importance in the inter-national markets. especially in Asia Huang, 1985!. This has Iedcountries not producing jellyfish to begin studying the productionos other species. ~catost ius spp. 97as, therefore. csee inAustralia Wootten et alee 1982! and Aurelia spp. in India Govindon, 1984!.
In U. S ~ waters, there is a non-stinging species of jellyfish
range from the mouth of the Chesapeake Bay to Texas. When abun-dant, they become a nuisance to shrimp fishermen. This specieshas been successfully developed into an edible form'on a pilotplant scale Huang, 1986, 1988!. The prototype product wascompared favorably to the existing imported products Huang,1987!. In order to completely utilize this resource, theharvesting method, on-board handling, and preservation ofcannonball jellyfish need to be understood. Objectives of thisstudy area 1! to determine the harvesting methods using smallerand larger fishing vessels, on-board handling, and preservation,and �! to compare the catches of cannonball jellyfish by usingdifferent Turtle Excluder Devices TEDs!.
MATERIALS AND METHODS
Research was conducted aboard University of Georgia vesselsin two phases. The first phase was conducted in the St. SimonsSound, Georgia Study area A! Figure 1! from May through June1986 using the R/V UNDERDOG, a 12-m long lobster boat. Theobjectives were to study small-scale harvesting, on-boardhandling, and preservation.
466

Figure l. Hap of Study Areas A and B in the ~aters aroundSt. Simons Island, Georgia
467

A 6~ flat net was used for phase one studies. The net wasconstructed from 4.8-cm stretched mesh number 12 nylon webbing forthe wings and body, with number 24 twine for the codend. Standardwooden trawl doors were used, and measured 0.9 x 0.38 m. Bridlelength was 9.1 m. The net was equipped with three 15.2-cm Spongexfloats on the headrope with standard loop chain spaced every 0.4 mon the footrope. A 4.8~ tickler chain which was 45.7 cm shorterthan the footrope was also used. The trawling time was 15minutes.
Phase two was conducted 3 to 5 N miles east of the southportion of St. Simons Island, Georgia Study area B! Figure 1!from October through December 1986 using the R/V GEORGIA BULLDOG,a 22~ long coalaerciai shrimp boat. One of the objectives was todetermine the corenercial scale catch and retention of cannonballjellyfish in nets equipped with Turtle Excluder Devices TEDs!.
Two identical 18.2-m flat nets were used for these studies.Each net was constructed from 4.8-cm stretched mesh number 15twine for the wings and body, with number 36 twine for the codend.Standard wooden trawl doors were used, and measured 1.0 x 2.4 m.Bridle length was 75.8 m. Each net was equipped with ten 20 ' 3-cmSpongex floats on the headrope and mud rollers spaced every 1.1 mon the footrope. In addition, 64-mn loop chain was used on thefootrope at the center 1.9 m! and wing/corner piece sections�.8 m!.
The sampling technique was designed to fit the random blockdesign Mendenhall, 1968!, and the trawling was in a mannersimilar to that used by coamercial fishermen. The net on the sideof the vessel to receive the TED was randomly chosen. All TED-equipped nets were pulled simultaneously against a control netwith no TED. Four TEDs, including the Louisiana TED, Georgia TED,Texas TED, and NMFS TED, were used in this study Christian andHarrington, 1987!. Tow time remained constant at 1 hour.
Ice and seawater were used for testing the preservation ofcannonball jellyfish on the boat. An innovative three-phasesalting and pressing technique was tested Huang, 1986! to produceand evaluate the finished jellyf ish product.
RESULTS AND DISCUSSION
Cannonball jellyfish is the most abundant jellyfish in thewaters off St. Simons Island, Georgia. It appears offshore inearly April and moves in nearer the beaches in May and June' Somecannonball jellyfish, however, were washed onto the beaches ofJekyll Island and St. Simons Is'land during April 1986, but nonewere caught in our trawling test during that time. By July, theyhad disappeared from shrimp grounds Figure 1!, but theyreappeared from late-October through mid-December Table 1!.During one of these periods, jellyfish filled the nets of our boat
468

II0 C
Vl
3~ ~
Ol Cl
~ ~w QQ
0
0
Q WN
0
m ~O' O
~ IQ
N
Cl
CO ~mQ
QN 0
LA 0~ I
Q N
0
my
0m
~ IPlN
CO NN
N ~4A
N N
0
N NN ~
aA O
0m
A N
~ON
0
II 0 aE
~ COl Vl
CO ~
~ LA
4A
N %
N
Q ch
N
CO
&0N
%N
0N
wmCO NO LA
N OO
0 h
wr0 Vl
Ol ~~ l
CCI0
0 LA
0 0mm
mm~
~ I
CO ~
CO N~ f
CO N
N N~ f
N ~
0ill0 ~
Ol
0I
Cl Ca c
34 00 w
0 3Z tl
4J
CO
N
CO
N
CO
CI
CO CO
N
CON
Cl
0
469
0 glCJ C
3Cl L0e a4 5a
Vl
0C 4
Cl IAa
4
Cl I
0
0as
IoC
40
0 II0
Ol
Ol
CP0 3
0Q Ol
lgtJ L~ ClC
8
c aQ
L0 r
Ul
Ih lg8 C
II0Cl IllOItg I0 I
N ~ Cg!COQ ~ th has
m

so quickly that trawling times were dramatical ly reduced. Aftermid-December, only the manubriums the stem-1 ike mouth-tube! ofjellyfish were caught> jellyfish had nearly disappeared from theshrimp grounds. Results from our 1986 studies were similar tothat of Kraeuter and Setzler 1975!. They reported thatcannonball jellyfish were col'Iected in the waters around SapeloIsland about 20 miles north of St. Simons Sound! from Marchthrough October. Both studies suggest that cannonball jellyfishare present along the Georgia coast during the spring and the fallseasons.
Cannonball jellyfish can be easily harvested using an ottertrawl with any boat rigged for shrimping. Je'Ilyf ish primarilydrift along the water's surface, and may be more easily caught'using a top water or surface trawl. The otter trawl should workfine for surface trawling, but there is a need to modify the netas well as to design a floating trawl door.
In compliance with the new Turtle Excluder Device regula-tions, four TEDs were used to study the effect on the quantity andsize of catch. Results show that use of the Louisiana TED reducedthe percentage of jellyfish by 844, followed by the Georgia TED at784, and the NMFS TED at only 34 Tab'Ie 2!. However, during theentire study period. no cannonball jellyfish were present when theTexas TED was tested. The reason the NMFS TED did not affect thequantity of catch was because the bar spacing of the NMFS TED 114.3 ran! was larger than that of the Louisiana {50.8 mm! andGeorgia TEDs �0.3 mm! Christian and Harrington, 1987!. The sizeof cannonball jellyfish caught in a TED-equipped net was alsoreduced Table 2!. Size was reduced by 504 using the LouisianaTED, while no difference was found with the NMFS TED. Since theTED will be mandatorily used by shrimpers off the South Atlanticcoast from May 1 until August 31, 1988, it suggests that a TEDwith larger bar spacing and a net with larger mesh should bedesigned to catch cannonball je'Ilyf ish.
Ice and seawater were tested for holding cannonball jellyfishafter harvesting during spring and fall. There are no significantdifferences in the eating quality of processed products.Therefore, seawater is suggested for use in preserving the catchduring May and June. However, there is no need for preservationfrom lat~ctober through mid-December for a day-long trip.
For further preservat!on of cannonball jellyfish, a saltedand dried product was produced. Results show that a three-phaseprocessing method is suitable for cannonball jellyfish. It takeseight days to process Table 3!, and the final product can bepreserved at 5'C up to one year without any 'loss of eatingquality. There are no significant differences in the texture ofprocessed products using fresh and frozen cannonball jellyfish.
470

OI
0 3
V C 0CJ
0
C 0
0
I C 00III
C 0 QL 0 Cl.
CII-
CI
I
0
u C 00I C0CD
0L
C 0 CII-
CII
CI
IIIIClm
III
00
L C 0 0 I C0
0 l44C 0 CI
I-
CI
I
0
IllCII44
0 Iu
I C0 00,
0V0 IIC 'DI0 c{1 V
I0 u0I W
44 ill0 Il-
00
Ill IV
4ILh
L 0 0O. C
C I50 0
IIw 0
m
O»m»
0
~ IQ»CF m
0CO N
Om
LA Q
m»
N~ CCI
»
471
NLA m
Q7 M
CO
O' O
IA NcO
m
COOO' O
CO
N Ch
COIZL
4~ CP'mN
~ I» O
0N
Q N
Q ~-4 0
~ IO M
0
N QO 4'
0
0 ~mO
~ IO~
Cl
u IIIOI 40» Ol3
0 ~~ 1
OI
0
ay~ ~
0
0 WN
0
N Q
Q ON
0
LA ~» O
~ IO Ch
0 0

C 0 IQIC!
rl0
D 0 4IEQlC eC
IhIh eIhO0 ~0 ~
Ill4 I
ILI
C lal 9V hl
472
Q ~
hl4 C
00 C
IOoDO
e eDC D
Ih 0 rnhl D IO
l
3 0 30 7 0
rr
E E
Orlll
E EI
O 3 I
Q hlIII rh 4Jrh al rhhl M hlC 4 C4 4
C DIh 0 l.
0 CP c4 4h I
40 IllV
Cl 0Ih III
CC hl0
98 0 !
3 07 VIh IOIh lrll 0 III
rl C0
OlWC 0IC C~ V ~
0 hl<g rh 4

CONCLUSION
2. Chilled seawater is suggested for use in preserving cannon-ball jellyfish caught during spring season. However, thereis no need for preservation in the fall season.
3. Salted, dried cannonball jellyf ish can be preserved at 5'Cup to one year without any loss of quality.
LITERATURE CITED
Christian, P. and Harrington, D. 1987. Loggerhead turtle, f in-fish and shrimp retention studies on four Turtle ExcluderDevices TEDs!. Proc. Hongame and Endangered WildlifeSymposium, September 1987. Georgia DNR, Social Circle, GA. In Press!
Davidson, A. 1977. Seafood of South-East Asia. Publisher~Federal Publications �! Pte Ltd., Singapore. p. 192.
FAO. 1987. Yearbook of fishery statistics. FAO. UH. Rome.
Grovindon, T. K. 1984. A novel marine animal with much exportpotential. Seafood Export J. 16�!s9-. 11.
Huang, Y. 1985. The utilization of American jellyfish and itsmarkets. Paper presented at the 30th Annual FisheriesTechnological Conference and International Symposium,August 25-29. Boston, MA.
Huang, Y. 'I986. The processing of cannonball jellyfish
Annual Tropical and Subtropical Fisheries Conference of theAmericas. p. 141.
Huang, Y. 1987. Acceptability and quality of cannonball
Paper presented at the 7th World Congress of Food Scienceand Technology. September 28 � October 1. Singapore.
~l~aqris! asHuang, Y. 1988. Cannonball jellyfish a food source. J. Food Sci. In P
473
1. Harvesting of cannonball jellyfish can be easily done bycomnercial shrimp vessels. However, when TEDs are requiredfor shrimp trawling, nets with larger mesh and TEDs withlarger bar spacing need to be designed. This will allowcontinued capture of larger sized cannonball jellyfish, whileallowing for the ejection of marine turtles. This needs tobe studied further.

Kraeuter, J. N. and Setzler, E. M ~ 1975. The seasonal cycle ofscyphozoa and cubozoa in Georgia estuaries. Bulletin ofMar ine Sc ience. 25� ! <66.
Mayer, A. G. 1910. iMedusae of the wor'Id. Volume 3. "TheScynhomedusae." Carneg ie Institute of Washington,Washington, DC.
Mendenhall, W. 1968. Introduction to linear models and thedesign and analysis of experiments. Wadsworth PublishingCoat Incan Belmont, CA.
Wootton, M., Buckle, M. Aap and Martin, D. 1982. Studies on thepreservation uf Australian jellyfish ~Catust ius spp.!Food Technol. Australia. 34~398.
ACKNOWI.EDGEMENTS
The authors greatly appreciate Lindsey Parker, David Daniels,Marty Higgins, and Lura Aelihan for their technical assistance.This study was supported in part by The University of Georgia, theGulf and South Atlantic Fisheries Development Foundation, and theNational Oceanographic and Atmospheric Administration, U. S.Department of Comnerce, through the National Sea Grant Program NA84 AA-D&0072!. The U. S. Government is authorized to produceand distribute reprints for Governmental purposes notwithstandingany copyright notation that might appear hereon.
474


Development and Evaluation of Skinless, Boneless Pink SalmonProducts
Charles CrapoUniversity of Alaska, Kodiak, Alaska
Elisa Elliot
USDA, FSIS, Vashington, D.CDJerry Babbitt and Kermit Reppond
National Marine Fisheries Service, Kodiak, AlaskaPaul Peyton
Office of Commercial Fisheries Development, Juneau, Alaska
INTRODUCTION
harvested in Alaska. Since 1980, pinks have accounted for 56 percent ofthe total salmon landings, averaging 71 million fish per year. Duringthis period, ex~easel prices have fallen from $0.44 per pound in 1981 to$0.23 per pound in 1986 ~ Among the reasons f or this decline have beenlimited product forms and markets.
The traditional markets for pink salmon have been as canned products, butin recent years consumption has dropped while supplies have been athistoric highs ~ The drop in consumption has been related to the change inconsumer trends to convenience type foods. As a response, the cannedsalmon industry has developed a skinless, boneless canned product whichhas found new markets.
In an effort to broaden product forms for pink salmon, the State of AlaskaOffice of Commercial Fisheries Development OCFD!, University of AlaskaFishery Industrial Technology Center FITC!, Alaska Fisheries DeveLopmentFoundation AFDF! and the National Marine Fisheries Service NMFS! haveconducted a series of studies to evaluate alternate fresh/frozen pinksalmon products made from skinless, boneless filleted' Studies includedinvestigations into product form and fresh/frozen versus reprocessed shelflife.
METHODS
Fresh-Frozen Product/Shelf Life Evaluations. Fresh pink salmon weredressed, hand or machine filleted and skinned, then trimmed to produceboneless fillets. Trimmings, which included pin and rib bone fractions Figure 1!, were minced using a Baader 694 deboner. Using 18.5 poundmetal forms, pink salmon blocks of 100 percent fillet, 100 percent mince,75 percent fillet/25 percent mince, and 50 percent fillet/50 percent mince
0 0were produced, frozen and stored at -l8 C � F! for 1, 3, 6, and 12
475

Figure 1. Cuts Uts Used To Prepare Pink Salmon Fillet Sk'and
e s inless, Boneless!an Trimmings Pin and Rib Bones!
Pin BoneFractions
ib Bone Fraction

months. Fillet �00 percent! blocks were used as controls and stored at-36 C -34 F!.
At the end of each storage period, product forms were evaluated forsensory, oxidative and physical changes' Sensory evaluation scored color,flavor, chewiness, moistness and desirabi,lity on a seven point descriptivescale and texture on a five point scale Table 1!. Color and moisturedescriptors were anchored to the control samples' Taste panel data wasanalyzed using a factorial design and least squares difference todetermine the effect of storage and product form on shelf life. Fatoxidation was determined using Lemon 's modified TBA test {1975! and thawdrip AOAC, 1984! was used as a measure for some of the physical andsensory changes occurring during frozen storage.
Re rocessed Product shelf Life Evaluation. Frozen, dressed pink salmonstored at -18 C � F! for 3, 6, and 12 months were thawed overnight at10 C �0 F!, hand filleted, skinned and trimmed to produce bonelessfillets. The trimmings were minced using a Baader 694 deboner. Fillet,mince and combination fillet/mince blocks were produced, refrozen andstored at -18 C � F! for 0, 3, 6, and 9 months. At the end of each
0 0
storage period, the reprocessed blocks were compared with the fresh/frozensamples and evaluated for sensory, oxidative, and physical changes.
RESULTS AND DISCUSSION
Recoveries ~ Fillet and mince yields from round fish varied with filletingmethods Tab1.e 2! ~ The use of mechanical f illeting equipment resulted ins lightly higher recover ice than hand f i lie ting. I ts addi ti on to thecombination fillet/mince blocks maximized recovery and provided 40 percentmore product.
gable 2. Recovery of Fillets Skinless, Boneless! and Trimmings FromManual and Mechanized Operations
X RECOVERY WHOLE WEIGHT BASIS!
Manual
Dee -skinned!Mechanical
Dee -skinned!
33.26X
12.24
33 ~ 56X
14.76
Fille ts
skinless, bonelessTrimmings
477
One Month Evaluation. After one month storage, the fresh/frozen productscompared favorably with the control samples. High sensory scores, low TBAvalues and thaw drip indicated the product forms had not deterioratednoticeably during storage. Taste panelists expressed significant
Table 1 ~ Score Sheet Used for Sensory Evaluation
COLOR FLAVOR CHE1<INESS
7-Much Lighter 7-Very Tender
6-Lighter5-Slightly Lighter4-Same as Control
6-Noderatelv Tender
5-Slightly Tender4-Tender
3-Slightly Darker2-Darker
1-Much Darker
3-Slightly Tough2Moderately Tough1-Very Tough
MorSTNESS DESlRABXLZTYTEXTURE
478
5-Fibrous
4Wrainy3-Flaky, Firm2-Soft
1-Mushy
7Wontrol, ExcellentFresh Salmon Flavor
6Mood, but not Intense5Wnly Mildly Pleasant4-Trace of Bad Flavor,
Rancid, Oxidised3-Mild Bad Flavor
2-Strong Bad Flavor1-intense Bad Flavor
7-Much More Moist
6-Nore Moist
5-Slightly Nore Moist4-Moist as Control
3-Slightly Drier2-Drier
1-Much Drier
7-Like Extemely6-Like Moderately5-Like Slightly4-Neutral
3-Slight Dislike2-Moderate Dislike
1-Dislike Extremely

preferences for the 100 percent fillet and 75 percent fillet/25 percentmince blocks Table 3!- TBA values revealed low amounts of fat oxidation Table 4! and thaw drips were constant Table 5! ~
Table 3. Mean Desirability Scores for One Month Fresh/Frozen Pink Salmon1
Blocks
FORM X FILLET!75X
TREATMENT
50%100X 0%
Fresh/Prozen BlockControl
6-126. 50
6-605.83 5.08
Analysis of VarianceRanking of Level Means
5.28 100X > 75X > 50X > OX
F ValuesForm F!
1 2n 10 Sig p>.005Level means with the same underline did not vary significantly p~.05!from one another-
Table 4. TBA Values umoles/100g! Por One Month Fresh/Frozen Pink SalmonBlocks
FORM X FILLET!75X
TREATMENT
100X 50X OX
Fresh/Frozen BlockControl
0.830.80
0.800.82 0.84
Table 5. Thaw Drip from One Month Fresh Prozen Pink Salmon Blocks
X THAW DRIPFORM
479
100 X fillet
75 X fillet50 X fillet
0 X fillet
2.42 X
4.84
2 ' 982.85
Three Month Evaluation. At three months s torage, rep rocessed blocks hadlower sensory scores, TBA values and higher thaw drip than thefresh/f rozen product. Taste panelis ts indicated a signi f icant p=. 05 !preference for the fresh/frozen product Table 6! ~ This oroduct hadbetter flavor and moistness than the reprocessed blocks. The 100 percentmince block scored significantly p .05! lower than other product forms.Taste panel scores revealed that the mealy texture of the mince blocklowered overall desirability.
Table 6. Mean Desirability Scores For Three Month Fresh Frozen and1
Reprocessed Pink Salmon Blocks
FORM X FILLET!75X10GX
Fresh/Frozen BlockReprocessed BlockControl
5 ' 434 ' 75
5 ' 76
5.35
6.60
5. 524-65
4.80
4 ' 15
Factorial Analysis of VarianceRanking of I.evel Means
13 ' 3335 ' 284 100X > 75X > 50X > OX0.29
F ValuesTreatment T!Form F!T X F
1 2 3 4n 10 Sig p>.001 Sig p>.005 NS p -05Level means with the same underline did not vary significantly p .05!from one another.
Table 7. TBA Values umoles/100g! for Three Month Fresh Frozen andReprocessed Pink Salmon Blocks
FORM X FILLET!75X
TREATMENT
100X 50X OX
Fresh/Frozen BlockReprocessed Block
Control
1.610.71
1.310.78*
1 ~ 50
0-85*1 ' 48
0.980.80
Estimated Values
480
TBA values of the fresh/frozen blocks were much higher than reprocessedproduct Table 7! ~ It appeared that processed products were moresusceptible to the development of rancidity during frozen storage. Thiswas due in part to the protection of the product in frozen storage. Thefresh/frozen products were stored in waxed liners and plastic lined mastercartons while the dressed salmon had been glazed and double plasticwrapped.

Thaw drips were highest for the reprocessed products as a result of doublefreezing Table 8! ~ Most were wi thin reasonable limits although thereprocessed 100 percent mince block had a thaw drip of 5.39 percent,considered unacceptable by many Alaska seafood processors.
Table 8- Thaw Drip Values for Three Month Fresh Frozen and ReprocessedPink Salmon Blocks
FORM X FILLET!75X
TREATMENT
0%IOOXFresh/Frozen BlockReprocessed BlockControl
2.96X4e38%2.15X
3.06%
5.39X
4.46X
3.60X2o65%
3.64X
Six Month Evaluation. After six months of frozen storage, differencesbetween fresh/frozen and reprocessed products were not significant p .05!. Fresh/frozen products were generally more desirable than thethree and six month reprocessed products Table 9!. The exception was the100 percent mince block which had the lowest desirability scores of anysample. The high fillet products were significantly p .05! moredesirable than the high mince products. Average sensory scores indicateda preference for the 75 percent fillet/25 percent mi,nce and 100 percentfillet forms- These samples had better flavor, texture and moistness'The first rancid and. oxidized flavors were noted in some of the samples.
Table 9. Mean Desirability Scores for Six Month Fresh Frozen and1 Reprocessed Pink Salmon BlocksFORM X FILLET!
75X 50X100X OX5-18 4e54 3 ' 555 ' 64
4 ' 274.64 4.36 4+00
F 184.006 ' 55
4 ~ 00 4.18
F ValuesTreatment T!Form F!T X F
1 2 3n~ll Sig p>.005 NS p .05Level means with the same underline did not vary significantly p .05!from one another.
Fresh Frozen Block3 Month
Reprocessed Block6 Month
Reprocessed BlockControl
Factorial Analysis of VarianceRanking of Level Means
1 392 Fresh Frozen > 6 Month > 3 Month4-15 75X > IOOX > 50X > OX1 ~ 92

TBA values were highest for the three month reprocessed product that hadbeen stored an additional three months and lowest for the six monthreprocessed product Table 10! ~ This indicated that thawing, refreezingand subsequent storage accelerated the development of rancidity in theproducts- TBA values for the fresh/frozen products remained fairlyconstant.
Table 10 ' TBA Values umoles/100g! for Six Month Fresh Frozen andReprocessed Pink Salmon Blocks
FORM X FILLET!75X
TREATMENT
100X 50X OX1.33 1 ~ 32 1 ' 381 ~ 12
1 541 ~ 68 1 ~ 44 1 ' 75
1.021 ~ 26
0. 801.21 0 ' 87
Thaw drips were highest for the reprocessed products Table 11! revealingthe effect of thawing and refreezing. All reprocessed samples hadexcessive thaw drips of 5.6 percent or greater indicating changes in thetexture and moistness that were confirmed by the taste panel evaluations ~The fresh/frozen products had acceptable thaw drips less than 4.5 percent.
Table 11. Thaw Drip Values for Six Month Fresh Frozen and ReprocessedPink Salmon Blocks
FORM {X FILLET!75X100X 50X OX
2e70X
8 ' 04X
5-60X
2 ' 06X
Twelve Month Evaluation. At the end of twelve months frozen storage,sensory scores were significantly lower revealing the generaldeterioration of all products. No significant p .05! differences existedbetween the fresh/frozen and rep rocessed f orms Table 12! . Thefresh/frozen and twelve month reprocessed products had the slightly higherdesirability than other samples. The three month reprocessed samples, thelongest stored in frozen storage, had the lowest scores ~ Panelists againpreferred p .05! the 100 percent fillet block form over all others. Asignificant p-.05! dislike of the 100 percent mince blocks were also
482
Fresh Frozen Block3 Month
Reprocessed Block6 Month
Reprocessed BlockControl
Fresh Frozen Block
3 Month
Reprocessed Block6 Month
Reprocessed BlockControl
3 ' 55X
5.58X
5 ' 77X
3 ~ 56X
5e77X
6 ' 31X
4.45X
7.34X
6 ' 29X

noted. No differences existed between the 75 percent fillet/25 percentmince and the 50 percent fillet/50 percent mince products.
Table 12 ' Mean Desirability Scores for Twelve Month Fresh Frozen andI
Reprocessed Pink Salmon Blocks
FORM X FILLET!75X 50X
TREATMENT
100X 0X3. 82 3 ~ 54 3 ' 274.73
3 ' 723.82 3.18 2 ' 27
4 18 4.003 ' 36 2.91
3 ' 824.64
6 ' 503 ' 55 3.09
Factorial Analysis of VarianceRanking of Level Neans
9.202 Fresh Frozen > 12 No- > 6 Mo. > 3 Mo.46-833 100Z > 75X > 50Z > OX
8I 19
F Values
Treatment T!Form F!T X F
I 2 3n~ll Sig p>.001 MS p<.05Level means 'with the same underline did not vary significantly p .05!from one another-
Thaw drips were high for all products ranging from 3.43 percent for thefresh/frozen fillet to 11 F 80 percent for the twelve month reprocessed 50percent fillet block Table 13!. Most samples had excessive drip althoughthey were the lowest for the fresh/frozen product. All reprocessedproducts had drips exceeding 6.91 percent which contributed to the poortexture scores' Most of these products would have been unacceptable forcommercial packs.
Table 13- Thaw Drip Values for Twelve Nonth Fresh Frozen and ReprocessedPink Salmon Blocks
FORM X FILLET!75X 50X
TREATMENT
O%%u100X
5 85X
9.49X
8.29X
10 2IX7 78X3-43X
11.07X
5.33X
483
Fresh/Frozen Block3 Month
Reprocessed Block6 Nonth
Reprocessed Block12 Month
Reprocessed BlockControl
Fresh/Frozen Block3 Month
Reprocessed Block6 Month
Reprocessed Block12 Nonth
Reprocessed BlockControl
3-43X
9.40X
11.74X
5.26X
6 ~ 91X
9.46X
11 ' 80X
4.61X
8.28X
10.90X

CONCLUSIONS
This pro!ect produced alternate pink salmon products that had acceptableshelf life and provided alternatives to processors needing to diversify.The major results from the study include:
1 ~ Combination fillet/mince products provided the optimum mix of recoveryand acceptability. Returning mince to the product increased yields by 12to 14 percent on a whole weight' basis'
2 ~ Fresh/frozen product was slightly more desirable than the reprocessedforms although pink salmon stored for three months produced veryacceptable blocks. After six months storage, all products wereindistinguishable'
3. The most desirable product form was the 100 percent fillet block. Theleast desirable form was the 100 percent mince block. No more than 25percent mince could be added back to the product and maintain acceptablesensory properties-
4. Thaw drip increased substantially in the reprocessed products andadversely affected texture and desirability. Thaw drip increased infrozen storage and became unacceptable in the reprocessed products at sixmonths and in the fresh/frozen- products at twelve months.
5. Frozen storage time for both fresh/frozen and reprocessed productsshould be limited to six months' At twelve months frozen storage, allproducts had deteriorated significantly. This was especially noticeablein the high mince products.
ACKNOWLEDGMENTS
This study was funded by the Alaska Fisheries Development Foundation AFDF! under its Pink Salmon Development Alternate Pink Salmon ProductForms! A component of the AFDF Full Utilization of American Surimi andOther Underutilized Species NOAA Account 0 86-ABH-00044! and supportedby the State of Alaska, Office of Commercial Fisheries Development.
REFERENCES
AOAC ~ 1984 ' Offical Nethods of Analysis, Fourteenth Edition.Association of Official Analytical Chemists, Washington, D.C.
Lemon, D.W. 1975. An Improved TBA Test for Rancidity. New SeriesCircular No. 51, Environment Canada, Fisheries and Marine Service,Halifax, N.S ~ , Canada.
484

DEVELOPMENTS XN ENGINEERED SEAFOODS
James R. Brooker and Robert D. Nordstrom
National Marine Fisheries Service, NOAA1825 Connecticut Avenue, N.W., Washington, D.CD 20235
INTRODUCTION
Engineered seafoods marketed in the United States in 1986amounted to 100 million pounds with a retail value of $350million. It is indeed safe to say that these products havebecome a well recognized line of food products in the USmarketplace and enjoyed by many consumers. The arrival ofthese modern food products and their current prominence inthe US marketplace was not by coincidence; rather it hasbeen the result of a well planned, orchestrated, andexecuted series of actions undertaken by the Japanese fishharvesting, processing and marketing industries. Noting avery rapid consumer acceptance of these products, represen-tatives of the U.S. Fishing Industries, Trade Associations,Fishery Development Foundations and US Government joinedforces to evaluate the Japanese technologies and attempt toapply them to the living marine resources under USjurisdiction, to derive maximum economic and social benefitsfor U.S. fishermen and processors.
The National Marine Fisheries Service's NMFS! involvementin stimulating the development of minced fish and surimitechnology within the United States has centered around theSaltonstall-Kennedy S-K! grant research program for fisherydevelopment coupled with some highly focused in-houseresearch. For the past 6 years NMFS has been partners withthe US industry providing funds through cooperative S-Kagreements to conduct research and development projects inthe areas of minced fish and surimi.
Three major technological breakthroughs in seafoodprocessing and preservation have taken place during thepast two and a half decades:
�! Mechanical separation and recovery of edible fishmeat from skin and bones.
485
�! Stabilization of processed minced fish meat assurimi for good frozen storage shelf life.
�! Fabrication that takes advantage of the functional gel forming! ability of fish flesh.
These developments have stimulated a renewed interest in thefishing countries of the world for increasing the productionof food from underutilized species. Research in all threeareas by several countries over twenty five years hassuggested that careful application of technical advancementsin these three areas may make it technologically andeconomically feasible to achieve full and near-optimumutilization of most fishery resources for human foodpurposes. Further, the state-of-the-art fabricationtechnology suggests that the variety of end products isnearly limitless, since they can be engineered to meetproduct edibility preferences unique to many differentconsumer groups of the world.
Surimi as we have all come to know is a Japanese termmeaning "a semi-processed wet fish protein", that is,mechanically deboned minced fish meat which has beenwashed to remove fat and undesirable matters such as blood,pigments, and odorous substances! and subsequently mixedwithh cryoprotectants such as sugar, and/or sorbitol! toachieve good frozen shelflife. At this stage surimi is anintermediate product, like flour made from a cereal grain,that can be used in the production of a limitless variety ofend products.
Two extremely important discoveries about surimi were madeat a very early date in its development in the U.S. thatcontinue to influence this expanding US industry.
l! Surimi is the common thread that links manyfisheries to gether -- pollock, menhaden, whitings,hakes and all other species used in its produc-tion. Xn the process of making surimi, the normalorganoleptic and edibility characteristics of theparticular species are lost resulting in a near-neutral fish protein product.
�! Surimi is a basic link between the seafood industryand the food business in general. Its availability
486
as an animal protein and its unique functionalproperties have caught the attention of the entirefood manufacturing complex in the US and abroad.
RESOURCE AVAILABILITY FOR SURIMI
In the United States, several target species have been thesubject of similar investigation as shown in Table I. Atthis time no attempt has been made to generate, evaluate,and organize GFA data for many US species due in part, tothe early stage of many of the investigations.
Table l.--US Species under Investigation
SpeciesGeographic Area
Red Hake
Silver Hake
Spiny DogfishOcean Pout
Sand Larce
SculpinSea Robin
New England andNo rthwe st Atl an t ic
Crocker
Atlantic !MenhadenSouth Atlantic andGulf of Nexico
Rockfish SpeciesPacific Whiting
West Coast
Alaska PollockAtka Mackerel
North Pacificand Alaska
487
The literature on surimi research and development aboundswith reports and data about species with respect to gel-forming ability GFA! which is the primary characteristicfor determining suitability in making surimi. In Japan morethan 50 species have been analyzed and their GFA establishedand ranked. Similar studies are being executed throughoutthe world and well over l00 species beyond those identifiedby Japan have been or are currently being tested toestablish their GFA and thus their potential for makingsurimi.

Three species Alaska pollock, Atlantic menhaden, andPacific whiting! which represent major US resources, are thetarget of extensive fishery development activitiesspecifically for utilization in the production of surimi.
A brief description and comments about the status ofdevelopment of these resources will highlight the stage ofprogress that has been achieved or not, and the existingchallenges associated with the conversion of these resourcesinto surimi.
Industrial development of the Alaska pollock resource injust a few years is hailed by all factions of the domesticfishing industry as "spectacular". The nature of thechanges in this fishery are well illustrated in Table II.Much of the credit for this growth goes to a project fundedby an S-K grant to the Alaska Fisheries DevelopmentFoundation AFDF!.
Table 2.-Whe Developing Alaska Pollock Market,4-Year Growth Chart
1 86
169,000 Netric Tons
$118.5 Million
2,325, Metric Tons
$14.5 Nillion
20
$59.5 Nillion
$100 Nillion
$830.000
???
120 Million Lbs.19 Million Lbs.
14
Source: Alaska Fisheries Development Foundation
Pollock Catch,US Vessels
Pollock Processedby US Firms
Catch ValueE x-Vessel
U.S. FactorTrawler Processors
Processed ValueEx-plant
Pollock ProductSales
US Sales ofSurimi/Kamaboko
US AnalogueNanufacturers
131,000 Netric Tons 1,077,000 Metric Tons

The abundance of Alaska pollock is generally described interms of abundance in both the Bering Sea and the Gulf ofAlaska stocks which are believed to be almost exclusivelyseparate from one another. There are substantial quantitiesof Alaska pollock from the US exclusive economic zone EEZ!taken by Japan, and purchased by the Japanese from US boats,that can be directed into surimi by the US industry. In1985 the US quota of Alaska pollock to Japan was 670,10lmetric tons; and Japan purchased 430,076 metric tons from UScatcher vessels. While the total harvest was not processedinto surimi, the figures provide a useful benchmark tounderstanding the existing ootential for continued USexpansion in the Alaska pollock fishery at the sametime as the overall developmental activities are shifting toimproving the efficiencies in using this resource.
The second major US fishery resource subject to research anddevelopment via the surimi scenario i.s menhaden. Thisresource occurs along the Southeast Atlantic Coast and theGulf of Nexico. Menhaden is the largest harvested USresource by volume of landings. Combined landings of Gulfand Atlantic menhaden purse-seine fisheries for reductionamount. to about 1,202,000 metric tons annually � yearaverage for 1981-86!. In contrast to the non-oily, white-fleshed Alaska pollock, menhaden is an oily, darker fleshedspecies which historically has been used in the manufactureof fish meal for use in animal feed, and semi-refined fishoil that has been exported to Europe for use in margerine.
A third major resource available .to U.S. fishermen in theEEZ off the West Coast of the US is Pacific whiting. Recentestimates put the harvestable biomass at between 300,000400,000 metric tons, a significant quantity even whencompared to Alaska pollock. The total tonnage of thisresource fished annually by American and foreign fishermenin the territorial waters during the past five yearsamounted to 80-100,000 metric tons. most of which has beenutilized by the Soviets. Historically there has beenlimited utilization of Pacific whiting in domestic productsbecause a relatively large proportion of the fish areinfected with a myxosporidian parasite. This infectiousorganism produces protease - an ernzyme which inducesundesirable textural changes in whiting products.
Investigations by Japanese researchers in the early 1970'sincluded examination of the GFA of four species of
489
Nerluccius including Pacific whiting. These early resultsshowed that. the GFA for these species was moderate to good,that is, the GFA's scored between 6 and 8 on a 10 pointscale very superior: 9-10!: very low: 0-1!. used by theJapanese at that time. There was one exception to this GFArating for the four species, and that was parasitizedPacific whiting taken of f the US Coast which scored verylow.
Other less significant fishery resources exist in the US EEZand inshore water which have the potential for utilizationas raw materials for surimi. Without identifying andquantifying them, these fishery resources appear to have thepotential to meet a continuing demand for surimi for thenext 2-3 decades.
TECHNOLOGICAL DEVELOPMENTS AND PROCESSING RESEARCH
A stage of maturation in the processing of Alaska pollockhas been achieved by the industry as a result of applyingthe results of technological investigations and processingresearch efforts that have been completed over the past Syears. Early handling. and storage studies, and investiga-tion of functional properties impacted by handling andstorage, provided essential information to the fishingsector on how to supply good quality fish to shore basedsurimi plants.
Armed with a working understanding of the Japanese surimi-making technology and the results of handling and storagestudies, a pilot plant project was initiated in October 1984witP a requirement to produce a million pounds of surimi.The surimi production contract to Alaska Pacific Seafood inKodiak, Alaska focused on quality, consistency andproduction economics, with the final product being surimithat met Japanese quality standards.
Technological improvements of the processing steps,performance of and use of different equipment was the nextfocus of research and development. This effort addressedimproving processes, improving yields, lowering productioncosts, and assessment of waste stream materials includingthe potential for conversion of reclaimable material tomarketable products. The contribution of data and
490

information from this work is expected to significantlyimprove the overall US surimi manufacturing process and UScompetitiveness.
Technology transfer to industry of the state-of-the-artsurimi processing procedures from the Japanese industry, andUS research and development experience was accomplishedthrough a cooperative project among Federal, State,industry, and Japanese surimi processing experts. A manual,Introduction to Surimi Nanufacturing Technology, wasprepared and a training school was held in Alaska totransfer the technical know how, in a uniform manner, toproduction and quality control personnel of a number of USsurimi processing firms. This has had a favorable impact ofaccelerating the industry application of the best availablesurimi processing technology and expanding domestic surimiproduction from Alaska pollock.
Shifting to surimi from menhaden, the US is still at a veryearly stage of research and development since there is noorganized body of knowledge available from other scientistsdescribing a good industrial process for producing surimifrom fatty fishes. To generate this needed information, theHNFS awarded a research and development contract in February1986, to the Zapata Haynie Corporation ZHC! for a two yearperiod to construct and equip a demonstration plant andinvestigate the technical and economic feasibility ofproducing surimi from Atlantic menhaden. A strategy similarto that used in Alaska calls for that project to supply 40tons of menhaden surimi to a wide-range of researchers andfood manufacturing firms for investigation of its functionaland performance characteristics and to carry out new productdevelopment research. Because of problems with schedulingequipment deliveries, testing and operating-requirements,results were not conclusive in the first year. Nenhadenfrom the Gulf of Nexico which is the same genus but somewhatdifferent in size, composition and season of harvest, alsolikely will be investigated for use in the production ofsurimi following completion of the research on the Atlanticspecies. A technically-oriented conference on themanufacture of surimi from fatty fishes, tentativelyscheduled to be held late in 1987, will provide an openforum for reporting progress on the surimi from menhadenproject, and for exchanging results with internationalscientists investigating various aspects of producing surimifrom other fatty fishes.
It is important to recognize that the processing equipment,its configuration, and the manufac,turing process for thesurimi from menhaden project was developed from the resultsof the Alaska pollock project and now is 4 years old. .Jewerequipment has been developed and alternative processingprocedures more appropriate to menhaden, are evident fromsome experimental work already conducted at thedemonstration plant. It is unclear at this time whether ornot the technical and economic feasibility of producingsurimi from atlantic menhaden can be adequately demonstratedwithin the established parameters and schedule of theproject currently in progress.
Recent research data show that parasitized Pacific whiting,could, when properly processed, provide a new source ofsurimi. Bench level research results suggest that by properprocessing and treatment, the earlier described proteaseinduced changes can be easily and economicallyneutralized. Pacific whiting surimi tested following suchtreatment exhibited functional properties that arecomparable to surimi from Alaska pollock. However,additional work is needed on Pacific whiting to validatethese research findings and demonstrate what are the optimumprocessing parameters for producing consistently goodquality surimi from this resource.
Other laboratory scale research results on producingacceptable quality surimi from Pacific whiting suggest thatneither the processing procedures for surimi from Alaskapollock, nor the experimental level processing regime formaking surimi from menhaden are directly applicable toPacific whiting. A demonstration plant type research projectmay be required to fully develop and provide the necessarydata and information on handling, treatment and processingtechniques that will facilitate the conversion of thisresource and other groundfish species off the Nest Coastinto surimi.
Assuming that the research and development period for afishery to industrial maturation is roughly 6 years, basedupon the model for Alaska pollock, and assuming that aPacific whiting development project is implemented in 1990,the U.S. production of surimi from pollock, menhaden andPacific whiting could easily reach an estimated 150,000 tonsby the year 2000.
492

PRODUCT SAFET Y
There have been only scant reports of gastroenteritisresulting from the consumption of surimi based foodsmarketed primarily in the form of analogue products. Thisis a good record for the industry in view of the rate ofincrease and volume of consumption of these imitationproducts in the United States.
Because of the rapid growth of this industry and its futurestability, it is extremely important that the industrycontinue to produce consistent high quality products free ofmicrobiological or other public health problems.
In-house research has been completed by NMFS at itsNorthwest and Alaska Fisheries Center that defines theprocessing, product, packaging and storage requirementsnecessary for the inhibition and/or destruction ofClostridium botulinum bacterium responsible for botulism!
imitation crab legs from seven different processors wouldnot support growth and toxin production by nonproteolytic CDbotulinum during a 67-day storage period at 50'F. When theproducts were stored at an abuse temperature of 774F, toxinproduction was delayed between 3 and 6 days. The results ofthese severe tests indicate that the ingredients of theproducts �.4% to 2.6% water-phase salt among other things!,.provide significant protection from nonproteolytic C.botulinum and that small increases of salt and other
and toxin production.
Based on the results of the research on C. botulinum a setof interim recommendations by Dr mel .aklund hasddeendeveloped, published and provided to the industry as a firsteffort to assure that good manufacturing, oackaging, anddistribution practices are implemented by the industry.These recommendations are provided in an Appendix.
Information from the Food and Drug Administration indicatesthat over 900 surimi based analogue samples of foreign anddomestic origin, obtained at retail stores in the US, weretested during the past 3 years. Of the 921 samples tested,two samples of breaded scallops and 2 samples of imitation
493

breaded shrimp contained C. botulinum type A spores. Fivesamples of imitation lobster contained type D spores. IIoneof the products to date, contained type E spores the typenormally associated with f ishery products! . Sampling at theretail level and testing will continue for some time.
A collaborative effort between the surimi industry, ?1NFS,USDA, FDA and the Alaska Fisheries Development Foundationhas been initiated to develop a Hazard Analysis of CriticalControl Points HACCP! program for surimi during the nextyear. The program was conceived to {a! establish industryconsistency in product quality and safety, and {b! tofacilitate industry efforts to achieve utilization of surimias a raw ingredient in other processed foods, including meatand poultry products. The question of a need for a HACCPfor the secondary processing and fabrication of surimi intoend products already has been raised. However, a decisionand action plan for its development have not been made atthis time.
The diversity in application of surimi as an ingredient inprocessed food products, as well as in pharmaceuticals andcosmetics, promises dynamic growth to the US surimiindustry. The progressive posture exhibited by the surimiprocessors in assuming a participating role in thedevelopment of a HACCP shows a commitment to long termplanning and exercise of leadership by this emergingindustry.
DEVELOPNEÃl OF SURINI BASED PRODUCTS
currently are the major end productsStates. Products in the form ofand chunks, shrimp, scallops andto be the major oroducts in the
Surimi based analoguesmarketed in the Unitedimitation legs, flakeslobster tails continuemarketplace.
494
In 1986 the U.S. market consumed 45,000 tons of products andindustry experts predict consumotion will exceed 50,000 tonsin 1987. If consumption continues at the same rate as thepast 3 years it will hit 70,000 tons in 1990, which isconsistent with the trends indicating increased overallconsumption of seafoods in the US. A recent prediction bythe U.S. Department of Agriculture is that US seafood

consumption could double to 30 pounds per capita by the year2020.
Use of surimi as a functional protein material is thecenterpiece concept behind much of the latest research anddevelopment underway in the United States. Foodtechnologists and others have been experimenting with surimiin new product development activities in a variety of waysas follows:
in traditional salmon products such as patties andjerkyin combination with blue crab meat to formulateuniform units of lumped crab meat.in sausage and processed meat productsin ice creamin pet foodin cosmetics such as face cream.
Other completed research has demonstrated that analogues canwithstand the more vigorous heat sterilization process ofcanning and maintain acceptable product texture, color,flavor and odor when preserved in retortable pouches. Thisresearch, however, was limited to imitation crab chunks insauce, that was packed in retortable pouches, processed, andstored. No di f ference in the organoleptic and colorcharacteristics were apparent due to storage for periods upto one year, the length of the storage studies.
495

SURI M I AS AH INK'E RME DIAT E
Introduction of fish-protein products in the form ofintermediates, for use as ingredients in other foods, is anew area for exploration by the industry. A window ofopportunity for the seafood industry is in producing andmarketing high-quality intermediate fish protein products,such as minced fish meat and surimi from various speciesand in many styles of intermediates!, that can be of feted atattractive prices to food processors. Some limited researchresults show that fish protein products can be added totraditional meat and poultry products to improve bindingproperties, improve nutritional composition, change flavorand color, and reduce costs. They may also be used asextenders and protein supplements. One on-going activityfocusing on this type of use is a S-K project undertaken bythe AFDF in 1986 to obtain USDA approval for using surimi ina surimi/meat product. Recently the AFDF achieved approvalof a sketch label for pork/surimi nugget patties. Finalapproval hinges on assurance to USDA that surimi enteringmeat and poultry plants is microbiologically safe on aconsistent basis.
On an international level, the Codex Committee on ProcessedNeat and Poultry Products has been examining the question ofa need to develop guidelines for the use of other proteinproducts such as milk powder, casein, caseinate and fish inprocessed meat and poultry products. The Codex Committee onFish and Fishery Products identified minced fish meat andsurimi as two fish protein products that merit considerationfor inclusion in processed meat and poultry products. Whileno action has been taken on the need for guidelinesaddressing the use of other protein products in processedmeat products, the assertive action of the Codex FishCommittee should encourage world wide consideration offormulating new end products composed of meat and fishing red ients.
The direction of new product development research clearlyindicates that surimi used as an ingredient in other foodsand non-foods for many different purposes will continue tocreate real opportunities for developing seafoodindustries. While the market forecast is for consumption ofanalogues to level off slightly about 1990, new applicationsfor surimi should create growth opportunities for theforseeable future.
496

QUALITY AND FUNCTIONAL ASSESSt4ENI'
Quality grades and grading procedures have been used by tneJapanese surimi industry for several years. That systemspecifies a! standard methodologies for the analysis ofvarious compositional and functional properties of surimiand b! application of the measurements to assignment ofgrades for surimi which are specific to the species of fishand location of the surimi process factory ship or shoreplant!. At an early date, the emerging US surimi industryconsidered the Japanese approach, and then decided in favorof developing a different system of quality specificationsrather than quality grades.
A research effort headed by Dr. Tyre Tanier of NorthCarolina State University was designed to criticallyevaluate both the current Japanese testing methodology andother available methodologies and to determine the optimumtesting procedures to elaborate quality specifications forsurimi in the U.S. The results of the three year researcheffort have been organized into a proposed standardizedsystem of quality specifications for surimi that allowssurimi users to purchase raw material according to itscharacteristics compositional! and functional properties.
A decision has been made to prepare a manual of standardtest methods for raw surimi that will contain the followinglevel of detail:
identity of properties to be testedidentity of a "standard" method for testing eachproperty
a procedure for applying each method to achieveuniformity of measurement
units of measurement to be useddescription of how results shall be expressed
The draft specification system presently is under review andconsideration by a surimi technical committee for adoptionas standardized test methods. It tends to parallel tnesystem now used in the US meat industry by meat processorswho purchase product raw materials! by specifications basedon product functionality.
497

The concluding efforts under this project will be to publishthe standardized methods for quality and functionalityassessment of surimi in a Manual of Methods for distributio~and use by the industry. Steps have already been taken tofamiliarize industry quality control and inspectionpersonnel with the methods and use of them.
END PRODUCT QUALITY STANDARDS AND PURCHASE SPE CI FICAT IONS
Secondary processing of surimi into seafood analogues hasincreased dramatically in the US from 1 plant in 1982 to 14processing establishments in 1986. Additional plants andfloating processers are scheduled to commence processingfish into surimi in 1987. As this industrial expansion wasoccuring in 1985, NNFS was requested to start the process ofdeveloping voluntary U.S. Quality Grade standards for themajor end products, i.e., imitation crab legs, chunks andflakes, scallops, lobster tails, and shrimp.
An announcement of this request was published in theNovember 25, 1985 issue of the Federal Receister andcomments were invited from interestere partres. In view ofvaried responses received and noting that the US surimiindustry is is a very dynamic state at this time, it isunlikely that NMFS will proceed to develop voluntary qualitygrading standards for analogues in the near future.
Interest in using analogue products has been developing inthe military services, motivated in part, by an evaluationof a crab food product by the Armed Forces Product Evalua-tion Committee AFPEC!. Additional product evaluation wascarried out by the V.S. Army Natick Research Development,and Engineering Center NRDEC! which resulted in a decisionto develop a Commercial Item Description CID! that can beused by the military services to purchase imitation crabproduc.ts.
A draft CID has been prepared and circulated to interestgroups and industry for views and comments. Once the CID isdeveloped and approved, the product will be added to theFederal Supply Catalog as an approved item for military foodservice programs. Upon completion of these actions militarypurchasing of imitation crab products can commence, perhapsby the end of 1987. Assuming good acceptance by militarypersonnel similar to that of US consumers generally,
498

opportunities for using analogues in a variety of preparedfood items such as in half steam table tray pricks, may bepursued on a timely basis.
IREE RNAT IOHAL DE VE LOPE NT S
The Codex Committee on Fish and Fishery Products responsiblefor elaborating international standards and codes ofpractice for fish and fishery products, at its 17th Session,took note of the global developments in the production ofsurimi and the implications for the Committee of thepotential uses in fish and other food products covered byexisting and draft international standards. In response toa request from the Committee, the US delegation agreed toprepare a background paper on the world-wide status ofsurimi and products manufactured therefrom for considerationby the Committee at its 18th session in 1988.
Other international developments in surimi and engineered'seafoods have moved rapidly in the past year. Japan hassubstantial research underway investigating the technologyfor making surimi from oily fish, and may be somewhat aheadof the US at this time.
From investigations on making surimi from sardines andmackerels, Japanese scientists have announced the use of anew vacuum flow process which allegedly produces a betterquality surimi resulting from a more thorough seoaration ofoil and flesh. They visualize using this type of surimi ina number of the traditional fried kamaboko products fortheir domestic market. In addition, Japanese researchersand vessels have been active in several regions of the worldconducting investigations as follows:
a! in Peru, Chile, and Argentina researching jackmackerel and hakes
b! in Europe working on blue whiting
c! in New Zealand working on hoki and southern bluewhiting
Recent curtailments of fishing in other countries'watershave prompted this flurry of Japanese activity.
499

Tpe Koreans have stepped up activity in both surimiproduction and export of engineered seafoods. Koreanexports of Alaska pollock surimi to Japan and the US havegrown substantially in the last few years. This year, theKoreans outfitted several new factory vessels to processsurimi off Alaska.
Nuch of the activity in Europe has concerned Japanese jointventures, although the Faroe Island industry had undertakensurimi production on their own with blue whiting. Japaneseanalogue plants have been constructed in Great Britain andefforts to utilize blue whiting, cod frames, and Norway poutare in the test stages.
Norway has been conducting pilot plant operations on anumber of species and has a mobile plant which moves fromport to port as seasons and target species change. The restof Europe has had little activity in surimi processing, butthere are plans for analogue plants in several EECcountries.
In South America, Peru has made and distributed to schoolchildren, fish milk and fish cookies. These productscombine processes reminiscent of fish protein concentrate aswell as minced fish and surimi. Chile and Argentina havelarge quantities of mackerel and hake which they areplanning to utilize in conjunction with Japanese interests.
Canada has one plant operating on the East Coast with asecond one planned for operation under U.S./Canadian jointventure arrangement.
IÃFERNATIONAL TRADE
After Japan, the United States is the largest consumer ofsurimi based products. An estimated 110 million pounds willbe sold in the U. S. in 1987. Until 1984, Japanese exportsof surimi were small, while exports of analogue doubled eachyear. Now that the U. S. has close to 20 plants makingeither surimi or analogue products, the situation ischanging. In 1986, Japan exported about 26,000 metric tonsof analogue products to the US, a drop of about 6,000 tonsfrom 1985. At the same time, US imports of surimi blocks,used for making the analogues, «ose from less than 1000
500

metric tons in 1974-31 to 4,800 tons in 1985 and almost8,000 tons in 1986. The increased secondary processingcapacity built in the US in the last two years is the causeof this turnaround. In addition, there are three shore-based surimi plants in Alaska and three new processingvessels either operating or ready to produce surimi thisyear. The US recently started exporting surimi to Japan andthis trade is expected to increase steadily.
Japan is exporting surimi and analogue products to about 24countries. Over 30% of the volume comes to the UnitedStates with very small amounts entering Australia, Canada,U.K. and Europe. Some small amounts being shipped to Spain,Hong Kong and Singapore, are transhipped to the UnitedStates.
CONCLUSION
The efforts in the US and other countries for usingunderutilized fish species for human food purposes arelargely concentrated on adapting raw material for processinginto foods by controlling and engineering their appearance,flavor and texture keyed to consumer taste preferences.Much of this effort includes studying the characteristics ofunder-utilized species for QFA, thereby giving foodprocessors the abili ty to accurately predict the pe r formanceand therefore the utility of the raw material invarious food systems. Beyond these general conclusionsthere are others that. can be drawn:
l. A wide-range of fatty and non-fatty species arebeing researched for potential use as food throughthe surimi and food processing technologies.
2. Nany fishing countries of the world perceive thatthe surimi technology offers new opportunities forbetter uses of under utilized resources.
3. A single handling and processing technology isunworkable for all species. Technology is notdirectly transferrable between species groups.Technical developments and improvements in thesurimi process are contining at a rapid rate andprocessing protocols are being refined dependingupon the species being investigated.

4. Excellent equipment is readily available forproducing surimi and end-products for some species;and improvement in both equipment, and processconfiguration continue to be made.
5. Process controls, and product safety and qualityconcerns are being addressed and implemented at arate paralleling technological advancements.
6. The type and variety of surimi based end productswill continue to expand well beyond the shellfishanalogue that now dominate the market place.
7. Surimi as raw material for use in formulating alltypes of stand-alone foods and reformulatingtraditional foods is the next major wave ofdevelopments in the food industry. Some complexlabeling issues may emerge from these developments.
8. International trade in both surimi and surimi basedend products should continue to increase over thenext two decades.
REFERENCES
l. Anonymous. 1987. Draf t Report of the TechnicalSubcommittee, Surimi Committee of NFI: StandardTesting Nethods for Raw Surimi, April 1987
2. Eklund, N. 1986. Careful Crabstick Nakers Safe fromBotulism. In the Lodestar Vol. IV, No 4, AlaskaFisheries Development Foundation, Anchorage, AK ~
3. Elkins, E.R., Dudek, J. and Chin, H.B. 1986.Commercial Heat Sterilization of Seafood Packed inRetortable Pouches and its effect on Quality andNutrient Retention. Report to National MarineFisheries Service, Washington, DC.
4. Erkins, R.A. The Erkins Seafood Letter Vol. 22,Issue 3, March 1987.
502

5. Gordon, W., 1985. Letter to FDA AssociateCommissioner for Regulatory Affairs dated April 10,1985, regarding Compliance Policy Guidance forlabeling surimi based products.
6. Groninger, H., Kudo, G., Porter, R., and Miller,1985. Preparation and Evaluation of Surimi fromPacific Whiting. In Proceedings of theInternational Symposium
on Engineered Seafood Including Surimi, p 199-210.Fdited by R.E. Martin and R. L. Collette, NationalFisheries Institute, Washington, DC.
7. Zanier, T., Hamman, D.C., and Wu., N.C. 1985.Development of Methods for Quality and FunctionalityAssessment of Surimi and Minced Fish to be used inGel-type Food Products. Report, to Alaska FisheriesDevelopment Foundation, Inc., Anchorage, AK.
8. Lee, C.N. Surimi Processing: Surimi Nanufacturingand Fabrication of Surimi-Based products. Presentedat the 45th IFT Annual meeting, Atlanta, GA., June9-12, 1985.
9. Martin, R.E. Developing Appropriate Nomenclature forStructured Seafood Products, 1986. In FoodTechnology 40�! p 127-124, March 1986.
10. NcKnight, Jeanne, 1986 S-K Review -- An Overview ofthe Saltonstall-Kennedy Fisheries DevelopmentProgram.
ll. Mitchell, CD Surimi - The American Experience,1986. In INFOFISH Marketing Digest. Kuala Lumpur,Mala ysi a.
12. Niyaucki, D., Kudo, G., and Patashnik, M. 1973,Surimi - A Semi-processed Wet Fish Protein. Mar.Fish. Rev. 35�2!:1.
503

13. National Narine Fisheries Service 1986. PreliminaryReview of the 1986 Atlantic and Gulf NenhadenFisheries. Report to the National Fish Neal and OilAssociation, Washing ton, DC
14 ~ Okada, N. and Noguchi, E. 1974. Trends in theUtilization of Alaska Pollock in Japan. InFisher Products. Ed. ! Kreuzer, Rudolf, FishingNews Boo~ks Ltd. Surrey, U. K.
1S. Okada, N. and Tamoto, K. 1986. Introduction toSurimi Nanufacturing Technology. Overseas FisheryCooperation Foundation. Tokyo, Japan.
16. Yutaka, S. 198S. Biochemical and FunctionalProperties of Material Fish. In Processings of theInternational Symposium on Engineered SeafoodIncluding Surimi p 148-167. Edited by R.E. 'Hartinand R.L. Collette, National Fisheries Institute,Washington, DC.
17. Zapata Haynie Corporation 1986. Surimi fromNenhaden, Technical Aspects of the Pr'oject. Reportto US Government under Contract No. 59-EANF-6-00048.
504

TEXTURE AND FREEZE-THAW STABILITY OF
SURIMI GELS PREPARED WITH A COMBINATiON
OF ATLANTIC POLLOCK AND WHITE HAKE
J. M. KIM
Department of Food ScienceUniversity of Maine
Orono, ME 04469
INTRODUCTION
It has been reported that species variation of muscle protein maybe due to the differences ln fishing ground, method, and season.Studies on the behavior of the purified fish actamyasfn suggests therels no species d'ffference fn the fntrinslc viscosity value,efectrophoretfc mobility, salting-fn and saftfngmut range, etc., whilethe temperature at which denaturatlon takes place, and the velocity ofdenaturation differs fram species ta species. It fs generally believedthat actomyosin fs related to the gel-strength of fish muscle products.From observations In the literature, it appears that hydrogen andhydrophoblc band'lng participate fn species dffference In "setting"temperature, i.e., format'fan and deformation of the setting and gelnetwork formation, but the role of dfsulfide bonding is still uncertain.
Atlantic pollock and white hake are regionally abundant fishspecies off the coast of Maine and they demonstrate good gel-form'lngability. Pollock muscle fs brown to grayfsh and regarded as not reallysuitable for a crab or lobster meet-analog praducts. Little publishedinformation is available about the effects of blendfng surlml ofdifferent specfes and how variatfons of blending of surlml affect thegel characterfstlcs of the finished product. Therefore, the objectivesof thfs study were �! to evaluate and compare rheofoglcel propertfes ofsurlml gels prepared with varying combinations of regionally abundantfish species, Atlantic pollock and white hake, end �! to determine therelationships of their rheological propert'ies ta gross microstructure ofthe gels before and after success'fve freeze-thew cycles.
MATERIALS AND METHODS
Preparation of surlmiSurfmi was prepared separately from fresh Atlantic pollock
P~~ ~~.! and white hake g~~ ~~! wfthin 24 hrafter befng caught off the coast of Maine. Fresh fll lets were runthrough a mincer Model 84141, Hobart MFG. Company, Troy, OH! with a diehaving perforations of 5 mm in diameter. The mfnced meat was washedfaur times with water, us'lng 1 part fish meat to 4 parts water W/W!.After the fourth washing and draining, the slurry was dewatered bycentrffugatfon Model K, fnternatfonal Equipment Company, Needham l-lts.,MA! at 3000 xg. The meat pellet was chopped in a silent cutter Model84141, Hobart MFG. Company, Troy, OH! wfth sugar, sorbital, and sodiumtrfpolyphasphate �$, 4'5, and 0.2$, W/W, respectively! and subsequentlypacked fn cryobags ta be stored at -20'C until used.
505

Preparation of thermally Induced surimi gelThe thawed pollock and hake surlmf overnight in a refrigerator,
78'5 mofsture! were separately weighed and recombined In varyIngpraportlons. The blended surfmf was chapped wfth 2g salt in a silentcutter for 9 mfn followed by 3 min add Itional chopping w'1th or without6$ starch and with the addition of icemhllled water to adjust themoisture level to 78$. The chapped surfml paste was extruded into 30 mmdfameter cellulose cas'lngs and cooked at 90'C for 40 mfn ln a waterbath. These were immediately cooied 'ln running tap water for 20 min.Ten types of samples were prepared usfng varyfng levels of pollock andhake surfmi and Incorporating either native potato or freeze-thaw stablemodif fed starch, as shawn in Tabfe 1.
Table 1. Types of surimi pastes/gels prepared
100
80
60
40
20
100 6 mod'l fled!6 modl f led!
6 patato!6 modified!
50
50
Measurement of textural propertiesThe prepared gels were left overnight at room temperature to
equilibrate and were cut inta cylindrical shapes �0 mm diameter and 25mm long!. The textural properties of the gels measured were campresslveforce, percent expressible moisture, and penetratfon force usIng anInstron testing machine Model 1000, Instron Engineering Corp., Canton,MA! as an Index of cohesiveness, water holdfng ability, and f frmness,respectively. Compression was done uniaxlally at a crosshead and achart speed of 50 and 100 mm/min, respectively.
Compressfve force was evaluated at 90$ deformation with failureusing a compression head of 10 cm in diameter. At the same time, theamount of moisture expressed upon compression was measured by collectingthe fluid on fflter paper and recarded fn terms of $ expressiblemoisture on a sample moisture wefght bas'ls. Penetration farce wasmeasured at 90$ deformation with failure using a plunger of 9.5 mmdfameter.
Samples were subjected to three freeze-thaw cycles to evaluate thefreeze-thaw stability. Gel samples were frozen at -20'C for fIve daysand thawed ta equilibrate to room temperature before texture measurementfor compressive force, percent expressible mofsture, and penetration
506
I
II
I I I
IV
V
Vl
Vll
VIII
IX
X
20
40
60
80100
100
50
50

force.
A Hunter LabScan II spectrocolorimeter Model PCIOO-B2, MunterAssocfates Laboratory, Inc., Reston, VA> was used to measure the HunterL, a, and b values of suriml pastes prepared with various combinationsaf pallock and hake surfmf using a half inch aperature.
Structure analysfsFor examination of surlml gels with a Ifght microscope, seall gei
blocks were quickly frazen fn liquid nitrogen and sectioned at 5 um witha Refchert cryostat microtome Model 975C, AO Sc'lentif lc Instruments,Buffalo, NY!. Prepared sect'fons were mounted on sifdes and stained forobservation.
RESULTS AND DISCUSSION
Specfes differences fn gel-strengthening ability have been wellknawn. In this experfment, Atlantic pollock and white hake were usedbecause they are abundant ln the Gulf of Maine region. White hake,particularly, ls an underutllfzed species. Even though preparatIon ofsurlmf and surlml paste 'involves a vigorous chopping process, muscleassoc'fated collagen fs seen Fig. 1b!. Collagen ln the surfml pasteshow fts bfrefrlngence enhanced fn polarized light Ffgs. 1d and 1f!.Intact potato and modified starches demonstrated characterist'Ic maltesecross patterns fn polarized light Figs. 1d and lf!.
The textural prapertfes af sur'lml gels prepared with variouscombinations of Atlantic pollock and white hake, and with or withoutdifferent types of starches, are shown In FIgs. 2-4 far compressivefarce, percent expressible moisture, and penetratfon force,respectively.
Changes fn color due to varying combinations of pollock and hakesurfmf are presented In Ffg. 5. There were signff'leant differences Inwhiteness and yellow and green colars between pollack and hake surimi.
Both pollock and hake surlml produced good sur'Iml gels, but gelsprepared with hake surfm'I, with or without starch, exhibitedsignificantly hfgher compressive force, water holding ability lowerpercent expressfble moisture! and penetration force than those preparedwith pallock surfml, with or without starch, respectively. It fs wellknawn that dark flesh, particularly red flesh meat, such as tuna, hasweak gel strengthening ability. Usually, ft has been said that thewhiter the flesh, the stronger the gef-strengthening ability It has.Therefore, gradual fncreases in compressive force, water holdingability, and penetration force were observed with proportional increasesln hake surlml <F'Igs. 2-4!. Substantial increases in L <white! and b yellow!, and a <green! values were observed as the level af hake surlmiIncreased Fig. 5!. In addition to improving the gel strength, theproblem associated with the brown-gray color of pollack surfmi can bealleviated by mix'lng with white hake surlmi.
Modlf led starch used fn this study is a blend of potato and tapiocastarches abaut 1:6 ratio, W/W> and modified by hydroxyalkylaiion forfreeze-thaw stabilfty.
The structure af a protein gel matrix of Type IV Fig. 6b! was moreuniform than that of Type I Fig. 6a!. Many air cells were observed
507

Fig. 1. surimi pastes before cookfng. CG: col Iagen; NIC: muscleassociated co I I agen; MP: muse f e protein; PS: potato starch;TS: tapfoca starch. a! Type I; b! Type V I; C! Type IX; d! same as Fig. 1c, but photographed in polarized I'fght; e! Type X; f! same as F'fg. 1e, but photographed 'inpolarfzed fight.
508

%I&%I%
Ql
16
U
~12
FREEZE-THAR 8 1 2 3CYCLE
TYPES OF GELS
Flg 2. Effect of varying comblnatlons of pol lock and hake surlml,with ore'fthout different types of starch, on compressive force of gel.
FREEZE-THAN 8 1 2 3CYCLE
TYPES OF GELS
Flg. 3. Effect of varying combinations of pol lock and hake surlml,vlth or without different types of ~rch on 5 expressible moistureof gel.
509
M
m 8
XOv 4
~28
15
JQ
Cl 18H
C4
I II IXX IV V VI VII VXIX XX X
I II XII XV V VX VXX VXXX. IX X

WI&
Ql 1.5FREEZE-THAW 6 3- 2 3
CYCLE
TYPES OP GELS
Flg. 4. Effect of varying comblnatlons of pol lock and hake surlml,
filth or w'ffhout different types of starch, on penetration force of gel.
0
X XX XXX Xv V vX
510
U
0 Lt
0 H
@@8. 5
Or 8x XX xxx xv v vx vxx vxxx xx x
TYPES OF GELS
Flg. 5. Effect of varying comblnatlons of pollock an4hake surlml on color of the paste.

thraughaut the latter protein gei Type I!. These observed structuraldifferences In the protein gels were reflected by the differences in geistrength Figs. 2 and 4! and water holding ability Fig. 3! before thegets were frozen. On heat treatment the palarlzatfon became dull andpotato starch lost lts maltese cross Flg. 6d!.
When gels were subjected to repeated freeze-thaw cycies, there wereslight decreases fn campressfve farce fn the case of the geis preparedwithout Types f-Vl! and with Types VII, Vill, and X! modified starch Fig. 2!. A gel prepared with native paiata starch Type IX!, however,showed a sfgniffcant decrease In compressive force. Percent waterexpressian and penetration farce were sfgnIflcantly increased In thecase of the geis prepared with native potato starch and without starch Fig. 3!, while gels prepared with modlf'fed starch did not showsfgnlf leant changes. During freez Ing, mechanically entrapped water Inthe gef matrix migrated to farm fce crystals Figs. 7a, 7b, Sa, and Sb!.In th'fs way, the pratein gel matrix is densely packed and hardened dueto the pressure exerted and dehydration af gel matrix resulting from thedevelapment of fce crystals. Thfs resulted fn Increased freely movingmoisture and f frmness af the gef upon thawing to cause Increased percentexpressible moisture and penetration farce. These changes were morepronounced when the gef was prepared with native potato starch becauseof the fncreased avalfabflfty of water for Ice crystal formation framcollapsed potato starch. This process was visualized fn Figs. 7c and8c. On the-other hand, there were no sfgnfffcant changes In campresslveforce, percent expressible moisture, and penetratian farce ln the caseof the gel prepared- wfth freeze-thaw stable modified starch. Commercialfreez~haw stable starches are modified by acetylatfan orhydroxyalkylatfon. These types of madlflcatlon stabl I lze the starch gelby mutual repulsfon of amyfose molecules and thus hold the moisturebetween the molecules. This retards or eliminates the assocfation ofamylase molecules, I.e., crystallization ar retrogradatfan phenomenonduring cold storage. Starch granules embedded fn the protefn gel matrfxwhich, when swollen, exerted pressure on and drew moisture from thematrix. This caused the gel matrix to became more compact and ffrm.The composfte gel-reinforcing effect of starch in heat-induced surimfgel was demonstrated In Figs. 2-4. When the gel is frazen, water forfce crystal formation ls avaflable from the protein gel matrix andgelatinized starch. Avalfabflfty of water far fce crystal formatfon isgreater In the gef prepared with native starch because this type ofstarch cannot withstand drastic physical changes, such as freeze-thawcycle and Is collapsed resulting fn increased avaflabflity of water forIce crystal formation. Furthermore, calculated water was added toadjust moisture content to 78$ during gel preparation. This factexplains why more pranounced changes fn textural propertfes occurred inthe gel prepared with potato starch than those prepared without ft Figs. 2-4!. Thfs also reffected the dffference 'fn gel structure duringfreeze-thaw cycles Figs. 7a-7c and Sa-8c!. In contrast, gets preparedwith modi fled starch Types VI I, V I I I, and X! did nat show slgnif fcantchanges fn the textural properties because moIsture Imbibed by starchgranules from the gef matrix during cook'Ing lowered the maIsture levelfn the surfmi gel. This mofsture Is not available for fce crystalfarmatlan because it is held within the gelatinized starch as mentionedabove during accelerated freeze-thaw cycles of the gei Ffgs. 2-4!. Gelmicrostructure analysis supports this phenomenon Figs. 7d and Bd!.
511

Fig. 6. Surimf gels after cookfng at 90 C for 40 min. AC: air cel I;GC'- gefatfnlzed collagen; GP:gelatinfzed potato starch; GT:gefatfnfzed tapfoca starch. a! Type I; b! Type VI; c!Type IX; d! same as Fig. Sc, but photographed In polarizedlfght; e! Type X.
512

Fig. 7. Surlml gels after f lrst freeze-thaw cycle. CP: col lapsedpotato starch; IC: lce crystal. a! Type I; b! Type Vl; c!Type lX; d! Type X.
513

Flg. 8. Surlmi gels after third freeze-thaw cycle. a! Type l; b!Type Vl; c! Type lX; d! Type X.

ln conciusfon, 1! goad surlmi gels can be prepared from Atlanticpollock and white hake. The concept of the mixed spec'Ies In this studywas suggested by the brown to grayish color of the pollock muscle, 2!the problem associated with the color can be alleviated by mixing thepollock with whIte hake surfml, which also Improves the texture, 3!presence or absence af starch and the type of the starch clearlyfnfluences the gel texture, and 4! changes ln the textural propertieswere supported by the changes fn the gross gel microstructure during theaccelerated freeze-thaw cycles.
REFERENCES
1 ~ Kim, J.M., Lee, C.M. and Hufnagei, L.A, 1987. Textural propertiesand structure of starch-reInforced sur'lmf gels as affected by heat-setting. Food Microstruct. 6�!:81.
2. Kim, J.M. and Lee, C.M. 1987. Effect of starch on texturalproperties of surlml gel ~ J. Food Scl. 52�!:722.
3. Lee, C.M. '1984. Surimf process technology. Food Technal. 38�1!:69.
4. Lee, C.M. and Kfm, J.M. 1985. Texture and freeze-thaw stability ofsurlml gels ln relation ta ingredients and formulation. In"Proceedings of the fnternatlanal symposium on engineered seafoodfncludlng surlml." R.E. Martfn and R.L. Collete eds.!, NationalFlsherles institute, Washfngton, D.C. p. 168.
5. Lee, C.M. and Kfm, J.M. 1986. The relat'lanshlp of compositecharacteristics ta rheological properties of surimi sol and gel. In"Food engineering and applications, vol. 1," M. Lemaguer and P.Jelen eds.!, Elsevler Applied Scfence publishers, London and NewYork, p. 63.
6. Radley, J ~ A. 1976. Starch productlan technology. Appfled Scfencepublishers LTD, Landon, England.
7. Suzuki, T., Karma, K., and Yamamato, T. 1969. Varfatlon of themuscle pratein in horse mackerel. Bull. Jap. Soc. Scl. FIsh.35�!:451.
8. Veda, T., Shimizu, Y., and Slmfdu, W. 1968. Species difference infish muscle - I. The gel-formfng ability of heated ground muscles.Bull. Jap. Sac. Scl. Ffsh. 34�!:357.
9. Whistler, R.L., BeMiller, J.N., and Paschall, E.F. 1984.Starch:Chemistry and technology, 2nd ed., Academic Press, Inc.,Orlando, FL.
ACKNOWLEDGEMENTS
This work was supported in part by Maine Agricultural ExperimentStation under project No. ME 08911 and ME 08553, Mafne AgrfcuituralExperiment Station Contribution No. 1232.
515


EFFECT OF POWDERED CELLULOSE ON THE TEXTURE AND WATERBINDING PROPERTIES OF SURIMI-BASED PRODUCTS
KiSun Yoon, C.M. Lee and K.H. ChungDepartment of Food Science and Nutrition
University of Rhode Island, Kingston, RI 02881
INTRODUCTION
The overall textural characteristics of surimi-basedproducts are affected by moisture, the functional propertiesof surimi, ingredients and the temperature-time relationshipduring heat setting Lee, 1986!. Lately, various types ofingredients were tested in surimi-based products for theirability to strengthen gel or to modify gel texture. Most ofwork has been focused in starch Okada, 1963, Lee, 1984, Wuet al., 1985, Kim and Lee, 1987! and protein l.ee, 1986!.Starch was found to have a gel strength effect, whileprotein does have texture modifying effect at appropriatelevels. Recently, interest has been directed to powderedcellulose because it can contribute to binding, strength,structure in food systems Labell, 1986!.
Powdered cellulose is purified from specially treatedwood pulp which has the lignins and impurities removed Labell, 1986!. Chemically, it is relatively inert whichmeans it wi 11 not interfere with any reactions taking placein a food system Mi 1'ler, 1986!. Among ingredients, theapplication of cellulose in surimi-based products has notbeen investigated. The objective of this research was tostudy the texture-modifying and water-binding properties ofcellulose in surimi-based products.
MATERIALS AND METHOD
Sample preparation.
Frozen surimi prepared from Alaska Pollock TheragraChalcogramma! was manufactured by the Alaskan PacificSeafoods Kodiak, AK! and obtained from the North PacificSeafood Seattle, WA!. Surimi was kept at -20 C until used.Cellulose powder and modified starch Nustar'! were obtainedfrom James River Co. Berlin, NH! and Staley ManufacturingCo. Decatur, IL!, respectively.
Surimi-based products, both molded and fiberized forms,were prepared from a 800g surimi block. Surimi waspartially thawed to -2 C and chopped for 2 min with 2C
516

salt on a surimi basis! in a silent cutter, followed by anadditional chopping for 8 min with other ingredients,namely, cellulose, starch or ice-chilled water to adjust thenecessary moisture level. Modified starch was also added incombination with cellulose to determine the freeze-thawstabilizing ability of cellulose when used together withmodified starchy
One portion of the resulting surimi paste was stuffedinto cellulose casings�5 mm dia.! to make a molded gel shrimp analog! and steam-cooked for 20 min in an autoclaveat 90 C and atmospheric pressure. Cooked gels wereienediately cooled with cold wate~ and left overnight atroom temperature before gel forming properties weremeasured.
The other portion was used to make a fiberized product crab analog!. It was prepared by extruding the paste intoa thin sheet through a reactangular nozzle having a narrowopening 1.5mm!. The extruded sheets were then partiallyheat-set for 2 min in the oven at 110 C and scored into1.5am-wide strips by a cutter similar to a noodle cutter.The resulting sheet of strips was folded manually into arope, wrapped with a satin wrap, and steam-cooked for 15 minin an autoclave at 90 C and imnediately stored in arefrigerator at 4 C before being evaluated for texturalproperties.
Formulation and processing.
The following experiments were conducted: 1! thedifferent sizes ranging from 11 um to 55 um were tested fortheir binding properties in surimi gel; 2! using the bestperforming size of cellulose from the result of firstexperiment, the effect of cellulose levels on the texture ofsurimi-based products was studied; and 3! the effect ofvarying cellulose levels at a 6X starch level on geltexture. Along with water binding and gel texture,freeze-thaw stability of both molded and fiberized gels wasalso studied by measuring textural change, such as increasesin rubberiness and firmness, as well as by analyzing sensoryproperties. For this purpose, all samples were subjected to1 freeze-thaw cycle.
Texture analysis
The textural properties of gels measured werecompressive force at 90K deformation, expressible moistureand penetration force using the Instron Testing Machine
517

Yodel 1122!. Testing was carried out following theprocedures described by Lee 1984! except for shear test.The shear test was conducted only on the fiberized gel. Inthis test, the cylindrical fiber bundle was shearedlongitudinally by a flat blade 1 mm thick! while the sampIerested on a stationary plate. The maximum force required tocut the sample was measured as shear force and was used asan index of firmness and chewiness.
The texture evaluation was also conducted by a sensorypanel of 7 people from the department who previouslyparticipated in the evaluation of the similar products.They were asked to score 4 textural characteristics firmness, chewiness, rubberiness and moistness! for theirintensity and desirability, as well as overall desirabilityusing a structured 9-point scale 1:least, 9:greatest!.Samples were presented in the flake form of fiberized crableg products.
Statistical anlysis
The data were analyzed using the Statistical AnalysisSystem Package SAS, 1982!. Correlation coefficients werecalculated to determine relationships between sensory andinstrumental parameters using the CORR program. Duncan'sMultiple Range Test was used to determine the significance ofthe differences between treatments.
RESULTS AND DISCUSSION
Table 1 shows effect of various sizes of cellulose on thetexture of surimi ge'I. Cellulose of the size from liam to20um performed better than ones larger than 2Gum in terms ofgel cohesiveness and water binding. As the size of fiberincreased beyond 20um, both gel cohesiveness and waterbinding ability decreased with increasing sense of chewing athread.
Under the microscope, it was clearly seen that finergrade cellulose llum! was dispersed finely throughout thematrix. Within the range of grade of ltum-20um, coarsergrades tend to be better binders than the finer ones. Waterabsorption is also affected by the fibrous particles ofpowdered cellulose. The coarse grades have a more openstructure, which allows them to absorb up to seven timestheir weight in water. Finer grades have a more densestructure, and they generally only absorb three to fourtimes their weight in water Ni lter, 1986!. It can besuggested that gel forming of protein in surimi gel can be
518

affected by the amount of moisture held in cellulose.
Table 1. Effect of various sizes of cellulose onthe texture of surimi gel.
GEL STRENGTH kg!SIZE OF expressible compressive penetrationCELLULOSE um! moisture X! force
* tested at 2% and 78% moisture** means within each column with different letter are
significantly different Pc0.05!.
Table 2. Effect of cellulose level on the texture ofsurimi based molded products
* GEL STRENGTH kg!LEYEL expressible compressive penetration %increase
moisture X! force rigidi ty--zszzs-------------@ms--r � z----a-as-------------------m
control�! 0.49 ab 93.3 a 0.446 a 20.6�.70! c! �5.8! b! �.538! a!
0 ' 39 b 80.3 b 0.402 a 6.9� ' 0! d! �5.7! a! �.430! abc!
70 c 0.377 b 4.2�6.5! a! �.393! c!
0. 51 ab�.36! e!
0.52 ab 60.1 d 0.365 bc 43.8�.24! b! �6.3! b! �.523! ab!
0.57 a 44.8 e 0.319 c 31.0�.50! a! �7.3! b! �.418! bc!
* 20am powdered cellulose at 78 X moisture.** ! indicates the value after 1 freeze-thaw cycle
53,9
control111720354555
1.47 c2.10 b1.48 c1.37 c2.37 b3.80 a2.76 b
16.6 a9.91 c
12.3 b13.2 b
8.0 d5.46 e
6.5 ed
0.303 a
0.196 c0.253 b0.257 b0.195 c0.195 c0.172 d

Effect of cellulose level on the texture of surimi basedmolded products is shown in Table 2. Overall, compressiveand penetration forces of molded products gradua11ydecreased with an increase in the cellulose level.
After I freeze-thaw cycle, the gel showed a goodfreeze-thaw stability at 1'L and 2X level with a least amountof expressible moisture and a smallest increase in rigidity.Cellulose at levels greater than 2X may have prevented itsability to reduce ice crystal growth upon freezing. This isin turn caused increases in expressible moisture andpenetration force rigidity!.
Table 3 Effect of cellulose level on the texturalcharacteristics of crab leg products
'% '92 & & W '%&& SWWW92 4
SENSORY SCOREchewi rubberi moist overallness ness ness
LEVELfo
shear firmrce kg! ness
RR ~Z
0.73 61.48! �.0!
control 6.4 6.2�.25! �. 5!
6 5.9�.75! �.5!
0.73 5 ' 2 6.2�.26! �.38! �.5!
6.6 6 6.2�.13! �.75! �.5!
068 52 56 55�.14! �.13! �.13! �.0!
6.6 5.6�.5! 8.0!
059 39 48�.02! �.38! �.13!
4. 9 6.2 5.4�.0! �.5! �.63!
4 0.53 3.8 3.8 4.2 5.8 4.0�.98! �.25! �.75! �.75! �.75! �.63!
* 20 <m powdered cellulose at 78% moisture"* ! indicates the value after 1 freeze-thaw cycle.
No significant differences in texture score were notedbetween control and products with ll level. However, thebetter overall texture value was obtained at a 1'A level.
520
The results of effect of cellulose level on the texturalcharacteristics of crab leg products are shown in Table 3.There were no significant changes up to 2%, but beyond thislevel, there were significant decreases in firmness, chewinessand rubberiness with an increase in cellulose level P<0.05!.

After 1 freeze-thaw cycle. there were slight decreases infirmness, chewiness and rubberiness with an increase in thecellulose level. There were no significant differences betweencontrol and at ll level in the texture score of chewiness,firmness and rubberiness. However, the better overall texturescore was marked at the 1% level cellulose due to a more meaty,less rubbery texture and a better mouthfeel. Crab Ieg productswithout cellulose showed the lowest desirability score due to arubbery and dry texture. The highest overall texture scorewas received at the 2% level. The improvement in the textureof the cellulose-containing ge1 is probably due to thefreeze-thaw stabilizing ability of cellulose. Themicroscopic examination revealed that cellulose was able toreduce ice crysta'J growth at a moderate moisture levelduring frozen storage.
Table 4 shows effect of addition of cellulose with 6Xstarch on the textural characte~istics of molded products.Overall, cohesiveness and rigidity of molded productsgradually decreased with an increase in the cellulose levelwith 6X starch. Gels without starch had a more rigid andless cohesive texture with high expressible moisture thanthe one with starch.
Table 4 Effect of addition of ce'tlulose with 6X starch onthe textural characteristics of molded products.
GEL STRENGTH kg!compressive penetration
force
SAMPLE expressiblemoisture X!
control G.68 a 43.6 bc 0.473 a
60.2 a 0.370 b
0.325 c
0.328 c
0.320 dc
0.28G d
49.3 b
41. 0 cd
40. 3 cd
35.5 d
* S-C:modified starch:powdered cellulose*" means within each column with different letter are
significantly different PC0.05!.
521
S-C:6-0
S-C:6-1
S-C:6-2
S-C:6-3
S-C:6-4
0.57 a
0.66 a
0.64 a
0.57 a
0.64 a

Addition of cellulose above 1X significantly reduced thecohesiveness and rigidity of surimi gels despite theirability to bind moisture. This could be its disruptiveeffect on the composite-reinforcing effect of starch.
Table 5 shows the effect of addition of cellulose with6X starch on the textural characteristics of crab legproducts' The highest textural strength and desirabilitywas obtained at 1X cellulose level. Beyond 1% level, thetextural values gradually decreased with an increase in thecellulose level.
Table 5 Effect of addition of cellulose with 6% starch onthe textural characteristics of crab leg products."
S-C:6-0 0.45�.75![66.7]
5.3 5.8 5.2 5.7 5.92�. 0! �. 0! 5. 0! �. 15! �. 5!
[-3.8] [+7.9] [+9.8]
S-C:6-1 0.45 5.83 6.8 5.3 5.7 6.25�.93! �.88! �.5! �.5! �.38! �.75![107] [-3.7] [+11.9] [+8.0]
S-C:6-2 0.40 5.0 5.5 5.1 5.2 6.13�.91! �.85! �.3! �.63! �.75! �.25![127] [-9 2] [»9 8] [ 1 95]
S-C:6-3 0.38�.92![142]
4.8 5.0 4.7 5 ~ 75 6.0�.0! �.75! �.5! �.75! �.13!
[-4.2] [+17.4] [+18.8]
S-C:6-4 0.34 4.5 4.6 4.0 5.6 5.6�.63! �.63! � ' 0! �.25! �.0! �.38![85.3] [+6.25] [+5.6] [+31.8]
! indicates the value of 1 freeze-thaw cycle[ ] indicates 5 increase after 1 freeze-thaw cycle.
522
SENSORY SCORESANPLE shear firm chewi rubberi moist overall
force kg! ness ness ness ness textureSSSSCSRCCCRSSSSRSR$2RCRCCSRXSSRCSS SCCSCSCSCSSSCSCCCR 0 ROC
control 0.57 6.5 7 6.7 5.5 6.6�.55! �.13! �.].3! �.13! �.0! �.75![172] [+6.4! [+9.9] [-28]

All starch-cellulose containing formulas {5.6-6.3! wereslightly inferior to control�.6! in the overall texturescore. A moderate correlation r 0.76! between shear forceand rubberiness was observed at the 99% level of confidence.This suggests that shear test can be used to measure changesin rubberiness.
After 1 freeze-thaw cycle, the overall textural scoresof cellulose-containing crab leg formulas at all tevels werehigher than those without cellulose. This was due to adecrease in rubberiness and an increase in moistness. Asexpected, the control without starch and cellulose becametoo rubbery and dry and received the lowest desirabilityscore. As shown previously in Table 3, a11 textural valuesgradually decreased with an increase in the cellulose level.However, when crab leg products were formulated with starch,the ones having cellulose received better desirability scorethan those without cellulose. It means that celluloseprevents the toughening of fiberized crab leg productsduring frozen storage. This result demonstrates theadvantage of adding cellulose to products to be distributedfrozen.
CONCLUSION
Cellulose at I-2X level helps keep products, both moldedand fiberized forms, from becoming rubbery and dry duringfreeze-thaw cycles by ef'fectively preventing freezesyneresis and improving water binding of a gel. Modifiedstarch alone results in a less moist and starchy texture.However, with addition of ce'Ilulose, a product having amoist and less starchy texture can be produced after frozenstorage.
REFERENCES
1. James river Corp., "Solka-Floe' powdered cellulose forthe food industry" brochure!.
2. Kim, J.M. and Lee, C.M. 1987. Effect of starch oftextural proper ties of surimi gel. J. Food Sci.52�!:722.
3. Kim, J AM., Lee, C.M., and Hufnagel, L.A. 1987. Texturalproperties and structure of starch-reinforced surimi gelsas affected by heat-setting. Food Microstruct. 6:81.
4. Labell, F. 1986. Powdered cellulose adds texture, high
523

fiber to reduced calorie foods. Food Processing 47:7.
5. Lee, C.M. 1984. Surimi process technology. Food Technol.38�1!:69.
6. Lee, C.M. 1986. Surimi manufacturing and fabrication ofsurimi-based products. Food Technol. 40�!: 115.
7. Miller, W.B. 1986. Seeing the ' light' Ce11ulose inreduced-calorie baked goods. Bakers Digest. 7.
8. Morse, E. 1978. Cellulose:The versatile dietary fiber.Cereal Foods World. 23�1!:645.
9. Okada, N. 1963. Studies of elastic property of Kamaboko.Bull. Tokai Reg. Fish. Res. 36:21.
10.0sman, E.M. 1975. Interation of starch with othercomponents of food systems. Food Technol. 29�!:30.
11.SAS. 1982. "SAS User's Guide:Statistics." SAS InstituteInc., Cary, NC.
12.Vetter, J.L. 1984. Fiber as a food ingredient. FoodTechnol . 38�!: 64.
13.Wu, M.C., Hamann, D.D., and Lanier, T.C. 1985.Rheological and calorimetric investigations ofstarch-fish protein systems during thermal processing. J.Text. Stud. 16:53.
ACKNOWLEDGEMENT
Authors would like to thank the dames River Corporationfor their financial support throughout the study. Thanks arealso extended to A. E. Staley Manufacturing Co. and ICIAmerica for providing starch and sorbitol samples. The useof trade names in this publication does not implyendorsement of the products named.
524


TEXTURE-MODIFYING EFFECT OF NONFISK PROTEIN IN SURIMI GEL
K.H. Chung and C.M. LeeDepartment of Food Science and Nutrition
University of Rhode Island, Kingston, RI 02881
INTRODUCTION
As a result of increasing consumption of surimi-basedshellfish analog products, a marked advancement in thesurimi technology has been made primarily in themanufacturing of surimi and shellfish analog products.
Texture of the product produced with surimi alone tendsto be rubbery and less desirable to the Americans' taste.Not only to ease the rubberiness but also to allowflexibility in formulation, textural modification of surimi-based product has been attempted. Modification of texturecan be achieved not only by a mechanical texturizationprocess, but also by the incorporation of gel-formingingredients such as starch and protein. Addition ofingredients to the surimi-based product can contribute tothe improvement of textural properties as well as economicand nutritional benifits Lee, 1986 ; Lee and Kim, 1986!.
When nonfish proteins are incorporated into surimi, eachprotein contributes different functional and texturalproperties to the surimi gel. Therefore, understanding of'the physicochemical properties of nonfish proteins and theirinteraction with fish protein is important to optimizing thetextural property of the surimi-based products. There appearto be potential demands for high protein surimi-basedproducts which stemned from the idea of bringing theprotein level of the surimi-based product 11-12 X! to thatof the natural product 16-17 l !. This may waivemanufacturers an "imitation" labeling requirement accordingto a recent FDA ruling on "nutrition equivalency". Theformulation of a high protein product needs to be developedwithout reducing the desirable textural quality which isnormally found in the ordinary surimi-based product.
The objectives of this study were : 1! to study texture-modifying properties of nonfish proteins in surimi gels, and2! to determine the relationship between functionalproperties of nonfish proteins and nonfish protein-incorporated surimi gel.
525

MATERIALS AND METHODS
Preparation of nonfish protein gel
Nonfish proteins evaluated were soy protein isolate SPI!, whey protein concentrate WPC!, lactoalbumin LA!,egg white frozen raw, EW!, milk protein isolate MPI! andwheat gluten WG!. SPI was obtained from Grain ProcessingCorporation Muscatine, Iowa!; EW from Hygrade Egg Products Elizabeth, NJ!; WPC, LA and MPI from New Zealand MilkProducts Petaluma, LA!; and WG from Ogilvie Mi 1ls Minnetonka, MN!. Protein gels were prepared by blendingthe proteins for 10 min in a silent cutter with addition of1.5 '5 salt and a proper amount of water to adjust themoisture level to 78 X. One portion of paste was stuffedinto a 25 mm diameter cellulose casing and the other portionplaced into centrifuge tubes. Casings were cooked for 20 minin a steam-cooker.
Evaluation of gel texture and water binding ability ofnonfish protein
Gel properties of samples were evaluated by a methodreported by Lee 1984 ! using an Instron TestingMachine Model 1122!. Protein content of the samples weredetermined by the micro-kjeldahl method 1975!. Waterbinding ability WBA! of the nonfish protein was determinedby a centrifugation method and expressed in X amount ofwater retained in the sample. Centrifugation was done for 10min at 3000 g using a Sorvall centrifuge Model RC 2B!after cooking the paste for 20 min in a steam-cooker whileit was in the tube. The water binding ability of nonfishprotein during heating was referred to "thermal hydration".The water binding ability was also determined by measuringthe amount of moisture expressed from the plug of cookedprotein gel �5 mm x 25 mm! upon compression and expressedin X moisture retained in the sample.
Preparation of surimi gel
The Alaska pollock Theragra chalcogramma! surimiobtained from the Alaska Fisheries Developement Foundation Anchorage, AK! was used throughout the study. Half-thawedsurimi was chopped for 10 min in a silent cutter withaddition of 2X salt, 3X nonfish protein and a proper amountof water to adjust the moisture level to 78 %. Allingredients were added on a surimi weight basis. Theresulting paste was divided into three portions. One part of
526

the paste was extruded into a sheet 1.5 mm thick, 25 mmwide and 70 mm long ! and partially heat-set for 15 min at50 C to run a tensile test. The second one was alsoextruded into a sheet, partially heat-set for 2 min at, 110C, and fiberized to run sensory evaluation and shear test.The third one was stuffed into a 25 mm diameter cellulosecasing. Fiberized and casing-molded samples were cookedfor 15 and 20 min, respectively, in a steam-cooker. Thefiberized sample was coo'Ied and kept in a refrigeraterwhile the casing-molded sample was cooled down in therunning cold water for 10 min and kept overnight at roomtemperature prior to the evaluation of the texturalproperties.
Evaluation of textural and water binding properties
Textural properties of gels were evaluated following themethod reported by Lee 1984! except for shear test using an1nstron Testing Machine. Testing parameters includedcompressive force at failure cohesiveness!, penetrationforce rigidity!, and % expressible moisture water bindingability! for the casing-molded samples; tensile and shearforce for the fiberized samples. In the shear test, afiberized sample was sheared longitudinally by a descendingflat blade 1 mm thick! while the sample rested on astationary plate. Water binding of casing-molded surimi gelwas determined by expressible moisture measured by thecompression test.
Sensory evaluation of fiberized products
Sensory evaluation of the textural properties of thefiberized surimi gel product was conducted by a group of 5panelists. The textural characteristics evaluated werefirmness, rubberiness, chewiness, moistness and overalltexture acceptability. The panel was composed of graduatestudents and faculty of the department who had a priorexperience in evaluating the quality of surimi gel products.The panelists were asked to score the intensity anddesirability of each textural characteristic on a 9-pointscale.
Ana'Iysis of data
Analysis of variance was used to determine thestatistical significance of the sample variations inphysicochemical properties of nonfish protein. Thedegree of correlation was determined between functionalproperties of nonfish protein and nonfish protein-incorporated surimi gel.
527
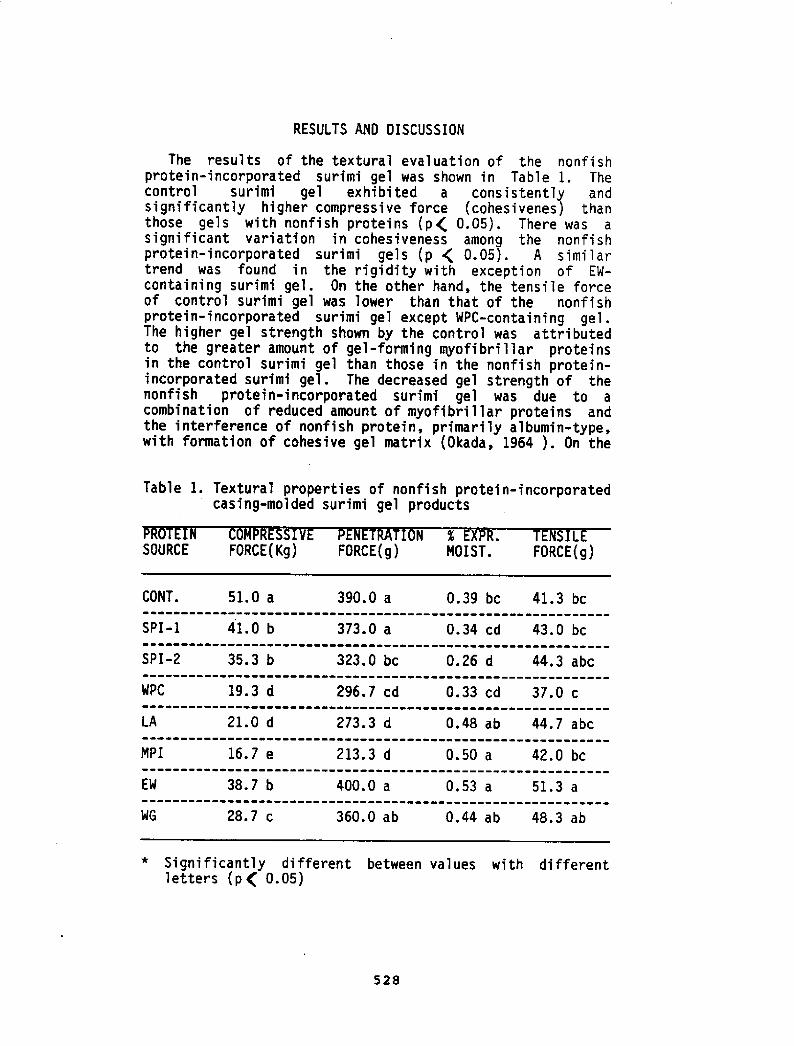
RESULTS AND DISCUSSION
Table 1. Textural properties of nonfish protein-incorporatedcasing-molded surimi gel products
V N X XR.FORCE Kg! FORCE g ! MOIST. FORCE g!SOURCE
CONT. 51.0 a 390.0 a 0.39 bc 41.3 bc
SPI-1 41.0 b 373.0 a 0.34 cd 43.0 bc
SP I-2 35. 3 b 323.0 bc 0 ~ 26 d 44.3 abc
WPC 19.3 d 296.7 cd 0.33 cd 37.0 c
LA 21.0 d 273.3 d 0.48 ab 44.7 abc
MPI 16.7 e 213.3 d 0.50 a 42.0 bc
38.7 b 0.53 a400.0 a 51.3 a
WG 28.7 c 360.0 ab 0.44 ab 48.3 ab
* Significantly different between values with differentletters p 0.05!
528
The results of the textural evaluation of the nonfishprotein-incorporated surimi gel was shown in Table 1. Thecontrol surimi gel exhibited a consistently andsignificantly higher compressive force cohesivenes! thanthose gels with nonfish proteins p g 0.05!. There was asignificant variation in cohesiveness among the nonfishprotein-incorporated surimi gels p 0.05!. A similartrend was found in the rigidity with exception of EW-containing surimi gel. On the other hand, the tensile forceof control surimi gel was lower than that of the nonfishprotein-incorporated surimi gel except WPC-containing gel.The higher gel strength shown by the control was attributedto the greater amount of gel-forming myofibrillar proteinsin the control surimi gel than those in the nonfish protein-incorporated surimi gel. The decreased gel strength of thenonfish protein-incorporated surimi gel was due to acombination of reduced amount of myofibrillar proteins andthe interference of nonfish protein, primarily albumin-type,with formation of cohesive gel matrix Okada, 1964 !. On the

RESULTS AND DISCUSSION
Table 1. Textural properties of nonfish protein-incorporatedcasing-molded surimi gel products
VSOURCE FORCE Kg!
X R. LMOIST. FORCE g !FORCE g!
CONT. 51.0 a 390 ~ 0 a 0.39 bc 41.3 bc
373.0 a 0.34 cd 43.0 bcSPI-1 41 ~ 0 b
SPI-2 35.3 b 323.0 bc 0.26 d 44.3 abc
WPC 19.3 d 296.7 cd 0.33 cd 37.0 c
LA 21.0 d 273.3 d 0.48 ab 44.7 abc
MPI 16.7 e 213.3 d 0.50 a 42.0 bc
38.7 b 400.0 a 0.53 a 51.3 a
WG 28.7 c 360.0 ab 0.44 ab 48.3 ab
* Significantly different between values with differentletters p g 0.05!
528
The results of the textural evaluation of the nonfishprotein-incorporated surimi gel was shown in Table I. Thecontrol surimi gel exhibited a consistently andsignificantly higher compress i ve force cohes i venes! thanthose ge1 s wi th nonf i s h proteins p g 0. 05! . There was asignificant variation in cohesiveness among the nonfishprotein-incorporated surimi gels p g 0.05!. A similartrend was found in the rigidity with exception of EW-containing surimi gel. On the other hand, the tensile forceof control surimi gel was lower than that of the nonfishprotein-incorporated surimi gel except WPC-containing gel.The higher gel strength shown by the control was attributedto the greater amount of gel-forming myofibril lar proteinsin the control surimi gel than those in the nonfish protein-incorporated surimi gel. The decreased gel strength of thenonfish protein-incorporated surimi gel was due to acombination of reduced amount of myofibri liar proteins andthe interference of nonfish protein, primarily albumin-type,with formation of cohesive gel matrix Okada, 1964 !. On the

contrary, nonfish proteins tended to increase the tensi1eforce of the fiberized products. It was not clear, however,whether such an increase in tensile force was an indicationof stiffness or elasticity. The variation of gel propertiesamong the nonfish protein-incorporated surimi gel wasattributed to the differences in physical and functiona1properties of nonfish proteins Table 3!. Addition ofnonfish protein having higher gel strength resulted in
Table 2. Sensory textural properties and shear force of thenonfish protein-incorporated fiberized surimi gelproducts
TEXTURAL CHARACTERISTICS
SHEAR FIRN CHEMI RUBBERI OVERALLFORCE g! NESS NESS NESS TEXTURE
PROTEINSOURCE
933 a 7.3 a 7.2 a 7.0 a�.0! a �.0! a �.0! a �.0! b
CONT.
5.0 c 5.6 b 6.0 ab�.7! a �.3! a �.7! a �.7! a
SPI-I 527 d
5.6 bc 5.7 b 5.3 b�.7! a �.0! a �.00 a �.9! a
SPI-2 750 b
6.3 b 6.0 b 5.7 ab�.0! a �.7! a �.0! a �.B! a
4I7 eMPC
5.3 bc 5.3 b 5.3 b�.3! a �.0! a �.3! a �.5! a
LA 550 d
5.5 bc 5.5 b 5.0 b�.0! a �.0! a �.5! a �.8! a
5.6 bc 5.7 b 5.3 b�.0! a �.0! a �.7! a �.9! a
650 cNP I
EM 743 b
600 cd 6 0 bc 5 7 b 5 3 b�.0! a �.0! a �.0! a �.0! a
529
* Without parenthesis : intensityWith parenthesis : desirability
** Significantly different between values with differentletters P$0.05!
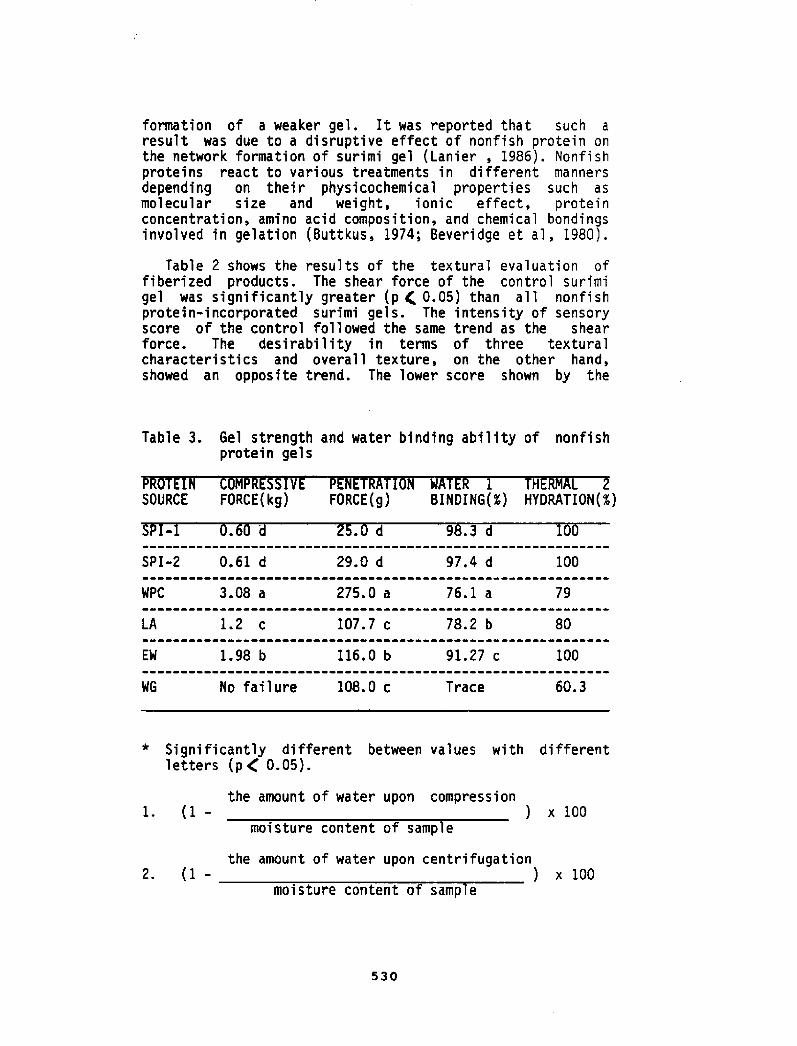
formation of a weaker gel. It was reported that such aresult was due to a disruptive effect of nonfish protein onthe network formation of surimi gel Lanier , 1986!. Nonfishproteins react to various treatments in different mannersdepending on their physicochemical properties such asmolecular size and weight, ionic effect, proteinconcentration, amino acid composition, and chemical bondingsinvolved in gelation Buttkus, 1974; Beveridge et al, 1980!.
Table 2 shows the results of the textural evaluation offiberized products. The shear force of the control surimigel was significantly greater p 0.05! than all nonfishprotein-incorporated surimi gels. The intensity of sensoryscore of the control followed the same trend as the shearforce. The desirability in terms of three texturalcharacteristics and overall texture, on the other hand,showed an opposite trend. The lower score shown by the
Table 3. Gel strength and water binding ability of nonfishprotein gels
9.3d
SPI-2 0.61 d 29.0 d 97 ' 4 d
76.1 a
100
WPC 3.08 a 275.0 a 79
LA 12 c 107.7 c
EW 1.98 b 116.0 b
78.2 b
91.27 c
80
100
WG No failure 108.0 c 60. 3Trace
* Significantly different between values with differentletters p 4 0.05!.
the amount of water upon compression�- ! x 100
moisture content of samp e
the amount of water upon centrifugation! x 100
moisture content of samp e�-
530
V W H L
SOURCE FORCE kg! FORCE g ! BINDING X! HYDRATION X!

control was due to a higher intensity, but less desirab1esensory score. However, addition of nonfish protein reducedthe intensity score and thus increased the desirabi1ityscore.
In an effort to determine what caused such variations inthe textural properties of nonfish protein-incorporatedsurimi gel, the relationship of the functional properties ofnonfish protein to the properties of nonfish protein-incororated surimi gel was studied. The functionalproper ties studied were water binding ability and gelstrength. Woodward et a t �982! and Hermansson �975!claimed that water binding ability of protein is one of themost important factors which control the textural andstructural properties of heat-induced protein gel. There wasa great deal of variation in water binding ability amongproteins, where WPC showed the least water binding ability,but with the highest gel strength for both cohesiveness andrig1dity Table 3!. Such a low moisture absorption by WPCmay have facilitated more protein-protein interaction,resulting in the development of a firmer gel.
Table 4. Correlat1ons among the water binding ability,gelstrength of nonfish protein and nonfish protein-incorporated sur imi.
1. r = -0.65 between thermal hydrat1on centrifugation! andcompressive force of nonfish protein gel Table 3!.
2. r = 0.94 between water binding based on expressiblemoisture of nonfish protein by compression Table 3!and compressive force of nonfish protein-incorporatedsurimi gel.
3. r 0,97 between thermal hydration Table 3! andcompressive force of nonfish protein-incorporatedsurimi gel, WG excluded Table I!.
4 r = - 0.68 for rigid1ty between nonfish protein-incorporated surim1 gel and nonfish protein gel.
5. r = - 0.63 for cohesiveness between nonfish prote~n-incorporated sur1mi gel and nonfish protein gel.
531

Cohesiveness of nonfish protein-incorporated surimi gelshighly correlated with thermal hydration r = 0. 97, WGexcluded!, as wel] as with water binding based on theexpressible moisture r = 0.94! of nonfish protein gels.This result suggests that both thermal hydration a ndexpressible moisture of nonfish protein are good indices ofprotein functionality to be related to the texturalproperties of nonfish protein-incorporated surimi gel.Thermal hydration of nonfish proteins inversely correlatedwith cohesiveness r = -0.65 !, r1gidity r = - 0.46 !,and X expressible moisture r = -0.97! of nonfish proteingel. In summary , nonfish protein with less thermalhydration and greater expressible moisture produced astronger nonfish protein gel due to protein concentration,but it made surimi ge'l weaker when nonfish proteins wereincorporated. Unlike cohesiveness, rigidity poorlycorrelated with thermal hydration r = 0.26! as shown inTable 4. Cohesiveness is the degree of protein binding inthe matrix and its value is better considered for the gelforming ability than r1gidity value Lee and Chung,1987!. This may explain the discrepancy between twocorrelation coefficients.
The result of protein analysis suggested that waterbinding abi 11ty of nonfish protein was dependent upon itsprotein content. WPC having 74 % protein content showed theleast WBA, while SPI having 89 X showed the highest WBA. Theprotein concentration of SPI is higher than that of WPC. Itmeans that SPI has more solid concentration and thus moresurface area which allows more water molecules forabsorption.
Conclusions
Addition of nonf1sh protein to the surimi-based productsimproved the textural properties by reducing the intensityof undesirable rubberiness, chewiness and firmness, thusincreasing the desirability of overall texture. Thereduct1on in the intensity of such undesirab'le texturalcharacteristics resulted in a soft mouthfeel.
Thermal hydration of nonfish protein inversely correlatedwith the cohesiveness of nonfish protein gel, but itmoderately correlated with the cohesiveness of nonf1shprotein-incorporated surimi gel. Gel strength of bothcohesiveness and rigidity of nonfish protein gel showedan inverse correlation with those of nonfish protein-incorporated surimi gel. It was concluded that the main
532

cause of variations in the texture-modifying effects ofdifferent nonfish proteins was the differences in thermalhydration and gelation properties of nonfish proteins.Therefore, thermal hydration and gelation properties can beeffectively used in determining texture-modifying abi 1i ty ofnonfish proteins
References
1. AOAC. 1975. Official Method of Analysis, 12th ed. Assoc.Off. Anal. Chem., Washington, D. C.
2. Beveridge, S., Ko, S.A.S and Chung, J.K.H. 1980.Firmness of heat induced albumem coagulum. Poultry Sci.59: 1229
3. Buttkus, H. 1974. On the nature of the chemical andphysical bond which contribute to some structuralproperties of protein foods: A hypothsis. J. Food Sci.39: 484
4. Hermasson, A. M. 1975. Functional properties of addedproteins correlated with properties of meat system.
Effect of concentration and temperature on water-binding properties of Model Meat Systems." J. Food Sci.40: 603
5. Lanier, T. C. 1986. Functonal properties of surimi. FoodTechnol. 40�! : 107
6 ~ Lee, C. M. 1984. Surimi process technology. FoodTechnol . 38�1!: 69
7. Lee, C.. M. 1986. Surimi manufacturing and fabricationof surimi-based products. Food Technol. 40�!: 115
8. Lee, C. M. and Kim, J. M. 1986. Texture and freeze-thaw stability of surimi gel in relation to ingredientsand formulation. Proc. of Inter. Symp. on EngineeredSeafood Including Surimi R. Martin and R. Collete, Ed!National Fishies Institute, Washingston, OC, P 168
9. Lee, C. M. and Chung, K. H. 1987. Textural analysis ofsurimi gel properties by compression and punch tests.paper No. 572 , presented at 47th Annual Meeting ofInstitute of Food Technologists, Las Vegas, Nevada, June16-19.
533

10. Okada, M. 1964. Effect of washing on the jelly formingability of fish meat. 8ull. Jap. Soc. Sci. Fish. 30: 255
11. Moodward, S. A. and Cotterill, 0. J. 1982. Texture andmicrostructure of heat-formed egg white gel. J. Food Sci.51 333
534
CHANGES IN THE FATTY ACID AND AMINO ACID PROFILES OF FISHMINCE DURING SURIMI PROCESSING
Henry Leibovitz, Richard D. Morizen and Chong M. LeeDepartment of Food Science and Nutrition
University of Rhode Island, Kingston, RI 02881
INTRODUCTION
Marine fish oils containing omega-3 fatty acids areincreasingly important to health-minded consumers who believethat increasing their intake of omega-3 fatty acids wit1 reducetheir chances of heart disease by lowering b1ood cholestero11evels Lands, 1986!. Essential amino acid EAA! profiles areof particular interest to nutrition oriented individuals andfood producers because they are indicative of protein quality.Examination of the effects of processing on the EAA profiles ofsurimi is necessary in order to substantiate its nutritionalvalue and the necessity of recovering amino acids currentlydiscarded in the wash water and strainer reject.
The objectives of the study were: to measure the effect ofwashing on levels of total lipid, eicosapentaenoic acid EPA,20:5W3! and docosahexaenoic acid DHA, 22:6W3! in red hake Uro h cis chuss! and mackerel Scomber scrombrus! surimi, and
d
the mince and wash water at the different surimi productionsteps using red hake.
MATERIALS AND METHODS
The general procedure for preparation of fish mince wasbased on the method by Lee 1986!. Red hake and mackerelfillets were ground through a plate having 4.5 mm holes andwashed two times for the amino acid study and three times forthe fatty acid study at a 3 : 1 water mince ratio at 10 C for 5min. Following the second washing red hake mince was strainedusing a strainer Bibun sum 420!. A portion of the resultingslurry from each washing was pressed with a Carver press andused for subsequent analyses. Changes in the fatty acid profileof the mince were analyzed after each washing. The fatty acidanalysis was conducted in the following manner. Red hake andmackerel flesh samples were collected at each washing cycle.Total lipids were extracted from the flesh using a solventsystem of chloroform-methanol-water 1:2:0.8 V/V! Bligh andDyer, 1959!. Lipid extracts were saponified and free fattyacids were converted into fatty acid methyl esters Kates,1972!. Fatty acid methyl esters were identified by gaschromatography on a cyanosi'1icon column SP-2330, Supelco Inc.!at 200 C in a Varian 1700 gas chromatograph.
535

Samples collected from each processing site werefreeze-dried Virtis Unitrap II! and analyzed for moisture,protein and amino acids. Samples included fresh fish fillets,wash waters, reject and strained mince. The moisture andprotein contents of each sample collected were determined byusing the oven drying and the micro-Kjeldahl method,respectively. Amino acids were analyzed in the followingmanner. Freeze-dried samples of quantities equivalent to 8 pgof protein were hydrolyzed in 6N HC1 at 110 C for 22 hoursfollowed by evaporation of the acid. The hydrolysates werediluted to 5 ml with 0. 1N HCl and filtered through a 0.45 pfilter. Six pl of the resulting filtrate was injected into ahigh pressure liquid chromatograph Perkin-Elmer Corp.! set upwith a sulfonated polystyrene cation exchange column Interaction Corp.!. The separated amino acids were convertedinto thiolesters by a post-column derivatization reaction withfluoraldehyde Pierce Co.!. The secondary amino acids such asproline were converted into primary forms by a post-columnreaction with sodium hypochlorite before deriving theirthiolesters. Amino acid derivatives were identified using afluorescence detector model LC-10, Perkin-Elmer Corp.!, and theconcentration of amino- acid was determined.
RESULTS AND DISCUSSION
Table 1: Effects of Washing on Total Lipid, EicosapentaenoicAcid and Docosahexaenoic Acid in Red Hake Surimi
Was ing Tota Lipid p DHNumber mg i 100 mg fish dry wt.!
0 3.39 0.58a 0.51 0.01a 1.061 3. 03 1.05a 0. 51 0. 18a 0. 712 2.72 O.lla 0.36 0.02a 0.823 2 ' 15 0.23a 0 ' 31 0.02a 0.76
0. 14a0. 25a0. 02a0. 16a
Means followed by different letters are significantlydifferent p c0.05!.
536
No significant differences in total lipid content were seenfollowing the washings. The total lipid, EPA and DHA remainedsimilar on a dry weight basis in the red hake samples. In themackerel samples, EPA was significantly p '0.05! moreconcentrated in the mince fol'lowing the third washing Table2!. Trends toward increasing total lipids and DHA afterwashings in mackerel samples and decreased levels of totallipids, EPA and DHA in the red hake samples were not significant p �.05! Table 1 and 2!.

Table 2: Effects of Washing on Total Lipid, EicosapentaenoicAcid and Oocosahexaenoic Acid in Mackerel Surimi
ashingNumber
Lipid mg I 100
Tota P DHA
mg f i sh dry wt. !
0.48 0.00a0.51 0.02ab0.52 0.05ab0.60 0.02b
0 8.941 9.462 9.34
3 9.74
0.09a0.32a0.91a0.67a
1.19 0,02a1. 29 0. 02a1. 22 0. 07a
1. 31 0. 05a
Means followed by different letters are significantlydifferent p <0.05!.
There were significant differences in the amino acidprofile between washed mince and wash water. Increasedessential amino acid EAA! levels in the mince increases afterwashing, notably, those of Yal, Tyr, Ile, Leu and Lys Fig. 1!.
537
The results of the essential amino acids EAA! analysis atdifferent processing steps illustrates the concentration effectof the surimi washing process Table 3! as indicated by anincrease in the EAA concentration in mince with increasedwashing cycles. A similar trend was seen in the changes in EAAconcentration in the wash water. However, this change was notdue to the concentration effect, but due to the increase intissue protein with a decrease in nonprotein nitrogen in thesecond washing. It was particularly noteworthy that there wassignificant difference in EAA concentration between the controlfillets and the strained sample. Overall, the concentration ofEAA in the strained mince was higher than that in the fillet.

Table 3: Essential Amino Acids Measured During Production Steps
ontro irst as econd Mash Reject Strained CT! Wash Water Wash Water RJ! STRD!
M-1! One W-2! Two LQI! LQ2!
1no
Acids
mg / 100 mg protein!
3.24 ~ 6
The nutritional quality of the reject in terms of amino acidprofile was equally as good as those of the control and firstwashed samples, and the amino acid leveis in the pressed strainedmince was far higher than those in the fresh fillet Figure 2!.
Using current knowledge, the expected percent fat andprotein losses in red hake and mackerel samples are displayed inFigure 3 . As shown, the estimated loss of fat amounts to about29K and the protein remaining is about 60 l of the originalfollowing washing and discards in the reject.
538
THRVALMET
ILELEUTYRPHELYS
3.83.42.43.1
6.82 ' 03.89.0
3.74.02.43.57.02.73.59.5
1.62.00.81.63.0
4.04.22.73.8
7.53.33.610.3
2.12.70.9
2.34.4
1.0
4.76.1
3.6
3.82.4
3.5
7.23.13.3
9.2
4.35.3
2.94.7
9.1
3.64.5
11. 4

PIRere j. PROTEIN kNQ PAT LOSSKS SIJRING VhSHING
RKD HAXK MACKEREL
FROTRIN F AT ASII iiOISTURSI7 2.9 l.o 7$,5
FROTRN100 MINCE
VASHINO
33 VASH WATER! I2: NTO/21: ShRCO}
t67 CASHED MINCE
-5.6 -X -0.5 +5.30
2.I
7.0 RKIKCT! RSTIIIATRD LOSS OF FAT X!:2,l 2.9-I/I I 3 + 2.9-X
+ I.0-0.5 i 70.5 i 53
Ix ~29 s J
If any nutritional colIIIents are to be made on the amino acidcontent and its value as a food source, we should consider theamino acid content on a wet basis instead of a dry basis. Themoisture contents of the strained and the pressed mince were 92 land 82 X, respectively, on a wet basis. The effect of themoisture reduction on the concentration of essential amino acidsare shown clearly in Figure 4, where the concentration of aminoacids in the pres'sed mince was much higher than that in thestrained mince and the variations in the concentration areclearly reflected by differences in the moisture content.
539

CONCLUSIONS
The washing did not reduce the levels of either omega-3fatty acids or total lipid in the fish flesh. This can bereasoned by the concentration effect of washing with losses ofsoluble components. A significant amount of lipids wereestimated to be lost during washing, however, and further studiesare needed to recover and measure the amount of total lipidactually lost in the wash water. Consumers should not considersurimi devoid of marine fish oil or omega-3 fatty acids.
Surimi processing does not appear to lower the proteinquality of the final product. The washing increased the overallamino acid concentration in the fish mince. The amino acidprofile of the wash water appears to be significantly inferiorto that of the washed mince. The reject after straining isconsidered equally as nutritious as the final mince.
REFERENCES
Bligh E. G. and Oyer, W. J. 1959. A rapid method of totallipid extraction and purification. Can. J. Biochem. andPhysiol. 37:9, p. 911 '
Kates, M. 1972. Identification of individual lipids and lipidmoieties. In: "Techniques of Lipidology". Elsevier SciencePublishers, Amsterdam, The Netherlands. p. 451.
Lands, W. E. N. 1986. Cowmen factors in heart disease, heartattacks, and strokes. In: "Fish and Human Health". AcademicPress, Inc. New York.
Lee, C. N. 1986. A pilot plant study of surimi makingproperties of red hake Uro h cis chuss!. In " Proc. Intern.Symp. on Engineered Seafoo nc u sng urmimi" R. E. Martin andR. L. Collete, Ed.!, National Fisheries Institute, Washington,D. C., p. 225.
540
SENSORY ANALYSIS OF EDIBLE FISH OILS
Janet A. Gooch and Sylvia B. GallowayNational Marine Fisheries Ser vice, NOAA, SEFC
Charleston Laboratory, P.O. Box 12607, Charleston, SC 29412
INTRODUCTION
Considerable interest has arfsen regardfng the nutritional andtherapeutic value of ffsh oils. Fish oils, with their relatively highconcentration of long-chained omega-3 fatty acids, are linked with theprevention of coronary heart disease Stansby, 1984; Sanders, 1985;Leaf, 1986!. In conjunction with this, several studies have shown thatthe consumption of fish or fish oils alters blood lipid patterns inhumans. Phfllfpson et al. �985! found that, in patients withhypertrfglyceridemfa, a f1sh oil enriched diet up to 30% of totalcalor1es! led to decreases in both plasma cholesterol and plasma trigly-ceride, as compared with control diets not containing f1sh oils. Inadd1tfon to lowerfng lipid levels, certain fish oil fatty ac1ds may alsoact to reduce platelet aggregation, decrease blood viscosity, and pre-vent ischemic damage as well as modify inflammation and immune responses Stansby, 1984; Harris, 1985; Kfnsella, 1986; Goetzl et al., 1986!.
A conference was held on the "Health Effects of PolyunsaturatedFatty Ac1ds in Seafoods" 1n 1985 in Mashfngton, D.C. Session chairper-sons voiced the crucial need for uniform test materials to be used forresearch on the biological mechanisms by which fish oils influencehealth and modulate disease processes S1mopoulos, 1986!. This researchwill be conducted by qualified biomedical researchers who are supportedby a variety of funding agencies including the National Institutes ofHealth NIH!, the National Science Foundation NSF!, and private univer-sities. During 1986, the National Oceanic I ' Atmospheric Administration,National Mar ine Fisheries Ser vice, Southeast Fi sheries Center,Charleston S.C. Laboratory began its Biomedical Test Materials Programto prov1de refined menhaden oil and oil fractions of defined quality andcomposition for the N1H-approved studies.
menhaden oll Brevoort1a spp.! was selected as the source for alltest mater1als s1nce etcosapentaeno1c acid EPA or 20:5n3! 1s one of 1tsprincipal fatty acids Joseph, 1985! along with moderate concentrationsof docosahexaenoic acid DHA or 22:6n3!. Eicosapentaenoic acid and DHAare two of the most cormmn omega-3 fatty ac1ds in fish oils, and EPA isbelieved to be especially effective in reduc1ng the risk of heartattack Hi rai et al., 1980; Kobayashi et al., 1981; Dyerberg, 1982!.Menhaden oil fs the primary commercial fish oil in the United States,and has been thor oughly analyzed Ackman et alee 1976, 1981; Ackman,1980; Dubrow et al., 1976; Joseph, 1985; Seaborn, 1986!.
S1nce the biomedical test materials must be of defined quality andcomposition, quality control of the production processes and qualityassurance of the products are of utmost importance. A number of stan-
541

dard methods for measuring the quality and composition of these productsare currently in use, including sensory analysis. Sensory analysis isan integral part of our gA/qC program and is performed on fresh samplesas well as oils undergoing storage to determine their flavor stability.
This paper outlines the methodology and presents results fromsensory evaluation of the following fish oil products:1! steam-stripped menhaden of 1 and placebo corn oil in soft gel
capsules;2! vacuum-stripped menhaden oil bulk packaged in bottles;3! placebo corn oil, vacuum-stripped menhaden oil, and fish oil
polyunsaturated ethyl esters, each microencapsulated in a matrixof 10� corn starch.
MATERIALS AND NETHOOS
Packa in and Antioxfdantse s o~ pro ucts have been bulk packaged in bottles, soft gel-
encapsulated or microencapsulated and stored in amber bottles which wereflushed with nitrogen prior to sealing. Placebo oils corn, safflower,or olfve! as well as ethyl esters of the fish oil were also packaged jnthe same manner. Antfoxidants Kodak 5-67, Tenox GT-1, and Tenox 20A'!were added to the various oils so that the final concentrations ofantfoxidants in all oils would be as follows: �! alpha-tocopherol, 1.3mg/g; �! gamma-tocopherol, 1.2 mg/g; and �! tertiary butyl hydro-quinone TBHg!, 0.2 mg/g. In this way, the antioxidant levels would be"balanced".
p on of several freshly processed and deli-berately abused exposed to light and air in a glass petri plate! menha-den oil samples showed that the fish oils exhibited many of the sameflavor and odor characteristics that are reported in the literature forother edible oils Chang, 1972; Jackson, 1981, 1985; Maltking, 1982;AOCS, 1983; Lawson, 1985; Marner, 1985!. To produce some of the flavorand odor attributes f.e., painty, rancid, and oxidized!, edible oils i.e., sunflower, linseed, soybean, and cottonseed! were heated at 60'Cover a period of days up to 16! until they attained the desired off-flavor and odor Marner, 1985!. A series of triangle tests was used toscreen panelists for the four basic tastes. Separate sessions were heldover a period of several weeks to familiarize panel members with odorsand flavors of different oils and then associate these characteristicswith the description of each term on the evaluation form. Chemicalr eference standards and known oils were used in training the paneliststo rate fntensity and to discriminate among oil samples. Several publi-cations AS'N, 1968, 1981; IFT, 1981; Powers, 1982, 1984! providebackground information and basic guidelines for sensory panel training.
1 The use of trade names does not imply endorsement by the NationalNa rf ne Fisheries Service, NOAA.
542

Odor and Flavor Evaluation Forme procedure emp oyed is a modification of the guantitative
Descriptive Analysis ADA! method for sensory analysis Stone et al.,1974; Necredy et al., 1974; Zook and Wessman, 1977!. The scale is anunstructured line 15 cm in length with one vertical line at the left endand a second vertical line 1 cm in from the right end of the line. Thescale runs from absent to very strong in intensity. Each panelistrecords his/her evaluation by making a vertical line across the 15 cmhorizontal line at the point that best reflects his perception of theintensity of each attribute. Only the attributes actually detected aremarked on the score sheet.
Fig. 1 and Table 1 show an example of the evaluation form anddefinitions for each attribute Stansby and Jellinek, 1965; Chang, 1972;Nounts and Warner, 1980; Jackson, 1981, 1985; Waltking, 1982; AQCS,1983; Lawson, 1985; Warner, 1985!.
Nany researchers Chang, 1972; Jackson, 1981, 1985; Waltking, 1982;AOCS, 1983; Warner, 1985! have utilized a 10-point flavor quality scalefor sensory analysis of vegetable oils, with 10 as excellent and 1 asrepulsive. However, we decided to use the ADA method because it hasworked well for sensory evaluation of other fishery products; and theopen line scale generates data that can be analyzed by standard sta-tistical methods which assume a normal distribution.

OATS:PANELIST:SANPLE:
SE150RT ANALYSIS OF FISN OIL
VERY STRON6
VERY STRONGRUTTERY iksvoet
VERT STRONGREANY soy orother ran beanflavor/sdor!
VERY STNNVG
VERY ST%Nb
YERY STRONG
GRASSY "greeny .fnaahly cut grais.
�5FISNY cod-Ilwroil odor/f!amor!
VERY STION!
VERY STRONIARS NTRITTER caffeineor cuisinetaste/odor!
VERT STRON6
VERY STRON6
VERT STRON6
VERT STRON6
Figure 1. Example of evaluation form using the unstructuredline scale.
544
Place s vertical nark acrossNark anly the attributes yauIS co. long.
ARS NTTI 6 Total Intsnsi tyof Odor]
ARSTI F Tati! Intplty
RAICIO strongodor « flavor ofrank, acrid, orsaid sed fats!
ARSPAIRTT ! insoedoil or dryingpaint «kvr/flavor!
ONIOIZEO sharp.CM~T "'
MET pleasant,odor/0 asser
ARSFRUITY/NEUW rindaf wtonselon ar«~hr awr!
k5 liTNINNY carwlitadfVav~or odour
ARSGEIGER odor/flaw r
the hoiscntal line according tc your judea«st as�tg the intansi tS nf each attribute.deteCt, Label cash vortisal line vith ~ ithar an "6 odor! cr "F flavOr!. Tha linn is
VERY STRONG

Table 1. Defin1tion of odors and flavors of fish oil.
TIO - Total intensity of odor.
TIF - Total intensity of flavor.
BUTTERY - Aroma and flavor of sweet, freshly-churned butter. A strongbuttery flavor would refer to a pronounced, sweet butter fla-vor, not old or rancid.
BEANY - Characteristic of soybean oil products or fresh, raw soybeans orother raw beans.
RANCID - Strong, very oxidized, rank acrid flavor and odor, very oldfats.
PAINTY - Resembl1ng drying paint or linseed o11.
OXIDIZED - Sharp; characteristic of oils exposed to air, particularlycottonseed oil. A strong ox1dfzed flavor is termed "rancid".
GRASSY - The "green" flavor or odor of freshly cut grass; sl1ghtlycharacter1stic of "green" in cucumbers.
FISHY - The characteristic odor and flavor of fish oil, such as cod-lfver oil.
BITTER - Taste and odor of caffeine or quinine; may be acrid.
SMEET - Pleasant, sucrose odor and flavor; slightly character1st1c ofsyrup.
FRUITY/MELON - Characteristic of watermelon rind or honeydew melon; maybe slightly citric; characterist1c odor and flavor off ish oil esters.
BURNT - Scorched; like carmelized sugar; may be found in conjunctionwith "sweet".
OTHER - Any odor/flavor not deffned above which is experienced by thepanelist.
545

RESULTS AND DISCUSSION
Specially processed menhaden oil was purchased from Zapata Hayn1eCorp., Reedville, Vfrgfnfai. This oil was e1ther steam-stripped orvacuum stripped, antioxidants were added, and the oil was shipped tocommercial companies for encapsulation. The steam-stripped oil wassoft-gel encapsulated, and the vacuum-stripped oil was mfcroencap-sulated; and then returned to NMFS for distribution to the variousresearchers.
Specific details of the sensory evaluation procedures used areoutlined in Table 2. Table 3 shows the results of sensory analysis onsoft-gel capsules of fish and corn oil. These data indicate only aslight increase fn intensity of odor and flavor of the fish oil as aresult of encapsulation. The sensory panel characterized the fish oflcapsules as being bland in odor and flavor with very little "fishiness".Stansby and Jellinek �965! characterized highly refined menhaden oilsas having a slightly "green" or "grassy" odor and flavor. Me found thisto also be true of our menhaden oil samples.
Tables 4 and 5 show results of sensory evaluation of a vacuum-stripped menhaden oil packaged fn bulk and three microencapsulated pro-ducts corn oil, vacuum-stripped menhaden oil, and fish oil ethylesters!. In Table 5 the microencapsulated fish oil and ethyl estersexhibited only a minute "painty" off-odor. The microencapsulatingmatrix was corn starch, as evidenced by panel members adding otherattributes such as "chalky" and "starchy".
The results and samples presented in this paper are representativeof the type of products that will be produced as part of the BiomedicalTest Materials Program at the Charleston Laboratory. Sensory analysisis an important component of the gA/gC program. Panel members arecapable of detecting off-odors and flavors long before chemical analyseswill ind1cate oxidation of a product. It is hoped that we will be ableto correlate sensory scores with analysis of volatiles by direct gaschromatography as well as other chemical analyses such as free fattyacids, peroxide values, iodine values, and anisfdine values.Statfstfcal analysis of the data will also be employed. In surrmrary,sensory scores of the oils and oil derivatives show that they are ofhigh quality with only slight "fishiness" and very few undesirable odorsand flavors.
546

Table 2. NMFS Biomedical Test Materials Program Sensory EvaluationProcedures
SENSORY ANALYSIS OF 0 ILSa
SAMPLE PREPARATION:
A 40 ml glass beaker containing 5-6 ml of oil is covered with awatch glass and placed in a preheated 50'C water bath.
�! The oils are heated 10 minutes prior to serving.
�! A sample is coded with a 3-digit random number.
�! A maximum of 3 samples per sessfon are evaluated due to taste andolfactory fatigue of the panel members.
ODOR AND FLAVOR TESTING PROCEDURES:
Panel members rate the oils for odor in the order in which samplesare presented from left to right. Reference standards that charac-terize the attribute as well as the fntensity were utilized duringpanel training and are available for review.
A covered beaker is swirled and lifted to the nose. Panelistremoves cover and sniffs the volatiles. The beaker is swirled againif necessary.
�!
�! The type and intensity of odor as well as total intensity of odor isrecorded on the score sheet.
�! For flavor attributes, the lightest aromatic sample is tasted first,followed by samples of increasfng odor intensity.
Disposable pipets are used to transfer an aliquot �0-100 yl! of oilinto the mouth. The oil is held on the back of the tongue as air isdrawn into the mouth and exhaled through the nose.
�!
�!
The type and intensity of flavor as well as total intensity of fla-vor are recorded on the same score sheet used for odor.
8! Each product is sampled and evaluated, for odor and flavor, 3 times.The intensity data is measured numerically in cm! and analyzed.
547
If possible, the sample is not swallowed. Carbon-filtered tap waterheated to 38'C is used to cleanse the palate after each sample.

Table 2 cont1nued
SENSORY ANALYSIS OF MICROENCAPSULATED OILS
SAMPLE PREPARATION:
�! A 40 ml glass beaker containing 5 g of the material and 25 mlboiling water is thoroughly mixed, covered with a watch glass, andplaced in a preheated 50'C water bath to attain equilibrium.
�! After 15-20 m1nutes, the temperature of the emulsion will havefallen to about 50'C and the odor 1s evaluated.
ODOR TESTING PROCEDURES'
Odor only 1s evaluated on mi croencapsulated oils since themicroencapsulatfng matrix not only contributes flavors of its own, butalso masks some oil flavors. See Steps 1-3 of Odor and Flavor TestinProcedures for methodology.
a Mounts and Warner, 1980; Jackson, 1981, 1985; Lawson, 1985;Chang, 1972; Warner, 1985; AOCS, 1983.
b Heath and Reineccius, 1986
548

Table 3. Mean scores scale of 0-15! and standard deviations are listedfor baseline data at the beginning of a storage study on fishoil and corn oil placebo! capsules. Data was obtained fromsensory evaluation of steam-stripped menhaden oil before andafter encapsulation by a comnercial company for NMFS.
SOFT GEL CAPSFISH OIL CORN OILCAPSULESb CAPSULESb
ODOR ATTRIBUTES'
0.6 + 0.9TYPICAL CORN
a Mean from 4 separate panels; N 7 panelists.b Mean from 3 separate panels; N 7 panelists.
549
T IOBEANYGRASSYFISHYSWEET
FLAVOR ATTRIBUTES:7 IFBEANYGRASSY
F ISHYSMEET
FISH OILa BEFORE
E NCAP SULAT ION!
1.6 ~ 0.70.3 4 0.30.2 + 0.30.5 ~ 0.70.1 x 0.1
1.7 a 0.60.4 t 0.30.5 * 0.40.3 i 0,40.0 ~ 0.0
2.4 * 1.10.2 + 0.20.2 + 0.50,7 + 0 70.1 R 0.2
2.6 ~ 1.20.1 * 0.20.3 + 0.51.0 a 0.80.1 x 0.1
2.1 + 1.20.4 + 0.50.0 + O.O0.1 + 0.10 ' 4 + 0 6
2.0 a 1.10.7 t 0.60.0 + 0.00.0 + 0.00.4 x 0.6

Table 4. Mean scores scale of 0-15! and standard deviations for avacuum-stripped menhaden oil bulk packaged in bottles.a
Flavor Attributes:Odor Attributes:
a Mean from 3 separate panels; N = 7 panelists.
Table 5. Mean scores scale of 0-15! and standard deviations are listedfor baseline data at the beginning of a stor age study. Datawas obtained from sensory evaluation odor only! of microen-capsulated placebo corn oil, vacuum-stripped menhaden oil, andfish oil ethyl esters commercially microencapsulated for NMFS.
MICROENCAPSULATED
FISH OIL' FISH OILESTERSa
CORN OILa
ODOR ATTRIBUTES'
3.0 + 1.90.0 + 0.01.1 t 0.80.6 + 0.80.0 ~ 0.0
TroBEANY
PAINTY
F ISHY
FRUITY/MELON
0.6 + 0.90.5 + 0.6
CHALKYSTARCHYTYPICAL ESTER
0.4 + 0.81.3 + 2.0
a Mean from 2 separate panels; N = 7 panelists.
550
TIO
PaintyOxidizedGrassyFishy
2.8 + 1.40.2 + 0.40.2 + 0.40.2 + 0.41 1 + I ~ 4
1.8 + 1.40.3 + 0.50.0 * 0.00.0 ~ 0.00.0 + 0.0
TIF
PaintyOxidizedGrassyFi shy
3.5 + 1.30.6 + 1.1
0 ~ 5+0 ~ 60 ' 2 + 0 ' 31.9 + 1.4
3.0 + 1.40.0 ~ 0.01.4 * 0.60.2 + 0.31.2 i 0.7

REFERENCES
Ackman, R.G. 1980. Fish lipids. Part I. In J.J. Conne11 editor!, Advances in Fish Science and Technology, p. 86-103.Fishing News Books, Ltd., West Byfleet.
Ackman, R.G., C.A. Eaton, and J.H. Hingley. 1976. Menhaden bodylipids: Details of fatty acids in lipids from an untapped foodresource. J. Sci. Food Agric. 27:1132-1136.
2.
Ackman, R.G., W.M.N. Ratnayake, and C.A. Eaton. 1981.Considerations of fatty acids in menhaden from the northern limitsof the species. Proc. N.S. Inst. Sci. 31:207-215.
3.
4.
ASTM Committee E-18. 1968. "Manual on Sensory Testing Methods",STP 434. Am. Soc. for Testing and Materials, Philadelphia, PA.
5.
ASTM Committee E-18. 1981. "Guidelines for the selection andtraining of sensory panel members", STP 758. Am. Soc. for Testingand Materials, Philadelphia, PA.
6.
Chang, S.S. 1972. Organoleptic evaluation of edible fats andoils. Unpublished data. Dept. Food Sci. Rutgers Univ., NewBrunswick, NJ.
7.
Dubrow, D., M. Hale, and A. Bimbo. 1976. Seasonal variations inchemical composition and protein quality of menhaden. Mar. Fish.Rev. 38 9!:12-16.
8.
Dyerberg, J. 1982. Observations on populations in Greenland andDenmark. In S.M. Barlow and M.E. Stansby editors!, NutritionalEvaluation of Long-chain Fatty Acids in Fish Oils, p. 245-261.Acad. Press, Inc. Ltd., Lond.
9.
Goetzl, E.J ., M.Y.S. Wong, D.G. Payan, T. Chernov-Rogan, W.C.Pickett, and V.A. Blake. 1986. Effects of eicosapentaenoic acidon immune responses and inflammation in humans. In A.P.Simopoulos, R.R. Kifer, and R.E. Martin editors!, Health Effectsof Polyunsaturated Fatty acids in Seafoods, p. 239-246. AcademicPress, Inc., Orlando, FL.
10.
11. Harris, W.S. 1985. Health effects of omega-3 fatty acids.Contemp. Nutr. General Mills! 10 8!, 2 p.
Heath, H.B., and G. Reineccius. 1986. Flavorists and flavorcreation. In Flavor Chemistry and Technology, p. 346-353. VanNostrand Reinhold Co., New York.
12.
551
AOCS. 1983. Flavor panel evaluation of vegetable oils. Am. OilChem. Soc. recommended practice No. CG 2-83; 4 p. Part of:Sampling and Analysis of Commercial Fats and Oils. In Official andTentative Methods of the Am. Oil Chem. Soc., Am. Oil Chem. Soc.,Champaign, IL.

Hirai, A., T. Hamazaki, T. Terano, T. Nishikawa, Y. Tamur a, A.Kumagai, and J. Sajfkf. 1980. Eicosapentaenoic acid and plate1etfunction in Japanese. Lancet ii: 1132-1133.
13.
IFT. 1981. Sensory evaluation guide for testing food and beverageproducts. Sensory Evaluation Div., Inst. of Food Technologists.Food Technol. 35�1!:50-59.
14.
Jackson, H.M. 1981. Techniques for flavor and odor evaluation ofsoy oil. J. Am. 011 Chem. Soc. 58�!:227-231.
15.
Jackson, H.W. 1985. Oil flavor quality assessment. In T.H.Applewhite ed1tor!, Bailey's Industr1al 011 and Fat Products, Vol.3, p. 243-272. John Wiley 5 Sons, New York.
16.
Joseph, J.D. 1985. Fatty acid composition of commercial menhaden,Brevooitia spp., oils, 1982 and 1983. Mar. Fish. Rev.
7.
17.
Kinsel la, J.E. 1986. Food components with potential therapeuticbenefits: The n-3 polyunsaturated fatty acids of fish oils. FoodTechnol. 40�!:89-97, 146.
18.
Kobayashi, S., A. Hirai, T. Terano, T. Hamazak1, Y. Tamura, and A.Kumagai. 1981. Reduction in blood v1scosity by efcosapentaenoicacid. Lancet ii:197.
19.
Lawson, H.M. 1985. Research and development. In Standards forFats and 01ls, p. 207-219. AVI Publishing Co., westport, CT.
20,
Leaf, A. 1986. Introduction: Approaches to prevention. In A.P ~Simopoulas, R.R. Kifer, and R.E. Martin editors!, Health E77ectsof Polyunsaturated Fatty Ac1ds 1n Seafoods, p. 81-86. Academ1cPress, Inc., Orlando, FL.
21.
Mecr edy, J.M., J.C. Sonnemann, and S.J. Lehmann. 1974. Sensoryprofiling of beer by a modified ADA method. Food Technol.28�1�6-41.
22.
Mounts, T.L. and K. Marner. 1980. Evaluation of fin1shed o1lquality. In Handbook of Soy Processing and Utilizat1on. p.245-266. %. Soybean Assoc. and Am. Oil Chem. Soc., Champaign, IL.
23.
Phillipson, B.E., D.W. Rothrock, W.E. Connor, M.S. Harris, and D.R.Il lingworth. 1985. Reduction of plasma lipids, lipoproteins, andapoproteins by dietary fish oils in patients with hypertriglyceri-demia. N. Engl. J. Med. 312:1210-1216.
24.
Powers, J.J. 1982. "Materials and Training Exercises for Workshopon Sensory Analysis", South African Assoc. for Food Sci. andTechnol., Johannesburg, 52 pp.
25.
552

Powers, J.J. 1984. Current practices and application of descrip-tive methods. In J.R. Piggott editor!, Sensory Analysis of Foods,p. 179-242. Elsevier Applied Science Publishers, Lond.
26.
Sanders, T.A.B. 1985. The importance of eicosapentaenoic anddocosahexaenoic acids. In F.B. Padley and J. Podmore in colla-boration with J.P. Burn,&. Burt, and B.W. Nicols editors!, TheRole of Fats in Human Nutrition, p. 101-116. Ellis Horwood,Chichester, England.
27.
Seaborn, G.T., J.O. Joseph, and P.E. Bauersfeld. 1986. Fish oilresearch aids fishing industry and consumers. Proc. EleventhAnnual Trop. and Subtrop. Fish. Technol. Conf. of the Amerfcas heldJanuary 13-16, Tampa, FL. p. 263-274.
28.
Simopoulos, A.P. 1986. Historical perspective, conference conclu-sions and recommendations, and actions by federal agencies. InA.P. Simopoulos, R.R. Kifer, and R.E. Hartin editors!, HealthEffects of Polyunsaturated Fatty Acids in Seafoods. p. 3-32.Academic Press, Inc., Orlando, FL.
29.
Stansby, N.E. 1984. Fish or fish of 1 in the diet and heartattacks. Mar. Fish. Rev. 46�!:60-63.
30.
Stansby, N.E. and G. Jellinek. 1965. Flavor and odor charac-teristics of fishery products with particular reference to earlyoxidative changes in menhaden oil. In R. Kreuzer editor!, TheTechnology of Fish Utilization, p. AT-176. Fishing News BooksLtd., London.
31.
Stone, H., J. Sidel, S. Oliver, A. Woolsey, and R.C. Singleton.1974. Sensory evaluation by quantitative descriptive- analysis.Food Technol. 28 ll!:24-34.
32.
33.
Warner, K. 1985. Sensory evaluation of flavor quality of oils.In D.B. Nfn and T.H. Smouse editors!, Flavor Chemistry of Fatsand Oils, p. 207-221. Am. Oil Chem. Soc., Champaign, IL.
34.
Zook, K., and C. Wessman. 1977. The selection and use of judgesfor descriptive panels. Food Technol. 31�1!:56-61.
35.
553
Waltking, A.E. 1982. Progress report of the AOCS flavor nomencla-ture and standards cortmnfttee. J. Am. Oil Chem. Soc. 59�!:16A-20A.

ELECTROPHORETIC 1DENTIFICATION OF SHRIMP USINGVARIOUS PROTEIN EXTRACTION SYSTEMS
Haejung An, Maurice R. Marshall, W. Steven Otwelland Cheng-i Wei
Food Science and Human Nutrition DepartmentUniversity of Florida, Gainesville, FL 32611
INTRODUCTION
Willful or unintentional adulteration by substitutinglower cgxality and/or lower priced seafood products forhigher priced products has led. to an increasing demand foridentifying species of fish or other seafood in themarketplace. However, only a limited number of methods, suchas starch gel-zone electrophoresis, acrylamide discelectrophoresis, thin layer polyacrylamide gel isoelectricfocusing, and cellulose acetate strip, has been accepted asofficial methods to differentiate species of seafood orseafood products AOAC, 1984!. In most test methods, thehighly water-soluble sarcoplasmic proteins have been usedfor species identification Lundstrom, 1981 and 1983;Hamilton, 1982!. Protein solubility is affected by severalfactors, such as pH, ionic strength, temperature or the useof organic solvents Thakker and Grady, 1984!. Thus, bymodifying the extraction conditions, species-relatedproteins can be more effectively extracted and used forspecies identification.
In addition, the solubility of sarcoplasmic proteinsvere affected significantly after heat treatment. The numberof water-extractable proteins, as demonstrated by comparingthe electrophoretic gels of heated to non-heated samples,vas reduced after heat treatment Dowdie and Biede, 1983;Lee et al., 1974!. The solubility of heat-denatured proteinscan be improved by using various solvent systems such asurea and SDS Tanford, 1968; Thakker and Grady, 1984! .
This study was carried out to compare the relativeeffectiveness of various solvent systems in extractingproteins for use in gel electrophoresis. Five solventsystems were used to extract proteins from three species ofraw and cooked shrimp. Sodium dodecyl sulfate-polyacrylamide gel electrophoresis SDS-PAGE! was applied toseparate sarcoplasmic proteins and to differentiate andidentify the species from raw and cooked shrimp. The best
554

protein extraction system was used with SDS-PAGE to checkapplicability in identifying shrimp species and theirrelative contents in fabricated samples by a blind study.
MATERIALS AND METHODS
Three shrimp samples, pink gmhhmus ~urarum! Keyf2
stored at -33 C vere thawed under tap vater, peeled, anddeveined. For the cooking treatment, shrimp muscle vasplaced in boiling water for 5 min.
Five solvents were compared for their effectiveness inextracting sarcoplasmic proteins from whole rav and cookedshrimp. They were water, water homogenate adjusted to pH 8.0with 0.1 N NaOH, 0.1 M NaCl, 14 SDS w/v!, and 8 M urea. Allfive solvents contained 0.1 mM phenylmethylsulfonyl fluoride PMSF!, 10 mM EDTA and 0 01% w/v! sodium azide. Shrimpsamples were chopped, mixed with each solvent at a ratio of1:3 v/v!, and homogenized at room temperature for 1 min atsetting 5.5 using a Polytron Brinkmann Instrument,Westbury, NY!. After the samples vere centrifuged at48,000x g for 20 min at 20 C, the supernatants werecollected, .and the protein contents determined by the Lovrymethod Lowry et al.,1951! .
The percent yield of protein was determined for thesupernatants of vater, 14 SDS or 8 M urea extract. Thepercent yield vas calculated as the ratio of total proteincontent in the supernatant to that in the homogenate.
SDS-PAGE was performed according to the modifiedprocedure of Laemmli �970! and O'Farrell �975! using aProtean II vertical slab! unit Bio-Rad, Richmond, CA! .Slab gels �.5 mm thick! of 10.4 and 3.1% w/v! totalacrylamide were prepared to serve as a running and astacking gel, respectively. Proteins at 35 ~g were analyzedon SDS-PAGE. A constant current of 15 mA/slab was appliedinitially and increased to 30 mA/slab when the marker frontreached the running gel. Following electrophoresis, theproteins were stained with Coomassie Brilliant Blue R-250 Bio-Rad!. Molecular weights of the protein bands veredetermined according to the method of Weber and Osborn�969! and Weber et al. �972! using a low molecular weight MW! protein kit Pharmacia, Piscataway, NZ! .
A blind study was performed on fabricated mixtures ofpink and rock shrimp. Raw pink and rock shrimp wereindividually chopped and then mixed in various ratios v/w!
555

unknown to the investigators. For heat boiled! treatment,the chopped shrimp mixture was boiled for 5 min in a 2 ozWhirl-Pak bag Fisher Scientific!. Shrimp proteins wereextracted with water and SDS for the raw and heat-treatedsamples, respectively. After SDS-PAGE, electrophoreticprotein patterns were compared to reference samples of pinkand rock shrimp at various ratios. The percent content ofrock shrimp in the unknown sample was determined by visualobservation of the intensity of the species-specific proteinbands.
RESULTS AND DISCUSSION
so ventsv
The five protein extraction systems used in this studycan be categorized into two general groups: non-denaturingand denaturing agents. Characteristic SDS-PAGE patterns wereobtained for all the extracts of the raw and boiled shrimp.Only the patterns of white shrimp were shown in Figures 1and 2.
For all three raw samples, a low ionic strength saltsolution �.1 M NaCl! or the adjustment of the homogenatesto pH 8.0 did not increase protein extractability data notshown! or change the electrophoretic patterns when comparedto the water extract Fig. 1!. When using two commonprotein-denaturing solubilizers, SDS and urea, more proteinbands were observed Fig. 1! .
Low percent protein recovery was noted for waterextract Table 1!. However, water was the most suitablesolvent to extract proteins from raw shrimp forelectrophoretic identification. Specific patterns wereobtained with water extract for each species, and distinctbands could be recognized and used for speciesdifferentiation. The highest percent recovery was noted for1% SDS Table 1! which has been often used to solubilizemembrane proteins.
Heat treatment, of shrimp prior to water extractionresulted in a drastic change in SDS-PAGE patterns; thenumber of bands reduced greatly Fig.2!. High temperaturecauses both denaturation and dissociation of subunits Dowdie and Biede, 1983; Lee et al., 1974!. Thus, water wasnot effective in extracting proteins from cooked shrimp. Aprotein yield of only 8-114 was obtained Table 1!. Thisproblem was alleviated by using SDS or urea which enhanced
556
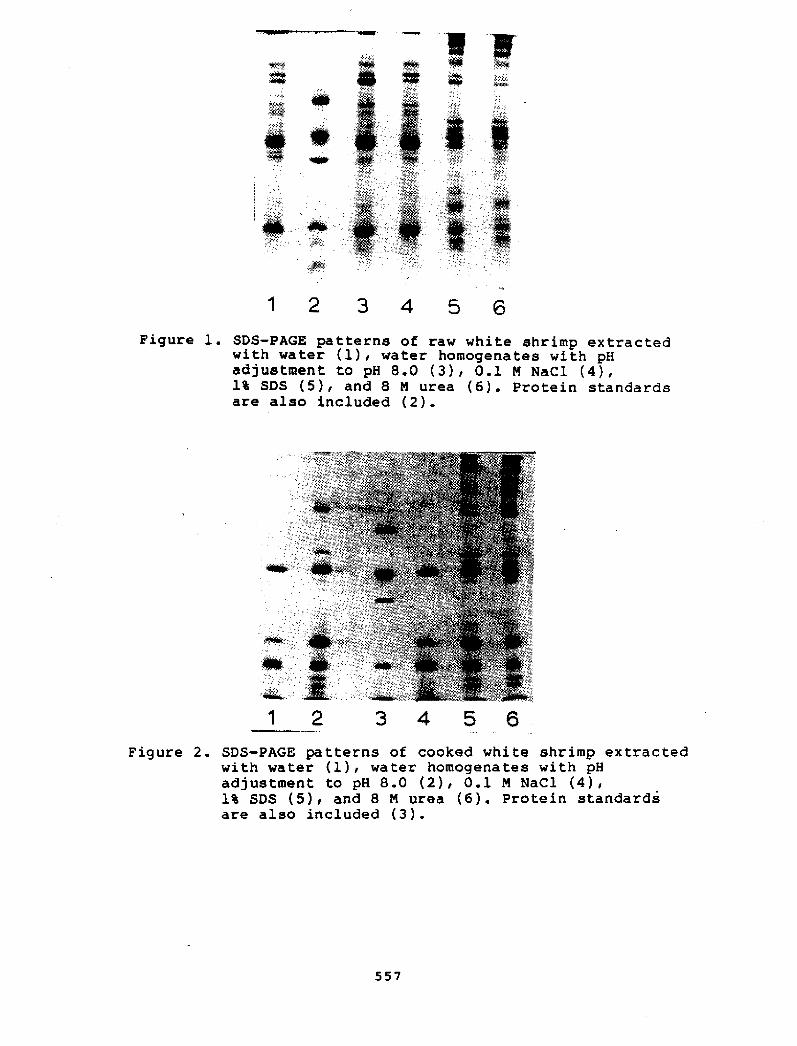
Figure l. SDS-PAGE patterns of raw white shrimp extractedwith water �!> ~ater homogenates with pHadjustment to pH 8.0 �!< O.l M NaCl �!>lt SDS �!< and 8 M urea �!. Protein standardsare also included �!.
1 2 3 4 5 6
Figure 2. SDS-PAGE patterns of cooked white shrimp extractedwith water �! I water homogenates with pHadjustment to pH 8.0 �!< O.l M NaC1 �!<1% SDS �!< and 8 M urea �!. Protein standardsare also included �!.
557

protein extractability Table 1!. Additional proteins wereextracted with these solvents, and provided greaterinformation for species identification Fig.2! . Since thepatterns of these two extracts were similar Fig. 2!, SOSwas chosen to extract proteins from cooked shrimp for genusidentification.
� AG attern
Characteristic gel patterns were obtained for allshrimp samples. For ease of comparison, the gel was dividedinto three equal segments, A top!, B middle! and C bottom!.
The water extracts of the raw samples showed the mostdiversity between species Fig. 3a!. Four major bands withNW of 88.3, 81.5, 78.6 and 74.1 kD were found in section Aof pink shrimp. For white shrimp, there were five bands inthis section. Their NW were 88.6, 81.7, 79.9, 77.7 and 75.7kD. The rock shrimp had six bands in section A with NW of88.9, 82.1, 80.6, 79.5, 78.1 and 76.0 kD. A species-specificminor band was also found between section A and B. Its NWwas 66.4, 65.7, and 63.8 kD for pink, white and rock shrimp,respectively.
Unlike those found in section A, the protein bands insection B showed no significant species difference. Twomajor thick bands were detected in section C with NW 19.1and 18.3 kD for pink and white shrimps or 18.5 and 17.7 kDfor rock shrimp.
Different banding patterns were observed for the SDSextracts of raw shrimp Fig. 3b!. Differences were found insection A and B f' or pink and white shrimp. The 78.6 kO bandwas only found in section A of pink shrimp. Two bands 80.5and 76.7 kD! in section A and one band �1.1 kO! in sectionB were only present in white shrimp. For rock shrimp, thebanding pattern at, section C was obviously different fromthat of the other two shrimps. Three unique bands of 26.5,23.7 and 21.5 kD were found in rock shrimp. The 58.4 kD bandin section B was also unique for rock shrimp. The ureaextracts of the three shrimps showed similar patterns as theSDS extracts.
In contrast to the raw samples, the species-specificityof the water extracts of boiled shrimp could not be easilydetected. Only a few bands were detected and they werebasically similar for all three species Fig. 4a!. Improvedgel patterns were found for the SDS extracts Fig. 4b!. Pinkshrimp was found to have similar patterns as white shrimp,possibly because they belong to the same genus. Two
Sse

characteristic thick bands �9.1 and 75.9 kD! found insection A of the rock shrimp extract were not as apparent inwhite or pink shrimp. The bands found in section C of rockshrimp could also be used for identification. Somevariations were found in the rock shrimp as compared to theother two shrimp. The bands with MW of 27.7-31.3 kD were notpresent in rock shrimp, while three new bands of 21.6, 18.7and 17.8kD vere detected. A new band vith a MW of less than27.7 kD was also found in rock shrimp. Again, as in the caseof rav samples, the urea extracts of boiled shrimp revealedthe same patterns as the SDS extracts. Distinct differencesin banding patterns could only be differentiated betweenwhite or pink and rock shrimp.
s 'xe shr' o ein
Characteristic banding patterns of each species vereused in identifying the existence of that specific speciesin shrimp mixtures. For example, the 79.9kD band of waterextracted rav white shrimp {Fig. 3a! could serve as animportant indicator for the presence of vhite shrimp in avhite-rock shrimp mixture. The minor band specific for eachspecies {66.4, 65.7 or 63.8 kD for pink, white or rockshrimp, respectively! provided another useful indicator forspecies identification. The minor band of the pink and rockshrimp is resolved enough to distinguish these species Fig.3a!. For example, the 58.3 kD band of the rock shrimp Fig.3a! provides additional information on the presence of rockshrimp in a mixture. This sharp band is intense and can beeasily recognized despite the presence of other bands withsimilar MW's �6.5 and 57.0 kD for the pink and whiteshrimp, respectively!.
The SDS extracts of boiled shrimp demonstrated a genus-specific pattern Fig. 4a!. The presence of twocharacteristic thick bands �9.1 and 75.9 kD! in section A,the 26.7 kD band in section B, and the 21.6 and 17.8 kDbands in section C would indicate the presence of rockshrimp in a mixture of sample. The 26.7 kD band ischaracterized by its intensity in mixture samples. The 21.6and 17.8 kD bands are unique because they are only found inthe SDS extract of rock shrimp.
559
Pink and rock shrimps of different genus were used inthe blind study. By using SDS-PAGE, various extractionsystems, and the information obtained in the previousstudies, all unknown samples were correctly identified. Theadulterated samples were detected at a maximum of 10%

PVf Vf RP'R
Figure 3. SDS-PAGE patterns of water extracts a, left! and SDSextracts b, right! of raw pink, white and rockshrimps and their mixtures �:1 protein ratio!. Thenumerical values are molecular weights of the specificproteins. P, pink; W, white; R, rock shrimp.
P W R std P:W
Figure 4. SDS-PAGE patterns of water extracts a, left! and SDSextracts b, right! of cooked pink, white and rockshrimps and their mixtures �:1 protein ratio!. Thenumerical values are molecular weights of the specificproteins. P, pink; W, white; R, rock shrimp.
560

difference from what was actually present for both raw andboiled shrimp samples Table 2! as judged by directinspection using the 204 increment ratio for the mixedextracts as a reference.
CONCLUSION
SDS-PAGE was an effective method to differentiate andidentify species of raw or boiled shrimp. Each species ofraw shrimp demonstrated a characteristic electrophoreticpattern when extracted with water. Heat-treatment of shrimpin boiling water for five min caused a loss of water-extractable proteins. No species-specific gel pattern wasobtained for these samples. SDS greatly increased proteinextractability and the number of proteins on the gel, thusmaking the identification of the genus of' heat-treatedshrimp possible. The technique to use SDS-PAGE withappropriate protein extraction systems to identify shrimpspecies was found to be very effective in a blind study. Amaximum error of 10% was encountered to detect, the actualamount of the individual shrimp in a rock-pink shrimpmixture.
ACKNOWLEDGEMENT
This work is the result of research sponsored by NOAA,Office of Sea Grant, Department of Commerce, under Grant No.IR-85-6.
REFERENCES
AOAC. 1984. "Official Method of Analysis" 14th ed.Association of Official Analytical Chemists,Washington, DC.
Dowdie, O.G. and Siede S.L. 1983. Influence of processingtemperature on the distribution of tissue and
~d !. J. Food Sci. 48: 804.
Hamilton,. W.D. 1982. Fish species identification by thinlayer agarose isoelectric focusing and densitometricscanning. J. Assoc. Off. Anal. Chem. 65: 119.
561

Laemmli, U.K. 1970. Cleavage of structural proteins duringthe assembly of the head of bacteriophage T4. Nature227: 680.
Lee, Y.B., Rickansrud, D.A., Hagberg, E.C., and Brisky, E.J.1974. Application of SDS-acrylamide gelelectrophoresis for determination of the maximumtemperature to which bovine muscle have been cooked.J. Food Sci. 39: 428.
Lowry, O.H., Rosebrough, N.J., Farr, A.L., and Randall, R.J.1951. Protein measurement with the Folin phenolreagent. J. Biol. Chem. 193: 256.
Lundstrom, R.C. 1981. Rapid fish species identification byagarose isoelectric focusing of sarcoplasmic proteins.J. Assoc. Off. Anal. Chem. 64: 38.
Lundstrom, R.C. 1983. Fish species identification by agarosegel isoelectric focusing: Collaborative study.J. Assoc. Off. Anal. Chem. 66: 123.
O'Farrell, P.H. 1975. High resolution two-demensionalelectrophoresis of proteins. J. Biol. Chem. 250: 4007.
Tanford, C. 1968. Protein denaturation. Adv. Prot. Chem.23: 121.
Thakker, K.D. and Grady, L.T. 1984. Solubility. Chap. 2. Zn"Food Analysis," D.W. Gruenwedel and J.R. Whitaker Eds.!, Marcel Dekker, Inc., New York, NY.
Weber, K. and Osborn, M. 1969. The reliability of moleculardeterminations by dodecyl sulfate-polyacrylamide gelelectrophoresis. J. Biol. Chem. 244: 4406.
Weber, K., Pringle, J.R., and Osborn, M. 1972. Measurementof molecular weights by electrophoresis onSDS-acrylamide gel. Meth. Enzymol. 26: 3.
562

FIGURE LEGENDS
Figure 1. SDS-PAGE patterns of raw white shrimp extracted
with water �!, water homogenates with pH
adjustment to 8. 0 �!, 0. 1 M HaC1 �!, 1% SDS �!,
and 8 M urea �!. Protein standards are also
included �!.
Figure 2. SDS-PAGE patterns of cooked white shrimp extracted
with water �!, water homogenates with pH
adjustment to 8.0 �!, 0.1 M NaCl �!, 1% SDS
�!, and 8 M urea �! . Protein standards are also
included �!.
Figure 3. SDS-PAGE patterns of water a! and SDS b!
extracts of raw pink, white and rock shrimps and
their mixtures �:1 protein ratio!. The
numerical values are molecular weights of the
specific proteins. P: pink, W: white and R: rock
shrimp.
Figure 4. SDS-PAGE patterns of water a! and SDS b!
extracts of cooked pink, white and rock shrimps
and their mixtures �: 1 protein ratio! .
The numerical values are molecular weights of the
specific proteins. P: pink, W: white and
R: rock shrimp.
563
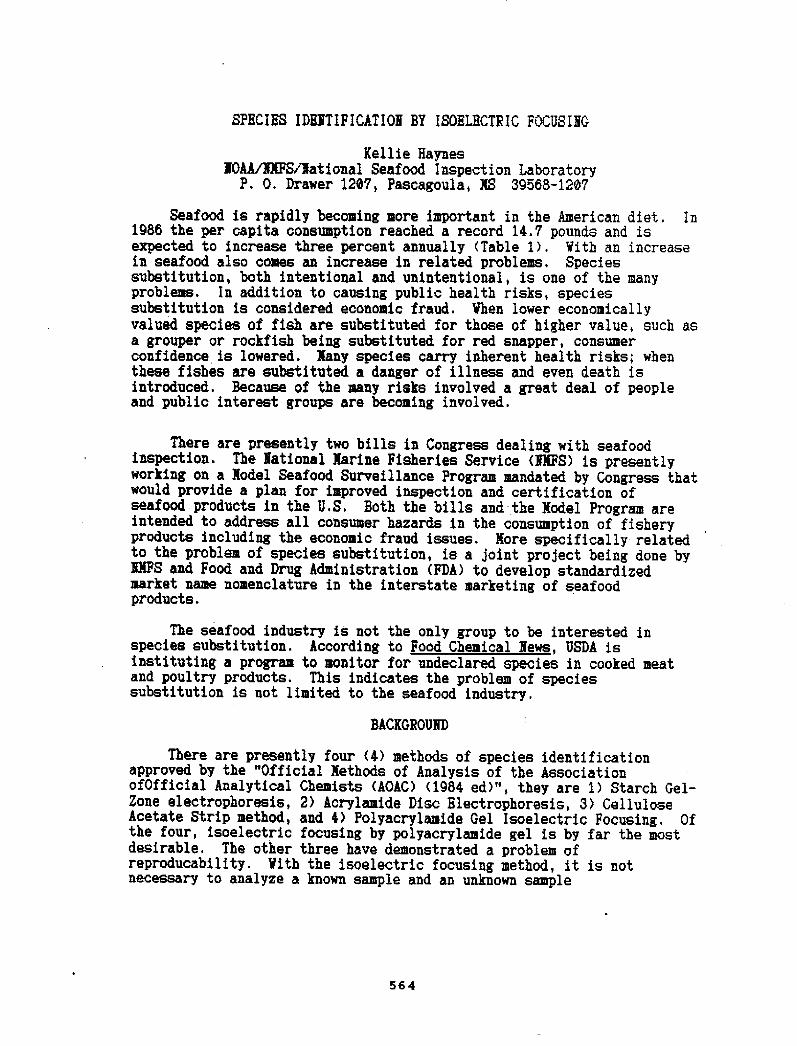
SPECIES IDHTIFICATIOI BY ISORLBCTRIC FOCUSIXG
Kellie HaynesIOAA/HFS/Iational Seafood Inspection Laboratory
P. O. Drawer 1287, Paecagoula, XS 39M8-1287
Seafood is rapidly becoming more important in the American diet. Ia1986 the per capita consumption reached a record 14.7 pounds and isexpected to increase three perceat annually Table 1!, Vith an increasein seafood also comes an increase ia related problems, Speciessubstitutioa, both inteatioaal and unintentional, ie one of the manyproblems. In additioa to causing public health risks, speciessubstitution is considered economic fraud. Vhen lower economicallyvalued epeciee of fish are substituted for those of higher value, such asa grouper or rockfish being substituted for red snapper, consumerconfideace is lowered. Many species carry inherent health risks; whenthese fishes are substituted a danger of illness aad even death isintroduced. Because of the maay risks involved a great deal of peopleand public interest groups are becoming involved.
There are presently two bills in Congress dealing with seafoodinspection. The Rational Marine Fisheries Service <IMPS! is presentlyworking on a Model Seafood Surveillance Program mandated by Congress thatwould provide a plan for improved inspection and certification ofseafood products in the U,S. Both the bills aad the Model Program areintended to address all coasumer hazards in the consumption of fisheryproducts iacludiag the economic fraud issues. More specifically relatedto the problem of species substitution, is a joint project being done byNIPS aad Food and Drug Admiaistratioa FDA! to develop standardizedmarket name nomenclature ia the interstate marketiag of seafoodproducts.
The seafood industry is aot the only group to be iaterested inspecies substitution. According to Food Chemical Mews, USDA isiastituting a program to moaitor for uadeclared species in cooked meatand poultry products. This indicates the problem of speciessubstitution ie aot limited to the seafood industry.
BACKGROUID
There are presently four �! methods of epeciee identificationapproved by the "Official Methods of Analysis of the AssociationofOfficial Aaalytical Chemists <AOAC! �984 ed!", they are 1! Starch Gel-Zoae electrophoresie, 2! Acrylamide Disc BLectrophoreeie, 3! CelluloseAcetate Strip method, aad 4! Polyacrylamide Gel Isoelectric Focusing, Ofthe four, isoelectric focusing by polyacrylamide gel is by far the mostdesirable. The other three have demonstrated a problem ofreproducability, Vith the ieoelectric focusing method, it ie notnecessary to analyze a known sample and an unknown sample
564

simultaneously. A "bank" of Known samples can be prepared aadphotographed for later comparison. This saves a great deal of time aadeffort.
The Isoelectric Pocusiag method utilizes an LKB 2117 multiphor forelectrophoresis <or equivalent apparatus!. The sample is prepared bygrinding 1 gram of fish with 5 milliliters of water then it iscentrifuged for 28 minutes to extract the proteins. The protein solutioa
Table 1. U.S. Per Capita Consumption of Commercial Fish aadShellfish, 1968-86.
Civilianresident
populationJuly 1
Per ca ita cons tionFresh
andfrozen Canned Cured Total
MillionPounds edible
IRecord.
Note: � These consumptioa figures refer only to consumptioa of fishand shellfish entering commercial channels, and they do not includedata on consumption of recreationally caught fish aad shellfishwhich since 1978 is estimated to be betweea 3 to 4 pounds <ediblemeat! per person annually. The figures are calculated on the basisof raw edible meat, i,e. excluding bones, viscera, shells, etc.Prom 1978 through 1988, data were revised to reflect the results ofthe 1988 census.
565
1968
19781971197219731974197519761977 �!1978 �!19'79 <1!1988 <1!1981 <1!1982 �!1983 �!1984 <1!1985 <1!1986 �!
178.1281.9284.9287 ' 5189.6211. 6213.8215.9218.1
228.5
223.8225.622'7. 7229.9232.8234,8237.8239,4
5,7
, 6.96.77.17.46.97.58.27.7
8.1
7.88,87.87.7
8.88.5
I9.89,8
4.84.54.3
. 4,95.84,74.34,24.6,
5.8
4.84.54,84.3
4 ' 84.95.15.4
8.6
.4
,5,5.4
,5.4~ 5.4
.3
,4
.3,3.3.3,3.3,3
18.3
11.811,512.5
,12.812.112.212.912.7
13.4
13.8
12,812,912.313.113,714,4
I14,7

is placed oa the gel and a constant power supply of 38 watts is appliedfor 90 minutes. Vhen the proteins reach their isoelectric point abiochemical "fingerprint" is produced. The gel then undergoes a seriesof fixing, staining then destaining steps. At the end of this processthe gel can be photographed using a specialized type of Kodak paper whichcan be easily stored,
RESULTS
hs part of its routiae laboratory mission, in 1986 the RationalSeafood Inspection Laboratory <XSIL! analyzed a total of 18 samples byisoelectric focusiag. Of these, 15 were labeled incorrectly. In otherwords, some other species had been substituted for the species' indicatedon the label. Ia 1987 a total of 26 samples were analyzed with 14 ofthese being substituted. Table two summarizes these results iapercentage form.
Table 2. Total Samples Analyzed for Species Identificatioa byIsoelectric Focusiag.
Year Percent Substituted Percent aot Substituted
29851987
83%87%
27%23'L
Here at II'SIL we have developed a "bank" of authentic samples thatare oftea substituted. Ve have amassed approximately 58 species from allregioas of the country. Vith regard to samples analyzed here, red drumand red snapper have been substituted for most often.
SUMMARY
Our analyses show a large percentage of fish are being substituted.This indicates that more testing aad inspection is anticipated. Alsowith the hazards involved with the polyacrylamide gel a aew aad safermethod of analysis needs to be developed,
566
There is oae drawback to using the acrylamide gel isoelectricfocusing method. The acrylamide gels contain traces of the acrylamidemonomer which is harmful if absorbed through the skin. Because of thisthe AOAC method includes a warning. Ia 1983, Ronald C. Lundstrum of KXFSnortheast Fisheries Center in Gloucester, %l conducted, a collaborativestudy using Agarose gels. These gels demonstrated an average. of 84'Laccuracy and have the added advaatage of a 38 minute protein separationstep. The results of the study were not good enough to recommend themethod for official first action in the AOAC, however this appears to bea promising method for future study.

AVOIDANCE COSTS DUE TO PUBLIC AWARENESS OFCIGUATERA FISH POISONINGS IN FLORIDA AND HAWAII
Myles Raizin and Malcolm MeaburnNational Marine Fisheries Service, NOAA, SEFC
Charleston Laboratory, P.O. Box 12607, Charleston, SC 29412
I NTRODUCT I ON
Ciguatera fish poisoning is a corrmron food-borne illness whichaffects the health of consumers and the economy of fisheries around theworld. Ciguatera is caused by eating fish that contain a virulent,naturally occurring toxin or toxins usually referred to as ciguatoxin.The toxin s! accumulate under generally unpredictable environmental con-ditions in the flesh of commercially important reef-associated fishesfrom tropical and sub-tropical waters. The overall ciguatera problemhas been summarized by Ragelis �984!. Studies on the impact ofciguatera on public health and local economies in endemic areas of theCaribbean De Motta et al. 1986! and Pacific Lewis, 1986! serve toillustrate the severity of the problem. Ciguatera was reported to bethe most corrmrron seafood-borne illness in the United States between 197Sand 1979 MMWR, 1980!, with Hawaii and Dade County, Florida, accountingfor the majority of documented cases during this period. It has beenestimated that the annual incidence of ciguatera in the Miami, Florida,area alone may be as high as five cases per ten thousand population Lawrence et al, 1980!.
There is currently no reliable and easily applied test fordetecting ciguatoxic fish. Protective measures are based primarily onresource management procedures, e.g., prohibition of fishing in watersbelieved to harbor the progenitors of ciguatoxin. The continuingoutbreaks of ciguatera in the United States demonstrate the ineffec-tiveness of this approach. The provision of a test to prevent toxicfish from reaching the marketplace would do much to reduce the incidenceof ciguatera and to minimize negative consumer perceptions about thes af ety of seaf ood.
The objective of this study is to determine if consumer avoidancedue to the threat of ciguatera poisoning had resulted in a significanteconomic cost to producers at the ex-vessel grouper and snapper marketsin Hawaii and on the east coast of Florida. Avoidance costs in the con-text of this paper are the costs to producers that accrue due to con-sumer avoidance of ciguatoxic finfish. We chose the snapper/grouperfisheries of eastern Florida and Hawaii for analysis. However, themethodology to determine these costs may be used to estimate the effectsof consumer avoidance at the ex-vessel market for any species of finfishor shellfish due to adverse health effects.
567

Shulstad and Stoevener {1978! and Schwartz and Strand �981! pre-sented methods to determine the impacts that public news items may havehad on demand for pheasant hunting and shellfish, respectively, bymeasuring changes in the intensity and scope of information relative toactual levels of avoidance in the marketplace. In our analyses, we wereconcerned only with the timing of the release of information, not itsintensity and scope. The basic hypothesis tested in this study was:when the public fs aware of a risk to fts health from eating grouper orsnapper which may contain ciguatoxin, it will avoid consuming these fishat prices which prevailed when the public was unaware of the risk.
We begin with a discuss1on of risk profiles, biased risk percep-tion, and avoidance costs. While rfsk is not directly used in esti-mat1ng avoidance costs ft is the essential concept that determines themagnitude of these costs. This section is followed by the model estima-tion, including methodology and interpretation of the results, which fnturn is followed by our summary and conclus1ons.
RISK PROFILES
Risk is a mathematically derived concept that uses probabilities.In the example of tossing a coin, the total probability is 1.0 and theprobability of e1ther heads or tails is 0.5. With these probabilities,we can quant1fy the coin toss and relate ft to economic choice by deter-mining expected gain or loss from the toss. If we assigned a prize of$100 for correctly guessing the coin toss, we can derive an expectedga1n of $50 �00 x 0.5! for each toss of the coin.
Let us introduce the human element to our game. Suppose the lot-tery master asked for the highest amount of money that each person inthe audience would be willing to wager on the outcome of one toss to winthe grand prize of $100. Let us further assume that secret bids aretaken and that only the highest bidder will be able to play the game.It would be folly to bid over $50 for an infinite number of tosses, butin the case of a single toss our game will reveal to us three d1fferentrisk profiles. Those who bfd under $50 are cons1dered to be risk aver-ters. The risk averse person will never bid more than his expsctepegain. In fact, the risk averter might be w1lling to pay up to $50 notto play the game. This would allow him to transfer the risk, the basisfor insurance. Alternatively, those who bid over $50 are consideredrisk takers. These individuals will assume risk rather than pass it on.
$These 1ndivfduals nei7fier assume nor transfer risk.
The r1sk prof11e as discussed above is influenced by individualchoice and may be derived from one's utility function. An indiv1dualmay be both a risk taker when smoking ci~qarettes and risk averter whenbuck 1 i ng up hi s seat belt or vi ce-versa. ~
568

BIASED RISK PERCEPTION
The perception of health risk and true health risk may varydepending upon toxicity of the transmitting agent, epidemiological dataand projections, and media exposure �nformation!. It was once thoughtthat large populations would tend on the average to be risk neutral inregard to their perceptions of health risk, i.e., the mean risk profileof large population would tend to view the expected value of the gainfrom avoiding disease as a maximizing level of utility of their health.
Recent psychological studies on biased perceptions of risk, such asthat of Lichtenstein et al. �978!, indicate that individuals tend tooverestimate risks of reLatively infrequent events, e.g., death frombotulism, and underest1mate risks of more frequent events, e.g., deathfram heart disease. Also, ind~viduals have a tendency to overestimatecertain risks characterized by wide media exposure, memorability, oruniqueness of various events.
Tversky and Kahneman �981! conducted a study on preference rever-sal based on paired lotteries with unique expected values. They foundthat partic1pants in the study when given a choice would prefer not togamble on probable losses and accept sure gains even though the ga1nswere quite ~ess than the expected value of the lotter1es. This studyrevealed that even though erfect information is ava11able, the wordingof the information may ef e c oice.
The theory of cognitive dissonance as advanced by Akerlof andDickens �982! may be the most important of the several theories con-cerning risk perception and economic consequences. It is based on theconcepts that individuals not only have preferences with respect to thestates of the world, but also have preferences regarding the specificbeliefs they hold, even if these beliefs contradict ava11able infor-mat1on. Individuals, after making a decision systematically, heldstronger beliefs than those who were on the verge of making a choiceeven when there has been no new 1nformation. Akerlof and Dickens �982!cite examples of benzene workers who denied they were working withdangerous chemicals and nuclear plant workers who were given badges butfailed to wear them to measure radiation exposure. Cognit1ve disso-nance, in part, explains why individuals' revealed preference in themarket may not reflect true health risk and avoidance costs may includea risk aversion premium depending upon individual beliefs, regardless ofthe information available to them.
A problem in calculating a risk aversion premiu~ for the threat ofciguatera poisoning is that the health risk associated with consumingsnapper and grouper is not known. For example, it is assumed that forCanadians, only one case of ciguatera poisoning in twenty-five isreported Hanschild and Bryan, 1980! and by assumption, only one case inten during 1974 to 1976 was reported to the Dade county Miami!Department of Public Health Lawrence et al., 1980!. Me cannot expect
569

the consuming public to make informed dec1sions regarding their personalsafety if true health risk is not known. Therefore, if we define a riskaversion premium as the difference between the cost of a health risk andavoidance cost, and health risk is underestimated, we may discover thatthe consuming public in aggregate has reacted in a risk neutral or evenrisk-tak1ng manner vis-a-vis true health r1sk. Underestimation ofhealth risk could thus have serious public health consequences.Alternatively, if health r1sk is overest1mated, consumers may react in amore risk-averse manner which may have a severe economic impact on thefishing industry. Unfortunately, it is not possible to separate outthat port1on of the risk aversion premium that is caused by biased riskpercepti on.
Economic theory tells us that the consumer will max1mize his uti-lity subject to his income and the prices of goods he desires. Weassume that the consumer is act1ng in a rational manner v1s-a-v1s theseparameters. When an element of health risk is 1ntroduced, the con-sumer's utility for a good may decrease if not d1minish to zero. If hisr1sk perception is b1ased, this may cause the consumer to act irra-tionally from the v1ewpoint of society even though he as an individualmay believe he is maxim1zing his utility. This is espec1ally true inlight of the theory of cognitive dissonance where the consumer mayderive satisfaction from not consuming.
AVOIDANCE COSTS
Swartz and Strand �981! showed that avoidance costs vary withintensity of information. While this may be true, we recognize also thecontributions of biased risk perception and cognitive dissonance to themagnitude of these costs. If we assume the general public to be riskaverse in relation to their health, avoidance costs w111 certainly belarger than if they were risk neutral and such costs may be morei nfl u en ced by i nf ormati on.
A classic example of avoidance costs associated with health risk isthe recent pharmaceutical capsule scare. The actual risk of poisoningwas quite small yet an entire industry was forced to alter its productform and packaging requirements. In fact, the entire food and phar-maceutical industries spent large sums of money to reduce avoidancecosts due to biased risk perception. A further example of biased riskperception arose in Puerto Rico in 1981 when amberjack and barracudawere banned from sale due to several documented cases of ciguaterapoisoning attributable to these species San Juan Star Magazine, 1981!.A poll of restaurateurs revealed that snapper and grouper salesdecreased approximately 5� even though these species were not impli-cated in poisonings and consumers were well informed of this fact.
570

MODELS TO DETERMINE AVOIDANCE COSTS
1. The Sna er and Grou er Ex-Vessel Markets of Eastern Florida andawai
Several species of snapper and grouper are landed with regularityon the east coast of Florida from Miami in the south to Jacksonville inthe north. These fish are generally channeled through coastal dealersto wholesalers or retailers very quickly in either a fresh whole iced orfresh fillet basis Prochaska and Keithly, 1984!. In the absence ofauct1on markets, prices generally are negotiated between buyer andseller ex-ante through forward contracting. A substantial portion ofthe snapper catch is marketed to the Midwest and Northeast wh1le grouperis, for the most part, consumed on the East Coast and is likely toappear on the menus of popular restaurants in the coastal reg1on.
In Hawaii, all snapper and grouper are consumed very close to theirsource. While bilateral exchange w1th negotiated pricing similar toFlor1da takes place in the Hawaiian Islands, the bottom fish marketwhich includes snapper and grouper operates around an auction which isthe basis for price determination Pooley, 1978!. Snapper has becomeeconomically important especially for the restaurant trade and for con-sumption during holiday periods. Alternatively, grouper 1s viewed to beof lesser quality and economically inferior to snapper. Therefore, themajority of grouper is consumed at home.
2 ~
Avoidance costs in these ex-vessel markets were estimated byobserv1ng demand shifts in the periods when the public was informed ofarticles of ciguatera poisoning incidents. Articles from the M1amiHerald and the Miami News for the years 1977 to 1985 Table 1!, and theHonolulu-Advertiser and Honolulu Star Bulletin for the years 1977 to1984 Table 2!, were used as proxies for public awareness of ciguaterapoi sonings.
Inverse demand curves were est~mated using monthly data. Thesedemand curves included a binary dummy variable with a value of 1 for themonths when informat1on on ciguatera poisoning was publ1shed and with avalue of 0 for all other months. The dummy variable was lagged untilits estimated coeffic1ent was no longer significant. This technique issuggested by Johnston �984! in cases where the number of lagged periodsi s indeterminate.
The model specifications for the two markets differed in that apartial equilibrium adjustment model Wang, 1984! was used for the eastcoast of Flor1da while the tradit1onal equilibrium model Crutchfield,1983! was used for Hawaii. The partial equilibrium model is used whenprices do not adjust easily to changes in exogenous variables and arevery much influenced by prices in previous periods. Wh~le this model
571

lacks simultaneity, the traditional model assumes that prices and quan-tities are instantly equilibrated. However, both models reflect thevery different pricing structures of the two geographic areas selectedfor this study. Since price dependent models were used, by definitionit was assumed that quantities were predetermined or fixed during eachperiod. The estimation of inverse demand curves at the ex-vesse1 levelis not unusual Wang, 1984, and Crutchfield, 1983!. It was also shownin a recent article by Squires �986!, that product supply curves forfishery producers tend to be extremely inelastic in the short run.
The equations were estimated using AR1, a maximum likelihood itera-tive technique Beach and MacKfnnon, 1978!. This technique was usedbecause ordinary least squares regression yielded first order serialcorrelation of the error term which produced biased estfmators.Furthermore, the ordinary least squares technique will yield incon-sistent estimators for an equation with a lagged dependent variable andautocorrelated disturbances Johnston, 1984!.
The models addressed the following hypotheses:
�! Consumers significantly avoid eating snapper or grouperat prevailig prices when these species are fmplicated aspoisoning agents.
�! Consumers sfgnificantly avoid eating snapper or grouperat prevai ling prices when these species are not impli-cated as the poisoning agent, but mentfoned as possibletransmitters of the toxin.
�! Consumers significantly avoid eating snapper or grouperat prevailing prices when these species are not impli-cated as the poisoning agent and are not mentioned aspossible transmitters of the toxin.
A sub-hypothesis for each of the above was also addressed asf ol 1 ows:
There is a significant and measurable lag effectassociated with this avoidance.
Table 1 gives the dates of newspaper articles for Florida and thespecies implicated or mentioned. Seven of the sixteen newspapera rt i cl es i dent i f i ed grou pe r as the speci es imp 1 i cat ed i n poi soni ngs,while only three identified snapper. Other implicated species includedb a rracuda and ambe r jack.
Table 2 provides the dates for Hawaii and the species implicated.Note that grouper was not implicated nor specifically mentioned in thesenewspaper articles and snapper was implicated only one time.
572

l. Articles reporting ciguatera involvement on the east coast ofFlorida. >
Table
Month/Year S ecies Im licated Sna er or Grou er Mentioned
GrouperGrouper
Grouper
Grouper
Grouper
Grouper
1 Miami Herald and Miami News, 1977-1985.
Table 2. Articles reporting ciguatera involvement in Hawaii.1
Sna er or Grou er MentionedS ecies Im licatedMonth/Year
NA9/78
NA
NANA
10/7811/783/79
NA4/79
NANA
NA
NA
NA
NA
NA
NA
11/796/809/8012/809/8110/839/8412/84
1 Honolulu Star Bulletin and Honolulu Advertiser, 1977-1984.
573
11/7712/772/785/786/7911/791/805/807/803/825/8210/844/856/859/85
GrouperNon-specificAmberjackGrouperSnapperNon-specificSnappe~Non-specificGrouperBarracuda
GrouperGrouperSnapper, GrouperGrouperBarracuda
Non-specific smallreef fish!
Marquesian sardineMarquesian sar dineJack, Goatfish, Mullet
SnapperNon-specific reef
fish!Non-specificNon-specificBonito, non-specificGoatfishwrasseNon-specificSurgeon fishNon-specific reef
fish!
SnapperSnapper,Snapper,SnapperNASnapper,GrouperSnapper,SnapperSnapper,SnapperSnapperNA
SnapperSnapper,

According to a national survey of fish consumption conducted onbehalf of the National Marine Fisheries Service in 1980-81, 60 percentof grouper was eaten away from home compared to 26 percent of snapper.This trend appears to reflect consumption patterns for fish landed inFlorida. However, the trend is reversed in Hawaii where snapper is thefish of choice in restaurants Pooley, 1978!. Due to these differentconsumption patterns our measures of income are necessarily different.These characteristics are reflected in our models.
3. East Coast Florida Model
The following are functional form equations with expected signsused to estimate avoidance costs in the east coast of Florida. Table 3indicates the variable specifications used in both models.
I! GPt = - L Stj -SN St, + t, t 1!, t, -DGt, ... -DG t n!
2! GPt = f -GLBSt, -SNPLBSt, +Yt, KP t ]!, +St, -DDGt, ... -DDG t-n!
3! SPt = f -SLBSt, -GRPLBSt, +RYt, +SP t ]!, +St, -DSt, ... -DS t n!
1! GP~ -5.94 - 0.22 GLB! - 0.13 SNPLBS + 1.06Y -1.03! -1.84! -4.84!* �.55!*
+0.45 gPt 1 +2 ~ 00 S - 3 ~ 06 DG - 0. 76 DGt 1�.40! �.55!* �.76!* -0.85!
F = 74.36*�,99!
R2 = 0.84 h= 0.21
RHO after 4 iterations = 0.12
2! GP= -7.65 - 0.26 G!BS - 0.11 SNPLSS + 1.02 Y � -1. 31! -2.16! -3. 95! * +4. 34!*
- 2.09 DDG -1.93!*
- 1.99 DGGt 1 -1.82!
+0.51 GPt 1+1.70 S�.22!* �.20!*
-0.22 DGGt 2�.19!
= 65.40*R2 0 85 h=o ~ 22F
8,98!
RHO after 4 iterations = -0.13
574
4! SPt f -SLBSt, -GRPLBSt, +RYt, +SP t 1!, +St, -DDSt, ~ .. -DDS t n!
3.a. Estimated Equations~~

Table 3. Variable specif1cations ~
Variable
GPt Price of grouper in cents per pound in per1od t.
Price of snapper in cents per pound in period t.SPt
G18si Landings of grouper in thousands of pounds inperiod t.
Landings of snapper in thousands of pounds inperiod t.
S LBSt
S NPLB St Total landings of snapper in thousands of pounds inFlorida in period t.
GRPLBSt Total landings of grouper in thousands of pounds inFlorida in period t.
Yt Personal income spent in restaurants in thousandsof dollars in period t.
RYt Personal income spent f' or fish in retail outletsin thousands of dollars.
Dummy fear avoidancq costs in period tFor ECF~~, DG~I when grouper mentioned, else=0For Hawa1i, DG I for ciguatera article, else=0
0GGt Dummy for avoidance costs in period tFor ECF, DBG 1 when grouper 1ndicated, else=0
DSt Dummy for avoidance costs 1n period tFor ECF, DS I when snapper mentioned, else=0For Hawaii, DG I for ciguatera article, else=0
DSSt Dummy for avoidance costs in period tFor ECF, DSS=I when snapper mentioned, elso=0
st Seasonal dumnIy 1n period t,For ECF, S=l for February to June, else=0For Hawaii, S=l for December, else=0
Z~ East Coast of Florida
575
I~ All income and price variables were deflated using the Consumer PriceIndex with 1967=0

3! SP= 14.91 �- 0.91 SI,BS - 0.05 GRPLBS + 2.89 Rg�. 14! -3. 64! -2. 34! * � ~ 18!
+ 0.70 SPt 1 + 1.04 S - .005 DS 9. 53! �.17! -.004!
R2 = 088 = 112.58F
�,100!h= -0.16
RHO af ter 5 i terat i ons = 0. 27
4! SP 14.8g - 0.90 SLCIS - 0.05 GRPLBS + 2.85 RY 3. 12! -3. 63! -2. 37! * �.21! *
+ 0.70 SPt 1 + 1.05 S - 1.14 DSS 9.62! * �.19! -0.47!
~R = 0.88 F
�,100!i 112.87 h= -0.16
RHO after 4 iterations -0.27
3.b. Inter retation of the Estimated E uations
576
All equations showed a high level of explanatory power of theexogenous variables on princes %2!, a statistically significant rela-tionship F!, and an absence of serial correlation h!. All signs areconsistent with economic theory. All variables are significant with theexceptions of the seasonality variables in Equations 3 and 4 and thefinal avoidance variables. All variables with the exception of thedummy variables represent the change fn price caused by a one unitchange fn an external variable, e.g., in Equation 1, a one thousandpound increase in quantity demanded of grouper will cause the price ofgrouper to decrease 0.22 cents. However, the dummy variables representthe absolute change in price caused by seasonality or consumeravoidance. Table 4 shows the dollar amounts associated with consumeravoidance of grouper on the east coast of Florida. These were calcu-lated by multiplying the estimated coefficient of the avoidance dummy byquantity demanded in the periods when newspaper articles appeared. Theaverage decreyse in price when grouper was owly mentioned was approxima-tely 10 cents~~ for the months that the newspaper articles appearedwhile average prices decreased 7 cents for months when the species wasimplicated in a poisoning, followed by approximately 7 cents decrease inthe first lagged month. Snapper, however, showed no significantdecrease fn price during periods of public awareness.

4. Avoidance costs for grouper producers on the east coast ofFl orida {in 1986 dollars!
Table
Nonth/Year Grou er Nentioned Grou er Im licated Total Revenue
2432
356050874615
7447
65565702
79838793
50452869
7706
6873
3997166915535884452942354528
3840
fnTabl e 1986
Total RevenueNonth/Year
577
11/7712/772/785/786/7811/791/805/807/808/803/825/826/8210/8411/844/855/856/857/859/85
9/7810/7811/7812/783/794/795/7911/7912/796/807/809/8010/8012/801/819/8110/8110/8311/839/8410/8412/84
5. Avoidance costs for grouper producers in Hawaiidollars!
Other S ecies Nentioned or Im licated
857202032642 18818062646
745
338698
536
733318
198769441
295
885121
1209
6411266
808
39007
5859662566
132817113811
68737
105344103642
82738
52026
102150112620
595233814834407
149628
9772292252
10122862520
1342911627
186571969628299
15129670952946286
8403
66044986
178812043
3969462179721897
10884
1005611395
12674

4. Hawaiian Model
Functional form equations with expected signs used to estimateavoidance costs in Hawaii are:
1! ln GP = ln -GLBSt, +RYt, +St,-DGt,..........-DG t n!!
2! ln SP = ln -SLBSt +Yt,eSt -DSt " ''''''' " t-n
4.a. Estimated e uations
1! GP ~ 1.69-0.13 GLBS + 0.42 RY + 0.04S - 0.06 DG
�.15! -5.80!* �.38!* �.81! -1.38!*
-0.10 DBt 1 + .05 DGt 2
�.19!* �.11!
R2 = 0.67 F� 89! = 30.74 d = 1.92
R HO after 2 iterations = 0. 58
2! SP ~ 3 76 - 0 28 SLBS + 1 G8 Y + 0.10 S - 0 01 DS
-0.64! -7.03! * �,89!* �.02! * -0. 37!
R2 ~ 0.63 F = 39.18 d = 1.96�,91!
RHO after 2 iterations = 0.43
4.b. Inte retation of the Estimated E uation
>78
Both equations showed an acceptable level of explanatory power ofthe exogenous variables on price F~!, a significant relationship F!,and an absence of serial correlation d!. Nth the exception of thedummy variables, the estimated coefficients for the double log formequation are interpreted as percentage changes in price caused by a onepercent increase in an explanatory variable. The estimated coefficientsof the dummy variables show us percentage changes i n price caused byseasonal variation or public awareness of ciguatera poisonings, e.g., anestimated coefficient of -0.10 translates to a 10 percent decrease inprice on average. Avoidance costs for grouper associated with ciguateranews releases are found in Table 5. These were calculated by estimatingwhat prices would have been without decreases due to consumer avoidance.For example, to calculate a 10 percent decrease, prices must have beenapproximately 11.1'l higher. The following equation was used to calcu-late a 1� decrease in price: GP/0.9 - GP = x, where x = price dif-ferential. These price differentials were then multiplied by quantity

demanded in each period. Unlike the Florida case, grouper was not men-tioned or implicated during the eight year period, yet significantavoidance costs for producers of grouper occurred in the month thearticle appeared and the following month. This result is not surprisingconsidering the aforementioned costs incurred by the pharmaceutica1industry of the United States and the fishing industry of Puerto Ricofor products not directly implicated in poisoning events. Decreases insnapper price were insignificant for months when the public was aware ofpoi soning events.
SUMMARY AND CONCLUSIONS
We conclude from our study that significant revenue losses asso-ciated with ciguatera do exist for grouper producers in Hawaii and onthe east coast of Florida. During periods of public awareness consumersavoided purchasing grouper at prevailing prices, thus causing a decreasein the value of the product. While the results are conclusive, thereader should be aware that regression analysis yields only approxi-mations. The true coefficient of our parameter may vary within therange of our confidence levels depending upon the standard error inrelation to the estimated coefficient wi th the estimated coe f f i ci entbeing an average or mean value.
In regard to avoidance costs, we show in Figure I that producerwilling-ness to pay to prevent avoidance costs can be estimated bymeasuring the decrease in producer rents rectangle A-8-C-0! resulting
.from a downward shift of the demand curve. However, only the triangleA-B-D represents net welfare loss to society social costs! while thetriangle A-C-D represents the transfer of producer rents to consumersurplus. These avoidance costs could be drastically reduced ifciguatoxic fish were kept from the marketplace. This could beaccomplished through an improved inspection system employing a re1iabletest for toxic fish.
If we were to use our results in a cost-benefit analysis, otherfactors beside welfare loss due to price changes may be included associal costs. For instance, days lost due to illness and medical costsmay be viewed as social losses. In a cost benefit approach, the elimi-nation of social costs are viewed as a benefit to society and thefunding of projects are contingent upon the magnitude of these costs.
To truly assess the risk profile of the general populationregarding the threat of ciguatera poisoning, we first need reliable epi-demiological information regarding the incidence of ciguatera due toconsumption of contaminated species of finfish. We believe that thisinformation is vital to both the physical well-being of the consumer andthe economic well-being of the affected segments of the fishingindustry. We advise caution when making estimates of the incidence rate.of ciguatera poisoning since overestimates may cause consumers to loseutility for the suspected species involved and may cause producers toexperience diminished profitability.
5'79

Fiyee 1. 5» lm ot greece scyhs from a derem ia danced.
ACKNOWLEDGNENTS
We wish to thank Jim Waters, Jeff Cunningham, Stanley Wang,Sam Pooley, Joyce Nettleton, John Ward, John Vondruska, and Dale Squiresfor their help in constructing the models and their timely reviews ofthe draft manuscript.
FOOTNOTES
1i For a more thorough discussion see Von Neumann and Norgenstern�947! .
~i An asterisk indicates significance at the 0.10 level one-tailt-test!. The h-statistic is used to test for serial correlation inthe presence of an exogenous lagged dependent variable Johnston,1984 and Wang, 1984!.
>i All price changes are expressed in 1986 cents.
580

LITERATURE CITED
Akerlot, George A. and William T. Dickens. 1982. The economic con-sequences of cognftive dissonance. American Economic Review7 2: 307-319.
Bagnis, R. 1968. Clinical aspects of ciguatera fish poisoning! fnFresh Polynesia. Hawaiian Medical Journal 28:25-28.
Beach, Charles M. and James G. MacKi nnon. "A Maximum LikelihoodProcedure for Regression with Autocorrelated Errors." Econometrica.46�978!. pp. 51-58.
Crutchffeld, Steven R. 1983. Estimation of foreign willingness to payUnited States fishery resources: Japanese Demand for Alaska Pollock.Land Economi cs 59:16-23.
Halstead, B.W. 1978. Poisonous and Venomous Marine Animals of theWorld. Darwin Press, rince on... pp.
Hauschild, A.H. and F.L. Bryan. J. Food Protect. 43,435 �980!.
Henderson, J.N. and R.E. guandt. 1980. Nf croeconomic Theor aMatheoatical ~Aroach, McGraw-M111. Ioc., w or . pp
Johnston, J. 1984. Econometric Methods. 3rd Ed. McGraw-Hill BookCompany. New York. p.
Lawrence, Dale N., Nyriane B. Enriquez, Robert M. Lumish, and AntonioMaceo. 1980. Ciguatera Fish Poisoning in Niami. J. Amer. Med.Assoc., 244�!:254-258.
Lewis, Nancy D. 1986. Epidemiology and Impact of Ci guatera in thePacific: A Review. Mar. Fish. Rev., 48�!:6-13.
Li chtenstein, Sarah, Paul Slovfc, Baruch Fischhoff, Mark Layman, andBarbara Combs. 1978. Judged Frequency of Lethal Events. Journalof Experimental Psychology: Human Learning and Nemory. 4:551-578.
Morbidity and Mortality Weekly Report, Centers for Disease Control.1980. 29:610-611.
de Motta, G. Escalona, J.F. Felfeu, and A. Izquierdo. 1986.Identification and Epidemiological Analysis of Ciguatera Cases inPuerto Rico. Mar. Ffsh. Rev., 48�4-18.
Pooley, Samuel G. 1978. Demand consideration in fisheries management-Hawaii's market for bottom fish. In: T i 1 S d G Jeffrey Polovina and Stephen Ralston,and London. pp. 609-633.
Prochaska, Fred J. and Walter R. Keithly. 1984. Region, market outletand product form distribution of Gulf of Mexico landed grouper.In: Proceedin s of the Ninth Annual Tro ical and Subtro icalFisheries Techno o ica Con erence o t e mericas.
581
Ragelis, E. 1984. Ciguatera seafood poisoning overview. In: SeafoodToxins E. Bagelis. ed.!. American Chemical Society, Was1i~ngtan,Kl.. pp. 25-36.
Schulstad, Robert N. and Herber H. Stoevener. 1978. The effects of mer-cury contamination in pheasants on the value of pheasant hunting inOregon." Land Economics. 34:39-49.
Schwartz, David G. and Ivan E. Strand. 1981. Avoidance costs associatedwith imperfect information: The case of Kepone. Land Economics57:139-150.
Squires, Dale. 1981. Public regulation and the structure of productionin multiproduct industries: an application to the New England ottertrawl industry. Rand Journal of Economics 18�!:232-247.
Todd, E.C.D. Ciguatera poisoning in Canada. 1985. In: ToxicDinof1 a ellates D. Anderson, A. White and D. Baden, eees.. El savior
u s ng o., New York. pp. 505-519.
Tversky, Amos and Daniel Kahneman. 1981. The Framing of Decisions andthe Psychology of Choice. Science 22:453-455.
Yon Newmann, J. and 0. Morgenstern. 1947.Behavior. 2nd Ed. Princeton University
Wang, D.H. 1984. Partial adjustment price models: a study of the impactof fish imports on ex-vessel prices on New England groundfish. In:Proceedin s of the International Institute of Fisheries Economicsand rade. C r stc urc, New ea and.
582

ENHANCED ISOLATION OF PLESIOMONAS SHIGELLOIDES USINGAN ENRICHMENT TECHNIQUE AND FACTORS INFLUENCING ITS RECOVERY FROM RAW
OYSTERS
Susan M. Freund, John A. Koburger, W. Steven Otwelland Cheng-i Wei
Food Science and Human Nutrition DepartmentUniversity of FloridaGainesville, FL 32611
INTRODUCTION
bacterial rod isolated from many aquatic sites worldwide �,2,7!. Itis a suspected opportunistic pathogen causing the classic symptoms ofgastroenteritis and more rarely meningitis or septicemia in infants
with outbreaks of gastrointestinal illness. Twenty-nine people becameill in a 6 day period after consuming raw oysters from ApalachicolaBay. Illness occurred approximately 24-30 hours after ingestion andsymptoms lasted a median of 5 days 8!.
pathogen, found most commonly in fresh surface waters �7! and it hasalso been isolated from a variety of animals including many types offish and crustaceans as well as wild and domestic mammals and birds�,9!. Seasonal variation has been reported with Plesiomonas being
Inositol brilliant green bile salts agar IBB! has beenrecommended for Aeromonas and Plesiomonas �6!. Miller and Koburger 9! recommended the use of both IBB and plesiomonas agar for
samples was highest using IBB, but in laboratory controlled studiesthey found plesiomonas agar to be better at isolating injuredorganisms.
Various enrichment broths have been used to enhance the recoveryof Plesiomonas. Gram negative GN! broth in combination with someenteric agars has been tried �,13!, but these researchers indicatedthat direct plating was still more effective. Von Gravenitz andBucher �0! suggested enrichment in alkaline peptone water APW! wassuperior to direct plating at low coliform to Flesiomonas ratios.Millership and Chattophady �2! also reported that APW incubationbefore plating on IBB improved isolation for Aeromonas when its ratioto coliforms was I;10 or less, but in the case of Plesiomonas, noisolates could be recovered using APW. Direct plating in thisinstance was more effective. Tetrathionate broth has been shown to behelpful for the recovery of Plesiomonas ~ Comparison of tetrathionatebroth TT! with and without the addi.tion of iodine showed that TTwithout iodine increased Plesiomonas recovery on Salmonella-Shigellaagar, but highest isolation of this organism was achieved after direct
583

plating onto MacConkey s agar �9!. A series of incubation times,ranging from 6-24 hours, and temperatures ranging from 24-45 C have0
been tried using these broths and plating media. The general trendseems to be toward the use of higher incubation temperatures in thatthey reduce the problem of competing bacteria growing in the variousmedia �,19! ~
In this study, five enrichment media were compared to the directplating method described by Miller and Koburger 9! for the recoveryof Plesiomonas from environmental water samples. The development of amore sensitive isolation procedure could enhance the detection ofPlesiomonas in samples, such as oysters, where it may have previouslybeen unnoticed. This would lead to a better understanding of thisorganism s ecology as well as its survivability and resusitation inboth environmental and clinical situations.
MATERIALS AND METHODS
Water samples were collected from five freshwater sites inGainesville, Florida. The sites included Lake Wauberg, Lake Alice,Newnan s Lake, Hogtown Creek, and a small pond. The samples werecollected in sterile whirl-pak bags and transported immediately to thelaboratory. Analysis was performed on the day of collection. Thisprocedure was repeated on 5 different days between January and June of1986.
Enrichment Broths
The five enrichment broths included: gram negative broth GN!,alkaline peptone water APW, 18!, tetrathionate broth without theaddition of iodine TT!, a plesiomonas enrichment broth PLE! and amodified plesiomonas enrichment broth mod PLE!. The PLE is comprisedof ammonium nitrate 0.1%, inositol 0.2X, yeast extract 0 ' 05X,potassium phosphate 0.5X, magnesium sulfate 0.02X and bile salts 0.1X.The modified PLE is the same as PLE, but contains less inositol�-1X! ~ The pH is adjusted to 7 ' 6 for both PLE and mod PLE.
The two plating media used were inositol brilliant green bilesalts agar IBB, 17! and plesiomonas agar PL, 9! ~
Enrichment Procedure
Ten ml of each water sample was inoculated in duplicate into 90ml portions of each of the five test broths. After mixing, one ofthe duplicate broth samples was incubated at 35 C and the other at0
40 C for 18 hours. The enriched samples were each streaked onto both0
584

PL agar and IBB agar plates and incubated at 35 C for 24-48 hours.0
Presumptive counts of typical Plesiomonas colonies were done and thetotal number of colonies counted. The rate of isolation ofPlesiomonas was expressed as the ratio of total number of Plesiomonascolonies to the total number of bacterial colonies on the plates.
Direct Platin Procedure
The water samples were serially diluted using Butterfield sphosphate buffer �8! before being surface inocuLated directly ontoIBB and PL agars. The plates were incubated at 35 C for 24-48 hours0
and presumptive Plesiomonas colonies were counted.
Confirmation
Presumptive Plesiomonas isolates obtained from broth enrichmentand direct plating were confirmed. Plesiomonas is alkaline over acidon Triple Sugar Iron agar slants. It i.s able to ferment inositolwithout the production of gas and cannot hydrolyze gelatin in InositolGelatin Deeps 9,17!. It is oxidase positive.
The enrichment method determined to be superior from theenvironmental water study was applied to both commerciaLLy packagedraw oyster meats as well as fresh unshucked raw oysters. The shelloysters were purchased from various retail stores and were shucked inthe laboratory in as sterile a manner as possible. The commerciallyshucked oysters are packaged in plastic containers raw and withoutfurther processing.
Enrichment Broths
The oyster meats were diluted with Butterfield s phosphate bufferin a 1:1 ratio and blended for 3 minutes. Homogenates were thenfurther diluted and O.lml was surface inoculated onto PL and IBBagars. Also 10 ml aliquots were inoculated into 90 ml portions of thevarious test brothe and incubated for 18 hours at 40 C.
0
Pure Culture Studies
A series of tests using a pure culture inoculum of Plesiomonaswere aLso performed to determine the sensitivity of the method.Oyster samples were spiked with various levels of Plesiomonas cultureinocula. The Plesiomonas cultures were grown overnight in Brain Heart
The bacterium was added to oyster samples before and after blending.The spiked oyster samples were serially diluted and inoculated intetrathionate broth as described above.
585

Competing Bacteria
Bacteria found commonly on the solid plating media were isolatedand identified using an Oxi-Perm or an Enterotube determination.Equal volumes of pure Plesiomonas culture and the competing organisms,Klebsiella and Pseudomonas, were mixed in and plated directly as wellas inoculated into tetrathionate broth to determine the effects ofcompetition.
Statistical Anal sis
A 5 K 3 factorial design analysis of variance using the GeneralLinear Models Procedure in the Statistical Analysis System �5! wasapplied to compare the relative effectiveness of the broths in
between broths were determined by the Least Significant Difference LSD! t-test.
RESULTS AND DISCUSSION
Recoveries of Plesiomonas on IBB and PL agars from the watersamples for each of the five test broths are shown in Table 1. Thevalues range from 0.04Z to 69K of the total colonies beingPlesiomonas. Comparison of the five enrichment broths revealedtetrathionate to be significantly p<0.05! superior to all otherstested, either at the two incubation temperatures or on the twoisolation media. The only other broth that gave a significantlyhigher recovery rate was the alkaline peptone water APW! at 40 C onplesiomonas agar, but this value was still significantly p<0.05!lower than that of tetrathionate under the same conditions. Otherresearchers have noted some success using tetrathionate enrichment.As previously mentioned, VanDamme and Vandepitte {19! reported thattetrathionate broth without iodine was superior to tetrathionate withiodine as an enrichment step before plating on Salmonella-Shigella SS! agar, although they indicated that direct plating on MacConkey sagar achieved a higher isolation rate. Alkaline peptone water is alsocited in a number of references for Plesiomonas enrichment �,12!, butagain these workers recommended direct plating over enrichment.
It is interesting to note that generally IBB appeared to be abetter medium for the recovery of Plesiomonas when the numbers ofPlesiomonas in the samples were low. This was true with GN, APW, PLE,
was the case following tetrathionate enrichment, plesiomonas agar0proved more effective at isolating this organism following both 35 C
and 40 C enrichment. This observation may be attributed to the0
greater amount of bile salts in the IBB agar as well as the ability torecognise Plesiomonas colonies on PL agar. A higher concentration ofbile salts helps to reduce the level of competing bacteria and thismay allow a greater chance of recovering the Plesiomonas colonies thatmay be present 9!.
586

Table l. Evaluation of Enrichment Broth, Agar Plating Media,and Incubation Temperature on the Recovery of
from 25 Water Samples
35 40 C
Broth PL IBB PL IBB
1.20 0. 03 0.20
0.81 2. 04 14.52* 6.88
PLE 0.04 2.32 1 ~ 40 2.64
PLE mod 0 ' 20 0.00 0.17 1 ~ 76
21+12* 15.68* 68 ' 92* 53.964
Difference significant between brothe at 0.05 levelas determined by the LSD t-test
* Difference significantly higher than GN, PLE and mod1
PLE, but significantly lower than TT at 0 F 05 level.
587

The elevated incubation temperature of 40 C was superior overall0
in enhancing the recovery of Plesiomonas. The inhibition of some ofthe competing microorganisms such as Pseudomonas and some of theEnterobacteriaceae which are often found in food and water may havecontributed to this higher recovery rate �,7,9,10!. Miller andKoburger reported that of 40 Plesiomonas isolates tested, all wereable to grow at 40 C, but that only 25X grew at 45 C �1!. Forenvironmental samples, therefore, it is suggested to incubateenrichment cultures no higher than 40 C to avoid the risk of0
inhibiting some Plesiomonas ~
The advantage of using the tetrathionate enrichment technique toenhance the detection of Plesiomonas from environmental water samplesis well demonstrated in Table 2 ~ The value of enrichment is not asgreat for a eutrophic sample such as Sample 1 because by using directplating only, about 35X of the colonies are easily detected asPlesiomonas. However, in a sample such as Sample 5, where only 3X ofthe colonies are Plesiomonas as shown by the direct plating method,the benefits of this enrichment step become obvious; the recovery ratefor Plesiomonas was increased to 86X post-enrichment. The chances offinding a Plesiomonas colony when only 3X of the total colonies arePlesiomonas is low, but it can hardly be missed when it is present as86X of the colonies. It should also be noted that in 12X of thesamples tested, no Plesiomonas colonies could be detected by directplating and yet it was easily isolated following enrichment. It isunder such conditions, when the organism is present in low numbersthat the enrichment technique can be a significant aid in the study ofthe ecology of this microorganism.
A similar experiment using both freshly shucked and packagedoyster meats was conducted based on the results of the environmentalwater samples. In preliminary studies with packaged oyster meats,direct plating detected no Plesiomonas positive samples, howeverfollowing enrichment in tetrathionate broth some of the samples werepositive. These results suggested that the enrichment method does workfor oyster samples, but recovery seemed to be affected by a number offactors. Initially, the high positive recoveries of Plesiomonasdetected with the water samples were not being achieved using oystersamples. Pure Plesiomonas cultures were spiked into the oystersamples and were plated directly and enriched. Table 3 shows theresults of one such experiment. In the low dilutions of oyster,Plesiomonas was not detected, but as the sample was diluted more,Plesiomonas colonies were easily detectable. This indicates thatPlesiomonas was present in the low dilutions, but was unable to bedetected because of the presence of a high number of competingbacteria that were visually evident on the plates. As these competingbacteria were diluted out the Plesiomonas colonies became moreapparent.
In order to better understand the effect of competing bacteriaon the growth of Plesiomonas, a number of bacteria growing on theseplates were isolated and identified. Table 4 lists the organismsrecovered. As would be expected there is Pseudomonas, Aeromonas,Vibrio and Enterobacter. Isolate I, Klebsiella was often recovered
588

Table 2. A Comparison of Direct Plating and TetrathionateEnrichment in the Recovery of Plesiomonas
Sam le X of total colonies!
+The values of the enrichment group are significantlyhigher p<0.05! than the direct plating group asdetermined by the LSD t-test.
Table 3 ~ Detection of Plesiomonas using DirectPlating when Different Amounts of Plesiomonasare Added to an Oyster Homogenate
1/5001/50
106 25* 87 87
10 56 39
10 17
*Values reported are X of total colonies foundto be Plesiomonas
Values are an average of three repetitionsperformed in duplicate
589
Direct plating
Enrichment*
Number of Plesiomonas
7
36.0 3.6 26.2 25.4 3 ' 2
76 ' 6 64.8 81.8 68.0 86.6
Dilution of 0 ster Homo enate
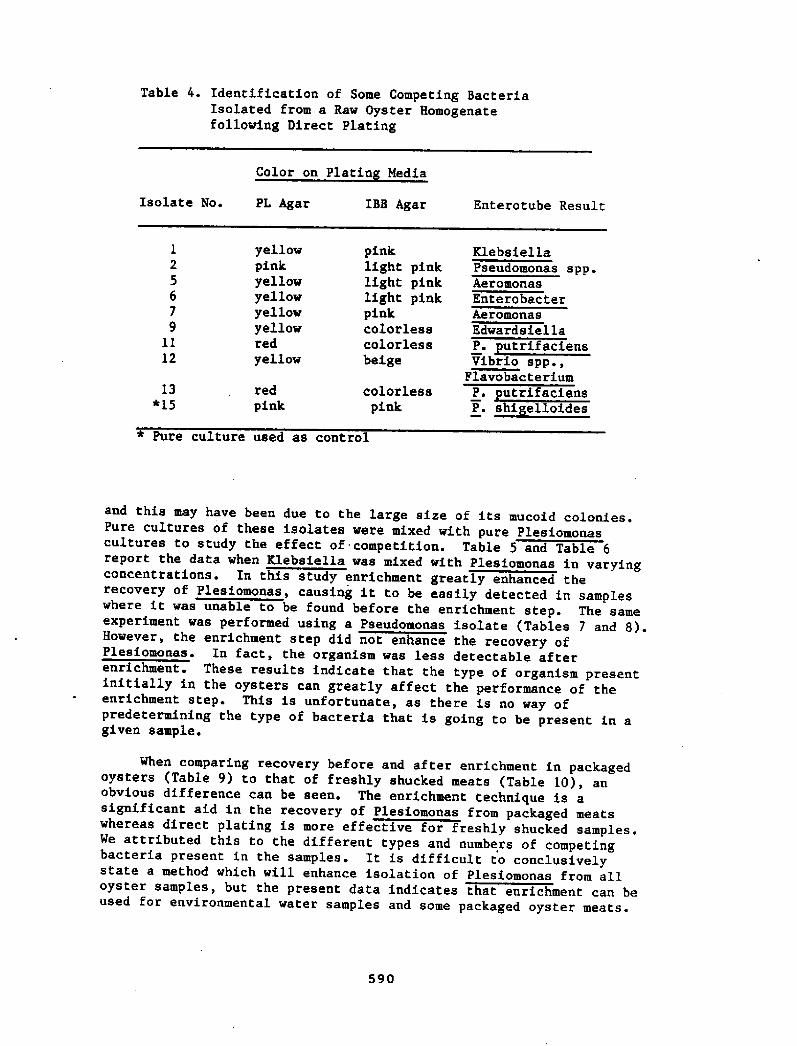
Table 4. Identification of Some Competing BacteriaIsolated from a Raw Oyster Homogenatefollowing Direct Plating
Color on Platin Media
Enterotube ResultIBB AgarIsolate No. PL Agar
Klebsiella
Pseudomonas spp.Aeromonas
EnterobacterAeromonasEdwardsiella
PE putrifaciensVibrio spp.,
Flavobacteriumcolorless
pinkred
pink13
*15 P ~
* Pure culture used as control
and this may have been due to the large size of its mucoid colonies.Pure cultures of these isolates were mixed with pure Plesiomonascultures to study the effect of competition. Table 5 and Table 6report the data when Klebsiella was mixed with Plesiomonas in varyingconcentrations. In this study enrichment greatly enhanced therecovery of Plesiomonas, causing it to be easily detected in sampleswhere it was unable to be found before the enrichment step. The sameexperiment was performed using a Pseudomonas isolate Tables 7 and 8!.However, the enrichment step did not enhance the recovery ofPlesiomonas. In fact, the organism was less detectable afterenrichment. These results indicate that the type of organism presentinitially in the oysters can greatly affect the performance of theenrichment step. This is unfortunate, as there is no way ofpredetermining the type of bacteria that is going to be present in agiven sample.
When comparing recovery before and after enrichment in packagedoysters Table 9! to that of freshly shucked meats Table 10!, anobvious difference can be seen. The enrichment technique is asignificant aid in the recovery of Plesiomonas from packaged meatswhereas direct plating is more effective for freshly shucked samples.We attributed this to the different types and numbers of competingbacteria present in the samples. It is difficult to conclusivelystate a method which will enhance isolation of Plesiomonas from alloyster samples, but the present data indicates that enrichment can beused for environmental water samples and some packaged oyster meats.
590
1
2 56 79
11
12
yellowpinkyellowyellowyellowyellowred
yellow
pinklight pinklight pinklight pinkpinkcolorlesscolorless
beige

Number of
PlesiomonasAdded ml
+, Plesiomonas detected; � , No Plesiomonas detected
Number of
Plesiomonas
Added ml
+, Plesiomonas detected; -, No Plesiomonas detected
591
10810610
10~5
1031021010
10710
10
10~5
10310210110
Table 5. Detection of Plesiomonas in thePlesiomonas-Klebsiella Mixturesfollowing Direct Plating
Number of Klebsiella Added/ml
10 10 10 10 10 10 10 10
+ + + +
+ + + +
+ + + +
+ + + +
+ + + +
+ . + + +
+ +
+ +
Table 6. Detection of Plesiomonas in thePlesiomonas-Klebsiella mixturesfollowing Tetrathionate Enrichment
Number of Klebsiella Added/ml
10 10 10 IO 10 IO 10 10
+ + + + + + +
+ + + + + + ++ + + + + '+ +
+ + + + + + +
+ + + + + + +
+ + + + + + +
+ + + + + + +
+ + + + + + +

Table 7. Detection of Plesiomonas in thePlesiomonas-Pseudomonas Mixturesfollowing Direct Plating
Number of Pseudomonas Added/mlNumber of
Plesiomonas
10 10 10 10 10 10 10 10Added ml
+ + +
+ + +
+ + +
+ + +
+ + +
+ + +
+ + +
+ + ++ +
+, Plesiomonas detected; -, No Plesiomonas detected
Table 8..The Detection of Plesiomonas in thePlesinmonas-Pseudomonas Mixtures
using Tetrathionate Enrichment
Number of Pseudomonas Added/mlNumber of
Plesiomonas
10 10 10 10 10 10 10 10Added ml
+ +
+ + + ++, Plesiomonas detected; � , No Plesiomonas detected
592
10710610
510~10310210
10
10'7
10610~10~10~10210
10
+ + + ++
+
+ + + +

Table 9. Effectiveness of Direct Plating versusEnrichment in Detecting Plesiomonas fromPackaged Oyster Meats
Sam le
+ + ++, Plesiomonas was detected; -, No Plesiomonas was detected
Table 10 ' Effectiveness of Direct Plating versusEnrichment in Detecting Plesiomonas fromFreshly Shelled Oyster Meat
Sample Direct Plating Enrichment
+, Plesiomonas was detected; � , No Plesiomonas was detected
593
1
2 3 5 6 78 9
1011
1213
14
1516
Presence of Plesiomonas Colonies
Direct Platin Enrichment
Presence of Plesiomonas colonies

REFERENCES
Arai, T. and N. Ikegima. 1980. A survey of
environments, domestic animals , pets and humans.J. Hyg., Camb. 84:203-211.
Cooper, R. G. and G. W. Brown. 1968. Plesiomonas
21:715-718.
2 ~
Davis, W. Ams II, J. H. Chretien, V. F. Garagusi andN. A. Goldstein. 1978 ' Snake-to-human transmission of
enteritis. Southern Ned. J. 71:474-476.
3 ~
Dudley, A. G., W. Mays and L. Sale. 1982. Plesiomonas
a case report. J. Ned. Assoc. Ga. 71:775-776 '
4.
Dupray, E. and M. Cormier. 1983. Optimal enrichment
from seafood. Appl. Environ. Microbiol. 45:1234-1235.
5.
Holmberg, S. D. and J. J. Farmer, III. 1984.Asromonas ~h dro hils and Plssiomonas
Rev. Infect. Dis. 6:633-639.
7.
Lich, ST 1983. Outbreak of shellfish associatedgastroenteritis, Bay County. Dept. of Health andRehabilitative Services, Tallahassee, FL.
8.
9. Miller, N. L. and Koburger, J. A. 1986. Evaluationinositol brilliant green bile salts and plesiomonas
from aquatic samples in a seasonal survey of theSuwannee river estuary. J. Food Prot. 49:274-278.
Miller, M. L. and Kobutger, J. A. 1986. Plesiomonas
pathogen. J. Food Prot' 48:449-457.
10.
Miller, M. L. and Koburger, J. A. 1986 ' Tolerance ofPlesiomonas shigelloides to pH, sodium chlorideand temperature. J. Food Prot. 49:877-879.
594
Koburger, J. A. and N. L. Miller. 1984. Plesiomonas
Proc. 9th Ann. Trop. Subtrop. Fish. Conf. Am. 337-342.

12. Millership, S. E. and B. Chattopadhyay. 1984. Methodsfor the isolation of Aeromonas ~hudro hila and
Camb. 92:145-152.
13. Pauckova, VS and A. Fukalova. 1968. Occurrence ofAeromonas hyydro hila and Plesiomonas
206:212-216.
14 ' Rutala. W. A., F. A. Sarubbi, Jr., C. S. Finch, J. N.MacCormack and G. ED Steinkraus. 1982. Oyster-associated outbreak of diarrhoeal disease possibly
SAS ~ Users guide: basic 1982 edition. SAS InstituteInc. Cary, North Carolina.
15.
16. Schubert, R. H. W. 1981. On the ecology of
Hyg., I. Abt. Orig. B. 172:528-533.
Schubert, R. H. W. Genus IV. Plesiomonas pp. 548-550.
Volume.I. Williams and Wilkins. Baltimore, Maryland.
17.
Speck, M. L. ed.!. 1984. Compendium of methods forthe microbiological examination of foods 2nd ed.American Public Health Association, Washington, D AC.
18.
19 ' Van9amme, 7. ~ R. and J. Vandepitte. 1980. Frequentisolations of Edwarsiella tarda and Plesiomonas
possible source of sporadic diarrhea in the tropics'Appl. Environ. Microbiol. 39:475-479.
20.
595
Von Graevenitz, A. and C. Bucherf. 1983. Evaluation ofdifferential and selective media for isolation ofAeromonas and Plesiomonas spp. from human faeces.J. Clin. Microbiol. 17:16-21.

THE EFFECT OF LACTIC ACID STARTER CULTURES ON FISH SPOILAGE BACTERIA
S. M. Rose, F. M. Bartlett and E. G. BlighDepartment of Food Science and Technology
Technical University of Nova ScotiaHalifax, Nova Scotia Canada B3J 2X4
INTRODUCTION
Development of an antispoilage or an inhibitory agent which willdelay deterioration of food would be of great importance from both aneconomic and public health standpoint. Lactic acid bacteria are knownfor their ability to repress bacterial growth, which is a major causeof food spoilage.
The use of lactic acid bacteria in food is not a new concept. Inthe dairy industry, cultures are cossaonly used to improve the shelflife of dairy products. Metabolic products of these bacteria, e.g.,lactic acid, propionic acid, diactyl and antibiotic-like substances!have a profound inhibitory effect on a variety of gram negative spoil-age bacteria. Developing a dominant microflora of Lactobacillus ~swould therefore be preferred due to its potentially inhibitory effecton spoilage bacteria.
Numerous studies have shown the beneficial effects of using lac-tic acid bacteria cultures for decreasing the spoilage organisms inboth beef and poultry. Reddy and Chen, �975! studied the effect of
changes in beef. Their data indicated a significant inhibitory effecton the growth of the gram-negative bacteria Pseudomonas,Achromobacter, and Proteus! when treated with a IOX lactic culture.Another study with beef examined the effect of the application of Iac-tobacilli and carbon dioxide on the growth of Microbacteriumthermos hactum on fresh beef Roth and Clark, 1975!. Results werepositive for the repression of the growth of the Microbacterium usinglactobacilli on the vacuum-packaged meat. The authors concluded thatthe inhibition was caused by a substance produced by' the lactobacilli.
Raccach and Baker �978!, studied the effect of two lactic acidbacteria Pediccocua acidiiectici and Lactotacillua ~lanterns! on theinhibition of Pseudomonas species which are the primary spoilage bac-teria of uncooked poultr'y meat. It was noted that Alteromonas
repressed by four log cycles when the mixed culture was used.
There are a number of mechanisms by which lactic acid bacteriaare able to repress the growth of other bacteria. The followingantagonistic properties were summarized by Andersson �986!:
1. Acid production and pH reduction2. Hydrogen peroxide production
596

3. Carbon dioxide production4. Nutrient depletion5. Decrease in reduction-oxidation potential6. Production of antibiotic like compounds
The purpose of this study was to evaluate the potential use oflactia acid bacteria L .pisntsrum! as an inhihitory agent od gramnegative spoilage bacteria of fresh codfish. Also, the extracellular
acidilactici were examined in order to assess their ability to inhibit
MATERIALS AND METHODS
greens-dried cultures og Laotohscillus glantarum 8014 andPediococcus acidilactici 8042 vere obtained from the American TypeCulture Collection. The bacteria were rehydrated in MRS broth Difco!and incubated at 30'C for 24-48 hrs. MRS agar slants and plates wereused to maintain the cutures vhich ware then stored at 6 C.
Pre aration of extracel u ar and intrace lu ar extracts
~sterna aad P acid.ilactici sera each gross ia i L arlynmayer flasks containing 400 mL of MRS broth media for 48 h at 25'C without shaking!. The growth medium vas centrifuged at 5,000 rpm for15 min at 5'C. The supernatant was decanted and filtered using aMillipore filter �.45 pm 'pore size!. This was the source of. theextracellular extract.
The pelleted cells were washed by resuspending in 100 mL of ster-ile saline solution �.85Z NaCI! and centrifuging �,000 rpm/15 min!.The supernatant vas discarded, and the cells were again washed withthe saline solution total of 3 washes!. After the final wash thecells were suspended in a minimum amount of saline » 5 mL! and put onice. The cells vere ruptured using a Biosonic III sonicator BronwillScientific, Rochester, N.Y.! at the maximum recommended setting forone minute. This was repeated a total of 6 times to ensure completebreakage of the cells. The ruptured cells were centrifuged at 10,000rpm for 30 min at 2'C. The supernatant was filtered and refriger-ated. This was the intracellular extract.
The pH of the extracellular and intracellular extracts wereadjusted to a value of » 6.3 with 1N NaOH.
Disk essa rocedure
Petri plates containing plate count agar Difco! were inoculated
a~ebs. The plates were allowed to dry for 1 h at room temperature.
597

Sterile disks �.7 cm in diameter! vere placed on the agar surface andimpregnated with the extracellular and intracellular extracts �0-100pL! of the two lactic acid bacteria cultures. The plates were incu-bated at 22'C for 24-48 h. Antimicrobial activity vas determined fromthe diameter of the zone of no growth around each disk.
Effect of LAB on cod fillets
Lactobscillus ~lantarum ouituras sara added to drest cod filletsto attain a level of 10' cells/g. On the same day, codfish filletsvere purchased and placed on ice. The bacteria was applied by meansof a sterile non-aerosol spray. Fillets were wrapped and stored at2'C for testing every second day. Control fillets left untreated werestored in the same way.
Fillets were sampled in duplicate for microbiological analysis,trimethylamine TMA! analysis and surface pH. Gram-negative bacterialcounts were performed on freshly prepared Crystal Violet TTC agar plusO.SZ NaC1. Serial dilutions were made with 0.1Z w/v! sterile pep-tone. Incubation for plates was at 22'C for 48 hrs. Fifty grams oftissue was extracted with 7.5Z trichloroacetic acid TCA! and analyzedfor TMA Dyer, 1945!. Surface pH was obtained by taking four repre-sentative readings of each fillet using a surface pH electrode.
RESULTS
Disk Assa Procedure
The results of the inhibitory effect of the extracellular ex-
sussaarized in Table 1.
Yabie i. Inhibitory effect of satracslluiar extracts od L. plantarum
Zones of lnhibitiona cmVolume L ~laatarum extract P. acidilactici extractextract pL! pH 3.81 pH 6.28 pH 4.32 pH 6.27
1.11.11.41.7
1.9
1.92b
0.91.3
1.5
1.9
1.92.0
>2b
0.9
1.01.2
1.2
Diameter of area of no growth; 0.7 cm sterile disks were used.bAccurate measurements could not be determined beyond this point.
598
10203040
506070
8090
100
0.81.01.1
1.31.7
2.02.12.22.32.3

of both L .Biantsrum and , Pacidilactici at their unadjusted pH valuesof 3.81 and 4.32 respectively. Inhibition was also evident by theextracts adjusted to pH 6.27 and 6.28. It is apparent that althoughthe inhibition is greater in each case at the lover pH, the effect is~ till present at pH 6.27-6.26, particularly for the L. Hlantarumextract. Uninoculated MRS broth did not adversely affect the growth
v
extracts of either lactic acid bacterial cuture at pH 6.2 data notshown! .
Effect of LAB on cod fillets
Gram-negative bacterial counts for the treated fillets were sig-nificantly lower than those for the control fillets on days 2 and 4 Fig. 1!. The surface pH of the treated fillets tended to be lowerthan the controls particularly towards the latter part of the storageperiod Fig. 2!.
The trimethylamine values of the treated and untreated filletsare presented in Fig. 3. It is apparent that the increase in TMAproduction is more rapid for the control fillets than the filletstreated with L. plantarum.
DISCUSSION
Both lactic acid bacterial cultures L. Blsntarma aad P. acidi-lactici! produced a substance s! which effectively inhibited the
k. ~ 'speared to be exclusively extracellular, since no antimicrobialactivity was associated with the intracellular fluids of either bac-terium. Although the chemical nature of the compounds was not deter-mined, it is unlikely that the inhibitory effect could be attributedsolely to the production of lactic acid since the antimicrobial effectwas evident at pH 6.3. Abdal-Bar et al. �987! reported similarfindings for L ~bul artcc . Phis bacterium produced an extracellularantibiotic-like compound which inhibited the growth of P. ~fra i. Theproductioa of aa extracellular inhibitory agent by a L. Hlantarumisolate from fermented carrots has also been reported Andersson,1986!.
Direct applicatioa of L. Hlantarum cells to cod fillets was foundto have an inhibitory effect on the gram-negative bacterial popula-tion, particulary during the first six days of storage Fig. 1!. Theintroduction of L. Bisntsrum appeared to be especially effectiveagainst TMA producing bacteria as indicated by the significantly lowerTMA values for the treated samples as compared to the controls Fig.3!. Raccach and Baker �978! were able to show that the addition ofL. Bisntsrum snd P. cerevisiee effectively extended tha lag phase of
599

Gram NegativeB t 'l CO
2 4 6 8 10
Days StorageFIG.y TOTAL GRAN NEGATIVE BACTERIAL COUNTS FOR COD FILLETS
STORED AT 2C. CONTROL SANPLES - UNTREATED.EXPERINEHTAL SANPLES - TREATED WITH L. PLANTARUNAT A CONCENTRATION OF 10 CELLS/GRAN.
600

Surface pH
2 4 6 8 10
Days StorageFIG.2 SURFACE pH OF COD FILLETS STORED AT 2C. CONTROL
FILLETS - UNTREATED. EXPERIMENTAL FILLETS � TREATED
a'ITH L. PLANTAR' AT A CONCENTRAT1ON OF 10 C'ELLS/GRAM.e

Trimethylamine Production
2 4 6 8 10
Days StorageFIG 3 TMA VALUES FOR COD F ILLETS STORED AT 2C . CONTROL
SAMPLES - UNTREATED. EXPERIMENTAL SAMPLES - TREATEDWITH L. PLANTARUM AT A CONCENTRATION OF 10 CELLS/GRAM.
602

pure cultures of Pseudomonas species in deboned poultry meat. As wasthe case in this study, they noted that the slight change in pH of themeat was not sufficient to explain this repression.
Zn conclusion, our study has shown that the use of LAB has poten-tial as an inhibitor of fish spoilage bacteria. Further work isrequired to determine whether a significant shelf-life extension forfresh fish can be realized as a result of their use. Zn addition,evaluation of the extracellular extract as an alternative to theapplication of whole cells to fish needs to be investigated.
REFERENCES
Abdel-Bar, N., Harris, N. D. and Rill, R. Lap 1987. Purification andProperties of an Antimicrobial Substance Produced byI "'"'"'"' '"' """'
Andersson, R. 1986. Znhibition of Sta h lococcus aureus andSpheroplasts of Gram Negative Bacteria by an AntagonisticCoopouod Produoad by a Strata of Laotobaolllua plaotarum.Znternat. J. Food Microbiol. 3:149-160.
Dyer, W. J. 1945. Amines in Fish Muscle; 1. ColorimetricDetermination of Trimethylamine as the Picrate Salt. J. Fish.Res. Bd. Can. 6:351.
Raccach, M. and Baker, R. C. 1978. Lactic Acid Bacteria as anAntispoilage and Safety Factor in Cooked Mechanically DebonedPoultry Meat. J. Food Protect. 41:703-705.
Reddyp S. G. and Chen, M. L. 1975. Znfluence of Lactic Cultureson the Biochemical, Bacterial and Organoleptic Changes in Beef.J. Pood Scil 40:314-318.
Roth, L. A. and Clark, D. S. 1975. Effect of lactobacilli andCarbon Dioxide on the Growth of Microbacterium thermos hactum onFresh Beef. Can. J. Microbiol. 21:629-632.
603

NUCLEOSIDE PHOSPHORTLASE AND ITS ROLE IN FISH SPOILAGE
T. A. Gill, Merc Surette and Stephen MacLeanCanadian Institute of Fisheries Technology
Technical University of Nova ScotiaP. O. Box 1000
Halifax, Nova ScotiaB3J 2X4
INTRODUCTION
Autolytic degradation in refrigerated fish muscle occurs as aresult of enzymatic changes within the muscle. Enzyme decompart-mentalization probably contributes to the rapid autolysis observed infish muscle after death. The autolytic accumulation of ATP catabo-lites in postmortem fish muscle has been shown to be a reliable indi-cator of edible fish quality Vchiyama et al., 1970; Hiltz et al.,1971!. In a live fish, adenosine diphosphate ADP! is produced inmuscle contraction and can either be rephosphorylated by respiratoryaction or phosphocreatine, therefore the adenosine monophosphate AMP!level remains low Watts and Watts, 1974!. After death, Fig. 1!inosine monophosphate IMP! accumulates via dephosphorylation anddeamination of ATP. Jones and Murray �904! suggested that the subse-quent production of inosine Ino! was rate-3.imiting in the ultimateformation of hypoxanthine Hx!, xanthine and uric acid.
Inosine nucleosidase E.C. 3.2.2.2! and nucleoside phosphorylase E.C. 2.4.2.1! were isolated from the muscle of Pacific lingcod byTerr �955, 1958! and were responsible, at least in part, for thepostmortem production of Hx from Ino. Recently, LeBlanc �987! foundlittle or no inosine nucleosidase nor nucleoside phosphorylase activ-ity in crude extracts of fresh cod. Ammonium phosphate fractionationof crude muscle extracts as described by Terr �955! resulted in nosignificant purification of inosine nucleosidase. However, measurablelevels of this enzyme were detected in commercial cod fillets whichhad been stored on ice for several days.
The present study was initiated to examine the pattern of nucleo-tide catabolite accumulation in Atlantic cod Gadus morhua! as well asthe determination of the relative importance of autolytic andmicrobial enzymes in the production of Hx.
604

O.I
Ig 0
0 0 E ~IIX
MIQ 0li 4
IIIC4 g0 C4
0 A R0 Q 0
II0 ~ C4
III W~ %0
605
e X0
cv +Ko
Ol
0 XIII
E CQ
III0
0 E 4
II!
t4
0 g 0 E 0

MATERIALS AND METHODS
Studies of sterile cod muscle vere performed by aeseptic removaIof tissue from freshly killed fish, and subsequent storage of samplesin sterile Petri dishes at 3'C. Sterile samples vere checked forbacterial contamination at, regular intervals, each time tissue was tobe removed for perchloric acid extraction and subsequent chemicalanalysis. In order to compare autolytic with microbiologicalproduction of Hx, paired fillets were removed from the same fishdescribed above but vithout precautions to preserve sterility.
Analysis of nucleotide catabolites vas routinely carried out byhomogenizing 50 g samples of tissue in 2 volumes of 6X perchloric acidfor two, I-minute intervals in a Varing blendor. Extracts werefiltered, neutralixed to pH 1.0 with 30K KOH, and chromatagraphed on aWaters HPLC system equipped w'ith a p Bondapak C-18 radiaL compressioncolumn using a 0.05 M, pH 7.0 potassium phosphate buffer pumped at 2.0ml min '. Detection was carried out by absorbance at 254 nm.Quantitation was accomplished with external standards obtained fromSigma St. Louis, MO!.
Bacterial colonies recovered from spoiling cod were grown intrypticase soy broth for 3 days and cells harvested by. centrifugationce11-free extracts «ere prepared by ultrasonic disruption for 7, 2-minintervals Biosonik III, Bronwill Scientific, Rochester, N.Y.!. Sevencolonies were subsequently screened for their ability to produce Hx inthe presence of Ino.
Activity essays for nucleoside phosphorylase were performedaccording to Boehringer Mannheim �975!, Activity assays for inosinenucleosidase vere performed on bacterial cultures, cell-free extractsand muscle tissue. The reaction mixtures contained 3.0 ml 0.05 Mveronal or TES buffer, 0. 10 ml of 7.3 mM inosine solution, and 0.10 mlof a xanthine oxidase solution Boehringer Mannheim! containing 20units ml ', Reactions were initiated by the addition of 0.01 ml crudeinosine nucleosidase. Activity was measured as the increase inabsorbance at 293 nm and 22'C. Protein concentrations were determinedby the Lowry at al. �951! method.
Identification of spoilage bacteria producing significantquantities of Hx vas performed using the api 20E enterobacteriaceaeidentification kit api Anyltab products, Plainview, N.Y.!.
For determination of pH optimum, reaction mixtures containing 1.8ml of 0.05 M Pipes-HCI Sigma, St. Louis, MO!, pH.6.65-7.4; TES-NaOHat pH 7.0-7 ' 5; or Tris-HCI at pH 7.4-8.4 vere added to 0.10 ml of 7.3mM inosine, 0.01 ml xanthine oxidase �.4 U/mI, Boehringer Mannheim!
606

and 0.10 ml of 0.10 M sodium phosphate pH 7.3. Reactions wereinitiated by adding 0.10 ml of the enzyme preparation and activitymeasured as the increase in absorbance during the initial minute ofreaction at 293 nm and 23'C.
For the determination of kinetic properties, the assay mixturecontained 0.05 ml phosphate - free xanthine oxidase �.04 U/ml!,0.05 to 0.20 ml of 2 mM inosine, 0.025 to 0.20 ml of 0.10 M sodiumphosphate, 0.025 ml nucleoside phosphorylase and was made up to 2.0 mlwith 0.05 M TES, pH 7.3. The activity was expressed in concentrationunits based on the molar absorbency change for inoeine to uric acid of12,500 at 293 nm Kalckar, 1947!. The assay' with guanosine as thesubstrate was determined spectrophotometrically by the decrease inabsorbance at 257 nm due to the depletion of guanosine to guanine witha molor absorbancy decrease of 5000 Fiers and De Bersaques, 1962!.The reaction mixture contained 0.025 to 0.10 ml of 2 mM guanosine,0.05 to 0.20 ml of 0.10 M sodium phosphate 0.10 nucleosidephosphorylase and was made up to 2.00 ml with 0.05 M TZS, pH 7.3.Adenosine was also assayed as a substrate by monitoring the change inabsorbance at 250 nm. The reaction mixture contained 0.25 ml of 2 mMadenosine, 0.2 ml sodiI phosphate, 0.2 ml nucleoside phosphorylaseand was made up to 2.0 ml with 0.05 M TES at pH 7.3. All assays ofactivity were performed at 25'C.
Purification of the enzyme catalyzing the production of Hx fromXno was carried out by a 3-step procedure starting with a cell-free~ street of proteus ~vul aria raooveree fros spoiliuf oof. fha firststep involved gel filtration on a Sephacryl $-300 Pharmacia! column�.5 x 80 cm! with 0.05 M Tris-HCl, pH 8.0. Active fractions werecollected, pooled and dialyzed against 0.05 M sodium citrate, pH 6.0.Activity was further purified on a DEAZ-Sephacel Pharmacia! column�.8 x 8 xm! equilibrated with 0.05 M sodium citrate, pH 6.0. Sampleswere eluted by an 80 ml continuous gradient from 0.05 M to 0.12 Mcitrate at 0.4 ml min . Active fractions were pooled, dialyzedagainst 0.01 M Na2 Pipes-HClp pH 7, and applied to an Agadenosine Pharmacia! �.1 x 7.5 cm! affinity column. Elution was accomplishedwith 20 ml 0.01 M Pipes, pH 7.0, followed by a continuous gradient of0 to 1.5 M KCI in Pipes at a flow rate of 6 ml h
Enzyme purity was determined by isoelectric focussing inpolyacrylamide gals Pharmacia! using a Pharmalyte 3-10 pH range.Activity staining was carried out by immersing gels in 0.02K 3-[4,5-dimethylthiazol-2-ylj-2,5-diphenyltetrazolium bromide, 8 mM inosineand 0.008 U xanthine oxidase per ml, all in 0.05 M TZS, pH 7.3. Gelswere incubated at 35'C until a dark blue-black band appeared within30 min!. Gels were fixed, stained with Coomassie Blue G-250 andcompared with marker proteins for the determination of pI.
607

The molecular weight of nucleoside phosphorylase was determinedby polyacrylamide gel electrophoresis on a 4-30X gradient slab in 0.09M Tris, O.OB M boric acid and 2.5 x IO 3 M Na2 EDTA.
RESULTS AND DISCUSSION
Figures 2 and 3 illustrate the progression of formation ofnucleotide catabolites in paired sterile and non-sterile cod fillets.It is clear that at 3'C, similar patterns emerge except that theconversion of Ino to Hx is delayed by about 2 days in the sterilesamples. This suggests that the enzymes responsible for theproduction of Hx are both autolytic and microbiological in nature. As~ould be expected the rate of dephosphorylation of IMP to Ino wassimilar in both sterile and non-sterile samples, since few spoilagebacteria are normally present during the first four days ofrefrigerated storage.
Figures 4 and 5 illustrate the purine metabolite spoilagepatterns for whole, gutted, bled and iced cod which were obtainedfresh from a local aquarium and the headless, gutted cod availablecosmercially. Notable were the differences in rates of nucleotidecatabolism between intact aquarium fish and the aquarium fish whichwere filleted under sterile or non-sterile conditions. It is evidentthat Hx is produced much more rapidly in fillets either sterile ornon-sterile! than in headless, gutted cod. One explanation for theaccelerated rate of decomposition in the fillets may be the mechanicaldamage received by' the tissue during the filleting operation. Thisphenominon could be explained by the effects of enzymedecompartmentalization or the breakdown of barriers to microbialinvasion within the muscle.
Initial attempts to recover either inosine nucleosidase ornucleoside phosphorylase from very fresh fish were fraught withdifficulty. Only by using partially decomposed muscle tissue were weable to recover measurable amounts of activity. Seven bacterialcultures obtained from spoiling fillets were screened for theirability to produce Hx from Ino.
Only 2 nuiturss proteus ~vul erie and Pseudononas dluorescens!contained any' measurable activity, with the specific activity of P.~vul aria cultures hsing approxinatsiy tvica that oi p. dlucrescens.Little activity was observed prior to ultrasonic disruption of thecells, suggesting that the enzyme was primarily intracellular innature. Upon extensive dialysis against phosphate-free buffers,little activity was observed, suggesting that nucleoside phosphorylasewas far more important than inosine nucleosidase in the bacterialproduction of Hx.
608

0. 2
0
Days at 3 C
FIGURE 2.
8 12
Days at 3 C
0 16
FIGURE 3. Metabolite concentrates IMPS, InoS and HxO! in non-sterile codfillets stored at 3 C.
609
O
I
Et0
8
E
I 0
6 4
metabolite concentrates {IMPS, Ino 8 and HxOI in sterile codfillets stored at 3 C.
4 2

4
3
2
104 6
Days at 3'C0
FIGURE 4. Metabolite concentrations IMP%, Ino8and HxO! in aquarium fishwhich were gutted, bled and stored at 3 C.
6
5 32 10
208 12
Days at 3 C
FIGURE 5.
610
Metabolite concentrations IMP%, InoL and HxO! in commercial guttedwhole cod during storage at 3 C .

Figure 6 illustrates the pH profile for activity of aucleosidephosphorylase NP! in three different buffer systems. A TES buffer atpH 7.3 was used routinely for the assay of NP activity.
TABLZ 1
Sussaary of the Purification of NP.
ACTIVITY PROTEIN SP. ACTIVITY pmoles/min! mg! pmoles mg-1 min-1!
RECOVERY
X!
STEP
Crude
extract 6.85 165.6 100.0
100.0
0.04
37.7Sephacryl 6.90 0.18
0.92Sephacel 5.88 6.4 85.7
0.22 69.2Agadenosine 4.75 21.6
The nucleoside phosphorylase was recovered in isoelectrically-pure form with a pI of 6.8 aad an apparent molecular ~eight of 120,000a 2000 daltons as determined by pore gradient electrophoresis.
The kinetics of NP were examined using Iao, and guanosiae sub-strates. The enzyme exhibited typical Michaelis-Neaten kinetics.Double reciprocal plots not shown! with inosine or guanosine as thevariable substrate and phosphate as the changing fixed substrate werealso constructed. Kinetic parameters obtained by plotting the slopesand intercepts of the reciprocal plots against 1/[phosphate] aresumaarized in Table 2. Although inosine was used as the assay sub-strate during the purification of NP, the ability of NP to catalyzethe phosphorylysis of guanosine indicates broad specificity. The Kmvalues for both substrates were similar but the apparent specificactivity toward inosine was double that obtained for guanosine.Adenosiae was not used as a substrate for NP but is ability to bindthe enzyme as a ligand in affinity chromatography has proven valuableia the purification procedure.
6ll
A three-step purification of the cell-free extracts was performedby gel filtratioa, ioa exchange chromatography and affinity chromatog-raphy using adenosine as the ligand. Gel filtration on Sephacryl S-300 Fig. 7! resulted ia the recovery of a single peak of NP activity,which when applied to a DEAE-Sephacel column Fig. 8!, resulted in a5-fold increase in specific activity from the Sephacryl column and anoverall purification of 23-fold from the crude cell-free extract.Affinity chromatography Fig. 9! resulted in a further 23-fold purifi-cation from the ion exchaage step �00-fold from the crude extract!yielding an overall recovery of 69K for all three steps. Table 1summarizes the results of the purification procedure.
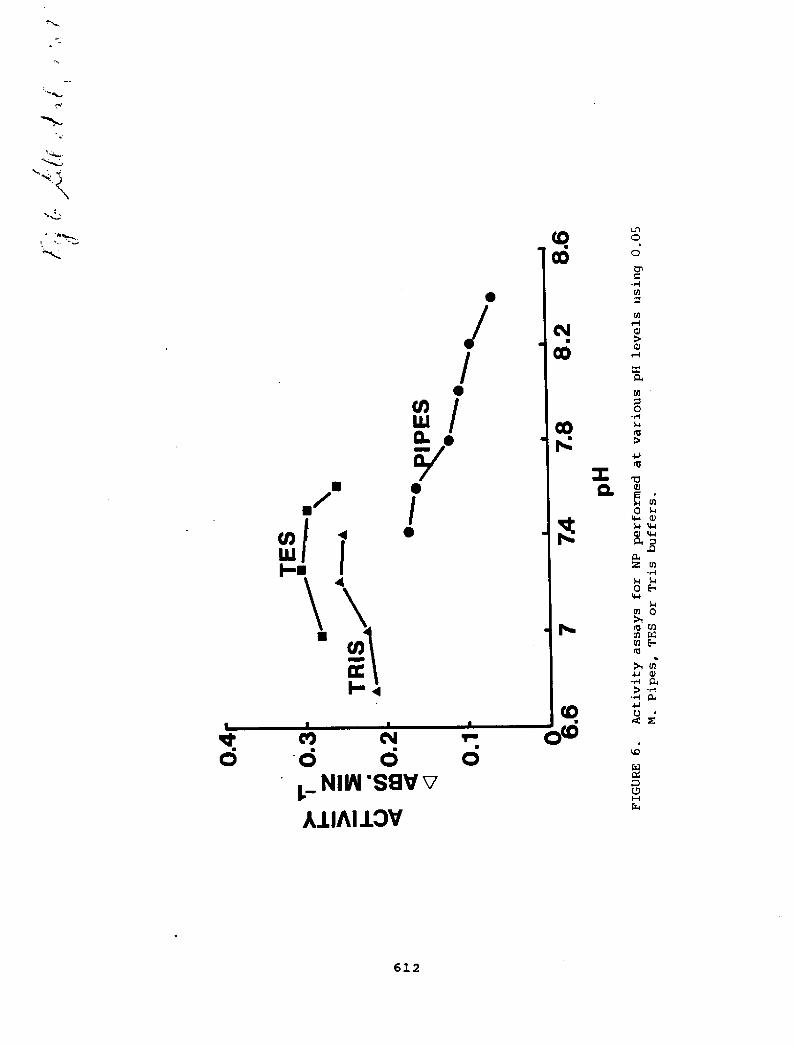
O o
CV
CO
o+
612
C9 CV
0 0
, NIW SaveA J.IAIDO%
AJ'0
E~0W 8
WP W
Z5Z u!
0W
4M 0
Nm KMr4
h0
cC X

OK
g!
CV
Z0IV
KOl
613
C4 ~ . 4 4 Ol OO
0 0 0 0
{, U!~~~v! janU.ov
Ul 0g ~0 CO
0
Q ~g
Q
CIJ~ + w 8
0g 48 Xg Ill
00 ~oat
o >
M
04
g 0g W
4p, 5
cN4
C I0
Ag 0
0 0
g 80 0
O4 Cl
V1W ~
A
4l WC9 0 4
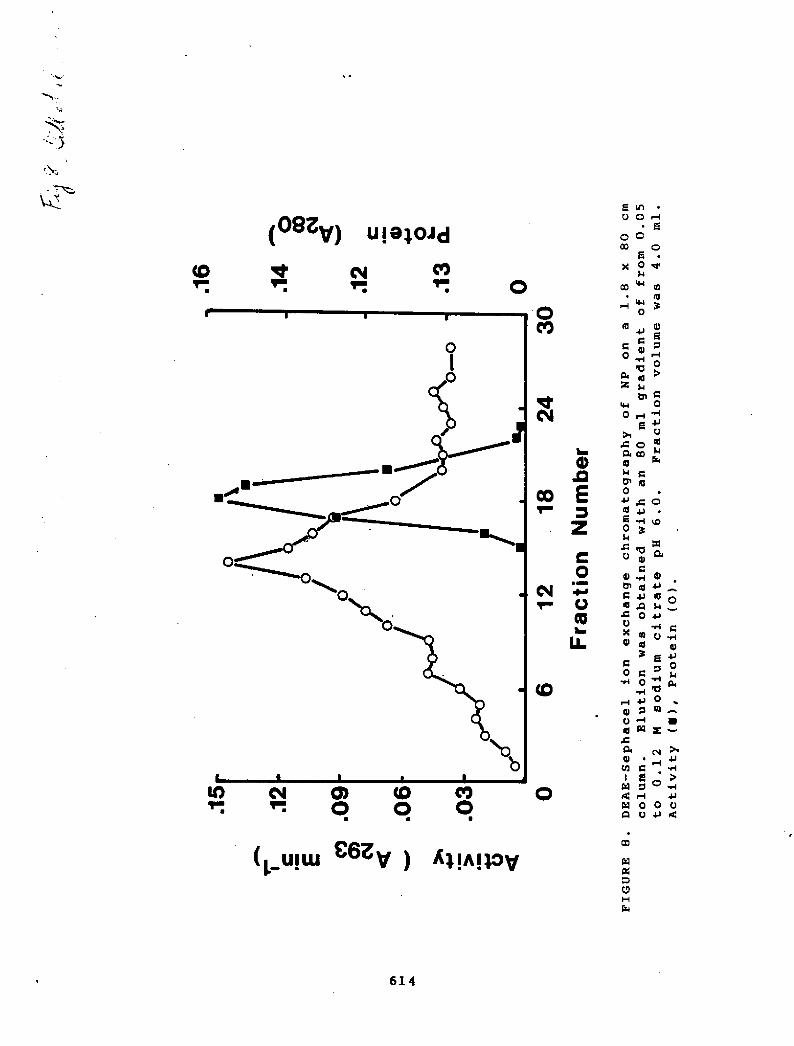
ig
O
8 E 0
C 0 4W 0
A O0 a>g4 CQl0
E ~0
0
5 w
O
C4 AA 00
CI
C0 C
C4III ~Ch CI E
Ol
W 0a 0
CV
O 0ClO
CV CbQ
09O
614
�8<y} ulsgOad
ullu Q } ~!IA}+g
C 0Ol
Q0$
LL.
E U
O C!
0
Ft
O O E 0 4 0 4l'0 Cl4
0 0 0g
0 C 4l0 4
R

00
615
~~V! NI3LOtldol
0 o 0 0
lO Q 0! CV0 0 0 0 0 0
I Ul~ 86K%! AJ.IAIJ.OV
SX
Q Ifl0 ~ Q
I0
0 0
S S O'Q 0 ~Id 4 P4V W
m4
S 0VO W I~ C S
~ 0 0
k'0 0l44
~ Ch CQ
0 OO
0 cf 4!4
R
w g O0 ~
0
0 m CS4
LH0 S U ~
0C 0 OS 0 I0 44 CO
5 I0 C C4 4l
0C 40 X F4
C M
CO~w w
W O

C GQJ r
W C
'0 CQ !
fgC'
0
<DC
C Vl0
0 C8
0 00<U 0
0 0C Ql
04
0E
hlx
M 0 Z
O C4
or0 A ~CJ%30CJ4 8
04 A0 gjQl lll
5!~r U
OW Q..0 0 '0
0
4 ill5
6 N04QJ
0 ~
VJ C 80
0 + 8
04 z4 tQ
0 Q Z0 U MN CC4 0
00 84 C
0.0 C 0
Q Ul0'0 CCl re
616

TABLE 2 '
Kinetic Parameters Estimated from the Replots of the Slopes andIntercepts of the Lineweaver-Burk Plots in Figs. 7 and 8.
pmoles mg ' minParameter
3.8 x 101.4x10 ~
2.9 x 102.5 x 10 '
Inosine, KmInosine, KiaGuanosine, KmGuanosine, KiaPhosphate, Km
with Inosine
with Guanosine
Vmax lnosine!Vmax Guanosine!
1.30 x 101.45 x 10
10.26
5.80
SURGlRY AND CONCLUSIONS
The breakdown of Ino in Atlantic cod tissue is at least in partdue to bacterial nucleoside phosphorylase. Very little nucleosidephosphorylase or inosine nucleosidase was recovered from sterile codmuscle and the production of Hx was delayed by at least 2 days insterile fillets as compared to non-sterile fillets from the samefish. The fact that inosine breakdown occurred at a more rapid ratein sterile and non-sterile fillets than in whole, gutted cod,suggested that mechanical disruption of the tissue accelerated theformation of Hx.
Nucleoside phosphorylase recovered from spoilage bacteria waspurified and characterized. NP had an apparent molecular weight of120,000, an isoelectric point of 6.8 and catalysed the phosphorylysisof both inosine and guanosine. NP was competitively inhibited byadenosine.
617
Kinetic analysis with adenosine as the inhibitor of inosinephosphorolysis was undertaken to determine if the site of attachmentwas the same as the active site for inosine binding. Figure 10illustrates the typical pattern of competitive inhibition, indicatingthat adenosine is attached to the active site of NP. The Ki ofadenosine was determined to be 4.9 x 10 M from the replot inset,Fig. 10!.

ACKNOWLEDGEMENT S
This research was supported in part by a Strategic Grant providedby the Natural Sciences and Engineering Research Council of Canada.The grant was awarded to author Gill.
REFERENCES
l. Uchiyama, H., Ehira, S., Kobayashi, H. and W. Shimizu. 1970.The curreat studies on the freshness of fish vith specialreference to nucleic acids and their related compounds. Bull.Jap. Soc. Sci. Fish. 36:977-982 '
2. Hiltz, D.F., Dyer, W.J., Nowlan, S. and J.R. Dingle. 1971."Variations of biochemical quality idices by biological andtechnological factors in fish inspection and quality coatrol"p.191. In Fish Inspection and Quality Control. R. Kreuzer, ed.,Fishing Neve Books Ltd., London.
3. Watts, R.L. and D.C. Watts. 1974. "Nitrogen Metabolism ia Pish"p.396. In Chemical Zoology, Vol. VIII. M. Florkin adn BE Sheer,eds., Academic Press, Nev York.
4. Jones, N.R. and J. Murray. 1964. Rapid measures of nucleotidedephosphorylatioa in iced fish muscle. Their value as indices offreshness and of iaosine 5'monophosphate coacentration. J. Sci.Food Agr. 15:684-689.
5. Terr, H.L.A. 1955. Fish muscle riboside hydrolases. Biochem.J. 59:386-391.
6. Terr, H.L.A. 1958. Lingcod muscle puriae nucleoside phosphory-lase. Can. J. Biochem. Physiol. 36:517-530.
7. LeBlanc, P.J. 1987. Approaches to the study of nucleotidecatabolism for fish freshness evaluation. M.Sc. Thesis. Dept.of Food Science and Technology, Technical University of NovaScotia.
8. Boehriager Mannheim. 1975. "Biochemica Information" p.ill.Boehringer Manaheim GmbH, Penzberg, W. Germany.
618
9. Lowry, O.H., Rosebrough, N.J., Farr, A.L. and R.J. Randall.1951. Protein measurement with the Folin phenol reagent. J.Biol. Chem. 193<265-275.
10. Kalckar, H.M. 1947. Differential spectrophotometry of purinecompounds by means of specific enzymes. J. Biol. Chem. 167:429-443.
11. Fiers, W. and J. De Barsaques. 1962. The reaction mechanism of anucleoside phosphoryiase. Enzymo],ogia 24:197.210.
619

A Rapid Color Test Strip for Estimating Fish Freshness
Kwan Wong and Tom Gill
Canadian Institute of Fisheries Technology
Technical University of Nova Scotia
P.O. Box 1000
Halifax, Nova Scotia
B3J 2X4
INTRODUCTION
Traditionally, freshness of fish have been assessed bysensory methods which are subjective in nature. The criteriacomaonly used to grade fish freshness are texture, color, odor andtaste. Ultimately sensory evaluation is the most satisfactory for.the consumers. However, the procedure is both laborious .andexpensive since many trained graders and tasters are required totest large numbers of fish. Furthermore, the qualitative andquantitative characteristics of the criteria mentioned above areextremely difficult to assess and convey to others. For thesereasons many objective tests, mostly chemical in nature, have beenproposed.
A number of chemicals have been reported as useful indicatorsof fish freshness. Some of these include: nucleotides,hypoxanthine, total volatile bases, and trimethylamine.Trimethylamine is perhaps one of the most widely used. It hasbeen used as an objective indicator for bacterial spoilage inseafood for over 40 years. Several studies have shown a highpositive correlation between bacterial numbers and TMA values forvarious fish species, Dyer et al., 1946; l.aycock and Regier,1971!. Several studies have also reported excellent correlationsbetween subjective determination of eating quality and TMA levels Castell and Greenough, 1958; Hoogland , 1958!.
The Dyer method �945! as modified by Tozawa et al. �971!has been used for many years for the determination of TMA infish. Some other methods of analysis include gas chromatography Iuiter, 1973; Miller et al., 1972; Kuwata et al., 1980!; ion
620

specific electrode Chang et al., 1976!; high pressure liquidchromatography Gill aad Thompson, 1984!; and enzyme assay Largeand McDougall, 1975: Wong and Gill, 1987!. These methods shareone or more of the following disadvantages: lack of specificity,cannot be performed outside the laboratory, expensive and timeconsuming.
Improvement over the above methods for estimating TMA haverecently been developed in our laboratory. The method is alsobased oa the TMA dehydrogenase reaction of Wang and Gill �987!,but using dry reagent chemistry on a test strip rather than a testtube reaction. The eatire procedure requires 5 min at roomtemperature. The technique is sufficiently simple so thatpersonnel with little or no laboratory experience can perform thetest.
MATERIALS AND METHODS
Strictly trash cod dados ~sorh a! aud haks U~ro h cus taouis!were purchased locally, filleted and stored at 2'C. Samples ofthe fillets were used periodically for perchloric acid PCA! ortrichloracetic acid TCA! extractions as described in Woyewoda etal. �986!. Fish juice was prepared with a modified 20 ml plasticsyringe. The modification consisted of drilling 3 rows of holes�.5 mm in diameter! 3-4 mm apart at the lower 1.5 cm of thebarrel. A row of holes was also drilled at the end of thesyringe. The opening of the syringe was plugged by the lock endof the needle. Squeezing 5-6 g of fish muscle in the syringeyielded 0.3-0.5 ml of juice. The extracts aad juice were dilutedto a workable level before use.
TMA ESTIMATION
Typically, a 10 ml disposable beaker contained 1 ml of, a 0.2H HOPS �- N-morpholino! propanesulfonic acid! buffer pH 7.5!and 0.1 ml of the diluted fish juice, neutralized TCA or PCAextracts. A test strip was immersed in the solution, swirled anceand then allowed to react at room temperature �9-21 C!. After 5min the color test strip was rinsed in water and the TMAconcentration estimated by matching the iateasity of the red colorwith the color of a set of TMA standards. Five inexperiencedjudges were asked to estimate the TMA levels usiag TMA standardsof 0, 0.5, 1, 3, 5.5 and 7 yg TMA-N. Storiag the reacted stripsia 10X H3P04 at 2 C in the dark preserved the color for a fewdays.

Trimethylamine in f ish extracts vas also est imated by thepicric acid method of Dyer �945! as modified by Tozava �971!.
RZSULTS AND DISCUSSION
The test strip was specific for TMA. Compounds such astrimethylamine oxide TMA-O!, dimethylamine DMA!, monomethylamineand ammonia did not react and did not interfere with thereaction. The minimum detectable level for TMA vas 0.25 ~gTMA-N. The best vorking range was between 0 ' 5 and 3 ~g withsaturating level at 7 yg TMA-N.
Neutralized TCA extract, neutralized PCA extract or fishpressed juice worked equally' well. Using 7 day old cod �'C! thepressed fish juice �7 times diluted! showed a slightly darkerpink color than either the neutralized TCA or PCA extracts of thesame dilution. When diluted 35 times or more, however, nodetectable color differences were observed for the 3 differentmethods of sample preparation. Similar results vere found forhake extracts.
Figures 1 and 2 illustrate the estimation of TMA levels inaged cod and hake fillets vith the test strip and picric acidasisays. Zxcellent agreement was observed for the 2 methods. TheTMA-N values for the picric acid method vere averages of 2determinations while the values for the test strip method vereaverages of 4 determinations from 5 inexperienced judges.Regression of these data gave a linear relationship between the 2methods vith a slope of 0.65, intercept of 0.86 and r2 of 0.99 forcod samples and a slope of 1.37, intercept of 1.01 and r2 of 0.96for hake samples.
The test strip assay' was more rapid than any publishedmethods for determining TMA in fish extracts. By immersing teststrips in samples at 15 second intervals, at least 12 fish samplescan be assayed within 10 minutes. The method vas simple andinexpensive. The only equipment required was a knife, a modifiedsyringe, disposable beakers and pipettes. Neither electricalpower nor potent protein precipitants such as TCA or PCA wererequired to determine TMA in fish samples. Because of itssimplicity, rapidity and reproducibility, the test trips will beuseful for routine testing of microbiological quality of fish.
622

70
60
o 4p
30
F 20
10
8 10 12 14 l6
DAYS 2C !
Ficpxre l. 'INA detexnunatian by the picric acid v ! andthe test strip o! methods.
623

70
60
50
10.
8 10
MYS 2 C !
12 14 16
624
840
30
20
~iguxe 2. ~ determinatian by- the picric acid v! andthe test strip a! methods.

1. Castell, C.H., M.F. Greenough, R.ST Rogers and A.S.MacFarlane. 1958. Grading fish for quality. 1. Trimethyl-amine values of fillets cut from graded fish. J. Fish. R.Bd. Can. 15:701-716.
2. Chang, G.W., W.L. Chang and IK.B. Lew. 1976. Trimethylaminespecific electrode for fish quality control. J. Food.
Sci. 41:723-724.
3. Dyer, W.J. 1945. Amines in fish muscle. I. Calorimetricdetermination of trimethylamine as the picrate salt. J.Fish. Res. Bd. Can. 6:351-358.
4. Dyer, W.J., F.E. Dyer and M. Snow. 1946. Amines in fishmuscle. lII ~ Spoilage of iced eviscerated cod. J. Fish.Res. Bd. Can. 6:403-413.
5. Gill, T.A. and J.W. Thompson. 1984. Rapid, automatedanalysis of amines in seafood by ion-moderate partitionHPLC. J. Food Sci. 49:603-606.
6. Hoogland, P.L. 1958. Grading fish for quality. 2.Statistical analysis af the results of experiments regardinggrades and trimethylamine values. J. Fish. Res. Bd. Can.15:717-728.
7. Keats, K., Y. Yamazaki and M. Uebari. 1980. Determinationaf traces of low aliphatic amines by gas chromatography.Anal. Cham. 52:1980-1982.
8. Large, P.J. and H. McDougall. 1975. An enzymatic method forthe microestimation of trimethylamine. Anal. Biochem.64:304-310.
9. Laycock, R.A. and L.V. Regier. 1971. Trimethylamine
fillets during refrigerated storage. J. Fish. Res. Bd. Can.28:305-309.
10. Miller, A., R.A. Scanlan, J.S. Lee and L.M. Libbey. 1972.Quantitative and selective gas chromatographic analysis ofdimethyl- and trimethylamine in fish. J. Agr. Food Chem.20:709-711.
625

11. Ruiter, A. 1973. Determination of volatile amines and amineoxides in food products. Proc. Int. Symp. Nitrite MeatProd. Zeist., Pudoc, Wageningen, pp 37-43.
12. Tozawa, H., K. Enokihara and K. Amano. 1971. Proposedmodification of Dyer's method for trimethylaminedetermination in cod fish. In "Fish Inspection and QualityControl". Fishing News Books! Ltd., London, pp. 187-190.
13. Wong, K. and T.A. Gill. 1987. Enzymatic determination oftrimethylamine and its relationship to fish quality. J. FoodSci. 52:1-3.
14. Woyewoda, A.D., S.J. Shaw, P.J. Ke and B.G. Burns. 1986.Recossaended laboratory methods for assessment of fishquality. Can. Tech. Rep. Fish. Aquatic Sci: No. 1448, pp35-40. Dept. of Fisheries and Oceans P.O. Box 550, Halifax,N.S. B3J 2S7.
626

PERFORKAKE CHARACTERISTICS OF FDA'SSANPLIK PLASS FOR DECONPOSITIOI
OF FISH AlD SEAFOOD
Alvin P. RainosekNational 34rine Fisheries Service, KAAiational Seafood Inspection Laboratory
P. 0. Drawer 1287, Pascagoula, NS 39568-1287
IXTRODUCTIOIW
Sampling plans are extensively used in practice as a means ofgathering data to assist in determining whether or not the productproduced <usually on a lot-by-lot basis! satisfies one or morespecifications. Since the conclusions drawn from the sampling andanalysis process are applied to the total production lot! under
|, ~ll «I ibiU f ~decision on the actual lot status, i.e., refection of a conforming lotor acceptance of a nonconforming lot.
Of interest then, or at least it should be, is to what extent doesthe sampling plan being used protect the producer/consumer against makingincorrect decisions when faced with lots of varying quality. In thiscontext, how a sampling plan perfonas, i,e., its so-called. performancecharacteristics, is usually described by that plan's operatingcharacteristic or OC curve. This curve indicates the chance of lotacceptance for lots of varying quality and can be presented in 'tabularand graphical form.
For the typical and. simplest type of sampling plan, a 2 class plan<e,g., each sample unit selected is judged to be defective ornondefective relative to a certain specification!, a few selected valueson the OC curve are used to basically describe the performance of thatplan. Conventionally, these selected values are the Acceptance gualityLevel AJL! and its associated Producer's or Seller's Risk of 5Z, theIndifference Value IV! and its corresponding Indifference Risk of 58Z,and the Re]ectable guality Level <RQL! with its associated Consumer's orBuyer's Risk of 18Z.
For example, suppose we are using a 2 class sampling plan thatrequires 12 sample units with an acceptance number of 1, This meansthat if 8 or 1 of the 12 sample units are defective, then the lot isaccepted; but if two or more are defective, then the lot is rejected,This sampling plan using the Binomial probability distribution! has thefollowing performance characteristics:
A9L = 3.8Z IV = 13.6Z RJL = 28.8Z
627

P j f f
~A L: If the entire lot actually has ~Z defective units, there is a95Z chance that this sampling plan will indicate lot acceptance or a 5Z chance of lot rejection!.
IV: If the entire lot actually has ~% defective units, there isa 5@% chance of lot acceptance <or a 5M chance of lotrejection!.
~R L: If the entire lot actually has g8.8% defective units, there isa ISZ chance of lot acceptaace or a 9M chance of lotrejectioa!,
This paper preseats the performance operating! characteristics ofsampling plans for decomposition used by the Food aad Drug Administration<FDA! in four seafood categories: �! Fish Fresh or Frozen!, CompliancePolicy Guide <CPG! 7188.$5, �! Canned Salmon, CPG 7168.18, �! Shrimp�Fresh or Frozen Raw Headless, Peeled or Breaded, CPG 7188.11, and�! Caaned Albacore, Skipjack and Yellow Fin Tuna, CPG 7188.24. Thesesampliag plans, however, are not of the simple 2 class type as describedabove. For fish, shrimp and canned salmon, FDA uses several different 3class plans corresponding to three classes of decompositioa. For canaedalbacore, skipjack and yellow fin tuna, the FDA utilizes a 4 classsampling plan corresponding to four levels of histamine content.
For 3 and 4 class sampliag plans, a simple descr'iptioa of theirperformance characteristics using one set of values for the AgL, IV andRQL is not appropriate. These values would have to be reported for oneclassification at various fixed levels of the other classifications andwould quickly become complicated aad,' of questionable practical use,Generally, the most useful presentation of the performance characteristicsof 3 and 4 class sampling plans is to employ 2 aad 3 � way tables. Forexample, the rows of a 2 � way table could represent various levels ofClass 2 decomposition and, the columns could denote different levels ofClass 3 decomposition. The tabular value found in the intersection ofeach row with each column would then indicate for that sampling plan thechance of lot acceptance for those row and column values of Class 2 andClass 3 decomposition,
In this paper, 2 � way tables are presented which describe theperformance characteristics of FDA's sampling plans for decomposition offish aad seafood. I want to thank aad express my appreciation to theDivision of >lathematics, FDA, for their cooperation and assistance inproviding these tables.
628

EVALUATION OF FDA SAMPLING PLANSFOR DECOMPOSITION IN FISH AND SEAFOODS
The sampling plans of Compliance Policy Guides 7108.05, 7108.10,7108.11, and 7108.24 were evaluated employing computer simulation and/ormathematical calculation involving either the uniform, binomial, multi-nomial, or double hypergeometric probability distributions or combina-tions of these in double and multi-stage sampling schemes.
A. Guide 7108.05 Fish Fresh or Frozen! � Adulteration InvolvingDecomposition
1. Criteria for Decomposition - �! 5X or more of the fish or filletsin the sample but not less than 5! show Class 3 decomposition overat least 25Z of their areas; or �! 20X or more of the fish or fil-lets in the sample but not less than 5! show Class 2 decompositionover at least 25X of their areas; or �! the percentage of fish orfillets showing Class 2 decomposition as above, plus 4 times thepercentage of those showing Class 3 decomposition as above, equalsat least 20 percent and there are at least 5 decomposed fish orfillets in the sample.
2. Though the product is defined by three classes of decomposition,the rejection criteria involving these three classes was of suf-ficient difficulty to require computer simulation to evaluate the0. C. Curves. A program was written employing a uniform distri-bution UD! with values ranging between 0 and l. A lot, say, 80XClass 1, 10X Class 2, and 10X Class 3 decomposition waa consideredin one-to-one correspondence to UD; and, for example, if a random-ly chosen value from UD times 100 was between 0 and 80 the valuewas considered in Class 1; if a randomly chosen value from UD times100 was between 80 and 90, the value was considered in Class 2; andif a randomly chosen value from UD times 100 was between 90 and 100,the value was considered in Class 3. The random sampling from UDand the value transformations were replicated until 50 values thenumber of fish up to 3 lbs in a sample! were chosen. The criteriafor decomposition was then used to test the sample to assess thepass/fail status. Approximately 1000 random samples of 50 sub-samples each were subjected to the criteria for decomposition foreach specified percentage of Class 1, Class 2, and Class 3 decompo-sitions.
3. The following table provides simulated 0. C. values X! for theprobability of accepting a lot of bulk fish, each weighing up to3 lbs., based on a random sample of 50 fish. In this table, PercentClass 2 represents the percent of fish in the lot with Class 2 decom-position over at least 25X of their areas, and Percent Class 3 denotesthe percent of fish in the lot with Class 3 decomposition over atleast 25 Z of their areas.
629

Percent Class 3
1 3 5 10 l5 20
Percent
Class 2
B. Guide 7108.10 Canned Salmon � Adulteration Involving Decomposition
Regulatory Action Guidance:
The following represents criteria for direct reference seizure toACRA, and for direct citation by District Offices.
Examination of the entire sample by two qualified organoleptic analystsin the Seattle District in accordance with the sampling plans Tables Iand II! show either:
l. A number of defective cans that equals or exceeds the numbers re-quired for action Tables I and II!. or
2. Two or more Class II cans in either the first or total sample.Note: One Class III can in the first sample of any lot size isa basis for resampling. The term "defective cans" as used in thecriteria above and in Tables I and II includes both Class II cansand Class III cans.
3. The probabilities of acceptance were determined by using a multi-nomial in three classes converted to a double hypergeometric asthe underlying probability distribution for a double samplingplan. Specified percentages of Class I, Class II, and Class IIIwere defined and used as the parameters to calculate the proba-bilities for a double sampling plan. Table I, Plans 1-7 presentsthe sampling plans and probabilities of acceptance for cans ofsalmon weighing 4 pounds through 1 pound. Table II, Plans 1-7presents the sampling plans and probabilities. of acceptance forcans of salmon weighing over 1 pound through 4 pounds.
630
0 13 5
10
1520
100.0
100.0
100.0
100.0
97.0
80.6
45.2
100.0 97.6
99.8 94.6
98.2 84.0
94.4 75.480.8 46.861.8 23.2
27.4 8.6
90.2 40.6 11.6 4.083.0 32.0 10.8 2.862.0 20.6 3.8 0.647.8 14.4 1.4 0.221.6 2.6 0.4 0.011.2 1.2 0.0 0.0
3.8 0.0 0.0 0.0

O 'be0
4I al &4J0 4l
4J Q4l C gW & Naj Ma
C 0al40 4J Icl4l V
IlCI4V
~ JC4lV
al
4J Iel4I 0VCaj Cl4JCaj NV CV N O
O
C V I44I
M
4I ~IS
ca 0 COg Ia IPI
0 ca VIJI
W 0
'C4 4l mCM «I0 0 CNv Scan4I aj Vcjj cJj ~
W M0N ISal N
al4J
O4J
Jh CN aj
V0be 4I
jje
0be
jje
00jm Ng
IN
C aj beO 4J 0
N Ice4I 4
4IW jce M4JV C IRal W N
w co4lCI
C0
C0
aj Maa 4J Pl4I V
0JJal
I4
4l ~JJ M N
De C c0NN
j4 cn~tOalIJ0a
4J M CCal NV QI al
4J4I M ca 0jjeOOQ
alIJ ~
Iaclj 4I ec
N O4J Ia 0OOM
~ y
631
8
CA
C3 I
OOM4I
MOWCJb ~ Cl0
0 MgA fal
A
g 0
9O
NO
0CC 4Jal V
I4MM M
NN 44N M
SI4JIe0
0 DC
4I IS'0
IaC
CJ alC
al M
Ngl N
N
0 4Ibe
4J 0V gl
0N40 04l
acINRccI 4~00yl ccjIcjm~ 0090N ~ ~ ~ ~ ~ ~ ~ ~
00009000
Fl>N+84MO0 Maa<I OOOO
~ ~ ~ ~ ~ ~ ~ ~<NMOOOOO
Ch Iel0I 0 O 0 % M O 0~ ~ ~ ~ ~ ~ ~ ~4N4FI0000'H
Iel N MN Ih O Ch Pl Iel M 0~ ~ ~ ~ ~ ~ ~ ~9 ISI M 0 N 0 0 0yl cel N w
CIN<0ewNW4Iel r Iel Cje CII Iel W
~ ~ ~ ~ ~ ~ ~ ~0 Cl 0e ISj ICj w 0 0Ch ~ W N
W acj Icl Pl ChM N Ml ISI Cle Cje N
~ ~ ~ ~ ~ ~ ~ ~acj 0e 0 4 cj N 0 0Cje ISj ICI
Va m I0 yS M N % O' W <0 ~ ~ ~ ~ ~ ~ ~~ Cel W Cel Cel < w
cac c000 ccj M 0 9 cel ch 49 ~ e ~ ~M<Or u0
O MHIllOIIlOIllN N

«l0 «IO
0C0 «l 0ss
4J0 «l
4J
s0 0 IW s»C «I
4
0 0c000 44 Ch«I CJ
M
0 «ICI
0�
C 0I0s
C0 IM Cl
OOM
C 0«lCh
0C0«l. C044
O4cC«l
a v04 0lI4e I0s
C cv
C
0IMO+
QCNHO mO I
4 Cal
0'00I c»cC0
Cd
s0 4O 44 0
0ss«l
«IM gss M4JV C I«Cl W s«W Ch«I4
c0C 0
c0
Vs0O
0«I00 44«l V
«l ~s0
0 C Og s0 C»c
M ~
44c0
~ »0l4c0
MM
4S M0ClCI C0 C04 «Is0 M «I 0Ccs O O W
«lN»»»» Ch
C0 ChVJ s0 M
c0 O0OO
I@I ~O 0
0'0 Wc 44
Cl
«Is0 00CI s0c0 M
O s0444
44 00 0»a 00I C0
C00
V «IC v
C0 M
Cla c0g C0
«I
00 «I
444 0CI I«I
000 04l
Oc»c
0s0CI«lAs
sPI4»l
0l 0ClC«I 0C4c0 «ICl C»CJ c0 O
O
wQHOOOCQ A C»I ~ O O O O~ ~ ~ ~ ~ ~ » ~OOOOOOOO
QcOOMca c»COO»0 N c»l sil O O O O
~ ~ ~ ~ ~ ~ ~ ~sPI c»l M O O Q Q Q
Ch w c»l Ch sdl C0 N Q»0 cO N scl c»l O O O~ ~ ~ ~ ~ ~ ~ ~4' s0 s0 c»C O O O OCsl
W ih C0 Ch »0 N C7 AR O O M c»l W O O
~ ~ ~ ~ ~ ~ ~ ~C»C Cg C»C Ch M Q Q Q
C! W C0 h» s0 s0 C»l cc0I» Ch C4 SCl C»C M C»l O
~ ~ ~ ~ » ~ ~c»c g cv Q 4 M O QCh C» W c»C
O W CÃI Csl00~ ~ ~ ~ ~ ~ ~ ~
CO »0 ch »Cs »0 m Q QCh CC! W C»C
Q W W & s0 Ch WO Vl s0 H Ch Q 00 C»IO ~ ~ ~ ~ ~ ~ ~MOr WchchQO
Ch Vl
M sCl 4! OQ C»C C»C O H CI m R
~ ~ ~ ~ ~ ~ ~C»C C»C Ch C»l C»l M O
C»l scl O scl O vlc»c
632

N N aO CO 6 Q Q QOP A~OOOON ~ ~ ~ ~ ~ ~ ~AQQQOOQQ
a4CJ0 N! 4J
0
V 4I 0W WNA
0Saa
0SS 4J wN CJ
N C NVA
8 V a4aS
CONN QaJI ~ Q Q~ ~ aOOOO
NN aaa COOa Q~ ~ ~ ~
N ~
W 0
W 0'0 4I ~C W N0 0 C
IS IS4I IS
ISJJ
V 4J0
4I 4ICJ
0 IJ 4Il4
aCI e1
A Saa
C 0
N Q~ ~Q O
N UlNag n4I IN NIN
C
N 4aW Paa4JV ISW4lA
0a4 H444J W4I V
cal a0 aPI CaCO Oa~ ~ ~ ~I +OO
QNOaQ Q aO wQ ~ ~ ~
Oa IFl M0 04JCl
COQO ~
Oa4JW NN 0 C M
gN N QSaa CO ~
N4J0z
4Jt4 0g4l SlV IS N
a4 0 4JSI W Sl 0Oa CJ 'U A
4IHMOa
4lCJI 4l M
NIJ CS QOUOA~N
633
U ICO
:iO+w
HO&
A SalZOD 'Q CJ
O
aSIS
~ OaCJ 0 8
0 N'0 W ClCa 4J Nal V
NOl4I
N SOWN N4 MCJ IS 44
4J 0&0 0 0
0 lmN
4l N Sl'0N JJge N
CJ CS0 CJ aC
WSIW 0NJS N 0ISNN
N Vg M
CJ00 4I~ J 0 NV 8 NN N
4a0 CJ
SS 0 Cl~4*-8
OCll4J04IVClSaa
4J0 0VSl CIJ04I SlV 0V N O
Q
N Oa CO aJl Pl Q QNatlallPaaQQOa ~ ~ ~ ~ ~ ~
QQOQQ
O Ct N Nn aPI a0 aO Oa aS' O Q~ ~ ~ ~ ~ ~ ~ ~Oa N N tb < Q O Oa0 aJI N
h + > Oa N COO aO ~ A Oa W~ ~ ~ ~ ~ ~Oa NI W N
~ ~ Q ~ O O a0 40a0 a0 Oa aPI n a0 n O~ ~ ~ ~ ~ ~ ~ ~Oa a0 CO a0 % ~ CI DOa CO ~ N
aJlaneanr Q8N+Q<+~ ~ ~ ~ ~Pl aPI CO Cal O Q
CI ~ Cal aPa O aCI O lhw+NN
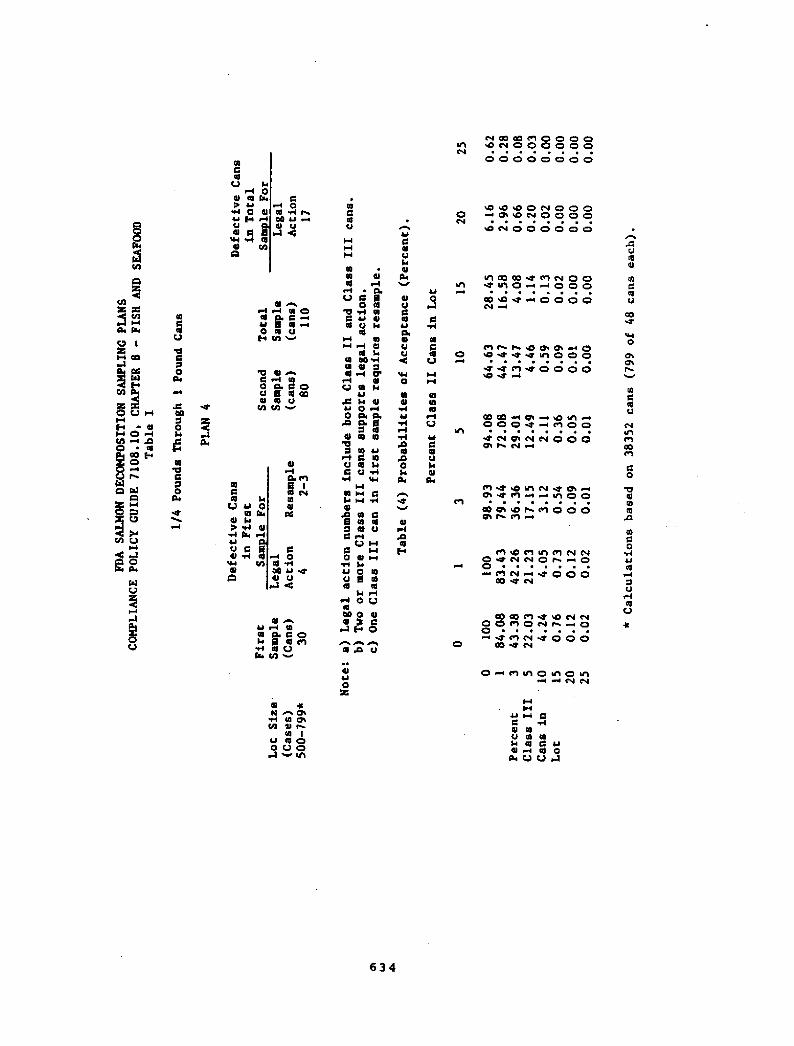
ISC NCJSl 4IJJ
0JJ fe4l CW WNCI
0l4 C 0
N SS JJ0 V
N C alCJ
A V ISCl
M
4I ~N 0
NOC~g alM
0 N Cl&I OS~ W 0
W0 M
NCM IS0 Oe CCIV g NINN N VIJS IJI ~ 4I I4
SlQ
4I Na V0
ClOe Sa
8g
C gJJ
4I SJM leeV CCl HW N
0Sae 04
IS0JJ
V
CJ
C0aS W
44 JJ W4l V
IU ~JJM NN O C O
SS N Celal a
Oe OS~4lIJ0
MM
CCN NV N Sl
C JJ4I M Cl 0Oe CJ CJ A
4lN ~CSe
N 092IJS Cl m
NIJ al O0UQ
8
'V IM COI@4
0 CJ M~ 4I
MOM
CI <A
0
N ~Sl SI
0 C m'0 a4 alC JJ NSI V
aSCJ
SI leN SOWN 4INM CP
4lCJ al
JJeC Se 4l
0 M0 OeOAl O 8
al4l Sl N'a
IS 4lWCNCl 4IC V W
WSIM CN
N CSS IS N
4I VC MC0 N MJJ 0 NV SSI4 IS
04ISO0 NN 5 CA Sa 0
0N
C4I
ClOe
ealJJ
4I 0VCNJJOeN N
CCJ IS O0
N CO NS cl 0 0 0 04N000000~ ~ ~ ~ ~oaaoooaa
ededeJSONOOO<NeeONaaaa~ ~ ~ ~ ~ ~eN000000
Ml Cd Cl e e N 0 04 Ml 0 + + 0 0 0~ ~ ~ ~ 0 ~ ~ ~IO e C M 0 0 0 0
eel Ce ~ eO Ne deeO W < < IJl 0 0 0~ ~ ~ ~ ~ ~ ~ ~N W Pl W O O O Q
Cd 40 M Cle m eO eal0 0 0 4 < Iel 0 0~ i ~ ~ ~ ~ e ~< N 0e N N 0 0 0
N M
Iel N e0 lal N W de Mde ~ Pl M M eal 0 0~ ~ ~ ~ ~ ~ e ~NSdeedt OOOO0a Ce Iel ~
Cl ed Pl Vl Iel N N3 ~ 4' N N 0 6 w 0~ ~ ~ ~ ~ ~
NM+000
COCdne4'eON N0080N>~a0 ~ ~ ~ ~ ~ ~ ~~smN+000IO O' N
0 M cel lal 0 eel 0 ealM N
634

0 cd0
CI «4 R4! 4J
0 4lJJ«JCI N 6WW cdCI cO
0cd W Ylrrd 4JCI V
JJ0 CIV ClC4
ClV
JJOeCl«J«J
W 0
M M
O cCr & if'r a CCr~ ~ ~ ~
CO A 0Yl H
OOOOOOOO
I
'R O H0H ~ CI
«JAN
0 N cdCO 0HH
OOOO
cdJJ0
0Idc
N Cl Vl O~ 1 ~ ~R «Cr
r
e+OOOOOO
OOOO
N 4IJJ
«4
0 IJF4
C CIV ClC4
sC I/i
0<WO ~Ch 0 N
~ ~ ~ ~%~0mCh '4! N
0~~0Crc H Q Q
>OHH Cfl ~ cdOcdr &
0000
0 rO
A I-I
0 QX4 OC6 H
4 00 C4
'O
CIC46 ~c4
CC
0«4O JJ 0
Ndl!W ClW jr«a H
v 4 64I W cd
Cl
& CD IN O< ~O0
lh CV'I0 N CV
e ~ ~ ~
NHOQO
0Cj«rd JJ
HWWO~NOQ
~ ~ ~NO 0 0
C0 Ch WO C1 ChQ ~ ~ ~
CCr Yl vl
I0
cd
4! ~ OO e1 < OQ ~ ~ ~
Pl
4I ~N
0 C w6 «dancd O
lA Ch P1 OIN IN 0 0
INOQO
' ~ ~4I4J0R
LJ
4I NV N
icjCrC4 O
Cl«C ~CA
dl ChCO 4I
N«4 Q
0OO
NCa JJN 0
635
cd ~N CI
O C 60 «4
'CI W N4l
VCl
M Nl4l
ClN rrd wN ClCj H 0'
CIO N IJ
C 4 ClJJ 00 C4 C4
C4 6cd
Cl N N'cd
dl JJg N
VV
W
N M gClCl N 06 N
cd V
O0 H0 CIH
JJ 0 N«J 6 Ncd c4
0 Ocrrj 0 clCl Q 0APO
0rc4000000l«l 0cRHOOOOO~ ~ ~ ~ ~ ~ ~ ~
QOQOQOOO
N%NN OOOOO RC!<00000N ~ ~ ~ ~ ~
%~000000
O H A Vl O R O AN

OA~QQQOOr <QOQOQQrc ' ~ ~ i ~ ~ ~ ~ ~OOQOOQQQIS
0 CI
4 IS!
0CJ4l CW 4A
40W ~
SS cJ rC4 CJ
IS
4 VOL Ch Q rJ 0 Q Q Q
OScOrJOQQOQ~ ~ ~ ~ ~ ~ ~CO CV 0 O 0 0 0 O
IS W4 0 gIrl~ J g 4 Mf4 Ch W'
W 04 ~
ce H Nrc004MV 6 4 w4l el VCO CO W'
W0 M
4 NISCJIJ
a4 4a v0IJ 4I
l4
|t < 4IMQHcrl M a
$ lO lOe
0Oe
4 0 III n4I I4I rcOSC
Q0 <
RR
N 4 SlCl
4IT4
W gayCJV 0ClCla
VlCh0
ISc4Ia 0 0
04SS CJ l04l V
N 0IJ4
V clCJ
4 ~~ J M I4N CCe Co&
Sa c4 Wcl Cj
l4 CO w'~ iClIJ0
N4I ChN ~W
N mCO 4I I
N OIJ NQ0 UO
IJ M CC44 ISV N SlIJ ClNM CI 0Oc CJ A Q
8
A
C5 Iz
0 llM
SlN 4
CJ 0 g'CS + N
44 V IJ
4M NM MSl SSHSl 4Cl M CP
4N4
C IJ 4l~ J Owl
4 N N'0IS CJ
H 4 NV 44 V W
WN MCl
Sl 4Q4 4
CI V
C w0 4 MCJ 0 NV 8 SIIS I4
IJ M0 O
Cl440 4A lR O
04lClCI4Oc
~ J4I 0V
4CJ0Cl I4CJ CCJ 4 O
CJ
NI O O Irl O O 0 0<~<~0000~ ~ ~ ~ ~ ~ ~ ~r >MOOOQQ
COMWAeooo<IN+COQQQQ~ ~ ~ ~ ~ ~ ~ ~40400000
m vl 4! M CO th O 0NNAHPIOQQ~ i i ~ ~ ~ ~ ~COOFl<0000
lCI A 0 w w < 0 0tho<Rwooo~ ~ ~ ~ ~ ~ ~0 r or ooooCh< CV
rJ Irl Ul 0 0 m 00 c4 c1 cO w a 0 0Q ~ ~ ~ ~ ~ ~ ~
O~OOOO4
g rJ cO 0 M M 00404rc<00Q ~ ~ ~ ~ ~+ 4 OI «0 0 0
W CV M
0 M re lh 0 Vl 0 Lrlrc rc
636

ISCJ
04I 4 De
4J0 4~ J
4I C CWel 4
VC 0Cl W Q44 JJ Yl 0 ceI
M
00
W 0
JJ0
0 Ml'0 C 00V 4ICJJ
CJSeC 40 W M
0 0 0 0ICe
4lJJISClIe
5 ICS C4SC
4
04 Gee
4l4l
W fse M4JVCH4I M 4IW VJ4lA
4J0
C 04 444I CJ
0W
a<0eel O O~ ~ ~000
4l
a e44JCOwwa
eaa~ ~ ~000
4 ~SI
0 CCO5 Slm4 CJCJC ~
4I4J
e0
0IJe
4J4
4e0 V~ ~4JJ0K
MJJC4 SlV 4I
44I MI4e CP
4ICC
IS 4Ch 4O
4 OIcl
OUw 4J4 00 A
637
A
R~CO
I4e See0 IRM C0
KCJW0
4Q 0 etWCh ~ 4I0 CO &Q O0CJICI AZ Q'0 05M
< Og ICe
4 ~
CJ C gSl
C 4J 4I4l Cl
4M SlMA 4I
44 40&Cl 4I4 W
40 4l le
4JeC 4e 44J 00 0 00 C g
Sl 4'0IS 4JC
CJ 4C V
W4 M
4 C8 4 IS
C4 CJC M
CeJC0 4IM
0 4V g 44' I4
0 J4l440 4AIRO
4JCCICJ4lCe
4lC'4l C O4JC
4V CV IS
V
4 Sl Icl4I Sl
4I4J
~ JC
IS 4lCJ
0 be4 4lICe I4e
eel eel 0 0 0 0 08000000e ~ ~ ~ e ~OOOOOOO
0 0 e0 O 0 0 04 eel 0 0 0 0 0~ ~ ~ ~ ~4+00000
0e e0 CV e4' 0 0O04000~ ~ ~ ~ ~eeld odd 0N W
rVO«cvdo80 lclceldod~ ~ ~ ~ ~ ~ICl 0 Cec 0 0 0 0'Cl W
4 Ce92 w A e0 wCC 0 Cl V + 0~ ~ ~ e e ~e0NC0ceJ 00Ch Iel
W Iel 0e e0 P92 Cec 0I der nod~ ~ ~ e ~ e ~Ch 0 0 e 0 0 0Ch'0 M
40 cel CeOOOC~ ~ ~
C0 CeJe0 Cel
O 40 e00 Q C0 Ill~ ~ ~
~ el CCCec
0 w cel Icl 0 Iel 0CV

Ih '4 Vl N Q w ~ Qe Ja <eCO<QQOaI ~ ~ ~ ~ ~ ~ ~
N CIJ A O O Q Q QCCJ
0aS Cl Caaa! u
0 0u SJ wVCl 0 8W Cl CJJIP
Cal N h aJC IhVl aalhaa&Vl<OO~ ~ ~ ~ ~ ~ ~ ~
> aa W N < O O Q
IS0V
ClCOJJ NCl V
0 ~IS
IS O,0C0uI IS~0 Cl V&4 CO~
'0 00 IS
IS0 aaCNV g el~CI IS cJCO CJJ ~
W 0
CO0
I4A u
0 00 lC iaO JJ 0
IC CaaCl
aSMgaa Wu CJ 0 gCI W aSW CJJaSa
caCa
CI0 0 0
00
Clco u NCl CJ
ClISISaCl0JJaCe-I
V a4CJ
aS wJJH NCC CL0aaIJ g JC
IC QIaa Ctl ~
~ ' ~CI~ J0
Wg
IOIO Clnl C u
Cl 0C7 VW
CIJI
ClCJJ CI CC
Cl QJJ aC Qav~W~Y
p8
Iw IJS
OV~s
Q IalCh ~ 4
$ eI 0V >P Ol
CICJO 0
0CS pJCa JJ
VCl
M
CSIaS
O ClJJ0
0 OaCl aaaS'0
IO~ CCV CCC V
IS~ a WCI
CI8 el
ISC M0
O0 aSu 0V 8IS
0ClCI 0aS
JJC ClVJa
ClVaIOu C4Cl
0 Cl
JOCl0Oa
IAJJ N
0 0CI0
IVI[J
CCaSQ O
u CICJlaCIOa
~ O aa w re W A O NCON~aa'aaAWO~ ~ 4 ~ ~ ~ ~COr N><mQQ
Qa000+h ViQn aa e ca ~ a0 n W~ ~ ~ ~ ~ ~ ~ ~caI 0a cO cO N W ~ Q
Cal N
Cal Ch P Q 0 Pl e N~ aa N M CO aa Jaa CO~ ~ t ~ ~ ~ ~ ~pl co M asC ae h N Oaa Ifl O' N m
e'er Q~r eN<QNCa~ee~ 'a ~ ~ ~ ~ ~ ~a0 ~ C1 Pl CO N N ~COCOaa<N+
Q~Chaaaa ~ lh aa aa N Oa aO~ ~ ~ 4 ~ ~ ~ ~aalaaeiCO h&aaNOII CJa Cl A Cal w
W INI Cal O ~ Fl aJIIO'CJN wCaICOCI NQ ~ ~ ~ ~ ~ ~~ Ch Cl Pl R CO N N
<7a ca aa ~ ~
QN
638

C s4O M 0
IO Ds4I CJ
0 Cl
4IA
00
OO IJ N4I V
C5 IM lg
~ I ~lO
Ol 0 C CslIJ g 4IN0 CO Cl
crJ ~
'0 4I~gM OI0 0V!IOMCII CII ssJ
IOI0
l4.JOJJ
CCI Ch Pl srls00 ChCh~ ~ ~ ~MODEM
N 0 M rs~ ~ ~
Csl 4 M 0
MMo CslCII
1 at OCI
N
'0 a
0 0gl Ll0
R 0 5g 0
C Ag 0
IO0 CIO CJ 0
IO gsN 4
4lW gas MIJV 0 54l M l4w trJCIa
N th~ ~40 rss
0 0
Cl0
M M0
OOIJ N4I V
IO0 0CJl4CNI NQ
Ch Vl~ ~ ~4! MIO
OONs0Q ~ ~ ~Ch CO sPI
M OeK0 O
IJ M OlIo 0.Cr
g OllO
Oss Cn ~sO0a
M M M gOICl OlCO C
4I 0OO A
4Il4 ~0s
lOCCI 4I
IO Oll lO Q0OM
IJClV4IOe
639
CIO C
004I V
COM M
OlC4 OOIO 4lOI MO OI
CJJO 4CJ 00 OsJO 04I'0
lOC
V IOC V
MIO M4 MClAl Olg OI
sOO
00 4I
0V SCI
40lO
40 0
Cl IJV 00l4Os4ICJ IOV C
OW0IOIO Ol
IOCI O
pls0CI 0
4I0 VOe 4l
C4 lrIN
Mewr eNOQVl R h Pl M 0 0 0~ ~ ~ ~ ~ ~MM000000
0 Ch Ch M > s0 N 0Chrrl>srirs F00
~ ~ ~ ~ ~ ~4<N ~0 000
NIAChOChWs0Ns0mNChrs t ~0~ ~ ~ ~ ~ ~
NCICNOQQ
Csl s0 srl N 0s0sleeeNr~ ~ ~ ~ ~ ~ ' ~ ~C M M C1 C0 N Q 0Fl Csl N
srl Csl Vl Ch 0s h~ 0ChChNr r~ ~ ~ ~ ~<CMOONQ
s0 Ch r Crs s0 srl Ch cslOr ~osCI+aa~ ~ ~ ~ ~ ~ ~Ch Ul ssrl 0 M N W MCh 0l w srl csl M
0 M e 0 e srl e srl

C Cl
O CI CIIJ0
~ J CJN CW WO
4c0
Id0
cd W44 4J 0CI
CJ
IJ0CICIN ccldec C4
4J0 0Vcd 004l Cl cCIV CfV
V
H H H
Cl mN
cd 0 NcJ IC Cl0 rd V~CA~
O
'0 4l m0 OV Id cdCl Cl VciI crI ~
W 0
CC0
Ccc4J
N dlCl Cl
cd Q4J
Q4I
JC CN Cl~ D CJ0
ClI4c hc
IACl0 CICJCIrl g44V 04I WCICi
4l0 0 0
Cl40 414I V
CI4J H Cl
Oo Cg cC
Crc Crl ~ ~ 4ClIJ0
H H4JCl NV N
Cl4lIlc CJ
Cl NN ~
N ChcrI ci
NlJ CI Q0 U O
gg IJcd 0CJ A
640
Ch
ICO
!~OVH
aHO IrlCA
!md0a hI
C 4RR
NcdCJ C
0IJ
Cl Vcd
H Hcd444l
Cl HN4I
C Ic4I 00 0
Cr04l N'0CC
V Cl0 V
HClCICh Ng N
ClC H
O00 4IM4I 0V a
0Cl44 0
ehICh~r HOOIce cOh Pl~a QOO~ ~ ~ ~ ~ ~ ~
OOOOOQOO
CN~>rrIChr ~O~COClcOROOO~ ~ ~ ~ 0 ~ ~e1cV +OOOOO
N ~ % CO h Ch wOOr ~e~ao~ ~ ~ ~ ~ ~ ~ 'IQChcCCPl~aOON
a Nra << wchPl A O O W c0 P92 Q~ ~ ~ ~ ~ ~CCrlcrr OcCCwaoCcICC HH
Chaooac0arh crI 8 O O + c0 e~ ~ ~ ~ ' ~ ~ ~ ~c0CciCNh Orrroo
44
c5 ~ cCI O O % w c4e14hh nomad~ ~ ~ ~ ~ ~ ~ ~e CN c0 CCI W cCC w OW c0 e nS ~
thc0<c1 c0 «hlrrl Ch 0C M sA Q CCI~ ~ ~ ~ ~ ~ ~CCI Crr CO hr le Ch Ccc QCh Ch c0 W N
cPI c0 ch O w coO crc m w e O ~ c0Q ~ ~ ~ ~ ~ ~~ CO ah c0 CCI O d1 O
Ch h
O~nannnnP92
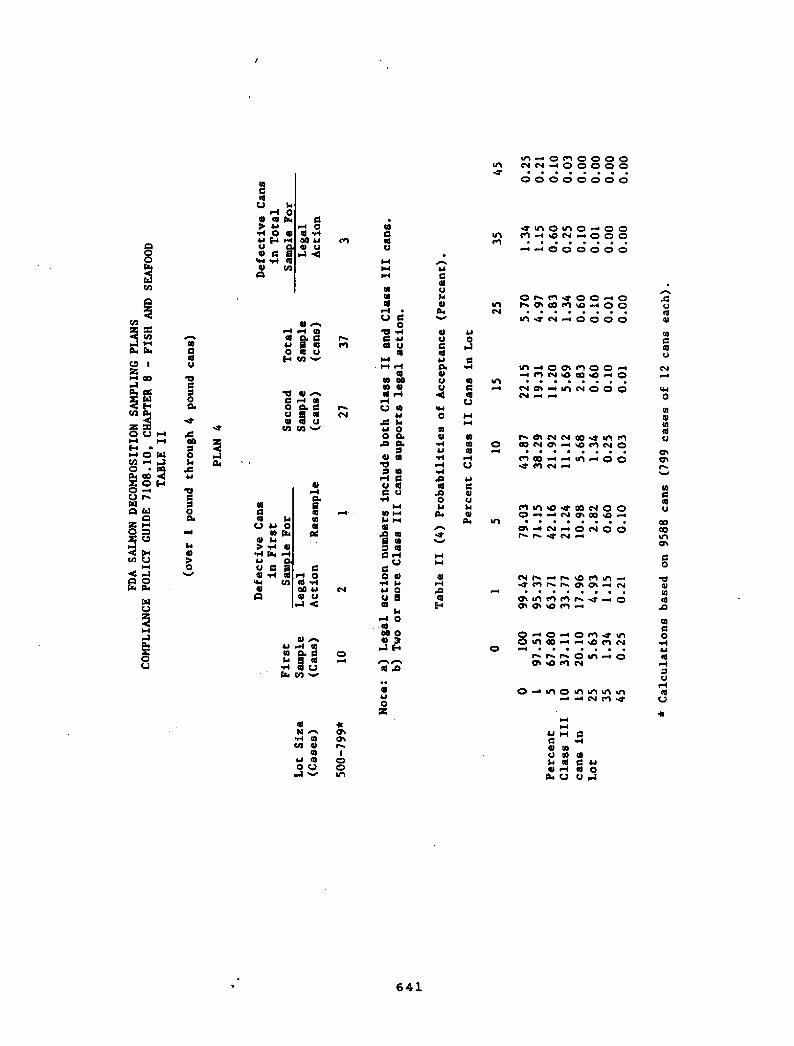
r4CJ fc
04I 4I fcc
CJ0 4I
C ffccc H r44I crfa
C0IS W
44 IJ4I V
H4J
C N 4ISv
0 elC
OeclV C4V C
0C4C0IS4I 4I
IS 0~ J Cl
O
IS CO 4I0 tJifr
ffc ul
'0 C
0 0 C0 CI4I
N
4004e4J
C0
ISV 4J 0
IS Isa4I lc
4IW fse H
4I Ww crlCI
M
C 0IS M40 4J4I CJ
4J4I
fCe
0
4IIJ0a
JJ HC4l ISV4 al4I Hffc CJ
4lCl Ch
OI 4I4I I
4J '4l 00 V 0
Irl
641
3!M ISI
$5
5 KJH HaHO falCrl
4 fcf
glR
0
C4C4ISCJ C
0tf WC 4JSI V
C4
40CS cl4I H
Sl4Jfc
4J 00 44
C4C
4l C4'0C4C
V ClC CI
IS M4c H4la C4a Sl
SIC HC
CJ0 4l4J 0V 8IS
040 0
AMOROOOONNMOOOOO~ ~ ~ i ~ ~ ~00000000
< A 0 ICI 0 H 0 00 6+4NH000~ ~ ~ ~ ~ ~ ~
e<OOOOOO
ONFl<OOHO> Ch Ct R Cl M 0 0~ ~ ~ ~ ~ 4 ~ ~crl<NM OOOO
cfl + 0 Ch Fl 0 0Pl N c0 CC 4 < 0~ ~ ~ ~ ~ ~ ~
N Ch H crl N 0 0 0N
Ch N N CD Q Icl PlCff NChH'4&NO~ ~ ~ ~ ~ ~ ~PWCO+wtcCIMOO
plcrl& NINN0 00+<N cfcgl4+~ ~ ~ ~ ~ ~Cfc O N M 0 N 0 0r
NMMNQChChCCHN~ ~ ~ ~ i ~ ~
Chewer <HOCh Ch 4 P! M
0>OH084e0 crl cc H M cl Pl N~ ~ ~ ~ ~ ~
r mwOglMO
0 M cfog 0 w crl ccl crlM N Pl

erl «O' M 0 C«I 0 0 0 0MMOOOQOQ~ ~ ~ ~ ~ ~ ~00000000C l4
0al al
0
u V 4I CW alC0
040
al wCS uea V
M u C alV 4 4lOe
4l Ir«al 0.4u g ea0 ea V
CO v
4lCM IS0 0«C
g alal e4 VCO CO v
4004
'0 C 00
CecJ u4l 4W leeuV 44I HWClCI
M M4 0
ea WCO ual V 4 0
u ea
V ea4I ~
u A Nlal 0 4
g alal CJ
Iae CII v al «0~ «ISu 0R
C4I0 ISl4 4 u
0OAK
4l *Cre
IS CreCO Cl Ch
ra Iu la Q0 U OQV CO
u C 4l4ISee
642
3!I' IC
M m
'ee I
ee «IMM QCO< yJ
0A ael
0
ealae4CJ
017 WCea V
alM
44C4 4lal +
u0
0 00
IN IS«Oal
V la4 V
al Mal«0 ISg al
al4 M
040 ISu 0V gla
0l4
4l uV 0Cu4Iv alV 4
CJW0la4I ca
IS Qu l4
I@I'«C
u«0 CI0 V
4Oe al
Oe err
CO 4' «0 O' Vl O O 0mr SMQOOO~ ~ ~ ~ ~ ~ ~ ~00000000
c«I cO 0 m «0 IA O 04 > 0 m <1 0 0 0e ~ ~ ~ ~ ~ ~ ~«4' C«I C«C 0 0 0 0 0
M CO &«0 Cre«0 erl00 n I««rrr Cn e 0 0~ ~ ~ ~ ~ ~ ~ ~M Ch Ch W M 0 0 CI
Oe «O 4 r«I 0 r««a' C«I0 r««e0 C«I Pl m M 0
~ ~ ~ ~ r ~ ~ ~+c1 +Oe< 000~ rl < C«C
NMOmChm«CIAerl erI «0 oe m cre & O~ ~ ~ ~ ~ ~ ~ ~mowcomMQQCO CO ra' M
0 crl Oe Oe O «0 I«~ ~ ~ ~ ~ ~ ~
M «0 O cle erl Yl 0 OOe «0 hl «H
cOOr cV rQ 0 Cre 0 Oe eel m M0 ~ ~ ~ ~ ~ ~ ~M r«Pl Pl «O W 0 0
Cre «O C«I M
0 M Ul O A Ih erl Ara w c«l c«I ~

O0
IS Ae0
u+HSI 0WM ISCl
00
00 uSI CI
M
u 0u0
04
A OIS e ~0<I0 N
CICI4 ISu C4CJCl
W 0
IaM Cd
%<ANNO%<NNOO~ ~ ~ ~ ~Ch Pl ~ Q Q 0
M
00
0 uu
OOMM MsH 0 04
0 HOr0 IA
4
N O
ISJh4Os
CdCd
u44I N ClV
Vl ~ ~CI0 4I Cd
C J0 0
Vl 0I ~ Cd N NC1 |0 M dl N 0~ ~ ~ ~ ~ ~ver ~00C I0
u 0IS CCI
0CI
W gse Hu
CI IlSI RW CIIa
NI
CI0
M NeolC Vl afl h~ ~ ~ ~ ~ ~>ZNNOOI/i NH
O thQ ~0
0IS R00 u 0 4
u IS
V ISO
N R ISIe ICl m W r Cd~ ~ ~Q dl + ~ ~ ~ANMPloa
CIsA
0 0 %
~ 920u 0KCI I
CICI0
' H
u M 00OI IIIO IS IS
0 uCI 6 CI 0OOOO&
ClN
ISCA Cl
IS0 O
643
IS
O0
c uIS
IS
SI00
IS SIIS MSl
u 00 Oea 0IS Sl'0
Sl0
V I4 ' CI'wlSl HISCl ISI CSC M4
O0 ISu 0CI lIIS
0IS00 0
cd 4 N 0 0 0 0 0IA QOOOOOOO~ ~ ~ ~ ~ ~
ooooaaoo
C000NCdNCIOOICl<NOOOOO~ ~ ~ ~ ~ ~ooaaaoao
% % 4! w N N 0 0QN<ANoaoN ~ ~ ~ ~ I ~48<oaoao
IS N N A 0 CI r Cd mIS h' < 4 0 N ICl Q 0IS 0 ~ ~ ~ ~ ~ ~ ~
+QNIOPlQQQO Ct VlN
OM4llOAAA VhN C1

4CJ
94l 4 Iaaa
u 9JJ Q WCJ4I C gkW W 44I CA0
C9
40 JJ4 V
~ JC 4l
4llla
W 0
c4JJ0 0 0 aPI
u
'0 C 04lu cl4l
C 40 u 0
C4 Cca4I! H CJW Cca Wu CJ. C4I HW CJJO
JJ
0 9W4l
04IClafuIJI
04 H40 JJ4l CJ
I44I
u 4 9Oo
W DaQ Ill Cal~ ~
~ ~4lJJ0
~ C4lCl 4l4Cu
04!C! A
4Ic4
CJI 4 OI4 O
u 4 IPI0 CJ
A
~ J4I
4lOa
644
48
0 I
M OUwM
~a ra
W al 4v wCI Icl'X MO 0
Cl440 c
0'0 MC IJ4l CJM
4I4 404
0 c4JJ
~ J 90 LAl Ca4I5 c4
CV 4C V
4l WIJ M4l
4l8 a4
4IC wC0 4lJJ 0V NC4
0c444 04I
4l IJCJ 0c4Cu COe4I IPIV l4V C
W0
W44I 4
C4 Q4
u4 CCl 4I9 CJ'4l4 4I
ov
~~OOOOOOOOOOQOQO~ ~ ~ ~ ~ ~ ~oaoaoaaa
0 c0 8 + 0 0 0 0Hoaoaooa~ ~ ~ ~ ~OOOOOOOO
< % a0 O Ol O 0 O408<0000~ ~ ~ ~ ~ ~ ~ ~HAOOOOOO
I cacao~maoRcVCCIac10 0 0~ ~ ~ ~ ~ ~ ~ ~Cal a0 < w 0 0 O 0hl
0 w acl PC n 0 ~ 0Qer ea~aa~ ' ~ ~ ~ ~ ~ ~ ~Daa a0 Pl cd ~ 0 0 0
a0 a0 ICI N 0 Ccl & Oa00aaaDCh&aa~ ~ ~ ~ ~ ~ ~ ~Ccl Cac e gl PC 0 0 QCa I@I M
lb0aaDICI ~ ~CO ~Ca a0 Cal n Cac ce 0 0~ ~ ~ 1 ~ ~ ~ ~Da R acl 4 a0 0 0 0
e>OQ~Q~ ~ ~ ~ ~
Car ~OO
0 w & 0 aPI IPI IPI lhw cac C1 +

Guide 7108.11 Shrimp Fresh or Frosen Raw Headless, Peeled orBreaded Adulteration Involving Decomposition
1. Criteria for Decom osed Subs: A sub shall be classifiedas decomposed: If five percent �R! or more of theshrimp are class 3; or if twenty percent �01! or more ofthe shrimp are class 2; or if the percentage of class 2shrimp plus 4 times the percentage of class 3 shrimpequals or exceeds twenty percent �0K!.
2. The product is defined by three classes of decomposition.The probabilities of acceptance were determined using thesimulation procedure described in A. 2 above to estimatethe percent decomposed for specified percentages of class1, class 2, and class 3 using the above criteria fordecomposition. The estimated percentages were then usedto determine the probabilities of acceptance based on thebinomial distribution. The sampling plans are as follows'.
NO. OF SUBS
EXAMINED N!ACCEPTABLE NO.
DECOMPOSED C!
612
18
645
3. Presented in the following tables are the a! simulatedpercent decomposed subsamples, b! probability of acceptinga lot using a N 6, C~1 plan, c! probability of acceptinga lot using a N 12, C~2 plan, and d! probability ofaccepting a lot using a N~18, Ce3 plan.

~ ''! lialsted Percent decosposed based on criteria for decoayosition and~ ssnnin8 100 shrinp Per sub.
Percent Class 3
1510
PerCentClass 2
b.! Probability of Acceptin8 �! A Lot Qsin8 A n~6, C~L Sanplin8 Plea
Percent Class 3
10
PercentClass 2
646
0 135
101520
0 135
101520
0.00.00.00.00.28.2
55.2
LGO.OO100. 00100.00100.0099. 9991. 926.79
0.40.60.82.4
15.844.277.2
19.821.223.234.252.084 ' 096 8
99.9899.9599.9199.1975.7617 ~ 370.30
55.659.6S9.870.886.09S ~ 499.6
66.0362.5957.7133.43
9.170.050.00
97.$98.299 ' 299.499.699.8
100eO
6.524.524.190.960,030.000.00
99.8100.0LOO.O100.0100.0100.0100.0
0.000.000.000.000.000.000.00

c.! Probability of Accepting X! A Lot Using A n~l2, c 2 Sampling Plan
Percent Class 3
10
PercentClass 2
d.! Probability of Accepting X! A Lot Using A n~lg, c 3 Sampling Plan
Percent Class 3
10
0 100 F 001 100.003 100.005 100.00
10 100.0015 95.5420 0 ' 09
PercentClass 2
647
0 135
101520
100.00100 F 00100.00100 F 00100.0093.08
0.76
100.00100.0099.9999.7470.80
4.730.00
100.00100 F 00100.0099 ' 9268.58
1.420.00
56.5451.6244.8316.51
1.370.000 F 00
50.9745.0237.06
8.890.230.000.00
0.700.310.290.020.000.000.00
0.080.020.020.000.000.000.00
0.000.000.000.000.000.000.00
0.000.000.000.000.000.000.00

D. Guide 7108.24 Decomposition and Histamine in Canned Albacore,Skip!ack and Ye3.lowfin Tuna
1 ~ Criteria For Recommending Legal Action to the Division ofRegulatory Guidance DRG!
a.! Danger to hea3.th: The histamine content of any sampleequals or exceeds 50 mg per 100 grams in both the originaland check analysis; or referral to DRG is authorized wherethere is documented evidence of an illness associated with
tuna containing levels of histamine lower than above.
b.! Decomposition: A minimum of two subsamples cans! persamples equals or exceeds 20 mg histamine per 100 grams inboth the original and check analysis.
c.! Referral: Referral to DRG is authorized where aminimum of two subsamples cans! per samples containbetween 10 and 20 mg histamine per 100 grams bothoriginal and check analysis! and either odor or
is present and confirmed by a qualifiedorganoleptic analyst.
d.! For the purposes of this guide, 24 subsample of cannedtuna will be examined organoleptical3.y and for histamine.
2. Class Designations for Histamine Levels mg/100 grams!
Class 1 � X 9
Class 2 � ~ 10 to 19 and either odor or
honeycombing confirmed to be present as above.
Class 3 - > 20 to 49Class 4 -> 50
3'. Decision Rule For Four Class Sampling Plan
a.! The lot is accepted if the original analysis indicates lotacceptance i.e., En a sample of size 24 cans, there areno more than one can with histamine levels in Class 2, andno more than one can with histamine level in Class 3, andno can with histamine levels in C3.ass 4!; or, the lot isaccepted if the original analysis does not indicate lotacceptance and the check analysis indicates lot acceptancebased on the above criteria for number of cans sampledand the acceptance numbers associated with Class 2.Class 3, and Class 4.
648

4. The probabilities of acceptance P A! were determined byusing a multinomial expression involving four classdesignations'
P A!~ N!/Kl!K2!K3!K4!! Pl**Kl! P2**K2! P3**K3! P4**K4!where Pl-P4 are the proportions of units having histaminelevels in Class l through Class 4, respectively; and Kl-K4are the number of subsamples in N 24 that are permitted tohave histamine levels within the class range levels.
5. Tables 1-7 present the probabilities X! of acceptance basedon the decision rule 3.a. above. En these tables, P2, P3,and P4 are the percentages of subsamples in the lot thatfall in Class 2, Class 3, and Class 4, respectively.
649

Table l.
1510
Table 2.
1510
650
P P /P4 0
0 100
5 88 ' 510 49 F 9
0 15 20 1
20 6.5
25 1.8
30 0.4
40 0 ' 0
P P3/P4 0
0 99 ' 95 87.3
10 48.7
15 19.5
1 20 6.3
25 1.8
30 0.4
35 0.0
95.476.6
40.1
15.54.9
1.4
0.4
0.0
94.675.2
39.0
15.0
4.7
1.2
0.20.0
73.1
52.524.8
9.02.8
0.8
0.2
0.0
71.851.4
24.1
8.8
2.60.6
0.20.0
49.9
33.7
4.8
5.11.4
0.4
0.0
0.0
48.732.9
14.4
4 ' 9
1.40.4
0.00 ' 0
15. 4
9.63.8
1.2
0.4
0.0
0.0
0.0
14. 89.2
3.6
1.2
0.2
0.0
0.00.0
4.02.4
O.S
0.20.0
0.00.0
0.0
4.02.2
0.8
0.2
0.00.0
0.0
0.0

Table 3.
1510
Table 4 ~
10 15
9.6 2.4
5.7 1.42.2 0.40.6 0.2
0.2 0 ' 0
0.0 0.0
0.0 0.0
Table 5.
10 15
651
PP/PO
0 97.4
5 79.810 42.2
3 15 16.320 5.1
25 1.4
30 0.4
P2 P3/P4 0
0 88.55 67.3
10 33.35 15 12.4
.20 3. 8
25 1.030 0.2
P P/P 0
0 49 ' 95 33.3
10 14.310 15 4 7
20 1.2
25 0.4
30 0.0
88. 2
67.2
33.412.4
3.81.0
0.2
76.6
55.426.0
9.4
2.8
0.8
0.2
40. 126.0
10.9
3.6
1.0
0.2
0.0
64 ~ 044. 6
20.47.12.2
0.6
0.2
52.5
35 ' 515.5
5.3
1.6
0 ' 4
0.0
24.81:5.5
6;1
2.0
0.4
0.0
0.0
42.4
28.112.0
4.01.20.2
0.0
33.721.9
9.03.0
0.8
0.2
0.0
14.8
9.0
3.4
1.0
0.2
0.0
0.0
12.6
7.6
3.00.80.20.0
0.0
3.82.2
0.8
0.2
0.0
0.0
0.0
3.2
1.8
0.60.20.00.00.0
0.80.4
0 ' 2
0.0
0.0
0.0
0.0

Table 6.
10
Table 7.
15
652
P2 P3/P4 00 20.1
5 12.4
15 10 4.715 1.4
20 0.2
25 0.0
P2 P3/P4 0
0 6.55 3.8
20 10 1.2
15 0.4
20 0.0
15.5
9.4
3.6
1.0
0.20.0
4.9
2.8
1.0
0.20.0
9.0
5.3
2.0
0.6
0.2
0 ~ 0
2.8
1.60.4
0.2
0.0
5.1
3.0
1.0
0.2
0.0
0.0
1.4
0.8
0.2
0.0
0.0
1.2
0.6
0.2
0.0
0.00.0
0.4
0.20.0
0.0
0.0
0.20.2
0.0
0.0
0.00.0
0.0
0.00.0
0.0
O.o

MODEL SEAFOOD SURVEILLAKE PROGRAM
E. Spencer Garrett and Martha A. HudaR-RoosNOAA/%PS/National Seafood Inspectioa Laboratory
P. 0, Drawer 1287, Pascagoula, KS 39568-1297
IXTRODUCTIOX
Seafood inspection is one of the most discussed topics in the area offood inspection today, Attention from the media, consumer groups, aadCongress has brought seafood inspection to the forefront of foodprotectioa discussions.
MODEL SEAFOOD SURVEILLAECE PROGRAM
Because of the attentioa dram to seafood inspection by such consumergroups as "Public Voice" Public Voice 1986, 1987!, TV exposes, andlegislative proposals U.S. Congress H.R. 1483; U.S. Congress S, 1813!requesting the mandatory federal inspection of fish aad fisheryproducts, Congress appropriated 4358,988 to FOAA Report to AccompanyH.R, 5161! for a two �! year study designing a program ofcertification and seafood surveillance.
The Congressional mandate requires XOAA to base the program oa theHACCP system aad coasult and coordinate with FDA, USDA, the fish andseafood industry and the States. Initial worR on the project began inFiscal Year FY! 87.
The objective of the Model Seafood Surveillance Program <TBSP! is todesign a fishery products surveillaace system which will provideconsumers reasonable protection in the consumption of fisheryproducts. This system, based upoa the HACCP concept, will provide forequitable treatment amoag domestic aad imported products,
In order to systematically follow a HACCP approach, the ESP has optedto follow the recommendatioas made in a report published by thelational Academy of Sciences %AS! ia 1985 ERC 1985!. This reportdefined the recommended procedures for utilizing HACCP ia foodprocessing plants, In the 1985 publication, the 3'AS emphasized thatwhile regulatory authorities should provide the broad outline of aHACCP system for each commodity, the specific details of applying HACCPshould be the prerogative of each industry. The %AS recommends thatindustry commodity groups should taRe the lead to define eachoperational step of a processing operation, indicate the hazard, andrelative importance in each step, identify the critical control pointsfor the significant hazards, define preveatative measures to minimizethe hazard, and detail the monitoring procedures either by observationor measurement which can be used for compliance procedures. After suchan industry drivea system is developed, the regulatory authoritiesshould then have the opportunity to assess the appropriateness ofselected critical control points and monitoring procedures, Further,
653

the WAS recommended that regulatory authorities should have theprerogative to review the action taken when in-plant monitoring resultsindicated the need for corrective action.
Having made the decisioa to follow the recommendations of this KASpublication, IIFS built on this basis for the conduct of the study byclassifying potential consumer hazards in the coasumptioa of foods,including seafoods, into three categories, i.e., �! product safety,<2! plant/food hygiene, <3! economic fraud <see Figure 1!.
Our initial efforts ia this study to address public health hazardshave focused on separating perception from fact. Causative agents ofpublic hazards in seafood are either environmental <natural orman-made!, or process or distribution-chain induced. In reality, areview of the Ceater for Disease Controls' CDC! seafood-borne illnessoutbreaks published data <CDC 1979-1985! indicate that the problem ismanageable. Specifically:
eighty-seven perceat of seafood related illnesses areattributed to very few species � those that areciguatoxic, scombrotoxic, or illness commonly associatedwith raw molluscan shellfish consumption Ciguatoxin aadscombrotoxin are primarily found ia fishes located intropical waters, Specific species sometimes related tociguatoxic or scombrotoxic illnesses include red snapper,grouper, barracuda, jacks, mackerel, tuna, and mahi-mahi!;
eighty-one percent of all seafood related, illnesses arereported, from only nine 9! states or territories:Hawaii, Puerto Rico, Virgin Islands, Guam, Sew Yo&,California, Washington, Connecticut and Florida;
nearly one-half of all seafood related illnesses �9'L!are reported from just four �! states or territories:Hawaii, Puerto Rico, Virgin Islands, aad Guam;
thirty-five percent of all seafood related illnesses arereported from Hawaii with ciguatoxin aad scombrotoxin asthe priacipal causative agents.
Public safety issues in the consumption of seafood are compounded,however, with the fact that 65'L of total U.S, seafood consumption isfrom imported product. These issues caa be resolved, aad it is theintention of the NSSP to have the I'AS address, through a two-yearcontract, product safety issues associated with seafood, From this wehope to gain insight into problems, the relevaacy of current programsestablished to handle these problems, and options to further improveseafood safety.
Food hygiene and economic fraud issues will be addressed throughindustry workshops.
654

Consumer Hazards
PRODUCT FOOD ECONOMICSAFETY HYGIENE FRAUD
FOOD CONSUMPTION
Figvs e L Polentiam Coesuaem. Hazic ds in the Consuaption of Seafoads.

Following the recommendations made by ]fAS in their prev'ouslymentioned publication, the MSSP is designed to have industry take thelead in defining the criteria by which they should be inspected, Inoperating under a Saltonstall-Kennedy grant to industry, the Programplans to conduct workshops on a commodity by commodity <industry byindustry> basis. The workshop attendees will examine the hazardsassociated with the end use of their product and develop a HACCP modelapplicable to their industry. The model will cover plant hygiene<sanitation!, food hygiene wholesomeness!, and economic malpractices fraud!. The attendees will then nominate a steering committee tofollow the testing of the model in e statistically representativenumber of plants in their industry. The testing will be done byrepresentatives of the MSSP who have previously signed an oathprotecting confidential plant information.
The conduct of this program described above has been placed underthe direction of E. Spencer Garrett, Laboratory Director, XatioaalSeafood Inspection Laboratory with a core team of senior INMFSstaff. The study conduct is detailed in a Plans of Operation<PLAXOPS! manual. The team is in contact with FDA, USDA, CDC, otherKAA components and %AS. By request, they are appraising stateagencies, interstate associations, and industry associations of theprogram and progress.
To date two workshops have been completed, one for breaded shrimp Tampa, Fl, October 6-8, 1987! and one for cooked shrimp Chicago, IL,3'ovember 3-5, 1987!. Of the thirty steps identified by the industry inproducing breaded shrimp, nine were considered critical. Much the samewas true for cooked shrimp processing. In-plant testing of the HACCPmodel developed by the breaded shrimp industry is scheduled to beginthe last week in January 1988, The in-plant testing for the HACCPCooked Shrimp Model will be conducted concurrently with the BreadedShrimp Model. A raw shrimp headless and peeled meat! HACCP Vorkshop isscheduled to be held at the Sew Orleans Airport Sheraton Hotel, January19-21, 1988. Additional workshops which are being considered include:raw, whole, dressed, steaked, and filleted fish; molluscan shellfish;imports; vessels; blue crab; Ring, snow, and dungeness crab; specialproduct hazards with Pacific and Caribbean species; smoked and, curedproducts; breaded fish and specialty items; scallops; and lobsters.
Upon completion of all the workshops and the %AS contract, KAAintends to deliver to Congress a surveillance system for seafoodproducts which will contain options for possible implementation with aneconomic and feasibility analysis of each option. During the conductof the workshop- information for plant quality assurance manuals wil],have been developed for each industry, These manuals have applicationsfor industry Quality Assurance and management personnel as well asgovernment regulatory officials,
656

The model seafood surveillance system then, as delivered to Congress,will be based on the HACCP principle, separate the nice fram thenecessary, have intensive industry input, have been built on existingstate, federal, aad industry programs, address ma!or problem areas, andoffer a basis from which inaovative consumer education techniques mightbe drawn,
REFERENCES
1. Public Voice for Food aad Health Policy. 1986. "The GreatAmerican Fish Scandal: Health Risks Unchecked,"
2. Public Voice for Food and Health Policy. 1987. "Hazardous Fish:The Raw Facts."
3. U.S. Congress, House, Joint Committees oa Merchant Marine andFisheries and Agricultural, "Mandatory Fish Inspection Act of198?." H.R. 1483. �88th Coagress, 1st Session!.
4. U.S. Congress. Senate. Committee on Agriculture. "Safe FoodsStandards Act," S. 1813. �88th Coagress, 1st Sessioa!,
5. U.S. Congress. Senate. Committee on Appropriations, "Report takccompaay H.R, 5161." Report 99-425, 99th Congress, 2ndSessioa!.
6. Rational Research Council <ZRC!. Subcommittee onMicrobiological Criteria, -Committee on Food Protection, Foodaad Xutrition Board. An Evaluation of the Role ofMicrobiological Criteria for Foods and Food Ingredients.Rational Academy Press, 1985.
7. Centers for Disease Control. 1979. Annual Sumaary of FoodborneDiseases, 1978. U,S. Department of Health and Human Services.55 pp
8. Centers for Disease Control. 1981. Anaual Suamary of FoodborneDisease, 1979, U,S, Department of Health and Human Services.48 pp.
9, Ceaters for Disease Control, 1983, Annual Summary of FoodborneDiseases, 1989, U,S, Department of Health aad Human Services.41 pp,
18, Centers for Disease Control. 1983, Annual Summary of FoodborneDisease, 1981. U.S. Department of Health and Human Services,41 pp.
11, Ceaters for Disease Coatrol, 1985. Annual Summary of FoodborneDisease, 1982. U.S. Department of Health and Humaa Services,38 pp.
657
CONTR!BUTION OF CATHEPSIN C TO THE FERMENTATION OF FISH SAUCEPREPARED FROM CAPELIN MALLOTUS VILLOSUS! AND SQUID HEPATOPANCREAS
Nongnuch Raksakulthai and Norman HaardInstitute of Marine Resources
Department of Food Science and TechnologyUniversity of California
Davis, CA 95616
INTRODUCTION
Capelin Mallotus villosus! is the most abundant fish in the NorthAtlantic and o~ne o the top ten species landed in the world Anon., 1981!.More than 99% of the world capelin catch is used for the production of mealand oil Jangaard, 1974!. In Canada, male capelin are a by-catch in thefishery for roe-laden female fish. A problem with producing fish sauce frommale capelin was reported earlier Raksakulthai, Lee and Haard, 1986!. It wasobserved that the fermentation rate using capelin: salt �:1 w/w! was veryslow and the sauce obtained after more than 1 year contained a relatively lowcontent of soluble nitrogen compounds, e.g. less than half the free amino acidcontent of ceaaercial products from Thai land or Philippines. Addition ofeither pronase, trypsin, chymotrypsin, or fungal protease 31,000 MilesLaboratories, Elkart, !N! to salted capelin was effective in accelerating therate of fermentation and yielded products containing a relatively high contentof soluble nitrogen. However, the sensory evaluation of fish sauces preparedwith proteolytic fermentation aids indicated they were less acceptable thancoaeercial products.
Earlier we found that supplementation of the fermentation of squid orherring with hepatopancreas tissue from Atlantic short finned squid Illexil'lecehrosus! helped to develop the desirable taste of these products~Lee,r .182!. 5fermentation for capelin fish sauce and, as well, yields a product rated veryhigh by sensory evaluation Raksakulthai et al., 1986!. The purpose of thisstudy was to understand why squid hepatopancreas tissue acts to bothaccelerate the rate of fish sauce fermentation and to yield an excellenttasting product.
MATERIALS AND METHODS
Preparation of fish sauce-
Inshore capelin were harvested by hand net near St. John' s,Newfoundland. Females were removed and the male fish were washed with tapwater and ground to pass a 6 mm plate fitted to a Hobart 7 horsepower meatgrinder. The mince was mixed with salt at a ratio of fish to salt, 4:1 w/w! . The mixture was left at 4 C for 16 h to allow equi libration of thebrine. Duplicate 1 Kg samples were packed in glass jars. Squidhepatopancreas tissue, normally 2.5X w/w of brined mince, was added to jars ta
658

aid the fermentation. The jars were incubated at ambient temperature �0-24 C! for up to 6 months. The liquid fish sauce! was recovered by filtrationthrough Whatman No. 1 paper.
Squid hepatopancreas tissue which had been heated 30 min. at 1GO C toinactivate proteo'lytic enzyme activity was also added to fish-brine todetermine if it affected the fermentation. A set of experiments was designedto test the contribution of capelin digestive enzymes to the fermentation,i.e. fish were eviscerated prior to mincing. Another set of experiments wasdesigned to test the contribution of bacteria to the fermentation, i.e 100 mggentamycin sulfate was added to each Kg fish-salt at the start of thefermentation. Also, the influence of pH on the rate of fermentation wasevaluated by adjusting the pH of fish-brine using 6 N HCl or 50% NaOH.
Analytical Methods-
The pH of fish sauce was measured directly with a pH meter . The degreeof protein hydrolysis was measured by formol titration as described byBeddows, Isamai l and Steinkraus �976!. Free amino acids were determined bydi luting one volume of fish sauce in 99 volumes water, de-proteinizing with12% w/v! sulfosalicylic acid and appropriate dilution with 0.2 M Lithiumcitrate, pH 2.2 prior to analysis in a Beckman Model 121MB analyzer Beckmanbulletin 121MTB-013!. Soluble protein was estimated by the Biuret method Cooper, 1977! and total nitrogen by micro-kjeldahl Lang, 1958!. Sodiumchloride was determined according to the volumetric method in AOAC �980!.Total viable bacteria was estimated using trypticase soy agar and trypticasesoy agar with 10% NaC1 and reported as described by Gi lli land, Busta, Brinda.and Campbell �976!. Sensory evaluation was by a panel of 5 Vietnamese-Canadians using a nine point hedonic scale and analyzed for statisticalsignificance Larmond, 1977!. The molecular size distribution of hydrolyzedprotein in fish sauce was evaluated by gel filtration or Bio-Gel P-2, 80x1.5cm, and eluted with 0.05 N HCl containing 0.1 N NaC1 at 20 ml/h. Theabsorbance of eluant at 214 nm was monitored with a Waters Model 441ultraviolet detector.
Isolation of Proteolytic Enzymes-
The enzymes in the fermentation brine were recovered from the fish sauceby ultrafiltration. A Mi llipore Ultrafiltration Pellicon Cassette system withpolysulfone filter of 10,000 dalton nominal exclusion limit was used to removesalt and other low molecular weight components from the fish sauce. Theretentate was dialyzed against about 100 volumes x3! of distilled water at4 C for 72h. Cathepsin C was purified from squid hepatopancreas as describedby Hameed 5 Haard �985!.
Assay of Protease Activity-
Protease activity was measured with azocasein substrate, i.e. the assaymixture contained 1.0 ml 1.5% azocasein, 0.9 ml 0.2 M sodium acetate-HCl, pH
659

6.0 and 0.1 ml enzyme. After incubation at 30 C for different time intervals,the reaction was stopped by the addition of 0.5 ml 20K trichloroacetic acid.Thirty minutes later the mixtures were filtered through Whatman No. 1 paperand the filtrate Absorbance at 366 nm was read. The pH of the assay solutionwas varied from 2.2 to 8 by use of 0.1 M citric acid-0.2 M Na2HP04 McIlvaine,1921!. Cathepsin C was assayed for dipetidylhydrolase and for transferaseactivity as described by Hameed 4 Haard �985!.
RESULTS AND DISCUSSION
Analyses of Fish Sauce-
Fish sauce prepared with 2.5% squid hepatopancreas SHP! receivedsignificantly higher sensory scores than product prepared with heated-SHP, SHPadded to fish-brine which had been adjusted to pH 4.5, or with no added SHP Table 1!. Sauce prepared with SHP at the natural fermentation pH had agolden brown hue and was significantly darker than the other samples Table1!. Sauce prepared with SHP at about pH 6 contained significantly more totalnitrogen, formol N titratable amine groups!, and free amino acids than theother samples Table 2!. Free amino acids were 78'X and 57% of total aminoacids recovered after acid hydrolysis! respectively for SHP supplemented andcontrol fish sauce. Gel permeation chromatography revealed similarfractionation patterns for the control and SHP supplemented sauces; however,the void volume peak protein! was larger and the lower molecular weightfractions were smaller for the control sample Fig. 1!. These data show thatthe fish sauce prepared with SHP contained more protein hydrolysis products,and also contained products which underwent more hydrolysis than occurred forthe other samples.
Influence of SHP on Rate of Protein Hydrolysis-
Protein hydrolysis proceeded at a faster rate when SHP was added tobrined fish Fig. 2!. Samples containing SHP and which were made to pH 4.5,showed a faster hydrolysis rate than the control during the first week; but,there was less hydrolysis during the remainder of the 6 month fermentation.The formation of free amino acids by all samples was more or less parallel tothat of formol nitrogen data not shown!. The mole percentage of free andpeptide amino acids in the fermentation brine were not significantly differentfor the three lots of fish sauce prepared at the natural fermentation, aboutpH 6. However, the free amino acid composition of sauce prepared at pH 4.5was different; the major free amino acid was leucine as opposed to alanine,glutamic and lysine for the sauces prepared at pH 6. These data indicate thatthe differences in protein hydrolysis for samples fermented at pH 6 weremostly quantitative; whereas protein hydrolysis at pH 4.5 also gave differentproducts. The qualitative differences may explain why fermentation with SHPat pH 4.5 gave a less acceptable product even though protein hydrolysisproceeded faster than the control Table 1!.
660

Table 1. Properties of jish Sauce Prepared Mite aod Without the Aid of SquidHepatopancreas
Preference Scorez Lightness L! Nac> X!Treatment
8 3b i8.8bSHP 5.92
5 3a 5.97
5 3a 5.99
4.8a 4.59
All samples prepared with fresh ma'Ie, inshore capelin and salt �:1 w/w! at20-24 C for 6 months. SHP 2.5% squid hepatopancreas. Values in the samecolumn followed by the same letter are not significantly different P <0.05!.
Preference score based on 9 point hedonic scale; comnercial product had ascore of 5.8. Data for SHP and control representative of fish sauces preparedfrom capelin in three different harvest seasons.
Table 2. Nitrogenous Components in Fjsh Sauce Prepared With and Without theAid of Squid Hepatopancreas
Treatment Total-N Formol-N Protein-Nmg N/ml
NH3-N Free Amino Acid-N
3 42bSHP 4.78 8.94
Heated SHP
Control
2.55 3.68
2.52 4.48
SHP, Acidified 14.43a 6.143.66
See Footnote to Table i. Values are average of duplicate determinations for twolots of fish sauce. Soluble protein-N was determined by dividing Biuret protein by
NH3 N is Formol-N less free amino acid -N and is probably somewhatoverestimated because it includes other sources of titratable -N.
661
Heated SHP
Control
SHP, Acidified
23.85b
12.82
3 94a
i3.7zb
6.Z3'
7 00
9 80c
4 09c
3 74a
3.32
ze.z'
3i 4'
30 5
27.0'
28.8

Absarbanco 214 nm
662

EchE
z 8
0 E0
160
Fermentation Time Weeks!
Figure 2- Progress of protein hydrolysis during fermentation of fish sauce at 20 C. SHP 2.5%squid hepatopancreas. heated SHP proteolytic enzymes inactivated by heating; acidifiedinitial brine adjusted to pH 4.5 with HCI. All samples were prepared from 4 parts freshmale, inshor e capelin and 1 part NaCl w/w!. Formol N is a measure of titratabie amine groups
663

Enzymes contributing to the fermentation-
Fish sauces prepared from eviscerated capelin underwent a slightly, butstatist1cally significant P%.05! lower rate of protein hydrolysis than wasobserved for round fish Figure 3-A!. Using a triangle test for productidentification, judges could not distinguish between fish sauce prepared withand without evisceration; i.e. the contribution of digestive proteases tofermentation was minor.
Addition of a broad spectrum antibiotic gentamycin sulfate! to thefermentation brine was effective against the growth of microorganisms. Noviable cells were detected in antibiotic treated fermentation brine for theduration of the experiment while the control, initially containing 5.3 x 10CFU/g in growth media with 10% NaCl, contained detectab'Ie bacteria during thefirst few weeks of the fermentation Figure 3-8!. However, the antibiotictreatment d1d not influence the rate of protein hydrolysis Figure 3-B!.
Ultrafiltration of fish sauce samples, using a 10,000 dalton exclusionmembrane, was effective in recovering all of the residual proteolytic activityin the retentate fraction. The pH optimum for hydrolysis of azocasein withenzyme isolates from either control or SHP-sauce, was 6.0. Assay of thesesamples revealed the sauce supplemented with SHP contained 3 times as muchgeneral protease activity at pH 6. Both samples contained aminopeptidaseactivity, however, the rate of this reaction was not different in thesamples. Moreover, the transferase activity with Gly-Phe-NH2, a reactionspecific for cathepsin C Fruton, 1982!, was 7 times as active in enzymeisolate from SHP-sauce compared to that from the control-sauce.
The pH optima for rate of protein hydrolysis during fermentation judgedby formol titration!, for hydrolysis of azocasein by the enzyme s! recoveredfrom sauce by ultrafi ltration, and for dipetidylaminopeptidase activity ofGly-Phe-NA a cathepsin C substrate! by enzyme s! recovered from the saucewere each 6.0 Figure 4-A,B,C!. Indeed the pH-activity profile f' or azocaseinhydrolysis and cathepsin C activity were very similar Figs. 48,C!. Thesedata indicate that cathepsin C may be a key enzyme in the fermentation of fishsauce from capelin. The dipept1dylaminopeptidase reaction of this enzymeresults in formation of dipeptide products, which may subsequently behydrolyzed to free amino acids by amino peptidases. Since SHP did notcontribute aminopeptidase activity to the fermentation and since free aminoacid accumulation paralleled overall fermentation rate in both samples, itappears that contribution of cathepsin C rather than aminopeptidase explainsthe utility of SHP as a fermentation aid.
Additional evidence for the involvement of cathepsin C-
Three additional lines of experimentation support the notion thatcathepsin C contributes to this fermentation. First, thedipeptidylaminopeptidase activity of purified cathepsin C from SHP isdependent on Cl and is activated by low levels of NaCl Fig. 5!. Secondly,when the residual enzyme activity from fish sauce is assayed at. increasing
664
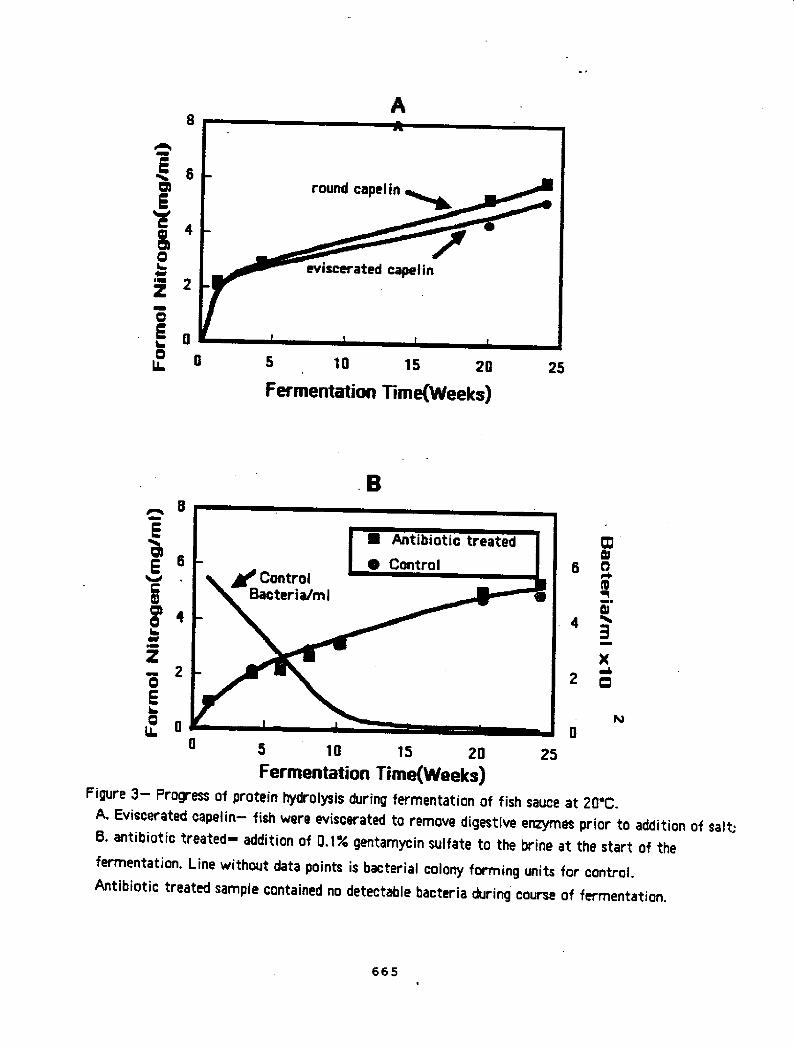
A
EC
5 10 15 20
Fermentation Time Weeks!
.B
5 10 't5 20 25
Fermentation Time Weeks!Figure 3 � Progress of protein hydrolysis during fermentation of fish sauce at 20 C.A. Eviscerated capelin- fish were eviscerated to remove digestive erzymes prior to addition of salt;B. antibiotic treated- addition of 0.14 gentamycin sulfate to the brine at the start of thefermentation. Line without data points is bacterial colony forming units for control.Antibiotic treated sample contained no detectable bacteria during course of fermentation.
665
ClL
2
aU.
EchE
CO
L
Z 0EL
8
6
2 0
R
6 0
~OII
4
X
2

Rate of of protein hydrolysis in sauce as a function of fermentation pH
Initial pH
100
80
60
0 lgL Q
, I~
40
20
0
5
Assay pH
5 7
Assay pH
Figure 4 � Influence of pH on rate of fermentation and key enzymes involved with fermentation.
666
8
l0
K 07N
0 isa
Z
8
E 0 0Z
$00
90
80
70
60
50
40
Azocasein in 4 N NaCI-
Enzymes recovered from fish sauce after 5 months
Hydrolysis of Gly � Phe � naphylamide by purified cathepsin C
100
80
60
40
20
0

hJCl
QhClCD
CO
0 Ch
8O
h!O
CLI
x
II a go
] |' n
Q g
f 'fA
I o 0Q
K
z
I CD
CD
Unitslmg Pmtein
667

4C5
VJ0a~r g!C
668
O CI
R Z
C3
O Z 0
Re|ative Activity

NaCl concentrations, gener al protease activity is progressively inhibited,i.e. at 4 M NaCl the rate of azocasein hydrolysis was only 5X of that at 25 mMNaCl Fig. 6!. However, the dipeptidylaminopeptidase activity retained about70% of the optimal activity observed in 25 mM NaC1. Substantialaminopeptidase activity was also sustained when the salt concentration of theassay medium was like that in the fermentation brine Fig. 6!. Thirdly, whenthe residual proteases isolated from fish sauce were assayed at low NaC1concentration, part of the azocasein hydrolyzing activity was inhibited bytrypsin inhibitor �5% inhibition at .25 mg 0.1 ml enzyme!, part by EDTA �%inhibition at 1 mM! and part by pCMB �� inhibition at 1 aN! indicating theretention of several types of protease in sauce. However, when the sameenzyme s! were assayed in a reaction medium containing 4 M NaC1, onlysulfhydryl protease inhibitors pCMB or HgC12! inhibited the reaction.Cathepsin C is a sulfhydr yl protease and is sensitive to pCMB or HgC1> Fruton, 1982; Hameed 4 Haard, 1985!; thus the data for protease inhi6itorstudies are also consistent with the retention and active expression ofcathepsin C activity in the fermentation brine.
CONCLUSIONS
Both dipeptidylhydrolase and transferase activities of cathepsin Cprobably contribute to the high degree of hydrolysis observed duringfermentation of capelin; i.e. approximately 80% of the protein amino acids arehydrolyzed to free amino acids in 6 months. The dipeptidylhydrolase reactionproduces dipeptides which appear to be hydrolyzed to free amino acids byaminopeptidase s!. The transferase reaction can "shuffle" the sequence ofthose peptides which are not amenable to hydrolysis by the hydrolase reaction,thus creating new peptides which have the appropriate N-terminus forsubsequent hydrolysis by the dipetidylhydrolase reaction.
REFERENCES
1. Anon. �981! .2. AOAC. �980!.
June 1981, p. 60.is, 13th ed. p. 289-290.
669
An excellent quality fish sauce can be obtained from male, inshorecapelin when the fermentation is aided by squid hepatopancreas tissue. Thebest conditions for' fermentation were 2.5% hepatopancreas tissue, 25K NaCl,natural pH about 6.0!, temperature of 20-25 C, and a time of about 6months. Additional aging of the product for 6 months to one year did not havea significant affect on the sensory properties nor on the chemical compositionof the products
Squid hepatopancreas contains proteolytic enzyme s! which aid thefermentation by virtue of component s! which have optimum catalytic activityat pH 6, are not inactivated by very high salt concentrations, and retaincatalytic activity in media containing very high salt content, and catalyzenearly complete hydrolysis of protein. The enzyme s! which persist and remainactive during the fermentation are sulfhydryl proteases and include cathepsinC.

3. Association of 0fficial Agricultural Chemists, Washington, O.C.4. Beddows, C.G., Isamail, N., and Steinkraus, K.H. �976!. The use of
bromelain in the hydrolysis of mackerel and the investigation offermented fish aroma. J. Food Technol. 11: 379-388.
l. 6, !.9. !!911!.Publication, New or , p.
6. Fruton, J.S. �982!. Proteinase-catalyzed synthesis of peptide bonds.Advances in Enz olo 53: 209-307.
7. Gi lli and. .. usta. . . Brinda, J.J. and Campbell, J.E. �976!.Aeorbic plate count. In: Com endium of Methods for theNicrobiolo ical Examination o oods, N.L. peck, Ed., APHAntersoc>ety gency oenittee on >crobiological Methods for Foods,
p. 107-130.8. Hameed, K.S. and Haard, N.F. �985!. Isolation and char acterization of
dipeptidyl aminopeptidase 1 cathepsin C! from Atlantic short-finnedsquid Illex illecebrosus. Com . Biochem. Ph siol. 82B: 241-246.
1 . 1.. In96!villosus! for human consumption. In: Fisher productts, treuzer,~e . ~is ing News Books Ltd.l,s London, p. -2%.
10. Lang, C.A. �958!. Simple microdetermination of Kjeldahl nitrogen inbiological material. Anal. Chem. 30: 1692-1694.
11. Larmond, E. �977!. Laboraator et ious for Sensor Evaluation ofFood. Publication, anada epartment o Agr~cu ture, ttawa.
12. Lee, ~, Simpson, B.K. and Haard, N.F. �982!. Supplementation ofsquid fermentation with proteolytic enzymes. J. Food Biochem. 6.127-134.
13. HcIlvaine, T.C. �921!. A buffer solution for colorimetriccomparison. J. Biol. Chem. 49: 183-186.
1 . 1 i..,, Tn., 6!. 19supplements on the production of fish sauce from male inshorecapelin ma!lotus vil lusus. Can. Inst. Food Sci. Technol. 19: 28-33.
670

WiU.iam B. Nilescel, Hl.D.Research Chaa~
Northwest and Alaska Fisheries Cenbm.Utilizatica Research Divisicm2725 RmtMce Boulevaxd East
Seattle, ML 98112
Prelimdnary evicLsnce fran amoral clinical sbxties has created an increasingId,
Ixa!esters derived fran >aenhaden oil usia supercritical fluid ~ has been foundcaIxkQ.e of producing EPA and QR in purities as high as 954. ~rs affectingyield and pvm3uctian rates will be discussed.
SERI' RRXT$88S CP MKSHQKX HXt HK RR
IRRlal Z~al!XN BK HLSZEHN ~ OP MEKCCO
William Z. Lia9bergDepartment of F~ies & Aquaculture
University of Florida7922 N.W. 71st Street
Gainmmrille, Flarida 32606
Frank Loci&art
Univeris~ of Florida
Harriet Perry and Richard %allerGulf Qoast Research Labozatcny-
Sukcmesihle transects and trap sampling confixmed cancentratians of goldencrabs �! alang intemnediate depth cxmtems, associated with rock autarcypings,and �! off peninsular Florida rather than the northern Gulf. Red crabs weredecor and at northern as well as southern statians. Bath species showed sexdif fere'=es in distribution.
671

Tyre C. LaniarNarth Carolina State University
Food Scierxm DepertzImntNarth Carolina State Uhiversity
Raleigh, NC 27695-7624
Ml'~ gg ty
YSubcmIIittee of the Suruai ~ttee, Natianal Fisheries Institute. The
'tpurposes of least cost fanmlation. It was found that, althLmgh the effect ofwater addition alcaic on gel texture was samwbat ~xtedicatable, mhctures ofsurimis at the sam misture ex+tent f~ gels in a fairly predictable
/ !sensitive indicators of gelling quality than a l.east~xxoerxtratian endpointtest.
SGRZMK STUMBLE CN MZER HLKE g~ggfg+ g@g~!
E.G. Bligh and K. SpatterChnmBan Institute of Fancies 'X~>3.ogy
Ted>nical University of Nova ScotiaHalifax, Cauda B3J 2X4
A series of studies uxhmmy at the Can' dim Institute of Fisheries Technology fua9ed by Fisheries and Oceans Canasta and N.S.E.R.C. ! is emunininp thepraising pazanmbma and product perfozmarme associated with the use of
ane of the tavy~ species and data will be presented an the effects of post-mortem age, use of fmzen material, water washman regime,, etc., on surimicpality.
EFHK3'. OF TiQSIKQK lXf MZGBKZ X%CGXQN CZMXNT IN MRK MD OBDBQRYNKCXE 'l58SGES CMR3ll6D i%KM 36XANTXC %%HAKIM
D.P. Green and T.C. ZanierFood Scieme Department
~ Carolina State UniversityRaleigh, NC 27695-7624
Prcecimate cxmposition and pmt~ distribution for excised Atlantic menhadendark and ordinary ~e tissues were detarauned. Washing studies suggest highamtent of dark mscle in mince prior to leactdrg decoaases rermval efficiencyof water soluble and will result in surimi of darker color and higher lipid andccnnective tissue carrtent.
672

Karl Bagnarsson and Joe M. RepensteinDepartxl.'nt of RxQtzy and Avian Sciences
Institute of Pood Sciences112 Rice Hall
Cornell UniversityIthaca, NY 14853-5601
Freezing and frozen stcxrage of gadoid fish advises causes textural changes.The effect of various salts NaCL, NaI, NaKX, Nahc, MgCL2 and CaC12! added tothe fish prior to freezing were stmiied with respect to the texture and thewater retention prcyerties of fish xsxscle. %ben Nahc and NaC1 weze ~ toocean perch and cod, the rate of textural taughmes and expremibl.e moisturedecreased during frozen stxeam. Qn the other hand, NaI, NaSCN, CaC12, andNgCL2 ~exated the textural tngbness develcyed and increased theexpressible moisture durity frozen storeya. SOS-ESGE sixcaue6 that a crosslinkedpml~ of 280,00 da occurs only with gadoid fish. Far cod, 20 days at -7C arexmadai, w4meas far whiting only 3 days are naadei. Cod samples treated withNaSCS did not show this band. Ascorbic acid ~crated the time of ~danceof the band, while fresh storage of cod for 10 days prior to freezingeliminated the band. Instxxn hazdness seelxad to imcvmse in gragartion to thedevelapmert of the SDS-ESGE band.
HKRPKR MSEO HHKEKKR HR KSCXHCXXCN GP %|INE TOKER
L.V. Sick and P.B. Tzavis%$%Mxarleston Labartxzy
Charleston, S.C. 29412
Qne of the most innovative a~oactxes for ~oping a detection mood toscreen seafood far the preset of natural tcacins concerns engineering membranechannel gxatein reeeptoxs into field applicable detection devices. Suchdevicss have the advantage of detecting sevezal taxins with a single chip andare inexpensive. Maitabmin, a putative agerxt in ciguatoxin disease, wasinvestigated for physiological properties involving its calcium ionopboric
! !lYinformation is being ay@lied to deve3.epmlmt of a capacitanm, reaqptor basedbiosemr.
673

zemDDN: Snmmm rZra Ce zxesr muermr. ma mHCA IBK CXMXNRD MHR SIKRRRE 3M ICHPQLLT MIXl'.ORES
L.J. Toledo-Flares and R.R. ZallDept~mt of Pood Science
Cornell UniversityIthaca, NY 14853
Fresh queen snapper Eb~~ oculatus! ami cardinal snapper Pristipamoidest
ccNbmed with staIrage in an ice/salt mixture at -3 C. Storage life of the twospecies in plain ice: 16.0 days far queen snapper and 15.8 days for cazdinalsnagvrr was e!*ended to 30.8 and 35.5 days, resp!s&ively, in the treated fish.'Ihe ccabination of treatnNsrts also retarded the fazmatian of spoilage ccrTpoundsand micmbial growth.778
EFHKGS OF FHRSRQKHK, NRClt %RHK CXÃHRlX', MD XSOCESS
Vivtan M. Higgins, Tyre C. Lmier, Jae W. Park and Jose NantejanoPood Scierxm Dept. N.C. State University, Raleigh, NC 27695-7624
Selected ptmsphates were evaluated far their effect in alter the texture ofgels prepared either primarily of surinam Alaalran pollack, ~gggza
aamercial crab analog foxmxlation! . ~ latter faraaQatians were
included differerrtial samning calarbrN~r, press moistuze, torsi~ failuretestin!p, and th!~we!al scanning of rheological properties. Results indicate thatplates had little effect on the textural ptzoperties of either pure surimigels ar thase g!tzeprmad by a ccssezcial czabstick foxmlati!m at 34 or 24 NaC1cxmtenct was zectuced to 14, ~~phate had a significant effect in improvingtextural pzaperites. ~ts also showed that water corrtent cauld be~eciably irxxeased without detri!mat to p!zoduct texture by use of a pre-"set" incubatian at 4aC far 16 hauzs priar to cac9cing.
EPPB& OF RARER CXÃHRT UPCN 'le PR!UIPRKZ OF HKRAGKTXCNOF SHOOK FjRQKR CLPL1N I%RIM" SERIClL' XRRXt %! PRRR2ZN, QXUMR
HKKRS SIHQGR IXlRIN 9%9iNIIW
David R.L. %biteDir, Inspection Services Branch
P.O. Bax 5667
St. Jahns, Newfoundland AIC 5X1
detezmine the relationship lxCween the level of zedfeed content and thefzequency of decp~tian of female caplin. Caplin were graded, following fourdifferent iced storage times, and three different frozen storage -26aC!/thmring +15aC! time ccaibinatices. Results of these exper~nents showedthat, the Msquency of degradation was mme affected by handling than by zedfeedlevel.
674

Robert J. Learscn, Vivant G. ~a, Burton L. Tinkerand Robert VarQtexyver
Northeast Fisheries CenterGlnxester Laboratory
Zperem AvenueGloucester Lalmratory, M. 01930
Ronald P. Athanas
A pmoess for fish hydmlysate prade~cm for fish processing wastes wasdeveloped using both formic acid ani phosphoric acid as acidulants. A pilotscale production line was designed and inst~ed in Gloucester, MA for letechnology hydmlysate pLoducticn ~ fish fmels. Qmsical analysis of thehydrolysstes indicated that the xesulting lhyxid fertilizer material usingphospbotric acid, had 1.6 - 2.4t nitzegen, 4 - 5t phophaxxms and 0.8 � 1.04
of Ieymsium, manganese, bamn and zinc. Pmblems relating to production andstabilization are discussed.
QKXR "3RAXSKP
Amul Purakut and Weel PotterEssex Agricultural 4 Ta~cal Institute
Hathoze, MK 01937
Ronald P. Athanas't
Robert J. Qaarson
National Mm~ Fisheries Service, Glmcester
Fish hydmlysate FH! made ~ Atlantic cod pmoessing wastes, with ananalysis of 1.6-4.2W.8 MPK! was compared to Peters 20-20-20 fertilizer ongreenhouse grown 'Ualapem" pe~ms Caggjgga grgbKggGQ! . 'Jhese pegpers were
ix nHP PX! Remix g350 pE! and top soil TS! at 0, 80 ard160 pgn Nit+~ applied in weekly and biweekly in~rala during June 9 toAugust 21, 1987. Oatpared to the Pe~ fertilizer ~lications, FH irxzxeaadyeilds by 48 and 7A at 80 azxl 160 ~ respmtively when used at a ~y rate.FH at 160 pgm ~lied biweekly, cxmsic~tly increased yields by 123, 97 and20t in PX, NX and TS resgxmtively as ccxapered to the B&ers fertilizerapplications. Ow~~l, FH at 160 ppm increased yield by 50% amp-m6 to thePeters fertilizer applications.
675

IN KEHKTHK H?OIL CGK IRXRK IN SRRHXXB
Bchdan M. Slcktyj, Susan A. Ismail and Stefanie O. SlabyjDepartment of Pood Scierxe, University of Maine
Grano, ME 04469
Senal seafaods were inoculated at two leveLs with 4 different Escherichiacoli isolates and emmrated using standard MES proem?ure as well as inoculatingPstrifilm, HecUigel, and Violet Rsd Bile VRB! Agar which were incubate at
the MHf ~. Pstrifilm, Qedigel, axe VRB were aitm~wmd to have limitedi
to include colifazms, while Pstrifilm can identify gas producing colanies andtherefore provide a mare reliable fecal coliform count.
Zmgela D. Ruple and David W. CookMicrobiology ~on
Gulf ~ Research LaboratoryP. O. Bm 7000
Over Springs, l% 39564
Qmnges m mamflara were monitored during bath casmrcual handling andcantroU.ed temperature stazege of' stmllstock cysters. ~ effects ofteepeIrature and salinity of the harvest area and shaQ stock starage
yCinvestigated. Multiplicaticn of fecal colifaxms, including g, ~co i, wasobserved at temperatures abave 10aC, but not at 1~. Multiplication of samevtbrias and ~gggas ~gg~a was also observed in shellstock oysters.
OSR
%zest A. WiUmlm and Barbara L. JobeNational Marine Fisheries Service
Gluxester Lab
30 Bmvsan Avesta
Glcaxester, MK 01930
of weight of skate wings to size weight, length and width! of whole skate; �!fillet yields frem skate wings; �! processing met1hods and ~mant; �! icedstorage time of skate wings, �! varicas product forms; and �!, a frozenstorage study which is. still in progress. Discoloratian of the wirga was alsoinmatigated, but a satisfactory nathad of preverrtiag this quality defect wasnot identified.
676

jiPHPCH%! BY KKIR AND/CK SAIZ
Jae W. Park and Tyre C. LanierDepartmsnt of Food Science, Narth Carolina State University
Raleigh, NC 27695-7624
'Ihs Icinstics of heat-indcxced denaturatian and aygvsaatian of surimi proteins,as aff'ected by additional of sugar amd/ar salt, were investigated bydifferential amnnhxy calarixN~ le!. Net enthalpic changes were always
4a gal struc~ in which potem~ bcmfmya were mme ccmpletely accamplished;that is, a mxre enexgetically favorable stre~ was affined with slewheating. Bm stablization of proteins by sugar, and destabilization ofproteins by salt, were also mesuvad calarimmtrically.
Jeanrm D. Joseph, Sylvia B. Gallcamy, and Robert R. KiferU.S. Departaexxt of Ocmmezce
National 8'arias Fish<~ Service, Charlestcm XaboratoryP.O. Box 31607
Charlestcn, S.C. 294M
Using chemical and physical separation ~niquM', the Charleston Xabceatoryis pwca~ qualit~ssured bicaaedic-Q. test materials fran menhaden oil for
anly refined oil and n-3 ester cammtrates, but also n-3 enriched glycerides,purified EPA and DK.
Marttxa Hudak-Roas
National Seafood Inspection LaboratoryP.O. Drmer I207
Peuxcagoula, 1% 39568-l207
With the ceasing of age of caqxzterized infacmatian system, vast aneunts ofinformation and data on alxnost amjr tcpic can be examined, read, and printedusing a perscmal ccmputer in alaest any location. 'Ihe National SeafoodInspect~ Labaratary NSIL! has developed ane such ~stan - FISHFAX. FR~AXa+stains infarmatian an a species specific basis, covering such topics asbiological profiles, processing methods, nutritional values, econcmniccansideratians, and public health information. All information and dataccmtained within PZSfIHLX has been previously published. 'Ibis information isverified, sumarized, and qmlity assure% before being entered into theinformatian base. A poster presentation damnstzates FISHFAX using a personalcclllpQter ~
677

Debra Z. HhoacLes N.M.F.S., Glcumster, MA!, andZaamll V. Sick N.M.F.S., Charleston, S.C.!
tV~gjggy, is thought to be asamiated with the dsve1apnamt of ciguatoxicity intropical marine reef fishes. Spleen cells frcm BHC/C mice iaaaunized withsmi~ified maitatmdn extracts were fused with myelaaa cells to prcduce?gIbridcsa cells using standard sonatic call fusion technology. Five sep~te
lines which secrete mmoclanal antiixdies reactive with various cxxapanents in' j&tF ~
have ideaxtified certain IM:eaclanal antibodies ~ aggcmz to be zea~ve withmeicxm physmts present in the maitataxin extxaWs. Other menoclanalantibodies react in direct proportion to maemK taxicity regardless ofmaitatclcin wctu~ pigIMIntatian, saxgesting that they are reacts with theactual toxin molecule ar a closely related cmpcIM.nt. Gem~ aanoclanaLantibodies have shcam detectable zeactian with maitc~cin extrcct at toxicitylevels as lmr as 0.002 mme units. Further N~ctcm.zation experizl.nts still
these monoclanal antibodies.
SMSX%RK HK EE5%CHKN CN? HKKRHEHh,
J.H. MacNeil, Z.C. ~ld and H.Z. Scisl~zDepaztment of Food Scil+ and Mechanical Engineering
'Ibe Pennsylvania State UniversityUniversity Park, PA 16802
Many segments of the food industry are currently using or ixmestigating the~icy
or far the detectica of defects. 'Ihe pechlaa of HmaMMma within the fishingin3ustzy has lang been a series a~am and this study deals with theinvestigation of a machirm visian g?stem far the detects of this parasite.Very early in this investigation it was found that the choice of the lightingschene to illuminate the cod warm is still a critical aspect of the totalmachismo vision system. Details of the lighting systene which result in thehighest contrast betmen fish tirmue and the cod warm are preen'~ as we11 asquality considerations of scsM systea|s.
678