
Untitled - National Sea Grant Library
84
-
Upload
khangminh22 -
Category
Documents
-
view
0 -
download
0
Transcript of Untitled - National Sea Grant Library


Master's Thesis
In presenting this thesis in partial fu1fillment of' the requirements for a Master's degree
at the University of Washington, I agree that the Library shall make its copies freely
available for inspection. I further agree that extensive copying of this thesis is
allowable only for scholarly purposes, consistent with "fair use" as prese'ribed in the
U.S. Copyright Law. Any other reproduction for any purposes or by any means sha11
not be allowed without my written permission.
Signatur

University of Washington
Abstract
Otolith Increment Anaiy'sis and the Application TowardUnderstanding Recruitment Variation in Pacific Hake
Wihi obhBy,
by Dewayne Allen Fox
Chairperson of the Supervisory CommitteeProfessor Bruce S. Miller
School of Fisheries
Commercial harvest of Pacific hake Mertucciccv productus! began during thelate 18th century and presently supports a large coastal trawl fishery. This fishery isdependent upon strong year-classes which are set within the first few months of life.Large interannual fluctuations in year-class strength make this fishery susceptible tooverharvest which has caused concern among fishery managers. The objective of thisstudy was to assess whether survivorship rates for a population of larval and juvenilePacific hake varied interannually. Three approaches were used to accomplish this goal: I! deterinination of first increment deposition of laboratory reared larval Phcific hakeotoliths, �! validation of otolith increment deposition rates on laboratory reared Pacifichake, and �! comparison of empirically determined spawn-date distributions withestimated spawning cycles to determine if periods of differential survival occur withinthe early life history of a population of Pacific hake.
Results from work conducted on laboratory reared larval Pacific hake revealedthat the first increment was deposited on the sagittal otolith of Pacific hake at 3.S dpost-hatch at 8'C 95% CI 1.3-S.S d! and at 4.2 d 95% CI 2.2-5.5 d! post-hatch atl2'C. Periodicity of increment formation was found to vary with temperaturetreatment. In the 8'C treatment increment deposition occurred on a non-daily basis.Strong evidence for daily increment deposition was found in the l2'C treatment. Thereason for the discrepancy in increment deposition rates was likely due to the nutritionalstate of the developing larvae. Rsh reared jn the 8'C appeared emaciated while youngfish <14 d post-hatch! in the l2'C treatment showed no apparent signs of rnalnutriioo.

Back-calculated spawn-date distributions for both 1990 and 1991 wereunimodal in shape and occupied a relatively narrow window of time from late Januarythrough March. The mean back-calculated spawn-date for 1990 was 14 March whichwas much later than that calculated for 1991 �0 February!. In both years the cycle ofegg abundance peaked on 14 March. Significant differences cx=.01! were found
between estimated spawn-date distributions and cycles of egg abundance in both years.In 1990 there was a higher degree of overlap in back-calculated spawn-date distributionof surviving individuals than was found in 1991. Relative survival rates were found tovary during the first few months of Pacifi hake early life history. During 1990individuals spawned early or late in the spawning season showed higher survival ratesthan individuals which were spawned during the peak of spawning season. This wasin contrast to 1991 where relative survival rates for fish spawned early in the spawningseason were higher, after which time survival rates dropped quickly. Future analysesshould focus on these periods of fluctuating survival rates to further our understandingof recruitment processes in Pacific hake.

R ecruitment Variatron � � � �� � � � � � � � � - � - � - � � � � � � � � � � � � --1Pa 'cific Hake- � � � � � � � � � � � � � � � 3
Pacific Hake Egg Sampling-
Larv al Rearing- - � � � - � � � --- � � � - � - � � � � � � � - � � � -ISLarval - Juvenile Pacific Hake Collection
Otolith Extraction � Preparation �--
Otolith Interpretation and Measurement�
Spawn-Date Distributions-
Timing and Periodicity of Increment Formation -- � � -- � � -- � � � � � 27
Spawn-Date Khstrtbutrons- � � ��
Egg Abundance - Timing of Spawning�Larval and Juvenile Survivorship- � - � �-
List of Figures-
List of Tables
Introduction--
Otoliths-
Materials and Methods
Growth
Discussion-
Literature Cited-
TABLE OF CONTKNTS
Page
-12
-12
-18
-19
� - � -21
-22
� � � � � � 27
� � - � -33
- � � � --- � 38
- � - � � � � � � � � � � -42
-49
� � � � � � 61

LIST OF FIGURES
Figure 1, Map of Dabob Bay, WA, with bathymetry and the location of samplingl ocations. 13
Figure 2. Linear regression for increment count vs. day post-hatch for larval Pacifichake reared in an 8'C treatment.- 28
Figure 3. Comparison of linear regression for increment count vs. day post-hatch forlarval Pacific hake reared in an 8'C treatment and a line with a slope of 1.� -29
Figure 4. Linear regression for increment count vs. day post-hatch for larval Pacifichake reared in an 12 C treatment.- �� � � � --- � � � -31
Figure 5. Comparison of linear regression for increment count vs. day post-hatch forlarval Pacific hake reared in an 12 C treatment and a line with a slope of 1. � 32
Figure 6. Age length data for surviving larval and juvenile Pacific hake collected fromDabob Bay WA. during 1990.-- � � - � � � � � � � � � � -- � � - � � � � -34J ~
Figure 7. Age length data for surviving larval and juvenile Pacific hake collected fromDabob Bay WA. during 1991.- � � � � � - � � - � -- � � -' � � � � � � � 35j 7
Figure 8. Predicted values for the Laird Gompertz growth model applied to the agelength data for larval and juvenile Pacific hake �6-35 mm SL! sampled inD abob Ba~ WA � � � � � � � � 37J ~
Figure 9. Back-calculated spawn date distributions for larval and juvenile Pacific hakecollected from Dabob Bay, WA during 1990.- � -- � 39
Figure 10. Back-calculated spawn date distributions for larva1 and juvenile Pacific hakecollected from Dabob Bay, WA during 1991.
Figure 11. Back-calculated spawn date distributions of larval and juvenile Pacific hakecorrected for mortality for 1990 and 1991.- �� � � � � � � � � � � -41
Figure 12. Estimated cycles of Pacific hake egg abundance within Dabob Bay, WA for1 990-1991. � � � � � � � � � � � - � � � - � � � � � � 43
Figure 13. Cycles of relative survival weekly spawn date frequency / weekly eggabundance frequency! estimated for larval and juvenile Pacific hake withinDabob Bay, WA. for 1990-1991. - � � � - � - - � ' � - -45
Figure 14. Comparison of back-calculated spawn date distribution of larval andjuvenile Pacific hake with estimated egg abundance cycle for Dabob Bay,WA during 1990.-

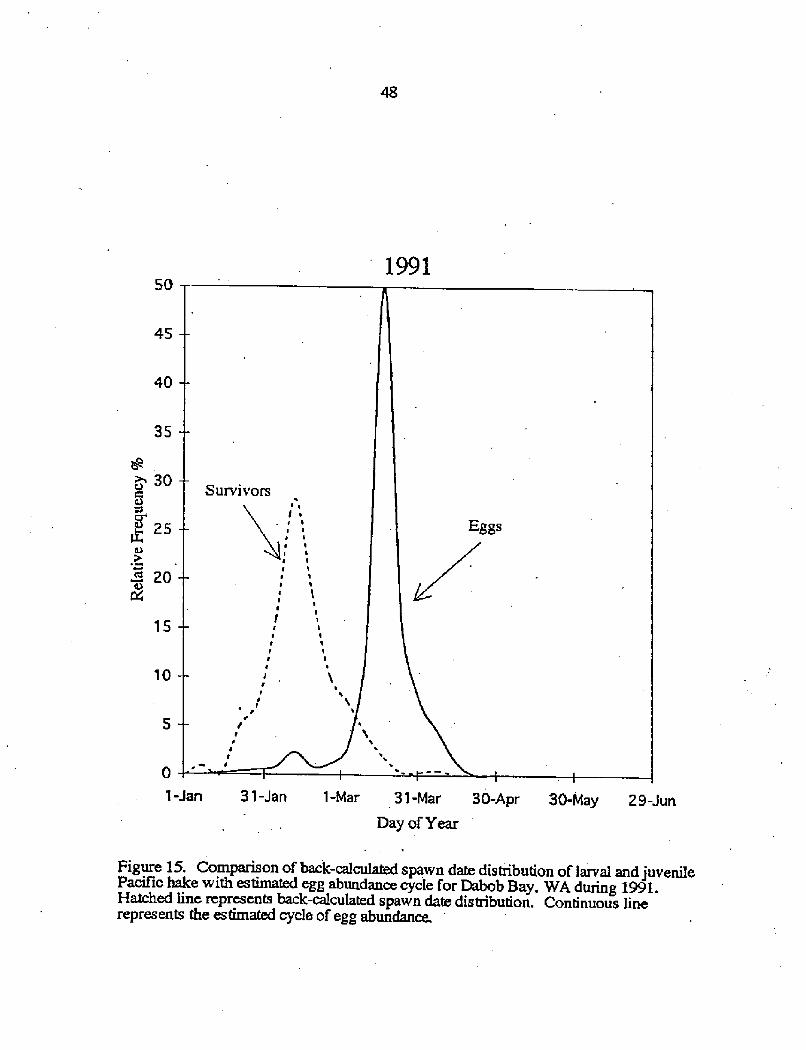
Figure 1S. Comparison of back-calculated spawn date distribution of larval andjuvenile Pacific hake with estimated egg abundance cycle for Dabob Bay,WA during 1991 - � � � � - � � � � � � � �� -43

LIST OF TABLES
Page
Table 1. Gear type, sampling location, and egg abundance estimates egg/m'! forPacific hake eggs collected within Dabob Bay, WA. during 1990-1991. � � -14
Table 2. Gompertz growth model parameters from models fitted to length at age datafor larval and juvenile Pacific hake collected from Dabob Bay, WA. during
990 and l991.-1 � � 36

Acknowledgmerits
First and foremost I wish to express my appreciation to Bruce Miller for all his
guidance, support and patience through the course of this research project. I would
also like to give a nod towards Kevin Bailey and Steve Bollens for always having time
to explain things. Several other people contributed much toward the completion of this
research. Annette Brown was always there as the resident otolith guru. Steve Porter
for his help with the larval rearing and automotive expertise. Steve Nixon and Jim Rice
at NC State for analytical advice. Dave Woodbury for helpful discussions on baby
hake, Chris Beasley and Christian Watters read way too many rough drafts and
listened to all the practice talks without much complaint. Lastly, I wouM like to give a
big tip of the hat towards Joe Hightower for his patience and prodding during the final
phases of this work, Come on Sturg!
Several other people, while less involved with my research, made graduate
school what it was supposed to be. Special thanks to the fabulous Mud-puppies-
Harv, Geir, Mayer, Paul H., Paul S., and Noble! "How many law school teams did
we beat"? Remember, I still have the playbook and the video tape. To Evi and Cheryll
for the croquette lessons on the playing fieMs of Sand Point Country Club. Deanna
Stouder gave much advice on the areas of running, life, cooking and science. Thanks
for all the help Deanna! Royden Nakamura and Ben Stephens provided the stimulus
for me to move up the evolutionary ladder to Pacific hake. Tough to go lower than a
hagfish! Dr. Troy Buckley for his help on the racquetball courts of the IMA. I actually
won one game in 2 years! Mark Lanegan and Carrie Akre for making Seattle what is
' was and still is. Voula and the crew; what is in a Hobo anyways'? Special thanks go

out to Blake Feist for all of his help building sheds, fixing computers, giving surf
lessons, picking me up off the asphalt more than once!, helping with slides, protecting
the free skies from communist insurgents and taking me on lovely ski runs. Thanks
Bud! Many bows to Celia Shelton for pushing me to finish this up. What will I do
with the free time now? Finally, I would like to thank my family for all their support.
To my parents Frank and Marylon, thanks for always being there. To Mrs. Hicks, that
makes two from UW!
Financial support for this thesis work was provided by Washington Sea Grant
funding for the project "Recruitment Fisheries Oceanography of Pacific Hake in Dabob
Bay, Puget Sound".

Introduction
Recruitment Variation
In recent years, there has been an increase in the amount of research devoted
toward understanding the mechanisms controlling recruitment. Recruitment will be
hereby defined as the process which young fish undergo until they enter the
commercial catch Beverton 1994!. Fritz et al. �990! regarded recruitment fluctuations
as the central problem currently facing fisheries oceanography, while Wooster �980!
noted that understanding the factors controlling recruitment were crucial to the
advancement of fisheries ecology, Undoubtedly, a driving force behind the interest in
understanding recruitment variation is to avoid both the biological and sociological
impacts associated with the collapse of a iishery. The fates of many clupeoid fisheries,
in particular, Peruvian anchovy and Pacific sardtne, provide reminders of the enormous
biological, economic, and social effects that the collapse of fish stocks can have on
fishing nations Radovich 1981; Tomezak 1981; and Lasker 1985!.
The problems associated with recruitment are not new to the field of fisheries
science, However, it has only been since the late 1900's that scientists have been
concerned with specific controlling mechanisms. Prior to this, research was conducted
on the species level and variability in recruitment was thought to be caused by
interannual differences in migratory patterns of commercially important species Lasker
1981!. A shift in this paradigm occurred in the early part of this century when Hjort
�913! advocated the examination of populations, rather than individuals, as being
important to the understanding of recruitment variability. Since then, the inquiry into
the question of variability has focused primarily on the population level. These studies
have usually been reductionist in their approach, often focusing on a single mechanism

affecting one life history stage of a organism, rather than taldng a multi-factorial
approach.
Research conducted during the 1950's through 1970's centered on the creation
of models which could relate size of spawning stock to ensuing recruitment levels
Beverton and Holt 1957; Ricker 19T5!. There were distinct problems associated wi th
preliminary stock-recruitment research. Hall �988! noted that the lack of predictive
power associated with early models likely stemmed from a restricted view of the fishes
environment. This lack of predictive power was in large part due to an engineering
approach to reduce natural processes into simple linear inodels, that are often not
representative of the natural environtnent Many early models overlooked the pre-
recruit stages of an organisms life history and focused primarily on the adult portion of
the population. The justification for this early work was based on the principle that
managers could only exert control over the harvest of adul t fish and that the outcomes
of such controls were quantifiable Hilborn and Walters 1992!.
Despite the obvious relationship between spawners and recruits, attempts to
quantify this relationship have resulted in models with low predictive power that are of
questionable confidence Troadec 1988; Koslow 1992!. The presence of large
variances in inost stock-recruitment data has been ascribed to many causes. These
include measureinent error Walters and Ludwig 1981!, vacation in fecundity rates
Koslow 1992!, questions of scale Lasker 1981; Legendre and Demers 1984!, and
non-stationazity of the stock recruitinent relationship Hiiborn and Walters 1992!, This
latter factor includes changes in the stock-recruit relationship that are caused by
environmental perturbations. These environmental changes are thought to involve both
biological and physical factors whose variability can cause fluctuations in the rate of
recruitment success. Much of the research conducted on fish recruitment during the

.3
past two decades has focused on these stochastic environmental events and their
operation in marine systems Bakun et al. 1982; Skud 1982; Legget et al. 1984; and
Hollowed and Bailey 1989!.
While some of the research that is directed toward the area of recruitment
variation is theoretical in nature, the majority of the work is conducted with the ultimate
goal of understanding the interactions between harvester, environment, and target
species. It is hoped that by increasing our knowledge base on the interactions of these
components we can increase our success in managing our commercial fisheries. One
fishery that has exhibited a remarkable hundredfold variation in recruitment variation is
that of the coastal harvest for Paci fre hake or Pacific whiting Merluccius pr oducrus,
Ayres 1855! Methot and Dorn 1995!. The coastal stock of Pacific hake is not the
only population to undergo large fluctuations in year class strength; the Puget Sound,
WA. stock has also experienced the "boom or bust" cycle common to many modern
fisheries.
Pacific Hake
The Family Merlucciidae is comprised of' two sub-families: Macruroninae and
Merlucciinae. The latter of these has one genus composed of the genus Merluccircs,
within which there are 13 ext3nt species worldwide Nelson 1994!. These 'true' hake
constitute important commercial fisheries in the Atlantic, eastern Pacific, and the seas
around southern New Zealand and South America Inada 1981; Bond 1996!. The
Pacific hake ranges from the Gulf of California to the Gulf of Alaska Miller and Lea
1972!. Pacific hake are an iniportant component of the groundfish community off the
western coast of North America, where it inhabits the semi-demersal waters of both the
continent shelf and slope areas Nelson and Larkins 1970!.

Historically, four major stocks of Pacific hake have been recognized as distirict
population segments. The coastal stock, which inhabits the waters of the continental
shelf and slope off of California, Oregon, Washington, and British Columbia, is the
most widely distributed and supports the largest fishery. Other stocks occur in Puget
Sound, the Strait of Georgia and off the west coast of southern Baja California and
Gulf of California Goni 1988!. This latter southern stock from the Gulf of California
has been identified as a distinct stock on the basis of meristics, morphometrics and
biochemical assays. Vrooman and Paloma �977! found this Gulf of Mexico stock of
"dwarf hake" to be significantly different from other stocks of Pacific hake and
suggested that it may be another species.
There is much evidence for treating the inshore stocks of Pacific hake Puget
Sound and Strait of Georgia! and the coastal stocks as distinct population units.
Several researchers have shown biochemical and genetic evidence for the divergence of
the inshore and coastal stocks Utter 1969; Patashnik et al. 1970; Utter 1971; Goni
1988!. In addition to this molecular evidence, behavioral differences exist between the
inshore and coastal stocks. Coastal stocks of Pacific hake, after spawning off the coast
of California and Mexico in the winter, move north and spend the summer months
feeding from northern California to southern Alaska, with the largest fish moving the,
furtherest north Bailey et al. 1982; Methot and Dora 1995!. In contrast to this, the
inshore stocks appear to remain within the confines of Puget Sound and the Strait of
Georgia for their entire life cycle McFarlane and Beamish 198S; Pedersen 1985!.
While some hake stocks worMwide have proven resistant to high levels of
exploitation Pitcher and Albeit 1995!, most have undergone great fluctuations in
harvest levels due to overfishing. Kstorically many hake fisheries were begun as a
source of pet food or fish meal, but as a result of declining Pacific cod stocks during
the 1950's and 1960's, large scale fisheries developed to fiH the need for desirable
whitefish. Worldwide catches of hake Family: Merlucciidae! peaked in the early
1970's at around 2.1 million metric tons, and recent catches �991! have declined to
1.2 mwlion metric tons Pitcher and Alheit 1995!.
The fishery for the Pacific hake began during the later part of the 18th century,
with the primary product being delivered to the animal food industry Grinols and
Tillman 1970; Nelson 1985!. Harvest levels remained low for the early part of the
19th century with average annual catches axound a few hundred tons, Development of
a larger market targeted at humans was inhibited by the rapid softening of the flesh
which occurs in individuals infested with myxosporidian parasites Dassow et al. 1970;
Kabata and Whitaker 1981!. This problem with degradation of the product was solved
by advances in seafood technology which allowed for either quick chilling of the flesh,
and or use of enzyme inhibitors. These advances in turn enabled the expansion of the
market for human consumption Methot and Dorn 1995!.
In 1966 foreign fishing fleets began exploiting coastal Pacific hake stocks and
catch rates quickly exceeded 100,000 metric tons mt! Nelson 1985!. Since 1966,
coastal hake harvests have undergone many changes in the nature of the fishery. These
operations evolved primarily from a foreign fishery in 1966, to joint venture operations
in the early 1980's, to an entirely domestic fishery in 1991. Since the expansion of the
fishery in 1966, catches have ranged between 90,000 - 320,000 mt and have averaged
276,000 mt over the last 5 years Woodbury et al. 1995!. Three major issues have
dominated the recent coastal fishery: US-Canadian catch allocation, allocation between
at-sea vs. shore based processors and the issue of bycatch Methot and Dorn 1995!.
The fishery directed at the inshore stocks of Pacific hake is small in comparison
to the coastal harvests. The harvest of. the Strait of Georgia stock began in 1977

following the discovery of large rnidwater concentrations of Pacific hake. Estimates of
adult Pacific hake biomass within the Strait of Georgia have ranged from 85,000 to
182,000 tons while exploitation rates in the 1970's-1980's were from 3-5%. Current
expIoitation rates �995! on the Strait of Georgia stock have exceeded the quota limits
�1%! set by management personnel Canadian Dept. of Fisheries and Oceans; unpubl.
data!. Although recent stock biomass estimates are within. the range encountered
during the 1970's and 1980's, the Straight of Georgia population has started to show
signs overharvest as indicated by a reduction in the mean size at age. This was
exemplified as a decrease in the mean size of Pacific hake captured in the fishery. An
example of this is reflected by the fact that a 4 year old female age at full recruitment!
measured approximately 40 cm throughout the 1980's while in 1995 the mean size of a
4 year old female decreased to 35 cm. G, McFarlane; pers. comm., Pacific Biological
S tation, Nanaimo, Canada!.
In contrast to the Strait of Georgia stock, the exploitation of the Puget Sound
stock began in 1965 Hipkins 1967! and catches peaked during 1983 in excess of
6,800 tons. Within Puget Sound, Pacific hake are scattered over most areas Miller
and Borton 1980! and there are thought to be several spawning populations of Pacific
hake. The only population that has been commercially exploited is the Sarratoga
Passage-Port Susan spawning group Bailey and Yen 1983; Pedersen 1985!. The
fishery in Sarratoga Passage started in September and ran through December at which
time it declined as fish abundance decreased. As Pacific hake biomass dropped in
Sarratoga Passage a large aggregation of' fish appeared in Port Susan. At that time, the
vast majority of the hake harvested were either ripe or maturing adults with peak
spawning generally thought to occur within Port Susan in mid-late March Goni 1988!.
Evidence derived from the fishery suggests that fish from many areas of Puget Sound

migrate to the Port Susan area every winter to spawn and thea disperse after spawning
Thorne et al. 1971!.
Throughout the early � mid 1980's exploitation rates on the Puget Sound stock
were relatively high with more than 40 1a of the adult population harvested during 1984
and 1985. Recent abundance estimates indicate that the Port Susan spawning
population has decreased from a peak abundance of 20,450 mt in 1983 to 3,266 mt in
1996. The speculated causes for this decline in abundance are thought to be a
combination of the high exploitation rates during the 1980's and subsequent increased
predation by pinnepeds Lemberg et al. 1988; Schmi tt et al. 1995; Washington Dept. of
Fish. Wildl. unpubl. data!. Since 1987, little or no fishing has occurred on the
Sarratoga Passage-Port Susan stock because abundance estimates place the stock size
below the 5,450 mt threshold set by the whiting management plan Schmitt et al.
At present, little work has been conducted on the interrelationships between the
different spawning populations of Pacific hake within Puget Sound. In addition to the
previously mentioned Port Susan population, a resident population Bollens et al
1992; Bollens and Frost 1989! of Pacific hake have been documented spawning in
Dabob Bay, WA Bailey and Yen 1983!. Within the confines of Dabob Bay, the
Pacific hake has been described as the dominant species in both the ichthyoplankton
and pelagic fish assemblages. The population within Dabob Bay has never been
commercially exploited '
The Pacific hake population in Dabob Bay permits researchers a unique
opportunity to examine how interannual fluctuations in year-class strength are fixed in
the early life history of Pacific hake. This opportuni ty is in part due to the unexploited
nature of the stock and both the smaller scale and semi-enclosed nature of Dabob Bay

when compared to the open ocean spawning areas chosen by coastal populations of
Pacific hake. The potential problem of advection of larval Pacific hake either into or
out of Dabob Bay seems minimal for three reasons; 1! there is minimal freshwater input
into Dabob bay which in turn makes for low estuarine circulation patterns Barnes and
Ebbesmeyer 1978!, 2! horizontal movements of water due to tidal influences within
Dabob Bay are very small, on the order of a few hundred meters McGary and Lincoln
1977!, and 3! the presence of a sill at the mouth of Dabob Bay which limits water
exchange in the bay.
Previous research on year class strength of coastal Pacific hake suggests that
strong year-classes can be determined within 1-3 mo. after spawning Hollowed and
Bailey 1989; Hollowed 1992!. In addition, long term comparisons of recruitment time
series data and the environmental variables present during the early life history of
Pacific hake indicate that recruitment success is correlated with temperature and both
the timing and strength of coastal upwelling Bailey 1981; Bailey and Francis 1985;
Hollowed and Bailey 1989!. It appears that increases in larval transport and retention
are linked to upwelling and productivity. S tated otherwise, factors independent of
spawning stock size are thought to be involved in the process of recruitment Smith
1995!.
The Pacific hake is an ideal species for studies that examine' the factors
controlling or influencing recruitment variation when one considers the coupling of
large interannual fluctuations in year-class strength, fixing of year class success in the
early life history stages, and the dependency of the commercial fishery on strong year
classes Woodbury et al. 1995!. Through the analysis of the age structure of
populations using fish otoliths, much information can be gained on the topic of
recruitment variation.

Otoliths
Annular growth rings have been used to age fish for over two hundred years,
Early researchers focused on the use of vertebral elements followed later by the use of'
scales. The use of otoliths as a tool for aging began almost 100 years ago as
researchers discovered the presence of annular rings on the surface of otoliths Jones
1992!. Age determination in fishes remained at the annular level until the early 1970's
when researchers discovered that many teleost fishes deposit growth accretions on the
otoliths with a 24 hour periodicity Fhnella 1971; Struhsaker and Uchiyama 1976!.
Shortly thereafter, researchers realized the usefulness of this technique for studies
involving larval and juvenile fishes Brothers et al. 1976!. Since this time, the use of
otolith increment analysis has added a much needed tool in our search for the
underlying mechanisms of recruitment variability. Information gained from otoliths
has been used successfully in both the marine and freshwater environments to explore
the causes of recruitment variability Methot 1983; Rice et aL ].987; Yoklavich and
Bailey 1990; Woodbury et al. 1995!.
The three otolith organs are fluid-filled sacs that each contain a dense mass of
some form of crystalline calcium minerals. Nonteleost vertebrates usually have otolith
organs which contain a less dense collection of small crystals called otoconia or
statoconia, bound together in a collagenous matrix. In contrast, most Actinopterygian
fishes, and in particular teleosts, have the crystalhne matrix developed into a much
more rigid stone-like structure and these structures are called otoliths Popper and Platt
1993!, Otoliths are acellular structures used in sensory perception that develop within
the endolymphatic sac of the inner ear Carlstrom 1963!, The daily secretions
increments! commonly found on many teleost otoliths are bipartite structures
composed of an aragonitic form of calcium carbonate and a discontinuous zone

10
composed of an organic matrix Degens et al, 1969; Mugiya 1987!. The basis for the
daily deposition of increments is thought to be an endogenous circadian rhythm that is
entrained or modified according to exogenous environmental cues Volk et al. 1995!.
Several laboratory studies have helped elucidate the interactions between light, feeding,
lunar phase, and temperature on the formation and appearance of otolith increments
Taubert and Coble 1977; Campana 1984; Neilson and Geen 1982; Jones and Brothers
Two concerns that must be addressed when using daily increments in the
construction of hatchdate date of capture minus age! distributions are the questions af
increment deposition rate and the issue of increment resorption. While incidents of
non-daily increment deposition have been found Taubet and Coble 1977; Methot and
Kramer 1979; Volk et aL 1995!, there is no demonstrated evidence for the resorption of
increments once they have been formed Campana and Neilson 1985; Jones 1992;
Neilson 1992! except under conditions of extreme stress. The presence of non-daily
increment formation in some species necessitates the need for validating increment
deposition rates in each fish species examined Beanush and McFarlane 1985, Geffen
1992!
The formation of daily increments has allowed researchers to calculate the
hatchdates of individual fish with greater accuracy and precision than was previously '
possible Campana and Neilson 1985!. By using age structure information as
determined by the use of daily increment analysis, scientists have been able to
determine the hatchdate distributions of many populations of larval and juvenile fishes.
This knowledge on hatchdate distribution can then be compared with the timing of
spawning to determine which periods, if any, in the early life history of the fish
resulted in decreased mortality, and conversely, increased survival rates e.g., Methot

1983; Crecco and Savoy 1985; Rice et al. 1987; Yoklavich and Bailey 1990; Mokness
and Fossum 1992; Fossum and Mokness 199'!. If periods of increased survival are
found to exist, then these critical periods can then be examined for possible
relationships with various factors hypothesized to control recruitment success.
In this study, the question of whether survivorship rates % successful recruits!
for a population of larval and juvenile Pacific hake vary interannually is addressed. To
accomplish this goal, I used three approaches; �! determination of first increment
deposition on laboratory reared larval Pacific hake otoliths, �! validation of otolith
increment deposition rates on laboratory reared Pacific hake, and �! companson of
empirically determined hatchdate distributions with estimated spawning cycles to
determine if periods of differential survival occur intra-annual and interaonual! within
the early life history of a population of Pacific hake. The following null hypotheses
were tested.'
H.: the relationship between primary increment number and age days post-
first increment deposition! differs significantly from a ratio of 1:1 for laboratory reared
larval Pacific hake.
H: the distribution of calculated hatchdates of field caught larval and juvenile
Pacific hake are not significantly different from the estimated spawning distributions.

Methods and Materials
Pacific Hake Kgg Sampling
Pacific hake eggs used in the determination of spawning cycles were collected
from a standardized sampling location �7' 47' N, 122' 49' W! in the upper third of
Dabob Bay, Washington, USA Fig. 1!. Both a OAO m diameter net and a 1.0 m,
333 pm and 500 pm mesh multiple mesh, electronically telemetered Tucker trawl
system Frost and McCrone 1974! werc used in the collection of samples. Vertical
taws from near bottom to the surface were made with a OAO m diameter, 73 pm mesh
net and were conducted on the following dates; D February, 27 February, 14 March, 2
April, 9 April, 16 April,23 April,4 May, 7 May, 10 May, 13 May, 16 May, 19 May,
22 May, 4 June 1990; and 5 February, 12 February, 20 February, 25 February, 8
March, 10 March, 13 March, 16 March, 19 March, 22 March, 26 March, 18 April, 6
May, 22 May, and 11 June 1991. Replicate, usually triplicate, hauls were taken and all
samples were fixed in 10%%uo buffered formalin upon collection S. Bollens, San
Francisco State Univ., unpublished data!.
The OAO m diameter net data was selected for generation of abundance
estimates since on the average it collected more eggs/sampling date than collections
made with a 1 m net fitted with either 209 or 216 pm mesh. In addition, I chose to use
the data sampled with the OAO diameter net since there were more samples from which
to estimate egg abundance cycles Table 1!. Although the OAO m diameter sampling
locations were in a shallower location �10 rn! than where larval and juvenile samples
were collected �90 m!, it was assumed that they were representative of egg abundance
cycles during Pacific hake spawning within Dabob Bay.

13
322 50 W
122450 w
Figure 1. Map of Dabob Bay with bathymetry and the location of sampHng locations A:deep station 190 m and 8: shsHow station 110 m Adapted from BoQens and Frost 1989!.
4 Tcl50'N
47445'N
4750'N
47,45l
N

Table l. Gear type, sampling location, and egg abundance estimates egg/m'! forPacific hake eggs collected within Dabob Bay, WA. during 1990-1991.
Date StationDate Station
Date StationStationDate
Tucker Trawl EggAbundance eggs/ m'!
393745581165666378
Date StationTucker Trawl EggAbundance eggs/ m'!
276029771454823629
StationDate
2/13/904/2/90
4/17/905/7/90
5/19/90
3/12I913/26/914/18/91
5/6/915/22/91
A A A A AA A A A A
2/13/90.2/27/903/14/904/~9904/9/90
4/16/904/24/905/4/905/7/90
5/10/905/13/90S/16/905/19/905/22/906/4/90
2/13/902/27/903/14/904/2/904/9/90
4/16/904/24/905/4/905/7/90
5/10/905/13/905/16/905/19/905/22/906/4/90
A B 8 B 8 8 B B B B B BA 8 8 B 8 8 8 8 B 8 B B 8
40 cm Net Abundance eggs/m'!
35738
84160 0 8 0 0 0 0 0 0 0 0
I Meter Net EggAbundance eggs/ m'!
3089
156IS0 0 8 0 0 0 0 0 0 0 0
2/5/912/12/912/20/912/25/913/8/91
3/10/913/13/913/16/913/19/913/22/913/26/914/18/915/6/91
5/22/916/11/91
2/5/912/12/912/20/912/25/91
3/7/913/10/913/13/913/16/913/19/913/22/913I26/913/18/915/6/91
5/22/916/11/91
8 8 B B 8 B B 8 B 8 B 88 8 B B 8 B B B 8 B 8 8 8 B
40 cm Net Abundance eggs/m'!
521
0 82780109
34746418374
0 0 0 01 Meter Net Egg
Abundance eggs/ m~!317-14
7413942
11928016536
0 0 0 0
15
Samples were split, with a fraction of the total saxnple being examined and the
number of Pacific hake eggs enumerated. From this information on the number of
eggs in a sample and volume of water filtered, egg abundance estimates eggs/m'! were
calculated for each sampling date. These egg abundance estimates formed the basis for
the estimation of the temporal relationship of Pacific hake spawning cycles within
Dabob Bay.
There were a total of LS sampling dates in both years on which eggs were
collected in an effort to model the spawning cycle of Pacific hake within Dabob Bay.
Since eggs were present at the beginning of the sampling dates during both years, it
was impossible to determine the start of the spawning cycle on the basis of these
samples alone. Bailey and Yen �983! determined that the spawning cycle for Pacif tc
hake within Dabob Bay begins after 10 January and is completed by 21 June. These
dates were used as the starting and finishing dates for our modeled spawning cycle and
it was assumed that minimal spawning occurred outside of these dates.
Due to the length of time periods between sampling dates, it was necessary to
develop a method for interpolation between dates. Egg abundance estimates between
sampling dates were estimated using linear interpolation. Calculations were tnade with
the equation: yi - mx + b, where yi = relative abundance of eggs on day i, m slope!=P2 � +
, x = sampling date, and b x axis intercept.xx � Xs '
X,arval rearing
Studies focusing on the timing and periodicity of otolith increment formation
were carried out using Pacific hake eggs collected in Port Susan, Washington.
Samples were collected on the mornings of 2 February, 13 February, and 26 February

16
1993 by the use of a 0.5 m 250 pm mesh net, with the cod end modified to collect live
zooplankton. Tows were conducted by lowering the net to the bottom and slowly
towing it near the bottom for approximately 20 minutes. At the completion of the tow,
the net was brought into the boat, samp1es were washed down and codends were
deposited into 41 glass jars. Transfer containers �1 glass jars! were filled with
seawater and placed on ice in a darkened cooler for transportation back to the lab for
sorting. During transfer back to the lab, temperatures were monitored and kept to
within 1-2 C of ambient surface temperature at time of sampling by use of ice bags
placed next to the containers.
In the laboratory, hake eggs were sorted from the plankton samples using a
large bore pipette and transferred into 4 I glass jars filled with filtered seawater. These
static flow incubation chambers were placed into a temperature controlled bath.
Temperature profiles were maintained throughout the bath by the use of both heaters
andacirculationpump. Twotemperaturetreatments 8'Cand12 C! were maintained
during the rearing experiments, At depths were eggs and yolked larvae reside, the
conditions of Dabob Bay most closely approximate 8 'C Bollens, et al. 1992!. It was
therefore important to determine the time larvae required at this temperature to begin
otolith increment deposition. The 12 'C treatment was selected since it approximates
the surface layer temperatures where latvae and juveniles reside in the spring. Eggs
co1lected on 2 February werc placed into the 8 'C tre ament and subsequently hatched
larvae were reared at this temperature. Eggs and resulting larvae from all other
coHection dates �3-26 February! were placed into the 12 'C treatment. Lighting was
provided by overhead fluorescent lights set on a 10 hour-on/14 hour-off cycle to match

17
ambient light cycles. Light intensity was maintained at approximately 9 micromol
photon/m /sec for periods when the lights were activated.
Incubation chambers were examined each morning shortly after the lights
switched on. Newly hatched larvae were transferred using a large bore pipette into 4 I
glass static rearing chambers filled with filtered seawater. Daily-hatched cohorts of
larvae were labeled and placed into the temperature bath for rearing. In order to
minimize disturbance to developing eggs and larvae while maintaining sufficient water
quality, 2S lo of the water within the chambers was exchanged by siphoning daily. At
this time non-viable eggs and dead larvae were removed with a pipette from individual
chambers.
About 2 days prior to the opening of the mouth ~ 12 d at 8 'C and 4 d at 12
'C! Bailey 1982!, larvae were presented with a prey source. Developing larvae were
offered a diet of rotifers Brachionus plicarilis, Muller! combined with the algae
Isochrysis sp. and Pavbva sp. Concentrations of rotifers were maintained at densities
of 20/ml which was within the range determined to be sufficient for growth of larval
walleye pollock Theragra chatcogramma! and northern anchovy Zngrmlis rnordax!
Bailey and Stehr 1988; Theilacker and McMaster 1971!. Rotifer levels were measured
periodically from concentrations in rearing chambers after water exchange.
In order to generate a series of known age Pacific hake larvae for increment
validation studies, individual larvae were randomly selected from rearing chambers for
measurement and otolith extraction. Due to constraints on the number of larvae
available for sacrifice, a complete time series of known age larvae was not collected.
Larvae from the 8 'C treatment were sampled on the following days post-hatch: 1, 2, 5,
7, 9, 10, 16, 17, 18, 21, 22, 24, 25, and 26. In the 12 'C experiments larvae were

18
sampled on days 1, 2, 8, 10, 12, 14, 18, 20, 23, and 28 days post-hatch. Upon
removal from the rearing chambers, larvae were placed in a solution of Tricane
methanesulfonate MS-222 .! until anesthetized. After anesthesia, fish were measured
SL! to the nearest .1 mm with the use of a dissection microscope fitted with an ocular
micrometer. Following measurement, individual fish were placed into 95% buffered
ethanol for preservation.
Timing of first increment formation was estimated by the use of inverse
regression Rice 1988!. Using this method I was able to calculate the day of first >- B i!gi!!increment formation using the model: Xti] - where xi = day of post-
@i]
hatch, y = increment count, B ' = y intercept, and 8 = slope of regression line.
Periodicity of increment formation was calculated using analysis of covariance
i.e. ANCOVA!. Validation of daily increment formation was assumed if the slope of
the regression of increment count on age days post-hatch! was not significantly
different than a'slope = 1. The model used in the analysis of covariance wasB-1
t. ~,.-x! where ~ test statistic a,n -2, B= slope of observed regression line,Sa
and S~ = standard error or regression equation.
Larval-Juvenile Pacific Hake Collection
The collection of larval and juvenile Pacific hake occurred in early summer
1990-1991. Specimens were taken in the same location that PaciTic hake eggs were
collected Fig. 1!. Collections were made using a Frame net Methot 1986! on
12-13 July, 1990 and 11-12 June, 1991 by making replicate, double oblique nighttime
tows in the upper 150 m. A total of 1059 hake were captured over the sampling period
�990 n~6 and 1991 n=223!. Individuals were removed from the net and placed in
buffered ethanol 95%! for storage. Fixative was changed in the sample jars twice

19
during the 10 days following sampling S. Bollens, San Francisco State Univ.
,unpublished data!. Following fixation, standard lengths to nearest I mm! were
recorded for individual Pacific hake by the use of a calipers.
Gtolith Kxtraction-Preparation
The removal of otoliths from laboratory reared larval Pacific hake was carried
out using a dissecting microscope fitted with a polarizing filter. Both the lapilli and the
sagittal otoliths were teased out of the otic capsules with fine dissecting needles, cleared
of excess tissue by use of distilled water coupled with dissecting needles, and
embedded in translucent nail polish concave side down on a microscope slide. For
larval fish, all four otoliths � lapilli and 2 sagittae! were mounted on the same slide.
Due to the translucent nature of the larval lapilli and sagittal otoliths, polishing and
grinding was not necessary for the examination of increments.
The data for the construction of an age-length key examining the hatch-date
distribution of larval and juvenile Pacific hake required large sample sizes. A total of
200 fish from each year were desired for the generation of the hatch-date distribution
information Due to the large number n~7! of Pacific hake collected in 1990, a
subsample of fish were randomly chosen for otolith removal. All collected individuals
from 1991 nMI9! were selected for otolith removal due to problems with otolith
mounting and interpretation i.e. not every dissection or preparation was successful!.
Of the three pairs of otoliths sagittae, asterisci, and lapilli!, present in Pacific hake, the
sagittal otoliths were used exclusively in the construction of the hatch-date distribution.
Sagittae were chosen because of their relatively larger size, which allows for easier
removal, greater ease of preparation, and potentially increa.md resolution due to the
larger diameter of the increments Secor et al. 1992!. Following measurement, fish

20
were placed under a dissecting scope fitted with a polarizing filter to ease in the removal
of otoliths. Sagittal otoliths were removed following the "up through the gills method"
as outlined in Secor et al. �992!.
After the otoliths were removed, excess tissue was cleared using distilled water
and slight rubbing pressure from the fingers. Otoliths were allowed to air dry for
approximately 15 min. One otolith per fish was placed sulcus side up on a glass slide
with a small amount of translucent epoxy for affixation. The remaining otoliths were
placed in labeled vials for future use if necessary.
Due to the opaque nature, curvature, and thickness of the juvenile sagittal
otoliths, external viewing of daily increment structures was not possible without further
preparation. In order to resolve the daily increments, a multiple step grinding process
was implemented for field caught specimens. Initial grinding was performed on a
lapidary wheel fitted with wet grind 500 grit sandpaper. During the first grind, otoliths
were reduced down to the primary growth zone. The primary growth zone is the fan
shaped area surrounding the nucleus and differs from the rest of the otolith in crystal
orientation Nishimura and Yamada 1984!. The second step in the polishing process
was accomplished using a 12 um aluminum oxide disc Buehler .! for several
minutes. Periodic checks on the progress of grinding were made using a compound
microscope to ensure that the otolith was not overground grinding beyond the
nucleus!. Polishing was concluded using a series of progressively finer silicon carbide
and aluminum oxide Buehler .! polishing discs: 3 um, 1 um, and 9 um. Polishing
was deemed coinplete when the reader was able to identify the narrowest increments
around the nucleus.

21
Otolith Interpretation and Measurement
Otoliths extracted from fish were examined using a research grade compound
microscope fitted with a blue filter to improve resolution of otolith structures. In order
to remove any potential biases, microscope slides were given a random code so the
reader had no prior knowledge af the age days post-hatch! or length of a given fish.
AII otoliths were set for examination by mounting the slide on the microscope stage and
then placing a drop of immersion oil over the otoli th surface. Measurements and
increment counts were made by a single reader with the periodic consultation of three
other experienced readers. Magnification used on all incitement readings was 1000x
while magnification used on measurements varied between 100-1000x depending on
the size of the otolith encountered. Individual otoli ths were measured to nearest 1 um
with the use of an ocular micrometer. Measurements recorded were: diameter of
nucleus, length along longest axis, and length of radii distance from center of nucleus
to edges of otolith along the longest axis!.
The aging axis trarlsect along which ages were read! for individual otoliths was
chosen by the criteria axis length and increment clarity! outlined by Campana �992!.
Once an axis was chosen, increment counts were made starting at the edge of the
nucleus and continued distaDy towaai the margin of the otolith! until the edge was
reached. Replicate readings were made for each otohth and the best reading, as
determined by the reader, usually the highest count and or best clarity! was recorded.
In the case of the laboratory reared larvae, all otoliths available were read. After
examination of all otoliths, the best count as determined by the reader was recorded as
the increment count for the individual, During the counting process, the micrometer
was often used as a reference point on the otolith, The edge of the micrometer was

placed on the increment being examined at a given moment in time and its positionrelative to the otolith was controlled by movement of the microscope stage.
Interpretation of daily increments occasionally became diff icult due to theappearance of probable sub-daily structures. This difficulty lies with the morphologicalsimilarities between the daily and sub-daily increments Campana 1992!. Rhea thissituation was encountered, the reader was forced to make a decision on the status of anincrement. Sub-daily increments were usually less prominent than daily increments butoften the best method of determination was to use tile regularity/continuity criteria asoutlined by Campana �992!. Another method that worked well was to shift the focusin and out on an individual increment. As the reader focused up and down on aparticular region it could be discerned if a ring would split into two or more rings as thefocus was changed. If in fact the split did occur, then it was assumed that the originalring was a daily increment, and the derived split' rings were recorded as sutxhilystructures.
Spawn-Date Distributions
Individual spawn-dates for a sub-sample of the field coUected PaciTic hake werederived from information generated from laboratory rearing experiments day of first:increment formation!, otolith increment analysis age!, time to hatch, and date ofcapture. An additional 4.5 days were added to the age estimates to account for thetiming of first increment formation as determined by inverse regression. Bailey �982!determined that time to hatch at 8 'C the approximate temperature of Dabob Bay! was6.S days. This time to hatch was added to the time to first increment formation and atotal of 11 days were added to all age estimates to back~culate to the age atspawning. Length frequency distributioM representing all field caught specimens were

used in the construction of age-length keys Kimura 1977!, Separate age-length keyswere developed for each year from randomly chosen subsamples of fish within each
year.
Since fish spawned closer to the collection date younger fish! experienced less
mortality than older fish, mortaLity corrections were made to adjust for these differences
{Yoklavich and Bailey 1990; Brown and Bailey 1992; and Woodbury et al. 1995!.
Mortality rates were based on fish length following the estimates of larval and juvenile
mortality rates developed by Hollowed �992!. Using these estimates a step sized-
specific mortal i ty function was created with mortality estimates of .05 d ' for larvae
between 10-34 mm SL and .02 d ' for larvae and juveniles between 35-60 mm SL.
Since all fish aged in this study were greater than 10 min SL, abundances were not
corrected for mortality that occurred while fish were less than 10 rnm SL. lt was
assumed that the age-specific mortality rates which occurred at ages prior to the
youngest fish in the sample were experienced by all fish collected and that these
mortaLity rates would have no effect on the shape of the resulting hatch-date
distributions Carnpana and Jones 1992!.
Duration of time between the size stepped mortality functions was calculated for
each year by fitting a linear regression model to the subsample of f ish aged. From this
analysis, inverse regression was then applied to determine the length of time days!
required for a fish to achieve a predetermined length Duration estimates were
calculated for length of time required for surviving larval and juvenile pacific hake fish
to attain lengths of 10 mm, 35 rnm, and 60 mrn SL
To examine changes in the rate of relative survivorship of larval and juvenile
Pacific hake over the course of the spawning season, an index of relative sur vival was

generated based on Methot �983!. The model is calculated by taking the ratio of the
weeldy spawn-date frequency to weekly egg production frequency.
Comparisons of calculated spawn-date distributions with egg production data
were carried out using a one sample Kolmogorov-Smirnov KS! test Zar 1984! . The
KS test examines differences in the cumulative relative frequency distributions of
observed and expected distributions. In this case, the test was conducted in such a way
that the expected distribution was defined as egg-abundance timing of spawning!
which was then compared to the observed distribution defined here as the back-
calculated spawn-date distributions aged sub-sample of fish!.
To estimate the test statistic, the following calculations were made! I ~ EDi - elFi-relF~ and D'i - rely-r rely! where Fr= cumu1ative observed
frequencies and Fr = cumulative expected frequencies. The test statistic for a one-
sample KS test is D - max[ max D ! max lYr!] which can be interpreted to mean D is
the largest vaIue of 13! or D'i. Critica1 values for the teststatistic were determined by0,16693
application of L4,» an
Growth
Growth of larval and juvenile Pacific hake was examined by fitting a Laird
Gompertz growth model Laird et al. 1965! to the subsamples of fish for which age
estimates were developed. With respect to larvae, the Gompertz or Laird Gompertz.
growth model has become the most frequently fitted model for examination of growth
Carnpana and Jones 1992!. Several researchers have successfully used this model to
explore both spatial and temporal differences in larval and juvenile fish growth
Sakagawa and Kimura 1976; Zweifel and Lasker 1976; Warlen 1992; and Woodbury

et al. !995!. The equation is in the form: SL ! -SL o>Sx!r tA s!/rx11 � Ex!s � at!!.
where SL i! = standard length at day t, SL o! = assumed standard length at time of
hatch t=0!, and A�! = specific growth rate at hatching a0!, and cr = rate of
exponential decay of the specific growth rate. The Laird-Gompertz modeL was fitted to
the year specific age-length data using the solver function in Microsoft Excel 5.G ..
Ahlstrom and Counts �955! determined the size at hatch for the coastal stock
of Pacific hake to be approximately 2.4 rnm. The samples on which Ahlstrorn and
Counts �955! based these finding were collected via standard sampling methodologies
used during the California Cooperative Oceanic Fisheries Investigations Cal COFI!.
After collection, samples were fixed in 3-5% buffered formalin for preservation. No
corrections were made by Ahlstrom and Counts for shrinkage effects upon preservation
of newly hatched PaciTic hake larvae. Bailey �982! examined the shrinkage SL! of
f irst-feeding larvae exposed to various concentrations and delays in time of
preservation using ethanol and formalin. He determined that larvae exposed to
conditions similar to Cal COFI methodologies experienced a 17% reduction in SL
Based on this information, size at hatch for larval PaciTic hake was fixed at 2.8 mm to
mitigate for the effects of preservation.
In an attempt to examine the interannual differences in growth rates of larval
and juvenile Pacific Hake, the Laird Gompertz model was fitted to data from both 1990
and 1991. To reduce any possible biases that could result from fitting a curve to f ish of
.different lengths, the range of data fitted by the model was limited to the length range
that was present in both years �6-35 mrn!. Average growth rates were calculated by
f itting a. linear regression model in the form of yi . mx + b to the predicted lengths

26
generated from the Laird Gompertz model. Average growth rates mm d '! were
calculated by taking the slope of the resulting linear regression equation.

RESULTS
Timing and Periodicity of Increment Formation
A total of 68 eggs were successfully incubated in the 8 'C treatment. Of the
68 resulting larvae, 29 individuals were aged. Larvae were reared to 26 days post-hatch at which time all remaining larvae were sacrificed for age determination. Bailey�982! determined that time to 100% death from starvation for larvae reared at 8 'C was
13.25 d SD = 2.7!. On the basis of these findings, it appears that larvae reared in
these experiments were feeding on the exogenous prey sources provided in the rearingchambers. During the course of measuring fish for otolith dissection, it became
apparent that many of the older larvae >10 d! exhibited signs of malnutrition and poordevelopment i.e. torsion!.
The effects of this poor nutritional state are evidenced by the timing andperiodicity of the first otolith increment formation in the 8 'C treatment, Using inverseregression the back-calculated day of fi rst increment formation was 3.51 d post-hatch
95% CI: 1.27 - 5.45 d!. The relationship between the number of otolith increments
and age days post-hatch! for the 8 C did not show strong evidence for daily incrementdeposition Fig. 2!. In this analysis, fish older than 16 d post-hatch were excluded
due to their poor nutritional state. The results of the linear regression model provideevidence that increment formation does not occur on a daily basis for larval Pacific hake
reared at 8 C in the laboratory. This is further evidenced by the results of the
ANCOVA which showed that there was a significant difference e=,01! between the
slope of the observed line B=.39! and a 8 =1 expected B for daily incrementformation! Fig. 3!. It should be noted that these results are likely biased by the effectsof starvation on the larvae.

28
18
12
Age days post-hatch!
Figure 2, linear regression for increment count vs. day post-hatch for larval Pacific hakereared in an 8'6 treatment. y = 0.306x+ 0. 1415 R = 0. 5578! Line fitted by least squaresregression Zar 1984!,

29
18
14
12
10
28
0
0 8 10 12 '14 16 18
Age days post-hatch!
Figure 3. Comparison of linear regression for increment count vs. day post-hatch forlarval Pacific hake reared in an 8'C treatment and a line with a slope of 1. Lines fitted byleast squares regression Zar 1984!.

30
A total of 71 eggs were successfully hatched in the 12 C treatmenL Of these
71 larvae, age estimates were generated for 47 individuals. Larvae were reared to 28 d
post-hatch at which time the remaining fish were sacrificed for age determination. In
his examination of the interaction of temperature and timing of starvation, Bailey
�982!, determined that time to 100% starvation was 9.8 d post-hatch SD = 1.2! at
12 'C. Since larvae survived to at least 28 d post-hatch in the experiment, it seems
probable that larval Pacific hake were actively foraging on prey iir the rearing
chambers. As was found in the 8 'C treatment, older fish > 12 d post-hatch! began
exhibiting signs of malnutrition and those fish which survived to 28 d post-hatch
appeared emaciated. Thus, it appears that although fish were foraging, they were not
feeding at rates necessary for proper growth and development,
In examining the timing and periodicity of increment formation, I chose to
exclude fish that were > 14 d post-hatch in an attempt to account for the affects of
starvation on increment deposition rates. The results of the inverse regression model
indicated that'the first increment is formed at 4.17 d post-hatch 95% CI; 2.24-5A5 d!.
In conducting the inverse regression analysis, I also chose to exclude fish that had not
yet deposited an increment since this information was not used in the prediction of daily
increment formation.
The results of the linear regression of age days post-hatch! against increment
. count shows a strong positive correlation r'=.85! Fig. 4!. Total sample size in the
computation of this relationship was 19. In addition, the results of the ANCOVA
showed that the slope of the regression equation B= .80! did not differ significantly
a=.01! from a slope = 1 Fig. 5!. These results when coupled provide strong
evidence that increment formation occurs on a daily basis throughout the first fourteen

31
10
2
6 8 10 12Age days post-hatch!
16
Figure 4. Linear regression for increment count vs. day post-hatch for larval Pacific hakereared in an 12'C treatinent. y = 0.8382x - 2. 6471 R' = 0,8642! Line f itted by leastsquares regression Zar 1984!.

32
10
0
V Q 88 0Days Post-Hatch
Figure 5. Comparison of linear regression for increment count vs. day pos t-hatch forlarval Pacific hake reared in an 12'C treatment and a line with a slope of 1. Lines fitted byleast squares regression Zar 1984!.

33
days post-hatch for Pacif rc hake larvae. On the basis of this information, it was
assumed that. daily increment formation continued throughout the larval and juvenilestages encountered during the course of this work.
Growth
Age-length data calculated for 1990 and 1991 were fitted to Gornpertz growthcurves Figs. 6-7!. The estimates for the parameters of the Gompertz growth modelappear to show interannual difference in growth rates for surviving larval and juvenilePacific hake for 1990 and 1991 Table 2!. In both years, growth of surviving larvaland juvenile Pacific hake appears to progress slowly over the first 4 mo of life
~MO mm SL!. Following this early period, growth accelerates as the fish get older.
This period of accelerating growth rates is more evident in the 1990 fish which were
sampled later in the year 12-13 July! in comparison to the 1991 larvae and juvenilesthat were collected on 11-12 June.
Evidence for interannual differences in the average growth rates over the first
4 months of Hfe for larval and juvenile Pacific hake was found to exist Fig. 8!. Fishbetween 16-35 mm SL were used for these analysis as these size categories werepresent during both years. Average growth rates were calculated by fitting a linearregression model to the predicted standard lengths mm!. Mean growth rates were lessover the calculated size range in 1990 �.24 mm d '! than that derived for 1991
,30 mm d'!. Although fish from 1990 reached a greater length-at-age <16 mm SL!than those fish in 1991, growth rates following this period increased for the 1991 yearclass. This data provides strong evidence that differences in growth rates were presentin larval arid juvenile Pacific hake for the years 1990-1991.

34
60
40
C
p 30
ZO
10
60 90 120
Age days post-spawn!
30 150 180
Figure 6. Age length data for surviving larval and juvenile Pacific hake collected fromDabob Bay, WA. during 1990. Fitted line represents the Laird Gompertz growth model Laird et al. 1965!.

SO
p 30
I20
10
0
300 60 90 120
Age days post-spawn!1SO 180
Figure 7. Age length data for surviving larval and juvenile Pacific hake collected fromDabob Bay, WA. during 199L Fitted Hue represents the Laird Gompe~ growth model Laird et ai. 1965!.

Table 2. Gompertz growth model parameters from models fitted to length at age datafor larval and juvenile Pacific hake collected from Dabob Bay, %A. during 1990 and1991.
a al ha SSEYear
202 2.8 mm .026053 3583.S
1350.22.8 mm .027367

37
35
30
70 130
Age days post-spawn!
Figure 8. Predicted values for the Laird Gompertz growth model applied to the age lengthdata for larval and juvenile Pacific hake �6-35 mm SL! sampled in Dabob Bay, WA Lairdet al. 1965!, Predicted lengths from the Laird Gompertz models have been fitted with aleast squares linear regression model to calculate average growth rates as determined by theslope of the model Zar 1984!. 1990 data is represented by the hatched line y = 0.236x�0,962 R' = 0. 999!. 1991 data is represented by the continuous Une y = 0.304x -9. 101R' = 0.998!
Spawn-Date Distributions
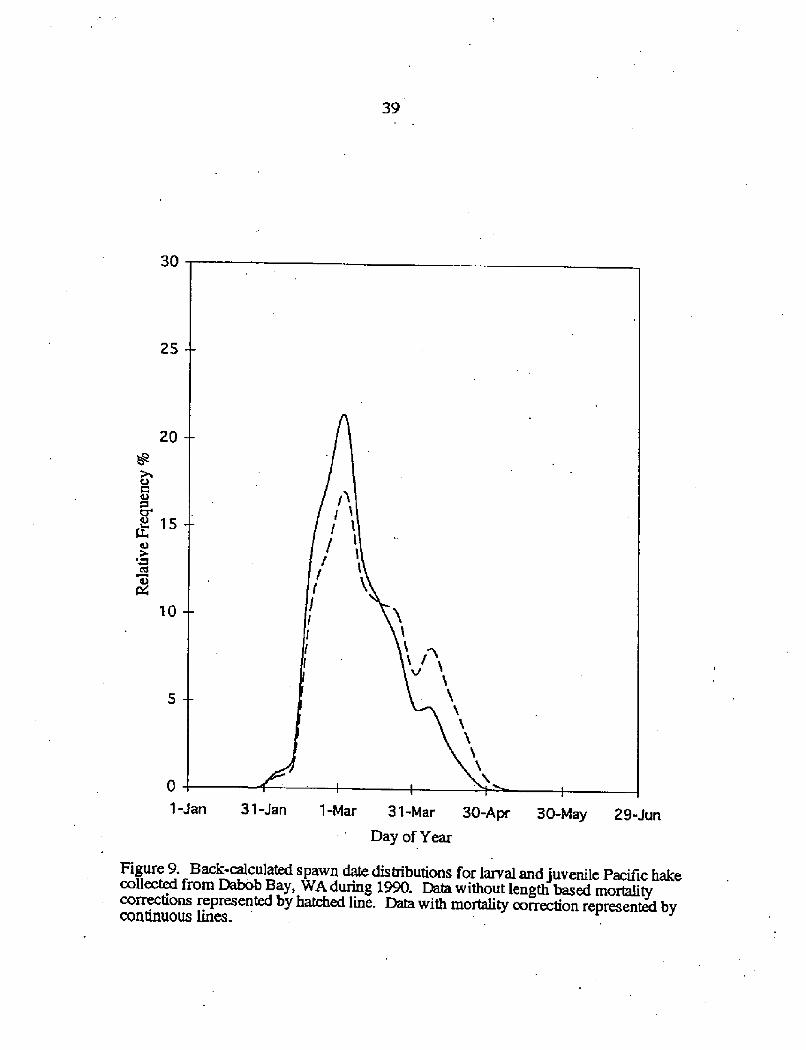
Mortality corrections applied to the back-calculated spawn-date distributions of
surviving larval and juvetule Pacific hake increased the relative frequency %! of f ish
which were spawned earlier in the year and decreased the abundance of those fish
spawned later in the year Figs. 9-10!. In addition, the length based mortality
correction also increased the magnitude of the peak spawn-date abundance.
The back-calculated spawn-date distributions of surviving larval and juvenile
Pacific hake from both 1990 and 1991 were uni modal in shape and occupied a
relatively narrow window of time from late January into late March Fig. 11!. While
some similarities in the shape of the curves existed, there were several differences
between years. The duration of the spawn-date distributions for surviving larval and
juvenile Pacific hake were similar between years �990 = 92 days and 1991 = 91 days!
but differed in timing between years. In 1990, the back-calculated day of spawn for
surviving larval and juvenile Pacific Hake ranged from 1 February through 9 May.
During 1991. the range of spawn-date back-calculations was from 8 January through9 April.
In 1990, the back-calculated spawn-date distribution of surviving larval and
juvenile Pacific hake reached its maximum on 3 March. The date of the mean back-
calculated spawn-date distribution was 14 March with a median value of 18 March.
This is in contrast to 1991 which exhibited a peak in the back-calculated abundance of
survivors almost a month �1 February! earlier in the year. In 1991, the mean value of
back-calculated spawn date was 20 February and the median value was 23 February,
ln general, the back-calculated distribution of survivors occurred later in the year
during 1990 and exhibited a more uniform less truncated! temporal distribution withrespect to 1991.
39
2S
20
'10
0
1-Jan
Figure 9. Back-calculated spawn date distributions for larval and juvenile Pacific hakecollected from Dabob Bay, WA during 1990. Data without length based mortalitycorrections represented by hatched line. Data with mortality correction represented bycontinuous lines.
@O
15
31-Jan 1-Mar 31-Mar 30-Apr 30-May 29-JunDay of Year

30
25
20
15
10
1-Mar 31-Mar 30-Apr 30-May 29-Jun1-Jan 31-Jan
Day of Year
Figure 10. Back-calculated spawn date distributions for larval and juvenile Pacifichake collected from Dabob Bay, WA during 199l. Data without length basedmortality' corrections represented by hatched line. Data with mortality correctionrepresented by continuous lines.

41
30
25
20
10
1-Jan
Figure 11. Back-calculated spawn date distributions of larval and juvenile Pacific hakecorrected for mortality for 1990 and 1991. Hatched line represents 1990. Continuous linerepresents 1991.
g
F 15
31-Jan 1-Mar 31-Mar 30-Apr 30-May 29-JunDay of Year

42
Egg Abundance - Titning of Spawning
In the initial examination of the egg abundance data, it became apparent that the
egg abundance estimate from the 13 February egg collection sample was much greaterthan on any other sampling date Table 1!. The 13 February sample was collected at
the deep water �90 m! central station within Dabob Bay Fig. 1! while all other
samples collected with the 0,40 m sampling gear were taken at the shallower station
�10 m!. When the 13 February sample is excluded from the data analysis, the eggabundance cycles for both 1990 and 1991 appear to be similar in the timing of peakabundance and duration of spawning seasan. For these reasons, I chose to exclude the
13 February data from my calculations on egg abundance cycles.
Pacific hake spawning cycles in 1990 and 1991 reached their peak abundance
on the 14 March sampling date Fig. 12!, In both years, the estimates of egg
abundance cycles were unimodal in distribution. While similarities between years werepresent, some interannual differences did exist in the spawning cycles of Pacific hake.
In general, the 1990 spawning cycle was less truncated than that estimated for 1991.,
Egg abundance also differed between years, with greater egg abundance in 1991 than
in 1990. From these results it appears that overall egg abundance at the shallow station
�10 M! was lower in 1990 when compared to 1991 Table 1!. This question of
overall egg abundance is also supported by the data collected with the Tucker Trawl at,
the deep �90 m! station. Although not as pronounced as at the shallow station, mean
egg abundance per sampling date was greater in 1991 than in 1990 Table I!.Larval and Juvenile Survivorship
In comparing back-calculated spawn-date distributions of surviving larval and
juvenile Pacific hake with calculated egg abundance cycles, significant differences in
the cumulative relative frequency distributions were found to exist using the

43
40
10
]-Jan
Figure 12. Estimated cycles of Pacific hake egg abundance within Dabob Bay, WA for1990-1991. Samples were collected by vertia6 tows using a .4 m 73 pm mesh net.Hatched line represents 1990. Continuous line represents 1991.
tCh
w 30
20
31-Jan '1 -Mar 31-Mar 30-Apr - 30-May 29-Jun
Day of Year

Kolmogorov Smirnov one-sample test a=.01! for both 1990 and 1991. Drnax which
is calculated by the absolute differences in cumulative relative frequencies for observed
and expected distributions was reached on 5 March during 1990 with a calculated value
of .349. The critical value for a=.01, n=202! of .1 14 was less than the calculated
value so the null hypothesis there was no significant difference in the cumulative
relative frequency distributions for the observed and expected distributions ! was
rejected. In 1991, Dmax occurred on 8 March with a critical value of 0.858. This
critical value was also greater than the calculated critical value of .114 a=.01, n=202!
leading to the rejection of the null hypothesis for 1991.
The relative survival of larval and juvenile Pacific hake during 1990 varied over
the course of the spawning season Fig. 13!. In 1990, relative survival of Pacific hake
increased slowly from mid-January and rose throughout the month of February at
which time it then dropped rapidly during early-March. This pattern of low relative
survival continued until the end of March. Toward the end of March, survival rates
increased sharply and peaked during mid-April after which they dropped quickly and
were 1 % by the end of April.
Relative survival of larval and juvenile Pacific hake during 1990 varied over the
length of the spawning season. This is illustrated by the separation in the timing of
peak egg abundance and peak abundance of surviving Pacific hake larvae and juveniles
Fig. 14!. Relative frequency of surviving larval and juvenile Pacific hake peaked
earlier in the year than was found in the egg abundance cycle. By the time spawning
peaked on 14 March, the relative frequency of surviving larval and juvenile Pacific

45
40
30
25@O 2015
10
0 1-Jan 31-Jan 1-Mar 31-Mar 30-Apr 30-May 29-JunDay of Year
Figure 13. Cycles of relative survival weekly spawn date frequency / weekly eggabundance frequency! estimated for larval and juvenile PaciTic hake within Dabob Bay,%A. for 1990-1991. Hatched line represents 1990. Continuous line represents 1991.

50
45
40
35
10
0
1-Jan 31-Jan 1-Mar 31-Mar . 30-Apr 30-May 29-Jun
Day of Year
Figure 14. Comparison of back-calculated spawn date distribution of larval and juvenilePacific hake with estimated egg abundance cycle for Dabob Bay, WA during 1990.Hatched line represents back~culated spawn date distribution. Continuous linerepresents the estimated cycle of egg abundance

47
hake had began to decrease. This disjunct pattern of relative abundance provides
additional evidence that survival rates varied over the 1990 spawning season,
During 1991, the relative survival of larval and juvenile Pacific hake also varied
over the course of the spawning season Fig. 13!. Early season survival rates rose
sharply after mid-January and then fluctuated slightly while maintaining relatively high
levels until 18 February when it peaked at a maximum of 22.8%. This period of
relatively high survival rates was followed by a sharp decline in survival rate that
quickly fell to < 1% by early-March where it reinained for the rest of the spawni ng
season.
When comparing the calculated egg abundance cycle and back-calculated
spawn-date distributions for 1991 a pattern of disjunct tiining becomes evident
Fig. IS!. As noted earlier, the peak in back-calculated spawndate for surviving larval
and juvenile Pacific hake occurred on 11 February and was followed over a month later
by the maximum egg abundance estimates on 14 March. By the time of maximum egg
abundance, the relative frequency of surviving larval and juvenile Pacific hake was
dropping rapidly.
In summary, relative survival of larval and juvenile Pacific hake reached higher
values in 1990 than those calculated for 1991. This distribution of survival rates in
1991 was unimodal whereas the distribution for 1990 was clearly bimodal in shape.
These changes in relative survival rates are also evidenced by the fact that there was a
greater degree of non-overlap in the relative frequency of surviving larval and juvenile
Pacific hake in 1991 than was found in 1990. This information provides strong
evidence that differences in the interannual survival rate of larval and juvenile Pacific
hake existed within Dabob Bay for the years 1990 and 1991.

DISCUSSION
The results of this study provide evidence that the timing of first increment
formation on the sagittal otoliths of Pacific hake occurs at approximately 4 days post-
hatch. In addition, there is evidence that increment deposition occurs daily in at least
the first two weeks during the life of larval Pacific hake. This background information
on the timing and periodicity of increment formation is required for the second portion
of this study; examining the interannual variability in growth rates, spawn-date
distributions, and the intra-annual variability in survival rates for larval and juvenile
Pacific hake. In this component of the project I found evidence to show that
interannual differences exist both for growth rates during the first 141 d post hatch and
back-calculated spawn-date distributions of surviving larval and juvenile Pacific hake
for the years 1990-1991. In conjunction with the above findings, I found significant
intra-annual differences in the distribution of surviving larval and juvenile Pacific hake
when compared to estimated spawning cycles.
Recruitment success in Pacific hake can vary dramatically from year to year.
Dora et al. �993! estimated that recruitment success can exhibit more than a
hundredfold variation on an interannual basis. These large scale fluctuations in
recruitment success when coupled with the fact that year-class strength is fixed during
the first three to five months of hfe Bailey et al. 1986!, make seemingly insignificant
variations in growth rate more important, GuIland �965! and Houde �987! both
propose' that small changes in the duration of the larval stage could have large impacts
on the amount of juveniles at a later date. Since length of larval stage is dependent
upon growth rate, this relationship supports the theory that small changes in growth
rates can affect the abundance of fish recruited to the juvenile population.

In the present study, average growth rates for surviving larval and juvenile
Pacific hake between 16 and 35 mm SL �990 n = 157; 1991 n =186! varied between
years. Fish between 16-35 mm SL were used for these analyses as these size
categories were present during both years of the study. During 1990 the growth rate
over this length strata was slower .24 mm d '! than that calculated for 1991
.30 mm d' !. Both of these growth rates exceed the value �.20 mm d'! calculated byWoodbury et al. �995! for fish between 16.5 and 30 mm SL. In addition, the rates I
calculated for 1990-1991 are also greater than the rates Woodbury et al. �995!
calculated from data collected by Bailey �982, 0.22 mm d '!. It. should be noted that
the value calculated from Bailey's data was from a wider size range approximately
5-35 mm! and may not be directly comparable to our results due to varying size-
specific growth rates. Rates calculated for Puget Sound stocks were greater upon
comparison to the coastal stocks of Pacific hake listed above. It is important to note
that these results may rellect interannual variations in age-specific growth rates since
mean rates calculated for the inshore stocks varied by 25 % between 1990-1991.
Although average growth rates during the first 141 d post-hatch of surviving
larval and juvenile Pacific hake were less for 1990 in comparison to 1991, there were
periods of time where growth rates during 1990 appear to exceed those estimated for
1991. During the first 120 d post-hatch, fish spawned in 1990 n = 159! had a greater
length-at-age and thus grew faster during tMs portion of their life than those survivingfrom 1991 n = 125!. This relationship is partly driven by the fact that fish <16 mm in
1990 had increased length-at-age than that estimated for survivors from 1991. From
these length-at-age estimates, it appears that the fish from 1990 experienced more
favorable conditions for growth during the first 70 d post-hatch. By day 120 post-
hatch surviving larvae and juvenile Pacific hake achieved the same length-at-age for

S1
both years. Following these first 4 months of grow th, the surviving juveniles from
1991 n = 37! showed an increase in the length-at-age estimates in comparison to thosecalculated for 1990 n = 32!. While sample sizes were relatively small for the ages> 120 d post-hatch, it appears that surviving larvae and juveniles from 1991
experienced increased growth rates after the first 4 months of life in comparison tothose survivors from 1990.
Length-at-age estimates of surviving larval and juvenile Pacific hake show that
growth progresses slowly over the first 4 mo of life ~0 mm SL!. Following this
early period, growth appears to accelerate as the fish increase in age. This period ofaccelerating growth rates is more evident in the 1990 fish which were sampled later inthe year �2- 13 July! in comparison to the 1991 larvae and juveniles that were colIected
on 11-12 June. Parameter estimates derived from these data reflected these differences
with an estimated growth rate at hatching A o! ! of .026 mm d ' in 1990 and an
estimate of .027 mm d ' in 1991.
It is interesting to note how the change in growth rate corresponds to the
transition from the larval to juvenile stages for the Pacific hake. Although this
transition is subtle and takes place over a protracted period of time, I would argue thatthese increased growth rates may be in part due to completion of fin formation and the
subsequent ossification of the supporting fin structures. Ahlstrom and Counts �955!determined that the completion of transition from the larval to juvenile farms takes placebetween 30-35 mm SL, which corresponds nicely to the change in growth rates shownin the present study. The mechanism for this change in growth rates is likely complexbut undoubtedly achieving full fin formation and ossification must enhance the

52
swimming ability of juvenile Pacific hake and consequently their prey capture abilityand subsequent growth.
Both the pattern and magnitude of survival in larval and juvenile Pacific hake
varied between years during the course of this study. In 1990 survival rates exhibited a
bimodal distribution as opposed to the unimodal pattern observed in 1991. It appears
that survival was greater for fish spawned early in the year during 1991, This
increased survival rate was followed by a rapid decrease for fish spawned in early-
March and the remainder of the sampling period. During 1990, the observed pattern
indicated increased survival for fish spawned during late-February, decreased survival
for fish spawned in March, and increased survival rates for fish spawned during early-
mid April. This bimodal pattern of survival seems to indicate the presence of a factor
or factors which lowered the relative surviva1 rate of Pacific hake spawned during
March 1990. These patterns of variability in survival rate coupled with egg abundance
cycles and growth rate estimates suggest the potential for density dependent patterns in
growth and survival.
A possible reason for the observed decrease in the abundance of surviving
Pacific hake could be that overall survival rates through the collection date were lower
for the 1991 year class within Dabob Bay, WA. This decrease in abundance may be
attributable to disjunct patterns observed during the comparison of surviving Pacific
hake spawn-date distribution with the cycle of egg abundance, When egg abundance
peaked later in the year, survival rates for larvae and juveniles were very low. It
appears that factors may have been present in the environment which decreased the
overall survival of late-spawned larvae in 1991. Another possible reason for the
decrease in the number of individuals collected in 1991 could be due to bias associated
with the sampling gear.

Quantification of larval or juvenile abundance of many fish species becomes
problematic once the fish achieve a length of about 10 mm due to the abili ty of the
larval fish to avoid sampling gear Gunderson 1993!, In addition to net avoidance,
there is the problem of escapement and possible extrusion through the net material for
smaller individuals. Since all larvae and juveniles used for the calculation of spawn-
date distributions were collected using one gear type Methot net!, an age length key
applied to the entire sample may be biased if the net used for collection was size
selective in nature. Shima and Bailey �994! determined that the overall bias on the
backcalculation of hatch date distributions for walleye pollock ranging from
approximately 10 to 40 mm Sl was small when sampling with a Methot neL
In the present study, there were differences in the yearly timing of sampling that
may have confounded the results of the spawn-date distributions. Sampling for
survivors was conducted on 12-D July 1990 which was a full month later than the
sampling conducted in 1991 �1-12 June!. Although growth rates varied between
years, the difference in sampling dates is likely one of the reasons why there were
differences in the mean length of survivors collected between years �990 = 28,9 mm
SL, 1991= 23.6 mm SL!. Since the Methot net is shown to under-sample smaller size
classes of walleye pollock Shima and Bailey 1994!, the lower numbers of larvae
collected on the sampling date in 1991 could be reflective of this size selective bias.
This size selectivity may be one possible reason for the decrease in relative survival of
fish spawned later in the year during 1991, I."o~vever, during 1990 it appeared that
survival rates increased late in the spawning season late March - mid April! and that
these fish were represented in samples collected later in July. This provides some
evidence that the sampling gear used during the course of this study was effective in the

collection of smaller individuals and thus was suitable for subsequent backcalculations
of spawn date distributions.
It appears that differences in length-at-age and hatchdate distributions for
Pacific hake in the present study reflect variability in interannual growth rates and the
subsequent survival of a marine fish population in a semi-enclosed environment.
These findings are consistent with those of' Vfoodbury et al. �995! who concluded that
back-calculated spawn-date distributions, when coupled with egg abundance data,
indicated large interannual differences in larval mortal i ty rates from fish produced
during periods of peak spawning.
The back-calculated spawn dates for surviving larval and juvenile Pacific hake
examined in this study provided evidence that variability in the marine environment can
affect the survival of young fish. Although the range of back-calculated spawn dates
were similar in duration between years �990 = FZ d and 1991 = 91 d!, they differed in
their temporal distributions. Fish which survived to the sampling date in 1990 had a
incan spawning date of 14 March which was approximately 3 weeks later in the year
than that calculated for surviving individuals from 1991 �0 February!. Even though
survival rate estimates were very low during the period of peak egg abundance during
1990, the average back calculated spawn date for this year was still from the peak of
spawning. So, although survival rates were low, the bulk of those fish surviving until
sampling were spawned during the peak of egg abundance.
In addi tion, year specific spawn-date distributions also varied in their
relationship to calculated yearly egg abundance cycles. Significant intra-annual
differences between the cycles of egg abundance and spawn-date distribution of
surviving larval and juvenile Pacific hake were found to exist in both years. In 1991
the separation of spawn-date distribution from egg abundance cycles is more distinct

55
than that observed for 1990 and this is further evidenced by the lower relative survival
rates which occurred after early March in 1991. One possible source of bias in these
results could arise from the calculated egg abundance cycles. Although the ends of the
spawning cycle were f ixed on the basis of historic data Bailey and Yen 1983!, I feel
that the patterns represented between these end points is probably reflective of the
actual spawning cycles.
Variability in the temporal range of spawn-date distributions is comparable tothat found by Woodbury et al. �995!, They concluded that back-calculated spawn-date distributions of surviving larval and juvenile Pacific hake showed differences in
peak abundance of up to a month or more between years, However, one problem with
their analysis is the smaII samples sizes from which the age-length keys were derived,
These small sample sizes range 9-3 1! of fish that were aged, likely added a largevariance component to their age-length key. lt should be noted however, that the
magnitude of interannual differences in spawn-date distributions calculated here for
Pacific hake are in accordance with the findings for other pelagic fish species Methot
1983; %'oodbury and Ralston 1991; Mokness and Fossum 1992!.
Multiple studies have been published regarding the effect of fish nutrition on
increment deposition rate. Several authors have reported findings that indicate a
relationship between increment width and nutritional status in a wide variety of teleostfishes Neilson and Geen 1982; Volk et al. 1984; Jones and Brothers 1986; Bailey andS tehr 1988; Lagardhre 1989; Molony and Choat 1990; Sogard 1991!. The results for
many of these studies indicate that as the nutritional status of individual fish declines,
so does increment width. Reductions in increment width often conlinue until increment
width drops below the resolution limits required for light microscopy Campana andNeilson 1985; Bailey and Stehr 1988!. At this point, it becomes difficult to discern

daily increment structure. Jones �984! added further evidence for the relationship
between increment deposition rates and rearing conditions. In her review of increment
formation rates, she noted that under sub-optimal or abnormal conditions increment
deposition rates can vary to the point that deposition is no longer on a daily cycle.
In contrast to the body of work showing decreased increment deposition under
sub-optimal conditions are the findings of Volk et al.�995!. Although they determined
that slower growing fish exhibited sub-daily increment deposition rates, they also
determined that increment periodicity was greater in fish wi th faster growth rates. They
reported that in many cases fish deposited multiple structures per day that could not be
differentiated either by use of SEM or light microscopy. Volk et al. speculated that
growth rate was not the ultimate mediator of otolith increment production, but that
growth rate is tied to other environmental influences and physiological cycles
experienced by the fish, which may entrain increment deposition rates. The results of
these studies on the relationship between growth and increment deposition rates
stresses the importance of rearing conditions in determining the rate of deposition
increment in teleost fishes.
The results of the second temperature treatment �2 C! while not ideal, provide
strong evidence that increment deposition occurs daily throughout the first 14 days
post-hatch for larval Pacific hake. Rate of increment deposition for the first 14 d after
hatching concur with Bailey's �982! determination that increment deposition is daily at
least through the first two weeks in the early life history of Pacific hake. During the
course of tny work, larval hake were reared to 28 d post-hatch which was well beyond
the expected starvation date of 9.8 d post-hatch SD = 1.2! as calculabxl by Bailey
�982! . In addition, Bailey also determined that the time to complete yolk-sac
absorption for 50% of his larvae was 6A d at 12 C. The longevity of lab-reared larval

Pacific hake during the course of this project provides support that exogenous feeding
was taking place while the larvae were in the rearing chambers. Although feeding is
evidenced, judging from the external appearance of the larvae, it appears that starvation
began a few days after yolk-sac absorption.
Although this study was not designed to examine the affects of temperature on
yolk-sac absorption, review of laboratory notes indicate that many fish still had visible
yolk reserves at 10 d post-hatch at 12 C. After 14 d post-hatch most larval Pacific
lacked significant yolk reserves. Since larvae were beginning to show external signs of
starvation coupled with decreasing rates of otolith increment deposition, I chose to
exclude fish >14 d post-hatch from my analyses. I feel that this decrease in increment
deposition rate may be linked to the nutritional state of the individual fish at this point.
The failure to provide evidence for daily increment deposition in the 8 'C
treatment is problematic and upon further examination there are reasons to disregard the
findings of this work. The primary reason for not incorporating the results of this
experirnenh6 group arise from the overall condition of the fish. Bailey �982! was
unable to rear larval Pacific hake at 8 'C through the period of yolk-sac absorption.
While performing %is work he determined time to 100% starvation for fish reared in
8 C was 13,25 d SD = 2,7!. Although I was able to rear larval Pacific hake out to
26 d post-hatch in the 8 'C treatment, the overall condition of these fish past 16 d post-
hatch was very poor. Externally, the fish became pro ressively more 'pin-headed' in
appearance and began showing signs of starvation i.e. torsion!.
While the role of nutrition can be used to explain what is happening to older
fish who have begun feeding, there remains the question of the non-daily deposition
rate for fish ~ 16 d post-hatch. I feel the lack of non daily increment deposition can be
attributed to a poor rearing environment. Since it was my first experience in culturing

and rearing larval fish, several mistakes were likely made while handling fish in thelaboratory.
Campana and Neilson �985! stressed the importance of optimal rearing
conditions if one expects the results to mimic the natural environment. In this case,
problems with temperature fluctuations and the association of longer duration at
developmental stages due to lower rearing temperatures probably led to the deposition
of narrow increments which were below the resolution limits of hght microscopy.
Acting in conjunction with the thermal problems were the issues of photoperiod and
lighting. Since photoperiod was maintained to match the natural light cycle except forthe rapid beginning and end of the daily cycle, I feel that its effect was likely minimal.
Recent work on other Gadiformes Theragra chalcogramma! has shown that lower light
levels may be required for optimal rearing S. Porter, NMFS, Seattle WA. pers.
comm.!. For these reasons I feel justified in excluding the results of the 8 C rearing
experiment from the analyses in this study. Although lighting was maintained at the
same intensity and cycles during the 12 'C treatment, the coupling of these light levels
with other conditions existing in the 8 'C treatment probably did not allow for adequate
growth and subsequent increment deposition.
Timing-of first increment deposition in this project was determined for fish
reared in both 8 C and 12 C treatments. The results of this work showed that
increment formation occurs at 3.51d post-hatch 95% CI: 1.27 - 5.45 d! for 8 C and at
4.17 d post-hatch 95% CI: 2.24- 5.45 d! for 12 C. Bailey �982! showed that first
increment deposition on the sagittal otoliths of larval Pacific hake occurs at 1-2 daysprior to yolk-sac absorption which corresponds to around 4-5 d post-hatch at 12 'C.
During his work, Bailey was unable to determine the timing of initial increment
deposition at 8 C since fish at 8-12 d post-hatch still had considerable yolk reserves

59
remaining. Although Bailey's results agree with the findings of this study with regard
to the timing of increment deposition at 12 'C, considerable differences appear to exist,
in the 8 'C treatment. One possible reason for the differences noted between the two
studies with regards to the timing of first increment formation at 8 'C may be improved
microscopic techniques used in the present study,
Calculated timing of first increment deposition were close for both temperature
treatments in this study. Karakiri and Hammer �989! found similar results when they
examined the effects of temperature on the initial deposition of otolith increments in
Oreochromis aureus . Their f indings suggested that little difference existed in the
timing of' first increment deposition for fish reared at 17 C and 28 'C. This is in
contrast to many other studies where the authors have linked timing of first increment
formation to exogenous factors such as the onset of first feeding or timing of hatch
Bailey 1982, Nishimura and Yamada 1984; Maillet and Checkley 1990!. Since time to
hatch and development are directly related to temperature, it is perplexing that the
estimates of initial timing of increment production show such close results.
Although once thought of as a 'trash fish' by many fisherman, recent decades
have seen increased economic benefits from the harvest of Pacific hake. With advances
in seafood technology and reduction in stock levels for other groundf ish species
worldwide, Pacific hake have been subjected to increasing harvest pressures. Of
particular interest are those stocks available to individual fishers with smaller boats
since these harvesters are often unable to fish the offshore coastal stocks of Pacific
hake. If stock levels can rebound to historic levels, there exists an opportunity for
several small-sade fisheries to begin operating again within the confines of Puget
Sound.

Future analyses on the physical and biological factors thought to control
recruitment success in Marine fish should focus on these periods during which
fluctuating survival rates have been shown to exist. Much of these data are available
and analyses should be conducted to explore the relationships between proposed
controlling factors and the relative survival of larval and juvenile Pacific hake.
Results of the present study indicate other areas requiring further research. The
annual spawning cycles for stocks of Pacific hake within Dabob Bay should be
examined in detail. The resident population of Pacific hake within Dabob Bay provided
researchers with an excellent opportunity to follow a cohort of fish throughout their
early life history. In this study, we were unable to define the beginning of the
spawning cycle for Pacific hake due to a lack of samples, This information is critical
for the generation of survival rates and subsequent back-calculated spawn-date
distributions.
In conjunction with the above mentioned work on egg-abundance cycles,
research validating the rate of increment deposition in older larval and juvenile Pacific
hake should be undertaken. Facilities exist to conduct this work and coupled with
recent advances in the rearing of larval and juvenile Gadiformes the problem appears to
be relatively straightforward.

1 ITERATURE CITED
Ahlstrom, E. H. and R. C. Counts. 1955. Eggs and larvae of Pacific hake Merluccius
productus. U.S. Fish Wildl. Sev. Fish. Bull. 99:293-329.
Bailey, K. M. 1980. Recent changes in the distribution of hake larvae: causes and
consequences. Cal. Coop. Oceanic Fish. Invest. Rep. 21: 167-171.
Bailey, K. M. 1980. Larval transport and recruitment of Pacific hake Merluccius
productus, Mar. Ecol. Prog. Ser. 6: 1-9
Bailey, K. M. 1982. The early life history of the Pacific hake, Merluccius productus,Fish. Bull. 80: 589-598.
Bailey, K. M., R. C. Francis, and P. R. Stevens, 1982. The life history and fisheryof Pacific whiting, Merluccius productus. Cal. Coop. Oceanic Fish, Invest.
Rep. 23: 81-98.
Bailey, K. M. and J. Yen. l.983. Predation by a carnivorous marine copepod,
Euchaeta elongata Esterly, on eggs and larvae of the Pacific hake, Mer luccius
productus. J. Planktori. Res. 5�!:71-82.
Bailey, K. M. and R. C. Francis. 1985. Recruitment of Pacific whiting, Merlucciusproductus. Mar. Fish. Rev. 47�!: 8-15.
Bailey, K. M. and C. I Stehr. 1988. The effects of feeding periodicity and ration on
the rate of increinent formation in otoliths of larval walleye pollock Theragra
chalcograrnma!. J. Exp. Mar Biol Ecol. 122: 147-161.
Bakun, A,, J. Beyer, D. Pauly, J. G. Pope, and G. D Sharp, 1982. Ocean sciences
in relation to living resources. Can. J. Fish. Aquat. Sci. 39: 1059-1070.

62
Barnes, C. A. and C. C. Ebbesmeyer. 1978, Some aspects of Puget Sound's
circulation and water properties. p. 209-228. In B, J. Kjerfve ed.!. Estuarinetransport processes. University of South Carolina Press, Columbia, South
Carolina.
Beamish, R. J. and G. A. McFarlane. 1985. The forgotten requirement for agevalidation in fisheries biology, Trans, Am. Fish. Soc. 112: 735-743.
Beverton, R. J. H, 1994. Notes on the use of theoretical models in the study of thedynamics of exploited fish populations. Marine Fisheries Section, American
Fisheries Society, Special Publication 1.
Beverton, R. J. H. and S. J. Holt. 1957. On the dynamics of exploited fish
populations. Fish. Invest. Ser. 2, Vol. 19 U. K. Min. of Agric. and Fish.London.
Bond, C. E. 1996. Biology of fishes. Saunders College Publishing. Orlando, FL
Bollens, S. M., B.W. Frost, H.R. Schwaninger, C.S, Davis, K. L. Way. and M. CLandsteiner. 1992. Seasonal plankton cycles in a temperate f]ord, and
comments on the match-mismatch hypothesis. J. Plankton Res. 14: 1279-
1305.
Bollens, S, M., and B.W. Frost. 1989. Zooplanktivorous fish and variable diel
vertical migration in the marine planktonic copepod CaLanus pacificus. Limnol.Qceanogr. 34: 1071-1083.
Brothers, E. B., C. P. Mathews,andR.Lasker. 1976. Dailygrowthincrementsin
otoliths from larval and juvenile fishes. U. S. Fish. Bull. 74:1-8.
Brown, A, L and K. M. Bailey. 1992. Otolith analysis of juvenile walleye pollockTheragra chalcogramma from the western Gulf of Alaska. Mar, Bio. 112: 23-
30
63
Carnpana, S. E. 1992. Measurement and interpretation of the microstructure of fish
otoliths. p. 59-71. In D. K. Stevenson and S. E. Campana. ed.!. Otolith
microstructure examination and analysis. Can. Spec. Publ. Fish. Aquat. Sci.117,
Campana, S. E. 1984. Lunar cycles of otolith growth in the juvenile starry flounder Platichthys srellatus!. Mar. Biol. 80:239-246.
Campana, S. E. and C. M. Jones. 1992 Analysis of otolith microstructure data. p.73-100. In D. K Stevenson and S. E, Campana. ed.!. Otolith microstructure
examination and analysis. Can. Spec. Publ. Fish. Aquat, Sci. 117.
Campana, S. E. and J. D. Neilson. 198S. Microstructure of fish otoliths. Can. J.
Fish. Aquat. Sci. 42: 1014-1032.
Carlstrorn. D. 1963. A crystallographic study of vertebrate otoliths. Biol. Bull. 125:441-463.
Crecco, V. A. and T. F. Savoy. 1985 Effects of biotic and abiotic factors on growthand relative survival of young American shad Alossa sapidissima, in the
Connecticut River. Can. J. Fish. Aquat. Sci. 42: 1640-1648.
Cushing, D. H. 1970. The dependence of recruitment on parent stock in different
groups of fishes. Journ. Cons. Perm. Int. Exp. Mer. 33�!:339-392.
Dassow, J. A., M. Patashnik, and B. J. Koury. 1970. Characteristics of Pacific
hake, Merluccius producrus, that affect its suitability for food. p. 127-136. InPaqiTic hake. U.S. Fish NildL Sev., Circ. 332.
Degens, E. T., W. G. Deuser, and R. L. Haedrich. 1969. Molecular structure and
composition of fish otoliths. Marine Biol. 2: 105-113.

Dorn, M. W., E. P. Nunnallee, C. D. Wilson, and M. E. Wilkins. 1993. S tatus of
the coastal Pacific whiting resource in 1993. NOAA Tech. Memo. F/AFSC-
47.
Fossum, P. and E. Moskness. 1995. Recruitment processes of the 1991 year-class ofspring-spawned Norwegian herring Clupea harengus L.! determined from
otolith microstructure examination. p. 467-480. In D. H. Secor, 3. M. Dean,
and S. E. Campana eds.!. Recent developments in fish otolith research.
University of South Carolina Press, Columbia, South Carolina.
Fritz, E. S., L. B. Crowder, and R. C. Francis. 1990. The National Oceanic and
Atmospheric Administration plan for recruitment fisheries oceanographyresearch. Fisheries. 15. 25-31.
Frost, 8, W. and L. E. McCrone. 1974. Vetical distribution of zooplankton and
myctophid fish at Canadian Weather Stabon Papa, with description of a new
multiple net trawl. Int. Conf. of Eng. in the Ocean Env, Inst. of Electricians
and Electronic Engs. 1: 159-165
Geffen, A. J. 1992. Validation of otolith increment deposition rate. p. 115-126. In D.K. Stevenson and S. E. Campana. ed.!. Otolith microstructure examination
and analysis. Can. Spec. Publ. Fish. Aquat. Sci. 117.
Goni, R. 1988. Comparison of Pacific hake Merluccius products Ayres, 185S!stocks in inshore waters of the Pacific Ocean: Puget Sound and Strait of
Georgia. M. S. thesis, Univ. of Washington, School of Fisheries, 104 p.Grinols, R. B. and M. F. Tillman. 1970. Importance of worldwide hake, Merluccius,
resource. p. 1-21. In Pacific hake, U.S. Fish Wildl. Sev., Circ. 332.
Gulland, J. A. 1965. Manual of methods for fish stock assessment. Part 1. Fish
Population Analyses. FAO Fish. Bull. Tech. Paper 72p.

65
Gunderson, D. R. 1993. Surveys of fisheries resources, 3ohn Wiley and Sons, Inc.
New York, NY. 248p.
Hall, C. A. S. 1988, An assessment of several of the historically most influential
theoretical models used in ecology and of the data provided in their support.
Ecological Modeling. 45. 5-31.
Hjort, J. 1913. Fluctuations in the great fisheries of Northern Europe. Rapp. P.-V.
Reun. Cons, Int Explor. Merr. 19: 1-228.
Hillborn, R. and C. J. Walters. 1992. Quantitative fisheries stock assessment: choice,
dynainics and uncertainty. Chapman and Hall, New York, NY. 570p.
Hipkins, F. W. 1967. Midwater trawl, telemetry gear prove value on Puget Sound
hake. Natl. Fisherman 47�0!: 108-118, 158.
Hollowed, A. B. and K. M. Bailey, 1989. New perspectives on the relationship
between recruitment of Pacific hake Merluccr'us producrus and the ocean
environment. P. 207-220. In R. L Beamish and G. A. McFarlane eds.!.
Effects of ocean variability on recruitment and an evaluation of parameters used
in stock assessment models, Can. Spec. Publ. Fish. Aquat. Sci. 108.
Hollowed, A. B. 1992. Spatial and temporal distributions of Pacific hake, Merluccius
producers, larvae and estimates of survival during early life stages. Cal. Coop.
Oceanic Fish. Invest. Rep. 33:100-123.
Houde, E D. 1987. Fish early life dynamics and recruitment variability. American
Fisheries Society Symposium. 2: 17-29.
lnada, T. 1981 Studies on the merluccid fishes. BuU. Far Seas Fish. Res. Lab.
Shirnizu! 18, 172 p.

Jones, C. M. 1992. Development and application of the otolith increment technique.p. 1-11. In D. K. Stevenson and S. E. Campana. ed,!. Otolith microstructure
examination and analysis. Can. Spec. Publ. Fish. Aquat, Sci. 117.
Jones, C., and E. B. Brothers. 1986. Validation of the otolith increment agingtechnique for striped bass Morone saxatilis!, larvae reared under subopti malfeeding conditions. Fish. Bull. 85: 171-178.
I&bata, Z. and Whitaker, D. J. 1981. Two species of Kudoa Myxosporea:Multivalvulida! parasitic in the flesh of Merlaccius pr oductus Ayres, 1855!Pisces; Teleostei in the Canadian Pacific. Can. J. Zool. 59: 2085-2091.
Karakiri, M. and C. Hammer. 1989. Preliminary notes on the formation of dailyincrements in otoliths of Oreochromis aureus. J. Appl. Ichthyol. 5: 53-60.
Kimura, D. K. 1977. Statistical assessment of the age-length key. J. Fish. Res.Board. Can. 34: 317-324
Koslow, J.A, 1992 Fecundityand thestock-recruitment relationship. Can. J. Fish.AquaL Sci. 49: 210-217.
Laird, A. K., S. A. Tyler, and A. D. Barton. 1965. Dynamics of normal growth.Growth. 29: 233-248.
Lagardkre, F. 1989. Influence of feeding conditions and temperature on the growthrate and otoli th-increment deposition of larval Dover sole Solea solea. L.!!;Rapp. P.-V. Reun. Cons, Int Explor. Merr; 191: 390-399.
Lasker, R. 1981. The role of a stable ocean in larval fish survival and subsequentrecruitment. p. 80-87. In R. Lasker ed.!. hone Fish Larvae: Morphology,Ecology, and Relation to Fisheries. University of Washington Press, SeattleWA.

Lasker, R. 1985. What limits clupeoid production? Can. J. Fish. Aquat. Sci. 42: 31-
38.
Legendre, L. and S, Demers, 1984, Towards dynamic biological oceanography and
limnology. Can. J. FiS. Aquat. Sci. 41: 2-19.
Legget, W. C., K. T. Frank, and J. E. Carscadden. 1984. Meteorological and
hydrographic regulation of year-class strength in cape/in Mallotus villosus!.
Can. J Fish. Aquat. Sci. 41: 1 193-1201.
Lemberg, N., S. Burton, and W. A. Palsson. 1988. Hydroacoustic results for Puget
Sound herring, whiting and Pacific cod surveys, 1986-1987. Wash. State,
Dept. Fish. Frog. Rep. 274. 46 p.
Maillet, G. L., and D.M. Checkley, Jr. 1990. Effects of starvation on the frequency
of formation and width of growth increments in sagi ttae of laboratory-reared
Atlantic menhadden Brevoorria tyr annus larvae. U.S. Fish. Bull. 88: 155-
165.
McFarlane, G. A., and R. J, Beamish. 1985. Biology and fishery of Pacific whiting,
Merluccius ps oductus, in the Strait of Georgia. Mar. Fish. Rev. 47�!: 23-34.
McGary, N. and J. H. Lincoln. 1977. Tide prints: surface tidal currents in Puget
Sound. Wash. Sea Grant Pub. University of Washington, Seattle, WA.
Methot, R. D., Jr. 1983. Seasonal variation in survival of larval Zngrau1is rnordax
estimated from the age distribution of juveniles. U.S, Fish. Bull. 81: 741-
750,
Methot, R. D, Jr, 1986. Frame trawl for sampling pelagic juvenile fish. Cal. Coop.
Oceanic Fish. Invest. Rep. 27: 267-278.
Methot, R. D., Jr. and D. Kramer. 1979. Growth of northern anchovy, Engraulis
mordax, larvae in the sea. U.S. Fish. Bull. 77: 413-423.

68
Methot, R. D., Jr, and M. W. Dorn. 1995. Biology and fisheries of north Pacific
hake M. productus!. p. 389-413. In J. Alheit and T. J. Pitcher eds.!. Hake:Biology, fisheries and markets. Chapman and Hall, London,
Miller, D. J., and R N. Lea 1%2. Guide to the coastal marine fishes of California
Calif. Fish Bull. 157. 249 p.
Miller, B. S., and S. F. Borton. 1980. Geographical distribution of Puget Sound
fishes. maps and data source sheets, volumes I and II. Wash. Sea Grant Pub.
University of Washington, Seattle, WA.
Mokness, E. and P. Fossum. 1992. Daily growth rate and hatching-date distribution
of Norwegian spring-spawning herring CIepea harengus L.!. ICES J. Mar.Sci. 49: 217-221.
Molony, B. W. and J. H. Choat. 1990. Otolith increment widths and somatic growthrate: the presence of a time-lag. J. Fish Biology, 37: 541-551.
Mugiya, Y. 1987. Phase difference between calcification and organic matrix
formation in the diurnal growth of otoliths in the rainbow trout, Salmo
gairdneri. Fish. Bull. 85: 395-40L
Neilson, J. D. - 1992. Sources of error in otolith microstructure examination. p. 115-126, In D. K. Stevenson and S. 'E. Campana. ed.!. Otolith microstructure
examination and analysis. Can. Spec. Publ. Fish. Aquat. Sci. 117..
Neilson, J. D. and G. H. Geen. 1982. Otoliths of chinook salmon Oncorhynchus
tshawytscha!; daily growth increments and factors influencing their production.Can. J. Fish. Aquat. Sci. 39: 1340-1347.
Nelson, J. S. 1994. Fiishes of the world. Third Edition!. John Wiley and Sons,New York, NY.

69
Nelson, R. E., Jr. 1985. Historical review of the coastal Pacific whiting, Merlucciusproducrus, fishery. Mar. Fish. Rev. 47�!: 39-46.
Nelson, M. O. and H. A. Larkins. 1970. Distribution and biology of Pacific whiting:A synopsis. p. 23-33, In Pacific hake. U.S. Fish Wildl, Sev. Circ. 332.
Nishimura, A. and J. Yamada. 1984. Age and growth of larval and juvenile walleyepollock Theragra chalcog ramada Pallas!, as determined by otolith daily growthincrements. J. Exp. Mar. Biol. Ecol 97: 45946S.
Pannella, G. 1971. Fish otoliths; daily growth layers and periodical patterns. Science173: 1124-1127.
Patashnik, M., H. J. Barnett, and R. W. Nelson. 1970. Proximate chemical
composition of Pacific hake. p. 121-125. In Pacific hake. U.S. Fish Wildl.Sev., Circ. 332.
Pedersen, M. 1985. Puget Sound Pacific whiting, Merluccius productus, resourceand industry: an overview. Mar. Fish, Rev. 47�!: 3S-38
Pitcher, T. J. and J. Alheit. 199S. %hat makes a hake? A critical review of the criticalbiological features that sustain global hake fisheries. p, 1-14. In J. Alheit andT. J. Pitcher eds.!. Hake. Biology, fisheries and markets. Chapman andHall, London.
Popper, A. N. and C. Platt. 1993. Inner ear and lateral line. p. 99-136. In D. H.Evans ed.!. The Physiology of Fishes. CRC Press. 'Fl.
Radovich, J. 1981. The collapse of the California sardine fishery. what have welearned? Cal. Coop. Oceanic Fish. Invest Rep. 23:56-78.
Rice, J. A. 1987. Reliability of age and growth rate estimates derived from otolithanalysis. p. 167-176. In R, C, Summerfelt and G. E. Hall, eds.!. Age andgrowth of fish. Iowa State University Press. IW.
Rice, J. A., L. B. Crowder, and M. E. Holey. 1987. Exploring mechanisms
regulating larval survival in Lake Michigan bloater. a recruitment analysis basedon characteristics of individual larvae. Trans. Am. Fish. Soc. 116: 703-718.
Ricker, W. E. 1975. Computation and interpretation of biological statistics of fishpopulations. Fish. Res. Board Can. Bull 191.
Sakagawa, G. T. and M, Kimura. 1976. Growth of laboratory-reared northern
anchovy, Engraufis mordax, from southern Ca1ifornia. Fish. Bull. 74: 271-279.
Schmitt, C. C,, S. J. Jefferies, and P. J. Gearin. 1995. Pinniped predation on marine
fish in Puget Sound. p. 630-637. In E. Robichaud ed.!. Proceedings, PugetSound Research '95, Vol.2, Puget Sound Water Quality Authority. Olympia,WA. 1038 p.
Secor, D. H., J, M. Dean, and E H. Laban. 1992. Otolith removal and preparationfor microstructural examination.. p. 19-54, In D. K. Stevenson and S. E.
Campana. ed.!. Otolith microstructure examination and analysis. Can. Spec.Publ. Fish. Aquat. Sci. 117.
Shima, M and K M Bailey. 1994. Comparitive analysis of ichthyoplankton
sampling gear for early lif'e stages of walleye pollock Therag ra chafc0gramrna!.Fish. Oceanogr. 3. 50-59..
Skud, B. E. 1982. Dominance in fishes: the relation between environment and
abundance, Science. 26: 144-149.
Smith, P. E 1995. Development of the population biology of the Pacific hake,Merluccius productus, Cal. Coop. Oceanic Fish. Invest. Rep. 36: 144-152.

71
Sogard, S. M. 1991. Interpretation of otolith microstructure in juvenile winter
flounder Pseudopleuroeectes arnericanus!: ontogenetic development, daily
increment validation, and somatic growth relationships. Can. J. Fish Aquat.Sci. 48: 1862-1871.
Struhsaker, P., and J. H. Uchiyama. 1976. Age and growth of the nehu, Stolephoruspupureus Pisces: Engraulidae!, from the Hawaiian Islands as indicated bydaily growth increments of sagitta. U.S. Fish. Bull. 74. 9-17.
Taubert, B. D. and D. W. Coble. 1977. Daily rings in otoliths of three species ofI epomis and Tilapis mossarnbica. J. Fish. Res. Board. Can. 34: 332-340,
Theilacker, G. H. and M. F. McMaster. 1971. Mass culture of rotifer Bractuonus
plicatilis and its evaluation as a food for larval anchovies. Mar. Bio't. 10: 183-
188.
Thorne, R. E., J. E. Reeves, and A. E. Millikan. 1971. Estimation of the Pacific hake
Merluccius productus.! population in Port Susan, Washington, using an echointegrator.. J. Fish. Res. Board. Can. 28: 127S-1284.
Tomezak, M. Jr. 1981. Prediction of environmental changes and the struggle of thethird world for national independence: the case of Peruvian fisheries. p. 401-
438. In M. H. Glantz and J. D. Thompson eds.!. Resource Management andUncertainty. John Wiley and Sons, New York, NY.
Troadec, J. P. 1988. Why study fish population recruitment? p. 477-500. In B. J.
Rothschild ed.!. Toward a theory on biological-physical interactions in the
ocean world. Kluwer Academic Publishers, Dordrecht.
Utter, F. M. 1969. Transfemn variants in Pacific hake Merlucciusproductus.!. J.Fish. Res. Board. Can. 26: 3268-3271.

Utter, F. M. 1971. Biochemical polymorphisms in Pacific hake Merluccius
productus.!. Cons. Perm. Int. Explor, 1Vler, Rapp, P.-V. Reun. 161:87-89.
Volk, E. C., R. C,Wissmar, C. A. Simenstad, and D,M. Eggers. 1984. Relationshipbetween otolith microstructure and the growth of juvenile chum salmon
Oncorhynchus keta! under different prey rations. Can. J. Fish. Aquat. Sci.34: 332-340.
.Volk, E. C., D G, Mortensen, and A. C. Wertheimer. 1995. Nondaily otolith
increments and seasonal changes in growth of a pink salmon Oncorhynchusgorbuscha! population in Auke Bay, Alaska. p. 211-225. In D. H. Secor, J.M. Dean, and S. E. Campana eds.!. Recent developments in fish otolith
research. University of South Carolina Press, Columbia, South Carolina.
Vrooman, A. M, and P. A. Paloma. 1977. Dwarf hake off the coast of BajaCalifornia. Cal. Coop. Oceanic Fish. Invest. Rep. 19: 67-72.
Walters, C. J., and D. Ludwig. 1981. Effects of measurement errors on the
assessment of stock-recruitinent relationships. Can. J. Fish. Aquat. Sci. 38:704-710.
Warlen. S. M. 1992. Age, growth, and size distribution of larval Atlantic menhaden
off North Carolina. Trans. Am. Fish. Soc. 83: 588-598.
Woodbury, D., A, B, Hollowed, and J. Pearce. 1995. Interannual variation in
growth rates and back-calculated spawn dates of juvenile Pacific hake
Merluccius productus.!. p, 481%96. In D. H. Secor, J. M. Dean, and S. E.
Campana eds.!. Recent developments in fish otolith research. University ofSouth Carolina Press, Columbia, South Carolina.

Woodbury, D., and S. Ralston. 1992. Interannual variation in growth rates and back-calculated birthdate distributions of pelagic juvenile rockfishes Sebastes spp.!off the Central California coast. Fish. Bull. 89: 523-533.
Wooster, W. S. 1980. Fisheries ecology: some constraints that impeded advances inour understanding. W. S. Wooster chair. National Academy of Sciences.Washington, D.C.
Yoklavich, M. E. and K. M. Bailey. 1990. Hatching period, growth and survival ofyoung walleye pollock Theragra chalcog ramma as determined with otoli thanalysis. Mar. Ecol. Prog. Ser. 64; 13-23..
Zarr, J. H. 1984. Biostatistical Analysis Second Edition!. Prentice Hall,Englewood, New Jersey.
Zweifel, J. R. and R. Lasker. 1976. Prehatch and posthatch growth of fishes - ageneral model. Fish. Bull. 74: 609-621.