Magnetic and Electric Brain Activity Evoked by the Processing of Tone and Vowel Stimuli
8
The Journal of Neuroscience, April 1995, 75(4): 2748-2755 Magnetic and Electric Brain Activity Evoked by the Processing of Tone and Vowel Stimuli C. Eulitz,’ E. Diesch,’ C. Pantev,’ S. Hampson,’ and T. Elbert’ ‘Institute for Experimental Audiology, University of MOnster, Mijnster, Germany and %stitute of Psychology, Technical University of Berlin, Berlin, Germany Sustained magnetic and electric brain waves may reflect linguistic processing when elicited by auditory speech stimuli. In the present study, only in the latency interval subsequent to the NlmlNl has a sensitivity of brain re- sponses to features of speech been demonstrated. We con- clude this from studying the auditory-evoked magnetic field (AEF) and the corresponding evoked potential (AEP) in response to vowels and a tone. Brain activity was re- corded from the left and the right hemisphere of 11 sub- jects. Three aspects of transient activity were examined: (1) the amplitudes and source characteristics of the Nlm component of the AEF; (2) the amplitudes and source char- acteristics of the sustained field (SF), and (3) the corre- sponding amplitude characteristics of the AEP. Sustained potential amplitudes and SF root mean square amplitudes, as well as the dipole strength of the SF source, were found to be larger for vowel-evoked signals than for signals elic- ited by the tone stimulus. The amplitude and dipole strength effects had an interaction with hemisphere, with larger interhemispheric differences for the vowel condition, as well as larger tone-vowel differences of these parame- ters in the speech-dominant left hemisphere. No statisti- cally significant hemisphere-by-stimulus-type interactions were found in Nl/Nlm amplitudes and Nlm source param- eters. [Key words: magnetoencephalography, electroencepha- lography, auditory-evoked magnetic field, auditory-evoked potential, acoustic processing, phonetic processing] The last 10 years of research have resulted in great stridesfor- ward in the methodsused for studying auditory-evoked mag- netic fields (AEF) elicited by tones (Hari, 1990). Slow auditory- evoked fields received the most attention, especially the Nlm wave, which peaksat around 100 msec after stimulus onset, and the P2m wave, which peaks at 150-200 msec. If the auditory stimulus continues for more than 150-200 msec, a stimulus- locked DC shift lasting for the duration of the stimuluscan be recorded. This is commonly referred to as the sustained field (SF). All of these time-locked transient auditory-evoked re- sponses were first described usingthe EEG technique.However, Received Nov. 15, 1993; revised Oct. 5, 1994; accepted Oct. 12, 1994. This research was suooorted bv wants from the Deutsche Forschungsn- meinschaft (Klinische F&cherg&pi Biomagnetismus and Biosignalanarysi). We thank Drs. M. Hoke, S. Makeig, and K. C. Squires for helpful comments. Correspondence should be addressed to Dr. Carsten Eulitz, Institute for Ex- perimental Audiology, University of Miinster, Kardinal-van-Galen Ring 10, D-48149 Mtinster, Germany. Copyright 0 1995 Society for Neuroscience 0270-6474/95/l 52748-08$05.00/O evidence for several principles of functional organization of the auditory cortex has been found in the intact human brain by noninvasive meanswhen using MEG. Tonotopy was demon- strated in the auditory cortex (Elberling et al., 1982b; Romani et al., 1982; Pantev et al., 1988; Yamamoto et al., 1988); inde- pendentcoding of amplitude and frequency modulation wasex- plored by Makela et al. (1987); and amplitopy described by Pan- tev et al. (1989). More recently, features characteristic of the perception of speech-related stimuli have been addressed (Kaukoranta et al., 1987; Kikuchi et al., 1988; Hari et al., 1989; Kuriki and Murase, 1989; Sams et al., 1991). Kaukoranta et al. (1987), for example, have presented the Finnish word lheil and observed an event- related field feature (Nlm’) concurrent to the Nlm component of the AEE This component peaked approximately 100 msec after the vowel onsetin lheil. Kaukoranta and coworkerslocated the Nl m’ source anterior to the equivalent current dipole (ECD) location for the Nlm. On the basis of a control study with non- speech analogs, theseauthors concludedthat the occurrenceof Nlm’ resultedfrom unspecified acousticparameters commonto a vowel and a square wave rather than to phonetic attributesof the stimulus. Kuriki and Murase (1989) also reported the AEF to be sen- sitive to the acoustic structure of speech sounds. These investi- gators compared the source locations of the Nlm and P2m evoked by tones, a vowel (/a/), and a syllable (/ka/). In the left hemisphere, the Nlm and P2m sources activated by the vowel stimuli tended to originate anterior to the sources of the 1000 Hz tone. Furthermore, a significant difference was obtained be- tween the vowel and the syllable sources in the left hemisphere, but not in the right one; the lkal sourcewas located posteriorto the /a/ source. The authors associated this hemisphericasym- metry in the spatialconfiguration of sources with linguistic pro- cessing. According to a critical review by Rugg (1983), EEG findings concerning a hemisphericasymmetry of amplitudesof Nl/P2 waves of event-related potentials evoked by speechand non- speech stimuli are contradictory. In one of the few studies done with vowels, Molfese and Erwin (1981) failed to obtain a hemi- sphericeffect on the Nl. Naatanenand Picton (1987) argued that at least part of the Nl deflection of the event-relatedsignal is not controlled by the temporal and physical aspects of the stimulus.It is not obvious, however,that responsiveness of the evoked signals to the acous- tic structureor higher order linguistic featuresof speech sounds shouldbe restrictedto this latency range. In studies by Molfese (1978) and Molfese et al. (1985), changes in evoked responses
-
Upload
zi-mannheim -
Category
Documents
-
view
0 -
download
0
Transcript of Magnetic and Electric Brain Activity Evoked by the Processing of Tone and Vowel Stimuli

The Journal of Neuroscience, April 1995, 75(4): 2748-2755
Magnetic and Electric Brain Activity Evoked by the Processing of Tone and Vowel Stimuli
C. Eulitz,’ E. Diesch,’ C. Pantev,’ S. Hampson,’ and T. Elbert’
‘Institute for Experimental Audiology, University of MOnster, Mijnster, Germany and %stitute of Psychology, Technical University of Berlin, Berlin, Germany
Sustained magnetic and electric brain waves may reflect linguistic processing when elicited by auditory speech stimuli. In the present study, only in the latency interval subsequent to the NlmlNl has a sensitivity of brain re- sponses to features of speech been demonstrated. We con- clude this from studying the auditory-evoked magnetic field (AEF) and the corresponding evoked potential (AEP) in response to vowels and a tone. Brain activity was re- corded from the left and the right hemisphere of 11 sub- jects. Three aspects of transient activity were examined: (1) the amplitudes and source characteristics of the Nlm component of the AEF; (2) the amplitudes and source char- acteristics of the sustained field (SF), and (3) the corre- sponding amplitude characteristics of the AEP. Sustained potential amplitudes and SF root mean square amplitudes, as well as the dipole strength of the SF source, were found to be larger for vowel-evoked signals than for signals elic- ited by the tone stimulus. The amplitude and dipole strength effects had an interaction with hemisphere, with larger interhemispheric differences for the vowel condition, as well as larger tone-vowel differences of these parame- ters in the speech-dominant left hemisphere. No statisti- cally significant hemisphere-by-stimulus-type interactions were found in Nl/Nlm amplitudes and Nlm source param- eters.
[Key words: magnetoencephalography, electroencepha- lography, auditory-evoked magnetic field, auditory-evoked potential, acoustic processing, phonetic processing]
The last 10 years of research have resulted in great strides for- ward in the methods used for studying auditory-evoked mag- netic fields (AEF) elicited by tones (Hari, 1990). Slow auditory- evoked fields received the most attention, especially the Nlm wave, which peaks at around 100 msec after stimulus onset, and the P2m wave, which peaks at 150-200 msec. If the auditory stimulus continues for more than 150-200 msec, a stimulus- locked DC shift lasting for the duration of the stimulus can be recorded. This is commonly referred to as the sustained field (SF). All of these time-locked transient auditory-evoked re- sponses were first described using the EEG technique. However,
Received Nov. 15, 1993; revised Oct. 5, 1994; accepted Oct. 12, 1994.
This research was suooorted bv wants from the Deutsche Forschungsn- meinschaft (Klinische F&cherg&pi Biomagnetismus and Biosignalanarysi). We thank Drs. M. Hoke, S. Makeig, and K. C. Squires for helpful comments.
Correspondence should be addressed to Dr. Carsten Eulitz, Institute for Ex- perimental Audiology, University of Miinster, Kardinal-van-Galen Ring 10, D-48149 Mtinster, Germany.
Copyright 0 1995 Society for Neuroscience 0270-6474/95/l 52748-08$05.00/O
evidence for several principles of functional organization of the auditory cortex has been found in the intact human brain by noninvasive means when using MEG. Tonotopy was demon- strated in the auditory cortex (Elberling et al., 1982b; Romani et al., 1982; Pantev et al., 1988; Yamamoto et al., 1988); inde- pendent coding of amplitude and frequency modulation was ex- plored by Makela et al. (1987); and amplitopy described by Pan- tev et al. (1989).
More recently, features characteristic of the perception of speech-related stimuli have been addressed (Kaukoranta et al., 1987; Kikuchi et al., 1988; Hari et al., 1989; Kuriki and Murase, 1989; Sams et al., 1991). Kaukoranta et al. (1987), for example, have presented the Finnish word lheil and observed an event- related field feature (Nlm’) concurrent to the Nlm component of the AEE This component peaked approximately 100 msec after the vowel onset in lheil. Kaukoranta and coworkers located the Nl m’ source anterior to the equivalent current dipole (ECD) location for the Nlm. On the basis of a control study with non- speech analogs, these authors concluded that the occurrence of Nlm’ resulted from unspecified acoustic parameters common to a vowel and a square wave rather than to phonetic attributes of the stimulus.
Kuriki and Murase (1989) also reported the AEF to be sen- sitive to the acoustic structure of speech sounds. These investi- gators compared the source locations of the Nlm and P2m evoked by tones, a vowel (/a/), and a syllable (/ka/). In the left hemisphere, the Nlm and P2m sources activated by the vowel stimuli tended to originate anterior to the sources of the 1000 Hz tone. Furthermore, a significant difference was obtained be- tween the vowel and the syllable sources in the left hemisphere, but not in the right one; the lkal source was located posterior to the /a/ source. The authors associated this hemispheric asym- metry in the spatial configuration of sources with linguistic pro- cessing.
According to a critical review by Rugg (1983), EEG findings concerning a hemispheric asymmetry of amplitudes of Nl/P2 waves of event-related potentials evoked by speech and non- speech stimuli are contradictory. In one of the few studies done with vowels, Molfese and Erwin (1981) failed to obtain a hemi- spheric effect on the Nl.
Naatanen and Picton (1987) argued that at least part of the Nl deflection of the event-related signal is not controlled by the temporal and physical aspects of the stimulus. It is not obvious, however, that responsiveness of the evoked signals to the acous- tic structure or higher order linguistic features of speech sounds should be restricted to this latency range. In studies by Molfese (1978) and Molfese et al. (1985), changes in evoked responses
The Journal of Neuroscience, April 1995, 15(4) 2749
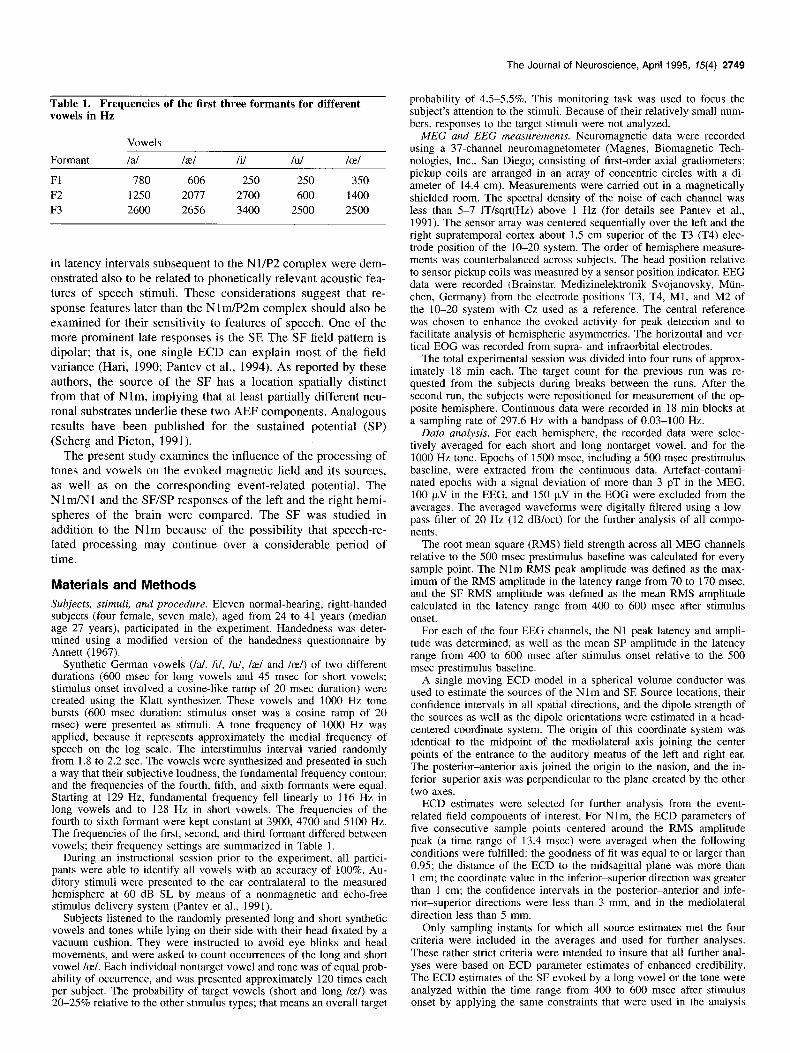
Table 1. Frequencies of the first three formants for different vowels in Hz
Formant
Fl F2 F3
Vowels
I al
780 1250 2600
/ae/ Ii/ Id Ice/
606 250 2.50 3.50 2077 2700 600 1400 2656 3400 2500 2500
in latency intervals subsequent to the Nl/P2 complex were dem- onstrated also to be related to phonetically relevant acoustic fea- tures of speech stimuli. These considerations suggest that re- sponse features later than the Nlm/P2m complex should also be examined for their sensitivity to features of speech. One of the more prominent late responses is the SE The SF field pattern is dipolar; that is, one single ECD can explain most of the field variance (Hari, 1990; Pantev et al., 1994). As reported by these authors, the source of the SF has a location spatially distinct from that of Nlm, implying that at least partially different neu- ronal substrates underlie these two AEF components. Analogous results have been published for the sustained potential (SP) (Scherg and Picton, 1991).
The present study examines the influence of the processing of tones and vowels on the evoked magnetic field and its sources, as well as on the corresponding event-related potential. The Nlm/Nl and the SF/SP responses of the left and the right hemi- spheres of the brain were compared. The SF was studied in addition to the Nlm because of the possibility that speech-re- lated processing may continue over a considerable period of time.
Materials and Methods
Subjects, stimuli, and procedure. Eleven normal-hearing, right-handed subjects (four female, seven male), aged from 24 to 41 years (median age 27 years), participated in the experiment. Handedness was deter- mined using a modified version of the handedness questionnaire by Annett (1967).
Synthetic German vowels (/al, Ii/, lul, lael and Ice/) of two different durations (600 msec for long vowels and 45 msec for short vowels; stimulus onset involved a cosine-like ramp of 20 msec duration) were created using the Klatt synthesizer. These vowels and 1000 Hz tone bursts (600 msec duration; stimulus onset was a cosine ramp of 20 msec) were presented as stimuli. A tone frequency of 1000 Hz was applied, because it represents approximately the medial frequency of speech on the log scale. The interstimulus interval varied randomly from 1.8 to 2.2 sec. The vowels were synthesized and presented in such a way that their subjective loudness, the fundamental frequency contour, and the frequencies of the fourth, fifth, and sixth formants were equal. Starting at 129 Hz, fundamental frequency fell linearly to 116 Hz in long vowels and to 128 Hz in short vowels. The frequencies of the fourth to sixth formant were kept constant at 3900, 4700 and 5100 Hz. The frequencies of the first, second, and third formant differed between vowels; their frequency settings are summarized in Table 1.
During an instructional session prior to the experiment, all partici- pants were able to identify all vowels with an accuracy of 100%. Au- ditory stimuli were presented to the ear contralateral to the measured hemisphere at 60 dB SL by means of a nonmagnetic and echo-free stimulus delivery system (Pantev et al., 1991).
Subjects listened to the randomly presented long and short synthetic vowels and tones while lying on their side with their head fixated by a vacuum cushion. They were instructed to avoid eye blinks and head movements, and were asked to count occurrences of the long and short vowel Ice/. Each individual nontarget vowel and tone was of equal prob- ability of occurrence, and was presented approximately 120 times each per subject. The probability of target vowels (short and long Ice/) was 20-25% relative to the other stimulus types; that means an overall target
probability of 4.5-5.5%. This monitoring task was used to focus the subject’s attention to the stimuli. Because of their relatively small num- bers, responses to the target stimuli were not analyzed.
MEG and EEG measurements. Neuromagnetic data were recorded using a 37.channel neuromagnetometer (Magnes, Biomagnetic Tech- nologies, Inc., San Diego; consisting of first-order axial gradiometers; pickup coils are arranged in an array of concentric circles with a di- ameter of 14.4 cm). Measurements were carried out in a magnetically shielded room. The spectral density of the noise of each channel was less than 5-7 fflsqrt(Hz) above 1 Hz (for details see Pantev et al., 1991). The sensor array was centered sequentially over the left and the right supratemporal cortex about 1.5 cm superior of the T3 (T4) elec- trode position of the lo-20 system. The order of hemisphere measure- ments was counterbalanced across subjects. The head position relative to sensor pickup coils was measured by a sensor position indicator. EEG data were recorded (Brainstar, Medizinelektronik Svojanovsky, Mtin- then, Germany) from the electrode positions T3, T4, Ml, and M2 of the lo-20 system with Cz used as a reference. The central reference was chosen to enhance the evoked activity for peak detection and to facilitate analysis of hemispheric asymmetries. The horizontal and ver- tical EOG was recorded from supra- and infraorbital electrodes.
The total experimental session was divided into four runs of approx- imately 18 min each. The target count for the previous run was re- quested from the subjects during breaks between the runs. After the second run, the subjects were repositioned for measurement of the op- posite hemisphere. Continuous data were recorded in 18 min blocks at a sampling rate of 297.6 Hz with a bandpass of 0.03-100 Hz.
Data nnalysis. For each hemisphere, the recorded data were selec- tively averaged for each short and long nontarget vowel, and for the 1000 Hz tone. Epochs of 1500 msec, including a 500 msec prestimulus baseline, were extracted from the continuous data. Artefact-contami- nated epochs with a signal deviation of more than 3 pT in the MEG, 100 pV in the EEG, and 150 p,V in the EOG were excluded from the averages. The averaged waveforms were digitally filtered using a low- pass filter of 20 Hz (12 dB/oct) for the further analysis of all compo- nents.
The root mean square (RMS) field strength across all MEG channels relative to the 500 msec prestimulus baseline was calculated for every sample point. The Nlm RMS peak amplitude was defined as the max- imum of the RMS amplitude in the latency range from 70 to 170 msec, and the SF RMS amplitude was defined as the mean RMS amplitude calculated in the latency range from 400 to 600 msec after stimulus onset.
For each of the four EEG channels, the Nl peak latency and ampli- tude was determined, as well as the mean SP amplitude in the latency range from 400 to 600 msec after stimulus onset relative to the 500 msec prestimulus baseline.
A single moving ECD model in a spherical volume conductor was used to estimate the sources of the Nlm and SE Source locations, their confidence intervals in all spatial directions, and the dipole strength of the sources as well as the dipole orientations were estimated in a head- centered coordinate system. The origin of this coordinate system was identical to the midpoint of the mediolateral axis joining the center points of the entrance to the auditory meatus of the left and right ear. The posterior-anterior axis joined the origin to the nasion, and the in- ferior-superior axis was perpendicular to the plane created by the other two axes.
ECD estimates were selected for further analysis from the event- related field components of interest. For Nlm, the ECD parameters of five consecutive sample points centered around the RMS amplitude peak (a time range of 13.4 msec) were averaged when the following conditions were fulfilled: the goodness of fit was equal to or larger than 0.95; the distance of the ECD to the midsagittal plane was more than 1 cm; the coordinate value in the inferior-superior direction was greater than 1 cm; the confidence intervals in the posterior-anterior and infe- rior-superior directions were less than 3 mm, and in the mediolateral direction less than 5 mm.
Only sampling instants for which all source estimates met the four criteria were included in the averages and used for further analyses. These rather strict criteria were intended to insure that all further anal- yses were based on ECD parameter estimates of enhanced credibility. The ECD estimates of the SF evoked by a long vowel or the tone were analyzed within the time range from 400 to 600 msec after stimulus onset by applying the same constraints that were used in the analysis
2750 Eulitz et al. * Tone- and Vowel-Evoked Brain Activity
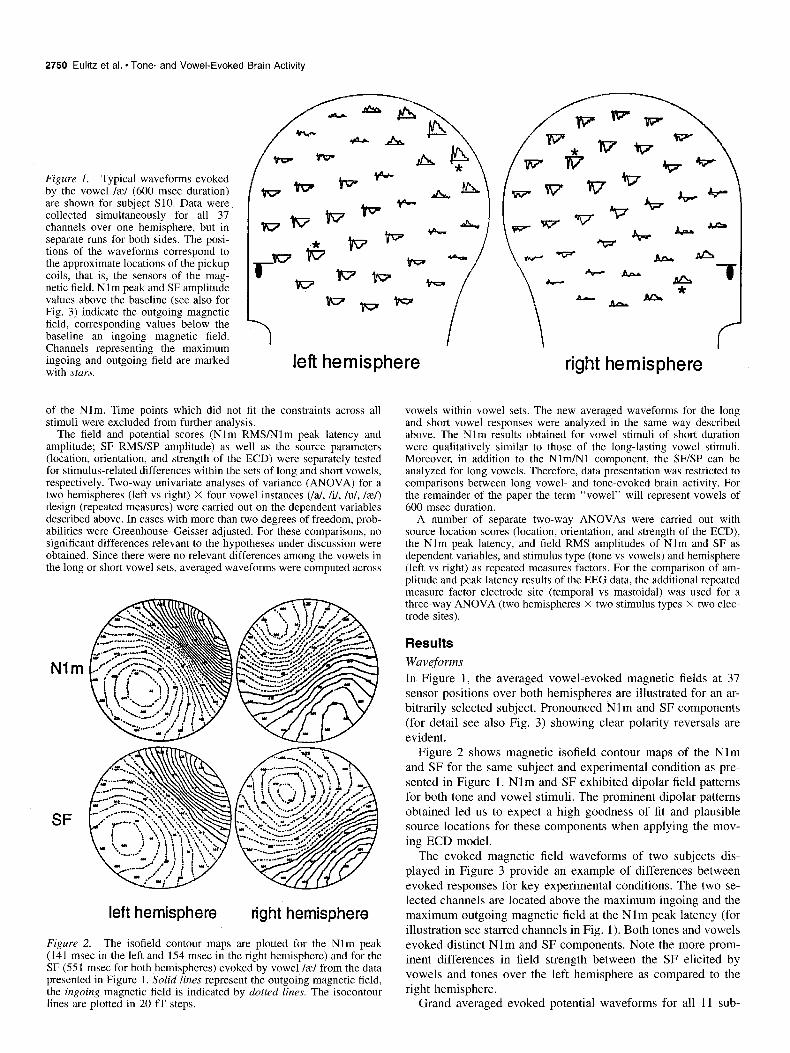
Figure 1. Typical waveforms evoked by the vowel /z/ (600 msec duration) are shown for subject SlO. Data were collected simultaneously for all 37 channels over one hemisphere, but in separate runs for both sides. The posi- tions of the waveforms correspond to the approximate locations of the pickup coils, that is, the sensors of the mag- netic field. Nlm peak and SF amplitude values above the baseline (see also for Fig. 3) indicate the outgoing magnetic field, corresponding values below the baseline an ingoing magnetic field. Channels representing the maximum ingoing and outgoing field are marked with stars.
-e* ! 1
left hemisphere
of the Nlm. Time points which did not fit the constraints across all stimuli were excluded from further analysis,
The field and potential scores (Nlm RMS/Nlm peak latency and amplitude; SF RMYSP amplitude) as well as the source parameters (location, orientation, and strength of the ECD) were separately tested for stimulus-related differences within the sets of long and short vowels, respectively. Two-way univariate analyses of variance (ANOVA) for a two hemispheres (left vs right) X four vowel instances (/a/, /i/, At/, /se/) design (repeated measures) were carried out on the dependent variables described above. In cases with more than two degrees of freedom, prob- abilities were Greenhouse-Geisser adjusted. For these comparisons, no significant differences relevant to the hypotheses under discussion were obtained. Since there were no relevant differences among the vowels in the long or short vowel sets, averaged waveforms were computed across
left hemisphere tight hemisphere
Figure 2. The isofield contour maps are plotted for the Nlm peak (141 msec in the left and 154 msec in the right hemisphere) and for the SF (55 1 msec for both hemispheres) evoked by vowel /z/ from the data presented in Figure 1. Solid lines represent the outgoing magnetic field, the ingoing magnetic field is indicated by dotted lines. The isocontour lines are plotted in 20 f f steps.
\ r right hemisphere
vowels within vowel sets. The new averaged waveforms for the long and short vowel responses were analyzed in the same way described above. The Nlm results obtained for vowel stimuli of short duration were qualitatively similar to those of the long-lasting vowel stimuli. Moreover, in addition to the Nlm/Nl component, the SFKP can be analyzed for long vowels. Therefore, data presentation was restricted to comparisons between long vowel- and tone-evoked brain activity. For the remainder of the paper the term “vowel” will represent vowels of 600 msec duration.
A number of separate two-way ANOVAs were carried out with source location scores (location, orientation, and strength of the ECD), the Nlm peak latency, and field RMS amplitudes of Nlm and SF as dependent variables, and stimulus type (tone vs vowels) and hemisphere (left vs right) as repeated measures factors. For the comparison of am- plitude and peak latency results of the EEG data, the additional repeated measure factor electrode site (temporal vs mastoidal) w-as used for a three-way ANOVA (two hemispheres X two stimulus types X two elec- trode sites).
Results
Waveforms
In Figure 1, the averaged vowel-evoked magnetic fields at 37 sensor positions over both hemispheres are illustrated for an ar- bitrarily selected subject. Pronounced Nlm and SF components (for detail see also Fig. 3) showing clear polarity reversals are evident.
Figure 2 shows magnetic isofield contour maps of the Nlm and SF for the same subject and experimental condition as pre- sented in Figure 1. Nlm and SF exhibited dipolar field patterns for both tone and vowel stimuli. The prominent dipolar patterns obtained led us to expect a high goodness of fit and plausible source locations for these components when applying the mov- ing ECD model.
The evoked magnetic field waveforms of two subjects dis- played in Figure 3 provide an example of differences between evoked responses for key experimental conditions. The two se- lected channels are located above the maximum ingoing and the maximum outgoing magnetic field at the Nlm peak latency (for illustration see starred channels in Fig. 1). Both tones and vowels evoked distinct Nlm and SF components. Note the more prom- inent differences in field strength between the SF elicited by vowels and tones over the left hemisphere as compared to the right hemisphere.
Grand averaged evoked potential waveforms for all 11 sub-
The Journal of Neuroscience, April 1995, 15(4) 2751
?. left hemisphere tight hemisphere
.... tone
-- 600 ms 6OOms
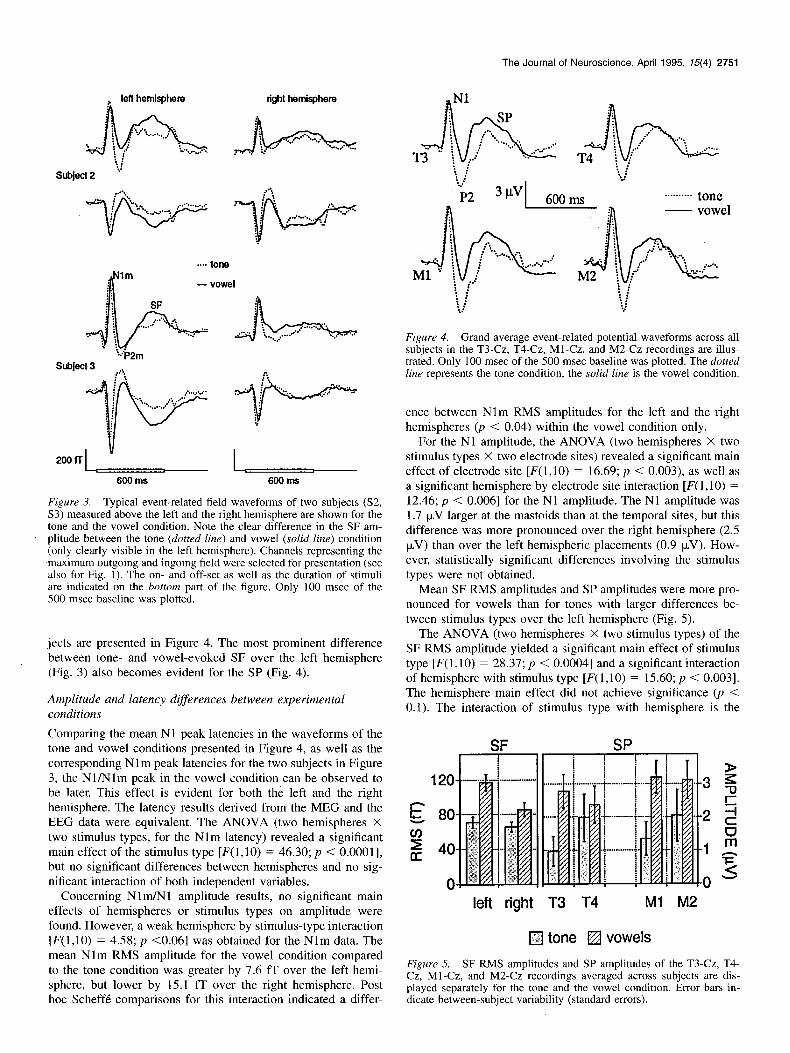
Figure 3. Typical event-related field waveforms of two subjects (S2, S3) measured above the left and the right hemisphere are shown for the tone and the vowel condition. Note the clear difference in the SF am- plitude between the tone (dotted line) and vowel (solid line) condition (only clearly visible in the left hemisphere). Channels representing the -maximum outgoing and ingoing field were selected for presentation (see also for Fig. 1). The on- and off-set as well as the duration of stimuli are indicated on the bottom part of the figure. Only 100 msec of the 500 msec baseline was plotted.
jects are presented in Figure 4. The most prominent difference between tone- and vowel-evoked SF over the left hemisphere (Fig. 3) also becomes evident for the SP (Fig. 4).
Amplitude and latency differences between experimental conditions
Comparing the mean Nl peak latencies in the waveforms of the tone and vowel conditions presented in Figure 4, as well as the corresponding Nlm peak latencies for the two subjects in Figure 3, the Nl/Nlm peak in the vowel condition can be observed to be later. This effect is evident for both the left and the right hemisphere. The latency results derived from the MEG and the EEG data were equivalent. The ANOVA (two hemispheres X two stimulus types, for the Nlm latency) revealed a significant main effect of the stimulus type [F(l,lO) = 46.30; p < O.OOOl], but no significant differences between hemispheres and no sig- nificant interaction of both independent variables.
Concerning Nlm/Nl amplitude results, no significant main effects of hemispheres or stimulus types on amplitude were found. However, a weak hemisphere by stimulus-type interaction [F(l,lO) = 4.58; p CO.061 was obtained for the Nlm data. The mean Nlm RMS amplitude for the vowel condition compared to the tone condition was greater by 7.6 ff over the left hemi- sphere, but lower by 15.1 ff over the right hemisphere. Post hoc Scheffe comparisons for this interaction indicated a differ-
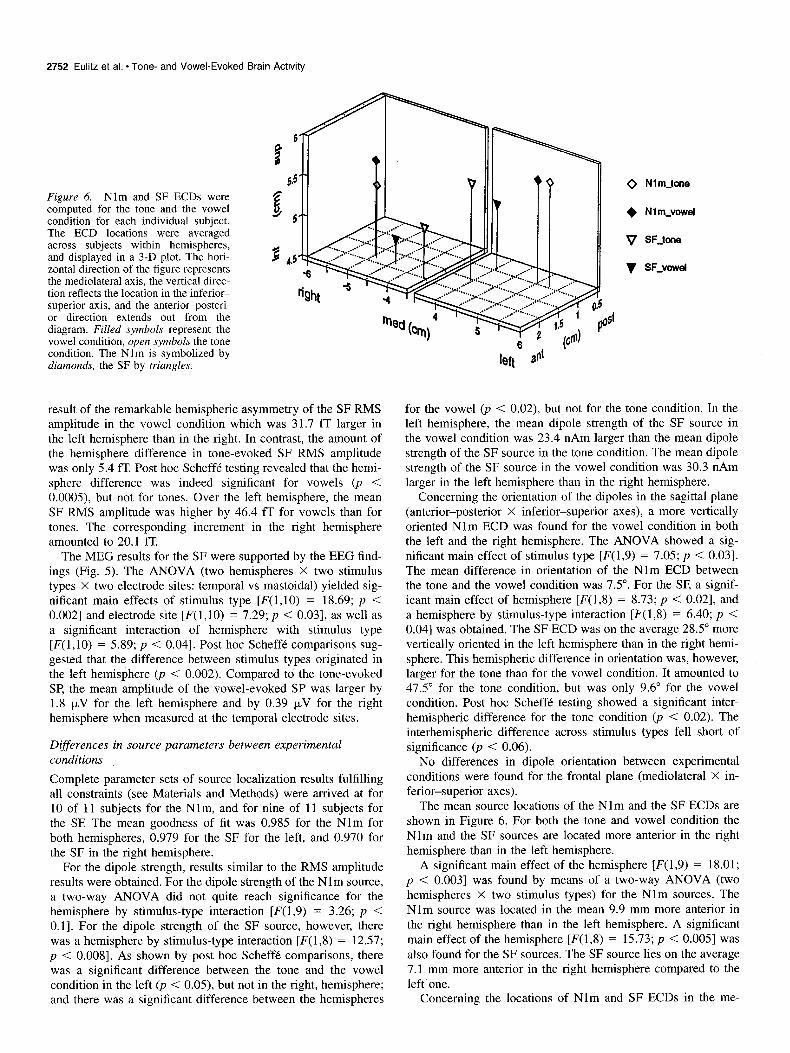
Figure 4. Grand average event-related potential waveforms across all subjects in the T3-Cz, T4-Cz, Ml-Cz, and M2-Cz recordings are illus- trated. Only 100 msec of the 500 msec baseline was plotted. The dotted line represents the tone condition, the solid line is the vowel condition.
ence between Nlm RMS amplitudes for the left and the right hemispheres 0, < 0.04) within the vowel condition only.
For the Nl amplitude, the ANOVA (two hemispheres X two stimulus types X two electrode sites) revealed a significant main effect of electrode site [F(l,lO) = 16.69; p < 0.003), as well as a significant hemisphere by electrode site interaction [F( 1,lO) = 12.46; p < 0.0061 for the Nl amplitude. The Nl amplitude was 1.7 pV larger at the mastoids than at the temporal sites, but this difference was more pronounced over the right hemisphere (2.5 pV) than over the left hemispheric placements (0.9 pV). How- ever, statistically significant differences involving the stimulus types were not obtained.
Mean SF RMS amplitudes and SP amplitudes were more pro- nounced for vowels than for tones with larger differences be- tween stimulus types over the left hemisphere (Fig. 5).
The ANOVA (two hemispheres X two stimulus types) of the SF RMS amplitude yielded a significant main effect of stimulus type [F( 1,lO) = 28.37; p < 0.0004] and a significant interaction of hemisphere with stimulus type [F(l,lO) = 15.60; p < 0.0031. The hemisphere main effect did not achieve significance 0, < 0.1). The interaction of stimulus type with hemisphere is the
SF SP
left right T3 T4 Ml M2
Q tone •j vowels
Figure 5. SF RMS amplitudes and SP amplitudes of the T3-Cz, T4- Cz, Ml-Cz, and M2-Cz recordings averaged across subjects are dis- played separately for the tone and the vowel condition. Error bars in- dicate between-subject variability (standard errors).
2752 Eulitz et al. * Tone- and Vowel-Evoked Brain Activity
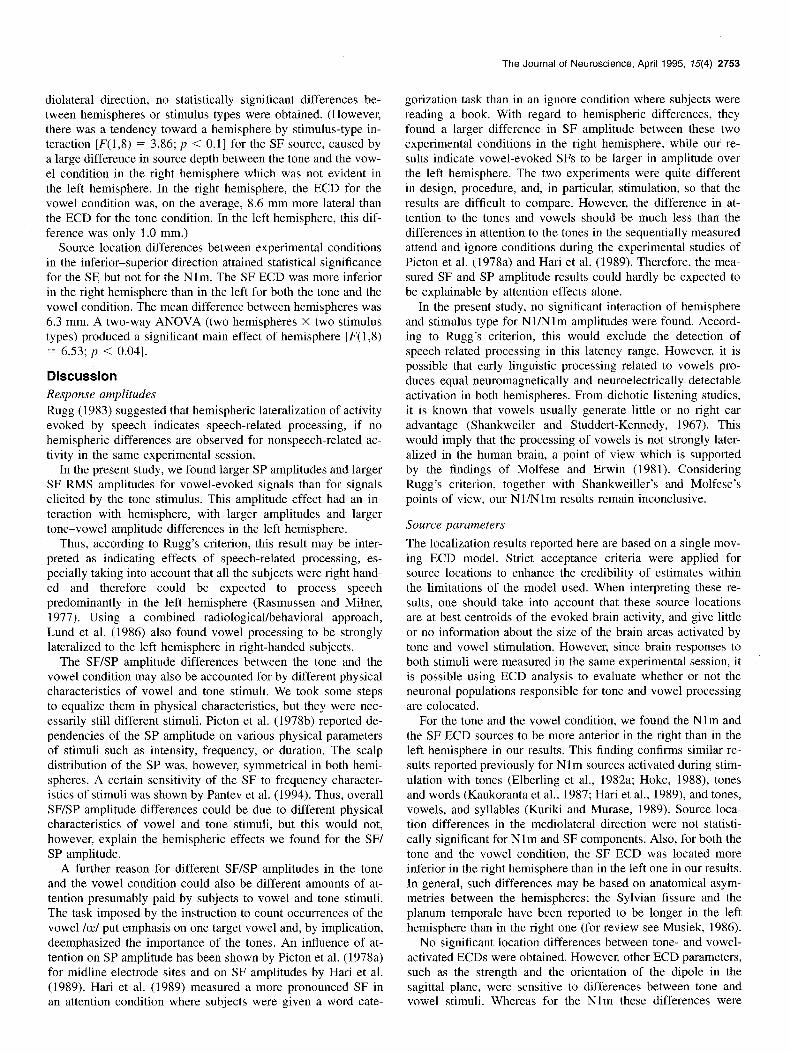
Figure 6. Nlm and SF ECDs were computed for the tone and the vowel condition for each individual subject. The ECD locations were averaged across subjects within hemispheres, and displayed in a 3-D plot. The hori- zontal direction of the figure represents the mediolateral axis, the vertical direc- tion reflects the location in the inferior- superior axis, and the anterior-posteri- or direction extends out from the diagram. Filled svmbols reoresent the
0 Nlm-tone
+ Nlm-vowel
V SF&tm
v SF_vowel
vowel condition, open symbols the tone condition. The Nlm is symbolized by diamonds, the SF by triangles.
result of the remarkable hemispheric asymmetry of the SF RMS amplitude in the vowel condition which was 31.7 ff larger in the left hemisphere than in the right. In contrast, the amount of the hemisphere difference in tone-evoked SF RMS amplitude was only 5.4 fI. Post hoc Scheffe testing revealed that the hemi- sphere difference was indeed significant for vowels (p < O.OOOS), but not for tones. Over the left hemisphere, the mean SF RMS amplitude was higher by 46.4 ff for vowels than for tones. The corresponding increment in the right hemisphere amounted to 20.1 ff.
The MEG results for the SF were supported by the EEG find- ings (Fig. 5). The ANOVA (two hemispheres X two stimulus types X two electrode sites: temporal vs mastoidal) yielded sig- nificant main effects of stimulus type [F( 1,lO) = 18.69; p < 0.0021 and electrode site [F(l,lO) = 7.29; p < 0.031, as well as a significant interaction of hemisphere with stimulus type [F( 1,lO) = 5.89; p < 0.041. Post hoc Scheffe comparisons sug- gested that the difference between stimulus types originated in the left hemisphere @ < 0.002). Compared to the tone-evoked SP the mean amplitude of the vowel-evoked SP was larger by 1.8 pV for the left hemisphere and by 0.39 pV for the right hemisphere when measured at the temporal electrode sites.
Differences in source parameters between experimental conditions
Complete parameter sets of source localization results fulfilling all constraints (see Materials and Methods) were arrived at for 10 of 11 subjects for the Nlm, and for nine of 11 subjects for the SF The mean goodness of fit was 0.985 for the Nlm for both hemispheres, 0.979 for the SF for the left, and 0.970 for the SF in the right hemisphere.
For the dipole strength, results similar to the RMS amplitude results were obtained. For the dipole strength of the Nlm source, a two-way ANOVA did not quite reach significance for the hemisphere by stimulus-type interaction [F(1,9) = 3.26; p < 0.11. For the dipole strength of the SF source, however, there was a hemisphere by stimulus-type interaction [F(1,8) = 12.57; p < O.OOS]. As shown by post hoc Scheffe comparisons, there was a significant difference between the tone and the vowel condition in the left (p < O.OS), but not in the right, hemisphere; and there was a significant difference between the hemispheres
for the vowel (p < 0.02), but not for the tone condition. In the left hemisphere, the mean dipole strength of the SF source in the vowel condition was 23.4 nAm larger than the mean dipole strength of the SF source in the tone condition. The mean dipole strength of the SF source in the vowel condition was 30.3 nAm larger in the left hemisphere than in the right hemisphere.
Concerning the orientation of the dipoles in the sagittal plane (anterior-posterior X inferior-superior axes), a more vertically oriented Nlm ECD was found for the vowel condition in both the left and the right hemisphere. The ANOVA showed a sig- nificant main effect of stimulus type [F(1,9) = 7.05; p < 0.031. The mean difference in orientation of the Nlm ECD between the tone and the vowel condition was 7.5”. For the SF a signif- icant main effect of hemisphere [F(1,8) = 8.73; p < 0.021, and a hemisphere by stimulus-type interaction [F(1,8) = 6.40; p < 0.041 was obtained. The SF ECD was on the average 28.5” more vertically oriented in the left hemisphere than in the right hemi- sphere. This hemispheric difference in orientation was, however, larger for the tone than for the vowel condition. It amounted to 47.5” for the tone condition, but was only 9.6” for the vowel condition. Post hoc Scheffe testing showed a significant inter- hemispheric difference for the tone condition (p < 0.02). The interhemispheric difference across stimulus types fell short of significance 0, < 0.06).
No differences in dipole orientation between experimental conditions were found for the frontal plane (mediolateral X in- ferior-superior axes).
The mean source locations of the Nlm and the SF ECDs are shown in Figure 6. For both the tone and vowel condition the Nlm and the SF sources are located more anterior in the right hemisphere than in the left hemisphere.
A significant main effect of the hemisphere [F(1,9) = 18.01; p < 0.003] was found by means of a two-way ANOVA (two hemispheres X two stimulus types) for the Nlm sources. The Nlm source was located in the mean 9.9 mm more anterior in the right hemisphere than in the left hemisphere. A significant main effect of the hemisphere [F(1,8) = 15.73; p < O.OOS] was also found for the SF sources. The SF source lies on the average 7.1 mm more anterior in the right hemisphere compared to the left one.
Concerning the locations of Nlm and SF ECDs in the me-
The Journal of Neuroscience, April 1995, f5(4) 2753
diolateral direction, no statistically significant differences be- tween hemispheres or stimulus types were obtained. (However, there was a tendency toward a hemisphere by stimulus-type in- teraction [F(l,S) = 3.86; p < 0.11 for the SF source, caused by a large difference in source depth between the tone and the vow- el condition in the right hemisphere which was not evident in the left hemisphere. In the right hemisphere, the ECD for the vowel condition was, on the average, 8.6 mm more lateral than the ECD for the tone condition. In the left hemisphere, this dif- ference was only 1.0 mm.)
Source location differences between experimental conditions in the inferior-superior direction attained statistical significance for the SF but not for the Nlm. The SF ECD was more inferior in the right hemisphere than in the left for both the tone and the vowel condition. The mean difference between hemispheres was 6.3 mm. A two-way ANOVA (two hemispheres X two stimulus types) produced a significant main effect of hemisphere [F( 1,8) = 6.53; p < 0.041.
Discussion Response amplitudes Rugg (1983) suggested that hemispheric lateralization of activity evoked by speech indicates speech-related processing, if no hemispheric differences are observed for nonspeech-related ac- tivity in the same experimental session.
In the present study, we found larger SP amplitudes and larger SF RMS amplitudes for vowel-evoked signals than for signals elicited by the tone stimulus. This amplitude effect had an in- teraction with hemisphere, with larger amplitudes and larger tone-vowel amplitude differences in the left hemisphere.
Thus, according to Rugg’s criterion, this result may be inter- preted as indicating effects of speech-related processing, es- pecially taking into account that all the subjects were right hand- ed and therefore could be expected to process speech predominantly in the left hemisphere (Rasmussen and Milner, 1977). Using a combined radiological/behavioral approach, Lund et al. (1986) also found vowel processing to be strongly lateralized to the left hemisphere in right-handed subjects.
The SF/SP amplitude differences between the tone and the vowel condition may also be accounted for by different physical characteristics of vowel and tone stimuli. We took some steps to equalize them in physical characteristics, but they were nec- essarily still different stimuli. Picton et al. (1978b) reported de- pendencies of the SP amplitude on various physical parameters of stimuli such as intensity, frequency, or duration. The scalp distribution of the SP was, however, symmetrical in both hemi- spheres. A certain sensitivity of the SF to frequency character- istics of stimuli was shown by Pantev et al. (1994). Thus, overall SF&P amplitude differences could be due to different physical characteristics of vowel and tone stimuli, but this would not, however, explain the hemispheric effects we found for the SF/ SP amplitude.
A further reason for different SF/SP amplitudes in the tone and the vowel condition could also be different amounts of at- tention presumably paid by subjects to vowel and tone stimuli. The task imposed by the instruction to count occurrences of the vowel /ce/ put emphasis on one target vowel and, by implication, deemphasized the importance of the tones. An influence of at- tention on SP amplitude has been shown by Picton et al. (1978a) for midline electrode sites and on SF amplitudes by Hat-i et al. (1989). Hari et al. (1989) measured a more pronounced SF in an attention condition where subjects were given a word cate-
gorization task than in an ignore condition where subjects were reading a book. With regard to hemispheric differences, they found a larger difference in SF amplitude between these two experimental conditions in the right hemisphere, while our re- sults indicate vowel-evoked SFs to be larger in amplitude over the left hemisphere. The two experiments were quite different in design, procedure, and, in particular, stimulation, so that the results are difficult to compare. However, the difference in at- tention to the tones and vowels should be much less than the differences in attention to the tones in the sequentially measured attend and ignore conditions during the experimental studies of Picton et al. (1978a) and Hari et al. (1989). Therefore, the mea- sured SF and SP amplitude results could hardly be expected to be explainable by attention effects alone.
In the present study, no significant interaction of hemisphere and stimulus type for Nl/Nlm amplitudes were found. Accord- ing to Rugg’s criterion, this would exclude the detection of speech-related processing in this latency range. However, it is possible that early linguistic processing related to vowels pro- duces equal neuromagnetically and neuroelectrically detectable activation in both hemispheres. From dichotic listening studies, it is known that vowels usually generate little or no right ear advantage (Shankweiler and Studdert-Kennedy, 1967). This would imply that the processing of vowels is not strongly later- alized in the human brain, a point of view which is supported by the findings of Molfese and Erwin (1981). Considering Rugg’s criterion, together with Shankweiller’s and Molfese’s points of view, our Nl/Nlm results remain inconclusive.
Source parameters
The localization results reported here are based on a single mov- ing ECD model. Strict acceptance criteria were applied for source locations to enhance the credibility of estimates within the limitations of the model used. When interpreting these re- sults, one should take into account that these source locations are at best centroids of the evoked brain activity, and give little or no information about the size of the brain areas activated by tone and vowel stimulation. However, since brain responses to both stimuli were measured in the same experimental session, it is possible using ECD analysis to evaluate whether or not the neuronal populations responsible for tone and vowel processing are colocated.
For the tone and the vowel condition, we found the Nlm and the SF ECD sources to be more anterior in the right than in the left hemisphere in our results. This finding confirms similar re- sults reported previously for Nlm sources activated during stim- ulation with tones (Elberling et al., 1982a; Hoke, 1988), tones and words (Kaukoranta et al., 1987; Hari et al., 1989), and tones, vowels, and syllables (Kuriki and Murase, 1989). Source loca- tion differences in the mediolateral direction were not statisti- cally significant for Nlm and SF components. Also, for both the tone and the vowel condition, the SF ECD was located more inferior in the right hemisphere than in the left one in our results. In general, such differences may be based on anatomical asym- metries between the hemispheres; the Sylvian fissure and the planum temporale have been reported to be longer in the left hemisphere than in the right one (for review see Musiek, 1986).
No significant location differences between tone- and vowel- activated ECDs were obtained. However, other ECD parameters, such as the strength and the orientation of the dipole in the sagittal plane, were sensitive to differences between tone and vowel stimuli. Whereas for the Nlm these differences were

2754 Eulitz et al. . Tone- and Vowel-Evoked Brain Activity
equally expressed for both hemispheres, for the SF, a significant interaction of hemisphere and stimulus type was evident for the dipole strength as well as for the dipole orientation in the sagittal plane. It must be noted that the orientation of the ECD is sen- sitive to both the brain anatomy, which differs between hemi- spheres, and the spatial configuration of the activated neuronal population. This means that conclusions arrived at concerning different neuronal populations for tone and vowel processing in the left and the right hemispheres must be based on individual anatomical data, such as magnetic resonance images, which were not available in the present study.
The dipole strength of the SF ECD was largest in the left hemisphere during the vowel condition, and differed signifi- cantly from that of the tone condition in the same hemisphere, as well as from that of the right hemisphere in the vowel con- dition. Both methods of data reduction, the amplitude and the source analysis, delivered qualitatively similar results for the SF data. We did not receive additional information about a spatial separation of sources related to vowel processing from those related to tone processing from the source analysis. However, we were, within the above mentioned limitations (the lack of individual anatomical data), able to derive information concern- ing the extent of the neuronal populations responsible for tone and vowel processing in the left and the right hemisphere. The extent of such neuronal populations was largest during vowel processing in the speech-dominant hemisphere in the SF latency range. Obviously, in addition to brain activities related to acous- tic processing, the neuronal activity connected with linguistic processing was superimposed. As pointed out by Glass and Wollberg (1983) based on measurements in the auditory cortex of primates, the stimulus-response relationship suggest no sim- ple one-to-one mapping between a neuron’s response selectivity and a specific vocalization. Recently, Suga et al. (1990) found specialized subsystems for processing biologically important complex sounds in the auditory system of the bat. Keeping in mind that the auditory systems of both humans and animals share basic principles of functional organization, such as tono- topy or amplitopy, it seems possible that such specialized sub- systems for processing speech sounds may exist in the human brain as well. Therefore, our RMS amplitude and dipole strength results in the SF latency range, indicating a lateralization of brain activity to the speech-dominant hemisphere during vowel processing, could be explained by an additional activity of such specialized subsystems for processing speech sounds.
As for the Nl/Nlm amplitude results, no significant interac- tion of hemisphere and stimulus type for the Nlm ECD param- eters was obtained. The more vertical orientation of the Nlm ECD as well as the longer Nl/Nlm peak latencies in the vowel condition compared to the tone condition in both hemispheres may be caused by varying acoustic parameters of tones and vowels. Stimulus parameters, such as intensity, rise time, dura- tion, or frequency, are known independent variables on the Nl expression, without showing any remarkable interhemispheric differences (for review see Lindsey, 1971). We tried to keep these parameters as similar as possible in the stimuli used, but this was possible only with certain limitations. Therefore, the differences of dipole orientation in the sagittal plane and the differences of Nl/Nlm peak latencies between the tone and the vowel condition could be a result of differing acoustic parame- ters. However, as mentioned for the Nl/Nlm amplitude results, there is also evidence that vowel processing in the human brain is not strongly lateralized, so that even with the inclusion of
results of source analysis, no definitive conclusions about the sensitivity of Nl/Nlm to features of speech can be reached.
Conclusion
The results of this study show that amplitude and source param- eters of evoked magnetic and electric brain signals elicited by tones and vowels behave differently in the Nlm and the SF latency range. There was no significant interaction of stimulus type and hemisphere in the Nlm/Nl amplitudes, and Nlm ECD parameters; that is, no indication for a lateralization of brain activity to the speech-dominant hemisphere during vowel pro- cessing in the Nlm/Nl latency range.
Amplitude measures of the SP/SF and the dipole strength of the SF showed interhemispheric asymmetries for vowels but not for tones, and intrahemispheric asymmetries between the tone and the vowel condition in the speech-dominant left hemisphere but not in the right hemisphere. Comparing brain responses dur- ing tone and vowel stimulation, a sensitivity to features of speech was evident in the latency interval subsequent to the Nlm/Nl.
References Annett M (1967) The binomial distribution of right, mixed and left-
handed. Q J Exp Psycho1 19:327-333. Elberling C, Bak C, Kofoed B, Lebech J, Saermark K (1982a) Auditory
magnetic fields from the human cerebral cortex: location and strength of an equivalent dipole. Acta Neurol Stand 65:553-569.
Elberling C, Bak C, Kofoed B, Lebech J, Saermark K (1982b) Audi- tory magnetic fields. Source localization and “tonotopical organiza- tion” in the right hemisphere of the human brain. Stand Audio1 11: 61-65.
Glass I, Wollberg Z (1983) Responses of cells in the auditory cortex of awake squirrel monkeys to normal and reversed species-specific vocalisations. Hearing Res 9:27-33.
Hari R (1990) The neuromagnetic method in the study of the human auditory cortex. In: Auditory evoked magnetic fields and electric po- tentials (Grandori P, Hoke M, Romani GL, eds), pp 222-282. Basel: Karger.
Hari R, Hlmalainen M, Kaukoranta E, Make12 J, Joutsiniemi SL, Tii- honen J (1989) Selective listening modifies activity of the human auditory cortex. Exp Brain Res 74:463-470.
Hoke M (1988) Auditory evoked magnetic fields. In: Dynamics of cognitive and sensory processing by the brain (Basar E, ed), pp 31 l- 3 18. Berlin: Springer.
Kaukoranta E, Hari R, Lounasmaa OV (1987) Response of the human auditory cortex to vowel onset after fricative consonants. Exp Brain Res 69: 19-23.
Kikuchi Y, Tsunoda T Naitoh S, Takahashi T, Uehara G (1988) A sound feature extraction mechanism in human brain. In: Biomagne- tism ‘87 (Atsumi K, Kotani M, Ueno S, Katila T, Williamson SJ, eds), pp 150-153. Tokyo: Denki UP
Kuriki S, Murase M (1989) Neuromagnetic study of the auditory re- sponses in right and left hemispheres of the human brain evoked by pure tones and speech sounds. Exp Brain Res 77: 127-134.
Lindsev JW (197 1) The auditorv evoked ootential in human: a review. Life<Sci 1:91-l 10.
Lund E, Spliid PE, Andersen E, Bojsen-Moller A (1986) Vowel per- ception: a neuroradiological study of the perception of vowels in the human cortex. Brain Lang 25: 191-211.
Make12 JP, Hari R, Linnankivi A (1987) Different analysis of frequency and amplitude modulations of a continuous tone in the human audi- tory cortex: a neuromagnetic study. Hearing Res 27:257-264.
Molfese DL (1978) Left and right hemisphere involvement in speech perception: electrophysiological correlates. Percept Psychophys 23: 237-243.
Molfese DL, Erwin RJ (1981) Intrahemispheric differentiation of vow- els: principal component analysis of auditory evoked responses to computer-synthesized vowel sounds. Brain Lang 13:333-344.
Molfese DL, Linnville SE, Wetzel WP, Leicht D (1985) Electrophysi- ological correlates of handedness and speech perception contrasts. Neuropsychologia 23:77-86.
The Journal of Neuroscience, April 1995, E(4) 2755
Musiek FE (1986) Neuroanatomy, nemophysiology, and central audi- torv assessment. Part II: the cerebrum. Ear Hear 7:283-294.
N&&en R, Picton T (1987) The Nl wave of the electric and magnetic response to sound: a review and an analysis of the component stmc- ture. Psychophysiology 24:375425.
Pantev C, Hoke M, Lehnertz K, Ltitkenhoner B, Anogianakis G, Witt- kowski W (1988) Tonotopic organization of the human auditory cor- tex revealed by transient auditory evoked magnetic fields. Electroen- cephalogr Clin Neurophysiol 69.160-170.
Pantev C. Hoke M. Lehnertz K. Liitkenhoner B (1989) Neuromagnetic evidence of an amplitopic organization of the human cortex.-Elec- troencephalogr Clin Neurophysiol 72:225-23 1.
Pantev C, Gallen C, Hampson S, Buchanan S, Sobel D (1991) Repro- ducibility and validity of neuromagnetic source localization using a large array biomagnetometer. Am J EEG Technol 31:83-101.
Pantev C, Eulitz C, Elbert T, Hoke M (1994) The auditory evoked sustained field: origin and frequency dependence. Electroencephalogr Clin Neurophysiol 90:82-90.
Picton TW, Woods DL, Proulx GB (1978a) Human auditory sustained potentials. I. The nature of the response. Electroencephalogr Clin Neurophysiol 45:186197.
Picton TW, Woods DL, Proulx GB (1978b) Human auditory sustained potentials. II. Stimulus relationships. Electroencephalogr Clin Neu- rophysiol 45: 198-210.
Rasmussen T, Milner B (1977) The role of early left-brain injury in
determining lateralization of cerebral speech functions. In: Evolution and lateralization of the brain (Dimond S, Blizzard D, eds). New York: New York Academy of Sciences.
Romani GL, Williamson SJ, Kaufman L (1982) Tonotopic organization of the human auditory cortex. Science 216:1339-1340. -
Rugg M (1983) The relationshin between evoked potentials and lateral &$mmktries’of processing. In: Tutorials in ERP research: endogenous components (Gaillard AWK, Ritter W, eds), pp 369943 1. Amsterdam: North-Holland.
Sams M, Aulanko R, Hamalainen M, Hari R, Lounasmaa V, Lu S, Simola J (1991) Seeing speech: visual information from lip move- ments modifies activity in the human auditory cortex. Neurosci Lett 127:141-145.
Scherg M, Picton TW (1991) Separation and identification of event- related potential components by-brain electric source analysis. Elec- troenceohaloaraohv ~SUDD~~ 42:24-37.
Shankweiier D, Smddert-Kennedy M (1967) Identification of conso- nants and vowels presented to left and right ears. Q J Exp Psycho1 14:59-63.
Suga N, Olsen JE Butman JA (1990) Specialized subsystems for pro- cessing biologically important complex sounds: cross-correlation analysis for ranging in the bat’s brain, pp 585-597. Cold Spring Har- bor, NY: Cold Spring Harbor Laboratory.
Yamamoto T, Williamson SJ, Kaufman L, Nicholson C, Llinas R (1988) Magnetic localization of neural activity in the human brain. Proc Nat1 Acad Sci USA 85:8732-8736.