Cisco Internet Service Node (ISN) Release Notes for Release ...

Medicine in Australia:Balancing Employment and Life (MABEL)
Mabel User Manual: Wave 1 Release
Daniel Kuehnle, Anthony Scott, Terence Cheng, Sung-Hee Jeon, Peter Sivey and Anne Leahy
April 2010
www.mabel.org.au

2
Acknowledgements We would like to thank the doctors who gave up their valuable time to participate in MABEL; endorsing organisations; members of the Policy Reference Group; and the other members of the MABEL team for data cleaning and comments on drafts of this paper: John Humphreys, Catherine Joyce, Guyonne Kalb, Matthew McGrail, Michelle McIsaac, Stefanie Schurer and Durga Shrestha. This work was supported by a National Health and Medical Research Council Health Services Research Grant (454799) and the Commonwealth Department of Health and Ageing. The study was approved by the University of Melbourne Faculty of Economics and Commerce Human Ethics Advisory Group (Ref. 0709559) and the Monash University Standing Committee on Ethics in Research Involving Humans (Ref. CF07/1102 - 2007000291).

3
Daniel Kuehnle (corresponding author) Melbourne Institute of Applied Economic and Social Research Alan Gilbert Building The University of Melbourne Parkville Victoria 3010 Australia E: [email protected] Anthony Scott Melbourne Institute of Applied Economic and Social Research Alan Gilbert Building The University of Melbourne Parkville Victoria 3010 Australia E: [email protected] Terence Cheng Melbourne Institute of Applied Economic and Social Research Alan Gilbert Building The University of Melbourne Parkville Victoria 3010 Australia E: [email protected] Sung-Hee Jeon Melbourne Institute of Applied Economic and Social Research Alan Gilbert Building The University of Melbourne Parkville Victoria 3010 Australia E: [email protected] Peter Sivey Melbourne Institute of Applied Economic and Social Research Alan Gilbert Building The University of Melbourne Parkville Victoria 3010 Australia E: [email protected] Anne Leahy Melbourne Institute of Applied Economic and Social Research Alan Gilbert Building The University of Melbourne Parkville Victoria 3010 Australia E: [email protected]

4
Table of Contents
1. Overview of the MABEL Survey .........................................................................6
1.1 Background, Focus and Goals .....................................................................................................6
1.2 Using the MABEL Survey .............................................................................................................7
1.3 The Population of Doctors in Australia .........................................................................................7
1.4 Survey Administration...................................................................................................................8
1.5 Questionnaire Design ...................................................................................................................9
1.6 Data Management and Analysis.................................................................................................10
1.7 Response Rates .........................................................................................................................10
1.8 Response Bias............................................................................................................................12
1.9 Survey Weights...........................................................................................................................15
2. The MABEL Data................................................................................................19
2.1 Variable Name Conventions.......................................................................................................19
2.2 Missing Value Conventions ........................................................................................................19
2.3 Data Cleaning.............................................................................................................................20
2.4 Data Quality Issues ....................................................................................................................21
2.5 De-identification..........................................................................................................................25
2.6 Overview of Top-coded Variables ..............................................................................................26
3. MABEL Wave 1 Coding Framework: De-identified Release ...........................28
4. References .........................................................................................................54
APPENDIX 1A: Alphabetical listing of variables .................................................55
APPENDIX 2A: Previous doctor surveys.............................................................56

5
List of Tables Table 1: Response rates ......................................................................................................................11 Table 2: Comparison of AMPCO doctor type against doctor type in MABEL......................................12 Table 3: Comparisons of respondent characteristics with populationa ................................................14 Table 4: Mean total clinical hours worked per week ............................................................................14 Table 5: Logistic regression for survey non-response .........................................................................17 Table 6: Descriptive statistics...............................................................................................................17 Table 7: Weekly working hours (WLWH), means ................................................................................18 Table 8: Annual income in AUD (FIGEY), means................................................................................18 Table 9: Overall job satisfaction (JSFL), means ..................................................................................18 Table 10: Missing value conventions for all variables..........................................................................19 Table 11: Basic data cleaning rules .....................................................................................................20 Table 12: Item response by doctor type and section (%).....................................................................21 Table 13: Data quality: on-call..............................................................................................................24 Table 14: Data quality: fees .................................................................................................................25 Table 15: Summary of top-coded variables .........................................................................................26
List of Figures Figure 1: Age distribution of respondents and population....................................................................13 Figure 2: Comparison of total clinical hours worked per week between respondents and population,
by gender .............................................................................................................................................15

6
1. Overview of the MABEL Survey
1.1 Background, Focus and Goals
The Medicine in Australia: Balancing Employment and Life (MABEL) survey is a longitudinal panel
survey of medical practitioners in Australia, with a particular focus on work-life balance issues (Joyce,
Scott et al. 2010). While there is a considerable body of research and data describing aggregate
trends in Australian medical labour supply, there is little research, nationally or internationally,
examining the determinants of labour supply decisions. Longitudinal data and appropriate statistical
analysis are essential for exploring the links between labour supply and its determinants. However,
few examples of this type of data exist. The dynamic nature of medical labour markets makes the use
of longitudinal panel data especially important.
The primary aim of MABEL is to investigate labour supply decisions and their determinants among
Australian doctors. Key outcome measures are the number of hours worked and decisions to change
job, relocate, enter a particular medical specialty or leave the medical workforce. MABEL seeks to
describe and understand key determinants of these outcomes, including working conditions, job
satisfaction, family circumstances and financial and non-financial incentives. The study is the largest
longitudinal survey of the Australian medical workforce. It offers opportunities to explore workforce
dynamics over time and thereby inform policies for workforce support and management.
The Medicine in Australia: Balancing Employment and Life (MABEL) study was developed in
response to this critical lack of data by researchers at the Melbourne Institute of Applied Economic
and Social Research and Monash University, Melbourne, Australia. The study received a Health
Services Research Grant (454799) from Australia’s National Health and Medical Research Council
for 2007–2011 to collect four annual waves of data. Additional support has been provided by the
Australian Government Department of Health and Ageing.
The Policy Reference Group of MABEL meets twice a year and provides the main link between
MABEL and the key stakeholders in the medical workforce policy area. Its activities include:
(i) to inform the research team of current, medium and long-term policy issues that can
potentially be examined by MABEL. This information will be used to inform the content of
the survey and the research questions addressed when the data are analysed, within the
overall aims of the survey;
(ii) to act as a forum for the communication and discussion of emerging research findings
from MABEL; and
(iii) to provide advice on how best to ensure the success of MABEL in terms of survey
processes such as response rates and publicity, and the use and implementation of
research findings from MABEL.
(iv) to act as a mechanism to build research capacity and effective working relationships
between academics and government

7
1.2 Using the MABEL Survey
This de-identified release of MABEL is intended to maximise the use of the unit record data by
researchers, government, and other organisations. All users of this data should have an appropriate,
high level of statistical and database management skill to manage this large and complex data set.
Those interested in using the data should visit our website www.mabel.org.au/data.html.
The data are most useful for national-level analyses of a range of doctors’ attitudes to work, job
characteristics, work settings, finances and family circumstances that can be tracked over time. Wave
1 provides baseline data that was collected in 2008 before the global financial crisis and before
health care reforms were proposed. The ethical requirements to ensure confidentiality to de-identify
the data means that state and jurisdiction identifiers could not be included in the de-identified release,
age is coded in bands, and some variables have been top-coded. Our ‘MABEL Matters’ newsletters
(No. 2 to No. 5) provide some descriptive statistics on how many doctors there are of each type by
state and jurisdiction (www.mabel.org.au/newsletter).
1.3 The Population of Doctors in Australia
The Australasian Medical Publishing Company's (AMPCo) Medical Directory is a national database
used extensively for mailing purposes (e.g. the Medical Journal of Australia). The Directory is
updated regularly using a number of sources. AMPCo receives 58,000 updates to doctors’ details per
year through biannual telephone surveys, and checks medical registration board lists, Australian
Medical Association membership lists and Medical Journal of Australia subscription lists to maintain
accuracy. The directory contains a number of key characteristics that can be used for checking the
representativeness of the sample and to adjust for any response bias in sample weighting. These
characteristics include age, gender, location, and doctor type.
At the time of the study’s first wave in June 2008 the AMPCo database recorded 58,620 doctors
practising in Australia, excluding those known to be not working due to retirement, maternity leave,
overseas location or other reasons. The intention was to include only those undertaking clinical work
in Wave 1. Of the 58,620 doctors, 1,552 (2.6%) could not be assigned to one of the four doctor types,
either because they did not supply this information to AMPCo (1,261) or because they were not
undertaking clinical practice (291). 1,263 doctors (2.2%) did not allow their contact details to be
released and 1,059 (1.8%) were non-contactable because they were in the process of having their
contact details verified. This left 54,746 doctors in the sampling frame.
Based on results from our piloting that showed relatively low response rates, we decided to
undertake a census of the entire population of doctors rather than select a random sample. Our third
pilot survey (which included a randomised trial of paper versus online response modes, sampling
strategies, and cost-effectiveness analysis), indicated that the census approach was the most cost-
effective method to produce a large and representative cohort.

8
Response rate calculations for Wave 1 were based on the combined totals from respondents in the
third pilot survey (February 2008) and those in the main wave (June 2008), as the survey content
was very similar. The numerator included respondents to the third pilot and the main wave. The
denominator included: 54,746 doctors from the main wave population obtained from AMPCo in May
2008, plus 35 doctors who were in the sample frame for the third pilot in February 2008 but not in the
main wave population in May 2008 (i.e. they were no longer listed in the AMPCo database as being
in clinical practice), less 31 doctors who responded to the first two pilots in October and November
2007. We felt it was not appropriate to send these respondents an invitation to participate in the main
wave, due to the short time interval since they completed the pilot study. Thus, the final denominator
for the baseline cohort used to calculate the response rate was 54,750.
1.4 Survey Administration
Invitations to participate in MABEL were distributed by mail through AMPCo, in early June 2008. The
invitation package included:
(i) a cover letter on university letterhead using personalised participant information and
coloured ink;
(ii) a copy of the survey questionnaire, printed in colour ;
(iii) an explanatory statement providing information about the study, in colour;
(iv) a reply-paid envelope (recommended by Edwards et al. (2002) and Dillman (2007) to
boost response rates); and
(v) a form to request another version of the survey, for example where the doctor was no
longer in a specialist training program but was now a specialist.
All survey materials are available on www.mabel.org.au.
Doctors were given the choice of completing a paper copy of the questionnaire or an online version
through the secure study website, and were provided with login details in the invitation letter. The
content of the online version was identical to the paper version. Participants were able to move
forward and backwards through the online survey sections; to complete the survey in multiple
sessions; and to elect not to answer any particular question.
In order to draw meaningful inferences about recruitment and retention in rural and remote areas, we
needed to ensure a high response rate in those regions where absolute numbers are small. Pre-paid
monetary incentives, not conditional on response, have been shown to double response rates
(Edwards et al. 2002). While cost considerations precluded the use of financial incentives for all
participants, we provided a AU$100 honorarium payment to doctors, mostly General Practitioners,
(GPs) in small rural and remote communities; this was done in order to maximise response rates for
this group, in recognition of both their importance from a policy perspective, and of the significant
time pressures on these doctors. This group was defined using both the Australian Standard
Geographic Classification (AGSC) based on the Accessibility and Remoteness Index for Australia
(ARIA+), and the Rural, Remote and Metropolitan Area (RRMA).

9
Doctors located in the following areas were sent a cheque:
(i) ASGC ‘Remote’ area;
(ii) ASGC ‘Very Remote’ area;
(iii) ASGC ‘Outer regional’ area & RRMA ‘Other remote area; and
(iv) ASGC ‘Outer regional’ area & RRMA ‘Remote Centre’.
A reminder letter was posted approximately 4–6 weeks after the initial mail-out to those yet to
respond. The reminder letter was personalised and included an invitation to request a different
version of the survey questionnaire if needed, or to log on to the website to complete the survey.
1.5 Questionnaire Design
The choice and development of questions were based on the key hypotheses to be tested in the
MABEL survey, namely, the determinants of labour supply and mobility. Questions were based on
those from other surveys where possible (see Appendix A2). Study questionnaires went through four
stages of piloting. First, the content and face validity of the GP questionnaire was examined through
face-to-face interviews with 11 GPs and two specialists. Additional feed-back on our pilot doctors-in-
training questionnaires was gained at a meeting of around 12 doctors-in-training and interns. Three
pilot surveys were administered to random samples of doctors from the AMPCo list (n=200, n=200
and n=2,702 with response rates of 8%, 8% and 17.8% respectively), helping to ensure that the final
versions were as relevant, concise and clear as possible. These were also used to pilot the online
processes. The first two pilots were online only, and the third included a randomised trial of different
response modes that helped inform the mode used in the main wave. The Policy Reference Group
provided input to ensure the surveys’ relevance to current policy issues.
There are four different survey questionnaires according to doctor type:
(i) General Practitioner & GP Registrar;
(ii) Specialist;
(iii) Hospital non-specialists; and
(iv) Specialists-in-training.
The four different questionnaires incorporated a set of common questions as well as specific
questions related to each doctor type, thus the surveys vary in length. All surveys comprise eight
sections, A to H, as follows:
Section A: About your job satisfaction
Section B: Your preferences for different types of jobs (DCE - discrete choice experiment questions)
Section C: About the places where you work
Section D: About your workload
Section E: About your finances
Section F: About your geographic location

10
Section G: About you
Section H: About your family circumstances
Job satisfaction was measured using a validated and widely used measure, the Warr-Cook-Wall Job
satisfaction scale (van Ham et al. 2006; Warr et al. 1979). The DCE presents a number of paired
scenarios describing different job packages and participants are asked, of each pair, which job they
prefer. The job packages differ according to a number of predefined job characteristics that might
include the earnings, sector of work, hours worked, opportunities for education and training, and
characteristics of the work environment. DCEs have been used successfully in examining doctors’
preferences for jobs in other studies (Scott 2001; Scott 2002; Ubach et al. 2003; Wordsworth et al.
2004).
Different versions of the survey questionnaire were created so that the content could be tailored to
the four groups of doctors. A different DCE was included for each type of doctor. For GPs, the focus
was on working in a non-metropolitan area. For non-specialist hospital doctors (the majority of whom
are junior doctors in their early postgraduate years), the focus was on speciality choice. For
specialists and specialists-in-training the focus was on the balance between public and private sector
work. The longest version of the questionnaire (specialists) contained 87 questions in a 13-page
booklet (there were 84 questions for GPs in an 11 page booklet; 59 questions for hospital non-
specialists over eight pages; and 58 questions for specialists-in-training over eight pages). While
there is strong evidence that shorter questionnaires yield higher response rates, we also needed to
ensure we could adequately test hypotheses about the potentially wide range of factors influencing
labour supply decisions in order to enhance the validity of our conclusions.
1.6 Data Management and Analysis
Data collected through paper questionnaires were entered into an electronic database by a
commercial data entry company using double-entry for all variables. A subsequent check of a random
sample of 5% of the items entered from the paper questionnaires (352 questionnaires and 64,590
items) found 99.72% accuracy. Additional analysis and cleaning took place to further improve the
accuracy of data entry. Data collected using the online versions of the questionnaires automatically
generated a record in an electronic database. These data were downloaded, and data from paper
and electronic versions were merged. Standard data checks and cleaning procedures (e.g. range and
consistency checks) were used to minimise errors and missing values and to maximise data quality.
Minimal recoding was undertaken to give data users maximum flexibility to code variables for their
own purposes.
1.7 Response Rates
The overall Wave 1 response rate was 19.36% (Table 1). Of the 54,750 doctors who were invited to
participate 0.64% (348) refused to participate, and 0.96% (527) were ineligible to participate. With
1,244 of the mailed questionnaires returned to sender, the overall contact rate was 97.71%. The

11
highest response rate was from specialists (22.34%), followed by specialists-in-training (20.56%),
GPs (17.65%) and hospital non-specialists (16.52%). This latter group also had the lowest contact
rate, reflecting their higher mobility.
Several doctors fell into a different category to that assigned to them by AMPCo, and so completed a
different questionnaire from the one they were sent (Table 2).This may have been due to a change in
status (e.g. a specialist-in-training becoming a specialist) or inaccuracies in the AMPCo database.
The final numbers of observations available for analysis for each group are therefore different from
Table 1: 3,906 GPs, 4,596 specialists, 1,072 specialists-in-training and 924 hospital non-specialists.
Table 1: Response rates
Doctor typea
All doctors GP Specialist Hospital non-
specialist Specialist in
training (a) Total 54,750 22,137 19,579 8,820 4,214
(b) Useable responses (with at least one question answered) 10,498 3,873 4,310 1,451 864
(c) Refusal (i.e. H/C returned blank, declined) 349 145 124 54 26
(d) No contact (return to sender) 1,244 161 307 547 229
(e) No responses 42,132 17,762 14,555 6,732 3,083
(f) Not eligible (i.e. retired, no longer in clinical practice) 527 196 283 36 12
Response rate (b/(a-f)) 19.36% 17.65% 22.34% 16.52% 20.56%
Contact rate ((b+c+e)/(a-f)) 97.71% 99.27% 98.41% 93.77% 94.55%
Online responses 30.41% 25.38% 27.60% 47.62% 38.08% Note: (a) Doctor type as defined in the AMPCo database.
Just over 30% of doctors chose to fill out the questionnaire online, with a higher proportion of online
responders in the younger age groups (specialists-in-training and hospital non-specialists). For the
566 doctors (mainly GPs) practising in small remote and rural communities who received a cheque
with their invite letter the response rate was 58.44%.

12
Table 2: Comparison of AMPCO doctor type against doctor type in MABEL
Survey type filled out in MABEL
GPs Specialists
Hospital non-
specialist
Specialist in
training Total
GPs 3,813 (97.6%) 27 (0.6%) 16 (1.7%) 17 (1.6%) 3,873
Specialists 7 (0.2%) 4,285 (93.2%) 9 (1.0%) 9 (0.8%) 4,310
Hospital non-specialist 73 (1.9%) 66 (1.4%) 866 (93.7%) 446 (41.6%) 1,451
Specialist in training 13 (0.3%) 218 (4.7) 33 (3.6%) 600 (56.0%) 864
Total 3,906 4,596 924 1,072 10,498
1.8 Response Bias
A key issue in survey research is whether respondents differ from non-respondents in some way that
is likely to impact systematically on the estimated outcome values. Variables which are of particular
relevance to our key outcome variables include age, gender, doctor type, geographic location and
hours worked.
Age is a key variable with impacts in a number of areas, such as: life-cycle labour supply decisions,
decisions to start a family; and the propensity to fill out questionnaires (e.g. those in the ‘middle’ age
ranges may be more likely to respond due to lower satisfaction with work and with life in general,
while doctors closer to retirement may be less likely to participate because of a perception that the
survey is less relevant to their situation (Lynn 2008), especially if they are working only a small
number of hours.
Compared to the total AMPCo population, MABEL has slight over-representation of doctors in all age
groups up until age 60 (Figure 1). Respondents aged over 60 years were slightly under-represented.
Overall, the largest difference is observed in the age group 51–60 (21.5% nationally versus 24.2%
amongst MABEL respondents).

13
Figure 1: Age distribution of respondents and population
0
5
10
15
20
25
30
<=30 31-40 41-50 51-60 61-70 >70
Age groups
Perc
ent
National Wave1
Table 3 shows differences between the MABEL cohort and the total AMPCo population by doctor
type, geographic location and gender. Female doctors are over-represented in MABEL by six
percentage points. Specialists are over-represented by five percentage points, whilst GPs are under-
represented by four percentage points. The proportion of hospital non-specialists is lower than in the
population, whilst the proportion of specialists-in-training is slightly higher.
The locality and postcode of doctors’ practice location were matched to the Australian Standard
Geographic Classification Remoteness Areas to compare geographic distribution (ABS 2003). Over-
representation of doctors in remote and rural areas was anticipated because of the incentive
payment. Doctors in major cities were under-represented in our cohort by four percentage points,
whilst doctors in all other locations, especially remote and very remote areas, were over-represented.
Females were over-represented across all doctor types. Over-representation of rural and remote
doctors is most marked for GPs, but is also apparent to varying degrees for other doctor types.
Under-representation of doctors aged 60 and over mainly affects GPs and specialists. Many of the
differences in response rates with respect to age, gender, doctor type and location are statistically
significant, partly reflecting the large cohort size. The final dataset includes response weights based
on a logistic regression model estimated for each doctor type (see next section).
It seems likely that doctors who work longer hours would be less inclined to complete a survey than
those who are less pressed for time. In general, the opportunity cost to respondents of filling out the
survey are related to the time taken to complete the survey (Groves and Peytcheva 2008; Dillman
2007). To examine the extent to which MABEL represents doctors who work long hours, we
compared the mean and distribution of hours worked with those reported in the Australian Institute of
Health and Welfare (AIHW) Medical Labour Force Survey (AIHW 2008). This is the only other source

14
of national data and these surveys, conducted by each state and territory and combined by the
AIHW, have response rates of between 27% and 84%, with an overall response rate of 69% in 2007.
Table 4 shows differences in the mean of total clinical hours worked weekly. Most differences are of
less than one hour, with the largest difference being that for female GPs in MABEL, who work 1.4
hours more than indicated by the AIHW sample, and with MABEL doctors reporting slightly more
hours worked than the national average on most comparisons. The hours question in MABEL was
based on the questions used in the AIHW survey
Table 3: Comparisons of respondent characteristics with populationa
National
N = 54,750 MABEL respondents
N = 10,498 Number % Number % Doctor typeb Hospital non-specialists 8,820 16.11 1,451 13.82* Specialists-in-training 4,214 7.70 864 8.23* Specialists 19,579 35.76 4,310 41.06* GPs 22,137 40.43 3,873 36.89* Remoteness (ASGC)c Major city 44,623 81.50 8,106 77.21* Inner regional 7,281 13.30 1,589 15.13* Outer regional 2,402 4.39 545 5.19* Remote 349 0.64 207 1.97* Very remote 95 0.17 51 0.49* Gender Male 36,415 66.51 6,392 60.89* Female 18,308 33.44 4,100 39.06* Missing 27 0.05 6 0.06 Notes:
(a) * p<0.001. Statistical significance based on a logistic regression model including age, doctor type,
gender, and remoteness as independent variables.
(b) Doctor type defined by AMPCo, rather than reported in actual survey completed.
(c) ASCG = Australian Standard Geographic Classification Remoteness Areas (ABS 2003).
Table 4: Mean total clinical hours worked per week
Males Females All doctors MABEL AIHW MABEL AIHW MABEL AIHW
All doctors 47.1 46.6 38.4 37.7 43.7 43.6 GPs 45.4 44.2 33.1 31.7 39.9 39.5 Specialists 47.1 47 37.5 37.8 44.4 45 Hospital non-specialists 49.5 49.4 45.7 45.2 47.3 47.3 Specialists-in-training 50.5 51.7 47.4 46.9 48.9 49.7 Source: MABEL and AIHW (2008).

15
The distribution of clinical hours worked per week is also similar for MABEL respondents and the
population of doctors (Figure 2). For males there is a slight under-representation at the lower and
upper ends of the distribution, and a slight over-representation for those working between 35 and 64
hours per week (of around two percentage points). The pattern is more mixed for female doctors,
with the largest differences at around three percentage points.
Figure 2: Comparison of total clinical hours worked per week between respondents and population, by gender
05
1015202530354045
1–19 20–34 35–49 50–64 65–79 80+
Hours per week
Perc
ent
Males - populationMales - MABEL
Females - populationFemales - MABEL
Source: MABEL and AIHW (2008)
1.9 Survey Weights
As MABEL surveyed the entire population of Australian doctors in Wave 1, it was necessary only to
create weights to adjust for non-response. Non-response weights are commonly used to adjust for
differences between the characteristics of respondents to a survey and the characteristics of the
population. For example, in order to calculate the mean earnings of doctors in Australia we must take
into account the fact that the MABEL survey over-represents rural doctors and under-represents
urban doctors. As we have information on the population of doctors, including the number located in
rural versus urban areas, we can compute weights to ensure that summary statistics better
approximate the true averages of the population.
The basic procedure for calculating sampling weights is as follows (adapted from Deaton 1997):
(i) Identify subgroups of the population which have different probabilities of responding to
the survey;
(ii) Calculate the probability of response for each subgroup; and
(iii) Calculate the corresponding weight for each subgroup by taking the reciprocal of the
probability of response.

16
Step (i) is influenced by the availability of data on the population.
Our population data, from the Australian Medical Publishing Company (AMPCo), was linked by
postcode to Australian Standard Geographic Classification Remoteness Areas (ASGC 2001). We
use information on the following: receipt of an incentive cheque (for rural doctors); doctor age group;
gender; rurality (ASGC); state/territory; and doctor type. The population data is linked to MABEL
responses. Where we received a response to the MABEL survey that indicated the doctor had
retired or was not currently in clinical practice we dropped the observation from the population.
Responses that were ‘return to sender’ were included in the population, on the assumption that these
responses represent doctors in the population who had changed address and could not be located.
Following a similar method to Watson and Fry (2002), we use a logistic regression to calculate the
probabilities in step (2). The probability of response is modelled as follows for each doctor type:
( )Pr( )response F gender agegroups states ruralitygroups chequeα β δ γ θ κ= + + + + +
Where F(.) is the logistic distribution function. Sampling weights are defined by:
( )1
Priweightresponse
=
We estimate the model separately for each doctor type, thus allowing the effect of gender, age, state
and rurality on response to vary by doctor-type, but we do not include any interaction terms. This
implies, for example, that for a given doctor-type, the effect of gender on probability of response is
the same across age groups, in all states and in all rurality groups.
The reason for restricting the interaction terms in the model is to avoid estimating response
probabilities from very small sub-samples of the data (see eg. Little 2003, section 3). If we included
all possible interactions we would be calculating a probability separately for 1120 groups
[2(genders)*7(age groups)*8(states)*5(rurality groups)*2 (cheque groups)], many of which would
have very few (or zero) observations. By omitting interaction terms (except for doctor type), we pool
many of these groups together to make estimation more reliable. For example, there are relatively
few observations in the ‘very remote’ rurality category, and in the model these observations are
pooled across states, age groups, and gender to estimate the effect of ‘very remote’ location on
response probability.
For some doctor types there are very small numbers of doctors in particular age groups, states or
rurality groups. Where there are less than ten doctors of a given type in a group, they are assigned
to a different group. For specialists-in-training we combine: doctors in ‘remote’, ‘very remote’ and the
‘outer regional’ groups; doctors in the Northern Territory and Western Australia; doctors in the (age)
groups ‘Age 50–59’, ‘Age 60–69’ and ‘Age 40–49’ (there are no specialists-in-training in the ‘Age >70’

17
group); and doctors in the ‘cheque’ group (eight doctors) and the ‘no cheque’ group. For hospital
non-specialist doctors we combine the ‘Age >70’ group and ‘Age 60–69’ group. For specialists we
combine the ‘very remote’ group with the ‘remote’ group. Table 5 presents results of the models (in
odds-ratio form) for each doctor type.
Table 5: Logistic regression for survey non-response
GPs Specialists Hospital non-
specialists Specialists-in-
training O-R S.E O-R S.E O-R S.E O-R S.E Female 1.467 0.056 1.548 0.065 1.403 0.083 1.628 0.127 Age <30 2.102 0.396 1.270 0.150 2.274 0.433 Age 30–39 1.172 0.072 1.088 0.069 0.864 0.103 1.639 0.190 Age 50–59 1.202 0.056 1.124 0.052 1.484 0.270 0.690 0.171 Age 60–69 0.868 0.054 0.944 0.050 1.048 0.302 Age >70 0.901 0.084 0.726 0.063 Age missing 0.576 0.043 0.586 0.040 0.560 0.076 0.682 0.101 ACT 1.690 0.230 1.119 0.152 1.271 0.282 1.149 0.371 NT 1.534 0.288 1.675 0.426 1.950 0.663 QLD 1.241 0.067 1.136 0.061 1.163 0.104 1.005 0.123 SA 1.386 0.099 1.424 0.093 1.062 0.142 0.730 0.144 TAS 1.498 0.167 1.206 0.145 0.957 0.187 0.700 0.202 VIC 1.645 0.080 1.555 0.070 1.544 0.117 1.309 0.127 WA 1.460 0.099 1.077 0.075 1.392 0.154 1.545 0.215 Inner regional 1.406 0.067 1.471 0.088 1.545 0.169 1.363 0.247 Outer regional 1.483 0.104 1.199 0.151 0.965 0.205 1.739 0.476 Remote 1.651 0.410 1.535 1.229 0.873 0.626 Very remote 1.355 0.440 1.088 0.846 Cheque 5.291 1.071 3.524 2.533 6.060 3.886 Log L -9819.1 -10038.6 -3807.1 -2051.7 N 21,941 19,296 8,784 4,202 Note: Reference Category is: male, age 40–49, NSW, major city, no cheque.
Table 6 presents descriptive statistics for the estimated response probabilities and associated
weights by doctor type.
Table 6: Descriptive statistics
GPs Specialists Hospital non-specialists
Specialists-in-training
Mean S.D. Mean S.D. Mean S.D. Mean S.D. Predicted response probability
0.211 0.115 0.241 0.069 0.192 0.086 0.237 0.079
Weight
5.649 2.134 4.474 1.229 6.040 2.293 4.850 2.073
Total 3,873 4,310 1,451 864 Note: The weights are greater than one by definition. When summed over all responders, they sum to the population for each doctor type.
As Wave 1 of MABEL is a census of Australian doctors rather than a random sample of the
population, it is inappropriate to calculate standard errors or confidence intervals for the weights (see

18
AIHW, 2008 Appendix A for a similar argument in relation to the AIHW Medical Labour Force
Survey).
1.9.1 Examples of weighted and unweighted means Tables 7 to 9 present unweighted and weighted means for three variables: weekly working hours,
annual income and overall job satisfaction using the doctor type as listed in AMPCo. Missing and
negative values are excluded.
Table 7: Weekly working hours (WLWH), means
GPs Specialists
Hospital non-specialists
Specialists-in-training
Unweighted 39.76 44.99 47.95 45.92
Weighted 39.92 45.08 48.17 45.92
No. respondents 3,367 3,617 1,255 755
Table 8: Annual income in AUD (FIGEY), means
GPs Specialists Hospital non-specialists
Specialists-in-training
Unweighted 190,184 351,932 101,193 137,865
Weighted 191,592 356,635 101,144 144,086
No. respondents 2,760 3,187 818 560
Table 9: Overall job satisfaction (JSFL), means
GPs Specialists Hospital non-specialists
Specialists-in-training
Unweighted 3.064 3.145 2.895 3.042
Weighted 3.051 3.149 2.894 3.042
No. respondents 3,832 4,258 1,442 857
Note: The variable is measured on a 5-point scale, from 1 (very dissatisfied) to 5 (very satisfied).

19
2. The MABEL Data
2.1 Variable Name Conventions
Variable names have a minimum of three and a maximum of 11 characters. Typically, each variable
name is comprised of two parts indicative of the content of the variable. The first two letters indicate
the section of the survey to which the variable relates, and the rest of the variable name relates to the
specific question /question part. Details regarding the individual sections can be found on page 28.
Users should be aware that some variables have been ‘top-coded’. Separate derived variables were
generated in these cases, which are denoted by the original variable name followed by an
underscore ( _ ) and suffix representing the doctor type. More detailed information on this can be
found in the section explaining the coding framework.
A complete list of all variables, ordered by section, starts on page 30. An alphabetical index of all
variables is provided in Appendix 1A (p. 55) to help users quickly find details regarding the variable of
interest.
2.2 Missing Value Conventions
Global codes are used throughout the dataset to identify missing data. These codes are used for all
variables in the dataset.
Text and numeric variables with missing values will typically contain the following text as shown in the
table below.
Table 10: Missing value conventions for all variables
Text Description
–1 Not asked
–2 Refused
–3 Not applicable
–4 Unable to determine value
–5 Written comment exists

20
2.3 Data Cleaning
Given that respondents were able to complete the survey either by filling out the questionnaire online
or completing a paper version, cleaning the MABEL data involved two steps:
• first, converting text entries into numerical values where appropriate; and
• second, determining values from either text or numeric responses and written comments
provided by respondents.
In general, we adhered to the guiding principles outlined below when cleaning the most common
problems in the data.
Table 11: Basic data cleaning rules
Problem Examples Solution
Written text instead of a
numeric value.
- Ten hours
- Twelve days
De-string the text, i.e. convert
text into a numeric value (i.e.
10 and 12)
Instead of a single number, a
range of numbers was
entered.
‘10-12’ (for instance hours
worked).
Replace the range with the
mean of the two values (i.e.
11)
‘Not applicable’ entered. ‘Not applicable’ or ‘N/A’. Apply global missing code,
i.e. replace with -3.
An inequality was entered
instead of a number.
- ‘at least 3 hours’
- ‘maximum of 5 days’
- 15+
In these cases it is not clear
what value to impute from
this entry, therefore coded as
-4.
Basic punctuation symbols
such as ‘?’ or ‘~’ were
combined with a numeric
value.
- ~ 5 (nurses)
- ?10
- 10?
These symbols were treated
equivalently with any string
entry meaning ‘around’, or
‘close to’. These symbols
were thus dropped to arrive
at the numeric value
contained in the entry

21
2.4 Data Quality Issues
In this section we describe and discuss the data quality issues that we are aware of in the dataset.
Though the data are cleaned, we have taken a conservative approach to recoding and imputation.
This gives the data user more discretion on how to recode variables for their particular objectives.
2.4.1 Item non-response Table 12 provides item response rates by section and doctor type for Wave 1.
Table 12: Item response by doctor type and section (%)
GPs Specialists Hospital non-specialists Specialists-in-training TotalJob satisfaction 99.03 99.10 97.25 99.50 98.95Work places 88.95 78.52 95.95 95.42 85.66Workload 89.50 86.47 92.38 93.87 88.87Finances 83.39 82.87 86.81 88.23 83.96Location 94.16 88.23 94.57 94.57 91.64About you 87.04 94.73 95.12 96.04 92.04Family 96.53 94.02 96.89 97.26 95.54Total 91.66 89.29 94.64 95.43 91.27Notes: Calculated by taking the mean of the percentage of completed questions per respondent.
Overall, the level of non-response differs by both doctor type and survey section. Of the four doctor
types, specialists and GPs have the lowest completion rates, with 89.3% and 91.7% respectively,
compared to 94.6 % for hospital non-specialists and 95.4% for specialists-in-training. In terms of
survey sections, job satisfaction and family circumstances have the highest item response rates at
99% and 95.5%, whereas completion rates are lowest for the sections on finances (84%), work
places (85.7%) and workload (88.9%) sections.
2.4.2 Data issues For a small number of variables in the data set we identified particular data-quality issues which have
been addressed prior to the release of the de-identified data, as described below. Given these
issues, we suggest that data users undertake careful sensitivity analyses when using variables
relating to income, hours, on-call and fees.
2.4.2.1 Income
(1) Some doctors reported their yearly income to be in the range of $0 to $1000. This applied to both
personal and household income, as well as to gross and net figures.
Solution: Based on a cross-tabulation of all income variables, these observations appear to refer to a
metric of ‘thousands’ (note: this is quite common in MABEL, but in most cases doctors added an
indicator such as ‘k’ or ‘thousands’ after the given number of dollars). We thus constructed an hourly

22
wage rate for these observations to check their validity, having multiplied the values in the range $0
to $1000 by 1000. Finally, we compared the means and medians of these observations with the rest
of the sample. It was concluded that all of these problem figures were indeed references to unit
measures of a thousand and we replaced them with the new values, that is, multiplied by one
thousand.
When analysing the fortnightly income figures, it was found that some of these values were
unrealistically low. Following the same approach as that outlined above, these figures were cross-
tabbed with the other income variables, which allowed us to conclude that these figures also referred
to ‘thousands’ rather than absolute numbers. We thus replaced the values by multiplying by one
thousand.
Note that although doctors were given the choice of reporting their income as yearly or fortnightly
figures (and as gross or net figures), the de-identified data set contains only the yearly income
variables. This process required converting fortnightly income to yearly income, which was not an
issue when both yearly and fortnightly incomes were reported. In those cases we simply used the
yearly figures. Whenever only fortnightly income data were available, these data were multiplied by
26 to calculate the yearly income.
(2) Some doctors reported a lower gross than net personal income (having multiplied the
aforementioned values by one thousand).
Solution: For these observations we decided to compare the income figures to those of doctors with
similar characteristics, in terms of: doctor type; gender; age; working hours; partner’s employment
status; and specialty (if the doctor is a specialist). Having constructed the average gross and net
income for a doctor’s reference income group, we compared these with the ‘problem’ income data.
Cross-tabulating all this information allowed us to impute corrected values based on the following
changes:
• switching gross and net;
• adding one zero to personal income where the respondent omitted one zero; and
• for the rest, either the gross or the net figure was replaced with an –4, depending on which of
these two figures was least similar to the group average (by the above criteria).
(3) There were a substantial number of observations where doctors reported a higher gross personal
than gross household income. This could be explained by measurement errors (typos/etc.); doctors
reporting only their partner’s earnings as household earnings; or doctors including either their
practice’s earnings or other forms of income in either of the two figures.
Solution: As a first step, a few cases were identified where one of the two variables had either a
surplus zero, or was missing a zero. These values were changed accordingly, but this still left the
large majority of cases unchanged. Due to the complexity of household earnings data (which can

23
include partners’ earnings, other sources of income, etc.) it was decided to change only those values
where the ratio of gross personal to gross household income was exactly ten. For these cases, we
cross-tabbed all income variables and were able to conclude that the household figures were missing
a zero. We then multiplied the household gross income data for these observations by ten. Note
however that this problem (i.e. gross personal income being higher than gross household income)
persists for a large number of observations in the dataset.
(4) There were 19 cases where household net income was greater than personal net income.
Solution: Using an analogous approach to that discussed in point 2 above, it was possible to resolve
these inconsistencies by:
• switching gross and net where appropriate;
• adding one zero to gross income where appropriate; and
• replacing either the gross or the net figure with a –4, depending on which of these two figures
was least realistic.
2.4.2.2 Hours
There are two sets of variables which collect information about hours worked: hours worked per week
by setting (public hospital, private practice etc,) with PWTOH as the total; and hours worked per week
by activity (direct patient care etc) with WLWH as the total.
(1) For some doctors the reported sum of hours worked (either PWTOH or WLWH) exceeded the
permissible limit of 168 hours per week.
Solution: Whenever the values exceeded 168 they were coded as –4.
(2) There is a potential mismatch between the variables WLWH and PWTOH. Although they are
supposed to be the same, PWTOH excludes, whilst WLWH includes, on-call work. This could
introduce an upward bias in PWTOH if on-call work was included.
Solution: We tried to remove all on-call hours from the workplace variables wherever possible. For
this purpose the additional text responses were checked and if a doctor indicated that work in a
certain setting was on-call work, we removed it from the individual variable as well as the total sum
(PWTOH).
It should be noted that PWTOH and WLWH do not match for every observation. Also, there are some
observations where the reported sum of hours (either PWTOH or WLWH) does not equal the actual
sum of hours (i.e. after adding up the individual parts).
2.4.2.3 On-call

24
There was a multitude of different text responses for the on-call variable WLOCR (Table 13).
Table 13: Data quality: on-call
Problem Example Solution
Reporting separate on-call
ratios for weekdays and
weekends
‘every weekday – 1 in 4
Sunday’
Coded as –4.
Reporting separate on-call
ratios for public and private
sector
‘2 private, 10 public’
‘4 public, 1 private’
Coded as –4.
Reporting separate on-call
ratios for different activities
‘10 for A&E, 1/1 for obstetrics’
‘3 (Department), 1 in 12 GP
Coded as –4.
Different notation used to
indicate ratio
For instance:
‘1 in 2’
‘1/2’
‘1:3’
Coded as 1 in:
2
–4
3
Reporting a range For instance:
‘1:2-1:4’
‘1 in 2 / 2 in 7’
We cannot be sure that these
ranges refer to the same
setting, so coded as –4.
Text meaning ‘on call all the
time’
‘all the time’
‘every day’
Coded as 1 in 1.
A key principle followed was to ensure that the on-call ratios referred to the same thing – e.g. ‘1 in 4’
would always be denoted in the same unit, i.e. one week in four weeks, or one day in four days.
Whenever there was a text response that did not allow the imputation of an on-call ratio, a
conservative approach was adopted and such values were recoded as –4.
There were several cases where a doctor did not respond to the on-call ratio question, but indicated
in the adjacent ‘NA’ text box that some kind of on-call work was performed (and we lacked the detail
to do something about it). In order to differentiate genuine ‘missing’ values from those situations
where there was some information, albeit ambiguous or lacking in sufficient detail, the on-call
variables for such responses were imputed as –4 and the NA box coded as ‘0’ (which implies that
some form of on-call work is performed). This approach also minimises coding bias by seeking to
‘attribute meaning’ to ambiguous responses where one coder’s interpretation may differ from
another’s.
2.4.2.4 Fees
There were many different text responses in relation to the fee variable WLCF (Question: ‘What is
your current fee for a standard private consultation?’). The intention of this question was to capture
information about the total amount charged to patients. The following table summarises some of the
main problems.

25
Table 14: Data quality: fees
Problem Example Solution
Doctors do not report a fee but
give details about the billing
schedules
‘bulk billing’
‘Medicare rebate’
‘rebate’
For doctors who bulk bill 100% of their
patients and reply ‘Medicare rebate’ or
‘rebate’ to the fees question, we set the
fee equal to zero. For those not not
bulk billing (i.e. bulk billing less than
100% of their patients) but charging the
rebate, we are unable to determine the
cost to the patient and recode as -4.
This is because we do not have the item
number and so do not know the rebate.
Separate fees for new and
review patients
‘New 240, Old 120’ Calculate average.
More than one item number
listed, with prices.
‘235$ item 132, 140 $ item
110, 70$ item 116’
Calculate average.
Specialists (only) list item but
not the price
‘Medicare only item 110’ We checked the individual item prices
on the MBS website. For more than one
item, we took the average of the MBS
fees.
Specialists (only) mention
Medicare but no item number
‘Medicare fee’
‘MBS’
‘Schedule fees’
It’s not possible to arrive at a numeric
value. Therefore recode as –4.
AMA fees schedule reported ‘AMA fee, item 110
‘AMA Fee’
When item number was listed, prices
were looked up in ‘AMA list of medical
services and fees’.
2.5 De-identification
This release of the MABEL dataset has been de-identified to reduce the risk that individual
respondents can be identified. This has involved:
• withholding some variables (such as geographic identifiers);
• aggregating some variables (for example, certain specialties, age categories); and/or
• top-coding some variables (such as age, personal income).
In most cases where variables have been top-coded, this has involved making all values above a
certain threshold equal to the threshold. For example, the number of dependent children (FCNDC)
has been top-coded at 3+, which means that all values above three have been set equal to the value
of three.

26
For income, as a continuous variable, a different approach was adopted. For all income variables,
top-coding involved substituting an average value for all the cases which are equal to or exceed a
given threshold. The substituted value is calculated as the weighted average of the cases subject to
top-coding. As a result, the cross-sectionally weighted means of the top-coded variable will be the
same as the original variable.
2.6 Overview of Top-coded Variables
Below is a list of all variables that have been top-coded to avoid identification of individual doctors
(Table 14). In a number of cases, it was necessary to top-code the variables differently for different
doctor types to maximise the informational content and usefulness of the overall data. These
variables have been released as the original variable name plus a suffix representing the doctor type.
Table 15: Summary of top-coded variables
Variable Description Variable Description
PWNWMF No of males - full time WLOTPY Approximately how many
days off work did you have for
other reasons in the past
year?
PWNWMP No of males - part time GLYRRS For how many years did you
live in a rural area up until the
age you left secondary
school?
PWNWFF No of females - full time
GLNL In how many locations do you
practise?
PWNWFP No of females - part time
PICMDI In what year did you complete
your basic medical degree?
PWNWN No of nurses
FCNDC How many dependent
children do you have?
PWNWAP No of allied health
professionals
AGEI Age in 2008 imputed using
'PIYRBI'
PWNWAD No of administrative staff JSSCI Which specialist training
course have you been
accepted into?
PWNWO No of other staff PIMSPI Main specialty in which you
practice?
WLWHPY How many weeks holiday did
you take in the past year?
PISTEI Which specialty training
program are you enrolled in?
WLRH How many hours were you
rostered or listed for after
hours and on-call?
FIGEY Gross earnings in $ (before
tax) - annual

27
WLPCH How many of these hours were
actually spent in direct patient
care?
FINEY Net earnings in $ (after tax) -
annual
WLCOT How many times were you
actually called out?
FIGHIY Gross earnings in $ (before
tax) - annual
WLOCR On-call ratio 1 in FINHIY Net earnings in $ (after tax) -
annual
WLMLPY How many weeks of parental
or maternity leave did you take
in the past year?
WLSDPY Approximately how many days
off work due to illness did you
have in the past year?
Note: Details regarding the top-coding and aggregation of variables can be found in the Coding
Framework.

28
3. MABEL Wave 1 Coding Framework: De-identified Release
The table on the following pages provides a comprehensive overview of all variables contained in the
de-identified MABEL survey dataset. This listing is intended to assist researchers using the MABEL
data and to provide a useful resource for checking the basic characteristics of each variable. The
information listed in the table is outlined below.
3.1 Variable name This is the variable name used in STATA. All variables are comprised of lowercase letters (although,
by convention, this user manual refers to variables in uppercase letters). As mentioned before, each
variable name is comprised of two parts indicative of the content of the variable. The first two letters
indicate the section of the survey to which the variable relates, and the rest of the variable name
relates to the specific question /question part. The following list presents the first two letters that
indicate the seven different sections of the questionnaire:
JS = Job satisfaction
PW = Places where you work
WL = Workload
FI = Finances
GL = Geographic location
PI = Personal information
FC = Family circumstances
Note that for variables that have been top-coded or regrouped, a new variable was created ending
with a suffix that corresponds to the doctor type. The suffix is shown in brackets following the variable
name. For example:
‘WLRH (*_gp, *_sp, *_hdoc, *_sit)’.
This indicates that the original variable has been top-coded and/or recoded and that four different
variables are available – these being WLRH_GP, WLRH_SP, WLRH_HDOC, and WLRH_SIT.
Details on the topcoding or regrouping can be found in the last column of the table as well as in the
variable notes in the STATA data set.
Note that there are some questions which are broken down into several variables (i.e. the first
question on job satisfaction is broken down into ten variables). In these cases the question is listed
first, followed by the variable names for the individual options.
3.2 Variable description This column describes the variable and is based on the survey question.

29
3.3 Categories This column informs whether a category is numeric or discrete, and the available categories for
discrete variables. Note that the global code for missing values is referred to (for details, see page
19) but not repeated for each variable.
3.4 Availability of variables by doctor type This column gives the availability of variables by doctor type.
3.5 Additional notes This is especially important for variables that have been top-coded or regrouped. It defines where the
threshold for the top code was set, which categories were regrouped, and what imputations were
performed.

30
MABEL Wave 1 Coding Framework: De-identified Release Variable Variable description Categories Availability
across doctor types
Notes (top-coding, imputations)
SDTYPE Survey Type 1 = GP 2 = Specialist 3 = Hospital non-specialists 4 = Specialists-in-training
All
ONLINE Response mode 0 = Hardcopy 1 = Online
All This is a derived variable based on our administrative records.
XWAVEID Cross-wave ID Numeric response, 6-digit All Made up of four components: first digit denotes the wave when first joined; second digit represents doctor type; last four digits are individual identifiers.
SECTION A - ABOUT YOUR JOB SATISFACTION
Please indicate how satisfied or dissatisfied you are with each of the various aspects of your job JSFM Freedom to choose your own method
of working
JSVA Amount of variety JSPW Physical working conditions JSAU Opportunities to use your abilities JSCW Your colleagues and fellow workers JSRC Recognition you get for good work JSHW Your hours of work
JSWR Your remuneration
JSRP Amount of responsibility you are given JSFL Taking everything into consideration
how do you feel about your work?
0 = Very Dissatisfied 1 = Moderately Dissatisfied 2 = Not sure 3 = Moderately Satisfied 4 = Very Satisfied 5 = Not applicable Blank = Global code frame supplied
All

31
Variable Variable description Categories Availability across doctor types
Notes (top-coding, imputations)
Please indicate the degree to which you agree or disagree with the following statements JSBC The balance between my personal
and professional commitments is about right
All
JSSN I have a poor support network of other doctors like me
All
JSIT The IT systems I use are very helpful in day-to-day practice
All
JSTO It is difficult to take time off when I want to
All
JSPE My patients have unrealistic expectations about how I can help them
All
JSCP The majority of my patients have complex health and social problems
0 = Very Dissatisfied 1 = Moderately Dissatisfied 2 = Not sure 3 = Moderately Satisfied 4 = Very Satisfied 5 = Not applicable Blank = Global code frame supplied
All
JSQS I have good support and supervision from qualified specialists
3, 4
JSPS Running my practice is stressful most of the time
1, 2
JSPU Research publications are important to my career
2
JSST There is enough time for me to do personal study
3, 4
JSPT Research publications are important to progress my training
3, 4
JSUH The hours I work are unpredictable
All JSCH Would you like to change your hours
of work (including day time and after hours)?
0 = No 1 = Yes, I'd like to increase my hours 2 = Yes, I'd like to decrease my hours Blank = Global code frame supplied
All

32
Variable Variable description Categories Availability across doctor types
Notes (top-coding, imputations)
JSAS Do you plan to apply for a place on a specialist training course in the future?
1 = Yes 2 = Unsure 3 = No, I already have a place 4 = No, I already have a specialist / GP qualification 0 = No Blank = Global code frame supplied
3
What year do you expect to begin specialist training? JSBSYR Year Numeric response
Blank = Global code frame supplied 3
JSBSDK Don’t know 1 = Response marked 3 0 = Response blank
JSSCI Which specialist training course have you been accepted into / are you waiting to commence?
0 = Not applicable 1 = Paediatrics and child health 2 = General practice 3 = Surgery 4 = Internal medicine (adult medicine) 5 = Anaesthesia 6 = Emergency medicine 7 = Internal Med - Others 8 = Pathology - others 9 = Other specialties Blank = Global code frame supplied
3 This variable has been recoded. Any individual specialty with less than 20 observations has been subsumed in one of the “(specialty) - other” groups.
JSMLE Please specify specialty program you would most like to enroll in
Text response Blank = Global code frame supplied
JSMENA Not Applicable 1 = Response marked 0 = Response blank
3

33
Variable Variable description Categories Availability across doctor types
Notes (top-coding, imputations)
What is the likelihood that you will: JSLP Leave direct patient care (primary or
hospital) within FIVE YEARS
JSLM Leave medical work entirely within FIVE YEARS
0 = Very Likely 1 = Likely 2 = Neutral 3 = Unlikely 4 = Very Unlikely Blank = Global code frame supplied
All
SECTION C - ABOUT THE PLACES WHERE YOU WORK
In your most recent USUAL week at work, for approximately how many HOURS did you undertake work in each of the following settings? PWPUHH Public hospital (including psychiatric
hospital) Numeric response Blank = Global code frame supplied
All
PWPIHH Private hospital Numeric response
Blank = Global code frame supplied All
PWPISH Private medical practitioner's rooms or
surgery Numeric response Blank = Global code frame supplied
All
PWCHH Community health centre or other
state-run primary care organisation Numeric response Blank = Global code frame supplied
1
PWDSH Deputising service or after-hours clinic Numeric response
Blank = Global code frame supplied 1
PWHFH Residential / aged care health facility
(nursing/residential home, hospice etc) Numeric response Blank = Global code frame supplied
All
PWEIH Tertiary education institution Numeric response
Blank = Global code frame supplied All
34
Variable Variable description Categories Availability across doctor types
Notes (top-coding, imputations)
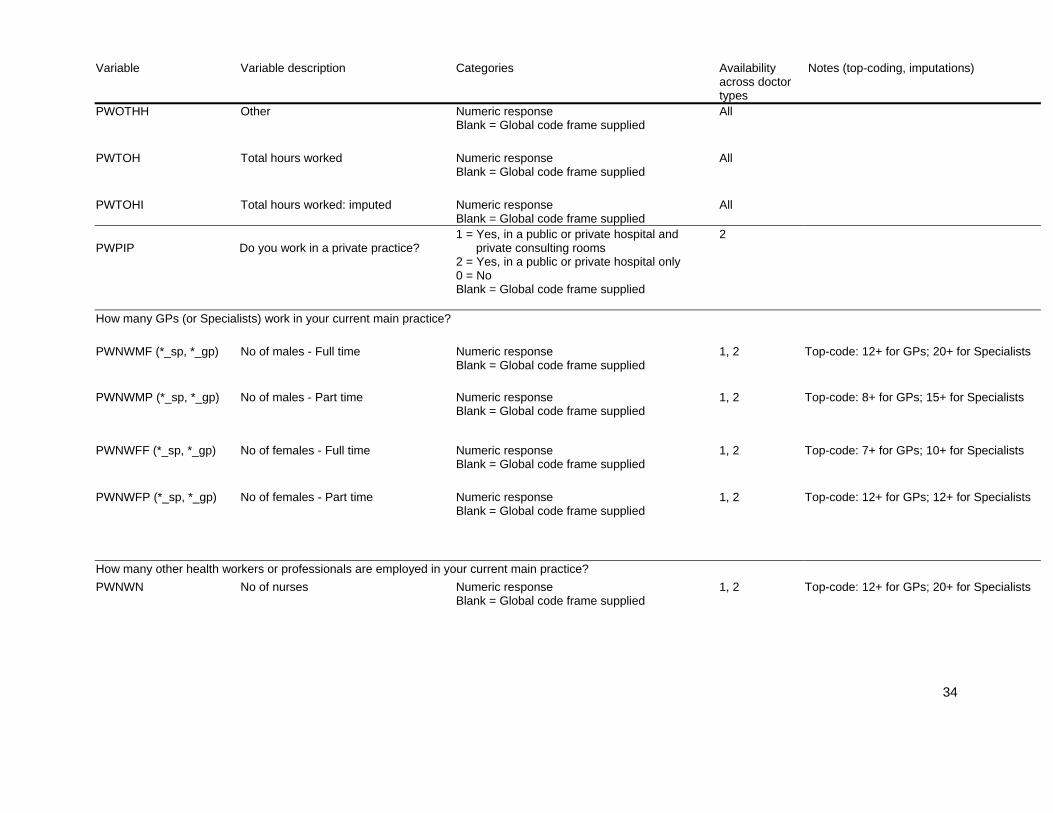
PWOTHH Other Numeric response Blank = Global code frame supplied
All
PWTOH Total hours worked Numeric response
Blank = Global code frame supplied All
PWTOHI Total hours worked: imputed Numeric response
Blank = Global code frame supplied All
PWPIP
Do you work in a private practice?
1 = Yes, in a public or private hospital and private consulting rooms 2 = Yes, in a public or private hospital only 0 = No Blank = Global code frame supplied
2
How many GPs (or Specialists) work in your current main practice? PWNWMF (*_sp, *_gp) No of males - Full time Numeric response
Blank = Global code frame supplied 1, 2 Top-code: 12+ for GPs; 20+ for Specialists
PWNWMP (*_sp, *_gp) No of males - Part time Numeric response
Blank = Global code frame supplied 1, 2 Top-code: 8+ for GPs; 15+ for Specialists
PWNWFF (*_sp, *_gp) No of females - Full time Numeric response
Blank = Global code frame supplied 1, 2 Top-code: 7+ for GPs; 10+ for Specialists
PWNWFP (*_sp, *_gp) No of females - Part time Numeric response
Blank = Global code frame supplied 1, 2 Top-code: 12+ for GPs; 12+ for Specialists
How many other health workers or professionals are employed in your current main practice? PWNWN No of nurses Numeric response
Blank = Global code frame supplied
1, 2 Top-code: 12+ for GPs; 20+ for Specialists

35
Variable Variable description Categories Availability across doctor types
Notes (top-coding, imputations)
PWNWAP No of allied health professionals Numeric response Blank = Global code frame supplied
1, 2 Top-code: 12+ for GPs; 25+ for Specialists
PWNWAD No of administrative staff Numeric response
Blank = Global code frame supplied 1, 2 Top-code: 22+ for GPs; 25+ for Specialists
PWNWO No of other staff Numeric response
Blank = Global code frame supplied 1, 2 Top-code: 20+ for GPs; 30+ for Specialists
PWCL Is your current practice co-located with
other specialist practices? 1 = Yes 0 = No Blank = Global code frame supplied
1, 2
PWBR What is your business relationship with the practice?
0 = Principal or partner 1 = Associate 2 = Salaried employee 3 = Contracted employee 4 = Locum 5 = Other (Please specify) Blank = Global code frame supplied
1, 2
When did you start working at this practice? PWSMTH Month Numeric response
Blank = Global code frame supplied 1, 2
PWSYR Year Numeric response
Blank = Global code frame supplied 1, 2
PWOCE My opportunities for continuing medical education and professional development are
0 = Very limited 1 = Average 2 = Very good Blank = Global code frame supplied
1
PWWH Do you currently work in a hospital? 1 = Yes 0 = No Blank = Global code frame supplied
1

36
Variable Variable description Categories Availability across doctor types
Notes (top-coding, imputations)
PWHLH How many hours a week do you work as a hospital locum?
Numeric response Blank = Global code frame supplied
2, 4
What is the main hospital in which you work (i.e. spend most time)? PWMHPASGC ASGC classification of main hospital
(based on postcode) 1 = Major City 2 = Inner Regional 3 = Outer Regional Blank = Global code frame supplied
1 This variable has been withheld for all doctor types but GPs. All hospitals classified as “remote” or “very remote” have been recoded and are included in the “outer regional” group.
How long have you worked at this hospital? PWWMTH Months (if less than a year) Numeric response
Blank = Global code frame supplied All
PWWYR Years Numeric response Blank = Global code frame supplied
All
PWSP What is your salaried position? 0 = Intern 1 = H M O Yr 1 2 = H M O Yr 2 3 = H M O Yr 3 4 = C M O 5 = Other hospital medical officer Blank = Global code frame supplied
3
PWPM How are you paid for this hospital work?
0 = Fee-for service / bill patients directly 1 = Fixed payment per session or hour 2 = Salary - no rights to private practice 3 = Salary with rights to private practice 4 = Other, please specify Blank = Global code frame supplied
1, 2
SECTION D - ABOUT YOUR WORKLOAD
Excluding after hours on-call work, how many HOURS in your MOST RECENT USUAL WEEK at work did you spend on the following activities? WLWHI Total hours worked per week - imputed Numeric response
Blank = Global code frame supplied
All

37
Variable Variable description Categories Availability across doctor types
Notes (top-coding, imputations)
WLWH Total hours worked per week Numeric response Blank = Global code frame supplied
All
WLDPH Direct patient care Numeric response
Blank = Global code frame supplied All
WLIDPH Indirect patient care Numeric response
Blank = Global code frame supplied All
WLEH Education activities Numeric response
Blank = Global code frame supplied All
WLMH Management and administration Numeric response
Blank = Global code frame supplied All
WLOTHH Other Numeric response
Blank = Global code frame supplied All
In your most recent USUAL week at work, for around HOW MANY patients did you provide care?
WLNPPC Total number of patients seen in
private consulting rooms Numeric response Blank = Global code frame supplied
1, 2
WLNPH Total number of patients seen in hospital or other settings
Numeric response Blank = Global code frame supplied
1, 2
WLNP Total number of patients that received
care Numeric response Blank = Global code frame supplied
3, 4
Approximately what percentage of these were: WLPGP GP referrals to you Numeric response
Blank = Global code frame supplied 2
WLPS Referrals from other specialists Numeric response
Blank = Global code frame supplied 2

38
Variable Variable description Categories Availability across doctor types
Notes (top-coding, imputations)
WLPOTH Referrals from other sources Numeric response Blank = Global code frame supplied
2
How long does a new (for Specialists: PRIVATE) patient typically have to wait for an appointment? WLWY You, their preferred doctor in the
practice? Numeric response Blank = Global code frame supplied
1
WLWOD Any doctor in the practice? Numeric response
Blank = Global code frame supplied 1
WLWD No. of days (if less than a week) Numeric response Blank = Global code frame supplied
1, 2
WLWW No. of weeks Numeric response
Blank = Global code frame supplied 1, 2
WLNT Not taking new patients at present 1 = Response marked
0 = Response blank 1, 2
WLNA Not applicable 1 = Response marked
0 = Response blank 2
WLCMIN How long does a standard private
consultation last? MINUTES Numeric response Blank = Global code frame supplied
1, 2
WLCNA Not applicable 1 = Response marked
0 = Response blank 2
WLCFI Imputed - what is your current fee for a standard private consultation?
Numeric response Blank = Global code frame supplied
1, 2 Imputed variable. See ‘data cleaning’ for details.

39
Variable Variable description Categories Availability across doctor types
Notes (top-coding, imputations)
WLCFNA Not applicable 1 = Response marked 2 0 = Response blank WLBBP Approximately what percentage of
patients do you bulk bill/charge no co-payment?
Numeric response Blank = Global code frame supplied
1, 2
WLBPNA Not applicable 1 = Response marked 2 0 = Response blank WLAH Do you do an after hours or on-call
yourself? 1 = Yes 0 = No Blank = Global code frame supplied
All
In your last usual week at work: WLRH (*_gp, *_sp, *_hdoc, *_sit)
How many hours were you rostered or listed for after hours and on-call?
Numeric response Blank = Global code frame supplied
All Top-codes: 100+ for GPs and specialists; 80+ for Specialists-in-training and Hospital non-specialists
WLPCH (*_gp, *_sp, *_hdoc, *_sit)
How many of these hours were actually spent in direct patient care?
Numeric response Blank = Global code frame supplied
All Top-codes: 50+ for GPs; 75+ for Specialists; 50+ for Hospital non-specialists; 60+ for Specialists-in-training
WLCOT How many times were you actually
called out? Numeric response Blank = Global code frame supplied
All Top-code: 10+ for all doctor types
In your most recent usual month, what was your on-call ratio? WLOCR On-call ratio 1 in Numeric response
Blank = Global code frame supplied All Continuous from 0-10; then intervals 11-12,
13-14, 15+ WLOO Opportunities for continuing medical
education and professional development are
0 = Very limited 1 = Average 2 = Very good Blank = Global code frame supplied
2

40
Variable Variable description Categories Availability across doctor types
Notes (top-coding, imputations)
WLAL Arranging a locum at short notice is usually
0 = Moderately easy 1 = Rather difficult 2 = Very difficult 3 = Not applicable Blank = Global code frame supplied
1, 2
Turning to time spent away from work: WLWHPY (*_gp, *_sp, *_hdoc, *_sit)
How many weeks holiday did you take in the past year?
Numeric response Blank = Global code frame supplied
All Top-codes: 20+ for GPs and Specialists; 15+ for Hospital non-specialists; 8+ for Specialists-in-training
WLMLPY How many weeks of parental or
maternity leave did you take in the past year?
Numeric response Blank = Global code frame supplied
All Top-code: 26+ for all doctor types
WLSDPY Approximately how many days off work
due to illness did you have in the past year?
Numeric response Blank = Global code frame supplied
All Continuous from 1-7, then intervals 8-9, 10-11, 12-13, 14+
WLOTPY Approximately how many days off work
did you have for other reasons in the past year?
Numeric response Blank = Global code frame supplied
All Continuous from 1-7, then intervals 8-9, 10-11, 12-13, 14+
WLHTH In general, would you say that your health is:
0 = Excellent 1 = Very good 2 = Good 3 = Fair 4 = Poor Blank = Global code frame supplied
All
SECTION E - ABOUT YOUR FINANCES
What are your (approximate) TOTAL personal earnings from ALL of the work you do as a doctor?

41
Variable Variable description Categories Availability across doctor types
Notes (top-coding, imputations)
FIGEY (*_gp, *_sp, *_sit, *_hdoc)
Gross earnings in $ (Before Tax) - ANNUAL
Numeric response Blank = Global code frame supplied
All The weighted mean was substituted for all the cases which are equal to or larger than the threshold. These thresholds/top-code values apply: 720,000 / 862,866 for GPs; 1,800,000 / 2,018,700 for Specialists; 320,000 / 375,875 for Hospital non- specialists; 250,000 / 365,127 for Specialists-in-training
FINEY (*_gp, *_sp, *_sit, *_hdoc)
Net earnings in $ (After Tax) - ANNUAL
Numeric response Blank = Global code frame supplied
The weighted mean was substituted for all the cases which are equal to or larger than the threshold. These thresholds/top-code values apply: 377,000 / 410,431 for GPs; 1,000,000 / 1,149,794 for specialists; 180,000 / 262,180 for Hospital non-specialists; 156,000 / 226,417 for Specialists-in-training;
FIB In addition to this, did you receive any
ongoing 'in kind' benefits or subsidies as part of your current job/s?
1 = Yes 0 = No Blank = Global code frame supplied
All
FIBV What is the approximate annual total value in dollars of these benefits?
Numeric response Blank = Global code frame supplied
All
FIDME
Medical education financial debt in $
Numeric response Blank = Global code frame supplied
All
FIMEDK Don’t know 1 = Response marked
0 = Response blank All
FIDP Financial debt from owning practice/premises in $
Numeric response Blank = Global code frame supplied
1, 2

42
Variable Variable description Categories Availability across doctor types
Notes (top-coding, imputations)
What is the total level of financial debt that you currently have as a result of your medical education and training? FIDPDK Don’t know 1 = Response marked
0 = Response blank 1, 2
FIDPNA Not Applicable 1 = Response marked
0 = Response blank 1, 2
FIPS What is the status of your private practice for tax purposes?
0 = Sole trader 1 = Partnership 2 = Company 3 = Trust 4 = Don’t know 5 = Not applicable Blank = Global code frame supplied
1, 2
FIOTI Do you have other sources of personal income apart from your medical work?
1 = Yes 0 = No Blank = Global code frame supplied
1, 2
In the last year, approximately what percentage of your total gross earnings did you receive from each of the following sources FISPM Payments from patients for services
covered by Medicare Numeric response Blank = Global code frame supplied
1, 2
FISNPM Payments from patients for services
not covered by Medicare Numeric response Blank = Global code frame supplied
1, 2
FISGI Government incentive schemes and
grants Numeric response Blank = Global code frame supplied
1, 2
FISHW Hospital work Numeric response
Blank = Global code frame supplied 1, 2

43
Variable Variable description Categories Availability across doctor types
Notes (top-coding, imputations)
FISOTH Other sources - Percentage Numeric response Blank = Global code frame supplied
1, 2
FICS Do you (or your employer) regularly contribute to a superannuation scheme?
1 = Yes 0 = No Blank = Global code frame supplied
All
FICSYR For how many years have you (and/or an employer on your behalf) contributed to a superannuation scheme?
Numeric response Blank = Global code frame supplied
All
FIEFR Please indicate the degree to which you agree with the following statement: "Given my current financial situation and prospects, I believe I will have enough to live on when I retire".
0 = Strongly Agree 1 = Agree 2 = Neutral 3 = Disagree 4 = Strongly Disagree Blank = Global code frame supplied
All
FIIP How much (in dollars) did you pay for professional medical liability, or malpractice, insurance premiums in the last year?
Numeric response Blank = Global code frame supplied
All
FIOS Do you have other sources of personal income apart from your medical work?
1 = Yes 0 = No Blank = Global code frame supplied
3, 4
What is your total gross and net HOUSEHOLD income?
FIGHIY (*_gp, *_sp, *_sit, *_hdoc)
Gross household income (before tax) - ANNUAL
Numeric response Blank = Global code frame supplied
All The weighted mean was substituted for all the cases which are equal to or larger than the threshold. These thresholds/top-code values apply: 1,100,000 / 1,873,355 for GPs; 2,450,000 / 3,977,989 for specialists; 425,000 / 599,557 for Hospital non-specialists; 500,000 / 737,180 for Specialists-in-training;

44
Variable Variable description Categories Availability across doctor types
Notes (top-coding, imputations)
FINHIY (*_gp, *_sp, *_sit, *_hdoc)
Net household income (after tax) - ANNUAL
Numeric response Blank = Global code frame supplied
All The weighted mean was substituted for all the cases which are equal to or larger than the threshold. These thresholds/top-code values apply: 500,000 / 557,268 for GPs; 1,100,000 / 1,307,035 for specialists; 260,000 / 327,612 for Hospital non-specialists; 230,000 / 361,516 for Specialists-in-training;
SECTION F - ABOUT YOUR GEOGRAPHIC LOCATION
GLNL (*_gp, *_sp) In how many locations do you practise? Numeric response Blank = Global code frame supplied
1, 2 Top-codes: 5+ for GPs; 8+ for specialists
Where is your main place of work? GLTWWASGC ASGC classification of main place of
work (based on postcode) 1 = Major City 2 = Inner Regional 3 = Outer Regional Blank = Global code frame supplied
1 This variable has been withheld for all doctor types but GPs. All main places of work classified as “remote” or “very remote” have been recoded and are included in the “outer regional” group.
How long have you been practising in or close to this geographic location?
GLMTH No. of months (if less than one year) Numeric response
Blank = Global code frame supplied All
GLYR No. of years Numeric response
Blank = Global code frame supplied All
Where do you live? GLTWLASGC ASGC classification of place where
respondent lives (based on postcode) 1 = Major City 2 = Inner Regional 3 = Outer Regional Blank = Global code frame supplied
1 This variable has been withheld for all doctor types but GPs. All locations classified as “remote” or “very remote” have been recoded and are included in the “outer regional” group.

45
Variable Variable description Categories Availability across doctor types
Notes (top-coding, imputations)
GLOSI The opportunities for social interaction for you and your family in the geographic location of your main job are
0 = Very limited 1 = Average 2 = Very good Blank = Global code frame supplied
1, 2
Please indicate the degree to which you agree or disagree with the following statements GLFIW I don’t have many friends or family
members in my current work location
GLBL It is easy to pursue my hobbies and leisure interests in my current work location
GLPFIW My partner does not have many friends
or family members in this work location
GLGEO There are good employment opportunities for my partner in this work location
GLACSC The choice of schools for our children is adequate in this work location
0 = Strongly Agree 1 = Agree 2 = Neutral 3 = Disagree 4 = Strongly Disagree 5 = Not applicable Blank = Global code frame supplied
All
GLYRRS For how many years did you live in a
rural area up until school leaving age? Numeric response Blank = Global code frame supplied
All Top-code: 18+ for all doctor types
GLRRI Derived - have you ever lived in a rural area up until school leaving age?
1 = Yes 0 = No Blank = Global code frame supplied
All This has been derived from the original questions about the rural state and town where the respondent lived up until school leaving age
Please indicate the reason/s for these restrictions GLRLPV I hold a Permanent Resident Visa All
1 = Response marked 0 = Response blank

46
Variable Variable description Categories Availability across doctor types
Notes (top-coding, imputations)
GLRLTV I hold a Temporary Resident Visa All GLRLRS I am undertaking a return of service
period for a Medical Rural Bonded Scholarship or Bonded Medical Place
All
GLRLRP I am undertaking a compulsory rural
placement as part of my training 1, 3, 4
GLRLOT Other All GLRLNA Not Applicable All
1 = Response marked 0 = Response blank
GLTPS Do you travel to provide services /
clinics in other geographical areas? 1 = Yes 0 = No Blank = Global code frame supplied
2
SECTION G – PERSONAL INFORMATION
PIGENI Imputed gender 1 = Female 0 = Male Blank = Global code frame supplied
All
PICMDI In what year did you complete your basic medical degree?
1 = pre-1950 2 = 1950-1954 3 = 1955-1959 4 = 1960-1964 5 = 1965-1969 6 = 1970-1974 7 = 1975-1979 8 = 1980-1984 9 = 1985-1989 10 = 1990-1994 11 = 1995-1999 12 = 2000-2004 13 = 2005-2009 Blank = Global code frame supplied
All Regrouped variable.

47
Variable Variable description Categories Availability across doctor types
Notes (top-coding, imputations)
In which country did you complete your basic medical degree? PICMDA A medical school in Australia 1 = Response marked All 0 = Response blank PICMDOI A medical school in the country
specified 1 = Africa 2 = Asia 3 = Europe_non UK 4 = North America 5 = Oceania 6 = Others 7 = South America 8 = UK Blank = Global code frame supplied
All
PICAMC If you did your degree at a medical school outside Australia, have you completed the AMC Certificate examination?
1 = Yes 0 = No 2 = Not applicable Blank = Global code frame supplied
All
PISTEG Main specialty group (recode of PISTEI)
1 = Internal 2 = Pathology 3 = Surgery 4 = other Blank = Global code frame supplied
4
PISTEI Which specialty training program are you enrolled in?
0 = paediatrics and child health 1 = psychiatry 2 = internal medicine (adult medicine) 3 = emergency medicine 4 = obstetrics and gynaecology 5 = radiology 6 = surgery 7 = anaesthesia 8 = pathology 9 = Surgery - Others 10 = Other specialties Blank = Global code frame supplied
4 This variable has been recoded. Any individual specialty with less than 20 observations has been subsumed in one of the “(specialty) - Others” groups.
What specialist postgraduate qualifications have you obtained in Australia? PIPQR None: I am currently a GP registrar 1 = Response marked 1 0 = Response blank

48
Variable Variable description Categories Availability across doctor types
Notes (top-coding, imputations)
PIPQNO None: I have qualifications from
overseas which are recognised in Australia
1 = Response marked 0 = Response blan
1
POSTGRAD1-5 0 = None
1 = Postgraduate Certificates / Diplomas 2 = Membership, Fellow-in-Training 3 = Masters / PHD 4 = Fellowship of Colleges 5 = Others Blank = Global code frame supplied
1 Imputed variable.
FRACGP Imputed: Does GP have postgraduate
qualification FRACGP? 1 = Yes 0 = No Blank = Global code frame supplied
1 Imputed variable.
FACRRM Imputed: Does GP have postgraduate
qualification FACRRM? 1 = Yes 0 = No Blank = Global code frame supplied
1 Imputed variable.
FWSHPOTH Imputed: Does GP have postgraduate
fellowship other than FRACGP and FACRRM?
1 = Yes 0 = No Blank = Global code frame supplied
1 Imputed variable.
PIPQNA Not Applicable 1 = Response marked 1 0 = Response blank PIMSPG Group - what is the main specialty in
which you practice? (recode of PIMSPI)
1 = Internal 2 = Pathology 3 = Surgery 4 = other Blank = Global code frame supplied
2

49
Variable Variable description Categories Availability across doctor types
Notes (top-coding, imputations)
PIMSPI Main specialty in which you practise 0 = Cardiology 1 = Clinical haematology 2 = Clinical immunology (including allergy) 3 = Endocrinology 4 = Gastroenterology 5 = General medicine 6 = Geriatrics 7 = Infectious diseases 8 = Intensive care - internal medicine 9 = Medical oncology 10 = Neurology 11 = Nuclear medicine 12 = Paediatric medicine 13 = Renal medicine 14 = Rheumatology 15 = Thoracic medicine 16 = Anatomical pathology 17 = General surgery 18 = Orthopaedic surgery 19 = Otolatyngology 20 = Plastic / reconstructive surgery 21 = Urology 22 = Neurosurgery 23 = Vascular surgery 24 = Anaesthesia (excluding intensive c 25 = Dermatology 26 = Diagnostic radiology (including ul 27 = Emergency medicine 28 = Intensive care - anaesthesia 29 = Obstetrics and gynaecology (including gynaecological oncology) 30 = Occupational medicine 31 = Ophthalmology 32 = Psychiatry 33 = Radiation oncology 34 = Rehabilitation medicine 35 = Other specialty - not specified ab 36 = Palliative Medicine 37 = Internal Med - Others 38 = Pathology - others 39 = Surgery - Others 40 = Other specialties
2 This variable has been recoded. Any individual specialty with less than 20 observations has been subsumed in one of the “(specialty) - Others” groups.

50
Variable Variable description Categories Availability across doctor types
Notes (top-coding, imputations)
Blank = Global code frame supplied PISESPG Group - what is the second specialty in
which you practice? (recode of PISESP)
1 = Internal 2 = Pathology 3 = Surgery 4 = Other Blank = Global code frame supplied
2
PISESP Second specialty in which you practise 0 = Cardiology 1 = Clinical genetics 2 = Clinical haematology 3 = Clinical immunology (including allergy) 4 = Clinical pharmacology 5 = Endocrinology 6 = Gastroenterology 7 = General medicine 8 = Geriatrics 9 = Infectious diseases 10 = Intensive care - internal medicine 11 = Medical oncology 12 = Neurology 13 = Nuclear medicine 14 = Paediatric medicine 15 = Renal medicine 16 = Rheumatology 17 = Thoracic medicine 18 = General pathology 19 = Anatomical pathology 20 = Clinical chemistry 21 = Cytopathology 22 = Forensic pathology 23 = Haematology 24 = Immunology 25 = Microbiology 28 = General surgery 28 = Cardiothoracic surgery 28 = Orthopaedic surgery 29 = Otolatyngology 30 = Paediatric surgery 31 = Plastic / reconstructive surgery 32 = Urology 33 = Neurosurgery 34 = Vascular surgery
2

51
Variable Variable description Categories Availability across doctor types
Notes (top-coding, imputations)
35 = Anaesthesia (excluding intensive care) 36 = Dermatology 37 = Diagnostic radiology (including ultrasound) 38 = Emergency medicine 39 = Intensive care - anaesthesia 40 = Medical administration 41 = Obstetrics and gynaecology (including gynaecological oncology) 42 = Occupational medicine 43 = Ophthalmology 44 = Psychiatry 45 = Public health medicine 47 = Radiation oncology 47 = Rehabilitation medicine 48 = Other specialty - Not specified above Blank = Global code frame supplied
PIRSYR In what year did you start this training program?
Numeric response Blank = Global code frame supplied
1, 4
PIREYR In what year do you expect to complete the program and become a Fellow?
1, 4
Numeric response Blank = Global code frame supplied
PIRNA Not Applicable 1 = Response marked
0 = Response blank 1
Since you graduated, how many years and/or months have you spent NOT practising as a doctor? PINDYR Years Top-code: 8+ years for all doctor types
PINDMT Months
Numeric response Blank = Global code frame supplied
All
PIRS What is your residency status? 0 = Australian citizen
1 = Permanent resident 2 = Temporary resident Blank = Global code frame supplied
All

52
Variable Variable description Categories Availability across doctor types
Notes (top-coding, imputations)
PIMR Do you have full, conditional or other type of medical registration?
0 = Full (unconditional) medical registration 1 = Conditional medical registration 2 = Other (please specify) Blank = Global code frame supplied
All
AGEI Age – imputed 1 = under 35 2 = 35–39 3 = 40–44 4 = 45–49 5 = 50–54 6 = 55–59 7 = 60–64 8 = 65–69 9 = 70+ Numeric response Blank = Global code frame supplied
All This variable was imputed from year of birth and then recoded. One group for “under 35”, from then on 5-year age bands. Top-coded at 70+.
SECTION H - FAMILY CIRCUMSTANCES
FCLP Are you currently living with a partner or spouse?
1 = Yes 0 = No Blank = Global code frame supplied
All
FCPES What is the employment status of your partner/spouse?
0 =- Not in the labour force 1 = Currently seeking work 2 = Full time employment 3 = Part time employment 4 = Not applicable Blank = Global code frame supplied
All
FCNDC How many dependent children do you have?
Numeric response Blank = Global code frame supplied
All Top-code: 3+ for all doctor types
What is the age in years of your youngest dependent child?
FCAY Age Numeric response Blank = Global code frame supplied
All

53
Variable Variable description Categories Availability across doctor types
Notes (top-coding, imputations)
FCAYNA Not Applicable 1 = Response marked 0 = Response blank
Which of the following forms of childcare are you using for your children of pre-school age? FCCCRF Relatives or friends FCCCN Nannies FCCCCW Childcare at work FCCCDC Other day care FCCCNA Not Applicable
1 = Response marked 0 = Response blank
All
WEIGHT Sampling weight Numeric response All

4. References Australian Bureau of Statistics (2001) Australian Standard Geographical Classification (ASGC). Australian Bureau of Statistics, Canberra. Australian Bureau of Statistics (2003). ASGC remoteness classification: purpose and use. Australian Bureau of Statistics, Canberra. Census Paper No. 03/01. Available at: http://www.abs.gov.au/websitedbs/D3110122.NSF/0/f9c96fb635cce780ca256d420005dc02?OpenDocument. Accessed: July 2009. Australian Institute of Health and Welfare (2008). Medical labour force 2006. Canberra: AIHW. AIHW Cat No. HWL 42. Available at: http://www.aihw.gov.au/publications/index.cfm/title/10620. Accessed: September 2009. Deaton, A. (1997) The Analysis of Household Surveys. The World Bank, Washington D.C. Dillman, D. A. (2007). Mail and internet surveys; the tailored design method. New York, John Wiley. Edwards, P., Roberts, I., Clarke, M., DiGuiseppi, C., Pratap, S., Wentz, R., Kwan, I. (2002). 'Increasing response rates to postal questionnaires: systematic review.' in British Medical Journal 324: 1183-1192.
Groves, R.M., Peytcheva, E. (2008). ‘The impact of nonresponse rates on nonresponse bias: A meta-analysis’, in Public Opinion Quarterly. 72(2): 167-189. Joyce, C.M., Scott, A., Jeon, S-H., Humphreys, J., Kalb, G., Witt, J., Anne Leahy (2010). “The “Medicine in Australia: Balancing Employment and Life (MABEL)” longitudinal survey – Protocol and baseline data for a prospective cohort study of Australian doctors’ workforce participation”. BMC Health Services Research 2010 10:50. Little R.J., Vartivarian S. (2003) ‘On weighting the rates in non-response weights.’ in Statistics in Medicine 22:1589-1599.
Lynn P. ‘The problem of nonresponse’, in International handbook of survey methodology, E.D. de Leeuw, J.J. Hox, and D.A. Dillman, Editors (2008). Lawrence Erlbaum Associates: New York. p. 35-55. Scott, A. (2001). 'Eliciting GPs’ preferences for pecuniary and non-pecuniary job characteristics.' in Journal of Health Economics 20: 329-347. Scott, A. (2002). 'Identifying and analysing dominant preferences in discrete choice experiments: an application in health care.' in Journal of Economic Psychology 23: 383-398. Ubach C, Scott A, French F, Awramenko M, Needham G. (2003). 'What do hospital consultants value about their jobs? A discrete choice experiment.' in British Medical Journal 326: 1432. Van Ham I, Verhoeven A, Groenier K, Groothoff JW, De Haan J. (2006). 'Job satisfaction among general practitioners: A systematic literature review.' in European Journal of General Practice. 12: 174-180. Warr P, Cook J, Wall T. (1979). 'Scales for the measurement of some work attitudes and aspects of psychological well-being.' in Journal of Occupational Psychology 52: 129-148. Wordsworth S, Skatun D, Scott A, French F. (2004). 'Preferences for general practice jobs: a survey of principals and non-principals.' in British Journal of General Practice 54: 740-746.

55
APPENDIX 1A: Alphabetical listing of variables The following table provides an alphabetical listing of all variables in the data set, followed by the page number on
which details for this variable appear in this manual:
AGEI, 52
FACRRM, 48
FCAY, 52
FCAYNA, 53
FCCCCW, 53
FCCCDC, 53
FCCCN, 53
FCCCNA, 53
FCCCRF, 53
FCLP, 52
FCNDC, 52
FCPES, 52
FIB, 41
FIBV, 41
FICS, 43
FICSYR, 43
FIDME, 41
FIDP, 41
FIDPDK, 42
FIDPNA, 42
FIEFR, 43
FIGEY, 41
FIGHIY, 43
FIIP, 43
FIMEDK, 41
FINEY, 41
FINHIY, 44
FIOS, 43
FIOTI, 42
FIPS, 42
FISGI, 42
FISHW, 42
FISNPM, 42
FISOTH, 43
FISPM, 42
FRACGP, 48
FWSHPOTH, 48
GLACSC, 45
GLBL, 45
GLFIW, 45
GLGEO, 45
GLMTH, 44
GLNL, 44
GLOSI, 45
GLPFIW, 45
GLRLNA, 46
GLRLOT, 46
GLRLPV, 45
GLRLRP, 46
GLRLRS, 46
GLRLTV, 46
GLRRI, 45
GLTPS, 46
GLTWLASGC, 44
GLTWWASGC, 44
GLYR, 44
GLYRRS, 45
JSAS, 32
JSAU, 30
JSBC, 31
JSBSDK, 32
JSBSYR, 32
JSCH, 31
JSCP, 31
JSCW, 30
JSFL, 30
JSFM, 30
JSHW, 30
JSIT, 31
JSLM, 33
JSLP, 33
JSMENA, 32
JSMLE, 32
JSPE, 31
JSPS, 31
JSPT, 31
JSPU, 31
JSPW, 30
JSQS, 31
JSRC, 30
JSRP, 30
JSSCI, 32
JSSN, 31
JSST, 31
JSTO, 31
JSUH, 31
JSVA, 30
JSWR, 30
ONLINE, 30
PICAMC, 47
PICMDA, 47
PICMDI, 46
PICMDOI, 47
PIGENI, 46
PIMR, 52
PIMSPG, 48
PIMSPI, 49
PINDMT, 51
PINDYR, 51
PIPQNA, 48
PIPQNO, 48
PIPQR, 47
PIREYR, 51
PIRNA, 51
PIRS, 51
PIRSYR, 51
PISESP, 50
PISESPG, 50
PISTEG, 47
PISTEI, 47
POSTGRAD*, 48
PWBR, 35
PWCHH, 33
PWCL, 35
PWDSH, 33
PWEIH, 33
PWHFH, 33
PWHLH, 36
PWMHPASGC, 36
PWNWAD, 35
PWNWAP, 35
PWNWFF, 34
PWNWFP, 34
PWNWMF, 34
PWNWMP, 34
PWNWN, 34
PWNWO, 35
PWOCE, 35
PWOTHH, 34
PWPIHH, 33
PWPIP, 34
PWPISH, 33
PWPM, 36
PWPUHH, 33
PWSMTH, 35
PWSP, 36
PWSYR, 35
PWTOH, 34
PWTOHI, 34
PWWH, 35
PWWMTH, 36
PWWYR, 36
SDTYPE, 30
WEIGHT, 53
WLAH, 39
WLAL, 40
WLBBP, 39
WLBPNA, 39
WLCFI, 38
WLCFNA, 39
WLCMIN, 38
WLCNA, 38
WLCOT, 39
WLDPH, 37
WLEH, 37
WLHTH, 40
WLIDPH, 37
WLMH, 37
WLMLPY, 40
WLNA, 38
WLNP, 37
WLNPH, 37
WLNPPC, 37
WLNT, 38
WLOCR, 39
WLOO, 39
WLOTHH, 37
WLOTPY, 40
WLPCH, 39
WLPGP, 37
WLPOTH, 38
WLPS, 37
WLRH, 39
WLSDPY, 40
WLWD, 38
WLWH, 37
WLWHI, 36
WLWHPY, 40
WLWOD, 38
WLWW, 38
WLWY, 38
XWAVEID, 30

56
APPENDIX 2A: Previous doctor surveys
Australian Doctor Surveys Australia and New Zealand College of Anaesthesists Workforce Survey
AMWAC Medical Careers Survey
Royal Australian College of Surgeons Workforce Questionnaire
Developing and Evaluating Viable Organizational and Economic Models of Rural General Practice (Monash
University)
HILDA
Australian Doctor Survey
AIHW Medical Labour Force Survey
The Medical School Outcomes Database
The Monash Medical Graduates Survey
Queensland Doctors E-cohort Baseline Survey
ABS Medical Business Survey 2001-02
AMA Survey of GPs
Rural Doctors Association of Australian GPs survey
ABS Medical Practitioners Survey
North American Doctor Surveys AMA study of the practice patterns of young physicians (US)
National Physician Survey (Canada)
National Survey of Rural Physicians (US)
UK Surveys Choosing somewhere to work survey (University of Aberdeen)
Towards a flexible basis workforce – a basis for change? (University of Aberdeen)
UK Medical Careers Research Group (University of Oxford)
Copyright © 2022 FDOKUMEN