
News Release
43
News Release 1 Teranga Gold Outperforms 2015 Cost Guidance Production shortfall deferred to 2016 Replaces reserves and significantly improves life of mine cash flows (All amounts are in U.S. dollars unless otherwise stated) Toronto, Ontario: January 28, 2016 - Teranga Gold Corporation ("Teranga" or the "Company") (TSX:TGZ) (ASX:TGZ) is pleased to report its fourth quarter and year-end 2015 operating results for ASX purposes. “Underlying the achievement of record low unit costs in 2015 is our ongoing business improvement program, which we plan to continue in 2016 and beyond,” stated Richard Young, President & Chief Executive Officer of Teranga. “Additional artisanal activity at Gora and unforeseen factors at Masato underlie our shortfall in 2015 production, although the majority of this production will be carried over into 2016.” Mr. Young also stated, “We enter 2016 with a significantly improved life of mine plan that reflects the replacement of reserves and improved free cash flow. Together with the strength of our balance sheet, we are well positioned for the future and to maximize long-term sustainable free cash flows." 2015 Highlights • Improved liquidity – Cash balance increased by $8.6 million to $44.4 million – Completed a $17.5 million private placement with new cornerstone investor – Improved liquidity with a $30.0 million Revolver Credit Facility, of which $15.0 million has been drawn down • Met or beat 2015 cost guidance – Delivered total cost savings $20+ million, or $100+ per ounce – Achieved record low unit mining and processing costs • Below 2015 production guidance – Majority of shortfall of 43,600 ounces originally planned for production in 2015 have been deferred into 2016 – Highlighted as a potential risk in the third quarter, 2015 production was negatively impacted by 13,500 ounces due to the additional impact of artisanal activity at Gora, the only deposit in the Company’s life of mine plan with artisanal mining risk – A localized rock fall at Masato in December resulted in a deferral of approximately 4,500 ounces to 2016 – During the third quarter, production was negatively impacted by material handling issues at Masato (13,000 recovered ounces) and changes to the Gora mine plan to defer three benches into 2016 (15,000 recovered ounces) • Replaced proven and probable reserves and improved life of mine plan free cash flows – Added high grade mill feed through the conversion of high grade underground resources to reserves – Removed lower margin ounces to maximize long-term sustainable free cash flow – Reduced life of mine all-in sustaining costs to approximately $900 per ounce over the 13.5 year mine life (more than $200 per ounce lower than the all-in sustaining costs in the previous life of mine plan from 2016 onwards) – From the Company’s 2.6 million ounce reserve base, production is expected to average approximately 200,000 ounces per year for nine years and 120,000 ounces per year for the remaining four and a half years of the improved life of mine plan before factoring in new exploration results or other growth options
-
Upload
khangminh22 -
Category
Documents
-
view
5 -
download
0
Transcript of News Release
News Release
1
Teranga Gold Outperforms 2015 Cost Guidance Production shortfall deferred to 2016
Replaces reserves and significantly improves life of mine cash flows
(All amounts are in U.S. dollars unless otherwise stated)
Toronto, Ontario: January 28, 2016 - Teranga Gold Corporation ("Teranga" or the "Company") (TSX:TGZ) (ASX:TGZ) is pleased to report its fourth quarter and year-end 2015 operating results for ASX purposes.
“Underlying the achievement of record low unit costs in 2015 is our ongoing business improvement program, which we plan to continue in 2016 and beyond,” stated Richard Young, President & Chief Executive Officer of Teranga. “Additional artisanal activity at Gora and unforeseen factors at Masato underlie our shortfall in 2015 production, although the majority of this production will be carried over into 2016.”
Mr. Young also stated, “We enter 2016 with a significantly improved life of mine plan that reflects the replacement of reserves and improved free cash flow. Together with the strength of our balance sheet, we are well positioned for the future and to maximize long-term sustainable free cash flows."
2015 Highlights
• Improved liquidity
– Cash balance increased by $8.6 million to $44.4 million
– Completed a $17.5 million private placement with new cornerstone investor
– Improved liquidity with a $30.0 million Revolver Credit Facility, of which $15.0 million has been drawn down
• Met or beat 2015 cost guidance
– Delivered total cost savings $20+ million, or $100+ per ounce
– Achieved record low unit mining and processing costs
• Below 2015 production guidance
– Majority of shortfall of 43,600 ounces originally planned for production in 2015 have been deferred into 2016
– Highlighted as a potential risk in the third quarter, 2015 production was negatively impacted by 13,500 ounces due to the additional impact of artisanal activity at Gora, the only deposit in the Company’s life of mine plan with artisanal mining risk
– A localized rock fall at Masato in December resulted in a deferral of approximately 4,500 ounces to 2016
– During the third quarter, production was negatively impacted by material handling issues at Masato (13,000 recovered ounces) and changes to the Gora mine plan to defer three benches into 2016 (15,000 recovered ounces)
• Replaced proven and probable reserves and improved life of mine plan free cash flows
– Added high grade mill feed through the conversion of high grade underground resources to reserves
– Removed lower margin ounces to maximize long-term sustainable free cash flow
– Reduced life of mine all-in sustaining costs to approximately $900 per ounce over the 13.5 year mine life (more than $200 per ounce lower than the all-in sustaining costs in the previous life of mine plan from 2016 onwards)
– From the Company’s 2.6 million ounce reserve base, production is expected to average approximately 200,000 ounces per year for nine years and 120,000 ounces per year for the remaining four and a half years of the improved life of mine plan before factoring in new exploration results or other growth options
2
• Advanced high-return organic growth initiatives
– Mill optimization project, which remains on track for completion in fourth quarter 2016, is expected to increase throughput by more than 10 percent and lower costs on an annualized basis
– Completed an optimised pre-feasibility engineering study for heap leaching low grade oxide ore, which concludes the technical viability for processing Teranga’s low-grade oxide and transitional ore
– Continued to advance mine licence and regional exploration programs with some encouraging results as outlined in the Reserves and Resources section of this report.
Significant exploration work was completed on the ML during the 4th quarter, with encouraging DDH intercepts near surface on several additional prospects
Encouraging results were found near surface on the KA prospect from DDH intercepts following up on surface anomalies and trench results
• Industry-leading health and safety record continues with 2.4 years without a lost time incident
2016 Outlook
• The Company’s outlook for 2016 is as follows:
– Production: 200,000 to 215,000 ounces1
– All-in sustaining costs (including all new project development costs): $900 to $975 per ounce2
• In addition to sourcing ore from Masato, Gora and existing stockpiles, 2016 production will also be derived from Golouma (new deposit). The current phase of Masato will be completed in the first quarter of 2016, with Golouma production commencing in the first quarter of 2016. Kerekounda waste stripping is scheduled to commence in the third quarter of 2016.
• The Company’s 2016 production guidance reflects the build-up of higher grade stockpiles of approximately 40,000 ounces, which will assist in mitigating operating challenges in the future.
OPERATIONAL OVERVIEW Sabodala Gold Operation
Fourth Quarter 2015
• Gold production for the fourth quarter was 51,292 ounces, representing a decrease of 28 percent versus the prior year period, and was below the Company’s full-year guidance by 18,000 ounces, or 9 percent. The fourth quarter production shortfall was attributable to (i) 13,500 ounces of additional artisanal activity at Gora; and (ii) 4,500 ounces related to a localized rock fall in December, which delayed access into Masato.
• For the fourth quarter, total cash costs rose to $668 per ounce2, or by 12 percent compared to the prior year period (excluding the reversal of non-cash inventory write-downs to Net Realizable Value (“NRV”)) as a result of lower gold production partly offset by lower mine site production costs.
• All-in sustaining costs per ounce for the fourth quarter were $969, or 36 percent higher than the prior year period (excluding the reversal of non-cash inventory write-downs to NRV) due to an increase in total cash costs and total capital expenditures related to the mill optimization project. All-in sustaining costs for the fourth quarter include approximately $145 per ounce of development capital expenditures, compared to approximately $6 per ounce in the prior year period.
1 This production guidance is based on existing proven and probable reserves only from the Sabodala mining license as disclosed in Appendix 2 on page 20 of this Report. The estimated ore reserves underpinning this production guidance have been prepared by a competent person in accordance with the requirements of the 2012 Australasian Code for Reporting of Exploration Results, Mineral Resources and Ore Reserves (the “2012 JORC Code”). Please refer to the Competent Persons Statement on page 15-16 of this Report. 2 Total cash costs and all-in sustaining costs per ounce of gold sold are a non-IFRS measures which do not have a standard meanings under IFRS. Please refer to Non-IFRS Financial Performance Measures at the end of this Report
3
Mining
• Mining activities in the fourth quarter were focused on completing the first two phases of Masato, as well as the upper benches of Gora. In the prior year period, mining was mainly focused on mining the upper benches of Masato and the lower benches of Sabodala Phase 3.
• Fourth quarter ore tonnes mined of 1.9 million tonnes and ore grades mined of 1.37 grams per tonne were 30 percent and 7 per cent lower, respectively, than the prior year period and 24 percent and 8 percent lower, respectively, than fourth quarter plan due to the following:
i. More artisanal voids than expected at Gora: Artisanal miners removed an additional 8,600 contained ounces in Phase 1 (approximately 32,000 tonnes at an estimated 8.25 grams per tonne), representing significantly more in this area than the total 12,000 ounces which the company had already estimated to have been removed from Phase 1 reserves. Overall, artisanal miners removed about 60 percent of the ounces to a depth of 45 metres from surface. By the end of December, mining activities had progressed below the artisanal workings in Phase 1 at Gora with ore tonnes and grades reconciling well to the reserve model. Accordingly, the Company does not expect any additional impact from artisanal mining in Phase 1. Appropriate adjustments have been made to Phase 2 and 3 to account for additional artisanal activities. Lower mining rates in areas of the artisanal workings caused a delay in accessing the final bench in the fourth quarter plan, resulting in the deferral of approximately 35,000 ore tonnes at over 6 grams per tonne (approximately 6,700 contained ounces) into 2016 where mining was completed on January 8th.
ii. Localized rock fall at Masato: Due to the proximity of the localized rock fall at the interface between oxide and fresh material near the Masato phase 1 access ramp, activity in this pit was limited during most of December while the area stabilized and remediation work was completed, delaying access to a high grade area. As a result, approximately 120,000 ore tonnes of high grade mill feed (approximately 9,300 contained ounces) were deferred. The balance of phase 1 is expected to be mined early in the first quarter 2016. Since mining commenced at Masato in September 2014, higher grade ounces mined are about 2,000 ounces higher than the reserve model with more ore tonnes partially offset by lower ore grades. Including lower grade ore, mining at Masato is about 4,000 ounces ahead of the reserve model at marginally better grade.
Processing
• For the three months, ore tonnes milled were 0.9 million tonnes, or 9 percent lower than the prior year period, which was a record quarter for the Company in terms of total tonnes milled. The rainy season continued to cause material handling issues with the material from Masato, impacting October’s throughput rates by approximately 25 percent. By the beginning of November throughput rates had returned to quarterly name-plate capacity of approximately one million tonnes.
• Head grade for the three months was 1.86 grams per tonne, or 24 percent lower than the prior year period, mainly due to the delays in accessing high grade areas of both the Gora and Masato pits. In addition, 93,000 ore tonnes of 2.7 grams per tonne material (approximately 8,000 contained ounces) mined in late December were stockpiled and processed in 2016. As a result of the access delays and high grade stockpiles that were not processed, mill feed for the quarter included a significantly greater proportion of low-grade material. In the prior year period, head grade was higher due to mill feed sourced from the upper benches of Masato, which contained higher ore grades, and the lower benches of Sabodala phase 3.
Costs
• The Company is focused on expanding cash margins by improving productivity and reducing operating costs. Both the mine and mill areas continue to make significant strides in lowering unit operating costs.
• Total mining costs for the three months were $20.4 million, or 10 percent lower than the prior year period. The improvement was mainly due to a decline in fuel consumption related to less material movement, favourable currency variance, and lower emulsion prices offset by the impact of poor ground conditions at Masato, which negatively impacted drill and haul productivity, and costs related to remediation of the localized rock fall in December. On a unit basis, mining costs for the three months were 10 percent higher than the prior year mainly due to less material movement.
4
• Total processing costs for the quarter decreased to $12.2 million, 13 percent lower than the prior year period due to cost savings associated with a reduction of power, grinding and reagent consumption together with favourable variances for fuel, reagent and currency. Accordingly, unit processing costs for the fourth quarter were 5 percent better than the prior year period.
• Total mine site general and administrative costs for the fourth quarter were $4.6 million, an increase of 7 percent over the prior year period mainly due to higher labour costs. Accordingly, general and administrative costs on a unit basis increased by 17 percent over the prior year period due to the year-over-year increase in costs together with a reduction in tonnes milled.
Full Year 2015
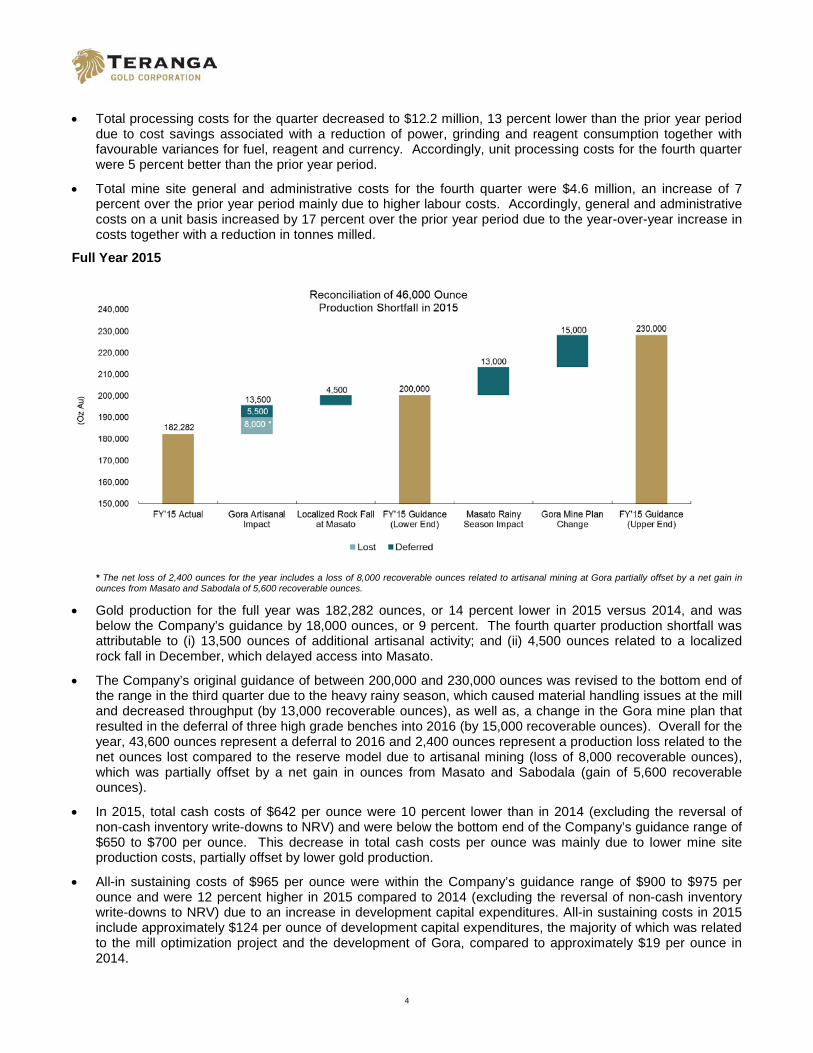
* The net loss of 2,400 ounces for the year includes a loss of 8,000 recoverable ounces related to artisanal mining at Gora partially offset by a net gain in ounces from Masato and Sabodala of 5,600 recoverable ounces.
• Gold production for the full year was 182,282 ounces, or 14 percent lower in 2015 versus 2014, and was below the Company’s guidance by 18,000 ounces, or 9 percent. The fourth quarter production shortfall was attributable to (i) 13,500 ounces of additional artisanal activity; and (ii) 4,500 ounces related to a localized rock fall in December, which delayed access into Masato.
• The Company’s original guidance of between 200,000 and 230,000 ounces was revised to the bottom end of the range in the third quarter due to the heavy rainy season, which caused material handling issues at the mill and decreased throughput (by 13,000 recoverable ounces), as well as, a change in the Gora mine plan that resulted in the deferral of three high grade benches into 2016 (by 15,000 recoverable ounces). Overall for the year, 43,600 ounces represent a deferral to 2016 and 2,400 ounces represent a production loss related to the net ounces lost compared to the reserve model due to artisanal mining (loss of 8,000 recoverable ounces), which was partially offset by a net gain in ounces from Masato and Sabodala (gain of 5,600 recoverable ounces).
• In 2015, total cash costs of $642 per ounce were 10 percent lower than in 2014 (excluding the reversal of non-cash inventory write-downs to NRV) and were below the bottom end of the Company’s guidance range of $650 to $700 per ounce. This decrease in total cash costs per ounce was mainly due to lower mine site production costs, partially offset by lower gold production.
• All-in sustaining costs of $965 per ounce were within the Company’s guidance range of $900 to $975 per ounce and were 12 percent higher in 2015 compared to 2014 (excluding the reversal of non-cash inventory write-downs to NRV) due to an increase in development capital expenditures. All-in sustaining costs in 2015 include approximately $124 per ounce of development capital expenditures, the majority of which was related to the mill optimization project and the development of Gora, compared to approximately $19 per ounce in 2014.

5
• In 2015, all unit costs were below the Company’s guidance range. This is due to a sharp focus on cost management, which resulted in more than $20 million (or $100 per ounce) cost savings and the lowest unit costs in the Company’s history. Cost savings related to improvements to the load/haul cycle, a reduction of overall energy costs and consumables used in the mill, as well as favourable variances in both currency and fuel prices.
Mining
• In 2015 the Company mined a total of 31.6 million tonnes from three pits:
i. 24.1 million tonnes were mined at Masato throughout the year;
ii. 6.5 million tonnes were mined at Gora, the Company's first satellite deposit, which as planned came into production by the third quarter; and
iii. 1.0 million tonnes were mined at Sabodala, where the final benches of phase 3 were completed during the first half of the year.
• In 2014, a total of 29.3 million tonnes were mined with 22.4 million tonnes from the lower benches of Phase 3 in the Sabodala pit and 6.9 million tonnes from Masato, which went into production in September 2014.
• In order to improve 2016 and 2017 cash flows, the mine plans for both Masato and Gora were optimized during 2015, with the result that both ore and waste mined increased at Masato and more waste and less ore were mined at Gora. The impact of the localized rock fall at Masato in December and the negative impact of artisanal voids on mining rates at Gora resulted in approximately 1.4 million tonnes less material being moved than the revised plan.
• While total ore tonnes mined in 2015 increased to 7.7 million tonnes, an increase of 25 percent compared to 2014, ore grades mined were lower. The decline in ore grade was mainly due to the lower-grade ore at Masato and the mining deferral of high grade ore at both Masato and Gora into 2016. In the prior year periods, mining was mainly focused on higher grade areas of the Sabodala pit. As a result of changes made to the Gora mine plan during the third quarter to enlarge phase 1 of the pit in order to optimize operating efficiencies and the slower rate of mining through artisanal voids, three benches containing approximately 100,000 tonnes of ore at over 6 grams per tonne (approximately 19,000 contained ounces) were deferred to 2016.
Processing
• Ore tonnes milled for the twelve months were 3.4 million tonnes, a decrease of 6 percent compared to the prior year and 8 percent lower than plan due to lower throughput during this year’s protracted and heavy rainy season, which caused material handling issues due to increased plasticity of the Masato ore when wet. The material handling issues during the third quarter reduced production by 13,000 recovered ounces. Together with the impact of delays in mining at Gora and Masato, approximately 248,000 tonnes at an average grade of 3.00 grams per tonne (approximately 23,500 contained ounces), which were scheduled to be processed during the fourth quarter, was deferred to 2016. In the prior year period, mill feed was comprised of mainly fresh ore from the Sabodala pit until the fourth quarter when mining began at Masato.
• Head grade in 2015 was 1.79 grams per tonne, a decrease of 12 percent versus 2014 due to the deferral of high grade feed into 2016.
Costs
• Total mining costs for 2015 were $76.5 million, or 8 percent lower than in 2014 mainly due to shorter haul distances, mine optimization to improve productivity, favourable fuel and currency movements, and improved drill and haul productivities. These savings were partially offset by an increase in grade control drilling costs and higher maintenance costs. Unit mining costs in 2015 at $2.42, were the lowest in the Company’s history and 14 percent better than the prior year due to a reduction in costs and higher tonnes mined.
• In 2015, total processing costs were $47.9 million, representing an improvement of 23 percent over the prior year due to cost savings associated with a reduction of power, grinding and reagent consumption together with favourable variances for currency, fuel and reagents. Accordingly, the Company reported record unit processing costs of $14.01 for 2015, representing an 18 percent improvement over 2014.

6
• Total mine site general and administrative costs for 2015 were $16.5 million, slightly less than the prior year as higher labour costs were offset by favourable fuel and currency rates. On a unit basis, general and administration costs were $4.82, or 5 percent higher in 2015 than in 2014 due to a reduction in total ore tonnes milled during the year.
PRODUCTION STATISTICS Three months ended December 31, Twelve months ended December 31, Operating Results 2015 2014 Change
2015 2014 Change
Ore mined (‘000t) 1,859 2,666 (30%)
7,748 6,174 25% Waste mined - operating (‘000t) 4,612 5,594 (18%)
18,382 21,179 (13%)
Waste mined - capitalized (‘000t) 726 490 48%
5,501 1,969 179%
Total mined (‘000t) 7,197 8,750 (18%)
31,631 29,321 8% Grade mined (g/t) 1.37 1.47 (7%)
1.22 1.54 (21%)
Ounces mined (oz) 82,057 126,334 (35%)
303,023 305,192 (1%) Strip ratio waste/ore 2.9 2.3 26%
3.1 3.7 (16%)
Ore milled (‘000t) 919 1,009 (9%)
3,421 3,622 (6%) Head grade (g/t) 1.86 2.44 (24%)
1.79 2.03 (12%)
Recovery rate % 93.4 90.1 4%
92.3 89.7 3% Gold produced1 (oz) 51,292 71,278 (28%)
182,282 211,823 (14%)
Gold sold (oz) 52,939 63,711 (17%)
193,218 206,336 (6%)
Average realized price $/oz 1,099 1,199 (8%)
1,161 1,259 (8%) Total cash costs (incl. royalties)2 $/oz sold 668 598 12%
642 710 (10%)
All-in sustaining costs2 $/oz sold 969 711 36%
965 865 12% Mining ($/t mined) 2.83 2.58 10%
2.42 2.83 (14%)
Mining long haul ($/t hauled) 5.33 - NA
5.35 - NA Milling ($/t milled) 13.27 13.91 (5%)
14.01 17.15 (18%)
General & Administrative ($/t milled) 4.99 4.27 17% 4.82 4.61 5% 1 Gold produced represents change in gold in circuit inventory plus gold recovered during the period. 2 Total cash costs per ounce and all-in sustaining costs per ounce are non-IFRS financial measures that do not have a standard meaning under IFRS. Please refer to Non-IFRS Financial Performance Measures at the end of this report.

7
OUTLOOK 2016
The following table outlines the Company’s estimated 2016 summary production and cost guidance:
Year Ended December 31
2015 2016
Actual Guidance
Operating Results Ore mined (‘000t) 7,748 2,000 - 2,500
Waste mined (‘000t) 23,883 34,500 - 36,000 Total mined (‘000t) 31,631 36,500 - 38,500 Grade mined (g/t) 1.22 2.75 - 3.25 Strip ratio waste/ore 3.10 13.00 - 15.00 Ore milled (‘000t) 3,421 3,700 - 3,900 Head grade (g/t) 1.79 1.80 - 2.00 Recovery rate % 92.3 90 - 91 Gold produced 1 (oz) 182,282 200,000 - 215,000 All-in sustaining cash cost 2 $/oz sold 965 900 - 975
Mining ($/t mined) 2.42 2.20 - 2.40 Mining long haul ($/t hauled) 5.35 4.00 - 4.50 Milling ($/t milled) 14.01 11.00 - 12.00 G&A ($/t milled) 4.82 4.25 - 4.50
Mine Production Costs $ millions 142.1 145 - 155
Capital Expenditures Mine site sustaining $ millions 4.4 8 - 10
Capitalized reserve development $ millions 4.8 5 Total Project Development Costs $ millions 23.9 17 - 20 Total Capital Expenditures 3 $ millions 33.1 30 - 35
Exploration (Expensed) $ millions 2.5 3
Administration & CSR Expense $ millions 16.0 15 - 16
Notes: 1 22,500 ounces of production are to be sold to Franco Nevada at 20% of the spot gold price.
2 All-in sustaining costs per ounce is a non-IFRS financial measure and does not have standard meanings under IFRS. All-in sustaining costs per ounce sold include total cash costs per ounce, administration expenses (excluding Corporate depreciation expense and social community costs not related to current operations), capitalized deferred stripping, capitalized reserve development and mine site & development capital expenditures as defined by the World Gold Council. 3 Excludes capitalized deferred stripping costs, included in in mine production costs. This forecast financial information is based on the following material assumptions for 2016: gold price: $1,100 per ounce; Brent oil:$40/barrel; Euro:USD exchange rate of 1.1:1 Other important assumptions include: any political events are not expected to impact operations, including movement of people, supplies and gold shipments; grades and recoveries will remain consistent with the life-of-mine plan to achieve the forecast gold production; and no unplanned delays in or interruption of scheduled production.
2016 Guidance Analysis
The Company’s mine plans are designed to maximize sustainable free cash flow. Mining activity in 2016 will focus on completing phase 1 of Masato through the first quarter of the year, and then the mobile equipment will move to Golouma, where development has just been completed and production has commenced. Development of Kerekounda is expected to commence in the third quarter with waste stripping continuing for the remainder of the year, while mining at Gora will continue throughout the year. Total tonnes mined are expected to increase from the 31.6 million tonnes mined in 2015 to between 36.5 and 38.5 million tonnes in 2016. Ore tonnes mined is expected to decrease from 7.7 million tonnes to between 2.0 and 2.5 million tonnes. While ore tonnage is lower in 2016, both grade and strip ratio are higher, reflecting the concentration of mining at the higher grade Gora and Golouma pits.
Mill throughput and grade are expected to increase in 2016. Since the end of the 2015 rainy season, mill throughput is back to name plate capacity of one million tonnes and with the anticipated completion of the mill optimization in the fourth quarter 2016, mill throughput rates are expected to rise to the 3.7 to 3.9 million tonne
8
range for the year. In 2016, the majority of ore expected to be processed during the rainy season is more competent as compared to 2015, when the majority of the material processed was softer, which created material handling issues during the wet season.
The Company expects to produce between 200,000 and 215,000 ounces of gold in 2016. The quarterly production profile in 2016 is expected to be more consistent than previous years, with the exception of lower production during the third quarter due to the rainy season. The 2016 production plan also reflects a build-up of higher grade stockpiles of approximately 40,000 contained ounces, which is expected to provide a buffer against any future operating shortfall.
Total mine production costs for 2016 are expected to be in the range of $145 to $155 million, slightly higher than 2015 due to the increase in tonnes mined and processed. While total mine production costs are expected to increase, costs on a unit basis are expected to be better than 2015, as the company benefits from a further improvement in fuel prices and its ongoing business improvement programs.
Administrative and corporate social responsibility (“CSR”) costs relate to the corporate office, the Dakar and regional offices and the Company’s corporate social responsibility initiatives, and exclude corporate depreciation and other costs. For 2016, these costs are estimated to be between $15 and $16 million, including approximately $3 million for CSR activities, similar to 2015.
Sustaining capital expenditures for the mine site are expected to be between $8 and $10 million, excluding capitalized deferred stripping costs, and reserve development expenditures are expected to be $5 million. Project development expenditures for growth initiatives, including the cost to develop the Golouma and Kerekounda deposits and costs to complete the mill optimization project, are expected to be between$17 and $20 million. The mill optimization project is expected to be commissioned in the fourth quarter.
All-in sustaining costs are expected to be between $900 and $975 per ounce, in line with 2015.
In 2016, the majority of the capital to be spent on the Company’s exploration program will be focused on organic growth through (i) the conversion of resources to reserves; (ii) extensions of existing deposits along strike on the Sabodala and OJVG mine licenses; and (iii) a systematic regional exploration program designed to identify high grade satellite and standalone deposits.
The Company identified a number of risk factors to which it is subject in its revised Annual Information Form filed for the year ended December 31, 2014. These various financial and operational risks and uncertainties continue to be relevant to an understanding of our business, and could have a significant impact on profitability and levels of operating cash flow. Refer to Risks and Uncertainties at the end of this report for additional risks.
CORPORATE
The Company’s sources of liquidity at December 31, 2015 include the Company’s cash balance of $44.4 million, cash flow provided by operations and a Revolver Credit Facility of $30 million, of which $15 million was drawn at December 31, 2015. Including the VAT receivable from the Republic of Senegal, the Company’s pro forma cash balance at December 31, 2015 was $57.6 million.
The Company is in the process of conducting its annual carrying value review of goodwill and long-lived assets. Our preliminary analysis indicates a potential non-cash write-down of goodwill and long-lived assets, mainly due to a change in our long-term gold price assumption as a result of a continued decline in the market price of gold. The results of this analysis will be released in February with the filing of the Company’s Audited Consolidated Financial Statements and Management’s Discussion and Analysis.
MANAGEMENT CHANGES
After nine years, Mark English moved from Vice President, Sabodala Operations into a new role as Vice President, Special Projects focused on the long-term development and growth of the Company. With Mark’s change in role, Nico Uys was promoted to Operations Manager, Sabodala with overall responsibility for the Sabodala operation.
As well, in addition to his current responsibilities as Vice President, Technical Services, Paul Chawrun has assumed responsibility for the Sabodala operations as the Company officer. As a result of Mr. Chawrun’s

9
increased responsibilities, the Company is adding senior technical and exploration expertise to the Technical Services team to provide additional oversight of operations while continuing to focus on the Company’s growth initiatives.
BUSINESS AND PROJECT DEVELOPMENT
Gora Development
Mining at the satellite Gora pit commenced in July 2015. All required infrastructure, including a 26 kilometre access road, was completed within the scheduled timeframe and came in $3.5 million under the estimated budget of $19.0 million3.
The impact of the artisanal mining activities at Gora was greater than anticipated, with artisanal activities extending to depths of 45 metres from surface. As a result, an incremental 8,600 ounces were removed on top of the 12,000 ounces that had already been estimated and removed from phase 1 of the reserve model. In total, artisanal miners removed 60 percent of the ounces to a depth of 45 metres. An additional 5,000 ounces had previously been removed from phase 2 and 3, however, based on phase 1 activities that amount was increased to 11,000 ounces.
To ensure the recovery of the high grade mineralization contained in narrow veins, the ore body is being mined in 2.5 metre flitches in the ore zones. Mining below the benches impacted by artisanal miners is showing tonnes and grade that closely match the reserve model.
To optimize the Gora pit for 2015 and 2016, changes in the pit design were made during the year. As a result, three benches scheduled to be mined in 2015, containing 100,000 tonnes averaging 6 grams per tonne, were deferred into 2016.
Mill Optimization
A mill optimization project was launched in mid-2015, which will add a second primary jaw crusher, screen and conveyor assembly to tie into our existing facility when it is completed in the fourth quarter of 2016.
Upon completion, the mill optimization is expected to increase throughput by more than 10 percent on an annualized basis based on existing ore hardness; however, there may be potential to increase throughput further based on simulations of the new design configurations. In addition to higher production, unit processing costs are expected to decrease by approximately 5 percent.
A number of key milestones were accomplished during the fourth quarter. The project entered into the construction phase and remains on schedule for completion in the third quarter with commissioning and full ramp up during the fourth quarter of 2016. All detailed engineering, procurement packages and steel fabrication was completed during fourth quarter. Most of the equipment and steel were delivered to site late in 2015. Civil construction commenced at site in November, with the structural and mechanical team mobilizing to site late in December for an early January start-up. To date, the project remains on budget.
Approximately $7.3 million of the $20 million budgeted was spent in 2015, with the remainder of costs expected to be incurred in 2016.
Heap Leach Project
In the fourth quarter, the Company completed the pre-feasibility study (“PFS”), which concluded that heap leaching is technically viable for processing its low-grade ore.
The PFS capital costs, which are currently being finalized, are based on the optimized Phase 2 trade off studies and subsequent design criteria. The basis for this capital estimate will incorporate vendor quotations and are using the ongoing mill optimization project for estimating detailed aspects of the construction costs. The estimated capital cost of the heap leach project is expected to be in the range of $50 million.
A decision to proceed will require the conversion of additional oxide resources to reserves and finalized project economics that exceed our 20 percent minimum hurdle rate. If a decision is made to go ahead with the heap leaching project, it is estimated that it will take approximately 24 months to permit and construct. Based on current assumptions, we estimate that heap leach could account for an incremental 10 to 20 percent of annual production once fully operational. 3 Pending decision on dyke construction in 2016.

10
Reserves and Resources
Mineral Resources at December 31, 2015 are presented in Appendix 1. Total open pit and underground Proven and Probable Mineral Reserves4 at December 31, 2015 are set forth in Appendix 2. The reported Mineral Resources are inclusive of the Mineral Reserves.
The Proven and Probable Mineral Reserves were based on the Measured and Indicated Resources that fall within the designed open pits and underground designs. The basis for the resources and reserves is consistent with the Canadian Securities Administrators National Instrument 43-101 Standards for Disclosure for Mineral Projects (“NI 43-101”) regulations.
All of the open pit designs were updated based on a Lerchs-Grossman (“LG”) pit shell using Whittle 4X software. The key input parameters were based on a gold price of $1,100 per ounce (with exception of Sabodala at $1,000 per ounce), extrapolated mine and plant operating costs from current operating data and wall angles based on rock mass classifications that use the existing database from observation coupled with analysis of diamond drill hole data. The net result is lower total ounces in open pit reserves from the previous designs but an improved cash flow over the life of mine plan with the removal of low margin areas of the open pit reserve pit shells at a gold price of $1,100 per ounce.
The Sabodala pit has been mined out through Phases 1-3, with the latter phase completed by mid-year in 2015. While the previous pit design was maintained using a $1,000 per ounce gold price, a re-evaluation of the final pit limits of Sabodala Phase 4 will be completed prior to mining and will use updated economic parameters at that time. Currently, the plan to mine Phase 4 in Sabodala is estimated to begin in 2017.
Mining of the initial phases of the Masato pit began in late 2014, with completion expected in first quarter 2016. The final phase of the Masato pit (Phase 3) remains largely unchanged from the original design and is expected to begin in 2018.
The previously named Niakafiri pit has been changed to Niakafiri Main. It has been redesigned and is based on an updated resource model that re-interpreted the previous drill hole data, updated economics for the pit shells using current economic parameters and pit wall angles consistent with similar rock types on the property.
Newly defined reserves have been added at Niakafiri SE, Niakafiri SW and Maki Medina orebodies as a result of drilling in 2015. Additional drilling is planned in 2016 to potentially further delineate additional open pit reserves on these orebodies.
Mining in the satellite Gora pit started in July 2015. The pit design remains largely unchanged from December 2012, however, it has been adjusted to show year end 2015 mining progress as well an additional 22.8 thousand tonnes at 8.19 grams per tonne (6,000 mined ounces) have been removed to estimate the impact of increased artisanal activity encountered during 2015.
The previously defined Golouma pit was renamed to reflect the two areas of the orebody: Golouma West and Golouma South.
Golouma South will be mined in 2016 and has begun early pre-stripping. Minor adjustments were made from the previous Golouma South to account for slightly shallower slope angles in the oxide zones, but steeper angles in the fresh zones. A small amount of artisanal activity was encountered near surface, accounting for the removal of 6.7 thousand tonnes at 2.96 grams per tonne (650 mined ounces) from the reserves.
Significant changes were made to the Golouma West pit design. A portion of the orebody was removed totaling 1.78 million tonnes of ore at 2.09 grams per tonne (119,900 ounces mined) but also removing 41.9 million tonnes of waste for an incremental strip ratio of 23.6. This smaller pit results in an improved cash flow at $1,100 per ounce gold. This pit is planned to be mined in 2021, and additional considerations will be made to the final pit design based on economic conditions at that time.
The Kerekounda pit design remains largely unchanged from the previous design, with minor modifications to the wall angles in the oxide zone and final pit boundaries based on the updated LG shell.
Underground Reserves
RPA Inc. (RPA) completed the underground mine design for the estimation of Mineral Reserves.
4 The term “Mineral Reserves” is being used with the same meaning as “Ore Reserves”, defined in the 2012 JORC Code.

11
The mining method chosen for the reserves estimate is a modified cut and fill. Due to the irregular geometry of these deposits, this allows for maximum recovery of ore, good mining selectivity, and a minimal amount of mining equipment. The ventilation will be a push system, with air being directed down the ventilation raise and exhausting at the portal. Two types of backfill material are proposed, Cemented Rock Fill and Unconsolidated Rock Fill. Groundwater and mine water will be collected in sumps and pumped to surface discharging into the pits.
The deposits will be mined two at a time in order to meet the current mine life schedule. Kerekounda and Golouma South will be mined first starting in 2021. Once they are exhausted, the Golouma West deposits will be mined. The objective of scheduling the deposits to be mined in this sequence is to have eight years of continuous production from the underground with some lag in the schedule to allow infrastructure to be moved from the first set of deposits to the second set. Each deposit is scheduled on a 500 tonnes per day production target, providing 1,000 tonnes per day combined at peak production.
Capital and operating costs were estimated by first principles and using budgetary quotes from vendors and contractors. Refining, royalty, processing, and general and administrative costs were provided by Teranga.
Life of Mine Schedule
Appendix 3 represents a life of mine schedule developed from the proven and probable reserves listed in Appendix 2. The pit sequencing schedule is based on blending the material movement capability with the mine mobile fleet and the availability of high grade ore within the various ore bodies. This schedule represents one of a number of possibilities that can be adjusted as economic conditions change. Pit sequencing emphasized the best cash flow for the first five years of mining (2016 to 2020) due to the low gold price environment, with flexibility for potential design changes as economic conditions change. A lower annual material movement (not exceeding 40 million tonnes per annum) utilizing the existing fleet provided for an optimal cash flow in the current economic conditions.
Open pit mining methods similar to current operations at the Sabodala and Masato deposits were applied by providing the highest grade available for plant feed and stockpiling lower grade ore for processing at the end of mine life. A detailed mine dilution and ore recovery analysis was applied to determine mine operating parameters.
Underground mining was assumed to commence in 2021, while the Niakafiri Main pit was deferred to 2023. Additional drilling for the purpose of converting resources to reserves at Niakafiri is expected to commence in 2016. The life of mine plan will be re-evaluated once drilling is completed at Niakafiri with the potential to move development forward based on conversion of resources to reserves and a positive decision on heap leaching.
Detailed annual capital and operating costs summaries will be included with the Company’s year-end results in February. While the timing rather than the cost of certain capital projects remains outstanding, operating costs have been finalized and, as a result, all-in sustaining costs are expected to be in the $900 per ounce range over the five-year period from 2016 to 2020, as well as over the 13.5 year mine life.
Sabodala Mine License Reserve Development
The Sabodala combined mine license covers 291km2. The objective of this multi-year development program is to add higher grade material earmarked for the mill and to add lower grade to potentially a heap leach pad.
Golouma NW Extension
Additional follow-up work on the “red” shear is being evaluated. Allowance has been made for possible infill drilling in 2016. Infill drilling in the northwest trending shear successfully confirmed geological and grade continuity. The resource model is planned to be updated later this year.
Maki Medina
The Maki Medina deposit is situated along the same steeply west dipping north-northeast trending structural zone that hosts two deposits to the north, Masato and Niakafiri, and two to the south, Kobokoto and Kinemba.
Previous drilling defined a northern zone and a smaller southern zone containing an estimated one million tonnes of oxide ore at just over 1 gram per tonne.
During the fourth quarter, 200 metres of a 1,000-metre trenching program investigating a 300-metre long soil anomaly to the south of the main mineralized zone was completed. Initial sampling results indicate that the gold
12
mineralization extends to the south. It is envisaged that a diamond drilling program will be undertaken in the second quarter of 2016 to test the depth extension of this southern extension to the Maki Medina Main zone. An updated resource model was completed in the fourth quarter.
Maki Medina East Anomaly
Previous soil sampling identified a parallel trending gold anomaly located 200 metres to the east of the Maki Medina deposit extending 700 metres along strike and 200 metres in width (Maki Medina East).
During the fourth quarter, trenches totalling 2,500 metres were excavated on the prospect to follow up on drilling and trench results. The trenching program tested soil anomalies across a 640 metre north-south strike direction and successfully identified a number of drill targets. The updated results indicate mineralization is associated with narrow quartz veins and breccia zones. Seven diamond drill holes totalling 800 metres were drilled along 150 metres of the gold mineralized zone with all assay results returned. Review of the trenching and drill data for the Maki Medina East zone will continue with potential follow up work in the first quarter of 2016. Highlighted results are shown in Appendix 4.
Niakafiri Southwest
During the third quarter, a 14-hole diamond drilling program was completed. A total of 1,000 metres was drilled with all assay results returned.
Drilling did not intersect additional mineralization along strike, but infilled gaps between wide spaced drill holes to confirm geology and grade continuity. An updated resource model was completed in the fourth quarter.
Golouma South
The Golouma South deposit is located in a north-northeast trending ductile shear zone and consists of sub-parallel mineralized zones coinciding with higher strain zones, intense alteration and quartz veining within the shear. Mineralization has been defined approximately 640 metres along strike and 560 metres below surface, and remains open at depth.
During the third quarter, a 14-hole 1,000 metre diamond drilling program was completed to confirm the geological interpretation, test the extent of artisanal voids, infill gaps and confirm grades in oxide. Results confirm the geological interpretation and location of mineralization, an updated resource model was completed in the fourth quarter.
Rotary air blast condemnation drilling of ground proposed for mine infrastructure and future waste dump footprint has located several gold mineralized zones north of the deposit which may have economic potential. A trenching program to evaluate these zones commenced in the fourth quarter and will be followed by a limited diamond drilling program. Two diamond drill holes were drilled in the fourth quarter with significant intercepts being recorded as shown in Appendix 5. The trenching and drilling evaluation program is ongoing.
Soukhoto
Soukhoto mineralization is located in a regional northeast trending structural corridor, and situated 1.5 km south of the Sabodala deposit, 800 metres north of the Niakafiri West deposit and 800 metres west of the Dinkokono deposit.
Mineralization was previously intersected in variably spaced holes, 30 to 80 metres apart on three 40 metre spaced sections.
Eight infill diamond drill holes were completed in the third quarter to better define geological interpretation and local structural trends that were previously interpreted from reverse circulation (“RC”) drilling. Results returned from seven holes indicate mineralization is associated with quartz veining located in oxide, and possibly associated with different local structural trends, perhaps subsidiary structures related to the Niakafiri shear zone to the east.
Further drilling will be evaluated pending follow-up data interpretation.
Goumbati West
The Goumbati West prospect is situated 1 kilometre southwest of the Kobokoto gold deposit. The gold mineralization at Goumbati West occurs within a 1.2 kilometre long NNE trending shear structure. It comprises a series of quartz veins occurring in a sheared sequence of epiclastics and minor basalt. It is highlighted by a 400
13
metre long gold soil anomaly with highs of 200-500 ppb gold and appears to be an extension of the Niakafiri SW shear.
Four diamond drill holes totalling 400 metres were drilled over a 150 metre strike length of the shear structure during the fourth quarter. Assay results from two of the four holes yielded encouraging gold assay results as shown in Appendix 6. Further follow-up trenching and drilling will be undertaken in the first quarter of 2016.
Goumbati East
Goumbati East is located 3 kilometres southwest of Golouma South in-between the Niakafiri and Golouma structural corridors. Mineralization is highlighted by a series of gold soil anomalies with highs of 200-500 ppb gold which are coincident with WNW and NE trending shear structures containing quartz veins within a sequence of volcanoclastics and basalts.
Four diamond drill holes totalling 400 metres were drilled to test the shear zones. Multiple shear zones, some 20 metres in width, with quartz-carbonate veining and sulphides were intersected in the holes. Favourable assay results were received during the quarter, listed in Appendix 7. Further trenching and diamond drilling is planned for the first quarter 2016.
Kouroundi
The Kouroundi mineralized zone is developed within a NW trending kink structure, situated between the Mamasato and Kerekounda deposits. A 6 hole 800 metre drilling program began in the fourth quarter. Two of the six holes drilled yielded favourable assay results as shown in Appendix 8. Further drilling and the re-interpretation of historical data is planned for the first quarter of 2016 to confirm the presence of strike extensions to the NW of the main ore body.
Regional Exploration
We currently have eight exploration permits encompassing approximately 1,000km² of land surrounding the Sabodala mine license.
During the fourth quarter, a settlement agreement was reached with a joint venture partner where by Teranga would receive cash consideration of $0.5 million for the relinquishment of its interest in the Garaboureya exploration permit.
For the fourth quarter 2015, we have been focused on six regional targets including Soreto, KD, KC, Nienienko Area targets, Marougou and the KA prospect.
Soreto
At Soreto diamond drill programs undertaken during the course of 2013, 2014 and 2015 intersected several continuous shear zones developed over a 600 metre strike length. The shear zones feature steep, north-westerly dipping altered shear zones often with associated felsic dyke, sheared and brecciated silicified metasediments containing quartz-carbonate veins with disseminated pyrite and visible gold in places. The shear zones coincide with the major NNE regional shear structure with an associated 6 km long geochemical soil anomaly and when projected to surface, align with the surface workings from artisanal mining. Gold mineralization also occurred in quartz veins filling conjugate brittle fracture sets in massive granite units in the NW portion of the prospect.
During 2015 trenching programs were undertaken along strike of the gold mineralization defined by the diamond drill programs and soil anomalies. To date a total of 1,800 metres of trenching has been completed. Initial trenching results have defined gold mineralized zones including 9 metres grading 2.16 grams per tonne gold and 4 metres grading 4.24 grams per tonne gold. Further drilling on the prospect will be determined by the trench sampling results.
KD Prospect
A reconnaissance trenching across a 600 metre long gold soil anomaly paralleling a regional NNE trending regional scale structure located a gold mineralized zone with grades of 7.3 grams per tonne gold over 2 metres and 15.8 grams per tonne over 2 metres. Follow up trenching of this zone is planned for the first quarter of 2016.
Nienienko Prospects
An extensive mapping and a trenching program, over 1,500 metres, was conducted during second and third quarter 2014 at the Nienienko prospect which lead to the outlining of a 500 metre-plus wide zone with gold

14
mineralization occurring in flat lying, near surface (0-2 metres) quartz vein and felsic breccia units developed over a strike length of 1,500 metres.
An isopach plan of the mineralized quartz vein and felsic breccia systems is in progress, and will be used to develop a plan for diamond drilling and a possible RC drill program. Due to the limitation of surface trenching and mapping used to develop the flat lying mineralized zone at surface, additional trenching and mapping is being undertaken in prospective zones near to the area to expand on the currently defined zone and to further develop an understanding of the source of mineralization zones for potential drill targets at depth. A diamond drill program will be considered once this work has been completed and is likely to be scheduled for early 2016.
KA Prospect
The KA gold mineralization outlined by a regional soil geochemistry program, RAB drilling and trenching is currently being re-assessed. Trenching undertaken in the fourth quarter 2015 has identified a flat lying gold mineralized zone at the contact between a quarts-feldspar porphyry intrusive and siltstone-shale unit. The contact zone is often found to be brecciated with multiple variably orientated, quartz vein stringers and sulphide box works. Horizontal channel sampling across the zone yielded 0.8 grams per tonne over 28 metres containing a high of 9 metres grading 1.4 grams per tonne. Vertical channel sampling across the same zone yielded a high of 6.1 grams per tonne over 0.5 metres.
A 9-hole diamond drill program of approximately 500 metres commenced in the fourth quarter 2015 with four holes completed. The program will initially determine the thickness of the flat lying gold mineralized zone and test its continuity over a 100 metre strike length. Assay results received are given in Appendix 9 confirming the presence of gold mineralization along strike. The remaining holes will be drilled in the first quarter of 2016.
Marougou Prospect
The Marougou prospect soil anomaly previously investigated by a series of RAB and RC drilling is currently being reassessed by means of a limited diamond drill program which will provide structural information on the orientation of the mineralized zones which is open to interpretation. 9 drill holes totaling 1,000 metres were planned of which 3 were sited to twin 3 RC holes drilled in 2013. The three twin holes were drilled during the fourth quarter and assay results were received for two of the three holes. The best gold intercepts are listed in Appendix 10. The remaining holes will be drilled in the first quarter of 2016.
Niakafiri Resettlement
In August 2015, Teranga and the Government of Senegal launched resettlement discussions related to the nearby village of Sabodala, adjacent to the Niakafiri deposit. Teranga has retained global resettlement consultants rePlan Inc. to ensure the resettlement process will follow the highest international standards, as well as all Senegalese laws and regulations. The company expects formal negotiations with community and regional stakeholders to commence in due course following which a drill program is planned. The objective of the drill program is to convert some of the existing resources (438,000 ounces included within Measured and Indicated resources, and 102,000 ounces in Inferred resources) into reserves.
Non-IFRS Financial Performance Measures
The Company has included non-IFRS measures in this Report, including “total cash cost per ounce of gold sold” and “all-in sustaining costs per ounce”. The Company believes that these measures, in addition to conventional measures prepared in accordance with IFRS, provide investors an improved ability to evaluate the underlying performance of the Company. The non-IFRS measures are intended to provide additional information and should not be considered in isolation or as a substitute for measures of performance prepared in accordance with IFRS. These measures do not have any standardized meaning prescribed under IFRS, and therefore may not be comparable to other issuers.
The Company reports total cash costs on a sales basis. Total cash costs per gold ounce include production costs such as mining, processing, refining and site administration, net of silver sales, divided by gold ounces sold to arrive at total cash costs per gold ounce sold. Production costs are exclusive of depreciation and depletion. Other companies may calculate this measure differently.
All in sustaining costs per ounce sold include total cash costs per ounce, administration expenses (excluding corporate depreciation expense and social community costs not related to current operations), capitalized
15
deferred stripping, capitalized reserve development and mine site sustaining capital expenditures (including project development costs) as defined by the World Gold Council. Other companies may calculate this measure differently.
Competent and Qualified Persons Statement
The technical information contained in this document relating to the open pit mineral reserve estimates is based on, and fairly represents, information compiled by Mr. William Paul Chawrun, P. Eng who is a member of the Professional Engineers Ontario, which is currently included as a "Recognized Overseas Professional Organization" in a list promulgated by the ASX from time to time. Mr. Chawrun is a full time employee of Teranga and is not "independent" within the meaning of National Instrument 43-101. However, he is a "Qualified Person" as defined in NI 43-101. Mr. Chawrun has sufficient experience which is relevant to the style of mineralization and type of deposit under consideration and to the activity which he is undertaking to qualify as a Competent Person as defined in the 2012 Edition of the "Australasian Code for Reporting of Exploration Results, Mineral Resources and Ore Reserves". Mr. Chawrun is a "Qualified Person" under National Instrument 43-101 Standards of Disclosure for Mineral Projects. Mr. Chawrun has consented to the inclusion in this Report of the matters based on his compiled information in the form and context in which it appears in this Report.
The technical information contained in this Report relating to mineral resource estimates is based on, and fairly represents, information compiled by Ms. Patti Nakai-Lajoie. Ms. Nakai-Lajoie, P. Geo., is a Member of the Association of Professional Geoscientists of Ontario, which is currently included as a "Recognized Overseas Professional Organization" in a list promulgated by the ASX from time to time. Ms. Nakai-Lajoie is a full time employee of Teranga and is not "independent" within the meaning of National Instrument 43-101. Ms. Nakai-Lajoie has sufficient experience which is relevant to the style of mineralization and type of deposit under consideration and to the activity which she is undertaking to qualify as a Competent Person as defined in the 2012 Edition of the "Australasian Code for Reporting of Exploration Results, Mineral Resources and Ore Reserves". Ms. Nakai-Lajoie is a "Qualified Person" under National Instrument 43-101 Standards of Disclosure for Mineral Projects. Ms. Nakai-Lajoie has consented to the inclusion in this Report of the matters based on her compiled information in the form and context in which it appears in this Report.
Teranga's exploration programs are being managed by Peter Mann, FAusIMM. Mr. Mann is a full time employee of Teranga and is not "independent" within the meaning of National Instrument 43-101. Mr. Mann has sufficient experience which is relevant to the style of mineralization and type of deposit under consideration and to the activity which he is undertaking to qualify as a Competent Person as defined in the 2012 Edition of the "Australasian Code for Reporting of Exploration Results, Mineral Resources and Ore Reserves". Mr. Mann is a "Qualified Person" under National Instrument 43-101 Standards of Disclosure for Mineral Projects. The technical information contained in this news release relating exploration results are based on, and fairly represents, information compiled by Mr. Mann. Mr. Mann has verified and approved the data disclosed in this release, including the sampling, analytical and test data underlying the information. The RC samples are prepared at site and assayed in the SGS laboratory located at the site. Analysis for diamond drilling is sent for fire assay analysis at ALS Johannesburg, South Africa. Mr. Mann has consented to the inclusion in this news release of the matters based on his compiled information in the form and context in which it appears herein.
The technical information contained in this document relating to the underground ore reserves estimates is based on, and fairly represents, information compiled by Jeff Sepp, P. Eng who is a member of the Professional Engineers Ontario, which is currently included as a "Recognized Overseas Professional Organization" in a list promulgated by the ASX from time to time. Mr. Sepp is independent of Teranga and is a "Qualified Person" as defined in NI 43-101 and a "competent person" as defined in the 2012 Edition of the "Australasian Code for Reporting of Exploration Results, Mineral Resources and Ore Reserves". Mr. Sepp has sufficient experience relevant to the style of mineralization and type of deposit under consideration and to the activity he is undertaking to qualify as a Competent Person as defined in the 2012 Edition of the "Australasian Code for Reporting of Exploration Results, Mineral Resources and Ore Reserves". Mr. Sepp has consented to the inclusion in this Report of the matters based on his compiled information in the form and context in which it appears in this Report.
Teranga's disclosure of mineral reserve and mineral resource information is governed by NI 43-101 under the guidelines set out in the Canadian Institute of Mining, Metallurgy and Petroleum (the "CIM") Standards on Mineral Resources and Mineral Reserves, adopted by the CIM Council, as may be amended from time to time by the CIM ("CIM Standards"). CIM definitions of the terms "mineral reserve", "proven mineral reserve", "probable mineral reserve", "mineral resource", "measured mineral resource", "indicated mineral resource" and "inferred mineral resource", are substantially similar to the 2012 JORC Code corresponding definitions of the terms "ore reserve",

16
"proved ore reserve", "probable ore reserve", "mineral resource", "measured mineral resource", "indicated mineral resource" and "inferred mineral resource", respectively. Estimates of mineral resources and mineral reserves prepared in accordance with the 2012 JORC Code would not be materially different if prepared in accordance with the CIM definitions applicable under NI 43-101. There can be no assurance that those portions of mineral resources that are not mineral reserves will ultimately be converted into mineral reserves.
CORPORATE DIRECTORY
Directors Alan Hill Chairman Richard Young President and CEO Jendayi Frazer Non-Executive Director Edward Goldenberg Non-Executive Director Christopher Lattanzi Non-Executive Director David Mimran Non-Executive Director Alan Thomas Non-Executive Director Frank Wheatley Non-Executive Director
Senior Management Richard Young President and CEO Paul Chawrun Vice President, Operations and Technical Services Navin Dyal Vice President and CFO David Savarie Vice President, General Counsel & Corporate Secretary Sepanta Dorri Vice President Corporate and Stakeholder Development Mark English Vice President, Special Projects Aziz Sy General Manager, SGO & Vice President, Development Senegal
Registered Office 121 King Street West, Suite 2600 Toronto, Ontario, Canada M5H 3T9 T: +1 416-594-0000 F: +1 416-594-0088 E: [email protected] www.terangagold.com
Senegal Office 2K Plaza Suite B4, 1er Etage sis la Route du Meridien President Dakar Almadies T: +221 338 642 525 F: +224 338 642 526
Auditor Ernst & Young LLP
Share Registries Canada: Computershare Trust Company of Canada T: +1 800 564 6253 Australia: Computershare Investor Services Pty Ltd T: 1 300 850 505
Stock Exchange Listings Toronto Stock Exchange, TSX symbol: TGZ Australian Securities Exchange, ASX symbol: TGZ
Issued Capital As of December 31, 2015 Issued shares 392,001,091 Stock options 15,539,165

17
Stock Options – Exercise Profile Exercise Price (C$) Options $3.00 11,684,165 $0.64 3,855,000
Forward Looking Statements
This release contains certain statements that constitute forward-looking information within the meaning of applicable securities laws (“forward-looking statements”). Such forward-looking statements involve known and unknown risks, uncertainties and other factors that may cause the actual results, performance or achievements of Teranga, or developments in Teranga’s business or in its industry, to differ materially from the anticipated results, performance, achievements or developments expressed or implied by such forward-looking statements. Forward-looking statements include, without limitation, all disclosure regarding possible events, conditions or results of operations, future economic conditions and courses of action, the proposed plans with respect to mine plan, anticipated 2015 results, mineral reserve and mineral resource estimates, anticipated life of mine operating and financial results, and the completion of construction of the Gora deposit related thereto. Such statements are based upon assumptions, opinions and analysis made by management in light of its experience, current conditions and its expectations of future developments that management believe to be reasonable and relevant. These assumptions include, among other things, the ability to obtain any requisite Senegalese governmental approvals, the accuracy of mineral reserve and mineral resource estimates, gold price, exchange rates, fuel and energy costs, future economic conditions and courses of action. Teranga cautions you not to place undue reliance upon any such forward-looking statements, which speak only as of the date they are made. The risks and uncertainties that may affect forward-looking statements include, among others: the inherent risks involved in exploration and development of mineral properties, including government approvals and permitting, changes in economic conditions, changes in the worldwide price of gold and other key inputs, changes in mine plans and other factors, such as project execution delays, many of which are beyond the control of Teranga, as well as other risks and uncertainties which are more fully described in the Company’s Annual Information Form dated September 1, 2015, and in other company filings with securities and regulatory authorities which are available at www.sedar.com. Teranga does not undertake any obligation to update forward-looking statements should assumptions related to these plans, estimates, projections, beliefs and opinions change. Nothing in this report should be construed as either an offer to sell or a solicitation to buy or sell Teranga securities.
About Teranga
Teranga is a Canadian-based gold company listed on the Toronto Stock Exchange (TSX:TGZ) and Australian Securities Exchange (ASX:TGZ). Teranga is principally engaged in the production and sale of gold, as well as related activities such as exploration and mine development in Senegal, West Africa.
Teranga's mission is to create value for all of its stakeholders through responsible mining. Its vision is to explore, discover and develop gold mines in Senegal and West Africa, in accordance with the highest international standards, and to be a catalyst for sustainable economic, environmental and community development. All of its actions from exploration, through development, operations and closure will be based on the best available techniques. For more information, please refer to www.terangagold.com.
Contact Information
Richard Young Trish Moran President & CEO Head of Investor Relations T: +1 416-594-0000 | E: [email protected] T: +1 416-607-4507 | E: [email protected]
18
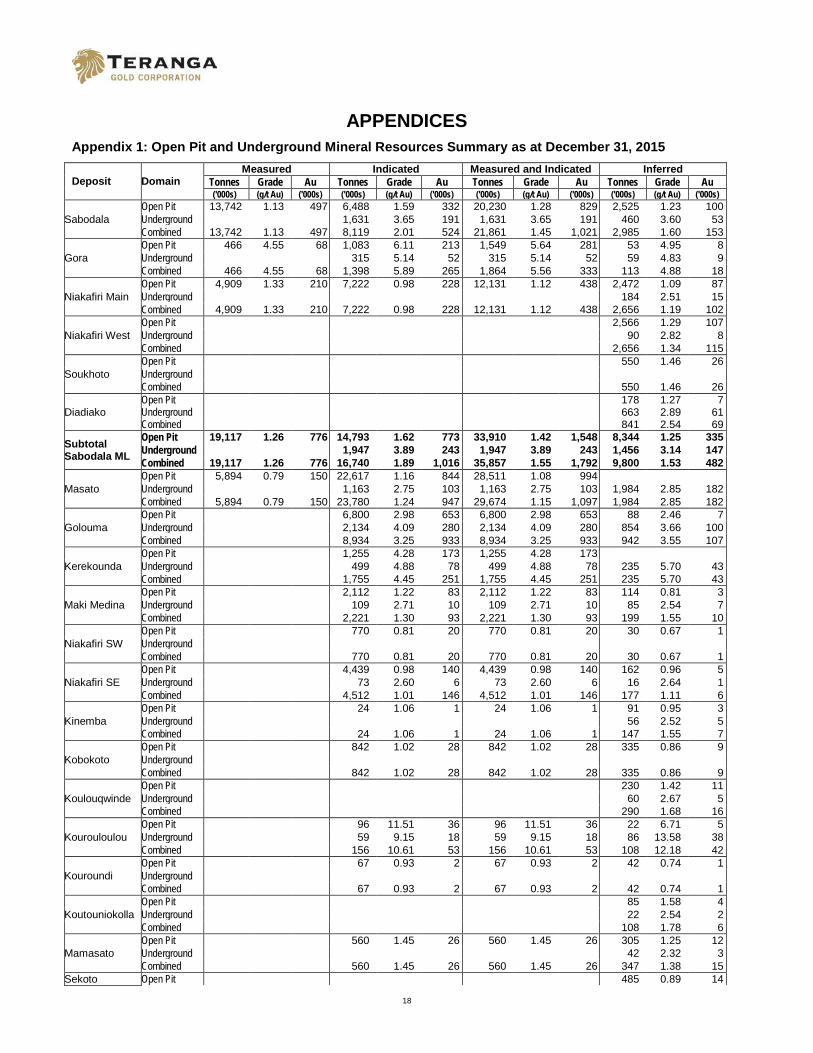
APPENDICES Appendix 1: Open Pit and Underground Mineral Resources Summary as at December 31, 2015
Deposit Domain Measured Indicated Measured and Indicated Inferred
Tonnes Grade Au Tonnes Grade Au Tonnes Grade Au Tonnes Grade Au ('000s) (g/t Au) ('000s) ('000s) (g/t Au) ('000s) ('000s) (g/t Au) ('000s) ('000s) (g/t Au) ('000s)
Sabodala Open Pit 13,742 1.13 497 6,488 1.59 332 20,230 1.28 829 2,525 1.23 100 Underground 1,631 3.65 191 1,631 3.65 191 460 3.60 53 Combined 13,742 1.13 497 8,119 2.01 524 21,861 1.45 1,021 2,985 1.60 153
Gora Open Pit 466 4.55 68 1,083 6.11 213 1,549 5.64 281 53 4.95 8 Underground 315 5.14 52 315 5.14 52 59 4.83 9 Combined 466 4.55 68 1,398 5.89 265 1,864 5.56 333 113 4.88 18
Niakafiri Main Open Pit 4,909 1.33 210 7,222 0.98 228 12,131 1.12 438 2,472 1.09 87 Underground 184 2.51 15 Combined 4,909 1.33 210 7,222 0.98 228 12,131 1.12 438 2,656 1.19 102
Niakafiri West Open Pit 2,566 1.29 107 Underground 90 2.82 8 Combined 2,656 1.34 115
Soukhoto Open Pit 550 1.46 26 Underground Combined 550 1.46 26
Diadiako Open Pit 178 1.27 7 Underground 663 2.89 61 Combined 841 2.54 69
Subtotal Sabodala ML
Open Pit 19,117 1.26 776 14,793 1.62 773 33,910 1.42 1,548 8,344 1.25 335 Underground 1,947 3.89 243 1,947 3.89 243 1,456 3.14 147 Combined 19,117 1.26 776 16,740 1.89 1,016 35,857 1.55 1,792 9,800 1.53 482
Masato Open Pit 5,894 0.79 150 22,617 1.16 844 28,511 1.08 994 Underground 1,163 2.75 103 1,163 2.75 103 1,984 2.85 182 Combined 5,894 0.79 150 23,780 1.24 947 29,674 1.15 1,097 1,984 2.85 182
Golouma Open Pit 6,800 2.98 653 6,800 2.98 653 88 2.46 7 Underground 2,134 4.09 280 2,134 4.09 280 854 3.66 100 Combined 8,934 3.25 933 8,934 3.25 933 942 3.55 107
Kerekounda Open Pit 1,255 4.28 173 1,255 4.28 173 Underground 499 4.88 78 499 4.88 78 235 5.70 43 Combined 1,755 4.45 251 1,755 4.45 251 235 5.70 43
Maki Medina Open Pit 2,112 1.22 83 2,112 1.22 83 114 0.81 3 Underground 109 2.71 10 109 2.71 10 85 2.54 7 Combined 2,221 1.30 93 2,221 1.30 93 199 1.55 10
Niakafiri SW Open Pit 770 0.81 20 770 0.81 20 30 0.67 1 Underground Combined 770 0.81 20 770 0.81 20 30 0.67 1
Niakafiri SE Open Pit 4,439 0.98 140 4,439 0.98 140 162 0.96 5 Underground 73 2.60 6 73 2.60 6 16 2.64 1 Combined 4,512 1.01 146 4,512 1.01 146 177 1.11 6
Kinemba Open Pit 24 1.06 1 24 1.06 1 91 0.95 3 Underground 56 2.52 5 Combined 24 1.06 1 24 1.06 1 147 1.55 7
Kobokoto Open Pit 842 1.02 28 842 1.02 28 335 0.86 9 Underground Combined 842 1.02 28 842 1.02 28 335 0.86 9
Koulouqwinde Open Pit 230 1.42 11 Underground 60 2.67 5 Combined 290 1.68 16
Kourouloulou Open Pit 96 11.51 36 96 11.51 36 22 6.71 5 Underground 59 9.15 18 59 9.15 18 86 13.58 38 Combined 156 10.61 53 156 10.61 53 108 12.18 42
Kouroundi Open Pit 67 0.93 2 67 0.93 2 42 0.74 1 Underground Combined 67 0.93 2 67 0.93 2 42 0.74 1
Koutouniokolla Open Pit 85 1.58 4 Underground 22 2.54 2 Combined 108 1.78 6
Mamasato Open Pit 560 1.45 26 560 1.45 26 305 1.25 12 Underground 42 2.32 3 Combined 560 1.45 26 560 1.45 26 347 1.38 15
Sekoto Open Pit 485 0.89 14
19
Deposit Domain Measured Indicated Measured and Indicated Inferred
Tonnes Grade Au Tonnes Grade Au Tonnes Grade Au Tonnes Grade Au ('000s) (g/t Au) ('000s) ('000s) (g/t Au) ('000s) ('000s) (g/t Au) ('000s) ('000s) (g/t Au) ('000s)
Underground 25 2.11 2 Combined 510 0.95 16
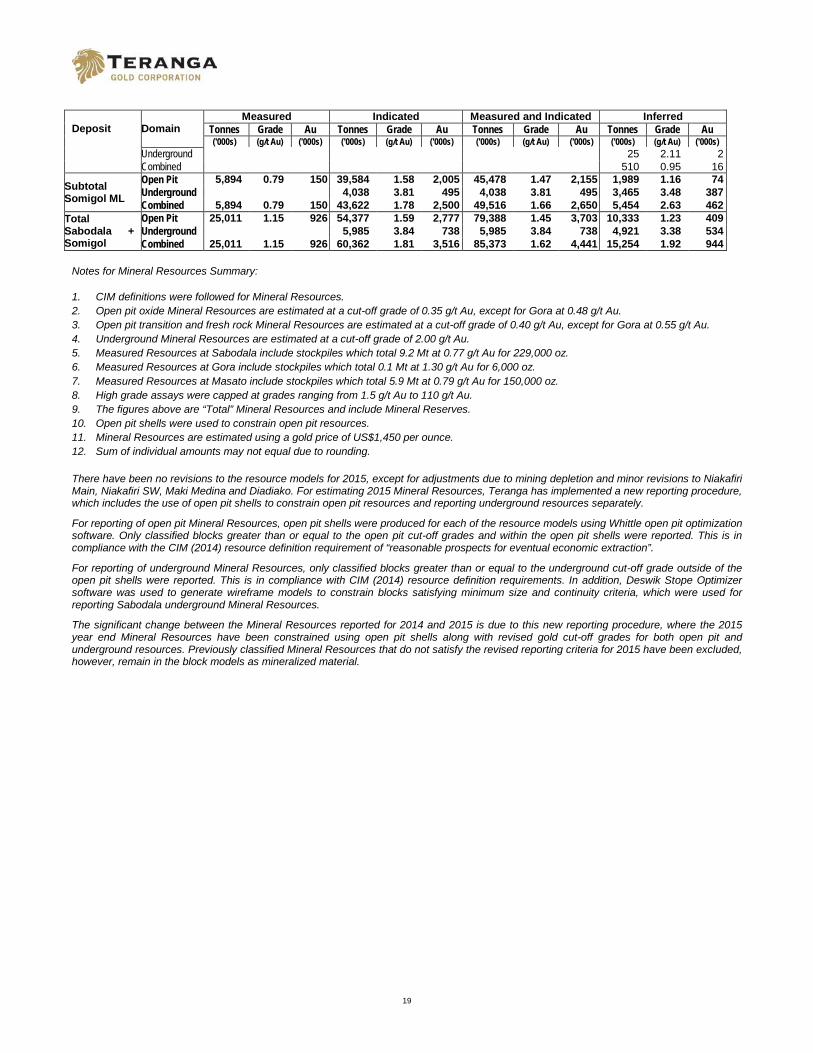
Subtotal Somigol ML
Open Pit 5,894 0.79 150 39,584 1.58 2,005 45,478 1.47 2,155 1,989 1.16 74 Underground 4,038 3.81 495 4,038 3.81 495 3,465 3.48 387 Combined 5,894 0.79 150 43,622 1.78 2,500 49,516 1.66 2,650 5,454 2.63 462
Total Sabodala + Somigol
Open Pit 25,011 1.15 926 54,377 1.59 2,777 79,388 1.45 3,703 10,333 1.23 409 Underground 5,985 3.84 738 5,985 3.84 738 4,921 3.38 534 Combined 25,011 1.15 926 60,362 1.81 3,516 85,373 1.62 4,441 15,254 1.92 944
Notes for Mineral Resources Summary:
1. CIM definitions were followed for Mineral Resources. 2. Open pit oxide Mineral Resources are estimated at a cut-off grade of 0.35 g/t Au, except for Gora at 0.48 g/t Au. 3. Open pit transition and fresh rock Mineral Resources are estimated at a cut-off grade of 0.40 g/t Au, except for Gora at 0.55 g/t Au. 4. Underground Mineral Resources are estimated at a cut-off grade of 2.00 g/t Au. 5. Measured Resources at Sabodala include stockpiles which total 9.2 Mt at 0.77 g/t Au for 229,000 oz. 6. Measured Resources at Gora include stockpiles which total 0.1 Mt at 1.30 g/t Au for 6,000 oz. 7. Measured Resources at Masato include stockpiles which total 5.9 Mt at 0.79 g/t Au for 150,000 oz. 8. High grade assays were capped at grades ranging from 1.5 g/t Au to 110 g/t Au. 9. The figures above are “Total” Mineral Resources and include Mineral Reserves. 10. Open pit shells were used to constrain open pit resources. 11. Mineral Resources are estimated using a gold price of US$1,450 per ounce. 12. Sum of individual amounts may not equal due to rounding.
There have been no revisions to the resource models for 2015, except for adjustments due to mining depletion and minor revisions to Niakafiri Main, Niakafiri SW, Maki Medina and Diadiako. For estimating 2015 Mineral Resources, Teranga has implemented a new reporting procedure, which includes the use of open pit shells to constrain open pit resources and reporting underground resources separately.
For reporting of open pit Mineral Resources, open pit shells were produced for each of the resource models using Whittle open pit optimization software. Only classified blocks greater than or equal to the open pit cut-off grades and within the open pit shells were reported. This is in compliance with the CIM (2014) resource definition requirement of “reasonable prospects for eventual economic extraction”.
For reporting of underground Mineral Resources, only classified blocks greater than or equal to the underground cut-off grade outside of the open pit shells were reported. This is in compliance with CIM (2014) resource definition requirements. In addition, Deswik Stope Optimizer software was used to generate wireframe models to constrain blocks satisfying minimum size and continuity criteria, which were used for reporting Sabodala underground Mineral Resources.
The significant change between the Mineral Resources reported for 2014 and 2015 is due to this new reporting procedure, where the 2015 year end Mineral Resources have been constrained using open pit shells along with revised gold cut-off grades for both open pit and underground resources. Previously classified Mineral Resources that do not satisfy the revised reporting criteria for 2015 have been excluded, however, remain in the block models as mineralized material.
20
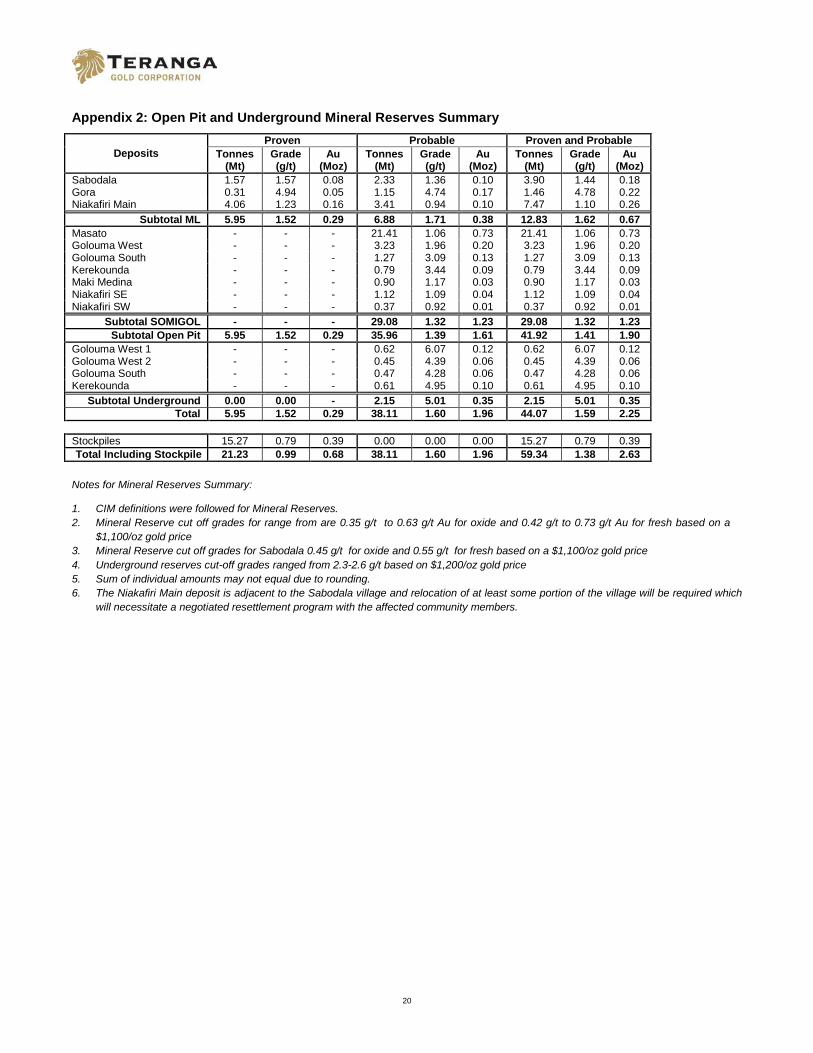
Appendix 2: Open Pit and Underground Mineral Reserves Summary
Deposits Proven Probable Proven and Probable
Tonnes (Mt)
Grade (g/t)
Au (Moz)
Tonnes (Mt)
Grade (g/t)
Au (Moz)
Tonnes (Mt)
Grade (g/t)
Au (Moz)
Sabodala 1.57 1.57 0.08 2.33 1.36 0.10 3.90 1.44 0.18 Gora 0.31 4.94 0.05 1.15 4.74 0.17 1.46 4.78 0.22 Niakafiri Main 4.06 1.23 0.16 3.41 0.94 0.10 7.47 1.10 0.26
Subtotal ML 5.95 1.52 0.29 6.88 1.71 0.38 12.83 1.62 0.67 Masato - - - 21.41 1.06 0.73 21.41 1.06 0.73 Golouma West - - - 3.23 1.96 0.20 3.23 1.96 0.20 Golouma South - - - 1.27 3.09 0.13 1.27 3.09 0.13 Kerekounda - - - 0.79 3.44 0.09 0.79 3.44 0.09 Maki Medina - - - 0.90 1.17 0.03 0.90 1.17 0.03 Niakafiri SE - - - 1.12 1.09 0.04 1.12 1.09 0.04 Niakafiri SW - - - 0.37 0.92 0.01 0.37 0.92 0.01
Subtotal SOMIGOL - - - 29.08 1.32 1.23 29.08 1.32 1.23 Subtotal Open Pit 5.95 1.52 0.29 35.96 1.39 1.61 41.92 1.41 1.90
Golouma West 1 - - - 0.62 6.07 0.12 0.62 6.07 0.12 Golouma West 2 - - - 0.45 4.39 0.06 0.45 4.39 0.06 Golouma South - - - 0.47 4.28 0.06 0.47 4.28 0.06 Kerekounda - - - 0.61 4.95 0.10 0.61 4.95 0.10
Subtotal Underground 0.00 0.00 - 2.15 5.01 0.35 2.15 5.01 0.35 Total 5.95 1.52 0.29 38.11 1.60 1.96 44.07 1.59 2.25
Stockpiles 15.27 0.79 0.39 0.00 0.00 0.00 15.27 0.79 0.39 Total Including Stockpile 21.23 0.99 0.68 38.11 1.60 1.96 59.34 1.38 2.63
Notes for Mineral Reserves Summary:
1. CIM definitions were followed for Mineral Reserves. 2. Mineral Reserve cut off grades for range from are 0.35 g/t to 0.63 g/t Au for oxide and 0.42 g/t to 0.73 g/t Au for fresh based on a
$1,100/oz gold price 3. Mineral Reserve cut off grades for Sabodala 0.45 g/t for oxide and 0.55 g/t for fresh based on a $1,100/oz gold price 4. Underground reserves cut-off grades ranged from 2.3-2.6 g/t based on $1,200/oz gold price 5. Sum of individual amounts may not equal due to rounding. 6. The Niakafiri Main deposit is adjacent to the Sabodala village and relocation of at least some portion of the village will be required which
will necessitate a negotiated resettlement program with the affected community members.
21
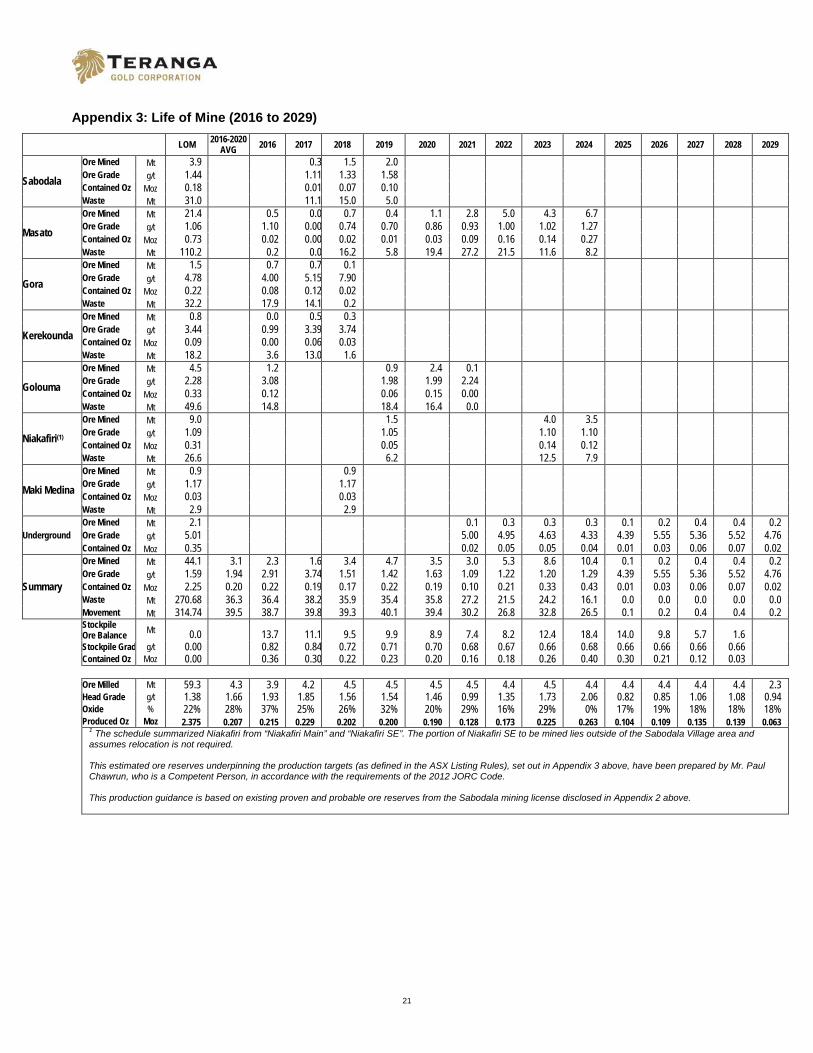
Appendix 3: Life of Mine (2016 to 2029)
LOM 2016-2020 AVG 2016 2017 2018 2019 2020 2021 2022 2023 2024 2025 2026 2027 2028 2029
Sabodala
Ore Mined Mt 3.9 0.3 1.5 2.0 Ore Grade g/t 1.44 1.11 1.33 1.58 Contained Oz Moz 0.18 0.01 0.07 0.10 Waste Mt 31.0 11.1 15.0 5.0
Masato
Ore Mined Mt 21.4 0.5 0.0 0.7 0.4 1.1 2.8 5.0 4.3 6.7 Ore Grade g/t 1.06 1.10 0.00 0.74 0.70 0.86 0.93 1.00 1.02 1.27 Contained Oz Moz 0.73 0.02 0.00 0.02 0.01 0.03 0.09 0.16 0.14 0.27 Waste Mt 110.2 0.2 0.0 16.2 5.8 19.4 27.2 21.5 11.6 8.2
Gora
Ore Mined Mt 1.5 0.7 0.7 0.1 Ore Grade g/t 4.78 4.00 5.15 7.90 Contained Oz Moz 0.22 0.08 0.12 0.02 Waste Mt 32.2 17.9 14.1 0.2
Kerekounda
Ore Mined Mt 0.8 0.0 0.5 0.3 Ore Grade g/t 3.44 0.99 3.39 3.74 Contained Oz Moz 0.09 0.00 0.06 0.03 Waste Mt 18.2 3.6 13.0 1.6
Golouma
Ore Mined Mt 4.5 1.2 0.9 2.4 0.1 Ore Grade g/t 2.28 3.08 1.98 1.99 2.24 Contained Oz Moz 0.33 0.12 0.06 0.15 0.00 Waste Mt 49.6 14.8 18.4 16.4 0.0
Niakafiri(1)
Ore Mined Mt 9.0 1.5 4.0 3.5 Ore Grade g/t 1.09 1.05 1.10 1.10 Contained Oz Moz 0.31 0.05 0.14 0.12 Waste Mt 26.6 6.2 12.5 7.9
Maki Medina
Ore Mined Mt 0.9 0.9 Ore Grade g/t 1.17 1.17 Contained Oz Moz 0.03 0.03 Waste Mt 2.9 2.9
Underground Ore Mined Mt 2.1 0.1 0.3 0.3 0.3 0.1 0.2 0.4 0.4 0.2 Ore Grade g/t 5.01 5.00 4.95 4.63 4.33 4.39 5.55 5.36 5.52 4.76 Contained Oz Moz 0.35 0.02 0.05 0.05 0.04 0.01 0.03 0.06 0.07 0.02
Summary
Ore Mined Mt 44.1 3.1 2.3 1.6 3.4 4.7 3.5 3.0 5.3 8.6 10.4 0.1 0.2 0.4 0.4 0.2 Ore Grade g/t 1.59 1.94 2.91 3.74 1.51 1.42 1.63 1.09 1.22 1.20 1.29 4.39 5.55 5.36 5.52 4.76 Contained Oz Moz 2.25 0.20 0.22 0.19 0.17 0.22 0.19 0.10 0.21 0.33 0.43 0.01 0.03 0.06 0.07 0.02 Waste Mt 270.68 36.3 36.4 38.2 35.9 35.4 35.8 27.2 21.5 24.2 16.1 0.0 0.0 0.0 0.0 0.0 Movement Mt 314.74 39.5 38.7 39.8 39.3 40.1 39.4 30.2 26.8 32.8 26.5 0.1 0.2 0.4 0.4 0.2
Stockpile Ore Balance Mt 0.0 13.7 11.1 9.5 9.9 8.9 7.4 8.2 12.4 18.4 14.0 9.8 5.7 1.6
Stockpile Grad g/t 0.00 0.82 0.84 0.72 0.71 0.70 0.68 0.67 0.66 0.68 0.66 0.66 0.66 0.66 Contained Oz Moz 0.00 0.36 0.30 0.22 0.23 0.20 0.16 0.18 0.26 0.40 0.30 0.21 0.12 0.03
Ore Milled Mt 59.3 4.3 3.9 4.2 4.5 4.5 4.5 4.5 4.4 4.5 4.4 4.4 4.4 4.4 4.4 2.3 Head Grade g/t 1.38 1.66 1.93 1.85 1.56 1.54 1.46 0.99 1.35 1.73 2.06 0.82 0.85 1.06 1.08 0.94 Oxide % 22% 28% 37% 25% 26% 32% 20% 29% 16% 29% 0% 17% 19% 18% 18% 18% Produced Oz Moz 2.375 0.207 0.215 0.229 0.202 0.200 0.190 0.128 0.173 0.225 0.263 0.104 0.109 0.135 0.139 0.063
1 The schedule summarized Niakafiri from “Niakafiri Main” and “Niakafiri SE”. The portion of Niakafiri SE to be mined lies outside of the Sabodala Village area and assumes relocation is not required. This estimated ore reserves underpinning the production targets (as defined in the ASX Listing Rules), set out in Appendix 3 above, have been prepared by Mr. Paul Chawrun, who is a Competent Person, in accordance with the requirements of the 2012 JORC Code. This production guidance is based on existing proven and probable ore reserves from the Sabodala mining license disclosed in Appendix 2 above.
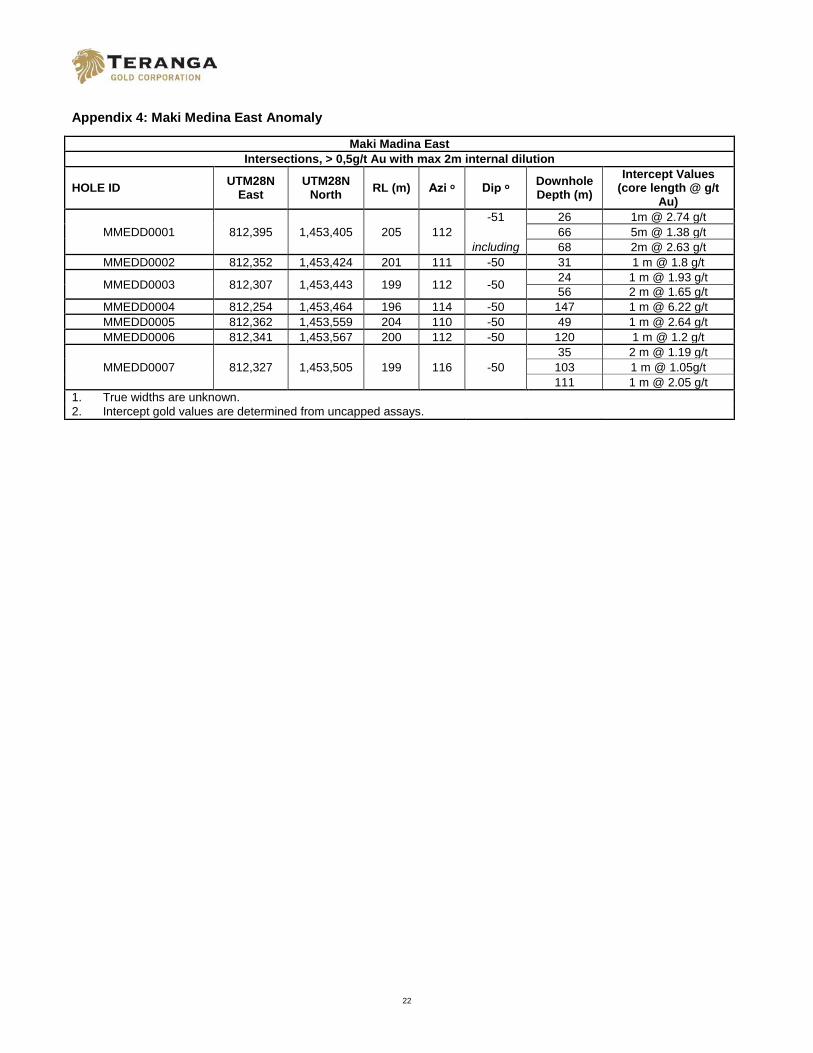
22
Appendix 4: Maki Medina East Anomaly
Maki Madina East Intersections, > 0,5g/t Au with max 2m internal dilution
HOLE ID UTM28N East
UTM28N North RL (m) Azi ᵒ Dip ᵒ Downhole
Depth (m) Intercept Values
(core length @ g/t Au)
MMEDD0001 812,395 1,453,405 205 112 -51 26 1m @ 2.74 g/t
66 5m @ 1.38 g/t including 68 2m @ 2.63 g/t
MMEDD0002 812,352 1,453,424 201 111 -50 31 1 m @ 1.8 g/t
MMEDD0003 812,307 1,453,443 199 112 -50 24 1 m @ 1.93 g/t 56 2 m @ 1.65 g/t
MMEDD0004 812,254 1,453,464 196 114 -50 147 1 m @ 6.22 g/t MMEDD0005 812,362 1,453,559 204 110 -50 49 1 m @ 2.64 g/t MMEDD0006 812,341 1,453,567 200 112 -50 120 1 m @ 1.2 g/t
MMEDD0007 812,327 1,453,505 199 116 -50 35 2 m @ 1.19 g/t
103 1 m @ 1.05g/t 111 1 m @ 2.05 g/t
1. True widths are unknown. 2. Intercept gold values are determined from uncapped assays.
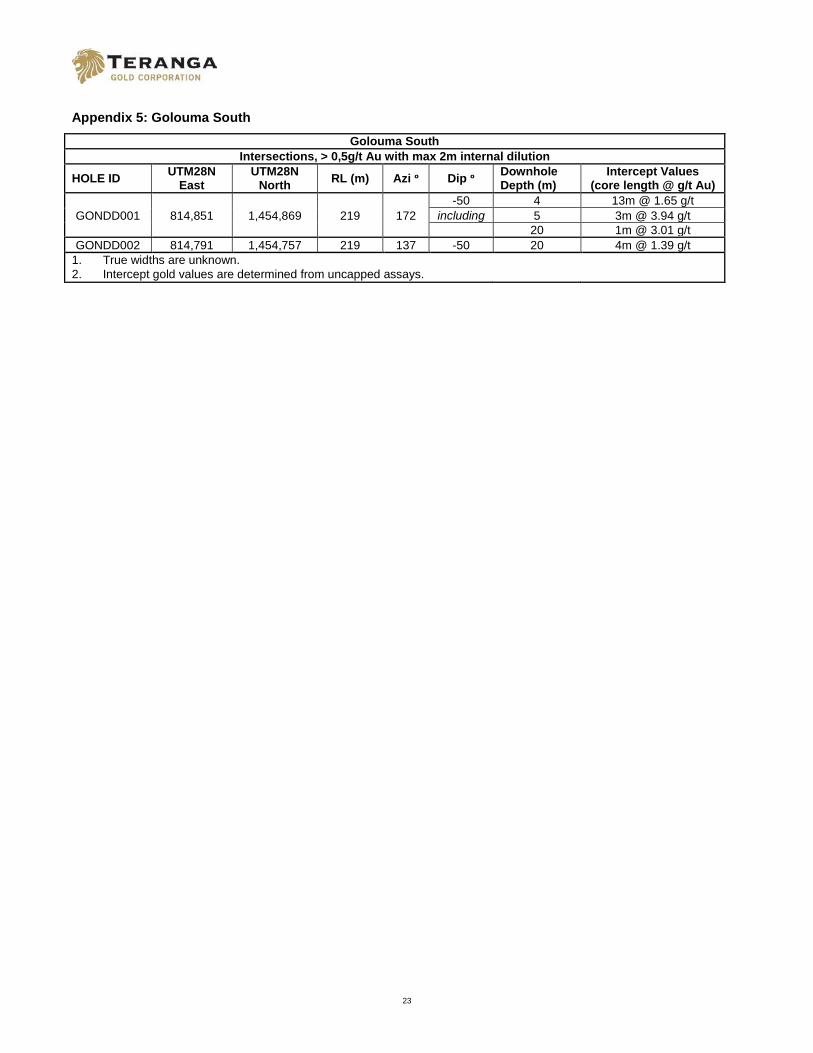
23
Appendix 5: Golouma South
Golouma South Intersections, > 0,5g/t Au with max 2m internal dilution
HOLE ID UTM28N East
UTM28N North RL (m) Azi ᵒ Dip ᵒ Downhole
Depth (m) Intercept Values
(core length @ g/t Au)
GONDD001 814,851 1,454,869 219 172 -50 4 13m @ 1.65 g/t
including 5 3m @ 3.94 g/t 20 1m @ 3.01 g/t
GONDD002 814,791 1,454,757 219 137 -50 20 4m @ 1.39 g/t 1. True widths are unknown. 2. Intercept gold values are determined from uncapped assays.
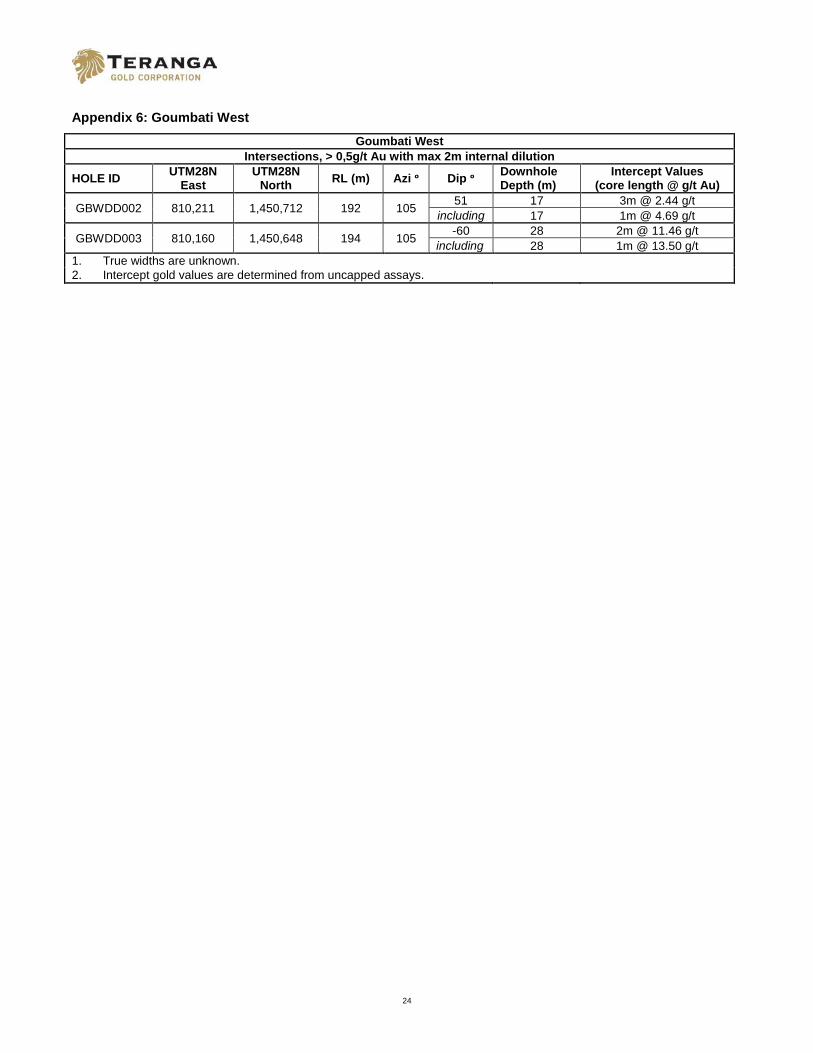
24
Appendix 6: Goumbati West
Goumbati West Intersections, > 0,5g/t Au with max 2m internal dilution
HOLE ID UTM28N East
UTM28N North RL (m) Azi ᵒ Dip ᵒ Downhole
Depth (m) Intercept Values
(core length @ g/t Au)
GBWDD002 810,211 1,450,712 192 105 51 17 3m @ 2.44 g/t including 17 1m @ 4.69 g/t
GBWDD003 810,160 1,450,648 194 105 -60 28 2m @ 11.46 g/t including 28 1m @ 13.50 g/t
1. True widths are unknown. 2. Intercept gold values are determined from uncapped assays.
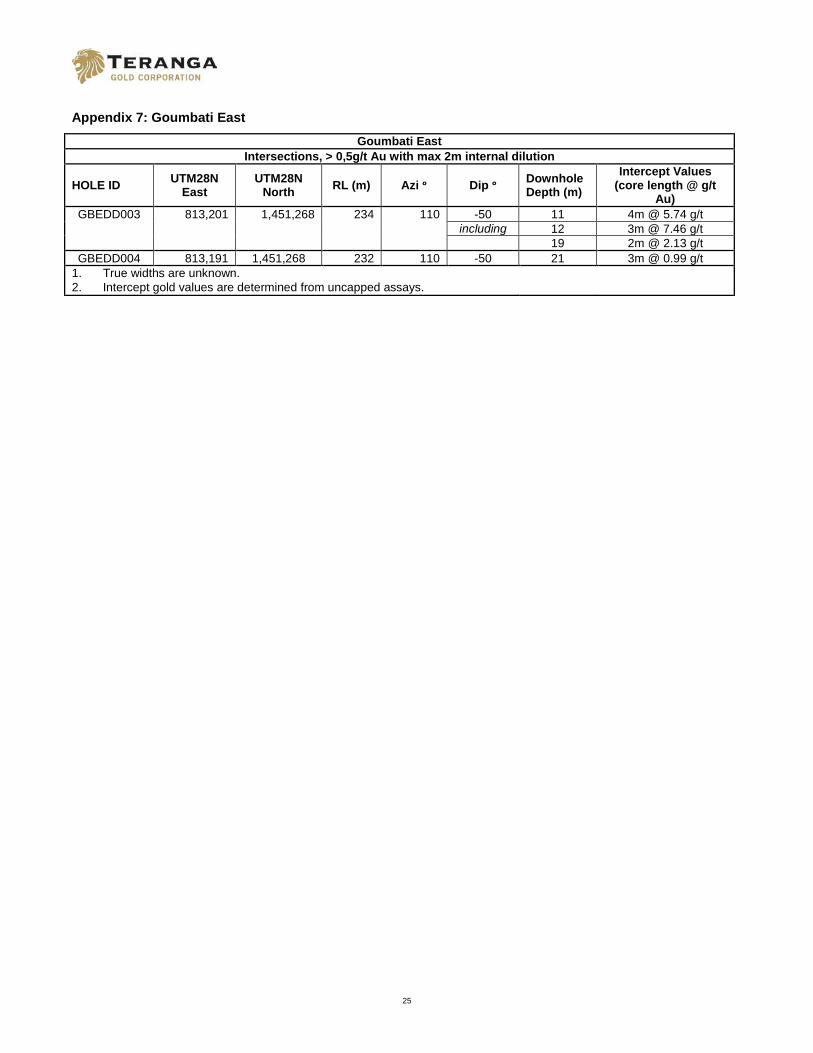
25
Appendix 7: Goumbati East
Goumbati East Intersections, > 0,5g/t Au with max 2m internal dilution
HOLE ID UTM28N East
UTM28N North RL (m) Azi ᵒ Dip ᵒ Downhole
Depth (m) Intercept Values
(core length @ g/t Au)
GBEDD003 813,201 1,451,268 234 110 -50 11 4m @ 5.74 g/t including 12 3m @ 7.46 g/t 19 2m @ 2.13 g/t
GBEDD004 813,191 1,451,268 232 110 -50 21 3m @ 0.99 g/t 1. True widths are unknown. 2. Intercept gold values are determined from uncapped assays.
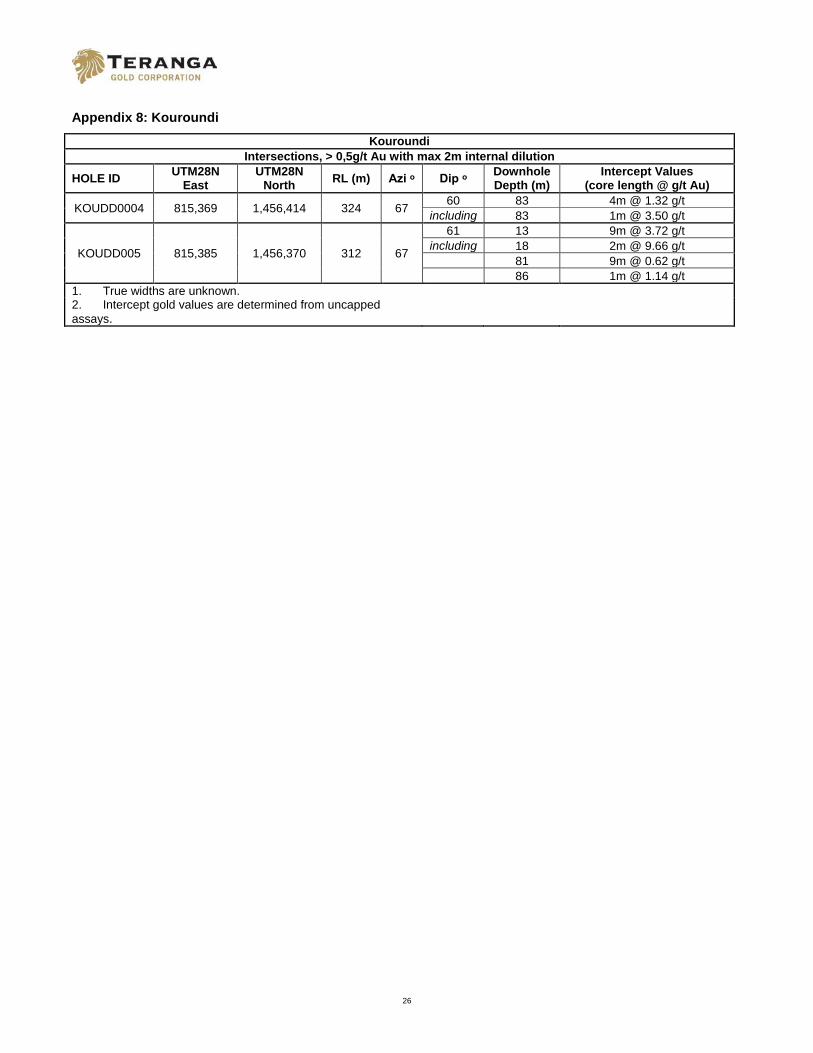
26
Appendix 8: Kouroundi
Kouroundi Intersections, > 0,5g/t Au with max 2m internal dilution
HOLE ID UTM28N East
UTM28N North RL (m) Azi ᵒ Dip ᵒ Downhole
Depth (m) Intercept Values
(core length @ g/t Au)
KOUDD0004 815,369 1,456,414 324 67 60 83 4m @ 1.32 g/t including 83 1m @ 3.50 g/t
KOUDD005 815,385 1,456,370 312 67
61 13 9m @ 3.72 g/t including 18 2m @ 9.66 g/t
81 9m @ 0.62 g/t 86 1m @ 1.14 g/t
1. True widths are unknown. 2. Intercept gold values are determined from uncapped assays.
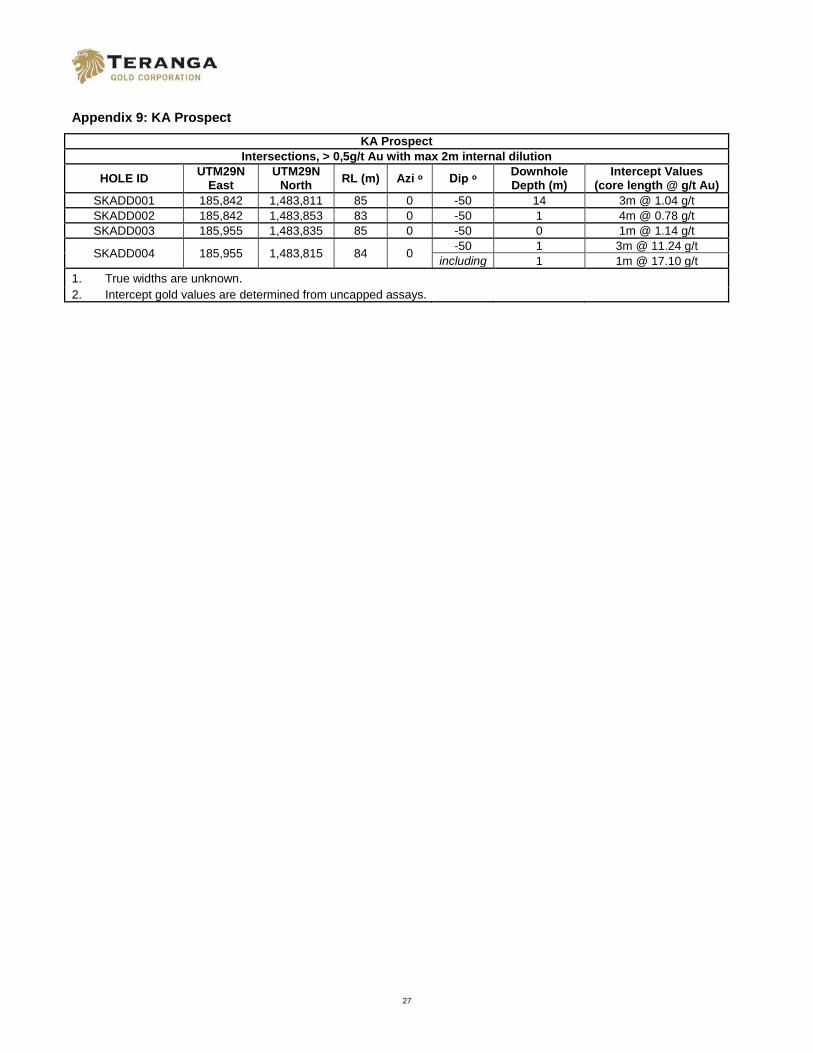
27
Appendix 9: KA Prospect
KA Prospect Intersections, > 0,5g/t Au with max 2m internal dilution
HOLE ID UTM29N East
UTM29N North RL (m) Azi ᵒ Dip ᵒ Downhole
Depth (m) Intercept Values
(core length @ g/t Au) SKADD001 185,842 1,483,811 85 0 -50 14 3m @ 1.04 g/t SKADD002 185,842 1,483,853 83 0 -50 1 4m @ 0.78 g/t SKADD003 185,955 1,483,835 85 0 -50 0 1m @ 1.14 g/t
SKADD004 185,955 1,483,815 84 0 -50 1 3m @ 11.24 g/t including 1 1m @ 17.10 g/t
1. True widths are unknown. 2. Intercept gold values are determined from uncapped assays.

28
Appendix 10: Marougou
Marougou Intersections, > 0,5g/t Au with max 2m internal dilution
HOLE ID UTM29N East
UTM29N North RL (m) Azi ᵒ Dip ᵒ Downhole
Depth (m) Intercept Values
(core length @ g/t Au)
MARDD0001 195513 1,468,099 80 120 -55 37 7m @ 4.68 g/t including 41 3m @ 7.73 g/t
MARDD0002 195887 1,468,563 85 120 -55 47 4m @ 2.24 g/t including 47 2m @ 3.21 g/t
1. True widths are unknown. 2. Intercept gold values are determined from uncapped assays.
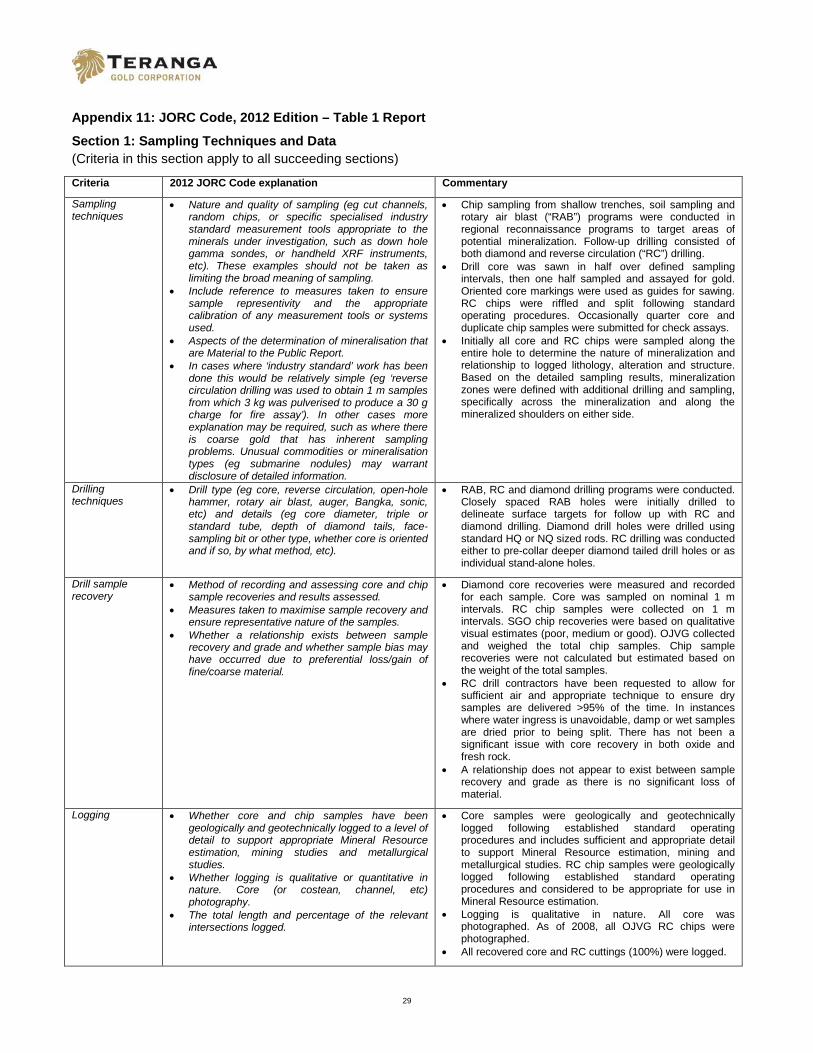
29
Appendix 11: JORC Code, 2012 Edition – Table 1 Report
Section 1: Sampling Techniques and Data (Criteria in this section apply to all succeeding sections) Criteria 2012 JORC Code explanation Commentary
Sampling techniques
• Nature and quality of sampling (eg cut channels, random chips, or specific specialised industry standard measurement tools appropriate to the minerals under investigation, such as down hole gamma sondes, or handheld XRF instruments, etc). These examples should not be taken as limiting the broad meaning of sampling.
• Include reference to measures taken to ensure sample representivity and the appropriate calibration of any measurement tools or systems used.
• Aspects of the determination of mineralisation that are Material to the Public Report.
• In cases where ‘industry standard’ work has been done this would be relatively simple (eg ‘reverse circulation drilling was used to obtain 1 m samples from which 3 kg was pulverised to produce a 30 g charge for fire assay’). In other cases more explanation may be required, such as where there is coarse gold that has inherent sampling problems. Unusual commodities or mineralisation types (eg submarine nodules) may warrant disclosure of detailed information.
• Chip sampling from shallow trenches, soil sampling and rotary air blast (“RAB”) programs were conducted in regional reconnaissance programs to target areas of potential mineralization. Follow-up drilling consisted of both diamond and reverse circulation (“RC”) drilling.
• Drill core was sawn in half over defined sampling intervals, then one half sampled and assayed for gold. Oriented core markings were used as guides for sawing. RC chips were riffled and split following standard operating procedures. Occasionally quarter core and duplicate chip samples were submitted for check assays.
• Initially all core and RC chips were sampled along the entire hole to determine the nature of mineralization and relationship to logged lithology, alteration and structure. Based on the detailed sampling results, mineralization zones were defined with additional drilling and sampling, specifically across the mineralization and along the mineralized shoulders on either side.
Drilling techniques
• Drill type (eg core, reverse circulation, open-hole hammer, rotary air blast, auger, Bangka, sonic, etc) and details (eg core diameter, triple or standard tube, depth of diamond tails, face-sampling bit or other type, whether core is oriented and if so, by what method, etc).
• RAB, RC and diamond drilling programs were conducted. Closely spaced RAB holes were initially drilled to delineate surface targets for follow up with RC and diamond drilling. Diamond drill holes were drilled using standard HQ or NQ sized rods. RC drilling was conducted either to pre-collar deeper diamond tailed drill holes or as individual stand-alone holes.
Drill sample recovery
• Method of recording and assessing core and chip sample recoveries and results assessed.
• Measures taken to maximise sample recovery and ensure representative nature of the samples.
• Whether a relationship exists between sample recovery and grade and whether sample bias may have occurred due to preferential loss/gain of fine/coarse material.
• Diamond core recoveries were measured and recorded for each sample. Core was sampled on nominal 1 m intervals. RC chip samples were collected on 1 m intervals. SGO chip recoveries were based on qualitative visual estimates (poor, medium or good). OJVG collected and weighed the total chip samples. Chip sample recoveries were not calculated but estimated based on the weight of the total samples.
• RC drill contractors have been requested to allow for sufficient air and appropriate technique to ensure dry samples are delivered >95% of the time. In instances where water ingress is unavoidable, damp or wet samples are dried prior to being split. There has not been a significant issue with core recovery in both oxide and fresh rock.
• A relationship does not appear to exist between sample recovery and grade as there is no significant loss of material.
Logging • Whether core and chip samples have been geologically and geotechnically logged to a level of detail to support appropriate Mineral Resource estimation, mining studies and metallurgical studies.
• Whether logging is qualitative or quantitative in nature. Core (or costean, channel, etc) photography.
• The total length and percentage of the relevant intersections logged.
• Core samples were geologically and geotechnically logged following established standard operating procedures and includes sufficient and appropriate detail to support Mineral Resource estimation, mining and metallurgical studies. RC chip samples were geologically logged following established standard operating procedures and considered to be appropriate for use in Mineral Resource estimation.
• Logging is qualitative in nature. All core was photographed. As of 2008, all OJVG RC chips were photographed.
• All recovered core and RC cuttings (100%) were logged.

30
Criteria 2012 JORC Code explanation Commentary
Sub-sampling techniques and sample preparation
• If core, whether cut or sawn and whether quarter, half or all core taken.
• If non-core, whether riffled, tube sampled, rotary split, etc and whether sampled wet or dry.
• For all sample types, the nature, quality and appropriateness of the sample preparation technique.
• Quality control procedures adopted for all sub-sampling stages to maximise representivity of samples.
• Measures taken to ensure that the sampling is representative of the in situ material collected, including for instance results for field duplicate/second-half sampling.
• Whether sample sizes are appropriate to the grain size of the material being sampled.
• Drill core sampling intervals were defined then cut in half with a diamond saw along the core length following orientation lines. Half core was sampled over approximate one meter lengths or based on lithology intervals.
• RC cuttings were sampled on one meter intervals for each meter drilled. The one meter interval cuttings were passed through a three-tier, one-eighth riffle splitter resulting in an approximately 2.0 kg to 2.5 kg subsample.
• Until 2013, Sabodala Mine Lease sample preparation was carried out at the SGS laboratory located on the Sabodala Mine Lease property and until 2011, OJVG samples were prepared at the TSL laboratory located on the OJVG property. Sabodala Mine Lease core and RC samples were dried and crushed to minus 2 mm, then split using a Jones riffle splitter to 200 grams. The 200 gram sample was pulverized with a ring and puck pulverizer to 85% minus 75 µm (200 mesh). OJVG core and RC samples were dried and crushed using a primary jaw crusher to a minimum of 70% passing through a minus 10 (2.0 mm) screen. The 250 gram sample split was transported to the TSL laboratory in Saskatoon, Saskatchewan, Canada where samples were pulverized to 95% passing a minus 150 mesh (106 µm) screen.
• In 2014, all RC samples were prepared at the SGS laboratory located on the Sabodala Mine Lease property and all drill core samples were prepared at the ALS laboratory in Johannesburg, South Africa.
• In 2015, all RAB and trench samples and some core samples were prepared at the SGS laboratory located on the Sabodala Mine Lease property. The majority of drill core samples and some trench samples were prepared at the ALS laboratory in Johannesburg, South Africa.
• One duplicate pulp sample was inserted into the sample stream for a minimum of every 20 samples. In addition, re-assays of the remaining pulp or reject samples were conducted as required for confirmation of the original assay results. SGO Standard operating procedures were established for sampling RC chips. Field duplicate samples were inserted into the sample stream at a ratio of 1 to 20 samples.
• Based on the characteristics of gold mineralization in these deposits and results from the QA/QC program and sample duplicates, the nominal 1 meter sample interval is determined to be appropriate.
Quality of assay data and laboratory tests
• The nature, quality and appropriateness of the assaying and laboratory procedures used and whether the technique is considered partial or total.
• For geophysical tools, spectrometers, handheld XRF instruments, etc, the parameters used in determining the analysis including instrument make and model, reading times, calibrations factors applied and their derivation, etc.
• Nature of quality control procedures adopted (eg standards, blanks, duplicates, external laboratory checks) and whether acceptable levels of accuracy (ie lack of bias) and precision have been established.
• From 2005 to 2008, all SGO samples were analyzed at the SGS laboratory in Kayes, Mali for gold by fire assay with an atomic absorption finish using 50 gram samples. From 2009 to 2013, all Sabodala Mine Lease samples were analyzed at the SGS laboratory located on the Sabodala Mine Lease property using an aqua regia digestion followed by AAS. Samples returning results higher than 0.2 g/t Au were sent for fire assay analysis at the SGS laboratory in Kayes, Mali.
• Until 2011, all OJVG samples were assayed at the TSL laboratory in Saskatoon, Saskatchewan, Canada for gold by fire assay with an atomic absorption finish. Assay results that exceeded a specified limit were reanalyzed using fire assay with a gravimetric finish
• In 2014, all core samples were assayed at the ALS laboratory in Johannesburg, South Africa for gold by fire assay with an atomic absorption finish. Where initial results exceeded 1.0 g/t Au, an additional assay was completed using fire assay with a gravimetric finish. For Masato, where the second assay results exceeded 10 g/t Au, an additional assay was completed using screen fire assay, screened to 100 microns. All RC samples were assayed at the SGS laboratory located on the Sabodala Mine Lease property using an aqua regia digestion followed by AAS.

31
Criteria 2012 JORC Code explanation Commentary
• In 2015, samples sent to the ALS laboratory in Johannesburg, South Africa were assayed for gold by fire assay with an atomic absorption finish. Where initial results exceeded 1.0 g/t Au, an additional assay was completed using fire assay with a gravimetric finish. Samples sent to the SGS laboratory located on the Sabodala Mine Lease property were assayed for gold using an aqua regia digestion followed by AAS.
• Blind Quality Assurance/Quality Control programs consisted of inserting blanks, duplicates and certified reference materials (CRM) into the sample stream at a minimum rate of one for every 20 samples. All SGO samples returned results within acceptable limits. SRK concluded that the OJVG QA/QC program was acceptable for use in resource estimates.
Verification of sampling and assaying
• The verification of significant intersections by either independent or alternative company personnel.
• The use of twinned holes. • Documentation of primary data, data entry
procedures, data verification, data storage (physical and electronic) protocols.
• Discuss any adjustment to assay data.
• Data verification was conducted over various time periods by independent consultants: SWRPA (2007), AMC (2010 and 2012), Lions Gate Consulting (2008 and 2009), and SRK (2009, 2010 and 2011). In addition, internal in-house data validation was conducted by company personnel.
• From October to November 2013, Teranga conducted an independent check on the OJVG data for Masato, Golouma and Kerekounda. Drill hole collar locations, downhole surveys, logging reports and assay certificates were checked on a random 5% of data. No significant discrepancies were identified. Drill core from holes on five cross sections through Masato were relogged. Additional quarter core samples were taken and sent for check assays. Results confirm location of gold mineralization, but a small percentage of assay results were significantly different from the original assays, perhaps due to the nuggety nature of gold and/or due to a smaller sample volume sent for the check assay.
• In 2014 and 2015, all drill data entered into the digital database was checked against original documents. Twinned holes were drilled and confirm locations and trends of mineralization.
• No adjustments were made to assay data returned from the laboratory.
Location of data points
• Accuracy and quality of surveys used to locate drill holes (collar and down-hole surveys), trenches, mine workings and other locations used in Mineral Resource estimation.
• Specification of the grid system used. • Quality and adequacy of topographic control.
• Until 2013, drill hole collars on the SGO Mine Lease and Gora were surveyed using either a Total Station or Differential GPS, both of which are capable of providing three-dimensional collar coordinates to sub-meter accuracy. Until 2011, OJVG drill hole collars were surveyed with a Total Station theodolite, Leica, Wild Heebrugg TC 1000 EDM. In 2014 Masato drill hole collars were surveyed using a Total Station theodolite; Golouma Northwest and Soreto drill hole collars were surveyed using Differential GPS. In 2015, drill hole collars were surveyed using a Total Station theodolite.
• All deposits were surveyed in WGS84 UTM Zone 28 North coordinates. All SGO Mine Lease, Gora, Maki Medina and Niakafiri SW data was converted into local grid coordinates for use in resource estimation.
• Surveyed collars located on the Sabodala Mine Lease property, were tied into established control points. Additional validation surveys were conducted on a random selection of collars, with no significant discrepancies identified. The quality and adequacy of topographic control was considered to be reasonable for use in resource estimation.
Data spacing and distribution
• Data spacing for reporting of Exploration Results. • Whether the data spacing and distribution is
sufficient to establish the degree of geological and grade continuity appropriate for the Mineral Resource and Ore Reserve estimation procedure(s) and classifications applied.
• Drilling is nominally on a 40 m by 40 m spacing, with closer spaced in-fill holes at approximately 20 m by 20 m, or 10 m by 10 m.
• Geological interpretation based on drill spacing has identified continuity of geology and grade and is determined to be sufficient for estimating Mineral
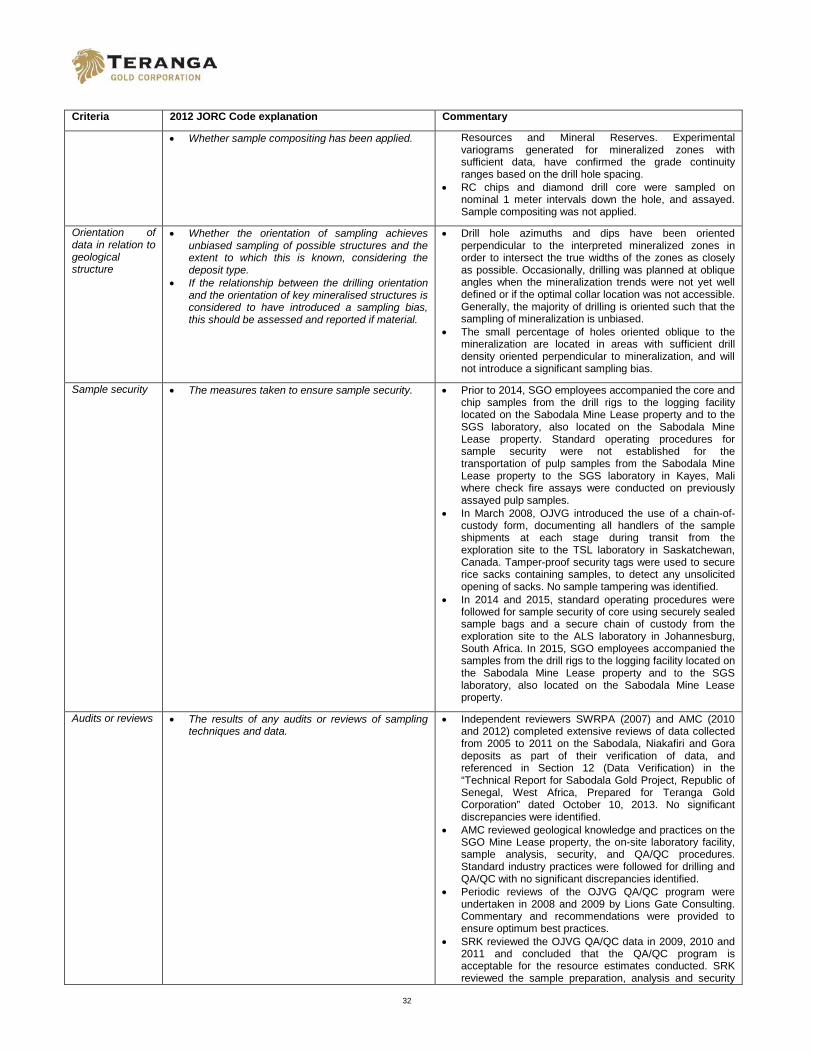
32
Criteria 2012 JORC Code explanation Commentary
• Whether sample compositing has been applied. Resources and Mineral Reserves. Experimental variograms generated for mineralized zones with sufficient data, have confirmed the grade continuity ranges based on the drill hole spacing.
• RC chips and diamond drill core were sampled on nominal 1 meter intervals down the hole, and assayed. Sample compositing was not applied.
Orientation of data in relation to geological structure
• Whether the orientation of sampling achieves unbiased sampling of possible structures and the extent to which this is known, considering the deposit type.
• If the relationship between the drilling orientation and the orientation of key mineralised structures is considered to have introduced a sampling bias, this should be assessed and reported if material.
• Drill hole azimuths and dips have been oriented perpendicular to the interpreted mineralized zones in order to intersect the true widths of the zones as closely as possible. Occasionally, drilling was planned at oblique angles when the mineralization trends were not yet well defined or if the optimal collar location was not accessible. Generally, the majority of drilling is oriented such that the sampling of mineralization is unbiased.
• The small percentage of holes oriented oblique to the mineralization are located in areas with sufficient drill density oriented perpendicular to mineralization, and will not introduce a significant sampling bias.
Sample security • The measures taken to ensure sample security. • Prior to 2014, SGO employees accompanied the core and chip samples from the drill rigs to the logging facility located on the Sabodala Mine Lease property and to the SGS laboratory, also located on the Sabodala Mine Lease property. Standard operating procedures for sample security were not established for the transportation of pulp samples from the Sabodala Mine Lease property to the SGS laboratory in Kayes, Mali where check fire assays were conducted on previously assayed pulp samples.
• In March 2008, OJVG introduced the use of a chain-of-custody form, documenting all handlers of the sample shipments at each stage during transit from the exploration site to the TSL laboratory in Saskatchewan, Canada. Tamper-proof security tags were used to secure rice sacks containing samples, to detect any unsolicited opening of sacks. No sample tampering was identified.
• In 2014 and 2015, standard operating procedures were followed for sample security of core using securely sealed sample bags and a secure chain of custody from the exploration site to the ALS laboratory in Johannesburg, South Africa. In 2015, SGO employees accompanied the samples from the drill rigs to the logging facility located on the Sabodala Mine Lease property and to the SGS laboratory, also located on the Sabodala Mine Lease property.
Audits or reviews • The results of any audits or reviews of sampling techniques and data.
• Independent reviewers SWRPA (2007) and AMC (2010 and 2012) completed extensive reviews of data collected from 2005 to 2011 on the Sabodala, Niakafiri and Gora deposits as part of their verification of data, and referenced in Section 12 (Data Verification) in the “Technical Report for Sabodala Gold Project, Republic of Senegal, West Africa, Prepared for Teranga Gold Corporation” dated October 10, 2013. No significant discrepancies were identified.
• AMC reviewed geological knowledge and practices on the SGO Mine Lease property, the on-site laboratory facility, sample analysis, security, and QA/QC procedures. Standard industry practices were followed for drilling and QA/QC with no significant discrepancies identified.
• Periodic reviews of the OJVG QA/QC program were undertaken in 2008 and 2009 by Lions Gate Consulting. Commentary and recommendations were provided to ensure optimum best practices.
• SRK reviewed the OJVG QA/QC data in 2009, 2010 and 2011 and concluded that the QA/QC program is acceptable for the resource estimates conducted. SRK reviewed the sample preparation, analysis and security

33
Criteria 2012 JORC Code explanation Commentary
practices and determined that the procedures followed generally meet or exceed industry standards. Details are documented in Section 10 (Sample Preparation, Analyses, and Security) and Section 12 (Data Verification) in the ”OJVG Golouma Gold Project Updated Feasibility Study Technical Report, Senegal, prepared for the Oromin Joint Venture Group” dated March 15, 2013.
• Teranga experienced discrepancies in the metallurgical account balancing when comparing accumulated daily production vs actual gold poured in Q3-2014. This resulted in, among other things, an audit of the aqua regia assay procedures at the on-site Sabodala SGS laboratory. Conclusions from this audit revealed a high bias for gold analyses starting in January 2014 and became progressively worse until it was detected and corrected in October 2014. The high bias was created when gold primary calibration solution standards received in September 2013 slowly degraded, likely due to thermal effects due to the way the solutions were stored. The high bias on the leach feed samples at the Sabodala laboratory from June to mid October 2014 varied between 6.1% and 13.6%. SGS has since implemented internal quality controls, with periodic monitoring of procedures by Teranga.
Section 2: Reporting of Exploration Results
(Criteria listed in the preceding section also apply to this section.)
Criteria 2012 JORC Code explanation Commentary
Mineral tenement and land tenure status
• Type, reference name/number, location and ownership including agreements or material issues with third parties such as joint ventures, partnerships, overriding royalties, native title interests, historical sites, wilderness or national park and environmental settings.
• The security of the tenure held at the time of reporting along with any known impediments to obtaining a licence to operate in the area.
• Sabodala Mining Concession – with full exploitation rights - granted by Senegalese Presidential Decree on April 2, 2007 for an initial 10 year term. Extension, in advance, until April 2022 has been committed to by the State of Senegal. Further details on the Sabodala Mining Concession have been provided by Teranga in prior disclosures. Sabodala Gold Operations SA, the holder of the Sabodala Mining Concession is 90% owned by Teranga
• Golouma Mining Concession – with full exploitation rights – granted by Senegalese Presidential Decree on January 26, 2010 for an initial 15 year term. SOMIGOL, the holder of the Golouma Mining Concession, is 90% owned by Teranga
• Both mining concessions are considered secure
Exploration done by other parties
• Acknowledgment and appraisal of exploration by other parties.
• Prior to Teranga’s acquisition of the Sabodala Gold mining operation in December 2010, exploration work on the Sabodala Mining Concession was conducted by Mineral Deposits Limited
• Prior to Teranga’s acquisition of the Golouma gold mining operation, exploration work on the Golouma Mining Concession was conducted by the Oromin Joint Venture Group Ltd.
• Prior to majority acquisition of the Gora deposit exploration activities were conducted by Axmin Inc.
Geology • Deposit type, geological setting and style of mineralisation.
• The Sabodala and SOMIGOL gold deposits and prospects are orogenic and localized adjacent to major faults in second and third order shear zones within volcano-sedimentary belts between granitic domains.
• Masato mineralization occurs within a north to northeast oriented shear zone consisting of strongly ductile-deformed greenschist facies metabasalts and meta-ultramafic units. Gold mineralization is associated with intensely altered zones dominated by the presence of carbonate, silica and pyrite. Numerous felsic dykes occur in close proximity with mineralization.

34
Criteria 2012 JORC Code explanation Commentary
• Golouma Northwest mineralization is hosted by a relatively narrow (2m to 10m) east-southeast striking shear zone that dips steeply to the south. Alteration is characterized by a moderate to strong carbonate-sericite-silica-pyrite mineral assemblage and is accompanied locally by quartz-tourmaline veining.
• Maki Medina East gold mineralization occurs within 2 meter to 5 meter wide zones of weakly sheared metavolcanics and metasediments with silica-carbonate-sericite alteration with narrow (1 to 3 cm wide) quartz-carbonate veins.
• Goumbati West gold mineralization is developed within 2 meter to 3 meter wide quartz veins occurring in metasediments (epiclastics) and lesser metavolcanics with quartz-carbonate alteration.
• Goumbati East gold mineralization occurs in 2 meter to 3 meter wide quartz-carbonate vein sets within silica-carbonate altered, occasionally brecciated metavolcanics with disseminated pyrite.
• Kouroundi gold mineralization is developed in sheared quartz-carbonate veins developed within sheared metavolcanics and at the contact with metasediments, and is brecciated in places with strong silica alteration with disseminated pyrite.
• Gold mineralization in the Soreto prospect occurs in smoky and white quartz veins developed in sheared and brecciated intrusives and sediments controlled by north and north-northeast trending structures, dipping steeply to the southeast.
• KD gold mineralization occurs within fine grained metasediments containing 1 to 50 cm wide smoky quartz veins developed parallel to the sediment cleavage.
• KA gold mineralization occurs in smoky quartz vein stringers with associated fine grained pyrite developed at the contact between a flat lying felsic intrusive and fine grained metasediments.
• Marougou gold mineralization occurs within sheared and deformed medium grained arkoses and fine grained argillite up to 10 meters in width with fabric parallel quartz-carbonate veinlets with oxidized sulphides. The trend of mineralized structures has yet to be determined.
Drill hole Information
• A summary of all information material to the understanding of the exploration results including a tabulation of the following information for all Material drill holes: o easting and northing of the drill hole collar o elevation or RL (Reduced Level – elevation
above sea level in metres) of the drill hole collar
o dip and azimuth of the hole o down hole length and interception depth o hole length.
• If the exclusion of this information is justified on the basis that the information is not Material and this exclusion does not detract from the understanding of the report, the Competent Person should clearly explain why this is the case.
• All drill hole collar locations, azimuth, dip and gold assay intercept data received to date is available on the Teranga Gold company website at www.terangagold.com.
35
Criteria 2012 JORC Code explanation Commentary
Data aggregation methods
• In reporting Exploration Results, weighting averaging techniques, maximum and/or minimum grade truncations (eg cutting of high grades) and cut-off grades are usually Material and should be stated.
• Where aggregate intercepts incorporate short lengths of high grade results and longer lengths of low grade results, the procedure used for such aggregation should be stated and some typical examples of such aggregations should be shown in detail.
• The assumptions used for any reporting of metal equivalent values should be clearly stated.
• Gold intercepts are reported as length-weighted average grades in grams per tonne, with a maximum of 2 metres contiguous internal dilution and no external dilution. Assays are not capped prior to averaging. A 0.2 g/t Au minimum cut-off grade was applied.
• Grade intersections and inclusive higher grade intersections are reported separately and available on the Teranga Gold company website at www.terangagold.com.
Relationship between mineralisation widths and intercept lengths
• These relationships are particularly important in the reporting of Exploration Results.
• If the geometry of the mineralisation with respect to the drill hole angle is known, its nature should be reported.
• If it is not known and only the down hole lengths are reported, there should be a clear statement to this effect (eg ‘down hole length, true width not known’).
• Down hole core lengths are reported, as true widths have not yet been determined.
Diagrams • Appropriate maps and sections (with scales) and tabulations of intercepts should be included for any significant discovery being reported These should include, but not be limited to a plan view of drill hole collar locations and appropriate sectional views.
• Plan view maps of drill hole collar locations for Maki Medina East, Goumbati East and West, Kouroundi, KA and Marougou are available on the Teranga Gold company website at www.terangagold.com.
Balanced reporting
• Where comprehensive reporting of all Exploration Results is not practicable, representative reporting of both low and high grades and/or widths should be practiced to avoid misleading reporting of Exploration Results.
• A representative selection of low and high grade intercepts are reported in the body of the press release, with a comprehensive listing of all gold intercept results available on the Teranga Gold company website at www.terangagold.com.
Other substantive exploration data
• Other exploration data, if meaningful and material, should be reported including (but not limited to): geological observations; geophysical survey results; geochemical survey results; bulk samples – size and method of treatment; metallurgical test results; bulk density, groundwater, geotechnical and rock characteristics; potential deleterious or contaminating substances.
• No other meaningful or material exploration data has been collected.
Further work • The nature and scale of planned further work (eg tests for lateral extensions or depth extensions or large-scale step-out drilling).
• Diagrams clearly highlighting the areas of possible extensions, including the main geological interpretations and future drilling areas, provided this information is not commercially sensitive.
• All data will be compiled and analysed for future follow-up programs at Maki Medina East, Goumbati East and West, Kouroundi, KA and Marougou.
Section 3: Estimation and Reporting of Mineral Resources Criteria 2012 JORC Code explanation Commentary
Database integrity
• Measures taken to ensure that data has not been corrupted by, for example, transcription or keying errors, between its initial collection and its use for Mineral Resource estimation purposes.
• Data validation procedures used.
• SGO drill hole logs were recorded manually on logging forms, entered into Excel spreadsheets then uploaded into MS Access databases. Assay data was received from the laboratories in csv format and merged into the master databases, with access restricted to a few personnel responsible for database management.
• Routine validation checks were run in MS Access as well as additional checking against original sources of data (hole collar surveys, downhole survey records, drill hole logs and assay certificates). Drill holes were visually validated using Maptek’s Vulcan® software.

36
Criteria 2012 JORC Code explanation Commentary
Site visits • Comment on any site visits undertaken by the Competent Person and the outcome of those visits.
• If no site visits have been undertaken indicate why this is the case.
• The Competent Person has visited the site on a regular basis to review and evaluate the drilling programs; procedures for drilling, logging, sampling, Quality Assurance/Quality Control and database validation; and review the geological, mineralization and structural characteristics of each deposit.
Geological interpretation
• Confidence in (or conversely, the uncertainty of ) the geological interpretation of the mineral deposit.
• Nature of the data used and of any assumptions made.
• The effect, if any, of alternative interpretations on Mineral Resource estimation.
• The use of geology in guiding and controlling Mineral Resource estimation.
• The factors affecting continuity both of grade and geology.
• Geological interpretation is based on surface mapping, with additional pit mapping at Sabodala, Masato and Gora, and surface holes drilled on a nominal 40 m by 40 m spacing. In addition, geophysical surveys and structural studies were used to interpret geological and structural trends. Locally, closer spaced drill holes confirm the geological interpretation and continuity of grade and geology in the mineralized zones. Gold mineralization is structurally controlled, with the location and trend of the mineralized structures reasonably defined.
• Geology and grade continuity are affected by local variations in folding, faulting, thinning and widening of zones.
• Wireframe models were generated around zones with similar geology, alteration and grade characteristics following interpreted geology and structural trends, and treated as hard boundaries for resource estimation.
Dimensions • The extent and variability of the Mineral Resource expressed as length (along strike or otherwise), plan width, and depth below surface to the upper and lower limits of the Mineral Resource.
• The extents of the Mineral Resources vary and follow different structural and geological trends for each deposit. A detailed description of all deposits are documented in Section 14 (Mineral Resource Estimates) in the “Technical Report for the Sabodala Gold Project, Republic of Senegal, Africa, prepared for Teranga Gold Corporation” dated March 13, 2014.
Estimation and modelling techniques
• The nature and appropriateness of the estimation technique(s) applied and key assumptions, including treatment of extreme grade values, domaining, interpolation parameters and maximum distance of extrapolation from data points. If a computer assisted estimation method was chosen include a description of computer software and parameters used.
• The availability of check estimates, previous estimates and/or mine production records and whether the Mineral Resource estimate takes appropriate account of such data.
• The assumptions made regarding recovery of by-products.
• Estimation of deleterious elements or other non-grade variables of economic significance (eg sulphur for acid mine drainage characterisation).
• In the case of block model interpolation, the block size in relation to the average sample spacing and the search employed.
• Any assumptions behind modelling of selective mining units.
• Any assumptions about correlation between variables.
• Description of how the geological interpretation was used to control the resource estimates.
• Discussion of basis for using or not using grade cutting or capping.
• The process of validation, the checking process used, the comparison of model data to drill hole data, and use of reconciliation data if available.
• The estimation methods used to update the revised block models were determined separately for each zone and generally determined by the number and spacing of composites in each zone as well as the zone extents. High grade gold assays were capped by zone prior to compositing. Block grades were interpolated using Inverse Distance Squared (ID2), Inverse Distance Cubed (ID3) or Ordinary Kriging (OK), except for Diadiako where the Nearest Neighbour (“NN”) estimation method was used to estimate Inferred Resources using Maptek’s Vulcan® software. A detailed description of the interpolation parameters used will be documented in a revised technical report, however, accepted industry standards were followed.
• There have been no revisions to the resource models for 2015, except for adjustments due to mining depletion and minor revisions to Niakafiri Main, Niakafiri SW, Maki Medina and Diadiako. Check estimates were run using different interpolation methods.
• No assumptions were made regarding recovery of by-products.
• Deleterious elements or other non-grade variables of economic significance were estimated.
• Sub-blocked resource models were generated for Sabodala, Gora, Niakafiri Main, Niakafiri SW, Masato, Golouma, Kerekounda, Maki Medina and Diadiako. A maximum parent block size of 5 m by 5 m by 5 m (x, y, z) was generated inside the mineralization wireframes with a minimum 0.5m by 0.5m by 0.5m (x, y, z) sub-block size generated at the wireframe boundaries.
• Niakafiri West and Soukhoto resource models are regularized models with 5m by 5m by 2.5m blocks.
• All other resource block models are percent models, with 5 m by 5 m by 5 m blocks, except for Kourouloulou which has 3m by 3m by 3m blocks.
37
Criteria 2012 JORC Code explanation Commentary
• Block grades were estimated using 1 meter composites in holes with approximate 40 m by 40 m spacing, and 20 m by 20 m spacing locally, except for Maki Medina which was estimated using 2 meter composites and Niakafiri Main which was estimated using 2.5 meter composites.
• Grade interpolation searches followed the orientation of each mineralization zone. Multiple interpolation passes were run on each zone, with the minimum search radius of the 1st pass generally approximating the hole spacing in the plane (determined by strike and dip) of the wireframe.
• A maximum parent block size of 5 m by 5 m by 5 m inside the mineralization wireframes was determined by the mining equipment used and size of the selective mining unit at the Sabodala, Masato and Gora open pit operations.
• No assumptions were made about the correlation between variables.
• Mineralization wireframes were treated as hard boundaries with block grades estimated inside each wireframe using only the samples located inside the same wireframe.
• Appropriate capping levels were applied to raw gold assays by zone, prior to compositing, and based on a combination of histograms, cumulative probability plots, decile analysis and cutting curves.
• Validation consisted of visual validation comparing assay and composite grades to block grade estimates, comparison of “well-informed” block grades with composites contained within the same blocks in each mineralized zone and comparison of average composite grades to block grades along different directions using swath plots.
Moisture • Whether the tonnages are estimated on a dry basis or with natural moisture, and the method of determination of the moisture content.
• Tonnages were estimated on a dry basis.
Cut-off parameters
• The basis of the adopted cut-off grade(s) or quality parameters applied.
• For reporting open pit Mineral Resources, open pit shells were produced for each of the resource models using Whittle open pit optimization software. Only classified blocks greater than or equal to the open pit cut-off grades and within the open pit shells were reported. Open pit oxide Mineral Resources are estimated at a cut-off grade of 0.35 g/t Au, except for Gora at 0.48 g/t Au. Open pit transition and fresh rock Mineral Resources are estimated at a cut-off grade of 0.40 g/t Au, except for Gora at 0.55 g/t Au.
• For reporting underground Mineral Resources, only classified blocks greater than or equal to the cut-off grade outside of the open pit shells were reported. In addition, Deswik Stope Optimizer software was used to generate wireframe models to constrain blocks satisfying minimum size and continuity criteria for reporting. Underground Mineral Resources are estimated at a cut-off grade of 2.0 g/t Au.
• Mineral Resources are estimated using a gold price of US$1,450 per ounce.
Mining factors or assumptions
• Assumptions made regarding possible mining methods, minimum mining dimensions and internal (or, if applicable, external) mining dilution. It is always necessary as part of the process of determining reasonable prospects for eventual economic extraction to consider potential mining methods, but the assumptions made regarding mining methods and parameters when estimating Mineral Resources may not always be rigorous. Where this is the case, this should be reported with an explanation of the basis of the mining assumptions made.
• For near surface Mineral Resources, open pit mining methods using a range of 2m to 4m minimum width is dependent on mining equipment and local mineralization widths within open pit resource shells.
• Some portions of the Mineral Resources below the open pit resource shells were considered to be suitable for underground mining. The Cut and Fill mining method at a minimum width of approximately 2.5 m was assumed in ore development.

38
Criteria 2012 JORC Code explanation Commentary
Metallurgical factors or assumptions
• The basis for assumptions or predictions regarding metallurgical amenability. It is always necessary as part of the process of determining reasonable prospects for eventual economic extraction to consider potential metallurgical methods, but the assumptions regarding metallurgical treatment processes and parameters made when reporting Mineral Resources may not always be rigorous. Where this is the case, this should be reported with an explanation of the basis of the metallurgical assumptions made.
• Ongoing metallurgical analyses are conducted on the Sabodala deposit currently operating as an open pit mine. Additional detailed metallurgical test work has been conducted on the Gora, Masato and Golouma deposits, which contain Mineral Reserves.
• Metallurgical testing of the additional Mineral Resources is assumed to have similar leach amenability due to the mineralization similarities.
Environmental factors or assumptions
• Assumptions made regarding possible waste and process residue disposal options. It is always necessary as part of the process of determining reasonable prospects for eventual economic extraction to consider the potential environmental impacts of the mining and processing operation. While at this stage the determination of potential environmental impacts, particularly for a greenfields project, may not always be well advanced, the status of early consideration of these potential environmental impacts should be reported. Where these aspects have not been considered this should be reported with an explanation of the environmental assumptions made.
• All Mineral Resources are located on mine licence properties and are compliant with all environmental and social requirements as part of the operating licences.
Bulk density • Whether assumed or determined. If assumed, the basis for the assumptions. If determined, the method used, whether wet or dry, the frequency of the measurements, the nature, size and representativeness of the samples.
• The bulk density for bulk material must have been measured by methods that adequately account for void spaces (vugs, porosity, etc), moisture and differences between rock and alteration zones within the deposit.
• Discuss assumptions for bulk density estimates used in the evaluation process of the different materials.
• In-situ dry bulk density was determined from diamond drill core using the water displacement method. Poorly consolidated oxide samples and porous samples were coated with wax. Samples were approximately 10 cm long and correspond to most of the mineralized and unmineralized rock types in each deposit. OJVG samples were taken approximately every ten meters to include all rock and alteration types.
• Bulk density measurements were averaged by major rock type and by oxide and fresh rock for the Sabodala deposit. The average bulk densities for oxide and fresh rock were applied to the Niakafiri Main, Niakafiri West, Niakafiri SW, Gora, Soukhoto, Diadiako, Masato, Golouma, Kerekounda, and Maki Medina deposits. Bulk densities were interpolated for oxide and fresh rock for the other deposits due to the high local variability of densities.
Classification • The basis for the classification of the Mineral Resources into varying confidence categories.
• Whether appropriate account has been taken of all relevant factors (ie relative confidence in tonnage/grade estimations, reliability of input data, confidence in continuity of geology and metal values, quality, quantity and distribution of the data).
• Whether the result appropriately reflects the Competent Person’s view of the deposit.
• Mineral Resource classification follows Canadian Institute of Mining and Metallurgy and Petroleum (“CIM”) “Definition Standards (2014) for Mineral Resources and Mineral Reserves”. Mineral Resource classification is based on sample spacing, confidence in geological and grade continuity.
• Based on the knowledge of the geology, mineralization and structure of the deposits, the Mineral Resource classification reflects the Competent Person’s view of the deposits.
Audits or reviews • The results of any audits or reviews of Mineral Resource estimates.
• Periodic internal in-house reviews, external 3rd party peer reviews on specific deposits by industry experts and technical due diligence audits for financing were conducted.
Discussion of relative accuracy/ confidence
• Where appropriate a statement of the relative accuracy and confidence level in the Mineral Resource estimate using an approach or procedure deemed appropriate by the Competent Person. For example, the application of statistical or geostatistical procedures to quantify the relative accuracy of the resource within stated confidence limits, or, if such an approach is not deemed appropriate, a qualitative discussion of the factors that could affect the relative accuracy and
• The relative accuracy and confidence level in the Mineral Resource estimate is based on the application of appropriate and industry standard grade estimation methods specific to each deposit and mineralization zone. The Inverse Distance Squared (“ID2”), Inverse Distance Cubed (“ID3”) or Ordinary Kriging (“OK”) estimation methods have been applied to all deposits, except for Diadiako where the Nearest Neighbour (“NN”) estimation method was applied to generate Inferred Resources. Additional validation of the grade estimation

39
Criteria 2012 JORC Code explanation Commentary
confidence of the estimate. • The statement should specify whether it relates to
global or local estimates, and, if local, state the relevant tonnages, which should be relevant to technical and economic evaluation. Documentation should include assumptions made and the procedures used.
• These statements of relative accuracy and confidence of the estimate should be compared with production data, where available.
parameters and estimation methods is regularly conducted.
• The statement relates to Mineral Resource estimates by deposit, which includes the use of open pit shells to constrain open pit resources and reporting underground resources separately, using revised cut-off grades. Details of the revised Mineral Resource estimates will be documented in a revised technical report, however, Mineral Resource estimates were generated following accepted industry standards.
• Regular reconciliation of the Sabodala, Masato and Gora Mineral Resource estimates to the production grade control models and mill feed is undertaken to determine relative accuracy and confidence of the estimate.
Section 4 Estimation and Reporting of Ore Reserves
(Criteria listed in section 1, and where relevant in sections 2 and 3, also apply to this section.)
Criteria 2012 JORC Code explanation Commentary
Mineral Resource estimate for conversion to Ore Reserves
• Description of the Mineral Resource estimate used as a basis for the conversion to an Ore Reserve.
• Clear statement as to whether the Mineral Resources are reported additional to, or inclusive of, the Ore Reserves.
• Resources classified as Measured were used as the basis for Proven ore reserves, resources classified as Indicated were used as the basis for Probable ore reserves.
• The mineral resources are reported as inclusive to the ore reserves
Site visits • Comment on any site visits undertaken by the Competent Person and the outcome of those visits.
• If no site visits have been undertaken indicate why this is the case.
• Mr. Chawrun visits the site regularly, and was last there in January 2016.
Study status • The type and level of study undertaken to enable Mineral Resources to be converted to Ore
• Reserves. • The Code requires that a study to at least Pre-
Feasibility Study level has been undertaken to convert Mineral Resources to Ore Reserves. Such studies will have been carried out and will have determined a mine plan that is technically achievable and economically viable, and that material Modifying Factors have been considered.
• The Mineral Reserves are based on ongoing mining operations and are located within existing mine licences.
• The underground Mineral Reserves are at Pre-feasibility study level and have been estimated by an independent consultant.
Cut-off parameters
• The basis of the cut-off grade(s) or quality parameters applied.
• The cut-off grades used in the Lerch Grossman algorithm to produce pit designs range from 0.3-0.4 g/t for oxide ore and 0.4-0.6 g/t for fresh ore. These cut-offs were derived from actual and projected processing and refining economics based on a gold price of $1100 per recovered ounce, less applicable royalty payments. Operating costs were determined through extrapolation of 2015 actuals.
Mining factors or assumptions
• The method and assumptions used as reported in the Pre-Feasibility or Feasibility Study to convert the Mineral Resource to an Ore Reserve (i.e. either by application of appropriate factors by optimisation or by preliminary or detailed design).
• The choice, nature and appropriateness of the selected mining method(s) and other mining parameters including associated design issues such as pre-strip, access, etc.
• The assumptions made regarding geotechnical parameters (eg pit slopes, stope sizes, etc), grade control and pre-production drilling.
• The major assumptions made and Mineral Resource model used for pit and stope optimisation (if appropriate).
• The mining dilution factors used. • The mining recovery factors used. • Any minimum mining widths used.
• Lerch Grossman (Whittle) pitshell optimization was done based on current mining and processing costs for oxide and fresh material, an increase of $0.02 per 10 meter increase in depth, as well as distance of each deposit from the Sabodala mill. A complete pit design was produced for each deposit based on current mining practice at Sabodala.
• Geotechnical parameters at Sabodala were provided by Xstract Mining Consultants. Slope geometries, per pit design sector, were prescribed for each geotechnical domain based on restrictions highlighted through the above analyses. Bench heights range from 10m to 20m with face angles ranging from 60 to 75 degrees. Berm widths range from 8.5 to 10 meters.
• The dilution assumption at Sabodala and Niakafiri Main is consistent with actual operating dilution of approximately 10%. For Gora, Golouma, Kerekounda and Masato, dilution was modeled based on a 1m dilution skin and a 5m minimum mining width for selective mining.
40
Criteria 2012 JORC Code explanation Commentary
• The manner in which Inferred Mineral Resources are utilised in mining studies and the sensitivity of the outcome to their inclusion.
• The infrastructure requirements of the selected mining methods.
• Recovery factor is based on operating actuals from Sabodala mill and are a function of mill feed grade. Recovery % = 86.74 + (1.55 x Head Grade)
• Minimum mining width used in pit designs was 30m • Inferred resources were not considered in creating pit
designs
Metallurgical factors or assumptions
• The metallurgical process proposed and the appropriateness of that process to the style of mineralisation.
• Whether the metallurgical process is well-tested technology or novel in nature.
• The nature, amount and representativeness of metallurgical test work undertaken, the nature of the metallurgical domaining applied and the corresponding metallurgical recovery factors applied.
• Any assumptions or allowances made for deleterious elements.
• The existence of any bulk sample or pilot scale test work and the degree to which such samples are considered representative of the orebody as a whole.
• For minerals that are defined by a specification, has the ore reserve estimation been based on the appropriate mineralogy to meet the specifications?
• Metallurgical testing for the Sabodala project has spanned several years. Detailed metallurgical research was concentrated on the ore from the Sabodala deposit and formed the basis for the current plant design. Subsequent testing has been conducted on the Sabodala orebody as the deposit has continued to be mined at depth and the process plant continues to operate. Metallurgical testing for the Masato deposit was conducted and ore has been processed at the Sabodala plant since September 2014.
• Testwork for Gora was conducted and ore has been processed at the Sabodala plant since August 2015
• Additional reserves at Golouma, Kerekounda, Niakafiri Main, Maki Medina, Niakafiri SE and Niakafiri SW are to feasibility study level and assume an identical recovery process as is in place at the Sabodala project.
• The process plant and associated service facilities were designed to process run of mine (“ROM”) ore delivered to the primary crusher, to produce doré bars and tailings. The process encompasses crushing and grinding of the ROM ore, carbon in leach (CIL) cyanidation and adsorption, carbon stripping, electro-winning and smelting to produce gold bars that are then shipped to a refinery for further processing. The CIL tailings are thickened before placement in the tailings management facility (TMF) to conserve water.
Environmental • The status of studies of potential environmental impacts of the mining and processing operation. Details of waste rock characterisation and the consideration of potential sites, status of design options considered and, where applicable, the status of approvals for process residue storage and waste dumps should be reported.
• An Environmental and Social Impact Statement (ESIS) for the Project was completed in July 2006 by Tropica Environmental Consultants ("Tropica"), and an Environmental and Social Management and Monitoring Plan (ESMMP) was developed by Earth Systems in September 2007. Environmental Compliance Certification was granted by the Ministère de l'Environnement et de la Protection de la Nature on 22 January 2008. Sabodala has been an established operation since 2008 and has operated above these standards during this time period. This has included approvals and ongoing testwork for rock waste dump and tailings storage.
• The wasterock for Gora deposit had extensive geochemical testwork and there have been minimal areas determined to be potentially acid generating. A waste dump placement schedule that blends this wasterock with non-acid generating areas has been designed. Geochemical analysis has determined that a blended waste rock dump will not be acid generating.
• Geochemical analysis of the waste rock was conducted for the OJVG deposits as part of the feasibility study. It has been determined from this that the waste rock is non-acid generating. An ESIA has been submitted and a mine license has been granted for placement of the waste rock.
• A tailings deposition, construction and water balance plan has been developed using existing operating criteria for Sabodala tailings. No additional footprint will be required in addition the existing approvals.

41
Criteria 2012 JORC Code explanation Commentary
Infrastructure • The existence of appropriate infrastructure: availability of land for plant development, power, water, transportation (particularly for bulk commodities), labour, accommodation; or the ease with which the infrastructure can be provided, or accessed.
• The Sabodala project is an established operation with all required infrastructure facilities.
Costs • The derivation of, or assumptions made, regarding projected capital costs in the study.
• The methodology used to estimate operating costs.
• Allowances made for the content of deleterious elements.
• The derivation of assumptions made of metal or commodity price(s), for the principal minerals and co- products.
• The source of exchange rates used in the study. • Derivation of transportation charges. • The basis for forecasting or source of treatment
and refining charges, penalties for failure to meet specification, etc.
• The allowances made for royalties payable, both Government and private.
• Project capital costs are based on benchmarks for actual construction costs with existing infrastructure (where required), vendor quotations for mine mobile equipment and current operating costs for mine development.
• Operating costs derived from the existing Sabodala operations are used.
• Metallurgical testing and plant operating data have not revealed the requirement allowances due to the existence of deleterious elements.
• The reserves were based on $1100 gold price, close to current price as of Jan/16.
• Transportation, treatment and refining charges, royalties, etc. are based on existing contracts and government agreements.
Revenue factors • The derivation of, or assumptions made regarding revenue factors including head grade, metal or commodity price(s) exchange rates, transportation and treatment charges, penalties, net smelter returns, etc.
• he derivation of assumptions made of metal or commodity price(s), for the principal metals, minerals and co-products.
• The revenue factor was derived based on a transport and refining cost and a silver revenue of $2.35 per ounce based on historic production actuals. It is factored on a net smelter return of 99.92%.
• A 5% royalty rate as part of the Global Agreement with the Republic of Senegal applied to revenue from all deposits with an additional 1.5% added to the Gora deposit as royalty to the joint venture partner Axmin.
• A gold price of $1100 was used for pit optimization based on current (Jan 1, 2016) market prices.
Market assessment
• The demand, supply and stock situation for the particular commodity, consumption trends and factors likely to affect supply and demand into the future.
• A customer and competitor analysis along with the identification of likely market windows for the product.
• Price and volume forecasts and the basis for these forecasts.
• For industrial minerals the customer specification, testing and acceptance requirements prior to a supply contract.
• The principal commodity of SGO is gold. Gold is widely and freely traded on the international market, with known and instantly accessible pricing information.
Economic • The inputs to the economic analysis to produce the net present value (NPV) in the study, the source and confidence of these economic inputs including estimated inflation, discount rate, etc.
• NPV ranges and sensitivity to variations in the significant assumptions and inputs.
• The Sabodala project is a producing issuer. No material expansion of current annual production is required that has not been previously disclosed in a Technical Report.
Social • The status of agreements with key stakeholders and matters leading to social licence to operate.
• The Sabodala project is an operating mine and consults regularly and formally with all stakeholders. This includes (but is not limited to) nearby villages, local, regional and national government agencies, representation from the local and regional population.
• Teranga Gold has a formal corporate social responsibility (CSR) team in place and provides annual documentation on the extent of these activities to the public through its website.
• Parts of the Niakafiri Main reserves are located close to the village of Sabodala and will require re-settlement prior to mining. Negotiations and discussions for the re-settlement plan are ongoing.

42
Criteria 2012 JORC Code explanation Commentary
Other • To the extent relevant, the impact of the following on the project and/or on the estimation and classification of the Ore Reserves:
• Any identified material naturally occurring risks. • The status of material legal agreements and
marketing arrangements. • The status of governmental agreements and
approvals critical to the viability of the project, such as mineral tenement status, and government and statutory approvals. There must be reasonable grounds to expect that all necessary Government approvals will be received within the timeframes anticipated in the Pre-Feasibility or Feasibility study. Highlight and discuss the materiality of any unresolved matter that is dependent on a third party on which extraction of the reserve is contingent.
• All open pit and underground reserves are located within approved mine licences.
• Niakafiri reserves require resettlement of the Niakafiri village.
Classification • The basis for the classification of the Ore Reserves into varying confidence categories.
• Whether the result appropriately reflects the Competent Person’s view of the deposit.
• The proportion of Probable Ore Reserves that have been derived from Measured Mineral Resources (if any).
• Probable Ore Reserves are based on the CIM definition for Indicated Resources using geostatistical modeling techniques applicable to gold deposits. Proven Ore Reserves are based on the CIM definition for Measured Resources using geostatistical modeling techniques applicable to gold deposits, and second, stockpile inventory based on production drill assay data.
• The Ore Reserves classifications appropriately reflect the Competent Person’s view of the deposits.
• No proportion of Probable Ore Reserves has been derived from Measured Mineral Resources.
Audits or reviews • The results of any audits or reviews of Ore Reserve estimates.
• Teranga regularly engages independent qualified persons to review various technical aspects within their areas of expertise. o Annual site visits and audits are conducted for the
rock mass classification performance in the Sabodala pit. Additional review was conducted on the geotechnical analysis used for the OJVG feasibility study.
o Metallurgical testing and ore characterization is conducted regularly with the operating plant. Detailed review of the metallurgical tests to determine the amenability of the OJVG ore was conducted. Follow up testing is being performed on select OJVG ore to determine blending opportunities.
o Annual performance checks of the Sabodala tailings management facility are conducted by independent qualified persons. An updated deposition plan was created based on current performance.
o Resources and reserves are peer reviewed by independents as part of an internal process prior to public release of resources and reserves.
• In addition, Teranga has had independent qualified persons reviewing the resources and reserves for the purposes of technical due diligence required for financing activities.
Discussion of relative accuracy/ confidence
• Where appropriate a statement of the relative accuracy and confidence level in the Ore Reserve estimate using an approach or procedure deemed appropriate by the Competent Person. For example, the application of statistical or geostatistical procedures to quantify the relative accuracy of the reserve within stated confidence limits, or, if such an approach is not deemed appropriate, a qualitative discussion of the factors which could affect the relative accuracy and confidence of the estimate.
• The statement should specify whether it relates to global or local estimates, and, if local, state the
• The relative accuracy and confidence level in the Mineral Reserves estimate is based on the application the industry standard Lerchs-Grossman optimizer, using operating costs defined by the existing operation at Sabodala.
• The dilution and ore recovery estimates are based on a comprehensive sub-routine in Datamine software that evaluates the orebody geometry and applies the minimum mining width to the in-situ sub-blocked model on a bench by bench basis.
• The geotechnical parameters for the pit wall angles for Sabodala are based on a rock mass model derived from empirical data.
43
Criteria 2012 JORC Code explanation Commentary
relevant tonnages, which should be relevant to technical and economic evaluation. Documentation should include assumptions made and the procedures used.
• Accuracy and confidence discussions should extend to specific discussions of any applied Modifying Factors that may have a material impact on Ore Reserve viability, or for which there are remaining areas of uncertainty at the current study stage.
• It is recognised that this may not be possible or appropriate in all circumstances. These statements of relative accuracy and confidence of the estimate should be compared with production data, where available.
• The geotechnical parameters used for the OJVG pit walls are based on detailed testing for the OJVG feasibility study. This has been reviewed by an independent consultant and has been deemed to be adequate.
• The metallurgical testing for the OJVG ore has been reviewed and appears consistent with similar characteristics as the Sabodala ore.
• Regular reconciliation of the Sabodala Mineral Resource model to the production grade control model and mill feed is undertaken to determine relative accuracy and confidence of the estimate.