Cisco Cyber Vision GUI User Guide, Release 3.0.0
107
Cisco Cyber Vision GUI User Guide Cisco Systems, Inc. Rev. 0.0.2, 17 January 2020
-
Upload
khangminh22 -
Category
Documents
-
view
3 -
download
0
Transcript of Cisco Cyber Vision GUI User Guide, Release 3.0.0

Cisco Cyber Vision GUI User Guide
Cisco Systems, Inc.Rev. 0.0.2, 17 January 2020

Cisco Cyber Vision GUI User Guide
Rev. 0.0.2, 17 January 2020
Owner: Cisco IoT
Author: Juliette Maffet
Cisco Systems, Inc.
Trademark Acknowledgments
Cisco and the Cisco logo are trademarks or registered trademarks of Cisco and/or its affiliates in the U.S. and other countries. To view a list of Ciscotrademarks, go to this URL: www.cisco.com/go/trademarks.
Third party trademarks mentioned are the property of their respective owners.
The use of the word partner does not imply a partnership relationship between Cisco and any other company. (1110R)
Publication Disclaimer
Cisco Systems, Inc. assumes no responsibility for errors or omissions that may appear in this publication. We reserve the right to change this publication atany time without notice. This document is not to be construed as conferring by implication, estoppel, or otherwise any license or right under any copyright orpatent, whether or not the use of any information in this document employs an invention claimed in any existing or later issued patent. A printed copy of thisdocument is considered uncontrolled. Refer to the online version for the latest revision.
Copyright
© 2018 Cisco and/or its affiliates. All rights reserved.
Information in this publication is subject to change without notice. No part of this publication may be reproduced or transmitted in any form, by photocopy,microfilm, xerography, or any other means, or incorporated into any information retrieval system, electronic or mechanical, for any purpose, without theexpress permission of Cisco Systems, Inc.
Americas HeadquartersCisco Systems, Inc.San Jose, CA
Asia Pacific HeadquartersCisco Systems (USA) Pte. Ltd.Singapore
Europe HeadquartersCisco Systems International BV AmsterdamThe Netherlands
Cisco has more than 200 offices worldwide. Addresses, phone numbers, and fax numbers are listed on the Cisco Website at www.cisco.com/go/offices.
Total pages: 107

Contents1 About this documentation. . . . . . . . . . . . . . . . . . . . . . . . . . . . . . . . . . . . . . . . . . . . 5
1.1 Document purpose. . . . . . . . . . . . . . . . . . . . . . . . . . . . . . . . . . . . . . . . . . . . . . . 51.2 Warnings and notices. . . . . . . . . . . . . . . . . . . . . . . . . . . . . . . . . . . . . . . . . . . . . 5
2 Introduction. . . . . . . . . . . . . . . . . . . . . . . . . . . . . . . . . . . . . . . . . . . . . . . . . . . . . . . . 62.1 Cisco Cyber Vision Installation. . . . . . . . . . . . . . . . . . . . . . . . . . . . . . . . . . . . . . 62.2 Cisco Cyber Vision overview. . . . . . . . . . . . . . . . . . . . . . . . . . . . . . . . . . . . . . . 6
3 Understanding concepts. . . . . . . . . . . . . . . . . . . . . . . . . . . . . . . . . . . . . . . . . . . . . . 73.1 Preset. . . . . . . . . . . . . . . . . . . . . . . . . . . . . . . . . . . . . . . . . . . . . . . . . . . . . . . . . . 73.2 Filters. . . . . . . . . . . . . . . . . . . . . . . . . . . . . . . . . . . . . . . . . . . . . . . . . . . . . . . . . . 7
3.2.1 Inclusive filtering. . . . . . . . . . . . . . . . . . . . . . . . . . . . . . . . . . . . . . . . . . 83.2.2 Restrictive filtering. . . . . . . . . . . . . . . . . . . . . . . . . . . . . . . . . . . . . . . 103.2.3 Negative filtering. . . . . . . . . . . . . . . . . . . . . . . . . . . . . . . . . . . . . . . . . 14
3.3 Component. . . . . . . . . . . . . . . . . . . . . . . . . . . . . . . . . . . . . . . . . . . . . . . . . . . . 173.3.1 Aggregation of components. . . . . . . . . . . . . . . . . . . . . . . . . . . . . . . . 19
3.4 Activity. . . . . . . . . . . . . . . . . . . . . . . . . . . . . . . . . . . . . . . . . . . . . . . . . . . . . . . . 243.5 Flow. . . . . . . . . . . . . . . . . . . . . . . . . . . . . . . . . . . . . . . . . . . . . . . . . . . . . . . . . . 253.6 Time span. . . . . . . . . . . . . . . . . . . . . . . . . . . . . . . . . . . . . . . . . . . . . . . . . . . . . 263.7 Tags. . . . . . . . . . . . . . . . . . . . . . . . . . . . . . . . . . . . . . . . . . . . . . . . . . . . . . . . . . 303.8 Properties. . . . . . . . . . . . . . . . . . . . . . . . . . . . . . . . . . . . . . . . . . . . . . . . . . . . . 333.9 Vulnerabilities. . . . . . . . . . . . . . . . . . . . . . . . . . . . . . . . . . . . . . . . . . . . . . . . . . 343.10 Events. . . . . . . . . . . . . . . . . . . . . . . . . . . . . . . . . . . . . . . . . . . . . . . . . . . . . . . 373.11 Credentials. . . . . . . . . . . . . . . . . . . . . . . . . . . . . . . . . . . . . . . . . . . . . . . . . . . 383.12 Variable accesses. . . . . . . . . . . . . . . . . . . . . . . . . . . . . . . . . . . . . . . . . . . . . . 40
4 Navigating through Cisco Cyber Vision. . . . . . . . . . . . . . . . . . . . . . . . . . . . . . . . . . 434.1 General Dashboard. . . . . . . . . . . . . . . . . . . . . . . . . . . . . . . . . . . . . . . . . . . . . . 434.2 Explore. . . . . . . . . . . . . . . . . . . . . . . . . . . . . . . . . . . . . . . . . . . . . . . . . . . . . . . . 45
4.2.1 Preset views. . . . . . . . . . . . . . . . . . . . . . . . . . . . . . . . . . . . . . . . . . . . . 464.2.2 Right side panel. . . . . . . . . . . . . . . . . . . . . . . . . . . . . . . . . . . . . . . . . . 56
4.3 Reports. . . . . . . . . . . . . . . . . . . . . . . . . . . . . . . . . . . . . . . . . . . . . . . . . . . . . . . 604.4 Events. . . . . . . . . . . . . . . . . . . . . . . . . . . . . . . . . . . . . . . . . . . . . . . . . . . . . . . . 61
4.4.1 The Dashboard. . . . . . . . . . . . . . . . . . . . . . . . . . . . . . . . . . . . . . . . . . 624.4.2 The Calendar. . . . . . . . . . . . . . . . . . . . . . . . . . . . . . . . . . . . . . . . . . . . 63
4.5 Monitor. . . . . . . . . . . . . . . . . . . . . . . . . . . . . . . . . . . . . . . . . . . . . . . . . . . . . . . 644.5.1 Monitor mode. . . . . . . . . . . . . . . . . . . . . . . . . . . . . . . . . . . . . . . . . . . 64
4.6 Search. . . . . . . . . . . . . . . . . . . . . . . . . . . . . . . . . . . . . . . . . . . . . . . . . . . . . . . . 754.7 System administration. . . . . . . . . . . . . . . . . . . . . . . . . . . . . . . . . . . . . . . . . . . 77
4.7.1 System. . . . . . . . . . . . . . . . . . . . . . . . . . . . . . . . . . . . . . . . . . . . . . . . . 774.7.2 Data management. . . . . . . . . . . . . . . . . . . . . . . . . . . . . . . . . . . . . . . 814.7.3 Sensors. . . . . . . . . . . . . . . . . . . . . . . . . . . . . . . . . . . . . . . . . . . . . . . . . 82
Cisco Cyber Vision GUI User GuideRev. 0.0.2
Page 3Contents
4.7.4 Users. . . . . . . . . . . . . . . . . . . . . . . . . . . . . . . . . . . . . . . . . . . . . . . . . . 904.7.5 Events. . . . . . . . . . . . . . . . . . . . . . . . . . . . . . . . . . . . . . . . . . . . . . . . . . 914.7.6 API. . . . . . . . . . . . . . . . . . . . . . . . . . . . . . . . . . . . . . . . . . . . . . . . . . . . 924.7.7 License. . . . . . . . . . . . . . . . . . . . . . . . . . . . . . . . . . . . . . . . . . . . . . . . . 934.7.8 LDAP settings. . . . . . . . . . . . . . . . . . . . . . . . . . . . . . . . . . . . . . . . . . . . 954.7.9 pxGrid. . . . . . . . . . . . . . . . . . . . . . . . . . . . . . . . . . . . . . . . . . . . . . . . . . 97
4.8 System statistics. . . . . . . . . . . . . . . . . . . . . . . . . . . . . . . . . . . . . . . . . . . . . . . 1004.8.1 Center. . . . . . . . . . . . . . . . . . . . . . . . . . . . . . . . . . . . . . . . . . . . . . . . 1014.8.2 Sensors. . . . . . . . . . . . . . . . . . . . . . . . . . . . . . . . . . . . . . . . . . . . . . . . 104
4.9 My settings. . . . . . . . . . . . . . . . . . . . . . . . . . . . . . . . . . . . . . . . . . . . . . . . . . . 106
Cisco Cyber Vision GUI User GuideRev. 0.0.2
Page 4Contents

1.1
1.2
1 About this documentation
Document purposeThis user guide presents the concepts you will meet in Cisco Cyber Vision and how tonavigate within the application by explaining available features.It takes into consideration the GUI with the highest license level (Advantage) and involvesall available users roles (from full rights to read-only).This manual is applicable to system version 3.0.0.
IMPORTANT
Cisco Cyber Vision EAP is a snapshot of the ongoing development process and is in thequalifying phase. Testing for this program is under progress and may contain features that areincomplete or may change before the next full release.
Warnings and noticesThis manual contains notices you have to observe to ensure your personal safety as wellas to prevent damage to property.The notices referring to your personal safety and to your property damage arehighlighted in the manual by a safety alert symbol described below. These notices aregraded according to the degree of danger.
WARNING
Indicates risks that involve industrial network safety or production failure that could possiblyresult in personal injury or severe property damage if proper precautions are not taken.
IMPORTANT
Indicates risks that could involve property or Cisco equipment damage and minor personalinjury if proper precautions are not taken.
Note
Indicates important information on the product described in the documentation to whichattention should be paid.
Cisco Cyber Vision GUI User GuideRev. 0.0.2
Page 5About thisdocumentation

2.1
2.2
2 Introduction
Cisco Cyber Vision InstallationThe Cisco Cyber Vision GUI (Graphical User Interface) is an integral part of Cisco CyberVision. Thus, you cannot use it without prior installation and initialization of:1. The sensors, to capture traffic and visualize data on the GUI.2. The Center, to configure network interfaces that collect data from the sensors and
install Cisco Cyber Vision software.If not installed yet, please refer to the corresponding quickstart guides.If everything is ready to start using the GUI, note that at least one sensor has to beenrolled so that you can enjoy your first experience with the GUI. To do so, please referto Managing the sensors section in this documentation.
Cisco Cyber Vision overviewOne of the aims of the Cisco Cyber Vision GUI (Graphical User Interface) is to provide aneasy-to-use, real-time visualization of industrial networks. Access to some features maydepend on the license subscribed and on the user rights assigned. The application iscollaborative; which means that actions performed may have an impact on the users ofthe platform and be visible to them.
Cisco Cyber Vision GUI User GuideRev. 0.0.2
Page 6Introduction

3.1
■
■
■
■
■
■
3.2
3 Understanding concepts
PresetAs knowing an industrial network can be really challenging, presets have been created tohelp you navigating through its numerous data.A preset is a set of criteria. This concept is a fundamental of Cisco Cyber Vision that willallow you to explore the network in its details from what you need to see. For example, ifyou are an automatician you could be interested in knowing which PLCs are writingvariables. To reach this data, you just need to access one Preset (e.g. OT) and select twocriteria (e.g. PLC and Write Var). Think a preset as a magnifying glass in which you can seedetails of a big network by choosing the metadata processed by Cisco Cyber Vision thatmeet your business requirements. Several types of view are available to give you fullvisibility on the results and from different perspectives.Some generic presets are available by default. You can start by playing with these ones tosee what they have to offer. They have been created according to the recommendationsand big categories listed in Cisco's playbooks which are the following:
Basics, to see all data, or filter data to IT or OT components.Asset management, to identify and make an inventory of all assets associated withOT systems, OT process facilities and IT components.Communications management, to see flows according to their nature (OT, IT, ITinfrastructure, IPV6 communications, Microsoft flows).Security, to control remote accesses and insecure activities.Control system integrity, to check the state of industrial processes.Network quality, to see network detection issues.
The category My Preset contains customized presets. You can create presets usingcriteria to meet your own business logic. However, as Cisco Cyber Vision is a collaborativeapplication, it shouldn't be forgotten that customizations on presets are persistent andimpact other users.
FiltersA preset is defined with criteria to be matched. Criteria are set of filters that are used torefine a dataset.Criteria are mainly based on tags, which are metadata of your network on Componentsand Activities. However, if applicable, criteria can also rely on groups (if created) andsensors (if several are used by the Center). Thus, filters are distributed under thefollowing menus:
Cisco Cyber Vision GUI User GuideRev. 0.0.2
Page 7Understandingconcepts

3.2.1
If you deploy the component and activity tags menus, you will find categories thatcontain tags.
Besides, the fact that selections of tags is flexible and precise (you can select tagsindividually, or collectively by selecting their category), it's useful to know how filteringrules are applied to understand how to use them. Refer to the subsections of thischapter.
Inclusive filteringInclusive filtering relies on the selection of tags of the same type (there are two types oftags: component tags and activity tags).Inclusive filtering sticks to the "or" rule, that is when you select several tags of the sametype, elements will be added in the corresponding list even if they partially respond tothe request. By partially, it is intended that a result found out of an inclusive filteringcontains elements marked with the tag requested and any other tag. As a consequence,once you have selected a tag, the more tags you add to the selection, the more resultsyou get. This is not the case with restrictive filtering.When using inclusive filtering, preferably use the list view which corresponds to yourselection (i.e. the Component list or the Activity list).
Cisco Cyber Vision GUI User GuideRev. 0.0.2
Page 8Understandingconcepts

In the example below, we first view general results on the Dashboard and then switch tothe Component list view. In such cases results won't be relevant if positioned on theActivity list view. For more information about the different views available, refer to Presetviews .Example:The Dashboard of the Preset All data shows 147 components and 299 activities on thenetwork.
1. I select under the Component tags menu Device Level 0-1 (1 component) and DeviceLevel 2 (31 components).
2. As results, I get 29 components in the Component list.
Note
You expect a result of 32 components, instead you get 29. This is because ofaggregated components. For more information, refer to Aggregation ofcomponents .
Cisco Cyber Vision GUI User GuideRev. 0.0.2
Page 9Understandingconcepts

3.2.2 Restrictive filteringRestrictive filtering relies on the selection of tags of different types (there are two typesof tags: component tags and activity tags).Restrictive filtering sticks to the "and" rule, that is, when you select tags of differenttypes, and thus make a cross-selection, an element will display only if it answerspositively to both requests: If an element is marked with the tag requested in thecomponent tags menu, but is not marked with the tag requested from the Activity tagsmenu, it is rejected. As a consequence, the more tags you select, the less results youget...at least in the first instance. We will explain why below.When using restrictive filtering, preferably use a view with crossed data such as theDashboard and the Map Expert/Simple.In the example below, results appear on the Dashboard but can also be seen on theMaps. Results displayed in the Component and Activity list views can be irrelevant orpreferred for advanced use. For more information about the different views available,refer to Preset views .Example:
Cisco Cyber Vision GUI User GuideRev. 0.0.2
Page 10Understandingconcepts

The Dashboard of the Preset All data shows 147 components and 299 activities on thenetwork.
1. I select Device - Level 0-1 and Device - Level 2 under the Component tags menu.2. As results, I get 29 components and 96 activities on the Dashboard.
Cisco Cyber Vision GUI User GuideRev. 0.0.2
Page 11Understandingconcepts

Up to here, an inclusive filtering is performed because the selection is limited to tagsof the same type. This selection means "I want to see all components categorized asDevice - Level 0-1 and 2". Thus, the components marked with the corresponding tagsdisplay, as well as their activity.
3. I select Control system behavior under the Activity tags menu.4. As results, I get 28 components and 27 activities on the Dashboard.
Cisco Cyber Vision GUI User GuideRev. 0.0.2
Page 12Understandingconcepts
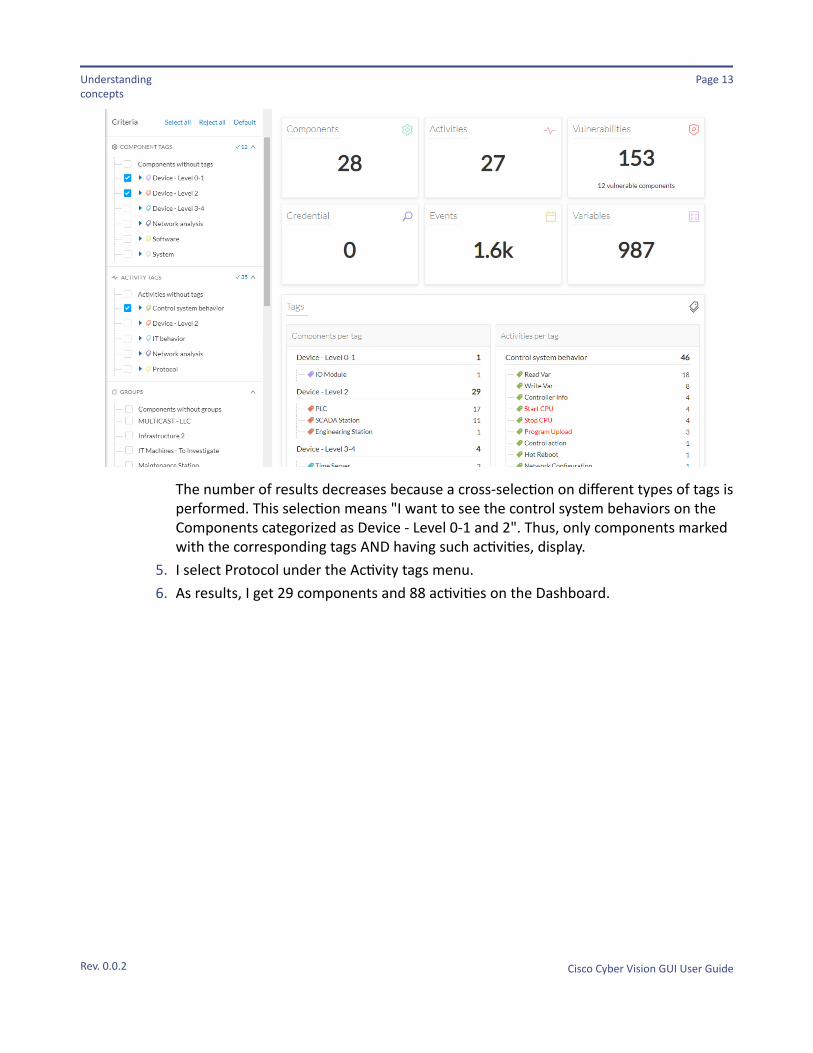
The number of results decreases because a cross-selection on different types of tags isperformed. This selection means "I want to see the control system behaviors on theComponents categorized as Device - Level 0-1 and 2". Thus, only components markedwith the corresponding tags AND having such activities, display.
5. I select Protocol under the Activity tags menu.6. As results, I get 29 components and 88 activities on the Dashboard.
Cisco Cyber Vision GUI User GuideRev. 0.0.2
Page 13Understandingconcepts
3.2.3
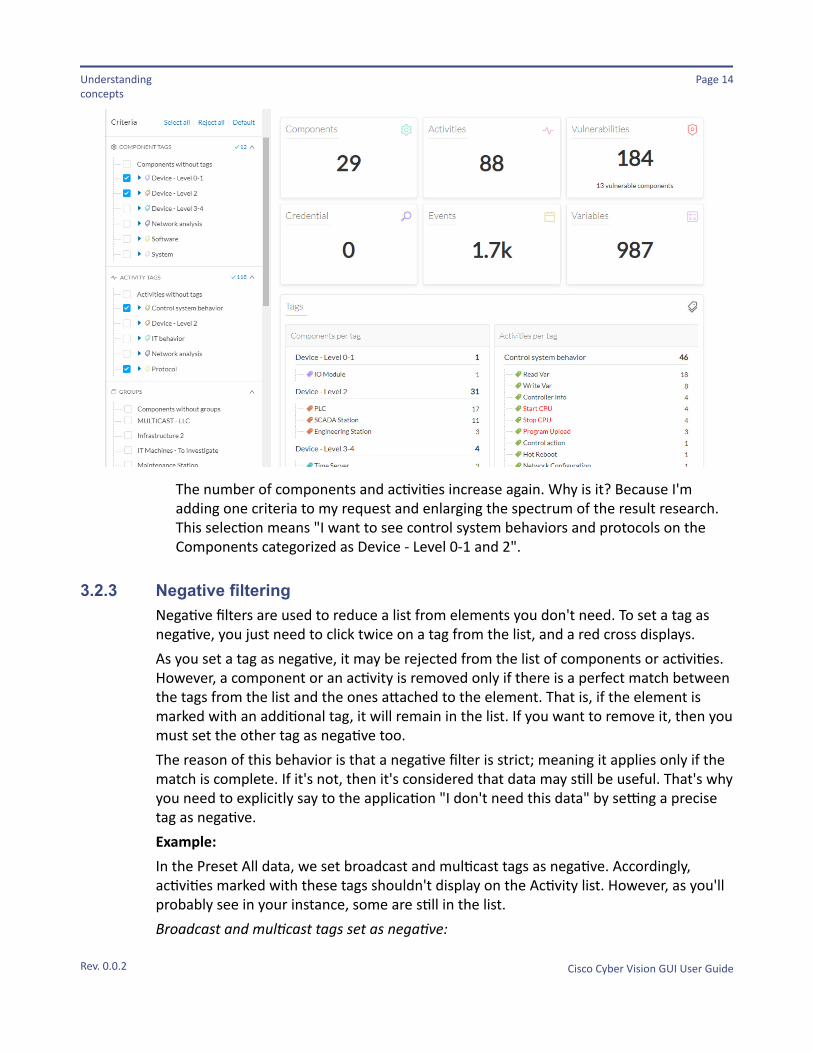
The number of components and activities increase again. Why is it? Because I'madding one criteria to my request and enlarging the spectrum of the result research.This selection means "I want to see control system behaviors and protocols on theComponents categorized as Device - Level 0-1 and 2".
Negative filteringNegative filters are used to reduce a list from elements you don't need. To set a tag asnegative, you just need to click twice on a tag from the list, and a red cross displays.As you set a tag as negative, it may be rejected from the list of components or activities.However, a component or an activity is removed only if there is a perfect match betweenthe tags from the list and the ones attached to the element. That is, if the element ismarked with an additional tag, it will remain in the list. If you want to remove it, then youmust set the other tag as negative too.The reason of this behavior is that a negative filter is strict; meaning it applies only if thematch is complete. If it's not, then it's considered that data may still be useful. That's whyyou need to explicitly say to the application "I don't need this data" by setting a precisetag as negative.Example:In the Preset All data, we set broadcast and multicast tags as negative. Accordingly,activities marked with these tags shouldn't display on the Activity list. However, as you'llprobably see in your instance, some are still in the list.Broadcast and multicast tags set as negative:
Cisco Cyber Vision GUI User GuideRev. 0.0.2
Page 14Understandingconcepts

The Activity list when setting broadcast and multicast tags as negative:
Cisco Cyber Vision GUI User GuideRev. 0.0.2
Page 15Understandingconcepts
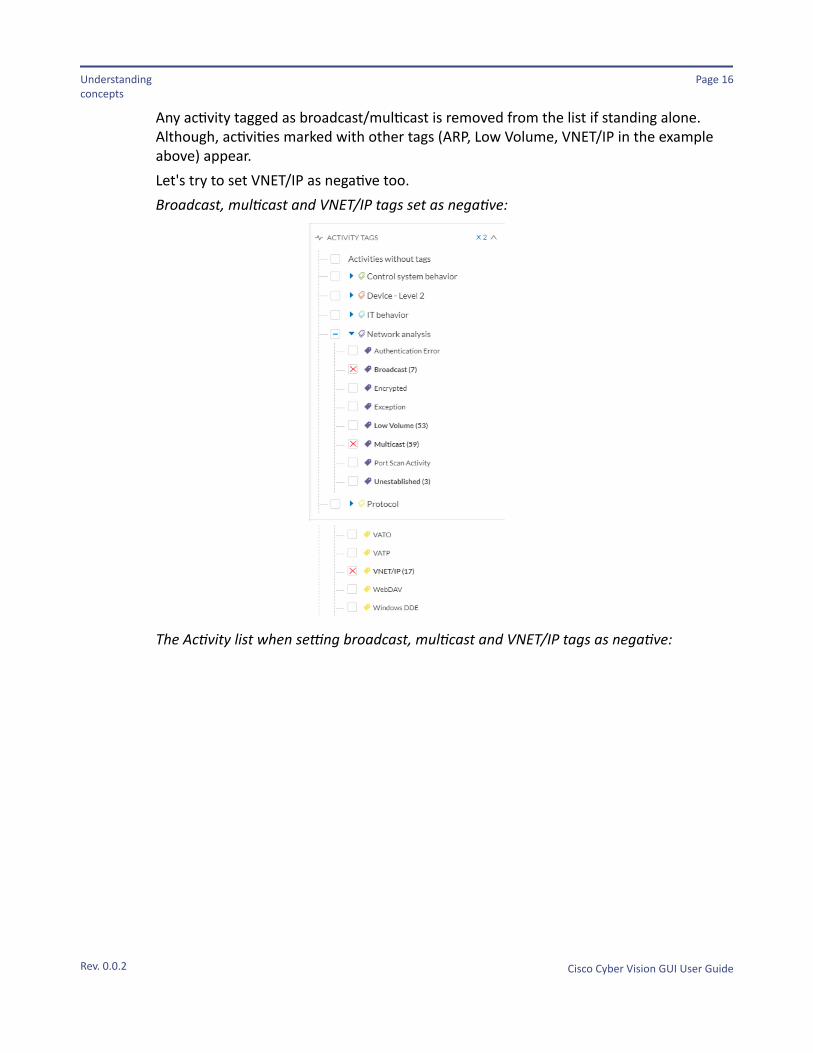
Any activity tagged as broadcast/multicast is removed from the list if standing alone.Although, activities marked with other tags (ARP, Low Volume, VNET/IP in the exampleabove) appear.Let's try to set VNET/IP as negative too.Broadcast, multicast and VNET/IP tags set as negative:
The Activity list when setting broadcast, multicast and VNET/IP tags as negative:
Cisco Cyber Vision GUI User GuideRev. 0.0.2
Page 16Understandingconcepts

3.3
The VNET/IP tag being set as negative, activities tagged with Broadcast, Multicast andVNET/IP disappear from the list.Activities marked with one of these three tags, plus any other tag (such as Low Volume orARP above) remain in the list.This behavior is to allow you to keep reducing your list gradually and don't miss anypotential important data in the meantime.
ComponentA component represents an object of the industrial network like a PLC, a PC, a SCADAstation, a network interface, etc. In the GUI, a component is shown as an icon in a box,either the manufacturer icon (if detected), or a more specific icon (for instance for aknown PLC model), a default cogwheel, a planet for a public IP, etc.Some examples of icons:
Cisco Cyber Vision GUI User GuideRev. 0.0.2
Page 17Understandingconcepts

■
Manufacturers icons
SIEMENS PLC icons A S7-300 PLC.
A Scalance X300 switch.
Default cogwheel The manufacturer has not been detected yet by Cisco Cyber Vision. OR The manufacturer has not been assigned a specific icon in Cisco's icon library.
Public IP
Broadcast Broadcast destination component.
Components can have a black and/or red counter badge:
Black counter badges display the number of aggregated components. Aggregationsare represented under a single component. If you click on an aggregation, the detailof components will appear on the right side panel. Aggregations are visible on the
Cisco Cyber Vision GUI User GuideRev. 0.0.2
Page 18Understandingconcepts

■
3.3.1
■
■
■
■
Maps Expert and Simple, and on the Component list. For more information, refer toAggregation of components .Red counter badges display the number of vulnerabilities detected on thecomponent. For more information, refer to Vulnerabilities .
In Cisco Cyber Vision, components are detected from the properties MAC address and (ifapplicable) IP address.
Note
MAC addresses are all physical interfaces inside the network. Instead, attribution of IPaddresses relies on the network configuration.
To be detected by Cisco Cyber Vision, an object needs to have some network activity(emission or reception). Thanks to Deep Packet Inspection technology, detailedinformation about a component is provided in the GUI. Thus, information like IP address,MAC address, manufacturer, first and last activity, tags, OS, Model, Firmware versiondepends on the data retrieved from the network. Data originates from thecommunications (i.e. flows ) exchanged between the components.When you click a component on a Map or a list, a side panel opens on the right with thecomponent detailed information.
Aggregation of componentsAn aggregation is a cluster of components that have been brought together because theyhave similar properties. In fact, components can share an IP address, a MAC address or aNetbios name. Enlightening such aggregations allows you to spot the type and functionof such clusters of components in the industrial network. Thus, aggregations can uncoverdevices such as PLCs and routers, several Ethernet interfaces with the same Netbiosname, and broadcast communications.The different types of aggregations are defined in Cisco Cyber Vision as follow:
Several components have the same MAC and the same IP addresses. Theaggregation is qualified as rack.Several components have the same MAC. These components may be located behinda router. The aggregation is qualified as router by default.Several components have the same Netbios name. These components are a samemachine with different network interfaces. Thus, the aggregation is qualified asNetbios.Several components have the same MAC (FF:FF:FF:FF:FF:FF) and a broadcastaddress -usually the last address of a subnet mask (e.g. in the 192.168.1.0/24network, the broadcast address is 192.168.1.255) or the IP address 255.255.255.255.Since this type of communications often produces network pollution, it is
Cisco Cyber Vision GUI User GuideRev. 0.0.2
Page 19Understandingconcepts

■
represented separately, with its own components. The aggregation is qualified asbroadcast.Particular case: Several components have the same IP address. It is assumed thatthese components are actually a single component seen through different sensors.The aggregation is qualified as IP.
Aggregations of components are fully visible in the Map - Simple and the Component listviews. The Map - Expert view, tough, only shows aggregations by IP address,independently of the aggregation types listed above.In any of these views, aggregations are enlightened thanks to a black counter badge.
Black counter badges display the number of aggregated components.Aggregations are represented under a single component. If you click onan aggregation, the detail of components will appear on the right sidepanel.
Examples:Rack type representation (same MAC, same IP):A rack type aggregation's right side panel in the Map - Simple view:
Cisco Cyber Vision GUI User GuideRev. 0.0.2
Page 20Understandingconcepts

In the Map - Simple view, components are aggregated by MAC and IP addresses andNetbios name. Here you have an example of how racks are represented. Racks, which special characteristic is to have components with the same MAC and thesame IP addresses, are especially well-handled in Cisco Cyber Vision's Map - Simple view.The PLC is represented onwards (1), and its modules are listed below (2).A rack type aggregation's right side panel in the Map - Expert view:
Cisco Cyber Vision GUI User GuideRev. 0.0.2
Page 21Understandingconcepts

In the Map - Expert view, components are aggregated by IP address. The same rack asabove is used in this example.The interest of checking an aggregation's right side panel in the Map - Expert view is thatyou can see specific information about each component of the aggregation.
Cisco Cyber Vision GUI User GuideRev. 0.0.2
Page 22Understandingconcepts

Summary of the different types of aggregation per view:
Cisco Cyber Vision GUI User GuideRev. 0.0.2
Page 23Understandingconcepts

3.4
■
■
■
■
■
■
■
■
View Visibility (black counter badge)
Aggregation Aggregation type
Dashboard No by IP, MAC, NetBIOS Rack, router, NetBIOS, Broadcast, IP aggregation
Map - Expert Yes by IP IP aggregation
Map - Simple Yes by IP, MAC, NetBIOS Rack, router, NetBIOS, Broadcast, IP aggregation
Purdue Model No - -
Component list Yes by IP, MAC, NetBIOS Rack, router, NetBIOS, Broadcast, IP aggregation
Activity list No - -
Mini Map No - -
ActivityAn activity is the representation of the communications exchanged between twocomponents . It is recognizable on the Maps by a line (or an arrow if the source anddestination components are known) which links one component to another:
An activity between two components is actually a simplified view of the flows exchanged.You can have many types of flows going in both directions inside an activity representedin the Maps.When you click on an activity in a Map, a right side panel opens, containing:
The date of the first and last communication between the two components.Details about the components (name, IP, MAC and if applicable the group they arepart of, their criticality).The tags on the flows.The number of flows.The number of packets.The volume of data exchanged.The number of events.A button to access the technical sheet that shows more details about tags and flows.
Cisco Cyber Vision GUI User GuideRev. 0.0.2
Page 24Understandingconcepts

3.5
Having a component in your Map with no activity does not mean that it did not have anyinteraction. In fact, a component can only be detected if at some point it has beeninvolved in a network activity (communication emission/reception). Lack of activity canmean that the other linked component is not part of the preset selected and so doesn'tdisplay.
FlowA flow is a single communication exchanged between two components. A group of flowsforms an activity , which is identifiable in the Maps by a line that links one component toanother. You can see flows by accessing a Technical sheet and then by clicking the Activitytab, or directly by clicking the number of flows on the right side panel .The Activity tab contains a list of flows which gives you detailed information about eachsingle flow: number of flows in the activity, source and destination components (ifknown), ports used, first and last activity, and tags which characterize each flow.
Cisco Cyber Vision GUI User GuideRev. 0.0.2
Page 25Understandingconcepts

3.6
The number of flows can be very important (there could be thousands). Consequently,filters are available in the table to sort flows by typing a component, a port, selectingtags, etc.
You can click on each flow in the list to have access to the flow's technical sheet forfurther information about the flow's properties and tags.
Time spanBecause Cisco Cyber Vision is a real-time monitoring solution, the Map is continuouslyupdated with network data. Thus, you can visualize the network activity during a definedperiod of time by selecting a time span.Time span is available on each preset's view.
Cisco Cyber Vision GUI User GuideRev. 0.0.2
Page 26Understandingconcepts

■
Note
No data display is often due to a time span set on an empty period. Remember to first set along period of time (such as This Year) before considering a troubleshooting.
Time span can be toggled between two modes:Live mode enabled is meant to see everything that had happened from the selectedperiod of time or a custom period up to now. You can use this mode so less datadisplays on the view you're on, and watch data evolution in real-time (data updateseach 10 seconds). It is advised to use this mode for short period of time.To set the live mode, click the Live button and select one of the options.
Cisco Cyber Vision GUI User GuideRev. 0.0.2
Page 27Understandingconcepts

■ Live mode disabled is meant to see everything that has happened during theselected period of time by setting its start and end. This mode is to view historicaldata by selecting a period of time from the past in the calendar. You can use thismode for example to check the network activity in case of on-site intrusion oraccident. This mode allows you to select any period of time and move around thanksto a player.
1. Click the period of time to set it in the calendar. Click the select time button to set amore precise period of time. Once set, the length of the period selected displays inbrackets.
Note
The value is set to 1 hour the first time you connect to Cisco Cyber Vision. Nexttimes, the last selection when leaving the session will be kept.
Cisco Cyber Vision GUI User GuideRev. 0.0.2
Page 28Understandingconcepts

■
■
■
■
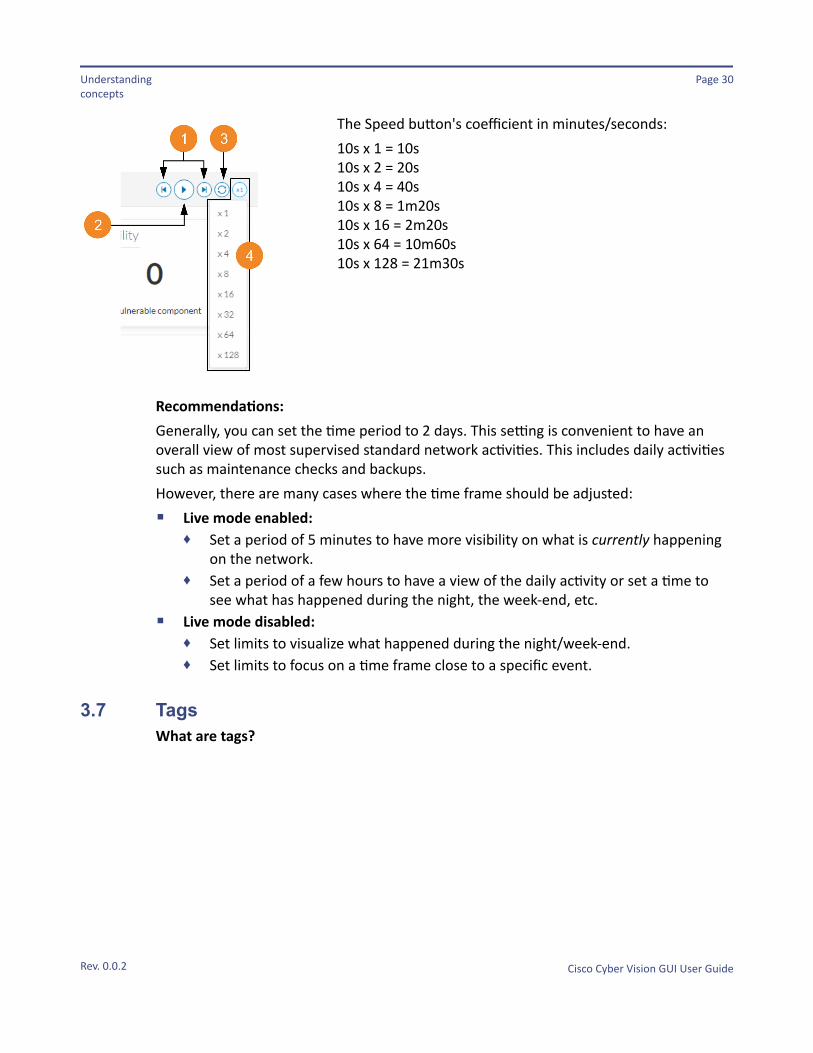
2. Once the period of time selected in the disabled live mode, use the buttons availableon the right to move through the period of time.The buttons to move through time are settable by selecting a coefficient under theSpeed button (see corresponding values below).Press Play to play data in the past. Data moves according to the speed set and refresheach 10 seconds. If you don't press pause, data will keep playing until the live mode isreached (the Live button turns to red in this case). Otherwise, you can use the Resumeto Live button.
Buttons to move within the period of time selected:
Buttons to move through time (1)Play/Pause button (2)Resume to Live button (3)Speed button (4)
Cisco Cyber Vision GUI User GuideRev. 0.0.2
Page 29Understandingconcepts
■
♦
♦
■
♦♦
3.7
The Speed button's coefficient in minutes/seconds:10s x 1 = 10s10s x 2 = 20s10s x 4 = 40s10s x 8 = 1m20s10s x 16 = 2m20s10s x 64 = 10m60s10s x 128 = 21m30s
Recommendations:Generally, you can set the time period to 2 days. This setting is convenient to have anoverall view of most supervised standard network activities. This includes daily activitiessuch as maintenance checks and backups.However, there are many cases where the time frame should be adjusted:
Live mode enabled:Set a period of 5 minutes to have more visibility on what is currently happeningon the network.Set a period of a few hours to have a view of the daily activity or set a time tosee what has happened during the night, the week-end, etc.
Live mode disabled:Set limits to visualize what happened during the night/week-end.Set limits to focus on a time frame close to a specific event.
TagsWhat are tags?
Cisco Cyber Vision GUI User GuideRev. 0.0.2
Page 30Understandingconcepts

■
■
Tags are meaningful labels that succinctly describe anetwork. They can be applied to components or activities.Some of them are red because they are considered asimportant. Each tag has a description and an icon color whichcorrespond to its category.
More specifically, tags are metadata on components and activities . Tags are generatedaccording to the properties of components and activities. Thus, there are two types oftags:
Component tags (1) which describe the functions of the component and arecorrelated to its properties.Activity tags (2) which describe the protocols used and are correlated to itsproperties. An activity tag is generated at the level of a flow and synthesized at thelevel of an activity (which is a group of flows between two components).
Each tag is classified under categories, which you can find in the filtering area, andapplies to a component or an activity.The component tags categories (Device - Level 0-1, Device - Level 2, etc.) and some tags(IO Module, Wireless IO Module) in the filtering area:
Cisco Cyber Vision GUI User GuideRev. 0.0.2
Page 31Understandingconcepts

Note
Device levels are based on the definitions presented in the ISA-95 international standard.
What are tags used for?Exploration of the network and Cisco Cyber Vision is mainly lead by tags. Criteria set onpresets are significantly based on tags to filter the different views.Also, tags are used to define behaviors (i.e. in the Monitor mode) inside an industrialnetwork when combined with information like source and destination ports and flowsproperties.Where to find tags?You will find tags almost everywhere in Cisco Cyber Vision. From criteria, which are basedon tags to filter network data, to the different views available. Views take differentperspectives and have different approaches concerning tags. For example, the dashboardshows the preset's results bringing out tags over other correlated data, while acomponent list highlights components over data like tags. Refer to the different types ofview to know more about them.If you want to know more about a tag, access the Basic tab inside a technical sheet to seethe tags' definition marked on a component and an activity.Some definitions of tags inside an activity's technical sheet:
Cisco Cyber Vision GUI User GuideRev. 0.0.2
Page 32Understandingconcepts

3.8 PropertiesWhat are properties?Properties are information such as IP and MAC addresses, hardware and firmwareversions, serial number, etc. that qualify components and flows. The sensor extractsflows properties from the packets captured. The Center then deduces componentsproperties from flows properties. Some properties are normalized for all componentsand some properties are protocol or vendor specific.What are properties used for?Besides from providing further details about components and flows, properties arecrucial in Cisco Cyber Vision to generate tags . And combination of properties and tagsare used to define behaviors (i.e. in the Monitor mode) inside the industrial network.Where to find properties?Properties are visible from components' right side panels and technical sheets under thetab Basics.A component's properties inside its technical sheet with normalized properties on the leftcolumn, and protocol and vendor specific properties on the right column:
Cisco Cyber Vision GUI User GuideRev. 0.0.2
Page 33Understandingconcepts

3.9
Note
Protocol and vendor specific properties evolve as more protocols are supported by Cisco CyberVision.
VulnerabilitiesWhat are vulnerabilities?Vulnerabilities are weaknesses detected on components that can be exploited by apotential attacker to perform malevolent actions on the network.Vulnerabilities are detected in Cisco Cyber Vision thanks to rules stored in the KnowledgeDB. These rules are sourced from several CERTs (Computer Emergency Response Team),manufacturers and partner manufacturers (Schneider, Siemens...). Technically, vulnerabilities are generated from the correlation of the Knowledge DB rulesand normalized component properties. A vulnerability is detected when a componentmatches a Knowledge DB rule.
IMPORTANT
It is important to update the Knowledge DB in Cisco Cyber Vision as soon as possible afternotification of a new version to be protected against vulnerabilities.
What are vulnerabilities used for?Example of a Siemens component's vulnerability visible on its technical sheet under theSecurity tab:
Information displayed about vulnerabilities (1) includes the vulnerability type andreference, possible consequences and solutions or actions to take on the network. Mostof the time though, it is enough to upgrade the component firmware. Some links to themanufacturer website are also available for more details on the vulnerability.
Cisco Cyber Vision GUI User GuideRev. 0.0.2
Page 34Understandingconcepts

A score reports the severity of the vulnerability (2). This score is calculated upon criteriafrom the Common Vulnerability Scoring System or CVSS.Criteria are for example the ease of attack, its impacts, the importance of the componenton the network, and whether actions can be taken remotely or not. The score can gofrom 0 to 10, with 10 being the most critical score.You also have the option to acknowledge a vulnerability (3) if you don't want to benotified anymore about it. This is used for example when a PLC is detected as vulnerablebut a firewall or a security module is placed ahead. The vulnerability is thereforemitigated. An acknowledgment can be canceled at any time. Vulnerabilitiesacknowledgment/cancelation is accessible to the Admin, Product and Operator usersonly.Where to find vulnerabilities?You can see vulnerabilities through the Component list. Sort the vulnerability column tobring vulnerable components up:
Moreover, vulnerabilities are pointed out in the Maps by a component with a red counterbadge (4). If you click this component, its side panel opens on the right with the numberof vulnerabilities evidenced in red (5).
Cisco Cyber Vision GUI User GuideRev. 0.0.2
Page 35Understandingconcepts

Clicking the vulnerabilities displayed in red (5) (in the above figure) opens thecomponent's technical sheet with further details about all its vulnerabilities:
Cisco Cyber Vision GUI User GuideRev. 0.0.2
Page 36Understandingconcepts

3.10
■
■
■
■
However, you'll be notified each time a component is detected as vulnerable by anevent . One event is generated per vulnerable component. An event is also generatedeach time a vulnerability is acknowledged or not vulnerable anymore.
EventsEvents are used to identify and keep track of significant activities on the network and onCisco Cyber Vision. It can be an activity, a property or a change whether it concernssoftware or hardware parts.For instance, an event can be:
A wrong password entered on Cisco Cyber Vision's GUI.A new component which has been connected to the network.An anomaly detected on the Monitor Mode.A component detected as vulnerable.
Events are visible in the Events page .
Cisco Cyber Vision GUI User GuideRev. 0.0.2
Page 37Understandingconcepts
3.11
New events may be generated when the database is updated (in real-time or each timean offline capture is uploaded to Cisco Cyber Vision) with a severity level (Critical, High,Medium and Low) customizable through the Events administration page .
CredentialsCredentials are logins and passwords that circulate between components over thenetwork. Such sensitive data sometimes carry cleartext passwords when unsafe; and ifcredentials are visible on Cisco Cyber Vision, then they're potentially visible to anyone onthe network. Credentials visibility on Cisco Cyber Vision should trigger awarenesstowards actions to be taken to properly secure the protocols used on a network.A component's right side panel showing the number of credentials detected:
Cisco Cyber Vision GUI User GuideRev. 0.0.2
Page 38Understandingconcepts

Credential frames are extracted from the network thanks to Deep Packet Inspection. Credentials are then accessible from a component's technical sheet under the security tab. You will find the number of credentials found (1), the protocol used (2), and the user name and password (3) with a button to unveil it (4). If a password appears in clear text, then action should be taken to secure it whether it is hashed or not.
Cisco Cyber Vision GUI User GuideRev. 0.0.2
Page 39Understandingconcepts

3.12
An unsafe password:
A hashed password:
Variable accessesWhat are variable accesses?A Variable is a container that holds information in an equipment such as a PLC or a dataserver (i.e. OPC data server). There are many different types of variables depending onthe PLC or the server that is in use. A variable can be accessed by the network by using aname or a physical address in the equipment memory. Variables are exchanged on theindustrial network between PLCs and servers for process control and supervisionpurposes. Variables can be read or written in any equipment according to need.A variable can be for example the ongoing temperature on an industrial oven. This valueis stored in the oven's PLC and can be controlled by another PLC or accessed by a SCADAsystem for supervisory purpose. The same value can be read by another PLC whichcontrols the heating system.What are variable accesses used for?Reading and writing variables inside a network is strictly controlled. Particular attentionshould be paid when an unplanned change occurs, especially when it comes to a newwritten variable. Indeed, such a behavior could be symptomatic of an attackerattempting to take control of the process. Cisco Cyber Vision reports the variables'messages detected on the equipment of the industrial network.
Cisco Cyber Vision GUI User GuideRev. 0.0.2
Page 40Understandingconcepts

■
■
■
■
Variable accesses are detailed inside component's technical sheet under a sortable tablelist, containing:
The variable's name.Its type (WRITE or READ, but not the value itself).Which component have accessed the variable.The first and last time the component has accessed the variable.
The mention "2 different accesses" (1) indicates that two components have read thevariable.Where to find variable accesses?You can see the number of variable accesses per component on the component list view.You can sort the var column by ascending or decreasing number.
Cisco Cyber Vision GUI User GuideRev. 0.0.2
Page 41Understandingconcepts

Clicking a component from any view opens its right side panel where the number ofvariables on this component is indicated.
A detailed list of variable accesses is available under the automation tab on thecomponent's technical sheet (see the first figure above) and on PLC reports.
Cisco Cyber Vision GUI User GuideRev. 0.0.2
Page 42Understandingconcepts

4.1
4 Navigating through Cisco Cyber Vision
General DashboardThis page is where you'll land as logging in Cisco Cyber Vision.The General Dashboard displays an overview of the industrial network's state andevolution over the last month.
The navigation bar on the left gives access to all other main pages of Cisco Cyber Vision:
Cisco Cyber Vision GUI User GuideRev. 0.0.2
Page 43Navigating through CiscoCyber Vision

■
■
■
■
■
Explore (1): This button leads to the overview of all presets by defaults or configured.Reports (2): This button leads to the Reports page to export valuable informationabout the industrial network.Events (3): This button leads to the Events page which contains graphics and acalendar of all events generated by Cisco Cyber Vision.Monitor (4): This button leads to the Monitor mode to perform and automatize datacomparisons of the industrial network.Search (5): This button leads to the searching area to look for precise data in theindustrial network.
Cisco Cyber Vision GUI User GuideRev. 0.0.2
Page 44Navigating through CiscoCyber Vision

4.2 ExplorePresets is a page containing an overview of all presets existing in Cisco Cyber Visionwhether they are present by default or part of users' customizations. You can access thispage by clicking the Explore button on the left navigation bar.
The top navigation bar (1) allows you to access the different presets (2) and then reachtheir different views .
Cisco Cyber Vision GUI User GuideRev. 0.0.2
Page 45Navigating through CiscoCyber Vision

4.2.1
■
■
■
■
■
■
Preset viewsThere are several types of views which relate to different perspectives:
The dashboard:The dashboard is a unique view which is displayed by default when accessing apreset. It offers an overview of data found by the preset. The fact that it's a tag-oriented view allows you to have a general insight of the network without going intodeep and technical details.Maps:Maps are visual data views of the industrial network that gives you a broad insight ofhow components are connected to each others. There are three different maps: TheExpert , the Simple and the Purdue Model .Lists:Lists are views specialized whether on components or activities. These viewsprovides classic but powerful data filtering to match what you are looking for. Formore information, refer to the component and activity lists .
Views are always structured as shown below:The top navigation bar (1), which allows you to easily switch between the differentviews thanks to its menu.The filtering area on the left (2), which allows you to modify and manage the presetby adapting criteria and registering changes.The view you're on (3), which dynamically evolves as you change criteria.
Example of the Controllers preset on the dashboard view:
Cisco Cyber Vision GUI User GuideRev. 0.0.2
Page 46Navigating through CiscoCyber Vision

4.2.1.1 Dashboard
The dashboard is the view by default when opening a preset. It gives you an overview ofthe preset's number of components, activities, vulnerabilities, credentials, events andvulnerabilities.The dashboard is also a tag-oriented view. It's an overview of all tags found -independently of the ones set as criteria- with the number of components and activitiesfound per tag.
Cisco Cyber Vision GUI User GuideRev. 0.0.2
Page 47Navigating through CiscoCyber Vision
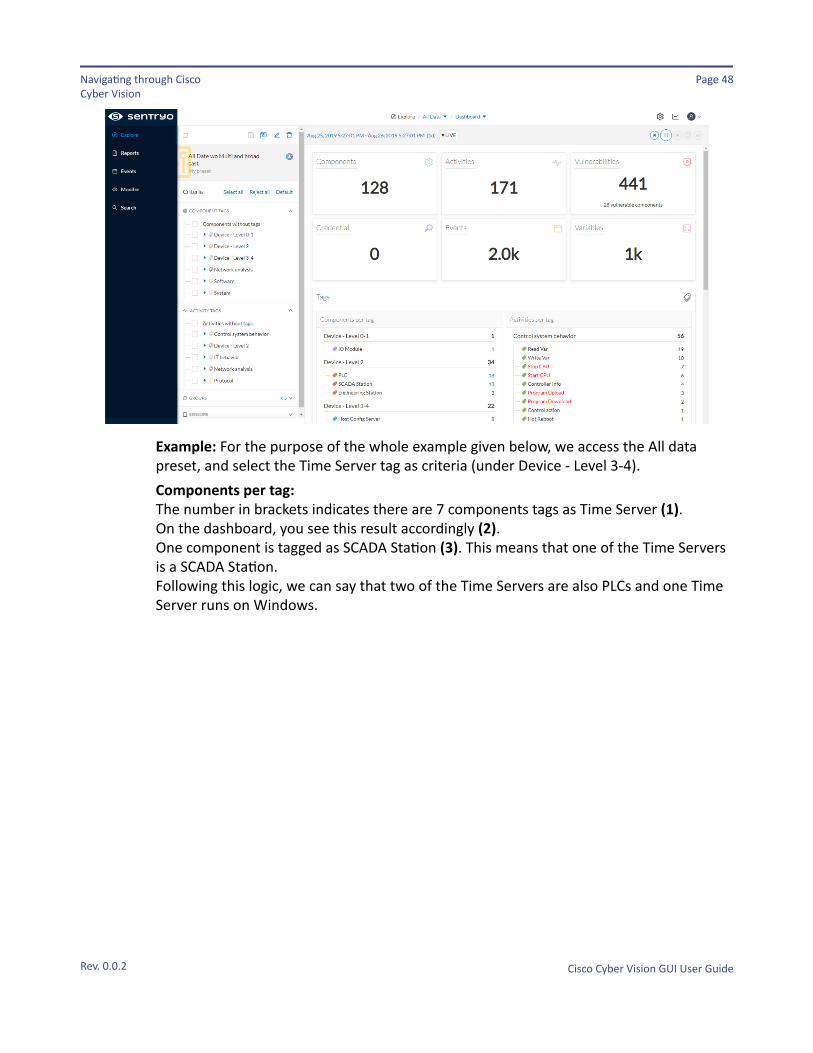
Example: For the purpose of the whole example given below, we access the All datapreset, and select the Time Server tag as criteria (under Device - Level 3-4).Components per tag:The number in brackets indicates there are 7 components tags as Time Server (1). On the dashboard, you see this result accordingly (2). One component is tagged as SCADA Station (3). This means that one of the Time Serversis a SCADA Station. Following this logic, we can say that two of the Time Servers are also PLCs and one TimeServer runs on Windows.
Cisco Cyber Vision GUI User GuideRev. 0.0.2
Page 48Navigating through CiscoCyber Vision

If you want to know more about one of these components, switch to the component listview and reach them using the filter available in the tags column.Activities per tag:As for activities, there is no activity tags set as criteria in the example below (4). Yet, youcan see that many activities have been found (5). This is because the dashboard view collects all activities involved with the Time Serversfound. These activity tags, especially important ones in red, can be useful information todetect an abnormal activity on the controllers of the network.
If you want to know more about one of these activities, switch to the activity list viewand reach them using the filter available in the tags column.
Cisco Cyber Vision GUI User GuideRev. 0.0.2
Page 49Navigating through CiscoCyber Vision

4.2.1.1 Component and activity lists
The component and activity lists are two specialized and oriented views. Even thoughthey are legated and share a large number of data, components and activities are split intwo different views to facilitate comprehension and visualization of data.These views provide general information and advanced technical data about eachelement found in the preset. Check at the differences between the component andactivity views.The Controllers preset in the component list view:
The Controllers preset in the activity list view:
Cisco Cyber Vision GUI User GuideRev. 0.0.2
Page 50Navigating through CiscoCyber Vision

■
■
4.2.1.1
Lists are meant to perform an in-depth exploration of the network. Using this type ofview is especially convenient when searching for a very specific data. To do so, differentfilters are available inside the lists to sort data:
The sort icon (1) is to sort data by alphabetical order or by ascending/descendingorder.The filter icon (2) opens a field to type a specific data in, or a multiple choice menu(3) to filter tags.
Clicking an element in the lists opens its right side panel which leads to more advanceddata.
Maps
Maps are visual representations of data of the industrial network that gives you a broadinsight on how components are interconnected. There are three different maps whichrepresent data differently and respond to different usage:The Map - Expert, the Map - Simple and the Purdue Model (from left to right):
Cisco Cyber Vision GUI User GuideRev. 0.0.2
Page 51Navigating through CiscoCyber Vision

Options per map (for more details, refer to the corresponding subsections):
\ Map - Expert Map - Simple Purdue model
organize manually Yes No No
self-organizing No Yes Yes
autolayout Yes No No
components aggregation by IP by IP, MAC, NetBIOS None
Note
Maps display components and activities according to criteria set in a preset. Grayed outcomponents display because, even if they don't correspond to the preset's criteria, they arenecessary to represent the activities of the preset.
Cisco Cyber Vision GUI User GuideRev. 0.0.2
Page 52Navigating through CiscoCyber Vision

Map - Expert
The Map - Expert is a very detailed view of the assets available per preset. It's a goodinput to get to know how the network is structured. Moreover, you can start organizingcomponents in a way that makes sense to you by moving the components and creatinggroups.
The only condition that drives how components display over this map are IPaggregations. Aggregations are represented by a component with a black label (1)displaying the number of aggregated components.An aggregation of components sharing the same IP:
Cisco Cyber Vision GUI User GuideRev. 0.0.2
Page 53Navigating through CiscoCyber Vision
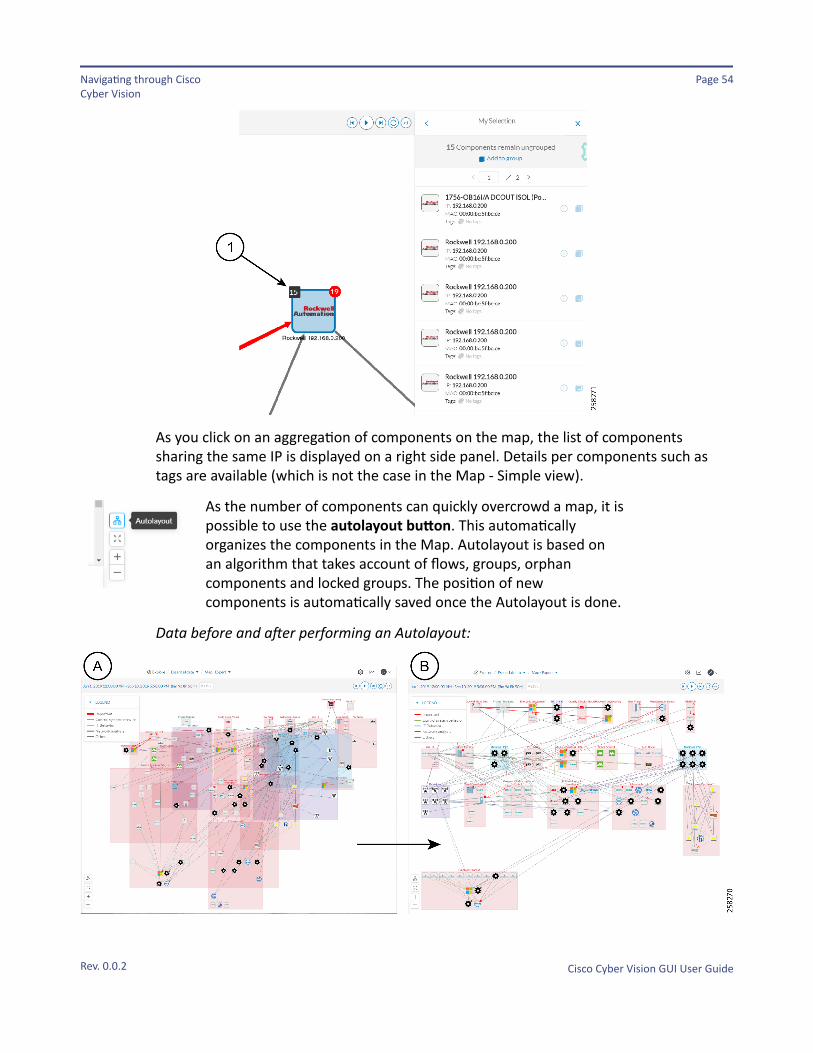
As you click on an aggregation of components on the map, the list of componentssharing the same IP is displayed on a right side panel. Details per components such astags are available (which is not the case in the Map - Simple view).
As the number of components can quickly overcrowd a map, it ispossible to use the autolayout button. This automaticallyorganizes the components in the Map. Autolayout is based onan algorithm that takes account of flows, groups, orphancomponents and locked groups. The position of newcomponents is automatically saved once the Autolayout is done.
Data before and after performing an Autolayout:
Cisco Cyber Vision GUI User GuideRev. 0.0.2
Page 54Navigating through CiscoCyber Vision

Note
An Autolayout cannot be reversed. If significant effort was done to organize the Map, it isadvisable to back up the database before performing this action.
Map Simple
The Map - Simple is a condensed and static view of the assets available per preset. It isaimed to always provide you the best readable map possible.
Compared with the Expert one, the Map - Simple seems to display less components.Components which share the same MAC, IP or Netbios name are actually aggregatedtogether. These aggregations are represented in the Map by a component with a blacklabel displaying the number of components sharing a same property.Contrarily to the Map - Expert view, components can't be moved around in the Map -Simple. This is because it's a self-organizing map. Assets are redistributed as componentsand activities appear or disappear, and as groups are created or deleted. Moreover, themaps automatically adapts over time and when changing preset. This way, it isguaranteed that the map is always well organized and components never overlap.
Purdue Model
This map displays the assets of a preset according to the Purdue model architecture.Components are distributed among the layers by considering their tags. The PurdueModel view doesn't undergo any aggregation and is self-organizing.
Cisco Cyber Vision GUI User GuideRev. 0.0.2
Page 55Navigating through CiscoCyber Vision

■
■
■
4.2.2
Assets of the preset All Controllers distributed among the layers of the Purdue model:
Components are distributed according to the different layers of the Purdue model:Level 0-1: Process and basic control (IO Modules).Level 2: Area supervisory control (PLCs, SCADA stations).Level 3-4: Manufacturing zone and DMZ (all others).
Right side panelA right side panel is a condensed view about a component, a group of components or anactivity's information. This view allows you to quickly scan general information about anelement meanwhile you're keeping an eye on a broader view such as a Component list ora Map.
Cisco Cyber Vision GUI User GuideRev. 0.0.2
Page 56Navigating through CiscoCyber Vision

4.2.2.1
The higher part (1) of the right side panel gives you general information about theelement. If consulting a component, you can edit its name an add/remove it to/from agroup.The lower part contains a round button (2) which opens the element's technical sheetwith all relevant information.The rectangular buttons below (3) redirect to the corresponding information inside thetechnical sheet.To access a right side panel you just need to click a Component or an activity on a Map ora list.
Technical sheets
A technical sheet is an interactive and complete view of all information related to acomponent, an activity or a flow. The views differ depending on the type of elementconsulted.A component's technical sheet:
Cisco Cyber Vision GUI User GuideRev. 0.0.2
Page 57Navigating through CiscoCyber Vision
■
■
■
■
■
■
■
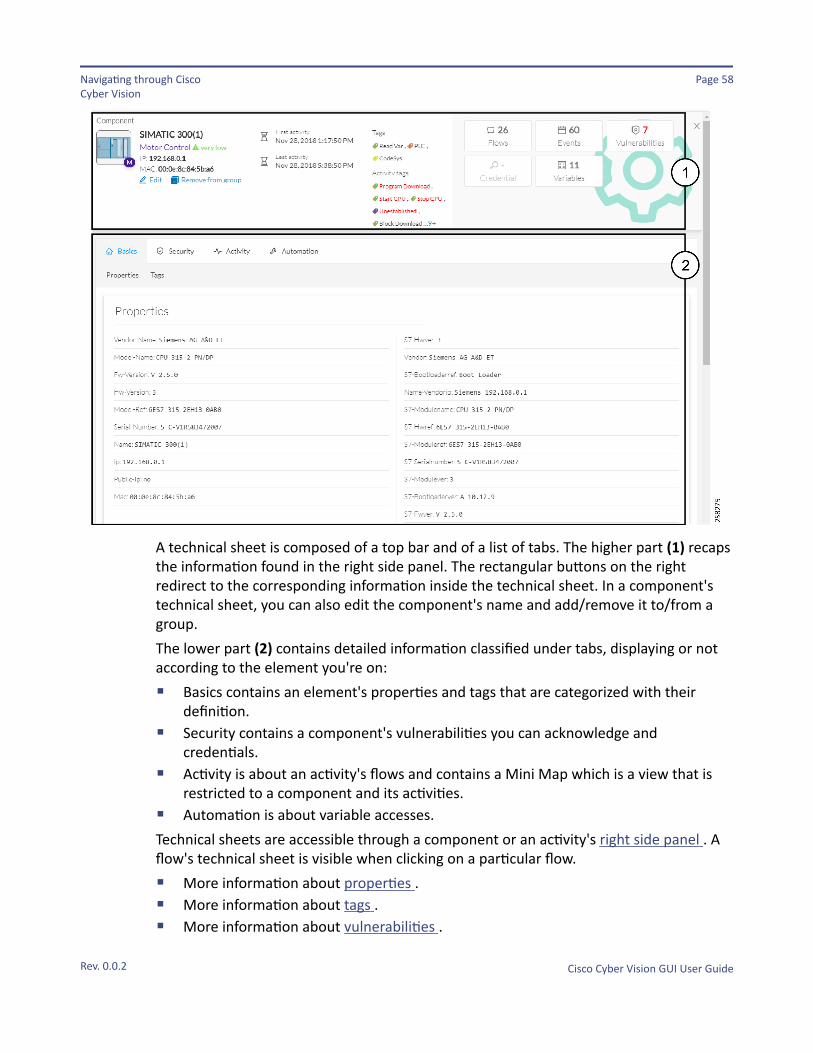
A technical sheet is composed of a top bar and of a list of tabs. The higher part (1) recapsthe information found in the right side panel. The rectangular buttons on the rightredirect to the corresponding information inside the technical sheet. In a component'stechnical sheet, you can also edit the component's name and add/remove it to/from agroup.The lower part (2) contains detailed information classified under tabs, displaying or notaccording to the element you're on:
Basics contains an element's properties and tags that are categorized with theirdefinition.Security contains a component's vulnerabilities you can acknowledge andcredentials.Activity is about an activity's flows and contains a Mini Map which is a view that isrestricted to a component and its activities.Automation is about variable accesses.
Technical sheets are accessible through a component or an activity's right side panel . Aflow's technical sheet is visible when clicking on a particular flow.
More information about properties .More information about tags .More information about vulnerabilities .
Cisco Cyber Vision GUI User GuideRev. 0.0.2
Page 58Navigating through CiscoCyber Vision

■
■
■
■
More information about credentials .More information about flows .More information about the Mini Map .More information about variables accesses .
Mini Map
The Mini Map is a visual representation restricted to a specific component and itsactivities.This view is accessible through the Activity tab of a Component's technical sheet .
Clicking any element in the Mini Map will open its ride side panel so you can have accessto further information.
Cisco Cyber Vision GUI User GuideRev. 0.0.2
Page 59Navigating through CiscoCyber Vision

4.3 ReportsReports are exportable files which improve your visibility of valuable information aboutyour industrial network. Information is collected and categorized according to differentperspectives which are components, flows, vulnerabilities and PLCs. Reports can begenerated for a time period you define into spreadsheets (XLSX) or printable (HTML thatyou can export to PDF).
Below is the description of the four types of reports available:
Cisco Cyber Vision GUI User GuideRev. 0.0.2
Page 60Navigating through CiscoCyber Vision
■
■
■
■
4.4
The inventory report lists and details all components of your industrial network.They are sorted by group. For each component different information is given like thecomponent name, when it was active for the first and the last time and tags thatqualify its activity. If available, you will also find technical details such as its MAC andIP addresses, hardware and firmware versions, the serial number and extraproperties.The activity report lists and details all communications exchanged between thecomponents of your industrial network. They are sorted by group and by direction(inner, incoming and outgoing communications regarding a group). Informationprovided includes the protocol, which source and destination ports have been usedand tags that qualify its activity.The vulnerability report lists all components detected as vulnerable and givesfurther details about vulnerabilities. Vulnerabilities are based on the Knowledge DBprovided by Cisco. So, the more you keep the Knowledge DB up to date, the betteryou will be notified about new known vulnerabilities. The report containsinformation about the vulnerability, its impact level, its CVSS (Common VulnerabilityScoring System) and solutions. A vulnerability is often about outdated softwareparts. It is strongly recommended to fix outdated states as soon as possible. Links tomanufacturers' websites are provided for this purpose.The PLC report lists all PLCs in your industrial network. For each PLC, the report listsand details properties, events, programs, program blocks and variable accesses, ifthere are any.
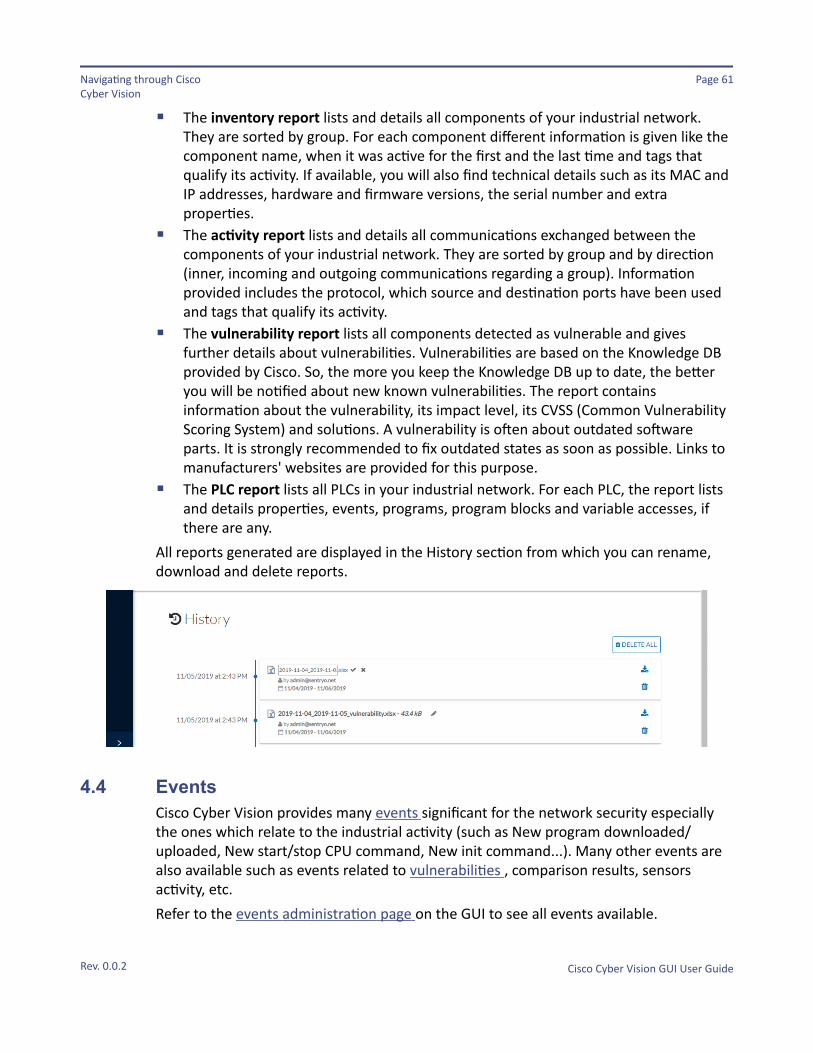
All reports generated are displayed in the History section from which you can rename,download and delete reports.
EventsCisco Cyber Vision provides many events significant for the network security especiallythe ones which relate to the industrial activity (such as New program downloaded/uploaded, New start/stop CPU command, New init command...). Many other events arealso available such as events related to vulnerabilities , comparison results, sensorsactivity, etc.Refer to the events administration page on the GUI to see all events available.
Cisco Cyber Vision GUI User GuideRev. 0.0.2
Page 61Navigating through CiscoCyber Vision

■
■
4.4.1
The Events page provides two views to give high visibility on these events:The Dashboard : a visual and continuously-updated view of the current state of theinstallation based on the number of events (by severity and over time).The Calendar : a chronological and continuously-updated view of the events withinwhich you can search events.
The DashboardEvents are presented in the Dashboard under doughnut and line charts.Doughnut charts present events numbers and percentages per categories and severities.
You can see the list of events per categories in the administration events page .Clicking the doughnut redirects you to the Calendar view that is filtered with thecorresponding category and severity so you can quickly access more events details.Below, the line chart puts an emphasis on the number of events per severity over time.
Cisco Cyber Vision GUI User GuideRev. 0.0.2
Page 62Navigating through CiscoCyber Vision

4.4.2
Clicking event markers (1) on the line chart lets you see the number of events percategory according to a specific time (2).Click a category event tab (3) to see events details in the Calendar view by means of thelink "Show in calendar" (4). Events will be filtered with the corresponding category,severity and event type.
The CalendarThe Calendar is a chronological view in which you can see and search events. Use thesearch bar to search events by MAC and IP addresses, component name, destination andsource flow, severity and category.You can also see events that have happened during the day, week, month and year.
Clicking on a result event will show you details about the event.
Cisco Cyber Vision GUI User GuideRev. 0.0.2
Page 63Navigating through CiscoCyber Vision

4.5
4.5.1
■
■
■
When an event is related to a component or an activity, you can jump to its technicalsheet by clicking See technical sheet.When a Monitor event is generated, the short description includes a link to view thedifferences in the Monitor page.
Monitor
Monitor modeCisco Cyber Vision provides a monitoring tool called the Monitor mode to detect changesinside industrial networks. Because a network architecture (PLC, switch, SCADA) isconstant and its behavior tends to be stable over time, an established and configurednetwork is predictable. The Monitor mode aims to show network states based onbaselines. Changes, either normal or abnormal, are noted when differences are foundbetween a baseline and a comparison point. This feature is particularly convenient forlarge networks as changes are directly highlighted in a map. Comparisons that have beenperformed are reported in the Events pages.The Monitor mode can be used to:
Create several baselines:A baseline is a snapshot of the network architecture state at a defined time. You cancreate a baseline for each state of an industrial network such as a baseline, a regularmaintenance period, a degraded mode, a week-end mode, etc. A baseline is createdfor a situation considered as part of a normal operating process which takes intoaccount all network activities (properties, behaviors and variables) happening withina time window.Launch comparisons:Compare a situation that you consider as being normal (i.e. a baseline) with thecurrent status within a defined period. Note that you have the option to schedulethe frequency that you want a comparison to be performed.Review differences and include them in your baseline:Any change resulting from the comparison are highlighted in a map of your industrialnetwork. You can include these changes to your baseline if it is part of a normalnetwork development process or take action in case of suspicious activities.
Cisco Cyber Vision GUI User GuideRev. 0.0.2
Page 64Navigating through CiscoCyber Vision

4.5.1.1
4.5.1.1
Creating a baseline
When visiting the Monitor mode for the first time (or after a Reset Data), no mapappears on the Monitor mode. At this point, you are invited to create your first baseline.You can choose to make a full copy of the data that has been captured up to this point byCisco Cyber Vision or to copy data according to a time range that you define.You can also create a baseline from one or several sensors' data.
Once the baseline is created, a map of your industrial network displays in the Monitorview.
Note
You can create as many baselines as you want.
Launching a comparison
After creating a baseline, you can launch a comparison of your baseline by clicking'Compare' and by selecting a time.
Cisco Cyber Vision GUI User GuideRev. 0.0.2
Page 65Navigating through CiscoCyber Vision

4.5.1.1
■
■
♦♦♦
■
Reviewing results
If there are no differences detected, it means that the current status is the same as thesituation registered in the baseline.In the monitor mode, each result is signaled but is considered as neutral. You will need todetermine if a result is normal or not. Each result does not necessarily represent a threatto your network.A result displays in one of the 3 following states, each represented in a different color:
Appeared (purple): a new component/behavior/variable has been detected.Changed (orange): a component or a behavior characteristic has changed.It can mean that:
a new property has been detecteda property has changeda new tag has been assigned to a component or a behavior.
Disappeared (green): a component or a behavior has been inactive during thecomparison period of time selected.
Cisco Cyber Vision GUI User GuideRev. 0.0.2
Page 66Navigating through CiscoCyber Vision

If you click on a result (e.g. the component or a flow in the example), the baselinedifferences side panel on the right automatically slides to the corresponding information.In the example below, you can see the information about a new component such as itsstate, its first and last activity, the manufacturer's brand (if known) and its MAC and IPaddresses.
Cisco Cyber Vision GUI User GuideRev. 0.0.2
Page 67Navigating through CiscoCyber Vision

4.5.1.1 Assessing results
The illustration below shows the information side panel about a new behavior that hasappeared. A behavior is a flow detailed with communication characteristics. In the sidepanel, you can find information such as the behavior state, its first and last activity, itstags, the flow direction and details about the protocol.The behavior here is a component identified as Kinco (the Ethernet interface vendor)that sends a command to a PLC S7-300 identified as SIMATIC 300(1) (source anddestination directional flow).Tags represent what happened on the flow. Here, the behavior indicates that Kinco hassent a programming block to the SIMATIC PLC through the protocol S7. SIMATIC's CPUhas stopped and started again to insert the new programming block.Blue tags represent information, such as the protocol used to communicate, while redtags represent a significant action.If you deploy the "show flows details" function, you will have access to some informationlike which port has been used, how many flows have been generated and the activityduration.
Cisco Cyber Vision GUI User GuideRev. 0.0.2
Page 68Navigating through CiscoCyber Vision

Cisco Cyber Vision GUI User GuideRev. 0.0.2
Page 69Navigating through CiscoCyber Vision

4.5.1.1
All this data will help you in assessing if the action is normal or not. This example couldtypically be a critical event as part of the beginning of an attack operating mode.You can include this behavior into your baseline because you consider it as normal (anychange will be notified in comparisons results), or ignore it and mute it fromcomparisons results (so feedback will no longer be received on this behavior).
Note
User actions will be visible in the Events page.
Scheduling a comparison
Schedule a baseline comparison to set preferences to automatically launch a comparisonon a regular basis. For instance, if a network maintenance occurs during the night once amonth, you can create a baseline and then plan a baseline comparison to be launchedafter each maintenance. You will be able to check each comparison afterwards and seewhat exactly had happened on your network.You can access it by clicking the Scheduling button on the baseline tools menu.
You must set the frequency and the start time of the comparison.
Note
Duration of the comparison is not settable yet. The comparison will be performed from the lastscheduled comparison set.
Cisco Cyber Vision GUI User GuideRev. 0.0.2
Page 70Navigating through CiscoCyber Vision

4.5.1.1 Creating an empty baseline
Creating an empty baseline is an alternative to creating a full baseline and removing datamanually. You can manually include components, behaviors or variables (instead ofremoving what you are not interested in from a baseline filled with all data captured).To create an empty baseline, you need to switch off the "Fill the reference" toggle button(1).
The newly created baseline is empty. In the information panel on the right, enable the"Edit mode" toggle button (2).The elements in the map are displayed but are grayed out. In the map, select thecomponents and flows you want to add to your baseline (3) and include them (4).
Cisco Cyber Vision GUI User GuideRev. 0.0.2
Page 71Navigating through CiscoCyber Vision

4.5.1.1 Setting comparison criteria
Managing comparison criteria enables you to choose which types of network activity tomonitor when launching comparisons. You can choose for each result type (Components,Behaviors, Variables) which states (Appeared, Changed, Disappeared) are to be takeninto account during a comparison. States selected will display in the next comparison youwill launch.To do so, click the cogwheel button on top of the baseline side panel, access Comparisonsettings and select the states you want to compare.
Cisco Cyber Vision GUI User GuideRev. 0.0.2
Page 72Navigating through CiscoCyber Vision

4.5.1.1 Use cases: Setting references and comparison criteria
Several degrees of configuration are available when defining baselines, comparisoncriteria and scheduled automated comparisons. Those are useful to generate events tomatch many use cases.
Note
It is advisable to consider using the API for very focused comparisons as comparisons are quiteCPU-intensive compared to API calls. However, comparisons are much simpler to configurethan writing API scripts: the user should balance short-term (ease of configuration) vs long-term (effectiveness) benefits.
Detecting and monitoring a remote access
An example of a possible standard use case is the detection of differences each time aremote access for maintenance reasons is detected on the network.To do so:
Cisco Cyber Vision GUI User GuideRev. 0.0.2
Page 73Navigating through CiscoCyber Vision

1. Identify the subcontractor maintenance machines to monitor.2. Create a baseline with all existing data.3. Edit the baseline to remove subcontractor maintenance machines.4. Set comparison criteria to "Appeared" for "Components", "Variables" and
"Behaviors".5. Schedule a comparison with a short period of time (e.g. 10 min) to be notified shortly
after a new remote access appears.
Enforcing specific rules
The same type of comparison can be used to enforce specific rules related to riskanalysis.For example, checking that engineering stations are shut down when not attended (i.e.IEC 62443 for impact analysis).To do so:1. Create a baseline with all existing data.2. Edit the baseline to remove engineering stations.3. Schedule comparisons during night-time or weekends to detect differences in case
they are active.Another way to check that engineering stations are off is to use a script in the API whichreads the "Last active" time value for each component with an Engineering Station tag(refer to the REST API user documentation).
Checking that specific components or behaviors are functional
A different use case is based on checking that specific components and/or behaviors areactive (i.e. not broken or failing).To do so:1. Create a baseline with all existing data.2. Set comparison criteria to "Disappeared" for "Components" and "Behaviors" and
untick other criteria.3. Schedule a comparison for a period of time long enough (1 hour or more) to reduce
false alarms. A component can be silent for a period of time but still be active. Forexample, if a component sends traffic each 30 minutes, it will be considered asinactive in the comparison if the period of time set is too short.
Cisco Cyber Vision GUI User GuideRev. 0.0.2
Page 74Navigating through CiscoCyber Vision

4.6
Checking behaviors and variables changes
This use case consists of setting "Changed" criteria to detect changes in authorizedbehaviors.For example, you can check that variables from a safety PLC are only "read" and not"written".To do so:1. Create a baseline with all existing data.2. Set comparison criteria to "Changed" for "Components", "Variables" and "Behaviors".
This will generate events if commands other than "read" are performed.3. Additionally, you can "Ignore" behaviors between other components by enabling the
baseline Edit mode toggle button. Focus will be done only on specific sensitive flowsand changes will be notified only on the components that make sense. Thus, falsealarms will be limited.
Using comparisons for such use cases typically requires lengthier configuration and “trial& error” before actually having a SOC handle the events.
SearchThis page is available to search for components among unstructured data. You can searchcomponents by name, custom name, IP, MAC, tag and property value.
Note
Aggregated components aren't available in this page.
Cisco Cyber Vision GUI User GuideRev. 0.0.2
Page 75Navigating through CiscoCyber Vision

Results out of a Station research:
In the example above, 20 components have been found with the mention "station" intheir name, property values and tags.It is possible to create a preset out of your research results (1). Presets created out ofresults will automatically update as new data are detected on the network.If you mouse over a component, the button that gives access to its technical sheet (2)appears. This view will give you access to advanced data about the component.
Cisco Cyber Vision GUI User GuideRev. 0.0.2
Page 76Navigating through CiscoCyber Vision

4.7
4.7.1
4.7.1.1
4.7.1.1
System administration
System
Center shutdown/reboot
You can trigger a safe shutdown and reboot of the Center from the Systemadministration page.The reboot can be used in case of a minor bug. For instance, in case of a system overload.
System update
Version releases usually include updates for both the sensors and the Center (i.e.combined updates). If operating conditions make it possible, you can update the Centerand all its online sensors at once from the user interface. You can proceed to a combinedupdate without opening a shell prompt and using SSH.
Note
Combined updates are applied to the Center and all its online sensors. Make sure (by accessingthe sensor administration page) that all your sensors are connected (status Active or Inactive)and SSH is authorized between the Center and the sensors before proceeding to a combinedupdate.
IMPORTANT
Cisco Cyber Vision GUI User GuideRev. 0.0.2
Page 77Navigating through CiscoCyber Vision

■
■
4.7.1.1
Rolling back to an older Cisco Cyber Vision version is not possible.
Requirements:An Admin access to the user interface.A combined update.
To verify the file integrity (recommended):
To verify that the file you just downloaded is healthy, use the SHA256 checksum providedby Cisco.1. Linux users can type on their shell prompt the command:
sha256sum CiscoCyberVision-<TYPE><VERSION>.<EXT>2. Compare both checksums.
▪ If both checksums are identical it means the file is healthy.▪ If the checksums do not match try to download the file again.▪ If, after downloading the file again the checksums still don’t match, please contact Cisco support.
To update the Center and all its online sensors:
1. Access the user interface.2. Access System administration > System > use the System update button.3. Select the update file CiscoCyberVision-update-combined-<VERSION>.dat4. Confirm the update.
As the Center and sensors updates proceed, you are redirected to a holding page.Once the update is finished the Center and the sensors need to reboot and you will belogged out from the user interface.
5. Log in again to the user interface.If there were offline sensors when the update occurred, the same procedure can be usedas many times as necessary to update all sensors.
Syslog configuration
Cisco Cyber Vision provides syslog configuration so that events can be exported and usedby a SIEM. To configure which machine the syslogs will be sent to:1. Click Configure.
Cisco Cyber Vision GUI User GuideRev. 0.0.2
Page 78Navigating through CiscoCyber Vision

4.7.1.1
2. Select a protocol.3. Enter the IP address of the SIEM reachable from the Administration network interface
(i.e. eth0) of the Center.4. Enter the port on the SIEM that will receive syslog.5. Select the variant of syslog format:
▪ Standard: event messages are sent in a format specific to Cisco Cyber Vision and with legacytimestamps (one-second precision).
▪ CEF: industry standard ("Common Event Format") which is understood by most SIEM solutions (noextra configuration is needed on the SIEM). This is the recommended option.
▪ RFC3164: extended syslog header format with microsecond precision for timestamps.
If you select TCP + TLS connection an additional "set certificate" button displays to importa p12 file. This file is to be provided by the administrator of your SIEM solution to securethe communications between the Center and the syslog collector.
Import/Export
You can import and export the Cisco Cyber Vision database from the Systemadministration.This can be used on a regular basis to backup the industrial network data on Cisco CyberVision or if you need to transfer the database to a different Center.
Exports are possible up to 2 GB of data to avoid side effects related to slow databaseexports. If the database is larger than 2 GB, you will get an error message. In this case,you must connect to the Center using SSH and perform a data dump using the commandsbs db dump.Network data, events, users will be kept as well as all customizations (e.g. groups,component names).
Cisco Cyber Vision GUI User GuideRev. 0.0.2
Page 79Navigating through CiscoCyber Vision

4.7.1.1
4.7.1.1
As for configurations, only those made in the Cisco Cyber Vision user interface will bekept. Thus, if you change Center you will have to perform a basic configuration of theCenter and then configure Cisco Cyber Vision again (refer to the Center QuickstartGuide).
Note
Import can last up to one hour for big databases. However, you can refresh the page from timeto time to check that the import keeps going on normally (i.e. no error message).
Knowledge DB
Cisco Cyber Vision uses an internal database which contains the list of recognizedvulnerabilities, icons, threats, etc.
IMPORTANT
It is important to update the Knowledge DB in Cisco Cyber Vision as soon as possible afternotification of a new version to be protected against vulnerabilities.
To update the Knowledge DB:
1. Download the latest.db file available.2. From the Cisco Cyber Vision system administration page click the Import a knowledge
DB button to upload the file.Importing the new database will rematch your existing components against any newvulnerabilities and update network data.
Reset
A Reset to Factory Defaults should be performed carefully with the help of Cisco productsupport and be used only as a last resort when all other troubleshooting attempts havefailed. Please read below all implications of taking this action.
Cisco Cyber Vision GUI User GuideRev. 0.0.2
Page 80Navigating through CiscoCyber Vision

■
■
■
■
4.7.2
Reset to Factory Defaults is to be used as a last resort to clear all existing data from theCenter.Proceeding to a Reset to Factory Defaults will lead to the deletion of:
Some Center configuration data elements.The GUI configuration (such as user accounts, the setup of event severities, etc.).Data collected by the sensors.The configuration of all known sensors (such as IP addresses, capture modes, etc.).
Root password, certificates and configurations from the Basic Center configuration willbe kept.Once a Reset to Factory Defaults has been performed, the GUI page refreshes with theCisco Cyber Vision installation wizard (refer to the Center Quickstart Guide).
Data managementFrom the system administration page, you can manage data stored on Cisco Cyber Visionby clearing data to optimize the Center performances.Clearing data should be performed carefully with the help of Cisco product support andbe used only as a last resort when all other troubleshooting attempts have failed. Pleaseread below all implications about all data clearance.
Cisco Cyber Vision GUI User GuideRev. 0.0.2
Page 81Navigating through CiscoCyber Vision

4.7.3
4.7.3.1
About all data clearance:
Clearing all data is to be used as a last resort in case of database overload issues. Proceeding to a Reset Data will result in the entire database content deletion. Networkdata such as components, flows, events and baselines will be deleted from Cisco CyberVision and the GUI will be emptied.All configurations will be saved. Existing users and user data configuration (such ascapture modes, events severity set up, syslog configuration) will remain unchanged.
Sensors
Managing the sensors
You can manage the sensors and obtain information about them from the sensoradministration page.
Cisco Cyber Vision GUI User GuideRev. 0.0.2
Page 82Navigating through CiscoCyber Vision

■
■
■
■
First, you need to understand that different types of sensors exist in terms ofconfiguration: the online and the offline sensors.
When used in online mode the sensor needs to be manually installed through USB.To do so, refer to the Cisco Sensor Quickstart Guide.On a sensor in offline mode, traffic is captured on a USB drive. The file will then beimported in Cisco Cyber Vision.
Then, from this page, you can:
Install a sensor manually (1).Capture traffic with an offline sensor (2).
Cisco Cyber Vision GUI User GuideRev. 0.0.2
Page 83Navigating through CiscoCyber Vision
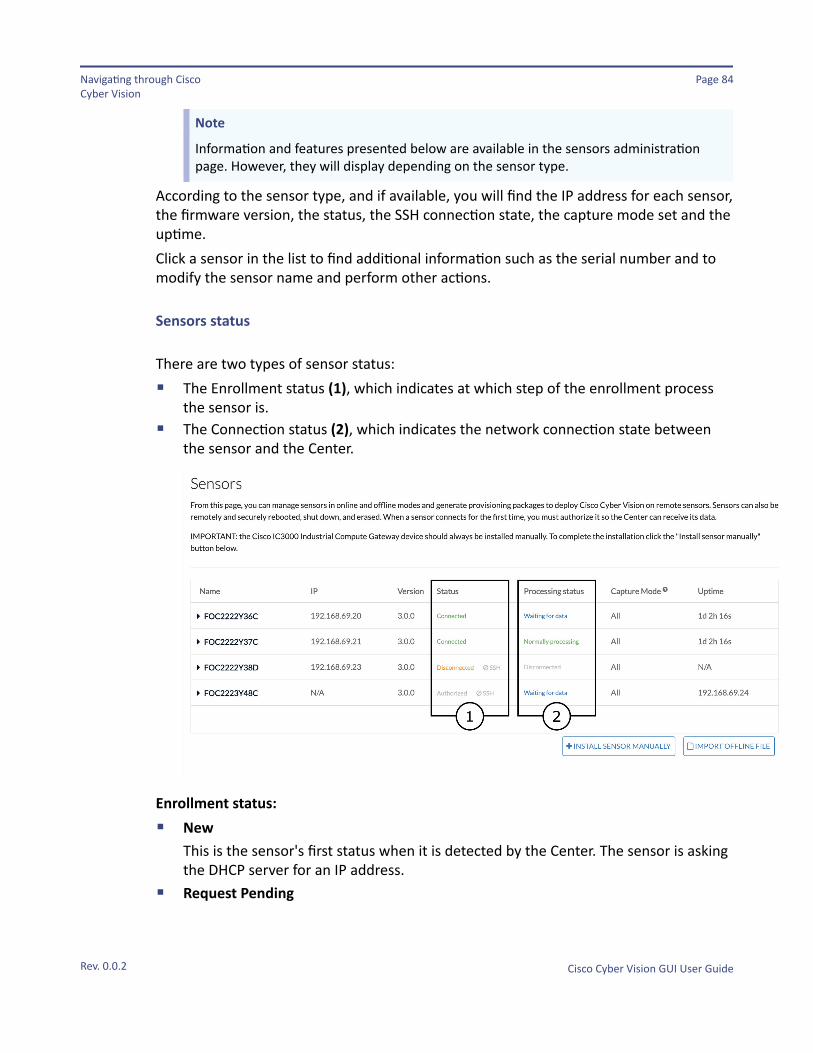
■
■
■
■
Note
Information and features presented below are available in the sensors administrationpage. However, they will display depending on the sensor type.
According to the sensor type, and if available, you will find the IP address for each sensor,the firmware version, the status, the SSH connection state, the capture mode set and theuptime.Click a sensor in the list to find additional information such as the serial number and tomodify the sensor name and perform other actions.
Sensors status
There are two types of sensor status:The Enrollment status (1), which indicates at which step of the enrollment processthe sensor is.The Connection status (2), which indicates the network connection state betweenthe sensor and the Center.
Enrollment status:NewThis is the sensor's first status when it is detected by the Center. The sensor is askingthe DHCP server for an IP address.Request Pending
Cisco Cyber Vision GUI User GuideRev. 0.0.2
Page 84Navigating through CiscoCyber Vision

■
■
■
■
■
■
■
■
The sensor has asked the Center for a certificate and is waiting for the authorizationto be enrolled.AuthorizedThe sensor has just been authorized by the Admin or the Product user. The sensorremains as "Authorized" for only a few seconds before displaying as "Enrolled".EnrolledThe sensor has successfully connected with the Center. It has a certificate and aprivate key.DisconnectedThe sensor is enrolled but the isn't connected to the Center. The sensor may be shutdown, encountering a problem, or there is a problem on the network.
Connection status:Not enrolledThe sensor is not enrolled. The enrollment status is New or Request Pending. Theuser must enroll the sensor for it to operate.Normally processingThe sensor is connected to the Center. Data are being sent and processed by theCenter.Waiting for dataThe sensor is connected to the Center. The Center has treated all data sent by thesensor and is waiting for more data.Pending dataThe sensor is connected to the Center. The sensor is trying to send data to the Centerbut the Center is busy with other data treatment.DisconnectedThe sensor is enrolled but the sensor isn't connected to the Center. The sensor maybe shut down, encountering a problem, or there is a problem on the network.
Sensors features
A label indicates that there is no SSH connectivity from the Center to the sensors (1).When it is down, Erase, Shutdown, Reboot, Capture mode and Start recording sensorfeatures are not available. This label can be useful in case of troubleshooting.
Cisco Cyber Vision GUI User GuideRev. 0.0.2
Page 85Navigating through CiscoCyber Vision

■
■
■
■
■
■
■
Different buttons (2) are available according to the sensor mode:The Remove button takes the sensor off from the sensor administration page and itsrelative data from the System statistics page is removed. This button is available onlywhen the sensor is not sending data to the Center (i.e. status Unreachable) or foroffline sensors. This action must be performed when the sensor and its data are notrelevant anymore.The Erase button performs a sensor Reset to Factory Defaults. The sensor will beremoved from the administration page and will appear again with the status New.The Shutdown button triggers a clean shutdown of the sensor from the GUI.
Note
After performing a shutdown, you must switch the sensor ON directly and manually on thehardware.
The Reboot button can be used to reboot the sensor in case of a malfunction.The Get provisioning package button provides a configuration file to be deployed onthe sensor in case of Manual sensor installation (online mode).The Capture Mode button can be used to set a filter on a sensor sending data to theCenter. Refer to the procedure for Setting a capture mode .The Start recording sensor button (3) records a capture on the sensor. Records canbe used for traffic analysis and may be requested by Cisco support in case ofmalfunctions.
Cisco Cyber Vision GUI User GuideRev. 0.0.2
Page 86Navigating through CiscoCyber Vision

Note
This feature is targeted for short captures only. Performing long captures may cause thesensor overload and packets loss.
You can also perform this action from the Capture page:
Capturing traffic with an offline sensor
Required material:
A USB drive formatted as FAT32 with a large storage capacity.
Note
The metadata collected by the USB drive takes up very little space. However, it isrecommended to use a USB drive with a large storage capacity (16 GB minimum). If the USBdrive reaches a saturation point its inner file would corrupt.
To capture traffic with a sensor reset to factory default:
1. Plug a USB drive into the sensor port marked "Offline".2. Connect the sensor to the industrial network to be monitored (refer to Cisco Cyber
Vision Sensor Quickstart Guide).3. Turn the sensor ON.
The sensor starts capturing traffic.
To finish the traffic capture:
1. Disconnect the sensor from the industrial network.2. Wait for the sensor to stop operating (10 seconds).3. Unplug the USB drive from the Offline USB port.
To import an offline capture file to the Center:
Cisco Cyber Vision GUI User GuideRev. 0.0.2
Page 87Navigating through CiscoCyber Vision

1. Plug the USB drive into your computer.2. Access the sensors administration page of the GUI.3. Click the Import Offline File button:
Date and time selection menus are meant to convert the traffic capture starting date/time of the imported file in the case the offline sensor date/time is not reliable (fillingout these fields is optional).
Note
The capture starting time in the offline capture file is in UTC.e.g.: offline-data-20171127-123338.dat (i.e. YYYYMMDD-HHMMSS)If the offline capture file indicates 12.33 a.m. (UTC), then it corresponds to01.33 a.m. CET.
IMPORTANT
Be careful when completing this step because it is not possible to go back oncethe date and time are changed and the file is inserted into the Center. TheCenter does not allow for the erasure of one single file. It is recommended toexport the database before importing an offline capture.
If you do not want to change this information note that you will need to search for theoffline capture file in the GUI Time span. Use the same traffic capture starting dateand time that is written in the file name.Although you can modify the date and time with this feature, it is recommended thatyou correct the offline sensor's date and time to avoid doing this for each and everycapture.
4. Select the .dat file to import.In the administration sensor page, a new sensor is created corresponding to theoffline file with the status Unknown and No SSH connection.
Note
A new offline capture file is created each time the sensor starts. Thus, you canmake several traffic captures successively at different points of the industrialnetwork.
Setting a capture mode
The Capture mode feature lets you choose which network communications will beanalyzed by the sensors.
Cisco Cyber Vision GUI User GuideRev. 0.0.2
Page 88Navigating through CiscoCyber Vision

The aim is mainly to focus the monitoring on relevant traffic but also to reduce the loadon the Center.For example, a common filter in a firewall can consist of removing the networkmanagement flows (SNMP). This can be done by setting a filter like "not (port 161 andhost 10.10.10.10)" where "10.10.10.10" is the network management platform.Using Capture mode Cisco Cyber Vision performance can be improved on large networks.Capture modes operate because of filters applied on each sensor. Filters are set to definewhich types of incoming packets are to be analyzed by the sensors. You can set adifferent filter on each sensor according to your needs.You can set the capture mode in the installation wizard when enrolling the sensors duringthe Center installation. This option is recommended if you already know which filter toset. Otherwise, you can change it at any time through the sensors administration page inthe GUI (provided that the SSH connection is allowed from the Center to the sensors).
Note
You can set a capture mode to offline sensors from a file containing the filter and registered onthe USB drive plug on the Offline USB port of the sensor.For more information about setting a capture mode on an offline sensor contact the support.
The different capture modes are:
Cisco Cyber Vision GUI User GuideRev. 0.0.2
Page 89Navigating through CiscoCyber Vision

■
■
■
■
4.7.4
■
■
ALL: No filter is applied. The sensor analyzes all incoming flows and they will all bestored inside the Center database.OPTIMAL (Default): The applied filter selects the most relevant flows according toCisco expertise. Multicast flows are not recorded. This capture mode isrecommended for long term capture and monitoring.INDUSTRIAL ONLY: The filter selects industrial protocols only like modbus, S7,EtherNet/IP, etc. Thus, only the industrial Map view will be filled with flows. Thismeans that IT flows of the monitored network won't be analyzed by the sensor andwon't appear in the GUI.CUSTOM (advanced users): Use this capture mode if you want to fully customize thefilter to be applied. To do so you will need to use the tcpdump syntax to define thefiltering rules.
UsersYou can create, edit and delete users through the users administration page.
During their creation each user must be assigned with one of the following user roles(from full rights to read-only):
AdminThe Admin user has full rights on the Cisco Cyber Vision platform. Users who havethis role assigned oversee all sensitive actions like user rights management, systemupdates, syslog configuration, reset and capture modes configuration on sensors.Product
Cisco Cyber Vision GUI User GuideRev. 0.0.2
Page 90Navigating through CiscoCyber Vision

■
■
■
■
♦♦♦♦
4.7.5
The product user has access to several features of the system administration page(i.e. the system, sensors and events administration pages). This access level is forusers who manage sensors from a remote location. In addition, they can manage theseverity of events and, if enabled by the Admin user, can manage their export tosyslog.OperatorThis access level is for users who use the Monitor mode and manage groups but donot have to work with the platform administration. Thus, the Operator user hasaccess to all pages, except the system administration page.AuditorThis access level provides read-only access to the Explore, Reports, Events andSearch pages. Auditors can use sorting features (such as search bars and filters) thatdo not require persistent changes to the Cisco Cyber Vision data (unlike Autolayout),and generate reports.
You can create as many users as needed with any user rights. Thus, severaladministrators can use and administrate the whole platform.However, each user must have their own account. That is:
Accounts must be nominative.One email address for several accounts is not allowed (note that email will berequested for login access).Passwords must contain at least ten characters belonging to three out of four of thefollowing character types:
Lower case.Capital letters.Numbers.Punctuation marks or symbols.
IMPORTANT
Passwords should be changed regularly to ensure the platform and the industrialnetwork security.
EventsThe severity of Events can be customized on the events administration page. By defaultchanges will be applied to future events only. However, you can apply new customizedseverities to past events by enabling Apply to existing events (i.e. save button).
IMPORTANT
This action is irreversible and can take several minutes to complete.
Cisco Cyber Vision GUI User GuideRev. 0.0.2
Page 91Navigating through CiscoCyber Vision

4.7.6
Click the Reset button to reset to the severity to default.You can enable or disable the export of events to syslog and database storage. These twooptions are active by default. However, make sure syslog has been configured before theexport.
APICisco provides a REST API. To use it you first need to create a token through the APIadministration page.A token is a random password which authenticates a request to Cisco Cyber Vision toaccess or even modify the data in the Center through the REST API. For instance, you canrequest the latest 10 components detected on Cisco Cyber Vision or create newreferences. Requests can be used by external applications like a SOC solution.
Note
Best practice: create one token per application so you can remove or expire accessesseparately.
Cisco Cyber Vision GUI User GuideRev. 0.0.2
Page 92Navigating through CiscoCyber Vision

4.7.7
Create your first token and enter a name that will help you identifying the token. Forsecurity reasons you can also use the status toggle button to disable authorization to usethe token (for example, if the token created is to be used later and you want to preventaccess until then) and set an expiration time.
Once the token is created click show to see and copy the token to the clipboard.
LicenseYou can install a license in Cisco Cyber Vision in the License administration panel.
Cisco Cyber Vision GUI User GuideRev. 0.0.2
Page 93Navigating through CiscoCyber Vision

Software Subscription LicensingConfigure which functionalities the product will have. Note that this setting can causeadditional cost.
To install a new license:1. Login to your Smart Account in Smart Software Manager.2. Navigate to the Virtual Account containing the licenses to be used by this Product
Instance.3. Generate a Product Instance Registration Token (this identifies your Smart Account)
and copy or save it.
Cisco Cyber Vision GUI User GuideRev. 0.0.2
Page 94Navigating through CiscoCyber Vision

4.7.8
■
■
■
■
LDAP settingsCisco Cyber Vision can delegate user authentication to external services using LDAP(Lightweight Directory Access Protocol), and in particular to Microsoft Active Directoryservices.You can enable LDAP authentication in the LDAP Settings administration panel.
Configure LDAP:You must fill the fields with the following information:
the service IP addressthe service portthe user root domain namethe group names
User groups available in the external directory will be mapped to Cisco Cyber VisionProduct, Operator and Auditor user roles. You must type the exact group names asconfigured into the remote directory, so they can be retrieved and mapped to user roles.Because the Admin user role is exclusively reserved for Cisco Cyber Vision internal usage,this group cannot be mapped to any external users and thus is not proposed in LDAPsettings.
Cisco Cyber Vision GUI User GuideRev. 0.0.2
Page 95Navigating through CiscoCyber Vision
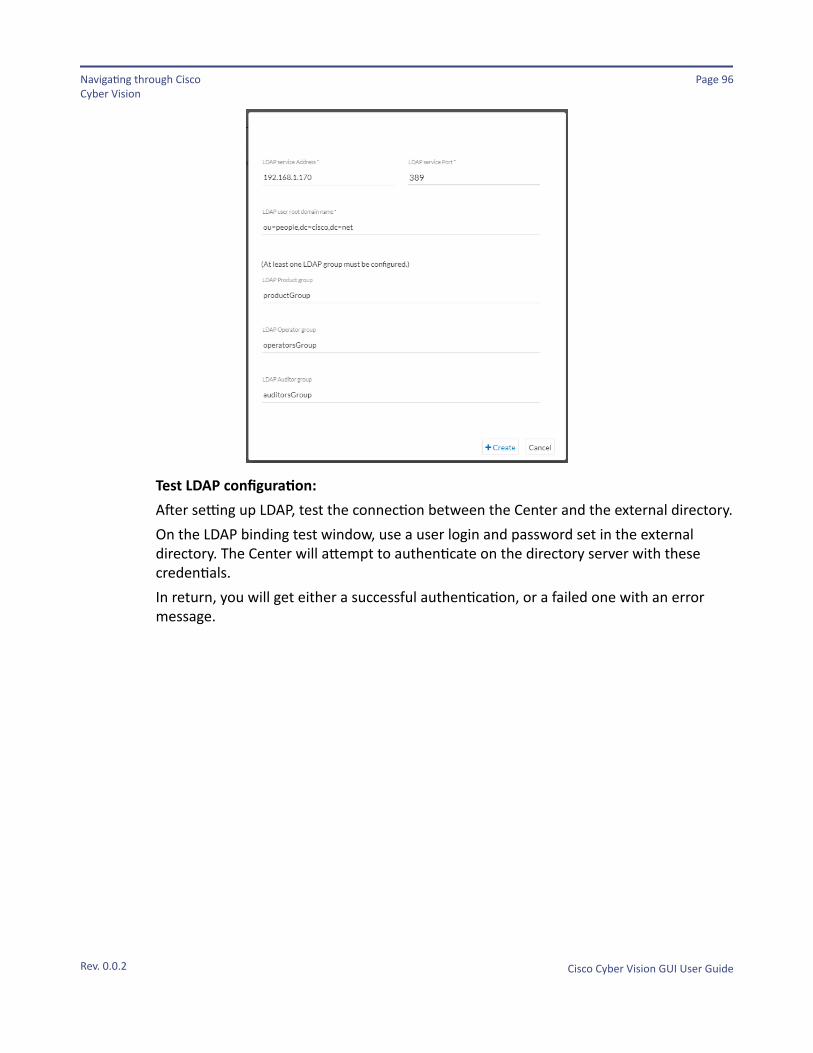
Test LDAP configuration:After setting up LDAP, test the connection between the Center and the external directory.On the LDAP binding test window, use a user login and password set in the externaldirectory. The Center will attempt to authenticate on the directory server with thesecredentials.In return, you will get either a successful authentication, or a failed one with an errormessage.
Cisco Cyber Vision GUI User GuideRev. 0.0.2
Page 96Navigating through CiscoCyber Vision
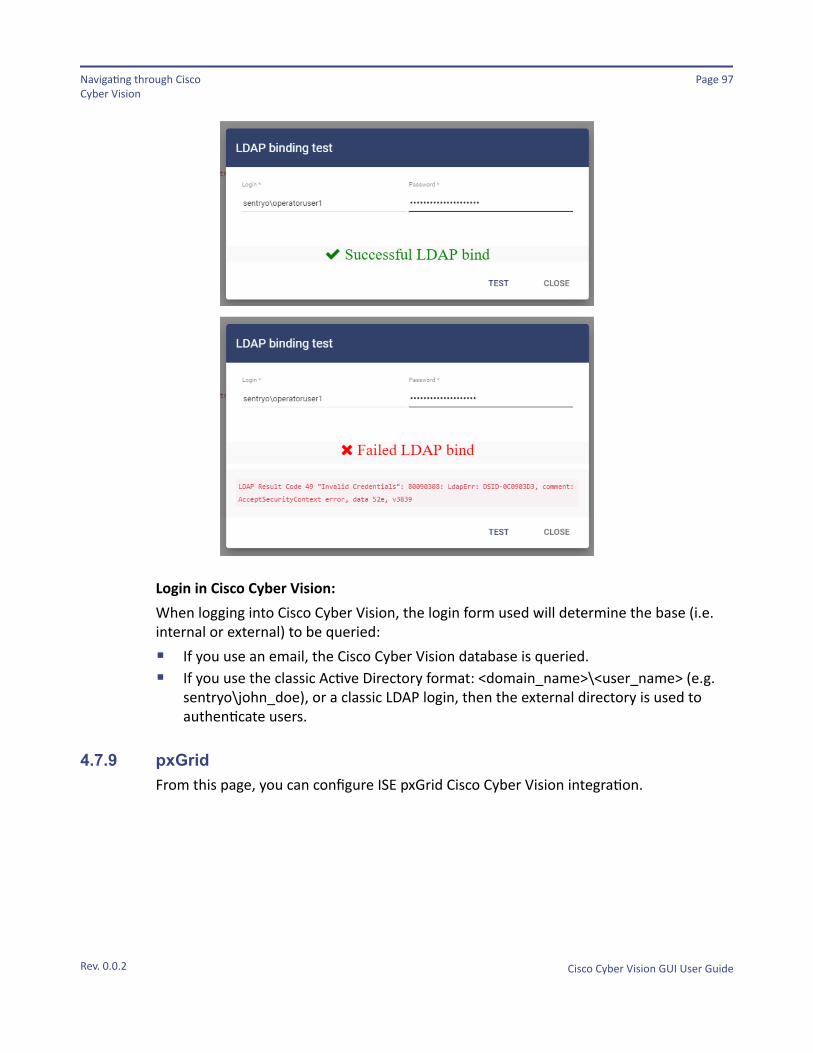
■
■
4.7.9
Login in Cisco Cyber Vision:When logging into Cisco Cyber Vision, the login form used will determine the base (i.e.internal or external) to be queried:
If you use an email, the Cisco Cyber Vision database is queried.If you use the classic Active Directory format: <domain_name>\<user_name> (e.g.sentryo\john_doe), or a classic LDAP login, then the external directory is used toauthenticate users.
pxGridFrom this page, you can configure ISE pxGrid Cisco Cyber Vision integration.
Cisco Cyber Vision GUI User GuideRev. 0.0.2
Page 97Navigating through CiscoCyber Vision

To do so, click the Download certificate button to retrieve Cisco Cyber Vision's certificateauthority. Then access ISE and follow the instructions below.Upload and enable ISE's trust for Cisco Cyber Vision authentication:
1. Access ISE's Administration > Certificates > Certificate Management > TrustedCertificates.
2. Click Import.3. Click Browse and select Cisco Cyber Vision's certificate authority.4. Tick Trust for authentication within ISE.5. Click Submit.Generate a client certificate for Cisco Cyber Vision:
Cisco Cyber Vision GUI User GuideRev. 0.0.2
Page 98Navigating through CiscoCyber Vision

1. Access ISE's Administration > pxGrid Services > Certificates.2. Fill in the fields as shown below:
Note
The CN field is mandatory because the goal of ISE CA is to issue identitycertificate. Ideally you should enter the FQDN of Cisco Cyber Vision, butsince identity certificate is not used by Cisco Cyber Vision, CN field value is notcritical.
3. Download the zip, extract it and upload the .p12 to Cisco Cyber Vision by clicking theChange Certificate button.
4. Fill in the fields.
Cisco Cyber Vision GUI User GuideRev. 0.0.2
Page 99Navigating through CiscoCyber Vision

4.8
Optional:If you do not have a DNS server for your services, you may need to configure custom hostin Cisco Cyber Vision Center and ISE so they can communicate.1. Add custom host in ISE:
ssh -c aes256-cbc [email protected] terminalip host 10.2.3.4 center# wait for application to restartEnd
2. Add custom host and restart pxgrid-agent in Cisco Cyber Vision Center:
ssh [email protected] "10.2.3.180 ise.corp.sentryo.net" >> /data/etc/hosts
System statisticsTo access system statistics click the System statistics button on the top right corner ofCisco Cyber Vision.
Cisco Cyber Vision GUI User GuideRev. 0.0.2
Page 100Navigating through CiscoCyber Vision

4.8.1 CenterThe Center statistics view provides data about the state of the Center CPU, RAM, disk,network interfaces bandwidth and database.
Note
Most data presented below evolve as you select a different period of time.
At the top of the page, you will find general information about the Center (the softwareversion, the length of time that it has been operating (i.e. uptime), the Center systemdate and whether DHCP is enabled or not).The button on the right generates a diagnostic file about the Center that is sometimesrequested by the Cisco product support in case of trouble.
System health:
The system health gives you the state of the Center CPU, RAM and disk usage.Usages (i.e. minimum, maximum and average) are indicated for each of these systemresources while the absolute value is shown in a tooltip if you mouse over the line chart.Below, you have the percentage of the system's current usage. Also, there is an indicativehardware score which is useful to Cisco product support.
Cisco Cyber Vision GUI User GuideRev. 0.0.2
Page 101Navigating through CiscoCyber Vision

The Compute Scores button initiates a new performance measure to compute a newscore.
Network interfaces bandwidth:
The line charts represent the Administration and Collection network interfacesbandwidth with the number of bytes received and sent by the Center per second.For example, the Collection network interface activity lets you see the amount of dataexchanged between the Center and the sensors.
Disk I/O:
The line chart represents the Center hard disk usage with the number of bytes read andwritten per second.
Database:
Cisco Cyber Vision GUI User GuideRev. 0.0.2
Page 102Navigating through CiscoCyber Vision

This section describes the database state by showing cards with the number of flows,components and variables that have been detected by Cisco Cyber Vision. Flowsdistribution is shown in a pie chart.Data is updated each time you access the Center statistics view (the latest count isindicated on top of the database section). However, the Get Count button actualizes thedatabase performance to the current time.
The flows card indicates the total number of flows (i.e. broadcast, multicast and unicastwhich are stored in the database) detected by Cisco Cyber Vision. If you mouse over thecard, you will get the number of activities and the flows evolution tendency. Thisinformation enables you to anticipate how the system load might be affected by flows inthe future.
Cisco Cyber Vision GUI User GuideRev. 0.0.2
Page 103Navigating through CiscoCyber Vision

■
■
4.8.2
The variables card indicates the total number of variables detected by Cisco Cyber Vision.This indicator is important because an overload of variables could impact the Cisco CyberVision performances. If you mouse over the card you will get the number of processvariables and the number of system variables.
Process variables are the number of variables used by PLCs' software. Processvariables are visible in the Monitor mode of the Cisco Cyber Vision GUI.System variables are the number of variables necessary to PLCs' proper operation.System variables are stored in the Cisco Cyber Vision database.
The flows distribution pie chart indicates the distribution of broadcast, multicast andunicast flows stored in the database. Mouse over the chart to see the absolute numberof flows per flow type.
SensorsThe sensors statistics view provides data about the CPU, RAM, disk, network interfacesbandwidth and packets captured for each sensor enrolled in Cisco Cyber Vision.
Note
Most data presented below evolve as you select a different period of time.
On the left you have a list of the sensors (only one sensor is represented here). Click on asensor name to access its statistics.On top of the sensors statistics view you will find general information about the sensor:its status (i.e. Connected), its serial number, its IP and MAC addresses, its firmwareversion, the capture mode set and the time it has been operating (i.e. uptime).
Cisco Cyber Vision GUI User GuideRev. 0.0.2
Page 104Navigating through CiscoCyber Vision

The button on the right generates a diagnostic file about the sensor that is sometimesrequested by the Cisco product support in case of trouble.
System health:
The system health gives you the state of the sensor CPU, RAM and disk usage.Usages (i.e. minimum, maximum and average) are indicated for each of these systemresources while the absolute value is shown in a tooltip if you mouse over te line chart.
Below, you have the percentage of the system current usage. There is also an indicativehardware score which is useful to Cisco product support.
Packets captured:
This line chart represents the number of packets that the sensor captures on theIndustrial network interface (in bytes per second). Packets dropped are also representedbut the value should stand to zero. If the dropped line shows activity then the sensor isoverloaded and is not capturing traffic.
Network interfaces bandwidth:
Cisco Cyber Vision GUI User GuideRev. 0.0.2
Page 105Navigating through CiscoCyber Vision

■
■
4.9
The line charts represent the Collection and the Industrial network interfaces bandwidthwith the number of bytes received and sent by the Center per second.
The Collection Network interface activity chart lets you see the amount of dataexchanged between the Center and the sensors.The Industrial ones lets you see the amount of data captured by the sensor on theindustrial network through each ports couple.Data sent to the industrial network is also represented but value should stand tozero. If the transmitted line shows activity then the sensor is not passive anymore. Ifthis situation happens, please contact Cisco support immediately.
Disk I/O:
The line chart represents the sensor hard disk usage with the number of bytes read andwritten per second.
My settingsYou can set up your personal account by clicking Settings in the user menu on the topright corner of Cisco Cyber Vision.
Cisco Cyber Vision GUI User GuideRev. 0.0.2
Page 106Navigating through CiscoCyber Vision

■
■
■
■
♦♦♦♦
From this page, you can:Modify your first and last name.Change the interface language. Cisco Cyber Vision is available in English, French andGerman.Restore interface notifications.Change your password.Passwords must contain at least ten characters belonging to three out of four of thefollowing character types:
Lower case.Capital letters.Numbers.Punctuation marks or symbols.
IMPORTANT
Passwords should be changed regularly to ensure the platform and the industrialnetwork security.
Note
Your email will be requested for login access.
Cisco Cyber Vision GUI User GuideRev. 0.0.2
Page 107Navigating through CiscoCyber Vision