MA 1986k - DTIC
100
/l- 4 Naval Training Systems Center (0 MEASUREMENT METHODS AND METRICS FOR AIRCREW ASSESMENT DURING CLOSE-IN AIR-TFO-AIR CO MBAT S.T. Breidenbach A.P. Ciavarelli E R. SieversMA6 MA 1986 k La 5 M INAN6fCH~ G
-
Upload
khangminh22 -
Category
Documents
-
view
0 -
download
0
Transcript of MA 1986k - DTIC

/l- 4
Naval Training Systems Center
(0
MEASUREMENT METHODS AND METRICS FOR
AIRCREW ASSESMENT DURING CLOSE-IN
AIR-TFO-AIR CO MBAT
S.T. Breidenbach
A.P. Ciavarelli ER. SieversMA6 MA 1986k
La 5 M
INAN6fCH~ G

NAVAIRSYSCOM N00019-81-C-0098
MEASUREMENT METHODS AND METRICS FOR
AIRCREW ASSESSMENT DURING CLOSE-IN
AIR-TO-AR COMBAT
S.T. Breidenbach
A.P. Clavarelli
R. Sievers
Cubic CorporationCubic Defense Systems
9333 Balboa Ave.
San Diego, CA 92123
LCDR M. Lilienthal
Naval Training Systems Center
Orlando, FL 32813
Final Report - September 1985
DOD DISTRIBUTION STATEMENT O TI1CApproved for public release; ELECTE
distribution unlimited KY1 6 196rk_ [m in!_ _ _
" "" ¢' .'"- -". . .€, - ) . "4" "."." " ', .-. ' ".""". .2,''" 2'...r. -" L E : TE"-,;::N ,, .,'£ "'",

(ref. Box # 18)
Tactical Aircrew Combat Training System (TACTS); Air Combat ManeuveringInstrumentation (ACMI) ; performance measurement ; training feedback;training effectiveness
a
A
S
NAVAIRSYSCOM N00019-81-C-0098
EXECUTIVE SUMMARY
The research and development program reported here was made possible throughsponsorship by two NAVAIR departments, Human Factors and Training Technology(AIR 330J), and Range Instrumentation (AIR 630). The ultimate aim of this researchactivity is to improve the training effectiveness of instrumented ranges, such as theNavy's Tactical Airerew Combat Training System (TACTS), by incorporatinginstructional capabilities.
Planned improvements to the TACTS call for development of an Instructional SupportSystem (ISS) consisting of new range training capabilities that include:
1. Inuetinmal preuentatio (tutorals and simulated demonstratons) -designed to teach air combat tactics and weapon employment.
2. Improved tshif feedback displays - designed to provide instruc-tionally relevant data in operationally useful graphic formats to beused during aircrew debriefings.
3. Diagnstic performanee memeat methods - designed to provideanalysis and diagnostic review of performance against established,user-generated training objectives and proficiency standards.
Research presented in this report deals specifically with the performance assessmentcomponent of the Instructional Support Subsystem, and it should be noted that future
integration of recommended measurement methods, and performance metricsdeveloped, is planned in order to complete the entire instructional system package forTACTS. The main objectives of this study were to:
1. Review and summarize research completed over the past few years inair combat performance assessment, with particular focus on metricsand displays developed for assessing maneuvering and energy-relatedtasks.
2. Recommend the most appropriate measures and measurementmethods necessary to incorporate reliable and valid performanceassessment capabilities as part of an overall ISS developmentprogram.
Both of these primary objectives were satisfied during the course of the study.Measures and measurement methodology were reviewed from the standpoint of theirutility in assessing airerew training progress and proficiency, within the context ofcurrent tactics and weapons availability.
Our evaluation of measurement methods and their application was conducted in asystems framework designed to identify relevant task dimensions and operatingconditions. In addition, some attention was given to the need and means to testreliability and validity of measures. The authors believe that greater emphasis isrequired in these areas to bring training measurement development more in line withprofessional test construction quality standards.
iii
I- r I~ ,y - 1 . I r i;~h-.~N(; §I i~:-C' IQ i't.:~:- I :
CNAVAIRSYSCOM N00019-81-C-0098
It is the authors' contention that any measurement program must progress throughstages which, at a minimum, call for a clear statement of the purpose of measure-ment, and provide systematic testing of reliability, validity, and application ofmeasures.
Procedures for reliability and validity testing are reviewed for those who may beunfamiliar with psychometric methods, and to provide a point of departure for arecommended measurement validation phase of research.
Additionally, if measures used in training are to have any utility to operational users,they must be relevant to the particular training program. This can be accomplished byinvolving users in the process of measurement development, and by emphasizing designof diagnostic graphic formats for presentation of performance data. In brief, we wantmeasures that are scientifically credible and trustworthy, yet satisfy user require-ments for meaningful feedback of training results on specific operational trainingtasks.
A major contribution of this study was the development of an improved maneuveringindex of performance effectiveness for air-to-air combat. Improvements to metricsreviewed were considered essential based on our extensive literature review whichrevealed serious deficiencies in previously developed metrics and measurementmethods.
'. Our analysis of extant metrics for measurement of maneuvering perfo,,iance effec-tiveness indicated that the particular approaches reviewed either could not accom-modate current tactical environmenL and weapon capabilities (e.g. most of themetrics reviewed are limited to rear-hemisphere weapons), or measurement outputsyielded unacceptable "truncated" performance scales.
The metric developed here is capable of measuring effectiveness of maneuvering forair combat within visual range, in which both opponents are equipped with modern, all-aspect weapons. Also, considerable attention was given during development of thealgorithm to insure that metric outputs produce continuous, equal-appearing intervalscale properties with improved sensitivity in reflecting dynamic performance varia-tions.
Plans for validation of the metric and procedures for incorporating maneuveringmeasures into a more comprehensive task-oriented measurement framework arediscussed. This technical discussion includes a review and analysis of measures andtraining aids used for assessment of energy maneuverability performance.
Several new energy metrics were identified in the literature, and their potentialapplication to air-to-air performance assessment was discussed. In general, these
*I specific metrics address fundamental changes in "energy use" concepts stemmingprimarily from introduction of high-performance aircraft and weapon systems. Butnone of the new energy metrics has been tested, and some energy metrics requireinput of aircraft performance data that are not presently available.
Si:
The authors, therefore, refrained from directly incorporating any new energy metricsinto the proposed maneuvering effectiveness algorithm at this time, pending furtherevaluation and availability of aircraft test data.
ivo- ' v € %-.-;.%.m . : _ v ,~cb .r w_ . r. =_ ° '' % f 4 "'%" # b "-#. ...=~ - ' . " ... "" LF , " %' . . . . . .,"'l ';

NAVAIRSYSCOM N00019-81-C-0098
Use of the more commonly understood energy metrics, such as specific energy (E.) andthe first derivative of specific energy (PS), is recommended at this time, but theirapplication deserves a more meaningful display. Suggestions for Improving displayformats used to assess maneuvering effectiveness and energy maneuverability arepresented, and a phased prototype development program Is recommended.
Finally, the report is comprehensive in its treatment and necessarily lengthy. For thisreason, the authors have Intentionally organized the report into separate, but related,topic areas. While we do hope that most would choose to read the entire report, it ispossible to read any of the major report sections with little loss of continuity.
&I,
V/i

NAVAIRSYSCOM N06019-81-C-0098
TABLE OF CONTENTS
Section Title
1.0 INTRODUCTION ..................................... 1
1.1 Problem ..................................... . .... . 1
1.2 Purpose .......................................... . . 2
1.3 Scope ........................................ .... 2
2.0 TECHNICAL APPROACH FOR MEASUREMENT
DEVELOPMENT AND VALIDATION .................... 32.1 Background ......................................... 3
2.2 Measurement Development ............................ 4
2.2.1 Purpose of Measurement ............................. 4
2.2.2 Measurement Types ................................ 4
2.2.3 Measurement Methods ................................ 5
2.2.4 Measurement Application ............................. 9
2.2.5 Measurement Selection ............................... 11
2.2.6 Reliability Testing ................................... 19
2.2.7 Test Validation Concepts .............................. .19
2.2.8 Methodological Considerations ......................... 21
2.2.8.1 Measurement Specification ............................ 21
2.2.8.2 Reliability Testing Problems ........................... 22
2.2.8.2.1 Test-Retest ..................................... 22
2.2.8.2.2 Internal Consistency Reliability ....................... 23
2.2.8.3 Validity Testing Problems ............................. 24
2.2.9 Strategy for Measurement Validation ................... 26
3.0 REVIEW OF AIR COMBAT MEASUREMENT MODELS .... 27
3.1 Review Methods and Evaluation Criteria ................ 21.7
3.2 Performance Assessment and Appraisal System .......... 28
3.3 Background for Position Advantage Models .............. 28
3.3.1 Maneuver Conversion Model ........................... 31
3.3.2 Performance Index ................................... 32
3.3.3 All-Aspect Maneuvering Index ............. 36
vii
N.),J . , ,#'t'tsJ.Q ;"..- ] 2 .. . ,, ,, ,".+% "+., , .+..' ' .' < .'. ,° .' ,.. - - ,..., # , ,+ . ..,-,.,./, , +, .

NAVAIRSYSCOM N00019-81-C-0098
TABLE OF CONTENTS (Continued)
Section Title Pe
3.3.4 TACSPACE ......................................... 37
3.3.5 Review Summary .................................... 37
4.0 DEVELPMENT OF A MANEUVER INDEX ............. 39
4.1 Basic Components of a Maneuver Index ................. 39
4.2 Computation of the Maneuver Index .................... 45
5.0 ENERGY MANEUVERABILITY CONCEPTS ............ 49
5.1 Historical Perspective ................................ 49
5.2 Metrics for New-Generation Aircraft ................... 53
6.0 ENERGY MANEUVERABILITY DISPLAY ................ 56
6.1 Description ........................................ .56
6.2 Operational Status and Usage .......................... 59
6.3 Evaluation of the EMD ................................ 59
6.4 Alternatives to the Current Energy Maneuverability
Display ............................................. 60
7.0 ENHANCED DISPLAYS FOR AIRCREW TRAINING ....... 61
8 8.0 SUMMARY, CONCLUSIONS AND RECOMMENDATIONS.. 76
9.0 REFERENCES ...................................... 78
APENDIX A TACTSIACMI DESCRIPTION .......................... 82
APPENDIX B GLOSARY OF AIR COMBAT TERMS ........... 85
D . : DISTRIBUTION LIST
......- % 'N: .... ! " , " '= : :i i '- ' .... F 'i... . .. 'X . . . .. A..... a-'. : • . *, ,

tHAVAIRSYSCOM N00019-81-C-0098
LIST OF TABLES AND FIGURES
Tabkffl owe Pace
Figure 2.2.2-1 Simplified Air Combat Sequence:
Shows Engagement Phases and Measurement
Points .............................................. . 6
Table 2.2.2-1 Air Combat Engagement Analysis ....................... 7
Figure 2.2.2-2 Measurement Types and Applications .................... 8Figure 2.2.4-1 Measurement Application During Various
Phases of Training .................................... 10
Figure 2.2.4-2 Menu Used to Select Diagnostic
Performance Graphs ................................... 12
Figure 2.2.4-3 Graphic Format Used to. Review Radar Contact
Information for a Single TrainingDetachment .................. ........................ 13
Figure 2.2.4-4 Graphic Format Used to Review Visual
Identification Information for a Single
Training Detachment .................................. 14
Figure 2.2.4-5 Graphic Format Used to Review Aim Missile Fire
Accuracy (Envelope Recognition) for aSingle Training Detachment ............................ 15
Figure 2.2.4-6 Missile Fire Success Rates ............................. 16
Figure 2.2.5-1 ACM Event Outcome Probability Tree ................... 17
Figure 2.2.5-2 Intercorrelation Matrix ................................ 18
Figure 3.3-1 Geometric Representation of Interaircraft
Parameters .......................................... 30
Table 3.3.1-1 State Transition Probabilities ........................... 31
Figure 3.3.2-1 Range Performance Penalty Function .................... 34
Figure 3.3.2-2 Energy Influence Function ............................. 35
Table 3.3.5-1 Limitations of Existing Performance
Measurement Models ................ 38
Figure 4.1-1 Methods for Computing Angular Geometry
Component of Maneuver Index .......................... 40
ix

NAVAIRSYSCOM N00019-81-C-0098
LIST OF TABLES AND FIGURES (CONINUED)
TS! ekr± Title Em
Figure 4.1-2 Relative Aircraft Position Examples ..................... 42
Figure 4.1-3 Scoring of Angular Geometry Component for
Relative Aircraft Positions ............................. 43
Figure 4.1-4 Requirement for Weapons Range Component
of Maneuver Index ...................... .............. 44
Figure 4.2-1 Illustration of Top View of Weapon Launch
Envelope ............................................. 46
Figure 4.2-2 Summary of Computation Logic for Weapon
Range Component of Maneuver Index .................... 47
Figure 4.2-3 Simplified Flow Diagram of Maneuver Index
Processing Steps .................. 48
Figure 5.1-1 Altitude - Mach Diagram ....................... 51
Figure 5.1-2 Turn Rate-Mach Diagram....... 52
Figure 6.1-1 Display Data Point Definition, Maneuver
Triangle ............................................. 57
Figure 6.1-2 Ilustration of Energy Maneuverability Display ............ 58
Figure 7.0-1 Airerew Training Model ......................... 82
* Figure 7.0-2 Display and Debriefing Subsystem:
(DDS) for TACTS/ACMI ................................ 63
Figure 7.0-3 Display and Debriefing Subsystem.
Centroid Top View ............. ............ 65
Figure 7.0-4 Display and Debriefing Subsystem:
04 N Centroid, Rotated Side View ........................... 66.nFigure 7.0-5 Display and Debriefing Subsystem:
Pilot Cockpit View Display ............................. 67
Figure 7.0-6 Display and Debriefing Subsystem:
Alphanumeric Flight Data .............................. 68
Figure 7.0-7 Display Enhancements to Pilot Cockpit View
Display ................................ 69
Figure 7.0-8 Maneuver Diagram .................................... 71
I
x
-w.-- -, ."- ", .'.,' -,. . " -.,, , .-, • . . ." , , .,, az.... .. . ... . . .

NAVAIRSYSCOM N00019-81-C-0098
LIST OF TABLES AND FIGURES (CONT INUED)
Tgblefl w e Titl PA
Figure 7.0-9 Diagnostic Assessment: Maneuver Index
Profile .............................................. 73
Figure 7.0-10 Diagnostic Assessment: Maneuver Index
Profile Learning Curve ................................ 74
Figure .0-11 Diagnostic Assessment: Pilot Performance
Compared to Air-to-Air Training Standards ............... 75
Figure A-1 Tactical Aircrew Combat TrainingSystem (TACTS) ...................................... 84
Figure A-2 General Configuration of TACTS Subsystems ............. 84
xi/xii

NAVAIRSYSCOM N0001941-C-0098
1.0 IWRODUCTIOF
1.1 PROBLEM
Maintaining a high-performance aircraft in an optimum anergy profile is an extremelydifficult skill to teach, learn and assess. Tt'3 is particularly true while the pilotattempts to maneuver his aircraft to attain a position advantage and missile fireopportunity against an adversary aircraft. The difficulty in acquiring energymaneuverability skills may be due, in part, to the fact that energy management cannot be viewed either as an absolute or linear concept. Instead, &n ideal energy state Istransient at any moment of an air-to-air engagement and is dependent upon thetactical or position advantage of the fighter relative to the adversary.
Energy may be defined as the sum of the potential and kinetic energy of an aircraft.To maintain an optimum aircraft energy package, the pilot must Judiciously ue hisenergy resources. This often involves split-second tradeoffs of speed (kinetic) foraltitude (potential) and vice versa. Energy tradeoffs are made by the pilot with thespecific objective to maneuver the aircraft into position to launch a missile anddestroy the target. A key to skilled pilot performance is to learn to control theinterplay between energy and maneuvers which are important to winning the fight.
Because of the interrelationship between position advantage and energy, both havebeen a subject of study by researchers. Much research emphasis during the past 10years has been directed to assessing the relative position advantage of one aircraft toanothpr. The work originated out of the test and evaluation field and was undertakenwith the aim to develop a global criterion of air combat. It was thought that a globalcriterion could be used to evaluate the effectiveness of a training system. Theselargely fragmented efforts produced a number of techniques which attempted to assessa pilot's position advantage performance during close-in maneuvers. Unfortunately,little or no effort was made to assess the validity and reliability of the measures.Since measures developed were often not task-based, they often lacked diagnosticvalue as training feedback.
On the energy side, researchers have emphasized the develop ent of training aids asopposed to developing measures for assessment. Specifically, NuItt, Moroney and Lau(1980) developed a prototype Energy Maneuveratility Dispt (EMD) under thesponsorship of the Naval Aerospace Medical Research Labort:ry. rhe EMD prototypewas designed to aid pilots in learning energy management skilis. The EMD wassubsequently implemented on the Tactical Airerew Combat Training System/AirCombat Maneuvering Instrument&;.on (TACTS/ACMI) by Cubic Defense Systems andhas been in operation for the past several years.rThe intenued use of the EMD, whichis described later in the report, is to enhance t'aining feedback related to energymanagement during TACTS/ACMI debriefs. For the reader who may be unfamiliarwith TACTS/ACMI, a description of the system is praented in Appendix A. Someterms used frequently in air combat are provided in the glossary.
J ......... .i ... . i i I I I! I.I I .~ I .

NAVAIRSYSCOM N00019-81-C-0098
1.2 PURPOSE
The present study was conducted to bring to focus the fragmented research effortsperformed in the position advantage area and integrate the results with availableenergy metrics. It was envisioned that a product of the research would be an up-to-date algorithm that would combine energy maneuverability and position advantageassessment capability. Recommendations would also be provided for presentingalgorithm output in display formats that would be meaningful and diagnostic toairerews. An additional study objective was to review and document the currentoperating status of the EMD\and make recommendations for updating software andrevising display formats to imp-ove their instructional value.
1.3. SCOPE 'C 'P1JAVL_
SThe research reported here represents the development of performance algorithms anddiagnostic displays for the maneuvering portion of an air-to-air combat engagementconducted within visual range. Although the metrics described in the report arespecific to air-to-air combat, the methods for developmant, validation and display ofperformance metrics are generalizable to other missions such as air-to-surface andelectronic combat.
2

NAVAIRSYSCOM N00019-81-C-0098
2.0 TECHNICAL APPROACH FOR MEASUREMENTDEVELOPMENT AND VALIDATION
2.1 BACKGROUND
This report reviews and evaluates several attempts by researchers to developmeasurement models for assessing the effectiveness of performance during air-to-air
combat. Several approaches, and numerous performance metrics, have been developedover the past few years which purport to measure performance effectiveness. Thesemeasurement models deal primarily with the maneuvering portion of an air-to-aircombat engagement. The measures used are intended for application as an aid totraining on instrumented ranges, such as the Navy's TACTS, or on flight simulators,such as the Air Force Simulator for Air-To-Air Combat (SAAC).
For the most part, this report evaluates these measurement models on their ownmerits with respect to their ability to accurately depict the air combat tacticalenvironment, and on the basis of their utility in training and training effectivenessevaluation. An equal, if not more important, criterion of evaluation addresses-questions concerning the actual measurement purpose and properties of performancemetrics in terms of whether or not the measures proposed can meet quality standardsof a test instrument. These standards require adequate sampling of a specific taskdomain, and statistical demonstration of acceptable reliability and validity.
Test instruments designed for educational measurement, and other behavioral applica-tions, generally follow a procedural famework that calls for systematic phases of testdevelopment and validation (Benson and Clark, 1982).
In the development of educational measures, for example, these procedures Include (1)Definition of the purpose of the test instrument (2) Specification of the measurementdomain in terms of psychological traits, or tasks and subject matter, (3) Definition ofthe target population for test administration (4) Preparation of performance objec-tives, (5) Composition of test items, based upon performance objectives (6) Ar.alysisand selection of high quality test items, i.e. on the basis of item difficulty anddiscrimination values, and (7) Statistical testing of test score reliability and validity(Ebel, 1979; Mehrens and Lehman, 1973).
As a further precaution to insure quality and appropriate application of educationaltest instruments, professional agencies have established standard practices for devel-opment and validation of tests which explicitly specify acceptable levels of reliabilityand validity. (American Psychological Association, American Educational ResearchAssociation, and National Council on Measurement in Education, 1974).
When one surveys the great variety of performance measurement approaches taken inthe training literature, a small sample of which is reviewed here, it is apparent thatchere are no equivalent standard practices in effect for the development, validation,and application of performance measurement systems in military training applications.
3
,'. .;;;i..S\ .;-".;,-.,",'3,t,., : ' <z.. '..-:.-r",, .,.. :.,',: " .' , '.' -. .. N: -.'.- t-,,V, . t",, W.,P.X'- '. >4>y ".Z'. .~ ', *:.< N ."', .5' ,, ' 4' ,
I InIt I~M I~ "~' "1Pnd~ t It - :1 :,:: :

NAVAIRSYSCOM N00019-81-C-0098
The performance measurement systems discussed in this report are no exception tothis rule. Each of the mathematical models reviewed and evaluated was formulated,and sometimes applied, with little or no attempt to understand the measures employedfrom the standpoints of the actual purpose and application of measures obtained, theunderlying task domain, and the quality of the test instrument itself, i.e. reliabilityand validity of measures obtained were not demonstrated.
2.2 MEASUREMENT DEVELOPMENT
The development of performance measures for use in training systems must addressseveral key issues, which parallel those frequently encountered in design of education-al test instruments, such as:
1. Purpose of measurement - Why do we measure?2. Measurement Types - What do we measure?3. Measurement Methods - How do we measure?4. Measurement Application - How, and when, are measures used?5. Measurement Reliability - Do measures used yield consistent results?6. Measurement Validation - Do measures work for intended purpose?7. Methodological Considerations - What are methodological limitations
and caveats?
Each of these issues is briefly discussed here, with an eye toward establishing aframework for more detailed treatment and consideration during planned measurementvalidation tests outlined in a later section of this report.
2.2.1 Purpose of Measurement
The effeitiveness of training depends largely on the quality of the evaluation on whichtraining decisions are based. For without the benefit of meaningful performanceassessment methods, we cannot 1) determine whether instruction is meeting itsintended design objectives and 2) whether or not trainees have attained thecapabilities desired (Gronlund, 1976; Gagne and Briggs, 1979).
For purposes of instruction and training, the availability of measures enables us tomake judicious decisions concerning the allocation of training resources, i.e. we strivenot to repeat practice on tasks that are already learned, but to concentrate on tasksrequiring additional practice.
" I., Training performance measures are important because they provide essential feedbackto trainees and instructors about the progress of learning, and also because theyprovide a quantitative data base for overall estimation of training system effective-ness, i.e. whether or not a training system is meeting its design objectives.
2.2.2 Measurement Types
Measurement in education and training is based upon a cycle of events that call for thefollowing.
1. Specification of training objectives or intended learning outcomes.
2. Planned training activities which include a determination of anappropriate instructional strategy and a method for delivery oftraining.
4
til! An su .A

NAVAIRSYSCOM N00019-81-C-0098
3. Evaluation of training results in terms of measurement and assessment ofactual learning outcomes.
Performance-based training objectives provide the basic building blocks for develop-ment of a particular training system, and form the basis for later specification ofmeasures used to assess student progress and to evaluate the effectiveness ofinstruction (Gagne and Briggs, 1979).
In the field of education, formally constructed task taxonomies in the psychomotor(Harrow, 1972), cognitive (Bloom, 1972), and affective (Krathwhol, Bloom, andBertram, 1972) domains exist and are usually employed for identifying task dimensionsin educational test development (Benson and Clark, 1982).
But in the area of complex man-machine systems, exemplified by instrumented rangesand simulators now increasingly used in military training, no commonly acceptedtaxonomy of operational tasks prevails. 1
In the absence of a standard task classification system for human skills, we arecompelled to apply time consuming task analysis method. i order to arrive at an apriori listing of tasks that are presumably critical to operational mission success. (Seefor example, Ciavarelli, Pettigrew, and Brictson, 1981a; Vreuls and Wooldridge, 1977)
In most of the measurement approaches reviewed here, particularly the attempts atmodeling air-to-air maneuvering performance, this very important step requiringprecise task specification was not undertaken. As a result, measures obtained aredifficult to relate to actual aircrew tasks and expected learning outcomes. This limitsthe application and value of these measurement models, which by themselves, are notvery useful in diagnostic assessment of training progress across task areas, or forevaluating training transfer results in operational missions, such as air-to-air combat,that typically represent multidimensional task environments.
Figure 2.2.2-1 shows a simplified air combat engagement sequence as usually flown onthe Navy's TACTS. Corresponding to this figure is Table 2.2.2-1 which itemizesspecific task-oriented training objectives and candidate performance measures(Ciavareli, Williams, and Pettigrew, 1981b). This figure and table illustrate themultidimensional aspects of the air combat mission, and also exemplify the need toidentify measures that cover several domains, encompassing cognitive (e.g. tacticaldecision making), procedural (e.g. missile launch sequence), and perceptual-motor (e.g.adversary aircraft tracking) task components. Figure 2.2.2-2 illustrates the types ofmeasures possible and their application to measurement of performance in air combat.The information provided in these figures is a useful point of departure for furtherdevelopment and validation of measures, discussed in more detail in a later section.
2.2.3 Meaumrement Methods
The way to assess learning progress during training is to build tests or other0 as3essment methods which directly measure the human performance described in the
objectives of the training program (Gagne and Briggs, 1979). In most trainingapplicatior, diagnostic measures are required In order to pinpoint instructional needs,so that trainees can concentrate on skills they lack and avoid unecessary instruction.
'Several attempts at deriving human skill taxonomies have been made, but most ofthese have concentrated on laboratory tasks that are difficult to extrapolate tooperational missions (Fleishman, 1967), or have little instructional relevance (Merrill,
1972).
5
• .- ',4 N...- ,..% '._. .. ,-,r J'.% - , . ;',.. .':. r'. ; .. .'N 4 . .:. .. , ',.. '',: .' .. r:,L'Y

?JAVAIRSYSCOM N00019-81-C-0098
0
wo0
w X CD
aj z
IxI~iioz 4I
0 0
w w0
uuL
-E -0 - - -
0Aq .
Cl
z cc w
< w u. R6*~~~~~~w~~ Nc" ; - ~ . . - . -

NAVAIRSYSCOM N00019-81-C-0098
TABLE 2.2.2-1AIR COMBAT ENGAGEMENT ANALYSIS
Training Objective Performance Measure
1. Obtain early radar contact Interaircraft range and success rate (%) overand lock-on engagements flown
2. Determine adversary attack Quantity and position of enemy aircraftformation at 10 nm.
3. Obtain early visual detection Interaireraft range and success rate (%) overof adversary aircraft engagements flown
4. Obtain early visual identifica- Interaireraft range and 3uccess rate (%) overtion (VID) of adversary aircraft engagements flown
5. Determine attack formation Quantity and position of enemy aircraftat initial pass
6. Maintain optimum energy state Indicated air speed and altitude (energypackage); composite energy metrics
7. Gain/maintain position ad- % or proportion of engagement in offensive,vantage defensive states
8. Gain firing opportunity Time and/or % in envelope or fatal offensivestate
9. Obtain first shot of engage- Elapsed time and % first shotsment
10. Fire weapon in weapon en- Interaircraft range, angle-off-tail, pointingvelope angle, airspeed and acceleration parameters
11. Obtain first kill of engage- Elapsed time and % first kills
ment
12.. Execute successful re-attack Iterate 6-11 above
13. Execute successful bugout by % neutral, indicated airspeed and altitude,staying neutral, maintaining % loss at bugoutenergy, and completing dis-engagement with no friendlyloss
14. Obtain favorable exchange Ratio of fighter-to-adversary killsrate
15. Satisfy mission (utility) re- Neutralize threat aircraft and survive orquirements minimize losses
7

NAVAIRSYSCOM NOO0i-81-C-0098
Cj w
E EID. 0
ow LD 0 U.U. U
1E~- w a. - z
E 01 0 0 0 2 0
CL4U
c
w~2 E'UMEd
0 0 r0 rS
Wc %m 0
4D C.4
*LU 0
00
8

NAVAIRSYSCOM N00019-81-C-0098
By following this logic, educators and training specialists are turning increasinglytoward the use of criterlon-referenced measurement methods (Popham, 1978; Swezey,1978; Glaser and Klaus, 1971).
Criterion-referenced measures are based on training objectives which describelearning outcomes In terms of the kind of student performance that we are willing toaccept as evidence that instruction has been successful. This measurement methodemphasizes determination of what an Individual can do, without reference to theperformance of others.2
The task framework (presented in Figure 2.2.2-1) implies application of a criterion-referenced measurement methodology. Using this approach relevant task dimensionsare identified, together with doctrinal training performance standards to be ust inproficiency evaluation.
This framework has already been applied in the development of the PerformanceAssessment and Appraisal System (PAAS) which provided the capability to store,retrieve, and display data in the form of diagnostic (graphic) feedback to aircrewstraining on the Navy's TACTS (Clavarelli, et al., 1981b; Ciavarelli, 1982).
The PAAS allowed aircrews to assess performance against a set of proficiencystandards (established by tactical experts at the Naval Fighter Weapons School) forkey air combat training objectives.
A performance evaluation tool, such as PAAS, must meet a requirement for adequatesampling of tasks composing the highly multidimensional air combat mission. PAAS isdeficient in this area because the system treated only discrete task components, i.e.radar contact, visual identification, missile fire, and engagement outcomes, and didnot address some important continuous task operations. For example, PAAS did notinclude maneuvering effectiveness and energy maneuverability tasks and measures.
One purpose of the review of mathematical measurement models, and energy metrics,reported here was to select measures appropriate for assessing performance during themaneuvering portion of an air combat engagement, and thereby complete thisparticular measurement framework for air-to-air training evaluation.
2.2.4 Measurement Application
The purpose and application of measurement in training systems varies over the"S duration of instruction, as illustrated in Figure 2.2.4-1. For example, performance
tests may be used early in instruction to assess the capabilities of students inundertaking planned instruction, and to appropriately assign them to a trainingprogram suitable to their particular readiness. Measures taken during initial instruc-tional development are used to suggest modification and improvement to instructiondesign and delivery. Finally, measures taken after instructional delivery are applied toassess student progress and overall training effectiveness. (See Figure 2.2.4-1).
2 As distinguished from norm-referenced measurement that interprets an individual's
score in terms of a comparison between his performance and the performance of othermembers of a group (i.e. with respect to a group average).
-.
9
V__

NAVAIRSYSCOM N00019-81-C-0098
0) WJ
a. 0 .z ~~ C,) >QZ~a
wI 0.
00
Oz w
ZWI w .2D c
<L (Ow W -
z <<MmzW wl)0- J UWa L
a)l 4cn 6 c . <O20LL. Li
00
rc0.10
U- I-; CL
*i o <- C

NAVAIRSYSCOM N00019-81-C-0098
In the application considered here, we are primarily concerned with measures used todiagnostically assess performance during, and after, the course of training as it isundertaken on Instrumented ranges and simulators.
The PAAS, once again, serves as an example. Figures 2.2.4-2 through 2.2.4-6 showpossible application of menu-driven graphic displays for providing operational air-crews, and their instructors, with the means for assessing performance on critical air-to-air combat tasks. Figure 2.2.4-2, presents the "diagnostic assessment" menu forselection of a particular performance summary graph, and Figures 2.2.4-3, 4, 5, and 6show, respectively, hypothetical performance graphics for radar contact, visualidentification (VID), missile fire accuracy, and missile fire success rates. Using PAAS,operational aircrews are able to review performance results following training, and todetermine proficiency levels against established standards, e.g. missile fire accuracyrequirements. PAAS also provides (not shown here) air-to-air final engagementoutcome scores (win, loss, draw) which can be applied to estimate overall performanceeffectiveness for air combat mission training.
2.2.5 Measurement Selection
In previous sections of this report we have drawn several parallel relationshipsbetween the construction of educational tests and performance assessment methodsused in training systems. In brief, performance measures used in training (like testitems and scores) must be consistent with performance objectives and must meetacceptable standards of reliability and validity.
A very important part of measurement development and validation begins with theformulation of a statement of purpose of the intended measurement instrument, whichincludes a specification of the domain to be measured, i.e. content area or constructsconsidered, and identification of the target group for which the instrument is Intended.This type of early measurement planning helps us to select appropriate procedures forlater reliability and validity testing. Initially, measures can be identified through taskanalysis procedures, and later verified for their relevance to overall mission successthrough correlation with a terminal measure of performance (Roscoe, 1980).
In the case of air combat measures, for example, antecedent event scores obtained oncritical tasks composing the air combat mission, such as radar contact, visualidentification, first-shot opportunity, and missile fire accuracy, can be correlated withfinal engagement win/loss outcomes (Ciavarelli, 1982). Figures 2.2.5-1 and 2.2.5-2show results from analysis of about one hundred air-to-air engagements flown on the
r' -Navy TACTS, and illustrate this point. Figure 2.2.5-1 shows the empirically obt, nedrelative frequency probabilities in an event tree format. This figure illustratescontingent relationships between various antecedent event scores and finalengagement outcomes. For example, analysis of this figure into "best case" and "worstcase" event outcomes indicates a .69 chance of obtaining a favorable win outcome forthe best case, versus a .14 chance for the worst case. Closer examination offigure 2.2.5-1 shows that the most significant event related to final engagementoutcome is "lst missile shot." For instances in which fighters obtained the first shotopportunity, the probabilities of winning the engagement were .69, .56, .73, and .30. Incases for which adversaries obtained the first shot opportunity, the--probabilities--of afighter win dropped to 0, 0, 0, .14. (See Figure 2.2.5-1 for illustration of these eventrelationships and outcomes.) By way of summary, when comparing results of earlytask performance on visual identification, first-fire opportunity etc., the resultssummarized in Figure 2.2.5-1 demonstrate that more favorable outcomes are attainedby aircrews who have made early positive identifications, and have taken a firstweapon fire opportunity.
.11

NAVAIRSYSCOM N00019-81-C-0098
*Z 0 itu 6
c ~ 00 t
6 a * 00
0
03 C3 0 0
us a;- no
eai. E= ** -o2z zW I. J*
c Cw qu 0 0
uua
C
z z LUN: Z:
124

NAVAIRSYSCOM N00O1B-S1-C-OO9B
LL-i
0
o iUJo
Mu ii
Zo 00
NCU- EL.......... .w
Cm 4c
24
Q dc
~UJ - 0wv
(~I *N)
13
.5V4
- *v.*.'.,* ~ ~4bA A" :Q~K::All<

NAVAIRSYSCOM N00019-81-C-0098
U.-j
z bi0
c
00 cuSw>I
00 cm
00~s I-(,~
o cz L
20 .2
CC
CO 4 ClJ ~ N)C
o~4: 3UJ sRUuM6MU3 CB
CO<M
14
.'.. ~ ~ ~ .-'*-v ~~- -* -~~ J-~*-~. a%,'~*. - ~-~ -~ *e~ ~ J* ~ .p~ ~ * **% ~ ------.-- _

?JAVAIRSYBCOM NOOO 19-S 1-C-0098
U. i
0.0
Z IL
'INr
K ~ PI ~ 1A
S.L
Go 0*
S
~amrorTycm*
.5 'z ** _j2
> -1 cCd 4cCmC
S... 5 5 * ii 0 c
1 7 U ,
UJ z
-w
15

NAVAIRSYSCOM N00019-81-C-0098
WEAPON FIRE SUMMRR y(Engagements - 12)
.: " .00
s o69 69 68
-j
0A UJ
U 40 3
20
0 -- 11111111L No ShotsALL 9-L G'HFIGHTE:R MISSILES
(FROM KRESS ANO BREIDENBACH, 1983)
Flgure 2.2.4-6 Missile Fire Success Rates
16
f-o, 0

NAVAIRSYSCOM N00019-81-C-0098
vz
z,
0 0
.3z 0)
uuJ~ U
cc Q
go )17U

IIAVAIRSYSCOM N00019-81-C-0098
n- CVl 0C v , f
I- Inc o c
104
* A I 7
C
CVC
C, C
LNN
N W I-SCDN
u 0 z -Z.e
cc' z LI' p <0I41 >..0
(Q2n D Z c Cu'.c( 0 L DA
5
U U < C LJ0 a .c .)5 0s . ) c j C ' u0U
18w

NAVAIRSYSCOM N00019-81-C-0098
These results were supported during correlation analysis, presented in Figure 2.2.5-2,which shows relationships between antecedent task scores and final engagementoutcomes. Significant correlations (p <.05) were established between engagementoutcome scores and such early task measures as visual identification range, weaponfire accuracy, and first-fire opportunity. Measures thus selected subsequently define ameaningful test set that can then be evaluated further lor reliability and validity.
2.2.6 Reliability Testint
Reliability is defined as the consistency of measurement over time, or precision ofmeasurement. 3 Several practical methods for determining reliability are brieflydescribed below (Allen and Yen, 1979; Benson and Clark, 1982):
1. Test-Retest - Administered by giving the same test to the samegroup (under the same conditions) at two different times, thencorrelating the scores using the product moment correlation coeffi-cient.
2. Equivalent Forms - Give form 1 immediately followed by equivalentform 2 of same test; correlate the two scores using product momentcorrelation coefficient.
3. Internal Consistenc - For tests with dichotomously scored items, usekuder-Richardson ormula 20; for all others use the coefficient alpha
--4 formula. (See Allen and Yen, 1979).
Y:cZ Of these, the test-retest method is most appropriate for testing reliability inheterogeneous test situations composed of numerous task dimensions, and is thereforeapplicable to the multidimensional framework used in air combat.
'An example of this particular methods' application might be to have the same group of-A aircrews fly duplicate trials under controlled conditions on a flight simulator, using a
fixed scenario and a mechanized, intelligent adversary, and correlating scoring resultsbetween successive test administrations.
To offset any possible contamination from learning effects, reliability testing should4 be conducted after aircrews have reached asymptotic levels of performance, i.e. are
on the high end of a learning curve.
2.2.7 Test Validation Concepts
Test reliability is a necessary, but not a sufficient standard for test/measurementdevelopment. An equally important requirement for judging the quality of a testinstrument entails demonstration of the validity for a given application. 4
r 3Reliability (oxx-), based on classical true score theory, is defined as (1) the squaredcorrelation between observed scores and true scores, oxx*= p2 xT, or (2) the ratio oftrue-score variance to observed-score variance Pxx'= a2 Th 2x But these theoretical
notions are most frequently represented by, test-retest, equivalent forms, and internalconsistency reliability methods, because true scores cannot be empirically determined.(Allen and Yen, 1979 p. 73)
4 1t should be noted that reliability (0xx-) limits validity (pxy) because true score theoryassumes that test scores can not correlate higher with any other scores than they cancorrelate with their own true score values, cxy 4 a_<--, (Allen and Yen, 1979, p. 98).
19

NAVAIRSYSCOM N00019-81-C-0098
A test is valid if it measures what it purports to measure (Allen and Yen, 1979).Another way of stating this is that a test must meet its intended purpose. Standardsfor test construction (APA, et al., 1974) discuss several kinds of "interdependent"
_ validity which are briefly discussed below:
1. Criterion - related - Apply when one wishes to infer from a test scorean individual's most probable standing on some other variable called acriterion. Predictive validity statements indicate the extent towhich an individual's future level on the criterion can be predictedfrom knowledge of prior test performance. Concurrent validityreflects only the status quo of a particular time, i.e. both predictortest data and criterion measures are collected at the same time(APA, et al., 1974, p. 26).
Criterion-related validity is important in aptitude tests which may be needed to screenand select students with the appropriate entry level skills necessary to undertake aparticular training regimen.
2. Content validity - is required when the test user wishes to estimatehow an individual performs in the universe of situations the test isintended to represent. A test is "content valid" to the extent that itshows behavior demonstrated during testing constitutes a representa-tive sample of behaviors required in the performance domain (APA,et al., 1974, p. 28).
The development of a task analysis framework, such as the one presented in an earliersection of this report for the air combat mission, exemplifies procedures necessary toestablish the content specification for adequate sampling of the performance domain.
3. Construct validity - A construct is a theoretical idea developed toexplain and organize existing knowledge. To establish constructvalidity, the investigator begins by formulating hypotheses about the
& characteristics of those who have high scores on the test and thosewho have low scores (APA, et al., 1974, p. 28).
Construct validity is based on an iteration between theory building and empiricalverification of specific hypotheses, or predictions based on theoretical precepts.Hypothesis testing can use any one, or all, of three methods, 1) known-groupcomparisons, 2) factor analysis, and 3) multitrait-multimethod procedures (Benson andClark, 1982).
1. Known-groups procedure - requires that a particular group tested already possess
the attributes or capabilities being measured. In the case of education and trainingmeasures to be used in evaluating student achievement, tests/measures should be ableto discriminate scores produced by entry level students (novices) from scores attainedby those who have completed training (experts), or who have otherwise acquired thehigh levels of skill required to perform the operational mission. Measurementsensitivity may be tested in the air combat training application, for example, bycomparing performance scores obtained on traihing ranges and simulators between theexperienced aircrews (e.g. pilots unde instruction) and more highly experiencedaircrews (e.g. flight instructors).
2%• w 20

NAVAIRSYSCOM N00019-81-C-0098
2. Factor analysis methods - require the investigator to hypothesize the nature andnumber of factors underlyini a particular measurement scale. The term factor refersto a theoretical variable derived by analyzing intercorrelatIons of test scores. (Allenand Yen, 1979). This procedure has proven to be particularly useful in themeasurement field for reducing a large set of measures to a manageable number offactors, represented by highly intercorrelated measures. Factorial vRlidity is estab-lished on the basis that factors so composed from a correlation matrix meet anexpected, or theoretical, factor structure. A predictable factor structure providesevidence about the validity of the constructs originally hypothesized. Factor analysistechniques may be applied to identify, and appropriately combine, highly correlatedmeasures into unitary (orthogonal) categories of specific task dimensions. Forexample, it is possible that energy metrics and maneuver effectiveness measures canbe combined to form a unitary factor related to "air combat maneuvering precision"required to attain a position advantage and a weapon fire opportunity.
3. Multitralt-multimethod procedure - developed by Campbell and Fiske (1959), isused to determine the extent to which tests designed to measure the same capability,with different methods, are correlated. Measures are presumed valid if measures ofthe same capability correlate higher with each other than they do with measures ofdifferent capabilities using different methods, i.e. measures that correlate with othermeasures of the same construct are said to have "convergent validity." In the aircombat measurement framework presented earlier, for example, we would expect
'4' objective and subjective (e.g. Instructor ratings) of the same task dimensions to haveconvergent validity, expressed by significantly high correlation coeficients.
4.'2.2.8 Methodololical Considerations
2.2.8.1 Measurement Specification. A common mistake made in the development ofperformance measurement systems is the assumption that the main problem involves.nstrumentation, data reduction, and analysis (Roscoe, 1980). In actuality, numerousdifficulties and technical hurdles face a researcher who attempts to develop, validate,and apply performance measures in military training systems. Some of the potentialproblem areas are summarized as follows (Adapted from Blaiwes, Puig, and Regan,1973):
SI1. It is difficult to accurately define training objectives so that they areeasily understood in terms of relevant task dimensions, desiredmeasures, and required performance levels.
To accomplish this, a considerable investment must be made to analyze mission taskrequirements and to evaluate the relationships of subtask performance to overallmission success outcomes. Few have been willing to make the necessary investment todevelop a comprehensive task/measurement framework, an essential foundation forperformance measurement system development. As a result, many of the performancemeasurement systems, including those reviewed here, are one-dimensional views ofhighly multidimensional operational missions.
2. It is difficult to determine what to measure, when to measure, andhow to interpret results of measureg obtained, especially in situationssuch as tactical decision making where complex team interactionsconfound individual measures.
Methods are needed for isolating individual and team components of performance andfor assessing their relative contribution to overall mission accomplishment. Both
I2 I

NAVAIRSYSCOM N00019-81-C-0098
individual performance standards (e.g. weapon launch success) and team performancestandards (e.g. engagement outcomes) need to be established.
3. Problems arise during measurement development because operationaltraining situations are usually not amenable to experimental control.Measures are usually only available on a "not to interfere" basis.
This makes it difficult to attain the degree of control necessary for reliability andvalidity testing, which calls for obtaining measures under test conditions designed tolimit extraneous sources of measurement variance.
Addressing this problem requires development and implementation of a performancemeasurement system that is highly valued and used by operational personnel, and theestablishment of close working relationships with aircrews undergoing training. TheA use of criterion-referenced measures (based on aircrew inputs related to doctrinaltraining standards), and emphasis on diagnostic feedback instead of "global evaluation"criteria, has proven to be a manageable way to gain acceptance and support inoperational training situations (Ciavarelli, 1982).
2.2.8.2 Reliability Testlnz Problems. Test specialists have accepted the reliabilitycoefficient as an important indicator of the trustworthiness of a test instrument.Since the reliability of a measurement device reflects both the precision orconsistency of measures, -and the degree of measurement error, the magnitude of thereliability coefficient is used to estimate the extent to which we can generalize fromone test application to another (Nunnally, 1975).
In cases where important decisions must be made about individuals on the basis oftheir test scores, e.g. assignment of students to different training treatments, ourconfidence in the test instrument must be very high. A reliability coefficient of .90may still not be acceptable in some psychological test applications, e.g. personnelselection. Yet, such high values in testing, even under carefully controlled testadministrations, are seldom attained (Bittner, Carter, Kennedy, Harbeson and Krause,1984).
Of course, this situation is compounded in field test applications, such as militarytraining, where control over practice effects, fatigue, and environmental conditionsare difficult at best. Therefore, it would be highly unrealistic to expect reliabilitycoefficients of such magnitude in applied settings.
This section discusses some of the more important methodological and practicallimitations to testing measurement reliability in applied settings.
2.2.8.2.1 Test-Retest - reliability methods appear to be the most practical to apply infield settings, but there are some problems inherent in this procedure. (Allen and Yen,1974):
1. The most serious problem with the test-retest method is the potentialfor carry-over effects between test administrations. Practiceeffects, fatigue, and changes in test conditions, influence test scoresand may result in underestimation or overestimation of actual testreliability.
2. Different lengths of time between testing can affect the reliabilityestimate in different ways, sometimes underestimating and some-times overestimating reliability.
22

NAVAIRSYSCOM N00019-81-C-0098
3. Repeated measures on many tasks frequently show practice effects. Atsome point certain task measures stabilize, i.e, the mean and varianceremains constant over repeated trials. But other tasks vary considerably intheir stability characteristics. This lack of stability is indicated by thepresence ot a "super diagonal" in a correlation matrix between trials(Jones, Kennedy, and Bittner, 1981). In other words, the correlationbetween trials decreases with separation (i.e., adjacent trials have highercorrelations). This finding is thought to reflect changes in relative skillcomposition during learning acquisition. The inherent instability of certaintasks measures, particularly during initial learning acquisition, mayseriously limit the use of stability-based, test-retest methods, used forestimating reliability.
$,'
2.2.8.2.2 Internal Consistency Reliability - is estimated from a single test applicationand therefore avoids the problems associated with carry-over effects. However, aswith test-retest methods, internal consistency methods also have limitations (Allenand Yen, 1979):
1. The most commonly applied methods yield a split-half reliabilityestimate that is based on the assumption that test items arehomogeneous, i.e they measure the same trait or capability. Thus,both coefficient alpha and Kuder Richardson formulas can only beused for a homogeneous test.
2. Internal consistency estimates, based on split-half methods, do notyield accurate results if assumptions of parallel tests, or - equiva-lence cannot be met. 5 For example, split-half methods are not
appropriate for a speed test in which all examinees have achievedmastery and can obtain high scores if given enough time to completethe test.
Finally, all of the reliability estimation methods reflect a major weakness of truescore theory (Weiss and Davison, 1981). Reliability estimates are highly sampledependent. For example, the magnitude of the reliability coefficient depends to agreat extent on the distribution, or spread, of scores in the group of individuals tested.Typically, heterogene-us groups, by virtue of their obtained score variability, demon-strate higher reliability estimates.
Weiss and Davison recommend using the standard error of measurement (SE) 6 becauseSE is a useful index of test precision that can be used to define limits around anobserved score within which we could expect the true score to fail, i.e. X + ZSE, whereX = obtained score, and Z = critical value of a normal score deviate (Allen and Yen,1979).
in practical applications, particularly with the use of criterion-referenced testing, theSE can be applied to estimate the probability of misclassifying an examinee for a
4- specific criterion level.I#. ° _ _ __ _ _ __ _ _ _
5 Parallel tests - true scores and error scores are equivalent-equivalent - true scores are equal except for an additive constant.
6SE is based on reliability, as the formula SE = S l-rxx( shows; where, S is the samplestandard deviation.
WI V23

NAVAIRSYSCOM N00019-81-C-0098
Other reliability methods (Livingston 1971a, 1971b; Lovett, 1977) have been specifi-cally developed for application with criterion testing approaches, since these measurestypically yield restricted score ranges. These methods are based on the assumptionthat classical true score theory can be used to test reliability using an analysis ofvariance (ANOVA) framework. Using this approach, deviations from mean score(commonly used in normative measurement) are replaced by deviations from estab-lished criterion values. Reliability, then, as in ANOVA can be interpreted in terms ofmean squared deviations from a criterion value (Swezey, 1978). Such methods mayprove to be of greater utility in practical situations, where restriction of range islikely, given for example the highly homogeneous populations of students and use ofmastery level, criterion-referenced test methods. But problems associated withgathering necessary reliability test data in military training environments stillrepresents a significant limitation.
In spite of these limitations, attempts can and should be made to estimate reliabilitythrough selection and application of the most appropriate method. Decisions based ontest scores related to training progress and proficiency. military readiness, andtraining effectiveness are important enough to warrant expenditure of time andresources necessary to have some degree of assurance that measures used in makingsuch decisions are reliable and trustworthy.
As indicated in a previous section of this report, perhaps the best vehicle forreliability testing would be a flight simulator since conditions for testing can be morereadily controlled. Therefore, plans should be incorporated in a measurementdevelopment program to accommodate simulator-based reliability testing of anyproposed performance measurement system.
2.2.8.3 Validitj Testing Problems. Over the past few years, some methods of validitytesting have been sharply criticized. A brief review of these criticisms andreco.rmendations for establishing a construct validation approach is presented below.This review is presented as a point of departure for development of a validationstrategy for air combat performance measurement, presented in a following section.
1. Criterion-related validity. Up until the mid-1950s most validitytesting was reported in terms of the accuracy of prediction betweena test and some specific criterion measure (Cronbach, 1971). Depen-dence on criterion-related validity, however, has been criticized overthe past few years by testing specialists. Some of the key criticismsare reflected in the test standards manual (APA, et al., 1974, p. 27)and include: (1) test conditions are never the same from sample tosample; (2) procedures assume that the criterion measure itself is avalid measure; (3) the sample used in validation may not be represen-tative of the population; and (4) it is difficult, at times, to obtain anadequate sample size.
2. Content validity. Tenopyr (1975) was critical of test standards (APA,et al., 1974) for not providing adequate guidance to compare thekinds of validity. The distinction between content and construct,according to Tenopyr, has resulted'in the most confusion. Tenopyrconcludes that the term "content validity' should refer to inferencesabout test construction, whereas the term "construct validity" refersto inferences about test scores. The controversy surrounding theissue of content validity was more recently reviewed by Fitzpatrick(1983). Following an extensive critique of the content validity
24
- . | - i-- i i i

NAVAIRSYSCOM N00019-81-C-0098
literature, Fitzpatrick concludes that no adequate means for defining andquantifying content validity was found.
3. Construct validity. Following publication of Cronbach and Meehl's (1955)classic article on construct validity, emphasis shifted to understanding themeaning of test scores In terms of underlying psychological processesrelated to obtained score variance. Test validation methods centering onconstructs established a comprehensive statistical methodology designed toprovide empirical evidence that test scores do In fact representhypothesized capabilities. Cronbach and Meehl called for a test validationapproach which examined, "the entire body of evidence offered," In ordertc determine the meaning of test scores. Validation was to be establishednot on the basis of a single "validation study" but by building a mountain ofevidence that supported predictions, while eliminating alternativehypotheses. These authors discuss use of a "nomological net" as a set ofinterlocking laws or formal theoretical principles that tie constructs andobservable properties together in an integrated framework. The validationprocess is one on which empirical evidence Is gathered through systematicexperimentation which support hypothetical predictions, or that eliminatescompeting hypotheses. Determination of construct validity is a means torefine the relationships specified in a nomological net. Cronbach (1971)called for test validation based on the need to understand and interpret themeaning of test scores... "to explain a test score, you must have some sortof theory about the causes of test performance and their implications" (p.443). He extends his point of view to educational measures as well, since
S instructors also need to have "some conception about acceptableperformance," i.e., in terms of proposed standards for evaluation, type ofmeasurement scale applied, and possible outcomes.
Messick (1975) maintains that all test developers and users must be able toanswer at least two questions regarding test application, (p. 962): (1) Is thetest any good as a measure of characteristics It is interpreted to assess?;and (2) Should the test be used for the proposed purpose? Neithercriterion-related nor content validation techniques are adequate options inarriving at an answer to these questions. Even in practical educationalsettings it is important for the test developer and user to be able todetermine whether or not the test is a "good measure," and to decide on itsappropriate application. Construct validity information provides the bodyof evidence for test developers, test administrators and instructors tointerpret the meaning, and value, of test results.
Improvements in statistical methodology are emerging to assist in establishing a set of.-. coherent construct validation procedures. For example, Hocevar-Page and Hocevar%. (1982), propose use of confirmatory factor analysis (CFA) as a statistical methodology
to evaluate factorial validity. Using CFA requires that a theoretical factor structurebe furnished "a priori" during validation testing. The CFA technique avoids some of
*the pitfalls of exploratory factor analysis, such as indeterminancy of rotation. CFAalso allows investigators to test alternate theoretical models for the best fit toempirical data as another useful tool in theory juided research.
4%
25
4- 1 T . C .. .fl.4,,r.. " -t-.. ~ .5,'1

NAVAIRSYSCOM N00019-81-C-0098
Educational researchers are becoming increasingly aware of the need to develop andtest "causal models" through path analysis methods (Pedhazur, 1982). Using thisapproach, a model that describes hypothetical relationships among key variables isconstructed, diagrammed in the form of path network of variables, and tested throughregression analysis. Hierarehical regression solutions are used to statistically confirmhypothetical relationships specified in the a priori model.
Both CFA and causal model methods require the Investigators to be guided in theirresearch by a theoretical, or conceptual, framework. Application of these methodshelps to satisfy requirements specified by key test specialists (Messick, 1975) that allmeasures should be construct-referenced.
2.2.9 Strategy for Measurement Validation
Following recommendations covered in the test validation literature cited previously,a planned program of measurement testing should be developed to establish theconstruct validity of air combat measures. A strategy which calls for several stagesof test instrument validation is recommended and includes the following procedures:
1. Tests of measurement framework - Procedures include testing ofmetrics developed to measure the maneuvering performance effec-tiveness. Initially, this is accomplished by correlating summarizedoutputs of metrics against a parametric set of data extracted fromTACTS mission tapes. This procedure will be used to establish therelevance of part-task scoring metrics to final engagement outcomes.
Subsequently, a more sophisticated correlation study should also beundertaken in order to demonstrate that the entire measurement set,including radar contact, visual identification, first fire opportunity,maneuvering effectiveness metrics, and weapon fire accuracy scoresare meaningfully related to outcome scores.
A possible approach to this more comprehensive treatment can beaccomplished through causal analysis methods using path networkcorrelation models. For example, a path network, based on findingsreported earlier (Ciavarelli, 1982), can be tested using path analysismethods (Pedhazur, 1982).
Verification of a hypothetical path structure provides one level ofconstruct validity, in that a theoretical framework, established onthe basis of tactical doctrine, can be empirically validated.
2. Tests of skill discrimination - Another step in the validation processcalls for demonstration that measures used, in fact, are sensitive toindividual differences and discriminate among aircrews of variousskill levels. Statistical discrimination tests run between experiencedand inexperienced aircrews can provide an experimental paradigm forvalidating the usefulness of measures for determining learningacquisition and skill retention levels.
3. Tests of User Acceptance and Tra4ning Utility - Finally, validatedmeasures need to be implemented in user adaptable formats thatprovide diagnostic information essential to aircrews undergoinginstruction. The benefit of and value to training can be assessed interms of their direct utilization by aircrews to improve training,and/or through collection and analysis of attitude survey data.
26
"", ... """

NAVAIRSYSCOM N00019-81-C-0098
3.0 REVIEW OF AIR COMBAT MEASUREMENT MODELS
Numerous air-to-air combat performance measurement models have been developedover the years. Despite the fact that researchers often had similar objectives, varioustechnical approaches were used resulting in some diverse measurement models. Thissection reviews the principal measurement models that have been developed during thepast 10 years. Before describing the models, the review method and the basis forcomparing the relative merits of the models are presented.
3.1 REVIEW METHODS AND EVALUATION CRITERIA
After collecting pertinent documentation for several performance measurementmodels developed for air-to-air combat, an analytical approach was used to review andassess their relative merits. The models were evaluated on the basis of the followingcriteria:
1. Utility of measures2. Appropriateness3. Completeness4. Scale Properties
The utility of measures involves a basic question: Are measures generated by a modelmeaningful and useful to aircrews? If a measurement tool does not provide feedbackto aircrews which is task-based and diagnostic, chances are that it will not be useful oraccepted by aircrews.
The appropriateness criteria concerns the extent to which the assumptions underlyinga model are up-to-date by incorporating the latest developments in aircraft, weaponsystems and tactics. For example, the model must be able to handle high-performanceaircraft which launch all-aspect weapons.
A model's completeness considers how well the model adequately samples the taskdomains which comprise the air-to-air combat mission.
Scores generated by a measurement model should exhibit certain desirable scaleproperties. For instance, the scale should maintain, at a minimum, ordinal relation-ships with consistent rankings from low to high and be sensitive to performancedifferences. Preferably, the scores should also reflect the magnitude of performancedifferences. The distance between each point on a scale should be of equal length orinterval. Other important factors to consider are the validity and reliability of themodels. Unfortunately, since limited or no validation work has been attempted withthe models, these factors could not be evaluated.
The remainder of this section describes several of the performance measurementmodels which have been developed for air-to-air combat and evaluates each basedupon the criteria described above.
27
P,% 7.lp u "

NAVAIRSYSCOM N00019-81-C-0098
3.2 PERFORMANCE ASSESSMENT AND APPRAISAL SYSTEM
The PAAS was developed under the sponsorship of the Naval Training Systems Center.PAAS is essentially a stand-alone data base management and graphics systemdeveloped on a desk-top micro computer. The prototype system is designed to providediagnostic feedback to aircrews after TACTS/ACMI engagements. This is accomplish-ed by selectively retrieving performance measures and displaying them in meaningfulgraphic formats. Descriptions of the system and its measurement framework arepresented in Ciavarelli, et al. (1981b) and Ciavarelli (1982).
A distinguishing feature of the PAAS model is the underlying measurement frameworkupon which It is based. This framework was developed from a task analysis of the air-to-air mission as flown on TACTS/ACMI. The framework highlights the mission phasesand measurement points during the course of the air combat engagement. (See Figure2.2.2-1 for framework illustration.)
The PAAS measurement framework is conceptually the most complete of themeasurement models to be discussed because it encompasses the entire spectrum oftasks from initial radar contact to combat disengagement, or bug out. Limitatiunsimposed by manual data input enabled the prototype to present only discreteperformance measures during a preliminary field test with aircrews. However, thedesigner of the measurement framework envisioned that continuous measures relatedto tactics and maneuvers and energy management would ultimately be included. A
A sample of measures included in the PAAS measurement framework is illustrated inTable 2.2.2-1 and Figure 2.2.2-2.
The task-based nature of PAAS performance meaures make them intuitively appeal-ing, especially when presented in simplified graphic formats. This appeal wasconfirmed by limited presentations which were well received by aircrews during thepreliminary field tests. While performance measures may be appealing and useful asfeedback, they must also be valid and reliable as an assessment instrument to evaluatethe progress, effectiveness or transferability of training. PAAS researchers attemptedsome preliminary validation work and found that many of their measures correlatedwith end-game outcomes. These early findings, reported in Section 2.0, provided auseful measurement set with empirically established relevance to end-game outcomes.
The remainder of this section presents the merits of other performance measurementN models. The models focus mainly on depicting position advantage information during
the maneuvering portion of the air combat engagement.
3.3 BACKGROUND FOR POSITION ADVANTAGE MODELS
--, Numerous methods have been developed to evaluate air combat performance and in
particular maneuvering perfc-mance. Perhaps the simplest and most direct measurewhich can be applied to multiplane engagements is the kill/loss ratio. Although thismetric may be calculated for various engagement scenarios and then applied as apredictive measure in similar engagements, it sheds little light onto the relativeimportance of the individual aspects of the engagements. More specific metrics have
d, been developed, which, while correlating with the overall kill/loss ratio, addresssegments of the engagement which are a little further removed from the finaloutcome of battle. Among these are the single value metrics, time to envelope for
* radar and heat-guided missiles, time to first valid shot, number of valid and invalidLA. shots, and number of missed opportunities (Robinson, Drinnon, Eubanks and Eddowes,-42
~28

NAVAIRSYSCOM N00019-81-C-0098
1981). However, these are still summary metrics and do not reveal how anengagement evolves with time.
To describe this evolution with time, researchers have developed what are calledposition advantage models. The following four position advantage models are
Vdiscussed below:
1. Maneuver Conversion Model (Oberle, 1974)2. Performance Index (Simpson, 1976)3. All-Aspect Maneuvering Index (McGuinness, Forbes and Rhoads, 1983)4. TACSPACE (Wooldrldge, Kelly, Obermayer, Vreuls, Nelson and
Norman, 1982)
A common thread among the first three researchers was their purpose of measure-ment. Each desired an ultimate or global criterion of air combat which could be usedfor test and evaluation purposes. Although their approaches differed, all theseresearchers used Instantaneous values of interaircraft parameters as a basis torepresent maneuvering performance of aircraft engaged in air-to-air combat.
Three parameters commonly employed are the angle off tail (AOT), antenna trainangle (ATA) and Interaircraft range (R). The first parameter, AOT, is the angle(expressed in degrees) between a line extending out the tail of the target aircraftalong its center line and the line of sight between the attacking and target aircraft.The ATA parameter is the angle between a line extending out the nose of the
X attacking aircraft along its center line and the sight line between the two aircraft. Athird parameter, R, is the range between the attacking and target aircraft. Thegeometric representation of these interaircraft parameters is illustrated inFigure 3.3-1. All three parameters are normally computed and displayed on bothTACTS/ACMI ranges and air-to-air combat flight simulators.
Since each of the models produce metrics which vary between any two instants intime, the dynamics of the engagement can be studied. These continuous data providecombat trends and enable one to identify sections of the engagement which areparticularly critical to the outcome of the engagement. Knowing which sections aremost critical provides the potential to optimize training by emphasizing techniquesand tactics pertinent to these critical areas.
Two of the models (Oberle, 1974 and Wooldridge, et al. 1982) are state space models.Briefly, a state space model continuously measures an aircraft with respect to severalvariables and assigns specific location in a state space based upon ranges of values.For example, one cell of a state space may be defined by airspeed ranging between 250and 300 knots, interaircraft range between 10,000 and 12,000 feet, and so on. Othercells within the space may be defined subsequently by different ranges of the samevariables. As an aircraft is continuously measured during an engagement, it mayoccupy one or more of the cells defined in the state space. The states that an aircraftoccupies can be examined and statistics calculated. While the underlying distributionof variables measured may be continuous, the coalescing of ranges of values into cellsresults in a discretc model with a finite number of states. In general, onedisadvantage of state space models is that iinportant information may be lost byreducing the dimensionality of measures to a finite number of states.
29

N4AVAIRSYSCOM N00a19-81-C-0098
CC E
0~I
300
NAVAIRSYSCOM N00019-81-C-0098
The other two models (Simpson, 1976 and McGuinness, 1983) are continuous modelswith each being the product of several continuous functions of time. The four positionadvantage models will now be detailed.
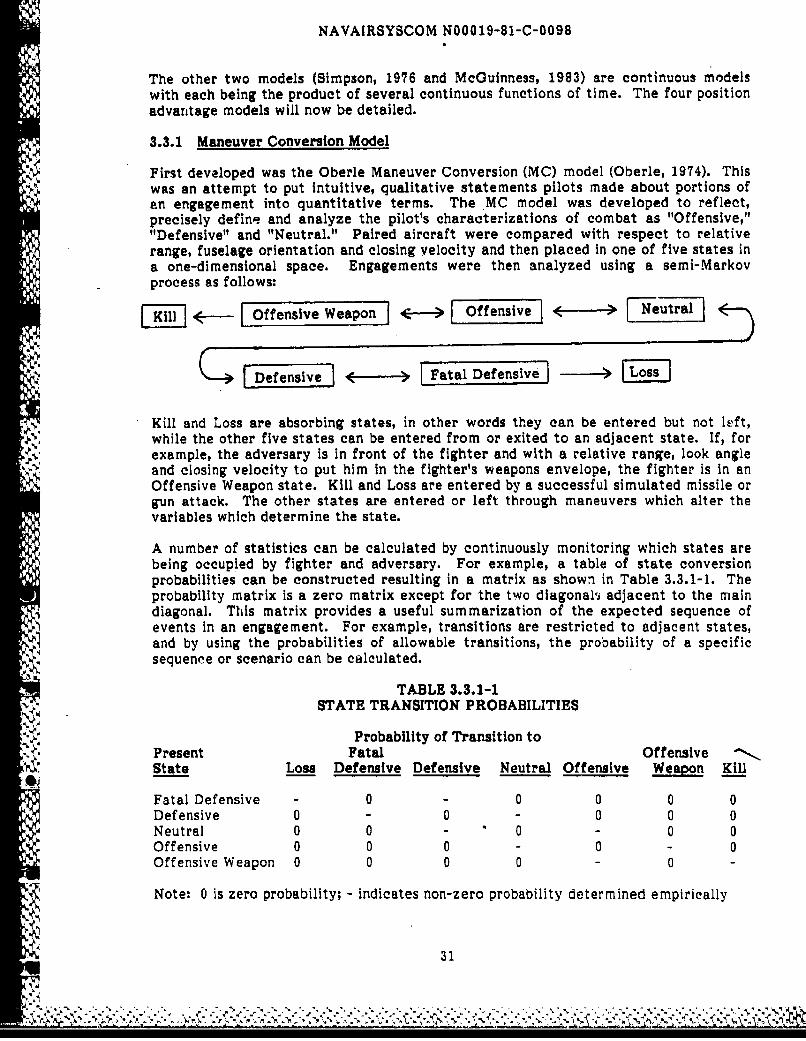
3.3.1 Maneuver Conversion Model
First developed was the Oberle Maneuver Conversion (MC) model (Oberle, 1974). Thiswas an attempt to put intuitive, qualitative statements pilots made about portions ofan engagement into quantitative terms. The MC model was developed to reflect,precisely define and analyze the pilot's characterizations of combat as "Offensive,""Defensive" and "Neutral." Paired aircraft were compared with respect to relativerange, fuselage orientation and closing velocity and then placed in one of five states ina one-dimensional space. Engagements were then analyzed using a semi-Markovprocess as follows:
Kl f- offensive Weapon] <* > Off ensive 4E- ; Neutrakl
rDefensive <- [Fatal Defensive -
Kill and Loss are absorbing states, in other words they can be entered but not keft,K,. while the other five states can be entered from or exited to an adjacent state. If, for
example, the adversary is in front of the fighter and with a relative range, look angleand closing velocity to put him in the fighter's weapons envelope, the fighter is in anOffensive Weapon state. Kill and Loss are entered by a successful simulated missile orgun attack. The other states are entered or left through maneuvers which alter thevariables which determine the state.
A number of statistics can be calculated by continuously monitoring which states arebeing occupied by fighter and adversary. For example, a table of state conversionprobabilities can be constructed resulting in a matrix as shown in Table 3.3.1-1. Theprobability matrix is a zero matrix except for the two diagonalj adjacent to the maindiagonal. This matrix provides a useful summarization of the expected sequence ofevents in an engagement. For example, transitions are restricted to adjacent states,and by using the probabilities of allowable transitions, the probability of a specificsequence or scenario can be calculated.
TABLE 3.3.1-1STATE TRANSITION PROBABILITIES
Probability of Transition to
Present Fatal OffensiveState Loss Defensive Defensive Neutral Offensive Weapon Kill
Fatal Defensive - 0 - 0 0 0 0Defensive 0 - 0 - 0 0 0Neutral 0 0 - 0 - 0 0Offensive 0 0 0 - 0 - 0Offensive Weapon 0 0 0 0 - 0
Note: 0 is zero probability; - indicates non-zero probability determined empirically
31
S ' . . ... - , - A , " , . -- ."

NAVAIRSYSCOM N00019-81-C-0098
Using the conversion probabilities in Table 3.3.1-1 and with the additional monitoringof time of weapon fire, the following statistics can also be calculated.
Probability of transition between states in a unit time interval.Time In state probability distribution.Probability a pilot will recognize a weapon opportunity.Probability of fire out of envelope.Probability of first-fire opportunity over adversary.Probability of achieving and using first-fire opportunity.Expected fraction of time in offensive or offensive weapon state.Ratio of probability of kill to the probability of loss in a represertativeengagement.
Initially, the MC model assumed that the probability of switching from one state to anadjacent state depended on the present state and not on any previous states occupied.After a number of engagements on TACTS were analyzed, it was found that previoushistory had a significant influence on transition probabilities (Oberle, 1983). Probabili-ties were then calculated using the current state and either one or two immediatelyprevious states.
An attempt was also made to expand this model to two fighter versus one adversaryengagements. A fighter pair working together (section) Is placed into a single state byindividually comparing each member of the pair to the adversary. For example, thepair is offensive when at least one member is offensive and the other is higher thanFatal Defensive. Oberle (1983) did not attempt to adapt the MC model to more thanthree aircraft.
A severe limitation of the MC model is that it assumes that at least one aircraft usesonly rear-hemisphere missiles. This results in symmetrical states between fighter andadversary. For example, a fighter's occupation of an Offensive Weapon state impliesthe adversary is in a Fatal Defensive state. Likewise, the adversary's possession of anOffensive state implies the first pilot is in a Defensive state. With forwardhemisphere capable missiles, both fighter and adversary can simultaneously have ashot opportunity and thus both be Offensive. With present-day, all-aspect weapons,this tactical situation is a common occurrence, but is not handled by this model.
3.3.2 Performance Index
Historically, the next approach taken to quantify the importance of relative position inair combat maneuvering was by Simpson (1976). The specific metric developed wasthe Performance Index (PI). The metric consists of a continuous real-valued functionof interairplane position and dynamics. This function is a product of three separatecontinuous real-valued functions which are as follows:.
1. The normalized direction angle function defined below which yields*values ranging from -100 to +100.
DA N 100 80 -(AOT + ATA)IL 180
N 32-.--------

NAVAIRSYSCOM N00019-81-C-0098
2. The range penalty function is a moderately complicated function involving
actual, optimum, and maximum ranges for guns and missiles. Functionvalues range from 0 to 1 as the interaircraft range goes from maximum tooptimum missile ranges. The range penalty function formula and itscharacteristic "S" shape are presented In Figure 3.3.2-1.
3. An energy influence function was initially included as an attempt tocompensate the PI for situations where the fighter and adversary have anon zero closing velocity. For example, a fighter may be in a position onthe adversary's tail and near optimum range but the closing velocity is sogreat that an overshoot is forced. Despite Its initial inclusion, the PIfunction calculated with and without the energy function producedessentially the same curves and was subsequently dropped from the PI
A (Oberle 1983). The energy influence initially included with the PI ispresented in Figure 3.3.2-2.
An underlying motivation for the PI model is to have a relatively simple metric fortwo aircraft engagements which, when one is In an offensive position, will approximatethe probability of kill if a missile or guns are fired from the current position. On theother hand, when the adversary is in an offensive position, the fighter's PI is negativeand should be approximately proportional to the probability of the adversary scoring akill. In a neutral situation PT equals zero.
*The PI model appeared to be a useful and appropriate tool in the time frame that itwas developed. Statistics similar to those calculated for the MC model can becalculated. A major drawback of the PI, however, Is that it Is not appropriate for usewith weapon systems carried aboard new-generation aircraft. Specifically, the modelwas developed for rear-hemisphere weapons and does not handle all-aspect weaponswhich can be fired head-on or in the forward hemisphere.
An extension of the PI to multiplane engagements (more than two aircraft) was madeby weighting and combining the individual PI scores into a single composite value for' "n" fighters in a section through the following equations.
nE (P11) I Pil
K=1 C =C
nZ (PI) I Pit
--1 1PJ = Ki=1
The value "C" in the above equation is a proportionality constant to establishmaximum and minimum values.
- 33

NAVAIRSYSCOM N00019-81-C-0098
~~~~~~ A [ (0Pr ( R R ) S R R 2 0 2 w ~ - - * * : 0 *
(RMAX )
F f~(R~~)5 1 MAX I)
I (RG4 OpTKH2 me"0 "
(RO, IRG~
0; ( NO, 0 ) ( hop T, 0 )
RANGE
(FROM SIMPSON, 1976)
Figure 3.3.2-1 Rang. Performance Penalty Function
34
....-------------..------i'" 'i-'----'ii.....j-i' .l- - -J---------.-.... . -.------.----
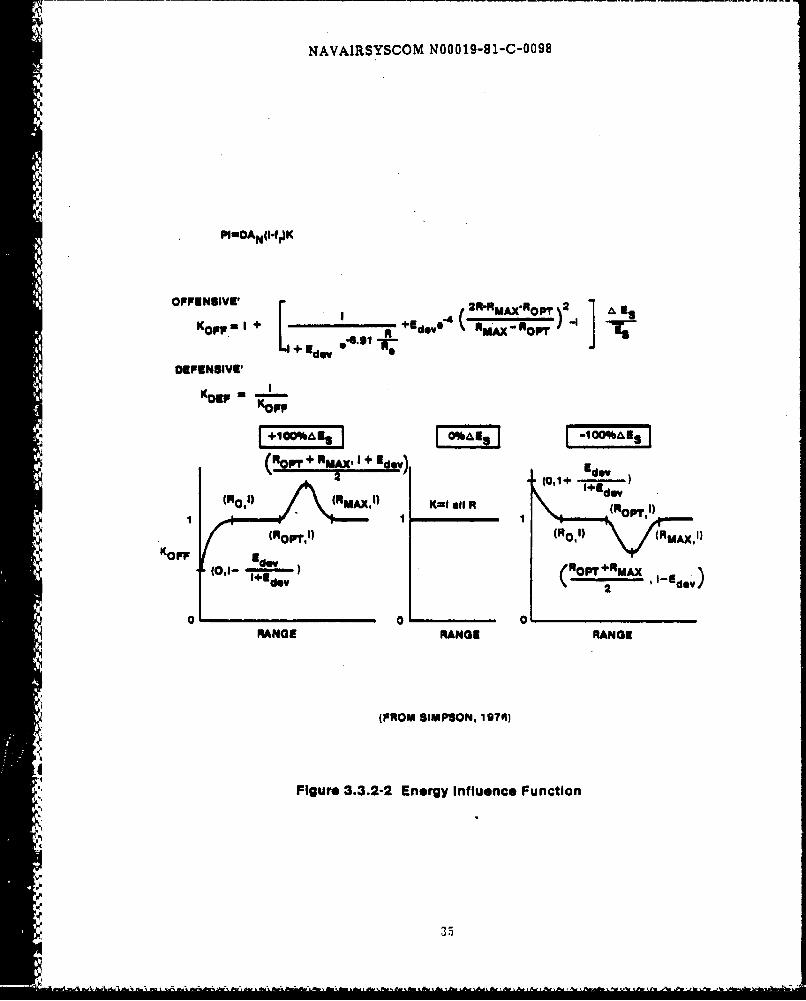
NAVAIRSYSCOM N00019-B1-C-0098
PIODAN(I-t,)K
OINGIE I 4 ( 2R.AMAX*ROP1. 2 1 A aKoppu + m9 R +Eov "MAX -ROPT)
.*ij -N- KaaSS
-ad
of 'RMXX, K- all1 OPT 1)
1 1 )
0 0 0RANGE RANGE RANGE1
(FROM SIMPSON, 1976)
Figure 3.3.2-2 Energy Influence Function
35

NAVAIRSYSCOM N00019-81-C-0098
A validation of this expanded model was not part of the memorandum (Simpson, 1976).In a technical report published the following year, Simpson and Oberle (1977) suggestedanother approach to expand the II function, which was titled the ConversionCoefficient. However, in a still later report, Oberle (1983), both the MC & PIapproaches to multiplane engagements were abandoned in favor of functions (the firingorder methods) not addressing position advantage.
As a final technical note, the integration routine used for the numerical analysis of thePI and MC models (Simpson and Oberle, 1977) used equally spaced functions incorpora-ting Simpson's rule and Newton's 3/8 rule. A more effective method would have usedan adaptive quadrature algorithm. Basically, instead of equally spaced intervals as ina simple Newton-Cotes formula, shorter intervals would have been used where thefunction is varying rapidly and longer intervals used where the function is changingmore slowly. These analysis techniques are discussed in detail in a number ofnumerical analysis texts; for example, Burden, Faires and Reynolds (1981).
* 3.3.3 AU-Aspect Maneuvering Index
McGuinness, et. al. (1983) developed a third model in which the metric is called the AllAspect Maneuvering Index (AAMI) and is a continuous measure of aircraft offensive-ness/defensiveness. It is the product of two separate functions and is a modificationof Simpson's approach with the DA function modified to reflect all aspect missiles.The first function uses the fighter's'rientation with respect to the adversary and is asfollows:
100 ((90-ATA)/90) for 0 < ATA 4 90 and = 0 otherwise
It differs from the DAN function of Simpson in that it is a normalized linear functionwith respect to ATA and not ATA plus AOT, resulting in positive values whenever theadversary is in front of the pilot's own aircraft. If fighter and adversary are coming ateach other, each may have a positive value for the ATA function. Consequently, themetric does not measure position advantage but fighter offensiveness. To obtain aposition advantage maasure, the AAMIs for pilot and adversary are subtracted to formwhat McGuinness calls Romp curves. Range and AQT are incorporated into the secondfunction. This is calculated in two steps: first, minimum, optimum, and maximumranges for each weapon type are selected from a table where these values are variedwith respect to AOT. Second, these values are then placed in a function and a valuefrom 0 to 1 is calculated. No further details were given in the report on the specific
%_
e form of this function. The AAMI was mentioned to have been modified to incorporateclosing velocity and altitude. Again, no more details were listed so the reasonabilityof these modifications cannot be determired. The statistics available are similar tothose listed for the MC and PI models and are based on several parameters 1) timedistribution of fighter and adversary AAMI values; 2) time of weapon fire; and, 3) timeof kills. As with previous models, the AAMI was designed for one-on-one engage-ments.
Major problems with the AAMI are its lack of sensitivity to angle changes in4. interaircraft geometry and undersirable scale properties. These problems will be
discussed in greater detail in Section 4.0.
36
"i . .... 3 ... .. . .. . ... . .. . . . . . . -" .... .. ia'-- - ..- . . . ..... ."I . i i,

NAVAIRSYSCOM N00019-81-C-0098
3.3.4 TACSPACE
The final model in this review was developed by Wooldridge, et al. (1982) and isdesigned to maximally differentiate pilots of low and high skill level. A three-dimensional state space was developed with axis variables of ATA, AOT, and Range.The space was divided into small cells corresponding with specific intervals of the axisvariables. These cells were then grouped into offensive, neutral, and defensivesubspaces based on ATA and AOT. A discriminant score was calculated over locationusing the parameters collected In a flight simulator: air speed, turn rate, G, ATA,closing rate, throttle position, roll rate, and lateral velocity. The discriminant score isa statistically derived linear composite of the parameters which maximally discrimin-ates between high and low skill groups. All the above parameters except throttleposition would be obtainable on TACTS/ACMI. The statistics available include thetime distribution of location in TACSPACE, the moments of this distribution, and thereal time values of the discriminant scores.
There are two major problems with TACSPACE which are related to theappropriateness and utility of the model. First, the TACSPACE is oriented, as withprevious models, to rear-hemisphere weapons and is not appropriate for use with all-aspect weapons and tactics. While TACSPACE could reasonably be adapted to thelatest weapons, there remains the utility problem. Discriminant scores are useful indesigning a selection instrument but their value as training feedback to aircrews isquestionable.
3.3.5 Review Summary
Five air-to-air combat performance measurement models were reviewed. The PAASmodel appears to be the most comprehensive because it encompasses most of the taskdomains of air combat. The model provides a framework of performance measureswhich are related to specific training objectives.
A primary deficiency of the PAAS model is a lack of adequate measures which sampleaircrew tactics and maneuvers during the engagement. To fill this void, four positionadvantage models, which were developed as stand-alone measurement systems, werereviewed. Each model has its relative strengths and weaknesses. Primary limitationsof the models are that either they do not incorporate all-aspect weapons or theyexhibit undesirable scale properties. A list of the limitations of each model reviewedis presented in Table 3.3.5-1.
Based upon limitations of existing position advantage models, it was deemed appropri-ate that a new model be developed for inclusion in the PAAS framework. Adescription of the new model developed is presented in the next section.
37
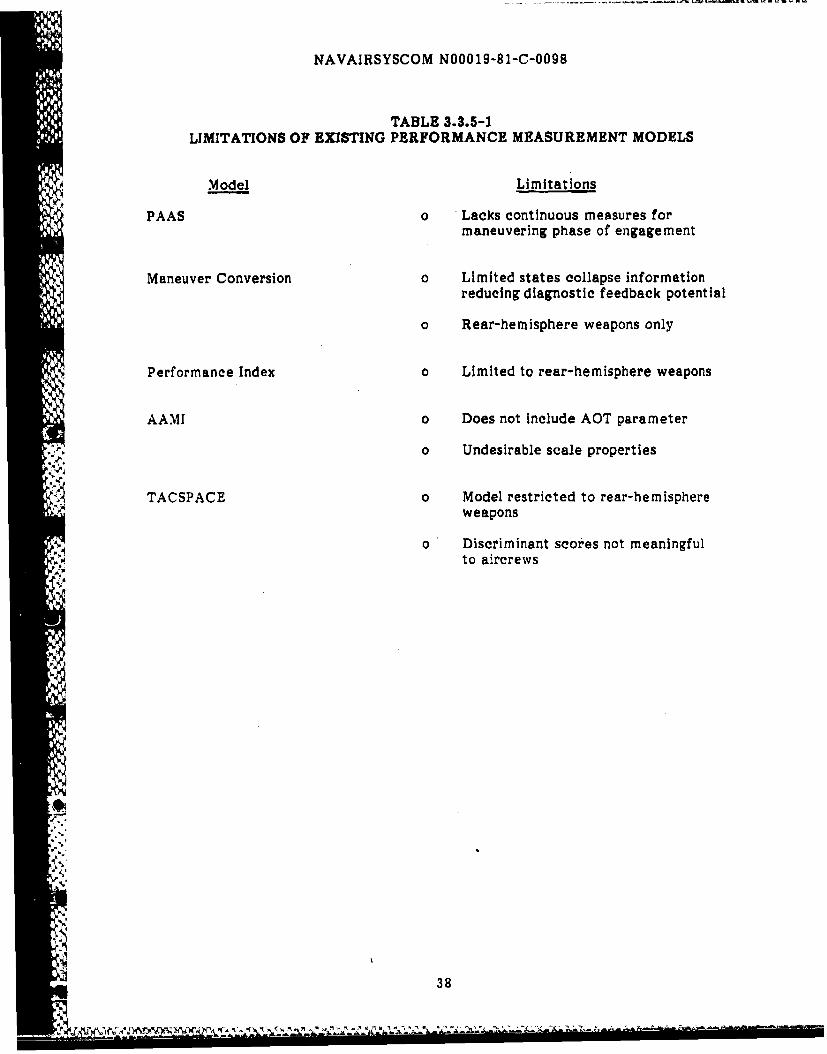
NAVAIRSYSCOM N00019-81-C-0098
TABLE 3.3.5-1LIMITATIONS OF EXISTING PERFORMANCE MEASUREMENT MODELS
Model Limitations
PAAS 0 Lacks continuous measures formaneuvering phase of engagement
Maneuver Conversion a Limited states collapse informationreducing diagnostic feedback potential
o Rear-hemisphere weapons only
Performance Index a Limited to rear-hemisphere weapons
AAMI a Does not include AOT parameter
o Undesirable scale properties
TACSPACE o Model restricted to rear-hemisphereweapons
a Discriminant scores not meaningfulto aircrews
38

NAVAIRSYSCOM N00019-81-C-0098
4.0 DEVELOPMENT OF A MANEUVER INDEX
Previous discussions of the technical approach, and review of air combat measurementmodels have identified the need for performance measures and limitations of existingmodels. There are presently no continuous measures which adequately depict pilotmaneuvering performance during engagements. This deficiency is particularly evidentduring the close-in maneuvering portion of the fight and with aircraft equipped withall-aspect (front-and rear-hemisphere) weapons. To fill this void in the air-to-aircombat measurement framework, an algorithm for computing a maneuver index (MI)was developed.
An MI to accurately depict a pilot's position advantage during air combat is animportant first step in developing energy maneuverability metrics. The importance ofintegrating energy with position advantage information is due to the fact that theoptimum energy state of a fighter aircraft is highly dependent upon the relativetactical position of the fighter with respect to the adversary. If, for example, thefighter is in a defensive position, it is likely that the pilot would want to maintain alarge amount of energy to permit escape. On the other hand, the pilot in an offensivestate likely wants to carefully control his energy level to prevent overshooting thetarget. In any event, it is important to first develop an MI so that optimum energyprofiles may be identified and tagged to specific position advantage states. Theremainder of this section describes the basic components and computation of the MI.
4.1 BASIC COMPONENTS OF A MANEUVER INDEX
There are three basic components comprising the MI which were also used in Simpson(1976) and McGuinness, et al. (1983) models:
1. Angular geometry component (AGC)2. Weapon range component (WRC)3. Scale factor (SF)
The AGC quantifies the relative angular positions between two aircraft in space andcan be expressed as a function of two interaircraft parameters. The two parameters,AOT and ATA, were previously defined and are illustrated in Figure 3.3-1.
Although AOT and ATA could be combined in several ways to compute the AGC of theMI, the methods developed by Simpson (1976) and McGuinness, et al. (1983) were usedas initial baseline candidates, subject to evaluation. If it could be determined that
*4 either AGC computation method produced a metric with desirable scale properties, itwould be used in the overall MI algorithm. Otherwise, it would be necessary todevelop a new computation method.
Simpson's algorithm incorporates both the AOTo and ATA parameters to quantify the*angular relationship between two aircraft. On the other hand, McGuinness uses only
the ATA parameter in his algorithm. These two baseline AGC computation methodsNare presented together in Figure 4.1-1, where a direct comparison can be made.
39-- -- - - - - " ". ,.-*- ,. - -"
"

NAVAIRSYSCOM N00019-81-C-0098
CPUI j IEDS
00 4z E 0 0o- c
LL8 IW aaU- 0
0 0 0u 0
wU +
04 -
0 S
004C
V U)
~~40I' C C%
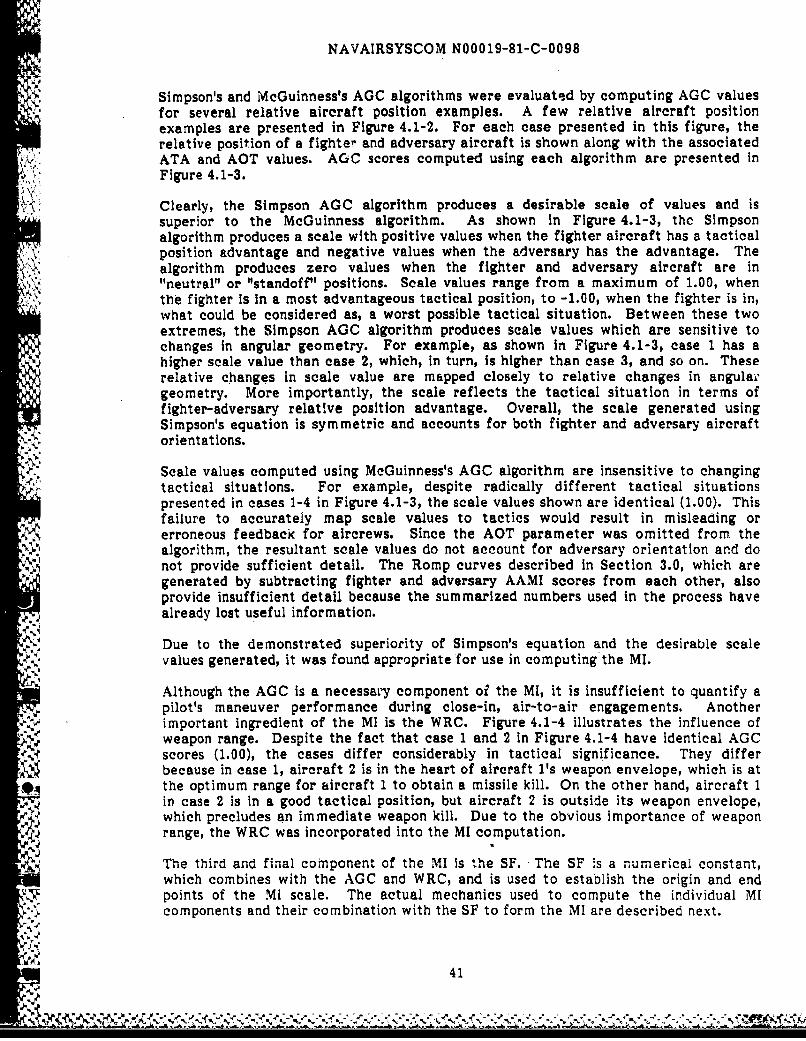
NAVAIRSYSCOM N00019-81-C-0098
Simpson's and McGuinness's AGC algorithms were evaluated by computing AGC valuesfor several relative aircraft position examples. A few relative aircraft positionexamples are presented in Figure 4.1-2. For each case presented in this figure, therelative position of a fighter and adversary aircraft is shown along with the associated
,,V ATA and AOT values. AGC scores computed using each algorithm are presented inFigure 4.1-3.
A. Clearly, the Simpson AGC algorithm produces a desirable scale of values and issuperior to the McGuinness algorithm. As shown In Figure 4.1-3, the Simpsonalgorithm produces a scale with positive values when the fighter aircraft has a tacticalposition advantage and negative values when the adversary has the advantage. Thealgorithm produces zero values when the fighter and adversary aircraft are in
v'.' "neutral" or "standoff" positions. Scale values range from a maximum of 1.00, whenthe fighter is in a most advantageous tactical position, to -1.00, when the fighter is in,what could be considered as, a worst possible tactical situation. Between these twoextremes, the Simpson AGC algorithm produces scale values which are sensitive tochanges in angular geometry. For example, as shown in Figure 4.1-3, case 1 has ahigher scale value than case 2, which, in turn, is higher than case 3, and so on. Theserelative changes in scale value are mapped closely to relative changes in angulargeometry. More importantly, the scale reflects the tactical situation in terms offighter-adversary relative position advantage. Overall, the scale generated usingSimpson's equation is symmetric and accounts for both fighter and adversary aircraftorientations.
5 . Scale values computed using McGuinness's AGC algorithm are insensitive to changingp. ~tactical situations. For example, despite radically different tactical situations
presented in cases 1-4 in Figure 4.1-3, the scale values shown are identical (1.00). Thisfailure to accurately map scale values to tactics would result in misleading orerroneous feedback for aircrews. Since the AOT parameter was omitted from thealgorithm, the resultant scale values do not account for adversary orientation and do
not provide sufficient detail. The Romp curves described in Section 3.0, which aregenerated by subtracting fighter and adversary AAMI scores from each other, alsoprovide insufficient detail because the summarized numbers used in the process havealready lost useful information.
Due to the demonstrated superiority of Simpson's equation and the desirable scalevalues generated, it was found appropriate for use in computing the MI.
Although the AGC is a necessary component of the MI, it is insufficient to quantify apilot's maneuver performance during close-in, air-to-air engagements. Anotherimportant ingredient of the MI is the WRC. Figure 4.1-4 illustrates the influence ofweapon range. Despite the fact that case 1 and 2 in Figure 4.1-4 have identical AGCscores (1.00), the cases differ considerably in tactical significance. They differbecause in case 1, aircraft 2 is in the heart of aircraft 1's weapon envelope, which is at
$4 the optimum range for aircraft 1 to obtain a missile kill. On the other hand, aircraft 1in case 2 is in a good tactical position, but aircraft 2 is outside its weapon envelope,which precludes an immediate weapon kill. Due to the obvious importance of weaponrange, the WRC was incorporated into the MI computation.
The third and final component of the MI is the SF. The SF is a numerical constant,which combines with the AGC and WRC, and is used to establish the origin and endpoints of the MI scale. The actual mechanics used to compute the individual MIcomponents and their combination with the SF to form the MI are described next.
41
;-Sy

NAVAIRSYSCOM N00019-81-C-0098
ANGULAR RELATION (DEG)FIGHTER - ADVERSARY
CASE FIGHTER ADVERSARY ATA AOT
01 0 0
2 0 45
30 90
o 1O
545 135
6 4 90 90
7 90 180sq 1
82 135 180
9 180 180
Figure 4.1-2 Relative Aircraft Position Examples
42

NAVAIRSYSCOM N00019-81-C-0098
AGC COMPUTATION METHODCASE FIGHTER ADVERSARY SIMPSON McGUINNESS*
1+ 1.00 1.00
2.75 1.00
3 .50 1.00
4 0 1.00
5 0 .50
6 0 0
7 -. 50 0
8-.75 0
9 -1.00 0
* McGUINNESS ASSIGNS AGC=O FOR ATA>90 -
Figure 4.1-3 Scoring of Angular Geometry Component for Relative Aircraft Positions
43

NAVAIRSYSCOM N00019-81-C-0098
* Side View of WeaponLaunch Enveiopes
2
Case 2: ~.1
Figure 4.1-4 Requirement for Weapon Range Component of Maneuver Index
44

NAVAIRSYSCOM N00019-81-C-0098
4.2 COMPUTATION OF THE MANEUVER INDEX
The first step involved in computing the maneuver index is to compute WRC scoresseparately for each weapon carried aboard fighter and adversary aircraft. Sinceprobability of kill (P ) results are provided on TACTS only after a missile has beenlaunched, these value' could not be used In computing the WRC. The next best optionis to \use standard "rule of thumb" launch boundaries that have been established foreach weapon type. Figure 4.2-1 illustrates the top view of a hypothetical weaponlaunch envelope. For each AOT degree, minimum (MIN), optimum (OPT), andmaximum (MAX) range boundaries have been established for each weapon. Thesevalues can be conveniently stored in computer memory as a look-up table for rapidretrieval.
In operation, the AOT value, at an instant in time, is used to determine MIN, OPT andMAX ranges from the look-up table. Next, interaireraft range (R parameterillustrated previously in Figure 3.3-1), is tested to determine if it is less than the MINor greater than MAX range. If It is, then the opposing aircraft is outside the weaponenvelope. If inside the weapon envelope, a normalized error score which reflectsrange deviation from OPT range is computed. The error score is multiplied by pi withthe result expressed in radians. This result is, in turn, operated on by a cosine functionwhich produces the WRC value for a missile. WRC values are computed for eachweapon carried aboard fighter and adversary aircraft. The WRC ranges in valuebetween 0 and 1. At the low end of the scale (WRC = 0), the opposing aircraft isoutside all weapon envelopes. At the high end of the scale (WRC = 1), the opposingaircraft is at the OPT range or "heart of the envelope." The highest WRC value(optimum weapon) for the adversary aircraft is then subtracted from tt'e fighter'shighest WRC value. The resultant difference score (WRC ) ranges in value between-1 and 1, with the sign depending upon which aircraft hRs' te weapon advantage. Apositive score indicates a fighter advantage, a negative score reflects an adversaryadvantage. if neither aircraft has a weapon range advantage, the difference score is0. A summary of the WRC computation logic described above is shown in Figure 4.2-2.
The AGC is computed after the WRC difference score is obtained. The AGC score andWRC difference score are then added together. Unit weighting of the two quantitiesis employed since no empirical data are available to justify other weighting schemes.Finally, the MI is obtained by multiplying the SF to the sum of the AGC and WRCdifference scores. A summary of the MI processing steps is presented in a simplifiedflow diagram in Figure 4.2-3. During each computation cycle outlined in the flowdiagram, the optimum weapon, envelope status (in or out) and MI are obtained. Thisinformation can be displayed to range/simulator operators and aircrews in variousformats.
'54,

NAVAIRSYSCOM N00019-81-C 0098
TOP VIEW OF WEAPONLAUNCH ENVELOPE
180 Maximum
Range (MAX)
I Optimum
Range (OPT)
900 --. NNW 90
Minimum00 Range (MIN)
-A -- 1:*"AOT"*"
..
Figure 4.2-1 Illustration of Top View of Weapon Launch Envelope
46

NAVAIRSYSCOM N00019-8)-C-0098
WRC COMPUTATION LOGIC
1. Compute WRCFighter and WRCAdvesary separately for al weapons
carded aboard respective aircraft. Use optimum weapon.
2. Based upon AOT, look-up MIN, OPT and MAX ranges of weaponenvelope.
3. If R<MIN or R>MAX then WRC=O (outside envelope)
4. If OPT<_R__MAX then
SM R-OPT
MAX-OPT~
5. If MIN_<R<OPT then\- oT-R \I
6. WRC- (e)2
7. WRCDiff=WRC Fig hter-WRCAdverSary
Figure 4.2-2 Summary of Computation Logic for Weapon Range Component of Maneuver Index
47

kIAVAIRSYSCOM N00019-81-C-0098
vi v I " II
LL I I IVIIw U U(L
0 0
z Od f.
+ E
0
CL- S IE
I~ W60 ~ 'p0
12 jj
cc
p ~ I 48
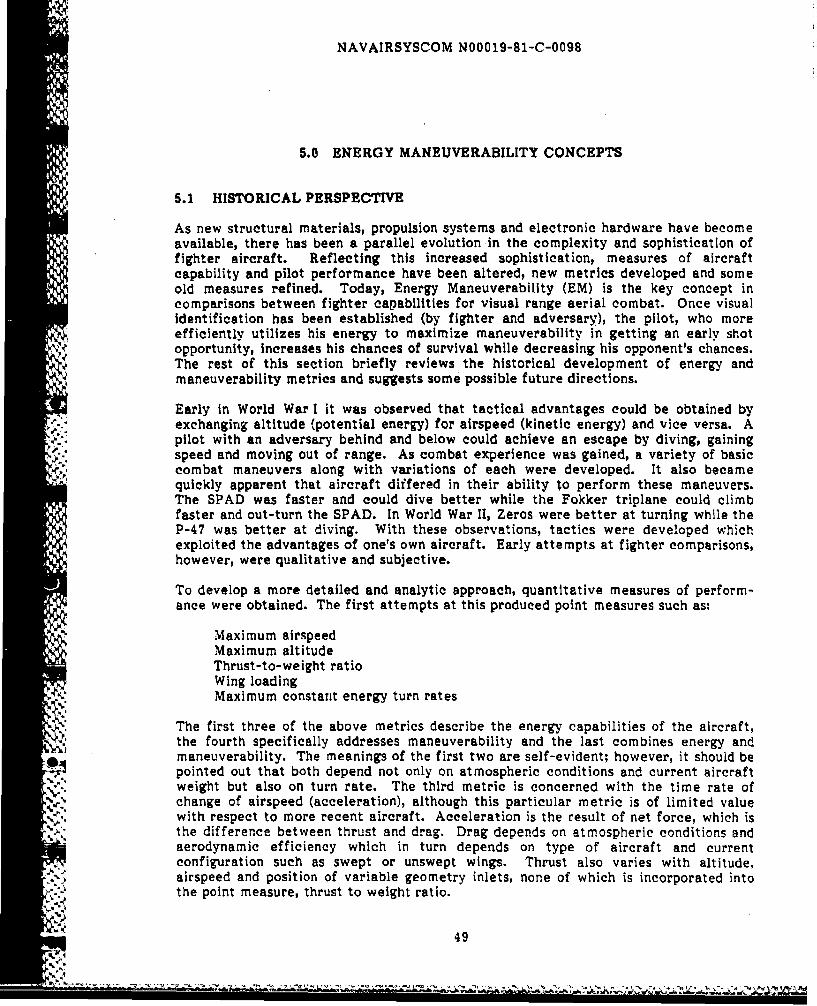
NAVAIRSYSCOM N00019-81-C-0098
5.0 ENERGY MANEUVERABILITY CONCEPTS
5.1 HISTORICAL PERSPECTIVE
As new structural materials, propulsion systems and electronic hardware have becomeavailable, there has been a parallel evolution in the complexity and sophistication offighter aircraft. Reflecting this increased sophistication, measures of aircraftcapability and pilot performance have been altered, new metrics developed and someold measures refined. Today, Energy Maneuverability (EM) is the key concept incomparisons between fighter capabilities for visual range aerial combat. Once visualidentification has been established (by fighter and adversary), the pilot, who moreefficiently utilizes his energy to maximize maneuverability in getting an early shotopportunity, increases his chances of survival while decreasing his opponent's chances.
* The rest of this section briefly reviews the historical development of energy andmaneuverability metrics and suggests some possible future directions.
Early in World War I it was observed that tactical advantages could be obtained byexchanging altitude (potential energy) for airspeed (kinetic energy) and vice versa. Apilot with an adversary behind and below could achieve an escape by diving, gainingspeed and moving out of range. As combat experience was gained, a variety of basiccombat maneuvers along with variations of each were developed. It also becamequickly apparent that aircraft differed in their ability to perform these maneuvers.The SPAD was faster and could dive better while the Fokker triplane could climbfaster and out-turn the SPAD. In World War II, Zeros were better at turning while theP-47 was better at diving. With these observations, tactics were developed whichexploited the advantages of one's own aircraft. Early attempts at fighter comparisons,however, were qualitative and subjective.
To develop a more detailed and analytic approach, quantitative measures of perform-ance were obtained. The first attempts at this produced point measures such as:
Maximum airspeedMaximum altitudeThrust-to-weight ratioWing loadingMaximum constant energy turn rates
The first three of the above metrics describe the energy capabilities of the aircraft,the fourth specifically addresses maneuverability and the last combines energy and
04l maneuverability. The meanings of the first two are self-evident; however, it should bepointed out that both depend not only on atmospheric conditions and current aircraftweight but also on turn rate. The third metric is concerned with the time rate ofchange of airspeed (acceleration), although this particular metric is of limited value
%" with respect to more recent aircraft. Acceleration is the result of net force, which is
%" the difference between thrust and drag. Drag depends on atmospheric conditions andaerodynamic efficiency which in turn depends on type of aircraft and currentconfiguration such as swept or unswept wings. Thrust also varies with altitude,airspeed and position of variable geometry inlets, none of which is incorporated intothe point measure, thrust to weight ratio.
49

NAVAIRSYSCOM N00019-S1-C-0098
Wing loading is the ratio of aircraft weight to wing surface area and is a measure ofturning performance. Wing loading is inversely related to the aerodynamic load factornw , which is defined as the ratio of the force normal to the wind axis and gross weight.Thus as wing loading increases the load factor decreases. Turn rate can then bedescribed with the following equation:
TR = 1092 nw2 -1
V
where: TR is a level turn degrees/second.nw is the aerodynamic load factor lbs/lbs (i.e., dimensionless):V is the airspeed knots.
As seen from this equation, for load factors much above 1, turn rate is nearlyproportional to load factor.
Up through the 1960's the approximation that wing loading was inversely proportionalto load factor worked fairly well. In the 1970's this situation changed and nw could bealtered independently of wing loading. For example, wings could be swept or the wingcamber changed with flaps. Additionally, with the development of thrust vectoring,turning can be affected separately from wings and flap deployment.
Despite the above limitations which have long been recognized, the single value orpoint measures of performance were valuable predictors of the outcome of aerialcombat through WW II. Changes occurred during the 1950's with the advent of super-sonic fighters carrying guided air to air missiles. Through the early 1950's, each newfighter developed was designed to be faster than the one it replaced. With theappearance of the F-104, fighters entered the Mach 2 range. At these great speedsturning ability is greatly reduced and an aircraft must fly a much straighter path.While a higher top-end speed may be useful in quickly getting out of or closing in ongun range, it is not nearly as effective in avoiding a guided missile. In.fact, sincecentrifugal force is proportional to the ratio of the square of the velocity over turnradius, a pilot can use an oncoming missile's speed to his own advantage. Although the
*; missile can pull more "G's," if the pilot can sight the missile, he may be able to turntightly and force a missile overshoot. The lack of utility of a higher maximum speed isalso demonstrated by the fact that most aerial dogfights have taken place at subsonicspeeds. For example, data from 1963 to 1973 in Southeast Asia indicate that combatwas usually between 280 and 450 knots (Gunston and Spick 1983). Maneuverability andacceleration at subsonic speeds have since been recognized as more important thantop-end speed.
Spurred by observations such as those above, a reassessment of aerial combatmaneuvering was conducted. The interaction of turn rate, turn radius, airspeed, andmaximum altitude was emphasized. This analysis resulted in the development of EMdiagrams in the 1960's. Two basic diagrams (Figures 5.1-1 and 5.1-2) have since beenadopted as standard display formats for EM descriptions (Martin, Luter, Caddy andMueller, 1984). These are two-dimensional diAgrams with either turn rate and Machnumber or altitude and Mach number as the axes. As opposed to single-valuemeasures, EM diagrams describe the variation of maximum turn rate or maximumaltitude with Mach number. For example, in Figure 5.1-2 the dotted (not the longerdashed) lines mark the boundary of turn rate as a function of Mach number. At lowspeeds, turn rate is limited by the aerodynamic characteristics of the aircraft, in other
50
"7 7" ...... ...... '-7 .... l-"T "... .i n n

NAVAIRSYSCOM N00019-81-C-0098
. . . . . . .. . . .. . a . .. . . ..
w "m
.. ....% ....]- . -
. ..... .. <
..............................................................,. ... ......,#"......... # . . ..... .4#.I
- w U
! . . .. .. . . .. J.
. . . . . . . . . . .... 7...' , - , . ..,...z U- E
4c-Jc acv'
A ~ ~ ~ U I34S6-Ql~l
&. 4... + J J ..... ..: ... ... ......
, .,t r z.=,a ")=o -
I?4Ai. -fr •2Ztc - - - ~ ~ . __
.: .i33j sea -mniiii, v"

NAVAIRSYSCOM NOO1-81-C-0098
-- ----
ase
X u
N .. -1
w cc
.4.c
%Su.
%~
g
0 N
z =a
o U.00
CL
cm N
vN CONfS/S33a93V 3iyubn841
52

NAVAIRSYSCOM N00019-81-C-0098
words, the lift limit. As velocity increases so does the force normal to the wings andeventually the maximum allowable load is reached. At this point, turn rate issimultaneously limited by both the lift and load limits. The velocity corresponding tothis point Is called the corner velocity and is the maximum instantaneous turn rate forlevel flight. As seen In Figure 5.1-2, the rate of energy change for this t rn rate isvery negative and the pilot Is quickly losing speed and/or altitude. To maintain theturn rate altitude must be decreased. Above the corner velocity, in order to taywithin the load limit, turn rate must be progressively decreased until the maximumspeed of the aircraft is reached. At this point the turn rate boundary drops verticallyto the Mach number axis. In addition, lines of constant specific excess power (Ps)7 canbe overlaid on the diagrams. The Ps = 0 curve represents the functional relationshipbetween maximum sustainable turn rate and Mach number. In regions where availRblePs is positive, the aircraft thrust can exceed drag resulting in either an increase inairspeed or altitude. These diagrams can also be used to compare dissimilar aircraft.Regions where P5 values differ between aircraft by 100 feet per second or more are,as a general rule, taken to indicate an advantage in maneuvering. From the EMdiagrams, one can develop tactics to fly at a speed and turn rate where the opponentloses energy faster than the fighter so that eventually he will reduce his speed and canno longer turn at the fighter's rate. The fighter can then position his aircraft for amissile firing.
p From Figure 5.1-2 it can also be seen that the velocity for maximum turn rate (cornervelocity) occurs slightly above 400 knots so that too high a velocity is actually adisadvantage in a turning engagement. In a typical engagement scenario, a pilot wouldcome into combat unloaded, i.e., not turning, and a bit above corner velocity. As hebegins turning, energy is drained away (Ps < 0) and airspeed drops so that a short wayinto the engagement he is at corner velocity. Here turn rate is maximum, allowing thepilot to rapidly get a nose on position for a missile firing, or if need be, a quick high"G" defensive maneuver. After missile firing, the pilot goes down to a low "G" stateand rapidly picks up air speed to reposition himself for another maneuver.
While the problem with just looking at maximum speed has already been pointed out,there is also a problem with just looking at maximum turn rate. If the fighter'smaximum turn rate is greater than the opponent's, it would at first appear that the
'I' fighter has an advantage. However, if a pilot's Ps value for similar turn rates is muchmore negative than his opponent's, he may not be able to mritain near corner velocitylong enough to get his nose on the opponent's aircraft. The %egative Ps will cause aquick loss of airspeed and the opponent may soon have a turn rate advantage. Finally,maximum turn rate is not the only important parameter; a slow drop off in turn rate asone gets away from corner velocity is also valuable. This late.r desirable characteris-tic is not apparent with the point measure, maximum turn rate, but is in Figure 5.1-2.
EM diagrams allow pilots to look at performance throughout the flight envelope ratherthan at one point in it. Much more information is present in EM diagrams such as
*presented in Figures 5.1-1 and 5.1-2 than in the single-value measures first developed.
5.2 METRICS FOR NEW-GENERATION AIRCRAFT
- While the EM diagrams discussed above are major improvements over earlier metrics,
they too have their shortfalls. For example, Figure 5.1-2 compares maximum turnrate with Mach number. When this diagram was first developed, aircraft were
7% P5 Change in the sum of kinetic plus potential energy divided by time.
53
K- PC i'. W* -% e e 1'

NAVAIRSYSCOM N00019-81-C-0098
*- designed such that maximum turn rate occurred near minimum turn radius. Tacticswhich were developed for the aircraft to be near corner velocity at a critical segmentof the engagement also came close to optimizing for minimum turn radius. Maximumturn rate no longer occurs at near minimum turn radius for some of the most recentfighters, and tactics have been developed which exploit one aircraft's turn radiusadvantage over another. The turn rate against Mach number diagrams cannotdistinguish these differences in turn radius. Furthermore, there are maneuvers such asthe barrel roll which has a maximum rate which varies with airspeed and turn rate.The standard EM diagrams do not address barrel roll, so obviously they cannot displaythe variation in barrel roll rate with other parameters.
Other difficulties with the carrent EM diagrams have been pointed out by Skow andHamilton (1984). These are concerned with transition times between maneuver states.For example, an aircraft can be characterized at any point on Figure 5.1-2 by using anordered triple of Mach number (MN), turn rate (TR), and Ps. Two different positionscan be compared using their ordered triples (MN 1 , TR1 , Ps ) and (MN2 , TR 2, Ps )-What is not shown is the minimum time required for a transitibn between these statis.Characterization of these transition rates Is a natural extension of the earlier EMmetrics. Initially, measures such as maximum turn rate, maximum airspeed, maximumaltitude, and thrust-to-weight ratio gave single values. Maximum turn rate andmaximum airspeed in particular characterized the maximum energy possible. P. is themaximum possible of the first time derivative of energy, and its placement on thestandard EM diagrams reveals how It varies with other parameters. Instantaneoustransition rates between ordered triples then give the second time derivative ofenergy. It was this second derivative which was addressed by Skow in his energy onsetrate (AP sftt), which will be described below. Likewise, although Figure 5.1-2 displayshow maximum turn rate varies with Mach number, it reveals nothing about the
* minimum time required for a transition between two TR-MN pairs. There areaerodynamic limits on how rapidly turn rates can be altered which depend on Machnumber. As a metric for this transition time, Skow has suggested what he called theturn agility metric which will also be described below.
The energy onset rate is defined as the difference between P5 at maximum thrust,minimum drag and Ps at minimum thrust, maximum drag, divided by the time to makethe transition. Dennding on what is limiting and whether one is concerned withacceleration or c'..celeratlon, it is either spool-up time, spool-down time, time todeploy flaps, or time to deploy thrust reversers. An argument for the metric is thatwhile one aircraft may have a higher maximum climb rate or maximum acceleration,another aircraft with a shorter spool-up time may be able to accelerate faster duringthe early part of an engagement.
The first aircraft may be the recipient of a missile before there is time to takeadvantage of its higher top-end acceleration. The second metric is turn agility and isequal to the turn rate divided by the minimum time required to switch from a 450 leftor right-banked turn to a 450 banked turn with the opposite bank.
These two new metrics, being approximate time derivatives of previous metrics, arefurther refinements of measurements of air combat maneuvering. In the future theymay play important roles in aircraft design and combat tactics. In the meantime,
A much work needs to be done with them. Values must first be generated for variousaircraft, including the variation of these new metrics with other parameters. Forexample, the energy onset rate will vary with turn rate depending on how the inletdistortion and recovery varies with angle of attack (Skow and Hamilton, 1984).
54

NAVAIRSYSCOM N00019-81-C-0098
Similarly, the time required for a 900 change in bank angle depends or. maximum rollrate. As roll rate decreases with higher angles of attack, so does turn agility.
Any models developed for the variation of Skow's metrics with other parameters needto be confirmed with flight tests. After confirmation of accuracy, these new metricsmust also be tested for utility on TACTS/ACMI ranges. For these metrics to beuseful, it needs to be shown that differences in pilot and/or aircraft performance asmeasured by these metrics, correlates significantly with discrete engagement out-comes. Based on the metric definitions, it would appear that the best chance for asignificant correlation for the energy onset rate metric would be in engagements withlarge and rapid changes in throttle position, while the turn agiuity metric would beexpected to do best in engagements with rapid changes in bank angles.
Pilots must be able to transfer a classroom understanding of these metrics to cockpitcontrols during actual flight. Pragmatically, this must be accomplished withinreasonable amounts of classroom, simulator and flight time. Considering the difficultyin applying the current TR-MN display to the TACTS/ACMI ranges, an immediateattempt to apply these new metrics seems premature.
Based upon the above considerations, it is recommended that a very simple metric be
applied to TACTS/ACMI ranges. It is then left to the pilot to interpret this metric anddecide on specific cockpit actions. The metric suggested is the specific energy(kinetic plus potential energy divided by total weight of aircraft), Es, or possibly itsfirst time derivative, Ps. Only after a thorough analysis of the relationship betweenthe variation of Es during TACTS/ACMI maneuvers and the outcome of the combat,should a metric be derived for performance with respect to energy maneuverability.
3.5
a,
'-A
. 55
i 'PI.:i

NAVAIRSYSCOM N00019-81-C-0098
6.0 ENERGY MANEUVERABILITY DISPLAY
6.1 DESCRIPTION
The EMD was developed and implemented for use on TACTS/ACMI. Development ofthe EMD is detailed in Pruitt (1979) and Pruitt, Moroney and Lau (1980). The display isdesigned as a training aid to assist aircrews in acquiring energy maneuverability skills.The EMD is a version of the standard turn rate versus Mach number diagram which was
presented previously in Figure 5.1-2. The diagram has been used for years byaeronautical engineers to compare aircraft performance. A simplification of thestandard diagram contains two nested graphs, which are referred to, collectively, asthe "Maneuver Triangle." Data points which comprise the Maneuver Triangle portionof the EMD are defined and illustrated in Figure 6.1-1. The outer or larger of the twonested graphs represents maximum instantaneous turn rates achievable by an aircraftat different speeds. The side of the outer graph to the left of the apex is theaerodynamic lift limit of the aircraft. The structural and placard limits are shownalong the outer graph to the right of the apeA. The inner or smaller graph representsthe Ps = 0 curve. Below this curve, energy may be gained, while above it, energy islost.
Each graph is a linearized approximation over five subintervals which are defined bythe points in Figure 6.1-1. Since the variables TMRPS, TCTPS, TXRPS and TMXPSare maximum sustained turn rates, they occur at Ps = 0. Connecting these points withVMR and VMX airspeeds enable linear approximations to be made for the fivesubintervals. Likewise, the maximum instantaneous turn rates defined by the pointsTMR, TCT, TXR, and TMX are connected to 0 and VMX airspeeds and provide a basisfor linear approximation over five subintervals. Each of the variables defined inFigure 6.1-1 represents a vertex whose location depends at any moment on altitude,weapons load and fuel status. In operation, the two nested graphs defined above forthe EMD are updated using a look-up table which assigns d value to each variabledepending upon gross weight, armament and altitude.
The EMD is displayed on the TACTS/ACMI Display and Debriefing Subsystem (DDS),where graphs of two aircraft are overlaid upon each other. An illustration of EMD ispresented in Figure 6.1-2. In the example, the maximum instantaneous and sustainedcurves for aircraft 1 are shown as solid lines. The graphs for aircraft 3 are presentedas dashed lines. The numbers 1 and 3 shown with the graphs are the current turn rates
and airspeeds of aircraft 1 and 3, respectively. Alphanumeric data such as velocity, G,altitude, specific excess power, acceleration and rate of altitude change are presentedfor each aircraft beneath the graphs.
Normally, one can analyze the graphs of two aircraft and determine an ideal speedrange and set of tactics for each aircraft "to exploit weaknesses of the other.However, in the example presented in Figure 6.1-2, aircraft 3 has a superior turningcapability over aircraft I across all speed regimes. It would be wise for the pilot ofaircraft 1 to avoid a turning fight against aircraft 3 because his aircraft is greatlyovermatched.
56

NAVAIRSYSCOM N00019-81-C-0098
TOT
TMX
Th4XPs
0 VMR VCT VXR VMx
VMR - AIRSPEED AT MINIMUM SUSTAINED TURN RADIUS TMRPS - MAX SUSTAINED TURN AT VMRCVCT - CORNER VELOICTY -AIRSPEED AT MAXIMUM TCT - MAXIMUM LEVEL TURN RATE AT VCT
INSTANTANEOUS TURN RATE TCTPS - MAX SUSTAINED TURN RATE AT VCTVXR - AIRSPEED FOR MAXIMUM SUSTAINED TURN RATE TXR - MAXIMUM LEVEL TURN RATE AT VXRVMX - 750 KCAS OR MAXIMUM VELOCITY IF LESS TXRPS - MAX SUSTAINED TURN RATE AT VXR
THAN 750 KCAS TMX = MAX LEVEL TURN RATE AT VMXTMR MAXIMUM LEVEL TURN RATE AT VMR TMXPS - MAX SUSTAINED TURN RATE AT VMX
Figure 6.1-1 Display Data Point DefinWon, Maneuver Triangle[From Pruitt, Moroney, and Lau 1 960
57
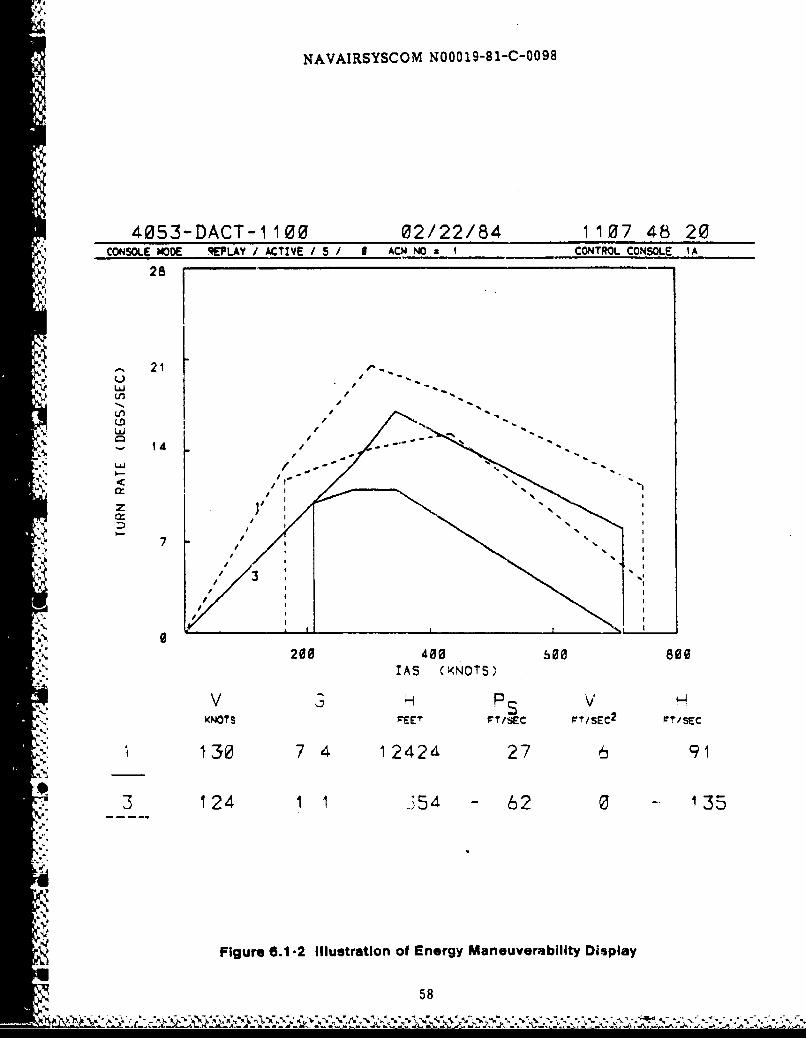
NAVAIRSYSCOM N00019-81-C-0098
4053-DACT-1100 02/22/84 1107 48 20CONSOLE MODE 9EPLAY /ACTIVE/ 5/ ACM NO I CONTROL CONSOLE 1A
28
'21
11
",.200 400 600 800-.- As ( NO TS N,
V L-
"'KNOT'S 'E£" 'r I/SC P'/SEC2 P ,T/SEC
:1-.t30 7 4 1 242d. 27 ,5 9 1
S 124 1 1 54 - 62
Li
Figure 6.1-2 Illustration of Energy Maneuverability Display
.58
.. ', ,'. - .< -.' '. , '- ., '' ' ''' ,Z .\ ,,.''"".'" , ,i ' " ""%-''" , """ - .' - . .. 4. , . . -':. o" -%:.-./
........ I /,,I *-. .. , ,,,.. P . . . . .,% 4 . * , . I • .. = ,, ,,. . ._ % . , . .' 4 ,,. /., . .

NAVAIRSYSCOM N00019-81-C-0098
6.2 OPERATIONAL STATUS AND USAGE
The EMD has received limited use on both Navy and Air Force training ranges. TheEMD has been used by Navy Fighter Weapons School instructor pilots, at NASMiramar, California, primarily to ascertain the limits of their aircraft maneuver-ability envelopes. The Nellis AFB, Nevada, range has completely removed thesoftware from the system to conserve system resources.
The reason for this limited use is due to the nature of the display. The concept of EMis very useful but difficult to apply in flight. The information displayed is notcorrelated to specific tactical encounters. Pilots must extrapolate the EM data andrelate it to the time and position of engagLag aircraft, and tactical maneuverattempted.
The software for the present EMD consists of a subroutine within the Control andComputation Subsystem (CCS) that calculates turn rate, end a display driver on theDDS that interprets the CCS output. The softwarc has been modified and migratedfrom Yuma to Nellis and back to Yuma over the life cycle of the program. The Yumasite has the most current updates and should be considered the field software baseline.
The existing software is poorly documented, and support of the code is dependent upona few site programmers who have monitored its evolution. The display exhibitsperiodic digressions when viewed on the DDS. Sometimes the aircraft positionirdicator Is projected outside the triangular performance envelope of the display. Anexample of this digression is illustrated in Figure 6.1-2 where the current turn rateand airspeed of aircraft 1 are shown outside the boundary of its aerodynamic limit.This problem can be attributed to the fact that aircraft profile data are defined forlimited discrete altitudes, and approximations must be made when actual aircraftaltitude is between defined altitudes. While more tabled values for altitude could bestored in memory, the increased resource demands would severely burden limitedcomputer resources. To correct this problem, a more powerful computer with largermemory capacity would be required.
A problem with EMD software has been found in which Ps values do not agree withalphanumeric data on airspeed, time rate of change of airspeed and time rate ofchange of altitude. Correcting this and other potential software problems would bedifficult due to the poor documentation. It is recommended that EMD software not beupdated at this time due to the limited use of the display, poor documentation andupcoming changes in computer architecture for the next generation ranges. Cur:ently,there are no plans to incorporate the EMD at the latest range at NAS Fallon, Nevada.
6.3 EVALUATION OF THE EMD
In developing the EMD, three candidate diagrams were considered:
1. Altitude versus Mach2. "g" versus velocity3. Turn rate versus Mach
The three candidates were reviewed by aircrews who expressed preference for usingthe turn rate versus Mach diagram in the EMD (Pruitt, et al., 1980).
Despite their preference for this EMD format, however, pilots seldom use the displayand it has been taken off the DDS at some sites. While velocity is easy for pilots to
50

NAVAIRSYSCOM N00019-81 C-0098
check, there is no turn rate display in the cockpit, and pilots have had difficulty inrelating EM diagrams to the actual maneuvers they perform in the aircraft. Justknowing the range of airspeeds where there Is a region of favorable Ps values does notappea: to give sufficient information to lead maneuvers, resulting in a favorableposition with respect to the adversary.
As a final note, a word of caution should be given on the development of tactics usingEM diagrams. To obtain a position advantage, a pilot may fly in a region of theManeuver Triangle where his aircraft has superior performance. If this region is arelatively small portion of the triangle, the pilot is quite restricted in his choice ofmaneuvers. This restriction may make the pilot's actions predictable, enabling enemypilots to anticipate his maneuvers and to be prepared with counter maneuvers.
6.4 ALTERNATIVES TO THE CURRENT ENERGY MANEUVERABILITY DISPLAY
A possible alleviation to the difficulty pilots have in relating the turn rate versus Machnumber diagram to cockpit controls is to overlay constant "G" and constant turn radiuslines onto the graph as was shown in Figure 5.1-2. With respect to the predictabilityproblem, it should be pointed out that it is still useful to have your adversary loseenergy faster than you. Thus diagrams such as the turn rate versus Mach numbergraph are good to have in one's mind as long as they do not become overly restrictive.Rather than have the EM diagram on the DDS for debriefs, it may be more appropriateif it is employed in the classroom stage of instruction, where part-task simulationscould be used to demonstrate EM concepts. As discussed in Section 5.0, a simplified
Zt metric such as Ps may be most appropriate for pilot feedback. Techniques to displayenergy and maneuver information are described in the next section.
J0
4-0
,'"1
,W,,,. ,.*, . . ,e.
, ,., , , ,"=" " , ", " ,/ ,,"- , b-e", ,¢"-", ,- . -,--. ' ' - , ",". ", " ,..-j--.' - . ,. ,, ,. - ,... . ...- " -= .,-.- . ,

NAVAIRSYSCOM N00019-81-C-0098
7.0 ENHANCED DISPLAYS FOR AIRCREW TRAINING
This section presents several enhanced displays which were designed during the courseof developing maneuver and energy performance metrics. The displays represent afew of a much larger group of instructional and diagnostic assessment displays whichcould comprise a TACTS/ACMI instructional enhancements package. Although thedisplay presentation focuses on TACTS/ACMI enhancements, much of the informationis directly applicable to the design of instructor operator stations for air combat flightsimulators.
Prior to presenting display concepts, a framework for the design and use of enhanceddisplays is presented. The framework is based upon a simplified aircrew trainingmodel which is illustrated in Figure 7.0-1. The model shows the generic phases onemust go through to train aircrews to achieve or maintain proficiency in a skill area.
The aircrew training model begins with a specification of training objectives whichdelineate the task elements to be trained. Tasks are identified from mission and taskanalysis of the aircrew job. Other important outputs produced with the trainingobjectives are as follows:
1. Instructional prescriptions for teaching each task
2. How task performance is assessed3. What performance level determines mastery of a task
After these requirements are specified, aircrews enter the training cycle, where they
are provided instruction followed by practice on the task. Aircrew performance during'1r practice is assessed to determine if learning has occurred. Diagnostic feedback is an
essential element of learning obtained during practice and assessment phases. Withknowledge of prior performance in hand, each aircrew receives additional instructionand continued practice until his performance reaches the prescribed level.
The significance of the above framework is that information requirements, which maybe unique to each phase of the training cycle, should drive the display design. Forexample, displays developed for the instruction phase could teach difficult-to-graspprinciples involving spatial relationships which are not amenable to a classroomsetting. To teach how a weapon envelope is distorted under diverse conditions, anaircrew could be provided a three-dimensional view of a weapon envelope on a desktopdisplay system. The aircrew could observe, directly, envelope distortions as hemanipulates the movement of a simulated ai:-craft with a joystick. This is oneexample of many that could be developed as part of a future TACTS/ACMI instruc-tional enhancements package. The remaining section focuses on displays suitable forthe practice and assessment training phases.
Traditionally, emphasis has been placed on dev~loping displays for the practice phaseof air-to-air combat training. A classic example is the TACTS/ACMI DDS. The DDSprovides numerous graphic and alphanumeric displays which are monitored by theRange Training Officer (RTO) during live exercises. An illustration of the DDS ispresented in Figure 7.0-2. The same display formats are also utilized by instructorsand aircrews who observe engagement replays during post-mission debriefs.
61

NAVAIRSYSCOM N00019-81-C-0098
Z40
00
I-,
0
62

= NAVAIRSYSCOM N00019-B1-C-0098
-
{Q.l~ mups.=.
.
fl-
~Figure 7.02 Display and Debriefing Subsystem: (DOS) for TACTS/ACMI
• 63------------------------------------ 3-.-
.5 ' .1.--* -

NAVAIRSYSCOM N00019-81-C-0098
Two frequently used graphic displays on the DDS are the centroid view and pilotcockpit view displays. The centrold view enables a DDS user to view several aircraftsimultaneously within.the TACTS/ACMI operating area from a 'god's eye' perspective.The centroid view scene can be rotated easily for side viewing. Top and side centroidviews on the DDS are presented in Figures 7.0-3 and 7.0-4, respectively. The pilotview display provides the user with the perspective of looking out the cockpit ofinterest at the adversary aircraft. An illustration of the pilot cockpit view display ispresented In Figure 7.0-5. In the illustration, the user can observe aircraft 4 as thoughhe were looking through the cockpit of aircraft 2.
The pilot cockpit view display provides a good pictorial rendition of events during liveexercises and replays of engagements flown on TACTS/ACMI. In addition to pilot viewdisplay graphics, the DDS operator can view detailed alphanumeric data on each ofseveral alphanumeric displays. One example of an alphanumeric display presented onthe DDS is the alphanumeric flight data display (Figure 7.0-6). Although alphanumericdisplays can be called up readily, users prefer graphic display formats which they viewmost frequently. A possible reason for this preference may be that users are requiredto synthesize raw data contained in alphanumeric displays. Data synthesis is adifficult task which becomes even more complicated when the user must thenintegrate the synthesized information with graphic information presented dynamicallyin the pilot view display.
.%n A potential aid to assist in data comprehension may be to synthesize some of the mostrelevant alphanumeric data for the user and display the synthesized data in meaningfulgraphic formats. The MI, described previously, is a most suitable candidate becausethe algorithm synthesizes the raw data parameters AOT, ATA, and R, and produces asummarized output. Moreover, the MI output can be transcribed directly to graphicformats which are compatible with graphic scenes presented in the pilot view display.By utilizing compatible graphic formats, the authors believe that the user may bebetter able to integrate and comprehend the large quantity of training data generatedby TACTS/ACMI and simulators.
Application of the above concepts is illustrated in the enhanced pilot cockpit viewdisplay (Figure 7.0-7). The enhancements are shown on the right side of the display.As illustrated in this figure, there are two analog bars. The bar on the left is the MIscale which indicates aircraft position advantage. The open arrowhead symbol () tothe left of the MI bar, as shown in the illustration, represents the current positionadvantage of aircraft 2 with respect to aircraft 4. As aircraft maneuver during the
course of an engagement, the arrowhead moves against the fixed MI scale. If thearrowhead symbol is at the top of the scale, aircraft 2 would have a significantposition advantage. If it Is at the bottom of the MI scale, the opposing aircraft (4)would have the position advantage. Neutral or standoff states would be indicated bythe location of the arrowhead near the middle of the MI bar.
Located to the right of the MI bar in Figure 7.0-7 is an energy index (El) bar. The Elmay represent E , P or some other calculated energy parameter. The most desirableenergy parametr tl use for the El bar should be determined through additionalresearch and empirical testing. In any event, the El bar should represent an energyscale with high energy depicted at the top of the bar and low energy at the bottom.The open arrowhead symbol (>) to the left of the El bar would represent, as shown inFigure 7.0-7, the energy level of aircraft 2. The second symbol (>-) on the left side ofthe El bar would represent a desired or ideal energy level which would correspond toprescribed doctrinal standards. The current energy level of aircraft 4 would be
64
N,4

NAVAIRSYSCOM N00019-81-C-0093
N-W 32 ~CA
X1> P< A:? OrC'
:, 104
HVFiguG7--3 ispay nd ebrefig Sbsytem Cotrad~o~leK / A-
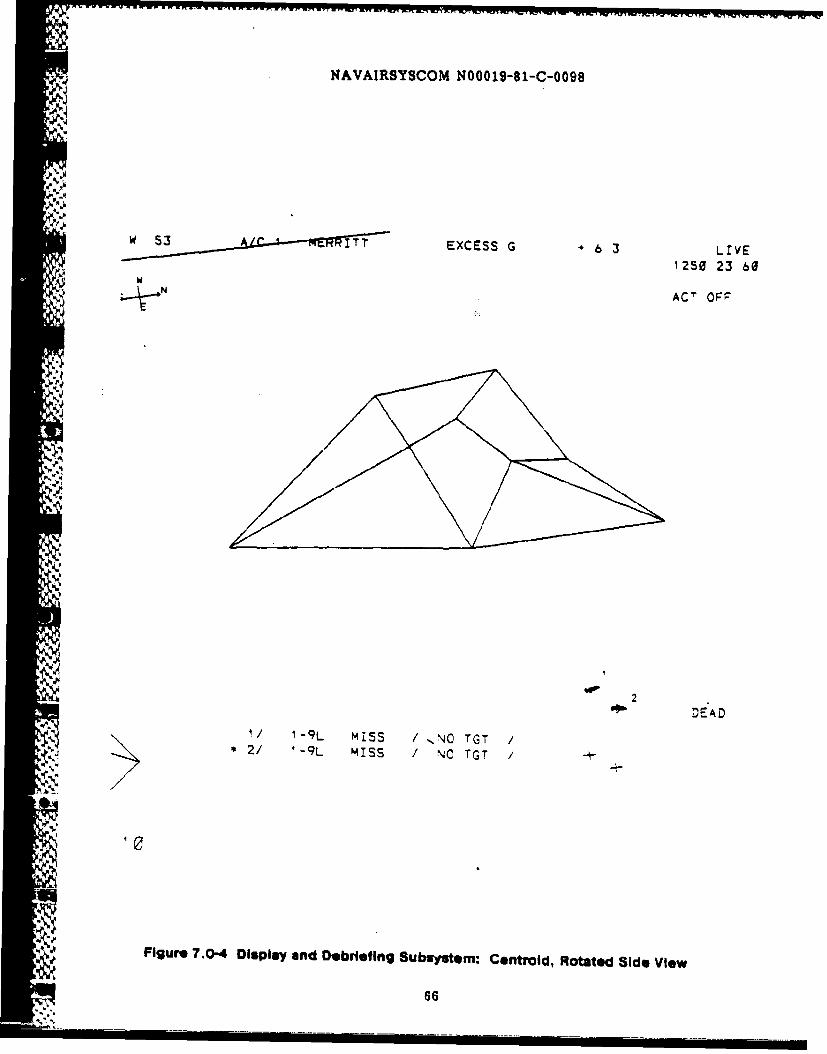
NAVAIRSYSCOM N00019-81-C-0098
5 3 '!111 . .......M IT T EXCESS G "* 6 3 LIVE
w
:AMA
! . I/ I-9L miss /-,.NO TGT /_ j ". "2/ '-9L miss / NO TGT / J
.,4
,a Figure 7.0-4 DIStPlay aind Debriefing Subsystem: Centroid, Rotated Side View
i ii1
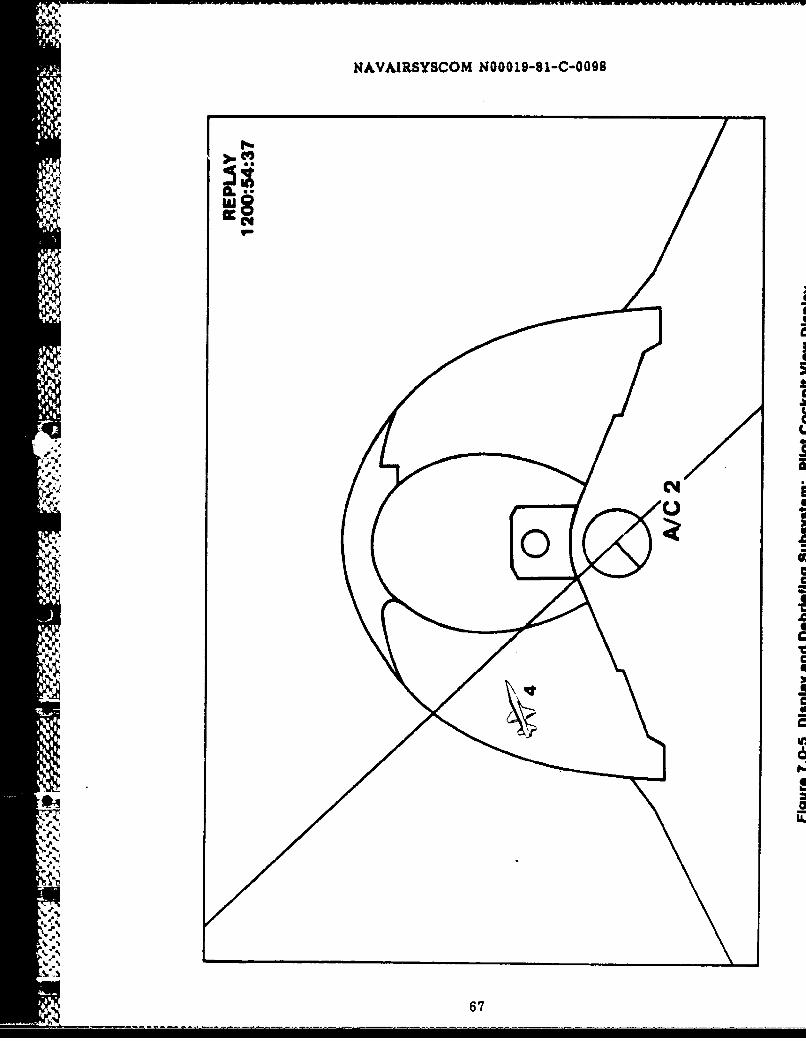
A
NAVAIRSYSCOM N00019-S1-C-009B
N
a
.1
4
I. .I
1
4aa
4'
dI
I*1UCI
I
*1aC
V
II-.
I
C
A~.,
.1~
-p~. .~
%. -~
67

KAVAIRSYSCOM N00019-81-C-0098
MA41211-1297 12/11/84 1019 42 80:ON30LE MODE REPLAY / ACTIVE / 6 ACM NO I CONTROL CONSOLE 3A
2/6 6/2
BRG 263 83
R e 02 M 1 02 ,,M
VC(ITS 287 287
*AOC' 176 61
,* ATA 119 4
A/C 1 2 3 5 7 B
MAC 00 77 30 00 73 80 . 02
,AS 0 347 0 0 287 355 474
AL' 00 22239 02 20 31749 233'3 '8743
ACA 0 '2 C A 12
S 3 3 0 23 35 48
NE0 3 0 0 0SEEER 50 5 5v 5 50 4 2 50PADAR So 5053 5 50 4 2 50A A-e 4 4 4 4 4 4
A 'A-7 4 2 2 -
I - - !&:"- 2 .4 0 "2
<E"OARD INPUt
Figure 7.0-6 Display and Debriefing Subsystem: Alphanumeric Flight Data
68
S"I---T'.T"-T-.T----T--I-.--.-- .1 - -.i i i i i i i -.

NAVAIRSYSCOM N00019-81-C-0098
coz
9 69
-8 Wi I-

NAVAIRSYSCOM N00019-81-C-0098
depleted by the filled arrowhead symbol (4) located to the right if the El bar.Together, the El and MI bars could enable the user to assess airerew trade-offs ofenergy for position advantage, and vice versa.
A most important feature provided by the enhancements shown in Figure 7.0-7 is thealphanumeric information presented beneath the MI and El indicator bars. Thisinformation specifies when the adversary is inside a weapon envelope of the fighterand which weapon type is the optimum one to use. Envelope status Information is anextremely useful diagnostic. For example, occurrences of a pilot who consistentlymisses shot opportunities might indicate a need for additional specialized instructionto teach weapon envelope recognition skills.
In actual operation, the user would be able to view the MI, El, envelope status or otherparameters as desired options. Once selected, these enhancements would be displayedas windowed overlays on the basic pilot cockpit view display.
The introduction of high-speed raster graphics systems to TACTS/ACMI would providea wide range of capabilities for developing innovative display enhancements. Anexample made possible by this latest technology is the maneuver diagram shown inFigure 7.0-8. This diagram depicts aircraft flight paths and maneuvers flown. Ahistory of the flight path is shown as a ribbon which follows the aircraft. Energymanagement information could be easily integrated with the maneuver information bycoding it into the ribbon of the maneuver diagram. For example, if the aircraft is in apositive energy state, or gaining energy, the ribbon could be coded as a specific color
Aand texture. When an aircraft is in a negative energy state, or losing energy, theribbon would show a contrasting color and texture. A third color, located between theother two colors on the color spectrum, and a distinct texture could signify when theaircraft is neither gaining nor losing energy. Details of the color scheme will not beelaborated upon since it is a subject for future study. It should be mentioned,however, that redundant color and texture coding is desirable for viewing by colorblind operators and with non-color terminals and printers.
Displays designed to assess training have not been given much emphasis in the past.However, with increased military training requirements and resource constraints, it isbecoming increasingly important to have an assessment capability built into trainingsystems. There is virtually no objective means to determine whether learning hasoccurred without an assessment capability. At the individual level, diagnosticassessment displays could provide the aircrew with a rich source of feedback todetermine his level of task mastery. Moreover, the displays could help pinpointstrengths and weaknesses so appropriate training resources could be applied toexpedite the learning process.
A key ingredient to a diagnostic assessment capability is a data base managementsystem (DBMS). The DBMS stores historical data collected during the training cycle.eause storage is an obvious limitation to any system, only the most essential data
points or measures can be stored. The quantity of data can be reduced by storing onlythose measures which relate directly to tasks identified from mission and taskanalysis. Diagnostic assessment displays must then be based upon these mea~sures andbe formatted in a simplified manner which is meaningful to aircrews.
Due to time constraints for reviewing exercises during TACTS/ACMI debriefs, it ispossible that important events or trends may be overlooked or forgotten. Thispotential problem may be particularly heightened with large-scale TACTS/ACMIsystems. Fortunately, the historical nature of the data makes diagnostic assessmentdisplays well suited for off-line viewing (e.g. squadron location).
70

k4AVAIRSYSCOM N00019-S1-C-0098
''I'
AV z
4 A W0
U U5 I z
4
3E
y - U
U
S. S
'I~d SC
V SU0
pm.
S-- 3
I II.
1%,*
V
.1~
V
71

NAVAIRSYSCOM N00019-81-C-r098
An example of a diagnostic assessment display is the MI profile which is illustrated inFigure 7.0-9. The MI profile is basically a plot of the MI over the course of theengagement. MI values are shown along the y-axis, and engagement time is displayedacross the x-axis. Superimposed on the graph is weapon envelope information. In theexample presented in Figure 7.0-9, times are marked where the fighter maneuvered toget the adversary within his AIM-7F and AIM-91 missile envelopes. Simulated missilesfired during the TACTS/ACMI engagerment are Indicated near the bottom of the MIprofile.
During the engagement shown in Figure 7.0-9, the fighter started in a neutral position,proceeded to a slightly offensive position and then drifted to a defensive position. Asthe fighter maneuvered into an offensive position, the aircrew fired an AIM-7F missilewhich was scored as a no-kill. It is important to note that the fighter shot prior toentering the missile envelope. The fighter then began to lose his position advantage tothe adversary who subsequently fired a simulated missile and missed. The engagementended after the fighter obtained a position advantage a second time and successfullyfired a simulated AIM-9L missile inside the weapon envelope.
The MI profile provides a historical perspective of the fight- and would be a goodsource of diagnistic feedback to aircrews, particularly with respect to enveloperecognition performance. Summarizing MI profiles and plotting them over successivetraining days would show the aircrev's learning curve. An example of this type ofassessment output is illustrated in Figure 7.0-10. The learning curve could show whenairerew performance levels drop off due to extended layoffs. This information couldbe valuable to determine when to allocate training resotirces to maintain aircrews atpeak readiness levels. Interestingly enough, the learning curve could also be valuableto determine whf ch training methods or devices are actually working.
A final example of an output for use during the assessment phase of training isillustrated in Figure 7.0-11. This output reveals the aircrew performance for severalkey tasks identified in air-to-air combat. For each task, the aircrew average is shown.The individual's performance is then compared to established training standards, not toother aircrews. The percentage of a training standard accomplished reveels overalltraining strengths and weaknesses which might require additional training. A! -oughemphasis has been placed in this report on air-to-air missions, a summary out Ut, asillustrated in Figure 7.0-11, would be applicable to other missions s- *h asair-to-surface and electronic combat.
72

NAVAIRSYSCOM N00019-81-C-0098
za I z 0
o z w
0 0S
w
z 00 ILcU
LUU
wc
p..U.(I)6
a 0 0 0 0
X~a~l 3An3N0
73C

A
1~JAVAIRSYSCOM 1~OOO19-81-C-OO98
VAU)
[.2 a
0
S S
USCI
U
0 a Nci 801~ 6
S SCU
-~ I-w U
SO CU, 2
6ES
U I4.''
C UU
4' a'I,, C
S.2
nO C-~ z 0
Yv*
1~
I-0 S
L's
C'duJ ~g~. q
I I'C -
22000 0I I I
XIaNI UNAfl~NVfl a3ZW~II~infl9
74

NAVAIRSYSCOM N0OO19-81-C-OO98
Ow
0 0 .
(o
ca c
-C wOu~ 4
00LLE
j CC
LUU
>U
c 0
cc LUwa
cc 0 f c E z =
cc Ow 0 CLCL~~O~~ Ccx ZI C U4
u c 96w
cc Lic
U I
75
Awl..~
bid&~- ~- C fC ~- -.

NAVAIRSYSCOM N00019-81-C-0098
8.0 SUMMARY, CONCLUSIONS AND RECOMMENDATIONS
This report presents technical progress and results from a study contract performed byCubic Corporation for the Naval Air Systems Command. A primary objective forundertaking the research was to develop up-to-date algorithms for use in assessingaircrew performance during the maneuvering portion of the air-to-air combat engage-ment conducted within visual range. Another objective was to integrate availableenergy management metrics with output from the position advantage algorithms.
The report presents a rationale and framework for the development of performancemeasures. Requirements are outlined for assessing the validity and reliability ofperformance measures. Applications for the use of performance measures in anaircrew training environment are also described.
Prior to developing performance algorithms, a review and analysis was performed ofmeasurement models that have been developed for air-to-air combat over the past 10years. Strengths and weaknesses of each model are described. A major weakness ofthe position advantage models is that they do not adequately accommodate aircraftequipped with all-aspect weapons.
A major breakthrough in the study was the development of a maneuver index. The MIis designed to depict maneuvering performance of a fighter aircraft during vectoredair-to-air engagement as flown on TACTS/ACMI. The MI comprises three basiccomponents. An angular geometry component depicts the position advantage of thefighter relative to an adversary and is expressed in terms of direction angleparameters (AOT and ATA). The AGC computation method was adapted fromSimpson's (1976) performance index algorithm. The second component of the MI is theweapon range component. This component is essentially a distance measure expressedas deviation or error from the optimum range of a weapon envelope. The thirdcomponent of the MI is the scale factor which is included to set the origin and endpoints of the MI scale.
The report presents a historical perspective of energy metrics that have been used bydesign engineers over the years to compare aircraft performance. While pointcomparisons of aircraft performance such as maximum air speed, maximum altitude
'Vi and thrust-to-weight ratio were prevalent up through the 1960's, newer metrics arebecoming significant due to the improved maneuvering performance of aircraft. Thework by Skow and Hamilton (1984) is described which introduces metrics such as turn
*, agility, energy onset rate and barrel roll rate. Many of these metrics are new andhave not been fully tested. It is not known if the new metrics will be available orapplicable for use as aircrew training feedback. At this point it is recommended that
= ' simplified metrics such as specific energy or specific excess power be used inN conjunction with the MI.
The report describes the Energy Maneuverability Display which has been operating atTACTS/ACMI sites the past few years. The EMD is used primarily by Navy instructorswho use the display to evaluate tactics when aircraft are flown at the edge of theirperformance envelope. Unfortunately, the EMD appears to be used very little byaircrews during their daily training exercises. A possible reason for its lack of use
76
- ~ ~ _ - -.&.p 4 ~* ->,r . JA ' v7CAy%.___ __-___

NAVAIRSYSCOM N00019-81-C-0098
may be the display format which makes a difficult concept even more difficult tounderstand. Suggestions for improving the EMD format are provided.
Although the EMD could potentially be modified and improved, changes would be verydifficult to implement. The EMD has been maintained and updated by operators atdifferent field sites with a different version evolving at each site. This problem iscompounded by a lack of complete documentation. The EMD has been removed fromsome TACTS/ACMI sites because it is expensive in terms of computer memory
MI resources. To revise display formats and update the EMD, it may be necessary toreprogram the software, especially for new-generation systems (e.g. NAS Fallon)which have a different computer architecture.
Various display formats are recommended in the report to improve training feedbackfor aircrews. Unique displays aret designed for viewing during the practice andassessment phases of TACTS/ACMI training. During the practice phase, it isrecommended that the pilot cockpit view display be enhanced by the introduction ofvertical indicators which can be windowed. The indicators would show aircraftposition advantage information based upon the MI and a simplified energy metric suchas specific energy or its ctrivative. A display made possible by high-speed rastergraphics technology is the maneuver diagram. This type of graph shows actual aircraftflight paths with energy information color and texture coded on a ribbon which trailseach aircraft. Graphs recommended for assessment are based upon cumulativetraining data. They highlight aircrew learning curves and performance profiles. Dueto the historical nature of the data, assessment displays could be viewed at oft-linelocations, if desired.
It is recommended that a phased research effort be conducted to develop and test theMI, assess the reliability and validity of the metric and to evaluate user acceptanceand training utility. Initially, the MI algorithm should be coded to run on aTACTS/ACMI compatible computer. MI outputs could then be tested against engage-ments stored on TACTS/ACMI tapes. Ideally, performance during the maneuveringportion of the engagement as reflected by the MI should predict discrete engagementoutcomes. Next, the graphic display formats described above should be verified by aircombat subject matter experts and then developed to provide a proof of conceptdemonstration. The final pis.e cf the research effort for the air-to-air mission shouldfocus on assessing the validity and reliability of the MI in a training setting. Due to
N' requirements for large sample size, experimental control and repeatability ofconditions, validation of the training system should be conducted on a flight simula. r.TACTE/ACMI should then be used as a vehicle to test transfer of training from thesimulator to "real world" coneditions. Following validation, prototype development andtesting, the completed performance assessment system should be implemented onexisting TACTS/ACMI ranges and air combat training simulators. The authors believethat its implementation at that point would prove to be a considerable asset to
*, aircrews undergoing training, and would provide a useful training effectiveness testbed.
4 77

NAVAIRSYSCOM N00019-81-C-0098
k9.0 REFERENCES
Allen, M.J., and Yen, W.M. (1979). Introduction to measurement theory. Monterey,CA: Brooks - Cole Publishing Co.
American Psychological Association, American Educational Research Association, andNational Council on Measurement in Edu-cation. (1974). Standards foreducational and psychological tests. Washington, D.C.: American PsychologicalAssociation.
Baker, R.T., Mednick, B.R., and Brock, W. (1980). An application of causal modelingtechniques to prospective longitudinal data bases. Unpublished manuscript. LosAngeles: University of Southern California, Center for Interactional Research inHuman Development and Learning.
Benson, J., and Clark, F. (1982). A guide for instrument development and validation.*, American Journal for Occupational Therapy, 36, 12, 789-800.
INN Bittner, Jr., A.C., Carter, R.C., Kennedy, R.S., Harbeson, M.M., and Krause, M.(1984). Performance evaluation tests for environmental research (PETER): thegood, bad and ugly. In Proceedings of the Human Factors Society 28th AnnualMeeting. Santa Monica, CA: Human Factors Society.
Blaiwes, A.S, Puig, J.A., and Regan, J.J. (1973). Transfer of training and themeasurement of training effectiveness. Human Factors, 15, 6, 523-533.
Bloom, B. (Ed.) (1972). Taxonomy of educational objectives: The classification ofeducational goals, Handbook I: Cognitive domain. New York: David McKay.
Burden, R.L., Faires, J.D., and Reynolds, A.C. (1981). Numerical analysis (2nd ed.).Boston: PWS Publishers.
Campbell, D.T., and Fiske, D.W. (1959). Convergent and discriminant validation by themultitrait-multimethod matrix. Psychological Bulletin, 56, 81-105.
Ciavarelli, A.P. (1982). Methodology to assess in-flight performance for air-to-aircombat training. In Proceedings of the 4th Interservice/Industry TrainingEquipment Conference: Volume I. Washington. D.C.: National Security IndustrialAssociation.
Ciavarelli, A.P., Pettigrew, K.W., and Brictson, C.A. (1981a). Development of a
computer-based air combat maneuvering range debrief system(NAVTRAEQUIPCEN 78-C-0136-1). Orlando: Naval Training Equipment Center.
Ciavarelli, A.P., Williams, A.M., and Pettigrew, K.W. (1981b). Performance
assessment and appraisal system (PAAS) (NAVTRAEQUIPCEN 80-D-0011-1).Orlando: Naval Training Equipment Center.
. Cronbach, L.J. (1971). Test validation. In R.L. Thorndike (Ed.), Educationalmeasurement (2nd ed.). Washington, D.C.: American Council on Education.
Cronbach, L.J., and Meehl, P.E. (1955). Construct validity in psychological tests.Psycholoikical Bulletin, 92, 281-302.
78

I I - .&A-. & 1 4 .k *t *•%_.'* . - .-
NAVAIRSYSCOM N00019-81-C-0098
REFERENCES (Continued)
Ebel, R. (1979). Essentials of educational measurement (3rd ed.). Englewood Cliffs,NJ: Prentice-Hall.
Fitzpatrick, A.R. (1983). The meaning of content validity. Applied PsychologicalMeasurement, 7, 1, 3-13.
Fleishman, E.A. (1967). Performance assessment based on an empirically derived tasktaxonomy. Human Factors, 6, 349-366.
Gagne, R.M., and Briggs, L.J. (1979). Principles of instructional design (2nd ed.) .New York: Holt, Rinehart and Winston.
Glaser, R., and Klaus, D.J. (1971). Criterion referenced measurement. In M.D. Merrill(Ed.), Instructional design readings. Englewood Cliffs, NJ: Prentice-Hall.
Gronlund, N.E. (1976). Measurement and evaluation in teaching (4th ed.). New York:
Macmillan Publishing Co., Inc.
Gunston, B., and Spick, M. (1983). Modern air combat. New York: Crescent Books.
Harrow, A. (1972). Taxonomy of psychomotor domain. New York: David McKay.
Hocevar-Page, S., and Hocevar, D. (1982). Use of confirmatory factor analysis inevaluating factorial validity. Paper presented at the conference of the Academyof Management.
Jones, M.1., Kennedy, R.S, and Bittner, Jr., A.C. (1981). A video game forperformance testing. American Journal of Psychology, 94, 1, 143-152.
Krathwohl, D., Bloom, B., and Bertram, M. (1972). Taxonomy of educationalobiectives: The classification of educational goals, Handbook lh. Affectivedomain. New York: David McKay.
Kress, G., and Breidenbach, S.T. (1983). A performance assessment and appraisalsystem for air combat training. Orlando: Naval Training Equipment Center.
Livingston, S.A. (1971a). A classical test-theory of criterion-referenced measures.Paper presented at the annual meeting of the American Educational Research
Association.
Livingston, S.A. (1971b). The reliability of criterion-referenced measures. Paperpresented at the annual meeting of the American Educational ResearchAssociation.
Lovett, H.T. (1977). Criterion-referenced reliability estimated by ANOVA.Educational and Psychological Measurement, 37, 21-29.
Martin, T., Luter, M., Caddy, M., and Mueller, W. (1984, September). A review of aircombat maneuvering performance presentations (Update 1) (NADC-84043-60).Washingtan, D.C.: Department of the Navy, Naval Air Systems Command.
79

NAVAIRSYSCOM N00019-81-C-0098
REFERENCES (Continued)
McGuinness, J., Forbes, J.M., and Rhoads, J.E. (1983, September). Design of an aircombat maneuvering performance measurement system for the simulator for air-to-air combat and the air combat maneuvering instrumentation range.Alexandria, VA: Person - System Integration, Ltd.
Mehrens, W., and Lehman, L. (1973). Measurement and evaluation in education andpsychology (2nd ed.). New York: Holt, Rinehart and Winston.
Merrill, M.D. (1972). Psychomotor taxonomies, classifications and instructionaltheory. In R.N- Singer (Ed.), The s2,chomotor domain: movement behavior.Philadelphia: Le- qnd Fabinger.
Messick, S. (197'). The standard problem: Meaning and values in measurement andevaij,'ica. Amierican Psychologist, 30, 955-966.
Nunnally, J.C. (1975). Psychometric theory - 25 years ago and now. EducationalResearcher, 4, 10, 7-20.
Oberle, R.A. (1974, November). An air combat maneuver conversion model (ReportCRC 274). Washington, D.C.: Office of Naval Research.
Oberle, R.A. (1983, May). Air combat evaluation: The reduced dimension measures(RES 83-6-2). Orlando: Naval Training Equipment Center.
Pedhazur, E.J. (1982). Multiple regression in behavioral research: Explanation andprediction (2nd ed.). New York: Holt, Rinehart and Winston.
RI- IPopham, W.J. (1978). Criterion-referenced measurement. Englewood Cliffs, NJ:Prentice-Hall.
Pruitt, V.R. (1979, April). Energy management training aid for the Navy's air comba.maneuvering range (ACMR) (Contract N00123-78-C-1371). St. Louis: McDonnell
. Aircraft Co.
Pruitt, V.R., Moroney, W.F., and Lau, C. (1980, August). Energy maneuverabilitydisplay for the air combat maneuvering range/tactical training system(ACMR/TACTS). Pensacola, FL: Naval Aerospace Medical ResearchLaboratory.
Robinson, J.C., Drinnon, D.D., Eubanks, J.L. and Eddowes, E.E. (1981, April).Evaluation of pilot air combat maneuvering performance changes during TACaces training. Nellis AFB, NV: Tactical Air Command, Tactical Fighter WeaponsCenter.
Roscoe, S.N. (Ed.) (1980). Aviation psychology. Ames: The Iowa State UiniversityPress.
Simpson, W.R. (1976, July). Development of a time-variant figure of merit for use inanalysis of air combat maneuvering engagements (TM 76-1 SA). Patuxent River,MD: Naval Air Test Center.
80

NAVAIRSYSCOM N00019-81-C-0098
REFERENCES (Continued)
Simpson, W.R., and Oberle, R.A. (1977, June). The numerical analysis c air combatengagements dominated by maneuvering performance (TM 77-2 SA). iatuxentRiver, MD: Naval Air Test Center.
Skow, A.M., and Hamilton, W.L. (1984, September). Advanced fighter agility metrics(TR 84-05). Torrance, CA: Eidetics International.
Swezey, R.W. (1978). Aspects of criterion - referenced measurement in performanceevaluation. Human Factors, 2. 2, 169-178.
.5 Tenopyr, M.L. (1975). Content - construct confusion. Personnel Psycholog-, 30,677-680.
Vreuls, D., and Wooldridge, L. (1977). Aircrew performance measurement. In J. Popeand D. Meister (Eds.), Proceedings of symposium on productivity enhancementand personnel assessment in Navy systems. San Diego: Navy Personnel Research
*and Development Center.
Weiss, D.J., and Davison, M.L. (1981). Test theory and methods. Annual Review ofPsychology, 32, 629-658.
:.4 Wooldridge, L., Kelly, M.J., Obermayer, R.W., Vreuls, D., Nelson, W.H., and Norman,D.A. (1982, October). Air combat maneuvering performance measurement statespace analysis (NAVTRAEQUIPCEN III-342/AFHRL-TR-82-15). Brooks AFB, TX:HQ Air Force Human Resources Laboratory.
4.
18

NAVAIRSYSCOM N00019-81-C-0098
APPENDIX A
TACTS/ACMI DESCRIPTION
Aw
N~82

NAVAIRSYSCOM N00019-81-C-0098
APPENDIX ATACTS/ACMI DESCRIPTION
The Navy's TACTS enables airerews to monitor various air combat exercises in realtime. Through its replay capability, TACTS permits debrief and evaluation of pilottactics, maneuvers and weapon delivery accuracy. (The U.S. Air Force second-generation version of this system is referred to as Air Combat Maneuvering Instrumen-tation (ACMI).) Four major subsystems comprise the TACTS/ACMI System:
o Airborne Instrumentation Subsystem (AIS) - A pod attached to theaircraft which measures flight dynamics information, senses weaponfiring signals, and transmits data to the ground through the TrackingInstrumentation Subsystem (TIS).
o Tracking Instrumentation Subsystem (TIS) - A series of unmannedremote tracking stations communicating with a master trackingstation to monitor AIS-equipped aircraft in a specified airspace.
0 Control and Computation Subsystem (CCS) - Converts data receivedfrom the TIS into suitable form for display.
o Display and Debriefing Subsystem (DDS) - Serves as a control centerend display station.
6, Figures A-I and A-2 illustrate the major TACTS/ACMI subsystems and their inter-relationships. Some of the more important training features of TACTS/ACMI follow.
0 Real-time tracking including position, velocity, acceleration, atti-tude, and angular rate measurement of aircraft engaged in aircombat training
o Tape playback of flight history data, complete with pictorial displayof the air-to-air engagement and voice transmissions
S Both digital and graphic hard-copy printouts of flight data, aircraftstate vector, cockpit view of engaged aircraft, and mission summarydata
o Computer-generated results of weapon firing.
In addition to air-to-air combat training capabilities of TACTS, engineering upgradeshave been made to provide ground attack training missions. Some of these capabilitiesinclude No-Drop Bomb Scoring, electronic warfare, and No-Drop Mine Laying. Thus,TACTS has evolved into a multi-mission range instrumentation system capable ofproviding training across the entire spectrum of air warfare activities.
83

NAVAIRSYSCOM N00019-S1-C-0098
AIS Airborne Instrumentation Subsystem _____
0 Transmission Unk
TI8 Tracking Instrumentation Subsystem U
* One Master Station* Seven Interrogator Stations
CCS Control and Computation Subsystem -
$ S Aircraft Stats Vector0Weapon Trajectory Simulation
DDB Display £ Debriefing Subsystem
* Graphica and Alphanumerics DisplaysAK C Lve and Replay Capability
* Pmjectlcn Large Screen Displays
Figure A-I Tactical Aircrew Combat Training Sysem flACTS)
I INSTIUMENT1ATION
(POD)
DISLAY A n
CONTROL& TACIN
CMUAINfUETTO-NSEQSUSYTE SUBSYSTEMTE
INTERROGATOR
itVMASTER \t=jSTATION
Figure A-2 General Configuration of TACTS Subsystems
84

NAVAIRSYSCOM N00019-B1-C-0098
APPENDIX B
, GLOSSARY OF MIR COMBAT TERMS
A
.1
N,.'V
V
'9
"48
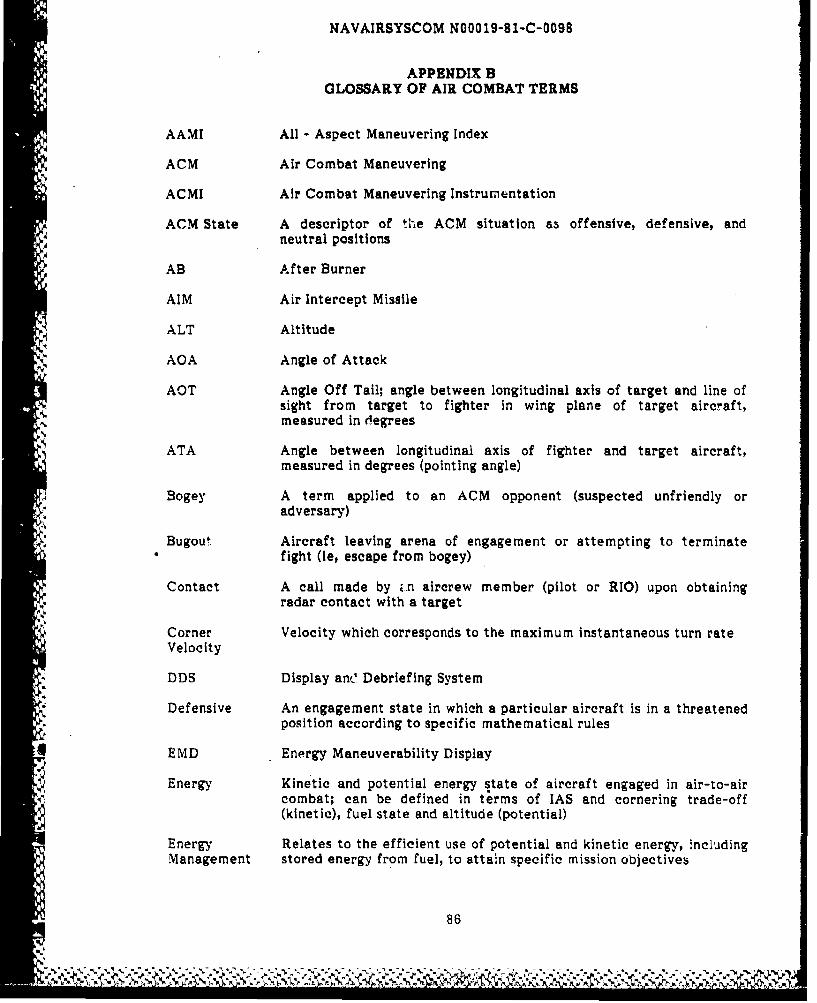
NAVAIRSYSCOM N00019-B1-C-0098
APPENDIX BGLOSSARY OF AIR COMBAT TERMS
AAMI All - Aspect Maneuvering Index
ACM Air Combat Maneuvering
ACMI Air Combat Maneuvering Instrumentation
ACM State A descriptor of the ACM situation as offensive, defensive, andA neutral positions
AB After Burner
AIM Air Intercept Missile
ALT Altitude
AOA Angle of Attack
AOT Angle Off Tail; angle between longitudinal axis of target and line ofsight from target to fighter in wing plane of target aircraft,measured in degrees
ATA Angle between longitudinal axis of fighter and target aircraft,measured in degrees (pointing angle)
4 Bogey A term applied to an ACM opponent (suspected unfriendly oradversary)
Bugout Aircraft leaving arena of engagement or attempting to terminatefight (ie, escape from bogey)
Contact A call made by i.n aircrew member (pilot or RIO) upon obtainingradar contact with a target
Corner Velocity which corresponds to the maximum instantaneous turn rate
Velocity
DDS Display ant' Debriefing System
Defensive An engagement state in which a particular aircraft is in a threatenedposition according to specific mathematical rules
EMD Energy Maneuverability Display
Energy Kinetic and potential energy state of aircraft engaged in air-to-aircombat; can be defined in terms of IAS and cornering trade-off(kinetic), fuel state and altitude (potential)
Energy Relates to the efficient use of potential and kinetic energy, includingManagement stored energy from fuel, to attain specific mission objectives
86
.#
. . . . . .. -V . . . . . . . - - ". .. .. . . . . . . .. i ..

NAVAIRSYSCOM N00019-81-C-0098
APPENDIX B (Continued)GLOSSARY OF AIR COMBAT TERMS
Energy Capability of aircraft under dynamic flight conditions to perform a
Maneuverability change or combination of changes In direction, altitude, and airspeed,expressed In terms of energy and energy rate
Energy Onset A Ps/Az; the increment in specific excess power between theRate maximum power, minimum drag configuration and the minimum
wpower, maximum drag configuration divided by the time to go fromminimum to maximum power and from maximum to minimum drag
Engaged A fighter whose primary responsibility is to kill or control bogey. ItFighter should be in an offensive position
Envelope Weapon boundary limits within which a missile or guns should befired. An envelope is defined in terms of distance (range) and anglesoff tail (degrees) between shooter aircraft and target
E Specific Energy; sum of potential and kinetic energies divided byaircraft gross weight
Fox 1 Call made by aircrew member (usually pilot) indicating that aSparrow (AIM 7) missile has been fired
Fox 2 Call made by pilot indicating that a Sidewinder (AIM 9) has been fired
G A unit of force acting on a body being accelerated; unit is equal tothe gravitational force applied to the object at the earth's surface (eg3G's = 3 times the object's weight)
g Normal Acceleration; measured in units of g = 322 ft/sec2
GCI Ground Control Intercept
LAS Indicated Airspeed; airspeed for aircraft measured in knots
Lock-on Electronically locking the radar system on a particular target
I" Mach Number Ratio of the speed of an object to the speed of sound in the.V surrounding atmosphere
MC Model Model for estimaticn of position advantage using a semi-Markovprocess
Neutral An engagement state in which a particular aircraft is in neither anadvantaged or disadvantaged state, according to specific mathemati-cal rules
n W Wind axis load factor; n W sum of force normal to wind axis dividedby gross weight
87
"Pt b~{P r~hA - .7;.'&-.~ ~A . 7X.. rc

NAVAIRSYSCOM N00019-81-C-0098
iAPPENDIX B (Continued)GLOSSARY OF AIR COMBAT TERMS
Offensive An engagement state in which a particular aircraft is threatening anopponent (see above defensive, neutral)
lv1 An engagement involving one friendly versus (v) one bogey aircraft
Pi Performance Index; a metric for position advantage based on theproduct of continuous functions of AOT, ATA, Range and closingvelocity
Placard Limit Maximum velocity of an aircraft in level flight
PMI Performance Measurement Index
- PS Specific Exces Power, change in the sum of kinetic plus potentialenergy divided by time (first derivative of ES)
Range or R Distance in feet or nautical miles (nm) between fighter and aircraft
RIO Radar Intercept Officer
RTO Range Training Officer
SEAM Sidewinder Extended Acquisition Mode
Section Two aircraft that fight as coordinated unit in an air-to-air engage-meint
TACTS Tactical Aircrew Combat Training System
Tally Ho A call made by an aircrew member upon obtaining visual contact witha target
Turn Agility Turn rate divided by the time required for a complete bank anglechange of 90 degrees at that turn rate
Turn Rate Ability of aircraft to turn expressed in degrees of arc per second
2v1 An air-to-air engagement involving two friendly aircraft versus (v). one bogey aircraft
2v2 An air-to-air engagement involving two friendly aircraft versus (v)two bogey aircraft
UHF Ultra High Frequency communication channel for radio transmissionhYP: between aircraft
Vc Closing Velocity, positive or negative, between fighter and targetaircraft, measured in knots
VTAS Visual Target Acquisition System (helmet mounted gunsight used toslave and point weapon seeker)
88
ft4G _* AN ~'

NAVAIRSYSCOM N00019-81-C-0098
APPENDIX BW(Continued)GLOSSARY OF AIR COMBAT TERMS
Wingman Second aircraft in flight section; also referred to as "wingy"; see
definition for "Section"
89