lr the Et,e C)pUonsY - World Bank Documents
248
lr the Et,e C)pUonsY J~ oint ReL,edl of :3RL)Df( i!U -4 .. .. .. . 7etebr18 R'It Public Disclosure Authorized Public Disclosure Authorized Public Disclosure Authorized Public Disclosure Authorized Public Disclosure Authorized Public Disclosure Authorized Public Disclosure Authorized Public Disclosure Authorized
-
Upload
khangminh22 -
Category
Documents
-
view
0 -
download
0
Transcript of lr the Et,e C)pUonsY - World Bank Documents

lr the Et,e C)pUonsYJ~ oint ReL,edl of :3RL)Df( i!U
-4 .. . . .. .
7etebr18
R'It
Pub
lic D
iscl
osur
e A
utho
rized
Pub
lic D
iscl
osur
e A
utho
rized
Pub
lic D
iscl
osur
e A
utho
rized
Pub
lic D
iscl
osur
e A
utho
rized
Pub
lic D
iscl
osur
e A
utho
rized
Pub
lic D
iscl
osur
e A
utho
rized
Pub
lic D
iscl
osur
e A
utho
rized
Pub
lic D
iscl
osur
e A
utho
rized

JOINT JNDP/WORLD BANK ENERGY SECTOR ASSESSENT PROGRAMREPORTS ALREADY ISSD
Countrv Date Number
Indoones ia November 1981 3543-INDMauritius December 1981 3510-MASKenya May 1982 3800-KESri Lanka May 1982 3792-CEZimbabwe June 1982 3765-ZIMHaiti June 1982 3672-HAPapua New Guinea June 1982 3882-PNGBurundi June 1982 3778-BURwanda June 1982 3779-RWMalawi Augulst 1982 3903-MALBangladesh October 1982 3873-BDZambia January 1983 4110-ZAT urkey March 1983 3877-nUBolivia April 1983 4213-BOFj i June 198; 4462-FIJSolomnon Islands J une 1983 4404SaLSenegal July 1983 4182-SESxudan July; 1983 4511-SUUiganda Tu1y 1Q83 4453-UGNigeria August 1983 44C0-UNI:NepaI sAugust 1983 4474-NEP
Gam.bia Novem;ber 1983 47e43-CMPeru January 1954 4677-PECost; Rica .Januarv 1°P,6 4655-CRLesotho Januarv 1984 467b-LSOSvycbelles Janluary 1984 4693-SEYMorocco March 1984 4157-MORPortugal April J984 4F824-PONiger May 1984 4642-NIREthIopIa .iuiv 1984 4741-ETCaape Verde Au5pst 198- 5ii73-CV(;Gi nea scan Auiust. I 9 R . 5083-GUBTit) swa na S eptembme r 1984 4998-BTSt. V-ncetTi XH ad
the G.reiladine'tS Sep tcz:'ber 518, R0>5ThSt . Lucla Septenber 194p 511 1-SM.UPar;aguay (i'rtolxr I.A. 7 1 5145-PATanz.ni' a N.vcibt'. 1984 4969-TAYemen Ar-h RA p:h - *- -e T Imb r 198 4892-YARLihe?r;a !h'cexrbr-r iQ%!a 5279-E.RRIslamic fe-nuhiW -
Mau rit ant A;ril 198N52 24-%IALIanT.. a 1cCaAupr! I I j9 54'66-JMlvory Coast AprIl 198 525" -iVC
Benln J.une 1ne 5 522-SLNTog o June 198 5 221-TO
Var';a: 1 une P85i I5 5.-VATonga ue i . S t ,-8-TaN
Wesi.*rn Sanrn Ae .. a 'i 4-WSi)
Buria Junes i9a:n 54!6-BA

FOR OFFICIAL USE ONLY
Report No. 5793-TH
THAILAND
ISSUES AND OPTIONS IN THE ENERGY SECTOR
SEPTEMBER 1985
This is one of a series of reports of the Joint UNDP/World Bank EnergySector Assessment Program. Finance for this work has been provided, inpart, by the UNDP Energy Account, and the work has been carried out by anassessment team from the World Bank in association with the NationalEconomic and Social Development Board (NESDB) of Thailand. In addition,the Canadian International Development Agency (CIDA) provided concurrentindirect support to the assessment team chrough the funding of an energypolicy adviser to the NESDB. This report has a restricted distribution.Its contents may not be disclosed without authorization from theGovernment, the UNDP or the World Bank.
ABSTRACT
An effective energy development program is well within the capacity ofthe government of Thailand if it is carried out efficiently incooperation with the private sector. The strategy proposed in thisreport recommends an expanded role for the private sector not only in theexploration and production of energy but also in its transportation,refining and marketing. To bring this about, the regulatory processgoverning private involvement in energy activities will need to beimproved and a pricing system established that more accurately reflectsthe opportunity costs of energy resources. In addition, the reportrecommends (a) expanding the uses for natural gas; (b) formulating aprogram to expand exploration and development of lignite for power,industry and domestic uses; (c) increasing electricity tariffs to augmentinternal cash generation at the utilities; (d) deregulating petroleumproduct prices to allow them to adjust more freely to changes ininternational prices and the value of the Baht; (e) making institutionalreforms to clarify responsibilities and improve long-term planning in thepublic sector; and (f) formulating new policies to ensure adequate ruralenergy supplies of both traditional and commercial fuels at competitiveand economic prices.

ABBREVIATIONS AND ACRONYMS
BMTA Bangkok Mass Transit AuthorityDED Defense Energy DepartmentDMR Department of Mineral ResourcesEGAT Electricity Generating Authority of ThailandE&P Exploration and ProductionICB International Competitive BiddingIOC International Oil CompaniesLPG Liquefied Petroleum GasMEA Metropolitan Electricity AuthorityNEA National Energy AdministrationNESDB National Economic and Social Development BoardOMO Oil Marketing Operations (PTT)ONG Natural Gas Operations Unit (PTT)PEA Provincial Electricity AuthorityPTT Petroleum Authority of ThailandRTG Royal Thai GovernmentSRT State Railways of ThailandTP Texas Pacific Oil Company

CURRENCY EQUIVALENTS(As of December 1984)
l Baht = US$0.03727 Baht = US$1.00
FISCAL YEAROctober 1 to September 30
WEIGHTS AND MEASURES
bbl Barrels (approximately 6.6 barrels per tonne fuel oil)bpd Barrels per day 9Bcf Billion cubic feet (l0 }BTU British Thermal Unit - a unit of heat equal
to 0.25 k caloriescif Cost, insurance and freightmm 1Millionmmbbl Million BarrelsMW MegawattsMMCFD MiLlion cubic feet per flytcf Trillion cubic feet (10 )toe Tonnes oil equivalent (10.415 x 10⁶ kcals)km kilometers

TABLE OF CONTENTS
Page No.
I. Overview and Reco mmendations 1......................
II. An Energy Perspective for Sixth Plan Period ....... 22
III. Energy Resources - Lignite, Hydro, Biomass ........ 32
IV. Energy Resources - Oil and Gas .................... 52
V. Power Sector .. 74
VI. Petroleum Product Demand, Supply and Pricing ..... 106
VII. Natural Gas Demand, Supply, and Pricing . ...... 146
VIII. Rural Energy Sector ............................... 156
IX. Potential for An Energy Efficiency ImprovementProgram .......................................... 179
X. Sixth Plan Investmer.t Priorities .................. 200
ANNEXES
1. Energy Balances in Original Units, 1983 ............... 2152. Energy Balance, 1983 .2163. Extension of the Siam 2 Model .2174. Thailand: Assumptions on Gas and Condensate
Productivity ......................................... 2215. Natural Gas, Condensate and Crude Oil PotentiaL
Production Capabilities Still to be Contracted asof April 1985 ........................................ 222
6. Petroleum Product Demand, Refinery Production andImports , 1970-84 .................................... 223
7. Sectoral Consumption of Petroleum Products,1971-1983..224
8. Operating Performance of Thailand's Refineries, 1983 2259. Product Yield and Production in 1990 from the three
Local Refineries ..................................... 22610. Determination of Gas Equivalent Values of Alternative
Fuels Used as Base Load in the Power System .22711. Support Activities for Fuelwood Program .228
MAPS
IBRD 19199: Thailand PortsIBRD 19200: Provincial Electricity AuthorityIBRD 19201: Electricity Generating Authority of Thailand

PREFACE
This report is one in the series undertaken by the Joint UNDP/World BankEnergy Assessment Program. To carry out this work on Thailand, a jointenergy assessment team was established between the World Bank and theNational Economic and Social Development Board (NESDB) of Thailand. Theteam executed its work through a series of missions in Thailand between1983-1985 and a wrap-up mission in Washington, D.C. The team also,through three working groups (related to energy supply and demand),undertook an extensive evaluation of the Thai energy sector with thespecific objective of providing support to the formulation of the energystrategy being developed for Thailand's 6th Five Year Plan (1987-91).Members of the working groups were drawn from the private sector, theThai government and state enterprises, plus NESDB's advisors financed byCIDA World Bank staff and its consultants financed under the UNDP/IWorldBank Energy Assessment Program met on a number of occasions with thesegroups to discuss specially prepared working papers.
The following persons formed the World Bank Team at various points intime during the course of this study: Robert Sadove (Team Leader),Trevor Byer, John Tillman, Gary Gaskin, L. Wijetilleke, E. Deffern,T. Fitzgerald, CoLin Warren, Ms. Swee-Kheng Koh, J. Boroumand, D.K.Kumar, Y. Albouy, Ms. Helena Ribe, Ernesto Terredo, Fred Temple, and D.Fallen-Bailey.
The NESDB team consisted of Dr. Phisit Pakkasem (Team Leader and DeputySecretary-General of the NESDB), Anuparb Sunananta (Director,Infrastructure Projects Div.), Piromsakdi Laparojkit (Chief, EnergyPlanning Section), Piyasvasti Amranand (Chief, Technical PlanningSection), Praipol Koomsup (Associate Prof. of Economics, ThammasatUniv.).
The team also was supported by Canadian energy consultants providedthrough the NESDB and fiaanced by CIDA. These were: Peter Eglington(Chairman, Ottawa Energy Group Ltd.), John Foster (President, EDPRAConsulting Inc.) and Susan Bogach (President, Bogach Associates Ltd.).
The report was written by Robert Sadove and Trevor Byer with contribu-tions made by John TilLman and D. Fallen-Bailey. The report was editedby Maryellen Buchanan.

[. OVERVIEW AND RECOMMENDATIONS
Introduction
1.1 This report outlines the key issues and options to be addressedin formulating a five-year energy strategy for Thailand and therecommended policies and investment program to implement that strategy.
1.2 Over the last two decades, Thailand has k-een almost totallydependent on imported petroleum for its primarv energy requirements. In1980, imported petroleum accounted for about 70% of the country's totalenergy needs: hydro providing 3%; coal/lignite, 3%; fuelwood andcharcoal, 11%, and bagasse, 72. The availability of increasingquantities of natural gas since 1981, as well as the rise in the use oflignite in the power and cement sectors, is already having a majorstructural impact on the energy supply mix and use patterns in thecountry. Natural gas use has already lowered the share of orimary energysupplied by petroleum from 82% in 1970 to some 56% in 1983. Thisdeclining trend should continue over the short to medium term as gas andlignite production increase during the rest of this decade. Despite thisprogress, however, the bill associated with importing some 210,000bbls/day of petroleum amounted in 1984 to some US$2.5 billion and remainsa significant drain on the economy given that it absorbed over one-thirdof the country's export earnings. In this context, the economy ofThailand has reached the point where an economically sound energy programover the five-year period 1987-91 will be essential to maintain higheconomic growth rates. This implies continued development of domesticenergy resources and expansion of production policies that would ensurethe efficient exploitation and use of energy resources. This reportproposes policy changes that would make Thailand's economy more efficientand less dependent on imports of energy than under present policies.
1.3 Energy demand for the next five to seven years is projected togrow at about the same rate as CDP (5-6% p.a.), this growth is dependenton a continuation of the current structural adjustment program whichencompasses suitable exchange rate policies, promotion of exports,increased domestic energy production, a realignment and reform ofdomestic energy prices, and reasonable stability in international fuelprices. With appropriate policies, the share of imports in overallenergy consumption couLd decline from 54% in 1982 to 33% in 1991.However, any failure to sustain exploration and development for gas, oiland lignite thereafter could create a need for imported energy again tosupply almost 60% of domestic demand, causing a deterioration in thebalance of payments and slowing economic growth in the second half of the1990s.
1.4 An effective energy development program is well within thecapacity of the Government of Thailand, if it is carried out effectivelyin cooperation with the private sector. As far as the public sector is

concerned, certain institutional reforms are desirable. Among thenumerous agencies and departments responsible for various phases of thegovernment's energy activities, there is a compelling need to clarifyresponsibilities, eliminate overlapping juriidictions, improve long-termplanning and coordination and establish improved procedures for settingoverall sector policies. While most agencies require some strengtheningand efficiency improvement, especially on the planning side, none is abottleneck for implementation of the policies and investment programsbeing proposed.
1.5 The strategy proposed in this assessment report will require allincreased role for the private sector, both local and foreign, in theexploration, production, transportation, refining and marketing ofenergy. To stimulate such an expansion of the private sector role, thereport discusses the following steps in detail:
(a) establishment by government of policy guidelines concerning theareas where increased private sector participation is desired;
(b) improvement of government's private sector regulatorymechanisms; and
(c) deregulation of energy prices.
1.6 Emphasis is placed on the adequacy of incentives to fosterprivate sector investment in the desired areas by modifying relevantpolicies including royalties, taxes, prices, leasing arrangements, andthe legal requirements for establishIng joint ventures. Expandedexploration and development of oil, gas and lignite can be encouragedonly if greater incentives for the private sector and a more effectiveregulatory process are established. Better energy demand management inthe form of appropriate pricing and proper fuel selection measures alsocan help in this process; these studies are discussed in specificchapters of the report.
1.7 Essential components of the strategy that needs to beformulated for discussion purposes include:
(a) developing more natural gas by attracting additional privatesector participants, improving the regulatory process andestablishing a pricing system that more closely reflectsopportunity costs;
(b) expanding the uses for natural gas;
(c) formulating program to expand expLoration and development ofboth low quality lignite for power and high quality lignite forindustry and domestic use;
(d) increasing electric power tariffs to augment the utilities'internal cash generation; focusing on the expansion program for

the next five to ten years in a flexible manner which is moredirectly related to indigenous resource development programs;
(e) continuing to base the choice of imported petroleum productsversus domestic refining on competitive pricing whileencouraging private sector investment in any refinery expansionthat may be needed at the end of the decade;
(f) deregulating petroleum product prices, thereby ensuring moreautomatic adjustment of these prices at both the retail and ex-refinery levels as international prices or the value of theBaht undergo change. As a means of achieving this, theelimination of the Oil Stabilization Fund is desirable;
(g) encouraging the more efficient use of the major transport fuels(diesel, gasoline and LPG) by modifying the structure ofpetroleum product prices at the retail level should be modifiedto reflect more closely that at the border price level; and
(h) formulating new policies and programs to ensure adequate ruralenergy supplies by improving the supply and efficiency of usingtraditional fuels while also more effectively providing ruralconsumers with access to commercial fuels at competitive andeconomic prices.
Resources, Institutional Background and Planning
Resources
1.8 In practice it should be possible to increase domestic energyproduction in a way to sustain economic growth over the next two to threedecades. Thailand has a somewhat diversified e- gy resource base,consisting of lignite, hydropower, natural gas, and limited quantities ofoil and natural gas liquids. The rural sector still has access tosubstantial forest resources, although the future of these resources isthreatened by continuing rural population increases and pressures todevelop agricuLtural holdings. The lignite potential, although clearlysubstantial, so far appears to be of average quality and competitive incost. Hydro resources are substantial, but most are located in borderrivers and are not likely to be developed before the end of thecentury. Thailand has a substantial potential for oil and gas; some 180million barrels of liquids (crude oil and condensate) and 12,900 billioncubic feet of gas already have been identified to date, out of anultimate recoverable reserve (URR) estimated at 1,100 million barrels ofliquids and 19,000 billion cubic feet of gas. The task of the futuretherefore is to develop these resources quickly, economically andefficiently so that they can provide an adequate energy base for arapidly growing modern economy.

-4-
Institutions and Planning
1.9 Energy sector institutions in Thailand appear to functionadequately in terms of agency-by-agency operations, maintenance andimplementation of projects. However, there is some lack of coordinationamong sector agencies and some areas of overlapping responsibilities.Except for the five-year planning exercise, long-term plans forindividual agencies are seldom coordinated, and in many subsectors no oneagency has been designated to have overall planning responsibility.
1.10 Although energy institutions can and should be strengthened,they are not the bottleneck which would hold up an expanded energyprogram. The greatest need is to make them more efficient in planningfuture programs in a more integrated manner. In oil and gas, thePetroleum Authority of Thailand (PTT) is the dominant public sector bodysince it is respcnsible for transporting, processing, purchasing andselling natural gas, but the Department of Mineral Resources (DMR) hasresponsibility for regulating the oil and gas licensing, exploration andproduction industry. Its long-term plans are rareLy made in coordinationwith those prepared for the rest of the energy sector except when theFive Year Plan is under preparation.
1.11 In the case of electricity, somewhat better coordination isachieved amongst the three agencies -- EGAT (responsible for mostgeneration and transmission facilities), MEA (for distribution in theBangkok area) and PEA throughout the rest of the country. For example,despite the involvement of seven government agencies/committees indecision-making on power sector issues, a reasonably good degree of co-ordiniation is achieved within the sector. These agencies/committeesare: the Committee for Power Policy and Development; the Budget Bureau;the Tariff Rate Committee; NESDB; the Ministry of Finance; NEA; and theNational Debt Committee. These agencies review a large number of issuesfrom tariffs to capital project proposals, budgets for submission to theCouncil of Ministers, annual financial performance, and requests forgovernment equity and loans. Though none of these bodies has overallpolicy responsibility for power sector issues, decisions are made to agreat extent by the agencies and the three utilities reaching aconcensus.
1.12 Energy sector policy and planning functions involve theCabinet, the National Economic and Social Develop;.dent Board (NESDB) --which is under the Office of the Prime Minister -- and NEA. From anadministrative standpoint EGAT reports to the Prime Minister's Office,PTT and DMR to the Ministry of Industry, while NEA is under the Ministryof Science, Technology and Energy. Despite this, the energy system worksreasonably well in terms of implementing projects, as well as operationsand maintenance. Its main weakness is at the overall energy sectorpolicy and planning level, while at the sub-sectoral level thesecapabilities are much stronger. Sound investment reviews take place inan integrated way on an annual basis, but the one-year horizons forinvestment review appear too short for overall sectoral planning

purposes, particularly in a period when financial and technicalconstraints have become so severe. Effective energy sector planning andstrengthened program coordination within the sector also need to focus onthe role of the private sector. There clearly is room for an expandedprivate sector role in the exploration, production, transport, refiningand marketing of energy in Thailand, and to some extent in electric powergeneration and lignite mining. The private sector's involvement isalready strong in the petroleum industry, particularly in oil and gasexploration and production, the import and distribution of oil products,and to a lesser extent, in refining. The private sector has begun toplay an increasing role in lignite mining, which is dominated by EGAT'soperation of large captive mines of low quality lignite for power use.The private sector also plays a dominant role in the small sL le miningof high quality lignite for industrial use as well as in overburdenremoval at EGAT's Mae Koh mining on a subcontractor basis.
1.13 Opportunities for expanding private participation in energydevelopment and associated changes in state energy roles must beapproached carefully so that clear guidelines are formulated to encouragea gradual integracion of private activity without unduly disruptingexisting patterns of operation. In this process there is a need for theprivate sector to appraise government more of its views andperspectives. There also is a need to strengthen government machinery inregulating private sector activities in the energy sector and improvecoordination between public and private sector activities.
1.14 Possible changes in the state agency roles must be approachedcautiously. Energy issues pervade all sectors of the economy and nomajor activity can be ignored. Too much integration by governmentagencies may result in dor..ination of a supply-side orientation. Althoughthe major thrust of the energy component of the 6th Five Year Planemphasized in this report is for increased exploration, production andmarketing of energy in Thailand, programs need to be closely related todemand prospects. Given this thrust, what appears to be required in theview of the assessment team is:
(a) better coordination and planning between pubLic sectorentities;
(b) clear guidelines regarding policy to be provided by thegovernment, especially concerning those areas in whichincreased private sector activity is called for;
(c) the need for the private sector to appraise government moreeffectively of its views and perspectives; and
(d) improved government machinery to regulate enhanced privatesector activities in the energy sector and facilitate bettercoordination between public and private sector entities.

1.15 The government can do much to increase the production andefficient use of energy by focusing its policy tools more specifically onproduction and use objectives. Energy demand management can be used moreeffectively to achieve greater efficiency in energy use both throughappropriate pricing and conservation incentives. Expanded explorationand development of oil, gas and lignite are being examined with newapproaches to production and institutional arrangements based on betterincentives for the private sector and a more effective regulatoryprocess. The uncertainties regarding gas and lignite availability andfuture power demand have lead to a reexamination of the planning policiesused in determining least cost investment programs. Current policies arenow being designed to base programs more on minimizing the cost of energyproduction and in turn optimizing the timing of investments.
Formulating a Government Energy Strategy
The Role of Pricing
1.16 At this time pricing should be the starting point informulating an energy strategy in Thailand because prices are a majorfactor in most of the decisions that need to be taken regarding fuelsupply and use, and some serious distortions already exist. The basisfor pricing used in the report is that energy prices should be set atleast at the level of their opportunity costs to encourage optimalinvestment decisions from the national standpoint. Perhaps the mostcritical area of pricing policy involves the level and structure ofretail and ex-refinery petroleum prices. In the case of tradeable goodssuch as petroleum products, their opportunity costs are the import parity(c.i.f.) prices in Bangkok for those products that are in deficit(primarily diesel oil), while for those products in surplus (natural gascondensate/gasoline and increasingly fuel oil) they are their f.o.b.(export) prices. Since Singapore is the major regional trading centerfor petroLeum products import parity prices in Bangkok are likely toreflect their f.o.b. Singapore price plus freights while for products insurplus, export prices may have to be close to or somewhat below those inSingapore to clear the market.
1.17 Petroleum Product Prices. Prior to the November 1984devaluation the retail value of the reconstituted barrel of petroleumproducts consumed in Thailand was about 46% above the import pricelevel. This retail value of the reconstituted barrel, of course,included all margins to distributors as well as government tax take.When account is taken of the former, this level of weighted averageretail prices was roughly in line with general tax levels. However, asretail prices of petroleum product were not adjusted since thedevaluation, the retail value of the reconstituted barrel of consumedproducts has declined, reaching a level of only 22% above that of theweighted average import price in February 1985. Since then world oil

prices have continued their slow decline 1/, resulting in the weightedaverage import product price in June 1985 falling by about 9%. Thismeant that as of June 1985 the retail value of the reconstituted barrelof consuiaed products had risen to about 31% above that of the weightedaverage import price. Since there is, however, the need for additionalgovernment revenue, steps should be taken to adjust the overall level ofretail product prices upwards so that their weighted average price wouldbe around 402 above that at the border. This measure would increasegovernment revenue by about 2.5 billion Baht to a total of around 19billion Baht from petroleum product taxes.
1.18 The disproportionate level of taxation on gasoline hasintroduced major distortions into the structure of retail prices relativeco border prices. This has resulted in an uneconomic shift to diesel oiluse in transport, especially for light trucks/pick-ups. This reportsuggests specific ideas on how to eliminate some of the distortions inpetroleum product prices. A new structure of retail petroleum productprices should be set which is closer to the structure of border prices soas to ensure a more economic pattern of use especially for the majortransport fuels -- diesel oil, gasoline and CPG. In effecting thesechanges, the following are of relevance:
(a) retail prices for automotive diesel oil are low relative togasoline -- the differential between retail premium gasolineand automotive diesel prices should be reduced from its presentlevel of 5 Baht/liter to about 3 Baht/liter.
(b) retail prices of LPG are low relative to those of gasoline --the differentiaL between the retail prices of premium gasolineand LPG should be reduced from its current level of 6.3Baht/liter to about 4.6 Balt/liter.
The current retail price structure of petroleum products along with thatproposed by the Assessment Team and their relevant border prices areshown below:
1/ This being more pronounced for diesel oil and fuel oil.

-8 -
Present
Border Prices Retail Price Recommended
Product as of Feb. 1985 a/ Structure Retail Prices
---------------- Baht/liter-
LPG 4.674 5.38 6.4Premium Gasoline 6.245 11.70 11.0
Regular Gasoline 5.706 10.80 10.1Kerosene 6.073 6.12 7.9
Auto. Diesel Oil 5.808 6.70 8.1
Resid. Fuel Oil 4.853 4.09 5.5
a/ As of June 1985 gasoline border prices had declined by about 2%
relative to February 1985 and kerosene, diesel oil and fuel oil border
prices by between 7-12%.
To effect such a change in the structure of retail prices would requireraising the level of taxes on diesel, kerosene, LPG and fuel oil. At thesame time an effort needs to be made to ensure that imported "boiler"fuels such as fuel oil and coal are taxed equally. The cumulative effectof adopting the above retail price structure would be to lower theforeign exchange cost of supplying LPG, diesel oil and gasoline by aboutUS$1.2 billion between 1986-95 or about 5-10X of the estimated balance ofpayments current account deficit.
1.19 The Oil Fund. The Fund initially was established to stabilizethe domestic effects of large short-run movements in international oilprices. This now appears to be a secondary role, as the Fund has becomea discretionary mechanism to delay retail price adjustments todevaluations or changes in international oil prices as well as amechanism to cross-subsidize petroleum products. The result has beenfurther encouragement of uneconomic fuel substitution. The Fund also hasbecome costly in terms of government expenditure in that cross subsidiescurrently exist for LPG, kerosene, diesel oil and fuel oil which, ifsustained through 1985, could amount to about 1/2Z of GDP (5 billionBaht). The assessment team recommends that the government adopt a policyobjective to abolish the Fund and in its place establish a mechanism tolink retail prices to international border prices while automaticallyreflecting changes in exchange rates.
1.20 Ex-Refinery Prices. Appropriate ex-refinery prices are acritical instrument for maintaining a competitive environment forrefinery operators. Before the November 1984 devaluation, ex-refineryprices were consistently below or equal to the c.i.f. level of directlyimported products. However, since then ex-refinery prices for mostproducts have been higher than those of direct imports. The assessmentteam recommends that ex-refinery prices be set at levels competitive withthose of directly imported products even if this leads to temporary

- 9 -
financial losses in the refinery sector because of the prevailing levelof international product prices relative to crude prices. Adherence tothis policy at present and over the medium term would ensure:
(a) that the country enjoys the benefits of very competitivelypriced internationally traded products which have resulted fromexcess refining capacity in the region and worldwide; and
(b) decisions made in the late 1980s concerning investments inrefineries would result in a more economically efficient andcompetitive industry.
Natural Gas Prices and Development of the Gas Industry
1.21 Pricing is one of the most important tools for fostering theexploration and development of natural gas. In fact, the absence of anyaccepted international reference point for determining gas prices to theproducers in Thailand is a major deterrent to further exploration and hascaused protracted delays in negotiations. Clear guidelines on thepricing of gas to producers and consumers need to be establishedimmediately. One possible option for such a system could contain thefollowing key features:
(a) a clear signal to producers and consumers regarding current andfuture principles for pricing natural gas;
(b) the pricing system adopted must possess a high degree oftransparency so that producers and consumers are able todetermine well-head prices and plant-gate prices respectively,given a Basing Point Price for gas in Bangkok;
(c) the gas price at the Basing Point must be directly lir.ked tothe international prices of competing fuels, expressed as apercentage (yZ) of the fuel oil price in Singapore (plusfreight costs to Bangkok); the report refers to this percentageas the "discount parameter";
(d) to address short term movements, the Basing Point Price shouldbe adjusted quarterly to follow the behavior of the fueL oilprice in Singapore, over the preceding 90-day period;
(e) every few years, the government should adjust the "discountparameter" in order to reflect the medium term changes in theopportunity cost of gas between fuel oil and coal parity;
(f) in order to simplify and give transparency to the system, it isimportant that the gas transport cost be established clearly.In establishing the cost (or price for ommon carrier systems),the guiding principle would be a reasonable return oninvestment to the pipeline owner. The cost will also depend onthe volume, load factor, distance and interruptibility of thegas being transmitted.

- 10 -
(g) that government should implement the above system concurrentlywith a revised tax and royalty system so that government takesits henefits through royalty and income tax on gas productionbased oa profits measured at the well head.
1.22 The report places great emphasis on gas prices for the powersector, as the power sector is the most important user of gas in Thailandand would remain so until the end of the century. 2/ The recentlynegotiated gas price to EGAT (US$3.201MMBTU) is close to the estimatedequivalent value for gas used in a comparable steam unit fueled by coalat today's prices. This latter value (the so-called "coal parity") iscurrently calculated to be US$3.14/MMBTU and might be thought of as thefloor price for gas used in the power sector (it is also currently about90% of the fuel oil equivalent price). The assessment team recommendspricing gas to EGAT close to its current floor price over the nextseveral years in order to make gas competitive.
Pricing Imported Coal
1.23 According to pricing projections in the world market, importedcoal may be expected to pLay a growing role as a fuel in the cementindustry and, by the mid-1990s, in the power sector. Coal's primarycompetitor in the cement sector is high grade lignite which, with naturalgas, already has displaced most of the fuel oil consumed in thisindustry. Under current government policy a 10% import duty is levied onimported coal; therefore to ensure equal tax treatment with otherimported "boiler" fuels, the assessment team recommends a similar importduty/excise tax be applied on fuel oil.
Pricing Electric Power
1.24 Pricing electric power is particularly important in generatingsufficient resources to finance investment. The present tariff structureprovides a mechanism of cross-subsidization in which higher electricrates apply in urban areas and industry subsidizes rural and householdconsumers. The government policy of uniform national tariffs has led tosome economic distortion, but a more important problem concerns thegeneration of resources to finance investment. Large rate increases wereintroduced in 1981 and 1982 which went a long way towards restoring arelatively healthy financial situation in the subsector; however, 1983tariff reductions caused a setback in this progress. The projected cashgeneration ratio and the return on revalued assets for 1985-86 is notexpected to be particularly robust. A general increase in rates iswarranted, and there are some serious problems with the rate structures.Cross subsidies from commercial to residential customers need to bereduced. As PEA tariffs are about the same as MEA's in spite of
2/ Power sector use of gas would account for between 70-80% of totalgas utilization over this period.

- 1i -
substantial cost differences, regional cross subsidies also exist whichare questionable, at least for the largest consumers. Apart from thesemajor changes, some improvements in tariff design should be consideredwhich could shift demand away from the peak period.
1.25 More generally, lessons should be drawn from peak load pricingwhich can quickly be put into effect for several large industrialconsumers and more options involving direct control of the Loads ofsmall, medium and large consumers should be investigated since peakingcosts are still high, i.e., more than USC12/kWh for PEA low voltageservice. More research into the opportunities for managing theindustrial and commercial loads will be useful in shaping the high andlong duration of the daily load plateau and in assessing its increasingsensitivity to climatic conditions.
Developing Indigenous Primary Energy Resources
Optimizing Future Uses of Lignit
1.26 Lignite will play an increasingly critical role in meeting baseload power requirements over the next ten years. Current estimates ofthe opportunity cost of lignite at the Mae Moh mine 3/ show it to beclose to the transfer price between EGAT's mining and generationdepartments. The depletion premium is estimated to be low due to theuncertainties regarding the size of reserves, future mining costs, andestimates of replacement fuel costs (essentially imported coal) at thetime the reserves can no longer be committed for new capacity. Hence,the opportunity costs of lignite as now used in power generation areclose to mining costs. The assessment team therefore recommends thatlignite for the power sector should continue to be priced at itsopportunity cost. In the case of high quality lignite used in theindustrial sector (particularly that of cement), prices are set by thecompetition relative to fuel oil, coal and natural gas and hence areclosely market related.
1.27 Unlike oil and gas exploration and development where theinternational oil companies play the lead role, in the case of ligniteEGAT plays the major role in exploration and development activities. Thelocal private sector has begun playing an increasingly significant rolein the lignite industry. First, as a subcontractor to EGAT at the MaeMoh mine for the removal of overburden and secondly, as the supplier ofhigh-quality llgnite to industrial users, among which the cement sectorhas become very important.
3/ Calorific value of Mai Moh lignite of 4,900 Btullb.

- 12 -
1.28 In the assessment team's view the current level of ligniteexploration activity in Thailand (about US$2 million a year) is too lowfor the period of the Sixth Plan and should be expanded. In addition,there should be a program:
(a) to increase the efficiency of overall mining activities andscrengthen the mining industry as a whole;
(b) of measures to facilitate the penetration of high grade ligniteuse outside of the power sector which, inter alia, requires theidentification and development of additional mines havingbetter quality lignite than Mae Moh; and
(c) to ensure that the private sector role is enhanced where it isefficient to do so. This could have the desirable effect oflimiting the scale of increases in public sector borrowingrequired as the sector expands over the next decade. Twospecific options could be evaluated. Under the first, EGATwould maintain sole control for mining low grade lignite forcaptive use at mine-month power stations, while at the sametime form a joint venture company with private mining concernsto explore for, develop and market high grade lignite forindustrial uses. Under the second option, a single major jointventure company would be formed. using the lignite departmentof EGAT as a base, to undertake exploration and mining of highand low grade lignite for use in the non-power and powermarket.
Refinery Expansion
1.29 In the past Thai refineries have supplied nearly three-fourthsof the country's petroleum product requirements; the rest were covered byimports. However, the refineries' product yield pattern emphasizesmiddle distillates and fuel oil so that product imports are heavilyskewed (60%) towards diesel oil. The imbalance between product yields atthe refineries and product demand is due to:
(a) the uneconomic stimulus to diesel demand in transport providedby retail pricing policies;
(b) the increasing amounts of natural gas that are substituting forfuel oil, thereby eroding the market share of an importantpetroleum product; and
(c) the very limited processing flexibility in the refining sectorto modify product yield pacterns. This flexibility is limitedto an 8,800 bbls/day fluid catalytic cracker (FCC) and a 12,000bbls/day visbreaker, both located in the TORC refinery.
1.30 If current plans to expand Esso's hydroskimming refinery andrehabilitate the Bangchak refinery are implemented and the TORC refinery

- 13 -
retains its current capacity and complexity, by 1990 net product importsshould have declined to about three-fourths of their 1984 level, althoughdiesel oil imports would be about the same as in 1984. At the same timethe government would need to restructure the retail prices of petroleumproducts, as recommended above, to stimulate economic fuel choices, andhave the three refineries run on light feedstocks, including condensatesand allow the Bangchak refinery access to very competitively pricedSirikit crude.
Oil and Gas Exploration and Development
1.31 Because the oil and gas fields that have been discovered so farin Thailand are geologically complex and much broken up by geologicalfaults, larger numbers of wells are needed to develop any one discovery,and individual well reroveries are relatively low. Furthermore, thefields themselves are subject to relatively rapid declines once they havereached peak production, and over time, many small oil and gas fields arelikely to be found rather than a few large ones. All of this means thatin order to maintain a given level of production, a steady, continualpace of exploration is needed, and the investment per unit of productionwill be higher in Thailand than in other countries. The legal and fiscalsystem governing the oil industry must take account of these factors ifthe stop-and-go character of past exploration activity is to be replacedwith steady progress in producing oil and gas.
1.32 Appropriate government policies are needed to encourage morerapid conclusion of the contracting process governing the exploration anddevelopment activities of the private oil companies. Unless thecontracting process can be simplified and speeded up, there is animminent danger that exploration activity will decline (especially whencombined with weak international oil prices) and that discoveries willnot be brought on stream fast enough, leading to:
(a) a serious underutilization of downstream investments inpipelines and gas recovery facilities;
(b) significant financial and economic losses to government due todelayed or foregone revenues and economic benefits (in terms ofoil import displacement); and
(c) severe financial penalties for the private operators who wouldbe unable to quickly recover their exploration costs.
1.33 To avoid the anticipated declines in gas and condensateproduction capability levels from existing contracts, the team recommendsthat the government satisfactorily conclude current negotiations withcompanies regarding the development of discoveries already made. Thiswould address the short- to medium-term problem. Second, in order toaccelerate exploration activity, incentives and policies will have to beimproved and better focused.

- 14 -
1.34 The legislation/regulations governing oil and gas activity needto reflect the high costs of production in Thailand relative to majoroil/gas producing areas of the world. In addition, there is a need toreassess incentives for the oil industry while keeping them consistentwith national interests, particularly if the current period of weak oilprices persists over the medium term. The assessment team recommends thefolLowing modifications to the legislative/fiscal regime:
(a) Royalty - payments should be graduated according to the size offields, with smaller fields paying a lower rate;
(b) U.S. Tax Compatibility - minor changes are needed in thecurrent taxation to ensure compatibility with US tax regimes;
(c) Abandonment of the 1982 DMR Requirements - these should ceaseto be applied as they provide severe limits on the costs whichcan be offset against income, such that taxable profits in theearly years are higher than in most countries. In addition,the regulations provide for steep increases in royaltiesunrelated to likely profits;
(d) Joint Ventures and Participation - DMR regulations shouldspecify inclusion of a joint venture option for a Thai oilcompany for aLL new concessions, which would become effectiveupon establishment of a commercial discovery;
(e) Other Legal Aspects - these include obligations to produce; thelength of exploration and promotion periods; relinquishments;and confidentiality provisions, which are extreme byinternational standards.
Power System Development
1.35 The development of the power system has been closely related tothe expansion in primary energy. It has also been particularly capitalintensive and a major burden on the financial resources available to thecountry. The power system has sustained very rapid growth for more thantwenty-five years, averaging more than 15% a year. During this timeinstalled capacity ias increased from 176 MW in 1960 to 6155 MW in1985. Since 1980 there has been a substantial substitution away fromfuel oil with consumption declining from a peak of 2,500,000 toe to1,800,000 toe. Natural gas consumption in the power sector reached 149MMCFD in 1983 and lignite consumption increased from 93,000 tons in 1960to 1.6 million tons. The future, however, is clouded by pendingshortages of these domestically produced resources. Unless the gas orlignite programs can be further expedited to produce more fuel for powergeneration, substantial imports of coal and fuel oil will be required forpower use by the mia to late 1990s.
1.36 The official electricity demand projections for Thailandprepared by the Working Group in September 1984 show a long run average

- 15 -
growth rate of about 6.8% p.a. through the year 200t. NESDB projectionsbased on the Siam II Model indicate likely growth in demand of 11.12 p.a.during the fifth plan period (1982-86), 6.9X between 1987-1991, 5.7Zbetween 1991 and 1966, and 5.2Z between 1996 and 2001. Upward changes inthis load forecast are not unlikely and would require significantadjustments in EGAT's future program. As in the assessment team's highdemand scenario, a 1Z difference in the demand growth rate couldtranslate into a peak generation requirement difference of 1500 MW in1996 -- 15% higher than with the ECAT projection. Coping witg demanduncertainty will be one of the most difficult issues facing the sector.It requires reducing construction lead times for all plants through sitcstudy/preparation and design standardization. It may also influence thefuel choices.
1.37 According to EGAT planning, by the end of the sixth plan periodgas and lignite 4/ available for power will be fully developed. However,it is dangerous to rule out the gas option completely for the periodafter 1992/93 since it is recognized that more gas supply than nowprojected could be available if large reserves are rapidly proven anddeveloped. Therefore, flexibility must be incorporated into ECAT'splanning decisions and commitments so that, if and when gas becomesavailable around current price levels, it could be used for powergeneration. Since analysis shows that EGAT will need to build over 2000MW of capacity additions between 1993 and 1996 and alternatives to gasare available, decisions can be taken in stages.
1.38 Gas is ruled out of the first decision stage, around 1985-86.Plants for 1994 and after, -- the second decision stage around 1987-88 --could reopen this issue. In case a higher gas supply variantmaterializes, perhaps an additional 300 MW combined cycle unit could becommissioned. Such a plant would represent a small addition to thesystem so it could be inserted almost at any time and no opportunitywould be lost in deferring this additional commitment until more is knownabout gas development.
1.39 The choice of combined cycle units is not only dictated by itsshort construction lead time but also by its higher efficiency and lowerinvestment cost which maximize the netback value of gas in the expansionof power generation. This preference for combined cycle units extendsnaturally to the development of a core program based on firmly availableresources and a lower demand scenario.
4/ Unless the 200 million tons of lignite reserves at Mae Muh currentlysterilized by Units 1-3 were to be developed following de-commis-sioning of these units. This reserve would provide about 1700 NW ofadditional capacity equivalent to about four years demand growth atthat time.

- 16 -
1.40 The use of dual-fired (fuel oil/gas) steam capacity in thepower system was valuable at the beginning in accelerating the develop-ment of a gas market at its infancy. It also provided flexibility toburn fuel oil in the event that gas did not become available. This hasresulted in EGAT having, by end 1986, some 2400 MW of dual fired fueloil/gas steam capacity which will remain in the system for another 10-20years. The leap to triple-fired (oil/gas/coal) units is onlyexceptionally justified, as is the case for Bank Pakong #3 and 4, becausethe site is convenient for both coal and gas supply and the commissioningdates (1991-93) at a stage when gas production could either enter itsdecline or its renaissance.
1.41 The issue in the development of coal-fired capacity is to deferthis massive investment as much as possible. The use of efficientcombined cycles commissioned at short notice, for the major part of theincremental gas available for power is a good strategy. Triple-firedunits also exceptionally will achieve that purpose if some heavy coalrelated investments can be deferred at the plant site.
1.42 Reserve capacity margins are also a source of investmentcosts. Whether the present EGAT's reserve criteria are too cautiousdepends very much on the performance of the plants to be commissioned andgenerally on the quality of EGAT's operation planning and maintenance.This subject deserves more attention and so does the optimization of thereserve criteria based on a study of the economic cost of power outages.
Rural Energy Issues arnd the Role of Modern Fuels
1.43 Rural life in Thailand has been undergoing dramatic changesover the Past two decades involving a shift away from a self-sufficient,subsistence agrarian economy based on renewable energy to one vhich isbecoming technologically, economically and culturally focused oncommercial production for larger markets. The high rate of increase inrural incomes associated with this growth has unleashed new expenditurepatterns and life styles, which in turn have increased the demand forcommercial energy sources in transport and residential uses. The growthin electricity and LPG use in rural households therefore can be expectedto accelerate in the future. By the year 2000, 35-45% of ruralhouseholds are expected to be using LPG.
1.44 Fuelwood shortages and serious environmental problems arebeginning to occur in certain areas, although the fuelwood supply problemis not yet critical, and substantial areas of natural forests are stillaccessible in many parts of the country. Forest depletion rates haveexceeded sustainable levels and give cause for concern for the future.Continued demand for fuelwood at current rates already has put a strainon the accessible forests and resulted in deforestation in large areas,such as Central Thailand. The combination of fuelwood collection,agricultural expansion, commercial fellings, shifting cultivation, andthe effects of urbanization have reduced the country's forested land areafrom 27 to 16 millior. hectares over the last 25 years. By 2001 the area

- 17 -
is likely to be less than 11 miLlion hectares if current trends continue.The total sustiinable supply of fuelwood in 1983 is estimated to be about15.5 million 3m , which compares with the 1983 consumption level of about3 million m , including urban demand (Table 8.2). The nearly 23 millionml deficit is met by overcutting of the forests. By 2001 potentialdemand could increase to a level of 50 million cubic meters while thesustainable supply would decline to about 13.9 million m3 leaving adeficit of about 36 million m3. Although these numbers have a margin ofuncertainty, there can be no disagreement on the direction of the trendand the nature of its potential impact. If unchecked, the excessiveexploitation of natural forests could quickly lead to environmentaldamage, fuelwood shortages and a decline of agricultural productivity inmany areas.
1.45 Over the next twenty years, the various economic factorsaffecting rural energy demand and the decline in natural forest resourceswill result in a growing deficit of fuelwood. Whether the situation willlead to a faster shift to modern fuels than assumed is a question thathas an impact on the supply strategy that needs to be adopted. Thepresent structure of prices (Table 8.4) shows clearly that fuelwood-derived energy is in some cases a less expensive option to consumers andthat the process of large-scale switching to modern fuels in rural areaswould involve a high cost to rural households. Since as much as 25X ofrural income may be spent for energy, maintaining fuelwood supplies maybe the least cost approach to meeting many of the rural household cookingneeds whenever fuelwood supplies can be planted close to consumers.Charcoal produced from wood from a nearby plantation can provide cookingenergy, allowing for differing end use efficiencies, at Baht 1.0 peruseful Kcal compared with Baht 2.2-3.3 for LPG and a LRMC of Baht 5.0 forelectric rice cookers. The essence of the rural energy strategy needs tocombine two objectives -- that of improving the supply and efficiency ofusing traditional cooking fuels while at the same time efficientlyproviding rural consumers with access to commercial fuels at competitiveand economic prices.
Energy Efficiency Programs
1.46 Increases in petroleum and electricity prices between 1979-82have encouraged the Thai manufacturing sector to undertake importantinitiatives to use energy more efficiently: for example, in the non-metallic minerals subsector (in particular, cement) a major switch fromfuel oil to cheaper lignite, coal and gas use began in this period.Added to this total, energy intensity also fell between 1979-82 by about14Z, indicating that some significant operational improvements had beenmade by cement operators. The need for these improvements is driven bythe fact that energy accounts for 30% of production costs in thisindustry.
1.47 In addition to pricing policitz. government action also isneeded to implement an effective energy efficiency strategy for themanufacturing sector:

- 18 -
(a) to identify and eliminate fiscL' ar'- financial constraints toprivate sector adoption of higher efficiency measures; and
(b) to assist in ensuring that the private sector is fully aware ofthe opportunities for cost effective measures (housekeeping,retrofitting and new equipment). Publicly sponsoreddemonstration projects in selected subsectors would go a longwav towards removing any remaining apprehensions about thecommercial viability of investments to increase energyefficiency. Specific short and long term measures which shouldform the core of government's energy efficiency program aredetailed in this report.
1.48 As transport consumed about 60Z of petroleum products in 1983,it is clear that improving the efficiency of petroleum use is primarily atransport issue in Thailand. Here again the pricing policy for petroleumproducts is a key issue. Past policies have stimulated an uneconomicsubstitution of diesel fuel for gasoline in light trucks/pick-ups an' theteam has recommended modifications to this policy. There also is theperennial problem of traffic congestion in Bangkok leading to low fueluse efficiencies. M!ost measures undertaken to relieve this problem havehad limited impact due to the continued rapid growth in vehiculartraffic. The team considers that further, efficiency-consciousinvestment in roads and public transport will be imperative as will betighter management of traffic demand.
In' estment Strategy
1.49 As the level of public sector investment in the energy sectorhas been rising substantially in recent years, it wiLl be important tokeep it both under control and in line with the country's growthobjectives during the Sixth Plan. The programs suggested in the variouschapters imply a level of investment to develop, produce and distributeenergy which is probably higher than for any previous five-year period inthe country's tistory. Except for oil company activities in oil and gas,most of the responsibility for this rising investment has been with thepublic sector energy enterprises. A primary concern of the governmentw;ll have to be to find ways to reduce this level and establish thehighest priorities consistent with che national economic framework.Determining the priorities is made complex by the fact that responsibil-ity for energy investments is shared among several agencies, namely, PTT,EGAT, MEA, PEA, BCP and DED, as well as a number of joint companies suchas TORC. judgments regarding priorities are also difficult in thatinvestment priorities often have been determined by the availability offunds. Furthermore, as government policy is strongly encouraginginvestment by the private sector, priorities must be weighed moreeffectively within in the context of total investment.
1.50 The overall energy investment strategy will not changesubstantially. The current strategy emphasizes minimizing public sectorinvestment and operating cost levels, particularly by maximizing the use

- 19 -
of gas and employing capital-intensive technologies. In practice thishas proven especially difficuLt because of uncertainties about the timingand amount of gas which might be available on the one hand, and theamount of alternative resources that might be developed on the other.Uncertainties regarding the price and availability of imported fuels alsohave complicated matters. For the next few years this situation probablywill not change. However, by expanding the private sector role and giventhe projected continuation of relative ease in the world energy picture,the level of public sector investment can be lowered (Chapter V).
1.51 The economic environment in which the Sixth Plan is beingformulated places severe constraints on financing public investment andthis factor is reinforcing a review of the role of each public sectorenergy agency. For example, substantial attention is being given toredefining and focusing the large role of PTT in investments related toupstream and downstream activities in oil and gas. Similarly, the roleof the public sector in future refinery investments should be assessed.Suggestions have been put forth which might promote lignite activities inthe private sector as well as foster additional contributions of privateequity for EGAT. Joint ventures already have begun as a promising meansof expanding private sector participation in oil and gas, and in lignite.
1.52 The burden of imported energy supplies and the discovery of newdomestic gas resources undoubtedly will continue to justify large capitalspending for the energy sector. Energy will continue to be the singlemost important sector for public spending. Energy sector capitalspending already weighs particularly heavily in total public in'estment,averaging 24% during the fifth plan period. Energy sector enterprises inrecent years have accounted for more than 50% of state enterpriseinvestment. The power sector agencies have contributed the bulk of theseinvestments. In the past, large amounts of this capital investment havebeen financed by foreign borrowing. Increasing the internal generationof cash by the various energy enterprises will be an absolute requirementof any energy strategy.
1.53 Since the Sixth Plan has not yet been formulated, it is tooearly to judge the size of proposed energy investments or their share ofmacroeconomic requirements. Preliminary estimates in Table 1.1 show thatwith a modest change in growth assumptions, investment requirements couldincrease by nearly $3 billion. Additional variations in potentialinvestment levels by the private sector are indicated below (para. 1.56).Variations attributable to changes in relative priorities over the decadecould add to or subtract from *iese figures.

- 20 -
Tible 1.1: PROJECTED PUBLIC SECTOR ENERGY INVESTMENT, 1987 - 1991(USs Million)
Increases Dueto Projects
Currently Based on HighSector/Program Proposed Projacts Growth Scenario a/
Electric Power
Hydro Electric Projects 369 _Thermal Power Plants 2,406 1,500EGAT Transmissions 495 345MEA 465 325PEA 275 125
4,010 2,295
PTT Projects
Pipelines 365 160Exploration and Development 154 345Marketing 63 -Gas Separation 60Refineries 234 -Misc. 30 45
906 550
Lignite Mining 578 125
Rural Energy Programs 100 -
Energy Efficiency Program 25 _
Total 5,6520
a/ Assume additional 1500 MW power required as outlined in Chapter V. TORCrefinery investment based on latest figures available. Lignite mininginvestment based on EGAT, July 15, 1985 reports. It is assumed a significantpart of the increase could be financed by private equity.
1.54 The approach to public sector investment followed in thisreport, starts with a "core" investment strategy, based on that levelwhich must be met to satisfy the needs of the projected GNP but will notbe so low as to constrain growth in energy in the period following theSixth Plan. A micro-economic review of the current investment proposaLssubmitted by the individual energy agencies indicates that most of theprojects these agencies are considering would need to appear inl some formin any core program (Table 1.1). However, some might be in the privatesector. Furthermore, since many of these investments represent longerterm programs, they have not yet been formally evaluated by NESDB andrepresent only a list of promising projects from which the responsibLeagencies will need to carry out feasibility studies, evaluate resourcerequirements and relate the projects to national priorities. The coreprogram, at this time, is still a coLlection of projects at varyingstages of identification and preparation. Summing up these lists ofprojects provides a core investment program varying from as low as $4.5billion to as high as $5.6 billion.

- 21 -
1.55 The government's strategy of making greater use of the privatesector in developing indigenous energy resources could succeed not onlyin keeping the level down but also tailoring the priority of publicinvestments more closely to scarce resources. The fact that theprojects in the public sector that now appear most favored by theagencies involved would total close to $5.6 billion should give a clearsignal that careful control of public sector expenditures will be at theheart of the energy strategy.
1.56 In quantitative terms the potential of the private sector canbe very large. If a higher gas scenario can be achieved, for example,then the cost of the future power program can be reduced considerably.If proper incentives are created, the private sector could provide about$1.3 billion during the years 1987-91, of which about 20X would be forexploration (medium case scenario). Higher figures have been proposed byvarious members of the study group. Once the process of privatizationbegins in earnest, there is a consensus in the group that much higherinvestment expenditure levels over the decade of the 1990s will bepossible -- around $6 billion in an optimistic scenario, or $3.5 billionin a medium scenario.

- 22 -
II. AN ENERGY PFRPECTIVE POR THE SIXTH PLAN PERIOD
Introduction
2.1 These are difficult times to put into effect an expansiveenergy strategy, particularly one that is dependent upon rapid develop-ment of indigenous resources. Long-term price and supply uncertaintieshave hardly diminished despite the recent decline in world energyprices. The financial outlook for the world economy is still not partic-ularly optimistic.
2.2 Exploration and development of oil, gas and lignite is such acostly and risky operation that the role of the State in this effort inThailand is being reassessed for the sixth plan period. It is proposedthat greater use might be made of private sector resources and market-oriented decision-making. Many of the policy options discussed in thisreport are intended to create an environment which would allow theprivate sector to supplement better the activities that the public sectorhas monopolized in the past. If equity investments are to become a moreimportant factor in the energy sector in Thailand, and this is thegovernment's stated goal, a more realistic incentive system will need tobe created; the burden of an outdated Legislative and regulatory processalleviated; price distortions eliminated; and the demand managementsystem liberalized. It is possible that domestic energy production couldbe raised substantially, energy could be used more efficiently, and thelevel of public investment could be kept to a modest level that would besustainable for the rest of this decade. The success of the energystrategy that is being formulated for the sixth plan period will dependon how these issues are addressed. If the plan is successful, it may bepossible to avoid another energy crisis and associated high levels ofimports that appear to to be on the horizon for the mid-1990s.
Macroeconomic Background
2.3 The economic background for the sixth plan period is an outlookof somewhat slower growth, with a greater emphasis on exports. Energyimports are to be held in check. The economy, which sustained one of thehighest growth rates in per capita incomes among developing countriesbetween 1960 and 1980, probably will grow more slowly. Although itsreliance on traditional agriculture would still continue, the expansionwould be led by additional intensification and mechanization in agricul-ture, a modest growth in modern industrial and service sector activities,and a broad strengthening of transport and communication facilitiesthroughout the country. GDP growth would continue at about 5.5% a year,which is well below the 7-8% achieved during the 1960s and 1970s.
- 23 -
2.4 In this atmosphere energy consumption, which was stalled at thebeginning of this decade, would begin to grow again, although not at therapid pace of the 1970s. For nearly 25 years rapid GNP growth wasaccompanied by an even faster growth in energy consumption, increasingfrom about 1.6 million tons of oil equivalent (toe) in 1960 to around 18million toe in 1983. 5/ During the seventies the share of energy importsin commercial energy averaged about 90%. Only since 1982 has thisdependence on oil imports declined somewhat as a result of modestincreases in zhe domestic production of natural gas, lignite and crudeoil. In 1983, imported petroleum still accounted for nearly 75Z ofcommercial energy. The import bill for petroleum that year represented25% of total imports and absorbed 39% of the economy's export ea-nings.
2.5 Because of this heavy reliance on imported oil, the Thaieconomy suffered severely from the two oil price shocks of the 1970s andthe ensuing international economic upheavals. The effects of the firstoil shock were partially hidden for several years because world inflationin commodity prices temporarily offset the impact of the oil priceincrease on the balance of payments. Furthermore, the government'sconservative fiscal policies at that time helped to keep domestic infla-tionary pressures under control.
2.6 In the second half of the 1970s, expansionary policiesencouraged continued high rates of economic growth but resulted inaccelerating inflation, a quickly deteriorating external balance, arapidly growing savings-investment gap -- particularly in the publicsector - and increased reliance on foreign borrowing. In order to limitdomestic inflation and reduce the external imbalances, the governmentimposed price controls on selected items. By failing to adjust domesticenergy prices to the sharp increases in oil costs, the transition to anenergy scarcity situation was delayed. The second oil price shock andthe effects of the severe worldwide recession that followed therefore hitThailand at a time wher. its economy was already deteriorating. Thegovernment at first was slow in responding to these adverse externalconditions but by late 1980, several policy adjustments were made whicheffected substantial increases in electricity tariffs and in the price ofmost petroLeu-u products by early 1982. At this time, growth in petroleumproduct consumption ceased, both as a response to these price increasesand to the increasing availability of natural gas. The average growthrate of GDP continued to fall short of historical growth (about 5X p.a.during 1982-84) due the high interest rates at home and abroad, thecontinuing worldwide recession, and weak exports.
5/ Per capita energy consumption rose from 59 kgoe in 1960 to 296 kgoein 1983.

- 24 -
Evolution of the Energy Sector
2.7 The social and economic transformation of the Thai economy overthe past 25 years has resulted in higher per capita incomes. This inturn led to increased use of energy intensive appliances such as auto-mobiles and air conditioners, which account for much of the rapid growthin energy consumption during the 1960s and 1970s. How much of thisgrowth in energy consumption can be attributed to the low domestic energyprices is difficult to measure. However, it is clear that most of thisgrowth was met by rapidly expanding energy imports which, by 1978,accounted for 21% of total imports. After the second oil shock, theshare of energy in Thailand's total imports increased to 31X, while 45%of the economy's export earnings were required to finance energy imports(1980 data). This level has been reduced onLy slightly in recent years.
2.8 The role of traditional fuels in the energy supply picture hasbeen declining. Estimates prepared for the World Bank Rural EnergyAssessment 6/ indicate that in 1982 traditional fuels provided only aboutone-third of the final energy consumed in Thailand. One fourth of thetraditional fuels consumed is attributed to industry -- principallybagasse used in sugar mills. Most of the rest is consumed by house-holds. Charcoal accounts for about 16%, followed by fuelwood (12%),bagasse (7%), and paddy husk (4X).
2.9 Until 1981, almost all crude and petroleum products consumed inThailand were imported. In that year indigenous resources met only 11%of commercial energy demand, with hydroelectric power and ligniteaccounting for three quarters of domestic supplies. With the advent ofnatural gas production, by 1983 the share of petroleum products incommercial energy consumption fell to 75%. Domestic resources (25Z ofcommercial energy) came mostly from natural gas (10%) and hydropower(7%), and the rest from crude oil (5%) and lignite (3%). Electricitygeneration absorbed the bulk (98%) of natural gas production. Withrespect to final consumption of commercial energy, petroleum productsaccounted for 85% (diesel 44%; gasoline 19%; fuel oil 16%, jet fueL 11%;LPG 6% and kerosene 5Z), electricity 132, and coal/lignite 2%.(Annex 1).
Economic Projections for Energy and the Economy
2.10 If government policies are properly structured, prospects arefavorable for developing indigenous energy during the remaining years ofthis decade. The most likely scenario for domestic crude and natural gas
6/ World Bank Rural Energy Assessment, Report No. 044/85, September1985.

- 25 -
production indicates the share of imports in overall energy consumptionwould decline from 54% in 1982 to 33% in 1991. However, after 1995 thevolume of energy imports may start to rise again -- at first moderately,but the pace quickens towards the end of the 1990s. If nothing is doneto sustain exploration for gas, oil and lignite by the year 2001,imported energy is expected to again provide almost 60% of domesticenergy requirements (base case scenario). In ligt.: of the relatively lowprice outlook for coal in international markets and the lower thanexpected potential surply of natural gas and lignite, imported coal hasbecome an attractive option for use in power generation and in the cementindustry in Thailand. Hence, the share of imported coal in commercialenergy use in Thailand by the late 1990s could be 15 (Table 2.1).
Table 2.1: PROJECTED ENERGY CONSUMPTION, 1982-2001
(THOUSAND TOE)
Annual
1982 1991 1996 2001 Growth
Petroleum Products 9,436 13,427 16,663 20,033 4.0
Natural Gas 1,119 6,103 8,255 5,602 8.9
Hydro Electricity 1,118 1,533 1,926 1,988 3.1
Coal 98 299 412 5,034 23.0
Lignite 596 2,988 3,188 3,270 9.4
Commercial 12,367 24,350 30,444 35,927 5.8
Non-commercial 5,707 6,348 6,781 7,357 1.4
TOTAL 18,074 30,698 37,225 43,284 4.7
Source: Based o.i Energy Demand and Macroeconomic Situation 1985-2001, NESIB,
June 1985.
2.11 The prognosis for the overalL economy during the same period isencouraging, assuming that the government continues to adopt the stabili-zation policies now under way. External factors such as an economicrecovery in industrialized countries and weak international oil priceshave already contributed to a favorable outlook for economic growth inthe near future. The most likely scenario for the Thai economy would begrowth at about 5.4% p.a. through the end of the decade. As a resulc ofthe recent devaluation of the Baht and reforms in the exchange ratesystem, Thailand's net trade posicion is improving. The combination ofweaker oil prices and increased substitution of gas and lignite for oilimports is effectively reducing the level of imports. Future improve-ments in :he balance of payments will be contingent on the continuationof current exchange rate policies, the promotion of exports and increaseddomestic energy production, plus a decline in international fuel prices.

- 26 -
2.12 To analyze the interaction between the energy sector and theeconomy and prepare energy demand forecasts, NESDB, with support from theWorld Bank, has developed an economy-wide multisectoral, multi-householdequilibrium model of the economy of Thailand. The model is an adaptationof the SIAM2 model which uses a Social Accounting Matrix (SAM) as thedata base. SAM includes an input-output table which specifies the amountof each type of energy used in the production process of every sector.Changes in output over time generate associated changes in the demand foreach type of energy from each sector. The sum of individual demandsacross sectors gives the total demand for each type of energy. Econo-metric specifications of changes in the input-output coefficients areincorporated whenever possible to account for improvements in energyefficiency over time. Details of the model, data base, and scenariosused are provided in Arknex 2. The results of the projections through2001 for the consumption of different forms of energy are shown in Table2.1. These results are reasonably consistent with similar projectionsprepared by the assessment te-m for each subsector as discussed in thevarious chapters of this report.
2.13 As the macroeconomic projections indicate, even if a stabili-zation program of restrictive fiscal and monetary policies is adopted andexternal factors such as international oil prices and worldwide economicactivity are favorable, failure to maintain domestic oil and gas produc-tion (at Least at the levels now proje-ted for the mid-late 1980s) willresult in a deterioration of the Thai balance of payments and GDP growthduring the nineties. Even in the scenario where real oil prices remainconstant up to 2001, the current account deficit would widen rapidly inthe nineties and lower ecorimic growth would be unavoidable.
2.14 To maintain a healthy balance of payments and steadv growthafter 1990, several key policy decisions are required:
(a) Structural adjustment policies including a cautious fiscal andmonetary policy; maintenance of the current exchange ratesystem and export promotion are essential.
(b) Demand management intended to achieve greater efficiency inenergy use through the provision of appropriate pricing andconservation incentives will be necessary.
(c) An expanded program of exploration and development of oil, gasand lignite is needed to at least maintain, or increase, thelevels of indigenous energy production from the late 1980sthrough the 1990s. This would require the adoption of appro-priate institutional and production arrangements based ongreater incentives for the private sector and a more effectiveregulatory process.
(d) Careful investment planning will be required to minimize thecosts of energy production and optimize the timing of invest-ments.

- 27 -
Projected Energy Use By Sector
2.15 Current end-use energy consumption in Thailand, as derived fromthe SIAM model exercise, is shown in Table 2.2. Households and industryaccounted for most of traditional energy consumption (62% and 38%,respectively), and transport and industry dominated commercial energyconsumption (at 52% and 24%). Transport accounts for two-thirds ofpetroleum products consumption, including virtualLy all gasoline andabout two-thirds of diesel consumption. Transportation also absorbed 45%of LPG, 34% of kerosene and all the jet fuel. The industrial sectorconsumed 50% of the electricity provided, 80% of fuel oil and the bulk ofcoal and lignite. The outlook for energy consumption in each of thesemain sectors, as summarized from the assessment team's subsectoranalyses, is presented below.
Table 2.2: PROJECTION OF FINAL ENERGY DEMAND (IN THOUSAND TOE)1982-1991
Commercial AnnualEnergy 1982 1991 Growth
=~~~~
Agriculture & Fishery 793 1,194 5.3Industry 2,783 5,347 8.5Transportation 4,447 7,295 6.4Households 646 1,403 10.2Services 749 1,328 7.4
Total Commercial 9,418 15,567 7.3
Traditional Energy 5,707 6,348 1.3
Total 15,125 22,915 5.3
Source: Based on Energy Demand and Macroeconomic Situation, 1985-2001,NESOB, June 1985.
Agriculture
2.16 Agriculture 7/ accounts for about 20% of GDP but only 13% ofenergy consumed. Rice and sugar milling consume more than 80X of theenergy used in agriculture. The agricultural growth which took placebetween 1960 and 1980 has been associated with a rapid increase inmechanization which is reflected in an increased use of petroleumproducts and electricity. Between 1960 and 1983, the consumption of
7/ Agriculture includes crops, livestock, forestry and the processingof rice and sugar, as well as fishing.

- 28 -
energy in agriculture (excluding rice and sugar milling) is estimated tohave risen by 24.3% per year, reaching about 400,000 toe by 1983. Morethan three-fourths of this was diesel consumed by tractors and otherfield operations. Since the rapid expansion in area under irrigation andrelated multiple cropping observed in the past is not likely to continuemuch further, growth in mechanization and in energy demand is expected toslow down.
2.17 The demand for diesel is expected to grow about 7.7% p.a. until1986 and fall to 4.4% p.a. during 1987-2001. For the agriculture sectoras a whole, energy consumption would continue to grow steadily at 2.7%between now and 2001. A modest shift away from traditional fuels tocommercial fuels is anticipated, with the share of non-commercial energyexpected to fall from about 86Z in 1982 to about 81% in 2001.
2.18 Fishing, which has been included under agriculture, is one ofthe most energy intensive industries in Thailand, with energy accountingfor about 18% of the industry's total production cost. In 1983, thefishing industry consumed about 500,000 toe, or 4% of toLal end-useenergy consumption -- most of it diesel fuel, which amounted to 14Z ofthe country's total diesel consumption.
2.19 Growth in the consumption of energy in fishing will be deter-mined primarily by growth in the industry's output -- which is expectedto rminain steady and uninterrupted. However, a decline in the fish catchin the Gulf may force fishermen to travel greater distances which willincrease the consumption of energy. If the present petroleum pricestructure is maintained and international oil prices remain stable, thedemand for diesel by the fishing industry should grow at an annual rateof 6.7% through 1986 and 3.6% during 1987-2001.
Industry
2.20 This sector, which includes manufacturing, mining, and con-struction, made up about 30% of total energy consumption in 1983, two-thirds in the form of commercial energy. In the same year, oil made up47Z of the commercial energy used in industry, followed by diesel with24%, and electricity most of the remainder. Within industry, most of thefuel oil consumed is in cement, iron and steel, and textiles; cementalone accounted for about 25% of national fuel oil consumption in 1983.
2.21 The demand for energy in industry in the next decade or so willdepend on the growth of the sector itself, the degree of interfuelsubstitution, and the limited adoption of more energy efficient techno-logies. Several heavy industries -- fertilizer and petrochemicalplants -- based on natural gas as a feedstock are likely to be builtduring the next five to six years. These plants are projected to consumeabout 30 MMCFD and 43 MMCFD of gas, respectively, by 1990. Meanwhile,the demand for fuel oil in industry is expected to decline through thelate 1980s as greater use is made of lignite, natural gas and coal incement production. After 1990, however, the demand for fuel oil would

- 29 -
grow again at 5-6% per year if there is no major gas discovery or iflimited amounts of coal and lignite can be used in the cement industry.
2.22 In 1983, the total demand for electricity in the industrialsector amounted to 676,000 toe, approximately 30Z of which t-as used inheavy and intermediate industry (mostly cement, iron and steel), 25% inlight industry, and 15% in food processing. In fact, industry used two-thirds of all electricity consumed in the country and a significant shareof this was consumed by a relatively few industries, such as metals,cement and textiles. On the basis of the expected growth in theseindustries, the industrial demand for electricity is projected to grow atan annual rate of 7.2% up to 1991 and 5.7% during 1992-2001.
2.23 Industry also makes extensive use of traditional fuels; bothfuelwood and charcoal are used by the brickmaking and ceramics sectors,and agricultural wastes are used in food processing. Bagasse is used asa boiler fuel in the sugar mills -- about 5 million tons or 1,035,000 toeactuaLly were utilized in 1983. Since the sugar industry has undergonetremendous growth during the past two decades, the use of bagasse hasgrown rapidly. Given the present low price of sugar in internationalmarkets, growth in sugarcane production is expected to be modest during1987-2001 -- around 3Z per year -- and the consumption of bagasse isexpected to rise at the same rate.
2.24 Paddy husk is mainly used by rice mills; about 2.5 million tons(535,000 toe) of rice husks were produced in rice milling operations in1982. Its largest use was in the rice mills themselves, to drive steamengines and raise process steam for parboiling and drying purposes. Riceproduction and the consumption of paddy husks in the agricultural sectorare expected to grow at about 1.5% per year.
Transport
2.25 Transport facilities have been growing rapidly over the past 25years. The highway network has expanded nearly threefold, while themotor vehicle fleet nearly doubled over the last five or six years.During the 1970s the consumption of gasoline, diesel and jet fuel intransport grew at annual rates of 6.4%, 6.6%, and 8%, respectively. Thistrend slowed after 1979 with the decline in economic activity. Gasolineconsumption declined by 2.7% per year between 1979 and 1984, mostly dueto absolute and relative price increases and the slowdown in economicactivity. During the same period diesel consumption increased by 15% ayear. Similarly, LPG consumption in transport increased by roughly 50% ayear over the same period. To a large extent the growth in consumptionof these two fuels is due to the price structure which providesincentives to substitute them for gasoline. In 1983, the transportsector accounted for 52% of total commercial energy consumption and 62%of petroleum product consumption. Approximately 90% of gasoline and 64%of diesel was used in transport. In 1985, about 4,500,000 toe is beingconsumed in transport and consumption is growing at an annual rate of6.4%. By 1991, nearly 7,300,000 toe a year is expected to be consumed inthis sector.

- 30 -
Power Generation
2.26 The choice of fuels used in electricity generation is likely tohave a substantial effect on the energy picture over the next 15 years.To meet the rapidly growing demand for electricity over the past 25years, inputs of commercial fuel increased at more than 10% a year. In1960, diesel provided the fuel for two-thirds of the capacity. Thesubsequent expansion in capacity was provided mostly by oil-fired steamthermal plants and, to a lesser degree, by hydro-based plant. Until theearly 1980s, hydro provided 21-251 and fuel oil most of the rest. In thelast few years, the share of hydro has remained about the same, but theshares of natural gas and lignite have risen to 30% and 10%, respective-ly. Natural gas consumption in the power sector reached 54,462 MMSCF in1983 and lignite consumption increased from 93,000 tons in 1960 to 1.6million tons. Fuel oil consumption used in electricity generatior. roseto a peak of 2,580,' .J toe. The substitution away from fuel oil around1983 reduced fuel oil consumption to 1,550,000 toe. However, the projec-tion to the 1990s shows a reversal of the substitution process so that bythe latter part of the next decade over 50Z of the fuel used ingene.4ting electricity would be imported coal. By the end of the 1990s9,000,000 tons of coal may have to be imported unless there is a majorincrease in hydro imports or in generation from additional discoveries oflignite or gas reserves.
Households
2.27 Household demand for energy has changed substantially duringthe past 25 years. In urban areas there has been a shift towards usingmodern fuels for lighting and cooking, and the use of air-conditioningand household appliances is now becoming widespread. In 1980, charcoaland fuelwood were used as cooking fuel in 42% of households, compared toabout 90% of the households in the early 1960s. LPG and electricity arenow used in place of traditional fuels for cooking by more than 70% ofurban households. Overall, electricity has become the most importantcommercial energy used in urban households (about 45% of the total),followed by kerosene (33%), which is used for cooking in restaurants andhotels. About one-half of the electricity consumed in commerce andservice establishments is for air-conditioning; the other half is usedfor lighting and operating other electrical equipment and appliances.
2.28 The consumption of energy by the service sector is projected togrow by 5.6% through 1986, and 5.3% per year to 2001. The service sectordemand for electricity is expected to rise by 7.1% per year through 1991,and 5.4% per year during 1992-2001. Due to shortages of fuelwood andcharcoal and conseqnent higher prices that will develop, the demand forthose fuels by the service sector is projected to rise by less than 1.OZper year through 2001. LPG use is expected to substitute partially forthese fuels and it is estimated to grow at an annual rate of 10%.
2.29 Overall, between 1982 and 1991 final energy demand is expectedto grow at about the same rate as GDP (5.3% and 5.4%, respectively).

- 31 -
The use of traditional energy is expected to grow very slowly, at 1.3%p.a., although commercial energy consumption will grow faster than GDP atabout 7.3% p.a. This will result in an energy-GDP elasticity of 1.3%,which is comparable to that observed in countries at a similar stage ofdevelopment. The highest growth (10.2% p.a.) will take place in thehousehould sector, which will account for 9Z of commercial energy con-sumption in 1991, compared to 7% in 1982. Although the industrial sectoris anticipated to grow at 8.5% p.a., its share in consumption is expectedto grow more than that of any other sector -- from 29% to 34%. Theshares of transport, agriculture and fisheries, and services will remainstable, at about 47%, 8%, and 7%, respectively.

- 32 -
III. ENERGY RESOURCES - LIGNITE, HYDRO, BIOKASS
Introduction
3.1 Thailand's commercial energy resource base is somewhat diversi-fied, consisting principally of lignite, hydropower, natural gas, andmore limited quantities of oil and natural gas liquids. The rural sectorformerly was supplied by the ample forest resources, but continuing ruralpopulation increases and pressures to develop agricultural holdings haveput sufficient strain on these to jeopardize their long-term availabili-ty. Known lignite reserves are around 1,700 million metric tons (MMt),865 MMt of which are regarded as proven. The total reserves may begreater. since only 23 of 70 potential coal-bearing basins have beeninvestigated in detail or systematically explored and only 5 of the 79potential basins are being mined. The rest of the potential coal-bearingareas have been subjected only to geological reconnaissance. Of thetotal proven and probable reserves, 86% are located in the Mae Mohdeposit in northwestern Thailand. 8/ The total hydropower potential inThailand itself is estimated to be about 8,300 MW, with an annual genera-tion potential of 14,330 CWh. A much larger potential exists on borderrivers with Laos and Burma -- estimated to be around 14,000 MW, with anannual generating capacity of 90,000 GWh. Development of these siteswould require international agreements with other riparian states, whichin the present disturbed political environment of Southeast Asia seemsunlikely to occur before the end of the century. Of the oil and gasreserves, some 180 million barrels of liquids (crude oil and condensate)and 12,900 billion cubic feet of gas have been identified t: date asproven, probable and possible 9/, while the ultimate recoverable reserves(URR) including both discovered and as yet undiscovered are estimated tobe around 1.1 billion barrels of liquids and 19,000 billien cubic feet ofgas. To put the above resource figures into perspective, Thailand'scommercial energy consumption in 1983 was 14.3 million tor of oilequivalent and has been growing at 10 a year for the last ten years.The total of presently known proven and possible energy reserves(excluding hydropower) amounts to approximately 57 years of supply atpresent consumption levels. This reserve base should by no means beconsidered comfortable for four reasons:
(a) it obscures the fact that 57% of the total represents lignite,only 3% oil and condensates, and 40% natural gas;
(b) the lignite reserve data are for mineable reserves with presenttechnology, as distinct from reserves which are economicallymineable at present levels of costs and competing fuel prices;
8/ ECAT Power Development Plan (1985-2001), May 1985.
9/ About 3.72 billion cubic feet of this gas is considered proven.

- 33 -
(c) if one assumes that the growth rate of demand for commercialenergy in Thailand up to the year 2,OCI declines to 5Z per yearand to 2.5% per year between 2000 and 2010, commercial energyresources will be depleted by 2015, or within 30 years; and
(d) with oil only providing 3% of the reserve base, it is clearthat the country's energy resources would not be able even tomeet the transport sector demand, which represented some 45% ofcommercial energy demand in 1983.
3.2 Although the countey has energy resources which can be used byindustry and the power sector, these resources clearly do not provide anadequate energy base for a rapidly growing modern economy, particularlyone in which transport sector consumption will continue to dominate.
Institutional Issues
3.3 The irstitutional aspects of energy resource management inThailand are complex and include a large number of government bodieswhich in some cases appear to have overlapping jurisdictions. In thecase of coal (lignite) there are three: the Department of MineralResources (DMR), the National Energy Administration CNEA), and theElectricity Generating Authority of Thailand (EGAT). In oil and gas, thePetroleum Authority of Thailand (PTT) is the dominant public entity,since it is responsible for transporting, processing, purchasing andselling natural gas (para. 4.40), but the DMR has the responsibility forregulating the oil and gas exploration and production industry. EGAT isresponsibLe for hydroelectric development but must coordinate this withthe Royal Irrigation Department to ensure the optimum use of waterresouLces. Energy sector policy and planning functions involve theCabinet, the National Economic and Social Development Board (NESDB)(which is under the office of the Prime Minister), and NEA. The situa-tion is further complicated by the fact that ECAT reports to the PrimeMinister's office, PTT and DMR to the Ministry of Industry, while NEA isunder the Ministry of Science, Technology and Energy. There is a lack ofeffective coordination between these official bodies.
3.4 Private sector involvement is strong in the petroleum industry,particularly in oil and gas exploration and production, the import anedistribution of oil products and, to a lesser extent, in refining. Theprivate sector has only played a small role so far in lignite mining,which is dominated by EGAT's operation of large captive mines to supplythermal power stations; the NEA operates two lignite mines to supplysmall industrial consumers. The private sector participates little ingeneration and not at all in the distribution of eLectric power. Genera-tion is principally the responsibility of EGAT, although there is somecaptive generating capacity in the sugar and cement industries.

- 34 -
3.5 The institutional aspccts of the energy sector in Thailand arecomplex and need to be clarified in light of a new thrust in governmentenergy policy towards a greater private sector role. To do this it isnot necessary to have all entities with operational and/or planningresponsibilities reporting to a single Ministry of Energy, as was commonin many countries a few years ago. Energy issues pervade all sectors ofthe economy and such a Ministry could easily become all-powerful and fartoo supply-side oriented. The major thrust of the energy component ofthe 6th Five Year Plan calls for an increased role for the private sector(local and foreign) in the expLoitation, production, transport, refiningand marketing of energy in Thailand. This is a direction which theassessment team fully endorses but which will certainly require, in theassessment team's view:
(a) clear guidelines regarding the government's policy toward areasin which increased private sector activity is called for;
(b) better coordination and planning between public sector enti-ties; and
(c) improved government machinery to reguLate and enhance privatesector activities in the energy sector and facilitate bettercoordination between public and private sector entities.
Lignite!Coal
3.6 Thailand&s coal resources are all relatively low grade, of thequality generally categorized as lignite, although some deposits verge onbeing sub-bituminous. The characteristics of lignite include a relative-ly low calorific value due to its high water content, and, in several ofthe Thai deposits, a high proportion of mineral ash. Table 3.1 givesestimated reserves and average calorific values for Thai lignites. Forcomparative purposes, the heat value of imported Australian steam coal is6,700-7,100 kcal/kg, or double that of most Thai lignites except for thereserves at Li, which are of reasonably good quality. Information aboutreserves is sketchy and inadequate, especially in view of the need toformulate longer-term energy policy. There is considerable evidence toshow that lignite could be a major long-term energy source in Thailand,but the lack of definite information regarding the quality, location, andeconomic mineability of reserves makes firm planning difficult.
Occurrence of Lignite and Exploration
3.7 Lignite in Thailand occurs in a series of small disconnectedareas, known in geological terms as "basins", which are scattered thelength of the country, mainly in the western part. A total of 79 suchbasins have been identified, of which 37 are known to have either work-abLe deposits or verified occurrences of lignite and the remainder awaitgeological exploration. Only five basins contain active mines at

fable 3.1: SUMMARY OF COAL RESERVES AND QUALITY IN MAJOR DEPOSITS
(Reserves in million metric tons)
Year
Mine or Operator Prod, Reserves
Locdtion Deposit Owner Started Proven Probable Moisture Ash Volatiles Fixed Carbon Sulphur Heat Value
- - - - - - - - - - (percent) - (kcal/kg)
IAMPANG MAE MOH EGAT 1955 802 661 30-35 10-28 20 13-26 0.8-1,5 2500-3000
KHADi Khlong Khu Nan)
Khlong Thom ) EGAT 1964 25 28 30 32-47 n.a, n.a, 1.5-2.4 2850-3000
I MlfUN Pa Kha, Li NEA 1969 12.0 15.0 21 8 n,o, n.a, c I 5500-6000
Ban Pu, Li World Fuels Co. 1979 8.0 15.0 20.7 8.1 n,a, 37.3 4
NGAO Mas reeb Phrae Lignite 1976 1.1 11.0 19 6.2 30 40.5 6.5 4980
I AMPiUN Co.
MAE RAMAr, Mae Tuell Thai Lignite 1980 1.3 2.3 7.75 1.06 39.5 51.7 0.71 3275
lA?. Co.
1*E1 Nd Dudng Siam Grdphite 1982 0.05 n.a. n.a. n.a, n.a, n.a. n,a,
Co.
KkAUI Sin Pun 16.0 n.a. n.a. n.a. n,a, n.a. n.a.
iAMPIANG Jae Khoo NEA 15,5 32.0 4.6-23.6 n,a. 20.3-41.5 37.6 1.6-9,7 1527-502
! AMPANC Ngdo 24.5 n.a, n,o, n,a. n,a. n.a. nba.
Chde Hon 26.3 n,a, n.a, n.a. P.a, n.a. n.a.
865 831
I.e. - ddid not aevdilble,
bource: M4onenco Repor. on Lignite, 1984, and EGAT Power Development Plant 11985-20011, May 1985.

- 36 -
present and two others have old abandoned mines. By the end of 1983 EGAThad mapped and drilled in ten basins, and other government agencies orprivate concerns had conducted limited exploration in about six basins.
3.8 According to available information the basins were classifiedon the basis of their lignite potentiaL and the extent to which they havebeen explored. Table 3.2 summarizes this classification scheme.
Table 3.2: STATUS OF LIGNITE EXPLORATION
----Lignite Potential----I Good II Fair III Poor Total
1. Unexplored 16 19 24 592. Partially explored 5 5 5 153S Fully explored - - - -
4, Basin- with lignite mining 5 - - 5Total 26 24 29 79
The 21 basins rated as having good lignite potential but which areunexplored or only partialLy explored have been designated as highpriority targets for EGAT's exploration program; the six prime targetsare:
Northern Region Southeen Region
Wiang Haeng Thung Yoi (Sin Pun)Mae Taoi Khian SaSerm Ngam Sa Pan Sai
3.9 In the second phase of the 1983 exploration exercise, threebasins were drilled in detail. Only the exploration at Wiang Haengresulted in any discovery of a significant lignite reserve -- between 40and 50 MMt of 3500 kcal/kg lignite, which is sufficient to fuel a 300-MWpower plant for about 30 years. However, the overall stripping ratio was15.4 bank cubic meters per ton of lignite, which is too high to make thelignite economica.ly mineable under present conditions.
3.1C Lignite exploration has been carried out in at least 20 of the79 tertiary basins, although in most of these the effort has not beensystematic. Some basins are small and the lignite bearing area would beLimited to a few square kilometers; others cover several thousand squarekilometers. Consequently, the ultimate lignite potential will only berevealed as systematic exploration proceeds. The number and thickness oflignite seams vary within a basin and from basin to basin. Mae Moh hasfour seams; only the two middle seams, each 5 m to 15 m thick, aremined. The top seam is also thin and the bottom too deep. In the Libasin two seams, each up to 7 m thick, are mined and at Krabi a 15 mthick seam is mined. Lignite seams typically dip towards the center of

- 37 -
the basins at about 10°, but dips of up to 40° also occur. There arealso numerous minor geological faults which displace the lignite seams sothat estimating reliable stripping ratios and economically mineablereserves is difficult.
3.11 One of the anomalous aspects of lignite exploration anddevelopment in Thailand is that the most active and important entity inthis field is EGAT. Some exploration is undertaken by the NEA, and smallprivate mining companies to a more limited extent. Though informationi onthese activities is limited they are definitely at a level significantlybelow that of EGAT.
3.12 Table 3.3 details EGAT's exploration activities in 1982 and1983. In both these years about 70% of the effort had been concentratedon detailed drilling of Mae Moh and Krabi, with the remaining 30% spreadover several other basins. Its annual lignite exploration budget isabout US$2.0 million. Given the prospects, this Level of activity may beappropriate for EGAT in terms of power sector requirements, though itshould ensure that priorities are continually reviewed and effortsdirected at the most promising prospects.
Table 3.3: EGAT'S 1982 AND 1983 EXPLORATION ACTIVITIES
---- FY82---- ------------FY83-----------Holes Meters Holes Meters 1000 Baht
Mae Moh 124 23,407 116 13,294 7,600 a/Krabi 116 32,610 224 51,243 30,000 a/Mae Tha-KhoKa 5 705 44 8,184 2,571Thai/Malaysian Border - - 5 1,179 840
Chiang Muan - - 21 3,613 949
Wiang Haeng - - 31 5,510 1,921San Pa Tong - - 18 3,357 916
Chaiburi - - 33 2,288 1470
Chai Hom 16 1,084 - - -Wang Nua 89 7,264 - - -Li 53 9,617 - - -Ngao 12 2,015 _ - -
Total 415 76,702 492 88,668 46,267USS thousand 2,007 b/
a/ Preliminary estimate.b/ 23.05 Baht/USS.
3.13 It is not necessarily in the national interest that the majorexploration and development effort of one of Thailand's important energyresources should be left only to a public electric utility, which isbound to have its own internal priorities and will allocate funds forlignite exploration and development only insofar as its own needs areconcerned, regardless of whether other industrial consumers have need of

- 38 -
or could use lignite as a fuel. This is not to say that EGAT has notperformed an excellent task so far in the development of economic ligniteresources for use in the power sector. This issue is wider than EGAT andthe power sector. It involves:
(a) the future role of high quality lignite as an important fueloutside of the power sector, in particular, in the cementsector competing with imported coal, fuel oil and naturalgas. This industry in 1984 used some 330,000 tons/lignite (orabout 14% of total lignite production); and
(b) the most effective institutional arrangements to accelerate theexploration, production, transport and use of such lignite innon-power sector markets. In this context, high grade deposits(such as at Li) are of special significance once lignite is tobe transported for use by industry, while lower grade resourcescan still be economically exploited for mine-mouth powergeneration.
3.14 Regardless of the eventual arrangements decided upon forlignite development in the 6th Five Year Plan, the assessment teambelieves that the scale of activity in lignite exploration between 1986and 1991 should be at least twice as high as that of EGAT in 1983 orshould increase to at least US$4 million annually (paras. 3.27-3.34).
Lignite Reserves and Production
3.15 Presently known reserves of lignite in Thailand are estimatedat 1700 MMt (Table 3.1), 1460 MMt (86:) of which are in the Mae Mohbasin. However, most of the reserves outside Mae Moh occur at depths toogreat, or consist of seams too thin, to make them economically mine-able. Currently known mineable reserves total 465 MMt; 452 MMt are atMae Moh. Another 10 MMt are at Krabi, where EGAT has plans to exploitthem to fuel a 75-MW power station. There is little available informa-tion on privately held reserves. Of the basins where lignite is known tooccur but which have not been drilled sufficiently to enable reasonablyaccurate total reserve estimates to be made, Sin Pun (Krabi province) isthe most promising. The stripping ratio here is between 2.7 and 5.1 bankcubic meters per ton of lignite (BCM/ton), lower than at Mae Moh (7.1BCM/ton average), and lignite quality is slightly higher. Another basinwhere exploration is currently under way is Wiang Haeng (Chiang Maiprovince), where estimated total reserves are 40-50 MVt; however, thehigher average stripping ratio (15.4 BCM/ton) of this deposit makes itlook less attractive than Sin Pun at this sta-e. EGAT's current strategyis to concentrate exploration efforts in the southern (peninsula) region(Region 3) due to the more urgent need for expanded electricity genera-tion there as compared to the central and northern regions.

- 39 -
3.16 The current operators and production of lignite are shown inTable 3.4. Output in 1983 totaled 2.2 million tons, of which 1.8 milliontons was produced by EGAT.
Lignite Production Potential
3.17 Over the next decade, lignite production will expand in the MaeMoh and Krabi basins, with the Mae Moh basin making the largest contribu-tion to national primary energy supply. Even if significant additionalreserves were discovered in other basins, the time requirements forexploring, measuring and developing reserves would mean that exploitationcould not begin until the mid 1990s, at the earliest. The followingsections describe the development now under way at Mae Moh and Krabi andindicate their likely future production potential.
Mae-Moh - Currrent Situation and Reserves
3.18 The Mae Moh mine and associated power station is locacedapproximately 650 km north of Bangkok in an area of low populationdensity where most of the land is used to cultivate of teak wood andtobacco. The mine is connected to the national road system by pavedroads and to the national rail system by a 5-km spur. In the past, thisspur has been used to deliver lignite to the North Bangk- power plant(see Table 3.4). Extensive exploration has established total proven andprobable reserves at 802 and 661 MMt, respectively. Consideration oflignite ash content and other figures considerably reduces the volume ofreserves that is economically mineable. The costs of mining a unit ofheat are reduced as the percentage of ash in the lignite decreases; inaddition, lower ash content means lower power plant operating costs inthe areas of milling, slagging, ash disposal, etc. The lignite reservesat Mae Moh which have ash content below 45% are considered economicallymineable; using this criterion, Mae Moh measured and indicated reservestotaled 814.2 MMt at the end of 1982, from which a total 437 MMt run-of-mine production is expected between 1987 and 2024, as follows:
?9tTotal measured and indicated reserves with ash
content below 45% 814.2Less: reserves considered uneconomic 74.6
reserves sterilized power units 1-3 237.8
reserves mined to 1987 (14.2 Mt run-of-mine) '5.8
Indicated reserves available for mining after 1987 486.0
Indicated run-of-mine reserves at 90% recovery 437.4
Source: World Bank Second Mae Moh Lignite Prcoject. AppraisalReport (March, 1984).
These reserves have an average stripping ratio of 7.2 bank cubicmeters/ton, an average run-of-mine ash content of 26Z, and an averagecalorific value of 2700 kcallkg. Their sulphur content is high, rangingfrom 2.5% to 4.0%.

Table 3,4: OPERATING LIGNITE MINES AND PROOUCTION,1977-83
Mineable ------ Output ('000 tons) a/-----------------Province Location Operator Reserves Destination of Output 1977 197d 1979 1980 1981 1982 1983 Est.1984
(Mt)
Mae Moh (Lampang) EGAT 452 Mae Moh Power Plant 47.1 103.9 823.3 875,3 1184,8 1195.7 1291.9 1640North Bangkok Power Plant 115.6 75.9 51.8 0.1 0.1 0.1 - _
Sub-total 162.7 179.8 875.1 875.4 1195.7 1291.9 1640
Krabl (Krabi) EGAT 10 Krabi Power Plant 294.6 268.2 283.1 363,8 362.4 372.3 351.7 350
Li (Lamphun) NEA 6 Industries, households
Li (Lamphun) World Fuels Co. Ltd. 2 Industries, households
Li (Lamphun) Dharmumaprlda Co, Ltd. 1.1 Industries, households
Sub-total 85.7 106.7 94.1 110.5 99.6 131,6
Ngao (Lampang) Phrae Lignite Co, Ltd. 0,79 102,3
Mae Ramat (Tak) Thai Lignite Co. Ltd, 1.0 83,5
Na Duang (Loci) Siam Graphite Co. Ltd. 1.0 5.9Totals 473.9
a/ On a Thai fiscal year basis (Oct, I-Sept, 30),
Sources: EGAT data and Li sub-totals - Second Mae Moh Lignite Project SAR; other: - data provided to a December 1983 IMF assessment team,

- 41 -
3.19 Future Production. The magnitude of the Mae Moh reserve baseis sufficient to maintain an annual production level of 14.6 Mt a yearfor 30 years -- the maximum economic lifetime of any power facilitiesinstalled at Mae Moh. This level of output could support 2,090 MW ofinstalled base load capacity at Mae Moh. 10/ Current installed capacityat Mae Moh is 375 MW (3 x 75 MW, 1 x 150 'i) and a further three units of150 MW each are now under construction. 11/ By March 1986, a total of825 MW will have been commissioned, consuming some 5.7 Mt a year oflignite.
3.20 EGAT is currently preparing plans for further expaiision of theMae Moh mine to fuel an additional 3 x 300 MW of generating capacity, andits May 1985 Power Development Plan (1985-2001) shows the foLlowingcommissioning dates for these three units:
Unit 8 300 MW July 1989Unit 9 300 MW June 1990Unit 10 300 MW December 1990
3.21 A significant fraction (29%) of Mae Moh reserves are unavail-able for mining at present because generating Units 1-3 and someassociated buildings are located on top of them. When these units areretired in the mid- to late-1990s an additional 238 MIt of reserves willbecome available for mining, or 214 MMt of run-of-mine reserves (902recovery). At this time, the feed requirements of units 4-10 will beapproximately 10.5 MMt/year, and run-of-mine reserves, including thereleased portion, will stand at 550 MMt. This level of reserves would besufficient to support an additional 1500 MW of generating capacity overand above the already committed or planned 1725 MW so that reserves wouldbe depleted by the year 2025. This would require an expansion of minecapacity to about 21 MMt/year -- a very large mine by any standard. Thecrucial question facing Thailand is, in the absence of other knownsizeable lignite reserves for base load power generation, what is theoptimal pattern of use of the Mae Moh reserve. Related to this is theenvironmental problem at Mae Moh which could become significant in a mineof 21 million tons/year production (para. 3.35). The entire issue of theoptimal development of Mae Moh's resources will depend on the price andavailability of natural gas in the mid-1990s, the movement of interna-tional coal prices and the shadow price of foreign exchange. The latteris of significance since a power plant based on imported coal will bemore foreign exchange intensive over its lifetime than its lignitecompetitor. Furthermore, the present high value of the US dollar rela-tive to the Australian dollar and other currencies of coal exportingcountries tends to underrate the long-term cost of imported coal -- an
10/ S;suming a 75% annual load factor and an overall plant efficiency of30%, net of auxiliary equipment requirements.
11/ In March 1984, these were 65%, 19% and 12% completed, respectively.
- 42 -
effect intensified by the current depressed state of the internationalcoal market and the shipping industry. AlL these factors tend to makeimported coal appear much cheaper at present and over the short term thanits probable long-term cost, the net effect of which possibly might be toslow the rate of lignite development in the early l990s unless thesesignals change over the next coupLe of years.
Krabi Basin - Reserves and Exploration
3.22 The tertiary basin at Krabi, as defined to date, is 30 km longby 12 km wide and is topographically flat, containing large areas ofmangrove swamp in the southern portion. The western edge of the basinsubcrops to the west of a major river, the Pakasai, and the seam extendsunder the river. About 8.5 km of the subcrop has been drilled to dateand three potential mining areas identified in addition to the two areasof the subcrop that are already being mined. The lignite seam istypically 10 to 15 meters thick. Reserve estimates of coal quantity andquality at Krabi are still tentative, pending completion of the fullexploration program. Moreover, given the steep dip of the seam, econo-mically mineable reserves will be less than the technically provenreserves. At present, economically mineable reserves are estimated atabout 10 million tons.
3.23 ECAT operates a 60 MW (3 x 20 MW) lignite-fired power stationat Krabi (Chapter V) with lignite supplied from two nearby open castmines, Wai Lek and Bang Pu Dam. Together these mines produce about360,000 tons of lignite per year averaging about 3,000 kcal/kg and 35Zash. The power units were commissioned between 1964 and 1969 and currentplans are to decommission them in August 1990. The Krabi power plant isthe largest single base load plant in the southern region and depends onenergy transmitted approximately 800 km from the central region for muchof its supply (Chapter 5).
Sin Pun Area
3.24 This is the most promising of the lignite deposits discoveredby EGAT in the course of its recent exploration program. The location isabout 70 km east- northeast of Krabi. So far, about 3,000 meters of veryshallow subcrop have been delineated by trenching and 90 boreholes. Coalquality appears to be superior to Krabi and Mae Moh (3,000 kcal/kg).Even with limited drilling, measured reserves total 5 million tons, andanother 5 million are indicated, which could support a 75-MW power plantfor 25 years. The deposit is still open at both ends, so there areexpectations that the extent of known reserves will increase during 1984-85 as EGAT continues its drilling program. It is reasonable to expectthat a power generating and lignite mining project will develop in SinPun by the early 1990s.
Coal and Lignite Consumption in Thailand
3.25 Table 3.5 shows the actual reported consumption of lignite andimported coal from 1975 to 1983.
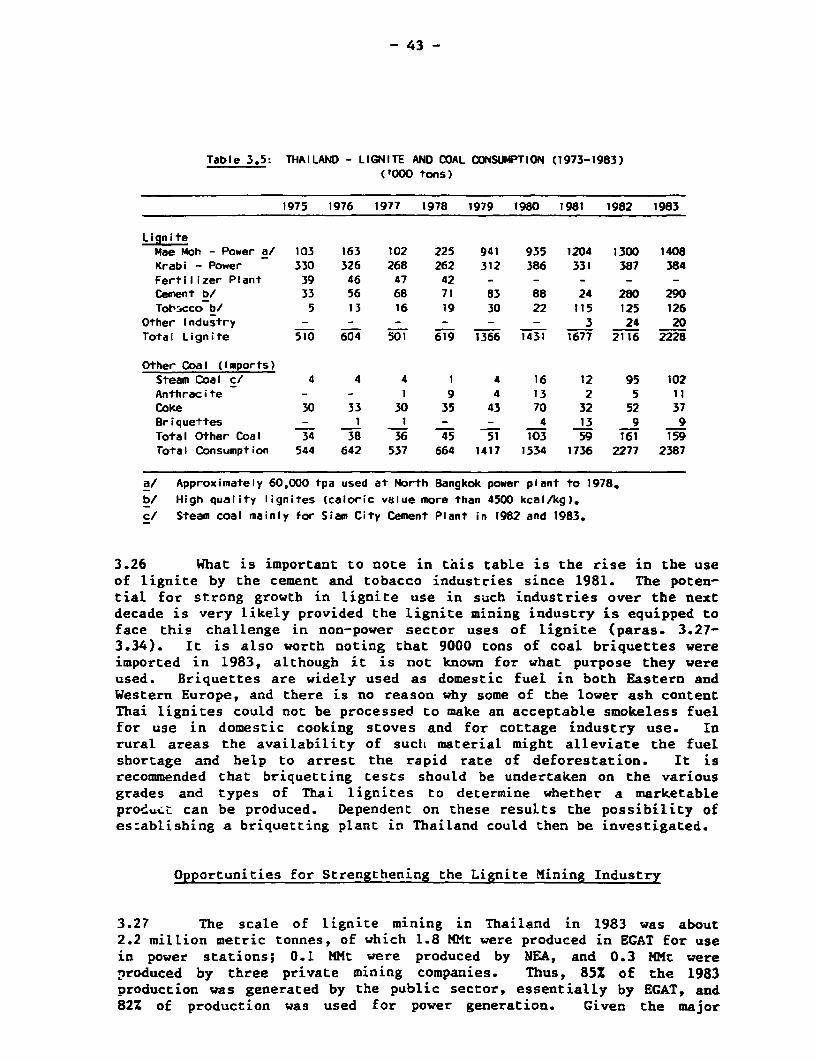
- 43 -
Table 3.5: THAILAND - LIGNITE AND COAL CONSUMPTION (1973-1983)
(1000 tons)
1975 1976 1977 1978 1979 1980 1981 1982 1983
LigniteMae Moh - Power a/ 103 163 102 225 941 935 1204 1300 1408
Krabi - Power 330 326 268 262 312 386 331 387 384Fertilizer Plant 39 46 47 42 - - - - -Cement b/ 33 56 68 71 83 88 24 280 290
Totbicco b/ 5 13 16 19 30 22 115 125 126Other Industry - - - - - - 3 24 20
Total Lignite 510 604 501 619 1366 T431 1677 2116 2228
Other Coal (Imports)
Steam Coal c/ 4 4 4 1 4 16 12 95 102Anthracite - - 1 9 4 13 2 5 11
Coke 30 33 30 35 43 70 32 52 37Briquettes - 1 1 - - 4 13 9 9
Total Other Coal 34 38 36 45 51 103 59 t61 159Total Consumption 544 642 537 664 1417 1534 1736 2277 2387
a/ Approximately 60,000 tpa used at North Bangkok power plant to 1978.
b/ High quality lignites (caloric value more than 4500 kcalAkg).
c/ Steam coal mainly for Siam City Cement Plant in 1982 and 1983.
3.26 What is important to note in tnis table is the rise in the use
of lignite by the cement and tobacco industries since 1981. The poten-
tial for strong growth in lignite use in such industries over the next
decade is very likely provided the lignite mining industry is equipped to
face this challenge in non-power sector uses of lignite (paras. 3.27-
3.34). It is also worth noting that 9000 tons of coal briquettes were
imported in 1983, although it is not known for what purpose they were
used. Briquettes are widely used as domestic fuel in both Eastern and
Western Europe, and there is no reason why some of the lower ash content
Thai lignites could not be processed to make an acceptable smokeless fuel
for use in domestic cooking stoves and for cottage industry use. In
rural areas the availability of SUChI material might alleviate the fuel
shortage and help to arrest the rapid rate of deforestation. It is
recommended that briquetting tests should be undertaken on the various
grades and types of Thai lignites to determine whether a marketable
produ.; can be produced. Dependent on these results the possibility of
es:ablishing a briquetting plant in Thailand could then be investigated.
Opportunities for Strengthening the Lignite Mining Industry
3.27 The scale of lignite mining in Thailand in 1983 was about
2.2 milLion metric tonnes, of which 1.8 MMt were produced in EGAT for use
in power stations; 0.1 MMt were produced by NEA, and 0.3 MMt were
produced by three private mining companies. Thus, 85% of the 1983
production was generated by the public sector, essentially by EGAT, and
82% of production was used for power generation. Given the major

- 44 -
expansion in lignite use for power generation under way, production forthe power sector could rise tc about 12 million tons a year by the early1990s. In addition, the cement industry is expected to increase itscapacity from about 9.5 million tons in 1984 to about 17.5 million tonsin 1995. By that time lignite could meet about 352 (2 million tons/year)of this industry's energy needs (para. 6.54) if it is competitive withimported coal and/or natural gas in such end-uses. Other industrial usesof lignite could consume another 0.5-1.0 million tons a year by thattime.
3.28 Most private lignite mining operations in Thailand are smalland undercapitalized. These characteristics appear to prevail for muchof the national mining industry in addition to the lignite part of it.These companies are involved in mining higher grade lignite ores for useoutside of the power sector. The key issues therefore that need to beaddressed are:
(a) how to strengthen the role and activities of the private sectorin lignite mining, especially with the objective of increasingthe exploration, production, transport and use of high gradelignite in non-power sector activities over the next decade;and
(b) ho; to harness the financial strength of ECAT's mining acti-vities for power sector use to achieve these objectives.
3.29 Under current arrangements, EGAT mines exclusively for thelarge, secure and rapidly growing power sector market, and the privatesector operators attempt to increase exploration and production for, anduse of, high quality lignite in the more difficult industrial market.These arrangements may not be optimal and could limit penetration oflignite as an energy source in the economy outside of the power market.12/ A healthy mining industry in Thailand needs the support of a stablelong-term market such as that provided by the power sector if it is toattract the additional capital, professional expertise and industrialuser commitment to lignite which are needed to provide for the possibleincrease in demand by industry. Penetration of the industrial market,particularly cement, is more complex than mining lignite for mine-mouthpower generation because of:
(a) the small current size of the market, which makes it difficultfor small operators to undertake the level of improvementsneeded to achieve significant growth;
121 Current World Bank covenants covering its first and second Mae Kohlignite projects limit the use of lignite produced under theseprojects to power generation by EGAT.

- 45 -
(b) the need to identify and develop more high quality lignitemines (low in ash and water content and high in calorific 13/value) to allow the mineral to be transported to users competi-tively and to partly sustain the high temperatures needed incement kilns; and
(c) the requirement to improve the transport infrastructure frommine to end-user so that costs are further reduced.
3.30 In assessing the roles of the private sector and EGAT in futurelignite mining operations the issue of the efficiency of some privatemining interests needs to be addressed. Presently EGAT sub-contracts toa Thai joint venture contra:tor (selected through local competitivebidding) for the removal of 60% of overburden at Mae Moh for the1984-1990 period. The local contractor is to remove some 90 million bankcubic meters (BCM) of overburden while EGAT would remove 60 million BCMof material (25 million BCM of lignite and 35 million BCM of overburden)with its own personnel and equipment. At Mae Moh, in 1984 the privatecontractor moved 5.5 millicn BCM at an average cost of US$1.47/BCM, whileEGAT moved 12.1 milLion BCM at an average cost of US$2.38/BCM. ThoughEGAT's task may be complicated because it consists of removing materialbetween the lignite seams and from deeper levels than those worked by thecontractor, the difference still is sufficient to make it appear that theprivate contractor can excavate the lignite at a substantially Lower costthan EGAT. Apart from the direct cost comparison cited above, acomparison of the relative efficiency of private sector and EGAT miningoperations should consider that the lat,.er has benefited from a number ofindirect subsidies, such as the government's waiver or customs duties forimported equipment, and access to capital on favorable terms in the formof World Bank loans backed by government guarantees. Such loans haveamounted to US$131 million. The government contribution to EGAT's miningoperations through remission of customs duties in 1984 is estimated tohave been equivalent to 9% of total investment, or US$3.9 million.During the same period, EGAT earned about 12% return on its revaluedmining assets of about US$180 million, or $21.6 million. This means thatnearly 18% of EGAT's return on mining assets was due to an indirectgovernment "subsidy." If, with these advantages, EGAT's costs ofoverburden removal are about 60% above those of the private miningcontractor, there would appear to be a strong case for either furtherimproving EGAT's mining efficiency or for EGAT to continue increasedreliance on private contractors for overburden removed. It would appearthat the contractor's productivity is higher, enabling him to mine atlower cost witlh higher equipment utilization rates and lower laborcosts. The key issue therefore becomes to improve the efficiency of thelignite mining industry as a whole while building on the areas ofstrength in EGAT's operations.
3.31 This objective couLd be achieved through various options, oneof which is the full privatization of the industry. The government is
13/ In the region of at least 4,500 kcal/kg.

- 46 -
increasingly concerned about the level of the country's foreign debt,especially the public sector foreign debt service, which is limited bylaw not to exceed 9% of foreign exchange earnings. The Mae Moh mine hadabout US$180 million of assets at the end of 1984, much of itrepresenting foreign exchange costs. To raise the level of ligniteproduction at Mae Moh and other deposits above 12-13 million tons/year bythe early 1990s, further major purchases of new mining equipment (much ofit in foreign exchange) will be called for. It is in seeking to relievesome of this burden while concurrently improving efficiency, that somedegree of privatization (involving local and/or foreign privatecompanies) of mining operations should be assessed.
3.32 The method and extent of further private participation in theindustry may be limited by practical considerations. Full private owner-ship of all lignite mining operations is unlikely (even if foreign parti-cipation is contemplated) given the size of the investment and the factthat EGAT is the only large buyer of lignite and is likely to remain soeven if major penetration of the non-power market occurs in the nextdecade. Another possible mechanism includes leasing the mining assets toa private operator of the mine. Care has to be exercised in sucharrangements to ensure that the operator does not skimp on equipmentmaintenance resulting in breakdowns and production interruptions.Contracts would also have to be concLuded between EGAT and the operatorregarding grades and quantities of lignite to be delivered with penaLtiesfor failure to perform.
3.33 One of the arguments put forth in favour of maintaining thepresent arrangements in the lignite mining industry is that, with EGATcontrolling both Mae Moh mining and power generation, it is unlikely thatthe level of coordination this allows between the two functions could beduplicated if there were two separate operators. Although this is valid,there is stiLl:
(a) a desire to increase the efficiency of overall miningactivities and strengthen the mining industry as a whole;
(b) the need for measures to facilitate the penetration of ligniteuse outside of the power sector and to identify and developadditional mines with better quality lignite than Mae Moh; and
(c) t concern about somewhat limiting the scale of increases inpublic foreign indebtness as the sector expands over the nextdecade.
3.34 Most of these objectives could be met by forming a jointventure mining company between EGAT, local and foreign private miningpartners, with EGAT holding majority interest. This suggestion wasconsidered by the joint Bank/NESDB Energy assessment team as a valid anduseful option worthy of further analysis. Such a company could be esta-blished by starting with the lignite department of EGAT and its assets,while the private sector partners would acquire minority interest in thenew company through cash contributions for equity. One option would befor this new joint venture company to take over EGAT's mining leases and

- 47 -
be issued with leases to explore for, produce, and market lignite forpower and t.on-power uses. The possibility of foreign equity parti-cipating in such a joint venture operation is not clear, since lignite isnot internationally traded and the expected dividends, in foreignexchange, would have to be higher than the opportunity cost of capital tothe private investor. Another option could involve leaving operations asthey currently are for low quality lignite for power sector use, whileputting more incentives in place to encourage private sector activity inthe exploration and production of high quality lignites for industrialuses. What appears desireable is that the issues and opt..ons ofstrengthening the lignite mining industry further need to be analyzed ingreater depth to provide the basis for a new policy thrust.
Environmental Issues
3.35 A final issue to be addressed concerns the environment at MaeMoh in the mid-1990s. At th.! scale of mining anticipated, issuesregarding disposal of overburden and ash, and backfilling of mined outareas are likely to assume serious proportions. If planned beforehand,the cost of remedial measures is not generally excessive. It could beargued that a joint venture company in which EGAT had majority interestwould be more likely to undertake this duty in a more conscientiousmanner than a private mining company which wishes solely to maximizeprofits.
Lignite Costs and Value
3.36 Since lignite mined at Mae Moh is produced by ECAT exclusivelyto supply its mine-head power plants, operations at this largest mine :nriailand do not reflect a market price for lignite nor its relativeworth. Studies undertaken in 1983 14/ determined the opportunity cost oflignite at Mae Moh to be about US$18/ton (US$1.70/MMBTU).15/ This wasclose to the transfer price of lignite between EGAT's mining and genera-tion departments of US$19.22/ton in 1983. It was also estimated that theeconomic rent, or depletion premium, of lignite is small due to theeconomic size of the Mae Moh reserves, future mining costs, and uncertainestimates of repLacement fuel costs (essentially imported coal) at thetime the reserve is depleted. As such, the opportunity cost of ligniteat Mae Moh is close to its mining costs which are estimated to remainfairly constant in real terms over the next several years. The degree towhich lignite can be competitive with imported coal, fuel oil, andnatural gas is discussed below (paras. 5.38 and 6.57).
3.37 The sector of lignite use which most closely reflects marketPrices is cement, where high grade lignite is involved. As noted below(para. 6.54), lignite currently is moved considerable distanc.2s (about
14/ Lignite Pricing Study by Meta Systems, Inc. (1983).

- 48 -
550 km) by private operators at highly competitive transport costs(USC2/km). The delivered prices 16/ of lignite in the Saraburi area(center of the cement industry) in 1984 were US$30-33/ton(US$1.68-1.84/MMBTU), 17/ of which roughly one-third of the pricerepresents the transport cost element. This implies a mine-head price ofsome US$22/ton (US$l.23fMMBTU) for a private operator.
Hydropower
3.38 The totaL hydropower potential of rivers in Thailand (i.e. com-pletely under Thai control) is estimated to be 8,300 MW, offering anannual energy generation potential of 14,330 GWh/year; of the latter,installed capacity was 1,809 MW in April 1985. The average load factorfor hydra generating plants is only 32% because the majority of theplants are used for intermediate and peaking purposes.
3.39 Apart from the installed capacity, a further 429 MW is alreadyunder construction, and ECAT's development plan calls for an additional840 MW of hydro capacity to be installed by 1995, when the total shouldbe 3,078 MW with an energy generating potential of 6,600 GWh/year. Thiswould represent about 37% of the estimated indigenous hydro capacity and46% of its hydro energy generation potential. Most of the remainingsites are small and apparently have limited economic potential despitetheir high aggregate amount. It is possible that many of the smallersites could be exploited for local use outside the interconnected gridsystem (mini-hydro).
3.40 NEA has been in charge of the development of mini-hydro plantsoutside the integrated EGAT system, although the management of many ofthese is turned over to ECAT management upon completion of construc-tion. The principal potentiaL for this development is in the northernprovinces of Thailand. By the end of 1984, NEA had completed five mini-hydro projects and had seven more under construction or planned, for atotal of 75 MW of installed capacity. "Micro-hydro" projects of 5 kW to200 kW capacity have been installed at twelve sites, and ten more areunder construction or planned, for a total installed capacity of 1 MW.The installed cost of these projects is high, around $3,500 per kW,including transmission and distribution. Thus, the construction of suchprojects must be justified more on social grounds than economic ones.
3.41 The hydro capacity of rivers within Thailand is dwarfed by thepotential of rivers forming the Thai frontier with Laos and Burma. Ten
15/ Based on an average Mae Moh calorific value of 2,700 kcal/kg.
16/ Monenco Study (1984) of Potential Coal Demand.
17/ Based on high grade, more than 4,500 Kcal/kg lignites.

- 49 -
possible sites on these rivers would have an installed capacity of14,000 MW and an energy generation of 90,000 GWh/year. The Pa Mong siteon the Mekong River alone could have an installed capacity of 4,800 MWand thr Salawin Project on the Burmese border could have another31'J00 NW. Problems impeding the development of these projects are asmuch political as technical. Their development would require agreementbetween the riparian powers. Since neither Burma nor Laos is likely tobe in a position to absorb the energy provided by such projects, any suchagreement would have to include acceptable terms for ThaiLand to use theother countries' shares of the energy generated. Given the long leadtime required for constructing such large projects, it is probably nottoo soon for Thailand to initiate preliminary negotiations with the twoneighboring countries, although it is unlikely that any energy will beavailable from these sources until some time early in the next century.Unless there are further major increases in gas, oil and/or l1ri,:tediscoveries in Thailand over the next decade, by the beginning of thenext century imported energy will again play a significant role inmeeting the power sector's requirement. Within this context, inter-national hydro would become an important alternate option. Thailandcurrently imports power generated at the 150 MW Nam Ngum hydro installa-tion in Laos. These imports have been transmitted to the Thai gridwithout any non-technical break since the initial Nam Ngum units werecommissioned in December 1971. Many other hydro sites which could bedeveloped exist within northern Laos. Six of the largest of these siteshave a total capacity in excess of 4,000 MW with an estimated energygeneration of 17,500 GWhlyear. Desk top studies have suggested thatprobably all six of these would be economic to develop with a view toexporting the power to ThaiLand. The most favorable of these sites is onthe Nam Theun with a potential of 1,200 MW. A recently completedprefeasibility study of this site indicates that 5,000 GWh/year could bedelivered to the Thai grid at a very competitive price. The studysuggests that, given favorable encouragement by Thailand, the first 600-MW phase of the project could be commissioned in 1996 and the second 600-MW phase in 1997. The early involvement by Thailand during the pre-development stage would help ensure that the development of such siteswould be timed to fit in with Thailand's energy and power requirements.

- 50 -
Table 3.6: THAILAND: INDIGENOUS HYDRO POWER
Capacity Energy LoadInstalled Oependable Average Firm Factor
(MW) (GWh) (S)
1. Installed 1,809 1,533 5,007 3,346 322. Under Construction 429 358 528 217 143. Planned for Completion
1988-95 a/ 840 - - - -
Total 3,078 ? 6,600 ? 25
4. AdditionalIdentified Site 1,750
5. Mini-Hydro 800 800
Total 5,628
Theoretical Potential 8,300 14,330 20
a/ Includes Nao Choan with capacity of 580 MW.
Source: Items 1-2 EGAT Power Development Plan (1985-2001), May 1985, other itemsmission estimates.
Biomass
3.42 The residential sector in Thailand has traditionally relied onwood and charcoal for cooking fuel. However, population pressure on theland and constantly increased felling of trees have placed the long-termfuture of this fuel resource in jeopardy. At present some 36 millionpeople (75% of the population) reside in rural areas. In 1980, about 40Zand 55% of rural households used wood and charcoal, respectively, astheir principal cooking fuel. The combination of fuelwood collection,agricultural expansion, commercial fellings and the effects of urbaniza-tion have reduced the country's forested land area from 27 to 16 millionhectares over the last 25 years. It is further estimated that, by theturn of the century, the forested land area is likely to have decreasedto 11 million hectares if current trends continue (para. 8.25). Thesustainable yisld for all of Thailand's forests is estimated to be about37.5 millon m (9.6 million TOE) a year relative to current deiand of 39million m . However, as only about 20% (around 8 million m ) of theforests are economically accessible, there is a very high level ofovercutting near inhabited areas, which reduces the sustainable yieldfrom this source in future years. The net effect is that forests nearinhabited localities are being heavily overcut, thus requiring thetransport of woodfuels from greater distances each year. This in turnimplies that the cost of wood and charcoal will increase steadily in thefuture.
3.43 In addition to wood, substantial quantities of bagasse andpaddy husk are consumed as fuel in the sugar and rice industries. Thesefuels are utilized by the industries producing them and do not generallyfind their way into domestic consumption in large quantities. The

- 51 -
quantities produced and used are directly proportional to the level ofactivity in the industry involved, i.e., bagasse in the sugar industryand rice hulls in rice mills. There is a substantial qurplus of ricehusks and bagasse not required by their processing industries to meetcaptive energy demand. Research is in progress to see if these can beturned into usable domestic or industrial fuels in order to relieve thepressure on fuelwood supplies (paras. 8.34-8.35).
Oil Shale Resources
3.44 It has been well known for several years that Thailand hasreserves of oil shale in the Tak Province. The area of the sedimentarybasin of tertiary deposits in Thai territory is about 500 kms . Thereserves of oil shale are estimated at about 6 billion barrels. TheDepartment of Mineral Resources (DMR) has been conducting an expLorationdrilling program in this region since February 1974. Through a chemicalanalysis of the oil shale samples from drilling data, the quality andquantity of oil shale have been evaluated. The results indicated thatoil shale quantity ranges from 1% to 26% by weight or 10 to 330 litersper ton of oil shale. The specific gravity of oil shale was about 0.9 at600F. At the 1985 level of oil prices and given the prospects for theseprices over the next several years, the exploitation of shale oil inThailand would not be competitive. As such, this area of resourceexploration and development should be given low priority in theassessment team's view.

- 52 -
IV. ENERGY RESOURCES - OIL AND CAS
Background and Occurrences
4.1 Small quantities of oil have been produced from the Fang areaof Northern Thai!snd for many years but the modern phase of the industrybegan with the discovery by Union Oil of the Erawan gas-condensate fieldin the GuLf of Thailand in 1974. Another large gas fieLd was discoveredfurther south in the Gulf by Texas Pacific. Subsequently, Shell dis-covered oil at Sirikit, north of Bangkok in 1981, and Esso discovered gasin the Khorat Plateau of northeast Thailand. With the exception of theKhorat gas, which is produced from relatively old rocks, the oil and gasfields of Thailand produce from five sedimentary basins containing rocksof relatively young geol-ical age, mainly sands and shales, locatedalong the axis of the central valley and extending south into the Gulf ofThailand. There is another sedimentary basin off the west coast ofThailand which is relatively unexplored and its petroleum potentialcannot be evaluated with any precision at this time.
4.2 Most of the fields which have been discovered so far aregeologically complex, much broken up by geological faults, and havereservoirs which are laterally discontinuous. This is the case with theErawan field, whare experience has shown that it is in effect an agglom-eration of small discrete accumulations rather than the large individualfield it was originally thought to be. The corollary of t'iis is thatlarger numbers of wells are needed to develop any discovery, and indivi-dual well recoveries are relatively low, while the fields themselves aresubject to relatively rapid declines once they have reached peak produc-tion. There is also the likelihood that over time many small oil and gasfields rather than a few large ones will be found. All of this hasconsequences of major importance for the future of the oil and gasindustry in Thailand, and, in particular, government policy (paras. 4.40-4.48). One of the most important of these is that, in order to maintaina given level of production, a steady, continual pace of exploration isneeded. Another consequence is that the investment per unit of produc-tion will be higher in Thailand than it would be in, for example,Indonesia or Malaysia. The legal and fiscal system governing the oilindustry must take account of these factors if steady progress is to bemade in producing oil and gas, as opposed to the stop-and-go regime whichhas characterized exploration activity so far.
4.3 The reasons for the Lack of continuity in cxploration aremany. Some are based on international oiL industry factors beyond thecontrol of the Thai government; others are the results of gaps ordeficiencies in the existing petroleum iegislation, ard of actions takenunilaterally by RTG with regard to the fiscal treatment of oil and gasdevelopment by private companies which the latter regarded as financiallydetrimental to their interests. The initial disappointment to theprivate concession holders in the Gulf of Thailand was the failure to

- 53 -
discover sizeable oil accumulations. The only significant discoverieswere those made by Union Oil and Texas Pacific which consisted of gas/-condensate fields that could not be produced until there was a market forthe gas. This resulted in all but these two companies relinquishingtheir concessions. The prolonged negotiations over the price to be paidby the government for gas produced from the offshore fields (which stillhave not been concluded in the case of Texas Pacific) and the associateduncertainty for explorers about that price, and the disillusionmentresulting from the realization that the producible reserves and produc-tion rate of Union Oil's Erawan field were much less than had beenforecast, all had a discouraging effect on further exploration off-shore. The discovery of oil at Sirikit by Shell in 1981 was veryencouraging for future oil exploration in Thailand as a whole, but itseffect was largely negated by DMR's publication in 1982 of addicional taxrequirements, on the eve of a general weakening in international oilprices.
Oil and Gas Reserves
4.4 To date oil and/or gas has been found in five basins: FangBasin in northern Thailand, Sukhotai in north-central Thailand, Khorat ineastern Thailand, the northern Gulf of Thailand, and the central andsouthern Gulf of Thailand. In northern Thailand the Defense EnergyDepartment has been producing small amounts of oil from Miocene sandstonereservoirs associated with a lacustrine shale source; between 300-500bbl/day of medium gravity high paraffin oil have been produced in theFang Basin over the past 20 years. There are several discoveries, themost important of which is Mai Soon. Additional discoveries in the FangBasin are likely and at least six other similar basins -- several consid-erably larger than the Fang Basin -- exist in northern Thailand but havenot yet been tested by the drill. Shell has found at least four oilaccumulations in the Sukhotai Basin, of which the Sirikit Field is theprincipal discovery. Sirikit produces from lacustrine/fluvial Miocenesandstone with a probable Miocene lacustrine shale source. The structureappears to be a remnanL of a collapsed anticline. Additional finds onthe Shell Block are likely, and a discovery in an adjacent block wasreported recently. Esso has tested two gas discoveries on its KhoratBlocks and encountered a strong indication olh a third feature(Channobot). Gas is reservoired in upper Paleozoic carbonates which havelow matrix porosity caused by fractures below the mid-Triassic unconfor-mity. Amoco tested oil and gas in Block 5/27 (now PTT) in the upper Gulfof Thailand from L. Miocene sandstones. Union has eleven discoveries(several may be combined for production), and Texas Pacific made threediscoveries in the central and southern Gulf of Thailand (Pattani Trough,an arm of the Malay Basin). These fields produce from Lenticular fluvialsandstones of Miocene/ Oligocene age. Structures are north/southoriented collapsed features with a high density of faulting. Table 4.1indicates present estimates of proven oil and gas reserves.

- 54 -
Table 4.1: THAILAND OIL AND GAS RESERVES(as of February 1985)
Proven ReservesField OiJ/Condansate Gas Operator Location
(millionbarrels) (BCF)
Erawan 25.6 628 Union OffshoreBaanput 8.2 165 Union OffshorePlatong 4.5 144 Union OffshoreSatun 10.0 580 Union OffshoreKaphong - - Union OffshorePladang - - Union OffshoreFunan - - Union Offshore.lakrawan - - Union OffshorePakarang - - Union OffshoreTrat - - Union Offshore"B" b/ 10.6 1,799 Texas Pacific Offshore"E" ;I 2.4 125 Texas Pacific OffshoreSirikit cl 36.3 - Thai Shell OnshoreSirikit-West cl 1.4 - Thai Shell OnshoreNam Phong - 280 a/ Esso Khorat Onshore
Total 99.0 3,721
a/ Estimate by Department of Mineral Resources (DMR).b/ Estimates of the Texas, Pacific Band E structures have not been
revised downwards to take into account the Erawan experience.cl A small amount of associated gas exists at t;he Sinkit field,
though it is not shown here.
Source: NESDB Working Group on Energy Supply and Investment for 6th
Five Year Plan (March 1985).
4.5 The structural and stratigraphic complexities previouslyreferred to (fragmenting reservoirs into small components - fault blocksand/or sand lenses) make the estimation of recoverable reserves, i.e.,the fraction of in-place reserves that will be produced, difficult in theabsence of production history and reservoir performance. This situationcauses recoverable reserves and production levels to be unusually sen-sitive to price/cost relationships and highly dependent on well densityand abandonment levels. This sensitivity of reserves to price isimportant in a situation where there is little margin between productioncost and price/value, especially during periods of weak international oilprices which act as the ultimate marker of gas value. This is wellillustrated by the dramatic reduction in estimates of recovery factors atErawan, from 82% of in-place gas reserves -- a rether standard expectedgas recovery fraction -- to approximately 35%. Clearly, if the price/cost relationship were to improve, recoverable reserves would increasethrough higher density of drilling, produced from more reservoir compart-ments, or lower abandonment levels. On the other hand, if the price/cost

- 55 -
relationship were to deteriorate significantly, it would not be economicfor the producer to develop the field at all. The Erawan lesson has beenwell taken and applies to most if not all of the fields discovered inThailand to date; the reserves estimated above and the undiscoveredpotential estimated in the following paragraph therefore incorporate aconservative approach to the expected recoverable fraction. To maximizerecoverable reserves from both past and expected future discoveries andthereby maximize government benefit, the nperator must receive thehighest justifiable price and keep a tight control on his costs. In thiscontext, government benefits come directly from royalty and taxes ratherthan on the margin between price and costs.
4.6 The potential oil and gas resources for Thailand are estimatedin Table 4.2.
Table 4.2: roTAL ESTIMATED POTENTIAL OIL AND GASRESOURCES IN THAILAND
TotaI ExpectedBasin Oil/Condensate Gas
(million barrels) (BCF)
Northern 150 250Central 500 1,500Khorat 5 7,500Northern Gulf 50 200Western Gulf 100 600Southern Gulf 180 6,000
Total 985 16,050(excluding Andaman Sea)
Andaman Sea 165 3.200
Total 1,150 19,250
Source: Based on data frem exploratory activity.
As shown, total potential oil/condensate and gas resources in Thailand(including the Andaman Sea) amount to some 1.15 billion barrels and 19.3trillion cubic feet, respectively. However, proven reserves to date ofoil and condensates only represent about 9% of total potential while inthe case of gas, current proven reserves are around 19% of totalestimated resources. From this it is clear that there is still consider-able scope for increased discoveries of oil and gas in Thailand. Suchdiscoveries should be forthcoming, provided government adopts the appro-priate policies to encourage a higher level of exploration anddevelopment activity by the private oil companies as well as measures toensure a key role for gas in the energy supply mix.

- 56 -
Cost of Gas
4.7 The assessment team estimated the economic unit cost of gas forthe following fields: Erawan (Union I contract, currently producing);Baanpot, Satun and Platong (Union II contract also producing); Union IIIcontract (not yet negotiated); Texas Pacific "B" structure (not yetnegotiated), and Esso-Khorat (negotiations not completed). Based on theassessment team's estimate (para. 4.32-4.39) of gas supply under ScenariorI investment costs for field exploration and development as well asdelivery costs, the costs of gas supply from the various fields inThaiLand were derived. The assessment team's estimate of these costs forthe Union I and II supplies at late 1984 prices are shown in Table 4.3.In relation to unit costs, projected production and costs have beendiscounted at a rate of 12%.
Table 4.3: COST OF NATURAL GAS SUPPLY (1984)(S per MMBTU)
ErawanUnion I Union II
1, Exploration & production 1.7 1.5
2. Foreign remittances 0.2 0.4
3. Well head cost 1.9 1.9
4. Govt. take (Royalty/ tax/PTT profit share) 0.5 0.6
5. Well Head price 2.4 2.5
6. Pipeline c'st a/ 0.6 0.6
7. Delivered cost (lines 3 & 6) 2.5 2.5
8. Delivered price (lines 5 & 6) 3.0 3.1
a/ Based on gas delivered to Bangkok.
4.8 It should be noted that the costs of exploration and productionare the estimates of the Bank, and the operating companies may notnecessarily concur with these cost estimates. Further, as noted above,the timing and quantity of gas production are subject to substantiaLuncertainties. Accordingly, the unit cost of exploration and productionwould need to be revised in the event of changed expectations regardinginvestment costs and gas supply outlook.
4.9 For purposes of estimating the production costs of gas, conden-sates have been treated as a by-product and the income derived therefromhas been netted against the field operating costs. WhiLe Union's fields

- 57 -
are expected to have the lowest productivity of gas on a per well basis,they are at the same time projected to produce rich gas which would yieldthe highest production of condensates. The opposite is expected ofEsso's onshore operation at Khorat in that it would have the highestproductivity of gas per well but negligible condensate production. TexasPacific fields, when compared with those of the other -wo producers, areexpected to have medium productivity of both gas and condensates.Detailed assumptions on gas and condensate productivity for the variousfields are set out in Annex 4. In effect, the high unit cost of gas atUnion's fields (which has resulted from the low productivity of gas perwell) is partially offset by the income from high condensate yields.Similarly -- but to a lesser extent -- the unit cost of Texas Pacific gasmay be reduced by condensate income.
4.10 In addition to the exploration and production cost, the wellhead cost of gas to Thailand includes a return to equity capital of theproducers. It has been assumed that these profits accruing to theforeign concessionaires would be remitted abroad. While in principle thewell head cost should also include a depletion premium, it is presentlyestimated to be small 18/ and has been treated as zero in this report.Determination of the depletion premium is dependent on:
(a) the cost of gas production;
(b) the cost of replacement fuels (additional gas from exploration,coal and/or fuel oil) when the gas runs out; and
(c) the lifetime of the gas reserves.
The cost of gas produced and delivered to Bangkok is high and isestimated to be US$2.4-2.8/MMBTU for known fields. This implies that theavailable rent is small. Second, because of the difficulty in estimatingthe cost of replacement fuels when the gas runs out, this can only betermed speculative. The major uncertainties about the evolution of theseprices over the next twenty years make estimates about the cost ofreplacement fuels to gas that far in the future little more than educatedguesses. If the reserves are assumed to have a 30-year life and replace-ment fuel costs assumed to be constant in real terms over this period thedepletion premium is negligible. Based on the current state of knowledgeof the country's gas reserves, gas production costs and the future valueof fuel to replace gas when it is depleted, the assessment team hastreated the depletion premium as zero.
4.11 Well head prices of gas include both well head costs andgovernment take from the various fields. government take has beenderived from royalty, income taxes paid by the foreign operators as wellas PTT's profit share in case of joint ventures. A royalty of 12 ½Z has
18/ PEIDA Energy Pricing Study, 1984.

- 58 -
been calculated on the basis of gas and condensate revenues to theproducers. Income taxes of 50% have been estimated on the basis ofprojected production costs and well head prices for each field.
4.12 Well-head prices for fields not covered under the existingcontracts, namely Union's third contract and those of Texos Pacific andEsso, have been estimated assuming that the delivered price is equal tothe adjusted price of imported coal (which is the fuel likely to besubstituted at that time). The well-head price is then the imported coalprice 19/ minus the cost of transporting gas. By and large, future gassupply contracts would provide for incremental gas supply over and abovethe demand for fuel oil replacement and generaLly would be substitutingimported coal and/or lignite for power generation (para. 3.36). As aresult, imported coal has been taken as the relevant parity 19/ for esti-mating the value or opportunity cost of gas from these fields. Deliverycharges include the costs of pipeline and compressors (if any) and aprofit margin to allow the pipeline operator a reasonable rate of returnon investment. In the case of shared delivery system costs such as thesubmarine trunk line and offshore compressor, a cost allocation has beenmade on the basis of gas volume.
4.13 The delivered cost of gas to Thailand includes the well-headcost plus pipeline cost. Based on the assessment team's estimates themost expensive source of gas worth developing, depending on the futureprices of fuel oil/coal, is expected to be Texas Pacific. Based on themethodology mentioned above for estimating the well-head prices forfuture gas supply contracts, the economic costs of gas from the variousfields may vary only within a small range of about $0.4 per MMBTU.Furthermore, the well-head prices so derived may yield an adequate,though not high return to the producers of all the fieLds.
4.14 However, as already noted, gas reserves and development costsare subject to considerable uncertainty. If these major parameters turnout to be less favorable than the Bank estimates, the Texas Pacific (TP)field, in particular, could be of only marginal commercial interest,especially if oil/coal prices decline further. This is mainly becausethe delivered cost for TP gas is likely to be the highest among all theknown fields, and therefore its producers could expect to receive a lowerwell-head price than for closer fields.
Fiscal/Legislative Regimes and Suggested Revisions
4.15 The existing petroleum legislation in Thailand provides a basicframework for petroleum exploration by private oil companies which isessential because the government has neither the risk capital nor thetechnical expertise to undertake this activity on its own. However,
19/ Adjusted for the additional costs of capital and operations andmaintenance associated with coal use in the power sector.

- 59 -
certain aspects of the legislation require clarification, modificationand updating if exploration activity is to be renewed and sustained.
4.16 The present fiscal regime under which oil and gas producersoperate in Thailand is biased against the development of small fieLdsbecause of its heavy reliance on royalty payments to the government.There are several aspects of the fiscal/legislative regime that need tobe considered:
Royalty: in effect, this is a fixed tax on production irrespectiveof cost or production rate. As such it is regressive in respect ofsmall marginal fields which, for geological reasons, may be morecommon in Thailand than larger fields. It is suggested that royaltypayments be graduated according production rate, with lower produc-tion rate fields paying less royalty than the present 12½Z. Underthe present regime the Fmallest offshore oil field which couldprofitably be developed is around 15 million barrels. Suitablemodification of the tax regime could reduce this threshold to about10 million barrels. The economic thresholds onshore would be lowerbecause development costs are lower, but the same general principlesapply. It does not appear to be in the national interest to inhibitthe development of small oil and gas fields since their aggregatecontribution to total production could be significant. However, anychanges to the existing fiscal regime must be approached cautiously,and only after full discussion with the private operators. Fewthings are as disturbing to investor confidence as sudden andarbitrary changes in the taxation system.
U.S. Tax Compatibility: minor changes are needed in the currenttaxation system to ensure compatibility with US tax regimes. Inthis context, any modifications in the petroleum industry's fiscalregime should take into account their effect on the total tax paidby operators in Thailand to RTG and to their own governments. It isimportant that the two tax systems be compatible in order to mini-mize the effect of double taxation of profits, which again wouldhave an inhibiting effect on further exploration and development.Thailand should seek to ensure that producers are able to obtainmaximum advantage from home country tax systems. This will includemeasures such as allowing interest as a tax reduction.
Abandonment of 1982 DMR Special Benefits: the government shouldcease to apply 1982 tax and royalty demands for new concessions.They provide severe limits on the costs which can be offset againstincome, such that taxation in the early years is high compared withthe bases in most countries. The requirements also provided for asteep increase in royalties unrelated to profits. These measuresare more appropriate for Malaysian-style hydrocarbon discoveries ofche immediate post 1979 period and have proved unwise for Thailand.Although geologically attractive areas were offered to the industry,this action restricted the number of offers made to just a fewoffered by small under-capitalized companies. Several of these were

- 60 -
accepted. Acceptance of such offers brings risks of delay infinancintg, and exclusion of the majors reduces the range ofexploration expertise. Some offers were made by larger companieseager to initiate some exploration in Thailand. The assessment teamunderstands, however, that many of the companies are concerned thatthe fiscal terms will prevent production of small discoveries.
Other Legal Aspects
4.17 Apart from the three key areas noted above, there are lesserbut nevertheless important aspects that could conveniently be tidied upat the same time. The various issues noted below are of substantialimportance to government but more minor importance to the companies, sothat they could be addressed as part of a wider package without mate-rially affecting the country's attractiveness as a place for explora-tion. They could also be implemented for existing concessions, afterfull consultation, in exchange for improved incentives.
4.18 Obligation to produce: currently companies can obtain 40-yearproduction licenses (30 plus 10) giving them substantial rights but noobligation to produce. Once the pricing basis is clarified (para. 4.27-4.29) it would be reasonable to include firm production obligations inany production license.
4.19 Exploration/production periods: overall exploration (12 years)and production (40 years) periods are very long by internationalstandards, particularly for oil, and could usefully be brought down tocustomary levels.
4.20 Relinguishments: in some cases exploration is aimed at opti-mizing relinquishment obligations rather than bringing discoveries on-stream quickly. A number of countries have built flexibility into theirregulations so that government can defer the relinquis;.ment obligationsin the event of a discovery in order for the discovery to be delineatedpromptly. This might also be in Thailand's interest.
4.21 Confidentiality: Thailand's provisions for the treatment ofoil company acquired data keep such data confidential as long as thelicense is in effect and for several years thereafter, which is morerestrictive than most countries. Further, the confidentiality provisionsare rigidly interpreted by the DMR as their sole responsibility and aMinisterial request is necessary for any other government entity toobtain access. Thus, valid uses of such data for the National Five YearPlan, gas network and railroad planning, and PTT and EGAT counterpartinvestments are substantially inhibited. The promotior. of Thailand'shydrocarbon potential to the international industry -- a particularlyimportant function belonging to the DMR --- is also neglected under theguise of confidentiality. Companies expect the government to use thedata collected and provided by them. They do not expect that a hard copyof that data will be sold or otherwise provided to competitors during theperiod of confidentiality. Reductions in the confidentiality period

- 61 -
should be incorporated in new contracts and attitudes within the govern-ment should be relaxed to permit the various agencies concerned to eitheruse the confidential data directly or require the DMP to provide thenecessary interpretations.
Joint Ventures and Participation
4.22 Present law and regulations do not provide for Thai participa-tion or for production sharing. The present joint venture provisions inmost concessions are vague and represent a disadvantage to Thailand.Either joint ventures or production sharing would have advantages overthe present system in giving larger benefits to the country.
4.23 Most production sharing systems require no cash input fromgovernment; instead, in a typical arrangement a share of production isused to cover costs and the balance is shared between government andcompany. In general, the average cash position would be comparable in ajoint venture system, but in this case government would have to providecash in the early period, with a view to getting greater benefitslater. Although carrying some financial risk, in a number of situationsthe joint venture system is more advantageous to Thailand at thisstage. The joint venture is important to ensure that the discovery isproperly proven before the joint venture is effective. It provides for amore effective transfer of technology and operating experience for Thainationals and a more harmonious relationship between the foreign investorand the country in the financial and operating areas. The joint venturesystem also avoids a major and unsettling change in legislation.
4.24 The most appropriate way of clarifying and simplifying theposition is for DKR regulations to specify inclusion of a joint ventureoption for a Thai oil company for all new concessions, to be activatedfor commercial developments after an adequate testing period (to minimizerisks) or to provide for a production sharing system as an alternative.The parameters would need to be set out in detail in DMR regulations.The Thai share of the joint venture should be pitched at a levelreflecting risks (both field and transport) ar.d ability to obtainfinancing, which for some of the larger gas options may mean a fairlyminor share of production.
Accelerating the Exploration and Negotiating Process and the Role ofGas/Oil Prices
4.25 The fields being developed by Shell (onshore oil) and by Union,which produces gas and condensate in the Gulf, are foreseen to berelatively shortlived -- typified by rapid production build-up with ashort peak production plateau, followed by equally rapid decline. As aresult, there is a clear need for continuing development of additionaldiscoveries and intensifying exploration efforts. Unless the contractingprocess can be simplified and speeded up, there is an imminent dangerthat discoveries will not be brought on-stream fast enough, leading to:

- 62 -
(a) a serious under-utilization of downstream investmeiLts inpipelines and gas recovery facilities;
(b) significant financial and economic losses to government interms of delayed or foregone revenues and economic benefits (interms of oil import displacement); and
(c) severe financial penalties for the private operators in termsof not being able to quickly recover their exploration costs.
4.26 As discussed below (para. 4.35), significant declines in oil,condensate and gas production capability levels from existing contractswith Union Oil and Shell are expected from 1989 onwards. Given the longlead times involved in finding and developing additional reserves, it iscrucial for government to satisfactorily conclude current negotiationswith additional companies regarding the development of discoveriesalready made, as well as adjusting regulations along the lines high-lighted above to accelerate exploration activity. The oil industry needsa clear signal that additional gas/oil contracts can be concludedexpeditiously with the government if it is to be convinced that there isa long-term national commitment t- gas utilization.
4.27 In addition, an issue in speeding up the negotiating process,and which requires early resolution is gas pricing. The lack of anyaccepted international reference point for gas prices to the producers inThailand is regarded as a major deterrent to further exploration and hasled to protracted negotiations and delays in the deveLopment of fieldsalready discovered. This damages both the companies and the country'sinterests. Given the high probability of finding gas rather than oil,companies embarking on exploration need to know at the outset at leastthe basis on which gas would be valued. This currently does not existand its absence inhibits oil exploration as well since exploration foroil and gas cannot be neatly separated.
4.28 In the assessment team's view, clear guidelines for the pricingof gas to producers and consumers need to be established immediately.Current gas contracts between PTT and Union Oil are based on a "cost-plus" approach (and therefore backward looking) with the gas pricederived at the "field-gate". In terms of escaLation, this price islinked partially to Singapore fuel oil prices (about 40X) as well as tothe U.S. and Thai inflation levels and the exchange rate of the Baht. Asa matter of policy, Thailand needs to move away from cost-based gaspricing for producers since it is clumsy, prone to cause extensive delaysin contract conclusion, and often leads to a decline in industry explora-tion and production activity. It also sends confusing signals toconsumers. The country should move to a market-oriented gas pricingsystem in which prices are closely related to the opportunity value ofgas rather than to producer costs. The assessment team endorses theproposal discussed by the joint World Bank/NESDB energy assessment teamfor the establishment of a gas Basing Point Price in Bangkok for allfuture gas contracts. This would be the wholesale price of gas at the

- 63 -
Bangkok end of the transmission system with consumers being chargeddifferent retail prices depending on volume, load profile interruptibil-ity, quality and distance from the basing point, etc.
4.29 One possible option for establishing a natural gas pricingsystem for new gas contracts in Thailand is discussed in more detailbelow; however, several features of such a pricing system can be set outhere (existing contracts, of course, would not be affected):
(a) a clear signal must be sent to producers and consumersregarding current and future principles governing the pricingof natural gas;
(b) the pricing system adopted must have a high degree of transpar-ency so that producers and consumers are able to determine wellhead prices and plant gate prices respectively, given a BasingPoint Price for gas in Bangkok;
(c) the gas pr_ 2 at the Basing Point must be directly linked tothe international prices of competing fuels, expressed as apercentage (yZ) of the fuel oil price in Singapore; thispercentage the assessment team terms the "discount parameter"(sub-para. (e) below);
(d) to address short term movements, the Basing Point Price will beadjusted on a quarterly basis to follow the behavior of thefuel oil price in Singapore, over the preceeding 90-day period;
(e) government will adjust every three-five years, the "discountparameter" in order to reflect the medium term changes in theopportunity cost of gas (as this varies between fuel oil andcoal parity) which in turn depends on the perceived medium termbalance between supply and demand for gas. Arrangements wouldneed to be built in to limit the effect on producers and toallow them sufficient certainty for investment decision makingand planning;
(f) in order to simplify and give transparency to the system, it isimportant that the gas transport cost be established clearly.In establishing the cost (or price for common carrier systems),the guiding principle would be a reasonable return oninvestment to the pipeline owner. The cost will also depend onthe volume, load factor, distance and interruptibility of thegas being transmitted.
(g) that government should implement tte above system concurrentlywith a revised tax and royalty system so that government takesits benefits through royalty and income tax on gas productionbased on profits measured at the well head.

- 64 -
4.30 There aoes not appear to be any prLblem regarding oil producerpricing in Thailand, as the current practice reflected in the contractbetween Shell and RTG appears adequate. Under this, the crude oil ispriced relative to international prices based on the refinery net-backresulting from distilling the crude and applying Singapore refinedproduct prices and an appropriate refinery margin.
4.31 In addition to measures dealing with modifications to thepetroleum legislative/fiscal framework and adoption of new policies ongas pricing, Thailand can take other steps to encourage the interest offoreign oil companies and accelers.e exploration efforts. This wouldinvolve DMR, which has vast amourcs of data -- some still confidential tothe government. It is importa.nt that DMR staff obtain a more thoroughunderstanding of the petroleum potential of each basin. Most commonlythis sort of understanding comes from basin studies by in-housegeologists supported by consultants. This understanding would enable DMRto make future projections of oil and gas discoveries and would highLightpriority areas where action would be important. In this way DMR couldplay an active role in the systematic promotion of promising acreage andin negotiating work commitments with interested companies.
Natural Gas/Condensate and Crude Oil Production
4.32 Natural gas and condensate production in Thailand began on acommercial scale in 1981 when Union Oil produced an average 128 MMCFD ofgas and 5,600 BbLs/day of condensate. Despite the early setbacks experi-enced by Union with its Erawan field (para. 4.3), in 1984 its gasproduction reached 214 MMCFD, 14% of which came from its second contractwhich became effective in 1984. Present estimates are that in 1985 totalgas production would rise to 485 MMCFD, 95% from Union's I & II contractand the remainder from '-hell's onshore Sirikit production. Thisrepresents nearly a fourfold increase in gas production within threoyears and can be considered a major achievement by the oil industry,government, and PTT (owner of the underwater pipeline in the Gulf linkingUnion's fields to Bangkok). Added to this, condensate production isestimated to reach 14,400 Bbls/day in 1985 (all from Union's fields)while crude oil supplied from Shell's Sirikit field should average 18,100bbls/day this year. This would represent about a sixtyfold increase inoil production relative to the 1981 level of 300 Bbls/day from the Fangfields produced by the Defense Department.
4.33 Table 4.4 shows the gas, condensate and crude oil productioncapabilities arising from the two Union Oil cortracts for Gulf productionand the Shell contract for onshore Sirikit production. These are theonly production contracts in place at present and therefore representreasonably firm estimates of likely production from these fields. Ofspecial significance is the fairly rapid decLine in production(para. 4.2) once the relatively short peak plateau has been reached.This lends added urgency to the need to accelerate the negotiationprocess for fields already discovered, since the long lead time for fielddevelopment requires that additional significant levels of gas, oil and

- 65 -
condensate production be brought on-stream by 1989/90 to avoid majordeclines in the availability of chese indigenous fields.
Table 4.4: NATURAL GAS, CONDENSATE AND CRUDE OIL PRODUCTION CONTRACrED AS OF APRIL 1985
Union Erawan a/ Union 11 b/ a/ Shell-Sirikit c/d/ TotalGas Condensate Gas Condensate Gas Crude Oil Gas Crude Oil Condensate
Year MMCFD Bbls/day MMCFD Bbis/day MMCFD Bbis/day MMCFD Bbis/day d/ Bbis/day
1982 128 5,600 - - - - 128 - 5,600
1S83 146 6,000 3 100 5 6,100 154 6,100 6,100
1984 184 6.600 30 1,700 17 14,000 231 14,000 8,300
1985 200 6,700 262 7,400 23 18,100 485 18.100 14,100
1986 200 6,100 300 11,300 28 19,300 528 19,300 17.400
1987 180 5,300 320 11,600 25 13.400 525 13,400 16,900
1988 170 4,600 330 11,700 15 8,000 515 8,000 16,300
1989 140 3,500 360 11,900 10 7,100 510 7,100 15,400
1990 90 2,300 380 11,700 9 6,300 479 6,300 14,000
1991 60 1.500 370 11,000 7 3,900 437 3,900 12,500
1992 40 1,000 330 8,700 4 2,100 374 2,100 9,700
1993 25 700 280 6,400 2 1,200 307 1,200 7,1001994 15 400 230 4,800 - - 245 - 5,200
1995 5 200 150 3,200 - - 155 - 3,400
1996 - - 10 1,900 - - 100 - 1,900
1997 - - 50 700 - - 50 - 700
al Offshore.
bl Includes Baanpot, Platong, Satun, Kaphong and Pladang fields.
cl Onshore.
d/ The Bank's Appraisat Report on Sirikit uses additional full-size Sirikit and allows for
production of gas cap gas.
Source: "Thailand Natural Gas Reserves and Petroleum Production Forecast," NESDB Supply and
Investment Working Group. (March, 1985)
4.34 In Annex 5 the gas, condensate and crude oil productioncapabilities are shown for discoveriei made or indicated to date (as wellas for some fields not yet discovered) but for which negotiations todevelop the known fields have not yet been started or concluded. Theseproduction capabilities have been developed by the joint government/oilindustry Working Group on Energy Supply and Investment of the NESDB forpreparation of the 6th Five Year Plan. In the offshore domain, a thirdUnion contract is included based on four discoveries (Funan, Jakrawan,Pakarang and Trat) but appraisal and development are still several yearsaway. Texas Pacific's "B" structure, discovered and delineated, isincluded. Development of this structure awaits conclusion of a mutuallysatisfactory gas contract with the government. Due to its location afurther 150 kms. into the Gulf than Union's discoveries, the transmission

- 66 -
costs for this gas will be high. This, combined with the fact that thisgas is low in condensate and high in carbon dioxide, makes its develop-ment more sensitive to the movement of international energy prices thanother major gas discoveries in Thailand. In terms of onshore productionscenarios, two cases are postulated. The first and most likely scenarioincludes Esso's Nam Phong discovery in the Khorat basin (two producers sofar) which is awaiting the settlement of pricing and related issuesbefore being placed on long duration tests. Also included in thisscenario is oil production irom several small fields in north-centralThailand, which in total are estimated by the NESDB Working Group atabout half the production leveL of Sirikit. These fields include WestSirikit, Nong Toom, West Tan, Pradu Tao, and Bung Ya. The secondscenario of onshore production is more speculative and is based on fieldsnot yet discovered but considered likely in geological terms. The sizesof these discoveries assumed are: for oil, the same size as Sirikit; andfor gas, possible reserves of 1.5 TCF likely to be discovered in theKhorat plateau.
4.35 Table 4.5 shows the gas, condensate and crude oil productioncapabilities between 1985-97 under four different conditions. rhe "basecase" assumes the production capability represented by supplies currentlycontracted for. As noted above, by 1989/90 the production of gas,condensate and oil would begin to decline rapidly in this case. ScenarioI includes:
(a) the "base case" plus;
(b) Texas Pacific and Union III production on-stream in 1990; and
(c) Esso's Nam Phong and additional Shell production equivalent to1/2 of Sirikit. Esso's production beginning in 1986 and theadditional Shell in 1987.
Under Scenario I, 20i gas production would rise slowly from 485 MMCFD in1985 to 783 MMCFD by 1990, peaking at 959 MMCFD in 1993 and beginning todecline in 1987. Condensate production would increase to about 17,400Bbls/day in 1986 and slowly decline to about 11,200 Bbls/day by 1997.Oil production would peak at an average rate of 19,300 Bbls/day in 1986,decline slowly to 16,000 BbLs/day by 1990, and experience a more rapidfall-off in the 1990s (to about 2,000 Bbls/day by 1995).
4.36 Scenario II is the same as Scenario I except that it is assumedthat there would be some slippage in Union III supplies becoming avail-abLe. In this case, the supplies are considered to become available in1992 and not 1990 as in Scenario I. This results in a somewhat flatteravailability profile for gas in the 1990s (763 MMCFD in 1990 and 804MMCFD in 1995). Under Scenario II, crude oil production is the same andcqndensate somewhat lower than Scenario r.
20! This scenario was adopted by the NESDB Supplv and Investment WorkingGroup (March 1985) as their "3ase Case".

Table 4.5: NATURAL GAS, CONDENSATE AND CRUDE OIL PRODUCTION CAPABILITY SCENARIOS (1985-97)
Currently Contracted for a/ Scenario I b/ Scenario It c/ Scenario II.A d/
Gas Condensate Crude Oil Gas Condensate Crude Oil Gas Condensate Crude Oil Gas Condensate Crude Oil
Year MMCFD BbIs/day Bbis/day MMCFD Bbis/day Bbls/day MMCFD Bbis/day Bols/day MMCFD BbIs/day Bbis/day
1985 485 14,100 18,100 485 14,100 18,100 485 14,100 18,100 485 14,100 18,100
1986 528 17,400 19,300 548 17,400 19,300 548 17,400 19,300 548 17,400 19,300
1987 525 16,900 13,400 568 16,900 16,450 568 16,900 16,450 568 16,900 16,450
1988 515 16,300 8,000 584 16,300 15,000 594 16,300 15,000 594 16,300 15,000
1989 510 15,400 7,100 622 15,400 16,150 622 15,400 16,150 622 15,400 22,150
1990 479 14,000 6,300 783 14,900 15,950 763 f/ 14,000 15,950 763 f/ 14,000 29,950
1991 437 12,500 3,900 820 14,600 10,600 750 f/ 12,500 10,600 750 f/ 12,500 28,600
1992 374 9,700 2,100 912 e/ 13,600 6,100 812 f/ 10,600 6,100 812 f/ 10,600 26,100
1993 307 7,100 1,200 957 ;/ 12,900 4,750 832 t/ 9,200 4,750 832 f/ 9,200 18,150
1994 245 5,200 - 954 e/ 12,800 3,150 829 f/ 9,100 3,150 829 f/ 9,100 11,150
1995 155 3,400 - 954 e/ 13,700 1,950 804 f/ 10,000 1,950 804 t/ 10,000 9,150
1996 100 1,900 - 934 o/ 13,300 1,050 809 f/ 9,500 1,050 859 f/ 9,500 7,350
1997 50 700 - 854 11,200 600 849 f/ 11,000 600 929 f/ 11,000 4,600
a/ From Table 4.4 Includes Union I and 11 and Shell-SlrikIt.
b/ This Is based on the following assumptions: (i) supplies currently contracted for plus; (ii) Union IlI and Texab Pacific contracts
signed with suppiIes on-stream In 1990 according to Annex II plus; (Mii) add! tIonaI gas from Esso's Nam Phong field in 1986 and
gas and oil from 1987 from Shell fields about 1/2 the size of Sirikit.
c/ ScenarIo I Is based on the following assumptIons: (1) currently contracted for supplies plus; (II) Texas Pacific and Union Ill
supplies on-stream In 1990 and 1992 respectivoly plus; till) additional gas from Essols Nam Phong field In 1986 and gas and oil
from 1987 from Shell fields about 1/2 the size of Sirikit. The Bank's Sirikit Project Report uses additional full-size Sirikit.
d/ In Scenario II.A, It is assumed that an additional oil fleld, the size of Sirikit would be discovered and developed by 1989 and a
gas field equivalent to Esso's Nam Phong discovered and developed by 1996.
e/ Under this scenario between 1992-96 gas supplies from the Gulf would range between 700-750 MMCFD; therefore requiring Investment
In compressors.
f Under this scenario between 1990-1997 gas supplies from the Gulf range from about 600-645 MMCFD.
Source: "Thailand Natural Gas Reserves and Petroleum Production Forecast," NESDB Supply and Investment Working Group (March, 1985).
- 68 -
4.37 Scenario II.A is based on Scenario II plus the additionalspeculative assumptions that another oil field the size of Sirikit wouldbe discovered, developed and on-stream by 1989 (Annex 4.2) and a gasfield equivalent to Esso's Nam Phong discovered, developed and on-streamby 1996. The major difference with Scenario II concerns oil production,which rises to 30,000 Bbls/day by 1990 and declines to one-third by 1995.
4.38 In the assessment team's view, if the modifications to thelegislative/fiscal regimes and other recommended policy measures areadopted expeditiously and contract negotiations with Union, Esso andTexas Pacific concluded in the near future, production capabilities alongthe lines of Scenario I could be achieved. However, if one allows fordelays in government implementing the needed measures, somewhatprotracted negotiations with the oil companies, and soft oil prices overthe next couple of years, production profiles closer to those in ScenarioII could result. It is this scenario that the assessment team considersmost likely to represent production capabilities over the next ten years.
4.39 The production forecast for aLl cases recognizes that, as aresult of geologic complexity, particularly dense faulting, the fieldsconsist of a large number of individual reservoirs. This implies highwell density and rapid depletion rates so that all fields, with thepossible exception of Esso's Khorat basin, are expected to be relativelyshort-lived. These factors all point to the fact that energy strategy inThailand will have to manage many uncertainties in production levels andassociated costs for hydrocarbon production. Government benefits aretherefore likely to fluctuate in tandem with the gas volumes in PTT's,EGAT's and other consumers' facilities.
The Role of Government, PTT and DMR in the Oil and Gas Sector
4.40 PTT was established in December 1978 by the Petroleum Authorityof Thailand Ace to engage in and promote the petroleum business, includ-ing related petroleum and petrochemical activities. At present: PTToperates as a single legal entity. PTT's exploration and productionsubsidiary was established in July 1985. The core of PTT's activitieshas involved gas purchases and sales, gas transmission, refining andpetroleum products marketing. Its two major operational units consist ofthe Natural Gas Operations and Oil Marketing Operations. As PTT's rolesoon will be expanded to include a minority share in upstream operatinns-- the immediate one being a 25% share in a joint venture with Shell todevelop Block S-1 -- its exploration and production (E&P) department willalso become an active operational unit through the new subsidiary.Insofar as downstream operations are concerned, PTT has entered intojoint venture agreements holding shares in the TORC refinery (49%) andNational Petrochemical Corporation (48%), National Fertilizer Corporation(21X), Thai LNG Company (10%) and Bangkok Aviation Fuel Services (10Z).In addition, PTT is a 30% shareholder of the Bangchak PetroleumCorporation (BPC).

- 69 -
4.41 PTT has a staff of about 2,800, of which some 400 are under LheNatural Gas Operations. Taking account of the relative inexperience ofthe staff, under the provisions of the Natural Gas Pipeline Project,theoretical and on-the-job training has been provided for the natural gasoperations and accounting and finance department. In addition, trainingis planned for the operation of the gas separation plant and LPG distri-bution, as provided under the LPG project. Further, it is also essentialto build-up the strengths of the E&P Department in the specializedtechnical fields. This would include both recrui:ment of staff andtraining provisions. Moreover, the delegation of auLhority would need tobe carefully monitored to ensure that the E&P Department is able to maketimely decisions in a constantly changing environment as exploration anddevelopment proceeds. Indeed, this is critical for the efficient opera-tion of the joint venture with Shell.
4.42 As PTT is expanding rapidly in bch the scale of its operationsand the areas of activities, there is a need to streamline as well asdevelop its staffing capabilities. With a view towards promotingefficiency, PTT recently commissioned a study on organizational anddevelopment planning, to be followed by the design and implementation ofa management information system as provided under the LPC roject.
4.43 The studies commissioned are designed to address the issues ofimproving PTT's organizational efficiency. However, within the co-cextof the 6th Five Year Plan, the government's policy to encourage a greaterprivate sector role in the energy sector and increased reliance on marketforces in decision making, the following issues need to be focused on:
(a) what should be the focus of PTT's activities over the medium-and longer-term?
(b) what are the most effective mechanisms for government toregulate oil and gas activities and to formulate and implementsubsector policy?
4.44 The government strategy in the oil and gas subsector to datehas been to rely exclusively on the international oil companies (IOC's)in the area of exploration and production. Substantial reliance on theprivate sector to take these risks is appropriate and should continue toform the core of government policy. Covernment hds the option of takingon a minority joint venture with Shell, Esso and other companies oncecommercial discoveries are made. This minority joint venture role is asound way for PTT to gain production experience and, over time, shouldresult in transfering technology to a Thai institution. PTT's 25% shareof the co:;ts and benefits in the joint venture with Shell to developBlock S-1 is the first such operation for PTT. Materially, higherproportions (e.g. in other joint ventures) wouLd expose the public sectorto potentially imprudent risks in what may be regarded as the most riskyelement of the industry because of Thailand's geological conditions. Theassessment team fully endorses the current policy of PTT to increase itsup-stream activities through the joint venture mechanism as a minority(20-25Z) partner.

- 70 -
4.45 As one moves further downstream to the gas transmission system,PTT is the sole owner of the submarine gas pipeline in the Gulf linkingthe Union Oil fields to onshore. The cost of this pipeline was aboutUS$430 million and, as the private sector expressed little interest inequity investment in this project, the state had to play the lead roLe intaking 100% of the risk, through PTT, in ensuring that the pipeLine wasbuilt and hence that gas from the Gulf could be marketed. As additionalgas fields are developed and the number of gas consumers begins toexpand, the gas transmission and distribution system will have to grow.Already, a private sector consumer, Siam Cement Co., has financed andowns a 100 km line from Bangkok to Saraburi (para. 6.54) with about 60MMCFD of capacity, which alLows it to use gas in its cement plants. BothPTT and the private sector (producers and/or consumers) have major rolesto play in developing the gas transmission and distribution system eitherthrough joint ventures or wholly owned elements of the system operatingwithin a regulated framework.
4.46 When one goes further downstream to petroleum refining, PTTalready holds a 49% interest in the TORC refinery, with both PTT (30Z)and the government (70%) having major interests also in the BangchakPetroleum Company (BCP) that is to undertake rehabilitation of theBangchak refinery (para. 6.69). In the assessment team's view (para.6.71), over the medium and longer term the private sector should beplaying a significant role in the petroleum refining industry inThailand. This is especially important given the significant risks anduncertainties that have characterized the refining industry since 1973.These risks become particularly large when conversion capacity is contem-plated because of the size of investment involved and the sensitivity ofits profitability to price differentials between petroleum products.
4.47 In terms of petroleum product marketing, this is a domain wherethe private sector should again be dominant, in the assessment team'sview. The assessment team is unaware of the relative efficiencies of PTTand the private oil companies and operators in the petroleum productmarketing and distribution area. Although there is reason for the statepetroleum company to be involved competitively with the other oilcompanies and operators in domestic marketing, the rationale 1-as not beenexplained for PTT's monopoly on sales of petroleum products to stateenterprises such as BKTA, State Railways of Thailand (SPT), and ECAT.Indeed, much of PTT's liquidity problem has been aggravated by substan-tial delays in payments from some of its public sector zonsumers such asthe BMTA and SRT.
4.48 Finally, to improve management of the petroleum subsector theassessment team recommends an approach which addresses several immediateoutstanding problems:
(a) improvement of the fiscal and legislative regimes for oil andgas exploration and development;

- 71 -
(b) accelerating the negotiation, exploration and developmentprocess;
(c) establi"'.ing a regulated, transparent gas pricing system linkedto international energy prices; and
(d) reassessing the role of the staLe in the oil and gas sector,placing greater emphasis on private sector participation.
To facilitate these and other changes that will be required in thefuture, the assessment team accepts as a valid and useful option thesuggestion considered by the joint Bank/NESDB Energy Assessment team,that government establish an Oil and Gas Management Board. This Boardwould be regulatory but would also act as an oil and gas policy advisoryboard. By building on the oil and gas regulatory mandate of DMR andtaking on responsibility for tariff regulation of gas and gas pipelines,such a Board would provide a mechanism for strengthening DMR's role aswell as its capacity to fulfill the major tasks that lie ahead. TheBoard could also act as a forum for private sector and government dia-logue, as well as improvement of government's regulation of "goodengineering" practices in oil and gas exploration, development andtransmission.
PTT's Investment Funding
4.49 PTT's governing act, taken together with its agreements withthe Ministry of Finance, provide a framework that rnuld allow PTT toachieve and maintain a sound financial position and to raise externalfinance without too much difficulty. PTT is a relatively new organiza-tion; it was undercapitalized when first established, and it has been inbusiness for too short a time to accumulate adequate reserves. Asdiscussed below there are many disquieting features about the way PTT hasto operate that could leave the company in a precarious position, but PTTwill have to be encouraged and allowed to act commercially for it toachieve a healthy and stable financial position. This in turn requiresthat government tackle problems promptly. PTT has raised (with govern-ment guarantees) significant sums from commercial banks, export creditagencies, multilateral and bilateral institutions, through loans,floating rate notes, lines of credit and other arrangements, and it has arelatively sophisticated cash management system. PTT's present andfuture financial position reflects its role as a state enterprise in thatit suffers from a poor payment record by state agencies and enterprises,and is required to make investments not in its direct commercialinterest. At the same time it can benefit from the economic rent onnatural gas sales, and through its monopoly of public sector sales itspetroleum products market is larger than it would be otherwise. This isa mixed picture -- at present beneficial, but probably not so in themedium term.
4.50 Investment funding comes from commercial banks, officialsources such as export credits, international sources and internal cash

- 72 -
generation. The single most important source of investment funding forPTT is its operational cash flow, estimated to finance almost 100% offuture upstream joint venture investments (oil and gas exploration andproduction) and 30% to 35Z of other investments and working capital.These funds will arise from profits on the transmission and sale ofnatural gas, marketing of petroleum products, and joint ventureproduction of oil and gas. The basic structure of internal cashgeneration is fundamentally dependent on government permitting theimmediate pass through of cost increases and the timely settlement ofamounts due from other state enterprises. However, the track record hasnot been good. The most important customers are ECAT, Bangchak PetroleumCompany, Bangkok Mass Transit Authority (BMTA) and the State Railways ofThailand (SRT) and, because of difficulties in their own cash flows overthe past five years, each has at times been seriously delinquent inmaking payments to PTT. ECAT has been a prompt payer for some time buthas strongly questioned why it should pay price increases under thesupply contract; hence, PTT's margin is at risk. The Bangchak arrearswere substantially settled earlier this year after three years ofproblems. CurrentLy BMTA and SRT together owe PTT about $75 million,rising at $4 million per month and this is net of a major ($36 million)government-financed partial settlement in April 1985. The government hasagreed to come forward with an early solution to this problem. Thesepayment problems arise principally because PTT is a monopoly supplier tostate enterprises and at the same time appears to be obligated to supplyregardless of whether payments are made. Two state enterprises appear tobe making little attempt to pay. Clearly, it is financially unsound forcountries to allow such practices to prevail. An additional potentialcash flow problem is the Oil Fund, which only three years ago accummu-lated $125 million in payments due to PTT, and which again is rapidlymoving towards a deficit. It is worth noting that the solution toseveral of these problems has involved MOF funding of energy costs forstate enterprise and Oil Fund deficits, which is not really appropriatefor a sector meant to be a revenue earner.
4.51 The internal cash generation from gas operations and oilmarketing (in both cases primarily to state enterprises), which meets30X-35% of PTT's investment needs, represents the estimated local curren-cy content of the investment program (including taxes). Surplus cashwill be remitted to government after first recognizing PTT's cash needsand legal obligations, including specifically the payment performance ofstate enterprises. Government plans initially to seek a 30% remittance.The internal cash generation from exploration and production is intendedto meet the major part of the cash requirements for further investment inthese joint ventures, and, recognizing the risks inherent and the natureof the investments, PTT will retain its after-tax cash flow fromproduction for joint venture financing. Taxes and royalties will, ofcourse, be paid in the same way as payments by foreign oil companies.
4.52 PTT in the past has had little difficulty in raising money fromthe commercial markets using government guarantee and is in the processof seeking to raise funds without government guarantee. Given the recent

- 73 -
experience of developing countries in commercial funding this lack of aformal guarantee may not be worth achieving. More importantly, PTT'sunder-capitalization makes it vulnerable to experiences such as thepresent one concerning non-payment of debts. It wiLl be some yearsbefore accummulated profits put PTT into a mature and sound financialposition. Moreover, the move into more risky activities such asexploration end development calls for a stronger debt/equity position.While pipeline companies in the developed countries traditionally have ahigh debt/equity ratio, most exploration companies have low(conservative) ratios. The substantial uncertainty introduced bygovernment involvement (e.g., in pricing and investments) calls for amuch stronger ratio, such that PTT should be aiming for an overall 50/50ratio.
4.53 It is important at this stage to consider more closely thefunding of Thai oil and gas investments, taking into account the finan-cial risks of the various projects and the possibility of sharing theserisks. Progress has been very mixed. PTT's investment in Bangchak wasdictated more by Bangchak's needs (and the cash position between the two)the by prudent PTT investment. PTT's share of the investments in thepropo3ed ethylene cracker and fertilizer plants appears to be determinedmore by government requirements and broader national interests than bystrictly commercial criteria. Such requirements are not compatible witha commercial orientation.
4.54 A positive step has been made in the government's insistencethat the TORC refinery expansion take place on a non-recourse basis,without government/PTT guarantee either of the loans or the profitabil-ity. In this way the private sector is being invited to take privatesector risks. This should also apply to petrochemicals and fertili-zers. In the longer term, the next major project where similar consider-ations should apply is the development of the Texas Pacific gas fieLd,which, from a risk viewpoint should include the pipeline from the fieldto the nearest market or existing pipeline. In current terms, the totalcost of developing the field could be around $700 million, with a further$300 million for a pipeline. Given the uncertainties regarding thepotential performance of this field, it would be appropriate for PTT toaccept no more than about 25Z of the $1000 million involved, principallyfocusing on the less risky pipeline component, and to seek private sectorpartners and limited or non-recourse financing for the balance. Thisaspect of limiting risk has already been adopted in the (draft) jointventure agreement with Shell and the possible joint ventures with Essoand in respect of the Block 5/27 prospect.

- 74 -
V. THE POMILR SECTOR
Organization
5.1 The organization of the power sector has been quite efficientduring the past decade. The sector consists of three stateenterprises: the Electricity Generating Authority of Thailand (EGAT),the Metropolitan Electricity Authority (MEA), and thc ProvincialElectricity Authority (PEA). EGAT is responsible for most generation andtransmission facilities, and MEA is responsible for dist.i;Lion in theBangkok area and PEA throughout the rest of the country. Coordination issometimes a problem in that seven government agencies are involved inpower sector issues: the Committee for Power Policy and Development; theBudget Rureau; the Tariff Rate Committee; NESDBi Ministry of Finance;NEA; and the Foreign Loan Committee. These agencies review a largenumber of issues including tariffs, capital project proposals, budgetsfor submission to the council of Ministers, annual financial performance,and requests for government equity and loans. No one agency has overallpolicy responsibility and many decisions are made by consensus of all theagencies, including the state utilities. The system, which generally hasbeen successful, is designed to ensure that sector capital expendituresare controlled without overly centralizing the decision making authorityin any one governmental body. Most of the agencies involved have asubstantial amount of autonomy but perhaps could be better coordinatedwith respect to planning and carrying out their programs.
5.2 Power sector coordination is facilitated through two arrange-melits. The first is the Load Forecast Working Group, made up of repre-sentatives from the NESDB, NEA, EGAT, PEA and MEA. This group is respon-sible for forecasting power demand. The second arrangement is reflectedin the rate adjustment procedures which require coordination betweenEGAT, PEA and MEA to ensure that each utility generates an adequateproportion of its investment while at the same time preventing cashimbalances. In general, the overall financial targets established forthe sector have been reasonable although the mechanism of cross-subsidi-zation with higher electric rates in urban areas and in industry has 1 dto subsidizing rural and household consumers. Furthermore, the policy ofuniform national tariffs has undoubtedly led to some economic distor-tions. Although the power sector has functioned fairly effectively,there have been some years in which financial returns have been inade-quate. Also, improvement in investment programning and planning appearsnecessary if the Large programs that are contemplated in the future areto be cost effective.

- 75 -
Past System Development
Demand Crowth
5.3 The power system in Thailand has grown at an unusually rapidrate over the past two decades. Between 1961 and 1983, electricitydemand grew from 464 GWh to 17,563 GWh, increasing from 18 kWh to 365 kWhper capita. Prior to 1973, electricity demand had been growing by morethan 20% per year (three times GDP growth). When GDP growth 3lowed andreal prices rose sharply in 1974 and 1979-82, growth declined to 6%p.a. When GDP growth picked up in 1974-79 and again in 1983 and pricesstabilized, electricity demand again grew at 13% p.a. or at about twicethe rate of GDP growth. Industrial consumption has been growingespecially rapidly.
Table 5.1: BREAKDOWN OF ELECTRIC ENERGY DEMAND
1961 1970 1980
Electric Power Sold (GWh) 467 3,817 13,157
Percentage ShareIndustrial 37 64 63Cofmercial & Misc. 24 14 14Residential 39 22 23Total Demand 100 100 'O
5.4 MEA's share of the country's total dem.and declined from 80% in1965 to 52% in 1982. By the end of the 1970s MEA served a wellestablished, developed market in the Bangkok area; in fact, electricitysupply was already available throughout most of this service area asearly as 1960. With the relatively higher real incomes in Bangkokcompared to the rest of Thailand, the annual consumption per householdconnection in the MEA service area increased from about 695 kWh in 1963to around 2,600 kWh in 1980. By the beginning of the 1980s, residentialownership of electrical appliances in Bangkok had become widespread. Forexample, the proportion of households using electric fans increased from33% in 1962 to 90% in 1980, televisions from 17% to 80%, refrigeratorsfrom 11% to 61%, and air-conditioners from 1% to 10%. 21/ The intensityof industrial use of electricity had also increased, from 120 watt hoursper Baht of value added in 1968 to 156 in 1978, or an annual growth rateof 2.7%. Key growth indicators are shown in Table 5.2.
21/ MEA survey data from 1981 indicates even higher ownership rates formany appliances; 84Z of households owning a rice cooker, 19% a hotplate, and the average customer having lights totaling 420 watts.

- 76 -
Table 5.2: ELECTRICITY INDICATORS FOR MEA SERVICE AREA1961-1984
Year 1961 1965 1970 1975 1980 1982 1984
Ave-age Load (MW) N/A 153 503 968 1,647 1,897 N/A
Peak Load (MW) N/A 311 954 1,483 2,380 3,234 3,601
Load Factor (%) N/A 49.3 52.7 65.2 69.2 58.7 67.8
Energy Sold (GWh) 467 1,100 3,817 7,496 13,157 15,047 19,349
Consumption (kWh per cap) 17.6 360 107.4 176.8 280.2 308.0 i/A
Energy Sold in MEA N/A 868 2,693 4,909 7,873 0,389 N/A
5.5 The provision of electricity for the rest of the countryoutside of Bangkok was organized into provincial areas on a planned basisin 1960 with the formation of PEA. Consumption levels since then haveincreased rapidly, with PEA's sales growing from 251 GWh in 1966 to 6,680GWh in 1983. PEA focused initially on electrifying urban areas and, bythe mid 1970s, most urban areas outside of Bangkok had access toelectricity. Consumption per household connection increased with thegrowth in income from about 290 kWh per year in 1966 to 1,130 kWh in1983, while the watt hours per Baht of industrial value added in provin-cial urban areas increased even faster at 20X . a. -- from 17 in 1968 to105 in 1978. By 1983 about 88% of PEA sales were made to urban areasencompassed by municipalities and sanitary districts. (Table 5.3).
Table 5.3: PEA ELECTRIC'TY SALES(GWh)
1968 1978 1983
Urban 342 3,477 5,815
Residential/Service 210 1,603 2,858
Industry 132 1,874 2,957
Rural 20 140 865
362 3,617 6,680
Source: Mission team estimates based on PEA data.
5.6 The widespread use of electricity was slow to get under way inrural areas; only 5% of rural households were electrified by 1970compared to 3% in 1960. To accelerate the process, in 1973 the govern-ment adopted a National Plan for the Total Electrification of Thailand,calling for the electrification of all villages in about 25 years. Thetarget completion date was later brought forward to the late 1980s. A

- 77 -
variety of rural electrification programs were soon adopted and emphasiswas given to electrifying villages with various kinds of partial self-help programs as well as directing attention to the less developed partsof Thailand. 22/ As a result of these intensified efforts, the annualrate of village connections increased from 940 in 1974 to 5,000 in 1981,and the proportion of villages electrified increased from 23% in 1978 to52% in 1982. In fact, according to PEA, 20,000 villages were electrifiedbetween 1977 and 1983 and it was intended that up to 32,000 more villageswere to have been electrified during the 5th Five Year Plan period (1982-6). In retrospect the number of rural households connected increased bya massive amount -- from 181,000 in 1970 to about 2.5 million in 1982.Average consumption levels in households recently connected, however,indicated that lighting was the dominant use of electrical energy by1984, running at about 280 kWh/p.a. per rural household connected. Otheruses of electricity outside the household sector still accounted for arelatively modest share of consumption in rural areas at this timealthough such use is beginning to expand quite rapidly into agro-industries, irrigation and other non-residential uses.
Table 5.4: RURAL ELECTRIFICATION PROGRAM
1970 1976 1978 1980 1981 1982
Villages (thousands)Total '-- 48.0 49.8 51.7 51.7 52.3
Electrified ... 11.0 14.0 17.5 22.6 27.1Percent ... (23) (28) (34) (44) (52)
Households (thousands)Total ... ... ... 6,565 6,706 6,848
Electrified 181 ... ... 1,730 2,120 2,470
Percent (5) ... (26) (32) (36)
Source: PEA.
Load Management
5.7 This rapid growth into rural areas, the ery large expansion ofresidential consumption, and the recent upsurge in the use of electricrice cookers all have had an important part in shaping electricity demandin the national system. Peak demand is increasing more rapidly thanoverall consumption at 9.5% p.a., up from 2,255 MW in 1979 to 3,547 MW by1984, and the daily load curves at FGAT are rather sharply defined withthe peak running from 6 to 10 p.m., a "shoulder" from 9 a.m. to 6 p.m. atabout 852 of peak, and off-peak hours for the remainder of the time
22/ In 1978, 44Z of villages in the Central Region were electrified, 39%in the North, 30% in the South and i4% in the Northeast.

- 78 -
averaging some 702 of peak. Daily load factors are in excess of 75% andthe yearly load factor about 67%. The load is weather sensitive, butthis effect is very much random and no seasonal pattern of consumptionemerges clearly. A principal contributor to this growing system peakappears to be the Lmall residential consumers, particularly those servedby PEA; by comparison the MEA load curve for many years has beenconsistently high during shoulder hours, achieving its highest peakbetween 2 and 3 p.m. which reflects the much more diversified economy ofBangkok.
5.8 The marginal costs at peak are still high -- i.e., more thanUSC12 per kWh for PEA low voltage service. However, MEA and PEA areunlikely in the foreseeable future to achieve significant progress insupressing the large contribution that the small consumers' load makes tothe system peak. This type of load, because of its geographicaldiversity and the types of appliances used, does not lend itself well tomanipulation by the supplier to contain the system peak throughconventional methods such as ripple control switching or domestic duo-metered time-of-day tariffs. However, significant opportunities existfor reducing the demand of the large industrial consumers at system peaktime. This can be effected by increasing Time-of-Day (TOD) tariffincentives (para. 5.12) A study carried out by Kuljian Consultants in1983 indicated that the application of TOD rates could producesubstantial cost savings for both EGAT and the large consumers with highload factors on heavy pumping loads. System peak load could be reducedby some 75 MW in a first step with negligible costs. If the programeffected only a 30 MW reduction in the system peak, it is estimated thatthis would save about $2.5 million each year in the power sector'scapital expenditures. More research into the use of air conditioning bylarge commercial and industrial users would also identify possibilitiesto lower the load between 9 a.m. and 10 p.m.
Electricity Supply Trends
5.9 To meet the rapidly growing demand both at the peak and duringother times Thailand has had to undertake a very substantial powergeneration and transmission investment program over the past 25 years,which has increased installed capacity from 176 MW in 1960 to 6,155 MW atthe end of April 1985. In 1960 diesel generation provided two-thirds ofthe capacity but subsequent expansion has been through hydro and oil-based steam thermal plants. When the Bhumibol dam came into service in1963 hydro and diesel oil dominated the system. In recent years hydrodeclined to 21%, and fuel oil accounted for 36% of energy generated byECAT. Natural gas has risen in che past ccuple of years to 30%, ligniteto 10%, and imported electricity to 4%. Fuel oil consumption used inelectricity generation units had risen to a peak of 3 billion litres in1980. Since 1980, however, the arrival of natural gas and lignite hasencouraged a substantial substitution away from fuel oil. For example,the conversion of South Bangkok Units 3-5 to dual gas/oil around 1983 hasalready reduced fuel oil consumpticn to 1.8 billion litres. Natural gasconsumption in the power sector reached 54,462 MMSCF in 1983 andconsumption of lignite increased from 93,000 tons in 1960 to 1.6 milliontons (Table 5.6).

- 79 -
Table 5.5: EGAT GENERATING MIX, ElN 1984
Installed Ospendable AverageType Fuel CapacIty Capacity Energy
- - - - (MW) - - - - (GVh)
Hydra Hydro 1,809.9 1,533.1 5,006.3a/
Thermal 3,327.5 3,158.3 21,596.9
Lignite b/ 5eK.0 5L2.9 3,746.9Oil C/ 742.5 705.4Gas/Oil d/ 2,000.0 1,900.0 17,852.0
CombinedCycle Gas 740.0 684.0 3,780.0
Turbines 265.0 218.5 679.1Gas e/ 70.0 60.5 115.0Gas,Diesel fl 75.0 60.5 460.1Diesel 120.0 98.0 104.0
Intern;lComustion Diesel 33.6 26.9 29.0
Totil g/ 6,155.0 5,260.8 31,093.3
a/ Firm is 3,346.6 GWh.bl Mae Moh 525 MW and Krabi 60 MW.cl North Bangkok 237.5 MW; South Bangkok units 1 & 2 x 200 NW, Surat
Thani 30 MW; Barge mounted unit 75 MW.d/ South Bangkok, units 3, 4. & 5, 3 x 300 MW; Bang Pakong Thermal 2 x
550 MW.e/ Lan Krabu 70 MW.f/ South Bangkok 75 MW.9/ Maximum demand in EGAT in 1984 was 3,547 MW and EGAT supplied
21,006 GWh.
Financial Trends and Tariff Issues
5.10 During much of the 1960s the financial condition of the electr-
ic system was reasonably sound, and internally generated resources
contributed substantially to the investment program. However, deteriora-
tion set in as the effect of the world energy crisis began to be felt in
the 1970s. EGAT was able to generate operating surpluses after the 1973
fuel price increases until late in the 1970s despite government-imposed
constraints on tariff adjustments. When possible greater efficiency was
achieved through increases in hydro generation and the use of larger,
more efficient steam plants. However, the surpluses were not large
enough and in the end the rate of return on revalued assets declined from
10% in 1971 to 3% in 1979 and was negative by 1980. In 1980, EGAT
incurred losses of Baht 1,043 million. Apart from various financia.l
measures taken by the government to ease EGAT's liquidity problem, the
electricity tariffs of EGAT had to be more than doubled between 1979 and
1982. As a result EGAT's financial position recovered and the rate of
return on revalued assets increased from -2% in 1980 to 9Z in 1981.

- 80 -
Since then EGAT has maintained a reasonable financial position, achievinga rate of return around 9-10Z on revalued assets through 1983 and 8.3% in1984. The effects of the higher tariffs, however, had been passed on toMEA and PEA and they were not able to rerover as well, their rates ofreturn still averaged only around 5-6% in 1933-84.
Table 5.6: FUEL USED IN EGAT ELECTRICITY GENERATION
Year Fuel Oil Lignite Diesel Oil Natural Gas
(Million ('000 tons) (Million (Billionliters) liters) SCF)
1960 a/ 89.5 93.4 79.6 --
1965 86.6 107.7 54.8 --
1970 486.7 323.4 247.7 --
1975 1,170.8 424.1 77.3 --
1979 2,229.7 1,259.0 192.3 --
1980 3,000.1 1,259.0 192.3 --
1981 2,456.9 1,534.4 99,1 9.31982 1,523.4 1,686.9 26.1 47.41983 1,832.1 1,573.4 40.8 54.5
a/ In 1960, the following quantities of additional fuels were also used:
Coal Fuel Wood Saw Dust Paddy Husk(tons) (Cu. m.) (M. tons) (M. tons)9,917 1,365 1,115 45,333
Source: "Thailand Energy Situation" for 1977 and Suboequent annual
volumes through 1982. Mission estimate for 1983.
5.11 Electric rates have been a serious issue for many years. Until1973, electricity tariffs were stable in nominal terms, i.e., decliningslightly in real terms in the face of modest inflation. This did notcause many problems in these years as oil-based generation costs declinedand low cost thermal steam capacity was replacing high cost dieselgeneration. As inflation picked up and fuel prices rose rapidly in the1970s, EGAT's rates were raised by 50% during 1973-75 and by 259% during1979-82 but the increase only partially offset the unavoidably higherfuel and capital costs. Besides the problem of tariff levels, however,there emerged the question of structural differences between majorelectricity users and the effect of uniform national tariffs. In settingtariffs for final customers, goveriment policy has been to equalize thetariff structure in MEA and PEA a-eas; this probably was a reasonablepolicy when the Bangkok market dominated the system. However, as PEAgrew rapidly and incurred higher costs, a subsidy became necessary andwas effected by having EGAT charge MEA a higher wholesale tariff thanPEA. However, since all of the differences were not passed on to theconsumers, the financial condition of MEA and PEA deteriorated. Analysesof this situation carried out by consultants indicated that in 1982,although EGAT's and MEA's average revenues per kWh exceeded what had beenestimated by the government as the proper long run marginal costs (LRMC)of producing electricity, those of PEA were far below the LRMC; thefinancial projections, if put into effect, would require at least that

- 81 -
tariffs be maintained vis-a-vis inflation. The tariffs as projected bythe consultants in 1982 for ECAT, PEA and MEA (Baht per kWh) arepresented in Table 5.7. Average revenue per kWh already declinedsomewhat over the years to 1985, reflecting ECAT's actual price reductionon April 1, 1983 from B1.44 per kWh to B1.38. Similarly, PEA reduced itsaverage rate from B1.77 per kWh to B1.68 and MEA reduced its rate fromB1.82 per kWh to B1.80. The financial conditions began to deteriorateafter this reduction. These regional cross-subsidies should bereconsidered in the light of their true economic impact, especially forlarge customers.
5.12 Cross-subsidies from commercial to residential customers areeven more questionable. They should be reduced. Apart from these majorchanges, some improvements in tariff design should be considered tocomplement load control policies mentioned in para. 5.8:
(a) an increase in the capacity charge, expressed through the kWhenergy charge for users with lower load factors. For theseusers, any modification to the present rates would then beminimal.
(b) creating for large industrial consumers who already havesuitable metering a time-of day tariff, which would induce themaway from the system peak.
(c) the contracting of additional demand between 12 a.m. and 6 a.m.for only a fraction of the distribution network marginal cost.This option would reduce peak and shoulder loads and could beparticularly attractive for large pumping sets (and waterheaters, if any).
Table 5.7: EGAT, PEA AND MEA PROJECTED TARIFFS(B/kWh)
FY82 FY83 FY84 FY85 FY86
Projected (in a 1982 study)EGATCurrent 1.43 1.48 1.57 1.59 1.66Real 1.43 1.38 1.37 1.30 1.28
PEA a/Current 1.80 1.94 2.06 2.11 2.23Real 1.80 1.81 1.80 1.72 1.72
MEA a/Current 1.85 1.93 2.07 2.09 2.19Real 1.85 1.80 1.81 1.71 1.69
Actual - EGAT - Cutrent 1.43 1.40 1.38 1.36 N.A.
a/ MEA's average revenue per kWh is higher than PEA because MEAsales are in somewhat higher tariff categories than PEA sales.
Source: NEA Consultants. Projection of rates required to maintainsectoral rate of return of 8S.

- 82 -
For comparative purposes, NEA consultants estimated the following long-run marginal costs for each utility in 1982 (in b/kWh): EGAT 1.25; PEA2.01, and MEA 1.55.
EGAT's Financial Outlook
5.13 Despite growing subsidies to make up for inadequate tarifflevels during the FY77-79 perioe, EGAT consistently generated operatingsurpluses, and the issue only surfaced in FY80 when EGAT's financialposition began to deteriorate (with a loss of US$50 million equivalent inFY80). The government at that point granted EGAT equity contributions ofBaht 1.2 billion (US$59 million) to keep it financially solvent and alsoarranged a transfer of Baht 100 million (US$5 million) from MEA and PEAto EGAT. In order to finance its investment program EGAT increased itsborrowings in 1980 by about 200% over the previous year. In fact, EGATwas in the midst of a long-term borrowing program growing at 33Z perannum. The equity and loan funds obtained ensured that EGAT's normaloperations and investment program would not be negatively affected,although EGAT was to see its working capital almost disappear, as reflec-ted in a seriously eroded current ratio (to 0.59 in FY80).
5.14 The government instituted a Plan of Action to restore EGAT's andthe sector's financial soundness and to ensure that ECAT's investmentprogram remained intact. EGAT's income recovered to US$126 million inFY82 and US$154 million in FY83 (before the government appropriation),and its liquidity position improved substantially with the current ratioreturning to 0.94. These results were better than expected mainly due to(a) the unusually high percentage of energy generated by hydro plants inplace of thermal plants using heavy oil (resulting in an estimated costsavings of US$39 million); and (b) lower than expected interest rates onborrowings. EGAT's rate of return on net revalued fixed assets remainedsatisfactory through FY84 at 8.3%. Projections for FY85 and FY86 beganto show the deteriorating effect of price reductions as well as theburden of a long term debt that had reached B42 billion (US$1.8 bii.-on)by 1984. Debt service in FY84 had reached 80% of capital expenditures.Rates of return of 7.3% and 6.9% were recently projected by EGAT (June24, 1985) for the years 1985-86.
5.15 A broad view of EGAT's financial situation is provided inTable 5.8. These indicators reflect two things in particular: (a) asharp improvement in the rate of return resulting from the large increas-es in the average electricity prices in 1980 and 1982; and (b) an increa-se in the debt problem resulting from an inability to cover a largeenough part of the cost of investments out of internally generatedfunds. The debt service coverage ratio which had declined to 0.8 in 1980

- 83 -
rose to 2.5 in 1983, but declined again in FY84 to 1.2. 23/ Similarly,the self-financing ratio which had been 29.2% in 1977 declined to 16.7Zin FY80, rose to 28.5Z in FY82 and was back to 18.3 in FY84.
Table 5.8: EGAT SELECTED INDICATORS, 1979-1984
FY79 FY80 FY81 FY82 FY83 FY84
ProfitabilityRate of return (revalued S) 2.7 01.9 ) 9.2 9.9 10.0 8.3Average tariff (satang/kWh) 55.42 74.79 129.78 143.56 139.66 137.57Self-financing ratio (annual %) 17.4 16.7 25.5 28.5 25.1 18.3Operating ratio 91.9 105.2 82.4 80.6 80.6 83.0
DebtDebt as % of equity plus
long-term debt 42.1 44.6 50.4 51.2 51.3 45.9Debt seivice coverage 1.5 0.8 2.2 2.2 2.5 1.2
LiquidityNet working capital (B million) (621) (2,401) (2,220) (1,404) (465) (1,369)Current ratio (times) 0.79 0.59 0.71 0.82 0.94 0.85
TechnicalPeak generation (MW) 2,255 2,417 2,589 2,838 3,204 3,547Annual increase (%) 7.3 7.2 7.1 9.6 12.9 10.7Energy generated andpurchased (GWh) 13,964 14,754 15,960 16,882 19,066 21,066
Annual increase (S) 12.8 5.6 8.2 5.8 12.9 10.5
MarketEnergy sales (GWh) 12,933 13,657 14,545 15,386 17,571 19,357Annual increase (M) 12.3 5.6 6.5 5.8 14.2 10.2System losses (S) 7.4 7.4 8.9 8.9 7.8 8.1Annual load factor 70.7 69.67 70.38 67.9 67.9 67.6Number of employees 17,301 20,316 23,233 26,769 30,077 32,157Sales per employee (MWh) 747 672 626 575 584 602Employee per MW installed 6.0 6.3 6.1 6.6 6.0 5.5
Source: World Bank April 1985 Power Division Mission.
23 The situation in 1984 was somewhat extraordinary in that debtservice was apparently very high as a result of EGAT taking out arefinancing loan of $200 million to repay two long-term loans whichhad higher rates of irterest. During fiscal years 1981, 1982 and1983, ECAT's debt service was about 25% of capital expenditures(excluding interest during construction). EGAT expects thispercentage to rise to about 80% in FY83 and to about 100% in FY86,largely because of a substantial reduction in annual capitalexpenditures and the November 1984 devaluation of the Baht which hasincreased the debt service burden.

- 84 -
MEA and PEA Financial Outlook
5.16 The financial position of MEA and PEA during the 1970sresembled that of EGAT. Between 1977 and 1981, for example, PEA'srevenues increased rapidly at an average annual rate of 382, reflectingthe expansion of PEA's market and the large tariff adjustmentsimplemented in FY80 and FY81. This increase in revenues was largelyoffset by a substantial increase in the cost of power purchased from EGATwhich grew at an average annual rate of 50%. This and the fact thatPEA's yearly investment trebled during the period and the burden ofcarrying a debt which also tripled in financing the investment resultedin higher interest costs and reduced PEA's rate of return (Table 5.9) andits self-financing ratio. The very large increase in debt service hashad a serious effect on net internal cash generation.
Table 5.9: SUMMARY OF PEA'S FINANCIAL SITUATION, FY77-81(in millions of current Baht)
AverageAnnual
FY77 FY78 FY79 FY80 FY81 FY82 FY83 GrowthFY77-81
Energy sales (GWh) 3,174 3,650 4,254 4,696 5,210 5,840 6,680 13.2Revenues 2,394 3,168 3,697 5,080 8,742 NA NA 38.2Average tariff B/kWh 0.75 0.87 0.87 1.08 1.62 NA NA 22.3Operating expenditures 2,140 2,811 3,348 4,843 8,428 NA NA 40.9Operating income 254 357 349 237 314 NA NA 5.4Net income 173 354 342 146 151 NA NA -3.3Rate of return (revalued) (S) 10.3 12.0 9.3 5.0 4.8 NA NA -Number of connections ('000) 1,144 1,350 1,574 1,886 2,270 2,723 3,186 18.7Energy revenue per connection (B) 1,909 2,282 2,283 2,618 3,718 WA NA 18.1Operating expenditures
per connection (8) 1,870 2,082 2,127 2,568 3,713 NA NA 18.7Debt service coverage 4.2 3.8 2.8 1.9 1.6 1.6 0.8 -Self-financing ratio 39.1 49.6 38.8 22.0 15.7 2.67 NA -
Borrowings as Z ofcapital expenditures 75 39 56 88 103 71 113 NA
Source: World Bank Appraisal Report 4201 TH.
PEA's operating cost per connection increased so that by 1981 theymatched the revenue from electricity sales per connection. This is theresult of PEA's expansion into the rural market where customers aremainly in the lower tariff brackets. In other words, during that period,in order to produce a positive net income, PEA had relied mainly onrevenues from sources other than its electricity sales such as instaLla-tion and inspection fees, construction for customers and interest. Tocomplement its internally generated funds, during this period PEA madeextensive use of its borrowing capacity and relied on some contributions

- 85 -
from consumers. Equity contributions from the government were limited.Borrowings as a percent of capital expenditures even exceeded 100% inFY81. PEA has customarily relied largely on foreign loans, many of themon soft terms, from the World Bank, the Overseas Economic CooperationFund (OECF} of Japan, the Kreditanstalt Fur Wiederaufbau (KFWI of WestGermany, the Kuwait Fund for Arab Economic Development (KFAED), theCanadian International Development Agency (CIDA), and the Organization ofPetroleum Exporting Countries (OPEC) Fund for InternationalDevelopment. In addition, the government has subsidized the interestrate paid by PEA on domestic loans, mainly from the Ministry of Financeand the Krung Thai Bank.
5.17 Because of the availability of low interest financing, the debtservice declined in this period but managed to remain above 1.6. Duringthe period PEA's long-term debt as a percentage of its capital structurewas aLways below 41% despite the fact that its borrowings by 1981 hadslightly exceeded its capital expenditures.
5.18 As a result of tariff increases after 1981 the financialposition of PEA and EGAT recovered with the PEA's rate of return on netrevalued assets rising to 6.8% in FY82 and average tariff per kWhincreasing from 0.84 Baht/kWh in 1978-79 to 1.80 Baht/kWh in 1982.Despite efforts to keep this tariff in line with inflation, which wouldhave raised its level to Baht 2.10 by 1985, 24/ the level was reduced inApril 1983 and significantly declined in real terms by 1985. PEA's rateof return had been expected to rise to about 7.5-8% but remained at the5-6% level.
5.19 In its lending program covenants the World Bank required EGATand the sector to produce rates of return on net revalued fixed assets ofnot less than 2% in FY81 and 8% in FY82 and thereafter, and PEA to earnrates of return consistent with the sector's requirements. In FY81 thesector rate of return was 8.8% and ECAT's ;was 9.2%. In FY82 the rates ofreturn for EGAT and the sector were 9.9% and 8.9Z, respectively(Table 5.8). These covenants as applicable to future years have beenconti.iued in all electric power lending in Thailand since that time.However, the modest tariff increases required just to keep PEA generatingfunds equivalent to a rate of return above 6% between FY83 and FY85 werenot forthcoming. The financial analysis carried out assumed that somecross-funding would take place among EGAT, PEA and MEA by EGAT charginghigher bulk tariffs to MEA than to PEA. This policy has been continuedbut apparently is not a satisfactory way to achieve a sound financialposition for the whole sector. The situation is being reviewed by thegovernment; but, with the reiatively large investment programs contem-plated and the desire to internally generate large cash resources withinthe sector, urgent action on the electric tariff is tequired.
24/ According to an NEA consultants' study.

- 86 -
Sector Investment and Internal Cash Generation
5.20 Capital investment in the power sector has been heavilyfinanced by borrowing. In general, the goal has been to finance 30-50%out of internally generated cash resources. In fact, borrowing has beena key factor in the sector's strategy in recent years to meet the growingenergy demands of the Thai economy. As much as 65% of the financingrequired for the sector's investments has been obtained from externalgrants and loans. ECAT's average level of borrowing, both foreign anddomestic, has run about 70% over the period 1979-84 (see Table 5.10).Whether such a low level of internal cash generation and such a highlevel of borrowing should be permitted in the future is an importantissue facing the government. Most important is the question of how toincrease rate levels to raise internal cash generation to a level whichcovers a reasonable share of the investment program.
Table 5.10: EGAT CAPITAL INVESTMENT AND BORROWINGS1979-84
Investment Borrowing asFY Amount a/ Borrowing % of Investment Investment Amount Borrowed
- - (milion B) - - - - - (USS millions) - - -
1979 3,707 2,124 57 181.2 103.31960 8,904 6,153 69 435.2 300.31981 11,453 8,319 73 520.6 380.31962 13,797 9,819 71 599.9 425.91983 14,058 9,084 65 611.2 397.31984 10,932 8,002 73 475.3 347.0
TOTAL 1979-1984 62,851 43,501 69 2,823.4 1,953.8
a/ Including interest during construction.
Source: Adapted from April 1985 World Bank Power Mission findings.
Future Development of the System
Adequacy of the Load Forecasts
5.21 The Load Forecast Working Group has consolidated electricityload forecasts each year since l973, with rather frequent reexaminationof the results. MEA and PEA prepare forecasts for their own distributionareas, and EGAT prepares a forecast for its 13 direct customers. Theload forecasts are examined by the group and changes are made aswarr -ited. The requirements are ag--egated, and provisions made fortran: sion losses, and these Load $orecasts are used in preparingEGAT's development plan. NESDB and NEA also make macro forecasts ofenergy requirements based on population and GDP for information andconsistency purposes and for use with other economic forecasts.

- 87 -
5.22 MEA and PEA forecasts are prepared using quadratic trendfunctions based on data for 10 to 13 years. The peak load f or theutilities and EGAT is calculated on the basis of actual load factorexperience and expectations of variations from historic data. Comparingthe forecasts for 1983 made in 1978 with the actuaL 1983 outcome toexamine the effects of using these rather simple and pragmaticmethodologies indicates that the forecasts have been higher than theactuals; the PEA forecast was about 30% above the outcome, whiLe the MEAforecast was much closer. Mathematical trend projections for a large,long established electricity distribution system can provide reasonablysatisfactory results over the short-to medium-term (1-5 years) providedthere are no major interruptions to the trends in the underlyingbehavioral determinants of electricity demand. However, this was not thecase for Thailand during 1979-82 with the second oil shock, the economicslowdown, and the sharp rise in electricity tariffs.
5.23 Substantial data are available in Thailand to permit a betterunderstanding of the determinants of electricity demand and to enablemore analytical forecasting techniques to be used. MEA has already begunto improve its projection methodology but this has not yet beenincorporated into the load forecapt group work. MEA carried out a Loadsurvey of all customer categories in 1980-81, detailed surveys of house-holds to establish appliance ownership were undertaken, and individualOFF-ON peak and special rate customers were surveyed for projectingdemand. MEA has also undertaken a detailed analysis of load demand andhas estimated income and price elasticities of demand for majorcategories of customers.
5.24 PEA has not undertaken such detailed analysis but has made anumber of surveys and the need for improved forecasting methods has beenrecognized, particularly since this may be a key factor in major changesin the future peak load forecast. PEA's present accelerated ruralelectrification program makes the long term forecasts derived from theparabolic extrapolation very unreliable. A PEA management study is beingundertaken by Price Waterhouse/Snowy Mountain Engineering which isintended among other things to give guidance on how to improve demandforecasts for the short-, medium-, and long-term.
5.25 The methods of preparing Load forecasts in Thailand must bejudged in terms of the dynamic changes that are taking place in thecountry. The growth in electricity demand between 1970 and 1982 .asparticularLy rapid. The average annual growth rate for the 12-yearperiod was 12.0% for the peak and 12.5% for elerrrical energy. Followingthat period the growth in demand slowed down between 1979-82, duringwhich time the average annual growth in peak demand and energy demandsstill grew at 7.72 and 8.0Z, respectively. Several factors influencedthe growth in this period, including sluggish growth in the economy, apower shortage in 1980 caused by a drought in 1979 which reduced hydrocapacities, and the substantial increase in electricity prices. The Lastfactor is significant. Between February 1980 and April 1981 the electri-city prices to the consumers increased from about 80 Satang/kWh (3.5

- 88 -
cents/kWh) to about 180 Satang/kWh (7.8 cents/kWh). Little analysis isavailable to establish the impact that this price increase had on demand,but as indicated in NESDB work it was likely to be substantial. TheTariff Study being carried out by NEA/NIDA which wiLl be completed thisyear is expected to clarify this issue.
Improving Long Term Load Forecasting
5.26 Forecasting the load growth is so important that even if thereis general agreement on growth prospects during the next five years orso, the entite procedure still needs to be reexamined periodically. Thisis the logic behind the various load growth studies that are currentlyunder way. The three major classes of customers -- residential, commer-cial, and industrial -- require different approaches. Residentialconsumption depends on the number of households with electricity connec-tions and on the consumption per household connected. There isconsiderable demographic data available down to the province level, andpopulation and household projections are made by the ChulalongkomUniversity Institute of Population Studies. Since urban areas often arecompletely electrified, projections of the number of households will bealmost sufficient to project the number of electrified households inthose areas. For rural areas, the task is more complex since, inaddition to projecting the number of rural households, the increase inthe percentage of households electrified also needs to be forecast. Suchforecasts, in the first instance, can be based on: (a) a reasonableassessment of the extent to which PEA plans for rural electrificationwill be carried out, and (b) the increase expected in the percentage ofhouseholds being connected within an electrified village over time.According to recent experience, about 50% of households obtainelectricity connections in newly electrified villages but this has beenincreasing over time.
5.27 The second step in such an approach would be to forecast thegrowth in consumption per electrified household. A major determinant ishousehold income and information from the 1980/81 Household ExpenditureSurvey which is now being used to estimate the income elasticities forexpenditures on electricity. Forecasts based on this approach could beused to check against estimates obtained from househoLd ownership and useof appliances. 25/ For rural areas there is the additional problem ofdealing with the growth in consumption of newly electrified households,to indicate how rural households respond to the availability of electri-city. On the basis of experience in Bangkok consumption levels have beenhighly responsive to relatively small changes in income.
25/ Information on the ownership and use of electrical appliances isavailable from Population and Housing Censuses as well as theExpenditure Survey. In addition, MEA has done surveys of ownershipand use of apAliances.

5.28 At present, the forecasts for industrial demand are groupedinto small industry, large industry, special rate, off-on peak, andagricultural pumping. These groupings reflect tariff groupings. A moreuseful breakdown for forecasting electricity loads would be the standardindustrial classification, for example, iron and steel, mining, cement,chemical, pumping, oil and gas, and miscellaneous. Electricity loadscould then be forecast on the basis of the economic growth expected inthese sectors, which is the approach used in the Siam Model Planningexercises discussed in the macro analysis in Chapter It.
5.29 The electricity demand in the commercial sector is grouped intosmall and large business tariff categories and categories for government,hospitals and institutions. This breakdown has similar limitations formaking medium- and long-term forecasts. The commercial and publicservice demand is related to industrial, public, and personal expendi-tures. Commercial power requirements in other countries frequentlycorrelate well with the sum of industrial and residential electricityrequirements, and the business load forecast would follow from theresidential and industrial load. For budget purposes, the distributionof the commercial load between small business and large business tariffgroups can be used in this approach on a pro rata basis using historicinformation.
Demand Projections
5.30 The official electricity demand projections for ThaiLandprepared by the working group in September 1984 show a long run averagegrowth rate of about 6.8% p.a. through the year 2001. More specificalLy,NESDB pLjections based on the Siam II Model indicate consistent patternswith likely growths in demand of 11.1 p.a. during the 5th plan period(1982-86), 6.9% between 1987-1991, 5.7% between 1991 and 1966, and 5.2%between 1996 and 2001. The forecast of the official working group wasbased on regression models which include the effect of changes in GDP,population and the price of electricity. The constants for the regres-sion equation, however, were derived from the historical data. The loadforecasting group has avoided major mistakes by updating the forecastsrather frequentLy. The value of this procedure is apparent in that eachsuccessive updating since 1978 has resulted in reducing demand projec-tions and has been translated effectively into several major investmentreductions during the 5th Five Year Plan period: initially in November1981, again in 1982, and a final reduction in February 1983. Forecastsof the group prepared in June 1982 and used until a year ago by EGAT forsystem planning were projected to increase by about 10.5% in 19P3-86 andthen gradually reduce to about 6.7Z by 1991, giving an average growth of9.1% p.a. for the nine-vear period 1982-91. The 10.5% growth rate isstill being used through 1987 but from there until che end of the centurythe latest projeccion is slightly under 6% p.a. This compares with asimilarly low forecast by N.SDB. The nature of the macroeconomic exer-cise used in the NESDB work is discussed in Chapter II.

- 90 -
5.31 A serious issue in this exercise concerns ECAT's and thegovernment's use of a demand around 6.8% chrough the year 2001, which iswhat would be the ef sect if a higher demand materializes. According tothe September 1984 working group, energy demand is projected to grow by10.5% per annum during 1984-1987 but the growth rate declines to only5.7% in 1993, averaging 7.9% from 1984-1993. However, if economic growthand development in Thailand exceeds the current outlook, it would then beunlikely for electricity demand to have begun to decline as early as1989. If most of this demand growth is due to PEA residential customers,then an improvement in the load factor becomes less likely. A forecastalong these lines would be related to a GDP growth rate of 6% per year,still significantly lower than the growth rate of 7.6% achieved during1960-1980 and electricity demand would grow at 8.2Z in the period to 1996with a 67% load factor (Table 5.11).
Table 5.11: MISSION'S HIGH GNP SCENARIO
GROWTH RATE OF ELECTRICITY DEMAND
1983 Projected Growth Rate a/(GWh) (percent)
Residential 4,091 7.5Urban 3,156 7 0 -Rural 935 9.2 c
Industrial 7,554 8.4 d
Co'nercial 5,918 8.4 d
TOTAL 17,563 8.2 -
a/ Based on GDP growth of 6% (3% in agriculture, 7% in non-agriculture).
b/ 3.5% growth in urban population and income elasticity of 1.c/ Estimated from Rural Assessment Report.d/ Elasticity of 1.2 and sector of GDP growth rates of 7%.e/ Weighted average gro-th rate.
Source: Assessment team estimated high demand variant based oncalculations outlined in the paragraphs above and theassumpticns indicated below.
5.32 The effect of a serious change in the load forecasts discussedabove in the next few years may require significant adjustments to EGAT'sfuture program. The load forecast prepared by the Working Group inSeptember 1984, as compared to the high demand scenario for 1989-1996,would result in energy requirements of 57,400 GWh in 1996 compared toonly 50,000 GWh in the scenario accepted by EGAT. The peak generationrequirement would be 9,780 MW, or 1500 MW (15%) higher than with the EGATprojection, as shown in the bottom section of Table 5.12.

- 91 -
Table 5.12: EGAT's TOTAL GENERATION REQIJIREMENTWITH TWO DEMAND Variants, 1979 - 1996
Fiscal Peak Generation Energy Generation Annual Load FactorYear LFWG High D. LFWG High D. LFWG High D.
(MWI) (GWh) (percent)Actual1979 ----2255---- ----13965---- 70.691980 ----2417---- ----14754---- 69.481981 ----2589---- 5960---- 70.381982 ----2838---- ----16882---- 67.911983 ----3204---- ----19006---- 67.92
Forecast1984 ----3601---- ----21272---- 67.431985 ----4026---- ----23770---- 67.401986 ----4413---- ----26055---- 67.401987 ----4860---- ----28696---- 67.401988 ----5285---- ----31016---- 66.99
1989 5604 + 100 33245 33497 66.72 671990 5958 + 200 35463 36117 67.95 671991 6295 + 360 37605 39071 68.19 671992 6640 + 550 39809 42197 68.44 671993 6994 + 770 42093 45573 68.70 671994 7409 + 976 44649 49218 68.79 671995 7839 + 1220 47294 53156 68.87 671996 8282 + 1500 50029 57408 68.96 67
Annual Growth Rate(s)
1979-82 --… 8.0---- 6.5-----1983 ----12.9---- ----12.9-----1984-88 ----10.5---- ----10.2-----
1989-96 5.8 6.2 8.0
Source: Load Forecast Working Group, September 1984; assessment teamadjustments after 1988 based on assumption indicated above intext.
Reliability and Reserve Margins
5.33 The comparison of demand and capacity should not be oversimpli-fied. ECAT has a rule of thumb to approximate the future capacityrequirements. The total dependable capacity of the system less thedependable capacity of the first and second largest units, current Ban0Pakong thermal plants (2 x 550 KW), is defined as the firm capacity

- 92 -
required to meet the forecast peak demand at least cost. 26/ EGAT's 1985Power Development Plan provided for a substantial margin of firm capacityover peak demand, 14% in 1985, declining to 2Z in 1989 but increasing to18% by 1995. EGAT has also aimed to have the firm energy generationpotential close to the actual requirement where firm energy is based onfirm capacity and applying factors of 0.24 for peaking units (hydro,peaking turbines and diesel generators) and 0.70 for base load(thermal). At first sight, this approach appears rather cautious in asystem with so much hydropower capable of delivering more than the outputtaken by EGAT as the dependable capacity. This will apply all the moreso in the i990s when firm energy requirements will cease to prevail andhydro will be ̂ alled mostly to meet peak demand.
5.34 On the other hand, EGAT is now engaged in commissioning yearafter year rather large and complex units, the "teething" problems ofwhich always result in lower performance levels in the three yearsfollowing start-up. Computer-based assessments of loss of Load probabi-lities (LoLP) and expected power curtailments provide a basis for reli-ability evaluation, but the results greatly depend on the quality ofoperating policies and their modeling and on the assumptions about plantoutages.
5.35 The next step is to determine a reliability standard whichstrikes a good compromise between the cost of overabundant margins andthe economic cost of eventuaL outages. Lowering the LOLP from old USstandards to 5 days/year can save 300 MW as against an economic loss ofless than US$60/kW if power outages cost is about USC50/kWh. Experiencein other countries show that average outage costs are about this magni-tude and that actual loss of load is smaller than the computer evaluationbecause many operating flexibilities (overloads, voltage and frequencydrops) are not modeled. Considering the large investment program for thenext decade, it is recommended that EGAT research into the subject ofreserve margin economic optimization.
Fuel Options
5.36 According to EGAT's current analysis, the required capacitywould have to increase nearly 6,000 MW between 1985 and 1996. Accordingto its program EGAT has scheduled installation of about 5,500 MW between
26/ Dependable capacity allows for plants not being able to generatetheir installed capacity. For most thermal plants, operatingrecords indicate that dependable capacity is 95% of instalLedcapacity. For hydro plants, long-term reservoir simulation studiesusing past hydrological records have been undertaken and dependablecapacity averaged 84.5% for existing hydro plants and those underconstruction.

- 93 -
1986 and 1996. During the three years, October 1993 to November 1996,402 of this capacity or 2,180 MW would be installed in three large 600-MWunits, all of which would be dual-fired to burn coal. The cost of thisprogram through 1996 would be about $5.3 billion, with the large dual-fired plants requiring an average $1100 per kW. Such a use of largecoal-burning units requires an examination of what operating and mainte-nance problems might be encountered. Also built into this analysis areother key parameters which need careful consideration and involve majoruncertainties. The price of alternative fuels is one. The price assump-tions being used by EGAT were established in September 1984 but arealready out of date (see Table 5.13). It is not only the current actualprices that are considerabLy lower, but also the expectations regardingthe future prices through the year 2000. These modifications are likelyto improve the competitiveness of coal h.nile possibly causing some hydroto be reevaluated.
Table 5.13: FUEL PRICES ASSUMED IN EGAT'S POWER DEVELOPMENT PLAN(USS per MBTU, 1984)
Imported NaturalYear Lignite Fuel Oil Coal Gas
1985 2.00 4.72 3.19 3.631990 2.28 5.31 3.10 3.541995 2.51 6.42 3.23 3.682000 2.86 7.76 3.39 3.83
Current Actual Price(June 1985) 1.86 3.49 2.08 3.20
Source: Based on EGAT Development Plan, May 1985.
5.37 A constant reexamination of the program is inevitable in viewof the uncertainties involved. Views regarding the size and timing ofthe various units proposed may be changing so the latest cost outlook forthe specific options available to EGAT for expanding generating capacityin the period beyond 1990 is considerably changed from what it was asrecently as the Fall of 1984. For example, on the basis of rough compar-isons using current fuel price relationships (Table 5.14), given therelatively low economic costs of natural gas, combined cycle (CC) plantsshow the lowest average generating cost of USc3.7 to USc4.3 per kWh,respectively. Lignite-fired steam plants are next, with USc5.2/kWh,followed by coal-fired steam units and gas-fired steam units at USC5.3.Fuel oil-fired steam plants at current low price levels show a rough costof USC5.6 per kWh. The average generating cost of hydro, insofar as itis available, depends on its initial capital costs and the length of con-struction periods, although only detailed studies on a plant-by-plantbasis can really establish its actual cost. System studies are requiredto determine the value and role of hydro in meeting the load. If trans-mission costs are added to lignite and port facilities to coal, and the

- 94 -
current low cost of fuel oil is assumed, all three options at the presenttime are very closely competitive and only gas-fired combined cycle unitsstand out as clearly preferable for base load duty. The choices will bedetermined by EGAT on the basis of its view of supply availability,particularly the security of that supply and the actual cost outtook forthe various options and the role that each type of supply will play inactually meeting the Load, but the assumptions upon which these choicesare made must be clearly understood.
Table 5.14: ESTIMATED GENERATING COSTSOF ALTERNATIVE BASE LOAD PLANTS a/
(USS 1985)
GasCombined Imported Imported
Category Steam-Gas Cycle Lignite b/ Coal c/ Fuel Oil d/
Basic Capital Costs SfKW 800 500 1,000 1,100 800
Construction Time (Years) 4 3 4 4 4Capital Cost Incl. Interestduring Const. (SfkW) 928 552 1,160 1,276 928
0 .M.R./Year% of Capital Costs 4 6 5 5 4
Heat Rate (BAU/kWh) 9,500 8,000 10,000 9,500 9,500
Fuel Cost per unit (SMMBTU) e/ S3.20 52.50 11.86 S2.08 S3.49
Useful Life (Years) 25 15 25 25 25
Annual Capital Costs (S/kW) 102.2 72.6 127.8 140.6 102.2
Annual O,M.R. (SAW) 32.00 30.00 50.00 55.00 32.00
Annual Fuel Costs (f/kWh) 3.04 2.0 1.86 1.98 3.32
Average Bus-Bar Costs(US cents/kWh) 5.3 4.3 4.9 5.3 5.6
(4.7) e/ (3.7) e/ (5.2) f/ (5.5) q/
a/ Interest rate, 10%: average load factors, all plants: 67%.b/ Lignite at USS20/ton at Mae Moh. Calorific value taken as 4900 BTU/Ib.c/ Imported coal c.i.f. Bangkok at US55f/ton. Calorific valgs a' 12,000 BTU/lb.d/ Fuel oil price of USS22/bbl. Calorific value of 6.3 x 10 BTU/barrel.e/ With gas at USS2.5O/MMBTU. which is the estimated economic production cost (while the
USS3.20/MMBTU price is the current price to EGAT).f/ Including transmission from Mae Moh to Bangkok.2/ Cost of port facilities for 4 x 600 MW coal plants assumed to be S200 million with capacity
of 6 million tons.
Source: Mission estimates.

- 95 -
The Natural Gas Option
5.38 A crucial aspect of these relationships is the assessment ofthe gas supply and demand. As discussed earlier (para. 4.32-4.38), about230 MMSCFD of gas were produced in 1984. Current prospects are thatproduction will rise to about 485 MMCFD in 1985. The most likely gassupply scenario envisaged by the assessment team was that set out inScenario II (Table 4.5), which estimates gas production to rise to 760MMCFD by 1990 and 804 MHCFD by 1995. Within this supply picture, theassessment team considers gas availability to the power sector to risefrom some 385 MMCFD in 1985 (Table 7.3), to 520 MMCFD by 1990 and around570-600 MMCFD between 1993-95. Due to the uncertainties inherent inestimating gas supply that far into the future, a variant to theassessment team's case of gas availability is also considered. This isScenario I (Table 4.5) and reflects the "Base Case" assumed by the NESDBand ECAT. This scenario does not differ materially from that of theassessment team's up to 1990; however, between 1991-96 its figures forgas availability are between 70-130 MMCFD higher -- all of which could beallocated to power.
5.39 Against such suppLy prospects EGAT has already constructed (orhas under construction) generating capacity with the gas burning capabi-lity shown in Table 5.15. Based on the present prices EGAT pays forlignite (US$1.86lMMBTU), gas (US$3.20/MMBTU) and fuel oilCUS$3.49/MMBTU), the energy costs of lignite plants, combined cycle gasfueled units, gas-fired steam plants and fuel oil-fired steam units areUS$1.86 per million BTU, $2.56, $3.04 and $3.32, respectively. Thismeans that in terms of energy dispatch the order is lignite, combinedcycles, gas-fired steam and then fuel oil-fired steam plant. This meritorder currently does not deviate from that obtained by using the presenteconomic cost of gas (about US$2.50/MMBTU) rather than its financialprice to EGAT (as $3.20/MMBTU). Based on the current prices of its mainfuels to EGAT, the dispatch order is consistent with economic dispatch.This should remain true in the mid-1990s when coal capacity is added tothe system and the energy cost of coal-fired generation is smaller thanthe energy costs of combined cycle units, with gas priced near itseconomic cost, which, by then, will be more than US$2.50/MMBTU.
5.40 The future of gas generated electricity relates closely to boththe supply and cost of the gas. If the gas supply ultimately proves tobe much larger than what has been indicated above and its cost levels nohigher, of course, the future of gas generated electricity as could beinferred in Table 5.16 would be substantial. If, on the other hand,supply continues to be severely limited and alternative sources such asTexas Pacific increasingly costly, then there appears little future forgas in the electricity program after 1992 when it is assumed that NamPhong #1 and #2 CC units would be completed. Even these additions, whichwill increase gas demand by about 80 MMCFD, would eventually have tn herun on gasoil in the late 1990s unless the presencly contemplated decl;)in gas production is corrected. An early switch to a fuel which expected to be expensive at that time would jeopardize the economicviability of the last CC unit to be commissioned.

- 96 -
Table 5.15: PLANTS IN THE EGAT SYSTEM CAPABLE OF BURNING GAS
Retirement
Plant Capacity Gas Demand Date
(MW) (MMCFD)
Southern BangkokUnits 1 and 2 aJ 400 64 1g95
3, 4, 5 900 144 1999
Bang Pakong ThermalUnit 1 550 88 2008
Unit 2 550 88 2010
Bang Pakong Combined Cycle 720 97 2007TOTAL 3,120 481b/
a/ To be converted to gas in 1986.b/ This assumes all units on base load at 70% utilization factor.
Economic dispatch considerations could limit the demand to 400 MMCFD.
5.41 However, it is equally dangerous to completely rule out the gasoption for the period after 1992, since it is recognized that more gassupply than now projected could be available if large reserves arerapidly proven and developed. Therefore, flexibility must beincorporated into ECAT's planning decisions and commitments so that, ifand when gas becomes available at or around current price levels, itcould be used for power generation. Since the various analyses show thatEGAT will need to build over 2000 MW of capacity additions between 1993and 1996, and other options Lesides gas are available, decisions can betaken in stages. If the high gas supply variant materializes, perhaps anadditional 300-MW combined cycle unit at Nam Phong could be commissionedwith a reasonably short lead time and the certainty of a good netbackvalue for the gas consumed, because of its high efficiency and lowinvestment cost. This capacity represents a small addition to the systemso it can be inserted almost at any time. No opportunity is lost indeferring this additional commitment until more is known about gasdevelopment and establishing a core expansion program based on firmlyavailable energy sources, including lignite, hydro and imported coal. Analternative strategy would be to install dual triple oil/gas/coal-firedplants. This strategy is most valid when gas is available early on andsome coal-related heavy investments can eventually be deferred. It maybe a response to uncertainties about the decline of a developed field.Bay Pakong III to be commissioned in 1991 is certainly one of the bestexamples, since the site, which is suitable for coal-firing, is alsoalready supplied with gas. Converting the boilers to gas, if more of itis available, will entail only negligible costs. But for most othersites new gas pipelines would be required and the triple-fired unitshould remain an exception.

- 97 -
The Lignite Option
5.42 As discussed in Chapter III, lignite reserves currently areessentially focused on what is available at Mae Moh -- estimated at 815million tons out of a national total of 857 million tons. Of this totalabout 350 milLion tons are proven and probable and are sufficient tosustain a generating capacity of about 1,700 MW. Three units of 75 MWare in operation and four more units of 150 MW each are under differentstages of implementation. Therefore, 900 MW of additional generatingcapacity (3 x 300 MW) are possible at Mae Moh (Units 8, 9 and 10) andthese plants have been incorporated in EGAT's May 1985 program forimplementation through December 1990.
5.43 The rough analysis noted in Table 5.14 indicates that thedecision to proceed with development of Mae Moh .;jits 8-10 was sound.The transfer price of lignite was about $19.22 per ton in 1983, equi-valent to $1.79 per MBTU, and has risen to about $1.90 per MBTU sincethen. This is close to the estimated lignite opportunity cost based onthe cost of imported coal. 27/ The Meta System Study indicated thatlignite is likely to remain an attractive option for base load generatingcapacity. The calculations prepared for this report indicate that thecost comparison with ott:..r options remains attractive, though close.However, there appears to be a general consensus that mining costs couldbe brought down to make the industry more competitive. Lignite thereforedeserves substantial support as a potentiaL long-term option.
Hydro Plants
5.44 Thailand does not have any major hydro schemes suitable forbase load operation -- apart from those involving international agree-ments. These latter clearly would be economic if they were feasible.However, some 1,000 MW of peak load duty hydro schemes are still avail-able, the largest of which is Nam Choan (580 MW), and recent calculationshave shown these schemes to be economically quite competitive with otheroptions. Again, feasibility becomes the crucial issue.
The Imported Coal Option
5.45 Because of uncertainties about natural gas and the limitedreserves of lignite presently known, new capacity beyond 1993-94according to the ECAT approach would be fueLed with imported coal. Thisis consistent with the position taken in this report regarding theavailability of gas and lignite. However, it would mean a substantialincrease in capital investment as coal plancs are on average $300-500per kW more expensive and importing coal from abroad would probably placesignificant pressure on the balance of payments during the second half ofthe 1990s.
27/ Meta Systems Inc. 1983 Study on Lignite Pricing.

- 98 -
5.46 Because of the difference in capital cost between combinedcycle and coal-fired steam units, for the small part of the power systemwhere combined cycles are applicable, gas can be competitive for pricesup to US$4.37/MMBTU (see Annex 10), that is, much higher than fuel oilparity today. The economic cost of gas, although rising over time,should not be anywhere near this figure by the mid 1990s; but it willgreatly overshoot it afterwards when reserves depLetion approaches. Theissue here is not whether coal should be in time developed massively buthow much this heavy investment can be deferred. Given t!Le uncertainty ongas availability, the strategy in para. 5.41 provides first answers:take advantage of triple-firing and eventually delay coal-relatedexpenditures every time site conditions permit, but since such conditionsare seldom met, keep plans as flexible as possible to pitch in combinedcycle units in substitution of projected single coal-fired ones; acorollary of this solution is that construction lead-times of theseplants must be minimized through advance site study preparation anddesign standardization for reasonably sized units.
Overview of EGAT's Approach to Least Cost Planning
5.47 EGAT's planning department has developed a series of least costsequences for the expanding generacing capacity under different assump-tions using the Westinghouse Interactive Generation Planning (WIGPLAN)III computer program. Various demand scenarios have been used, some ofwhich were indicated earlier in this chapter. As noted, the focus of theEGAT program recently has been on rather modest growth rates of around 6%for the future after 1990. Similarly, main suppLy assumptions have beencautious assuming limited gas availability and no more lignite beyondwhat has already been proven. If unlimited gas supply is developedobviously the system expansion would emphasize more combined cycle gas-fired generating plants along with lignite plants if more of that fuelbecomes available. With limited gas, however, the system expansionexhausts available resources for lignite-fired plants and turns to coal-fired generating plants for base load duty and hydro plants for peakingduty as the most economical. As noted above, this makes sense but onlywithin the strict confines of what is actually known eoday. The key isexploration and development, both in gas, oil and lignite. Decisionstaken today can only be based on what is already known, but an optimisticview must be taken about what can be accomplished in the next two orthree years in exploration and development by the next stage of decision-making. The planning tools available to EGAT make it possible to mini-mize uncertainty without over-investing by using a staged decision-makingprocess.
Staged Decision-Making
5.48 According to EGAT, the plan of May 1985 represents only a firststep and will need fine tuning. An example of EGAT's staged decision-making is reflected in its policies toward electric supply for Region 3.Solutions for an impending shortage of supply in the southern part of the

-99 -
country (Region 3) have been subjected to special review and a stageddecision. As an adequate link does not exist between southern Thailand(Region 3) and the zest of Thailand (Region 1, 2 & 4), optimization hadbeen undertaken first on a two-region basis and then as an integratednational system. This separate, two-stage analysis was necessary asEGAT's work showed the likelihood of a growing energy shortage in Region3 by 1988 with very rapid growth in demand thereafter to more than 1000MW by the year 2000. To alleviate the 1988 shortage, EGAT in its basecase had proposed at varying times (a) securing, as an interim measure, abarge mounted power plant of 75 MW rating, and linking it to the southerngrid at Khanom; (b) installing a submarine gas pipeline from Erawan inthe Gulf of Thailand to Khanom; and (c) setting up at Khanom, a combinedcycle power plant in four stages, with a cumulative capacity of 600 MW.The uncertainty with regard to gas supplies has forced EGAT to adopt aninterim approach which would speed up the installation of a new electrictransmission line (originally scheduled for the mid-199Os) and delay aninvestment decision in favor of a gas pipeline and a combined cycle plantat Khanom in the South. Further, on account of the long lead time neededfor hydroelectric projects, that alternative was not considered a viablesolution for the immediate future. It appears therefore that EGATbelieves they can speed up the process of strengthening theinterconnection between the southern grid with the central grid andadvance the investment on a 230-kV tie line, to a completion date in late1990. This would permit the evacuation of 300 MW of additional powerfrom the Central and Northern Regions (where there is currently an excessof generating capacity) to the southern region. Such a solution isbelieved to have the following advantages:
(a) Investment requirements for a transmission tie line would besignificantly lower compared to a submarine pipeline (US$50million against about US$200 million);
(b) Savings could be realized in EGAT's reserve margins;
(c) By integrating the entire system into a single grid, EGAT couldchoose lower cost generating options regardless of regionalconstraints; and
Cd) The risks associated with insufficient supplies of gas could beavoided while gas-fired combined cycle plants still could bebuilt in Region 3 in the event that the construction of a gaspipeline to ihanom subsequently proves to be economicallyviable.
5.49 The commissioning of the Chiew Larn (Region 3) hydro electricproject (240 MW) is expected to take place in mid 1987. Furtherstrengthening of the transmission network between Prachuap Khiri Khan andSurat Thani (about 300 km) is the proposal being considered to permittransfer of about 300 1W from the central region to the south. However,the network can be constructed by 1990 or perhaps a little sooner only iffeasibility studies are carried out quickly and a decision to go ahead is

- 100 -
taken soon. In view of this, some supply shortage in the southern regionmay be inevitable in the 1986-87 period. EGAT has been examining interimsolutions to make up this projected shortfall. Available options consistof (a) shifting some gas turbines from South Bangkok Power Station;(b) purchasing new gas turbines; or (c) installing one more 75 MW bargeplant. All these solutions could be implemented in about three years butwould be costly for such a short term solution. In any event, movingtowards a quick integration of the system appears to be the bestapproach.
5.50 Beyond this type of fine-tuning, which is permitting a delay inthe Region 3 expansion program to be replaced by a strengthened inter-connection, EGAT's least-cost development solutions appear to be focusingon a clear two-stage approach. The first stage would consist ofcompleting the full utilization of proven gas and lignite resources whileat the same time integrating more effectiveLy the full system by under-taking investments necessary to strengthen several transmission lines toallow the transmission of power from north to south. The effect ofintegrating the system through the fine-tuning system analysis willundoubtedLy reduce the level of investment. By strengthening the elec-trical interconnector between Region 1 and Region 3, the reserve marginfor Region 3 is assumed to be approximately 25% instead of the 30%previously used in EGAT's system planning. 28/ Stage 2 planning is morecomplex in that it cannot be truly finalized until a better assessment ofgas availability has been made. The assessment team would add lignite tothis requirement. The general outline of the current least-cost develop-ment program is summarized in the list of urojects indicated in Table5.16, in which large new thermal plants are designed for dual coal/gas/oil firing and substantial use is made of imported coal or fuel oil inthe later 1990s. This two-stage approach of EGAT makes large and growingfuel imports in the late 1990s and increasingly large investment program(Table 5.18) two of the most troublesome aspects of the future program asit now stands.
5.51 The absolute size of the program is a very serious problem.According to the rough estimates indicated in Table 5.18, ECAT's programwill average nearly $800 million per year between 1988 and 2001. Theaverage cost of projects to be completed between 1988 and 1995 would beabout $635 million per year. The size of EGAT's investment program aswith other large public sector enterprises, has been a serious problemthroughout the fifth plan period. Initially (November 1981), whencombined with ongoing projects, investments would have required a totalcapital outlay of Baht 89 billion for the reriod 1982-86. Thisinvestment program was later revised to conform to the revised loadforecast of June 1982, reducing planned investments during the fifth planperiod to Baht 78 billion. In line with its further downward revisionsof power demand growth projections in February 1983, EGAT made another
28/ The reserve margin for Regions 1, 2, and 4 remain the same, at 25%.

- 101 -
downward adjustment in its investment program to Baht 68 billion bypostponing the construction of six major projects by one year each.
5.52 EGAT's investment programming thus has shown considerableflexibility over the last years in adjusting to a more constrainedfinancial environment as well as a changing demand outlook by graduallyphasing back investments by a total of 25% in planned capital outlays forthe fifth plan period. Indeed, the program designed for the remainder ofthe fifth plan appears quite conservative with only 1,000 MW of plantcurrently under construction. However, questions remain for the programbeyond 1986 which have been addressed in this report. First, the programas now planned can only foresee modest investments in gas utilizinggenerating capacity to cover two gas combined cycle units of 300 MW each(Nam Phong 1 & 2). As discussed above, this strategy is based on thecurrent outlook for available gas supplies. The outlook for the avail-ability of more gas is too uncertain to choose more gas units over othersupply options, although dual-fired facilities of 600 MW are scheduled tobe available at Bang Pakong 3, for 1991. EGAT thus is ready toincorporate relatively costly options in terms of capital investment,with the large investme-its in 900 MW of Lignite fuel plant at Mae Moh(Units 8-10) amounting to roughly $11 billion and the 600 MW Bang Pakongsuitable to burn coal costing $650 million. Second, more careful consi-deration of the elements of uncertainty in EGAT's investment planning,particularly regarding pricing, demand outlook, and gas supply prospects,will undoubtedly raise the cost of the program as dual-fired facilitiesrelying on coal become more important.
5.53 The other major factors in the power program -- MEA and PEA --have significantly increased their investment requirements. Six percentof total investment planned by the power utilities during the fifth planperiod was scheduled for MEA, and fifteen percent for PEA. For PEA thetotal number of households with electricity was programmed to more thandouble from 2.2 milLion in 1981 to 4.5 miLlion in 1986, roculting in anincrease in electrification from 33% to 62%, aimed at full electrifica-tion ty the late 1980s. The program has since been reduced somewhat aswas that of EGAT. The PEA program, originally scheduled to cost aboutB19,000 million, was reduced to B15,820 million. The MEA program wasestimated to be about B6,850 million in 1982 and was reduced to B4,271million by 1984. The total electric power sector program thus wasreduced from B102,000 million to B86,500 million.
5.54 Despite these reductions, power investment as a whole has beenrising rapidly. From the plan period 1972-76, it has risen from US$240million per annum to nearly US$700 million per annum du-ing the fifthplan period measured in terms of constant 1982 Baht. It is expected torise at a level of $920 million per annum during the sixth plan period1987-91 in terms of current prices. Although these levels appear justi-fied in terms of meeting the growth in power demand, it is not known yetwhether sufficient internaL cash resources can be generated by the powercompanies to finance the investment.

- 102 -
Table 5.16: PRELIMINARY EGAT PROGRAM (1958-2001)
Commissioning ApproximateName ot Project Rating Date Project Cost a/
(KW) (USS million)
2nd PPB* 75 June 1988 82.1Mae Moh £8 300 July 1989 380.0Srinagarind £5 180 October 1989 33.1Mae Moh £9 300 June 1990 380.0Nam Phong CC £1 300 November 1990 210.0Mae Moh £10 300 Decemoer 1990 380.0Bang Pakong TH £3 600 October 1991 654.0Nam Chon 11,2 290 October 1992 175.0Na. Phong CC £2 300 January 1993 214.0Na. Chon 03,4 290 April 1993 175.0Bang Pakong TH £4 600 October 1993 512.0Kaeng Krung £1,2 b/ 80 October 1994 87.0Krabi 2 £1I 150 November 1994 236.4Ao Phai £1 600 October 1995 922.2Ao Phai TH £2 600 October 1996 584.4Krabi 2 f2' 150 November 1996 236.4Ao Phai TH £3 600 October 1997 584.4Krabi 2 £3' 150 November 1997 236.4Ao Phai TH £4 600 October 1998 584.4Sai Buri 46 November 1998 77.1Coal-Fired £1 600 October 1999 900.0Coal-Fired £2 600 April 2000 900.0Coal-Fired £3 600 October 2000 900.0Coal-Fired £4 600 April 2001 900.0
Total Added Capacity 1988-2001 = 8,911.0 MW S10,343.5
Total Not Capacity Increased 7 1,284.9 MWAverage Cost per kW = USS1,161Average Added Capacity per annum = 685.5 MWAverage Cost per annum = USS795.7 million
a/ Based on EGAT's approximate project costs in Table 7,1, p. 39, nEGATPower Development Plan (1985-2001)."
bh Generation projects in Southern Region (3).

- 103 -
Table 5.17: PROJECTIONS OF CAPITAL INVESTMENT FORELECTRIC POWER IN FIFTH AND SIXTH PLAN PERIOD,
FY1970-1991 a/(Million Baht, 1982)
TOTALEGAT PEA MEA POWER
Fifth Plan Period
1982 13,797 2,980 719 17,4961983 14,058 2.280 783 17,1211984 10,932 3,122 968 15,0221985 9,036 3,537 1,022 13,5951986 13,756 390 779 18,4361982-1986 61,579 15820 4,271 81,670
Sixth Plan Period
1987 15,436 1,592 1,912 18,9401988 18,798 2,608 2,083 23,4891989 22,304 1,238 3,276 26,8181990 25,705 1,080 3,408 30,1931991 26,615 950 1.862 29,4271987-1991 108,858 7,463 12,541 128,867
al Investment estimates 1982-85 for EGAT, MEA and PEA based on Bank ofThailand data. Projections 1986-91 for EGAT based on Bank StaffAppraisal Report 4799-TH, March 1984 (interest during constructionincluded). For MEA and PEA 1986-91 based on World Bank SAR, 4201 -TMH, May 1983, p. 52.
Table 5.18: PROJECTIONS OF CAPITAL INVESTMENT FOR ELECTRIC POWERIN FIFTH AND SIXTH PLAN PERIOD, 1972-1991 a/
(million Baht, USS, 1982) bl
ANNUALEGAT PEA MEA TOTAL AVERAGE
Baht USS Baht USS Baht USS Baht USS usS
Fifth Plan Period1982-86 61,579 2,463 15,820 633 4,271 171 81,670 3,267 653
Sixth Plan Period1987-91 108,858 3,888 7,463 267 12,541 448 128,867 4,602 920
a/ Investment estimates 1982-85 for EGAT, MEA and PEA are based on Bank of Thailanddata. Projections 1986-91 for EGAT are based on Bank SAR 4799-TH, March 1984, p. 64(interest during construction included). For MEA and PEA 1986-91 based on World BankSAR 4201-TN, May 1983, p. 52.
b- Exchange rates used are:1982-1984 = 22.5 BahtAUSS1985-1991 = 28 BahtAUSS

- 104 -
Reducing the Level of Investment
5.55 Based on the components of the indicated expansion in theelectric power system, investment costs for generating facilities wereestimated in Table 5.18. A total of US$lj.3 billion would be requiredover the 13-year period after 1988. In the sixth plan period an averageof nearly $700 million a year (excluding price escalation) would berequired for the sector including transmission and the MEA and PEAprograms. Major efforts will be required to ensure that this programdoes not become so large as to seriously jeopardize the availability ofinvestment funds for other equally important activities both in thepublic and private sectors. The program as presented in this chapterrepresents a least-cost solution on the basis of EGAT's latest projec-tions of demand, the most recent estimates of gas and lignite availabi-lity and the current outlook for imported fuels. Although the level ofconsumption may be able to be reduced in the future, as noted in ChapterIX, this may prove difficult in the short run. Nonetheless, the assess-ment team believes that high priority should be attached to conservationefforts which might lead to a savings in the proposed expenditures andmake possible a reworking of the programs. Key assumptions such asprices, GDP forecast, supply projections, need frequent updating and alsomight result in investment savings. There are several additional issueswhich may affect the size of the investment program and were addressedpreviously, such as the size of the reserve criteria, the lesser use ofcapital intensive fuel options, and the greater use of combined cycleplants in the system.
5.56 The need for flexibility in the expansion program can be bestachieved by planning a plant mix emphasizing those units that are bothlow cost and have short lead times -- combined cycles. This is especial-ly true in the face of major uncertainties in the growth of residentialconsumption with its low load factor. An expansion program combiningimproved load management policies with additional gas-fired combinedcycle units, and which would constantly be fed with new information aboutdemand could help to minimize investments. Its main cost would be toaccelerate slightly the depletion of gas reserves.
5.57 For the longer term and what this report considers the secondpoint of decision around 1988, EGAT may have to turn to coal-burningplants. As early as October 1991, the Bang Pakong No. 3 unir isscheduled to come on stream with a multi-fired facility capable ofburning coal. The strategy apparently is to include dual-fired cap?cityin all large steam units scheduled for installation beyond 1991. Theseplants (e.g., 2400 MW Ao Phai No. 1-4) are intended to operate on gas aslong as gas supply is available but would have the equipment available toswitch to coal or oil as gas fields near depletion. The large units thatwould follow would be designed for burning only coal under the currentplan. As noted earlier the projected levels of investment may pose aserious constraint and need to be reexamined most carefully. The impli-cations for future investment levels cannot be ignored.

- 105 -
Balance of Payments Implications
5.58 The trends outlined in the EGAT program point up clearly thetroublesome balance of payments implications. Whether the future in the1990s is based on oil or coal, there clearly will be a higher return toenergy imports in the 1970s. Unless the gas or lignite programs can befurther expedited to produce more, Thailand will face another seriousenergy problem in the mid- to late-1990s.
Table 5.19: EGAT ENERGY GENERATION BY TYPE OF FUELFY85-2000
1985 1990 1995 2000
Total Generation in GVh 23,050 35,46 46,970 61 ,260
Percentage ShareLignite 12 25 24 19Imported Coal 0 0 1 44Natural Gas 35 56 56 16Fuel Oil 33 1 1 8Hydro 15 16 15 11
Source: Based on EGAT 1985 projections.

- 106 -
VI. PETROLEUM PRODUCT DEMAND, SUPPLY AND PRICING
Historical Petroleum Product Demand
6.1 In tandem with the high rates of economic growth Thailandexperienced during the 1970s, petroleum product consumption increased atan average annual rate of 9.5Z during that decade, rising to 218,400bbls/day in 1980. However, the 1979-80 period represented a fundamentalturning point in both the level and structure of demand for petroleumproducts triggered by the doubling of oil prices during the second oilcrisis. Between 1980 and 1982 the demand for petroleum declined 13%,reaching the low point of 189,800 bbls/day in 1982. This was due partlyto the recession and the increase in retail prices 29/, as well as theadvent in 1981 of natural gas as a major new energy source in the powersector. However, the recovery of petroleum demand between 1982-84 was asdramatic as its decline over the 1980-82 period. By 1984, theconsumption of petroleum products rose to 224,400 bbls/day, implying anannual rate of increase of 8.7% between 1982 and 1984.
6.2 Thus, by 1984 petroleum demand exceeded its previous 1980 highpoint by nearly 3%. However, the structure of demand had undergonesignificant modification during that short four-year period. In particu-lar, the share of fuel oil declined from 37% of the petroleum market in1980 to 24% in 1984 as natural gas entered the energy supply mix. Inaddition, as a result of the distorted structure of retail petroleumproduct prices, which differ substantilly from their border price struc-ture. the following occurred:
(a) A rapid increase in the demand for LPG, especially in thetransport sector as a substitute fuel for gasoline in taxis andcars. Between 1980-1984 the consumption of LPG increased byabout 28%/year, tising to 16,500 bbls/day in 1984 or about 45Zof gasoline consumption (see Table 6.1). Indeed, LPG's shareof the petroleum market rose to 7% in 1984 from 3% in 1980;
(b) An unprecedented increase in the demand for kerosene, themarket share of which increased from 2% to 4% between 1980 and1983. Demand for this product grew an average of 23% a yearover the period, a large share of it caused by the adulteration
29/ Between January 1980 and December 1982, the retail prices of premiumgasoline, diesel oil and LPG increased by 72%, 51%, and 36%respectively.

- 107 -
of diesel oil with kerosene, as diesel oil was priced about 14%above kerosene at the retail level; 30/
(c) In the case of diesel oil, although demand declined by about10Z between 1979 and 1982, between 1982-84 consumptionincreased by one-third and the share of its use in the trans-port sector rose from about 50% in 1979 to 68% by 1984. Thiscoincides with the increasing use of diesel-fueled rather thangasoline-fueled pick-ups and light trucks (see para. 6.28).While in 1979 diesel oiL accounted for about 35% of petroleumdemand, by 1984 this had grown to 41%;
(d) A 12% reduction in gasoline demand between 1979 and 1984, asthe share of this product in the petroleum product marketdeclined from 19% in 1979 to 16% in 1984. This in large partoccurred because of the interfuel substitution of LPG anddiesel fueled vehicles caused by the large price differencesbetween gasoline, LPG and diesel resulting from higher gasolinetaxes. Indeed, within the gasoline market itself a dramaticshift in demand has occurred between premium and regulargasoline due to the erratic retail pricing policies (para. 6.3)pursued for premium gasoline. While in 1979 premium accountedfor about two-thirds of the gasoline market (Table 6.1), thisshare had coLlapsed to merely one-third of the market by 1982,during which time the differential between premium and regulargasoline increased sharply (Table 6.2).
Table 6.1: DEMAND FOR LPG, PREMIUM, ANDREGULAR GASOLINE, 1970-1984
(barrel s/day)
Year/Product LPG Premium ufts Regular Gas Total Gasoline
1970 1,500 16,3001979 6,400 25,200 15,500 40,7001980 6,100 21,400 17,300 38,7001981 7,800 19,100 16,900 36,0001982 10,400 11,900 22,800 34,7001983 14,300 12,700 22,900 35,6001984 16,500 14,500 21,900 36,400
30/ As a result of measures instituted by the government in late 1983,kerosene demand had declined by almost 50% in 184. These measuresincluded a 50% reduction in the kero/diesel price differential andgovernment regulation of bulk sales to peddlars.

- 108 -
6.3 During the 1979-1981 period, the retail prices of 2remiumgasoline were 4-6% above those of regular, and the total demand forgasoline declined some 12% with premium dropping about 24% and regularrising some 9% (see Table 6.1). This occurred even while the differen-tial in their retail prices was between 4-6%; consumers were moving tothe lower priced fuel, a simple choice between two easily substitutablefuels. However, following the 1981 Baht devaluation, the price ofpremium was raised to 18% above regular and remained at that level untilMarch 1983 when it was reduced to about 13.5% above the price of regulargasoline (Table 6.2). The response from consumers was immediate. Whathad been a gradual shift from premium to regular in a declining gasolinemarket over the 1979-81 period was transformed into a precipitouscollapse of premium demand (by 38%) in 1982; the consumption of regulargasoline increased by 35% even though total demand for gasoline declinedby 4% in that year.
Table 6.2: RETAIL PRICES OF PREMIUM
AND REGULAR GASOLINE, 1979-PRESENT
(Baht/I itre)
Dates Premium Gas Regular Gas Ratio Prem/Reg
14 July 79-Feb. 80 7.84 7.45 1.05210 Feb. 80-20 Jan. 81 9.80 9.26 1.05821 Jan. 81-1 Dec. 81 11.90 11.40 1.0442 Dec. 81-28 March 83 13.45 11.40 1.18029 March 83-20 Oct. 83 12.60 11,10 1,1351 Dec. 83 to Present 11.70 10.80 1.083
6.4 Annex 6 shows the consumption, imports and refinery productionfor each petroleum product between 1970-84. Of special note is:
(a) the dominance of diesel oil (41%) in the petroleum market in1984, followed by fuel oil (24%), and gasoline (16%);
(b) the growth in gasoline demand of 10.7% a year between 1970-79,which turned into an annual average decline of 3.2% between1979-1983;
(c) the associated explosion in LPG demand, especialLy after 1978,as retail pricing policies induced the substitution of gaso-line. The annual average growth rate of LPG demand jumped from17.5% between 1970-1979 to 23.9% during 1979-1983; and
(d) the consumption of fuel oil, which had grown 13X a year between1970-1980, started to decline during 1980-1984, by an average9.4% per year, initially as a result of the recession and thenas natural gas began to flow in 1981.

- 109 -
6.5 The disaggregation of petroleum demand by fuel type andeconomic sector is shown in Annex 7 for the period 1971-1983.Unfortunately, there are significant problems regarding the reliabilityof end-use data due LO the method used to establish sectoral use which isoutlined below. The oil companies make direct sales of product to majorconsumers and also to intermediate agents who in turn sell to others.Present practices identify major end-users of each product as those whopurchase directly from the oil companies. However, in the case of salesthrough intermediate agents the end-use sector is not identifiedexplicitly. For example, in the case of gasoline, 91% of sales by volumeare through agents, while for kerosene, diesel, LPG and fuel oil theproportions are 82%, 732, 72%, and 14%, respectively.
6.6 The current NEA method of allocating agent sales by sector isbased on the percentages of identified direct sales. This would beappropriate if no difference were expected between large and smallconsumers in fuel type and use patterns, but this is not the case. Inthe assessment team's view, NEA should undertake, on a continuing basis,end-use surveys among the smaller consumers in particular in order toestimate consumption shares for the various sectors. Suclh data areespecially important to the issue of petroleum product demand forecastingwhich is discussed below (para. 6.38). Overall, the estimation andanalysis of energy use by economic sector is an area of energy planningwhich, in the assessment team's view, NEA needs to strengthen and assignhigher priority.
6.7 Despite these limitations, it is possible to draw broad con-clusions about the trends in demand for petroleum products for the majoreconomic sectors in Thailand. In volumetric terms, the transport sectorhas dominated petroleum demand over the last several years; its share hasrisen slowly from 45% in 1971 to 52% in 1983. The share of petroleumproducts used in the manufacturing sector declined from 20% in 1971 toabout 13% in 1983, while that of agriculture has moved only slightly,from 12% in 1971 to 10% in 1983. The share of petroleum product used bythe power sector increased from 12.6% in 1971 to about 20% in 1979 butsubsequently declined to 15% in 1983 due to the emergence of natural gas.
6.8 In the case of diesel oil, demand has traditionalLy been drivenby the transport and agricultural sectors which together accounted for77% of diesel consumption in 1971 and 90% in 1983. What has beenparticularly significant over the last couple of years has been therapidly rising share of diesel oil consumption being devoted to transportuses. While in 1971 the transport sector accounted for 46% of diesel useand agriculture about 31%, by 1983 the share of transport had jumped to

- 110 -
63Z and that of agriculture had declined to 26Z. 31/ Fuel pricingpolicies have played a major role in acclerating this trend (para.6.28). Almost alL larger trucks, tractor/trailers and most buses arediesel fueled (accounting for roughly 15% of total motor vehicles) withcars and taxis being largely spark ignition engines fueled with gasolineand, increasingly, LPG. In the range of smaLl trucks, pick-ups and otherlight commerciaL vehicles there is a mixture of both diesel and sparkignition engines. It is in this mixture of engine types (diesel andspark ignition) among light trucks and pick-ups that dramatic changeshave occurred in the last couple of years. Table 6.3 shows the estimatedannual sales of passenger cars and light trucks/pick-ups in Thailandbetween 1977-84.
Table 6.3: ESTIMATED SALES OF PASSENGER CARS ANDLIGHT TRuCKS IN THAILAND, 1977-84
Total
Passenger Light Trucks/Pick-upsYear Cars Diesel Gasoline Total
1977 21,400 36,4001980 26,900 9,o00 29,900 39,7001982 27,300 36,600 7,800 44,4001983 33,400 53,200 5,600 58,8001984 33,400 63,200 3,900 67,100
Two important points are highlighted in this table:
(a) annual sales of passenger cars relative to light trucks/pick-ups declined from 59% to 50% between 1977 and 1984. This wasreflected in light truck sales increasing at 14Z a year between1980-84 compared to 5.6Z in the case of passenger cars; and
(b) since 1980, when vehicle assembly plants in Thailand beganintroducing light trucks/pick-ups with diesel-fueled engines, adramatic shift has occurred in the ratio of gasoline to dieselfueled engines among this class of vehicle. While in 1980diesel engined light truck sales only made up 25% of totalsales, by 1984 diesels had captured 94% of new light trucksales. Based on an estimated annual use of about 50,000kilometers this switch in engine type is estimated to haveaccounted for more than 80% of the increase in use of dieseloil over the past couple of years.
31/ By 1984, the share of diesel in transport rose to 68% and that ofagriculture declined to about 22%.

- ill -
6.9 The other important sector which uses diesel oil is agri-culture, which includes fisheries. In this sector, fisheries aetivitiesaccount for roughly two-thirds of diesel use (approximately 15X of totaldiesel demand in 1984) as most fishing vessels have diesel engines.
6.10 Fuel oil consumption is dominated by the manufacturing andelectricity generating sectors. In 1971, manufacturing claimed 572 oftotal fuel oil use; however, this declined to 37Z by 1983. The two sub-sectors that have driven the manufacturing use of fuel oil to date arecement and textile production, using about 41% and 20X, respectively, ofthe fuel oil consumed in this sector in 1983. In contrast, the share offuel oil used by the power sector had increased from 37% in 1971 to 55Z(31,600 bbls/day) in 1983.
6.11 About 90% of the demand for gasoline arises from the transportsector, and kerosene consumption traditionally has been dominated by theresidential sector (76% of demand in 1979) although it declined to 32% in1983. The main use of kerosene in residences is for lighting in non-electrified households which in 1982 represented about 4.3 millionhouseholds 32/ (or 52% of total households) and, to a much lesser extent,for cooking purposes. Based on an estimated kerosene use for lighting ofabout 1 litre/week/non-electrified household, total consumption for thispurpose is estimated at about 3,800 bbls/day, which would account for 80-90% of that allocated to residential use. An increasingly large propor-tion of kerosene demand (61% by 1983) is unidentified in terms of end-usesector (Annex 7). The amount of unidentified use had been rising sinceabout 1981 due to the growing adulteration of diesel oil with kerosene.However, new measures instituted by the government in late 1983 to reduceadulteration effectively reduced kerosene domand by nearly 50% in 1984.
6.12 In the case of LPG, the demand structure has changed over chepast few years. In 1983 about 45% of its use was in transport, 40% inthe residential sector (for cooking and hot water), and 13% in manufac-turing. In 1979, residential use made up 56% of LPG demand, and trans-port only 20% because of the low retail price of LPC relative togasoline.
Petroleum Product Pricing
Background
6.13 Similar to the principles of gas pricing outlined earlier, theproposals for petroleum product pricing in Thailand are based on theassumption that optimal fuel use and investment will result if local
32/ Based on 1982 data, 79% of urban households (1.45 million) and 41%of rural households (6.8 million) were electrified.

- 112 -
retail prices reflect the true opportunity costs of fueLs to thecountry. The best way to achieve this is by decontrolling petroleumproduct prices to ensure that domestic prices automatically reflect theopportunity costs of petroleum products. In the view of the assessmentteam, Thailand shouLd be moving towards such a policy. Until it isadopted, the most severe distortions in the petroleum product pricingsystem need to be addressed and measures undertaken immediately to remedythem. Since all th- petroleum products consumed in Thailand are tradedinternationaLly, their opportunity costs are the prices at which they areimported (if local demand exceeds supply) or exported (if domestic supplyexceeds local demand). This has two implications:
(a) the overall retail price level of petroleum products shouldreflect at least the international price levels for the rele-vant market (Singapore); and
(b) the structure of domestic retail prices should reflect thestructure of relative international petroleum product prices.
6.14 With regard to the first issue, the value of a reconstitutedbarrel of oil in Thailand at the retail level in February 1985 was onlyabout 22% above import prices (see Table 6.4 below), excluding jet fuel33/ Although from the viewpoint of petroleum price levels this wouldappear adequate, there is an important fiscal issue to consider. This isbecause the present average price is lower in relation to import pricesthan it was before the October 1984 devaluation when it was about 40% androughly in line with general tax rates. Clearly, this has had sub-stantial revenue implications for the government. As such it is of someurgency that the average retail price level be raised back to the levelof about 40% that prevailed before the latest devaluation. It is veryimportant also that domestic prices continue to reflect internationalprices following future changes in either exchange rates or world prices.
6.15 The key problem with petroleum product prices in Thailandrelates to their structure at the retail level which promotes uneconomicfuel use and introduces distortions in demand to such a degree that majorincremental investments in conversion capacity in the refining sector mayappear warranted if the resulting demand patterns are to be met largelyfrom local refining capacity. In particular:
(a) automotive diesel oil retail prices are too low relative topremium or regular gasoline prices;
33/ Due to the decrease in c.i.f. prices (even when expressed in Baht)since February 1985, by June 1985 the value of the reconstitutedbarrel at the retail level had risen to about 31% above that at thec.i.f. level.

- 113 -
(b) LPG retail prices are too low relative to the prices ofgasolines;
(c) kerosene recail prices have been too low relative to automotivediesel oil; and
(d) the retail price differential between premium and regulargasoline should not exceed the benefit in improved fuel economyfrom the higher octane fueL 34/ (about 1% improvement in fueleconomy increase in octane number). This differential has beenreduced to around 8% since December 1983, compared to 14-18% inthe period December 1981 to December 1983 (Table 6.2).
6.16 Table 6.4 shows the structure of petroleum product prices inFebruary 1985 from import parity (c.i.f.) through to the retail level.
Table 6.4: STRUCTURE AND LEVEL OF PETROLEUM PRODuCT PRICES,FEBRUARY 1985 cl
(Baht/l itre)
C.I.F. Taxes & Marketing Oil Fund RetailProduct/Price Level a/ Duties Margin (Deficit) Price
LPG bl 4.674 0.502 0.931 (0.717) 5.39Premium Gasoline 6,245 4.043 0,569 0.843 11.70Regular Gasoline 5.706 3.956 0.525 0.613 10.80Kerosene 6.073 0.432 0.3964 (0.781) 6.12Auto. Diesel Oil 5.808 0.959 0.439 (0.506) 6.70Resid. Fuel Oil(3.5% sulphur) 4.853 0.001 0.147 (0.911) 4.09
a/ Exchange rate Baht 27.7 = USS1.00.b/ This refers to "controlled" LPG price (i.e. for non-automotive
purposes). In addition this unit price is for a 50 kg cylinder butexpressed in liters.
c/ The weighted average c.i.f. price in June 1985 had declined by about8% compared to February 1985 due to decreases in kerosene, dieseloil and fuel oil prices ranging between 7-12S.
6.17 Product prices are set at the ex-refinery level through theMinistry of Industry, and at the retail level through the NationalPetroleum Policy Committee (NPPC). The ex-refinery prices areestablished on the basis of Singapore posted prices and notional freight,and are converted into Baht at the prevailing floating exchange rate.The ex-refinery price is based on an average of Singapore price postingsusing a different price base for imported and domestically refinedproducts. Ex-refinery prices are calcuLated by the Ministry of Industry
34/ In the case of 97 (RON) octane premium and 85 octane regulargasolines this differential should be less than about lOX.

- 114 -
and changes are put in effect by the Petroleum Policy Committee wheneither Singapore prices or exchange rate variations require a petroleumprice change. Up to the October 1984 devaluation the ex-refinery pricesof products in Thailand were consistently below (about 1-22) c.i.f.import parity prices. However, since October 1984 the ex-refinery pricesof most products have been somewhat higher (about 1-3%) than the c.i.f.import prices of these products. In the view of the assessment team, itis critical that Lhe local refining sector not be subsidized and in thiscontext policy regarding ex-refinery pricing of petroleum productsbecomes very important.
6.18 The retail price includes import duties, business and municipaltaxes which are levied on imported products or excise and municipal taxeswhich are levied on locally produced products. In addition, retailprices include a margin for marketing activities and a contribution to ora subsidy from the Oil Fund. There is no difference in retail priceregardless of whether the product is imported or produced locally.
6.19 The Oil Fund was established by the government in 1974,initially for one year, as a price stabilization mechanism during aperiod when international prices were undergoing major upward changes.The position of each product vis-a-vis its contribution to or subsidyfrom the Oil Fund as of early February 1985 is shown in Table 6.4. Themassive Oil Fund transfers for LPG, kerosene, diesel oil and fuel oil areof special concern because if they are sustained throughout 1985 theywould amount to some 5 billion Baht, or nearly 1/2% of GDP. The Oil Fundstabilizes retail prices by absorbing increases or decreases in ex-refinery prices through a cross-subsidization mechanism between productswhich do not require any direct transfers to or from the government'sbudget as long as the Fund remains more or less in balance or insurplus. In the past, however, the Fund has often run major deficitswhich have required contributions from the government. As noted above,the Fund has recently been accumulating a monthly deficit because theimpact of the November devaluation has not been passed through to retailprices. The original objective for establishing the Oil Fund, namely,the stabilization of short-run international oil price movements, appearsnow to play a secondary role. In practice the Fund has become a discre-tionary mechanism to delay adjustments in retail prices resulting fromincreases in the cost of petroleum products to the country (through Bahtdevaluation or increases in international product prices) and a mechanismto cross-subsidize petroleum products, and it can be fairly costly interms of tax revenues for the government.
6.20 One desirable alternative to resolve this issue would be toabolish the Fund and establish a mechanism by which domestic prices arelinked to those at the international level and reflect automaticallychanges in either exchange rates or border prices. In addition, retailprices would need to be increased so that the average level of thereconstituted barrel is at least 4CZ above the c.i.f. value, thereby re-establishing the level which prevailed before the October 1984 devalua-tion and which is roughly in line with the general tax level in Thailand.

- 115 -
In effecting this adjustment, a new structure of retail prices whichreflects the structure of product prices at the border price level moreclosely could also be put in place. There may be some practicalproblems, however, in implementing such reform, for example because ofexisting tax ceilings which would not allow the higher taxes required fordiesel oil, LPG and kerosene. Consequently, while these issues are beingresolved, the Oil Fund could be restructured in such a way that theeconomic costs of petroleum products are reflected automatically inretail prices. The Fund would need to be subject to an automatic"trigger" which would signal the need for changes in retail prices. Themagnitude of the price change could be related directly to changes ininternational prices valued in domestic currency. This procedure couldbe used in the short-term to correct the price structure.
6.21 As shown in Table 6.4, the higher taxation on gasolinescompared to automotive diesel oil results in a major change in theirrelative prices at the retail level compared to the c.i.f. level. Forexample, retail premium gasoline currently is priced 75% above dieseloil, while at the border price level it is only 7.5% above. Much smallerdistortions occur in the case of other products, as shown in Table 6.5.For example, kerosene is 5% above automotive diesel at the border leveland 9% below at the retail level. The major consequences of these pricedistortions are outlined below with special reference to the fuels usedin the transport sector (accounting for almost 52Z of petroleum productconsumption).
Table 6.5: PETROLEUM PRODUCT PRICE RATIOS AT
RETAIL AND C.I.F. LEVELS, FEBRUARY 1985
Ratio C.I.F. Level Retail Price Level
Premium Gas/Diesel 1.08 1.75Regular Gas/Diesel 0.98 1.61Kerosene/Diesel 1.05 0.91LPG/Diesel 0.81 0.81Residual Fuel Oil/Diesel 0.84 0.70
Pricing Fuels Used in Transport: Gasolines, Diesel and LPG
6.22 The compression ignition diesel engine has a considerablybetter fuel economy compared to the gasoline fueled spark ignitionengine. This is due to the lack of throttling losses, use of a highercompression ratio engine, as well as the use of a fuel with a higherspecific energy content per volume unit. Many comparisons of the fueleconomies of gasoline and diesel powered vehicles often are made in caseswhere both vehicles have equal engine displacements (c.c. ratings).However, in such comparisons the diesel vehicle would have a lower horse-power and hence less power output and poorer performance (e.g., in

- 116 -
acceleration). Consequently, Lhe most appropriate comparison is forvehicles of comparable performance and weight but different enginedisplacements. Pertinent data for such cars are shown in Table 6.6.
Table 6.6: VEHICLE PERFORMANCE AND FUEL ECONOMY FOR
GASOLINE AND 0:ESEL CARS OF EQUAL HORSEPOWER AND WEIGHT a/
Performance Data Gasoline Model Diesel Model
Fuel Economy, kms/litre
City driving 9.4 12.3Highway driving (90 km/h) 13.2 15.3
a/ Data from manufacturers.
Two important characteristics of the data in this table generally arealso valid for other diesel/gasoline car models. First, although theimprovement in fuel economy of the gasoline car in highway versus cityconditions is about 40%, for the diesel vehicle this improvement is onlyabout 24%. Second, under city driving conditions the diesel obtainsalmost 30% higher fuel economy than the gasoline car, whereas on thehighway this declines by about one-half. The key issue is the betterfuel economy of the diesel especially under the stop/start, stressedconditions of city driving. Although the above data refer to developedcountry conditions, the traffic congested Bangkok environment would tendto favor diesel perfornance more than the above data will suggest.
6.23 The benefits in higher fuel economy of the diesel engine areoffset both by its higher investment cost and its higher running costs(the latter due in part, to higher lube oil requirements). In the casecited above, the differential investment cost relative to the gasolinemodel c.i.f. Bangkok was about US$900 in 1984 with differential runningcosts being some US$150 a year.
6.24 Whereas the substitution of diesel oil for gasoline requires anengine change, LPG can directly substitute for gasoline in a sparkignition engine merely by changing the fuel supply system. Such simplemodifications could be achieved at relatively low cost (about US$250 inBangkok in 1984) and have already been undertaken extensively in Thailandover the recent past (para. 6.2). There is no significant incrementalrunning cost when LPG is substituted for gasoline. The performancecharacteristics of LPG as a motor fuel in spark ignition engines dependson the composition of the LPG, i.e., the fractions of propane and butanegoing to make up the mixture. Since these components have differentcharacteristics the mixture that may be optimum for meeting cooking usesmay not be when used as a substitute for gasoline. For example, propanehas a higher octane number (RON 111) than butane (RON 94) while butane'senergy content per volume unit is 13% higher than that of propane. This

- 117-
means that if 1002 propane is used as a gasoline substitute, or LPGcontaining a high propane fraction, the optimum fuel use would be from ahigh compression ratio spark ignition engine (11-12:1) rather than in alow compression ratio engine (7-8:1). Virtually all the gasoline fueledvehicles in Thailand belong to the latter category. When LPG rich inpropane is used in low compress4.on ratio engines, the benefit of thehigher octane number cannot be taken advantage of and hence the fueleconomy penalty on a volume basis is quite severe. Because LPG has alower energy content per unit volume compared to gasoline, the fueleconomy penalty in reduced kilometers per liter is about 30% relative togasoline. However, if such LPG rich in propane gas were used in a highcompression ratio engine the fuel economy penalty would only be about15%.
6.25 In order to compare the benefits and costs of operating thesevehicles with different fuels (gasoline, diesel and LPG) two types ofdriving modes are examined. The first simulates that of a Bangkok taxi(high annual kilometers) driving about 80,000 kms/year with around 90%city and 10% highway driving. The second simulates a private motorist(low annual use) in the greater Bangkok area driving about 24,000kms/year, 70% under city and 30% highway conditions. The operating costsof each mode are expressed in Baht per kilometer and where differentialinvestment or running costs are involved these are expressed relative togasoline. Table 6.7 shows these comparisons based on product prices atthe c.i.f. and retail levels in Bangkok 35/ without taking into accountinvestment or running cost differentials. Table 6.8 reflects total costsincluding these differentials.
Table 6.7: COMPARISON OF UNIT FUEL COSTS FOR GASOLINE,
LPG AND DIESEL FUELED CARS IN BANGKOK a/
Relative unit fuel costs (Baht/km)
Fuel Prices Taxi Private MotoristFeb. 1985 Diesel LPG Gasoline Diesel LPG Gasoline
C. 1. F.Prices a/ 0.46 0.62 0.64 0.44 0.58 0.59
Retail Pricesin Bangkok b/ 0.53 0.86 b/ 1.20 0.51 0.80 b/ 1.11
0.72 c/ 0.67 c/
al See Table 6.4 above.b/ Retail prices given in Table 6.4 above except for LPG in which case
a price of 6.5 Baht/l iter was used wl;ch represented the February1985 price level for automotive uses,
c/ Based on February 1985 conrroiled eetail price for LPG diomeslicuses.
35/ Based on February 1985 prices.

- 118 -
6.26 With the c.i.f. price structure, the lowest fuel cost option isdiesel, followed by LPG and gasoline, irrespective of the mode of use.The difference between LPG and gasoline is marginal. With the retailprice structure, LPG fuel costs per unit are below those of gasoline forboth modes and diesel remains the lowest cost fueL for both modes.
6.27 Turning to Table 6.8, which compares total unit costs afterfactoring in the incremental capital and running costs for diesel and LPGrelative to gasoline, the following significant modifications occur:
(a) at the c.i.f. price level, in the taxi mode there is no clearadvantage or disadvantage between LPG and gasoline. However,the diesel fueled taxi has a lower economic cost (about 10)than either of the other fuels due to the high annual mileageof taxis which offsets the additional incremental costs;
(b) based on c.i.f. prices, in the private motorist mode the lowestcost fuel is gasoline, folLowed by LPG (about 72 higher cost),while diesel is the most costly fuel by a significant margin(about 312 above that of gasoline). This is due to the lowannual mileage in this mode;
Cc) based on the retail price structure, for the taxi mode dieselis the lowest cost fuel, followed by LPG, and gasoline isnearly 85X more costly than diesel use and between 36-60% morethan LPG depending on whether "controlled" or "uncontrolled"LPG is compared. For this particular mode of use therefore theretail price structure stiil sends the correct economic signalbetween diesel and other fuels but not between LPC andgasoline; and
(d) in the private motorisL mode, with the retail price structureLPG is the least cost fuel, followed by diesel, and gasolineagain with excessively high cost -- being between 30-50% higherthan LPG. In this case, prices at the retail level are sendinga signal completely at variance with what they should be topromote economic choices.
6.28 The above analysis has focused on cars; however, as notedearlier (para. 6.8) major changes have occurred in Thailand since 1980 inthe sales of diesel versus spark ignition-engine light trucks/pick-ups.Table 6.9 compares the estimated total unit costs for gasoline and dieselfueled light trucks in Bangkok. Once more the relative costs in Baht/kilomet-r based on c.i.f. and retail prices of gasoline and diesel oilform the basis of the analysis. The following points should be noted:
(a) based on the c.i.f. price structure the gasoline fueled lighttruck/pick-up has Lower total unit costs (by about 15% atcurrent prices) than the diesel version;

- 119 -
(b) however, at the level of retail prices, diesel unit costs areabout two-thirds of those of gasoline. Clearly, such a pricestructure provides a sizable financial incentive to consumersto purscq the economically inefficient option (para. 6.8).
Table 6.8: COMPARISON OF TOTAL UNIT COSTS FOR GASOLINE,
LPG AND DIESEL FUELED CARS IN aANGKOK a/
Relative Total a/ Unit Costs (Baht/km)
Taxi b/l_ Private Motorist b/
Fuel Prices Diesel LPG Gasoline Diesel LPG Gasoline
C. 1. F.
Prices cl 0.58 0.64 0.64 0.77 0.63 0.59
Retail Prices
in Bangkok d/ 0.65 0.88 d/ 1.20 0.84 0.86 d/ 1.11
0.74 e/ 0.72 e/
a/ Including incremental capital and running costs for diesel and LPG fueled
vehicles relative to gasoline powered vehicles.b/ Taxi life assumed 5 years and that of private car 7 years, cost of capital
taken as 12%.c/ See Table 6.5 above.
_f Retail prices from Table 6.4 above except LPG which was taken as 6.5 bhat/
liter - the uncontrolled Bangkok retail price for automotive uses.
e/ Based on the February 1985 controlled retail price for LPG for domestic uses.
Table 6.9: CC?J'AR:SON OF ESTIMATED TOTAL UNIT COSTS FOR
GASOLINE AND DlIE?L FUkLED LIGiGT TRUCKS IN BANGKCK a/
(Relative Total a/ Unit Costs (Baht/km)
Light Truck b/
Fuel Prices Gasoline Diesel
c.i.f. Prices c/ 0.83 0.95
Retail prices in
Bangkok c/ 1.56 1.06
a/ Including Incremental capital and running costs for diesel fueled
Iight trucks relative to gasoline ones. Capital cost differential
about Baht 30,000 in 1984 (USS1300) with an annual runn:ng cost
differential of about Baht 6,000 (USS260 in 1984).
b/ Truck life taken as 6 years assuming an average 50,000 kms/year of
use and the cost of capital as 12%. Fuel economies taken as 7.5
kms/liter for gasoline and 8.5 kms/liter for diesel vehicle.
c/ See Table 6.4 above.

- 120 -
6.29 What is shown by the above analysis is the degree to whichrelative price distortions at the retail level between transport fuelsencoe.rage drivers of both cars and light trucks/pick-ups to select fuelchoices which are not the lowest cost fuel from the national stand-point. For example, from the economic perspective, gasoline should bethe fuel used for all private motoring as well as for light trucks.However, it is so heavily taxed relative to its fuel substitutes that itis the most costLy fuel for all of these classes of drivers. In thiscontext, private cars, light trucks and pick-ups represented more than80% of the registered motor vehicles (excluding motorcycles) in Thailandin 1984. Among the light weight vehicles (cars, taxis, light trucks andpick-ups) it is only in the case of taxis that diesel is the leasteconomic cost option and this arises essentially because of the highannual mileage. Regarding the choice between l-PG and gasoline (in lowcompression ratio spark ignition engines) it is only in the taxi modethat either fuel is an economic choice, while for the private motoristgasoline is the preferred fuel from the economic standpoint (costingabout 7% less than LPG).
6.30 One issue that arises is the sensitivity of the preceedinganalysis to c.i.f. price differentials between the key transport fuels:gasoline, LPG, and diesel oil. Table 6.10 shows the average postedprices of LPG, premium gasoline and automotive diesel oil in Singaporebetween 1977 and February 1985. Over this period the ratio of premiumgasoline to LPG prices ranged from a high of 1.37 to a low of 1.22--thelow level occurring during the height of price instability, 1979 and1980. This ratio, based on c.i.f. Bangkok prices (Table 6.4) in February1985, was 1.34, and these prices were used in the above analysis forthese two fields. If the ratio of border prices of premium gasoline andLPG increases to about 1.40 (whicn is higher than any level in the pastdecade) gasoline still remains the lowest cost economic fuel for privatemotoring (though only marginally so), while for taxis LPG becomes themarginally lower cost fuel. In other words, the above conclusions (para6.27) do not change substantially even when the LPG/premium gasolineborder price differential is assumed to be wider than at any time in thepast decade.
6.31 When one turns to premium gasoline and diesel oil the variationin Singapore posted prices over the past several years (Table 6.10) isgreater than for LPC and premium gasoline. For example, the ratiobetween 97 octane premium gasoline and automotive diesel oil averageposted prices has decreased from 1.17 in December 1977 to 1.01 inDecember 1982, increasing slightly to 1.11 in February 1985. The aboveanalysis was based on the c.i.f. Bangkok price catio of 1.075 for thesetwo fuels in February 1985 (Table 6.4). This ratio would have toincrease to about 1.30 for the choice between gasoline and diesel fueledlight trucks/pick-ups to be indifferent at the border price level.

- 121 -
Table 6.10: HISTORICAL WORLD PRICE DIFFERENTIALS BETWEENGASOLINES. DIESEL OIL AND LPG a/
(1977-1985)
Singapore Average Posted Prices of: Ratios of Average Posted PriceUSS/US gallon
Date LPG Premium Gas Diesel Oil Premium Gas/ Premium Gas/(97 oct.) (0.5S S) LPG Diesel Oil
Dec. 1977 34.5 47.3 40.6 1.37 1.17Dec, 1978 34.5 47.5 40,2 1.37 1.18Dec. 1979 64.5 80.4 76.5 1.25 1.05Dec. 1980 86.7 106.1 102.1 1.22 1.04Oec, 1981 83.5 110.9 107.2 1.33 1.04Dec. 1982 78.9 104.2 103.5 1.32 1.01Dec. 1983 73.6 94.3 82.0 1.28 1.15Dec. 1984 66.6 87.8 79.0 1.32 1.11Feb. 1985 65.0 87.8 79.2 1.35 1.11
a/ Average Posted Prices of LPG, 97 octane premium gasoline and 0.5% S automo-tive diesel oil in Singapore on the dates indicated.
6.32 A further case of incorrect pricing signals at the retail levelinvolves kerosene and diesel oil. There has been substantial adultera-tion (estimated at about 40% of non-aviation kerosene use) of automotivediesel oil with kerosene. This adulteration requires no engine modifica-tions and is a very attractive option available to owners of dieselvehicles. Since the cost to the economy of kerosene is about Baht0.27/litre higher than that of diesel oil (February 1985 c.i.f. prices)but the price of kerosene to the consumer is 0.58 Baht/liter less thanthe price of diesel oiL, it is clear that about 0.27 Baht are lost to theeconomy for every litre of kerosene so diverted at present. 36/
6.33 In seeking to reflect the correct economic price structure(i.e. the structure of border prices) at the retail price level forpetroleum products, a number of constraints have to be recognized:
(a) petroleum products represent a major source of government taxrevenue and gasoline has traditionally borne most of the taxburden;
(b) whereas gasoline, LPG and kerosene have significant final userapplications, fuel oil is used extensively as an intermediateinput (e.g., in the production of electricity and manufacturedgoods). This means that it may be economically inefficient tolevy an equaL tax on all products;
361 Measures instituted by the government in late 1983 to reduce thisadulteration have been very effective in that in 1984 kerosenedemand declined to about 50% of its 1983 level.

- 122 -
(c) the possibility of adverse impacts on Low income groups fromsignificant upward adjustments in the price of fuels likekerosene; and
(d) the near impossibility of developing a single set of breakevenprices among the transport fuels due to the differing fuelefficiencies and differential capital and running costs betweendifferent fuel consuming activities.
6.34 Given that some of these constraints are mutually exclusive,developing a satisfactory structure of retail prices becomes a matter ofdoing the least violence to each of the above factors while signaling toconsumers that uneconomic fuel uses are to be discouraged and simultane-ously protecting government's total revenue. In this context, thefollowing types of measures need to be considered:
(a) an immediate upward adjustment in the retail prices of allproducts to account for the effect of the October 1984 devalua-tion;
(b) in undertaking this adjustment, the resulting structure ofretail prices should reduce the differential between gasolineand its main competitors in the transport sector -- diesel oiland LPG. This implies increased taxes on these two fuels;
(c) if there are strong fiscal reasons for raising additionalrevenue, then fuel oil should begin to attract some tax. Sinceimported coal already attracts an import duty of some 10%, asimilar levy should be imposed on fuel oil to ensure equivalenttax treatment; and
(d) the level of tax increase needed on diesel oil could be limitedby the adoption of non-fuel price policies. First, in the caseof diesel engine light trucks/pick-ups and passenger cars, anexcise duty higher than that levied on the equivalent sparkignition engine vehicle should be introduced. Second, a higherannual registration fee on such diesel vehicles should also belevied. These combined measures would reduce, though by nomeans eliminate, the financial incentives for uneconomicswitching of engine types provided by the current fuel pricingsystem. For example, a 40% increase in the excise duty on thediesel version of light trucks would virtually double (to aboutBaht 60,000) the existing selling price differential betweenthe equivalent diesel and gasoline versions. When combinedwith a differential annual registration fee of about Baht 6,000for the diesel versions this would merely equate the estimated

- 123 -
financial cost per kilometer 371 of operating a gasoline ordiesel fueled light truck, if gasoline and diesel fuel retailorices are restructured along the lines recommended by theassessment team below.
6.35 Table 6.11 shows the past and present structure of retailpetroleum product prices, as well as that proposed by the assessmentteam. These structures are expressed in terms of the ratio of the retailprices to the c.i.f. price for each product. The assessment team'srecommendation should be considered as indicative of the type ofstructure which should achieve many of the desired objectives subject tothe constraints outlined above. This structure is similar to thatproposed in the PEIDA Energy Pricing Study. Certain points about thistable are worth noting:
(a) the ratios in February 1985 are systematically lower than thoseof October 1984 because the devaluation adjustment has not beenpassed through to retail prices yet;
(b) the new level of retail prices proposed by the assessment teamand the associated new structure would result in the followingchanges in retail prices above their current levels:
Premium gasoline -0.70 Baht/literRegular gasoline -0.70 Baht/literKerosene +1.78 Baht/literAutomotive diesel oil +1.40 Baht/literResidual fuel oil +1.41 Baht/literLPG +1.02 Baht/liter
6.36 The most important result of this proposed structure would beto narrow the current differential between premium gasoline and auto-motive diesel oil from 5 Baht/liter to 3 Baht/liter. In addition, fueloil would begin to attract a modest import duty (about Baht 0.48 perliter). This is to ensure equal tax treatment for coal and fuel oil aswell as to strengthen government revenues from petroLeum products -- thiswould raise at least 0.7 billion Baht annually. Adoption of thisstructure and its associated levels of product prices would increase thevalue of the reconstituted barrel in Thailand to about Baht 7.68/liter,or 40% above that at the border price level. The impact of introducingsuch a structure of retail prices on product demand over the rest of the
37/ These measures merely achieve equality of financial costs though, asshown in Table 6.9, the gasoline fueled engine is 15% lower ineconomic cost that the diesel engined light truck based on a premiumgasoline/diesel oil border price difference of 7.5%. Hence theproposals above can be considered as the minimum required to achievethe correct economic signal.

- 124 -
decade and the implications for refinery sector configuration arediscussed below (para. 6.76).
Table 6.11: PAST, PRESENT AND PROPOSED RETAIL PRICE STRUCTURE:FOR PETROLEUM PRODUCTS: RATIOS OF RETAIL TO C.l.F. PRICES
Prices to C.I.F. Import PricesRatio of Retail Proposed New Structure
October 1984 Feb. 1985 with DevaluationProduct December 1983 Pre-Devaluation Current a/ Adjustment
(Prices inBaht/liter) (Prices in Baht/liter)
Premium Gasoline 2.13 2.25 1.87 (11.70) 1.76 (11.0)Regular Gasoline 2.17 2.28 1.89 (10.80) 1.76 (10.1)Kerosene 1.17 1.21 1.01 (6.12) 1.3 (7.9)Automotive Diesel 1.35 1.38 1.15 (6.70) 1.4 (8.1)Residual Fuel Oil(1500 sec.) 1.04 1.01 0.84 (4.09) 1.13 (5.5)
LPG(large cylinder) 1.35 1.39 1.15 (5.39) 1.37 (6.41)
a/ These retail prices do not reflect the effect of the 1984 October devaluation.
6.37 The government has available to it two other options to dealwith the gasoline/LPG/diesel oil problem of consumer choice in thetransport sector. The first option would involve banning the use of newdiesel fueled cars (other than taxis) and light trucks/pick-ups. If thisis done the high differentials between gasoline and diesel oil retailprices could be maintained, since the uneconomic use of diesel in certaintransport modes (cars and light trucks/pick-ups) would simply beprohibited. This option is attractive because of its simplicity inachieving the desired objective without having to raise the tax ceilingson diesel oil, as well as introducing differential non-fuel pricedisincentives for using diesel engines in cars and light trucks. Theother option involves having an equal excise tax on all petroleumproducts. In this manner, the structure of retail prices would remainthe same as that of border prices, thereby signalling to consumers thatfinancial and economic differentials remain mnchanged and limiting theincentive for uneconomic choices of fuels anc, engines in the transportsector. Under this option the structure of retail prices (based onFebruary 1985 border prices, Table 6.4) would be as shown below assumingthat the retail value of the reconstitutea barrel were set at 40% aboveimport parity:

- 125 -
Product Retail Price (Baht/lItre) a/
Premium gasoline 8.74Regular gasoline 7.99
Kerosene 8.50Auto Diesel Oil 8.13Resid. Fuel Oil 6.79
LPG 6.54
a/ Based on 40% above February 1985 c.i.f.Prices--Table 6.4.
Petroleum Product Demand Projections
6.38 The future demand for petroleum products depends on the growthand structural transformation of the economy and demand managementpolicies such as energy pricing and interfuel substitution. The mostimportant interfuel substitution options in Thailand over the next decadepertain to natural gas, which is increasingly being used as a fuel in thepower and manufacturing sectors in place of fuel oil. Within the manu-facturing sector such substitution is already well under way in thecement industry though the shortfall in gas supply in 1983 and 1984 hassomewhat reduced the rate of gas penetration.
6.39 Lignite offers another substitution option; alread- in 1983 itfueled about 10 of the electricity generated by EGAT. As discussedearlier the power expansion programme over the rest of this decade andduring the early part of the 1990s calls for further major additions oflignite fueled capacity. These developments indicate that fuel oildemand will decline further over the next few years as substitution ofexisting fuel oil using capacity in the power and cement sectors worksits way through.
6.40 In the transport sector (para. 6.24-6.37), the inter-fuelsubstitution trends between gasoline, LPG and diesel oil which arestimulated by the current retail price structure of these products havealready been mentioned. Finally, in the household sector, the substitu-tion of LPG for traditional fuels in cooking and electricity for kerosenein lighting can be expected over the next several years as rural incomesrise and the rural electrification programme continues to expand.
6.41 Currently, both the NEA and PTT project the demand forpetroleum products by regression estimates of the relationship betweenthe demand for a particular petroleum product and the determinants ofthat demand. These determinants include petroleum product retail pricesand those of their substitutes, GDP or components thereof, motor vehiclepopulation, etc. The appropriateness of applying such forecastingtechniques to the Thai energy sector can be seriously questioned. First,the regression methodology makes no allowance for the rapid structural

- 126 -
changes in the composition of output which are expected and planned forin Thailand over the next decade. Second, regression estimates arehighly sensitive to the data variation at the beginning or the end of theestimation period selected for the analysis. This becomes especiallyserious when the end of the period includes data reflecting a one-timeresponse to a suduen shock such as occurred to energy consumption inThailand following the large increases in domestic prices in 1980 and1981.
6.42 The assessment team has based its forecast of petroleumproducts on energy end-use demand projection methodology. The end-useprojection is based on the ratio of energy used per unit of outputproduced, the change of this ratio over time and the expected growth rateof output in each sector. An application of this deniand forecastingmethodology was developed into a simple model by the PEIDA consuLtantsduring their energy pricing study to demonstrate the impact of pricechanges on petz:leum demand.
6.43 The model includes eight broad economic sectors: agricuLture,mining, construction, electricity, transport, services, manufacturing,and others. The manufacturing sector is further divided into 19 sub-sectors which allow the model to distinguish between a total of 26subsectoral and sectoral activities. The demand for each petroleumproduct is calculated as the sum over all sectors of the fuel requirementper unit of output in each sector (input coefficients) multipLied by thesectoral output. The input coefficients are model parameters and thesectoral outputs are exogenous, making the model "output driven". Theinput coefficients are affected by changes in price levels and pricereLativities through individual and cross price elasticities for eachfuel. These price effects are allowed to "feedback" through interfuelsubstitution and conservation. Table 6.12 shows the individual and crossprice elasticities for gasoline, kerosene, diesel oil and LPG used in themodel to project demand for these products and illustrate the impact ofdifferent pricing regimes on future product demand. These elasticitiesare partly based on estimates recently made in Thailand. 38/ The assess-ment team has been guided by these estimates with some modifications.For example, in the case of LPG the individual and cross elasticitieswere reduced due to possible overestimation because of the nature of theLPG transport market in which most substitution has taken place in thetaxi fleet but very little in that of private motorists. Individualprice elasticities range from 0.15 for diesel, 0.20 for kerosene andgasoline to 0.30 for LPG. As for cross-price elasticities, as expected,that between gasoline and LPG is highest at about 0.45, while that ofdiesel oil with respect to the price of gasoline is 0.25, indicating thatincreases in gasoline prices result in a higher response in LPG demandthan for diesel oil demand. In part, this is because of the need for anengine change to occur in the case of diesel oil.
38/ "Estimation of Petroleum Product Demand Functions", by Terra Ashakul(NESDB), February 1985.

- 127 -
Tabie 6.12: ESTIMATES OF LONG-RUN PETROLEUM PRODUCTDEMAND ELASTICIrIES WITH RESPECT TO PRICE
Prices of:Petroleum Product Gasoline Kerosene Auto. Diesel LPG
Gasoline -0.20 0.00 +0.25 +0.45Kerosene 0.00 -0.20 +0.05 0.00Automotive Diesel +0.25 0.00 -0.15 0.00LPG +0.45 0.00 0.00 -0.30
6.44 GDP sectoral outputs for the period 1983-1995 were used togenerate the demand forecasts for gasoline, LPG, diesel oil andkerosene. To project GDP two scenarios were assumed -- the high one inwhich an overall annual rate of 6.0% is assumed and the low one of 4.5%over the same period 1985-1995. In both cases the agricultural sector isassumed to grow at 3% annually with non-agricultural sectors growing at7% and 5% in the high and low scenarios, respectively.
6.45 The other critical parameter required to project futurepetroleum product demand is the international price of oil over the nextten years. The uncertainties involved here are well known. Givencurrent perceptions of soft international demand for oil and sufficiencyof supply which are likely to persist over the next few years, theassessment team adopted the latest World Bank projections of crude oil.These crude oil price projections were combined with projections of crudeoil to product price ratios 39/ to yield estimates of product prices --these projections are shown in Table 6.13. According to these projec-tions prices are expected to decline by about 7% in real terms in 1986over the 1985 level and then remain fairly constant in real terms until1990 (an actual annual increase of 0.9%). After 1990 they are projectedto rise in real terms at an annual rate of about 4.9Z up to 1995. Toassess the sensitivity of the fuel demand projections to world oilprices, three alternative perceptions of such prices over the 1985-95period were also used. These other price scenarios were:
(a) constant 1985 prices throughout the period;
(b) all product prices escalating at 3Z a year in real termsbetween 1985-95; and
(c) all product prices declining 3% a year in real terms between1985-1995.
39/ World Bank Appraisal Report (April 1985), "Bangchak Oil Refinf-"-Rehabilitation."

- 128 -
Table 6.13: PETROLEUM PRODUJCT PRICE PROJECTIONS, 1985-95 a/
(Constant 1984 S/bbl)
Year/ Premium Residual CrudeProduct LPG Gas Kerosene Auto. Diesel Fuel Oil Oil
1985 26.8 36.1 35.9 35.8 26.1 27.81986 24.8 33.4 33.2 32.9 24.0 25.91987 24.9 33.7 33.4 33.1 23.6 26.11988 25.1 33.8 33.6 33.2 23.9 26.41989 25.2 34.1 33.8 33.5 24.3 26.61990 25.3 34.1 34.1 33.8 24.5 26.81991 26.5 35.8 35.7 35.4 25. 28.11992 27.6 37.3 37.5 36.9 27.7 29.51993 28.6 38.9 38.8 38.4 29.4 30.91994 30.0 40.8 40.7 40.3 30.8 32.51995 31.5 42.8 42.7 42.3 32.3 34.1
a/ Based on World Bank crude oil price projection of January 1985.
6.46 For each scenario of c.i.f. product prices over the projectionperiod the two structures of retail prices were examined. The firststructure was the traditional one and the alternative was that proposedby the assessment team (see Table 6.11).
6.47 Using the above assumptions regarding the evolution of worldcrude oil, retail petroleum product prices, and the high and lowscenarios of GDP growth, projections of demwAnd for gasoline, kerosene(excluding jet fuel) 40/, diesel oil and LPG were made based on the modeldeveloped by PEIDA. Variations in nararal gas supply over the nextseveral years will primarily affect f'.el oil demand. For this reasonfuture demand for fuel oil has been projected independently of the modeland is discussed below (para. 6.50-6.60). The assessment team'sestimates of demand for LPG, gasoline, kerosene and diesel oil are shownin Table 6.14 in the case of the high GDP growth and current World BankCrude oil price projections. The effect of instituting a change in thestructure of retail prices to reflect more closely the structure at thec.i.f. level is clearly illustrated over the period up to 1990 whenlittle real increase in prices is assumed, and between 1990-95 when realprices are assumed to begin a stronger upward trend once more. Forexample, by 1990 gasoline demand under the assessment team's proposedretail price structure would be about 18Z above that which would resultfrom the traditional price structure. In contrast, the demand for LPGand diesel oil under the proposed price structure would be 13% and 10Xlower, respectively, in 1990 than under the existing pricing regime.This stimulation of gasoline demand at the expense of diesel oil and LPGpromotes a more efficient allocation of these fuels in the transportsector and therefore should be encouraged.
40/ The mission has projected jet fuel demand independently of themodel.

- 129 -
Table 6.14: PETROLEUM PRODUCT DEMAND (1984-1995) AND EFFECTS
OF CHANGED RETAIL PRICE STRUCTURE a/(bbis/day)
Traditional Retail Price Structure Proposed Retail Price StructureProduct 1984 1987 1990 1993 1995 1987 1990 1993 1995
LPG 16,500 23,400 33,100 45,400 54,900 21,500 29,300 39,400 46,900
Gasoline 36,400 39,400 40,500 40,200 39,000 45,800 47,700 46,300 44,300
Diesel Oil 90,900 105,400 122,300 139,800 150,500 99,300 111,300 124,300 131,900
a/ High GOP growth scenario and January 1985 World Bank crude oil price projections(Table 6.13).
Table 6.15: RATIO OF THE PROJECTED PRODUCT DEMAND USING THETRADITIONAL RETAIL PRICE STRUCTURE/DEMAND USING
MISSION'S RECOMMENDED STRUCTURE
Product 1990 1995
LPG 1.13 1.17Gasoline 0.85 0.88Diesel Oil 1.10 1.14
6.48 The effects of the proposed retail price structure on theforeign exchange costs of gasoline, diesel oil and LPG (as measured bytheir c.i.f. prices) are also important. Based on the World Bank crudeoil price projection, the result of leaving the traditional retail pricestructures in place would be to increase the foreign exchange acquisitioncosts of. these three products in 1990 and 1995 by 4% and 9%, respec-tively, over the assessment team's proposed structure. 41/
6.49 From the standpoint of changes in GDP, under the medium growthscenario (4.5%/year between 1984-95) the only important modificaticnunder all world oil price assumptions is a lowering of petroleumdemand. The level of reduced demand varied from 10-12% for gasoline,diesel and LPG by 1990 and from 20-23% for these products by 1995. Infact, in the case of LPG and diesel oil, the reduction in demand by 1990under the medium CDP growth case is about the same as the reduced demandfor these products in the high GDP growth scenario as a result of
41/ The cumulative effect of adopting the mission's recommended pricestructure between 1986-95 would be to lower the foreign exchangecost of supplying these three products by about US$1.2 billion(1985$) relative to a cost of USA25.5 billion over this period inthe absence of any adjustment.

- 130 -
adopting the assessment team's proposed retail price structure instead ofthe traditional one.
6.50 Under the high GDP growth case and the assumption that oilprices evolve along the path of the World Bank's projections, diesel oildemand increases at about 3.52 a year over the 1984-95 period based onthe assessment team's proposed retail price structure (Table 6.14).Growth in LPC demand is estimated to remain strong (around 10% p.a.) withan increasing number of households switching over to this fuel forcooking purposes. Gasoline demand is projected to grow again under theproposed price structure, with an annual increase of some 4.6% expectedup to 1990. This would represent a significant turnaround in the gaso-line market. However, as real oil prices begin to increase more rapidlyin the 1990s (under the World Bank price scenarios) continued growth ingasoline demand is likely to weaken again unless further measures aretaken in the early 1990s to ensure that the retail price differentialsbetween gasoline, LPG and diesel oil do not begin to widen relative toc.i.f. levels.
6.51 During the early part of the 1970s (1970-73) jet fuel demandincreased very rapidly (about 32% a year). After the first oil shock,however, demand for this product remained constant throughout the rest ofthe 1970s with some growth resuming in the early 1980s (at about 6.9% ayear between 1979-84). The demand for this product is very dependent onthe operations of Thai Air and the degree of fuel up-lift by foreign aircarriers at Bangkok airport. With more fuel efficient aircraft beingintroduced the demand growth is expected to slow despite an increasinglevel of air traffic forecast over the period. The assessmenr teamprojects jet fuel demand to increase at about 4% a year over the period1984-95 in the high GDP growth scenario. In the case of kerosene, thesuccessful measures of the government to reduce the adulteration ofdiesel oil with this product resulted in almost a 50% reduction in demandin 1984. If these measures remain effective, demand growth sho 'd bevery modest, especially since the rural electrification progr&m isresulting in a major substitution of electricity for kerosene. Theassessment team projects demand for kerosene to increase at only 1.5% ayear over the period 1984-1995.
6.52 The assessment team's estimates of demand for all major petro-leum products other than fuel oil are set out in Table 6.16. Theseestimates refer to the most likely scenario -- high CDP growth and oilprices evolving in line with World Bank projections. FinaLly, the demandestimates assume that the assessment team's proposed retail pricestructure is put into place before the end of 1985.

- 131 -
Table 6.16: MISSIONMS PETROLEUM PRODUCTDEMAND PROJECTION (1984-95) a/
(bbis/day)
Product 1984 1987 1990 1993 1995
LPG 16,500 21,500 29,300 39,400 46,800Gasoline 36,400 45,800 47,700 46,300 44,300Kerosene 4,900 5,200 5,500 5,900 6,100Jet Fuel 20,900 23,500 26,400 29,700 32,100Diesel Oil 90,900 99,300 111,300 124,300 131,900
a/ High GDP growth scenario accompanied by World Oil Prices evolving inline with the World Bank's Oil Price Projection. This demandforecast assumes that the mission's proposed retail price structureis in place by the end of 1955.
Projected Fuel Oil Demand
6.53 The power and cement production sectors have driven fuel oildemand in Thailand over the last decade, accounting for over 702 ofconsumption. Future demand for fuel oil over the next decade thereforewill. critically depend on Ehe extent and rate of substitution of naturalgas, lignite and imported coal in these two sectors. The use and substi-tution of fuel oil in the power sector has been addressed earlier; thecement sector is analyzed below.
6.54 Thailand has a large and well developed cement industry consis-ting of six main plants operated by three companies. Siam Cement Companyoperates three plants -- two located in the Saraburi area about 100 kms.north of Bangkok and another in the southern peninsula about 900 kms.south of Bangkok (at Thung Song). Siam City Cement operates one plant,also in the Saraburi area. Jalaprathan's two plants are located at Cha-am -- about 180 kms. southwest of Bangkok -- and at Takli -- about 200kms. north-northwest of Bangkok. The capacities and fuels used in thesplants are summarized in Table 6.17. In 1984, installed cement capacitywas 9.5 million tons and clinker capacity 7.5 million tons. All plantsuse the modern dry process except the one at Takli, which has beenconverted from wet to semi-dry. Major conversions of fuel sources awayfrom exclusive dependence on fuel oil has been under way in the sectorfor some time. The two Siam Cement plants in Saraburi, representingabout 50% of the country's cement capacity, were converted to a dual-fired fuel oil/gas system. Indeed, the company built a US$60 millionextension to the natural gas pipeline delivering gas to EGAT. Initially,gas was in short supply in 1983 and ±984, and this restricted the amountused by Siam Cement; however, with gas now becoming more available, themain constraint to incrased gas use in this sector is the price of gasand its ability to compete with coal and lignite. Siam Cement's thirdplant, at Thung Song, has fared better in its conversion to importedcoal, which was completed in mid-1984. In the case of the Jalaprathan

- 132 -
plants both of these now use high grade lignite and fuel oil as fuels,the former generally being used in the pre-calciners and for meeting partof the heat requirements in the clinkering kilns. Fuel oil is then usedalso in these kilns to achieve high enough temperatures, since theavailability of high grade lignite (about 8,000-10,000 BTU/lb) islimited. Finally, the Siam City plant near Saraburi was converted to useboth lignite and imported coal in different parts of the plant, althoughfuel oil still is being used for some operations.
Table 6.17: CEMENT PLANTS AND THEIR CHARACTERISTICS, 1984
Ownership Location Cement Capacity Fuels Used Amounts at Full Capacity
('000 tons/annum)
Siam Cement Ta Luang 3.200 dual fuel oil/ 4,200 bbis/day fuel oil(Saraburi) gas system or 26 MMCFD gas if
available
Siam Cement Kaeng Khoi 1,700 dual fuel oil/ 2,400 bbis/day fuel oil(Saraburi) gas system or 15 MMCF0 gas if
available
Siam City Tab Kwang 2,800 lignite, imported 100,000 tons/per year(Saraburi) coal and fuel oil coal plus 200,000 tons/
all currently year lignite or 205,000used in different tons/year fuel oilpart operation (3,600 bbis/day)
Jalaprathan Takli 420 lignite supple- 64,000 tons/year lignite(North of Bangkok) mented with fuel plus 17,000 tons/year
oil fuel oil
Jalaprathan Cha-am 450 lignite supple- 73,000 tons/year lignite(180 kis. southwest mented with fuel plus 17,000 tons/yearof Bangkok oil fuel oil
Siam Cement Thung Song (900 kms. 900 100% coal or 80% 120,000 tons/year coalfrom Bangkok) coal and 20% fuel plus 400 bbls/day fuel
-___ oil oil (22,000 tons/year)
Total 9,470
6.55 Cement demand in Thailand rose from some 2.5 million tons in1970 to about 7.1 million tons in 1983, representing a growth rate of8.4% a year over this period. At the same time GDP increased at about6.6% a year, implying an elasticity of cement growth to GDP of about1.3. The Thai cement industry has projected cement demand to increase ataround 10% a year up to 1990. However, based on the assessment team'sassumed rate of GDP growth of 6% a year up to 1995 and a more conserva-tive estimate of future elasticity of cement growth to GDP of 1.2, thefuture demand, plant capacity, and total energy use in the sector is

- 133 -
shown in Table 6.18. Cement demand is projected to rise from about 7.5million tons in 1984 to 16.1 million tons by 1995, and an additional 8.0million tons of new capacity to be added between 1,87 and 1994 to meetthis demand. Of particular importance in such new capacity is the fuelson which it should be based and the location where expansions shouldoccur.
6.56 Before these issues are addressed, however, it is essential tograsp the scope and rate at which fuel oil substitution in the cementsector has occurred over the past four years. In 1980, about 5.3 milliontons of cement were produced and fueL oil use in the sector amounted tosome 12,000 bbLs/day -- with virtually all facilities then using thisfuel. 42/ By 1982, when cement production rose to 6.6 million tons,fuel oil use had already declined to about 9,900 bbls/day due to itspartial substitution by gas, lignite and coal in the facilities mentionedearlier. Despite the limited availabiLity of gas in 1983 and lM84 foruse in the cement industry, the assessment team estimates that in 1985fuel oil use in the industry amounted to some 4,600 bbls/day, which wouldaccount for about 44% of total sectoral energy requirements, theremainder coming from gas (34%), coal (12%), and lignite (10%).
6.57 Four key factors emerge in assessing the degree of competitionamong these fuels in the sector. The first is, of course, their relativeprices c.i.f. the plant gate; second is their qualities; third-- thetransport logistics involved in moving these fuels from their points oforigin to the plants in question; and fourth, the costs of convertingfrom fuel oil use to gas, lignite or coal use. Currently, lignite istransported in Thailand by truck to its non-mine-mouth uses while thesmall quantities of coal imported for the cement industry are lighteredin the Ko Sichang area and barged to the plants in question. Truckingdistances vary from 450 kms (to the Jalaprathan plant at Takli) to 850kms (to their plant Cha-am). In the case of delivery to the Saraburiarea a distance of about 550 kms is involved by truck and presentdelivered costs of lignite to this area are about US$30-33/ton (US$1.68-1.84/MMBTU). 431 Around one-third of this cost represents transportcosts (about USC2/km). In contrast, the current price of Australian coalc.i.f. Bangkok is about US$55-60/ton, resulting in a delivered price atSaraburi of about US$66-70/ton (US$2.5O/MMBTU) after lightering, barging,handling and trucking costs are included. With the costs of convertingto coal or lignite firing being roughly equal but with operating costsbeing higher in the case of lignite, the latter has a marginal costadvantage at the above delivered prices of coal and lignite in Saraburi.
42/ Major energy conservation measures had not yet been taken to reduceenergy use in this sector from almost 1 bbl of fuel oil/ton ofcement to half this level.
43/ For high quality lignite with 4,500 kcal/kg calorific value.

Table 6.18: PROJECTED DEMAND, CAPACITY ADDITIONS AND ENERGY USE
IN THE CEMENT SECTOR, 1983-95
Energy Requirements
Capacity Added Total Energy Needed Estimated to be Met
Year Demand Plant Capacity Plant Utilization Above 1984 Base to Meet Demand by Fuel Oil
('000 tons) ('000 tons) (0) ('000 tons) (bbis/day of fuel
oil equivalent)
1984 7,500 9,470 79 9,900
1985 8,000 9,470 84 + 300 in 1986 10,500 4,600
1987 9,200 9,770 94 12,100 1,000
t 1,600 in 1987
+ 1,500 in 1987 w
1990 11,400 13,470 85 + 600 in 1990 15,000 1,000 1
1992 13,100 15,070 87 17,200 1,000
+ 1,600 In 1992
+ 1,600 In 1993
+ 1,600 In 1994
1995 16,100 19,870 81 26,100 1,000

- 135 -
6.58 When the costs of converting from fuel oil to coal, lignite orgas firing in a cement plant are taken into account as well as thetransport costs of these three fuels 44/, the most competitive fueldepends on the plant location. For example, in the case of all cementplants lignite is a more competitive fuel than fuel oil by a largemargin. The competition between lignite and coal (at current coalprices) is marginally in favor of ligni;. for ,lants not more than about500 kms from the mines. The competition between gas and lignite dependsupon two issues -- whether or not a pipeline already exists, and theprice/availability of gas. For gas to compete with lignite and/or coalin the cement industry in Saraburi, its delivered price would have to beLess than about US$3.00/MMBtu. Even if the existing gas pipeline istreated as a sunk cost, it would be difficul for gas to compete withthese fuels on the basis of current prices. Only if there is an abun-dantly sustainable supply of gas and an associated decline in price can amajor role be envisaged for gas use in the expanding cement sector.
6.59 The 1.6 million ton expansion in capacity at the Siam CementCo. plant at Kaeng Khoi in Saraburi province which is already under wayand scheduled to be commissioned in 1987 is based on total flexibility infuel use. Though the design is to use lignite for up to 60% of the totalheat requirement, the remaining 40% of energy needs can be supplied bygas, coal or fuel oil depending on availabilities and relative prices.It is expected that coal and fuel oil would supply the remaining energyneeds for this expansion. Increased gas availability by 1990 (Table 4.5)could allow increased gas off-take by the cement sector in Saraluiri, butthis would depend purely on the price rather than availability in the1983-84 period.
6.60 In summary, fuel oil use in the cement sector is likely todecline to around 4,600 bbls/day in 1985 and continue to decline to about1,000 bbls/day by 1987 as substitution of coal is completed at the Siamcity plant. Fuel oil use in the cement sector would be about 1,000bbls/day (or 6% of the sector's 1992 energy needs) and remain at thislevel for the next several years. In this sector it would be used on asmall scale in the two Jalaprathan plants as well as the Siam Cementplant at Tnung Song in the south where it is utilized along with coaland/or lignite. By 1990, the assessment team estimates the followingpattern of energy inputs in the cement industry: fuel oil (7%), gas(45%), coal and lignite (48%); the split between these fuels will bedetermined by the price differentials prevailing then assuming the newplant additions (Table 6.18) between 1986 to 1990 will be able to useboth fuels. This could imply that close to 1 million tons/year oflignite, about 500,000 tons/year of coal, and 40 MMCFD of gas would beconsumed by the early 1990s.
44/ PEIDA "Energy Pricing Study", Section 6.

- 136 -
6.61 Table 6.19 highlights the past as well as the future demand forfuel oil projected by the assessment team up to 1995. Power sectordemand for fuel oil is expected to continue declining over the nextseveral years from the 1982 level of 26,300 bbls/day to about 6,000bbls/day in 1990 with a further reduction to around 4,500 bbls/day in1995. In the case of the cement sector, its use of fuel oil will be veryLow from about 1987 onwards, at about 1,000 bbls/day. Clearly, given thedecreasing role of fuel oil in these two sectors, its demand wiLl bedriven increasingly by the degree to which gas substitution furtherpenetrates other manufacturing sectors. In 1971, fuel oil demand outsideof the power and cement sectors accounted for about one-third of totaLfuel oil demand -- by 1982 this proportion was about 302. Of this useroughly 90% arose from the manufacturing sector other than cement, withtextiles and food processing being especially important. In contrast tothe power and cement sectors this remaining 302 of fuel oil use is madeup of large numbers of small consumers who are not usually in the fore-front of the transition to rew fuels such as gas due to the absence of anextensive gas distribution system which is not expected to be in place bythe mid-1990s. NevertheLess, some substitution of gas for fuel oil isexpected to occur over the next several years among those manufacturingsector consumers located close to the gas distribution lines.
Table 6.19: PAST AND PROJECTED DEMAND FOR FUEL OIL(bb Is/day)
rotal Demand NetPower Sector Cement Sector Total of Power and
Year Demand Demand Demand Cement Sectors
Actuals1971 11,200 9,400 30,800 10,2001975 20,200 9,000 45,600 16,4001977 33,100 10,100 60,800 17,6001980 51,700 12,000 81,400 17,7001982 26,300 9,900 51,600 15,4001983 31,600 8,700 58,000 17,700
Forecasts1985 10,400 4,600 32,600 17,6001987 4,300 1,000 24,500 19,2001990 6,000 1,000 28,900 21,9001992 6,000 1,000 27,900 20,9001995 4,500 1,000 27,500 22,000
6.62 The elasticity of growth in fuel oil use outside of the powerand cement sectors relative to GDP between 1971-80 was about 0.9. Giventhe expected weakening of this elasticity during the next several yearsas energy is used more efficiently in the manufacturing sector, the

- 137 -
assessment team estimates 45/ that fuel oil demand excluding the powerand cement sectors should rise to about 21,903 bbls/day by 1990. Theimpact of substituting gas for fuel oils among these "residual" consumersshould be felt in the early part of the 1990s as gas availabilityimproves and the distribution system is extended into areas with a highdensity of manufacturing entities. As such, very little growth in fueloil demand is expected for these users between 1990-95. However, by 1995about 80% of fuel oil use will arise from outside of the power and cementsectors compared to 301 in 1982.
6.63 When these end-use projections of fuel oil demand are aggre-gated, total demand for this petroleum product is expected to drop fromabout 51,600 bbls/day in 1982 to 28,900 bbls/day in 1990 (see Table6.19). A further decline should occur in the early 1990s as gas avail-ability improves so that by 1995 fuel oil demand is likely to be around27,500 bbls/day.
Petroleum Product Supply
6.64 Overall responsibiLity for planning and investment decisions inthe petroleum refining sector is vested in the National Petroleum PolicyCommittee (NPPC) which was established by the Cabinet in 1981 Thiscommittee sets policies and targets for development of Lhe percroleumindustry and the pricing of petroleum products. There are currently twosub-committees of the NPPC, one dealing with refining expansion, and theother with petroleum pricing and procurement (para. 6.17).
6.65 Thailand presently has a total crude distillation refiningcapacity of about 175,00U bbls/day distributed between three refineries-- T.O.R.C. (65,000 bbls/day), Bangchak (65,000 bbls/day), and Esso(45,000 bbls/day). Esso is a fully owned subsidiary of Exxon, while TORCis a joint venture between the government and private oil companies,Shell and Caltex. The government owns 49% of the equity through the PTT,the Crown Property Bureau 2%, and Shell and Caltex own the remaining49%. This refinery is operated under a service contract with SheLL. TheBangchak refinery (BPC) has had a checkered history as reflected in itspoor performance over the past several years compared to the other tworefineries. Initially established by the government in 1964 and operatedby the Defense Ministry, the management and operation of BPC were trans-ferred to Summit International Corporation, a private company, through a15-year lease in 1965. On expiration of the lease, the affairs ofBangchak were eventually transferred to P.T.T. and, under a Bank-financed
45/ Based on the high GDP growth scenario of an annual 6% rate between1984-1995.

- 138 -
rehabilitation project, an autonomous commercial company, BangchakPetroleum Co. (BPC) was recently established. 46/
6.66 In 1983, the refining sector processed some 163,000 bbls/day ofcrude oil and condensates, 47/ equivalent to 93% of design capacity.Esso operated in this year at 110% of design capacity, TORC at 98%, andBPC at 78%. TORC and Esso have consistently followed a satisfactoryrepair and maintenance program. In contrast, the BPC refinery has notrepaired and maintained its processing facilities, which reduced crudethroughput to about 50,000 bbls/day in 1983.
6.67 Due to an exceedingly rapid growth in diesel oil and LPG demandbetween 1982-84 (paras. 6.4 and 6.8), the share of the petroLeum productmarket supplied by locally refined products has declined recently. In1982, local products satisfied 79% of demand 48/; this fell to 73% in1983 and 68% in 1984. The remaining requirements traditionally have beenmet by product imports, mainly from Singapore. This dependence onfinished product imports is nothing new to Thailand in that in 1970 whenpetroleum demand was only 88,200 bbls/day, product imports accounted for27% of total supply with diesel oil then representing some 76% of suchimports. Indeed, this continued but limited level of dependence onproduct imports has been critical in many ways to providing a degree ofcompetition to the local refining sector in that ex-refinery prices havebeen kept generally equal to or below c.i.f. product import prices overthe past several years. In fact, up to the devaluation in October 1984,ex-refinery prices had been consistently below the c.i.f. import level.However, since October 1984, ex-refinery prices for most products havebeen above those of direct imports -- the degree depending on theproduct 49/ (para. 6.17).
6.68 The aggregated yield pattern of the refining sector in 1984relative to product imports and demand is shown in Table 6.20. As shown,middle distillates (kerosene, jet fuel and diesel oil) made up 45% of therefineries product yield and fuel oil, 29%. This slate is somewhat outof line with the structure of demand (middle distillates 52% and fuel oil24%), causing the pattern of imports to be weighted heavily (66%) towardsmiddle distillates. This inability of the refining sector's yieldpattern to more closely conform to that of demand is due to:
46/ BPC's equity is owned by PTT (30%), the Government, and Krung ThaiBank.
47/ Of which 7,000 bbls/day were condensates and natural gasolineseparated from natural gas, some 6,000 bbls/day of indigenousSirikit crude oil and the remaining 150,000 bbls/day of importedcrude oil.
48/ Roughly the same level as in 1979.
49/ In May 1985, for example, the ex-refinery price of automotive dieselwas about 5.6% above import parity.

- 139 -
(a) the uneconomic stimulus given to diesel demand in transport bypast and current retaiL pricing policies;
(b) increasing amounts of natural gas which are substituting forfuel oil, thereby eroding the market share of an importantpetroLeum product; and
(c) there is very limited processing flexibility in the refiningsector to modify product yield patterns. Currently thisflexibility is limited to a 8,800 bbls/day fluid catalyticcracker (FCC) and a 12,000 bbls/day visbreaker, both of whichare in the TORC refinery.
Table 6.20: REFINERIES PRODUCTION, IMPORTS ANDDEMAND FOR PETROLEUM PRODUCTS. 1984
Products Refineries Production a/ Imports a/ Demand a/
(BbIs/day) (M) (Bbis/day) IS) {BbIs/day) (%)
LPG b/ 4,300 (2.8) 11,900 (16.0) 16,500 (7.4)Gasolines 34,600 (22.6) 1,200 (1.6) 36,400 (16.2)Kerosene 4,100 (2.7) 800 (1.1) 4,900 (2.2)Jet Fuel 17,600 (11.5) 3.600 (4.8) 20,900 (9.3)Diesel Oils 47,700 (31.1) 44,800 (60.3) 90,900 (40.5)Fuel Oil 45,000 (29.4) 12,000 (16.2) 54,800 (24.4)
Total 153,300 (100) 74,300 (100) 224,400 (100)
a/ The sum of production and imports may not equal demand due toinventory changes.
b/ Excludes LPG production from the gas separation plant of 600bbis/day averaged over 1)e4. The plant began operations late in1984.
6.69 The performance and capabilities of the these three refineriesvary widely, as shown in Annex 8 where their 1983 production patterns arecompared. For example, in 1983 the middle distillate yield patterns atthe TORC and Esso refineries were 54.5% and 54.2%, respectively, comparedwith that at Bangchak of 35.8X. In addicion, the fuel oil yields at TORCand Esso were 12% and 21%, respectively, with Bangchak being about 37%.The TORC refinery runs very light crude feedstocks and this combined withits conversion facilities contributes to its low fuel oil, high middleand light distillate yields. In the case of Esso, although this is asimple hydroskimming refinery with no conversion capacity, by judiciouschoice of light spiked crude oils its yield pattern is close to thestructure of Thai demand (Annex 9 and Table 6.20). The narrowing of thedifferential between heavy and light crudes in the past couple of yearshas facilitated Esso's task of running a small (45,000 bbls/day)hydroskimming refinery profitably in Thailand -- an achievement by anystandards. Indeed, Esso is now in the process of debottlenecking itsrefinery to increase its throughput capacity to 65,000 bbls/day (442

- 140 -
capacity increase), at minimal cost, again with no conversion facilitiesbeing added. The yield pattern of the expanded facility therefore wouldbe similar to that shown in Annex 9 when running similar light crudes.At the Bangchak refinery the poor mechanical state of the plant and itsassociated low throughput have caused significant losses over the lastseveral years. 50/ However, the World Bank is financing a ptoject torehabilitate the refinery by 1989/90 to make it a profitable operation.
6.70 Part of this rehabilitation project includes establishing acommercial company, Bangchak Petroleum Corporation (BPC), which now ownsthe refinery with PTT, the government, and Krung Thai Bank holding theequity. The other part of this project consists of physicallyrehabilitating the facility at a total cost of about US$144 million, ofwhich the World Bank will provide about US$85 million of financing.There will be no increase in crude distillation capacity although athermal cracking and a visbreaking unit will be restored to theiroriginal design basis to improve middLe distillate yields.
6.71 The refinery sector in Thailand has been the subject of severalstudies over the past few years as government and the private sector havestruggled with decisions about the level to expand refinery capacity, ifat all, the type of conversion facilities, if any, and the complexity toallow the sector. The uncertainties in the world oil price and refiningenvironment in which these studies 51/ have been done have highlightedthe significant risks involved in making major investment decisions aboutthe profitability and economics of different types of conversion optionsin Thailand during a period (up to about 1990) when a major surplus ofrefining capacity is a worldwide phenomenon. Indeed, within SoutheastAsia, Indonesia and Malaysia are moving rapidly to almost complete self-sufficiency in product requirements over the medium-term. The jointventure Petromin/Shell refiniery at Jubai' in the Persian Gulf of 250,000bbls/day capacity is now on-stream with the Far East targeted as itsprime market area. These developments have exacerbated the surplusrefining capacity situation in Southeast Asia over the short to mediumterm as evidenced by the 50% average throughput for the Singaporerefining center.
6.72 The Thai refining sector will need to be restructured over themedium term to achieve the following objectives:
(a) produce the fulL product slate required by the economy at coststhat are fully competitive with directly imported productswhich are traded internationally. In this context, ex-refinery
50/ "Bangchak Oil Refinery Re3tructuring Project", World Bank AppraisalReport, April 1985.
51/ Foster-Wheeler study of TORC expansion options in 1980. A Lummusstudy of the entire refining sector in Thailand in 1981/82.
- 141 -
prices must be set less than or equal to those of directlyimported products 52/;
(b) ensure that local refining capacity remains somewhat belowprojected demand for products to guard against excess capacitydeveloping in the 19909. This allows Thailand to enjoy thebenefit of direct product imports traded competitively due toexcess refining capacity in the region. Keeping the Thaimarket open to a tributary flow of product imports to meetdemand maintains the competitive pressure on local refineryoperators; and
(c) encourage the private sector, both local and foreign, to play alarger role in undertaking the risks and investments associatedwith further developing the sector while reducing the role ofthe state.
6.73 Several uncertainties in the refining industry in Thailandshould be considered before any decisions are taken concerning invest-ment
(a) the border price differentials between residual fuel oil anddistillate products, which are a key factor in determining theprofitability of investments in conversion facilities --whether catalytic or hydrocracking;
(b) government retail pricing policies for diesel oil, gasoline andLPG over the next several years and the impact of changingpricing policies on the structure of demand for transportfuels;
(c) the degree of penetration of natural gas into the manuftcturingsector over the next several years. This will increasinglydetermine the level, if any, of fuel oil surpluses in Thailandin the early 1990s given that about three-fourths of fuel oildemand after 1990 will come from outside of the power andcement sectors.
6.74 The uncertainties and wide variations in relative pricesbetween residual fuel oil and middle distillates over the past decade areshown in Table 6.21. Although this is no guide for the future, it shouldhighlight the potential pitfalls for projects which are very sensitive to
52/ A covenant attached to the Bangchak rehabilitation project calls forthe government to "continue to set ex-refinery prices of petroleumproducts which (i} allow refineries, operating efficiently, to meettheir expenses, service their debts, and earn a reasonable rate ofreturn on capital employed, and (ii) be reasonably competitiveinternationally."

- 142 -
these variations. The ratio of t.hese prices in Rotterdam varied from1.39 in 1974, 2.35 in 1979, 1.65 in 1981, and 1.38 in April 1985. Forhydrocracking investment to become attractive, sustained ratios at leastabove 1.70 are required at present. Given these uncertainties and thoseraised above, the risks associated with major conversion investments inthe refining sector become apparent, especially when undertaken by thestate.
Table 6.21: RATiOS a/ OF SPOT PRICESFOR DIESEL OIL AND RESIDUAL FUEL OIL
IN ROTTERDAMN 1974-85
RatioYear (Diesel Oil/Resid. Fuel Oil)
1974 1.391975 1.611978 1.681979 2.351981 1.651983 1.521984 1.38April 1985 1.38
a/ Weight and not volume ratros.
6.75 Based on current firm plans in the refining sector, by 1990 theBangchak refinery will be rehabilitated and the Esso refinery expanded(this by 1986). Assuming that decisions on expansion and conversioninvestments at TORC are not made until the end of the decade so that in1990 the TORC refinery still has its current size and configuration, theproduction of petroleum products from the three refineries shouLd be asset out in Annex 9. Table 6.22 summarizes the aggregate refineryproduction, product demand and required product imports in 1990. Thedemand shown in Table 6.22 is based on the assessment team's high CDPgrowth scenario assuming that the assessment team's recommended retailproduct price structure (Table 6.16) has been implemented from 1986 andthe fuel oil demand levels estimated by the assessment team (Table 6.19).

- 143 -
Table 6.22: ESTIMATED 1990 PETROLEUM PRODUCTPRODUCTION, DEMAND AND IMPORTS
Product Refineries Production a/ Imports Demand
(bbis/day) (% yield) (bbls/day) (bbis/day) (S)
LPG 4,500 (2.4) +7,000 b/ 29,300 (11.8)Gasolines 42,600 (22.5) +2,700 c/ 47,700 (19.2)Kerosene/Jet Fuel 33,800 (17.9) -1,900 d/ 31,900 (12.8)Diesel Oil 62,600 (33.1) +48,700 e/ 111,300 (44.7)Residual Fuel Oil 39,000 (20.6) -10 100 ff 28 900 (11.6)
Total 182,500 (96.5) 46,400 9/ 249,100 (100.0)
a/ Based on refinery yield patterns and production given in Annex 9.b/ An estimated 17,800 bbis/day of LPG will be produced from the LPG separation
plant.c/ An estimated 2,400 bbis/day of natural gasoline from the LPG separation plant
will be used directly in the gasoline blending pool.d/ This small surplus of kerosene/Jet fuel would be blended into the diesel oil
fraction rather than exported.e/ The import requirement of 46,800 bbls/day of middle distillate production
arising from the 1,900 bbis/day of the karo/jet cut being blended into thediesel fraction.
fl This surplus would be exported or cracked if such a unit were installed atTORC.
2V This reflects the net import position.
6.76 Compared to the 1984 local refinery supply/demand balance(Table 6.20) that estimated by the assessment team for 1990 (Table 6.22)highlights the following factors:
(a) although total product demand is expected to rise by about 11%over the 1984-90 period, net product imports are projected todecline to around two-thirds of their 1984 level (46,400bbls/doz);
(b) the level of refinery production would increase by 19X abovethe 1984 level due to ESSO's debottlenecking and the majorirLvestment in rehabilitating the Bangchak facility;
(c) although diesel oil demand is expected to rise by about 22Zover the period (even with the assessment team's recommendedretail prices in place), imports of diesel oil are onlyexpected to rise by about 4-5% above their 1984 level of 44,800bbls/day. Diesel oil would still, however, remain the dominantpetroleum product imported by Thailand, representing by 1990about 100% of net product imports;
(d) a surplus of fuel oil is projected by 1990 (about 10,100bbls/day) and this will have to be exported;

- 144 -
(e) LPG demand should rise by about 78% above its 1984 level by1990; however, although refinery production of this fuel wouldchange little, imports will decline to about 60% (7,000bbls/day) of their 1984 level due to major production (17,800bbls/day) by the LPG separation plant; and
(f) finally, even as growth in gasoline demand resumes (31% by1990) with new retail pricing poLicies, import levels remainmodest (around 2,700 bbls/day) due to increased refineryproduction and the use of about 2,400 bbls/day of naturalgasoline from the gas separation plant being directly used inthe gasoline blending pool.
6.77 To achieve the refinery product yield patterns outlined inTable 6.22 it is assumed that the Esso and TORC refineries continue torun light feedstocks, including condensates, simiLar to 1983 and that therehabilitated Bangchak refinery continues to run an increasingly lightslate of feedstocks. In this context, having access to the highlycompetitively priced Sirikit crude and natural gas condensates is anessential element of this refinery's future profitability and yieldpattern. Table 6.23 shows the low fueL oil (low in sulphur) and highmiddle distillate yields of Sirikit crude compared to Arab light.Indeed, it is quite an ideal crude for Thailand given the structure ofmarket demand which is becoming less skewed to fuel oil. The onlydisadvantage of Sirikit crude is its waxy character, which gives it aresidue with a high pour point. This problem can be dealt with throughblending with other non-waxy feedstocks since the estimated volume ofSirikit crude (about 20,000 bbls/day) will only be about 10% oL- therefinery industry's feedstock in 1990.
Table 6.23: COMPARISON OF SIRIKIT AND ARAB LIGHT CRUDE
YIELD PATTERNS FOLLOWING DISTILLATION
Percentage Yield by VolumeProduct Sirikit Crude Arab Light
Gasolines & lighter 20 16Middle Distillates 50 44Fuel Oil Residue 30 40
6.78 To date, the refinery industry has used most of the natural gascondensate produced as feedstock along withx crude oil in refinery runs.In 1983, TORC used some 6,300 bblslday of condensate in this manner.However, with the gas separation plant now on-stream natural gasoline,propane, butane and ethane will be removed from the gas stream. Conden-sates still extracted from the gas at the well head would remain avail-able for refinery feedstock use; however, that extracted from the gas

- 145 -
separation plant (principally natural gasoline--about 2,500 bbls/day) canbe added directly to the gasoline blending pool at a refinery since ithas a good octane number.
6.79 As shown in Table 6.22, net product imports would meet about21Z of Thailand's product requirements in 1990. This is based on arefinery configuration in which Esso debottLenecks its hydroskimmingfacility to 65,000 bbls/day, the Bangchak refinery is rehabilitated to65,000 bbls/day, and TORC remains at the same capacity and complexit7.Given the scale of surplus refining capacity in Singapore and the emer-gence of the Jubail export refinery in the Persian Gulf, the assessmentteam considers it advantageous for Thailand to continue to importproducts over the next several years at about this level. Beyond 1990the need could arise for an increase in refinery distillation and conver-sion capacity as petroleum demand continues to grow. However, suchdecisions should not be made until the late 1980s. Under the Bangchakrehabilitation project yet another study will be undertaken of the Thairefining industry with the objective of identifying the least-cost optionfor supplying petroleum products to the economy. Without preempting theconclusions of this study, the assessment team believes that in takingany major decisions in the late 1980s about the capacity and complexitylevels of the Thai refiniag industry in the 1990s, the private sectorshould play the dominant role and accept the risks associated with anygiven strategy. This should inciude an action programme bygovernment/PTT to reduce its financial involvement.
6.80 Table 6.24 shows the changes in imported crude oil and productsprojected by the assessment team in 1990 compared with the position in1983, based on the refinery configuration outlined in para. 6.79 above.
rable 6.24: CRUDE OIL AND PRODUCT IMPORTS, 1983 AND 1990('000 bbis/day)
Imports Local Supply Total Supply1983 1990 1983 1990 1983 1990
Crude Oil 159.0 169.0 6.6 16.0 165.6 185.0Condensates as -- -- 6.7 4.4 6.7 6.8
Refinery feedstockPetroleum Products 56.9 46.4 155.0 202.7 a/ 211.9 249.1
(Net)
a/ Of which 17,800 bbis/day is LPG from the gas separation plant and2,400 bbls/day of natural gasoline.

- 146 -
VII. NATUBAL GAS D!IND, SUPPLY AND PRICING
Background
7.1 With the discovery of commercially exploitable natural gas inthe Gulf of Thailand in 1975-76 discussions began between Union OilCompary and the government regarding the development and marketing of thegas. The newly formed state company, Petroleum Authority of Thailand(PTT), and Union Oil signed the first gas supply contract in 1978 underwhich Union was obligated to supply, and PTT obligated to take, 200 MMCFDof gas from October 1981 to September 1982 and 250 MMCFD for subsequentyears. In order to market the gas a 34-inch submarine pipeline 53/ 425kmns long was built offshore from Union's production platform to anonshore terminal. An onshore pipeline 170 kms long was then built toEGAT's power stations at Bang-Pakong and South Bangkok. Since Union Oiland other private sector interests expressed no interest in joint ventureactivities in establishing the offshore pipeline, the State, through PTT,had to undertake the full risk in owning this pipeline to ensure that thegas was marketed (para. 4.45).
Uses of Gas
Power
7.2 Initial plans for using gas focused on power generation.Therefore, to accelerate the rate of gas utilization, the three 300-MWsteam units at the South Bangkok power station were converted from fueloil-fired to dual gas/fuel oil-fired boilers. This was completed in 1981in time for gas supplies from the Gulf. Concurrent with this a series oflarge gas turbine units 8 x 60 MW were commissioned at Bang-Pakong bymid-1981 with 2 x 120 MW waste heat boilers being added in 1982. By thattime the Bang-Pakong station had 2 x 360 MW of combined cycle plantcapable of burning natural gas or diesel oil. Additional dual-firedgas/fuel oil capacity was added at Bang-Pakong in the form of 2 x 550 MWsteam units commissioned in 1983 and 1984. During this period, however,it became difficult for Union Oil to meet its gas commitment. Forexample, in 1982, 1983 and 1984 gas supplied under Union's first contractamounted to 128, 146, and 184 MMCFD. This represented an importantsetback for all parties concerned -- EGAT, Union, PTT, and thegovernment. However, with additional gas now flowing under Union'ssecond contract (para. 4.33), the avaiiability of gas for power sectoruse has improved. Currently, the dual-fired gas/fuel oil capacity atBang-Pakong and South Bangkok power stations are capable of utilizingsome 400 MMCFD if all 2,720 KW of capacity is base loaded. By the end of
53/ With a free flow capacity of some 500 MMCFD.

- 147 -
1986 the two 200-MW fuel oiL-fired steam units at South Bangkok stationalso will be converted to dual-firing gas/fuel oil capability. At thattime the potential maximum level of gas demand in the power sector willbe about 46C ?MCFD 54/, which would imply an average level of about 400MMCFD given normal power dispatch criteria. Additional power plants(Table 5.20) capable of using gas are not expected to be commissionedbefore 1990 (300-MW combined cycle at Nam Phong), 1991 (600-MW No. 3steam unit with gas/fueL oil and coal firing capability at Bang-Pakong),and 1993, when the second 300-MW Nam Phong combined cycle will becommissioned. Issues concerning the further use of gas in the powersector are discussed below (para. 7.18-7.24).
LPG Extraction
7.3 The non-associated gas from Union's producing areas is rich inpropane, butane, ethane and natural gasoline. Extracting these productsfrom the gas was a high priority PTT project. The first gas separationplant with a throughput capacity of 350 MMCFD of gas was commissioned inlate 1984. The production from this plant is set out in Table 7.1.Since LPG is being used extensively for household cooking and for trans-port fuel, any LPG production from gas extraction plants would beabsorbed by the domestic market displacing imported LPC. There appearslittle scope for LPG exports given the rate of growth of local demand.
7.4 A second gas extraction plant is being considered by PTT toalso separate gas from the Gulf. This plant, originally proposed with acapacity of 350 MMCFD, now has been scaled down to 150 MMCFD and isexpected to be commissioned in 1989. This and the first plant wouldenable some 500 MMCFD of Gulf gas to be processed, and there are reason-able expectations that gas supplies from the Gulf should not be less thanthis level up to the end of the century, assuming production begins undera Texas Pacific and/or Union III contract by 1990. The second plantwould use about 30 MMCFD of gas and produce around 175,000 tons of LPG ayear. A third gas separation plant has been proposed to processassociated gas from the Sirikit oil producing field. This plant wouldhave to be smaLl (with a throughput of around 30 MMCFD) because of thevery limited level of associated gas production expected from thisfield. LPG production from this third plant would be around 46,000 tonsa year with about 7 MMCFD of gas used in the extraction process. Thelongevity of gas supplies from the Sirikit field is insuffiently known,and the DMR figures do not allow for the production of gas cap. Anyventure to establish. such a plant should probatly be undertaken by thejoint venture at its own risk unless gas availability conditions changesignificantly. Current prospects for gas extraction from the two plantsare as set out in Table 7.1.
54/ If all this capacity, 3,120 MW were base loaded.

- 148 -
Table 7.1: GAS SEPARATION PLANTS
Natural CommissloningPlant No. Throughput Gas Use LPG Ethane Gasoline Date
- - - - (MMCFD) - - - - - - - ('000 tons) - - - - -
1 350 (Gulf gas) 70 457 320 66 1984
2 150 (Gulf gas) 30 175 1989
By 1990 about 21,900 bbls/day (687,000 tons annually) of LPG will beextracted from gas at these two plants, thereby contributing about 75% ofthe LPG demand in that year.
Petrochemicals
7.5 The consumption of petrochemicals has been growing rapidly inThailand; the demand for polyethylene more than doubled during 1980-83and polypropylene and vinyl chloride also doubled during this period.Nevertheless, the consumption of pLastic products in Thailand remains lowby international standards, being only 3-4 kg per person compared with20 kg in Taiwan and South Korea or 30 kg in the US and Japan.Nevertheless, the use of natural gas has been proposed as a feedstock forestablishing a petrochemical industry to supply local demand. Ethane andpropane from the gas separation plants would be used as a feedstock foran olefins plant which will include an ethane cracker producing 315,000tons per year of ethylene and propane dehydrogenerator producing 105,000tons of propylene, both of which will supply a downstream petrochemicalcomplex. Such a complex would use 43 MMCFD of gas. Construction wasdelayed by uncertainties about gas availability as well as developmentsin the international petrochemical markets. However, plans to developthe US$350 milLion olefins complex are now under way and the project isexpected to be completed in 1989.
Fertilizers
7.6 Although the use of fertiliz.-rs increased from 150,000 tons in1966 to about 800,000 tons in the early 1980s, fertilizer use remains lowin comparison with most East Asian countries. However, Thailand has toimport all of its fertilizer requirements, and, with continued agricul-tural growth, future demand is likely to increase. The governmentestablished the National Fertilizer Corporation (NFC) in 1982 to under-take the construction of a fertilizer plant using natural gas and phos-phate as feedstocks. The proposed plant would produce about 150,000 tonsof urea and 700,000 tons of ammonia and urea, using 30 MMCFD of gas. Theinvestment associated with this complex is about US$250 million and,according to current plans, this project should be completed in 1989.

- 149 -
Cement
7.7 As discussed in paras. 6.54-6.60, the cement industry hasexhibited high levels of growth over the past 15 years. This sector wasone of the first major industrial users of fuel oil to begin diversifyingaway to natural gas, lignite and imported coal as a means of loweringproduction costs. Indeed, Siam Cement Co. was one of the first majorprivate gas consumers to finance an extension of the gas pipeline networkto Saraburi (170 kms northeast of Bangkok) at a cost of US$60 million fora line with a capacity of some 90 MMCFD (para. 6.54). This coincidedwith the conversion of their two Saraburi plants to dual gas/fuel oilfiring. However, the off-take of gas contemplated (45 MMCFD) for the twoSiam Cement plants has been well below original targets with only some 25MMCFD being used in 1984.
7.8 The experiences of both EGAT and the cement industry, whichhave proceeded with major investments in gas infrastructure and conver-sions of equipment to be able to use gas, have been far from satisfactoryto date. The euphoria that accompanied plans to develop Union's offshoregas has given way to extreme caution bordering on skepticism on the partof major gas users. Several of them already have suffered by investingin gas utilization equipment years before supplies are available. Addedto these negative factors there is the issue of gas pricing policy andwhat markets gas should seek to penetrate (para. 7.13).
7.9 The availability of gas for cement use has been improving since1985, with 60 MMCFD potentially being available for the next couple ofyears (Table 7.3). However, as a result of gas prices and initial supplyconstraints, it is unlikely that gas would be able to compete withimported coal and/or lignite for most of the cement industry over thenext severaL years. Therefore, the assessment team does not envisage alevel of demand for gas in the cement sector above 40-'.U MMCFD over theperiod to 1997.
Refineries
7.10 Fuel for the three refineries in Thailand is provided byrefinery waste gases and residual fuel oil. To run about 170,000bbls/day of feedstock in the refining industry about 5,000 bbls/day ofresidual is used as fuel; the rest are waste gases. Natural gas caneasily substitute for this fuel oil as refinery fuel. At the levels ofrefinery throughput expected up to 1090 this substitution would requiresome 30 MMCFD. The key issue facing the refiners is whether the priceincentive for using gas in this mode offsets their problems and costs offuel oil disposal given that by 1990 the assessment team expects asurplus of fuel oil requiring export (Table 6.23). The economic value offuel oil then would be its f.o.b. Bangkok price or the f.o.b. Singaporeprice. Based on current Singapore fuel oil prices of US$21.50/bbl(US$3.40/MMBTU), gas would have to be priced at a discount of 5-10% belowfuel oil parity to encourage any conversion in the refinery sector.

- 150 -
Small Industrial Users
7.11 By the early 1990s about 75Z of fuel oil demand will arise frommanufacturing entities outside of the cement sector and the power sector(para. 6.63). The assessment team estimates modest levels of substitu-tion of gas for fuel oil in small manufacturing operations close to majorgas pipeline systems would continue to occur during the early 1990s.Such substitution, h-:ever, is unlikely to exceed about 20 MHCFD (3,200bbls/day of fuel oil) of gas distributed over several smaLl consumers.
LNG
7.12 One possible use of gas that has been raised is a major LNGexport project. However, the assassment team has found no evidence tosupport such a project and strongly advises against the governmentassigning any priority to thi- - 14jct, for three reasons:
(a) Thai gas is expensive (about two-three times) relative toMalaysian or Indonesian gas, which puts the country at a severedisadvantage to these countries as a major gas exporter or asan exporter of gas-based products;
(b) the reserve base has not been established in Thailand tojustify committing about 4.4 trillion cubic feet of gasreserves 55, to any LNG project; and
(c) committment to an LNG project at present would result in alower net benefit to Thailand than virtually all other gas uses(para. 7.14).
Gas Value and Optimal Use
7.13 Pricing poLicies will play the key role in ensuring not onlythat gas is used optimally but also in accelerating the exploration anddevelopment process (para. 4.27-4.29). Maximizing the net value toThailand requires not only that the price of gas be at least equal to itseconomic production costs but also at a level which encourages those useswhich yield the highest net economic benefits. This requires settingprices no lower than the opportunity cost of gas -- i.e. the net benefitto the last user of gas (the marginal consumer) when the various uses ofgas are ranked by their economic benefit and gas supplies allocated tothose with the highest benefits. When gas supplies are constrained, asthey are presently and likely to be for the foreseeable future, theopportunity cost is the true cost of the resource to the nation. The
55/ Relative to proven reserves of 3.7 TCF and probable and possibLereserves of 9.2 TCF.

- 151 -
marginal economic production costs become the opportunity cost only whengas supplies have expanded sufficiently so that all potential users witha benefit higher than the marginal production cost have been supplied.
7.14 Estimates of the net-back values of using gas in power genera-tion, cement, LPG extraction, petrochemical and fertilizer production andLNG indicate the most valuable uses of gas under different internationalfuel and commodity price scenarios. This is shown in Table 7.2.
Table 7.2: GAS NETBACK VALUES a/(1984 USS/MMBTU3
World Price ScenarioUses Low b/
Petrochemicals 3.9Power Sector (Fuel oil substitution in existing plant) 3.5Power Sector (in new base load plant) 4.3LPG 3.4Process Heat (Cement) 3.9Fertilizers 3.3LNG 1.1
a/ Peida Energy Pricing Study, 1984.b/ The low price scenario corresponds to constant, real crude oil prices
from 1985 to 1995 at about USS26.70/bbl (1983 SM. Fertilizer andpetrochemical product prices are assumed constant in real terms from1984 to 1995. For new power generation the breakeven analysiscompares gas-fired combined cycle plants with coal-fired steamplants. The coal price was taken In the low scenario as constant atS61.90/ton (USS2.70/MMBTU).
The gas netback values were assessed for low oil and commodity pricescenarios. In the low crude oil case prices remained constant in realterms at a 1985 value of US$26.70/bbl (1983 $). Several key factorsenerge from the values in this Table.
(a) LNG use gives the lowest netback (even when high oil prices areconsidered) -- indeed, the gas value is less than its cost atany known fields in Thailand (Table 4.3). As noted above, thisis not an option that should be pursued;
(b) fertilizers netbacks are sensitive to product values, oilprices (and hence feedstock costs) and capital costs. Thereported low bid price for construction of the fertilizer plantin Thailand is a major factor in the gas netback value in theabove Table being as high as US$3.3/MMBTU placing this optionon a par with LPG extraction.

- 152 -
(c) petrochemical production is also highly sensitive to priceassumptions although in the low oil price case the gas netbackvalue compares favorably with other options;
(d) LPG extraction shows good netback values which do not varysignificantly as the oil price scenario changes. This shouldassign high priority to LPG extraction;
(e) high priority is equally assigned to substituting fuel oil insteam based power plants -- a process that already is about tobe completed in the EGAT system;
(f) substitution of fuel oil in the cement sector (provided gaspipeline infrastructure already exists (para. 6.58)) offers areasonable netback -- this is again not highly sensitive tosignificant oil price changes;
(g) similar to LPG extraction, substituting gas for coal ir. steampower units provides a good netback though, as expected, lowerthan substituting for fuel oil in such units (para. 7.20-7.23).
7.15 It is clear that the power sector holds the key for developingthe gas industry, as it can be expected to dominate gas demand until theend of the century. Since petrochemical netback values appear goodrelative to gas costs even in the low price scenario, the proposedpetrochemicals project (para. 7.5), which will only demand some 43 MMCFDof gas, appears justified. The same cannot be said, a priori, for thefertilizer plant (para. 7.6). However, since very attractive termsapparently have been negotiated for this project, its ranking isconsiderably higher. In addition, only 30 MMCFD of gas use is involved,so if the project is financially viable but economically sub-optimum, theproject should not be too costly to the country. Clearly, the second LPGseparation plant to process Gulf gas should be undertaken as a highpriority project, with total gas demand for the first and second plantsbeing 70 and 30 MMCFD, respectively. Table 7.3 summarizes the supply anddemand balance for gas in Thailand to 1997.
7.16 From the gas supply standpoint, in 1985 available gas shoulddouble from 231 MMCFD in 1984 to about 485 MMCFD (para. 4.32). Thismeans that gas use in the power seccor's gas-fired units can begin on alarge scale with some 320 MMCFD of demand expected. As shown in Table7.3, gas demand in the power sector accounts for two-thirds to three-fourths of total gas demand for the entire period 1985-97. Due to thehigh benefits associated with gas use in LPG, petrochemical and powersector uses, fluctuations in available gas have been reflected in thistable by varying the gas demand in (i.e., the availability to) the cementsector and small users.
7.17 Even without including potential gas demand from end-uses suchas refinery fuel, it is clear that the gas industry will be supplyconstrained over the entire period to 1997 except, possibly, in

- 153 -
1985/86. This, combined with expected variations in gas volumes andvalues to different end users, highlights the need for gas tariffs tocertain consumers to include an interruptible component (clearly at avery competitive price). In the case of industries such as the gasseparation plant, fertilizer, and petrochemicals, such fluctuations infeedstock volumes cannot be easily tolerated. In the power sector, alarge fraction of gas demand in the power sector must be considered firm;but some variations are possible not so much because some gas-firedplants do intermediate load duty during the course of a day but becausehydropower contributions cannot be perfectly regulated from one season tothe next and from one year to the next.
Gas Use in the Power Sector
7.18 Another important issue which should be emphasized is theoptimal use of gas in the power sector, since this will determine the gasindustry's future over the next decade. There are three modes in whichgas can be used in the power sector assuming hydro will continue to coverthe system peak up to the late 1990s. These modes are:
(a) dual-fired gas/fuel oil boilers raising steam, operating as abase load unit;
(b) triple-fired gas/fuel oil/coal boilers raising steam, operatingalso as a base load unit; and
(c) gas-fired combined cycLe unit consisting of gas turbines (GT)with retrofitted waste heat boilers using the hot gases fromthe GTs to generate additional electricity in a steam turbine.
Table 7.3: NATURAL GAS DEMAND AND SUPPLY. 1985-87(MMCFD)
Petro- Ferti- Small Total Total Differ-Year LPG chemical lizer Cement Users Non-Power Power Demand Supply a/ ential b/ Year
1985 70 - - 35 - 105 380 485 485 0 19851986 70 - - 40 - 110 420 530 548 +18 19861987 70 - - 40 - 110 465 570 568 -2 19871988 70 - - 44 - 114 480 594 594 0 19881989 100 43 30 30 - 203 420 623 622 -1 19891990 100 43 30 40 20 233 520 753 763 410 19901991 100 43 30 40 17 230 520 750 750 0 19911992 100 43 30 40 20 233 560 793 812 +19 19921993 100 43 30 40 19 232 600 832 832 0 19931994 100 43 30 40 19 232 597 829 829 0 19941995 100 43 30 40 19 232 572 804 804 0 19951996 100 43 30 40 19 232 577 809 809 0 19961997 100 43 30 40 21 234 615 849 849 0 1997
a/ From Scenario 11, Table 4.5.b/ Oifference between supply capability and demand. Positive number implies excess supply
capability.

- 154 -
7.19 Two important factors should be noted. First, the combinedcycle unit has an efficiency of fuel use of about 432 compared to 36% forwell-run steam units. Second, while steam-fired boilers can use fuel oilor coal in addition to gas, the combined cycle gas turbine can use onlydistilled fuel oil or diesel oil as a replacement for gas, and dieseL oilnormally costs about 20-30% more than fuel oil.
7.20 Annex 10 compares the use of gas in a steam-fired unit and aunit fired by coal, fuel oil and lignite. Combined cycle units are thelowest cost generating thermal systems available in Thailand due to theirlow investment and fuel costs when using gas (Table 5.14). This isexpressed in Annex 10 in terms of the gas netback vaLue for the use ofgas in steam units and combined cycle units when compared to coal, fueloil and lignite-fired steam plants. At base load, the netback for gasuse in steam units are US$3.49/MMBTU, US$3.23/MMBTU and US$3.14/MMBTUwhen compared to fuel oil, lignite and coal-fired steam units using thesefuels at prices of US$22/bbl, US$20/ton, and US$55/ton, respectively.The spread is only 9% between the so-called "fuel oil parity" price andthe "coal parity price" for gas use in steam plants.
7.21 Gas has the highest value when used in the base loaded combinedcycle mode. Compared to a coal-fired steam unit, using US$55/ton coal,the breakeven price of gas in a combined cycle is US$4.37/MMBTU for thatsmall part of the system where it is applicable. 56/ This has veryimportant implications for the allocation of gas use by plant type in thepower sector. As long as incremental gas becomes available for powersector use it should be committed to combined cycle use and not toadditional dual or triple-fired (coal/fuel oil/gas) steam capacity.
7.22 The need for dual-fired (fuel oil/gas) steam capacity in thepower system only occurs at the beginning of gas development. Indeed,the existence of Bang Pakong and South Bangkok steam plants as gas-usingfacilities was vital in accelerating the development of a gas market atits infancy. It also provided flexibility to burn fuel oiL in the eventgas were not available. An important jump occurs in investments andstrategy as one moves from dual-fired (fuel oil/gas) steam units totriple-fired (fuel oil/gas/coal) ones. In the former case the investmentdifferential relative to a single-fired gas or fuel oil unit is negli-gible. However, once coal firing capability is introduced in the triplefiring mode investment differentials with single-fired coal units mayincrease mainly because of the difficulty of having sites that areconvenient for both suppLy of gas and coal.
56/ The break-even price of US$4.37/MMBTU establishes a parameter forinvestment planning. A lower price based on operating cost and fuelefficiency would be necessary for plant scheduling. Price payableto producers would also have to reflect location, guarantees onlong-term gas availability, rate of gas production, quantity andother factors.
- 155 -
Gas Pricing
7.23 The establishment of a gas pricing system for producers andconsumers in Thailand is a matter of the highest priority (para. 4.27-4.29). Although the guidelines for establishing this system werediscussed in Chapter IV, there are further details and issues whichshould be noted. First, the linkage between the Basing Point price andinternational prices of competing fuels is critical. This linkage alsomust be able to track the relatively short-term movement in prices,perhaps quarterly. With a large amount of equipment in the power andcement sectors possessing dual-fired gas/fuel oil capability, a majorslump in fuel oil prices could cause consumers to switch from gas to fueloil unless gas prices move downward in tandem. This is not the case asyet, even at today's lou fuel oil prices of US$21-22/bbl (US$3.33-3.49/MMBTU), which remain 33-40% above the economic cost of producinggas. Only if fuel oil prices begin to drop below about US$15/bbl wouldthe outlook change.
7.24 Second, since the power sector is the most important user ofgas in Thailand and would remain so until the end of the century, gaspricing poLicies for this sector are very important. The current gasprice to EGAT is US$3.20/MMBTU which is close to the estimated "coalparity price" (Annex 10). At current prices this is also 90% of the"fuel oil parity" in steam units. Clearly, the ceiling value of gas usedin the power sector would be about US$4.3/MMBTU (Annex 10), which wouldbe the breakeven price between use in a combined cycle unit and powergeneration in a coal-fired steam unit, but pricing gas near this ceilingvalue would seriously affect its use in the existing 2400 MW of dual-fired fuel oil/gas steam capacity. On the other hand, the presenteconomic production cost of gas, which is about US$2.5/MMBTU and does nottake into account the prospect of reserve depletion, is not a sustainablefloor price, since it would imply a freeze in the development of a coal-based alternative. Pricing gas to EGAT close to or just above the "coalparity price" in a steam unit neither distorts planning decisions in thelong run nor dispatch decisions in the short run (see para. 5.39). Itstrikes a good balance between tne above considerations of economicefficiency and financial revenue requirements by both EGAT and the gasindustry.
7.25 Third, for the gas pricing system to be transparent toproducers and consumers, there is a need to know the price at which gaswould be transmitted by pipeline systems that are not owned by producersor consumers. This price would depend on che volume, distance, andinterruptibility of the gas transmitted. In this way both producers andconsumers can determine their well head and plant gate gas prices respec-tively from the stated Basing Point price in Bangkok. Based on currentperspectives of gas availability over the next several years as well asmedium-term trends in international coal and fuel oil prices, in theassessment team's view the Basing Point price of gas in Bangkok should beset at about the Singapore fuel oil price, which currently is close tothe equivalent coal parity. The differential between fuel oil and coal,however, would have to be continually monitored.

- 156 -
VIII. RURAL ENERGY SECTOR
Introduction
8.1 The process of modernization occurring in rural Thailandinvolves complex interactions between various social and economic factorsincLuding production technologies, institutions, and changes in thepatterns of energy consumption. Trends toward increasing populationdensity, mobility, migration, deforestation, intensive land use, mecha-nization, monetization, and material consumption are interrelated anddirectly reflected in energy use. For example, modern transportation,which relics upon petroleum fuels, increases the mobility of people andprovides easier access to new products and markets. The outcome is thatrural Thailand is moving away from a self-sufficient lifestyle based onrenewable energy sources (wood and agricultural residues) to one which isdependent on non-renewable fossil fuels and electricity.
8.2 Energy consumption patterns differ significantly between ruraland urban areas. Patterns also differ among rural communities dependingon their regional location and distance from urban centers such asBangkok. Rural areas in the more developed and irrigated parts of theCentral region are well advanced in the transition to using modern fuels,while in the more remote regions of the north, northeast and south, theprocess is just beginning.
Modernization and Rural Energy Use
8.3 Although Thailand's economy has been growing since the mid-nineteenth century, until the 1950s there was little change in theoverall patterns of energy demand, which relied on traditional fuels.The establishment of a reliable and growing overseas market for riceprovided the main sources of economic expansion from 1850 onwards and ledto a dramatic growth in paddy production. Farming techniques, however,remained traditional, relying on animal and human power. Even the rail-way system was dependent on wood for fuel up to the 1950s. Fuelwood alsoremained the principal household cooking fuel in rural areas, while itwas supplemented by charcoal in urban areas. Fuel for lighting continuedto come mostly from kerosene, oil lamps or homemade candles; only inBangkok was electric light at all prevalent by 1950.
8.4 Thailand's economic growth since 1950 has been accompanied by alarge increase in the use of modern fuels, which have more than doubled

- 157 -
the growth of traditional fuels. 57/ This shift has progressed furthestin the urban areas of Thailand, particularly in Bangkok, where industry,commerce and transport are now almost entirely dependent upon modernfuels. Urban household energy consumption patterns also have beenextensively transformed by the increased availability of numerouselectric household appliances and LPG gas f3r cooking.
8.5 Rural areas have also undergone major changes in their energyenvironment. For example, the post 1950 agricultural expansion promptedby the mechanization of production methods, which has created a growingdemand for petroleum fuels. The rapid expansion of the infrastructure ofroads and electricity supply has provided greater access to modern con-sumer goods including energy-using appliances. The availability ofcredit facilities also has accelerated the purchase of such appliances.Nevertheless in most rural areas, households continue to rely ontraditional fuels for cooking. The rapid increase in road transport inrural areas spurred much of the growth in demand for petroleum fuelsduring 1950-1980.
8.6 To understand what is happening within rural communities, it isuseful to examine the changes that have typically been occurring in theagricultural, transport and household sectors. 58/ Agriculturalexpansion has been associated with an increasing degree of on- and off-farm mechanization. At the same time the opportunities for increasedagricultural production were greatly enhanced by improved transportfacilities. The development of roads linking villages to main highwayswhich began in the 1960s opened new markets and encouraged specializedmarket-oriented production of sugarcane, poultry and animal rearing.Village products in the form of crGps, vegetables and husbandry now areregularly trucked to nearby urban markets. Production thus has shiftedfrom a form that was intensive in animal and human energy to one whichincreasingly makes use of mechanized energy both for on-farm activitiesand for trucking cash-oriented production to market.
8.7 The development of the rural road infrastructure has led to agreat expansion in the number and types of vehicles used and owned invillages. The buffaloes and oxen which once served the dual purposes ofdraft and farm power and transportation, have been replaced by tractors,bicycles, motorcycles and trucks. Travel and transport have become majoraspects of village life. Rural people are travelling more frequently,
57/ Here the term "modern fuels" applies to petroleum products andelectricity, and "traditional fuels" or "biomass" includes firewood,charcoal, agricultural and animal residues. "Fuelwood" refers toboth firewood (burned directly) and the wood equivalent of charcoal.
58/ The discussions in para. 8.6-8.11 are based on the paper producedfor the assessment by Jasper and Fern Ingersoll, "Changes in EnergyUse in Village Thailand: A Review of the Experience," July 1984.

- 158 -
over greater distances, and for longer durations than they did ageneration ago. Bicycles are now owned by ordinary families and motor-cycles have become commonplace. Bus and truck transport have also grownrapidly. Many villages now have frequent bus services to nearby townsand truck traffic built up substantially during the 19709. Pick-uptrucks are becoming more popular both for passenger transport as well asfor freight hauling, and regularly carry agricultural produce to and frommarkets. The proliferation of vehicles also has facilitated migrationfrom rural to urban areas and permitted rural people to work in nearbytowns.
8.8 The higher incomes generated from the increased agriculturaloutput and remittances received from new urban dwelLers have encouragednew expenditure patterns and a change in household energy demand. Atupper income levels, purchased LPC and electric rice cookers arereplacing charcoal and fuelwood. Its association with modern Bangkokliving makes LPG and electric cookers the prestige fuel choices for manyrural residents. Electricity and the cleaner gas flame of LPG cookersare more compatible with the more closed-in living quarters charac-teristic of urban dwellings and, increasingly, urban-style houses, whichhave become more popular in rural areas.
8.9 The demand for cooking fuels in rural areas also has beeninfluenced by the reduced availability of wood caused by deforestation.Where LPG supplies are available and household incomes sufficient, thesituation has encouraged the shift to modern fuels. However, wheremodern fuels are not accessible or incomes are not sufficient, thetendency has been for charcoal to replace fuelwood for householdcooking. As forest boundaries have receded, those villagers who dependon collecting "free" wood have to travel increasingly further distancesto obtain fuelwood, thus encouraging the conversion of fuelwood intocharcoal in the forest to make it easier to transport the fuel back tothe village. 59/ Exposure to u-ban habits including cooking withcharcoal rather than wood may also account for the expansion of charcoal-making even in areas where wood supplies remain plentiful. Reducedavailability of traditional fuels has had less effect on higher andmoderate income families but poorer households who cannot afford modernfuels have to spend more time collecting fuelwood from woodlots andforests. In parts of the Central Plains and much of the northeast, wheremuch of the natural forests have already disappeared, these householdshave suffered severe hardship.
59/ Village woodlots, which used to provide a continuous, reliable andregenerative source of fuelwood, have also been converted to what isperceived as more profitable uses for growing cash crops such assugarcane and cassava. Indeed, growing cash crops instead of fuel-wood is perceived as part of the modernization shift from self-sufficiency to market-oriented production.

- 159 -
8.10 Whiere electricity has become available, electric light isreplacing kerosene lamps and homemade candles. Wealthier households arealso acquiring fans, a rice cooker, television, iron, andrefrigerator. 60/ Over 50% of households in some villages in the Centralregion had television sets in 1983. Poorer households which cannotafford the cost of being connected to the electrical system as well as aminimum level of interior wiring and lighting fixtures continue to remaindependent on kerosene lighting. It is important to note that an absoluteminimum of 4 liters of kerosene are required each month to meet the basiclighting needs of a non-electrified household. At current retail pricesthis costs about 24 Baht/month. In contrast, at current PEA tariffs ahousehold with 100 watts of incandescent light used four hours daily(i.e. 12 kWh/month) would pay only 12.5 Baht/month -- one-half the costof using kerosene.
8.11 RuraL life in Thailand thus is undergoing changes which involvea shift away from a self-sufficient, subsistence agrarian economy basedon renewable energy to one which is technologically, economically, andculturally focussed on commercial production for larger markets. Con-tinued rural development thus will lead to further increases in ruraldemand for modern fuels both for residential and transport uses. On theother hand, the demand for traditional fuels for cooking in rural house-holds is likely to remain substantial well beyoad the year 2000. Meetingthese demands without damage to the environment will require carefulplanning.
Rural Energy Demand Patterns
8.12 Despite the widespread migration to urban areas in Thailand,rural areas still accounted for half of total energy consumption inThailand in 1983: 96% of traditional fuels and 23% of modern fuels. 61/Households in these areas consumed 60% of the traditional fuels andindustry 40X (Table 8.1). Petroleum products supplied 70Z of the modernfuels consumed in rural areas for transportation purposes.
60/ In those villages which obtain electricity from isolated micro-hydroor diesel units, supply or maximum wattage levels are likely to beseverely restricted to certain times of the day. In these circum-stances the acquisition rate of appliances is slower and familieswith electricity connections might use it only for electric lightsand television.
61/ Rural areas are defined here as all non-urban areas. Urban areasare municipalities and urban sanitary districts. It follows thatrural areas are rural sanitary districts and non-municipal areasoutside sanitary districts.

- 160 -
8.13 The modernization trends are also extending into the moretraditional forms of energy. Although charcoal and wood remain the majorfuels used by rural households, their relative importance was reversedbetween 1962 and 1980. Whereas fuelwood was used by two-thirds ofvillage households in 1962 and charcoal one-third, by 1980 the proportionusing fuelwood had fallen to 40%, and that using charcoal had risen to55%. The trend away from traditional energy was more pronounced in theviLlages in the Central Region, where higher incomes and a more developedinfrastructure provide better access to distribution centers. By 1980,11% of rural households in this region were making some use of LPG as acooking fuel -- more than three times that of the national ruralaverage. 62/ Rural households in Thailand thus are beginning to followurban household trends.
8.14 Rural electrification grew substantially between 1970 and 1980,as the proportion of rural households with electricity increased from 5%to 28%. Again, the Central Rcgion led the way with 45% of ruralhouseholds electrified compared to 19% in the northeast. The use ofelectricity is initially limited to lighting but a number of appliancesare being acquired and are increasing at a relatively rapid rate. By1980, for exampLe, 16% of rural households had a fan, 10% a televisionset, and 7X a refrigerator.
8.15 The available industrial statistics do not permit a cleardistinction between urban and rural industries, but a rough picture ofenergy use by the latter may be shown. Despite the changing technologyresulting from electrification, rural cottage industries produce foodproducts or household goods which generally require very little fuel andtherefore remain largely labor intensive. Larger rural industries whichare also affected by electrification, however, often use by-productbiomass as well as other traditional fuels such as for food processing(in rice milling, rice husks; cassava processing, fuelwood; sugarmilling, bagasse), sawmilling or brick-making. Bagasse provides one halfof the traditional fuel used in rural industry, mostly by sugar millsthemselves (excluding bagasse, industry accounted for 19% of total ruralenergy consumption, mostly in the form of fuelwood, as compared to 48%for household demand).
8.16 Thailand's agricultural growth averaged 5% per year during1960-80. More intensive farming of irrigated land during this timeinvolved some mechanization and substantial amounts of fertilizer, whilean extension of the total cultivated area generated an increased demandfor labor in excess of population growth which spurred the use ofmech&nical equipment. The rapid increase in the number of tractors (25%per year during 1967-80), water pumps and threshing machines has resultedin a concomitant growth in commercial energy use. In 1983, 440,000 toeof petroleum products (diesel fuel and gasoline) were estimated to havebeen used in agriculture.
62/ Eleven percent is a regional average; in some villages a much largerproportion of households are using LPC and electricity for cooking.

- 161 -
TabIe 8.1: ENERGY CONSUMPTION (1983 and 2001)('000 toe)
1983 2001 1983-2001Rural Projected - Projectedas % of Rural Growth of
Rural Urban Total Total Energy Use Rural Energy
(%) (%)A. By Sector
Households (Fuels)Traditional 4,180.3 295.2 4,475.5 93.4 4,607 0.5Modern 381.2 418.7 799.9 47.7 669 3.2
Cottage Industry 380.0 - 380.0 100.0 380 -
Industry (Fuels)Traditional b/ 2,363.0 - 2,363.0 100.0 3,498 2.2Modern 229.2 2,363.8 2,593.0 8.8 683 6.3
Agriculture 449.9 - 449.9 100.1 1,055 4.9
Transport 1,427.8 4,237.3 5,665.1 25.2 4,513 6.6
Commercial/Government - 615.9 615.9 - - -
Fisheries - (680.9) 680.9 -
Total 9,411.4 8,566.6 18,023.2 52.2 15,405 5.0
B. By fuelTraditionalFuelwood 2,971.7 15.0 2,986.7 99.5 2,844 -0.2Charcoal 2,219.7 280.2 2,499.9 88.8 3,480 2.5Agricultural
Residues 526.9 - 526.9 100.0 635 1.8bagasse 1,205.0 - 1.205.0 100.0 1,526 1.3
Subtotal 6,923.3 295.2 7,21a.5 95.9 8,485 1.3
ModernPetrvleumProducts 2,259.4 6,938.2 9,197.6 24.6 6,138 5.7
Electricity 190.5 1,236.8 1,427.3 13.3 695 7.8Lignite/Coal 38.2 141.6 179.8 21.2 38 _
Subtotal 2,488.1 8,316.6 10,804.7 23.0 6,920 5.8
a/ Projections based on procedures outlined in paragraph 8.18.Bagasse accounts for 50% of traditional fuels used in rural industry.
Source: Assessment team estimates.
8.17 The expansion of the rural road network between 1960 and 1980had a great impact on the use of commercial fuels for transport purposes.Household expenditures on transportation and on the ownership of vehiclesgrew quickly. Real per capita expenditures on transport services grew by8% per year in rural areas between 1962 and 1976 -- more than three timesfaster than the growth in per capita rural incomes. The ownership ofbicycles, which started the process, increased from 30% of rural house-holds in 1962 to 50Z in 1980; other forms of transport are followingsuit, as the ownership of motorcycles increased from 1% to 19%, and cars

- 162 -
from zero to 4%. In the Central region 7X of rural households owned anautomobile or truck in 1980. As a result, the use of commercial fuelsfor transpert is estimated to have grown by 7Z per year during 1960-83 toreach 1,427,000 toe in 1983.
Projections
8.18 The assessment team developed projections of the likely volumeand composition of energy demand in rural areas during the next 15 yearsbased on the assumption that relative prices for various fuels remain asat present and the economic growth experienced in the past wilL continuealthough at a somewhat slower rate. A two-step procedure was adopted forprojecting household demand. The first was to project the number ofhouseholds using a particular fuel as their main energy source; thesecond was to project the consumption levels for these households. Theproportion of rural households using fuelwood as their main fuel wasassumed on the basis of current trends to decline to only 152 by 2001 ashouseholds switch over to chatcoal use. However, the switch to charcoalwas assumed to be partially offset by other households, mostly higherincome, switching to LPG or electricity as the availability of thesefuels increases. The number of households relying on charcoal was thusassumed to remain at about 55%, while those using LPG were to increasefrom 5% in 1983 to 25% by 2001 (from 325,000 households in 1983 to2,200,000 in 2001). On the basis of the assessment team's evaluation 63/of the way in which the current rural electrification program is being
63/ GDP is assumed to grow at an average rate of 6.0% p.a. (3.0Z inagriculture and 7.0% p.a. in the non-agricultural sectors). Thepopulation projections are:
Annual1983 2001 Growth Rate
(millions) (percent)
Urban 12.0 22.4 3.5Rural 36.1 43.7 1.0
Total 48.1 66.1 1.8
By the year 2001, the rural popuLation will have declined to about66% of the total population compared with 75% at present. If therural population had grown at the national rate, it would havereached 50 million in 2001, i.e., 6 million people are assumed tomigrate from rural to urban areas and in the process shift from arural energy consumption pattern to an urban one with greater use ofmodern fuels.

- 163 -
impLemented, 75% of all rural households are projected to have elec-tricity connections by 2001.
8.19 To project the growth in fuel consumption by households using aparticular fuel, assumptions were made about income elasticities. Theincome tlasticity of electricity was estimated at 1.2, which is con-sistent with PEA's experience over the past decade. In the absence ofsimilar data for other fuels, a value of 0.5 was used, which appearsconsistent with experience in other countries. Combining the two steps,aggregate household consumption is projected to increase, but the demandfor firewood wouLd decline. Aggregate traditional fuel demand increasesby 0.5% per year to reach 4,607,000 toe in 2001, compared with 4,181,000toe in 1983. The demand for modern fuels increases by 3% per year, withLPG demand growing by 13Z and electricity by 9%. Kerosene demanddeclines, reflecting the increased number of households that areprojected to use electricity for Lighting.
8.20 Energy demand by cottage industries appears to be growing quiteslowly while the use of wood and charcoal by larger industries has in-creased somewhat. Nevertlieless the latter is expected to grow moreslowly than industrial output because of increasing technologicalinnovations and labor-saving techniques which will undoubtedly emphasizethe use of more modern fuels. The use of bagasse and agriculturalresidues in industry are supply-determined reflecting agriculturaloutput; the growth of the sugar industry is slowing, and hence the use ofbagasse is assumed to flatten out in the 1990s. To sum up the variouschanges that can be envisaged at this stage, on the basis of currenttrends, the growth of industrial use of modern fuels is projected toincrease by 6.3% per year and traditional fuels by 2.2%.
8.21 The mechanization of agriculture is expected to continue at afairly rapid pace up to 1990 when opportunities for additionalmechanization fall off. As such, the use of diesel and gasoline isprojected to grow by 6% per year through 1991, and 4% thereafter andslightly faster than the growth in agricultural output. However, despitethis rapid growth in the use of commercial energy, its use foragriculture should not rise much above 1 miLlion toe by 2001.
8.22 Transportation to and from rural areas is the most dynamicelement in the entire picture as commercial fuel use in this area isprojected to keep pace with the entire modernization process. The demandfor transport fuel would grow by 7% per year and reach 4,500,000 toe in2001, which is more than currently is consumed by transport ir the wholecountry. The volume and growth rate of diesel/gasoline demand are likelyto be the largest components of this growth, depending on pricing and thetypes of vehicles that are used. The modernization and urbanizationprocess has gone so far and the links with the rural areas are becomingso close that it is hard to envisage a slowdown in this process.
8.23 Projections indicate, therefore, that the demand for modernfuel in rural areas is likely to grow by 5.8% per year and the demand for

- 164 -
traditional fuels by only 1%. Such growth in the demand for modern fuelsin rural areas by 2001 implies that about 7,000,000 toe will beconsumed. Nearly 6,000,000 toe will be in the form of petroleumproducts, 75% of which is for fuels to be used in transport. Electricityuse would increase to about the equivalent of 695,000 toe. Commercialenergy will be necessary to fill what could become a growing energyshortage in rural areas. The effect of vast road construction, the ruralelectrification programs and such agricultural improvements as arerelated to irrigation, mechanization, the availability of fertilizer andimproved seeds, all fostered by the public sector, have stimulated astrong modernization trend accompanied by a capidly growing use of energyboth at the construction stage and even more so as the private villagesector has taken fuller advantage of the public facilities created.Villagers and farmers who in the past looked to the central government tobring the facilities are now themselves introducing their own momentum tothe process. Rural inhabitants are buying all kinds of appliances,mostly on credit. Villagers who in the past have participated in cost-sharing or have contributed local labor to obtaining public facilitiesare now obtaining television sets and motor bicycles. Dynamic villageleaders such as head priests, teachers and village headmen who in thepast have been primarily responsible for the actual success in bringingpublic works to the village are now becoming entrepreneurial as farmers,truckers or middlemen. Outside merchants are making a major contri-bution, particularly in providing credit for hire purchases. Greatlyexpanded use of modern energy has been the end result of all of theactivities.
8.24 Policy guidelines are needed to improve the incentives faced bythese entrepreneurs. In general it means letting the market function asfreely as possible: allowing prices to reflect proper economic values;avoiding the monopolistic power of large dominant enterprises, whetherpublic or private; planning the development of energy resources so thatthey can be made more available in direct response to the demands of therural population. Rural residents who have tasted modernization areunlikely to be willing to revert to an energy economy primariLy based ontraditional fuels. A reasonably accurate view of commercial energyrequirements must be related to what can be accomplished in the next twodecades in the production of traditional fuels and how far the existingpopulation using fuelwood and charcoal will continue to use it.
Traditional Fuel Supplies
8.25 Fuelwood shortages and serious environmental problems arebeginning to occur in certain areas, although the overall nationalfuelwood supply situation is not yet critical, and substantial areas ofnatural forests are still accessible in many parts of the country.Forest depletion rates have exceeded sustainable levels by 400Z incertain areas and give cause for concern for the future. Continueddemand for fuelwood at current rates has already put a strain on the

- 165 -
accessible forests and resulted in the deforestation of large areas, e.g.in Central Thailand. The combination of fuelwood collection,agricultural expansion, commercial fellings, shifting cultivation and theeffects of urbanization have reduced the country's forested land areafrom 27 to 16 milLion hectares in the last 25 years (Annex 11). By 2001the area is likely to be less than 11 million hectares if current trendscontinue. The total sustainable supply of fuelwool from all sources 64/in 1983 is estimated to be about 15.5 million m , which compares withthe 1983 consumption leveL of about J3.6 million m3, including irbandemand (Table 8.2). The 23.1 million m' deficit is met by overcuttingthe forests. By 2001 potential demand could increase to a level of 50million cubic meters while the sustainable jupply without a fuelwoodprogram would decline to about 13.9 million m , leaving a gross deficitof about 36.1 million m3. Although these numbers have a margin ofuncertainty, there can be no disagreement on the direction of the trendand the nature of its potential impact. If unchecked, the excessiveexploitation nf natural forests could quickly lead to environmentaldamage, fuelwood shortages and a decline of agricultural productivity inmany areas.
Table 8.2: FUELhCOD )EMAND AND SUPPLY(Million m Wood)
1983 2001
Demand 38.6 50.0
Supply from Public Sources 11.5 9.9Sustainable Yield 7.5 a/ 6.9 b/Other 4.0 c/ 3.0
Supply from Private Sources d/ 4.0 4.0
Gross Deficit 23.1 36.1
a/ 15.5 million hectares, 20% economic accessibility, MAI 2.5 "13/ha/y.b/ 11 million hectares, 25% economic accessibility.c Includes state plantations, mangrove forests and logging wastes.
d/ Total private sources can amount to 4-14 million cu.m. depending on
assumptions. The mission considers 4 million cu.m. a more realistic
estimate.
Source: Mission estimates based on discussions with RFD and NEA.
8.26 Furthermore, although the geographical distribution of forestresources in Thailand is uneven and there are remote forest areas withabundant cover, the process of deforestation is likely to spread as more
64/ Existing sustainable wood supplies from all private sources assumedto be about 4 million m .

- 166 -
of ihese areas become accessibLe. Charcoal, which requires between 5 to9 m of wood per tonne, will continue to be produced, not only because itis a preferred fuel in many households but also because it has double theenergy density of wood and therefore is cheaper to transport overincreasingly greater distances as the forests recede. Thus, the devas-tation may continue long before its damage is fully recognized. Indeed,the 1980 NEA rural energy survey showed that many households in thenortheast (15%) and the southern regions (46%) already obtain a sub-stantial portion of their fuelwood from relatively distant forests(Table 8.3). For the country as a whole, 16% of the fuelwood was alreadycoming from "distant" forests, over 5 km away from villages.
Table 8.3: SOURCES OF FUELWOOD FOR RURAL HOUSEHOLDS
North- Central CentralSources North east 1 2 South National
- - - - - - Percentage of Fuel Supply - - - - - - - -
Free SourcesWithin own compound 64.9 35.7 85.1 31.1 5.2 35.4
Other's compound 3.9 21.4 2.3 0.9 2.4 14,4
Nearby forest(less than 5 km) 21.2 26.9 6.9 61.0 44.1 31.7
Distant forest 5.9 14.6 3.9 0.6 45.8 16.3
Subtotal 95.7 98.6 98.3 93.6 97.5 97.8
Commercial Sources 4.3 1.4 1.7 6.4 2.5 2.2
Source: Chirarattananon (op. cit.), based on NEA Rural Energy Survey.
Household Energy Prices
8.27 The impact of continued overcutting in due course will be notonly to increase the distance that households must go to coLlect wood,but will raise both the cost and price of fuelwood and charcoal. This isalready happening in numerous areas of the country. The effect on costscan be imputed as is illustrated in Table 8.4. In village 1, fuelwoodfrom forests within 2 kms carries an implicit cost of Baht 0.38 per kg;in village 2, where the forests are 15 kms away, fuelwood costs Baht 1.03per kg. Similarly, the cost of charcoal would increase from Baht 2.0 perkg in Village 1 to Baht 3.5 per kg in ViLlage 2. In provincial muni-cipalities the actual price of charcoal has already been running aboutBaht 3.5 per kg, while in Bangkok the price is Baht 5 per kg becausecharcoal supplies come from as far as 100-150 kms away. These cost and

- 167 -
price levels compare to those of competing commercial fuels as follows.The retail price of LPG is about Baht 10 per kg in Bangkok, and Baht 13.3per kg in provincial municipalities. Because LPC has only recently begunto be distributed in rural areas, no published price data are available,but the assessment team did hear of reports of LPG as high as Baht 20.5per kg in village stores.
Table 8.4: REPRESENTATIVE COMPARATIVE FUEL PRICESIN RURAL AND URBAN AREAS, 1983
(Baht per Unit) a/
ProvincialRural Urban Bangkok
Fuelwood (kg)Imputed costvillage 1 - 0.38 (1.4)Village 2 b/ 1.03 (3.7)Urban _
Charcoal (kg)Imputed costb/Village 1 - 2.0 (1.4) -
Vfi Illage 2 - 3.5 (2.5) - -Market price - 3.5 (2.5) 5.0 (3.6)
Kerosene (liter)Retail price 8.0-12.5 6.5 6.1
LPG (kg)Retail price 13.3-20-5 13.3 10.0
(2.2-3.3) (2.2) (1,6)
Electricity (kWh)Tariff 1,17-t.75 1.75 1.83
(1.4-2.1) (2.1) (2.2)
2l Figures in brackets are Baht per Useful 1,000 Kcal where calorificcontent and end use efficiencies of various fuels are:
Fuel Heat End Use Net Useful EnergyUnit Value Efficiencies Kcal per Unit
Fueiwood kg 3500 8% 280Charcoal kg 7000 20% 1400LPG kg 11,154 55% 6135Elec'ricity kWh 860 95% (rice cooker) 817
b/ Village I is assumed to be within 2 kin of fuelwood supplies,Village 2, 15 kms.
cl Tariff depends on amount of power consumed per month.
Source: Assessment team estimates based from information received fromNEA and other Thai sources.

- 168 -
8.28 When the differing heat content and end-use efficiencies of thevarious fuels are taken into consideration, fuelwood and charcoal are themost economic fuels for cooking, particularly when fuelwood supplies arestill located in nearby villages. However, as wood has to be transportedover greater distances, it becomes more costly and LPG becomes morecompetitive. Present subsidized electricity tariffs in areas where woodis becoming more costly make electric rice cookers also competitive.Location, as well as the level of subsidy now prevailing are, of course,critical. In those areas where overcutting continues and the forest isreceding or even disappearing as in Central Thailand, the higher cost oftraditional fuels and the low subsidized prices for commercial fuels havealready made LPG and electricity sufficiently attractive to be the fuelof choice for many medium-to high-income households.
8.29 As shown in Table 8.4, LPG currently is competitive with fuel-wood in Village 2 situations; in the case of charcoal it is competitivein Bangkok and in provincial urban and rural Village 2 settings. Thisalso applies to the use of electric rice cookers at present tariffs.
8.30 As forest cutting continues and cheap fuelwood becomes lessaccessibLe the rising cost of traditional fuels will make LPG competitiveeven in Village 1 locations. To these supply side effects have to beadded the increasing demand side preference for LPC as a cooking fuel inprovincial urban and rural settings -- a process which is reinforced bythe impact of rising disposable incomes of rural households.
Rural Use of Modern Fuels and Policies
8.31 The effects of these cost and price changes already are addingpressure to traditional fuels and causing additional switching to modernfuels bevond those that have been assumed in the projections in Table8.1. The cost of such switching to the country and the extent of theswitch is open to conjecture. Various possible scenarios have beenconsidered in this report. The scenario considered most realistic by theassessment team assumed that the number of households using LPG risesfrom the projected 35% to 50% and the use per household increases from 45kg to 60 kg per year. 65/ In addition, electricity use could e-asilyincreace from the 2.0 kWh per household using electricity per day assumedin the projection in Table 8.1 to 2.5 kWh per day. The aggregate impactof such an increase when combined with the additional use of LPG wouldresult in only a 585,000 toe increase in the total denand for commercial
65/ This would be equivalent to about 270,000 tons of LPG a year (about6,800 bbls/day, which is roughly 50% of total 1984 LPG demand, oraround 90% of the LPG currently used in transport).

- 169 -
fuel. 66/ Such an increase in commercial energy use is less than 4% oftotaL commercial energy used in 1984. Substitution by commercial fuelsis feasible providing the policy framework applied is sound. Great careshould be taken to imprc"_ the distribution mechanisms and the pricingsystem to ensure that significant segments of the population are able toobtain adequate energy supplies. The avoidance of subsidies for modernfuels is particularly important to prevent growing distortions whichresult in uneconomic demand for the wrong fuels, e.g. diesel and LPG usein transport. The continued underpricing of some of these fuels and themaintenance of subsidies will soon result in an increasingly onerousburden on Thailand's public finances.
8.32 The tariff for rural electricity, which presently receives asubsidy, also needs to be revised to reflect the LRMC and to avoid anexcessive financial burden on the electric system. A principalcontributor to the EGAT system peak at the present appears to be thesrmall residential consumers, particularly those served by PEA. Thesubstantial quantities of electricity used by higher income households-ho cook with electricity should be supplied at full economic cost. Atcurrent PEA tariffs low income households with consumption levels lessthan about 15 kWh/month are estimated to spend much less on electricitythan on kerosene for lighting purposes (para. 8.10). Since LPG use islikely to be limited to the upper income half of the population, itsprice should reflect full economic costs. A proxy for this could be awholesale price based on border prices. The elimination of controlledretail LPG prices for residential use, which has resulted in a two-tierpricing system, would help to remove existing incentives to divert cheaphousehold LPG to transport uses. Deregulating prices should also be usedto encourage the entry of additional suppliers into the LPC market, tocreate a competitive environment which is essential to the de'elopment ofan efficient distribution and sales network in rural areas.
8.33 Higher energy prices no doubt will begin to seriously affectmany rural households. The higher costs of firewood and charcoal willamount to a burden of as much as US$650 million per year by 2001 forrural households. Moreover, switching to modern fuels will require sub-stantial initial expenditures because the use of LPG requires a depositof Baht 300 on a gas cylinder of 15 kg. Thus, if LPG were used by 50Z ofrural households in 2001, this would require a financial outlay of $90million in cylinder deposits by these consumers. The purchasing of gasand electrical cooking equipment would also require a substantial invest-ment. The government cannot be expected to share in the burden of thisinvestment for these households, most of whom would be among therelatively high income groups. The increasing role of LPG as a cookingfuel in provincial u ban and rural locations highlights the issue of the
661 Of which 310,000 toe is LPG and 275,000 toe (1100 GWh) of elec-tricity.

- 170 -
role of the private sector both in providing the bottles and stoves andin efficiently distributing the fuel in these areas. Here it isimportant that government not permit the emergence of any LPG marketingand distribution monopolies if these efficiency objectives are to beachieved. One issue for the suppliers of LPG concerns the financing ofdeposits on cylinders by consumers. There is no apparent reason why theprivate sector could not only sell the gas but also lease or providecredit for the equipment.
Forestry, Conservation and Biomass Substitution Program
8.34 Over the next twenty years, the various economic factorsaffecting rural energy demand and the decline in natural forest resourceswill result in a growing deficit of fuelwood. Whether the situation willlead to a faster shift to modern fuels than assumed is a question whichwill affect the supply strategy that needs to be adopted. The presentstructure of prices (Table 8.4) shows clearly that fuelwood-derivedenergy is in some cases a less expensive option to consumers and that theprocess of large-scale switching to modern fuels in rural areas wouldinvolve high costs to rural households. Since as much as 25X of ruralincomes may be spent for energy, maintaining fuelwood supplies may be theleast cost approach to meeting many of the rural household cooking needswhenever fuelwood supplies can be planted close to consumers. Charcoalproduced from wood from a nearby plantation can provide cooking energy,allowing for differing end-use efficiencies, at Baht 1.0 per useful Kcalcompared with Baht 2.2-3.3 for LPG and a LRMC of Baht 5.0 for electricrice cookers. The essence of the rural energy strategy needs to combinetwo objectives -- that of improving the supply and efficiency of usingtraditional cooking fuels while at the same time efficiently providingrural consumers with access to commercial fuels other than just elec-tricity at competitive and economic prices.
8.35 Consequently, traditional fuels have an important role to playin an overall rural energy strategy. A critical element in such astrategy is the size of the appropriate fuelwood program, thedeterminants of which include not only the estimated deficit but alsoconsiderations related to the feasibility of implementation. It will bepossible, therefore, to set a definite program magnitude only afterfurther study of certain specific information such as the viability ofprivate fuelwood plantations and the amount of sustainable wood resourcesalready in place in non-public lands. Nevertheless, to provide planningperspective, the assessment team has identified possible components of afuelwood program which would supply some 20 million cubic meters of woodequivalent by the year 2000 through afforestation, conservation andbiomass substitution (Table 8.5). The program is ambitious but feasiblein the view of the assessment team, if the implementation issuesdiscussed below are effectively addressed. However, even at fullimplementation, a net deficit of up to 16 million cubic meters of woodequivalent could still remain, to be be met by overcutting and/orincreased use of modern fuels.

- 171 -
Table 8.5: FUELWOOO PROGRAM
Annual Production Investment Costs2001 1986-2001
(Million Cu.M (Million USS)Wood Equivalent)
I. Supply Strategy1. 0.45 million ha private
sector plantations 9.0 240.0- 0.3 M ha small farmers- 0.15 M ha industrial-scale
2. 75,000 ha intensivelymanaged RFD plantations 1.7 40.0
3. Homesteads, 100 million trees 2.5 20.0rotal 13.0 300.0a/
II. Conservation Strategy
1. Improved Kilns
(5000 producers, 370 t/y ave) 2.7 5.Ob/
2. Improved Charcoal Stoves
(800,000 units) 1.8
3. Improved Firewood Stoves 7.5c/
(600,000 units) 0.5
Total 5.0 12.5
II, Substitution with
Biomass Residues
1. Rice Husks 1.0 3.0c/
2. Sawmill Wastes, etc. 1.0
Total 2.0 3.0
Overall Total 20.0 315.5
a/ Initial investment only. Excludes administrative costs.b/ includes cost of kilns, accessories and administration.c/ All program costs included.
Source: Mission estimates based on discussions with NEA, RFD and otherThai officials.
8.36 The afforestation effort outlined in Table 8.5 would involve:
(a) establishing 450,000 ha of private fuelwood plantations;300,000 ha in small farm holdings (about 5 ha each) that havebeen converted to growing fuelwood as a cash crop, and 150,000ha of industrial-scale glantations near wood markets. Anaverage yield of 20 m /halyr iould be obtained in suchplantations generating 9 miLlion m wood annually.

- 172 -
(b) tree-plar.ting around homesteads by 2 million rural households,each with about 50 trees. With a rotation period of 6-10years, this would provide 2-3 million m3 of fuelwood annuaLly.
(c) converting 75,000 ha of state-owned forest land intointensively-mayaged government plantations. At an assumedyield of 20 m /ha/yr, this would contribute about 1-2 millionm per year to the supply.
(d) increasing the proportion of total forest area that will beeconomically accessible for fuelwood collection by 2001,through, for example, building roads into more remote forestedareas to permit managed commercial exploitation of fuelwood tosupply charcoal.
8.37 Complementary demand-side actions are also needed. An achiev-able objecti- would be to have about one-fourth of charcoal productionin 2001 carried out in improved kilns with 25% higher efficiencies thanthose of preseni kilns. 67/ The program could result in savings of about2.7 million m of fuelwood and would engage about 5,000 charcoalproducers a year in producing a total of 370 tonnes. 68/ Additionalsavings could be achieved by promoting wider use -,f improved householdstoves. A feasible 15-year program would be to have about 10% ofhouseholds using improved stoves, i.e., requiring the deployment of about800,000 units of improved charcoal stoves and about 600,000 units ofimproved firewood stoves. The efficiency increases of 20Z-30Z forcharcoal stoves and 8Z-15X for firewood stoves produce a combinedfuelwood savings of about 2.3 million m3.
8.38 Substitution with biomass residues, particularly rice husks andsawmill wastes, could be pursued in certain areas of the countr3y. Themaximum potential in 2001 for rice husks is 3.2 million mi woodequivalent. In the rice producing regions, the natural shift to paddyhusks for cooking as wood becomes more costly to obtain may increasetheir use from about 100,000 mi at present to 500,000 m3 by 2001. It maybe possible to push use up to as much as 1.0 million m3 through theappropriate programs. Sawmill wastes, now used for fuel at probabLy lessthan 0.5 million m3, may be promoted to increase usage to about 1.0million m3. Other potential sources include wood obtained from clearingfor agricultural expansion. These are slashed and burned in the field atpresent and very little end up as household fuel.
67/ Projected total charcoal demand by 2001 is 7.7 million tonnes.
68/ Part of this shift to more efficient methods will probably occureven without government intervention.
- 173 -
Implementation Issues in Traditional Fuel Programs
8.39 A critical element in the analyses presented in this reportrelates to how large a fuelwood program is feasible. The targetsoutlined above are certainly ambitious and should be considered at thistime as a tentative ceiling. Whether in fact they can be achieved willdepend on a host of institutional, economic and sociological factorswhich are discussed in the sections that follow. In the context of thisdiscussion, it is important to emphasize that:
(e) the targets were estimated to permit quantification of thenecessary efforts. They do not represent fixed numbers fromwhich some upward or downward deviation would be unexpected.
(f) at full implementation, the program can at best meet only abouthalf of the projecced fuelwood gap, clearly indicating theinitiatives that need to be taken on the modern fuels side.
(g) a more modest program achievement would stiLl represent asignificant contribution to the fuelwaod supply plus importantbut unquantifiable impacts on the environmental degradationcaused by continued overexploitation of the natural forestresource base.
8.40 This report emphasizes the importance of gettirg the privatesectorinvolved in all rural energy programs and particularly the ruralafforestation fueLwood program. In this area the government already isleasing land to farmers at a lump-sum fee of Baht 20/rai to grow wood ona 30-year lease. Some farmers are already taking up these leases.
8.41 A further issue concerns the need to integrate the fuelwoodsupply program and all charcoal kiln efficiency improvement projects, andnot treat them as separate activities involving the fuelwood supplier onthe one hand and the charcoalier on the other.
Private Sector Role
8.42 The program relies heavily on private sector participation tominimize government investment and actual planting work to be done byRFD. About 85% of the total target area is planned to be planted by theprivate sector; two-thirds of this area would be small farmer's lots andone-third industrial-scale plantations. The basic incentive to privatetree growers would be the attractive financial rate of return on invest-ment, shown to be about 23% for plantations supplying the fuelwood needsof charcoal makers within 5 km from the plantation gate (Annex 12). Theeconomic rate of return is about 23% at a land rental cost of 500

- 174 -
Bahtslha/year. 69/ However, such estimates of financial viability arenot likely to be the only basis for private farmer or companydecisions. In practice other key factors will have equal or greaterimportance. First is the existence of established market outlets for thewood produced. Where charcoal makers have easy access to "free" woodfrom natural forests, the market will not be there. Hence the projectshould give priority to areas such as in the south and northeast wheresupplies are distant from consumers. A second consideration would be Lheperceived advantages of using the same land for agricultural cropsinstead of trees. Fuelwood plantations even for fast growing speciesrequire at least four-five years before the first harvest. Mostagricultural cash crops require much less time. A third factor is theactual availability of suitable land for afforestation within an economichauling radius of main townships. These issues need to be addressed indetail in the context of each project.
Previous Experience
8.43 Experience with past and ongoing Bank agriculture projects inThailand provides valuable insight3 on potentiaL implementation diffi-culties and possible means to surmount these. The Highland ForestryComponent of the Northern Agricultural Development Projects (NADP), forexample, has exceeded its original physical targets of 7,700 hectares ofplanted area. However, cornmunity participation, which is a crucialrequirement for the successful implementation of laL7er planting efforts,has remained a problem. Serious incidents of community resistance wereencountered by the implementing agency, RFD, when it planted in areastraditionally cultivated by local hill tribe people. RFD is onlygradually learning to include such social factors in its planning. Inaddition, legislative restrictions on forest reserve lands and RFD'spresent lack of extensior. expertise have limited the role of localfarmers. Virtually none of the component's woodlot plantations aremanaged and harvested by the farmers.
8.44 The other forestry activity of the NADP, the smaller UplandForestry component, is being implemented by the Land DevelopmentDepartment. It is likely to achieve only one third of the originaltarget of 4,050 ha of planted area. Aside from technical difficulties(inadequate culling of seedlings, unsuitable tree species for certainsites, selection of sites with extremely poor soil, etc..) .he moresignificant problems were sociological in nature. Since a fair amount ofwood is still available from nearby forests, the farmers do not perceiveany urgency in planting their own trees. Also, common woodlots do notseem to gain acceptance becau_e of their collective and voluntary nature.
69/ Sensitivity analysis indicates that if the rentaL cost of land wereto double, the economic rate of return would still be 20X.

- 175 -
8.45 These particular problems point to the critical role forcontinuous, expert extension work; the need to select woodlot sites andtree species more judiciously; the importance of securing the rights offarmer participants; the need to review the collective as opposed to theindividual woodlot approach; the need to carefully delineateresponsibilities and working relations of all relevant RTG agencies, thelocation of planting -- areas where free wood is remote -- and the pricethat can be expected for charcoal.
Organization
8.46 For the proposed program, the organization and institutionalroles should be subject to careful study before projects are undertaken(Annex 8.3). RFD will need to be the lead government agency, as it hasthe forestry expertise and the custodial responsibility over much of theland that will be converted to fuelwood plantations. To ensureconsistency with national land use policies and plans, RFD must have thesupport of and coordination with the Land Development Department, theOffice of Agricultural Land Reform, and the Department of Lands. On theconservation and biomass substitution side, NEA should continue toprovide research assistance, especially on the development, field testingand standardization of improved kilns and household stoves. Themanufacture and marketing of these fuel-conserving devices should,however, bc turned over to commercial producers as soon as possible. Thedissemination of improved charcoal making techniques to rural householdsand small charcoal producers is probably best done by REFD field staff whoare more familiar with village conditions and personalities.
8.47 The program will obviously require a substantial increase inRFD manpower, including new staff with specialized training in socialforestry and wood-based energy. The institutional expansion and staff-training can be done gradually, in consonance with the long term plan-tation development plan. Again, this aspect of the program, includingthe budgetary implications not only for RFD but for all other involvedagencies, needs careful study at the pre-investment stage.
Policy Measures
8.48 Program implementation must be supported by policy measures andactivities designed to protect the r_maining natural forests andencourage private sector participation in plantation establishment. Twoimportant broad policy objectives are: (a) to limit as far as possiblethe removal of fuelwood from national forests to low income groups of thepopulation who cannot afford modern fuels; and (b) to encourage, withinthe group that must rely on traditional fuels, maximum self-production ofneeded supplies, e.g., dedicated plantations for wood-burning industries,homestead planting and agro forestry, etc.

- 176 -
8.49 Recommended policy measures include:
(a) gradual imposition of fuelwood extraction fees from the royalforests which more closely reflect economic rent for theresource. A fair stumpage fee, for example, may be the"willingness to pay" by final users minus all cutting,collection, and transport costs. Aside from the economicobjective, the policy can encourage private sector plantationsby making the Latter's product more competiti'ie;
(b) ensu-e security of land tenure, and hence the ability to obtaincredit, to energy plantation farmers through the continuationof current land titling programs;
(c) provision of flexible pricing for tree seedlings. In poorerand remote rural areas, free distribution of seedlings may beneeded as an incentive for small farmers to take up treeplanting. For larger scale tree farmers situated close topotential cash markets, a policy of full cost recovery may beappLied; and
(d) provision of strong support to conservation-oriented researchand demonstration activities for improved charcoal kilns anccooking stoves.
Action Plan
8.50 Specific program activities for financial support forplantation development, research and institutional strengthening arelisted in Annex 13 and in the action plan outlined below and highlightedin Table 8.5.
8.51 As an immediate step, the above recommedations should betranslated into a two-phased action plan. Phase I would consist of twostudies which focus on fuelwood issues which are not being addressed incurrent preparatory work for projects financed by the Bank and otheragencies. 70/ The studies, which should be carried out in an integratedmanner, would:
(a) Identify the specific conditions for viable operation offuelwood plantations by the private sector (small farmers and
70/ It is imperative to first determine potential areas of overlap withother ongoing/planned studies of broader scope, such as the prepara-tion work fo= the proposed Rural Land Use Project. The Phase Istudy should be coordinated with that work, to ensurecomplimentarity of objectives and specific areas of investigation.

- 177 -
industrial companies). The study would make a more detailedfinancial and economic analysis of the fuelwood growingbusiness, considering typical farm sizes, locations, suitablespecies and likely yields; examine existing and projectedfuelwood and charcoal markets; assess the feasibility ofcharcoal making as an adjunct to wood production in theproposed plantations and the impact of this option on small,landless charcoal producers; examine, under various conditionsand locations, the competitiveness of fuelwood growing versusother agricultural crops; examine the feasibility of inter-cropping and co-production of non-fuelwood forest products(poles, timber, fruit, etc.) which could improve profitability;examine the actual availability of suitable land, as well aspotential constraint- that may be imposed by existing andforthcoming land-us- policies and plans 711 and determine therequired governmer_ mechanisms and resources for leasing forestreserves and p:oviding seedlings and technical extensionsupport. It w:l also be useful to examine more recentlyacquired RFD -uelwood supply data, especially the magnitude offuelwood a-ailable from existing private sources, inpreparation for the Phase II study which, among others, willreassess t=.e physical targets of the planting program proposedin this r:-port.
(b) Review the sociological aspects of a fuelwood supply,conservation and biomass substitution program. This wouldessentially be an assessment of people's awareness of thefuelwood supply problem and their attitude to participation ina government program to plant trees in and around homesteadsand in viLlage woodlots, and to use improved cooking stoves inlieu of the "normal" less efficient kinds. These sociologicalanalyses at the household and community levels are necessarybefore making any major investments because experience hasshown that centralized planning perspectives of what con-stitutes optimal solutions to the fuelwood "crisis" may notalways be in accord with the perceptions of target groups. Asnoted earlier, a substantial amount of information is alreadyavailable from experience with Bank projects and many socio-economic studies that have been done by CUSRI, NEA, PEA andother agencies. A fresh and more expert analysis of the datais probably of greater value than additional extensive fieldinterviews.
711 The Land Titling Project (Loan 2440-TH), Land Reform Areas Project(Loan 2198-TH), The Northern Agricultural Development Project(Crcdit-929-'TH) the Land Use Policy Component to the SAL I andSAL II loans, a World Bank research project on the impact of tenuresecurity on land productivity, and the proposed Rural Land UseProject are important sources of information on this particularsubject.

- 178 -
Implementing Phase I might require the input of an Energy PLanningEconomist, a Forester and Sociologist for a total of about nine man-months. The detailed terms of reference for the two Phase I studies needto be worked out with RTG at the time of reviewing the overalL energyassessment report.
8.52 Phase II would depend on a positive outcome to Phase I. Theresults of Phase I would be used to reassess the physical targets foreach program component to ensure that they are achievable, and todetermine the most feasible institutional mechanisms for carrying outeach component as well as the overall program. The exact roles of eachgovernment agency and the budgetary implications of such roles would beexamined in this phase. The Phase II work would also examine therelationship of each program component with similar activities under theproposed Rural Land Use Project, to ensure complimentarity and to explorewhether certain components could be carried out under that Project.
8.53 A tentative estimate of the cost of these two studies would beUS$150,000 for Phase I and US$250,000 for Phase II, assuming acombination of overseas and LocaL expertise.

- 179 -
IX. POTEMTIAL FOR AN ENERGY EPICIENCY INPROVEKENT PROCRMA
9.1 Although the sharp increase in oil prices since 1973 hasreduced Thailand's elasticity of commercial energy to GDP from 2.1 during1960-73 to 0.7 during 1973-83, the elasticity has shown signs of risingagain in the face of declining energy prices. This would imply thatenergy demand will pick up and grow more rapidly than it has in recentyears even though GDP is growing more slowly. If these trends continue,the future import of commercial fuels may indeed rise. As discussed inChapter 2, it is expected that increasing energy imports could cause arenewed balance of payments crisis in the mid- to late-1990s. Further,the burden of large public sector energy investment is causing severefinancial constraints.
9.2 It will be important to ensure that fuels are used moreefficiently to minimize the financial pressures over the next decade -- aprocess which should prove feasible, as Thailand is faced with the samepotential for improving energy efficiency as most developing countries.Some energy intensive industrial plants are consuming 20% to 30% moreenergy per unit of output than the best international practice, and some-onsume over twice as much. Some oil-using plants can be converted touse other fuels costing substantially less than the petroleum fuelequivalent. Most transport entities in Thailand could reduce consumptionper ton-km by 10-20% through low-cost improvements and by much more ifthe many problems with roads and vehicles were properly addressed. Somesavings might be obtained by improving electric power transmission anddistribution facilities. In rural areas improved fueLwood and charcoalstoves requiring only half as much wood as traditional stoves might beused.
9.3 Three energy consuming sectors stand out as offering the bestpotential for immediate reductions in consumption by increasing theefficiency of fuel use. The first is households, where the use oftraditional fuels such as fuelwood and charcoal can be reduced byimproving the efficiency of stoves and charcoal-making kilns. The twomajor users of commercial fuels -- the manufacturing and transportsectors -- have already demonstrated that substantial fuel can be saved,although most reductions have taken place by the private sectorrespondinc' co higher energy prices. There can be little doubt thatsubstnt-ial potential for further energy savings remains and could beachieved through stronger government actions in that sector. Thischapter briefly reviews the scope for increased energy efficiency and themajor options for accelerating its implementation.
Efficiency in Using Traditional Fuels
9.4 Despite the expect-ed rapid growth of commercial fuels for usein household cooking in rural areas, the sheer magnitude of currentdemand for fuelwood (in the form of both firewood and charcoal) makes itcertain that fuelwood will continue to be the predominant household fuel

- 180 -
in rural areas for at least the next 20 years. If present consumptiontrends continue, the total fuelwood-equivalent demand will increase toabout 53 million m3 by 2001, severely straining natural forestresources. Forestry programs outlined are not at a maximum expected toproduce more than an additional 21 millions m of fuelwood. Commercialenergy may be the only practical alternative, and it may be feasible onlyfor supplying part of the rural population. The most promising measuresfor reducing the level of demand relate to the improved charcoal kilnsand cooking stoves.
Charcoal Making
9.5 Of the total fuelwood consumption in 1983, about two-thirds or26 million m of it was used in the production of 3.7 million tons ocharcoal. This implies an energy loss equivalent to about 16 million mof wood (41% of the total fuelwood demand) as a consequence of thecharcoal-making process. Charcoal production is practiced in nearlyevery area with forest resources. Producers include households who makesmall quantities of charcoal for their own use, as well as larger scaleoperators who produce charcoal for commercial purposes. The southernregion, with its mangrove resources, appears to have the best establishedcommercial production systems, using large permanent kilns. Reflectingrelatively scarcer forest resources, charcoal in the North and Northeastis produced by smaller, more inefficient kilns which are movedperiodically.
9.6 The average kiln efficiency is difficult to estimate, as itdepends on the physical properties of the wood input, the kiln design andconstruction materials, and the specific operating method. A 1982 surveyby NEA made some limited field measurements and reported averagecharcoal-to-wood weight conversion ratios ranging from about 18Z for theearthmound type kilns to about 30% for the permanent (mud/clay) oven-typekilns. 72/ The implication is that with current charcoal productionmethods, about 20-30 kg of charcoal can be produced from 100 kg ofwood. In fact, 70-80 kg of wood are consumed in the process. 73/ There
72/ About 402 of commercial charcoal production is carried out in small(7-9 m3 ) oven-type mud/brick structures and the remainder in pit orearth mound types usually with even smaller capacity, at the villagelevel The earthmound type kilns predominate. The large (50-100 m ) oven type is used especially in the South region forcarbonizing mangrove, and the sawdust mound type is used mainly forsawmill wastes and para rubber wood residues. A few portable metalkilns--the so-called "Mark V" kilns of about 3-7 m3 capacity--arealso used in so-e parts of Thailand, introduced in the 1970s by theFAO for salvaging the residues of clearfelling operations.
73/ Considering that charcoal has nearly twice the energy content ofwood, the amount of wood wasted as a result of carbonization wouldonly be about 30-40 kg per 100 kg wood carbonized.

- 181 -
is clearly potential for introducing more efficient charcoal-makingtechniques and kiln designs.
9.7 Through a USAID-financed renewable energy project, KEA and RFDhave been engaged in evaluating and adapting to their conditions higherefficiency kilns including permanently situated systems (e.g., Brazilianbeehive, earth and rice-husk mounds) as well as portable metal kilns(drum type, Mark V kilns, etc.). Improvements in efficiency of up to 30-50Z have already been demonstrated in the RFD work. An aggressiveprogram for disseminating the improved designs by extension work would bejustified. One goal would be to educate the piivate sector, while at thesame time stimulating credit mechanisms and other incentives which mightbe combined with tighter government measures to prevent significantdeforrestation. In view of the predominance of small and highlyinefficient producers, priority should be given first to them. Thepotential fuelwood savings are substantial; for example, if only 10% of1983 charcoal production achieves an efficiency improvement of 25% overthe current ave:age (which appears possible), the implied wood savingswould be about 500,000 m , or roughly the sustainable yield of 200,000 haof natural forests.
9.8 The Rural Energy Report proposed that a program be establishedto have 25Z of charcoal production by the end of the century carried outin improved kilns. 74/ The kilns would have 25% higher efficiencies onaverage than present kilns, which could result in about 2.7 million m offuelwood savings. About 5,000 charcoal producers would be involvedproducing 370 tons a year. 75/
Household Cooking Stoves
9.9 Although the Thai bucket stove is a significant improvementover the three-stone stove of the past, further scope for improvement ispossible, for example, by narrowing the hot air exhaust gap, deepeningthe stove "seat", better lining and g-rte design, etc., NEA and RFD havedeveloped bucket stoves with 10% higher efficiency compared to currentlyavailable commercial stoves. As with kilns, the potential fuelwoodsavings from such improved stoves would be great. Replacing, forexample, 500,000 firewood stoves of 8% effisiency with improved versionsof 15% efficiency couLd save up to 500,000 m of fuelwood annually.
9.10 The Rural Energy Report has proposed a 15-year program to haveabout 10% of households using improved stoves. The program would provideincentives for the private sector to provide about 800,000 units ofimproved charcoal stoves and about 600,000 units of improved firewood
74/ The projected total charcoal demand by 2001 is 1.7 million tons.
75/ Because of the savings involved part of this shift to more efficientmethods will probably occur even without government intervention.

- 182 -
stoves, with assumed efficiency increases averaging 20%-30% for charcoalstoves and 8%-15% for firewgod stoves. The combined fuelwood savingswouLd be about 2.1 million m . Such a strategy involving both charcoalkilns and cooking stoves ?otentially could cut fuelwood demand in 2001 byas much as 4.8 million m . A seven-year demonstration and disseminationprogram for improved cooking stoves, jointly carried out by thegovernment and the private sector, would target 1 million households andis estimated by NEA to require a total capital investment of US$5.3million over a 15-year period. The assessment team's analyses show thatsuch a program would reduce energy demand by a half million tons of oilequivalent per year.
Industrial Energy Efficiency
9.11 With industrial growth averaging 11% per annum during 1960-1980, industry already accounts for 25% of the total energy consumed.Its share has continued to grow rapidly, and, in fact, its intensity isalso increasing. At the present time, industry is consuming over4,000,000 toe per year. The major industrial subsectors are food (30% ofsectoral CDP in 1982), textiles (26%), chemicals (15%), fabricated metals(11), and non-metallic minerals (6%). The consumption of energy differssomewhat because of substantial differences in energy intensities. Forexample, non-metallic minerals (cement, brick making and ceramics),textiles and food processing all have relatively high intensities andaccount for 83% of the total energy used in industry. The most widelyused form of energy is fuel oil -- accounting for about 48%, followed byelectricity (19%), gasoline (9%), and diesel (7%). In fact, half of thefuel oil and 70% of the electricity used by all sectors in the economywas recently consumed by industry. The cement industry by itself in 1982consumed about 25% of the country's total fuel oil. This industry'senergy consumption is projected to grow to more than 2.6 million toe peryear by the end of the century, of which approximately 60% could still bein the form of fuel oil. The potential both for changing the energy mixand for both using that energy more efficiently and substituting cheaperfuels in the cement industry is great. For example, if gas is cheaprelative to coal, its use could grow to 66 MMCFD by the end of thecentury supplemented by about 174,000 tons of coal annuaLly. However, ifgas remains expensive and coal becomes cheap, the fuel mix could be 15MMCFD plus 965,000 tons of coal. In terms of economic efficiency, if thecomparative relative prices used are their economic prices, then thecement industry would receive the correct signals and could adjustaccordingly (paras. 6.53-6.63).
9.12 Correct energy pricing to date has been the single mosteffective factor in both interfuel substitution and related energyefficiency improvement. The effectiveness, however, has been delayedbecause the real domestic price of the two most important industrialenergy inputs -- fuel oil and electricity -- did not increase signifi-cantly until after 1979. At that point, the increases had a substantitaleffect on energy consumption patterns. In 1979, oil-based products

- 183 -
provided the most energy used by the manufacturing sector. By 1982,after the price adjustments, non-oil energy inputs exceeded oil-basedinputs. A noticeable trend was the decline in the use of oil in allindustriaL subsectors, offset by a growth in the use of coal, lignite andfuelwood. Total energy intensity remained relatively constant despitethe fact that the energy intensity of oil fell by about one-third between1979 and 1982 (Table 9.1). This emphasizes the dynamic effects thatalready have taken place in Thailand as the result of higher oilprices. With increasing gas availability and cheaper imported coal theuse of fuel oil in cement, for example, has not only declined but isexpected to continue that decline over the near future.
9.13 One question concerns the effect on the overall intensity ofenergy use of the government's policy of supporting a slow shift towardsheavy industry while continuing priority for labor-intensive lightindustry and food processing. Heavy industries to be promoted during thenext five or six years include a fertilizer project and a petrochemicalindustry, both expected to use natural gas as a feedstock. The demandfor natural gas by these two industries by 1988 is projected to be 30MMCFD and 43 MMCFD, respectively. This, togther with the substitution ofnatural gas for fuel oil in the cement industry (of up to 60 MMCFD),would raise the demand for natural gas by the industrial sector to 133MMCFD by 1990. The total demand for natural gas by the industrial sectorwould raise its consumption level from 400,000 toe in 1986 to 1,350,000toe by 1991. This would represent 21% of the total end-use demand forenergy by the industrial sector.
9.14 In 1982, industry's use of electricity amounted to 665,000toe. Approximately 30% of this was used in heavy industry (mostlycement, iron and steel), 25Z was used in light industry, and 15X in foodprocessing. Growth in the demand for electricity is very much influencedby what happens in these three industrial subsectors. The latestprojections used by the assessment team show that the demand forelectricity in all of industry would rise to 1,240,000 toe in 1991 and2,170,000 toe in 2001, representing annual growth rates of 7.2Z during1982-91 and 4.7Z during 1990-2001.
9.15 The largest consumer of gasoline in the industrial sector isthe construction industry (28.31), followed by heavy industry -intermediate (24.2%), while the largest user of diesel is in mining(49.21). The demand for gasoline is expected to increase from 307,000toe in 1982 to 836,000 toe in 2001, representing an annual growth rate of5.4% per year. During the same period the demand for diesel would risefrom 230,000 toe to 608,000 toe, or at an annual growth rate of 5.2%.
9.16 The demand for fuel oil, on the other hand, could remain fairlystable during 1982-86 as a result of an increased use of natural gas bythe cement industry. However, there has been significant switching inthis industry to coal and lignite and to relatively small amounts of gasso far. Future consumption levels are very much linked to the relativeprices that can be expected for fuel oil, natural gas, lignite and coal.

- 184 -
The government's pricing policy for these products will be crucial indetermining demand by practically all industries.
9.17 Isolating the effects of substitution to cheaper fuelsseparately from other forms of efficiency improvements will requiredetailed analyses at the subsector level. Improvements in energyefficiency that have already occurred will have to be pinpointed todetermine where progress can still be achieved. In some cases wherethere is low substitution potential with electricity, electricityintensity might be used as a de facto indicator of potential improvementsin general energy efficiency. 76/
9.18 AnaLysis at a subsector level makes it clear that textiles,paper, chemicals, non-metallic minerals and fabricated metals havealready made progress in energy conservation, while food processing andwood products have relied on substitute fuels, and the basic metalssubsector increased its energy intensity. The non-metallic mineralssubsector has also made a major switch to substitute fuels.
9.19 The textile industry reduced both its total energy intensit-'and its electricity intensity by about 30% during 1979-82. Most of itwas attributable to process improvements. Further progress thereforeprobably would require substantial investment in new technology. Thepaper industry has already reduced total energy intensity by 361 duringthe same period and electricity intensity by 13%. Chemicals has reducedits energy intensity by 52%, and further improvement also probably willrequire substantial investment in new technology. Fabricated metalsalready reduced its overall energy intensity by 21%, and there may stillbe room for improvement.
9.20 Non-metalic minerals in this period moved quickly to substitutecheaper lignite and coal for fuel oil. The move to substitute cheaperfuels was mandated by the fact that in this industry, energy accounts for30% of production costs. Total energy intensity also decreased by 14%during this period, indicating that some significant operationalimprovements had been achieved. It is the view of the assessment team,however, that further reductions will oe possible, but only ifsubstantial investments are made in new technology.
76/ At the macro level, only small improvements in electricity intensityand h ice in process efficiency have -ken place. The energy tooutput io for electricity peaked in 1280 at 391 Ti BAHT and fellto 370 TJ BArT in 1982, or at an average of 3% p.a. Thisimprovement in efficiency (3% p.a.) appears to have been achievedthrough better operational procedures rather than investing inretrofitting or installing new energy efficient equipment.

- 185 -
Table 9.1: ENERGY INTENSITY a/
Distribution of
Consumption of OilManufacturing Sector 1976 1979 1982 and Electricity
(S)
TOTAL MANUFACTURING l1o
Electricity 0.38 0.38 0.37Oil and Electricity 1.88 1.74 1.32Total (Including other fuels) ... 2.48 2.45
FOOD 18
Electricity 0.21 0.25 0.25
Oil and Electricity 1.02 0.83 0.80
Total (Including other fuels) ... 2.92 3.95
TEXTILES 17Electricity 0.49 0.47 0.32Total (Oil and Electricity) 1.44 1.18 0.85
WOOD 1
Electricity 0.17 0.23 0.27
Total (Oil & Electricity) 1.03 1.13 0.72
PAPER 5
Electricity 0.50 0.46 0.40Total (Oil & Electricity) 2.53 2.23 1.52
CHEMICALS 8Electricity 0.30 0.26 0.18Total (Oil & Electricity) 1.26 1.38 0.65
NON-IETALS 31Electricity 0.87 0.88 0.77
Oil and Electricity 10.33 9.60 6.87
Total (including other fuels) ... 11.81 10.23
BASIC METALS 5Electricity 3.13 1.38 2.06
Total (Oil & Electricity) 5.73 3.89 4.16
FABRICATED METALS 2
Electricity 0.15 0.17 0.11
Total (Oil & Electricity) 0.52 0.27 0.21
OTHER 13
Electricity 0.75 1.17 0.93
Total (Oil and Electricity) 6.23 14.82 4.80
a/ Terrajoules per billion Baht of output (1972 prices).
Source: Mission estimates.

- 186 -
9.21 In food processing, cheaper indigenous fuels have substitutedfor imported oil products, whiLe it has not yet been possible to improveoverall energy intensity. It appears, therefore, that there may besubstantial scope for increasing efficiency. As a large energy user,this subsector is a priority target for retrofitting. For another area-- wood processing -- commercial energy intensity has fallen 36%,electricity intensity has actually risen, and the inference appears to bea move to cheaper fuels along with a deterioration in processefficiency. There may be some scope, therefore, for additionaloperational improvements.
9.22 Electricity intensity has increased in basic metals, whiletotal energy intensity remained relatively stable. This appears toindicate a move to a more expensive but more efficient form of energy(electricity) in the face of rising prices. Falling production during1982 combined with the continued use of old electric furnaces explainssome of the subsector's performance problems. Both its energyintensiveness and the growing use of energy per unit of output in thissubsector should give it priority in studying the effects of introducingmore modern technology.
Overall Investment Requirements
9.23 Energy efficiency achieved to date has probably been due to theeffects of substantial fuel switching by one industry -- cement -- andthe widespread use of low cost operational 'housekeeping' savings.Investment in retrofitting existing plants and instalLing new energyefficiency equipment has been limited. 77/ As Thailand's 45,000factories had an average age of 13.4 years in 1982, pre-oil crisisdesigns predominate. The potential for reLrofitting, therefore, stillappears significant. Studies sponsored by JICA and ADB found thatfurther energy savings from more efficient use of petroleum productscould be as much as 15-20%, while those for electricity could averagebetween 3-6% (Table 9.2). 78/
9.24 The ADB study extrapolated its results to estimate thepotential savings and required investments for the whole economy but notall the savings could be realized because of different penetration ratesin each sector (Table 9.3). The financial requirements for such aprogram were estimatec tc be about $690 million, plus another US$50
77/ Only 59 applications have been made for import duty exemption onenergy saving equipment, of which 41 were approvcd.
78/ The JICA study focused on technicaL efficiency while the ADB studyfocused on economic investment opportunities.

- 187,-
million for natural gas substitution. 79/ The funds would be used mainlyto retrofit existing equipment (USS185 million) and purchase new energyefficient equipment (US$505 million).
Government Activities to Date
9.25 The NEA has been the lead government agency in promotingefficiency and has carried out the work necessary to bring an industrialenergy efficiency program close to the implementation stage. NEA is aLsoundertaking a study on industrial efficiency incentives and disincentivesto assess the policy reforms required before starting an investmentphase. NEA is preparing to involve the private sector in implementationthrough the establishment of a joint government/private energy managementcenter to be known as the Energy Conservation Center for Thailand(ECCT). 80/ Lending by development banks for energy efficiency has beenvery limited; in 1983, the Industrial Finance Corporation of Thailand(IFCT) approved loans for energy efficiency projects amounting to onlyUS$2.8 million (out of total approved loans by that agency of US$70million).
Table 9.2: POTENTIAL FOR ENERGY SAVINGS:Average Savings as Percent of Total Energy Used, 1983
Petroleum Products ElectricitySector JICA ADB JICA ADB
Ceramic/Glass 12.2 9,44 1.5 3.4Paper 21.5 18.5 0.3 2.8Textile 10.2 14.9 5.3 10.9Metal 22.5 8.9 1.7 4.2Chemical/Plastic 11.1 19.1 4.4 3.1Food 15.0 16.P 3.1 2.9
Average 15.8 ... 2.5 5.5
Source: JICA Report on the study on Energy Conservation Project in the Kingdom ofThailand; Summary of Phase I January 1984, Japan International CooperationAgency; ADB s,udy "Industrial Energy Audits and Consprvation Program inThailand", October 1984.
79/ The ADB investment potential was based on a sample of 49 audits and19 feasibility studies.
80/ This would differ substantially from the Energy Conservation Centreset up within NEA.

- 188 -
Table 9.3: ENERGY SAVINGS POTENTIAL AND INVESTMENT REQUIREMENTSBY SUBSECTOR AND TYPE OF MEASURE
(1984 Dollars)
Total Energy Total Monetary TotalSubsector Savings Savings Investment
(million BOE) (million US dollars) (million US dollars)
I, Subsector a/Food and Beverage 0.7 21.0 50.8Textiles 0.888 26.64 24.8Wood 0.86 2.58 5.0Paper 0.151 4.53 6.9Chemicals 0.158 4.74 3.7Non-Metallic b/ 1.224 36.72 540.3Basic Metals 0.167 5.01 19.8Fabricated Metals 0.176 5.28 18.5Other Industry 0.539 16.17 16.3
Totals 4.089 122.67 686.1
I1, Type of Measure a/
Conservation
Housekeeping,Better Management 0.922 27.66 17.7
Process Improvement -S-ome New Equipment 2.415 72.45 164.69
New Equipment 0.752 22.56 503.8
Total 4.089 122.67 686.1
Ill. Fuel Substitution(Oil Displaced) cl 2.803 84.09 54.6
a/ This excludes the fuel substitution measures.b/ Includes cement.c/ This figure represents oil displaced and the value of the oil and are thus gross
savings which do not allow for the value of the gas substituted.
Note: World oil price is assumed to be USS30 per barrel.
Source: Asian Development Bank, op. cit.
Strategy for an Industrial Efficiency Program
9.26 Although NEA has been undertaking the necessary preliminarywork, the government has yet to formulate a strategy for acceleratingenergy efficiency in the industrial sector. What could have been donesince 1979 to promote conservation in the absence of such a program hasbeen largely realized through adjustments in energy prices, althoughthere has been some slippage since the November 1984 devaluation.
9.27 Increases in oil and electricity prices since 1979 haveresulted in the private sector undertaking substantial initiatives to useenergy more efficiently. But in addition to appropriate pricingpolicies, two other areas require government action to institute an

- 189 -
effective strategy. The first is to identify and eliminate fiscal andfinancial constraints to private sector adoption of higher efficiencymeasures. The second is to assist in making the private sector aware ofopportunities for cost saving measures (housekeeping, retrofitting andnew equipment). Publicly sponsored demonstration projects in selectedsubsectors would go a long way in removing private sector apprehensionsabout the commercial viability of investments to increase energyefficiency.
9.28 The need for additional government action was highlighted bythe ADB study which surveyed 349 factories and found that individualenterprises did not feel that energy efficiency was a high priorityissue. There would appear to be several key factors determining whethercompanies invest in energy conservation: (a) return on investment;(b) government support; and (c) availability of capital. The requiredpayback period for investments in energy efficiency improvement projectsis 3.7 years in Thailand and 4.5 years for capacity expansion projects.The lack of knowledge about investment opportunities and the lack oftechnical skills are very serious constraints to investment in energyconservation.
9.29 CreaLing a policy environment conducive to increasing energyefficiency investments requires providing selective fiscal incentives forinvesting in retrofitting and replacing inefficient plant. Fiscalincentives would signal to industry the government's commitment to theprogram. The experience in developed countries has shown accelerateddepreciation allowance to be very effective, but care should be takenthat these incentives are not made permanent.
9.30 The availability of financing is also required for energysaving projects which are in the national interest. With the generallysmall loan size and the large number of potential applicants, theinvolvement of the private banking sector in the financing of anyinvestment program will be essential. 81/ However, commercial banks lackthe expertise to evaluate the technical aspects of loans for efficiercyprojects. The expertise of IFCT should be built up to provide somesupport in this area.
9.31 The government also needs to facilitate importation of thelatest energy saving technology by streamlining import restrictions andminimizing bureaucratic procedures. More explicitly, the governmentshould ensure that:
(a) technically competent peopLe are obtained to advise industry onrequired retrofitting;
81/ Excluding the cement industry (average loan US$29 million), theaverage conservation loan would be in range of US$16,000 toUS$298,000.

- 190 -
(b) a system is created to help certify companies in the privatesector which have sufficient potential savings so that theirloan applications can be seriously considered; and
tc) finance from commercial banks is available in the suitable formto meet the needs of the industry.
Recommendations for Government Action
Short Term
9.32 The government's industrial energy efficiency program should bearticulated in sufficient detail to formulate an action program. Therole of the ECCT, IFCT, private banks, industry associations, andgovernment departments should be identified and coordinating mechanismsestablished. More specifically, NEA should concentrate on policydevelopment, while the ECCT, IFCT, and others should concentrate onimplementing policy. Specific measures to be undertaken in the shortterm are to:
(a) Start the process, in conjunction with the private sector, offormulating a retrofitting program and identifying promisingplant investments;
(b) Establish ECCT. Present proposals undercapitalize thecenter. More multilateral and bilateral aid should besought. The appointment of an experienced and well respectedThai CEO will be critical to the Cencer's success. Expatriatetechnical support may also be needed;
(c) Review the relationship between this new center and theexisting ECC in NEA. Also, review the demonstration programbeing carried out by ECC.
(d) The existing Energy Conservation Center within NEA should startto train private sector entrepreneurs in energy-auditing andenergy-saving techniques. These trained individuals would bethe catalysts for the investment program. Successful traineesshould be approved and be able to prepare industry's investmentapplications to commercial banks;

- 191 -
(e) NEA, in conjunction with NESDB and the Ministry of Finance,should develop fiscal and financial policies to encourageprivate sector investment in energy saving equipment. The
0 details of the policies would be defined after the ongoingstudy on industrial energy conservation incentives has beencompleted;
(f) NEA, in conjunction with IFCT, Ministry of Finance andcommercial banks, should prepare a timetable for implementinginvestments. IFCT should assist in developing theinstitutional and financial framework for implementinginvestments through the commercial banking system. Further,depending upon the government's progress in putting in placethe above policy and institutional set-up, a suitableconservation action plan should be designed and implemented;
(g) PEA, MEA, EGAT and PTT also need to be invoLved in energyconservation. They should be on the Board of the ECCT andprovide a substantial annual contribution to the ECCT.
Long Term
9.33 Measures to be undertaken in the longer term:
(a) NEA should monitor the operations of the ECCT to ensuretraining and technology transfer are achieved.
(b) NEA should install an industrial energy data base which shouldbe the basis for setting program targets and developingiidustrial energy policy;
(c) after completing the retrofitting phase of the program, theECCT activities should be redirected into other sectors such astransport, hotels, etc. where high returns and oil savingscould be achieved; and
(d) all market reinforcement incentives should be reviewedperiodicalLy.
Energy Efficiency in Transport
Introduction
9.34 With the transport sector consuming about 60% of petroleumproducts in 1983, it is important to evaluace how the sector has beenresponding to the increase in fuel prices in recent years and whetherfuel is beginning to be used more efficiently. The transport system isdominated by the road sector, whiich accounts for about 80% of total

- 192 -
freight ton-km and 90% of passenger kilometers. 82/ Road transport madeup about 95% of the total fuel used in the transport sector.
9.35 During the past 25 years, the road transport sector has grownrapidly. The highway network has been expanded from 17,000 km in 1963 to43,000 km in 1982, and rural roads have increased from 35,000 km in 1970to 106,000 km in 1982, giving Thailand a very high density of roadscompared with other LDCs. The country's motor vehicle fleet increasedfrom about 400,000 units in 1978 to over 1,000,000 units in 1982 -- anannual growth of 9% (including motorcycles, the growth was from 740,000units to 2,200,000 units). Commercial vehicles--buses, trucks and otherutility vehicles--account for at least 60% of four-wheel vehicles, withautomobiles making up the remainder. The average growth of vehicletraffic (excluding motorcycles) outside of urban areas was around 7% p.a.in the 1970s. Light trucks lead the growth with a rate of 15% p.a.,followed by light buses at 9%, heavy trucks 6%, car traffic 4%, and heavybuses at less than 3%. Traffic is forecast to grow in the range of 6-8%p.a. during the remainder of the 1980s, slightly ahead of GDP growth.
9.36 The Bangkok area accounts for about 80Z of total cars andtaxis, 70% of buses, and almost 30% of trucks. About 50% of motorizedtraffic (excluding motorcycles) on aLl non-urban roads is alsoconcentrated within a radius of 150 km from Bangkok, highlightingBangkok's leading role as the center for government, commerce, industryand transport.
9.37 The transportation sector dominates the consumption ofgasoline, diesel and jet fuel. Approximately 60.5% of end-use gasolineconsumption is used in the transport sector, with roughly 50% of this incommercial vehicles while the other 50% is used by private motorists.Jet fuel is by definition completely consumed in the transportationsector, while 74% of end-user diesel consumption is used in thetransportation sector.
9.38 In 1982, the transportation sector consumed 5,171,000 toe ofcommercial energy, or roughly 29% of total end-use gasolineconsumption. It is therefore a critical sector in terms of an energyconservation program. During the 1970s the consumption of gasoline,diesel and jet fuel in the transport sector grew at relatively highannual rates of 6.4%, 6.6% and 8.0%, respectively. The use of LPG waslow and remained fairly low throughout the 1970s. However, with thesecond oil shock in 1979/80 and tho distorted price structure of retailpetroleum products, the consumption of gasoline, which is mostly used inpassenger cars, passenger trucks, samlors, light trucks and motorcycles,declined consistently. Between 1979 and 1984 the consumption of gasolinein the transport sector fell by 2.7% per year, partly due to increasing
82/ 1981 figures, excluding urban traffic, which is predominantly byroad.

- 193 -
efficiency as a result of the higher oil price and partLy as a result ofsubstitution of LPG and diesel in certain types of vehicles.
9.39 There has been a substantial amount of substitution away fromgasoline over the last four or five years. Nearly all taxis in Bangkokand a very substantial proportion of samlors have converted to LPG.Light trucks, passenger trucks and passenger cars have also changed todiesel or LPC. Data on new diesel fueled passenger and light trucksclearly reveal this trend. In 1980 roughly 75% of the light or passengertrucks produced had gasoline engines, but the proportion declined to only6% in 1984. Approximately 94% of light and passenger trucks produced arenow diesel fueled.
9.40 The substitution resulted in a 90% per year increase in LPGconsumption in the transport sector during the period 1980-84. Theconsumption of diesel also rose relatively fast during the same period --at roughly 15.5% per annum.
Efficiency Through a Better Choice of Fuels
9.41 The most important factor in conservation concerns the changesthat have taken place in retail fueL prices. For the future, if thedistortions in consumption patterns that appear to be developing are tobe eliminated then prices must reflect current economic costs. Whileoverall price movements have been reasonably appropriate, the relativeprice of different transport fuels has been seriously distorted. Thus,while gasoline has been heavily taxed, diesel has been taxed lightly andLPG and kerosene essentially not taxed. 83/ These distortions have had asubstantial impact on fuel use, as evidenced by the rapid conversion ofautomobiles and other light vehicles from gasoline to LPG in Bangkok andother major urban areas since 1980. For new vehicles there has also beena shift from gasoline to diesel engines. In addition, diesel is beingadulterated by kerosene. These trends and their economic costs have beendiscussed in detail in Chapter VI.
9.42 The low retail price of LPG (propane and butane) relative togasoline has motivated the transport sector to use about 50% of LPGconsumption, requiring continued imports of LPG. The low retail price ofdiesel has resulted in a shortage of the fuel from domestic refineriesand a very rapid increase in imports. One answer which has been widelyproposed is a large expansion in secondary refinery facilities, whichwould be very costly. Another is to increase the use of gasoline throughbetter pricing relationships. A third is to use compressed natural gas(CNG: methane) as a partial solution and as a possible way of using moreof Thailand's natural gas in transport. As a replacement for gasoline ordiesel fuel, CNC may offer a higher value use of gas than when gas isused as a substitute for fuel oil, coal or lignite in power generation.
83/ Taxes net of oil fund contributions or receipts.

- 194 -
Efficiency
9.43 Transport operators and users can modify their behavior so asto reduce the energy used per passenger or ton kilometer. One approachis to shift traffic to more efficient types of vehicles, i.e., passengersfrom cars to buses and freight from smaller to larger trucks. Perhapsthe most striking example is that fuel use per passenger kilometer forcars is two or three times higher than fuel use for buses. Thus, whereascars account for only 30% of the passenger-kilometer in buses, the totalfuel consumption of cars is about 80% of that of buses. 84/ While thismight suggest substantial potential for fuel conservation, it is,however, notoriously difficult to shift existing passenger traffic out ofcars. More realistically, the emphasis should be on inhibiting futurepassengers from switching away from bus travel to private cars. Forfreight traffic some measures to encourage the use of large trucks havebeen proposed including the promotion of tractor-trailers over existingten-wheel trucks (although Bangkok port roads are not currently suitablefor such large vehicles) and developing freight centers to handle thelarger loads needed by larger trucks. However, in Thailand the truckingindustry is largely free from regulations that would inhibit the use oflarger freight vehicles and the amount of fuel that could realisticallybe saved may be small.
9.44 The other approach is to reduce fuel use in each class ofvehicle. A number of measures can have substantial fuel savings. 85/Promoting energy awareness in driving habits such as vehicle tuning andenforcement of speed limits has been found to have energy savings of upto 202. Introducing newer vehicles has significant fuel savingspotential. New automobiles are about 30% more fuel efficient and trucks10-20% more efficient than those of the early 1970s. Thus, measures toencourage the purchase of more efficient models, introduce technicalinspection of old vehicles to check fuel efficiency and encouragescrapping of older vehicles, where feasible, could lead to greater fuelefficiency. The Ministry of Industry can play a useful role inencouraging manufacturers to introduce fuel efficient models.
Government Transport Conservation Policies
9.45 The Cabinet has approved the Ministry of Communication's ActionPlan on Policy Measures for Energy Conservation in Road Transport, but noserious attempt has yet been made to implement it. The plan contains alarge variety of proposals, and a first step would be to identify those
84/ 1978 data.
85/ Intensifying fleet use by eliminating restrictions on commoncarriers in order to increase truck loads has increased fuelefficiencies 52 or more in some countries. However, the truckingindustry in Thailand is already largely unrestricted.
- 195 -
measures which have the greatest, most cost-effective energy savingspotential and to set prio-ities. The next step would be to define thecritical components of priority measures, establish which agency willimplement them and set implementation schedules, targets and proceduresfor monitoring implementation.
Traffic Congestion in Bangkok
9.46 The first, most important target for increasing fuel efficiencyis to reduce traffic congestion in Bangkok. Bangkok's traffic conditionsare among the worst in Asia and in recent years have been deterioratingsteadily. Severe congestion is the principal symptom, with high fuelconsumption resulting from very low traffic speeds. The economicbenefits, including energy savings from reducing congestion, areconsiderable. For ev.zaple, a 1982 study of the effect of the automatictraffic control system in a small part of Bangkok indicated substantialsavings in car and bus journey time resulting in fuel savings of up to20%. Also, the introduction of bus lanes increased speeds 10-20%,achieving comparable fuel savings without slowing car speeds. Thesemeasures were introduced at very Lo;: cost.
9.47 While low cost traffic engineering methods can be veryeffective when dealing with a given level of traffic demand, they wouldnot be sufficient to deal with potential growth in Bangkok traffic by theyear 2000. The population of the Bangkok metropolitan area is expectedto increase from 4.7 million in 1980 to about 10 million by 2000. Urbandevelopments are likely to increase employment and reduce residentialaccommodation in the central part of Bangkok, thus increasing the demandfor commuting even more than population growth. In addition, theownership of private vehicles in Bangkok, which had been growing by 9%per year during 1978-83, is likely to continue to grow rapidly and couldtriple the number of vehicles by 2000. Thus, long-term (and even medium-term) solutions require serious consideration of priorities forinvestment in transport facilities and their energy implications.
9.48 Urban transport problems worldwide have partially stemmed fromthe failure to consider energy implications in the course of attemptingto balance demand and supply for transport facilities as cities havegrown. The growth of city population and economic activity in manycities resulted in an even faster growth of transport demand in the innerpart of cities. The cost of supplying transport services to these areasof high land values with construction difficuLties rises disproportion-ately, eventually outstripping the government's ability to meet thecosts. In particular, the feasibility of continuing to build roads inthe central areas of Bangkok is questionable. Bangkok has grown muchmore rapidly than most other cities. Since its growth is occurring afterthe automobile and bus period, the case for rail mass transit is nolonger a financially attractive solution.
9.49 Although Bangkok's traffic situation is by no means unique, itis in serious difficulty. The system is unable to cope with existing
- 196 -
transport demands, let alone projected or latent growth. Travel speedswill continue to decline until certain trips are deferred or altogethercancelled as the cost of travel becomes too high. Indeed, this mayalready be occurring, since average car speeds are only 12 km/h and busspeeds 9 km/h during the heaviest travel hours in the central area of thecity. Furthermore, congestion has reached such high levels that no"peak hours" are discernible as heavy traffic spreads throughout most ofthe working day. Further evidence of the deteriorating situation is theprogressive spreading of acute congestion outward from the city as motorvehicle ownership increases.
9.50 Within Bangkok about 60% of person-trips on arterial streetsare carried by buses and minibuses, which constitute only 62 of thestream of passenger vehicles. In contrast, private cars, which compriseover half of the traffic stream, carry only one-fourth of ali person-trips. Public bus services are provided by BMTA, which carries about 3.8million passengers daily. 86/ About 20% of public transit trips areprovided by minibuses, both legally and illegally registered.
9.51 Transport problems in Bangkok are exacerbated by a highlyfragmented institutional structure, duplication and conflict overfunctions, insufficient coordination among the agencies concerned, and,in some cases, lack of suitably trained staff. There are approximately15 agencies concerned with providing urban transport infrastructure andservices in Bangkok. Lack of clarity and cooperation in interagencyroles is particularly acute in (i) traffic management and (b) multi-modaltransportation poLicy/planning/programming.
Past Traffic Policies and Programs
9.52 To date, the approach to dealing with the urban traffic problemhas been a combination of measures including:
(a) Construction. Road building, including the first stageexpressway (toll road), flyovers and river bridges;
(b) Traffic Engineering. Automotive traffic control in a smallpart of Bangkok, introduction of bus lanes and one way systemand reductions on parking on main roads; and
(c) Nationalization of private bus companies to form BMTA in 1976.
However, demand management measures such as the introduction of streetparking charges and cordon pricing schemes have not been undertaken.
86/ BMTA is severely under-capitalized, does not have a suitable farestructure for profitable operation, and has lacked suitablemanagement control over its operations.

- 197 -
9.53 In view of the severe urban transportation problems facingBangkok, and with it the tremendous cost in terms of energy consumption,a number of investment proposals have been considered by publicauthorities. Among these are to:
(a) expand the toll road system;
(b) establish a 50-km elevated mass transit system;
(c) elevate approximately 13 km of the rail system to minimizedisruption to the arterial road system;
(d) expand and modernize the BMTA bus fleet and maintenancefacilities;
(e) complete the middle and outer ring road system; and
(f) make extensions to the primary and secondary arterial roadsystem.
(g) develop a joint public/private vehicle maintenance program.
T-hese investments would total about US$2.0 billion, or about US$400 perresident to Bangkok, a very high level relative to the governmen:'sfiscal resources. An investment study is addressing this problem ofconflicting urban transportation investment priorities. 871
9.54 In the meantime, however, the government gave approval forconstruction of the Second Stage Expressway in March 1983. A budget ofBaht 12 billion was approved for Part I construction during 1985-91.Construction of the whole scheme wll take many years and will relievetraffic in only part of the city. Moreover, experiencp elsewhere hasshown that such a road will generate new volumes of traffic both onitself and on other roads and will create new congestion probLems ataccess/exit points (as evidenced by the First Stage Expressway). Thus,although the expressway will provide partial relief for a few years, itwill not provide a lasting solution by itself; therefore a comprehensivestrategy is needed.
An Urban Transport Strategy to Save Energy
9.55 A comprehensive energy savings strategy is needed to includeboth the supply of transport facilities and traffic demand managementmeasures. While there may be serious doubt about the priority ofbuilding more expressways, the projected growth of 250,000 people and100,000 motor vehicles each year in the metropolitan area will certainlyrequire some substantial investment.
87/ Metropolitan Bangkok Short-term Urban Transport Review Project,Halcrow Fox and Associates.

- 198 -
9.56 Traffic engineering measures such as traffic signalization, oneway systems, median barriers, right turn and bus bays, intersectionchannelization, on-street parking removal, street signing and marking,and street lighting are increasing vehicle capacity and improving safetyconditions. However, given the continued growth in Bangkok, thesemeasures will only marginally delay or reduce congestion levels.
9.57 In addition to improving the effectiveness of the urban roadnetwork, there is a need to greatly improve public transport facilities.A critical element is to ensure a more convenient and comfortable busservice. Publ:c transit must be made sufficiently efficient to attract ahigher percentage of riders than now; every effort should be made toavoid shifts from bus to less fuel efficient and congestion-inducingprivate transport (mainly automobiles and motorcycles). BMTA, as apublicly owned entity, has major problems and represents a significantfinancial drain on the government. At a minimum, high priority should begiven to stabilizing BMTA's financial condition by allowing for fareincreases and to assist BMTA in improving its bus fleet. Given thefailure to address the numerous problems facing BMTA up to now, there isa serious need to readdress the potential role of private transitoperators in providing public transit services.
9.58 However, as long as buses have to travel on the same congestedroads as other vehicles, they will offer little advantage over privatecars. Indeed, allowing for the time waiting for a bus and to walk fromthe house to bus stop, even private transport in Bangkok is faster. Thesolution is to segregate buses from other traffic, and a low-cost way ofdoing this is to provide bus lanes. Ccntrza-flow buses have proved verysuccessful but are limited to streets with one way traffic. With-flowbus lanes require effective policing, and this has proved difficult overa long period. An alternative would be to have separate bus-ways in themiddle of main roads with access at bus stops by overbridges, but this iscostly. In addition, proposals have been made for light and heavy masstransit rail systems, but these are also very capital intensive, and toextend them throughout the city could take as long as 20 years. Verycareful analysis would be needed before undertaking such largeinvestments. Corridors (e.g., Taksin and Phanon Yothin) which carrypassenger flows of up to 15,000 passengers per hour in one directioncould well be candidates for using light rail instead of busways.
9.59 Investment in roads and public transport will have to becomplemented with management of traffic demand to restrict the use of lowoccupancy vehicles. There can be no solution to the problem ofcongestion in Bangkok unless a majority of people traveling in thedensely built-up area use public transport, especially during peakhours. In Tokyo, only about 8X of peak-hour travellers to the citycenter can be accommodated by private transport, in New Yo:k 6%, London12%, and Paris 20%. The majority usz public transport, even though theypossess their own cars. The modal split is achieved by a combination ofincentives through the provision of public transport and disincentives tothe use of private (or low occupancy) vehicles.

- 199 -
9.60 In Bangkok, about 252 of travellers are currently carried bypri-ate vehicles; therefore, it will be critical for at least 75% of thegrowth in passenger journeys between now and 2000 to take place in publictransport. This will require substantial disincentives to private cars,particularly in view of the projected tripling of vehicle ownershipduring this period. Thus, although it has proved difficult in the pastto introduce adequate demand measures, there really is litcle option butto do so if Bangkok is to continue to meet its transport demand andcontinue its dynamic economic growth. The alternative is a growingtraffic paralysis with serious consequences for the economy.
9.61 In the final analysis, the only answer may be to enforcetraffic management measures which discourage the use of low-occupancyautomobiles such as removing on-street parking, more aggressiveenforcement of parking regulations, increased charges for parking spaces,closing central area streets to private traffic and, in the longer term,more Land-use controls. It is at best a partial solution. The mosteffective, quick action might be a cordon scheme to charge low occupancyvehicles for entering or using road space in the center of Bangkok.Given the political difficulties of introducing this, a public educationprogram to build support for such rigorous measures needs to beundertaken as soon as possible.

- 200 -
X. SIXTH PLAN INVESTMENTS PRIORITIES
10.1 The demand forecasts outlined in this report and the suppiyprograms suggested in the various chapters imply a substantial level ofinvestment will be needed to develop, produce and distribute energy inThailand over the coming years. With the exception of oil companyactivities in oil and gas, the Thai public energy enterprises have beenresponsible for the buLk of investments in the sector. A primary concernof the government is to determine how the level and composition of publicenergy investments for the Sixth Plan Period can be controlled andsupplemented by private sector support. Responsibility for energyinvestments recently has been shared among several agencies, namely, PTT,EGAT, MEA PEA, BCP and DED, as well as a number of joint companies suchas TORC. The Sixth Plan represents a major transition in that privatesector investment is being strongly encouraged. More effectiveincentives will be needed to expand resource exploration and developmentwhile improving the regulatory climate. The current energy strategyemphasizes minimizing public sector investment and operating cost levelsparticularly by maximizing the use of gas together with less capital-intensive technologies. In practice this has proven especially difficultbecause of uncertainties about the timing and amount of gas which mightbe available on the one hand, and the amount of alternative resourcesthat might be developed on the other. Uncertainties regarding the priceand availability of imported fuels also have complicated decision making.
10.2 The severe constraints on financing, both domestically andworldwide, have forced the government to reevaluate the role ofinvestment in the public sector. A number of options have been discussedfor redefining and focusing the role of PTT in both upstream anddownstream activities in oil and gas. The role of the public sector infuture refinery investments should be reassessed. Another suggestion hasbeen to promote lignite activities beyond electric power and co obtaincontributions of private equity for EGAT. Joint ventures are believed tobe a promising means of expanding private sector participation in oil andgas, and in lignite. It is difficult at this stage to determine how farthe privatization of investment in energy will go quantitatively, butthis process is likely to be a determining factor in the success of thegovernment's future energy strategy.
10.3 This chapter presents the current public sector investmentproposals of the individual energy agencies which will go into theformulation of the Sixth Plan. For convenience these proposals have beenassembled in the format of a program. Many of them are under reviewwithin the government, and a number of them have not yet even beenconsidered by NESDB as part of its budgetary review process. Theyrepresent a list of projects from which responsible public sectoragencies might eventually formulate their nrograms based ot nationalpriorities and resource availabilities. The energy program which needsto be assembled from this collection of public sector projects is at allstages of identification and preparation and still needs to be combined

- 201 -
with a detailed review of what is possible in the private sector. Thepublic sector projects and programs being discussed amount to US$5-6billion for the period 1987-91.
10.4 These large levels of public sector investment in energy are acontinuation of the experience of the last five years. The increasedcost of imported energy supplies and the discovery of new domestic gasresources has led to a rapid expansion in capital spending for the wholeenergy sector. This expansion in investment has been particularly rapidsince 1980, with the result that energy is now the single most importantsector for public spending, having increased its share of total publicexpenditure from 12.5% in 1977 to 22.1% by 1981 and a somewhat highershare since then. For the Fifth Plan Period, NESDB projected that theenergy sectar will have contributed about 26% of total gove.Lknentalspending, up from an average 18% during the Fourth Plan Period. Energysector capital spending weighs even more heavily in total publicinvestment; having reached a peak share of 31.9% in 1981, up from 13.5%in 1970 and 13.7% in 1977, it is anticipated to average 24% during theFifth Plan Period. Energy sector enterprises in recent years haveaccounted for more than 50% of state enterprise investment and areexpected to remain at about the same level during the Fifth PlanPericd. The power sector agencies have contributed the bulk of theseinvestments: during the Fourth and Fifth Plan periods ECAT accounted forabout 60Z of total public investment in the energy sector, MEA for 7-8%,and PEA for 15%.
10.5 In the past, much of this public sector capital investment,particularly in the power sector, has been heavily financed by foreignborrowing. In fact, foreign borrowing has been a key factor in thegovernment strategy in recent years to meet the growing energy demands ofthe Thai economy. As much as 65% of the financing required for thesector's investments has been obtained from external grants and loans.EGAT's average level of borrowing, both foreign and domestic, has runabout 70% over the period 1979-84. The government's current view appearsto be that such a high level of foreign borrowing should no longer bepermitted and that a higher share of capital should be obtained through acombination of private equity and -a higher internal generation of fundsfrom each individual enterprise.
10.6 A large part of PTT's investment was equally financed byforeign borrowing. PTT and its predecessor's share in public investmentwas insignificant until 1979 but it increased substantially when naturalgas reached about 18% of the capital expenditure of energy sectorenterprises during 1977-81. Since then, its investments have declinedand its share in public investment in energy is expected to be close to15Z during the Fifth Plan Period. PTT's investment level is expected todecline further during the Latter half of the 1980s to about 11% and evenfurther in the 1990s. This base case forecast, however, assumes alimited role for PTT in oil and gas development and processing (with amuch greater role by the private sector). Otherwise, its investmentscould be substantially higher and its share in the total could be 20% oreven higher during the 1990s.

- 202 -
Table 10.1: CAPITAL EXPENDITURES IN THE ENERGY SECTOR
AS A PERCENTAGE OF TOTAL INVESTMENT
FY FY FY 5th Plan 6th Plan
1982 1983 1984 1982-86 1987-91
Share in totalgross investment 10.1 8.5 7.9 8.2 n.a
Share in total
public investment 27.2 26.1 24.0 20.0 n.a.
Share in total state
enterprise investment 57.8 57.6 49.8 50.0 n.a.
Share in capital
expenditure of energy
sector agencies 100.0 100.0 100.0 100.0 100.0
EGAT 76.2 74.7 54.8 65.8 74.6MEA 4.0 4.2 4.8 4.2 0.7
PEA 16.4 12.1 15.6 15.5 5.4
PTT 3.4 9.0 24.8 14.5 11.3
After the expansion in power and gas development of the late 1970s and
early 1980s when public sector investment in energy reached its peak, the
share of energy enterprises in public investment has been declining from
about 27% in 1982 to about 23% in 1984, and it is anticipated to average
24% during the Fifth Plan Period. The share of public e.iergj investment
in total gross investment also has declined from about 10 in 1982 to
about 8% in 1984, with an average of about 8% over the Fifth Plan
Period. Both shares are anticipated to remain roughly constant or
decline slightly through the 1980s if the government's private sector
strategy proves successful.
Electricity Supply Program
10.7 Excluding the oil and gas program, energy investments have been
largely synonymous with the program for public eLectricity supply. The
preliminary program of electricity investments for the period 1967-91
amounts to B112,000 million (US$4,012 million). This compares to the
latest estimate of expenditures of B81,670 (US$3,267 million) for the
Fifth Plan period. After adjusting for inflation, the Sixth Plan period
expenditures would be somewhat lower than those of the Fifth Plan period.

- 203 -
Table 10.2: PROJECTED ELECTRICITYSECTOR INVESTMENT, 1987-1991
USS million
Power GenerationHydro 369Oil 62Lignite 870Gas CC 407Dual-fired 65Triple-fired 1,004
2.777
Transmission and Distribution
Transmission 495
MEA 465PEA 275
1,235
TOTAL 4,012
Source: Based on July 15, 1985 Summary of ESAT Investment
Plan, FORM ES-1.
10.8 The two largest projects in the electricity sector proposed forthe Sixth Plan are Mae Moh lignite-fired generating units totalling 900MW, and the Bang Pakong triple-fired generating units totalling 1,200 MW,with combined expenditures of about $965 million during this period.Furthermore, a start is being made on the Ao Phai triple-fired units (600MW each) which will require expenditures of about $485 million in thisperiod. The issues raised in Chapter 5 suggest a shift to less capitalintensive options may have to be considered in the second half of theSixth Plan period for implementation after the completion of the Mae Mohlignite plants 9 and 10 (para. 5.68). The analysis in this reportsuggests that this may be the anpropriate time to start with a plantdesigned solely on the basis of imported coal, e.g., at Ao Phai, on theassumption that additional gas might not be forthcoming. Both the BangPakong and Ao Phai Thermal expansions proposed by EGAT would have to burneither oil or gas and, in any case, later on would be fueled withimported coal. Designing for multi-fired capacity appears to be anexpensive approach to diversifying the supply of fuel. These pointsshould be reviewed again carefully before a final decision is reached.
10.9 The rural electrification program which had been so greatlyexpanded between 1977 and 1983, 88/ is approaching relative saturationnow that 50% of Thai villaoes have electricity. Only a modest expansiontherefore is projected to take place during the Sixth Plan period. In
88/ Over this period the number of villages electrified increased from1,570 to 4,674.

- 204 -
fact, PEA's program, which was about B15,800 million for the 1982-86period, is now projected at only B7,500 million for 1987-91.
Lignite Mining, Exploration and Development
10.10 The EGAT lignite mining program under way includes an expansionof production to 5 million tons by the end of 1987 and an increase to10.5 million tons during 1988-1991 to fuel Mae Moh units 8-10 which areto be installed during the 6th Five Year Plan period. EGAT estimatesthat their expenditures for this program would amount to nearly B16,200million (US$578 milLion). This would incorporate only $2 million forlignite exploration and development, an amount which the assessment teamconsiders too small.
Rural Energy
10.11 The essence of the rural energy program will be to improve thesupply arid efficiency of using traditional cooking fuels while at thesame time more effectively providing rural consumers with access tocommercial fuels other than just electricity at competitive and economicprices. Programs have been outlined to supply some 20 million cu.m. ofwood equivalent by the year 2000 through afforestation, conservation andbiomass substitution. This would still leave a net gap of about 16million cu.m. to be met by either overcutting or increasing the use ofmodern fuels. Affcrestation efforts envisaged in this program wouldinvolve: (a) establishing 450,000 ha of private fuelwood plantations;(b) treeplanting around homesteads by 2 million rural households; (c)converting 75,000 ha of state-owned forest land into intensively-managedgovernment plantations; and (d) increasing the proportion of total forestarea that will be economically accessible for fuelwood collection by2001, through, for example, building roads into mcre remote forestedareas to permit managed commercial exploitation of fuelwood to supplycharcoal.
10.12 Complementary actions on the demand side would involveimproving the efficiency of charcoal production through the use ofimproved kilns with 25% higher efficiencies than those presently inuse. Additional savings would be achieved by promoting wider use ofimproved household stoves. It is proposed that in 15 years about 10% ofhouseholds would use improved stoves. To achieve this a programdeploying about 800,000 units of improved charcoal stoves and about600,000 units of improved firewood stoves would be required.
10.13 The cost of this program for 1986-2001 has been estimated bythe World Bank's Rural Energy Assessment Report at $315.5 million, $240million of which would ultimately be for private sector plantations.Roughly $100 million would be scheduled for the 6th Five Year Plan

- 205 -
period, a significant share of which would probably be in the publicsector.
10.14 The program would be guided by RFD and, although it wouldrequire significant funds in the early years, it would rely heavily onprivate sector participation to minimize government investment and actualplanting work. About 85% of the totaL target area is planned to beplanted by the private sector; two-thirds of this area would be smnallfarmer's lots and one-third industrial-scale plantations.
Energy Efficiency Improvement
10.15 Energy efficiency improvement is currently being assessed byvarious government agencies in Thailand and a program to promoteconservation needs to be formulated. Three energy consuming sectorsstand out as having immediate potential for increased efficiency of fueluse. Besides households, where the efficiency of stoves and charcoalmaking kilns has already been discussed, the two major users ofcommerciaL fueLs -- manufacturing and transport -- demonstrate substan-tial opportunity for savings. Energy efficiency investments in industryhave taken the form of fuel switching by the cement industry and low costoperational 'housekeeping' improvements in some 50 industries.Investment in retrofitting existing plants and installing new energyefficiency equipment has been limited, although the potential isobviously significant. Studies sponsored by JICA ane ADB revealedpotential energy savings from more efficient use of petroleum products tobe about 15-20%, while those for electricity are estimated to averagebetween 3-6%. These studies have roughly estimated that an effectiveprogram would invoLve financial requirements of about $690 million, plusanother US$55 million for natural gas substitution for fuel oil. Thefunds would mainly be required for retrofitting existing equipment(US$185 million) and purchasing new energy efficient equipment (US$505million); the largest part of these expenditures would have to beundertaken by the private sector. An Energy Conservation Center is beingformed by NEA to review and possibly help implement these programs and tomake policy recommendations with regard to governmental incentives. Thisreport has incorporated a nominal figure of $25 million as the publicsector's expend.tures for this program.
PTT's Oil and Gas Program
10.16 PTT's investment program is devoted mostly to the developmentof natural gas and, to a lesser extent, oil. Projects under constructionor recently completed include a gas separation plant, LPC marketinginstallations, and a tie-in pipeline to supply gas from the Second UnionContract. The timing and magnitude of future projects are subject tosubstantial change resulting from the uncertainty in gas supplies.

- 206 -
Nevertheless, feasibility studies and other preparatory work need notwait until supply estimates and contracts are entirely confirmed.
10.17 The investment program (1982-86) that PTT presented to NESDB inlate 1982 has been revised downward, and investment outlays for mostprojects have been postponed for one or two years with respect toprevious plans (and could be delayed even more). Based in part on inputfrom PTT, a recent Bank mission made preliminary estimates of PTT'sinvestment program for the period 1987-1991 totalling some $500 milLion(excluding a contribution to TORC). Additional public sector investmentsin joint ventures, Banchak and TORC refineries, bring the total to about$900 million. This still represents a substantially scaled-down programfrom the one submitted to NESDB at the end of 1982, which totalled $2.8billion for the ten-year period 1982-1991. Based on the downwardrevision of gas production/consumption prospects, some projects areexpected to be shifted from the Fifth to the Sixth Plan period, andcertain projects are no longer included in the current investmentestimate. 89/ The PTT program includes the construction of a pipeline(with offshore compressor) from Texas Pacific to the Union Oil Erawanfield, and a second LPG plant with 150 MMCFD of capacity.
Table 10.3: PUBLIC SECTOR OIL AND GASPROJECTED INVESTMENTS, 1987-91
(in million USS)
PTT ProjectsLPG market and distribution 5
Pipeline from ESSO to Konkaen 20Pipeline from Texas Pacific to
Erawan (with offshore compressor) 303
Gas distribution pipeline (industrial markets) 42Petroleum exploration/development ,Block 5/27) 15
Petroleum products marketing 58
Second Gas Separation Plant (150 MMCFD) 60
503
Joint Venture Projects (proposed)Block S-l field exploration development (25S) 89Ethylene Cracking plant (49%) 21Fertilizer Plant (22%) 9Khorat Field exploration development (201) 50Bangchak Petroleum Company 45TORC refinery expansion 189
TOTAL 403
906
Source: PTT and World Bank Oil and Gas Mission estimates.
See Table 10.6 for details.
89/ Details of the earlier investment program have been presented inWorld Bank Report No. 4366-TH, August 31, 1983.

- 207 -
10.18 The Texas Pacific (TP) pipeline is expected to be postponeduntil the end of this decade to coincide with the delayed commencement ofTP's production. In relation to the Erawan/Southern ThaiLand pipeline,investment for an additional gas-fired power plant located at the EasternSeaboard is likely to be the least cost solution to meeting the needs ofthe South, and a gas-fired plant in Khanom is no longer in EGAT'sinvestment program. Consequently, a pipeline from Texas Pacific orUnion-Erawan to Khanom in Southern Thailand may not be justified duringthe 1980s and is not included in Table 10.3.
10.19 Except for the offshore compressor and investment related toEsso-Khorat field deveLopment, PTT's core investment program for gasdevelopment is expected to be essentially the same under the variousscenarios of gas supply presently considered. In projecting the gasproduction profile, the investment implications have been taken intoaccount. Under the low gas supply scenario, to avoid the investment foran offshore compressor which would only be required for a few years, gasproduction from the Gulf is projected to be limited to 500 MMCFD, whichis the free-flow capacity of the submarine trunk line. Similarly, underthe medium and high gas supply scenario, gas production from the Gulf isprojected to be limited to 700 MMCFD, which is the design capacity of theexisting submarine trunk line; this would minimize incremental gastransmission investment, which would be idle for most of the time.
10.20 In addition to the aforementioned pipeline from TP, otherfuture gas development investments are expected to include a second gasseparation plant, infrastructure relating to the Esso gas discovery,joint venture projects in an ethylene cracking plant and a fertilizerplant. As the margin between domestic demand for LPC and the localsupply from the first LPG plant and refineries is projected to grow, asecond LPG plant is being planned to replace the growing imports ofLPG. However, the optimal timing and sizing of the second LPG plant aredependent on the availability of Gulf gas since the gas from the Esso-Khorat field is high in methane and unsuitable for LPG recovery. Basedon the present estimate of Gulf gas production, it would reach a peakplateau of some 500 to 700 MMCFD during the next decade, thereafterdeclining rapidly to well below 350 MMCFD, which is the design capacityof the first gas separation plant. In effect, the maximum Gulf gasavailable for the second gas separation plant could vary between 150 to350 MMCFD, for a period of about 10 years. Because of the uncertainty ofgas supply at this stage, PTT would need to weigh the incrementalbenefits of a second gas plant sized at more than 150 MKCFD capacityagainst the incremental cost and risk of oversizing in the event of a Lowgas supply scenario. Preliminary analysis indicates that a second gasseparation plant at 150 MMCFD would be economic given the presentexpectations regarding gas supplies from the Gulf. Because of the needto ensure gas availability for the economic life of the LPG plant, PTTwill need to await the firm conclusion of the next offshore gas supl.'contract before awarding a contract for this LPC plant. To minimize therisk of oversizing, the Bank's oil and gas mission believes that PTT's

- 208 -
program should include a second gas separation plant at 150 MMCFD insteadof the 350 MMCFD initially considered by PTT.
10.21 Regarding investment relating to the Esso gas discovery, EGAThas planned to build a power plant (600MW) at the Esso field (Nam Phong)which could utilize an average of about 100 MMCFD of gas. However, thelocation of the proposed plant at the field should be carefully evaluatedagainst the alternative of locating it at the nearby city of Kon Kaen,which is the regionaL center for electricity distribution in northeasternThailand. Major power transmission lines run near Nam Phong and Kon Kaensuch that 600 MW of power could be tratsmitted at fairly low cost. Gastransmission through a short pipeline (40 km) to Kon Kaen would allow forthe possibility of diversified gas utilization which, in addition topower generation, could also cover other potential industrial uses. Thereserves at Nam Phong are uncertain and may be substantially mere thanprojected by DMR; there may be discoveries elsewhere in Western Khoratwhich could justify a sustained gas supply of perhaps 350-400 MMCFD inthe early 1990s. These higher levels of gas supply may eventuallyrequire the construction of a $160 million pipeline from Khorat to themajor power and gas 'onsumption centers in Greater Bangkok and theEastern Seaboard. On the basis of these higher production levels, PTTwould also need to invest an additional $100 million as its share of thefield investment cost. This field investment would in large part beself-financed out of production. As this higher level of gas supply hasbeen excluded from the base case, the investment has been omitted fromthe core PTT Investment Program.
10.22 In contrast to non-associated gas production, the prospects fordomestic oil and associated gas production have improved since thepreparation of the Fifth Plan. PTT has almost finalized plans for itsjoint venture with Shell in Sirikit, and most of its $89 millioninvestment requirements will be generated directly from earnings of theproject. If discoveries in the Sirikit area are high enough to grant thedevelopment of a second Sirikit, PTT investment could increase, perhapsby a further $300 million during 1992-2000 but this too would be largelyself-financed. In Light of the high liquids content of the gas in theShell Block S-1, PTT is investigating the feasibility of an LPG plant atthe Sirikit oil field. The assessment team's estimate of PTT's programcurrently excludes an LPG plant of 30 MMCFD capacity ($20 million) torecover LPG before supplying the dry gas to EGAT for power generation asthis plant will most probably be covered by the joint venture. Theavailability of gas has yet to be agreed with DMR.
10.23 PTT's investment program has been and is expected to continueto be dominated by infrastructure for gas transmission. However, asnoted above, PTT's role has been expanding to include direct participa-tion in oil/gas exploration and production. The current estimate forthis activity includes investment for minority shares in joint ventureoperations at Shell Block S-1 (25%) and Esso-Khorat field (20%). Inaddition, while it is too uncertain at this stage to be included in PTT'sinvestment estimate, it is possible that it wouLd participate in the

- 209 -
development of the TP field, perhaps up to 25X. Further, PTT iscurrently undertaking a seismic survey in Block 5/27 with the assiscanceof PetroCanada. Again, the timing and magnitude of PTT's futureinvestments in E&P activities is uncertain and would vary considerablyunder different oil/gas reserve scenarios. Realistically, the publicsector's core investment level in oil and gas has been indicated at amaximum of around $900 million. However, if the kind of success impliedin the high gas supply scenario materializes and/or there is asignificantly higher discovery rate at Sirikit, larger public sectorinvestments would be required -- perhaps up to an additional $500million.
Private Sector Investment in Oil and Gas
10.24 For petroleum exploration and development activities, thegovernment strategy has been to rely mainly on international oilcompanies (IOC's). To date, private sector investment has amounted tomore than $1 billion. The World Bank has prepared estimates ofadditional IOC investment based on varying oil/gas supply scenarios forthe next two decades, as follows:
Table 10.4: REQUIRED PRIVATE SECTOR INVESTMENT IN OIL AND GAS(In S billion, 1986-2000)
Oil/Gas Supply Scenarios Exploration Development Total
Low supply 0.1 2.0 2.1Medium supply 0.4 3.0 3.4High supply 0.9 5.0 5.9
These scenarios are based on estimates of geological prospects usingplausible assumptions about the timing of exploration, development andcontracting of supplies.
10.25 As indicated in Table 10.4, additional private sectorinvestment amounting to some $2 billion is expected to be required undera low oil/gas suppLy scenario. Substantially more investment over alonger period of time is expected to be reqtired for achieving higherlevels of oil/gas supply, amounting to some $3.5 billion and $6 billionunder the respective scenarios of medium and high oil/gas supply.Clearly, the timing and magnitude of the investment are closely relatedto oil/gas reserves and government policy towards IOC's participationwhich, as discussed above, are the major issues in the petroleumsector. While the estimates of future investments are subject toconsiderable uncertainty at this stage, it is nevertheless quite clear
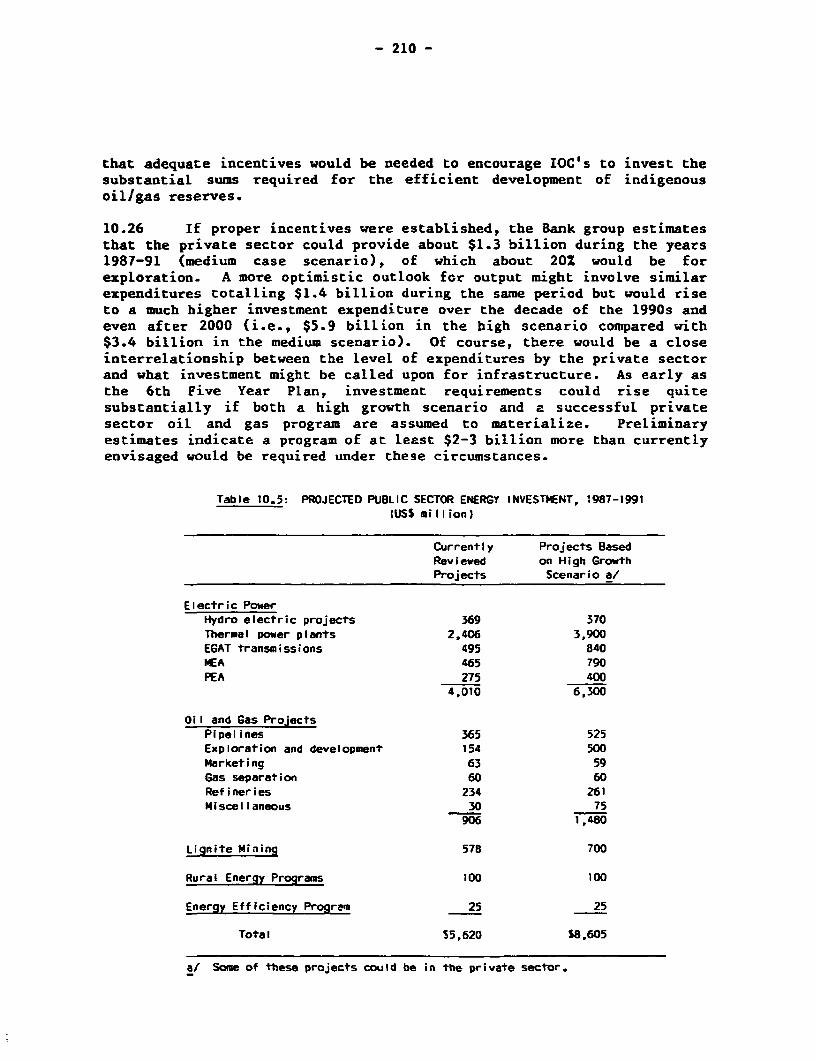
- 210 -
that adequate incentives wouLd be needed to encourage IOC's to invest thesubstantial sums required for the efficient development of indigenousoil/gas reserves.
10.26 If proper incentives were established, the Bank group estimatesthat the private sector could provide about $1.3 billion during the years1987-91 (medium case scenario), of which about 20Z would be forexploration. A more optimistic outlook for output might involve similarexpenditures totalling $1.4 billion during the same period but would riseto a much higher investment expenditure over the decade of the 1990s andeven after 2000 (i.e., $5.9 billion in the high scenario compared with$3.4 billion in the medium scenario). Of course, there would be a closeinterrelationship between the level of expenditures by the private sectorand what investment might be called upon for infrastructure. As early asthe 6th Five Year Plan, investment requirements could rise quitesubstantially if both a high growth scenario and a successful privatesector oil and gas program are assumed to materialize. Preliminaryestimates indicate a program of at least $2-3 billion more than currentlyenvisaged would be required under these circumstances.
Table 10.5: PROJECTED PUBLIC SECTOR ENERGY INVESTMENT, 1987-1991(USS million)
Currently Projects BasedReviewed on High GrowthProjects Scenario a/
Electric PowerHydro electric projects 369 370Thermal power plants 2,406 3,900EGAT transmissions 495 840MEA 465 790PEA 275 400
4,010 6,300
Oil and Gas ProjectsPipelines 365 525Exploration and development 154 500Marketing 63 59Gas separation 60 60Refineries 234 261Miscellaneous 30 75
906 1,480
Lignite Mining 578 700
Rural Energy Programs 100 100
Energy Efficiency Program 25 25
Total 55,620 58,605
a! Some of these projects could be in the private sector.

- 211 -
10.27 A significant part of the increase would be the result of aneed for an additional 1,500 MW due to higher demand for electricity.However, more gas transmission pipeline capicity and significantlygreater activity in the exploration and development of oil, gas andlignite would also be needed. If increased programs in infrastructurerelated to high growth are justified in the context of a more successfulprivate sector effort and higher growth prospects there should be apotential for increasing private equity participation.

- 212 -
Table 10.6: PUBLIC SECTOR ENERGY INVESTMENTS, 1987-1991(USS million) a/
Total ApproximateProject Program
Cost 1987-91Power Projects
Hydro generationCh1ew Larn 1-3 182 44Srinagarind 5 33 36Nam Chon 1, 2 350 246Kraeng Krung 1, 2 87 43
Hydro Sub-total 652 369The rma I generation'-cond Power Plant Barge 82 62Mae Moh 8 380 293Mae Moh 9 380 286Naui Phong CC 22' 221Mae Moh 10 290 290Bang Pakong 3 654 553Main Phong 2 186 186Bang Pakong 4 512 262Krabi 2 236 65Ao Phai 1 922 189Ao Phai 2 584 -
Thermal Sub-total 4,448 2 407Power Generation 5,099 2,736Transmission 495 495MEA Distribution 465 465PEA 275 275Total Power 6_334 4,011
Lignite Mining - Exploration & Development 600 578PTT Oil and Gas
Ongoing ProjectsGas separation plant No. I -- __LPG market and distribution 100 5Pipeline from Union (Block 10) 53 --
Proposed ProjectsPipeline from ESSO to Kon Kaen 20 20Pipeline from Texas Pacific to
Erawan (with offshore compressor) 303 303Gas distribution pipeline
(Poochaosming Pral & Bang Pleeindustrial markets) 4. 42
Petroleum exploration/development(Block 5/27) 20 15
Petroleum Products Marketing 116 58LPG Plant (30 P4CFD) at SirikitSecond Gas Separation Plant C150 MMCFD1 60 60Joint Venture Projects (proposed) d/Block S-l field exploration
development (2511 202 89Ethylene Cracking planrt (495) 44 21Fertilizer Plant (221) 19 9Knorat field exploration
d6velopment (201) 97 50Bargchak Petroleum Company 45 45TORC refinery expansion 189 169Total PTT Oil and Gas 1.12? 906
Rural Energy Program 316 100Energy Efficiency Program b/ 690 225
TOTAL PUBLIC SECTOR 9,061 5,620
a! All Drices are expressea .n current dollars. All EGAT figures include interest dur;ngconstruct on.
b/ Mostly in the priv3te sector. For purposes of allocation 525 million assumedncminaily :n DUO&;c SeCror.
Source: Basc on ore mirary est-nares i,a ao e ,n Marcn-%oril 1985. FGAT project
estimnates as of _uty 5, 985.

- 213 -
Table 10.7: PTT INVESTMENT PROGRAM (1985-1991) a/
(in Million USS Current Prices)
1985 1986 1957 1988 1989 1990 1991
Ongoing Projects
Gas separation plant 64 -- -- -- -- -- --
LPG market and distribution 40 35 5 -- __ __ __
Pipeline from Union (Block 10) 6 7 -- -- -- -- --
Subtotal 110 42 5 0 0 0 0
Proposed ProjectsPipeline from ESSO to Khon Kaen -- -- 4 10 6 -- --
Pipeline from Texas Pacific toErawan (with offshore compressor) -- -- -- -- 56 150 97
Gas distribution pipeline(Poochaosming Prai & Bangplee - industrial markets) -- -- 12 25 5 -- --
Petroleum exploration/develop-ment (Block 5/27) -- -- 5 -- 10 -- --
Petroleum products marketing 8 10 13 15 10 10 10
Se-ond gas separation plant0150 MMCFD) -- -- 12 3C 18 -- --
Joint Venture Projects (proposed)
Block S-1 field exploration &
development (25S) 69 44 34 34 21 __ __
Ethylene cracking plant (49%) 2 21 21 -- --
Fertilizer plant (22%) 4 6 3 6 -- __ __
Khorat field explorationdevelopment (20%) -- -- -- 13 13 12 12
Bangchak Petroleum Company 36 9 -- -- -- --
TORC refinery expansion a/ -- --
TOTAL 229 132 109 133 139 172 119
a/ Excludes interest during construction.
b/ Assumed to be project financed and PTT's contribution to equity expected to be negligible.According to current plins, the TORC expansion would be built during four years (1986-1989) at acost of about S700 million. PTT might assume 20% of commercial credits. Accordingly, its financial
responsibility would amount to about S140 million as follows: (A recent estimate of TORC was S189million.)
1986 1987 1988 1989 Total
28 42 42 28 140
Source: Based on World Bank Oil and Gas Mission estimates prepared in April 1985.

- 214 -
TebI. 10.61 SIRNV oF SAT IHWSIWNT PLAN at, 91117.-91
Ion? le" 1960 t19 11 393N. now rI, 69t NL "a" a. %I MLt .. IgIht N, 666?
0.lptl.. ns Total S Tote. t IS Tot NI TPtal I Tot.rI MS Tori
ry,u _ 43710 Prelact.
C01_ L- ProJAct UIbti 1. 2. 3 IN0 MD 44.2 1.23.3 - - - - -- - -,2 3,R2,R;aN Yes *rR lt sue 614j.t
1t..q 6Amg 80 0? - - - 6L 11714 36.! 4911_7 7loj 977,1 42.9 3,00.7
Ab. rWtw Ionlt 1, 2 IU pat_t. C% twit - cum amo 7.7 2.e..4 II.: 17?.0 -4.1 3,9131 15.7 2,043.1 19,1 7.72,1. 249.0 9 .2
Sol&IIrIf,oj.ct 446 a - - -- -- ------
Sl.w"prls Sed l'4. 1.19 5 [Isc WI) 4.6 '79.0 20.6 ,.1 30.6 731.4 -- n I,O o.ftwfl,9l-of 91IfrRwt..eDA - - - - -- -----
SUB 7r AL Uyewlctrlc ProJct. 4.3 332.5 W2,1 1,45M. 70.6 1.W7.4 so,. 2515,-0 60,7 1 .. )l. 9, tre.1372.1
Tft-.... P., Plow Proj_cts
0A PhaI TmRqI 11.1t 3 4600 aW - - - - - - 26.0 ,M I *n,1 4.4I1,0 1R6.9 1,300.0
AO Pe31I moIAI 3.1t 2 1600 aW - - - - - - -- - - - - -
A.Prgl Th.raimnitjiinbM - - - - - --
A. P_Il T1l. l 1. 14 (600Mo36 - - - - - - - - .~ - - -
q PSkiW 7hr_I Omit 3 1600M) 15.5 477.0 Iot 1,046.0 146,3 a. 10t. 177,60 35.4,7 1 s9.6 4,12,7 -997. I%.4 77Pw' Q Pa. TIWAI 1cIt 6*600 M) - - 72_ 620.0 795 7,92, 14S.1 4,579.2 262.0 1.'11.2
CC.InIrSId Unilt I IBM NI _ _ _ _ _ -- _ _ _ _
cc.lI ,rFsun't1 oo, -_ _ _ _ - _ _ t- _ _ _ _
Gsl Fre,d Unit 3 C60o _Mt ____
Erbl Th7m- I n2 UR31 I t 1130 - - - - - - 7-1 Ill.. 9,0 1.5"0,D 44.6 I ,ROR.0KroabITh lIUni W - -t 2 - .1M)- - - - - -
"6be Th-b . I (2) wt ,I 1 M) -
fT_I-1 U.17l30 -M I - - - -r0 Th_Al U1it O ailO Wa s0.6 2.513,3 10 .6 3o041.? 04.6 2497 - - - - 297.3 .217.7N TOak Iral 1.1 19 (5_0 Me 9.S 560.0 71.a 2.004.4 101.1 2,67I.9 94.? 7,R41.6 - - 20.3 6..064.4Nar n ThPAl AlIt 30 43001 r) 19.3 S50.0 73.7 2,001.) 03.9 T.?7.' 36.3 2,4313. 30.3 , 14,1 214.7 M,19n.0Nl PIli Ce01lu Cyci. 9, I00 a1 4.5 121.1 37.9 1.061.4 125.11 S. 1gm.- an,6 1,143,5 132.4 146.5 271.6 6.177.6_b cing Cflh ed Ccl-. 2 (3m0 Wi - - I.0 33.6 39 300.3 4'' 19.9 1,600.4 '35.9 i.3Q,6
P^_ Pl _,Ig. 94.5 .0 1 33. 9 1 3 4.3 _ _ - _ - - (2.3 .117
3So TOTAt Th-rAI PAr Proeb,ts 9.35 3,5317.6 432. 11.731.I 1S64 16434.7 W0.5 14.909,3 ft3,0 16,764.6 7.4m.3 4?,377.7
SUB TOAL T .1I,PoJon 36.3 3.373,7 11. 7248.4 6.6 31.0 1.4 9.5 2,797.7 I (.4 3.91.?7 4"9.2
01nI,I, PrOIln
N_ NAh NI. StIsg. P4 (r I. _k 03r, 6 a 71 4.5 1,1.6 36.6 3,029.4 - - - - 3O3.6 7,207.0
-Is lNo. NI. sT$ 3. 5 Irr _6 ",a m, 01 32.6 392. .939.2 113.0 5,223.0 I,0 X 4.75 3,55 l, 354.9 9.,1
1_' -I- stow 6 I F_ _ *a r 6. £10 - - - 5.6 363.3 36.0 50,2 I ,n?7 1o,4 2.613.0 32,3 591,5
SO3 TOTAL LlgIltw NIeleg PjscP. 70 9 2,352.3 356,7 2.,0.s 320.6 3.34. 12S.0 s,sn,* 3 .o. a., 11 -,73. 3 6A,3 65s
Nrss 1sAPAO. Pa.-? Ad It11 23.4 660.0 71.4 600.0 21,4 60.0 23.4 8nn,1_1 23.4 MOO. Ino, I %,000,0
l .. -E_an 7.O 20.c0 1.1 2C0.0 7.1 200.0 T,1 no0,o 7,3 2o.n 5.1 I.00eo.0
SUB Tra. HIM. VrJrs 211.5 eao.o u.5 soo 1.1 inoo.o 27.5 a100.0 27.5 3eeo,0 342.4 4.neD.n
GRAN lOTAL 416.7 .168,4 41. 19.273T.3 905.2 2q,221.3 641.3 23.723.2 3,3003. 31,G1,61.1 3.603.9 11.7,.1
oS Pro.4 PI" - 57T Sly"". Plasm0
OSwt?_ - 4,? 33, I'M. P,t*, .33s f lonp913 l. ,pI -PI,I,. ta. an -I-. 0 ltm 4l
conrnc.3.l

Annlew I
ENERtGY ALANCE IN ORIOINAL UiNITS, 19hl
Primary Energy Secondary Enerey
Traditional Fuel Non-Traditional Fuel Petroleum Products
Fugilood Bagesse Residue Hydro Crude Oil Gas Lignite Coal Charcoal Electricity LPG Gasoline Jet Fuel Kerosene Olesel Fuel oll litume
Gross supply 30723.4 5524.6 1610.3 3659.6 9503.4 56731.8 1997.0 129.2 - 675.6 602.5 - 65.8 117.6 1251.3 1066.6 -
Production 30723.4 5524.8 1610.3 3659.8 847.5 56731.8 1997.0 -
l.rorts - - - - 8655.9 - - 129.2 - 675.6 602.5 - 68.1 117.8 1251.3 068ose
Conversion:Petroleum Refining - (9125.3) - - - - - 228.0 2062.8 1069.6 423.3 3062.3 2160.i 128.3
Charcoal Production (24284.01 - - - 3642.6 - - - - - - - -
Elec. Power Generation - - - (3659.8) - (54452.4) 11573.41 - 18856.6 - - - (40,61 (1832.1)-
Converson Losses - - - - (37t.1) - - - - - - _ _ _ _
Poeor T & 0 Losses - - - - - - - - (2625.9) - - - - - -
Non-energy use - _- - (126.3) "
Statistical Difference - - - - - 955.2 - - - 25.1 - 3,9 6.1 3.1 98.7 135.1
Final Consumption 6439.4 5524.6 1610.3 - - 1324.2 423.6 129.2 3642.6 16931.4 630.7 2066.7 1142.5 538.0 4361.5 1532.4
Agriculture - - - - - - - - - 115.7 - 57.6 - - 419.4 - -
FIshery - - - - - - - - - - 12.2 - - - 732.9 - -
Industry 465.6 5524.6 468.9 - - 1324.3 423.6 129.2 86.5 8013.5 113.1 15.2 - 51,6 401.4 1270,61
Transport - - - - - - - - - 101.6 372.5 1691.6 1142.5 184.9 2784.1 182.2
Residential 5953.1 - 1141.4 - - - - - 3554.1 4167.8 247.9 - - 321.3 - -
Cercial/Govt. - - 4512.6 65.0 102.3 - - 23,7 79.4
Unlts: Fuelwood, bagasse, Agr. Residues, Lignite, Coal, Charcoal Thousand tons
Hydro end Electricity Oih
Crude Oil and Petroleum Products MliIon lItersNatural Gas million cubic eters ImelcI
Note: See the attached documentation for ources and explanation.Parentheses indicate outflows.

ENERGY IALANCE. 1963l'000 TOE)
Prl_rv Earcwqv secondary EneroyTraditional Fuel Non-Traditlonal Fuel Petroleum Products
ruelnoad Eaoss0e Residue Hydro Crude Oil Gas Llsnifs Coal Chercoel Electriclty LPJ Gasoline Jet Fuel terosene 0lesel Fuel Oil Ritumen totol Line 'otal
Gross Supply 10S41.2 120S.0 526.9 936,1 8566.4 1401.6 469.5 76.0 - 67.0 676.7 - 'S.' 107.2 1149.6 1t79.4 - 27S7.0 266s4.9
Production 10541.2 1205.0 526.9 96S.1 763.9 1401.8 49.6 - - - - - - - 13963.4
Imports *- *- *- *- 1601.6 - - 16.0 - S7.0 375.7 - 7.1 107.7 m1149.6 iln?4 - 2737.0 1n671.5
Conversions:
Petrolem Relininq- 1*130.4 - - 1-2.1 1695.3 0 6.7 'Ai. 1 2R04.1 7041.s 123.J 413M.5 n.0
Charcoal Production t2499.61 -- 2499.6 - - -- -- -- -- - - - n.o
Elec. Pcuer GOneretion - - - (93S.11 - 1319.S1 (366.71 -446 7 - - 137.111(764.91 - IAn2M51 0o.n
Conversion Losses (6632.21 -- -- - (43.0) -- - _ _ 12474.91 __ _ _. _ _ - (9142.11
Power T 4 D Loss*% -- _ _ _ - _ _ _ _ 221.41 - - - - - - - (221.41
Mon-Energy Use --- _ _ _ 1123.61 (123.63 (12S.61
Stestical Oiffmrnce - . _ - - 23.6 -- - - 2.1 - 3.2 * 2 2.6 90.7 130.1 - (216.11 190.4
Final Consumption 2209.4 1205.0 '26.9 2- 327 1053. 76.0 2499.6 1427.3 617.R 1701.6 9656. 469.S 4006.9 1476.2 - t157.S 17236.2
Agrlcultur -- -- - - - - 9- . - 4.4 M - 3 - - 432.7 442.6
Flshery -- -- .. - - - - - - 7.6 - -- - 673.3 - - 641.9 6en.9
Industry 166.6 1205.0 153.4 - - 32.7 10S.e 76.0 60.4 67S.) 70.6 12.S - 21.9 ' W4.9 1224.2 - 170S.0 4171.4
Trnnsprt -- - -- - 6.6 232.1 1557.4 Q656. 1641.2 M7 .7 17$.5 - 656.6 5 665.1
Residentlal 2042.6 - 373.5 - - 2439.2 '3.0 154.s - - 255.4 - - 446.9 6.4
Cinrcll/Govt. -- -- -- - - - - 3S0.4 53.0 04.7 - 71 . 756 - 235. 515.9
Motel Parentheses Indicate outIlows.

- 217 -
Annex 3Page I of &
EXTENSION OF THE SIAM2 MODEL
The model is a multisector general equiLibrium model whichdistinguishes 17 types of energy. There are also 27 types of productionactivities; 11 energy activities end 16 non-energy activities.
The 17 types of energy are:
1. Premium gasoline 9. Natural gas2. Regular gasoline 10. Crude oil3. DieseL 11. Condensation4. LPC 12. Electricity5. Fuel oil 13. Charcoal6. Kerosene 14. Fuelwood7. Jet fuel 15. Coal and ligniceB. Other petroleum products 16. Bagasse
17. Other energy
The model defines 27 types of activities in energy, agriculture,industry, transportacion and services, as follows:
I. Energy
1.1 Petroleum refining which produces gasolines, diesel,EPC, fuel oil, kerosene, and other petroleum products.
1.2 gatarel gas which produces natural gas and condensate.
1.3 Crude Oil
1.4 Electricity. Five types of electricity generacion aredistinguished:
HydroCoal & lignite firedNatural gas firedFuel oil firedOther methods (e.g. diesel)
1.5 Coal & lignite1.6 Hydro1.7 Charcoal1.8 Fuel Hood1.9 Paddy husk1.10 Bagasse1.11 Other energy

- 218 -
Annex 3Page 2 or 4
2. Agriculture
2.1 Rice and paddy2.2 Sugar and sugarcane2.3 Fishery2.4 Other agricuLture (other crops, forestry, livestock)
3. IndustrS
3.1 Mining and quarrying3.2 Food processing3.3 Light industry3.4 Chemical and rubber products3.5 Fertilizer3.6 Heavy industry - intermediate products3.7 Heavy industry - machineries3.8 Construction
4. Transportation
4.1 Transportation and communication
5. Services
5.1 Trade5.2 Market services5.3 Non-market services
The data base used includes the 1982 Input-Output Table. thesocio-economic survey (1980/81), Labor force surveys, and national incomeaccounts data. The 1982 I-0 Table was specially built for this purposeand has disaggregated the energy sector as described above. Althoughcertain parts of the cable are simply updated from the 1980 I-0 Table,the energy sector sub-component relies on recent surveys on energy use inthe various sectors.
Substitution between different types of energv
Four types of substitutions among different types of energy areallowed in the model:
(a) Charcoal, fuelvood. electricity, LPG-already discussed.
(b) Electricity, kerosene - as already discussed.
(c) Natural, gas, fuel oil, coal. This is undertaken byadjusting coefficien s of the Input-Output table.
(d) Casoline. diesel, LPCG for transportation. Elasticitiesof substitution used are:
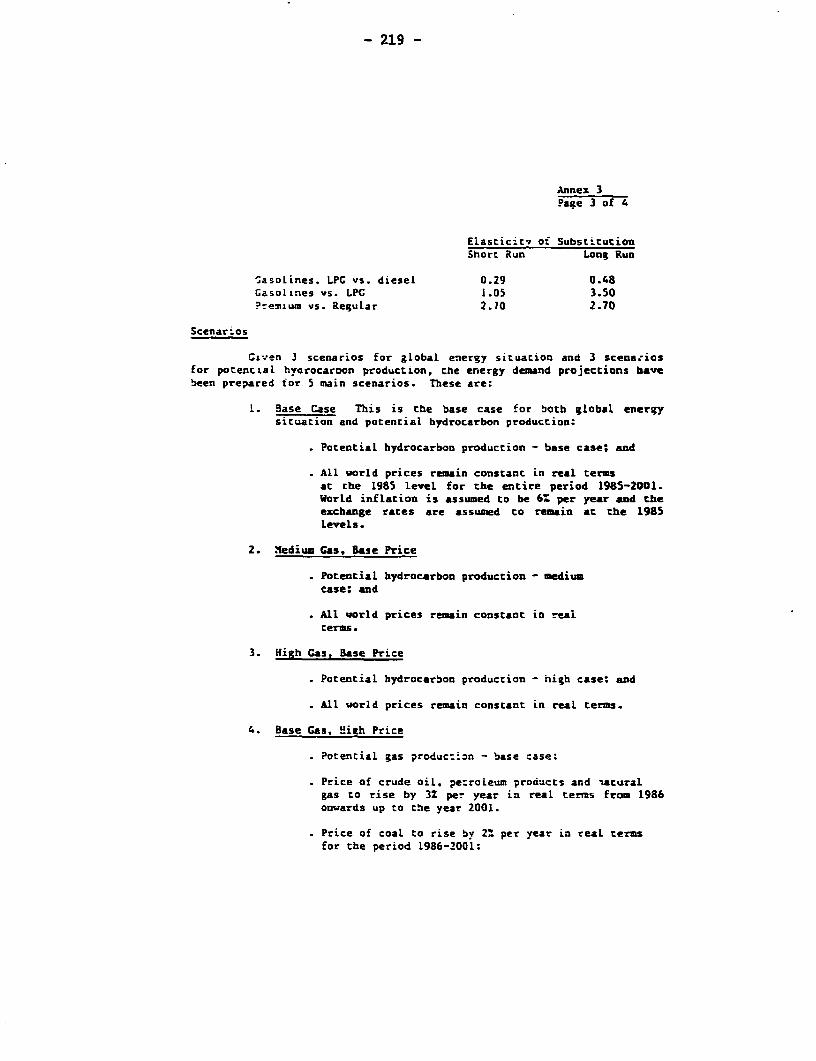
- 219 -
Annex 3Page 3 of 4
Elasticic7 of SubstitutionShort Run Long Run
SasoLines. LPG vs. diesel 0.29 0.48GasolLnes vs. LPG 1.05 3.50Premium vs. Regular 2.70 2.70
Scenarios
C5-zen 3 scenarios for global energy situacion and 3 scenaciosfor potenctal hyarocaroon production, che energy demand projections havebeen prepared tor 5 main scenarios. These are:
9. Base Case This is the base case for both global energysituation and potential hydrocarbon production:
Potential hydrocarbon production - base case; and
All world prices remain constant in real termsat che 1985 level for the entire period 1985-2001.World inflation is assumed to be 6% per year and theexchange rates are assumed to remain at the 1985levels.
2. Hedium Gas, Base Price
Potential hydrocarbon production - mediumcase; and
All world prices remain constant in realcerms.
3. High Cas, Base Price
Potential hydrocarbon production - high case; and
All world prices remain constant in real terms.
4. Base Gas, High Price
Potencial gas produc:_on - base case;
Price of crude oil. petroleum products and saturalgas to rise by 3: per year in real terms from 1986onwards up to the year 2001.
Price of coal to rise by 2% per year in real termsfor the period 1986-2001:

- 220 -
Annex 3Page E of L
All other world prices remain constant in realterms at Lte 1985 level; and
wcr d inflation 6% per year.
5. Base Gas. Low Price
Potential gas production - base case;
Pr;ce of crude oil, petroleum products and naturalgas to fall by 3% per year in real. terms from 1986 tothe year 2001;
Price of coal to fall by 2% per year in real termsfor che period 1986-2001;
. All other world prices remain constant in real termsat the 1985 level; and
. World inflation 6% per year.
The Base Cas High Price scenario could aLso be considered as theLow Growth scenario as the higher oil prices have the effect of slovingdown the country's economic growth. Similarly, the Base Gas Low Pricescenario could be considered as the High Crowth scenario.
In all these cases it is assumed that
* Relative prices of different types of petroleumproducts in the world market remain at the currenclevel;
. The present recail structure of petroleum products ismaintained and that domestic oil price level isal-ays adjusted in line with anv changes in the woridprice; and
. The level of imported coal remains at the presentlevel.

- 221 -
Annex 4
THAILAND: ASSUMPTIONS ON GAS AND ..ONDENSATE PRODUCTIVITY
Gas Condensates
(BCF/well) (bbl/MMCF)Union (single completions)
Eravan 5.0 32.5
Second Contract:Baanpot 5.5 50.2Satun 5.5 18.5Platong 5.0 60.0
Third Contract 30.0
Texas Pacific 13.6 12.0(Dual Completions)
Esso 38.7 1.0
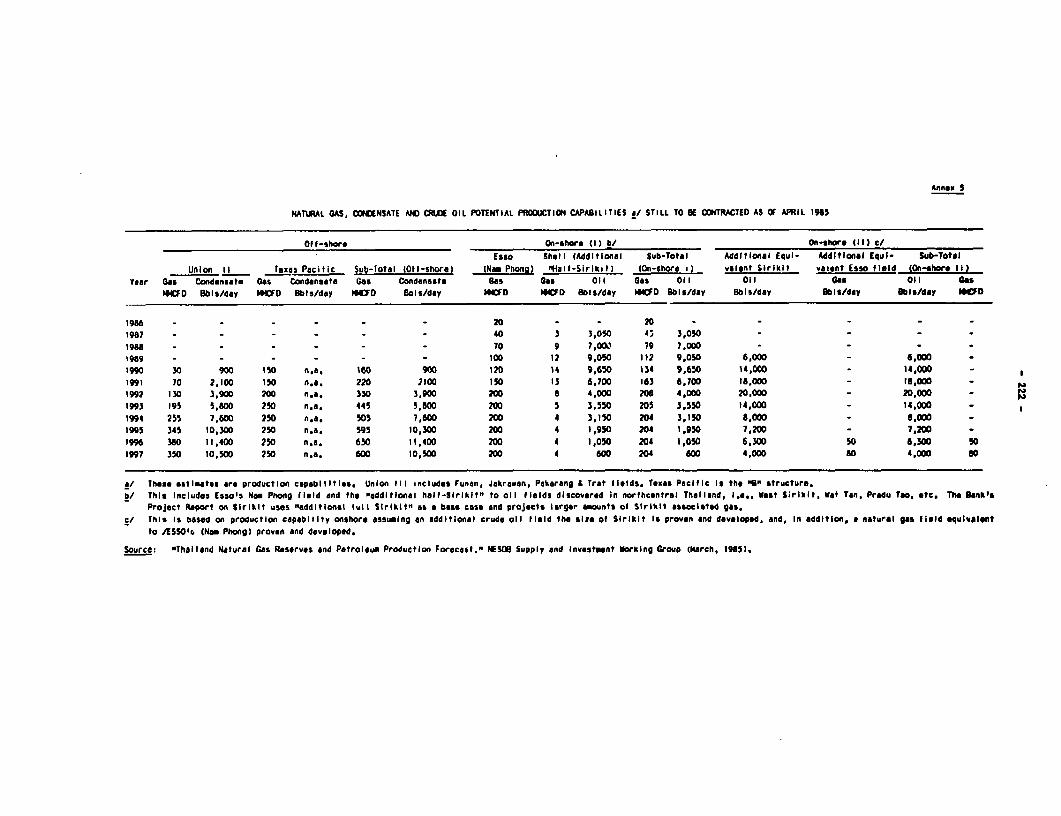
Annex 5
HATLFAL GAS, WCNENSATE AND CRUDE OIL POTENTIAL PRODUCTION CAPABILITIES a/ STILL TO BE CONTRACTED AS OF APRIL 1965
Of I -shore On-shore (I) bh On-shore (II) CIEsso Shell (Additional Sub-Total Additional Equl- Additional Equl- Sub-Total
Union 11 Texas Pacific Sub-total (Off-shore) (Na Phong) Htalf-Sirlkit) (On-shore i) valent Sirikit valent Esso fluid (On-shore 11)Year Gas Condensate Gas Condensate Ges Condensate Gas Gas Oil Gas Oil Oil Gas Oil Gas
ROD Bbis/day WCFD Slhs/day lFD Bols/day MfD 60CD Bals/day MOD SOle/day Bbis/day Eble/day bise/day MUD
1986 - - - - - - 20 - - 20 -1987 - - - - - - 40 3 3,050 4; 3,050 -
198 - - - - - - 70 9 7,00) 79 7,000 - - - -
9989 - - - - - - 100 12 9,050 112 9,050 6,000 - 6,000 -
1990 30 900 150 n,e, 160 900 120 14 9,650 934 9,650 14,000 - 14,000 I
1991 70 2,100 150 nAe. 220 2100 150 13 6,700 163 6,700 18,000 - 18,000 -
I992 130 3,900 200 n.e. 330 3.900 200 a 4,000 208 4,000 20,000 - 20,000 -
1993 195 5,600 250 n,a, 445 5,800 200 5 3,550 205 3,550 14,000 - 14,000
1994 255 7,600 250 n.a. 505 7,600 2?0 4 3,150 204 3,150 8,000 - 8,0001995 345 0,30w 250 n.a. 595 10,300 200 4 1,950 204 1,950 7,200 - 7,200
1996 360 11,400 250 n.e. 630 11,400 200 4 1,050 204 1,050 6,300 SO 6,300 501997 350 10,500 250 n,a, 600 10,500 200 4 600 204 600 4,000 s0 4,000 s0
a/ These astlatees are production capabilities, Union Ill Includes Funan, Jakrewan, Pakarang A Trnt fields. Texss Pacific Is the "on structure,bi This Includes Essmas Nam Phong lfIld and the "additional half-SirIkit" to all fields discovered In northcantral Thailand, Ie,., West Sirikit, Wet Tan, Pradu Tao, ete. The Sank's
Project Report on SIrIkit uses "additional lull SIrikilt" as a base cass end projects larger aounts of SirIkit associated gas.c/ This Is ba"d on production capability onshore assumlng an addItlonal crude oll field the slze of SIrlklt Is proven and developed, and, In addition, a natural gas field equivolent
to AESSO's (Nm Phong) proven and developed.
Source; "Thailand Natural Gas Reserves and Petroleum Production Forecast," NESDG Supply and Invastent orekIng Group (March, 19859.

Annex 6
PETROLEUM PRODUCT DEMAND, REFINERY PRODUCTION AND IMPORTS, 1970-84(Barrels/day)
Diesels
Item Year L.P.G, Gasolines (Auto t Indust.) Kerosene Jet Fuel Fuel Oil Total
Demand 1970 1,500 16,300 37,600 2,200 6,600 24,000 88,200
1979 6,400 40,700 74,100 5,400 15,000 68,800 210,4001980 6,100 38,700 70,800 5,000 16,300 81,400 218,4001981 7,800 36,000 69,400 6,700 16,000 71,400 207,3001982 10,400 34,700 67,700 6,700 18,600 51,600 189,800
1983 14,300 35,700 75,800 9,300 19,700 58,000 212,8001984 16,500 36,400 90,900 4,900 20,900 54,800 224,400
Refinery 1970 1,500 14,100 19,800 2,200 5,400 21,800 64,800
Production 1979 4,300 36,400 47,800 5,500 13,500 60,100 167,6001980 4,000 31,500 48,100 5,000 13,400 43,300 145,300
1981 4,200 31,400 47,400 6,100 15,900 45,300 150,3001982 3,300 34,100 49,100 6,200 16,300 40,800 149,8001983 3,900 35,500 52,600 7,400 17,900 37,200 154,5001984 4,900 a/ 34,600 47,700 4,100 17,600 45,000 153,900 a/
Net Imports 1970 --- 2,200 17,800 --- 1,200 2,200 23,4001979 1,300 3,600 28,200 100 1,800 24,000 59,0001980 2,300 8,000 27,200 100 3,100 37,900 78,6001981 4,000 4,800 20,300 700 1,400 22,600 53,800
1982 7,300 300 20,100 1,200 1,800 10,900 41,6001983 10,400 --- 19,700 2,000 1,900 20,500 54,7001984 11,900 1,200 44,800 800 3,600 12,000 74,400
Average AnnualGrowth Ratesof Demand 1970-79 17.5% 10.7% 7.8% 10.5% 9,6% 12,4% 10.1%
1979-84 20.9% -2,2% 4.2% -1.9% 6,9% -4.5% 1.3%
a/ Includes some 600 bbls/day of production from the LPG separation plant,
Source: oOil and Thailand, 1983," published by the N.C.A., and 1984 data provided by the NESD3,

Annex 7
SECTORAL CONSUMPTION OF PETROLEUM PRODUCTS, 1971-1983 a/
(Barrels/day)
Electricity Commercial
Product Year Agriculture Manufacturing Construction & Water Transport Residental Other 2/ Total
LPG 1971 - - - - - - 1,600 b/ 1,600
1979 200 1,200 - - 1,300 3,600 100 6,400
1982 200 1,300 - - 3,500 5,100 300 10,400
1983 200 1,900 - - 6,400 5,700 100 14,300
Gasoline 1971 - 600 100 100 19,700 - 1,400 b/ 21,900
1979 900 1,00 - - 36,400 - 2,700 40,700
1982 1,000 900 100 3%.,800 - 1,900 34,700
1983 1,000 200 - - 32,600 - 1,900 35,700
Diesel Oil 1971 13,700 3,800 2,500 2,600 20,400 - 1,500 44,500
1979 20,030 6,700 1,800 3,300 36,400 - 5,900 74,100
1982 21,600 4,000 2,000 500 35,700 - 3,900 67,700
1983 19,900 4,400 1,400 700 47,900 - 1,900 75,800
Fuel Oil 1971 - 17,500 100 11,200 1,100 - 800 30,700
1979 - 28,300 100 38,400 1,300 - 700 68,800
1982 - 23,100 200 26,300 1,000 - 1,000 51,600
1983 600 21,300 200 31,600 3,100 - 1,200 58,000
Kerosene 1971 - 400 - - 600 - 2,400 b/ 3,400
1979 - 1,100 - - - 4,100 200 5,400
1982 - 800 - - 100 3,200 2,600 c/ 6,700
1983 - 500 - - 100 2,900 5,800 c/ 9,300
a/ Excludes jot fuel sales which are all allocated to air transport.
b/ Before 1979 sectoral consumption between "residential" and "commercial and others" was not broken down.
c/ This large increase is due in large part to kerosene "leakage" into the transport sector through diesel oil adulteratlon
that Is not belng picked up In the official data,
Source: "Oil and Thailand, 1983", published by the N.E.A.

- 225 -
Annex 8
ORERATING PERFORMANCE OF THAILAND'S REFINERIES, 1983
Product TORC ESSO Qb.agchak
(bbis/day) (S yield) (bbis/day) (S yield) (bbls/day) (S yield)
LPG 1,200 1.7 1,200 2.3 1,500 2.9
Gasolines 18,600 27.2 10,600 20.0 11,100 21.1
Jet Fuel 12,200 17.8 6,200 11.7 2,200 4.2
Kerosene 2,500 3.6 3,300 6.2 2,800 5.3
Auto Diesel 22,700 33.1 19,100 36.3 13,900 26.3
Fuel Oil 8,400 12,3 11,200 21.2 19,500 36.9
Total 65,600 95.7 51,600 97.7 51,000 96.6
Feedstock Run 68,500 100% 52,800 100% 52,900 100%
Source: "Bangchak Oil Refinery Restructu,*ng Project", World Benk A.ppraisal Report,
April 1985.

- 226 -
Annex 9
PROOUCT YIELD AND PRODUCTION IN 1990 FROM THE TnOEE LOCAL REFINERIES
Product TORC a/ ESSO b/ Bangchak c/
(bbis/day) (% yield) (bbis/day) lS yield) (bbls/day) (% yield)
LPG 1,100 1.7 1,500 2.3 1,900 3.0
Gasolines 17,300 27.2 12,700 20.0 12,600 20.4
Kerosene/Jet Fuel 13,600 21,4 11,400 17,9 8,800 14.2
Diesel Oi1 21,100 33.1 23,100 36.3 18,400 29,8
Residual Fuel Oil 7,800 12.3 13,500 21.2 17,700 28.6
Total 60,900 95.6 62,200 97.7 59,400 96.0
Feedstock Run 63,700 100% 63,700 100% 61,750 100%
a/ Running similar light crude/feedstocks as in 1983. Throughput taken as 98% of design
capacity.
b/ After de-bottlenecking of refinery completed in 1986. Same yield pattern and crude
feedstock as In 1963 assumed with the throughput at 98% of design capacity.
c/ BPC rehabilitation assumed completed in 1989. Crude throughputs assumed to be 95% of
design capacity with feedstock increasingly light-29% Sirikit crude, 7% conde'.sate,
38% Arab Light, 13S Arab Heavy and 13% Arab Medium crudes.
Source: Mission estimates and World Bank Appraisal Report, April 1985 on "Bangchak Oil
Refinery Restructuring Project."

- 227 -
Annex 10
DETERMINATION OF GAS EQUIVALENT VALUES OF ALTERNATIVEFUELS USED AS BASE LOAD IN THE POWER SYSTEM
1. The basic comparison is between base loaded generated powerfrom steam fired units using gas, coal, lignite and fuel oil as fuels aswell as combined cycle units fired by gas. The utilization factor isassumed to be 70%, interest rate of 10% with capital costs, constructionperiods, heat rates, economic lifetimes and estimated annual operationsand maintenance costs as indicated in Table 5.16. In the case of lignitefueled generation account is also taken of transmission costs back toBangkok from Mae Moh (650 kms away) in order to determine the gasequivalent value of lignite in power generation.
2. When the above iactors are taken into account the following gasequivalent values are obtained for the competing fuels based on currentprices of alternative fuels. These gas equivalent values are the break-even prices for gas use in steam or combined cycle units at which totalpower generation costs from the alternative fuels (coal, lignite and fueloil) are equal.
Gas EquivalentMode of Use in Value
Fuel Power System Fuel Price 1985 US$/MMBTU
Coal Steam Unit US$55/ton c.i.f. 3.14 a/Bangkok
(US$2.08/MMBTU)
Fuel oil Steam Unit US$22/bbl 3.49 a/(US$3.49/MMBTU)
Lignite Steam Unit at US$20/ton 3.23 a/Mae Moh Power (US$1.86/MMBTU)Transmitted toBangkok
Coal Steam Unit US$55/ton c.i.f. 4.37 b/Bangkok(US$2.08/MMBTU)
a/ Th,s is the gas equivalent value for gas used .zn an equivalent sizesteam power generating unit.
b/ This is the gas equivalent value for gas used in an equivalent sizedcombined cycle unit.

-228 - Annex 11
Page 1 of 7
SUPPORT ACTIVITIES FOR FUELWOOD PROGRAM
Program Activities
(a) Creation of a network of small-scale (village-level) treenurseries in the rural areas, initially covering those parts ofThailand where deforestation is becoming severe. The activitymust explore maximum involvement of private farmers, schoolsand NGO's in operating the nurseries, with RFD providingtechnical advice. A possible approach, for example, is forgovernment to offer a guaranteed price to the participant forrepurchasing and distributing seedlings for local plantingschemes in the poorer rural areas.
(b) Establishment by RFD of an effective system of tree seedcollection spread throughout the rural areas, with strongemphasis on faster growing indigenous trees that farmersperceive as having multiple benefits and on the introduction ofselected fast growing fuelwood species, particularly those thathave the potential for sustaining high branch-wood volume viapollarding or coppicing techniques (e.g., specieis of Leuceana,Azadirachta, Melia, Cassia, Eucalyptus, Melaleucae, and Acacia.
(c) Introduction of low cost tree seedling and rree seeddistribution techniques (e.g., in areas of reasonably reliablerainfall or where trees are being planted on irrigated lands, ashift away from polythene pots to either the "basket"technique 11 or, where appropriate, distribution of tree seedsfor direct sowing on a farmer's holding).
(d) Continuation and expansion of the program of villagev woodlotplanting already started by RFD with emphasis on theirdemonstration effect, particularly in relation to maximumbiomass productivity techniques such as closer space andfertilizer application.
(e) A mass-media promotional campaign aimed at encouraging smallfarmers throughout the rural areas to augment the existingsupply of trees maintained around homesteads by the planting ofadditional fast growing species on patches of wastelandunsuitable for agriculture or along farm boundaries.
1/ Growing of seedlings in shallow earth baskets from which they can bedirectly transplanted into a farmer's land or into a village woodlot(see Cujarat, India experience).

- 229 - Annex 11
Page 2 of 7
(f) Promotion of private sector investment in energy plantationtree farming aimed at, on the one hand, small scale 5 ha 30 RAItree farms and, on the other, larger scale private sectorenergy tree plantations sited close to main fuelwood/charcoalmarkets, particularly urban centers.
(g) Encouragement of larger wood-based industries (pulp and paper,particle board, sawmiLling, etc.) which also consume wood-basedenergy, to enter into long term marketing contracts withfarmers and other agencies situated within an economic radiusof such plants for supplying part of their future wood rawmaterial needs.
(h) Preparation and publication by RFD/MOA/NEA of economic studiesrelating to wood-based energy products, e.g., alternativemarketing arrangements for fuelwood and charcoal that wouldensure a fair price to both tree growers and consumers; costsand benefits of various approaches to plantation establishment;harvesting and transport costing, etc.
Research Activitiqs
(a) Strengthening of agro-forestry/fuelwood research, particularlyin the area of improving the genetic and biologicalproductivity of gas growing multi-purpose species.
(b) Extension of the household energy consumption surveys such asthose already carried out by NEA with assistance from RFD. Thesurveys should be periodically updated and extended to otherparts of the country. They should provide the starting pointfor assessing the appropriate size of reforestation programsand other basic project design considerations such as choice ofappropriate species.
(c) Intensification of current NEA-RFD efforts for the development,field-testing and large-scale dissemination of improvedcharcoal kilns and cooking stoves. A study of the mostappropriate mass production and marketing approaches must beconducted.
(d) Study of the fuelwood substitution potential of agriculturalresidues, especially rice hulls and bagasse. The study mustassess, inter alia, the possibility for wider usage of ricehull fired stoves; the technical and financial requirements forproducing excess bagasse from the sugar industry; approaches toresolving technical and social acceptance problems associatedwith the use of densified crop residues in rural industries andhouseholds.

- 230 - Annex 11
Page 3 of 7
Institutional Strengthening Activities
(a) A vigorous training program for RFD and the Department ofAgriculture Extension (DOAE) staff. RFD should providetechnical Subject Matter Specialist support to DOAE, who wouldbe the main direct contact point with small farmers. RFD's ownextension staff should provide the main technical support tolarger tree farmers and private companies.
(b) Implementation of already existing proposals for makingsignificant changes in the curricula of forestry trainingestablishments such as Kasetsart University to place strongeremphasis on Social Forestry.
(c) Strengthening of technical support by RFD to creditinstitutions, such as BAAC, which could play a role inproviding credit for energy plantation tree farming.

J inn m,Page 4 of 7
Table 1: RATE OF DEFORESTATION, 1961-1982 a/Area of Forest by Reglon
Total Land Forest AreaRegion Area 1961 % 1973 S 1976 S 1978 S 1982 S
North 169,644 120,388 20.96 113,595 66.96 102,327 60.32 94,937 55.96 87,756 51.73
Northeast 168,854 71,199 42.17 50,671 10.01 41,494 24.57 31,221 18.49 25,886 15.33
Central 103,901 5X,006 53.90 39,006 37.54 34,457 33.16 31,463 30.28 26,516 25.52
South 70,715 26,035 16.82 18,435 26.07 20,139 28.48 17,603 24.89 16,442 23.25
Total 513,115 273,628 53.33 221,707 43.21 198,417 38.67 175,224 34.15 156,600 30.52
a/ Based on recent Remote Sensing (LANDSAT) and Serial Survey Comnparlsons.
Source: RPD Statistics, 1982.

Annex IIPage 3 of 7
Table 2: INDIVIDUAL WOODLOTI ha Model (Eucalyptus Camaldrensia)
Physical Analysis
Fuelwcod Production 0 1 2 3 4 5 6 7 8 9 10 11 12 13 14 15 16
1, Investment
1. Tools2. Seedling (pcs) 3,2503, Labor for preparation (MD) 534. Fertilizer (MD) 25. Fertilizer (kg) 15-15-15 325 kg6. Planting 177. Supplementary plant (MD) 5
11. Maintenance1. Fire control and etc. (MD) 8 8 8 8 8 8 8 8 8 8 8 8 8 8 8 82. Weeding (MD) 26 26 26 26 26
111. Production1. Logging (MD) 100 100 1002. Production m3 150 150 150
Other AssumptionsRotation: 5 yrs (harvest at 6th yr)Average Yield: 30 m /ha/yrliscount Rate: 12%

Annex I I
Page 6 of 7
Table 3: FINANCIAL ANALYSISIndividual Woodlot
I ha Model (Eucalyptus Camaldrenais)
Fuelwood Production 0 1 2 3 4 5 6 7 8 9 10 11 12 13 14 15 16
I, Initial expensesI. Seedl ings 4875 --
2. Labor for Land Prep 2385 --
3. rertilizer 1950 --
4. Laoor tor fertilizer App 90 --
5. Labor tor Plaintinig 765 --
6. Labor for Suppl. Planting 225 -- -- -- -- -- -- -- -- -- -- -- -- -- -- --
I1. Maintenance
7. Labor for Fire Control 360 360 360 360 360 360 360 3u0 360 360 360 360 360 360 360 360'
8, Labor for Weeding 1170 1170 -- -- -- 1170 -- -- -- -- 1170 -- -- -- -- 1170
Ill, Production9. labor ior Logging -- -- -- -- -- 4500 -- -- -- -- 4500 -- -- -- -- 4500
lutal Expenses 6945 1530 360 360 360 6030 360 360 360 360 6030 360 360 360 360 6030
Revenues -- -- -- -- -- 34500 -- -- -- -- 34500 -- -- -- -- 34500
Net Cash Flow -6945 -1530 -360 -360 -360 28470 -360 -360 -360 -360 28470 -360 -360 -360 -360 28470
IINANCIAL RATE OF REIURN 23%

Annex 11IPage 7 of 7
Tablo 4: ECONOMIC AMALYSIS
Fuelwood Production 0 I 2 3 4 5 6 7 8 9 10 11 12 13 14 IS 16
1. INITIAL EXPENSES1. Seedlings 3413 --2. Labor tor Land Prep. 1479 --
3. Fertilizer 1365 --
4. Labor for Fertilizer App 56 --
5. Labor for Planting 474 --
6. Labor for Suppi. Planting 140 --
11, MAINTENANCL7. Labor for Fire Control 223 223 223 223 223 223 223 223 223 223 223 223 223 223 223 223
8. Labor for Weeding 725 725 -- -- -- 725 -- -- -- -- 725 -- -- -- -- 725
Ill. PRODUCTION I9. Labor tor Logging -- -- -- -- -- 2790 -- -- -- -- 2790 -- -- -- -- 2790N
IV, OTHERS10. Land Rental 130 130 130 130 130 130 130 130 130 130 130 130 130 130 353 130
IOrAI. EXPENSES 4592 1079 353 353 353 3869 353 353 353 353 3869 353 353 353 353 3869
REVENUES -- -- -- -- -- 27600 -- -- -- -- 27600 -- -- -- -- 27600
Nt I CASH FLOW -4595 -1079 -353 -- -353 23731 -353 -353 -353 -353 23731 -353 -353 -353 -- 23731
ICONOMIC RAIE OF RErURN 26% a/
a/ At land rental - 500B, IRR 23%; at 10008, IRR a 20%.

' iN t; C Hi I N A \ \ f Xt 0 CHINA~~~~~~~~~~~~~~~~~~~~~I
* BURMA ~~~~~~~~~~1' KANCHANABUR!IP TOPLES T U
,;,,, ~ ~ P. ,,~ 5,,L I f''' .R )2:f 2
VET NAM RATCHABUI
THAILAND N S THAILAND '(Bangkok KH
|~~~~~~~E'1Rt iiR4b$
e~ ~~~~Va ;e: CJ.BI LATA Gj;3 CAGA CNES1'MPUHE BA"I oW:tA 9 nu RASr
Sea G./
7ARE .o SATTAHIP a' 34W BUNDAROf MAP Th- BUR
.'.-,.- ~~~ ~~~~~~~~~~~~~~~~~~~~~2j )4 RAT
!MALA?SIA
7RAHUAPI .* ~ ~ ~ ~ ~ ~ ~~KA
98O*
THAILAND
PORTS
4 COASTAL PORTS
10* / ~~~~~~~~~~~~~~~~~CHANGWAT CENTERS/ ~~~Langsuan ROADS
-'------RAILRIOADS
u/ - ~~~~~~~~~~CHANGWAT BOUNDARIES

;Lja;/ 1; 8> > j9ongsuon -- ROADS
( I ->----I- |RAILROADS
J - -- \tCHANGWAT BOUNDARIES
/- | BANDON 1INTERNATIONAL BOUNDARIES
I~~~~~~~~~~~~~~~~~~~bno I I:1
PHANGNGA,) .\INAKHON Si THAMMARAT
Pak Phanang
o>. V~~KRABI T un7 \
-8§ Abi # &>>PdagSonB as 8.-
TACHI~~~~~~~~~~~~~~AATIA
18 ~~ 11zATH LUNG
Kan 100
> t )>~~SONGKHLA
t~~~o Jv t PATTANI
sA<S J ^ s t i~~~~~~~~Sa Burii1Poang Desor ziu Lb 15^;
M I L E S i-J ~~~~~ *\ / t <g>)~~~ NARAT HIWAT
O 50 1'o
~~~6 ~~~0 50 10'0 \)U6°-
KILOMETERS ungar
IN Il rjn hi blW p , D .I rwv vF I. 3- 1 Ti- t* Adc nt rr lraiat,
C 'rn.v CotatY sItit Ti. fltttrt,. ct t tI e tnlf ttte ,t 'its ,W y, .v,t.C) t,I% rtI et.c nI Ti itit *a n P u p. tot t.ike3 t .it.st < ru.,n * urt
C C-o.Jn r. tt*,V 03ht h t.rt V. *xvvnt. 3D. tt t.M..,
I M A l A A w0D- 98* l00Oe lzz2 _

BURMA L. \ *
-200~~~~~~~~~~~~ 0
I ,in al Jing THAILAND \ .l
CNVANG RAI -3k--)G/AE HONG SON\ DEMOCR\ (~ of rs 05#1X ¢F:dr) ) t - \ KAUP ICRATIC
)hp." ontSkn 8 t-s^ ) l}t\\ LAO PEOPLE'S DEM. REP r ; VIETA
rj / CHA O MAI (NAN h '-'
ChlanMie oPAwJ8 sz
Lam I_t
! ~ ~ ' :, - G NUN,
> r LAmPano (PNE ) ~7 \* *PHVR.AEQ t,,.,''' a To'V
UItarai~~ LJTTAR DIT - \' ~I0fig KJ~~i'..3 ...- ~..)~~SINCiAPORZ
N '~~~~~ PH~~ITSANJLO
EN rail I . -- ** -~'~
OKHOTHAI' Nakho"
t'q, ~ ~~~~ h > ptcaR; 2 >gthnw. £K§nm~
0'~RA NAKNO T A rr A
A)AArcNrhb dm hn K
SAAfU4.AP.h~~~'4.. ,akan DEMOCRATICHOI. PH/c Snhra
UT SONGKNRAM ... ~~~~~40 S
Andamw,~~~~~~~~~~~~~~~~~nAFuf-Sea ~ ~ ~ ~ JVFC~~~5RI ~ ~~~-' ~U

> * , 7~~~~~~ Kha~n rJir
VA ,
.Ig' Gulf of fh/w/and
. ;J 2 btU~~HIJPtHON
fl N Qisumphan
_00 ii I -
' 1 n;g- 10
560 ~ (1 MA t oI~~~~~(N
>uriani s T H A I L A N D
, }/ SUfiA T HANI 1¶1ga4qT ".' PROVINC IAL ELECTR IC ITY AUTHORITY
PHA GNU48 9UTHPHO
PA ~ ~ ~ ~ A /O ITFAAAA
1 _ ,; <, t4z1/a,v 51 r~HAIL.tAND
v !r~ v7 .~ <s > CNakion Si Thammarat
8° ~ ^ } \1gAJ/ A , REGION VILLAGES WITH VILLAGES TO BE
FHUtCIS R lerab t, A i . ;/[,._ \ S _. , .. . ELECTR!CITY (END 1981 ELECTRICIED (1982-1985
Phukel NORTH . . 6.245 3,825
ROAUS .~~~~~~~~~PO thalungROADS 4 ¢ Trang 6,072 6.296
*d.---4 RAILWAYS .N
R VERS Snkhl CENTRAL 6.406 2.609
PROVINCE BOUNDARIES
-. - INTERNATIONAL BOUNDARIES (' SA fij",V Aitafni SOUTH 3 9as 4.918
0 s lo0 200 K M *' Sajn O S IL4 A ' | __*_-_-_____.______________' VILLAGES TO BE ELECTRIFIED .S500
0 50 100 MILES Narathiwat UNDER THE NREP
NARA THJ;ArIF
a mpbabe rp,db hhi* eb fRecd'~ i YALA\0 M3 t,reaeSe nwreavebis y rVhor th hiIarld uaes sYaN de i c TOTALS 22,62' , 23,148 _
CA Franca Cotporaln The den*wu.be ueK aid NW brdws moawn an dIo rrp Pa m. l.lpn*. on Rd part of The It Elan ard the hternationak FEIrrnce Capcation. drAburne -IV, rJ0
_ on Ihe l aeg har eto any lemlovy or any crbnder t erccepIance of suh bLu. / A L & I _cii 980 i(n L

0 ~~B U R M A ,5\ 20 ,
/ InUDiDAMW LAO PEOPLE'S DEMOCRATIC THAILAND
Phapac REPUBLICt{ InI.u XtM a h o
Mae Mongwon 7, I RPBlCx6'
MAE TIPS Mae Hangman Chiangmoi 2XtLjtin )1M( Diesel 7 MWO Mi)< Dlsol 7 MWtF ~~MAE MOH Tha,mot Non A GMDMz, .k .A
MOl. Tgn ,nOIiNa) NAM NOUM DAM Gu f
C'.-. Cltiangnsail d 3 75S4AQO Ultimnate Cop 135hMW rhe/GAd75M thoo Initial 30M W 4`1
Lom / 30D MW . a South
Lampangt DA 25 / / \ ISWSIRIXIT DAM Chi.eU a \CpS0MW\\.500MW /PA MONO IA .| injA
BInstollerJ NM i ^< Phlt~~Ionuia F,s Ctop2 \iCo oMj
Lign to M.um U nIo \h"movf 375 MW u -,goo iThoen Llrat rrNvngkhaip
e Udanthani I 0 Udanihani 2 Nalthanpha,, > 'h15lNOAPORI
BHMBLDAM Got turbine 15MW -- p Saeg kon NcHalt~ '
Cap 60 MW Pn hom t/Thothono.420 W Suh olhai M NAM PUNO D IIns talled \* UBORATANA ADAM Cap 6MW
ToC, <PIrntsanuIak Com Wde/
p et * ci X|Bonopo An 70 (ae 7 IN
1 K s r ANGtl j. jP/ochgnouel EWRKln'~~~4 MukdaGanT01l fNiw
Pherctiabun 1 G R A D cDAM Chum ,0 M aho2 'arakham
lnop M NcetheottInitial 40 MW / Dsti Canto,
S e a. .) I ( ) t \ J NiD ) , '? h a i S ata n i p N ~ C h i o. ;, ' tNl h h n 1 5Vr o
k ] VA' & / Phon I.4 A r6 9 K V unatoY h
R F 1[,4 C 'ar'en.j ~~~~~ anrm TakhIlI 2 d0"7 N khan / tin
15. Maintain -~~~~~~~~~~~~~~~~~akliI RPai1chmasi 1I Rotcharhani e4 Go,~~~~~~~ Tisrone/ttoPbUub lMWw 2j S.sake'
1.~~~~~~~~~~~~~Snbr DAMartUffi,mito Cali, 72OMWaan Nahhn Rocad,ioste 2 CIINIop 3 DM1sUltimate C4s. 720MW Pokcharm ~~~~~ ~ ~~~~~~~~~~~~Swtim Initial 24 MW
Kamnphoengsoep
S AWJJT ~TALN
K-agPanPanibni \70MW- sc2rKrnciTYG OA W AUTHOITY OF THAILANDKa nchanabiass ,. GGIUA1WGachmbur\~~~~~~~~~~ t .2~~I~.a ln spuTomPIJC
II ' * METRO BANG~?u?r PiAnteONne
ridaman K RAGlAN DAM P~~~~~~~jMthab l'~~~# .2±..... ~~Mae Mohi Lignite Mine
NG R Shnar " ,h2 0 K Tronsm nissnon LinesAndaman ~~~~Co 9MWNUCLA) BnLmug115 KV Transmissio LinesPOWER PLANT i Sattohip 1 'n -b -i 69 KV Transmission Lines
Sea ~~~~~~~~~~~~~~-- -230 KV SubstationsPronbvri so alp .A £*115 KV Substations
kar 69 KV Substations

iii Ii: / UC. ~~~' 8iuiti.omuni kkNii.l IV' 'iransmiS3104 Lifl11S.' n, i'OW kN tPX lil, #1 g gl l: ;! 1\ + , / N t .A N T\ f Satta htrip . - - - - - 9 KV Transm ssion Lines
l----A ~~Chantt,oburt| Seao'<i t/ ' \ l0Plar,tu SatichipA R m 230KV Substations
Sattobip 2 ~ ~ ~ ~ ~ ~~~A A 115 KV Subsfations<~~~~~ ~ ~ ~ ~ Pranbun Trap ~~~~~~~~~~~~~~~~~~~~~~69 KV Substations
0i % 1 1. O Thermal Power Plants
Prachuop Khiri Khan \0 Hydro Power PNantsA Prochup hiri Khon Nucleor Power Plant
. / Rivers
/ -^ f Regional Boundaries/ - .-. - Internationol Boundaries
Gulf of 7Thai/and KIL ' OLOMEtERS
C1 51010 200
SAILE5
Rc.~,ALANG SLJANRana'g, 05 cPNRiStc' ,,___
4%x45MW . - PAVED OROAD4K45A¶WL-ATEr LATiE aADS
-. RAIL.WAYr
SURAT HANICHIEW LARN PROJ C' Lmi MU0 101W
Ultimnate 240OMW , .n - ^ P nl InitiaO2x 60Mp. Sot .
Phang r a NothL.i 5n Thont Chot q A Nhoth4Eorat
aRPOS IT BOUNDAP Y
K -b.vDUMPING
Plhuket Cap 60 MW 3 hTATt5:0.esel 10 6 M W 3 'J$i
I -11 phar?a1ntig
! rfOrg, \ 2>STATti # ~~~~STT -
ROrSEO POWER
T?.s rnap has beon prepared by HaO ya ST TIONThe WboId Bank's staff oxcAusivey 2o | TRA N NG CE SQ Tfor tha convvrwence of the A 5 MN.- N COPOS
readers anda is Lsxc ePe for tho RESETTLt ENT SZTEinernal fie ol The Wol M1tr1and Mte hlernational Faunce hnOFFICEANCoztoran Trhe denon?eations A HOUSING AREAused and f he bctssou*>^.NrAlthieawn ,A,
>on OWs rnsp do rlot inriply, onl thMe y ^_,> part of rhe WVWed Eank and 08N ATAI / >, zt_
* Itairnabonati Ftrnce Corworon. I | TC any fptAVrp; on m lWOa status J 3 * 24MW
rzof any territory Or arry I.___C
*ndorseroanl enlora:cerspMtA d \ t rJ \, $ BMAE MOIH MINE AREA
-l such bttderies. 100 A L A Y S I A &4 _ _