
Loss of Estrogen-Regulated microRNA Expression Increases HER2 Signaling and Is Prognostic of Poor...
38
1 Loss of estrogen-regulated microRNA expression increases HER2 signaling and is prognostic of poor outcome in luminal breast cancer Shannon T. Bailey 1,2 , Thomas Westerling 1,2 and Myles Brown 1,2† 1 Center for Functional Cancer Epigenetics, Dana-Farber Cancer Institute 2 Department of Medical Oncology, Dana-Farber Cancer Institute, and Department of Medicine, Brigham and Women’s Hospital and Harvard Medical School. Running Title: ER regulated miRNA expression and breast cancer outcome Keywords: estrogen receptor, miRNA, luminal breast cancer, nuclear receptor, cistrome Financial support: This study was supported by grants from Susan G. Komen for the Cure (to MB), the NCI (P01 CA080111 to MB) and NIDDK (R01 DK074967 to MB). † Corresponding Author: Myles Brown, M.D. Professor of Medicine Harvard Medical School Director, Center for Functional Cancer Epigenetics Dana-Farber Cancer Institute 450 Brookline Avenue, D730 Boston, MA 02215 Tel: 617-632-3948 Fax: 617-582-8501 [email protected] Potential conflicts of interest: The authors declare no potential conflicts of interest. Word count: 4,644 Total number of figures and tables: 6 on March 20, 2016. © 2014 American Association for Cancer Research. cancerres.aacrjournals.org Downloaded from Author manuscripts have been peer reviewed and accepted for publication but have not yet been edited. Author Manuscript Published OnlineFirst on November 11, 2014; DOI: 10.1158/0008-5472.CAN-14-1041
-
Upload
hms-harvard -
Category
Documents
-
view
0 -
download
0
Transcript of Loss of Estrogen-Regulated microRNA Expression Increases HER2 Signaling and Is Prognostic of Poor...

1
Loss of estrogen-regulated microRNA expression increases HER2 signaling and is
prognostic of poor outcome in luminal breast cancer
Shannon T. Bailey 1,2 , Thomas Westerling 1,2 and Myles Brown 1,2†
1Center for Functional Cancer Epigenetics, Dana-Farber Cancer Institute
2Department of Medical Oncology, Dana-Farber Cancer Institute, and Department of
Medicine, Brigham and Women’s Hospital and Harvard Medical School.
Running Title: ER regulated miRNA expression and breast cancer outcome Keywords: estrogen receptor, miRNA, luminal breast cancer, nuclear receptor, cistrome Financial support: This study was supported by grants from Susan G. Komen for the Cure (to MB), the NCI (P01 CA080111 to MB) and NIDDK (R01 DK074967 to MB). †Corresponding Author:
Myles Brown, M.D. Professor of Medicine Harvard Medical School Director, Center for Functional Cancer Epigenetics Dana-Farber Cancer Institute 450 Brookline Avenue, D730 Boston, MA 02215 Tel: 617-632-3948 Fax: 617-582-8501 [email protected]
Potential conflicts of interest: The authors declare no potential conflicts of interest. Word count: 4,644 Total number of figures and tables: 6
on March 20, 2016. © 2014 American Association for Cancer Research.cancerres.aacrjournals.org Downloaded from
Author manuscripts have been peer reviewed and accepted for publication but have not yet been edited. Author Manuscript Published OnlineFirst on November 11, 2014; DOI: 10.1158/0008-5472.CAN-14-1041
2
ABSTRACT Among the genes regulated by estrogen receptor (ER) are miRNAs that play a
role in breast cancer signaling pathways. To determine whether miRNAs are involved in
ER-positive breast cancer progression to hormone independence, we profiled the
expression of 800 miRNAs in the estrogen-dependent human breast cancer cell line
MCF7 and its estrogen-independent derivative MCF7:2A (MCF7:2A) using NanoString.
We found 78 miRNAs differentially expressed between the two cell lines, including a
cluster comprising let-7c, miR-99a, and miR-125b, which is encoded in an intron of the
long non-coding RNA LINC00478. These miRNAs are ER targets in MCF7 cells, and
nearby ER binding and their expression is significantly decreased in MCF7:2A cells.
The expression of these miRNAs was interrogated in patient samples profiled in
The Cancer Genome Atlas (TCGA). Among luminal tumors, these miRNAs are
expressed at higher levels in luminal A vs. B tumors. While their expression is uniformly
low in luminal B tumors, they are lost only in a subset of luminal A patients.
Interestingly, this subset with low expression of these miRNAs had worse overall
survival compared with luminal A patients with high expression. We confirmed that miR-
125b directly targets HER2 and that let-7c also regulates HER2 protein expression. In
addition, HER2 protein expression and activity is negatively correlated with let-7c
expression in TCGA. In summary, we identified an ER-regulated miRNA cluster that
regulates HER2, is lost with progression to estrogen independence, and may serve as a
biomarker of poor outcome in ER+ luminal A breast cancer patients.
on March 20, 2016. © 2014 American Association for Cancer Research.cancerres.aacrjournals.org Downloaded from
Author manuscripts have been peer reviewed and accepted for publication but have not yet been edited. Author Manuscript Published OnlineFirst on November 11, 2014; DOI: 10.1158/0008-5472.CAN-14-1041
3
INTRODUCTION The estrogen receptor (ER) is an estrogen-regulated transcription factor that
controls the transcription of numerous coding and non-coding RNAs and is a key target
for therapy in ER+ breast cancers (1, 2). In breast cancer, ER acts predominantly by
binding to distal enhancer sites to mediate transcription (3). Downstream effectors of ER
activity in breast cancer include genes with pro-oncogenic functions including survival
and growth. It has been known for more than 40 years that a primary determinant of the
response of breast cancers to endocrine therapy is the expression of ER, leading to the
first stratification of breast cancer into ER+ and ER- subsets. More recently, refined
subsets have been identified by gene expression profiles characteristic of clinical
subtypes in which ER may play different roles (4-6).
microRNAs (miRNAs) are small non-coding RNAs ~22 bp in length that regulate
the expression of genes by targeting the 3’ UTRs of mRNAs. These molecules have been
demonstrated to play important roles in normal development and physiology as well as
regulating a number of disease processes including breast cancer (7-9). miRNAs have
been reported to be generally downregulated in cancers, and their loss leads to the
increased expression of targeted genes, notably including oncogenes that lead to cancer
progression. In breast cancer, a number of miRNAs have been reported to be abnormally
regulated (10-13). ER has also been reported to regulate the expression of a number of
miRNAs in response to its ligand estradiol (E2) (14-17).
Here, we report the identification of miRNAs directly regulated by ER and
differentially expressed in the estrogen-dependent ER+ breast cancer cell line MCF7 and
its hormone-independent derivative MCF7:2A. The let-7c/miR-99a/miR-125b cluster is
on March 20, 2016. © 2014 American Association for Cancer Research.cancerres.aacrjournals.org Downloaded from
Author manuscripts have been peer reviewed and accepted for publication but have not yet been edited. Author Manuscript Published OnlineFirst on November 11, 2014; DOI: 10.1158/0008-5472.CAN-14-1041
4
expressed in MCF7 cells where it is directly targeted by ER and both expression and ER
binding are lost in MC7:2A cells. Expression of this miRNA cluster is uniformly low in
luminal B breast cancers, which have a worse outcome than luminal A. Within the
luminal A subtype, low expression of the cluster predicts for poor patient outcome. We
find that two members of the cluster, let-7c and mirR-125b, inhibit HER2 protein
expression and increased expression of the HER2 protein in luminal A tumors lacking
expression of these miRNA may mediate their poor outcome.
MATERIALS AND METHODS
Cell culture and reagents
MCF7 cells were grown in high-glucose DMEM (Invitrogen) supplemented with 2
mM L-glutamine, 10% (vol/vol) heat-inactivated FBS, 100 IU/mL penicillin, and 100
μg/mL streptomycin (Invitrogen) in a humidified incubator at 37°C and 5% CO2. The
MCF7:2A, MCF7:5C, and MCF7:LTLT cell lines were grown in phenol red-free high-
glucose DMEM (Invitrogen) supplemented with 2 mM L-glutamine, 5% (vol/vol) heat-
inactivated FBS, 100 IU/mL penicillin, and 100 μg/mL streptomycin (Invitrogen). The
MCF7:LTLT cells were also supplemented with 1 μM letrazole. The MCF7:2A and
MCF7:5C cell lines were obtained from V. Craig Jordan and the MCF7:LTLT cell line
was obtained from Angela Brodie. The Dharmacon anti-miRs and miRNA mimics were
obtained from ThermoFisher (Pittsburgh, PA).
NanoString
A total of 2x10⁶ MCF7 and MCF7:2A cells growing in the exponential phase were
seeded in 6-well plates and cultured for 2 days. The cells were then harvested for total
on March 20, 2016. © 2014 American Association for Cancer Research.cancerres.aacrjournals.org Downloaded from
Author manuscripts have been peer reviewed and accepted for publication but have not yet been edited. Author Manuscript Published OnlineFirst on November 11, 2014; DOI: 10.1158/0008-5472.CAN-14-1041
5
RNA using the miRNeasy Kit (Qiagen). A total of 100 ng of total RNA was assayed
using the Human nCounter miRNA Assay 2.0 Kit following the manufacturer’s
instructions (NanoString). Differences in miRNA expression were analyzed using the
NanoSTRIDE software program (18) with default settings. Clustering of the differentially
expressed genes and heatmap generation was performed using the GenePattern Server
(genepattern.broadinstitute.org). The volcano plot displaying the significance of the
miRNA differences was produced using R version 3.0.2.
RT-PCR
For RT-PCR, total RNA was isolated using a combination of TRIzol (Sigma) and the
RNeasy Mini Kit (Qiagen). First-strand cDNA, which was created using the Quantitect
Reverse Transcription Kit (Qiagen) following the manufacturer’s protocol, was assayed
using Taqman miRNA assays (Life Technologies, Inc.), and the level of U6 RNA was
used as a control. The expression of LINC00478 was measured using the Power SYBR
Green PCR Master Mix (Life Technologies, Inc.) with the following primers: 5’-
GATCTGAGAACGCTGTCTGG-3’ (forward) and 5’-AGAGTCTCCCTCCTGCTTCC-
3’ (reverse). For the Ago1 experiments, the following primers were used: HER2: 5’-
CTGGTGGATGCTGAGGAGTA-3’ (forward) and 5’-TCCAGCCCTAGTGTCAGGTC-
3’ (reverse), Myc: 5’-CTGGTGCTCCATGAGGAGA-3’ (forward) and 5’-
CTCTGACCTTTTGCCAGGAG-3’ (reverse), p21: 5’-
GGAAGACCATGTGGACCTGT-3’ (forward) and 5’-
GGCGTTTGGAGTGGTAGAAA-3’ (reverse).
on March 20, 2016. © 2014 American Association for Cancer Research.cancerres.aacrjournals.org Downloaded from
Author manuscripts have been peer reviewed and accepted for publication but have not yet been edited. Author Manuscript Published OnlineFirst on November 11, 2014; DOI: 10.1158/0008-5472.CAN-14-1041
6
Cell growth assays
To determine the rate of growth in the presence of miRNA mimics, 2.3 x10⁵ MCF7:2A
cells/ml were seeded into 6-well plates. The following day, the cells were transfected
with 20 pmol of let-7c, miR-99a, or miR-125b miRIDIAN microRNA Mimics
(ThermoFisher) or a negative control using the Lipofectamine RNAiMAX transfection
reagent (Life Technologies, Inc.) following the manufacturer’s protocol. The cells were
incubated at 37°C under 5% CO2, passaged into 96-well plates the following day (day 0),
and allowed to proliferate. Triplicate wells were counted on days 1, 3, and 5 to determine
the rate of growth.
Luciferase assays
A total of 3 x 10⁴ HEK 293 cells were seeded into 96-well plates. Twenty-four hours
after plating, the cells were transfected with a psiCHECK2 vector encoding the entire 3’
UTR of HER2 fused downstream of the renilla luciferase gene and the firefly luciferase
gene as a reporter with Lipofectamine 2000 following the manufacturer’s instructions.
After incubation for 48 h, the cells were lysed in 1X Passive Lysis Buffer and assayed
with the Dual-Luciferase® Reporter Assay System (Promega) to measure the renilla
luciferase activity and that of firefly luciferase, which served as a transfection control.
Ago1 RNA immunoprecipitation
The Ago1 complex was immunoprecipitated as described in (19). Briefly, A total of 2 x
106 MCF7 and MCF7:2A cells in the growth phase were seeded in 10 cm plates. After 24
h, the cells were harvested in 400 μl lysis buffer (100 mM KCl, 5 mM MgCl2, 10 mM HEPES, pH 7.0, 0.5% Nonidet P-40) supplemented with 100 U/ml RNase Out on March 20, 2016. © 2014 American Association for Cancer Research.cancerres.aacrjournals.org Downloaded from
Author manuscripts have been peer reviewed and accepted for publication but have not yet been edited. Author Manuscript Published OnlineFirst on November 11, 2014; DOI: 10.1158/0008-5472.CAN-14-1041
7
(Invitrogen Cat# 10777-019) and Complete Protease Inhibitor Cocktail (Roche). The lysates were centrifuged, and 50 μl was set aside for input. A total of 2 μg anti-Ago1 antibody (Abcam #ab5070) was prebound to protein A Dynabeads (Life Technologies). The antibody and lysate mixture was incubated overnight at 4°C. The next morning, the beads were collected by magnetic separation, and they were treated with DNaseI in NT2 buffer (50 mM Tris, pH 7.4, 150 mM NaCl, 1 mM MgCl2, and 0.05% Nonidet P-40) for 10 min at 37°C. The beads were then washed twice with NT2 buffer, treated with proteinase K to digest protein, and resuspended in 300 μl acid-phenol:chloroform (Ambion). The solution was centrifuged for 1 min at 14,000 rpm at RT, the upper layer was collected, and the RNA was ethanol precipitated in the presence of GlycoBlue (Life Technologies, Inc.). The obtained RNA was resuspended in 30 ml water and used to generate cDNA and subsequent RT-PCR analysis. Transfection and Immunoblotting
MCF7 and MCF7:2A cells were transfected with 20 pmol of miRIDIAN microRNA anti-
miRs or miRNA mimics as described above. Cells were incubated for five days, and
whole-cell extracts were then harvested in RIPA buffer (Tris-Buffered Saline, 1%
Nonidet P-40, 0.5% sodium deoxycholate, 0.1% SDS, 0.004% sodium azide). Protein
lysates were quantified using the BCA Protein Assay Kit (Pierce), and they were then
separated in 4-12% NuPAGE Bis-Tris SDS/PAGE Protein Gels (Life Technologies)
followed by transfer onto a PVDF membrane. The membrane was blotted with anti-
HER2 (2165; Cell Signaling Technologies) and β-actin (4967; Cell Signaling
Technologies) antibodies followed by incubation with a secondary donkey anti-rabbit
on March 20, 2016. © 2014 American Association for Cancer Research.cancerres.aacrjournals.org Downloaded from
Author manuscripts have been peer reviewed and accepted for publication but have not yet been edited. Author Manuscript Published OnlineFirst on November 11, 2014; DOI: 10.1158/0008-5472.CAN-14-1041
8
antibody (Pierce). The blots were developed using the Western Blotting Luminol Reagent
(Santa Cruz).
Patient sample analysis For patient sample analysis, data were extracted from the Breast Invasive Carcinoma
provisional dataset in The Cancer Genome Atlas (TCGA) using the cBioPortal for Cancer
Genomics CGDS-R version 1.1.19 package in R version 3.0.2. Kaplan-Meir analysis was
performed using the Survival package version 2.37-7, and significance was determined
using the log-rank test.
RESULTS
miRNAs are differentially expressed in MCF7:2A vs. MCF7 cells
To identify candidate miRNAs that may play a role in endocrine resistance, we
compared miRNA expression between estrogen-dependent MCF7 cells and the estrogen-
independent derivative cell line MCF7:2A using the nCounter NanoString platform.
Using RNA derived from MCF7 and MCF7:2A cells under standard culturing conditions,
we found that a number of miRNAs are differentially expressed (Figure 1A). Of the 800
miRNAs assayed by this method, 78 (9.8%) had significant differential expression (p <
0.05, 1.5 fold) in the two cell lines including 54 that were downregulated and 24 that
were upregulated in MCF7:2A cells as compared with MCF7 cells (Table 1). Of these
miRNAs, 57 are located within annotated sequences including coding and noncoding
RNAs, and 21 are intergenic (Table 1). The top upregulated miRNA was miR-148a (fold
change: 10.6, p-value: 3.9 x 10⁻²⁰), and the top downregulated miRNA was miR-99a (fold
change: -19.7, p-value: 5.1 x 10⁻²⁵; Figure 1B). We found that the miR-17-92a cluster,
previously been shown to be regulated by ER was upregulated, and that miR-221/-222,
on March 20, 2016. © 2014 American Association for Cancer Research.cancerres.aacrjournals.org Downloaded from
Author manuscripts have been peer reviewed and accepted for publication but have not yet been edited. Author Manuscript Published OnlineFirst on November 11, 2014; DOI: 10.1158/0008-5472.CAN-14-1041
9
which was previously shown to regulate ER expression, was downregulated (16, 20) in
MCF7:2A vs. MCF7 cells. In addition, the clusters miR-497/miR-195, miR-590-3p/miR-
590-5p, and miR-30e/miR-30e were significantly upregulated in MCF7:2A cells, while
the let-7c/miR-99a/miR-125b cluster was downregulated (Supplementary Figure 1).
Because the ER is responsible for the transcriptional regulation of genomic targets
in MCF7 and MCF7:2A cells (3, 21), we next sought to determine which of the
differentially expressed miRNAs are direct ER targets. ER binding sites are located
within 30 kb for 965 of the 1,595 miRNAs annotated in miRBase (version 19), including
631 miRNAs contained within the introns of coding or noncoding RNAs and 334 in
intergenic regions. Of the miRNAs with an ER binding site within 30 kb of their start
sites, 47 were differentially expressed in MCF7 vs. MCF7:2A. When we examined the
ER binding sites located near miRNAs with decreased expression in MCF7:2A, we found
that binding at these sites is also lost despite significant ER binding at other sites within
these cells (Supplementary Figure 2).
The miR-7c locus is downregulated in MCF7:2A cells
The most significantly underexpressed miRNA in MCF7:2A cells compared with
parental MCF7 cells is miR-99a. This miRNA is encoded in the intronic sequence of the
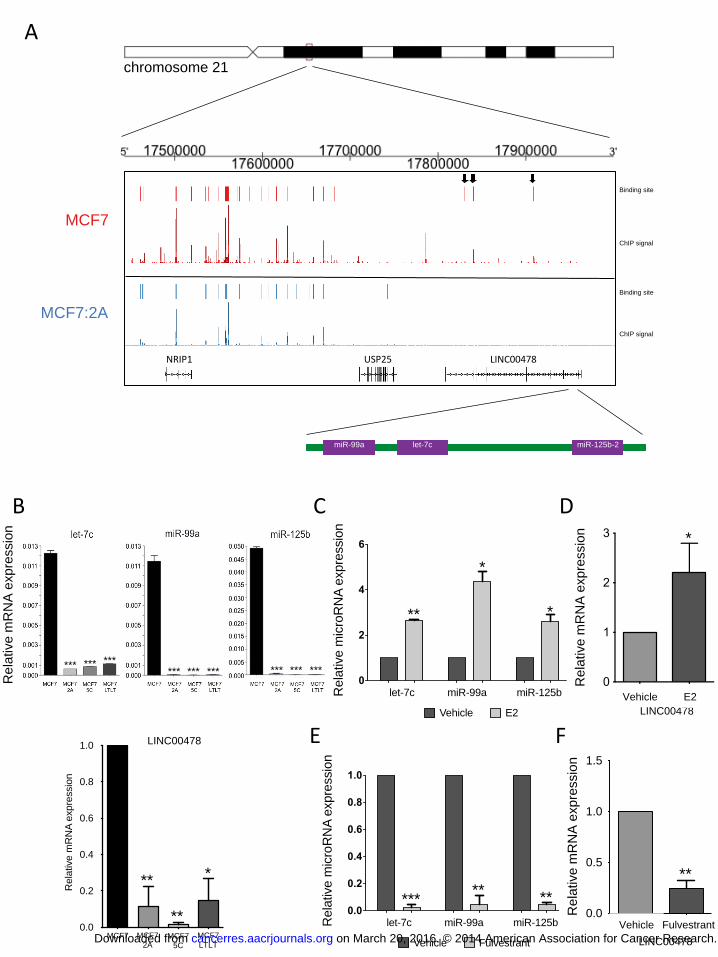
long non-coding RNA (lncRNA) LINC00478 together with let-7c and miR-125b (Figure
2A), which are also downregulated in MCF7:2A cells (Figure 1). Examination of ER
binding near this miRNA cluster demonstrates that there is a loss of ER binding activity
at this locus in MCF7:2A vs. MCF7 cells (Figure 2A). Interestingly, ER binding at the
nearby NRIP1 gene is not lost.
on March 20, 2016. © 2014 American Association for Cancer Research.cancerres.aacrjournals.org Downloaded from
Author manuscripts have been peer reviewed and accepted for publication but have not yet been edited. Author Manuscript Published OnlineFirst on November 11, 2014; DOI: 10.1158/0008-5472.CAN-14-1041
10
All three miRNAs in this cluster are also downregulated in two additional
estrogen-independent derivatives of MCF7 cells, MCF7:5C and MCF7:LTLT (Figure
2B) (22, 23). The downregulation of these miRNAs parallels the expression of their
primary transcript LINC00478 in MCF7 vs. MCF7:2A, MCF7:5C, and MCF7:LTLT
cells (Figure 2B, bottom panel). To determine whether these miRNAs and primary
transcript are estrogen regulated, we measured their expression in response to E2.
Treatment of MCF7 cells with E2 for 3 h demonstrated an increased in let-7c, miR-99a,
miR-125b, and LINC00478 (Figure 2C, D). Conversely, treatment with the ER antagonist
fulvestrant led to a decrease in the level of LINC00478 (Figure 2F) and the cluster
miRNAs (Figure 2E), suggesting that ER regulates this lncRNA together with the
miRNA cluster.
The let-7c/miR-99a/miR-125b cluster is underexpressed in luminal B breast cancers
and subset of luminal A tumors that demonstrate poor outcome
We next sought to determine whether the let-7c/miR-99a/miR-125b cluster is
clinically relevant. We first examined the expression of these miRNAs in patient samples
derived from The Cancer Genome Atlas (TCGA) for which mRNA and miRNA
expression profiling was performed (285 cases). The let-7c, miR-99a, and miR-125b
expression levels were highly correlated in the patient samples (r = 0.84 for let-7c/miR-
99a; r = 0.73 for let-7c/miR-125b; r = 0.71 for miR-99a/miR-125b; Supplementary
Figure 3). We next segregated the patient samples into clinical subgroups based on
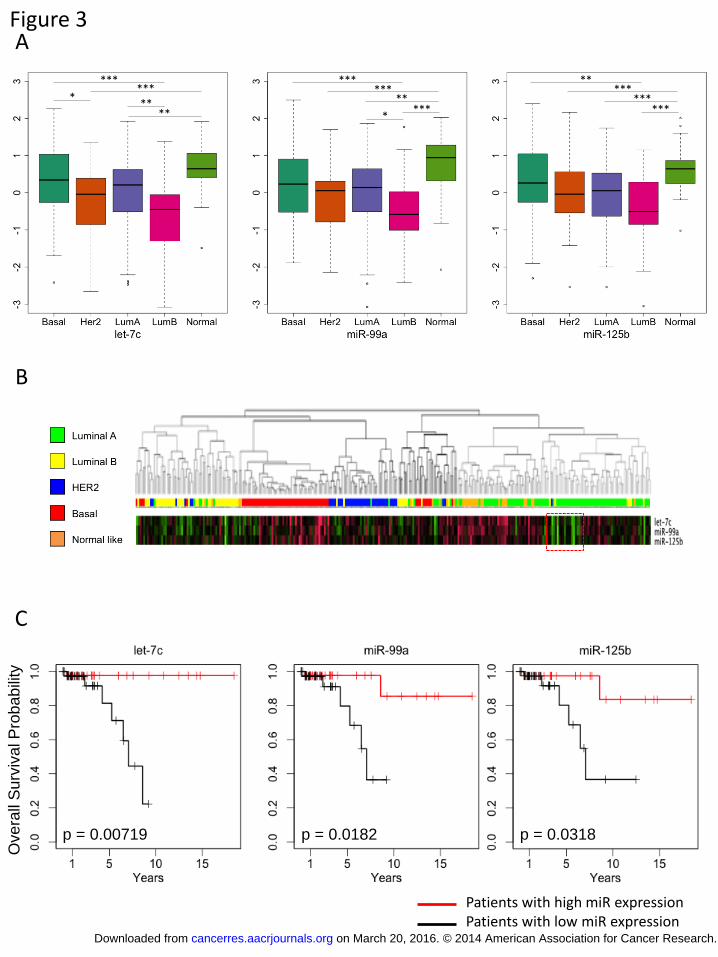
PAM50 classification (24) and then examined the expression level of let-7c, miR-99a, and miR-125b in the different clinical subgroups. The expression of all three miRNAs
was highest in normal-like tumors and lowest in luminal B cancers (Figure 3A). In the
on March 20, 2016. © 2014 American Association for Cancer Research.cancerres.aacrjournals.org Downloaded from
Author manuscripts have been peer reviewed and accepted for publication but have not yet been edited. Author Manuscript Published OnlineFirst on November 11, 2014; DOI: 10.1158/0008-5472.CAN-14-1041

11
luminal A and luminal B subsets, which comprise most of the ER+ breast cancers, we
found a significant decrease in the let-7c and miR-99a expression level in luminal B
compared with luminal A tumors (p < 0.001 and p < 0.01, respectively) and a trend
toward reduced miR-125b expression in these same subsets. Interestingly, within the
luminal A subset, we observed a significant fraction with low levels of the expression of
these miRNAs (Figure 3B).
We next sought to determine whether the let-7c/miR-99a/miR-125b cluster was
correlated with the clinical outcome of each of the different subsets. While no correlation
was found between the expression of these miRNAs and outcome in the basal, Her2,
luminal B, and normal-like subsets (Supplementary Figure 4), there was significant
correlation between the expression of the let-7c/miR-99a/miR-125b cluster and overall
survival in the luminal A subset (Figure 3C). Patients in the luminal A subset who
express higher levels of these miRNAs have significantly better survival than those
expressing lower levels of miR-99a, let-7c, and miR-125b (Figure 3C). Furthermore, the
low-expressing luminal A subset has a similar outcome as luminal B patients
(Supplementary Figure 5). Because low expression of this cluster in patients with luminal
A breast cancer indicates poor outcome and the luminal B subset is characterized by the
low expression of this cluster and poor outcome (24), these data suggest that low let-7c/miR-99a/miR-125b expression is predictive of poor outcome for ER+ patients.
let-7c, miR-99a, and miR-125b inhibit MCF7:2A cell growth and target HER2
We next sought to determine whether the let-7c/miR-99a/miR-125b cluster has an
effect on cell growth. MCF7:2A cells were transfected with each of the individual
miRNAs, and the number of cells was counted every other day for five days. While there
on March 20, 2016. © 2014 American Association for Cancer Research.cancerres.aacrjournals.org Downloaded from
Author manuscripts have been peer reviewed and accepted for publication but have not yet been edited. Author Manuscript Published OnlineFirst on November 11, 2014; DOI: 10.1158/0008-5472.CAN-14-1041
12
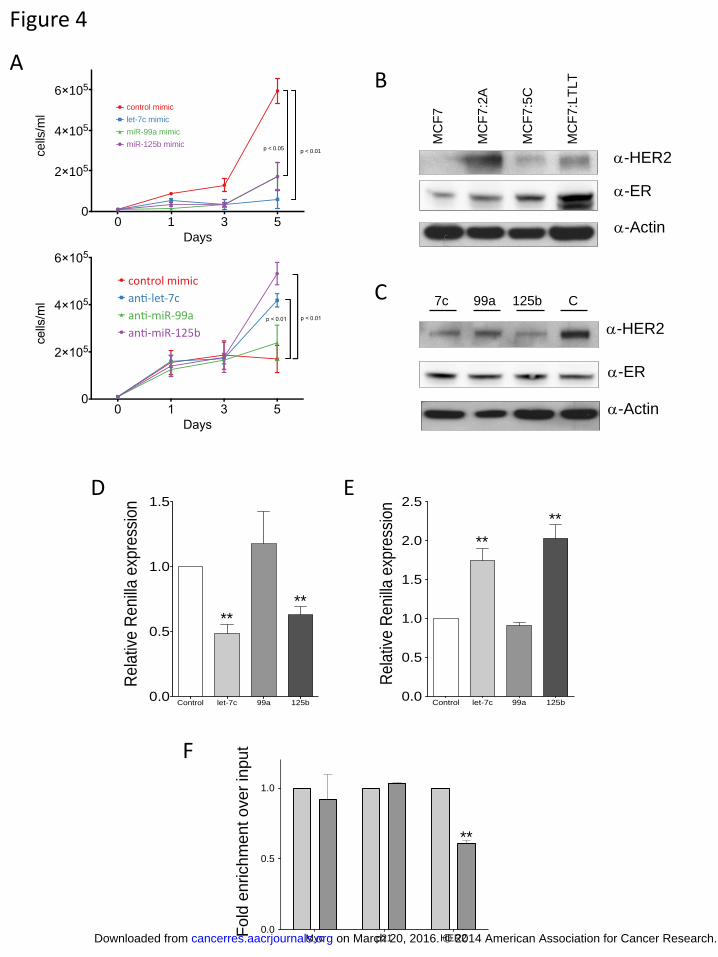
was little to no difference in the growth rate of MCF7:2A cells transfected with a miRNA
mimic control compared with untransfected cells, there was a significant decrease in the
growth rate of cells transfected with miRNA mimics for let-7c, miR-99a and miR-125b
(Figure 4A, top panel). In addition, when we transfected MCF7 cells with anti-miRs
targeting each of the miRNAs we found that anti-miRs directed against let-7c and miR-
125b significantly increased the growth of MCF7 cells, while the growth effects of anti-
miR-99a were not insignificant. Together, these data suggest that loss of the let-7c/miR-
99a/miR-125b cluster in MCF7:2A cells provides a growth advantage by permitting the
expression of downstream miRNA targets.
We next sought to identify targets that may be responsible for the growth of these
cells. A previous study reported that miR-125b targets HER2 in an in vitro system (25).
HER2 has also been shown to be responsible for the growth and activity of MCF7 cells
that have been selected for estrogen-independent growth (22, 26) and is expressed at a
higher level in MCF7:2A, MCF7:5C, and MCF7:LTLT cells compared with MCF7 cells.
This expression pattern is in contrast with the level of ER protein expression, which is
similar in the MCF7, MCF7:2A, and MCF7:5C cells and elevated in the MCF7:LTLT
cells (Figure 4B). To determine whether HER2 protein expression is under miRNA
control, we transfected MCF7:2A cells with miRNA mimics and measured the HER2
protein expression level in these cells after a period of five days. As expected, the miR-
125 mimic led to a decrease in HER2 protein expression as measured by western blot
(Figure 4C), whereas the miR-99a mimic had little to no effect; however, let-7c also led
to a decrease in HER2 protein expression (Figure 4C). In addition, we found a significant
decrease in the level of HER2 mRNA expression with let-7c overexpression
on March 20, 2016. © 2014 American Association for Cancer Research.cancerres.aacrjournals.org Downloaded from
Author manuscripts have been peer reviewed and accepted for publication but have not yet been edited. Author Manuscript Published OnlineFirst on November 11, 2014; DOI: 10.1158/0008-5472.CAN-14-1041
13
(Supplementary Figure 6). In contrast, no difference in HER2 mRNA level was found for
miR-125b overexpression as changes in mRNA level need not correlate with miRNA-
mediated changes in protein expression. To further confirm that the HER2 protein is
targeted by these miRNAs, we cloned the 3’-UTR of HER2, the gene that encodes the
HER2 protein, downstream of renilla luciferase and determined changes in the level of
luciferase activity in the presence of the mimics and anti-miRs of this miRNA cluster.
Co-transfection of the HER2-UTR luciferase plasmid with let-7c led to a decrease in
reporter expression that was similar to that for miR-125b. In contrast, transfection with
the mimic for miR-99a had no effect (Figure 4D). In addition, co-transfection of the
HER2 3’-UTR luciferase reporter with anti-miRs confirmed that let-7c and miR-125b act
through the HER2 3’-UTR (Figure 4E). These data suggest that let-7c and miR-125b
regulate HER2 at the protein level. In contrast to miR-125b, which has been previously
demonstrated to directly target the HER2 3’-UTR, let-7c is not predicted to target the
HER2 3’-UTR. Thus, we attempted to determine the sequences targeted by let-7c in the
HER2 3’-UTR by examining sites predicted by the Probability of Interaction by Target
Accessibility (PITA) algorithm, which takes into account the free energy of base pair
binding for potential sites (27)(Supplementary Figure 7A). However, mutation of these
sites could not block the let-7c mediated reduction in luciferase activity, suggesting that
the effects on the HER2 3’-UTR mediated by let-7c may be indirect (Supplementary
Figure 7B). In examining targets previously reported to be regulated by let-7c that could
mediate the effects of let-7c on HER2 expression, we found that there is strong
downregulation of Dicer mediated by let-7c overexpression (Supplementary Figure 7C).
This observation suggests that the mechanism involved in upregulated HER2 protein
on March 20, 2016. © 2014 American Association for Cancer Research.cancerres.aacrjournals.org Downloaded from
Author manuscripts have been peer reviewed and accepted for publication but have not yet been edited. Author Manuscript Published OnlineFirst on November 11, 2014; DOI: 10.1158/0008-5472.CAN-14-1041
14
expression in patients in response to let-7c overexpression includes a reduction in Dicer
protein.
To further confirm that the HER2 gene is regulated by miRNAs in MCF7 cells,
we examined its association with the Ago1 complex, which plays a role in translational
silencing mediated by miRNA. We performed immunoprecipitation of the Ago1 complex
in MCF7 and MCF7:2A cells and measured the level of associated HER2 mRNA (Figure
4F). In contrast to the levels of the Myc or p21 mRNA in the Ago1 complex which are
equivalent in MCF7 and MCF7:2A cells, the level of HER2 mRNA associated with the
Ago1 complex is significantly reduced in MCF7:2A cells compared with MCF7 cells.
These data support the conclusion that there is less miRNA-mediated regulation of HER2
expression in MCF7:2A cells compared with MCF7 cells, leading to greater HER2
protein expression in these cells.
HER2 protein expression and activity is negatively correlated with let-7c expression
In order to validate our cell model findings in actual patient samples, we
examined whether there is a correlation between HER2 protein expression and activity
and the expression of let-7c and miR-125b miRNAs in patient samples using HER2
protein expression and phosphorylation data obtained from the TCGA cohort (Figure 5
and Supplementary Figure 7). We found that let-7c levels are significantly negatively
correlated with HER2 protein expression (Figure 5A; r = -0.28) in the luminal A subset
of patients. In addition, there was a similar negative correlation with the expression of the
Tyr1248 phosphorylated form of HER2 (Figure 5B; r= -0.16), suggesting that HER2
expression and activity are negatively regulated by the miRNA let-7c. In contrast, no
significant correlation was found between miR-125b and HER2 protein expression or
on March 20, 2016. © 2014 American Association for Cancer Research.cancerres.aacrjournals.org Downloaded from
Author manuscripts have been peer reviewed and accepted for publication but have not yet been edited. Author Manuscript Published OnlineFirst on November 11, 2014; DOI: 10.1158/0008-5472.CAN-14-1041
15
activity (Supplementary Figure 7). These data suggest that let-7c may be an important
determinant of HER2 protein expression and pathway activation in ER+ breast cells.
DISCUSSION
Understanding the factors underlying the acquisition of endocrine resistance in
ER+ breast cancers not only allows for the prediction of outcome but more importantly
may identify novel therapeutic strategies to overcome resistance. Expression profiling of
mRNA genes has provided important insights into both breast cancer subtypes and
increased precision in predicting which patients may benefit from endocrine therapy (4,
28). More recently, miRNA expression levels have been explored both for predictive
biomarker development and therapeutic target identification. Expression of miRNAs has
been reported to be generally decreased during cancer progression (9). By examining the
miRNA expression profile of cell lines modeling estrogen-dependent and estrogen-
independent ER+ cancers, we found that expression of the let-7c/miR-99a/miR-125b
cluster is decreased during the progression to endocrine resistance. In data derived from a
large cohort of primary breast cancers, this miRNA cluster was found to be uniformly
reduced in luminal B tumors, a subset characterized by its aggressiveness, lower ER
expression and poorer survival in comparison with luminal A cancers (6, 29, 30). More
significantly, luminal A tumors, which generally have more favorable outcome and a
better response to endocrine therapy (31, 32), could be subdivided based on the
expression of this miRNA cluster. High cluster expression led to characteristically
favorable outcome, whereas low cluster expression reflected patients with poor outcome.
Patient outcome could be directly related to the proteins targeted by the
differentially expressed miRNAs; thus, we examined the expression of HER2, which was
on March 20, 2016. © 2014 American Association for Cancer Research.cancerres.aacrjournals.org Downloaded from
Author manuscripts have been peer reviewed and accepted for publication but have not yet been edited. Author Manuscript Published OnlineFirst on November 11, 2014; DOI: 10.1158/0008-5472.CAN-14-1041
16
previously described as a miR-125b target. Surprisingly, we found that let-7c also
regulates HER2 expression. We found a negative correlation between let-7c miRNA
expression and the expression of HER2 protein and phosphorylated HER2 in TCGA
patient samples, but no correlation was found for miR-125b. These data suggest that let-
7c may be the most clinically relevant miRNA within the let-7c/miR-99a/miR-125b
cluster. HER2 expression has been correlated with the expression of lin28 and its
homolog lin28b (33). These proteins bind the stem loop of let-7 family member
precursors to directly inhibit the Drosha- and Dicer-mediated processing of their primary-
miRNA precursors into mature let-7 miRNAs (34-38). Moreover, Lin28 expression
determines the expression of the let-7 family in tumors and cell lines (33, 39).
Previous studies have shown that the let-7 family controls the cell cycle, is
associated with increased proliferation, and blocks tumorigenicity (40-42). Moreover,
Lin28 is transcriptionally regulated by Myc, which is an ER-regulated gene that is
upregulated with progression to hormone independence (43, 44). This protein is also
targeted by let-7, suggesting a regulatory loop involving Lin28, let-7, and Myc (45-47).
As we found that let-7c could also target HER2, our data suggest that let-7 family
members may be directly involved in the regulation of HER2 in Lin28-negative breast
tumors.
Because many mRNAs are predicted to be targeted by the let-7c/miR-99a/miR-
125b cluster, other targets of these miRNAs may also be significantly regulated in breast
cancer. The mTOR protein, which is a downstream effector of the PI3K pathway (48),
has been reported to be regulated by miR-99a (49); thus, it would be interesting to
determine whether this miR-99a targets the expression of mTOR, which has also been
on March 20, 2016. © 2014 American Association for Cancer Research.cancerres.aacrjournals.org Downloaded from
Author manuscripts have been peer reviewed and accepted for publication but have not yet been edited. Author Manuscript Published OnlineFirst on November 11, 2014; DOI: 10.1158/0008-5472.CAN-14-1041
17
reported to play a role in endocrine resistance (50-52). In addition, all three miRNAs are
predicted to target insulin-like growth factor 1 receptor (IGF1R), which is a growth factor
receptor that, like HER2, has been reported to be upregulated in estrogen-deprived breast
cancer cells and is thought to be responsible for breast cancer cell signaling pathways.
Thus, loss of expression of this miRNA cluster may play a role in the acquisition of
endocrine resistance through the upregulation of multiple growth factor signaling
pathways.
In summary, we have identified a number of miRNAs differentially expressed in
estrogen-dependent vs. estrogen-independent cells and have demonstrated that the let-
7c/miR-99a/miR-125b cluster is group of miRNAs that regulate HER2 protein expression
and when lost may lead to worse outcome for patients with luminal A tumors.
ACKNOWLEDGEMENTS The authors would like thank Dr. Dipanjan Chowdhury and his laboratory for helpful discussions for the miRNA experiments. We would also like to thank Drs. V. Craig Jordan and Angela Brodie for providing the estrogen-independent MCF7 cell lines. This study was supported by grants from Susan G. Komen for the Cure (to MB),
the NCI (P01 CA080111 to MB) and NIDDK (R01 DK074967 to MB). REFERENCES 1. Charpentier AH, Bednarek AK, Daniel RL, Hawkins KA, Laflin KJ, Gaddis S, et al. Effects of estrogen on global gene expression: identification of novel targets of estrogen action. Cancer research. 2000;60:5977-83.
on March 20, 2016. © 2014 American Association for Cancer Research.cancerres.aacrjournals.org Downloaded from
Author manuscripts have been peer reviewed and accepted for publication but have not yet been edited. Author Manuscript Published OnlineFirst on November 11, 2014; DOI: 10.1158/0008-5472.CAN-14-1041

18
2. Frasor J, Danes JM, Komm B, Chang KC, Lyttle CR, Katzenellenbogen BS. Profiling of estrogen up- and down-regulated gene expression in human breast cancer cells: insights into gene networks and pathways underlying estrogenic control of proliferation and cell phenotype. Endocrinology. 2003;144:4562-74. 3. Carroll JS, Meyer CA, Song J, Li W, Geistlinger TR, Eeckhoute J, et al. Genome-wide analysis of estrogen receptor binding sites. Nature genetics. 2006;38:1289-97. 4. Perou CM, Sorlie T, Eisen MB, van de Rijn M, Jeffrey SS, Rees CA, et al. Molecular portraits of human breast tumours. Nature. 2000;406:747-52. 5. Sorlie T, Tibshirani R, Parker J, Hastie T, Marron JS, Nobel A, et al. Repeated observation of breast tumor subtypes in independent gene expression data sets. Proceedings of the National Academy of Sciences of the United States of America. 2003;100:8418-23. 6. Sorlie T, Perou CM, Tibshirani R, Aas T, Geisler S, Johnsen H, et al. Gene expression patterns of breast carcinomas distinguish tumor subclasses with clinical implications. Proceedings of the National Academy of Sciences of the United States of America. 2001;98:10869-74. 7. Medina PP, Slack FJ. microRNAs and cancer: an overview. Cell cycle. 2008;7:2485-92.
on March 20, 2016. © 2014 American Association for Cancer Research.cancerres.aacrjournals.org Downloaded from
Author manuscripts have been peer reviewed and accepted for publication but have not yet been edited. Author Manuscript Published OnlineFirst on November 11, 2014; DOI: 10.1158/0008-5472.CAN-14-1041
19
8. Taft RJ, Pang KC, Mercer TR, Dinger M, Mattick JS. Non-coding RNAs: regulators of disease. The Journal of pathology. 2010;220:126-39. 9. Lu J, Getz G, Miska EA, Alvarez-Saavedra E, Lamb J, Peck D, et al. MicroRNA expression profiles classify human cancers. Nature. 2005;435:834-8. 10. Mulrane L, McGee SF, Gallagher WM, O'Connor DP. miRNA dysregulation in breast cancer. Cancer research. 2013;73:6554-62. 11. Dvinge H, Git A, Graf S, Salmon-Divon M, Curtis C, Sottoriva A, et al. The shaping and functional consequences of the microRNA landscape in breast cancer. Nature. 2013;497:378-82. 12. Iorio MV, Ferracin M, Liu CG, Veronese A, Spizzo R, Sabbioni S, et al. MicroRNA gene expression deregulation in human breast cancer. Cancer research. 2005;65:7065-70. 13. O'Day E, Lal A. MicroRNAs and their target gene networks in breast cancer. Breast cancer research : BCR. 2010;12:201. 14. Bhat-Nakshatri P, Wang G, Collins NR, Thomson MJ, Geistlinger TR, Carroll JS, et al. Estradiol-regulated microRNAs control estradiol response in breast cancer cells. Nucleic acids research. 2009;37:4850-61.
on March 20, 2016. © 2014 American Association for Cancer Research.cancerres.aacrjournals.org Downloaded from
Author manuscripts have been peer reviewed and accepted for publication but have not yet been edited. Author Manuscript Published OnlineFirst on November 11, 2014; DOI: 10.1158/0008-5472.CAN-14-1041
20
15. Wickramasinghe NS, Manavalan TT, Dougherty SM, Riggs KA, Li Y, Klinge CM. Estradiol downregulates miR-21 expression and increases miR-21 target gene expression in MCF-7 breast cancer cells. Nucleic acids research. 2009;37:2584-95. 16. Castellano L, Giamas G, Jacob J, Coombes RC, Lucchesi W, Thiruchelvam P, et al. The estrogen receptor-alpha-induced microRNA signature regulates itself and its transcriptional response. Proceedings of the National Academy of Sciences of the United States of America. 2009;106:15732-7. 17. Klinge CM. Estrogen Regulation of MicroRNA Expression. Current genomics. 2009;10:169-83. 18. Brumbaugh CD, Kim HJ, Giovacchini M, Pourmand N. NanoStriDE: normalization and differential expression analysis of NanoString nCounter data. BMC bioinformatics. 2011;12:479. 19. Moskwa P, Buffa FM, Pan Y, Panchakshari R, Gottipati P, Muschel RJ, et al. miR-182-mediated downregulation of BRCA1 impacts DNA repair and sensitivity to PARP inhibitors. Molecular cell. 2011;41:210-20. 20. Zhao JJ, Lin J, Yang H, Kong W, He L, Ma X, et al. MicroRNA-221/222 negatively regulates estrogen receptor alpha and is associated with tamoxifen resistance in breast cancer. The Journal of biological chemistry. 2008;283:31079-86.
on March 20, 2016. © 2014 American Association for Cancer Research.cancerres.aacrjournals.org Downloaded from
Author manuscripts have been peer reviewed and accepted for publication but have not yet been edited. Author Manuscript Published OnlineFirst on November 11, 2014; DOI: 10.1158/0008-5472.CAN-14-1041

21
21. Magnani L, Stoeck A, Zhang X, Lanczky A, Mirabella AC, Wang TL, et al. Genome-wide reprogramming of the chromatin landscape underlies endocrine therapy resistance in breast cancer. Proceedings of the National Academy of Sciences of the United States of America. 2013;110:E1490-9. 22. Sabnis G, Schayowitz A, Goloubeva O, Macedo L, Brodie A. Trastuzumab reverses letrozole resistance and amplifies the sensitivity of breast cancer cells to estrogen. Cancer research. 2009;69:1416-28. 23. Pink JJ, Jiang SY, Fritsch M, Jordan VC. An estrogen-independent MCF-7 breast cancer cell line which contains a novel 80-kilodalton estrogen receptor-related protein. Cancer research. 1995;55:2583-90. 24. Parker JS, Mullins M, Cheang MC, Leung S, Voduc D, Vickery T, et al. Supervised risk predictor of breast cancer based on intrinsic subtypes. Journal of clinical oncology : official journal of the American Society of Clinical Oncology. 2009;27:1160-7. 25. Scott GK, Goga A, Bhaumik D, Berger CE, Sullivan CS, Benz CC. Coordinate suppression of ERBB2 and ERBB3 by enforced expression of micro-RNA miR-125a or miR-125b. The Journal of biological chemistry. 2007;282:1479-86. 26. Knowlden JM, Hutcheson IR, Jones HE, Madden T, Gee JM, Harper ME, et al. Elevated levels of epidermal growth factor receptor/c-erbB2 heterodimers mediate
on March 20, 2016. © 2014 American Association for Cancer Research.cancerres.aacrjournals.org Downloaded from
Author manuscripts have been peer reviewed and accepted for publication but have not yet been edited. Author Manuscript Published OnlineFirst on November 11, 2014; DOI: 10.1158/0008-5472.CAN-14-1041
22
an autocrine growth regulatory pathway in tamoxifen-resistant MCF-7 cells. Endocrinology. 2003;144:1032-44. 27. Kertesz M, Iovino N, Unnerstall U, Gaul U, Segal E. The role of site accessibility in microRNA target recognition. Nature genetics. 2007;39:1278-84. 28. Sorlie T. Molecular portraits of breast cancer: tumour subtypes as distinct disease entities. European journal of cancer. 2004;40:2667-75. 29. Loi S, Haibe-Kains B, Desmedt C, Lallemand F, Tutt AM, Gillet C, et al. Definition of clinically distinct molecular subtypes in estrogen receptor-positive breast carcinomas through genomic grade. Journal of clinical oncology : official journal of the American Society of Clinical Oncology. 2007;25:1239-46. 30. Creighton CJ. The molecular profile of luminal B breast cancer. Biologics : targets & therapy. 2012;6:289-97. 31. Rouzier R, Perou CM, Symmans WF, Ibrahim N, Cristofanilli M, Anderson K, et al. Breast cancer molecular subtypes respond differently to preoperative chemotherapy. Clinical cancer research : an official journal of the American Association for Cancer Research. 2005;11:5678-85. 32. Ignatiadis M, Sotiriou C. Luminal breast cancer: from biology to treatment. Nature reviews Clinical oncology. 2013;10:494-506.
on March 20, 2016. © 2014 American Association for Cancer Research.cancerres.aacrjournals.org Downloaded from
Author manuscripts have been peer reviewed and accepted for publication but have not yet been edited. Author Manuscript Published OnlineFirst on November 11, 2014; DOI: 10.1158/0008-5472.CAN-14-1041
23
33. Sakurai M, Miki Y, Masuda M, Hata S, Shibahara Y, Hirakawa H, et al. LIN28: a regulator of tumor-suppressing activity of let-7 microRNA in human breast cancer. The Journal of steroid biochemistry and molecular biology. 2012;131:101-6. 34. Newman MA, Thomson JM, Hammond SM. Lin-28 interaction with the Let-7 precursor loop mediates regulated microRNA processing. Rna. 2008;14:1539-49. 35. Piskounova E, Viswanathan SR, Janas M, LaPierre RJ, Daley GQ, Sliz P, et al. Determinants of microRNA processing inhibition by the developmentally regulated RNA-binding protein Lin28. The Journal of biological chemistry. 2008;283:21310-4. 36. Rybak A, Fuchs H, Smirnova L, Brandt C, Pohl EE, Nitsch R, et al. A feedback loop comprising lin-28 and let-7 controls pre-let-7 maturation during neural stem-cell commitment. Nature cell biology. 2008;10:987-93. 37. Viswanathan SR, Daley GQ, Gregory RI. Selective blockade of microRNA processing by Lin28. Science. 2008;320:97-100. 38. Heo I, Joo C, Cho J, Ha M, Han J, Kim VN. Lin28 mediates the terminal uridylation of let-7 precursor MicroRNA. Molecular cell. 2008;32:276-84. 39. Chang TC, Zeitels LR, Hwang HW, Chivukula RR, Wentzel EA, Dews M, et al. Lin-28B transactivation is necessary for Myc-mediated let-7 repression and
on March 20, 2016. © 2014 American Association for Cancer Research.cancerres.aacrjournals.org Downloaded from
Author manuscripts have been peer reviewed and accepted for publication but have not yet been edited. Author Manuscript Published OnlineFirst on November 11, 2014; DOI: 10.1158/0008-5472.CAN-14-1041

24
proliferation. Proceedings of the National Academy of Sciences of the United States of America. 2009;106:3384-9. 40. Yu F, Yao H, Zhu P, Zhang X, Pan Q, Gong C, et al. let-7 regulates self renewal and tumorigenicity of breast cancer cells. Cell. 2007;131:1109-23. 41. Bussing I, Slack FJ, Grosshans H. let-7 microRNAs in development, stem cells and cancer. Trends in molecular medicine. 2008;14:400-9. 42. Johnson CD, Esquela-Kerscher A, Stefani G, Byrom M, Kelnar K, Ovcharenko D, et al. The let-7 microRNA represses cell proliferation pathways in human cells. Cancer research. 2007;67:7713-22. 43. Miller TW, Balko JM, Ghazoui Z, Dunbier A, Anderson H, Dowsett M, et al. A gene expression signature from human breast cancer cells with acquired hormone independence identifies MYC as a mediator of antiestrogen resistance. Clinical cancer research : an official journal of the American Association for Cancer Research. 2011;17:2024-34. 44. Jeng MH, Shupnik MA, Bender TP, Westin EH, Bandyopadhyay D, Kumar R, et al. Estrogen receptor expression and function in long-term estrogen-deprived human breast cancer cells. Endocrinology. 1998;139:4164-74.
on March 20, 2016. © 2014 American Association for Cancer Research.cancerres.aacrjournals.org Downloaded from
Author manuscripts have been peer reviewed and accepted for publication but have not yet been edited. Author Manuscript Published OnlineFirst on November 11, 2014; DOI: 10.1158/0008-5472.CAN-14-1041
25
45. Lan FF, Wang H, Chen YC, Chan CY, Ng SS, Li K, et al. Hsa-let-7g inhibits proliferation of hepatocellular carcinoma cells by downregulation of c-Myc and upregulation of p16(INK4A). International journal of cancer Journal international du cancer. 2011;128:319-31. 46. Koscianska E, Baev V, Skreka K, Oikonomaki K, Rusinov V, Tabler M, et al. Prediction and preliminary validation of oncogene regulation by miRNAs. BMC molecular biology. 2007;8:79. 47. Sampson VB, Rong NH, Han J, Yang Q, Aris V, Soteropoulos P, et al. MicroRNA let-7a down-regulates MYC and reverts MYC-induced growth in Burkitt lymphoma cells. Cancer research. 2007;67:9762-70. 48. Cidado J, Park BH. Targeting the PI3K/Akt/mTOR pathway for breast cancer therapy. Journal of mammary gland biology and neoplasia. 2012;17:205-16. 49. Oneyama C, Ikeda J, Okuzaki D, Suzuki K, Kanou T, Shintani Y, et al. MicroRNA-mediated downregulation of mTOR/FGFR3 controls tumor growth induced by Src-related oncogenic pathways. Oncogene. 2011;30:3489-501. 50. Boulay A, Rudloff J, Ye J, Zumstein-Mecker S, O'Reilly T, Evans DB, et al. Dual inhibition of mTOR and estrogen receptor signaling in vitro induces cell death in models of breast cancer. Clinical cancer research : an official journal of the American Association for Cancer Research. 2005;11:5319-28.
on March 20, 2016. © 2014 American Association for Cancer Research.cancerres.aacrjournals.org Downloaded from
Author manuscripts have been peer reviewed and accepted for publication but have not yet been edited. Author Manuscript Published OnlineFirst on November 11, 2014; DOI: 10.1158/0008-5472.CAN-14-1041
26
51. Miller TW, Forbes JT, Shah C, Wyatt SK, Manning HC, Olivares MG, et al. Inhibition of mammalian target of rapamycin is required for optimal antitumor effect of HER2 inhibitors against HER2-overexpressing cancer cells. Clinical cancer research : an official journal of the American Association for Cancer Research. 2009;15:7266-76. 52. Baselga J, Campone M, Piccart M, Burris HA, 3rd, Rugo HS, Sahmoud T, et al. Everolimus in postmenopausal hormone-receptor-positive advanced breast cancer. The New England journal of medicine. 2012;366:520-9.
on March 20, 2016. © 2014 American Association for Cancer Research.cancerres.aacrjournals.org Downloaded from
Author manuscripts have been peer reviewed and accepted for publication but have not yet been edited. Author Manuscript Published OnlineFirst on November 11, 2014; DOI: 10.1158/0008-5472.CAN-14-1041
27
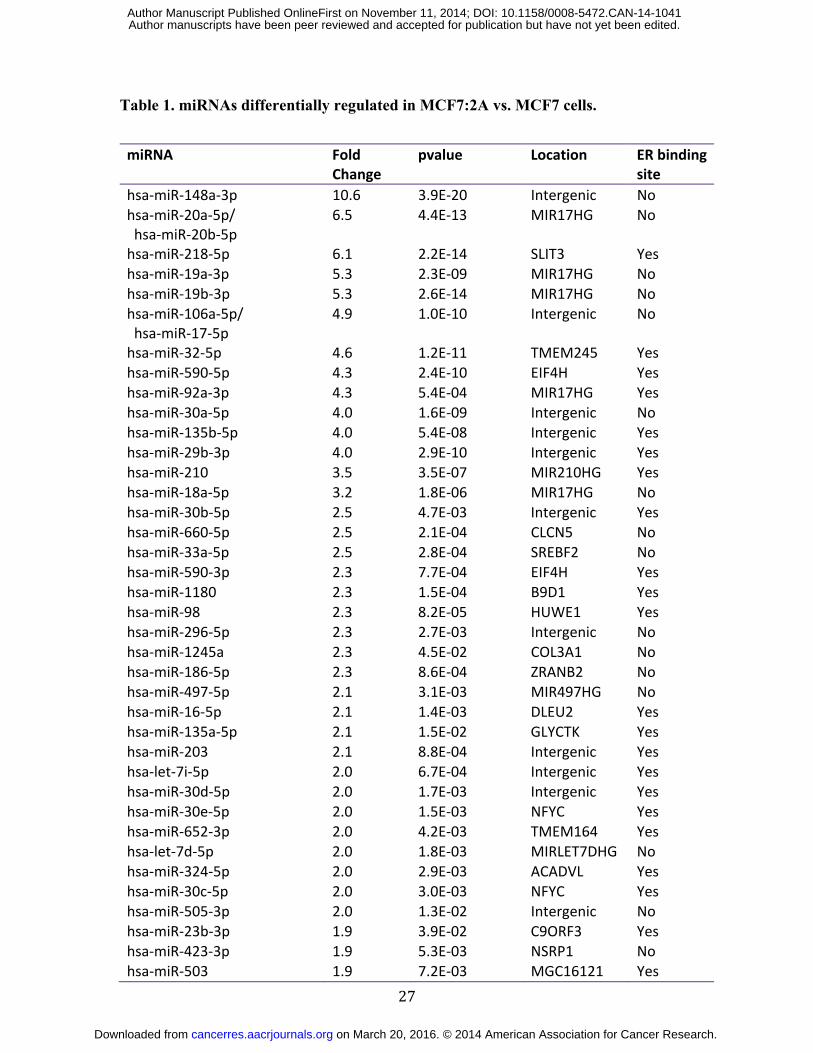
Table 1. miRNAs differentially regulated in MCF7:2A vs. MCF7 cells.
miRNA Fold Change
pvalue Location ER binding site
hsa-miR-148a-3p 10.6 3.9E-20 Intergenic No hsa-miR-20a-5p/ hsa-miR-20b-5p
6.5 4.4E-13 MIR17HG No
hsa-miR-218-5p 6.1 2.2E-14 SLIT3 Yes hsa-miR-19a-3p 5.3 2.3E-09 MIR17HG No hsa-miR-19b-3p 5.3 2.6E-14 MIR17HG No hsa-miR-106a-5p/ hsa-miR-17-5p
4.9 1.0E-10 Intergenic No
hsa-miR-32-5p 4.6 1.2E-11 TMEM245 Yes hsa-miR-590-5p 4.3 2.4E-10 EIF4H Yes hsa-miR-92a-3p 4.3 5.4E-04 MIR17HG Yes hsa-miR-30a-5p 4.0 1.6E-09 Intergenic No hsa-miR-135b-5p 4.0 5.4E-08 Intergenic Yes hsa-miR-29b-3p 4.0 2.9E-10 Intergenic Yes hsa-miR-210 3.5 3.5E-07 MIR210HG Yes hsa-miR-18a-5p 3.2 1.8E-06 MIR17HG No hsa-miR-30b-5p 2.5 4.7E-03 Intergenic Yes hsa-miR-660-5p 2.5 2.1E-04 CLCN5 No hsa-miR-33a-5p 2.5 2.8E-04 SREBF2 No hsa-miR-590-3p 2.3 7.7E-04 EIF4H Yes hsa-miR-1180 2.3 1.5E-04 B9D1 Yes hsa-miR-98 2.3 8.2E-05 HUWE1 Yes hsa-miR-296-5p 2.3 2.7E-03 Intergenic No hsa-miR-1245a 2.3 4.5E-02 COL3A1 No hsa-miR-186-5p 2.3 8.6E-04 ZRANB2 No hsa-miR-497-5p 2.1 3.1E-03 MIR497HG No hsa-miR-16-5p 2.1 1.4E-03 DLEU2 Yes hsa-miR-135a-5p 2.1 1.5E-02 GLYCTK Yes hsa-miR-203 2.1 8.8E-04 Intergenic Yes hsa-let-7i-5p 2.0 6.7E-04 Intergenic Yes hsa-miR-30d-5p 2.0 1.7E-03 Intergenic Yes hsa-miR-30e-5p 2.0 1.5E-03 NFYC Yes hsa-miR-652-3p 2.0 4.2E-03 TMEM164 Yes hsa-let-7d-5p 2.0 1.8E-03 MIRLET7DHG No hsa-miR-324-5p 2.0 2.9E-03 ACADVL Yes hsa-miR-30c-5p 2.0 3.0E-03 NFYC Yes hsa-miR-505-3p 2.0 1.3E-02 Intergenic No hsa-miR-23b-3p 1.9 3.9E-02 C9ORF3 Yes hsa-miR-423-3p 1.9 5.3E-03 NSRP1 No hsa-miR-503 1.9 7.2E-03 MGC16121 Yes
on March 20, 2016. © 2014 American Association for Cancer Research.cancerres.aacrjournals.org Downloaded from
Author manuscripts have been peer reviewed and accepted for publication but have not yet been edited. Author Manuscript Published OnlineFirst on November 11, 2014; DOI: 10.1158/0008-5472.CAN-14-1041
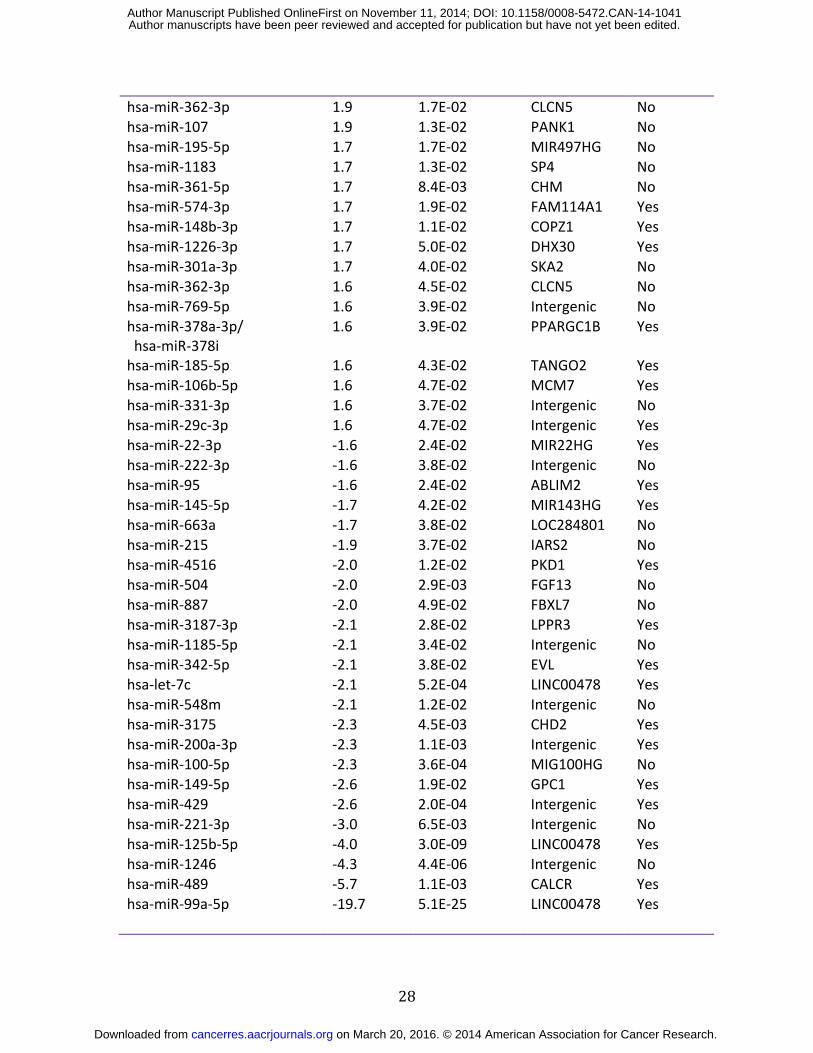
28
hsa-miR-362-3p 1.9 1.7E-02 CLCN5 No hsa-miR-107 1.9 1.3E-02 PANK1 No hsa-miR-195-5p 1.7 1.7E-02 MIR497HG No hsa-miR-1183 1.7 1.3E-02 SP4 No hsa-miR-361-5p 1.7 8.4E-03 CHM No hsa-miR-574-3p 1.7 1.9E-02 FAM114A1 Yes hsa-miR-148b-3p 1.7 1.1E-02 COPZ1 Yes hsa-miR-1226-3p 1.7 5.0E-02 DHX30 Yes hsa-miR-301a-3p 1.7 4.0E-02 SKA2 No hsa-miR-362-3p 1.6 4.5E-02 CLCN5 No hsa-miR-769-5p 1.6 3.9E-02 Intergenic No hsa-miR-378a-3p/ hsa-miR-378i
1.6 3.9E-02 PPARGC1B Yes
hsa-miR-185-5p 1.6 4.3E-02 TANGO2 Yes hsa-miR-106b-5p 1.6 4.7E-02 MCM7 Yes hsa-miR-331-3p 1.6 3.7E-02 Intergenic No hsa-miR-29c-3p 1.6 4.7E-02 Intergenic Yes hsa-miR-22-3p -1.6 2.4E-02 MIR22HG Yes hsa-miR-222-3p -1.6 3.8E-02 Intergenic No hsa-miR-95 -1.6 2.4E-02 ABLIM2 Yes hsa-miR-145-5p -1.7 4.2E-02 MIR143HG Yes hsa-miR-663a -1.7 3.8E-02 LOC284801 No hsa-miR-215 -1.9 3.7E-02 IARS2 No hsa-miR-4516 -2.0 1.2E-02 PKD1 Yes hsa-miR-504 -2.0 2.9E-03 FGF13 No hsa-miR-887 -2.0 4.9E-02 FBXL7 No hsa-miR-3187-3p -2.1 2.8E-02 LPPR3 Yes hsa-miR-1185-5p -2.1 3.4E-02 Intergenic No hsa-miR-342-5p -2.1 3.8E-02 EVL Yes hsa-let-7c -2.1 5.2E-04 LINC00478 Yes hsa-miR-548m -2.1 1.2E-02 Intergenic No hsa-miR-3175 -2.3 4.5E-03 CHD2 Yes hsa-miR-200a-3p -2.3 1.1E-03 Intergenic Yes hsa-miR-100-5p -2.3 3.6E-04 MIG100HG No hsa-miR-149-5p -2.6 1.9E-02 GPC1 Yes hsa-miR-429 -2.6 2.0E-04 Intergenic Yes hsa-miR-221-3p -3.0 6.5E-03 Intergenic No hsa-miR-125b-5p -4.0 3.0E-09 LINC00478 Yes hsa-miR-1246 -4.3 4.4E-06 Intergenic No hsa-miR-489 -5.7 1.1E-03 CALCR Yes hsa-miR-99a-5p -19.7 5.1E-25 LINC00478 Yes
on March 20, 2016. © 2014 American Association for Cancer Research.cancerres.aacrjournals.org Downloaded from
Author manuscripts have been peer reviewed and accepted for publication but have not yet been edited. Author Manuscript Published OnlineFirst on November 11, 2014; DOI: 10.1158/0008-5472.CAN-14-1041
29
FIGURE LEGENDS
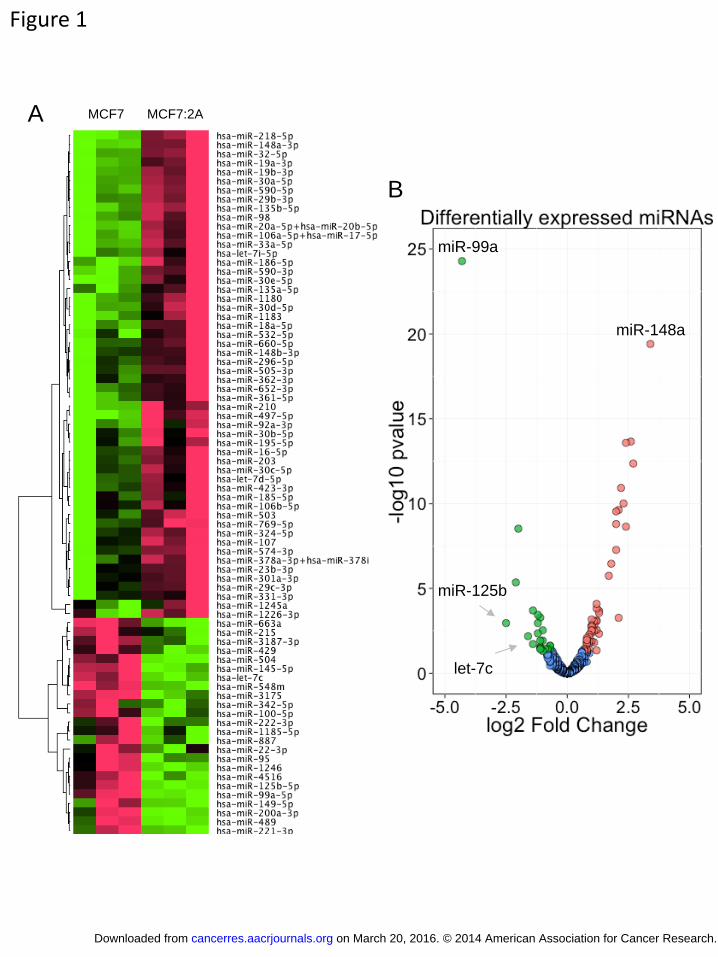
Figure 1. Differentially expressed miRNAs in MCF7:2A vs. MCF7 cells MCF7 and MCF7:2A cells were grown under standard culturing conditions, and small
RNAs were extracted from each cell line. Each sample was then assayed for the
expression of miRNA using nCounter NanoString assays. A) Heatmap demonstrating the
differentially expressed miRNAs found in the MCF7:2A and MCF7 cells including 54
upregulated and 24 downregulated miRNAs. B) Volcano plot demonstrating the profile
of the differentially expressed miRNAs in MCF7:2A vs. MCF7 cells. This plot
demonstrates the fold change (x-axis) and significance level expressed as the –log10 p-
value (y-axis). The green circles represent the miRNAs downregulated in the MCF7:2A
compared with MCF7 cells, and the red circles represent the miRNAs upregulated in the
MCF7:2A compared with MCF7 cells. The blue circles indicate miRNAs that were not
significantly expressed. Significance was determined with a p-value cutoff of 0.05 and a
1.5 fold change.
Figure 2. The let-7c/miR-99a/miR-125b cluster is regulated by the ER A) The top panel represents a schematic of the genomic location of the let-7c/miR-99a/miR-125b cluster within chromosome 21. The ER ChIP-Seq signal derived from both MCF7 (shown in red) and MCF7:2A (shown in blue) cells is shown demonstrating a loss of ER signal at the loci near the let-7c/miR-99a/miR-125b cluster. The ER binding sites within LINC00478 lost in MCF7:2A cells are indicated with arrows. B) The relative expression level of let-7c, miR-99a, and miR-125b (top) and LINC00478 (bottom) is shown in the MCF7, MCF7:2A, MCF7:5C, and MCF7:LTLT
on March 20, 2016. © 2014 American Association for Cancer Research.cancerres.aacrjournals.org Downloaded from
Author manuscripts have been peer reviewed and accepted for publication but have not yet been edited. Author Manuscript Published OnlineFirst on November 11, 2014; DOI: 10.1158/0008-5472.CAN-14-1041
30
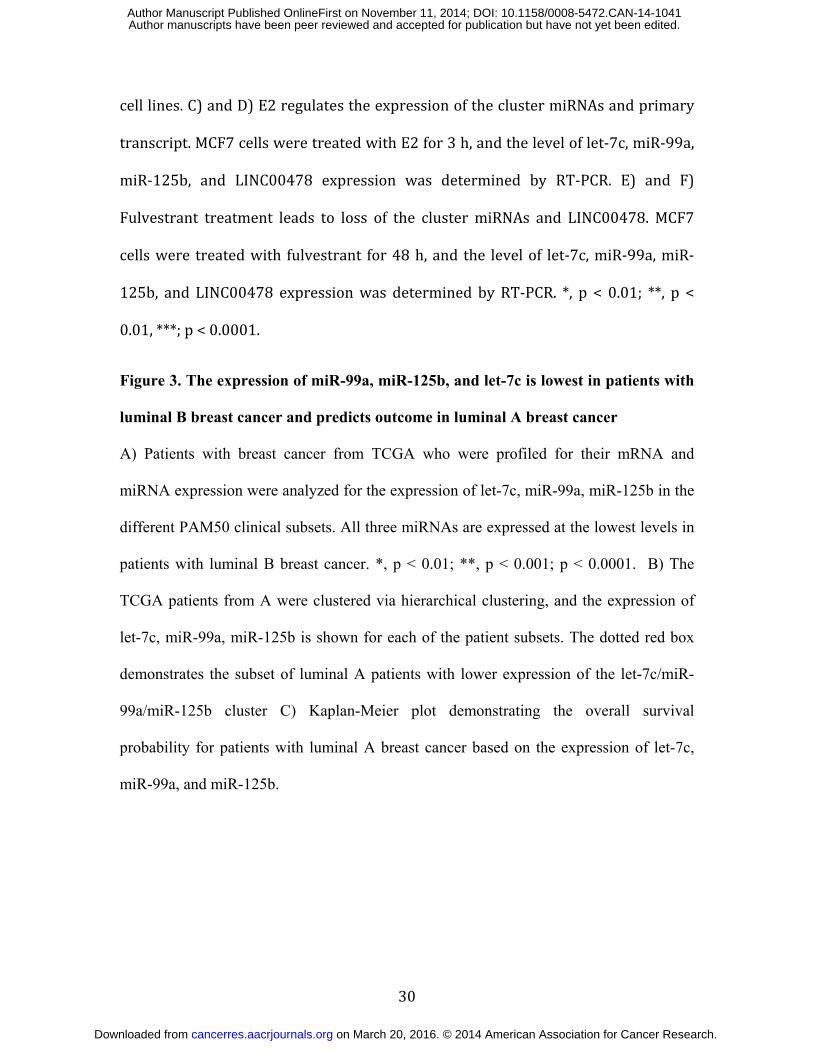
cell lines. C) and D) E2 regulates the expression of the cluster miRNAs and primary transcript. MCF7 cells were treated with E2 for 3 h, and the level of let-7c, miR-99a, miR-125b, and LINC00478 expression was determined by RT-PCR. E) and F) Fulvestrant treatment leads to loss of the cluster miRNAs and LINC00478. MCF7 cells were treated with fulvestrant for 48 h, and the level of let-7c, miR-99a, miR-125b, and LINC00478 expression was determined by RT-PCR. *, p < 0.01; **, p < 0.01, ***; p < 0.0001. Figure 3. The expression of miR-99a, miR-125b, and let-7c is lowest in patients with
luminal B breast cancer and predicts outcome in luminal A breast cancer
A) Patients with breast cancer from TCGA who were profiled for their mRNA and
miRNA expression were analyzed for the expression of let-7c, miR-99a, miR-125b in the
different PAM50 clinical subsets. All three miRNAs are expressed at the lowest levels in
patients with luminal B breast cancer. *, p < 0.01; **, p < 0.001; p < 0.0001. B) The
TCGA patients from A were clustered via hierarchical clustering, and the expression of
let-7c, miR-99a, miR-125b is shown for each of the patient subsets. The dotted red box
demonstrates the subset of luminal A patients with lower expression of the let-7c/miR-
99a/miR-125b cluster C) Kaplan-Meier plot demonstrating the overall survival
probability for patients with luminal A breast cancer based on the expression of let-7c,
miR-99a, and miR-125b.
on March 20, 2016. © 2014 American Association for Cancer Research.cancerres.aacrjournals.org Downloaded from
Author manuscripts have been peer reviewed and accepted for publication but have not yet been edited. Author Manuscript Published OnlineFirst on November 11, 2014; DOI: 10.1158/0008-5472.CAN-14-1041
31
Figure 4. The let-7c/miR-99a/miR-125b cluster regulates the growth of breast
cancer cells and downregulates HER2. A) MCF7:2A cells were transfected with the indicated miRNA mimics (top) or anti-miRs (bottom, split into a 96-well plate and allowed to grow for five days. Cells were counted on days one, three, and five to determine the growth rate. B) HER2 is expressed at a higher level in estrogen-independent cell lines. Western blot demonstrating HER2 expression in the MCF7, MCF7:2A, MCF7:5C, and MCF7:LTLT cell lines. The expression level of ER is also shown together with that of β-actin, which served as a loading control. C) HER2 is downregulated by let-7c and miR-125b overexpression. MCF7:2A cells were transfected with miRNA mimics for let-7c, miR-99a, and miR-125b. Cells were harvested after five days, and the level of HER2 expression was measured. The middle panel shows the expression of ER, which was unchanged with miRNA treatment. D) let-7c and miR-125b target HER2. A vector encoding the 3’-UTR of HER2 was transfected in HEK293 in the presence of miRNA mimics (D) and anti-miRs (E). The level of renilla luciferase expression was measured after 48 days and normalized to that of firefly luciferase. F) HER2 mRNA association with the Ago1 complex is lost in MCF7:2A cells. The Ago1 complex was immunoprecipiated from MCF7 and MCF7:2A cells, and the associated level of HER2 in each cell line as normalized to input total RNA was quantified by RT-PCR. The levels of associated Myc, p21, and HER2 mRNA are shown.
on March 20, 2016. © 2014 American Association for Cancer Research.cancerres.aacrjournals.org Downloaded from
Author manuscripts have been peer reviewed and accepted for publication but have not yet been edited. Author Manuscript Published OnlineFirst on November 11, 2014; DOI: 10.1158/0008-5472.CAN-14-1041
32
Figure 5. HER2 protein expression and activity is negatively correlated with let-7c
expression Luminal A breast cancer patient samples from TCGA for which protein expression data were generated were examined for their HER2 (A) and phosphorylated HER2 (B) expression levels. A negative correlation was found for both HER2 (A) and phosphorylated HER2 (B) protein expression, suggesting that HER2 expression and activity is negatively associated with let-7c miRNA expression in patients with breast cancer.
on March 20, 2016. © 2014 American Association for Cancer Research.cancerres.aacrjournals.org Downloaded from
Author manuscripts have been peer reviewed and accepted for publication but have not yet been edited. Author Manuscript Published OnlineFirst on November 11, 2014; DOI: 10.1158/0008-5472.CAN-14-1041
MCF7 MCF7:2A
B
A
miR-99a
miR-148a
Figure 1
miR-125b
let-7c
on March 20, 2016. © 2014 American Association for Cancer Research.cancerres.aacrjournals.org Downloaded from
Author manuscripts have been peer reviewed and accepted for publication but have not yet been edited. Author Manuscript Published OnlineFirst on November 11, 2014; DOI: 10.1158/0008-5472.CAN-14-1041
A
chromosome 21
B C
miR-99a let-7c miR-125b-2
LINC00478
MCF7
MCF7:2A
USP25 NRIP1
Binding site
ChIP signal
Binding site
ChIP signal
0
2
4
6
Rela
tive m
icro
RN
A e
xpre
ssio
n
Vehicle E2
let-7c miR-99a miR-125b
Re
lative
mR
NA
exp
ressio
n
*
0.0
0.2
0.4
0.6
0.8
1.0
Rela
tive m
RN
A e
xpre
ssio
n
LINC00478
MCF7 MCF7
2A MCF7
5C
MCF7
LTLT
**
*
*
0.0
0.2
0.4
0.6
0.8
1.0
Rela
tive m
icro
RN
A e
xpre
ssio
n
Vehicle Fulvestrant
let-7c miR-99a miR-125b Vehicle Fulvestrant0.0
0.5
1.0
1.5
Rela
tive m
RN
A e
xpre
ssio
nR
ela
tive
mR
NA
exp
ressio
n
**
*** ** **
**
**
*
D
E F
Vehicle
LINC00478
E2
Vehicle Fulvestrant
LINC00478
Re
lative
mR
NA
exp
ressio
n
*** *** *** *** *** *** *** *** ***
on March 20, 2016. © 2014 American Association for Cancer Research.cancerres.aacrjournals.org Downloaded from
Author manuscripts have been peer reviewed and accepted for publication but have not yet been edited. Author Manuscript Published OnlineFirst on November 11, 2014; DOI: 10.1158/0008-5472.CAN-14-1041
A
B
C
Patients with high miR expression Patients with low miR expression
**
*** ***
**
*
*** ***
*** **
* ***
***
** ***
Figure 3
p = 0.00719 p = 0.0182 p = 0.0318
Overa
ll S
urv
ival P
robabili
ty
on March 20, 2016. © 2014 American Association for Cancer Research.cancerres.aacrjournals.org Downloaded from
Author manuscripts have been peer reviewed and accepted for publication but have not yet been edited. Author Manuscript Published OnlineFirst on November 11, 2014; DOI: 10.1158/0008-5472.CAN-14-1041
Myc p21 HER20.0
0.5
1.0
Fold
enrichm
ent over
input
A
C
Figure 4
D
B
Control let-7c 99a 125b0.0
0.5
1.0
1.5
Rela
tive R
enill
a e
xpre
ssio
n
Control let-7c 99a 125b0.0
0.5
1.0
1.5
2.0
2.5
Rela
tive R
enill
a e
xpre
ssio
n
F
MC
F7
:LT
LT
MC
F7
MC
F7
:2A
MC
F7
:5C
a-HER2
a-Actin
a-ER
7c 99a 125b C
a-HER2
a-Actin
a-ER
E
** **
**
**
**
0 1 3 50
2×10⁵
4×10⁵
6×10⁵
Days
cells
/ml
control mimic
let-7c mimic
miR-99a mimic
miR-125b mimicp < 0.05
p < 0.01
on March 20, 2016. © 2014 American Association for Cancer Research.cancerres.aacrjournals.org Downloaded from
Author manuscripts have been peer reviewed and accepted for publication but have not yet been edited. Author Manuscript Published OnlineFirst on November 11, 2014; DOI: 10.1158/0008-5472.CAN-14-1041
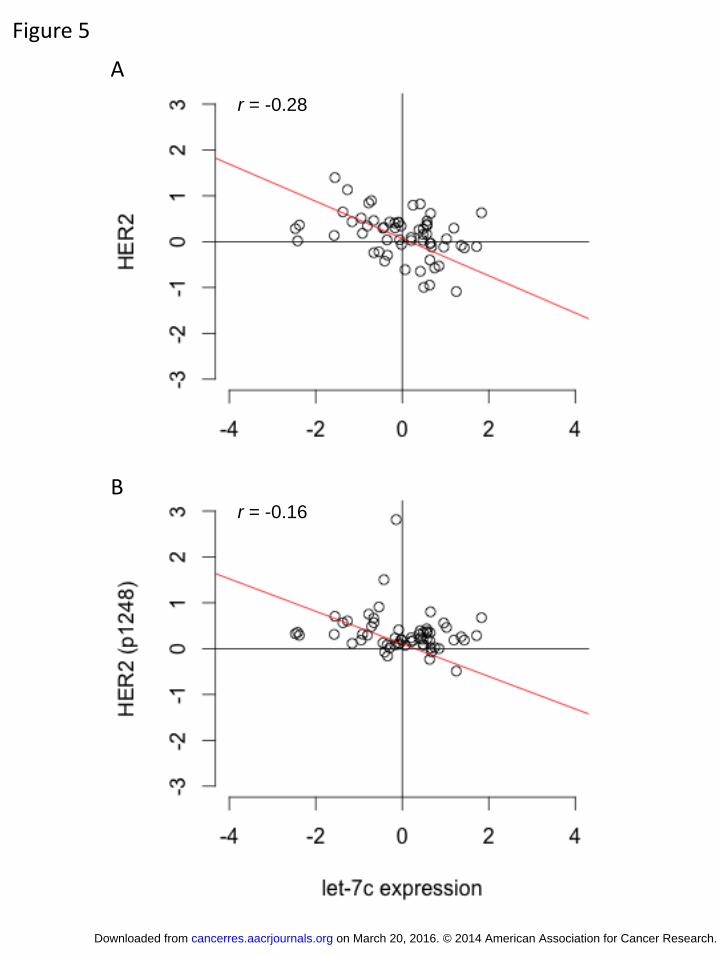
Figure 5
A
B
r = -0.28
r = -0.16
on March 20, 2016. © 2014 American Association for Cancer Research.cancerres.aacrjournals.org Downloaded from
Author manuscripts have been peer reviewed and accepted for publication but have not yet been edited. Author Manuscript Published OnlineFirst on November 11, 2014; DOI: 10.1158/0008-5472.CAN-14-1041

Published OnlineFirst November 11, 2014.Cancer Res Shannon T. Bailey, Thomas Westerling and Myles Brown cancersignaling and is prognostic of poor outcome in luminal breast Loss estrogen-regulated microRNA expression increases HER2
Updated version
10.1158/0008-5472.CAN-14-1041doi:
Access the most recent version of this article at:
Material
Supplementary
http://cancerres.aacrjournals.org/content/suppl/2014/11/11/0008-5472.CAN-14-1041.DC1.html
Access the most recent supplemental material at:
Manuscript
Authoredited. Author manuscripts have been peer reviewed and accepted for publication but have not yet been
E-mail alerts related to this article or journal.Sign up to receive free email-alerts
Subscriptions
Reprints and
To order reprints of this article or to subscribe to the journal, contact the AACR Publications
Permissions
To request permission to re-use all or part of this article, contact the AACR Publications
on March 20, 2016. © 2014 American Association for Cancer Research.cancerres.aacrjournals.org Downloaded from
Author manuscripts have been peer reviewed and accepted for publication but have not yet been edited. Author Manuscript Published OnlineFirst on November 11, 2014; DOI: 10.1158/0008-5472.CAN-14-1041