Advantages and Disadvantages of Technologies for HER2 ...
18
686 Am J Clin Pathol 2015;144:686-703 DOI: 10.1309/AJCPT41TCBUEVDQC © American Society for Clinical Pathology AJCP / Review Article Advantages and Disadvantages of Technologies for HER2 Testing in Breast Cancer Specimens Daniela Furrer, MSc, 1-3 François Sanschagrin, PhD, 4,5 Simon Jacob, MD, 4,5 and Caroline Diorio, PhD 1-4 From the 1 Centre de recherche sur le cancer de l’Université Laval, Quebec City, Canada; 2 Axe Oncologie, Centre de recherche du CHU de Québec, Hôpital du St-Sacrement, Quebec City, Canada; 3 Département de médecine sociale et préventive, Faculté de Médecine, Quebec City, Canada; 4 Centre des Maladies du Sein Deschênes-Fabia, Hôpital du St-Sacrement, Quebec City, Canada; and 5 Département de biologie moléculaire, de biochimie médicale et de pathologie, Faculté de Médecine, Quebec City, Canada. Key Words: Breast cancer; HER2 status; Trastuzumab; Lapatinib; HER2 inhibitors Am J Clin Pathol November 2015;144:686-703 DOI: 10.1309/AJCPT41TCBUEVDQC ABSTRACT Objectives: Human epidermal growth factor receptor 2 (HER2) plays a central role as a prognostic and predictive marker in breast cancer specimens. Reliable HER2 evaluation is central to determine the eligibility of patients with breast cancer to targeted anti-HER2 therapies such as trastuzumab and lapatinib. Presently, several methods exist for the determination of HER2 status at different levels (protein, RNA, and DNA level). Methods: In this review, we discuss the main advantages and disadvantages of the techniques developed so far for the evaluation of HER2 status in breast cancer specimens. Results: Each technique has its own advantages and disadvantages. It is therefore not surprising that no consensus has been reached so far on which technique is the best for the determination of HER2 status. Conclusions: Currently, emphasis must be put on standardization of procedures, internal and external quality control assessment, and competency evaluation of already existing methods to ensure accurate, reliable, and clinically meaningful test results. Development of new robust and accurate diagnostic assays should also be encouraged. In addition, large clinical trials are warranted to identify the technique that most reliably predicts a positive response to anti-HER2 drugs. Human epidermal growth factor receptor 2 (HER2) is a transmembrane tyrosine kinase receptor belonging to the family of epidermal growth factor receptors (EGFRs). 1 The protein is encoded by the HER2 (ERBB2) gene, which is located on the long arm of chromosome 17 (17q12-21.32). 2 HER2 is an essential mediator of cell proliferation and dif- ferentiation in the developing embryo and in adult tissues. 3 Its inappropriate activation, however, is associated with the development of several malignancies, including breast, ovarian, gastric, colorectal, pancreatic, and endometrial cancers. 4 In human breast cancer, HER2 gene amplifica- tion and receptor overexpression, which occur in 15% to 20% of patients, are important prognostic markers for poor prognosis, including a more aggressive disease and a shorter survival. 5 Moreover, HER2-positive status is con- sidered a predictive marker of response to HER2-targeted drugs, including trastuzumab and lapatinib. 6 Trastuzumab (Herceptin; Roche, Basel, Switzerland) is a recombinant humanized monoclonal antibody that specifically targets the extracellular domain of the HER2 protein. 7 Trastuzum- ab improves the outcomes of patients with HER2-positive breast cancer in both the metastatic 8,9 and adjuvant set- tings. 10,11 The US Food and Drug Administration (FDA) approved trastuzumab for the treatment of HER2-positive metastatic breast cancer in 1998 and as adjuvant treatment for HER2-positive early stage breast cancer in 2006. Lapa- tinib (Tykerb/Tyverb; GlaxoSmithKline, Philadelphia, PA) is a small-molecule inhibitor of the intracellular tyrosine kinase domain of both HER2 and EGFR receptors. 12 In 2007, lapatinib had been approved by the FDA as com- bination therapy with capecitabine for the treatment of patients with HER2-positive advanced breast cancer who Downloaded from https://academic.oup.com/ajcp/article/144/5/686/1760671 by guest on 27 March 2022
-
Upload
khangminh22 -
Category
Documents
-
view
6 -
download
0
Transcript of Advantages and Disadvantages of Technologies for HER2 ...

686 Am J Clin Pathol 2015;144:686-703 DOI: 10.1309/AJCPT41TCBUEVDQC
© American Society for Clinical Pathology
AJCP / Review Article
Advantages and Disadvantages of Technologies for HER2 Testing in Breast Cancer Specimens
Daniela Furrer, MSc,1-3 François Sanschagrin, PhD,4,5 Simon Jacob, MD,4,5 and Caroline Diorio, PhD1-4
From the 1Centre de recherche sur le cancer de l’Université Laval, Quebec City, Canada; 2Axe Oncologie, Centre de recherche du CHU de Québec, Hôpital du St-Sacrement, Quebec City, Canada; 3Département de médecine sociale et préventive, Faculté de Médecine, Quebec City, Canada; 4Centre des Maladies du Sein Deschênes-Fabia, Hôpital du St-Sacrement, Quebec City, Canada; and 5Département de biologie moléculaire, de biochimie médicale et de pathologie, Faculté de Médecine, Quebec City, Canada.
Key Words: Breast cancer; HER2 status; Trastuzumab; Lapatinib; HER2 inhibitors
Am J Clin Pathol November 2015;144:686-703
DOI: 10.1309/AJCPT41TCBUEVDQC
ABSTRACT
Objectives: Human epidermal growth factor receptor 2 (HER2) plays a central role as a prognostic and predictive marker in breast cancer specimens. Reliable HER2 evaluation is central to determine the eligibility of patients with breast cancer to targeted anti-HER2 therapies such as trastuzumab and lapatinib. Presently, several methods exist for the determination of HER2 status at different levels (protein, RNA, and DNA level).
Methods: In this review, we discuss the main advantages and disadvantages of the techniques developed so far for the evaluation of HER2 status in breast cancer specimens.
Results: Each technique has its own advantages and disadvantages. It is therefore not surprising that no consensus has been reached so far on which technique is the best for the determination of HER2 status.
Conclusions: Currently, emphasis must be put on standardization of procedures, internal and external quality control assessment, and competency evaluation of already existing methods to ensure accurate, reliable, and clinically meaningful test results. Development of new robust and accurate diagnostic assays should also be encouraged. In addition, large clinical trials are warranted to identify the technique that most reliably predicts a positive response to anti-HER2 drugs.
Human epidermal growth factor receptor 2 (HER2) is a transmembrane tyrosine kinase receptor belonging to the family of epidermal growth factor receptors (EGFRs).1 The protein is encoded by the HER2 (ERBB2) gene, which is located on the long arm of chromosome 17 (17q12-21.32).2 HER2 is an essential mediator of cell proliferation and dif-ferentiation in the developing embryo and in adult tissues.3 Its inappropriate activation, however, is associated with the development of several malignancies, including breast, ovarian, gastric, colorectal, pancreatic, and endometrial cancers.4 In human breast cancer, HER2 gene amplifica-tion and receptor overexpression, which occur in 15% to 20% of patients, are important prognostic markers for poor prognosis, including a more aggressive disease and a shorter survival.5 Moreover, HER2-positive status is con-sidered a predictive marker of response to HER2-targeted drugs, including trastuzumab and lapatinib.6 Trastuzumab (Herceptin; Roche, Basel, Switzerland) is a recombinant humanized monoclonal antibody that specifically targets the extracellular domain of the HER2 protein.7 Trastuzum-ab improves the outcomes of patients with HER2-positive breast cancer in both the metastatic8,9 and adjuvant set-tings.10,11 The US Food and Drug Administration (FDA) approved trastuzumab for the treatment of HER2-positive metastatic breast cancer in 1998 and as adjuvant treatment for HER2-positive early stage breast cancer in 2006. Lapa-tinib (Tykerb/Tyverb; GlaxoSmithKline, Philadelphia, PA) is a small-molecule inhibitor of the intracellular tyrosine kinase domain of both HER2 and EGFR receptors.12 In 2007, lapatinib had been approved by the FDA as com-bination therapy with capecitabine for the treatment of patients with HER2-positive advanced breast cancer who
Dow
nloaded from https://academ
ic.oup.com/ajcp/article/144/5/686/1760671 by guest on 27 M
arch 2022
AJCP / Review Article
Am J Clin Pathol 2015;144:686-703 687 DOI: 10.1309/AJCPT41TCBUEVDQC
© American Society for Clinical Pathology
had progressed on trastuzumab-based regimens.13 Given its prognostic, predictive, and therefore therapeutic implica-tions, an accurate evaluation of HER2 status is crucial for identification of patients who would most likely benefit from targeted anti-HER2 therapies.
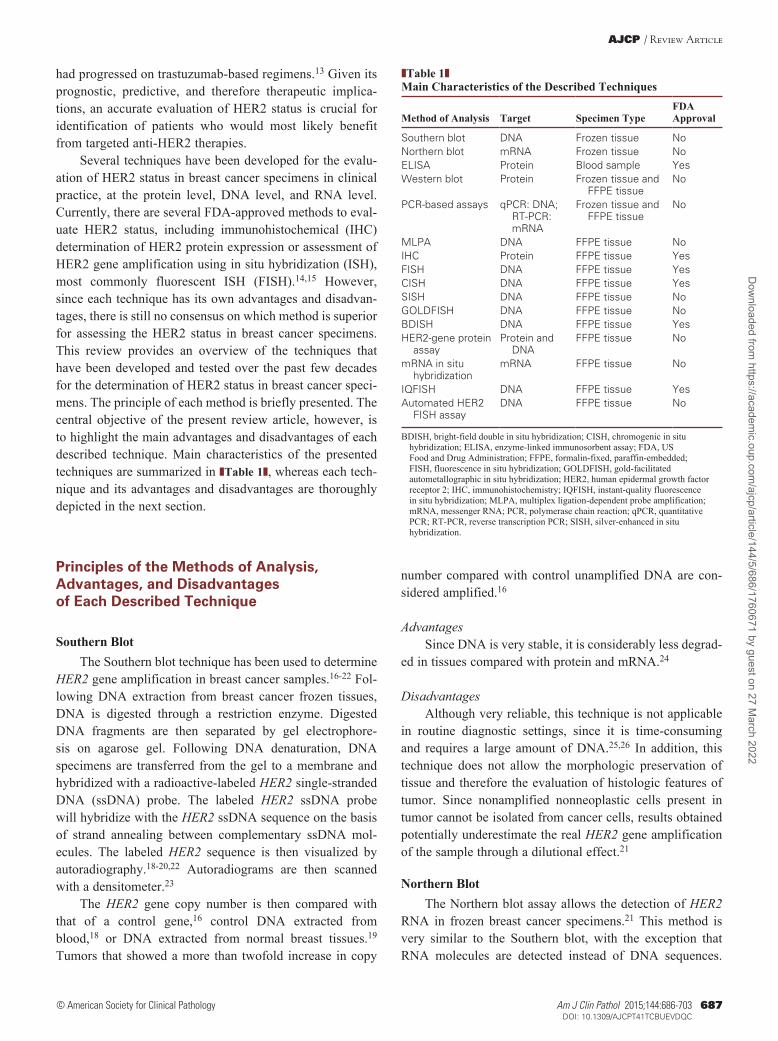
Several techniques have been developed for the evalu-ation of HER2 status in breast cancer specimens in clinical practice, at the protein level, DNA level, and RNA level. Currently, there are several FDA-approved methods to eval-uate HER2 status, including immunohistochemical (IHC) determination of HER2 protein expression or assessment of HER2 gene amplification using in situ hybridization (ISH), most commonly fluorescent ISH (FISH).14,15 However, since each technique has its own advantages and disadvan-tages, there is still no consensus on which method is superior for assessing the HER2 status in breast cancer specimens. This review provides an overview of the techniques that have been developed and tested over the past few decades for the determination of HER2 status in breast cancer speci-mens. The principle of each method is briefly presented. The central objective of the present review article, however, is to highlight the main advantages and disadvantages of each described technique. Main characteristics of the presented techniques are summarized in ❚Table 1❚, whereas each tech-nique and its advantages and disadvantages are thoroughly depicted in the next section.
Principles of the Methods of Analysis, Advantages, and Disadvantages of Each Described Technique
Southern BlotThe Southern blot technique has been used to determine
HER2 gene amplification in breast cancer samples.16-22 Fol-lowing DNA extraction from breast cancer frozen tissues, DNA is digested through a restriction enzyme. Digested DNA fragments are then separated by gel electrophore-sis on agarose gel. Following DNA denaturation, DNA specimens are transferred from the gel to a membrane and hybridized with a radioactive-labeled HER2 single-stranded DNA (ssDNA) probe. The labeled HER2 ssDNA probe will hybridize with the HER2 ssDNA sequence on the basis of strand annealing between complementary ssDNA mol-ecules. The labeled HER2 sequence is then visualized by autoradiography.18-20,22 Autoradiograms are then scanned with a densitometer.23
The HER2 gene copy number is then compared with that of a control gene,16 control DNA extracted from blood,18 or DNA extracted from normal breast tissues.19 Tumors that showed a more than twofold increase in copy
number compared with control unamplified DNA are con-sidered amplified.16
AdvantagesSince DNA is very stable, it is considerably less degrad-
ed in tissues compared with protein and mRNA.24
DisadvantagesAlthough very reliable, this technique is not applicable
in routine diagnostic settings, since it is time-consuming and requires a large amount of DNA.25,26 In addition, this technique does not allow the morphologic preservation of tissue and therefore the evaluation of histologic features of tumor. Since nonamplified nonneoplastic cells present in tumor cannot be isolated from cancer cells, results obtained potentially underestimate the real HER2 gene amplification of the sample through a dilutional effect.21
Northern BlotThe Northern blot assay allows the detection of HER2
RNA in frozen breast cancer specimens.21 This method is very similar to the Southern blot, with the exception that RNA molecules are detected instead of DNA sequences.
❚Table 1❚Main Characteristics of the Described Techniques
Method of Analysis Target Specimen TypeFDA Approval
Southern blot DNA Frozen tissue NoNorthern blot mRNA Frozen tissue NoELISA Protein Blood sample YesWestern blot Protein Frozen tissue and
FFPE tissueNo
PCR-based assays qPCR: DNA; RT-PCR: mRNA
Frozen tissue and FFPE tissue
No
MLPA DNA FFPE tissue NoIHC Protein FFPE tissue YesFISH DNA FFPE tissue YesCISH DNA FFPE tissue YesSISH DNA FFPE tissue No GOLDFISH DNA FFPE tissue NoBDISH DNA FFPE tissue YesHER2-gene protein
assayProtein and
DNAFFPE tissue No
mRNA in situ hybridization
mRNA FFPE tissue No
IQFISH DNA FFPE tissue YesAutomated HER2
FISH assayDNA FFPE tissue No
BDISH, bright-field double in situ hybridization; CISH, chromogenic in situ hybridization; ELISA, enzyme-linked immunosorbent assay; FDA, US Food and Drug Administration; FFPE, formalin-fixed, paraffin-embedded; FISH, fluorescence in situ hybridization; GOLDFISH, gold-facilitated autometallographic in situ hybridization; HER2, human epidermal growth factor receptor 2; IHC, immunohistochemistry; IQFISH, instant-quality fluorescence in situ hybridization; MLPA, multiplex ligation-dependent probe amplification; mRNA, messenger RNA; PCR, polymerase chain reaction; qPCR, quantitative PCR; RT-PCR, reverse transcription PCR; SISH, silver-enhanced in situ hybridization.
Dow
nloaded from https://academ
ic.oup.com/ajcp/article/144/5/686/1760671 by guest on 27 M
arch 2022

Furrer et al / Pros and Cons of HER2 Diagnostic Tests
688 Am J Clin Pathol 2015;144:686-703 DOI: 10.1309/AJCPT41TCBUEVDQC
© American Society for Clinical Pathology
After extraction from homogenized tissue sample, total cel-lular RNA or messenger RNA (mRNA) is separated by size via electrophoresis in an agarose gel and transferred to a nitrocellulose membrane. The HER2 RNA is then visualized via hybridization with an isotopic-labeled complementary probe.27 The labeled HER2 sequence is then visualized by autoradiography. The relative optical density (OD) of bands is measured by densitometry scanning. Tumors are then divided into four RNA expression categories: 1+ (0.1 to 0.5 OD units), 2+ (>0.5 to 1.0 OD units), 3+ (>1.0 to 1.5 OD units), and 4+ (>1.5 OD units).21
AdvantagesNorthern blot reagents are not too expensive, which
allows the running of many gels at low cost. Moreover, quantity and quality of RNA can be verified after gel electrophoresis.28
DisadvantagesOne of main disadvantages of the Northern blot tech-
nique is that RNA molecules are often degraded in tissues. Indeed, even a slight degradation of RNA can compromise the quality of data and therefore the ability to quantify gene expression. Similar to Southern blot, the Northern blot tech-nique, in addition to being a labor-intensive technique, does not allow an exclusive evaluation of HER2 status in cancer cells, since the morphology of tissues is destroyed during the homogenization of tissue samples.21
Enzyme-Linked Immunosorbent AssayHER2 protein is composed of a cytoplasmic domain
with tyrosine kinase activity, a transmembrane domain, and an extracellular domain (ECD).29 The HER2 ECD can be cleaved from the full-length HER2 receptor present on the breast cancer cell membrane by matrix metalloproteases30 and released into the serum.31
Enzyme-linked immunosorbent assay (ELISA) allows the detection and quantification of proteins in fluids or cell lysates.32 In breast cancer, manual and automated ELISA assays have been used for the determination of HER2 ECD serum concentration.33-37 HER2 ECD is detected using two monoclonal antibodies recognizing two distinct epitopes of the antigen. In the manual assay, HER2 ECD is immobi-lized using a 96-well plate coated with the first monoclonal antibody. The immobilized protein is then incubated with the second monoclonal antibody, which is labeled with horseradish peroxidase (HRP). After application of the HRP substrate, detection is accomplished by assessing the col-ored end product with spectrophotometry, which correlates to the HER2 ECD concentration in sample.37 In the auto-mated assay, HER2 ECD is visualized through direct che-miluminescent technology, using antibodies that are labeled
with chemiluminescent compounds (ie, acridinium ester, fluorescein).38 The measured chemiluminescence is directly proportional to the HER2 ECD concentration in sample.35
Among commercially available ELISA assays, one auto-mated (Immuno-1; Siemens Healthcare Diagnostics, Tarry-town, NY) and one manual ELISA assay (Siemens Healthcare Diagnostics) were approved by the FDA in 2000. Another automated platform (ADVIA Centaur; Siemens Healthcare Diagnostics) also received FDA approval in 2003.39
Some studies suggest that HER2 ECD could be used as a biomarker for the monitoring of the disease course and the patient’s response to therapy. Circulating levels of HER2 ECD greater than 15 ng/mL (this reference cutoff was derived from the serum samples of 242 healthy women36) in patients with HER2-positive breast cancer may be associated with the progression of primary tumors to metastatic breast cancer.39 In patients with metastatic and early breast can-cer, ECD levels might reflect the HER2 full-length protein expression, since elevated HER2 ECD levels in serum (≥15 ng/mL) have been correlated with higher scores at the HER2 IHC.34,35,40,41 In patients with metastatic breast cancer, high HER2 ECD serum concentrations (≥15 ng/mL) have also been associated with resistance to endocrine therapy and chemotherapy42 and, in patients with both metastatic and early breast cancer, with worse survival.43,44 In metastatic patients treated with trastuzumab, decreased HER2 ECD serum levels (>20%) were predictive of response to treat-ment.45 Another study conducted on patients with metastatic breast cancer, however, did not observe a clear association between the changes in ECD levels and response to trastu-zumab therapy.46 In general, results regarding the asso-ciations between ECD circulating levels and prognostic and predictive factors are very variable, depending on which assay was used or which cutoff value was considered (for a recent review, see Lam et al47). Based on these conflicting data, the clinical use of the ELISA assay for the determina-tion of HER2 ECD in the patient’s serum has not yet been widely implemented.47,48
AdvantagesELISA is a quick and simple assay in addition to
being a less invasive (only blood samples are needed) and quantitative test.32,47 Moreover, since HER2 ECD can be measured directly in serum, ELISA can be used to monitor the dynamic changes of HER2 status over the course of the disease progression or following treatment.47
DisadvantagesResults obtained by ELISA might not be reliable if the
serum samples are from patients receiving trastuzumab treat-ment, since trastuzumab still present in the patient’s serum might compete with the two antibodies used in the assay.49
Dow
nloaded from https://academ
ic.oup.com/ajcp/article/144/5/686/1760671 by guest on 27 M
arch 2022

AJCP / Review Article
Am J Clin Pathol 2015;144:686-703 689 DOI: 10.1309/AJCPT41TCBUEVDQC
© American Society for Clinical Pathology
Western BlotWestern blot has been used to evaluate HER2 protein
expression in frozen and formalin-fixed, paraffin-embedded (FFPE) breast cancer tissue samples.21,50,51 Following pro-tein extraction from tissues, sample proteins are separated by size using sodium dodecyl sulfate–polyacrylamide gel electrophoresis. Separated proteins are then transferred to a nitrocellulose or a polyvinylidene fluoride membrane. Mem-brane is first incubated with a primary antibody directed against HER2, followed by the incubation with a secondary antibody (radioactive or HRP labeled) raised against the primary antibody host species. Radioactive-labeled bands are visualized by autoradiography.52 HER2 expression levels in individual tumors are then determined by densi-tometric scanning and expressed as HER2 units based on a laboratory standard.51 More commonly, nowadays signal from HRP-labeled target can be detected through enhanced chemiluminescence.50
AdvantagesHigh sensitivity (as little as 0.1 ng protein can be
detected in a sample) represents the major advantages of the Western blot technique.51
DisadvantagesSince proteins are less stable than DNA, they are less
well preserved in tissues than DNA.24 The Western blot tech-nique presents the same disadvantage as the other blotting techniques—namely, that it is a time-consuming method, and the morphology of tissue samples is not preserved.21,51,53
Polymerase Chain Reaction–Based AssaysPolymerase chain reaction (PCR) is a method for the
detection of DNA samples through the exponential ampli-fication of target DNA sequences. At first, double-stranded DNA is denatured into a single-stranded DNA template. Oligonucleotide primers (ie, short single-stranded sequences that match the DNA sequence at each end of the region to be amplified) are then annealed to the single-stranded DNA template. In the following step, DNA polymerase synthe-tizes a new DNA strand by adding deoxynucleotide triphos-phates complementary to the bases of the single-stranded DNA template. As DNA doubles during each PCR cycle, this results in exponential accumulation of the targeted DNA fragment. The products of a PCR reaction are usually analyzed by agarose gel electrophoresis, which allows the detection of the presence (but not the quantification) of the target sequence and the length of the fragment.
PCR-based assays can evaluate changes in both HER2 gene copy number and expression. Quantitative PCR (qPCR) and reverse transcription PCR (RT-PCR) have been used to evaluate HER2 gene amplification and HER2 expression,
respectively, in breast cancer specimens in both FFPE and frozen tissue.24,25,54-63
qPCR, also called real-time PCR, is a form of PCR that is used for the DNA quantification in samples. DNA ampli-fication is monitored while the reaction proceeds through the implementation of either DNA-binding dyes or fluorescently labeled sequence-specific primers. Fluorescence signal pro-duced during the amplification process is detected using a thermal cycler equipped with a detector to monitor the emitted fluorescence. As fluorescence signal increases with a growing amount of PCR products, qPCR allows quantify-ing the amount of DNA formed after each cycle. HER2 gene and the reference gene are simultaneously quantified. A ratio between HER2 and the reference gene of 2.0 or more is regarded as HER2 amplification.25,55,58-60,62
RT-PCR, often denoted as real-time RT-PCR or quan-titative reverse transcriptase PCR, allows the quantification of mRNA in biological samples. Following RNA extraction from tissue samples, extracted RNA is reverse transcribed into complementary DNA (cDNA). cDNA is then measured by qPCR. The relative fold change in gene expression is usually calculated using the comparative ΔΔCT method.64 At first, the relative quantitation of HER2 gene expression is calculated comparing the target gene expression with that of one or several housekeeping genes. The relative HER2 gene expression measured in samples is then normalized to a cali-brator obtained by mixing RNA from several normal breast tissue samples. Several cutoff values have been used in the literature to define HER2 overexpression determined by RT-PCR.24,25,54,56-58,61 Importantly, the Oncotype Dx (Genomic Health, Redwood City, CA) assay is based on RT-PCR technology to analyze the expression of 21 genes involved in breast cancer biology, including HER2, estrogen recep-tor (ER), and progesterone receptor. The test, performed on mRNA extracted from FFPE tumor tissues, is used to predict the likelihood of breast cancer recurrence in patients with early-stage, node-negative, ER-positive breast cancer, in addition to their chemotherapy benefit.65
AdvantagesReal-time PCR allows a rapid and quantitative analy-
sis of gene amplification.60,66 Since real-time PCR is used to quantify DNA in samples, variations in tissue fixation and processing have little impact on the results. Moreover, since only small quantities of DNA fragments are required, real-time PCR represents a suitable technique for the evalu-ation of HER2 gene amplification from DNA isolated from FFPE tissues. In addition, real-time PCR is an easy, quick, and inexpensive technique that yields reliable results even in cases with low-level amplification.55 Moreover, since real-time PCR is a quantitative method, it is less sensitive to interobserver variability.62
Dow
nloaded from https://academ
ic.oup.com/ajcp/article/144/5/686/1760671 by guest on 27 M
arch 2022
Furrer et al / Pros and Cons of HER2 Diagnostic Tests
690 Am J Clin Pathol 2015;144:686-703 DOI: 10.1309/AJCPT41TCBUEVDQC
© American Society for Clinical Pathology
Real time RT-PCR presents several advantages, includ-ing a large dynamic range and an accurate quantification.67
DisadvantagesAlthough the PCR technique is an easy and reproduc-
ible technique, PCR technology has not yet been approved as a diagnostic tool for the evaluation of HER2 amplifica-tion. The main reason is that PCR results are often associated with false-negative results due to the dilution of amplified tumor cells with surrounding nonamplified stroma cells or noninvasive breast lesions.59,63,66 However, this effect can at least in part be resolved through laser-assisted microdissec-tion (LAM), which allows the isolation of tumor cells from archival FFPE tissues.59 Some authors suggest that the tumor histologic subtype might considerably influence the efficacy of this assay. The impact of surrounding stromal and nonma-lignant cells on test result might be in fact significantly big-ger in tumors in which tumor cells are scattered throughout the stroma, such as diffuse lobular tumors.55 LAM might be therefore particularly important in this subgroup of breast carcinomas.
Moreover, since mRNA integrity can be damaged by several factors, including tissue fixation and processing and storage time,24 the evaluation of HER2 status at the mRNA level by RT-PCR using FFPE can be problematic.60 Therefore, the widespread RNA fragmentation observed in archival FFPE tissues (but not in frozen tissues)24 may limit the use of RT-PCR for the evaluation of HER2 status for clinical purposes.57,63 Moreover, similar to qPCR, RT-PCR fails to detect equivocal cases at IHC/FISH and produces false-negative results.57
Multiplex Ligation-Dependent Probe AmplificationMultiplex ligation-dependent probe amplification
(MLPA) is a recently developed PCR method used to detect copy number variation, such as gene amplifications and gene deletions.68 After DNA denaturation and fragmentation, genomic DNA is hybridized with sequence-specific MLPA probes. The MLPA kit commercially available for the analy-sis of the HER2 gene in FFPE tissue (P004 HER-2 kit; MRC Holland, Amsterdam, the Netherlands) contains three probes for the HER2 gene, 11 probes for chromosome 17, and 25 control probes located on chromosomes other than chro-mosome 17.26 Each MLPA probe consists of two halves. Half is composed of a target-specific sequence flanked by a universal primer sequence. The other half consists of a target-specific sequence, a sequence showing a probe-specific length, and a universal primer sequence. Since the two probe halves recognize adjacent DNA target sequences, they are joined through the action of a ligase. This produces a complete probe flanked by universal primer binding sites that can be amplified by PCR, whereas unbound probe
halves cannot be amplified.68 Since each complete probe is characterized by a unique length, the resulting PCR products can be separated and identified by capillary electrophoresis. Since the amounts of probe are proportional to the target copy number, copy number variations such as deletions and amplifications of target sequence can be recognized by the relative peak heights.68 HER2 copy number is determined by comparing the mean ratio of the HER2 probe peaks with the reference probes located in stable regions of the genome. Mean values smaller than 1.5 indicate nonamplified cases, mean values between 1.5 and 2.0 indicate low-level ampli-fied cases, and mean values bigger than 2.0 designate HER2-amplified cases.26
AdvantagesThe MLPA assay is a fast, accurate, and inexpensive
technique. Moreover, only small quantities of DNA extract-ed from paraffin-embedded materials are required. Fragmen-tation of DNA does not have an impact on the reliability of results. In addition, this method yields quantitative results.26
DisadvantagesSome probe signals may be affected by factors such as
sample purity and small changes in experimental conditions. Therefore, copy number changes detected by MLPA should always be confirmed by other methods. Furthermore, tissue morphology is not conserved using this assay, and tumor heterogeneity can be missed.69 Moreover, the MLPA assay requires special equipment, including a thermocycler and a capillary sequencer.48
IHCIHC assays involve the detection of specific antigens in
FFPE tissues using specific antibodies. Immunohistochemi-cal analysis is a commonly used method for the evaluation of HER2 protein overexpression in FFPE breast cancer specimens.14,15 After antigen retrieval, tissue sections are incubated with a primary antibody directed against the HER2 protein. A visualization reagent (secondary antibody directed against the primary antibody and dextran poly-mer conjugated with HRP) is subsequently applied. Anti-gen is visualized by adding the enzyme-specific substrate 3,3′-diaminobenzidine tetrahydrochloride (DAB). Through the action of the enzyme, DAB is converted to a brownish reaction product, resulting in membranous staining.70,71
So far, several commercially available diagnostic tests for the determination of HER2 protein expression have been approved by the FDA for the identification of patients who might benefit from targeted anti-HER2 therapies: the HercepTest kit (DAKO, Glostrup, Denmark), the Pathway kit (clone 4B5; Ventana Medical Systems, Tucson, AZ), the InSite HER2/neu kit (clone CB11; BioGenex Laboratories,
Dow
nloaded from https://academ
ic.oup.com/ajcp/article/144/5/686/1760671 by guest on 27 M
arch 2022

AJCP / Review Article
Am J Clin Pathol 2015;144:686-703 691 DOI: 10.1309/AJCPT41TCBUEVDQC
© American Society for Clinical Pathology
San Ramon, CA), and the Bond Oracle HER2 IHC System (Leica Biosystems, Newcastle, UK).
Membranous staining is scored on a semiquantitative scale. According to the American Society of Clinical Oncol-ogy (ASCO), the College of American Pathologists (CAP), and Canadian recommendations for HER2 testing in breast cancer published in 2007, HER2 expression is scored as 0 (no staining), 1+ (weak or incomplete membrane staining in any percentage of tumor cells), 2+ (strong, complete mem-brane staining in ≤30% of tumor cells or weak/moderate het-erogeneous complete membrane staining in ≥10% of tumor cells), or 3+ (strong, complete, homogeneous membrane staining in >30% of tumor cells).15 In 2013, the ASCO/CAP updated the guidelines to clarify the recommendations pub-lished in 2007. According to the newest ASCO/CAP guide-lines, HER2 expression is scored as 0 (no staining or weak/incomplete membrane staining in ≤10% of tumor cells), 1+ (weak, incomplete membrane staining in >10% of tumor cells), 2+ (strong, complete membrane staining in ≤10% of tumor cells or weak/moderate and/or incomplete membrane staining in >10% of tumor cells), or 3+ (strong, complete, homogeneous membrane staining in >10% of tumor cells).14 For both the 2007 and 2013 ASCO/CAP guidelines, HER2 immunohistochemical status is considered negative if the immunohistochemical score is 0 or 1+, equivocal if the score is 2+, and positive if the score is 3+. Patients with a positive HER2 status at the IHC are eligible for targeted anti-HER2 therapy. The IHC 2+ group is regarded as borderline, and confirmatory testing using a gene amplification test (an ISH assay) should be performed. Patients with a tumor equivocal at the IHC but HER2 amplified at the gene amplification test are also eligible for therapy with HER2 inhibitors, whereas patients with a tumor that scores 0 or 1+ at the IHC and that is not HER2 amplified are not eligible.14,15
AdvantagesIHC is easy to perform and relatively inexpensive.72
Since staining results can be viewed using a conventional bright-field microscope, protein overexpression can be evaluated in the context of tissue morphology.73 Further-more, since staining is permanent, slides can be stored. Another advantage is that IHC detects the overexpression of the HER2 protein, which represents the direct target of trastuzumab and other anti-HER2 therapies.
DisadvantagesThe ability to accurately determine HER2 protein
expression status by IHC can be significantly affected by numerous factors,22,74,75 including warm/cold ischemic time,76 delay and duration of fixation, and fixative used.77,78 The method for antigen retrieval and the training of the staff also play an important role.14,15,79 Furthermore, since
commercially available antibodies display different specific-ity and sensitivity, HER2 overexpression rates vary consid-erably depending on the antibody used.80-85 An important factor regards the interpretation of results. Since the inter-pretation is based on semiquantitative scoring, immunohis-tochemical analysis is susceptible to considerable interob-server variability and therefore to substantial discrepancies in HER2 IHC results,86 especially for cases scoring 2+.87
Variability in staining results, however, has remarkably decreased since the introduction of the highly standardized HercepTest.48 Moreover, staining variability can be further reduced through the use of fully automated staining systems such as Ventana BenchMark (for the PATHWAY HER-2/neu assay, clone 4B5).88
To reduce variability in scoring results, ASCO/CAP recommendations have been published in 2007 and updated in 2013 for the interpretation of HER2 overexpression.14,15 Moreover, subjectivity in the interpretation of membrane staining can be reduced through the implementation of quantitative image analysis, including the automated cel-lular imaging system (ACIS; ChromaVision Medical Sys-tems, San Juan Capistrano, CA)89,90 and HER2-CONNECT
(Visiopharm A/S, Hoersholm, Denmark).91 ASCO/CAP guidelines recommend the use of quantitative image analy-sis, especially for cases showing a weak HER2 membrane staining (IHC score 1+ and 2+).15
FISHFISH is a cytogenetic technique that uses fluorescent-
labeled probes to detect specific DNA sequences in tissue samples.92 In breast cancer specimens, the FISH assay is used to quantify the HER2 gene copy number within tumor cell nuclei.92 FISH can be performed either as a single-color assay (HER2 probe only) or dual-color assay (using dif-ferentially labeled HER2 and chromosome 17 centromere probes simultaneously).93
Following enzymatic digestion of tissues, fluorescent-labeled probes are applied to tissue sections. After DNA denaturation, probes hybridize with their targets in tissue. The HER2 probe, labeled with an orange fluorophore, tar-gets the HER2 gene locus on chromosome 17. The green fluorophore–labeled chromosome 17 centromere probe tar-gets the a satellite DNA sequence located at the centromeric region of chromosome 17. Nuclei are counterstained with 4,6′-diamino-2-phenylindole (DAPI). Fluorescent hybrid-ization signals can be visualized using a fluorescence microscope equipped with ×100 oil immersion objectives and appropriate filters (Spectrum Orange for locus-specific probe HER2, Spectrum Green for centromeric probe 17, and the UV filter for the DAPI nuclear counterstain).94,95
Three FISH assay kits have been approved by the FDA so far for the evaluation of HER2 gene amplification in
Dow
nloaded from https://academ
ic.oup.com/ajcp/article/144/5/686/1760671 by guest on 27 M
arch 2022

Furrer et al / Pros and Cons of HER2 Diagnostic Tests
692 Am J Clin Pathol 2015;144:686-703 DOI: 10.1309/AJCPT41TCBUEVDQC
© American Society for Clinical Pathology
breast cancer specimens: the single-probe INFORM HER2 FISH DNA kit (Ventana Medical Systems; currently dis-continued), the dual-probe PathVysion HER-2 DNA probe kit (Abbott Molecular, Des Plaines, IL), and the dual-probe HER2 FISH PharmDx kit (DAKO).
According to the ASCO/CAP and Canadian recom-mendations for HER2 testing in breast cancer published in 2007, a mean HER2 gene copy number of less than 4 signals/nucleus or a HER2 gene/chromosome 17 copy number ratio (HER2/CEP17) of less than 1.8 is considered FISH negative (nonamplified), a mean HER2 gene copy number of 4 or more and 6 or less signals/nucleus or a HER2/CEP17 ratio between 1.8 and 2.2 is considered FISH equivocal, and a mean HER2 gene copy number of more than 6 signals/nucle-us or a HER2/CEP17 ratio of 2.2 or more is considered FISH positive (amplified).15 According to the updated ASCO/CAP guidelines published in 2013, a mean HER2 gene copy num-ber of less than 4 signals/nucleus or a HER2/CEP17 ratio of less than 2.0 with a mean HER2 copy number of less than 4 signals/nucleus is considered FISH negative (nonamplified), a mean HER2 gene copy number of 4 or more and 6 or less signals/nucleus or a HER2/CEP17 ratio of less than 2.0 with a mean HER2 copy number of 4 or more and less than 6 signals/nucleus is considered FISH equivocal, and a mean HER2 gene copy number of 6 or more signals/nucleus or a HER2/CEP17 ratio of less than 2.0 with a mean HER2 copy number of 6 or more signals/nucleus or a HER2/CEP17 ratio of 2.0 or more is considered FISH positive (amplified).14 A minimum of 20 tumor cell nuclei are counted in at least two invasive tumor areas. For equivocal FISH samples, results are confirmed by counting 20 additional cells or repeating the FISH test.14,15
AdvantagesSimilar to IHC, FISH is performed on FFPE tissues.92
The FISH assay yields results that are considered more objective and quantitative than immunohistochemical scor-ing.92,96 Although still a matter of debate, several investi-gators consider FISH as being more accurate and reliable than IHC in the determination of HER2 status in breast cancer specimens.81,86,97-99 Moreover, since DNA is more stable than protein, preanalytical factors have less impact on assay results compared with IHC.32 Another advantage is represented by the presence of internal controls, consist-ing of nonamplified signals in nonneoplastic cells (ductal epithelial cells and stromal cells) adjacent to the tumor.93 The dual-probe system evaluates HER2 gene amplification as a ratio of the total HER2 signals to those of chromosome 17. The inclusion of the chromosome 17 probe enables the recognition of chromosome 17 polysomy and therefore allows the distinction between pseudoamplification due to polysomy from true HER2 gene amplification.100 Although
some studies report that chromosome 17 polysomy is a rare event101-103 and therefore rarely affects HER2 results, and although clinical relevance of chromosome 17 polysomy in breast cancer is not well established yet,63,104,105 some authors argue that inclusion of the CEP17 probe is of central relevance for the accurate determination of HER2 amplifica-tion, particularly in cases with low-level amplification.106-108 In fact, chromosome 17 polysomy is reported as a frequent reason for discordance of results obtained with mono-color and dual-color FISH.109,110
DisadvantagesAlthough FISH has been established as a very robust
method to evaluate HER2 gene amplification, this technique presents several disadvantages. FISH is nine times more time-consuming (36 hours vs 4 hours)71 and almost three times more expensive compared with immunohistochemical analysis ($140 vs $50).111 Moreover, FISH testing requires costly equipment for signal detection and recognition. Expensive fluorescence microscopes equipped with high-magnification oil immersion objectives and multiband filters are indispensable, making it difficult to integrate the FISH assay in every routine diagnostic laboratory.85 Furthermore, as fluorescence signals fade within a few weeks, hybridiza-tion results should ideally be recorded with an expensive CCD camera.85,112 Since morphologic aspects of the tissues are difficult to evaluate under fluorescence, distinguishing invasive breast cancer from breast carcinoma in situ, where HER2 gene amplification or protein overexpression has dif-ferent clinical significance, is rather complicated and time-consuming.113 Therefore, the FISH assay can be interpreted only by well-trained personnel.113,114 Some authors suggest that since FISH analysis is performed at high magnification, intratumoral heterogeneity can be missed.115,116
Although the FISH assay is considered a more objec-tive and quantitative technique than IHC, reproducibility of FISH results depends on recognition of the invasive com-ponent.117 Moreover, discrepancies among observers occur mainly in samples showing low-level amplification.106 Another important aspect is that fluorescence signal count-ing is time consuming. To overcome this problem, image analysis software for the automated evaluation of fluores-cent signals has been developed. Several studies have dem-onstrated an excellent agreement between HER2/CEP17 ratios calculated through manual counting and those result-ing from automated image analysis software.118-120 Some image analysis software has been approved by the FDA for the automated evaluation of HER2 gene amplification, including the Metafer (MetaSystems, Altussheim, Ger-many) and the Ariol HER2/neu FISH (Applied Imaging, San Jose, CA). In addition to reducing the time required for the analysis of fluorescent signals, this software allows
Dow
nloaded from https://academ
ic.oup.com/ajcp/article/144/5/686/1760671 by guest on 27 M
arch 2022

AJCP / Review Article
Am J Clin Pathol 2015;144:686-703 693 DOI: 10.1309/AJCPT41TCBUEVDQC
© American Society for Clinical Pathology
the storing of captured images and therefore the archiving of cases for future studies.118
Bright-Field ISH MethodsTo overcome FISH limitations, alternative in situ meth-
ods, such as chromogenic ISH (CISH), silver-enhanced ISH (SISH), gold-facilitated autometallographic ISH (GOLD-FISH), and bright-field double ISH (BDISH), have been developed to detect HER2 amplification. These recent tech-niques combine practical advantages of immunohistochemi-cal analysis with the reproducibility of the FISH method.121 Similar to FISH, these alternative ISH methods allow the quantification of HER2 and CEP17 signals and therefore the identification of HER2 gene amplification. However, since visualization is achieved using other reactions than fluorescence-labeled probe, signals can be analyzed using a standard bright-field microscope, allowing the simultaneous analysis of gene copy numbers and morphologic features of tissue.121 Signals can be therefore exclusively analyzed in an invasive compartment, excluding normal tissue elements and noninvasive carcinoma. Similar to immunohistochemi-cal analysis and FISH, BDISH assays are performed on FFPE tissue sections.121
In the following subsections, we will briefly describe each single BDISH technique, as well the distinctive advan-tages and disadvantages of each assay.
CISHCISH allows the visualization of target genes in tissue
sections using peroxidase enzyme-labeled probes.121 Similar to FISH, CISH can be performed as either a single-color (HER2 probe only) or a dual-color (HER2 and chromosome 17 probes) assay. The single-color CISH assay (SPOT-Light HER2 CISH kit; Life Technologies, Carlsbad, CA) and the dual-color CISH assay (HER2 CISH PharmDx kit; DAKO) were approved by the FDA in 2008 and 2011, respectively, for the evaluation of HER2 gene amplification in breast cancer specimens, either as a primary test to evaluate HER2 status or to retest equivocal immunohistochemical results (IHC score 2+).14
With the monochromatic CISH, only the absolute HER2 copy number is scored.73,122 Following heat-induced epitope retrieval and enzymatic digestion, a digoxigenin-labeled HER2 DNA probe is applied to the slide. After DNA dena-turation and hybridization, the hybridized HER2 probe is visualized by sequential incubation with mouse antidigoxi-genin and polymerized HRP-goat antimouse, followed by development with DAB as chromogen. HER2 gene copies are then recognizable as intranuclear brown chromogenic reaction product signals. Slides are counterstained with hematoxylin.96,116,122-124 Evaluation of chromosome 17 can be performed on a consecutive slide, using the same protocol
as for the HER2 probe, with the exception that a biotin-labeled chromosome 17 centromeric (CEP17) probe will used instead of the digoxigenin-labeled HER2 DNA probe. The CEP17 probe is visualized through incubation with HRP-conjugated antibiotin antibodies and DAB.96,124
HER2 signals are recognizable either as large perox-idase-positive intranuclear signal clusters or as numerous individual peroxidase-positive small signals.123 Cases with low-level amplification show six to 10 signals per nucleus in more than 50% of cancer cells, whereas high-level ampli-fied cases are characterized by a mean HER2 copy number of more than 10 or by large gene copy clusters in more than 50% of tumor cell nuclei.73,106,123,125
Similar to the dual-color FISH, the dual-color CISH assay allows the simultaneous visualization of the HER2 probe and the CEP17 probe on the same slide.126,127 The dual-color CISH assay is performed using sequential HRP and alkaline phosphatase (AP) enzymatic reactions to detect digoxigenin-labeled HER2 probes and biotin or dinitrophe-nyl-labeled chromosome 17 probes.128,129 HRP-conjugated antibodies are then visualized using a green chromogen (HER2 signals) and AP-conjugated antibodies using a red chromogen (CEP17 signals).
Alternatively, AP-conjugated antibodies and HRP-conjugated antibodies can be used to detect Texas red–labeled HER2 DNA probe and fluorescein isothiocyanate (FITC)–labeled CEP17 probe, respectively. AP-conjugated anti–Texas red antibodies are then developed using a red chromogen (HER2 signals), whereas the HRP-conjugated anti-FITC antibodies are developed using a blue chromo-gen (CEP17 signals).126,127,130 Red fluorescence signals produced by Texas red are therefore converted to red chro-mogenic HER2 signals, and green fluorescence signals pro-duced by FITC are converted to blue chromogenic CEP17 signals. Slides are then counterstained with hematoxylin. Results obtained by dual-color CISH are reported as dual-color FISH.15,113,126,128-130
AdvantagesInterpretation of results is performed using equip-
ment already available in routine histopathology labora-tories, such as a conventional bright-field microscope.123 Moreover, since results can be visualized using a standard bright-field microscope, CISH analysis allows the simul-taneous evaluation of tissue morphology and copy number alterations, reducing the risk of analyzing the nonmalignant compartment.126,131 Similar to FISH, the CISH assay has the advantage of the built-in internal control.93 Another advantage over FISH is that tumor heterogeneity is promptly recognizable, even at ×20 magnification.132 Furthermore, chromogenic signals are permanent.73 Slides can there-fore be stored and used for reevaluation or retrospective
Dow
nloaded from https://academ
ic.oup.com/ajcp/article/144/5/686/1760671 by guest on 27 M
arch 2022

Furrer et al / Pros and Cons of HER2 Diagnostic Tests
694 Am J Clin Pathol 2015;144:686-703 DOI: 10.1309/AJCPT41TCBUEVDQC
© American Society for Clinical Pathology
studies.126,127 Comparatively to FISH, the CISH assay is less expensive ($98/slide vs $183/slide)48 and quicker (248 vs 314 minutes).96 Since the CISH assay allows an easier identification of the invasive component compared with FISH, analysis of CISH signals is consequently less time-consuming than FISH.96,126 The inclusion of a CEP17 probe in the dual-color assay allows the calculation of the HER2/CEP17 ratio, enabling exclusion of chromosome 17 poly-somy.124 In addition, the dual-color assay can be performed on a programmable automated slide stainer, improving the assay efficiency and reducing the risk of errors.128,129
DisadvantagesThe main disadvantage of mono-color CISH is that the
use of monochromatic signals does not allow the determi-nation of the HER2/CEP17 ratio and therefore the detec-tion of chromosome 17 polysomy, making it necessary to hybridize the control probe (chromosome 17) on an adja-cent section. This additional staining is time-consuming and cost ineffective.126 The evaluation of HER2 gene copy number can be difficult in areas presenting high-level amplification, since overlapping dots lead to formation of signal clusters.126
Although relatively infrequent, technical problems, including over- or underfixation of tissue samples, over- or underdigestion of tissue sections, and high background debris, can lead to erroneous results or loss of signal.73,112,122
SISHSISH is an automated enzyme metallography proce-
dure.133 Enzymatic metallography is a recently developed method for ISH, in which an enzyme reaction is used to selectively deposit metal from solution to produce a black, sharply defined staining.133 In the specific case of SISH, HRP-conjugated probes are used to deposit metallic silver at the reaction site.133
All steps of the automated assay, including deparaf-finization and counterstaining, are performed on the Ven-tana BenchMark XT automated slide stainer.134-136 HER2 and chromosome 17 analysis is performed on sequential slides.134-136 After heat-induced epitope retrieval and pro-teolytic pretreatment, slides are incubated with a dinitro-phenol (DNP)–labeled HER2 probe and a DNP-labeled CEP17 probe, respectively. Following DNA denaturation and hybridization, both HER2 and CEP17 probes are visual-ized by application of a rabbit anti-DNP antibody followed by an HRP-labeled goat anti-rabbit antibody.134,135,137,138 As mentioned above, probes are visualized through the process of enzyme metallography. This process is driven by the sequential addition of silver acetate, hydroquinone, and hydrogen peroxide. Silver ions are reduced to metallic silver ions through the action of the reducing agent, hydroquinone.
This reaction is stimulated by hydrogen peroxide, which is a substrate for HRP. The silver precipitation is deposited in the nucleus, and HER2 or CEP17 signals are recognizable as black dots within cell nuclei.135,137,139
Similar to FISH, HER2 gene amplification status obtained by SISH is reported as a HER2/CEP17 ratio, according to the ASCO/CAP guidelines.15,115,135-138,140,141
AdvantagesSISH is a fully automated bright-field ISH assay. In
addition, since SISH protocol is automated, this assay is six times faster to perform than FISH (6 hours vs 36 hours).135 Moreover, staining results obtained with SISH show a higher signal resolution compared with those obtained with DAB-based methods (IHC, CISH).133 Discrete black dots and signal clusters are easier to evaluate compared with other bright-field ISH techniques.142,143 Furthermore, image analysis software (Ventana Image Analysis System; Ven-tana Medical Systems) for the automated quantification of HER2 gene and CEP17 copy number in sequential sections has been developed.121
DisadvantagesTo correct for chromosome 17 aneusomy, the hybridiza-
tion of a further section is required for separate evaluation of CEP17 copy number.142 Moreover, the SISH assay is a relatively new technique and requires a rather expensive automated slide stainer that may not be available in many routine pathology laboratories.128
GOLDFISHGOLDFISH is a recently developed method that
combines the use of streptavidin-labeled gold nanopar-ticles with gold-based autometallography. Autometal-lography is the process through which gold nanoparticles are enlarged and therefore visualized through bright-field microscopy by selective deposition of gold ions onto their surface.144,145 GOLDFISH has been tested for the deter-mination of HER2 gene amplification in breast cancer specimens.145,146
The GOLDFISH assay is based on the tyramide sig-nal amplification principle.147 At first, tissue sections are hybridized with biotin-labeled probe. The probe signal is amplified through the addition of streptavidin-peroxidase and biotinylated tyramine. Tissue sections are then incu-bated with Streptavidin-Nanogold (Nanoprobes, Yaphank, NY), 1.4-nm diameter gold particles covalently conjugated with streptavidin, and GoldEnhance (Nanoprobes), a reagent that catalyzes the deposition of gold ions in solution around the gold nanoparticles, thereby increasing their sizes.145 This produces a dense black, permanent signal visible with a con-ventional bright-field microscope.146
Dow
nloaded from https://academ
ic.oup.com/ajcp/article/144/5/686/1760671 by guest on 27 M
arch 2022

AJCP / Review Article
Am J Clin Pathol 2015;144:686-703 695 DOI: 10.1309/AJCPT41TCBUEVDQC
© American Society for Clinical Pathology
Cells are considered nonamplified if up to two small nonconfluent black signals are identified within nuclei of invasive carcinoma. Amplified cases are characterized by large clusters of confluent black signals, whereas cases showing low-level amplification are characterized by four to eight separately distinguishable black small signals.145
AdvantagesSince amplification cases are immediately recognized
by the presence of massive confluent deposit in cell nuclei, signal counting in amplified cases is not required, allowing a quicker examination of amplified cases.146
DisadvantagesThe signals obtained with the GOLDFISH technique
are less discrete compared with those obtained by SISH.142
BDISHBDISH or dual-color in situ hybridization (dual ISH) is
a fully automated bright-field ISH assay for the simultane-ous detection of HER2 and CEP17 signals on the same FFPE breast cancer tissue section.142,148 This technique combines the detection of HER2 gene copies through the deposition of metallic silver particles at the reaction site, as in the mono-color SISH assay, with the visualization of CEP17 copies with fast red, similar to the CISH procedure.142,149
The whole assay is performed with the FDA-approved dual-color ISH assay (INFORM HER2 Dual ISH DNA probe cocktail assay; Ventana Medical Systems) using the BenchMark XT automated slide stainer (Ventana Medi-cal Systems).142,148,149 Following antigen retrieval, DNP-labeled HER2 probe is applied to the slide. HER2 probe is visualized with a rabbit anti-DNP antibody followed by an HRP-labeled goat anti-rabbit antibody. HRP enzyme is then developed with a silver precipitate. HER2 signals are visual-ized as discrete black spots in the nuclei.142,148,149
Sequentially, DNP-labeled CEP17 probe is applied to the slide. CEP17 probe is visualized by the incubation with a rabbit anti-DNP antibody, followed by an AP-labeled goat anti-rabbit antibody. AP enzyme is finally developed by fast red reagent. The CEP17 signals are visualized as red spots in the nuclei. CEP17 red spots are slightly larger than the HER2 black spots. Slides are then counterstained with hematoxylin.142,148
Similar to FISH and SISH, HER2 gene amplification status determined by BDISH is reported as HER2/CEP17 ratios, as recommended by the ASCO/CAP guidelines.15
AdvantagesThe BDISH assay allows the simultaneous visualization
of both HER2 and CEP17 targets on the same slide. This is very relevant, especially for cases displaying chromosome
17 aneusomy or intratumoral heterogeneity.142 Furthermore, since the assay procedure is completely automated, repro-ducibility of results is increased, since risk of human errors is diminished.142,143 Moreover, in analogy to the SISH assay, HER2 signals are visualized as discrete black dots that are particularly easy to count.142,143 As the HER2 signals and CEP17 signals differ in color and size, both signals can be distinguished from each other, even though they colocalize within cell nuclei.142 Moreover, since the assay is complete-ly automated, results are available within 6 hours.143 Similar to other bright-field ISH techniques, HER2 amplification status can be examined with a conventional bright-field microscope in the context of tissue morphology. Moreover, slides can be permanently archived.142
DisadvantagesThe BDISH assay presents the same disadvantages as
CISH and SISH.
HER2 Gene-Protein AssayThese recently developed assays allow the simultaneous
evaluation of HER2 protein expression and HER2 gene ampli-fication on single FFPE breast cancer tissue sections. Several combinations have been described so far in the literature.
Downs-Kelly and collaborators150 combined IHC with mono-color SISH (EnzMet GenePro, Ventana Medical Sys-tems). HER2 gene amplification assessment was performed using an HRP-based silver deposition method, followed by HER2 immunohistochemical staining using AP and fast red substrate. They observed an excellent correlation between the results obtained with the combination gene-protein assay and those obtained by IHC alone.
Ni and collaborators151 combined HER2 immunohisto-chemical staining with mono-color CISH. Similar to Downs-Kelly et al,150 HER2 immunohistochemical staining was achieved using an AP-based fast red system. Subsequently, the CISH assay was performed using a digoxigenin-labeled HER2 probe, which was visualized via an antimouse antidi-goxigenin antibody and an antimouse HRP polymer conju-gate, followed by incubation with DAB. The combined pro-tocol was performed partially on an automated slide stainer.
Reisenbichler and collaborators152 tested a HER2 gene-protein assay consisting of the sequential performance of mono-color CISH followed by HER2 immunohistochemical staining. The digoxigenin-labeled HER2 probe was visualized via an antimouse antidigoxigenin antibody and an antimouse HRP polymer conjugate, followed by incubation with DAB. HER2 protein expression was evaluated with an HRP-based DAB system. They observed 100% agreement between the gene amplification results obtained when CISH was performed alone compared with the sequential protocol. Compared with separately performed immunohistochemical staining,
Dow
nloaded from https://academ
ic.oup.com/ajcp/article/144/5/686/1760671 by guest on 27 M
arch 2022

Furrer et al / Pros and Cons of HER2 Diagnostic Tests
696 Am J Clin Pathol 2015;144:686-703 DOI: 10.1309/AJCPT41TCBUEVDQC
© American Society for Clinical Pathology
agreement with immunohistochemical staining obtained with the combined protocol was observed in 78% of cases.
Nitta and collaborators153 evaluated the performance of an automated tricolor HER2 gene protein assay, consist-ing of HER2 immunohistochemical staining followed by dual-color ISH. Analysis of HER2 gene amplification was performed using the FDA-approved dual-color ISH assay (INFORM HER2 Dual ISH DNA probe cocktail assay; Ventana Medical Systems). DNP-labeled HER2 probe was detected with anti-DNP antibody, HRP-conjugated antibody, and metallic silver deposition. HER2 signal was visualized as a discrete black dot. Digoxin (DIG)–labeled CEP17 probe was visualized with an anti-DIG antibody, an AP-conjugated antibody, and fast red. CEP17 signal appeared as a red dot. HER2 protein expression was evaluated using DAB as chro-mogen. Both stainings were performed using an automated slide stainer. The overall concordance between the results obtained with the combined tests and the separate IHC and dual-color ISH was excellent (concordance rate ranged between 97.8% and 99.5% for IHC, and concordance oscil-lated between 96% and 97.7% for dual-color ISH).
Analysis of the HER2 gene-protein assay is performed according to the ASCO/CAP guidelines used in the indi-vidual assay.15,150-153
AdvantagesThe HER2 gene-protein assays combine the advantages
of IHC with those of BDISH methods. Whereas IHC repre-sents an effective and inexpensive method to detect tumor heterogeneity, ISH assays allow quantitative analysis of gene amplification.153 These assays facilitate the interpretation of results by conventional bright-field microscopy and improve the identification of discordance between protein overex-pression and gene amplification.150 Since the protein-gene assay allows the simultaneous evaluation of HER2 protein overexpression and HER2 gene amplification at the single cell level, this method could be particularly advantageous in cases with equivocal results using a single technique or in cases showing heterogeneous gene amplification.152 This is clinically relevant, since intratumoral heterogeneity has been identified as a major cause of discordance between HER2 IHC and HER2 FISH assay results in breast cancer specimens.153
DisadvantagesISH assays are expensive, and costly automated slide
stainers are required.
mRNA ISHThis new method allows the evaluation of gene expres-
sion in FFPE tissues, using specific single-stranded DNA probes that hybridize to target gene mRNA. HistoSonda
(Cenbimo, Lugo, Spain) is the kit presently available for the determination of HER2 gene expression in FFPE breast cancer samples using the mRNA ISH technique.154 Follow-ing protein digestion, tissue sections are hybridized with a digoxigenin-labeled single-stranded DNA probe targeting HER2 mRNA.154 After hybridization, tissue sections are incubated with an anti-digoxigenin antibody and an HRP-labeled secondary antibody. Hybridized probes are subse-quently visualized using DAB as a chromogen.
The interpretation of results is carried out in a binary fashion. A case is considered positive for HER2 expression when a brownish coloration of cell cytoplasm is observed. On the contrary, the absence of staining is interpreted as a negative result.154
AdvantagesmRNA ISH is a simple, relatively inexpensive, and
fast technique. Since the hybridization step is very quick (1 hour), the procedure takes 3 hours from deparaffiniza-tion to counterstaining. The assay can be performed on an automated IHC stainer.154 Furthermore, this method is less toxic compared with other ISH techniques, since the use of the toxic formamide as a hybridization buffer has been suppressed. Detection of chromogenic signals can be performed using a conventional bright-field microscope. In addition, this method is highly reproducible. Since single-stranded DNA fragments have a length that is up to 30 times greater than commercial oligoprobes, the assay specificity is increased, since the likelihood that the DNA probe hybridiz-es with other than the target sequence is remarkably reduced.
DisadvantagesmRNA is significantly less stable than DNA in fixed
tissues, and this could affect the reliability of the test.24
Instant-Quality FISHIn analogy to conventional FISH, instant-quality FISH
(IQFISH) allows the quantitative determination of HER2 gene amplification in breast cancer specimens.155,156 The HER2 IQFISH pharmDX kit (DAKO) received FDA approval in 2013. The IQFISH technique is performed in the same way as manual FISH (ie, pretreatment, pepsin digestion, denaturation, hybridization, stringent washing, and visualization). The main difference lies in the introduc-tion of a new hybridization buffer (IQFISH buffer), which dramatically reduces the time required for the hybridization step (1 hour vs 16 hours).155,156 The utilization of this new buffer therefore considerably decreases the total assay time necessary to perform the IQFISH compared with conven-tional FISH (3.5 hours vs 16-20 hours).
IQFISH analysis is performed according to the same guidelines as for FISH.15,155,156
Dow
nloaded from https://academ
ic.oup.com/ajcp/article/144/5/686/1760671 by guest on 27 M
arch 2022

AJCP / Review Article
Am J Clin Pathol 2015;144:686-703 697 DOI: 10.1309/AJCPT41TCBUEVDQC
© American Society for Clinical Pathology
AdvantagesSince the IQFISH hybridization buffer considerably
decreases the assay time, this new method allows the deter-mination of HER2 gene amplification status in 1 day (instead of 2 days as for the traditional FISH).155,156 This technique is therefore particularly relevant when HER2 status determina-tion is urgent, such as in cases where neoadjuvant therapy is indicated.155 Another important aspect concerns safety. While hybridization buffers currently used contain the toxic formamide, the IQFISH buffer is nontoxic.155
DisadvantagesIQFISH has most disadvantages of manual FISH (ie,
high reagent cost, disruption of tissue morphology, etc).
Automated HER2 FISH AssayThis new assay allows the full automation of the FISH
technique for the determination of HER2 gene amplifica-tion.157,158 The automated HER2 FISH assay is performed with the Leica HER2 FISH System and the Leica BOND-MAX stainer (Leica Biosystems), using the FDA-approved PathVysion HER2 DNA Probe kit, which contains dual HER2 and chromosome 17 FISH probes. So far, two stud-ies have analyzed the performance of the fully automated HER2 FISH assay in breast cancer specimens.157,158 Both studies observed a high level of concordance between results obtained with manual and automated FISH (concordance rate ranging between 96% and 100%).157,158
Counting and analysis of the automated HER2 FISH assay are performed in the same manner as manual FISH.15,157,158
AdvantagesCompared with manual FISH, automated FISH is less
expensive, since less human intervention is required.157 Moreover, automated FISH enables faster processing of samples and recording of results.157 Furthermore, the auto-mation of the technique might also reduce laboratory errors and therefore reduce interobserver and interlaboratory vari-ability, as well as improve result reproducibility.157,158 Yoon and collaborators158 observed that nuclear membranes were less digested using automated FISH compared with manual FISH, resulting in better conservation of nuclear material and therefore easier distinction of the invasive component in the slide.
DisadvantagesEspecially in breast cancer specimens with abundant
stroma, the automated FISH assay produced a foggier background compared with manual FISH.158 This technique and manual FISH present several common disadvantages (ie, expensive and time-consuming methods).
Predictive Performance of Assays Used for the HER2 Status Determination in Breast Cancer
To date, only a few studies have compared the predic-tive performance of different assays used for the HER2 evaluation in breast cancer specimens.8,9,159,160 Results obtained from these studies are often quite different. Main reasons for inconsistencies between results could be attrib-uted to the different sensitivity of the applied antibodies, the lack of standardized staining evaluation, the different defini-tion of HER2 overexpression and HER2 gene amplification (especially in studies published before the publication of the 2007 ASCO/CAP scoring guidelines), and the type of treat-ment received.
One study reported that FISH performed better com-pared with IHC (clones 4D5 and CB11) in the prediction of trastuzumab response in a cohort of 114 patients with HER2-overexpressing metastatic breast cancer.9 It is, however, relevant to note that in this early study, tumors showing IHC 2+ were also considered HER2 overexpressing, independently from the HER2 gene amplification status. When only 3+ cases are considered, the response rates to trastuzumab were very similar to those observed in the HER2 gene amplified group.
In a cohort of patients with metastatic breast cancer treated with trastuzumab monotherapy, it was reported that centrally determined IHC (using the HercepTest) was slight-ly better compared with central FISH in predicting response to trastuzumab.159 Sensitivity in determining response to trastuzumab was 100% for the HercepTest compared with 84.2% for FISH.
Among 95 patients with metastatic breast cancer treated with trastuzumab in combination with paclitaxel, Seid-man and colleagues8 reported that the strongest associa-tion between clinical response rate and the assays used for the determination of HER2 (IHC: HercepTest, TAB250, CB11, and Pab1; FISH) occurred with FISH and CB11 and TAB250 antibodies.
In a cohort of 52 consecutive patients with HER2-posi-tive metastatic breast cancer treated with trastuzumab com-bined with chemotherapy, patients with tumors with a HER2 FISH ratio of less than 3.0 showed a shorter progression-free survival, whereas patients with tumors that did not overex-press HER2 (IHC score 1+) had a shorter overall survival.160
Conclusion
Assessment of the HER2 status in breast cancer specimens is a key component for defining prognosis and patient man-agement. Considering the clinical and economic implications of targeted anti-HER2 treatments, accurate HER2 test results are essential. False-negative results would deny the access of patients to the potential benefits of targeted treatment,
Dow
nloaded from https://academ
ic.oup.com/ajcp/article/144/5/686/1760671 by guest on 27 M
arch 2022

Furrer et al / Pros and Cons of HER2 Diagnostic Tests
698 Am J Clin Pathol 2015;144:686-703 DOI: 10.1309/AJCPT41TCBUEVDQC
© American Society for Clinical Pathology
whereas false-positive results would expose patients to the potential cardiotoxic side effects of these expensive drugs without experiencing any therapeutic advantages.
The optimal method for assessing HER2 status in breast cancer specimens has remained controversial, since each technique is characterized by its own advantages and disadvantages. IHC is an easy and relatively inexpensive technique. However, the reliability of immunohistochemical results is influenced by a variety of preanalytical, analyti-cal, and postanalytical factors. FISH is considered a more robust technique than IHC, but high cost of reagents and the requirement of expensive laboratory equipment for the eval-uation of fluorescent signals that fade over time represent major limitations of this technique. Bright-field ISH assays allow the simultaneous evaluation of HER2 gene amplifica-tion and histopathologic morphology using a conventional bright-field microscope. However, these techniques are rela-tively new and require sometimes expensive automated slide stainers. Although some publications consider FISH a more accurate and reliable test than IHC for the determination of HER2 status in breast cancer specimens, ASCO⁄CAP guide-lines14,15 do not define a true gold-standard method. They stress instead that standardization of laboratory procedures and test interpretation, as well as internal and external qual-ity control assessment, are key elements to provide reliable test results. ASCO/CAP guidelines recommend the use of IHC, FISH, or bright-field ISH assays for the evaluation of HER2 status in breast cancer specimens. The introduction of a new test method is encouraged, but the ASCO/CAP panel recommends that the new diagnostic test has to have been previously compared with a reference test to confirm the clinical benefit of the new test for the patient.14,15
Molecular biology techniques, including Northern blot, Southern blot, and Western blot, are very useful for the comprehension of the biology of HER2. However, they are rather impractical in the clinical setting. New technologies, including mRNA ISH, or high-throughput technologies such as PCR-based assays and MLPA are promising and poten-tially less costly compared with IHC and ISH assays. Their implementation in clinical routine, however, still needs to be thoroughly examined. Moreover, guidelines regarding the standardization and interpretation of diagnostic tests in addition to conventional IHC and ISH assays are needed.161
As a general remark, it should be kept in mind that although the ideal diagnostic test is 100% accurate and 100% precise, in practice, every diagnostic test is prone to error.161
In conclusion, since the optimal approach to testing HER2 status in breast cancer is still a matter of debate, stringent standardization of existing tests and development of new robust and reliable diagnostic tests are warranted. As further concluding remarks, it should also be noted that the superiority of one assay over another in the evaluation
of HER2 status in breast cancer specimens can be unequivo-cally determined only by analyzing the clinical response to anti-HER2 therapies as reference. Since the few studies that have been conducted so far comparing the predictive value of HER2 assays toward anti-HER2 therapies have shown conflicting results, more studies that analyze this intriguing subject should be performed.
Corresponding author: Caroline Diorio, PhD, Axe Oncologie, Centre de recherche du CHU de Québec, Hôpital du Saint-Sacrement, 1050 chemin Ste-Foy, Quebec City, QC G1S 4L8, Canada; [email protected].
Daniela Furrer received doctoral fellowships from the Fonds de recherche du Québec—Santé and the Laval University Cancer Research Center. Caroline Diorio is a junior investigator of the Canadian Cancer Society.
References 1. Yarden Y, Sliwkowski MX. Untangling the ErbB signalling
network. Nat Rev Mol Cell Biol. 2001;2:127-137. 2. Popescu NC, King CR, Kraus MH. Localization of the
human erbB-2 gene on normal and rearranged chromosomes 17 to bands q12-21.32. Genomics. 1989;4:362-366.
3. Olayioye MA, Neve RM, Lane HA, et al. The ErbB signaling network: receptor heterodimerization in development and cancer. EMBO J. 2000;19:3159-3167.
4. English DP, Roque DM, Santin AD. HER2 expression beyond breast cancer: therapeutic implications for gynecologic malignancies. Mol Diagn Ther. 2013;17:85-99.
5. Soerjomataram I, Louwman MW, Ribot JG, et al. An overview of prognostic factors for long-term survivors of breast cancer. Breast Cancer Res Treat. 2008;107:309-330.
6. Esteva FJ, Yu D, Hung MC, et al. Molecular predictors of response to trastuzumab and lapatinib in breast cancer. Nat Rev Clin Oncol. 2010;7:98-107.
7. Nahta R, Hung MC, Esteva FJ. The HER-2-targeting antibodies trastuzumab and pertuzumab synergistically inhibit the survival of breast cancer cells. Cancer Res. 2004;64:2343-2346.
8. Seidman AD, Fornier MN, Esteva FJ, et al. Weekly trastuzumab and paclitaxel therapy for metastatic breast cancer with analysis of efficacy by HER2 immunophenotype and gene amplification. J Clin Oncol. 2001;19:2587-2595.
9. Vogel CL, Cobleigh MA, Tripathy D, et al. Efficacy and safety of trastuzumab as a single agent in first-line treatment of HER2-overexpressing metastatic breast cancer. J Clin Oncol. 2002;20:719-726.
10. Gianni L, Dafni U, Gelber RD, et al. Treatment with trastuzumab for 1 year after adjuvant chemotherapy in patients with HER2-positive early breast cancer: a 4-year follow-up of a randomised controlled trial. Lancet Oncol. 2011;12:236-244.
11. Piccart-Gebhart MJ, Procter M, Leyland-Jones B, et al. Trastuzumab after adjuvant chemotherapy in HER2-positive breast cancer. N Engl J Med. 2005;353:1659-1672.
12. Xia W, Mullin RJ, Keith BR, et al. Anti-tumor activity of GW572016: a dual tyrosine kinase inhibitor blocks EGF activation of EGFR/erbB2 and downstream Erk1/2 and AKT pathways. Oncogene. 2002;21:6255-6263.
Dow
nloaded from https://academ
ic.oup.com/ajcp/article/144/5/686/1760671 by guest on 27 M
arch 2022

AJCP / Review Article
Am J Clin Pathol 2015;144:686-703 699 DOI: 10.1309/AJCPT41TCBUEVDQC
© American Society for Clinical Pathology
13. Ryan Q, Ibrahim A, Cohen MH, et al. FDA drug approval summary: lapatinib in combination with capecitabine for previously treated metastatic breast cancer that overexpresses HER-2. Oncologist. 2008;13:1114-1119.
14. Wolff AC, Hammond ME, Hicks DG, et al. Recommendations for human epidermal growth factor receptor 2 testing in breast cancer: American Society of Clinical Oncology/College of American Pathologists clinical practice guideline update. J Clin Oncol. 2013;31:3997-4013.
15. Wolff AC, Hammond ME, Schwartz JN, et al. American Society of Clinical Oncology/College of American Pathologists guideline recommendations for human epidermal growth factor receptor 2 testing in breast cancer. J Clin Oncol. 2007;25:118-145.
16. Andrulis IL, Bull SB, Blackstein ME, et al. neu/erbB-2 amplification identifies a poor-prognosis group of women with node-negative breast cancer. Toronto Breast Cancer Study Group. J Clin Oncol. 1998;16:1340-1349.
17. Berger MS, Locher GW, Saurer S, et al. Correlation of c-erbB-2 gene amplification and protein expression in human breast carcinoma with nodal status and nuclear grading. Cancer Res. 1988;48:1238-1243.
18. Jukkola A, Bloigu R, Soini Y, et al. c-erbB-2 positivity is a factor for poor prognosis in breast cancer and poor response to hormonal or chemotherapy treatment in advanced disease. Eur J Cancer. 2001;37:347-354.
19. Scorilas A, Yotis J, Pateras C, et al. Predictive value of c-erbB-2 and cathepsin-D for Greek breast cancer patients using univariate and multivariate analysis. Clin Cancer Res. 1999;5:815-821.
20. Slamon DJ, Clark GM, Wong SG, et al. Human breast cancer: correlation of relapse and survival with amplification of the HER-2/neu oncogene. Science. 1987;235:177-182.
21. Slamon DJ, Godolphin W, Jones LA, et al. Studies of the HER-2/neu proto-oncogene in human breast and ovarian cancer. Science. 1989;244:707-712.
22. Tsuda H, Tani Y, Hasegawa T, et al. Concordance in judgments among c-erbB-2 (HER2/neu) overexpression detected by two immunohistochemical tests and gene amplification detected by Southern blot hybridization in breast carcinoma. Pathol Int. 2001;51:26-32.
23. Miyada CG, Wallace RB. Oligonucleotide hybridization techniques. Methods Enzymol. 1987;154:94-107.
24. Cronin M, Pho M, Dutta D, et al. Measurement of gene expression in archival paraffin-embedded tissues: development and performance of a 92-gene reverse transcriptase–polymerase chain reaction assay. Am J Pathol. 2004;164:35-42.
25. Gjerdrum LM, Sorensen BS, Kjeldsen E, et al. Real-time quantitative PCR of microdissected paraffin-embedded breast carcinoma: an alternative method for HER-2/neu analysis. J Mol Diagn. 2004;6:42-51.
26. Moelans CB, de Weger RA, van Blokland MT, et al. HER-2/neu amplification testing in breast cancer by multiplex ligation-dependent probe amplification in comparison with immunohistochemistry and in situ hybridization. Cell Oncol. 2009;31:1-10.
27. Slamon DJ, deKernion JB, Verma IM, et al. Expression of cellular oncogenes in human malignancies. Science. 1984;224:256-262.
28. Streit S, Michalski CW, Erkan M, et al. Northern blot analysis for detection and quantification of RNA in pancreatic cancer cells and tissues. Nat Protocols. 2009;4:37-43.
29. Hudis CA. Trastuzumab—mechanism of action and use in clinical practice. N Engl J Med. 2007;357:39-51.
30. Codony-Servat J, Albanell J, Lopez-Talavera JC, et al. Cleavage of the HER2 ectodomain is a pervanadate-activable process that is inhibited by the tissue inhibitor of metalloproteases-1 in breast cancer cells. Cancer Res. 1999;59:1196-1201.
31. Sanderson MP, Dempsey PJ, Dunbar AJ. Control of ErbB signaling through metalloprotease mediated ectodomain shedding of EGF-like factors. Growth Factors. 2006;24:121-136.
32. Yeh IT. Measuring HER-2 in breast cancer: immunohistochemistry, FISH, or ELISA? Am J Clin Pathol. 2002;117(suppl):S26-S35.
33. Bramwell VH, Doig GS, Tuck AB, et al. Changes over time of extracellular domain of HER2 (ECD/HER2) serum levels have prognostic value in metastatic breast cancer. Breast Cancer Res Treat. 2009;114:503-511.
34. Fornier MN, Seidman AD, Schwartz MK, et al. Serum HER2 extracellular domain in metastatic breast cancer patients treated with weekly trastuzumab and paclitaxel: association with HER2 status by immunohistochemistry and fluorescence in situ hybridization and with response rate. Ann Oncol. 2005;16:234-239.
35. Ludovini V, Gori S, Colozza M, et al. Evaluation of serum HER2 extracellular domain in early breast cancer patients: correlation with clinicopathological parameters and survival. Ann Oncol. 2008;19:883-890.
36. Schwartz MK, Smith C, Schwartz DC, et al. Monitoring therapy by serum HER-2/neu. Int J Biol Markers. 2000;15:324-329.
37. Sias PE, Kotts CE, Vetterlein D, et al. ELISA for quantitation of the extracellular domain of p185HER2 in biological fluids. J Immunol Methods. 1990;132:73-80.
38. Esteva FJ, Cheli CD, Fritsche H, et al. Clinical utility of serum HER2/neu in monitoring and prediction of progression-free survival in metastatic breast cancer patients treated with trastuzumab-based therapies. Breast Cancer Res. 2005;7:R436-R443.
39. Carney WP, Leitzel K, Ali S, et al. HER-2/neu diagnostics in breast cancer. Breast Cancer Res. 2007;9:207.
40. Molina R, Jo J, Filella X, et al. C-erbB-2 oncoprotein in the sera and tissue of patients with breast cancer: utility in prognosis. Anticancer Res. 1996;16:2295-2300.
41. Sorensen PD, Jakobsen EH, Langkjer ST, et al. Serum HER-2 concentrations for monitoring women with breast cancer in a routine oncology setting. Clin Chem Lab Med. 2009;47:1117-1123.
42. Lipton A, Ali SM, Leitzel K, et al. Elevated serum Her-2/neu level predicts decreased response to hormone therapy in metastatic breast cancer. J Clin Oncol. 2002;20:1467-1472.
43. Kong Y, Dai S, Xie X, et al. High serum HER2 extracellular domain levels: correlation with a worse disease-free survival and overall survival in primary operable breast cancer patients. J Cancer Res Clin Oncol. 2012;138:275-284.
44. Sandri MT, Johansson H, Colleoni M, et al. Serum levels of HER2 ECD can determine the response rate to low dose oral cyclophosphamide and methotrexate in patients with advanced stage breast carcinoma. Anticancer Res. 2004;24:1261-1266.
45. Ali SM, Carney WP, Esteva FJ, et al. Serum HER-2/neu and relative resistance to trastuzumab-based therapy in patients with metastatic breast cancer. Cancer. 2008;113:1294-1301.
Dow
nloaded from https://academ
ic.oup.com/ajcp/article/144/5/686/1760671 by guest on 27 M
arch 2022

Furrer et al / Pros and Cons of HER2 Diagnostic Tests
700 Am J Clin Pathol 2015;144:686-703 DOI: 10.1309/AJCPT41TCBUEVDQC
© American Society for Clinical Pathology
46. Lennon S, Barton C, Banken L, et al. Utility of serum HER2 extracellular domain assessment in clinical decision making: pooled analysis of four trials of trastuzumab in metastatic breast cancer. J Clin Oncol. 2009;27:1685-1693.
47. Lam L, McAndrew N, Yee M, et al. Challenges in the clinical utility of the serum test for HER2 ECD. Biochim Biophys Acta. 2012;1826:199-208.
48. Moelans CB, de Weger RA, Van der Wall E, et al. Current technologies for HER2 testing in breast cancer. Crit Rev Oncol Hematol. 2011;80:380-392.
49. Hayashi N, Nakamura S, Tokuda Y, et al. Serum HER2 levels determined by two methods in patients with metastatic breast cancer. Int J Clin Oncol. 2012;17:55-62.
50. Becker KF, Schott C, Hipp S, et al. Quantitative protein analysis from formalin-fixed tissues: implications for translational clinical research and nanoscale molecular diagnosis. J Pathol. 2007;211:370-378.
51. Borg A, Tandon AK, Sigurdsson H, et al. HER-2/neu amplification predicts poor survival in node-positive breast cancer. Cancer Res. 1990;50:4332-4337.
52. Tandon AK, Clark GM, Chamness GC, et al. HER-2/neu oncogene protein and prognosis in breast cancer. J Clin Oncol. 1989;7:1120-1128.
53. Ross JS, Fletcher JA. The HER-2/neu oncogene in breast cancer: prognostic factor, predictive factor, and target for therapy. Oncologist. 1998;3:237-252.
54. Baehner FL, Achacoso N, Maddala T, et al. Human epidermal growth factor receptor 2 assessment in a case-control study: comparison of fluorescence in situ hybridization and quantitative reverse transcription polymerase chain reaction performed by central laboratories. J Clin Oncol. 2010;28:4300-4306.
55. Benohr P, Henkel V, Speer R, et al. Her-2/neu expression in breast cancer—a comparison of different diagnostic methods. Anticancer Res. 2005;25:1895-1900.
56. Capizzi E, Gruppioni E, Grigioni AD, et al. Real time RT-PCR approach for the evaluation of ERBB2 overexpression in breast cancer archival samples: a comparative study with FISH, SISH, and immunohistochemistry. Diagn Mol Pathol. 2008;17:220-226.
57. Dabbs DJ, Klein ME, Mohsin SK, et al. High false-negative rate of HER2 quantitative reverse transcription polymerase chain reaction of the Oncotype DX test: an independent quality assurance study. J Clin Oncol. 2011;29:4279-4285.
58. Lehmann-Che J, Amira-Bouhidel F, Turpin E, et al. Immunohistochemical and molecular analyses of HER2 status in breast cancers are highly concordant and complementary approaches. Br J Cancer. 2011;104:1739-1746.
59. Merkelbach-Bruse S, Wardelmann E, Behrens P, et al. Current diagnostic methods of HER-2/neu detection in breast cancer with special regard to real-time PCR. Am J Surg Pathol. 2003;27:1565-1570.
60. Nistor A, Watson PH, Pettigrew N, et al. Real-time PCR complements immunohistochemistry in the determination of HER-2/neu status in breast cancer. BMC Clin Pathol. 2006;6:2.
61. Noske A, Loibl S, Darb-Esfahani S, et al. Comparison of different approaches for assessment of HER2 expression on protein and mRNA level: prediction of chemotherapy response in the neoadjuvant GeparTrio trial (NCT00544765). Breast Cancer Res Treat. 2011;126:109-117.
62. Susini T, Bussani C, Marini G, et al. Preoperative assessment of HER-2/neu status in breast carcinoma: the role of quantitative real-time PCR on core-biopsy specimens. Gynecol Oncol. 2010;116:234-239.
63. Vanden Bempt I, Van Loo P, Drijkoningen M, et al. Polysomy 17 in breast cancer: clinicopathologic significance and impact on HER-2 testing. J Clin Oncol. 2008;26:4869-4874.
64. Livak KJ, Schmittgen TD. Analysis of relative gene expression data using real-time quantitative PCR and the 2(–Delta Delta C(T)) Method. Methods. 2001;25:402-408.
65. Cronin M, Sangli C, Liu ML, et al. Analytical validation of the Oncotype DX genomic diagnostic test for recurrence prognosis and therapeutic response prediction in node-negative, estrogen receptor–positive breast cancer. Clin Chem. 2007;53:1084-1091.
66. Jacquemier J, Spyratos F, Esterni B, et al. SISH/CISH or qPCR as alternative techniques to FISH for determination of HER2 amplification status on breast tumors core needle biopsies: a multicenter experience based on 840 cases. BMC Cancer. 2013;13:351.
67. Huggett J, Dheda K, Bustin S, et al. Real-time RT-PCR normalisation; strategies and considerations. Genes Immun. 2005;6:279-284.
68. Sellner LN, Taylor GR. MLPA and MAPH: new techniques for detection of gene deletions. Hum Mutat. 2004;23:413-419.
69. Sapino A, Goia M, Recupero D, et al. Current challenges for HER2 testing in diagnostic pathology: state of the art and controversial issues. Front Oncol. 2013;3:129.
70. Varshney D, Zhou YY, Geller SA, et al. Determination of HER-2 status and chromosome 17 polysomy in breast carcinomas comparing HercepTest and PathVysion FISH assay. Am J Clin Pathol. 2004;121:70-77.
71. Yaziji H, Goldstein LC, Barry TS, et al. HER-2 testing in breast cancer using parallel tissue-based methods. JAMA. 2004;291:1972-1977.
72. Hanna W, Kahn HJ, Trudeau M. Evaluation of HER-2/neu (erbB-2) status in breast cancer: from bench to bedside. Mod Pathol. 1999;12:827-834.
73. Gupta D, Middleton LP, Whitaker MJ, et al. Comparison of fluorescence and chromogenic in situ hybridization for detection of HER-2/neu oncogene in breast cancer. Am J Clin Pathol. 2003;119:381-387.
74. Jacobs TW, Gown AM, Yaziji H, et al. Specificity of HercepTest in determining HER-2/neu status of breast cancers using the United States Food and Drug Administration–approved scoring system. J Clin Oncol. 1999;17:1983-1987.
75. Ross JS, Fletcher JA. HER-2/neu (c-erb-B2) gene and protein in breast cancer. Am J Clin Pathol. 1999;112(suppl 1):S53-S67.
76. Yildiz-Aktas IZ, Dabbs DJ, Bhargava R. The effect of cold ischemic time on the immunohistochemical evaluation of estrogen receptor, progesterone receptor, and HER2 expression in invasive breast carcinoma. Mod Pathol. 2012;25:1098-1105.
77. Middleton LP, Price KM, Puig P, et al. Implementation of American Society of Clinical Oncology/College of American Pathologists HER2 Guideline Recommendations in a tertiary care facility increases HER2 immunohistochemistry and fluorescence in situ hybridization concordance and decreases the number of inconclusive cases. Arch Pathol Lab Med. 2009;133:775-780.
Dow
nloaded from https://academ
ic.oup.com/ajcp/article/144/5/686/1760671 by guest on 27 M
arch 2022

AJCP / Review Article
Am J Clin Pathol 2015;144:686-703 701 DOI: 10.1309/AJCPT41TCBUEVDQC
© American Society for Clinical Pathology
78. Penault-Llorca F, Adelaide J, Houvenaeghel G, et al. Optimization of immunohistochemical detection of ERBB2 in human breast cancer: impact of fixation. J Pathol. 1994;173:65-75.
79. Hicks DG, Schiffhauer L. Standardized assessment of the HER2 status in breast cancer by immunohistochemistry. Lab Med. 2011;42:459-467.
80. Lebeau A, Deimling D, Kaltz C, et al. Her-2/neu analysis in archival tissue samples of human breast cancer: comparison of immunohistochemistry and fluorescence in situ hybridization. J Clin Oncol. 2001;19:354-363.
81. Press MF, Hung G, Godolphin W, et al. Sensitivity of HER-2/neu antibodies in archival tissue samples: potential source of error in immunohistochemical studies of oncogene expression. Cancer Res. 1994;54:2771-2777.
82. Sapino A, Coccorullo Z, Cassoni P, et al. Which breast carcinomas need HER-2/neu gene study after immunohistochemical analysis? results of combined use of antibodies against different c-erbB2 protein domains. Histopathology. 2003;43:354-362.
83. Thomson TA, Hayes MM, Spinelli JJ, et al. HER-2/neu in breast cancer: interobserver variability and performance of immunohistochemistry with 4 antibodies compared with fluorescent in situ hybridization. Mod Pathol. 2001;14:1079-1086.
84. Tsuda H, Sasano H, Akiyama F, et al. Evaluation of interobserver agreement in scoring immunohistochemical results of HER-2/neu (c-erbB-2) expression detected by HercepTest, Nichirei polyclonal antibody, CB11 and TAB250 in breast carcinoma. Pathol Int. 2002;52:126-134.
85. Zhao J, Wu R, Au A, et al. Determination of HER2 gene amplification by chromogenic in situ hybridization (CISH) in archival breast carcinoma. Mod Pathol. 2002;15:657-665.
86. Tubbs RR, Pettay JD, Roche PC, et al. Discrepancies in clinical laboratory testing of eligibility for trastuzumab therapy: apparent immunohistochemical false-positives do not get the message. J Clin Oncol. 2001;19:2714-2721.
87. Hoang MP, Sahin AA, Ordonez NG, et al. HER-2/neu gene amplification compared with HER-2/neu protein overexpression and interobserver reproducibility in invasive breast carcinoma. Am J Clin Pathol. 2000;113:852-859.
88. Bankfalvi A, Boecker W, Reiner A. Comparison of automated and manual determination of HER2 status in breast cancer for diagnostic use: a comparative methodological study using the Ventana BenchMark automated staining system and manual tests. Int J Oncol. 2004;25:929-935.
89. Bloom K, Harrington D. Enhanced accuracy and reliability of HER-2/neu immunohistochemical scoring using digital microscopy. Am J Clin Pathol. 2004;121:620-630.
90. Tawfik OW, Kimler BF, Davis M, et al. Comparison of immunohistochemistry by automated cellular imaging system (ACIS) versus fluorescence in-situ hybridization in the evaluation of HER-2/neu expression in primary breast carcinoma. Histopathology. 2006;48:258-267.
91. Brugmann A, Eld M, Lelkaitis G, et al. Digital image analysis of membrane connectivity is a robust measure of HER2 immunostains. Breast Cancer Res Treat. 2012;132:41-49.
92. Hicks DG, Tubbs RR. Assessment of the HER2 status in breast cancer by fluorescence in situ hybridization: a technical review with interpretive guidelines. Hum Pathol. 2005;36:250-261.
93. Ross JS, Slodkowska EA, Symmans WF, et al. The HER-2 receptor and breast cancer: ten years of targeted anti-HER-2 therapy and personalized medicine. Oncologist. 2009;14:320-368.
94. Kovacs A, Stenman G. HER2-testing in 538 consecutive breast cancer cases using FISH and immunohistochemistry. Pathol Res Pract. 2010;206:39-42.
95. Varga Z, Noske A, Ramach C, et al. Assessment of HER2 status in breast cancer: overall positivity rate and accuracy by fluorescence in situ hybridization and immunohistochemistry in a single institution over 12 years: a quality control study. BMC Cancer. 2013;13:615.
96. Bhargava R, Lal P, Chen B. Chromogenic in situ hybridization for the detection of HER-2/neu gene amplification in breast cancer with an emphasis on tumors with borderline and low-level amplification: does it measure up to fluorescence in situ hybridization? Am J Clin Pathol. 2005;123:237-243.
97. Bartlett JM, Going JJ, Mallon EA, et al. Evaluating HER2 amplification and overexpression in breast cancer. J Pathol. 2001;195:422-428.
98. Paik S, Bryant J, Tan-Chiu E, et al. Real-world performance of HER2 testing—National Surgical Adjuvant Breast and Bowel Project experience. J Natl Cancer Inst. 2002;94:852-854.
99. Persons DL, Borelli KA, Hsu PH. Quantitation of HER-2/neu and c-myc gene amplification in breast carcinoma using fluorescence in situ hybridization. Mod Pathol. 1997;10:720-727.
100. Hicks DG, Kulkarni S. HER2+ breast cancer: review of biologic relevance and optimal use of diagnostic tools. Am J Clin Pathol. 2008;129:263-273.
101. Marchio C, Lambros MB, Gugliotta P, et al. Does chromosome 17 centromere copy number predict polysomy in breast cancer? a fluorescence in situ hybridization and microarray-based CGH analysis. J Pathol. 2009;219:16-24.
102. Moelans CB, de Weger RA, van Diest PJ. Absence of chromosome 17 polysomy in breast cancer: analysis by CEP17 chromogenic in situ hybridization and multiplex ligation-dependent probe amplification. Breast Cancer Res Treat. 2010;120:1-7.
103. Yeh IT, Martin MA, Robetorye RS, et al. Clinical validation of an array CGH test for HER2 status in breast cancer reveals that polysomy 17 is a rare event. Mod Pathol. 2009;22:1169-1175.
104. Hanna WM, Ruschoff J, Bilous M, et al. HER2 in situ hybridization in breast cancer: clinical implications of polysomy 17 and genetic heterogeneity. Mod Pathol. 2014;27:4-18.
105. Wang S, Hossein Saboorian M, Frenkel EP, et al. Aneusomy 17 in breast cancer: its role in HER-2/neu protein expression and implication for clinical assessment of HER-2/neu status. Mod Pathol. 2002;15:137-145.
106. Hanna WM, Kwok K. Chromogenic in-situ hybridization: a viable alternative to fluorescence in-situ hybridization in the HER2 testing algorithm. Mod Pathol. 2006;19:481-487.
107. Lal P, Salazar PA, Ladanyi M, et al. Impact of polysomy 17 on HER-2/neu immunohistochemistry in breast carcinomas without HER-2/neu gene amplification. J Mol Diagn. 2003;5:155-159.
108. McCormick SR, Lillemoe TJ, Beneke J, et al. HER2 assessment by immunohistochemical analysis and fluorescence in situ hybridization: comparison of HercepTest and PathVysion commercial assays. Am J Clin Pathol. 2002;117:935-943.
109. Dal Lago L, Durbecq V, Desmedt C, et al. Correction for chromosome-17 is critical for the determination of true Her-2/neu gene amplification status in breast cancer. Mol Cancer Ther. 2006;5:2572-2579.
Dow
nloaded from https://academ
ic.oup.com/ajcp/article/144/5/686/1760671 by guest on 27 M
arch 2022
Furrer et al / Pros and Cons of HER2 Diagnostic Tests
702 Am J Clin Pathol 2015;144:686-703 DOI: 10.1309/AJCPT41TCBUEVDQC
© American Society for Clinical Pathology
110. Vranic S, Teruya B, Repertinger S, et al. Assessment of HER2 gene status in breast carcinomas with polysomy of chromosome 17. Cancer. 2011;117:48-53.
111. Ridolfi RL, Jamehdor MR, Arber JM. HER-2/neu testing in breast carcinoma: a combined immunohistochemical and fluorescence in situ hybridization approach. Mod Pathol. 2000;13:866-873.
112. van de Vijver M, Bilous M, Hanna W, et al. Chromogenic in situ hybridisation for the assessment of HER2 status in breast cancer: an international validation ring study. Breast Cancer Res. 2007;9:R68.
113. Pedersen M, Rasmussen BB. The correlation between dual-color chromogenic in situ hybridization and fluorescence in situ hybridization in assessing HER2 gene amplification in breast cancer. Diagn Mol Pathol. 2009;18:96-102.
114. Dowsett M, Hanna WM, Kockx M, et al. Standardization of HER2 testing: results of an international proficiency-testing ring study. Mod Pathol. 2007;20:584-591.
115. Bilous M, Morey AL, Armes JE, et al. Assessing HER2 amplification in breast cancer: findings from the Australian In Situ Hybridization Program. Breast Cancer Res Treat. 2012;134:617-624.
116. Kiyose S, Igarashi H, Nagura K, et al. Chromogenic in situ hybridization (CISH) to detect HER2 gene amplification in breast and gastric cancer: comparison with immunohistochemistry (IHC) and fluorescence in situ hybridization (FISH). Pathol Int. 2012;62:728-734.
117. Mansfield AS, Sukov WR, Eckel-Passow JE, et al. Comparison of fluorescence in situ hybridization (FISH) and dual-ISH (DISH) in the determination of HER2 status in breast cancer. Am J Clin Pathol. 2013;139:144-150.
118. Furrer D, Jacob S, Caron C, et al. Validation of a new classifier for the automated analysis of the human epidermal growth factor receptor 2 (HER2) gene amplification in breast cancer specimens. Diagn Pathol. 2013;8:17.
119. Stevens R, Almanaseer I, Gonzalez M, et al. Analysis of HER2 gene amplification using an automated fluorescence in situ hybridization signal enumeration system. J Mol Diagn. 2007;9:144-150.
120. Tubbs RR, Pettay JD, Swain E, et al. Automation of manual components and image quantification of direct dual label fluorescence in situ hybridization (FISH) for HER2 gene amplification: a feasibility study. Appl Immunohistochem Mol Morphol. 2006;14:436-440.
121. Penault-Llorca F, Bilous M, Dowsett M, et al. Emerging technologies for assessing HER2 amplification. Am J Clin Pathol. 2009;132:539-548.
122. Gong Y, Gilcrease M, Sneige N. Reliability of chromogenic in situ hybridization for detecting HER-2 gene status in breast cancer: comparison with fluorescence in situ hybridization and assessment of interobserver reproducibility. Mod Pathol. 2005;18:1015-1021.
123. Isola J, Tanner M, Forsyth A, et al. Interlaboratory comparison of HER-2 oncogene amplification as detected by chromogenic and fluorescence in situ hybridization. Clin Cancer Res. 2004;10:4793-4798.
124. Vocaturo A, Novelli F, Benevolo M, et al. Chromogenic in situ hybridization to detect HER-2/neu gene amplification in histological and ThinPrep-processed breast cancer fine-needle aspirates: a sensitive and practical method in the trastuzumab era. Oncologist. 2006;11:878-886.
125. Tanner M, Gancberg D, Di Leo A, et al. Chromogenic in situ hybridization: a practical alternative for fluorescence in situ hybridization to detect HER-2/neu oncogene amplification in archival breast cancer samples. Am J Pathol. 2000;157:1467-1472.
126. Garcia-Caballero T, Grabau D, Green AR, et al. Determination of HER2 amplification in primary breast cancer using dual-colour chromogenic in situ hybridization is comparable to fluorescence in situ hybridization: a European multicentre study involving 168 specimens. Histopathology. 2010;56:472-480.
127. Mollerup J, Henriksen U, Muller S, et al. Dual color chromogenic in situ hybridization for determination of HER2 status in breast cancer: a large comparative study to current state of the art fluorescence in situ hybridization. BMC Clin Pathol. 2012;12:3.
128. Hwang CC, Pintye M, Chang LC, et al. Dual-colour chromogenic in-situ hybridization is a potential alternative to fluorescence in-situ hybridization in HER2 testing. Histopathology. 2011;59:984-992.
129. Laakso M, Tanner M, Isola J. Dual-colour chromogenic in situ hybridization for testing of HER-2 oncogene amplification in archival breast tumours. J Pathol. 2006;210:3-9.
130. Kato M, Watabe K, Hamasaki T, et al. Association of low serum adiponectin levels with erosive esophagitis in men: an analysis of 2405 subjects undergoing physical check-ups. J Gastroenterol. 2011;46:1361-1367.
131. Loring P, Cummins R, O’Grady A, et al. HER2 positivity in breast carcinoma: a comparison of chromogenic in situ hybridization with fluorescence in situ hybridization in tissue microarrays, with targeted evaluation of intratumoral heterogeneity by in situ hybridization. Appl Immunohistochem Mol Morphol. 2005;13:194-200.
132. Lambros MB, Natrajan R, Reis-Filho JS. Chromogenic and fluorescent in situ hybridization in breast cancer. Hum Pathol. 2007;38:1105-1122.
133. Powell RD, Pettay JD, Powell WC, et al. Metallographic in situ hybridization. Hum Pathol. 2007;38:1145-1159.
134. Bartlett JM, Campbell FM, Ibrahim M, et al. Chromogenic in situ hybridization: a multicenter study comparing silver in situ hybridization with FISH. Am J Clin Pathol. 2009;132:514-520.
135. Francis GD, Jones MA, Beadle GF, et al. Bright-field in situ hybridization for HER2 gene amplification in breast cancer using tissue microarrays: correlation between chromogenic (CISH) and automated silver-enhanced (SISH) methods with patient outcome. Diagn Mol Pathol. 2009;18:88-95.
136. Fritzsche FR, Bode PK, Moch H, et al. Determination of the Her-2/neu gene amplification status in cytologic breast cancer specimens using automated silver-enhanced in-situ hybridization (SISH). Am J Surg Pathol. 2010;34:1180-1185.
137. Dietel M, Ellis IO, Hofler H, et al. Comparison of automated silver enhanced in situ hybridisation (SISH) and fluorescence ISH (FISH) for the validation of HER2 gene status in breast carcinoma according to the guidelines of the American Society of Clinical Oncology and the College of American Pathologists. Virchows Arch. 2007;451:19-25.
138. Shousha S, Peston D, Amo-Takyi B, et al. Evaluation of automated silver-enhanced in situ hybridization (SISH) for detection of HER2 gene amplification in breast carcinoma excision and core biopsy specimens. Histopathology. 2009;54:248-253.
139. Papouchado BG, Myles J, Lloyd RV, et al. Silver in situ hybridization (SISH) for determination of HER2 gene status in breast carcinoma: comparison with FISH and assessment of interobserver reproducibility. Am J Surg Pathol. 2010;34:767-776.
Dow
nloaded from https://academ
ic.oup.com/ajcp/article/144/5/686/1760671 by guest on 27 M
arch 2022

AJCP / Review Article
Am J Clin Pathol 2015;144:686-703 703 DOI: 10.1309/AJCPT41TCBUEVDQC
© American Society for Clinical Pathology
140. Dekker TJ, Borg ST, Hooijer GK, et al. Determining sensitivity and specificity of HER2 testing in breast cancer using a tissue micro-array approach. Breast Cancer Res. 2012;14:R93.
141. Park K, Han S, Kim JY, et al. Silver-enhanced in situ hybridization as an alternative to fluorescence in situ hybridization for assaying HER2 amplification in clinical breast cancer. J Breast Cancer. 2011;14:276-282.
142. Nitta H, Hauss-Wegrzyniak B, Lehrkamp M, et al. Development of automated brightfield double in situ hybridization (BDISH) application for HER2 gene and chromosome 17 centromere (CEN 17) for breast carcinomas and an assay performance comparison to manual dual color HER2 fluorescence in situ hybridization (FISH). Diagn Pathol. 2008;3:41.
143. Schiavon BN, Jasani B, de Brot L, et al. Evaluation of reliability of FISH versus brightfield dual-probe in situ hybridization (BDISH) for frontline assessment of HER2 status in breast cancer samples in a community setting: influence of poor tissue preservation. Am J Surg Pathol. 2012;36:1489-1496.
144. Hainfeld JF, Powell RD. New frontiers in gold labeling. J Histochem Cytochem. 2000;48:471-480.
145. Tubbs R, Pettay J, Skacel M, et al. Gold-facilitated in situ hybridization: a bright-field autometallographic alternative to fluorescence in situ hybridization for detection of Her-2/neu gene amplification. Am J Pathol. 2002;160:1589-1595.
146. Tubbs R, Skacel M, Pettay J, et al. Interobserver interpretative reproducibility of GOLDFISH, a first generation gold-facilitated autometallographic bright field in situ hybridization assay for HER-2/neu amplification in invasive mammary carcinoma. Am J Surg Pathol. 2002;26:908-913.
147. Tubbs R, Pettay J, Hicks D, et al. Novel bright field molecular morphology methods for detection of HER2 gene amplification. J Mol Histol. 2004;35:589-594.
148. Brugmann A, Lelkaitis G, Nielsen S, et al. Testing HER2 in breast cancer: a comparative study on BRISH, FISH, and IHC. Appl Immunohistochem Mol Morphol. 2011;19:203-211.
149. Bartlett JM, Campbell FM, Ibrahim M, et al. A UK NEQAS ISH multicenter ring study using the Ventana HER2 dual-color ISH assay. Am J Clin Pathol. 2011;135:157-162.
150. Downs-Kelly E, Pettay J, Hicks D, et al. Analytical validation and interobserver reproducibility of EnzMet GenePro: a second-generation bright-field metallography assay for concomitant detection of HER2 gene status and protein expression in invasive carcinoma of the breast. Am J Surg Pathol. 2005;29:1505-1511.
151. Ni R, Mulligan AM, Have C, et al. PGDS, a novel technique combining chromogenic in situ hybridization and immunohistochemistry for the assessment of ErbB2 (HER2/neu) status in breast cancer. Appl Immunohistochem Mol Morphol. 2007;15:316-324.
152. Reisenbichler ES, Horton D, Rasco M, et al. Evaluation of dual immunohistochemistry and chromogenic in situ hybridization for HER2 on a single section. Am J Clin Pathol. 2012;137:102-110.
153. Nitta H, Kelly BD, Padilla M, et al. A gene-protein assay for human epidermal growth factor receptor 2 (HER2): brightfield tricolor visualization of HER2 protein, the HER2 gene, and chromosome 17 centromere (CEN17) in formalin-fixed, paraffin-embedded breast cancer tissue sections. Diagn Pathol. 2012;7:60.
154. Bernet L, Martinez Benaclocha M, Castera C, et al. mRNA in situ hybridization (HistoSonda): a new diagnostic tool for HER2-status in breast cancer—a multicentric Spanish study. Diagn Mol Pathol. 2012;21:84-92.
155. Franchet C, Filleron T, Cayre A, et al. Instant-quality fluorescence in-situ hybridization as a new tool for HER2 testing in breast cancer: a comparative study. Histopathology. 2014;64:274-283.
156. Matthiesen SH, Hansen CM. Fast and non-toxic in situ hybridization without blocking of repetitive sequences. PLoS One. 2012;7:e40675.
157. Ohlschlegel C, Kradolfer D, Hell M, et al. Comparison of automated and manual FISH for evaluation of HER2 gene status on breast carcinoma core biopsies. BMC Clin Pathol. 2013;13:13.
158. Yoon N, Do IG, Cho EY. Analysis of HER2 status in breast carcinoma by fully automated HER2 fluorescence in situ hybridization (FISH): comparison of two immunohistochemical tests and manual FISH. APMIS. 2014;122:755-760.
159. Hofmann M, Stoss O, Gaiser T, et al. Central HER2 IHC and FISH analysis in a trastuzumab (Herceptin) phase II monotherapy study: assessment of test sensitivity and impact of chromosome 17 polysomy. J Clin Pathol. 2008;61:89-94.
160. Kim JW, Kim JH, Im SA, et al. HER2/CEP17 ratio and HER2 immunohistochemistry predict clinical outcome after first-line trastuzumab plus taxane chemotherapy in patients with HER2 fluorescence in situ hybridization-positive metastatic breast cancer. Cancer Chemother Pharmacol. 2013;72:109-115.
161. Bartlett JM, Starczynski J. Quantitative reverse transcriptase polymerase chain reaction and the Oncotype DX test for assessment of human epidermal growth factor receptor 2 status: time to reflect again? J Clin Oncol. 2011;29:4219-4221.
Dow
nloaded from https://academ
ic.oup.com/ajcp/article/144/5/686/1760671 by guest on 27 M
arch 2022