Loss of Dicer in Sertoli Cells Has a Major Impact on the Testicular Proteome of Mice
14
Loss of Dicer in Sertoli Cells Has a Major Impact on the Testicular Proteome of Mice □ S Marilena D. Papaioannou‡¶¶, Me ´ lanie Lagarrigue§¶¶, Charles E. Vejnar‡¶, Antoine D. Rolland, Franc ¸ oise Ku ¨ hne‡, Florence Aubry, Olivier Schaad**, Alexandre Fort‡, Patrick Descombes**, Marguerite Neerman-Arbez‡, Florian Guillou‡‡, Evgeny M. Zdobnov‡¶, Charles Pineau§, and Serge Nef‡§§ Sertoli cells (SCs) are the central, essential coordinators of spermatogenesis, without which germ cell development cannot occur. We previously showed that Dicer, an RNaseIII endonuclease required for microRNA (miRNA) biogenesis, is absolutely essential for Sertoli cells to mature, survive, and ultimately sustain germ cell development. Here, using isotope-coded protein labeling, a technique for protein rel- ative quantification by mass spectrometry, we investigated the impact of Sertoli cell-Dicer and subsequent miRNA loss on the testicular proteome. We found that, a large propor- tion of proteins (50 out of 130) are up-regulated by more that 1.3-fold in testes lacking Sertoli cell-Dicer, yet that this protein up-regulation is mild, never exceeding a 2-fold change, and is not preceeded by alterations of the corre- sponding mRNAs. Of note, the expression levels of six pro- teins of interest were further validated using the Absolute Quantification (AQUA) peptide technology. Furthermore, through 3UTR luciferase assays we identified one up-reg- ulated protein, SOD-1, a Cu/Zn superoxide dismutase whose overexpression has been linked to enhanced cell death through apoptosis, as a likely direct target of three Sertoli cell-expressed miRNAs, miR-125a-3p, miR-872 and miR-24. Altogether, our study, which is one of the few in vivo analyses of miRNA effects on protein output, suggests that, at least in our system, miRNAs play a significant role in translation control. Molecular & Cellular Proteomics 10: 10.1074/mcp.M900587-MCP200, 1–14, 2011. In all sexually reproducing organisms, germ cells (GCs) 1 , in contrast to somatic cells, are the only cells that can give rise to a new organism; GCs give rise to the gametes— egg in females and sperm in males. Spermatogenesis refers to the development of mature haploid sperm from diploid spermato- gonial cells within the testis of the male reproductive tract. It is typically divided in three strictly regulated phases, the mi- totic, the meiotic, and the phase of spermiogenesis, which culminates with spermiation, the release of spermatozoa in the testicular seminiferous tubule’s lumen. Spermatogenesis ensures continuous gamete production and occurs through- out adulthood in consecutive waves within the seminiferous tubules of the testis (reviewed in (1)). Apart from the GCs, which undergo spermatogenesis, the supporting cells of the testis called Sertoli cells (SCs), play a central role in the coordination of this process (for review see (2, 3)). SCs struc- turally and nutritionally support GCs and secrete factors that control, among other events, the survival and progression of GCs through the sequential steps of spermatogenesis (for example see (4 – 6)). Post-transcriptional control plays an essential role in the regulation of spermatogenesis. During GC development, tran- scription and translation are un-coupled: transcription occurs massively following meiosis, with postmeiotic transcripts ac- cumulating in large amounts, becoming deadenylated and stored in a repressed, dormant form in the spermatid cyto- plasm for 4 –5 days, whereas translation occurs at later stages (7). In addition to this “classic” mechanism, a novel system of post-transcriptional control mediated by microRNAs (miRNAs) is lately emerging with an important role during spermatogenesis ((8 –10), and reviewed in (11)). miRNAs are endogenous, single-stranded, noncoding RNAs of 22 nucle- otides that act as post-transcriptional regulators of gene ex- pression. They are generated through a multistep enzymatic process that involves the function of Dicer (Dcr), an RNaseIII endonuclease essential for the production of mature miRNAs (reviewed in (12)). miRNAs bind most frequently to the 3UTR (3 untranslated region) of target mRNAs, although recent studies show that some can also bind within the coding sequence (CDS) of mRNAs (reviewed in (13)), and depending on sequence complementarity, induce either mRNA degrada- tion or translational repression of their target (for review see (14)). Importantly though, it has been reported that in some From the ‡Department of Genetic Medicine and Development, University of Geneva Medical School and ¶Swiss Institute of Bioin- formatics and **Genomics Platform, National Center of Competence in Research “Frontiers in Genetics,” University of Geneva, 1211 Ge- neva 4, Switzerland; §Proteomics Core Facility Biogenouest, Inserm, U625, Campus de Beaulieu, Rennes, F-35042, France; Inserm, U625, Univ Rennes I, IFR-140, GERHM, Campus de Beaulieu, Rennes, F-35042, France; ‡‡Unite ´ PRC, UMR 6175 INRA-CNRS- Universite ´ de Tours-Haras Nationaux, 37380 Nouzilly, France Received November 30, 2009, and in revised form, April 27, 2010 Published, MCP Papers in Press, May 12, 2010, DOI 10.1074/mcp.M900587-MCP200 1 The abbreviations used are: GCs, germ cells; DCR, Dicer; ITMS, ion trap mass spectrometry; ICPL, isotope-coded protein labeling; miRNA, microRNA; SCs, Sertoli cells. Research © 2011 by The American Society for Biochemistry and Molecular Biology, Inc. This paper is available on line at http://www.mcponline.org Molecular & Cellular Proteomics 10.4 10.1074/mcp.M900587-MCP200 –1
-
Upload
independent -
Category
Documents
-
view
3 -
download
0
Transcript of Loss of Dicer in Sertoli Cells Has a Major Impact on the Testicular Proteome of Mice

Loss of Dicer in Sertoli Cells Has a MajorImpact on the Testicular Proteome of Mice□S
Marilena D. Papaioannou‡¶¶, Melanie Lagarrigue§¶¶, Charles E. Vejnar‡¶,Antoine D. Rolland�, Francoise Kuhne‡, Florence Aubry�, Olivier Schaad**,Alexandre Fort‡, Patrick Descombes**, Marguerite Neerman-Arbez‡, Florian Guillou‡‡,Evgeny M. Zdobnov‡¶, Charles Pineau§�, and Serge Nef‡§§
Sertoli cells (SCs) are the central, essential coordinators ofspermatogenesis, without which germ cell developmentcannot occur. We previously showed that Dicer, an RNaseIIIendonuclease required for microRNA (miRNA) biogenesis,is absolutely essential for Sertoli cells to mature, survive,and ultimately sustain germ cell development. Here, usingisotope-coded protein labeling, a technique for protein rel-ative quantification by mass spectrometry, we investigatedthe impact of Sertoli cell-Dicer and subsequent miRNA losson the testicular proteome. We found that, a large propor-tion of proteins (50 out of 130) are up-regulated by more that1.3-fold in testes lacking Sertoli cell-Dicer, yet that thisprotein up-regulation is mild, never exceeding a 2-foldchange, and is not preceeded by alterations of the corre-sponding mRNAs. Of note, the expression levels of six pro-teins of interest were further validated using the AbsoluteQuantification (AQUA) peptide technology. Furthermore,through 3�UTR luciferase assays we identified one up-reg-ulated protein, SOD-1, a Cu/Zn superoxide dismutasewhose overexpression has been linked to enhanced celldeath through apoptosis, as a likely direct target of threeSertoli cell-expressed miRNAs, miR-125a-3p, miR-872 andmiR-24. Altogether, our study, which is one of the few invivo analyses of miRNA effects on protein output, suggeststhat, at least in our system, miRNAs play a significant role intranslation control. Molecular & Cellular Proteomics 10:10.1074/mcp.M900587-MCP200, 1–14, 2011.
In all sexually reproducing organisms, germ cells (GCs)1, incontrast to somatic cells, are the only cells that can give rise
to a new organism; GCs give rise to the gametes—egg infemales and sperm in males. Spermatogenesis refers to thedevelopment of mature haploid sperm from diploid spermato-gonial cells within the testis of the male reproductive tract. Itis typically divided in three strictly regulated phases, the mi-totic, the meiotic, and the phase of spermiogenesis, whichculminates with spermiation, the release of spermatozoa inthe testicular seminiferous tubule’s lumen. Spermatogenesisensures continuous gamete production and occurs through-out adulthood in consecutive waves within the seminiferoustubules of the testis (reviewed in (1)). Apart from the GCs,which undergo spermatogenesis, the supporting cells of thetestis called Sertoli cells (SCs), play a central role in thecoordination of this process (for review see (2, 3)). SCs struc-turally and nutritionally support GCs and secrete factors thatcontrol, among other events, the survival and progression ofGCs through the sequential steps of spermatogenesis (forexample see (4–6)).
Post-transcriptional control plays an essential role in theregulation of spermatogenesis. During GC development, tran-scription and translation are un-coupled: transcription occursmassively following meiosis, with postmeiotic transcripts ac-cumulating in large amounts, becoming deadenylated andstored in a repressed, dormant form in the spermatid cyto-plasm for 4–5 days, whereas translation occurs at later stages(7). In addition to this “classic” mechanism, a novel systemof post-transcriptional control mediated by microRNAs(miRNAs) is lately emerging with an important role duringspermatogenesis ((8–10), and reviewed in (11)). miRNAs areendogenous, single-stranded, noncoding RNAs of �22 nucle-otides that act as post-transcriptional regulators of gene ex-pression. They are generated through a multistep enzymaticprocess that involves the function of Dicer (Dcr), an RNaseIIIendonuclease essential for the production of mature miRNAs(reviewed in (12)). miRNAs bind most frequently to the 3�UTR(3� untranslated region) of target mRNAs, although recentstudies show that some can also bind within the codingsequence (CDS) of mRNAs (reviewed in (13)), and dependingon sequence complementarity, induce either mRNA degrada-tion or translational repression of their target (for review see(14)). Importantly though, it has been reported that in some
From the ‡Department of Genetic Medicine and Development,University of Geneva Medical School and ¶Swiss Institute of Bioin-formatics and **Genomics Platform, National Center of Competencein Research “Frontiers in Genetics,” University of Geneva, 1211 Ge-neva 4, Switzerland; §Proteomics Core Facility Biogenouest, Inserm,U625, Campus de Beaulieu, Rennes, F-35042, France; �Inserm,U625, Univ Rennes I, IFR-140, GERHM, Campus de Beaulieu,Rennes, F-35042, France; ‡‡Unite PRC, UMR 6175 INRA-CNRS-Universite de Tours-Haras Nationaux, 37380 Nouzilly, France
Received November 30, 2009, and in revised form, April 27, 2010Published, MCP Papers in Press, May 12, 2010, DOI
10.1074/mcp.M900587-MCP2001 The abbreviations used are: GCs, germ cells; DCR, Dicer; ITMS,
ion trap mass spectrometry; ICPL, isotope-coded protein labeling;miRNA, microRNA; SCs, Sertoli cells.
Research© 2011 by The American Society for Biochemistry and Molecular Biology, Inc.This paper is available on line at http://www.mcponline.org
Molecular & Cellular Proteomics 10.4 10.1074/mcp.M900587-MCP200–1

cases, miRNAs can also promote gene expression (15, 16),thus broadening even more their range of effects.
Although miRNA effects at the mRNA level have been fre-quently evaluated (for example (17–19)), their impact on pro-tein output, which is thought to be the primary effect of animalmiRNAs, has been, technically, more difficult to assess. Onestudy used stable isotope labeling by amino acids in cellculture (SILAC) technology to investigate the effect of a singlemiRNA on protein output and reported that miR-1 can regu-late a substantial percentage of the HeLa proteome (20). Onlyrecently though two groups performed a large-scale proteinanalysis that unraveled the impact of miRNAs on proteinoutput; both concluded that, in addition to down-regulatingmRNA levels, a single miRNA can repress the production ofhundreds of proteins, but that this repression is relatively mild(21, 22).
We previously generated a mouse model in which Dcr -andmiRNAs- are eliminated uniquely in the SCs of the testis (10).We found that this ablation leads to complete infertility be-cause of severe spermatogenic defects and gradual testiculardegeneration; importantly, significant transcriptome (mRNA)down-regulation of genes such as Gdnf, KitL, Man2a2, andWt1, all with essential roles during spermatogenesis, wasdetected upon SC-Dcr loss (10). Here, in order to investigatethe impact of SC-Dcr loss at the proteome level, we per-formed ICPL (isotope-coded protein label) analysis (23), whichallowed us, by means of MS, to relatively quantify proteinswhose expression was altered between SC-Dcr-depleted(Dcrfx/fx;MisCre, hereafter referred to as mutant) and wild-type(Dcrfx/fx, hereafter referred to as control) testes. We found thatmore than a third of 130 quantified testicular proteins areup-regulated in mutant testes, yet at a relatively mild level,and that, importantly, this up-regulation does not reflect de-tectable changes in their respective mRNA levels. Of note,protein absolute quantification was achieved in independentexperiments using the AQUA (Absolute QUAntification) pep-tide strategy (24) on a selected set of proteins and thusvalidated the results obtained through ICPL analysis. In addi-tion, we identified Sod-1, a gene up-regulated at the proteinlevel, as a direct in vitro post-transcriptional target of threeSC-expressed miRNAs, miR-125a-3p, miR-872, and miR-24,we hypothesize that its up-regulation upon SC-Dcr andmiRNA loss could account, partially, for the observed testic-ular degeneration. Globally, our findings further reinforce thecurrent notion of animal miRNAs exerting one of their primarynegative effects at the translational level, but most impor-tantly, open new perspectives in studying the testicular pro-teome and its relation to the miRNA machinery.
EXPERIMENTAL PROCEDURES
Affymetrix Microarray Analysis—Microarray analysis is described in(10). All microarray data are available through ArrayExpress (http://www.ebi.ac.uk/arrayexpress/, accession number: E-TABM-426).
Protein Extraction and ICPL Labeling—Performing differential pro-teomics analysis using extremely small micro-dissected tissue sam-
ples is indeed a challenge. Considering in addition, the cost of knock-out animals, experiments were only performed once. Protein extractswere prepared from 20 pairs of control and 20 pairs of mutant P0(postnatal day 0) testes; for additional information on the generationof the Dcrfx/fx;MisCre mouse strain, refer to (10). Tissues were homog-enized by sonication on dry ice in a lysis buffer (6 M guanidine HCl, pH8.5, tissue/buffer: 1/1.5(w/v)) and were then placed for 1 h at 4 °Cbefore being centrifuged (15,000 � g, 30min, 4 °C). The resultingsupernatants were then ultracentrifuged (105,000 � g, 1 h, 4 °C).Protein concentration of the resulting supernatants was measuredwith a bicinchoninic acid assay (Sigma-Aldrich) and was adjusted to5 mg/ml by addition of lysis buffer. Disulfide bonds were reduced with0.2 M tris(2-carboxyethyl)phosphine and then alkylated with 0.4 mM
iodoacetamide. For each sample, 100 �g of proteins were labeledusing the ICPL-kit (Serva Electrophoresis, Heidelberg, Germany) ac-cording to the manufacturer’s instructions. Briefly, free amino groups(lysine residues and N-terminal NH2) of proteins from control andmutant extracts were labeled at room temperature for 2 h with thelight (12C- nicotinoyloxysuccinimide) and the heavy (13C- nicotinoyl-oxysuccinimide) ICPL reagents, respectively. Following quenchingexcess reagent with 6 M hydroxylamine, the two labeled samples weremixed, purified by acetone-precipitation (�20 °C, overnight), andsubsequently dissolved in 20 mM HEPES. Labeled proteins (50 �g)were separated by SDS-PAGE on a 12% precast gel (Gebagel, GeneBio-Applications, Interchim, Montlucon, France). The gel was subse-quently stained with Coomasie blue R-350 using the EZBlue gelstaining reagent (Sigma-Aldrich, Saint-Quentin Fallavier, France). Theentire gel lane was cut into 20 bands, which were washed withdifferent acetonitrile (ACN)/100 mM NH4HCO3 solutions. In-gel diges-tion was performed overnight at 37 °C with modified trypsin (Pro-mega, Charbonnieres-les-Bains, France). Proteolytic peptides werethen extracted from the gel by sequential incubation in the followingsolutions: ACN/H2O/TFA, 70:30:0.1 (v/v/v), 100% ACN and ACN/H2O/TFA, 70:30:0.1 (v/v/v), and extracts were eventually concen-trated by evaporation to a final volume of 30 �l.
Nano-LC-MS-MS Analysis—Proteolytic mixtures were separatedon a nano-high performance liquid chromatography system (Ultimate3000, Dionex, Jouy-en-Josas, France), with an injection volume of22 �l: first, they were concentrated on a C18-PepMap trappingreverse phase column (5 �m, 300 Å/300 �m i.d. � 5 mm, Dionex),and were then eluted with a 75-min, 2–90% ACN gradient in 0.05%formic acid, at a flow rate of 250 nL/min. The nano-LC apparatuswas coupled on-line with an Esquire HCT Ultra PTM Discoverymass spectrometer (Bruker Daltonik, GmbH, Bremen, Germany),equipped with a nanoflow electrospray ionization (ESI) source andan ion trap analyzer (ITMS). The mass spectrometer was operatedin the positive ionization mode. The EsquireControlTM software(Bruker Daltonik, GmbH) automatically alternated MS and MS-MSacquisitions and was tuned to preferentially subject ICPL labeledpeptides to MS-MS acquisitions.
Protein Identification and Relative Quantification—The DataAnaly-sis 3.4 software (Bruker Daltonik, GmbH) was used to create the peaklists from raw data. For each acquisition, a maximum of 500 com-pounds were detected with an intensity threshold of 250,000 and thecharge state of precursor ions was automatically determined by re-solved-isotope deconvolution. The Biotools 3.1 software (Bruker Dal-tonik, GmbH) was used to submit MS/MS data to the Swiss-Protdatabase (version 47, Mus musculus taxonomy, 568,851 sequenceentries) using the Mascot algorithm (Mascot server v2.2; http://www.matrixscience.com). Given that modification of lysine residues byICPL labeling prevents their cleavage by trypsin, arginine C wasselected as enzyme with one allowed missed cleavage. In addition,carbamidomethylation of cysteins was set as fixed modifications, andlabeling of lysine residues and of the N-terminal NH2 group of proteins
Effect of Sertoli-cell Dicer on Testicular Proteome
10.1074/mcp.M900587-MCP200–2 Molecular & Cellular Proteomics 10.4

by light or heavy ICPL reagents, as well as methionine oxidation wereconsidered as variable modifications. The mass tolerance for parentand fragment ions was set to 1.2 and 0.5 Da, respectively. Peptideidentifications were accepted if the individual ion scores were above25 (the ion score is �10*log(P), where P is the probability that theobserved match is a random event). Protein identifications were ac-cepted if the score indicated identity or extensive homology, i.e. theprobability that the identification is a random match was lower than5%. Matches corresponding to the heavy and the light labeled formsof the same peptide counted for one peptide. Single peptide-basedidentifications were accepted because missed cleavages of labeledlysine residues leads to a global reduction in the number of peptidesproduced in comparison to “classical” trypsin digestion and to theformation of relatively long peptides that can single-handedly repre-sent a sufficient percentage of protein sequence coverage.
MS/MS spectra were searched against a randomized sequence(decoy) database using Mascot to determine the false discovery ratedefined as the number of validated decoy hits/(number of validatedtarget hits � number of decoy hits)*100. Thus, a satisfactory falsediscovery rate of 1.15% was obtained for the totality of identificationsacquired during ICPL analysis.
Relative protein quantification was obtained using the WarpLC 1.1software (Bruker Daltonik, GmbH). This automatically calculates theheavy-to-light (H/L) ratios by comparing the relative intensities of theextracted ion chromatograms (EIC) that are reconstituted by extrac-tion of the intensities of m/z ratios corresponding to the labeledpeptides observed on MS spectra. For each EIC, the contribution of1�, 2�, and 3� charge states of the peptide was considered andsmoothing was applied (one smoothing cycle with Gauss algorithmand a smoothing width of 3 s). For each protein, the H/L ratio wascalculated by averaging the different H/L ratios obtained for each pairof labeled peptides.
In the present study, the amount of peptides obtained followingpeptide extraction from both sample pools was not enough to per-form technical replicates. Reproducibility and accuracy of ICPL ex-periments performed by ESI-ITMS were evaluated in five independenttechnical replicates using a standard mixture of ICPL labeled proteinscontaining bovine serum albumin with a heavy-to-light ratio of 1:1(ICPL-kit, Serva Electrophoresis). For bovine serum albumin, an av-erage H/L ratio of 0.94 was obtained, very close to the theoreticalvalue of 1, and corresponding to a variation coefficient of 8%.
AQUA Peptide Analysis—AQUA [13C6, 15N2] K-Lysine-labeled and[13C6, 15N4] R-Arginine-labeled peptides (listed in supplementalTable 1) were synthesized and quality- and quantity-controlled bySigma-Aldrich. All AQUA peptide standard solutions were preparedfrom stock solutions at 5 pmol/�l according to the manufacturer’sinstructions. All samples used for AQUA peptide experiments weresystematically prepared in low adsorption tubes (LoBind tubes, Ep-pendorf, Le Pecq, France) to minimize errors because of peptideadsorption (25). AQUA peptide standard solutions were prepared at0.1, 0.2, 0.5, 1, 2 and 5 fmol/�l and were analyzed by nano-liquidchromatography (LC)-ESI-ITMS with an injection volume of 10 �l inthree analytical replicates for calibration. For each AQUA peptide, thecorresponding EIC area was automatically determined by the Quan-tAnalysis 1.8 software (Bruker Daltonik, GmbH) and plotted againstthe injected amount to obtain the calibration curves. The linearity ofthe response was verified for all AQUA peptides with correlationcoefficients ranging from 0.988 to 0.996. In addition, the analyticalrepeatability of measurement of EIC areas corresponding to the dif-ferent AQUA peptides was evaluated: satisfactory coefficient of vari-ations (CV) ranging from 2% to 9% (n � 6) were obtained for an AQUApeptide concentration of 2 fmol/�l.
Protein extracts used for the ICPL experiment, that is, one sampleof 20 pairs of control and one sample of 20 pairs of mutant testes,
were also used for AQUA peptide analysis. Proteins from the controland mutant sample were precipitated with acetone overnight at�20 °C and dissolved in Laemmli buffer (Gene Bio-Application). Thetwo samples were then independently separated by SDS-PAGE on a12% precast gel (Gebagel). Following fixation, washing, and staining,both entire gel lanes were manually cut into 20 pieces. Disulfidebonds were then reduced with dithiotreitol and alkylated with iodo-acetamide. Protein in-gel digestion and proteolytic peptide extractionfrom each gel band was then performed. In order to precisely controlthe final volume of proteolytic peptides, extracts were completelydried by evaporation and dissolved with 20 �l of H2O/formic acid(95/5, v/v) solution, then with 20 �l of a H2O/ACN/formic acid (95/5/0.2, v/v/v) solution and vigorously sonicated and vortexed. AQUApeptide standards were added in precise amounts to the samples justbefore nano-LC-MS analysis. For all AQUA peptide analysis, theEsquireControl software was operated in the Multiple Reaction Mon-itoring mode to specifically subject the labeled (AQUA peptides) andunlabeled (peptides from the sample) peptides to MS/MS fragmen-tations. Then, for each fragmented peptide, an EIC was reconstitutedby extracting the signals corresponding to fragment ions specific tothe peptide of interest. Absolute quantification was obtained by com-paring the EIC areas of the unlabeled peptide and its correspondingAQUA peptide added in precise amount.
Real-Time Quantitative PCR—Total RNAs from six control and sixmutant P0 testes were extracted using the RNeasy Micro Kit (Qiagen,Basel, Switzerland) according to the manufacturer’s protocol. Foreach of the 12 individual samples, 1 �g of total RNA was reversetranscribed with the Superscript II Reverse Transcriptase (Invitrogen,Basel, Switzerland) according to the manufacturer’s instructions, and1/40 of the cDNA was used as template for Real-Time PCR amplifi-cation on a Freedom Evo 150 System (Tecan, Mannedorf, Switzer-land) using the Power SYBR Green PCR master mix (ABI, Foster City,CA). Raw threshold-cycle (Ct) values were obtained with the SDS 2.0software (ABI). Relative quantities (RQ) were calculated with the for-mula RQ � E–Ct, using efficiencies (E) calculated with the DART-PCRalgorithm, as described (26). Mean quantities were calculated fromtriplicate PCR reactions for each sample, and were normalized to twosimilarly measured quantities of Gapdh and Trf1R as described (27).Normalized quantities were averaged for three replicates for eachdata point and represented as the mean � S.D. The highest normal-ized relative quantity was arbitrarily designated as a value of 100.0.Fold changes were calculated from the quotient of means of thesenormalized quantities and reported as values � S.E. The statisticalsignificance of fold-changes was determined by an unpaired Stu-dent’s t test. Primers used are listed in supplemental Table 2.
Spermatogenic Cell Purification—Mature Sertoli and peritubularmyoid cells were prepared from 10 C57BL/6J males aged P16,whereas immature Sertoli cells were prepared from 16 C57BL/6Janimals aged P6, as previously described (28). Germ cells wereprepared using the STAPUT technique according to (29); spermato-gonia were prepared from 40 C57BL/6J males aged P6–8, whereaspachytene spermatocytes and spermatids were prepared from sixadult (P60) C57BL/6J mice. To verify cell purity, 5 � 105 cells werefixed in phosphate-buffered saline (PBS)/PAF 1% for 10� at roomtemperature, washed in PBS and then conserved overnight at 4 °C inPBS/FCS 1%. Cells were then marked with propidium iodide (100�g/ml) in PBS/0.2% saponin (30�, RT) and were sorted on a Fac-sCalibur machine (Beckton Dickinson, France), in order to quantifytheir contamination. Leydig cells were prepared from 16 adult (12-week-old) mice, as previously described (30); their purity was as-sessed by incubating cells with NAD (in Nitro Blue Tetrazolium,NBT, N-6876, Sigma-Aldrich) for 90’ and quantifying the percent-age of cells having acquired a violet color, indicative of the pres-ence of 3�-HSD.
Effect of Sertoli-cell Dicer on Testicular Proteome
Molecular & Cellular Proteomics 10.4 10.1074/mcp.M900587-MCP200–3

microRNA Expression Profiling with Illumina Arrays—Total RNAwas isolated with Trizol (Invitrogen, Basel, Switzerland) and qualitycontrolled for RNA integrity by capillary electrophoresis on an Agi-lent 2100 Bioanalyzer. miRNA profiling was performed according tothe manufacturer’s protocol using the Illumina MicroRNA Expres-sion Profiling Mouse Panel (Illumina, Hayward, CA), which contains656 assays for miRNAs described in miRBase v12. Briefly, for eachsample, 500 ng of total RNA was polyadenylated and converted intocDNA using an oligo dT-Reverse PCR primer. miRNA-specific oli-gos (extended with specific address sequences and Forward PCRprimer sequences) were then hybridized to cDNAs. Following ex-tension using DNA polymerase, products were PCR-amplified usingCy3-labeled forward and unlabeled reverse primers, then purifiedand eventually hybridized onto a Sentrix Array Matrix overnight. TheSentrix Array Matrix was washed and scanned on a BeadArraysreader. Data were normalized and analyzed using the IlluminaBeadstudio 3.1.3 (background correction and quantile normaliza-tion without scaling). Expression profiles for each sample wereimported into GeneSpringGX 7.3.1 (Agilent Technologies) and Mat-Lab (MathWorks, Inc) and further analyzed in order to identifydifferentially expressed miRNAs. MicroRNAs were considered asbeing expressed when the expression was above 1000 (arbitraryunits).
MicroRNA Target Recognition Analysis—Target sites were initiallyidentified by the presence of miRNA seeds (the minimum sequence ofnucleotides required for successful miRNA binding on its target, seesupplemental Fig. 1A), and their biological relevance was estimatedusing the following three models: The first model relies on the ther-modynamics of the miRNA-mRNA interactions. The energy balanceof these interactions (��G) was computed with a method similar tothat of (31): It includes the free energy gain resulting from the forma-tion of the miRNA-target duplex (�G duplex) and the free energyrequired for the unfolding of the target site and of at least 10 nucle-otides upstream and 15 downstream of the target site (�G open). Thesecond model relies on sequence features as described in (32). Thethird model relies on conservation of the seed sequences amongplacental species: the Phastcons scores of the seed sequence bases,provided by the UCSC genome browser (33), were summed (the sumallows to include the effect of the seed length). For seed identification,we used standard parameters, requiring seed length to be 6–8 basesfrom position 2 of the miRNA, and not allowing mismatches except fora single G:U wobble in 7-mers and two G:U wobbles in 8-mers. Ofnote, for each model, the first quartile of the ranked predictions wasconsidered as biologically significant in our target site enrichment
analysis. A schematic representation of the described strategy isshown in supplemental Fig. 1B.
In vitro Luciferase Assays—The 3�UTR of Sod-1 was PCR-ampli-fied from genomic DNA using the following oligos: F:5�-ATATG-GTCTAGAACATTCCCTGTGTGGTCTGAG-3�, R:5�-ATATGGCCG-GCCGTCACACAGTTACAA-3�, and was subcloned in a TOPOIIvector (Invitrogen, Basel, Switzerland). The insert was then digestedout and directionally inserted downstream of the Firefly luciferasecoding sequence in the XbaI and FseI sites of the pTal-Luc vector(Clontech, Sait-Germain-en-Laye, France). Mutated Sod-1 3�UTRconstructs were generated with the QuikChange II Site-Directed Mu-tagenesis kit (Stratagene, Agilent Technologies, Schweiz AG), as de-scribed in the manufacturer’s protocol, using oligos carrying a fullymutated seed sequence. The day before transfection, 104 HEK293Tcells/well were seeded in 96-well plates; transfection was performedwith (i) 100 ng of the pTal-Luc-Sod1–3�UTR (wild-type or mutant)Firefly plasmid, (ii) 5 ng of the transfection control pRL-SV40 Renillaluciferase plasmid (Promega AG, Dubendorf)) and (iii) 10 nM of thepre-miR-125a-3p (#PM12378), pre-miR-872 (#PM12800), or pre-miR-24 (#PM10737) (Ambion, Applied Biosystems Europe BV), usingLipofectamine 2000 (Invitrogen, Basel, Switzerland) according to themanufacturer’s instructions. The Firefly and Renilla luciferase activi-ties were measured 48 h post-transfection using the Dual LuciferaseAssay system (Promega AG, Dubendorf) as described in the manu-facturer’s protocol. All experiments were performed three times, witheach experimental condition being performed in four technical repli-cates. A schematic representation of the Luciferase assays’ strategyis shown in Fig. 6A.
RESULTS
SC-expressed miRNAs Affect Testicular Transcription—Wepreviously generated a mouse model in which Dicer (Dcr), andsubsequently miRNAs, are specifically eliminated in the Ser-toli cells (SCs) of the testis (Dcrfx/fx;MisCre), and found thatthis loss leads to complete infertility (10). We were able todetect already by postnatal day 5 (P5), a delay in SC matu-ration and an initial increase in SC proliferation followed byhighly elevated levels of SC and GC apoptosis, events thatultimately led to a dramatic testicular degeneration duringadulthood (Fig. 1A). Importantly, although at birth (P0) nomorphological (histological) defects were detected (Fig. 1A),
FIG. 1. Morphological abnormalities appear by postnatal (P) day 5, yet mRNA transcripts are affected upon SC-Dcr loss already byP0. A, Hematoxylin and eosin-stained paraffin sections from P0 (a, d), P5 (b, e) and P60 (c, f) testis sections of control (Dcrfx/fx) (a, b, c) andmutant (Dcrfx/fx;MisCre) (d, e, f) mice; note the dramatic spermatogenic defects (arrowhead points to a tube containing only SCs) observed inadult P60 mutant testes. Scale bar: 50 �m. B, Scatterplot depicting genes showing at P0 differential expression between control and mutantwhole testes. Each dot (black or red) represents a gene; genes represented as red dots are those which are either up-regulated (77 genes) ordown-regulated (68 genes) 2-fold in mutant testes. Diagonal black bars represent a 2-fold threshold.
Effect of Sertoli-cell Dicer on Testicular Proteome
10.1074/mcp.M900587-MCP200–4 Molecular & Cellular Proteomics 10.4

we measured several alterations of the testicular transcrip-tome. More precisely, we found 77 and 68 genes to be � 2 -fold up- and down-regulated respectively in P0 testes lackingDcr in SCs (Fig. 1B). Deregulated genes included amongothers Gdnf, Kitl, Serpin5a, Sox9, Wt1, and Cldn11, all ofwhich have key roles during spermatogenesis. However, thein vivo effect of SC-miRNA depletion on protein output wasnot addressed.
Sertoli-cell Loss of Dicer Causes Significant Proteome Al-terations—Here, to assess the impact of SC-miRNA loss onthe testicular proteome, we performed relative quantificationof proteins on P0 whole testis protein extracts of control andmutant mice using ICPL: Proteins extracted from P0 controland mutant testes were labeled with the light (L) and heavy (H)ICPL reagent respectively, mixed, prefractionated by gel elec-trophoresis, excised, and trypsin digested. The obtained pep-tide mixtures were analyzed by nano-ESI-ITMS for proteinidentification and relative quantification (Fig. 2A).
By querying the Swiss-Prot database with the Mascot al-gorithm, we obtained 240 protein identifications showing ascore superior to the identity or the extensive homologythreshold. These 240 identifications actually corresponded to168 proteins, each associated with a nonredundant Entrez-Gene (EG) identifier. Out of these 168 nonredundant proteins,a mutant/control (H/L) protein ratio was calculated for 130 ofthem (all 130 proteins are listed in supplementary Table 3, andall peptide sequences for the identified proteins are listed insupplementary Table 4); for the remaining 38, this was notpossible because of the absence of detected labeled peptidesfrom either the control or the mutant sample. The minimumvariation of H/L ratios associated to significant variation ofprotein expression was determined similarly to (34). The av-erage of the CV (coefficient of variation) obtained for H/Lratios of all proteins for which at least two peptides werequantified was 11.1%. We thus considered that a variation of30% (2 CV) was significant. This significant variation of 30%largely overcomes technical variability in our experiments thatwas demonstrated to be 8%. Of these 130 quantified pro-teins, 50 were up-regulated (H/L ratio �1.3), whereas only 3were down-regulated (H/L �0.7) in mutant testes (Table I).The remaining 77 showed no significant difference in abun-dance between control and mutant testes (0.7H/L1.3).More precisely, of the 50 up-regulated proteins, 23 showed amild (1.3–1.5-fold change) up-regulation, and the remaining27 displayed an H/L ratio between 1.5- and 2- (Fig. 2B andTable I). These findings are in agreement with two recentstudies that reported a relatively mild repression of hundredsof proteins upon miRNA overexpression (21, 22).
Independent Validation of Testicular Protein Levels byAQUA Peptide Analysis—To confirm the differential expres-sion levels we detected through ICPL analysis, we selectedsix proteins, namely four up-regulated (Vimentin, Atp5d,Anxa2, and Sod1) in mutant testes and two unaffected (Prdx1and Gstm1), for further validation by means of AQUA peptide
A P0 Dcr(fx/fx) P0 Dcr(fx/fx);MisCre
Testis dissection
Protein extraction
ICPL labeling
Light ICPL
Heavy ICPL
Mix
SDS-PAGE
Trypsin digestion
Nano-LC ESI-ITMS
H
L
B
H/L ratio
num
ber o
f uni
que
prot
eins
0.3-0.
4
0.4-0.
5
0.5-0.
6
0.6-0.
7
0.7-0.
8
0.8-0.
90.9
-11-1
.1
1.1-1.
2
1.2-1.
3
1.3-1.
4
1.4-1.
5
1.5-1.
6
1.6-1.
7
1.7-1.
8
1.8-1.
91.9
-20
25
50
FIG. 2. SC-loss of Dcr causes significant proteome alterationsat birth. A, Schematic representation of the experimental designemployed for relative quantification of proteins using ICPL. B, Shownhere are proteins up-regulated (black bars), unaffected (gray bars) ordown-regulated (white bars) upon SC-Dcr loss. H/L (mutant/control)ratios between 0.7 and 1.3 are indicative of no difference betweencontrol and mutant testes.
Effect of Sertoli-cell Dicer on Testicular Proteome
Molecular & Cellular Proteomics 10.4 10.1074/mcp.M900587-MCP200–5

TABLE IList of proteins whose mutant/control (H/L) ratio, as revealed by ICPL analysis, is 1.3 (50 proteins, Sfrs-Stip1) or 0.7 (3 proteins, Hbb-b1,
Fasn, Hbb-b2). Also shown are two unaffected (0.7H/L1.3) proteins (Gstm1, Prdx1) that were used for AQUA validation analysis
Protein Name Gene Name H/L (ICPL)a H/L (AQUA)b mRNA (Affy)c mRNA (qPCR)d
Splicing factor, arginine/serine-rich 1 Sfrs 1.97 �1.08Heat shock protein HSP 90-alpha Hsp90aa1 1.86 1.12 0.75Heat shock 70 kDa protein 1L Hspa1l 1.84 �1.17Heat shock protein HSP 90-beta Hsp90ab1 1.82 1.0240S ribosomal protein S11 Rps11 1.8 1.04Tubulin �-1B chain Tuba1b 1.79 1.08Annexin A2 Anxa2 1.78 1.87 1 nsADP/ATP translocase 1 Slc25a4 1.77 1.13Poly(rC)-binding protein 1 Pcbp1 1.77 1.01Profilin-2 Pfn2 1.76 1.09Endoplasmin Hsp90b1 1.74 1.05Apolipoprotein A-I Apoa1 1.72 �1.22Vimentin Vim 1.69 1.93 1.03 0.75Superoxide dismutase �Cu-Zn� Sod1 1.68 1.44 �1.04 nsElongation factor 2 Eef2 1.66 1.06Rho GDP-dissociation inhibitor 1 Arhgdia 1.62 1.09Lamin-B1 Lmnb1 1.61 1.09Actin, cytoplasmic 2 Actg1 1.6 1.1Serum albumin Alb 1.6 �1.21Heat shock 70 kDa protein 1B Hspa1b 1.58 –60S ribosomal protein L14 Rpl14 1.57 �1.15 0.7540S ribosomal protein S14 Rps14 1.56 1.05Histone H4 Histh4 1.56 –Protein disulfide-isomerase P4hb 1.56 1.08ADP/ATP translocase 2 Slc25a5 1.55 �0.99Splicing factor, proline- and glutamine-rich Sfpq 1.53 1.03 nsATP synthase subunit delta, mitochondrial Atp5d 1.52 1.78 1.02 nsIg �chain C region Igk-C 1.48 –Tubulin �-5 chain Tubb5 1.47 1.11Actin, �-enteric smooth muscle Actg2 1.46 1.1360S ribosomal protein L10 Rpl10 1.45 1.0460S ribosomal protein L28 Rpl28 1.45 1.02Elongation factor 1-�1 Eef1a1 1.42 1.07Phosphoglycerate mutase 1 Pgam1 1.42 1.01Peptidyl-prolyl cis-trans isomerase A Ppia 1.41 1.08Nucleophosmin Npm1 1.4 1.06Calmodulin Calm3;Calm1;Calm2 1.38 �1.04;1.07;1.03Heat shock cognate 71 kDa protein Hspa8 1.37 �1.0140S ribosomal protein S20 Rps20 1.35 1.0160 kDa heat shock protein, mitochondrial Hspd1 1.35 1.1260S ribosomal protein L18 Rpl18 1.35 1.09ATP-citrate synthase Acly 1.35 1.1740S ribosomal protein S3 Rps3 1.34 1.04ATP synthase subunit �, mitochondrial Atp5b 1.34 1.0160S ribosomal protein L13 Rpl13 1.33 1.0240S ribosomal protein S8 Rps8 1.32 1.01ATP synthase subunit �, mitochondrial Atp5a1 1.32 1.06Heterogeneous nuclear ribonucleoprotein A3 Hnrnpa3 1.32 1.11Histone H1.2 Hist1h1c 1.3 1Stress-induced-phosphoprotein 1 Stip1 1.3 �0.99Hemoglobin subunit �-1 Hbb-b1 0.36 1.06Fatty acid synthase Fasn 0.37 �1.18Hemoglobin subunit �-2 Hbb-b2 0.38 1.06Glutathione S-transferase Mu 1 Gstm1 0.85 0.86 �1.38 0.5Peroxiredoxin-1 Prdx1 1.18 1.3 0.99
a Marked here is the H/L protein ratio, as measured through the ICPL analysis.b Marked here is the H/L ratio of six selected proteins, as measured through AQUA peptide analysis.c Shown in this column are the mutant/control mRNA ratios revealed by our Affymetrix (Affy) analysis (Ref (10)). Note that no statistically
significant difference in abundance of mRNAs is observed between mutants and controls. The mark (–) indicates that the mentioned proteincorresponds to multiple EG identifiers and thus, we were not able to sort out the correct corresponding Affymetrix probeset value.
d Marked here is the mutant/control mRNA ratio as measured through quantitative Real-Time PCR (also see Fig. 4). ‘ns’ indicates nosignificant difference.
Effect of Sertoli-cell Dicer on Testicular Proteome
10.1074/mcp.M900587-MCP200–6 Molecular & Cellular Proteomics 10.4

analysis, an MS-based technique for the absolute quantifica-tion of proteins. AQUA peptides are chemically synthesizedisotope-labeled peptides whose sequences correspond toproteolytic peptides of the proteins to be quantified. Theywere spiked into the sample in known quantities before LC-MS/MS analysis. Absolute quantification was achieved bycomparing the signals corresponding to AQUA and proteo-lytic peptides (an example for SOD-1 is shown in Fig. 3).Absolute quantities determined in mutant and control sam-ples were used to calculate mutant-to-control ratios, whichwe found to be close to those obtained with relative quanti-fication by ICPL for all six proteins, a result that validated ourICPL results. Note that all AQUA values are indicated in Table I.
Protein Up-regulation Upon Sertoli-cell Loss of Dcr is notAccompanied by mRNA Alterations—Next, we went on toassess whether the changes we measured in protein outputwere the result of changes in mRNA expression levels. Forty-seven out of 50 up-regulated proteins showed no difference intheir mRNA expression levels between controls and mutants,as evidenced by their expression levels measured on theAffymetrix microarray (for the remaining three proteins, wewere not able to sort out the corresponding Affymetrix probe-
set value, because they match to multiple EG identifiers)(Table I), thus suggesting that they represent genes whoseexpression is controlled at the translational level. In fact, wefurther selected seven up-regulated proteins (among themwere those that had been validated by AQUA peptide analy-sis) and performed RealTime qPCR for their respective geneson P0 control and mutant whole testes: these genes showedeither no difference (Anxa2, Sod1, Sfpq, and Atp5d), or, in-terestingly, a �25% reduction in their mRNA levels (Vimentin,Rpl14, and Hsp90aa1), whereas their respective proteins were1.3 times more abundant in mutant testes (Fig. 4A). We alsoselected three unaffected proteins (Gstm1, Cyp11a1, andPrdx1) to evaluate their mRNA levels, and found that themRNA expression levels of Cyp11a1 and Prdx1 remainedunaffected, whereas that of Gstm1 showed a �50% reductionin mutant testes (Fig. 4B). Taken together, these findingsdemonstrate that loss of Dcr and miRNAs in SCs has asignificant impact on testicular proteins, without however af-fecting the amounts of the corresponding mRNAs.
Several microRNAs are Expressed in Immature SCs—Thefact that the protein up-regulation we measured is not accom-panied by an mRNA up-regulation in mutant testes strongly
FIG. 3. AQUA peptide analysis vali-dated the ICPL results: shown here isthe example of SOD-1. Extracted ionchromatograms (EICs) were reconsti-tuted by extracting the signals of y3, y8,y9, y11, and y112� sequence ions of theVISLSGEHSIIGR unlabeled peptide andthe VISLSGEHSIIGR* AQUA peptideused for the quantification of SOD1 bymultiple reaction monitoring in mutant(A) and control (B) testes and their cor-responding MS/MS spectra (C). TheEICs obtained for AQUA peptides usedas internal standards in (A) and (B) cor-respond to an injected amount of 30fmol.
Effect of Sertoli-cell Dicer on Testicular Proteome
Molecular & Cellular Proteomics 10.4 10.1074/mcp.M900587-MCP200–7

suggested that their respective genes are most likely to rep-resent direct SC-miRNA targets regulated at the translational,and not the transcriptional level. To further investigate thishypothesis, we first set out to characterize the miRNA expres-sion profile of SCs using a miRNA microarray. For this pur-pose, we analyzed the expression of 656 murine miRNAs inpurified populations of testicular cells, namely immature P6and mature P17 SCs, in adult Leydig cells, in different types of
germ cells (spermatogonia A, spermatogonia B, and interme-diate, pachytene spermatocytes and spermatids), as well as inimmature P6 whole testes, using the Illumina microRNA Expres-sion Profiling System. We identified a set of 382 miRNAs ex-pressed in SCs (supplemental Table 5). Of these, we found that50 are expressed more than two times more abundantly inimmature P6 SCs in comparison to P6 whole testes (shown intwo graphs in Fig. 5A), a finding that could suggest a potential
FIG. 4. Real-Time qPCR revealed that protein up-regulation upon SC-Dcr loss is not accompanied by alterations at the mRNA level.A, Shown here are four genes (Anxa2, Sod1, Sfpq, and Atp5d) whose mRNA levels are not significantly different between controls and mutants(qPCR and Affy), but whose respective proteins are up-regulated in mutant testes (H/L1.3), and three genes (Vimentin, Rpl14, Hsp90aa1)whose mRNA levels show a �25% reduction (qPCR), but whose respective proteins are up-regulated in mutant testes (H/L1.3). B, Gstm1,Cyp11a1 and Prdx1 protein levels were unaffected and so were their transcript levels, except for Gstm1, which showed a 50% reduction inmutant testes. For each gene, the mutant/control (H/L) protein ratio revealed by ICPL analysis, as well as their mutant/control mRNA (transcript)ratio revealed either through microarray (Affy) or qPCR is given beneath the graph. Results are mean � S.E. (n � 6 animals/group), *p 0.05,**p 0.01, ***p 0.001 versus controls; ns: not significant. Primers used are listed on supplemental Table S2. �/� and �/� are abbreviationsfor control Dcrfx/fx, and mutant Dcrfx/fx;MisCre animals respectively. REL: relative expression levels.
Effect of Sertoli-cell Dicer on Testicular Proteome
10.1074/mcp.M900587-MCP200–8 Molecular & Cellular Proteomics 10.4

biological role for these miRNAs in SCs, without however ne-glecting the potential role of other SC-expressed miRNAs.
The 3�UTRs of Genes Up-regulated Upon SC-Dcr Loss atthe Protein Level are Enriched for SC-miRNA Target Sites—Having in hand these SC-expressed miRNAs, and given thatmiRNAs most frequently bind on regions of an mRNA’s3�UTR, we went on to assess whether the 3�UTRs of tran-scripts coding for up-regulated proteins are actually enrichedfor SC-miRNA target sites. First, we considered as a criterionfor successful miRNA binding only the presence of a seed (theminimum sequence of nucleotides required for successfulmiRNA binding on its target) in the transcripts’ 3�UTR(supplemental Fig. 1), but found that none of the seed se-quences were significantly enriched in genes coding for up-regulated proteins in mutant testes, when compared with theunaffected proteins (One-sided Fisher test p value � 0.40,Table II). However, when we further refined our query to targetsites bearing a conserved-in-placental-species seed se-quence, we found that genes coding for up-regulated proteinsin mutant testes were slightly, yet significantly, enriched inSC-miRNA target sites (One-sided Fisher test p value �
0.0128, Table II). Interestingly, nonsignificant enrichmentswere observed when considering either energetically favor-able miRNA-mRNA duplexes (�G duplex, One-sided Fishertest p value � 0.0721, Table II) or a favorable target sitesequence context (One-sided Fisher test p value � 0.71,Table II). Altogether, although the low statistical significanceof the enrichment is acknowledged, these findings tendto suggest that genes coding for up-regulated proteinsupon SC-Dcr loss are likely to represent direct SC-miRNAtargets.
SOD-1, a Protein Up-regulated Upon SC-Dcr Loss, is aDirect Target of Three SC-expressed miRNAs—Next, we se-lected Sod-1, one of the genes we found to be up-regulatedat the protein level, in order to evaluate its direct post-tran-scriptional targeting by SC-miRNAs. Sod-1 was selected be-cause of its potential biological interest: SOD-1 is a Cu-Zn
FIG. 5. miRNAs expressed in SCs. A, Shown here in two graphs arethe expression profiles of the 50 SC-enriched miRNAs, in descendingorder of expression in P6 SCs. The entire list of 382 miRNAs expressedin SCs, along with their sequences is provided in supplemental Table 5.B, Shown here are the expression profiles of 7 SC-expressed miRNAspredicted to have a putative binding site in the 3�UTR of Sod-1. Resultsare represented as mean values of three biological replicates �s.d.miRNA nomenclature is based on the Sanger miRBase, v12.
TABLE IISC-miRNA target site enrichment among genes coding for proteinsderegulated upon SC-Dcr loss. Shown here are the % of up-regulatedproteins (up) versus those unaffected (equal) upon SC-Dcr loss thatwere enriched in SC-miRNA target sites, when considering either onlythe presence of a seed sequence (seeds), an energetically favorablemiRNA-mRNA duplex (�G duplex), a favorable target site sequencecontext (Targetscan) or the conservation of the seed sequence (con-servation). The numbers in parenthesis indicate the number of genes
taken into consideration in each fraction
Fractions
Proteome fractions withan H/L threshold of 1.3
Up (59) Equal (96)
%targeted
Enrichment(p value)
%targeted
Seeds 93.2 0.40 90.6�G duplex 77.8 0.072 65.2Targetscan 74.6 0.71 77.1Conservation 78 0.013 59.4
Effect of Sertoli-cell Dicer on Testicular Proteome
Molecular & Cellular Proteomics 10.4 10.1074/mcp.M900587-MCP200–9

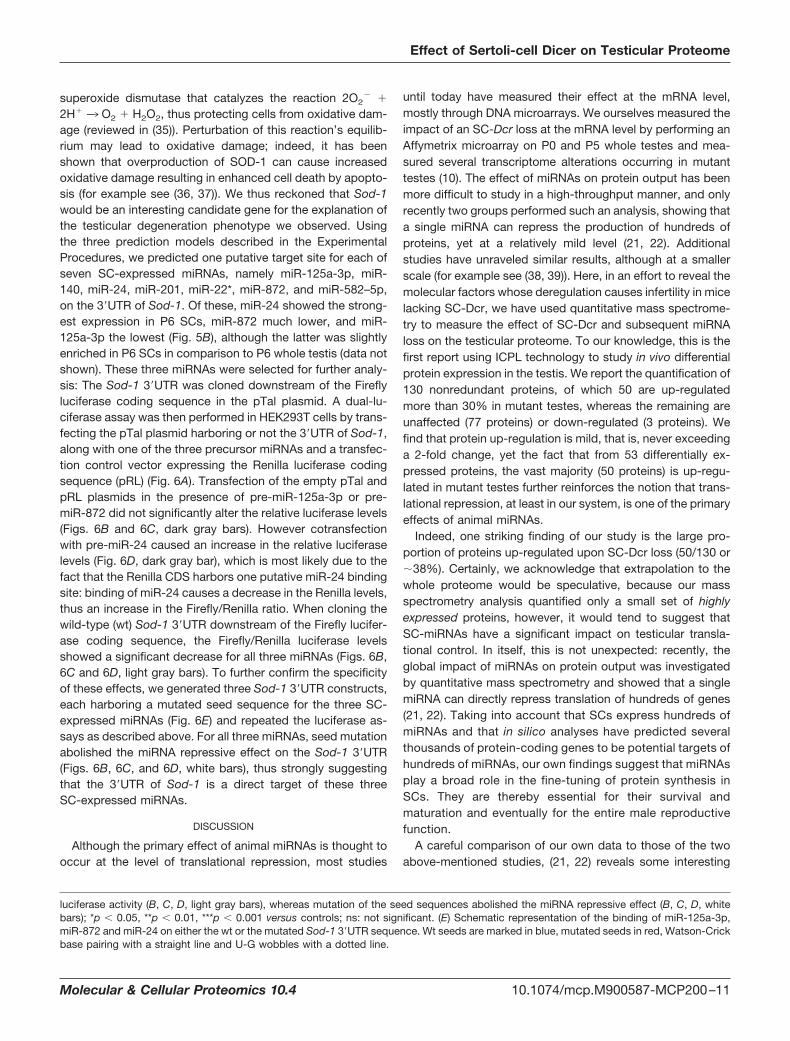
FIG. 6. Testing the binding of the Sod-1 3�UTR by SC-expressed miRNAs. A, The Sod-1 3�UTR was PCR-amplified (1) and cloned justdownstream of the Firefly luciferase CDS in the pTal plasmid. The pTal-Sod1–3�UTR plasmid was cotransfected with a pRL transfection controlvector expressing the Renilla luciferase CDS and 10 nM of a miRNA precursor in HEK293T cells (2) and the relative luciferase activity wasmeasured (3). Cotransfection of pTal (Firefly) and pRL (Renilla) (black bars) yielded a certain Firefly/Renilla luciferase level; addition of eitherpre-miR-125a-3p or pre-miR-872 did not alter the relative luciferase levels (B, C, dark gray bars), however that of pre-miR-24 did (see text) (D,dark gray bar); cloning the wt Sod-1 3�UTR in pTal in the presence of either one of three miRNAs caused a significant reduction in the relative
Effect of Sertoli-cell Dicer on Testicular Proteome
10.1074/mcp.M900587-MCP200–10 Molecular & Cellular Proteomics 10.4
superoxide dismutase that catalyzes the reaction 2O2� �
2H�3 O2 � H2O2, thus protecting cells from oxidative dam-age (reviewed in (35)). Perturbation of this reaction’s equilib-rium may lead to oxidative damage; indeed, it has beenshown that overproduction of SOD-1 can cause increasedoxidative damage resulting in enhanced cell death by apopto-sis (for example see (36, 37)). We thus reckoned that Sod-1would be an interesting candidate gene for the explanation ofthe testicular degeneration phenotype we observed. Usingthe three prediction models described in the ExperimentalProcedures, we predicted one putative target site for each ofseven SC-expressed miRNAs, namely miR-125a-3p, miR-140, miR-24, miR-201, miR-22*, miR-872, and miR-582–5p,on the 3�UTR of Sod-1. Of these, miR-24 showed the strong-est expression in P6 SCs, miR-872 much lower, and miR-125a-3p the lowest (Fig. 5B), although the latter was slightlyenriched in P6 SCs in comparison to P6 whole testis (data notshown). These three miRNAs were selected for further analy-sis: The Sod-1 3�UTR was cloned downstream of the Fireflyluciferase coding sequence in the pTal plasmid. A dual-lu-ciferase assay was then performed in HEK293T cells by trans-fecting the pTal plasmid harboring or not the 3�UTR of Sod-1,along with one of the three precursor miRNAs and a transfec-tion control vector expressing the Renilla luciferase codingsequence (pRL) (Fig. 6A). Transfection of the empty pTal andpRL plasmids in the presence of pre-miR-125a-3p or pre-miR-872 did not significantly alter the relative luciferase levels(Figs. 6B and 6C, dark gray bars). However cotransfectionwith pre-miR-24 caused an increase in the relative luciferaselevels (Fig. 6D, dark gray bar), which is most likely due to thefact that the Renilla CDS harbors one putative miR-24 bindingsite: binding of miR-24 causes a decrease in the Renilla levels,thus an increase in the Firefly/Renilla ratio. When cloning thewild-type (wt) Sod-1 3�UTR downstream of the Firefly lucifer-ase coding sequence, the Firefly/Renilla luciferase levelsshowed a significant decrease for all three miRNAs (Figs. 6B,6C and 6D, light gray bars). To further confirm the specificityof these effects, we generated three Sod-1 3�UTR constructs,each harboring a mutated seed sequence for the three SC-expressed miRNAs (Fig. 6E) and repeated the luciferase as-says as described above. For all three miRNAs, seed mutationabolished the miRNA repressive effect on the Sod-1 3�UTR(Figs. 6B, 6C, and 6D, white bars), thus strongly suggestingthat the 3�UTR of Sod-1 is a direct target of these threeSC-expressed miRNAs.
DISCUSSION
Although the primary effect of animal miRNAs is thought tooccur at the level of translational repression, most studies
until today have measured their effect at the mRNA level,mostly through DNA microarrays. We ourselves measured theimpact of an SC-Dcr loss at the mRNA level by performing anAffymetrix microarray on P0 and P5 whole testes and mea-sured several transcriptome alterations occurring in mutanttestes (10). The effect of miRNAs on protein output has beenmore difficult to study in a high-throughput manner, and onlyrecently two groups performed such an analysis, showing thata single miRNA can repress the production of hundreds ofproteins, yet at a relatively mild level (21, 22). Additionalstudies have unraveled similar results, although at a smallerscale (for example see (38, 39)). Here, in an effort to reveal themolecular factors whose deregulation causes infertility in micelacking SC-Dcr, we have used quantitative mass spectrome-try to measure the effect of SC-Dcr and subsequent miRNAloss on the testicular proteome. To our knowledge, this is thefirst report using ICPL technology to study in vivo differentialprotein expression in the testis. We report the quantification of130 nonredundant proteins, of which 50 are up-regulatedmore than 30% in mutant testes, whereas the remaining areunaffected (77 proteins) or down-regulated (3 proteins). Wefind that protein up-regulation is mild, that is, never exceedinga 2-fold change, yet the fact that from 53 differentially ex-pressed proteins, the vast majority (50 proteins) is up-regu-lated in mutant testes further reinforces the notion that trans-lational repression, at least in our system, is one of the primaryeffects of animal miRNAs.
Indeed, one striking finding of our study is the large pro-portion of proteins up-regulated upon SC-Dcr loss (50/130 or�38%). Certainly, we acknowledge that extrapolation to thewhole proteome would be speculative, because our massspectrometry analysis quantified only a small set of highlyexpressed proteins, however, it would tend to suggest thatSC-miRNAs have a significant impact on testicular transla-tional control. In itself, this is not unexpected: recently, theglobal impact of miRNAs on protein output was investigatedby quantitative mass spectrometry and showed that a singlemiRNA can directly repress translation of hundreds of genes(21, 22). Taking into account that SCs express hundreds ofmiRNAs and that in silico analyses have predicted severalthousands of protein-coding genes to be potential targets ofhundreds of miRNAs, our own findings suggest that miRNAsplay a broad role in the fine-tuning of protein synthesis inSCs. They are thereby essential for their survival andmaturation and eventually for the entire male reproductivefunction.
A careful comparison of our own data to those of the twoabove-mentioned studies, (21, 22) reveals some interesting
luciferase activity (B, C, D, light gray bars), whereas mutation of the seed sequences abolished the miRNA repressive effect (B, C, D, whitebars); *p 0.05, **p 0.01, ***p 0.001 versus controls; ns: not significant. (E) Schematic representation of the binding of miR-125a-3p,miR-872 and miR-24 on either the wt or the mutated Sod-1 3�UTR sequence. Wt seeds are marked in blue, mutated seeds in red, Watson-Crickbase pairing with a straight line and U-G wobbles with a dotted line.
Effect of Sertoli-cell Dicer on Testicular Proteome
Molecular & Cellular Proteomics 10.4 10.1074/mcp.M900587-MCP200–11

points worth of discussion. First, the Selbach and Baek pa-pers conclude that only targets translationally repressed bymore than a third also display detectable mRNA alterations,whereas those modestly repressed show little or no change atthe mRNA level. The protein up-regulation we measure in oursystem, which falls within a 1.3–2-fold range, is actually notaccompanied at all by alterations at the mRNA level. Thisfinding could be interpreted as a more significant miRNA-mediated translational control in SCs than in other systems,although, again, extrapolation to the whole proteome must bedone with caution. We should also mention here that, incomparison to our study, the fact that the Selbach and Baekpapers report the identification of �3000 proteins, is likelybecause of the following reasons: (a) They used stable isotopelabeling with amino acids in cell culture (SILAC) a techniquenot applicable to tissues, in which trypsin cleavage occursfollowing both lysine and arginine residues, thus generatingnumerous peptides and increasing the chances of proteinidentification and quantification; in our study, ICPL labelingprevents trypsin cleavage following lysine residues, allowingcleavage to occur only next to arginine residues, therefore thenumber of generated peptides is significantly smaller; (b) Themass spectrometer used in the Selbach and Baek papers wasan LTQ-Orbitrap instrument, which is of higher performanceand resolution than the one we used.
It would be worth noting at this point that, for purely tech-nical reasons, our starting material for the mass spectrometryanalysis was whole testis protein extracts, whereas depletionof miRNAs was performed uniquely in SCs. Thus, the pres-ence of a heterogeneous population of cells in P0 testesprobably masks the true impact on the protein output of SCsbecause of the dilution by proteins originating from other cellpopulations. The use of purified SCs would certainly furtherrefine our results and thereby unravel novel, or additional,molecular targets that could explain the observed testiculardegeneration and eventual infertility caused by the loss ofSC-Dcr and miRNAs. In fact, as a first step toward this direc-tion, we used purified wild-type SCs to perform a miRNAexpression profiling analysis. This allowed us to unravelseveral SC-expressed miRNAs that we then used to assesswhether the transcripts coding for up-regulated proteinsupon SC-Dcr loss are enriched for SC-miRNA target sites.The enrichment was significant only when taking into con-sideration seed conservation among placental species.However, neither an energetically favorable miRNA-mRNAduplex, nor a favorable target site sequence context yieldeda significant SC-miRNA target site enrichment. This couldbe explained by the fact that the �G duplex feature is basedon an RNA-only model and that more importantly, the se-quence context parameters are evaluated based on RNA-microarrays (32). As described above, the differences inprotein level we measured here are because of translationaldifferences and not mRNA alterations. Prediction featureswere described to be differentially relevant at each step of
the RNAi pathway (40), therefore, models for target predic-tion trained on the mRNA level are expected to be lessaccurate when no mRNA degradation is involved. Thismight thus explain our insignificant target site enrichmentwhen considering a favorable sequence context ormiRNA-mRNA duplex. In contrast, the conservation featurecaptures a “blinder” information (i.e. without a regulationmodel), which allows us to significantly isolate miRNA ef-fects on the measured proteome.
Among the proteins up-regulated in mutant testes, SOD-1retained our attention. We reckoned that because SOD-1 is aCu/Zn-superoxide dismutase whose overproduction causesincreased oxidative damage resulting in enhanced cell deaththrough apoptosis (for example see (36, 37)), its up-regulationcould be detrimental for cell survival, and thereby account, atleast partially, for the testicular degeneration we observedupon SC-Dcr loss. By performing an in vitro dual-luciferaseassay, we found the 3�UTR of Sod-1 to be directly targeted bythree SC-expressed miRNAs: miR-125a-3p, miR-872 andmiR-24. Of note, because SOD-1 is present in both SCs andin all types of GCs (41), the effect could be Sertoli-cell auton-omous or not. In either case, taking also into consideration the�3-fold mRNA up-regulation of Bcl2l11, a facilitator of apo-ptosis we previously detected at P0 (10), we are tempted tobelieve that two independent, miRNA-mediated, cell-deathmolecular mechanisms are at the origin of -at least part of- theobserved testicular degeneration. It would certainly be inter-esting to find out whether the observed SOD-1 increase uponSC-Dcr loss at birth is maintained at later stages of testisdevelopment. If this were indeed true, a chronic oxidativedamage could most likely explain the almost complete loss oftesticular structures upon aging.
An additional interesting issue raised by our findings iswhether the effects on protein output of mutant testes arebecause of direct SC-miRNA-mediated inhibition of proteinsynthesis, or because of indirect repressive mechanisms.Several indications suggest that a direct effect of miRNAs ontarget genes may account for most of the proteome altera-tions. First, we performed all of our analyses at an early stageof testis development (P0), when miRNAs are beginning to bedepleted from SCs and when no morphological and histolog-ical alterations are yet detected, a fact that would tend tosuggest a direct miRNA effect because of a rather restrictedtime window for secondary, indirect effects to occur. Second,although we did observe transcriptional alterations in mutanttestes, the deregulated genes at P0 represent only 0.5% ofthe total transcriptome (145 deregulated probe sets versus29.000 probe sets considered to be expressed in our Af-fymetrix analysis (10)), and most importantly, do not accountfor any protein deregulation, thus suggesting that, any alter-ations at the protein level are most likely to represent directeffects in our system. Finally, the fact that the 3�UTR oftranscripts coding for up-regulated proteins are enriched, al-though slightly, for SC-miRNA target sites, and that one of
Effect of Sertoli-cell Dicer on Testicular Proteome
10.1074/mcp.M900587-MCP200–12 Molecular & Cellular Proteomics 10.4

these proteins, SOD-1, is, at least in vitro, directly targetedby three SC-expressed miRNAs, points toward a direct neg-ative miRNA effect on protein synthesis.
Overall, with this study, we unravel a molecular mechanismthat could partially explain the observed testicular degenera-tion caused by SC-Dcr and miRNA loss. Most importantly, weshow, for the first time to our knowledge, that miRNAs havequite a significant impact on the testicular protein output andthus further reinforce the current notion of animal miRNAsexerting their primary negative effect at the translational level.
Acknowledgments—We would like to thank Nicolas Veillard forexcellent technical assistance; all the members of the Nef Laboratoryfor critical comments and discussion on the manuscript; all membersof the Proteomics Core Facility Biogenouest for valuable assistanceduring the mass spectrometry experiments.
□S This article contains supplemental Fig. S1 and Tables S1 to S5.§§ To whom correspondence should be addressed: Department of
Genetic Medicine and Development, University of Geneva MedicalSchool, 1, rue Michel-Servet, CH 1211 Geneva 4, Switzerland. Phone:�41 22 379 5193; Fax: �41 22 379 5260; E-mail:[email protected].
¶¶ Authors contributed equally to this work.
REFERENCES
1. Cooke, H. J., and Saunders, P. T. (2002) Mouse models of male infertility.Nat. Rev. Genet 3, 790–801
2. Jegou, B. (1992) The Sertoli cell. Clin. Endocrinol Metab. 6, 273–3113. Jegou, B. (1993) The Sertoli-germ cell communication network in mam-
mals. Int. Rev. Cytol. 147, 25–964. Chen, C., Ouyang, W., Grigura, V., Zhou, Q., Carnes, K., Lim, H., Zhao,
G. Q., Arber, S., Kurpios, N., Murphy, T. L., Cheng, A. M., Hassell, J. A.,Chandrashekar, V., Hofmann, M. C., Hess, R. A., and Murphy, K. M.(2005) ERM is required for transcriptional control of the spermatogonialstem cell niche. Nature 436, 1030–1034
5. Costoya, J. A., Hobbs, R. M., Barna, M., Cattoretti, G., Manova, K., Sukh-wani, M., Orwig, K. E., Wolgemuth, D. J., and Pandolfi, P. P. (2004)Essential role of Plzf in maintenance of spermatogonial stem cells. Nat.Gen. 36, 653–659
6. Meng, X., Lindahl, M., Hyvonen, M. E., Parvinen, M., de Rooij, D. G., Hess,M. W., Raatikainen-Ahokas, A., Sainio, K., Rauvala, H., Lakso, M., Pichel,J. G., Westphal, H., Saarma, M., and Sariola, H. (2000) Regulation of cellfate decision of undifferentiated spermatogonia by GDNF. Science 287,1489–1493
7. Braun, R. E. (1998) Post-transcriptional control of gene expression duringspermatogenesis. Sem. Cell Develop. Biol. 9, 483–489
8. Hayashi, K., Chuva de Sousa Lopes, S. M., Kaneda, M., Tang, F., Hajkova,P., Lao, K., O’Carroll, D., Das, P. P., Tarakhovsky, A., Miska, E. A., andSurani, M. A. (2008) MicroRNA biogenesis is required for mouse primor-dial germ cell development and spermatogenesis. PLoS ONE 3, e1738
9. Maatouk, D. M., Loveland, K. L., McManus, M. T., Moore, K., and Harfe,B. D. (2008) Dicer1 is required for differentiation of the mouse malegermline. Biol. Reprod. 79, 696–703
10. Papaioannou, M. D., Pitetti, J. L., Ro, S., Park, C., Aubry, F., Schaad, O.,Vejnar, C. E., Kuhne, F., Descombes, P., Zdobnov, E. M., McManus,M. T., Guillou, F., Harfe, B. D., Yan, W., Jegou, B., and Nef, S. (2009)Sertoli cell Dicer is essential for spermatogenesis in mice. Develop. Biol.326, 250–259
11. Papaioannou, M. D., and Nef, S. (2010) microRNAs in the Testis: BuildingUp Male Fertility. J. Androl. 31, 26–33
12. Kim, V. N., Han, J., and Siomi, M. C. (2009) Biogenesis of small RNAs inanimals. Nat. Rev. Mol. Cell. Biol. 10, 126–139
13. Rigoutsos, I. (2009) New tricks for animal microRNAS: targeting of aminoacid coding regions at conserved and nonconserved sites. Cancer Res.69, 3245–3248
14. Filipowicz, W., Bhattacharyya, S. N., and Sonenberg, N. (2008) Mecha-
nisms of post-transcriptional regulation by microRNAs: are the answersin sight? Nat. Rev. Genet. 9, 102–114
15. Vasudevan, S., Tong, Y., and Steitz, J. A. (2007) Switching from repressionto activation: microRNAs can up-regulate translation. Science 318,1931–1934
16. Place, R. F., Li, L. C., Pookot, D., Noonan, E. J., and Dahiya, R. (2008)MicroRNA-373 induces expression of genes with complementary pro-moter sequences. Proc. Natl. Acad. Sci. U. S. A. 105, 1608–1613
17. Bagga, S., Bracht, J., Hunter, S., Massirer, K., Holtz, J., Eachus, R., andPasquinelli, A. E. (2005) Regulation by let-7 and lin-4 miRNAs results intarget mRNA degradation. Cell 122, 553–563
18. Giraldez, A. J., Mishima, Y., Rihel, J., Grocock, R. J., Van Dongen, S., Inoue,K., Enright, A. J., and Schier, A. F. (2006) Zebrafish MiR-430 promotesdeadenylation and clearance of maternal mRNAs. Science 312, 75–79
19. Lim, L. P., Lau, N. C., Garrett-Engele, P., Grimson, A., Schelter, J. M.,Castle, J., Bartel, D. P., Linsley, P. S., and Johnson, J. M. (2005) Mi-croarray analysis shows that some microRNAs downregulate large num-bers of target mRNAs. Nature 433, 769–773
20. Vinther, J., Hedegaard, M. M., Gardner, P. P., Andersen, J. S., andArctander, P. (2006) Identification of miRNA targets with stable isotopelabeling by amino acids in cell culture. Nucl. Acids Res. 34, e107
21. Baek, D., Villen, J., Shin, C., Camargo, F. D., Gygi, S. P., and Bartel, D. P.(2008) The impact of microRNAs on protein output. Nature 455, 64–71
22. Selbach, M., Schwanhausser, B., Thierfelder, N., Fang, Z., Khanin, R., andRajewsky, N. (2008) Widespread changes in protein synthesis inducedby microRNAs. Nature 455, 58–63
23. Schmidt, A., Kellermann, J., and Lottspeich, F. (2005) A novel strategy forquantitative proteomics using isotope-coded protein labels. Proteomics5, 4–15
24. Gerber, S. A., Rush, J., Stemman, O., Kirschner, M. W., and Gygi, S. P.(2003) Absolute quantification of proteins and phosphoproteins from celllysates by tandem MS. Proc. Natl. Acad. Sci. U. S. A. 100, 6940–6945
25. Brun, V., Dupuis, A., Adrait, A., Marcellin, M., Thomas, D., Court, M.,Vandenesch, F., and Garin, J. (2007) Isotope-labeled protein standards:toward absolute quantitative proteomics. Mol. Cell Proteomics 6,2139–2149
26. Peirson, S. N., Butler, J. N., and Foster, R. G. (2003) Experimental validationof novel and conventional approaches to quantitative real-time PCR dataanalysis. Nucl. Acids Res. 31, e73
27. Vandesompele, J., De Preter, K., Pattyn, F., Poppe, B., Van Roy, N., DePaepe, A., and Speleman, F. (2002) Accurate normalization of real-timequantitative RT-PCR data by geometric averaging of multiple internalcontrol genes. Genome Biol. 3, RESEARCH0034
28. Toebosch, A. M., Robertson, D. M., Klaij, I. A., de Jong, F. H., and Groote-goed, J. A. (1989) Effects of FSH and testosterone on highly purified ratSertoli cells: inhibin alpha-subunit mRNA expression and inhibin secretionare enhanced by FSH but not by testosterone. J. Endocrinol. 122, 757–762
29. Bellve, A. R. (1993) Purification, culture, and fractionation of spermatogeniccells. Meth. Enzymol. 225, 84–113
30. Manna, P. R., Tena-Sempere, M., and Huhtaniemi, I. T. (1999) Molecularmechanisms of thyroid hormone-stimulated steroidogenesis in mouseleydig tumor cells. Involvement of the steroidogenic acute regulatory(StAR) protein. J. Biol. Chem. 274, 5909–5918
31. Kertesz, M., Iovino, N., Unnerstall, U., Gaul, U., and Segal, E. (2007) Therole of site accessibility in microRNA target recognition. Nat. Genet. 39,1278–1284
32. Grimson, A., Farh, K. K., Johnston, W. K., Garrett-Engele, P., Lim, L. P., andBartel, D. P. (2007) MicroRNA targeting specificity in mammals: deter-minants beyond seed pairing. Mol. Cell 27, 91–105
33. Karolchik, D., Kuhn, R. M., Baertsch, R., Barber, G. P., Clawson, H.,Diekhans, M., Giardine, B., Harte, R. A., Hinrichs, A. S., Hsu, F., Kober,K. M., Miller, W., Pedersen, J. S., Pohl, A., Raney, B. J., Rhead, B.,Rosenbloom, K. R., Smith, K. E., Stanke, M., Thakkapallayil, A., Trum-bower, H., Wang, T., Zweig, A. S., Haussler, D., and Kent, W. J. (2008)The UCSC Genome Browser Database: 2008 update. Nucl. Acids Res.36, D773–779
34. Sarioglu, H., Brandner, S., Jacobsen, C., Meindl, T., Schmidt, A., Keller-mann, J., Lottspeich, F., and Andrae, U. (2006) Quantitative analysis of2,3,7,8-tetrachlorodibenzo-p-dioxin-induced proteome alterations in 5Lrat hepatoma cells using isotope-coded protein labels. Proteomics 6,
Effect of Sertoli-cell Dicer on Testicular Proteome
Molecular & Cellular Proteomics 10.4 10.1074/mcp.M900587-MCP200–13

2407–242135. Turner, T. T., and Lysiak, J. J. (2008) Oxidative stress: a common factor in
testicular dysfunction. J. Androl. 29, 488–49836. Peled-Kamar, M., Lotem, J., Okon, E., Sachs, L., and Groner, Y. (1995)
Thymic abnormalities and enhanced apoptosis of thymocytes and bonemarrow cells in transgenic mice overexpressing Cu/Zn-superoxide dis-mutase: implications for Down syndrome. The EMBO J. 14, 4985–4993
37. Sanij, E., Hatzistavrou, T., Hertzog, P., Kola, I., and Wolvetang, E. J. (2001)Ets-2 is induced by oxidative stress and sensitizes cells to H(2)O(2)-induced apoptosis: implications for Down’s syndrome. Biochem. Bio-phys. Res. Comm. 287, 1003–1008
38. Taguchi, A., Yanagisawa, K., Tanaka, M., Cao, K., Matsuyama, Y., Goto, H.,and Takahashi, T. (2008) Identification of hypoxia-inducible factor-1 al-
pha as a novel target for miR-17–92 microRNA cluster. Cancer Res. 68,5540–5545
39. Yang, Y., Chaerkady, R., Beer, M. A., Mendell, J. T., and Pandey, A. (2009)Identification of miR-21 targets in breast cancer cells using a quantitativeproteomic approach. Proteomics 9, 1374–1384
40. Hausser, J., Landthaler, M., Jaskiewicz, L., Gaidatzis, D., and Zavolan, M.(2009) Relative contribution of sequence and structure features to themRNA binding of Argonaute/EIF2C-miRNA complexes and the degrada-tion of miRNA targets. Genome Res. 19, 2009–2020
41. Gu, W., Morales, C., and Hecht, N. B. (1995) In male mouse germ cells,copper-zinc superoxide dismutase utilizes alternative promoters thatproduce multiple transcripts with different translation potential. J. Biol.Chem. 270, 236–243
Effect of Sertoli-cell Dicer on Testicular Proteome
10.1074/mcp.M900587-MCP200–14 Molecular & Cellular Proteomics 10.4