Longitudinal study of perception of structured optic flow and random visual motion in infants using...
16
PAPER Longitudinal study of perception of structured optic flow and random visual motion in infants using high-density EEG Seth B. Agyei, Magnus Holth, F.R. (Ruud) van der Weel and Audrey L.H. van der Meer Department of Psychology, Norwegian University of Science and Technology, Norway Abstract Electroencephalogram (EEG) was used in infants at 3–4 months and 11–12 months to longitudinally study brain electrical activity as the infants were exposed to structured forwards and reversed optic flow, and non-structured random visual motion. Analyses of visual evoked potential (VEP) and temporal spectral evolution (TSE, time-dependent amplitude changes) were performed on EEG data recorded with a 128-channel sensor array. VEP results showed infants to significantly differentiate between the radial motion conditions, but only at 11–12 months where they showed shortest latency for forwards optic flow and longest latency for random visual motion. When the TSE results of the motion conditions were compared with those of a static non-flow dot pattern, infants at 3–4 and 11–12 months both showed significant differences in induced activity. A decrease in amplitudes at 5–7 Hz was observed as desynchronized theta-band activity at both 3–4 and 11–12 months, while an increase in amplitudes at 9–13 Hz was observed as synchronized alpha-band activity only at 11–12 months. It was concluded that brain electrical activities related to visual motion perception change during the first year of life, and these changes can be observed both in the VEP and induced activities of EEG. With adequate neurobiological development and locomotor experience infants around 1 year of age rely, more so than when they were younger, on structured optic flow and show a more adult-like specialization for motion where fasteroscillating cell assemblies have fewer but more specialized neurons, resulting in improved visual motion perception. Research highlights • As infants become more and more mobile during the first year of life, they depend to a greater extent on the correct pick-up of visual information specifying (self-)motion. • We studied the development of perception of struc- tured optic flow and random visual motion in infants using high-density EEG. • Brain electrical activities related to visual motion perception change during the first year of life, and these changes can be observed both in VEP and induced activities in EEG. • With adequate neurobiological development and locomotor experience infants around 1 year of age rely, more so than when they were younger, on structured optic flow and show a more adult-like specialization for motion where faster oscillating cell assemblies have fewer but more specialized neurons, resulting in improved visual motion perception. Introduction Perception of optic flow, the pattern of visual informa- tion resulting from an observer’s own motion (Gibson, 1979), plays an important role when navigating through our surroundings (for a review, see Lappe, Bremmer & Van den Berg, 1999). Optic flow information helps in determining direction of heading, stabilizing posture, and estimating the time taken to make contact with objects (Vaina & Rushton, 2000). Developmental studies have shown that infants are able to discriminate large changes in heading from optic flow prior to the onset of locomotion (Gilmore, Baker & Grobman, 2004; Gilmore & Rettke, 2003; Wattam-Bell, Address for correspondence: Audrey L.H. van der Meer, Developmental Neuroscience Laboratory, Department of Psychology, Norwegian University of Science and Technology, NO-7491 Trondheim, Norway; e-mail: [email protected] © 2014 John Wiley & Sons Ltd Developmental Science (2014), pp 1–16 DOI: 10.1111/desc.12221
Transcript of Longitudinal study of perception of structured optic flow and random visual motion in infants using...
PAPER
Longitudinal study of perception of structured optic flow andrandom visual motion in infants using high-density EEG
Seth B. Agyei, Magnus Holth, F.R. (Ruud) van der Weel andAudrey L.H. van der Meer
Department of Psychology, Norwegian University of Science and Technology, Norway
Abstract
Electroencephalogram (EEG) was used in infants at 3–4 months and 11–12 months to longitudinally study brain electricalactivity as the infants were exposed to structured forwards and reversed optic flow, and non-structured random visual motion.Analyses of visual evoked potential (VEP) and temporal spectral evolution (TSE, time-dependent amplitude changes) wereperformed on EEG data recorded with a 128-channel sensor array. VEP results showed infants to significantly differentiatebetween the radial motion conditions, but only at 11–12 months where they showed shortest latency for forwards optic flow andlongest latency for random visual motion. When the TSE results of the motion conditions were compared with those of a staticnon-flow dot pattern, infants at 3–4 and 11–12 months both showed significant differences in induced activity. A decrease inamplitudes at 5–7 Hz was observed as desynchronized theta-band activity at both 3–4 and 11–12 months, while an increase inamplitudes at 9–13 Hz was observed as synchronized alpha-band activity only at 11–12 months. It was concluded that brainelectrical activities related to visual motion perception change during the first year of life, and these changes can be observedboth in the VEP and induced activities of EEG. With adequate neurobiological development and locomotor experience infantsaround 1 year of age rely, more so than when they were younger, on structured optic flow and show a more adult-likespecialization for motion where faster oscillating cell assemblies have fewer but more specialized neurons, resulting in improvedvisual motion perception.
Research highlights
• As infants become more and more mobile during thefirst year of life, they depend to a greater extent onthe correct pick-up of visual information specifying(self-)motion.
• We studied the development of perception of struc-tured optic flow and random visual motion in infantsusing high-density EEG.
• Brain electrical activities related to visual motionperception change during the first year of life, andthese changes can be observed both in VEP andinduced activities in EEG.
• With adequate neurobiological development andlocomotor experience infants around 1 year of agerely, more so than when they were younger, onstructured optic flow and show a more adult-likespecialization for motion where faster oscillating cell
assemblies have fewer but more specialized neurons,resulting in improved visual motion perception.
Introduction
Perception of optic flow, the pattern of visual informa-tion resulting from an observer’s own motion (Gibson,1979), plays an important role when navigating throughour surroundings (for a review, see Lappe, Bremmer &Van den Berg, 1999). Optic flow information helps indetermining direction of heading, stabilizing posture,and estimating the time taken to make contact withobjects (Vaina & Rushton, 2000).
Developmental studies have shown that infants areable to discriminate large changes in heading from opticflow prior to the onset of locomotion (Gilmore, Baker &Grobman, 2004; Gilmore & Rettke, 2003; Wattam-Bell,
Address for correspondence: Audrey L.H. van der Meer, Developmental Neuroscience Laboratory, Department of Psychology, Norwegian Universityof Science and Technology, NO-7491 Trondheim, Norway; e-mail: [email protected]
© 2014 John Wiley & Sons Ltd
Developmental Science (2014), pp 1–16 DOI: 10.1111/desc.12221
1996). Both 3- and 5-month-olds have been found todiscriminate between optic flow displays that depict atleast 22° changes in heading direction (Gilmore et al.,2004), with the basic abilities to stabilize gaze on a visualflow field using head and body movements reported tobe acquired during the first 3 months of life (VonHofsten & Rosander, 1996). Emerging strings of evidencehave further shown sensitivities in infants to otheraspects of optic flow, particularly those associated withperception of the form of objects and detection ofcollision. For instance, with eye blinks and backwardhead movements, infants respond to radial flow patternsthat depict an impending collision of objects with theface (Kayed & Van der Meer, 2000, 2007; Schmuckler,1997). Further, analyses of brain responses of infants toa looming virtual object on a direct collision course showthat with age, infants show a developmental trend in theprediction of an object’s time-to-collision where theyshow a decrease in processing time and a peak brainresponse closer to a loom’s time-to-collision (Van derMeer, Svantesson & Van der Weel, 2012; Van der Weel &Van der Meer, 2009). Perception of motion is thereforeimportant for human survival and as such the develop-mental processes that mediate motion perceptionthroughout life are expected to be increasingly efficientafter birth.Physiological studies have implicated hMT/V5+ in
humans to have neurons primarily specialized for pro-cessing radial motionvia the dorsal visual pathway (Duffy& Wurtz, 1991; Dukelow, DeSouza, Culham, van denBerg, Menon & Vilis, 2001; Fukushima, 2008; Imura,Shirai, Tomonaga, Yamaguchi & Yagi, 2008; Tohyama &Fukushima, 2005), with optic flow motion specificallythought to be processed by cells of the dorsal MST (Vaina& Rushton, 2000). Together with numerous electrophys-iological and fMRI studies (e.g. Bartels, Zeki & Logothe-tis, 2008; Graziano, Andersen & Snowden, 1994; Saito,Yukie, Tanaka, Hikosaka, Fukada & Iwai, 1986; Whit-tingstall, Bartels, Singh, Kwon & Logothetis, 2010; Zeki,Watson, Lueck, Friston, Kennard & Frackowiak, 1991),TMS studies have further established the causal role ofMT/V5 in motion perception in humans where motionperception was impaired when magnetic stimulation wasapplied in this area approximately 150 ms post-stimulus(Sack, Kohler, Linden, Goebel & Muckli, 2006; Stevens,McGraw, Ledgeway & Schluppeck, 2009). In newborninfants, a V1 bypass toMT+/V5 via the superior colliculusand pulvinar has been reported to be involved in theimmature processing of visual information (see review byBraddick &Atkinson, 2011; Dubowitz, Mushin, De Vries& Arden, 1986). The initial level of radial motionprocessing in occipito-temporal cortex in infancy hastherefore been suggested to occur in the left hemisphere
with bilateral development and gradual involvement ofother visual areas occurring between 3 and 5 months ofage (Rosander, Nystrom, Gredeback & Von Hofsten,2007).Complementary to the above techniques, the use of
non-invasive electroencephalogram (EEG) recordings toascertain the neuronal basis of motion perception andexamine functional specializations of cortical structureshas been given considerable attention over the years(Berg & Scherg, 1991; Sakkalis, Tsiaras, Michalopoulos& Zervakis, 2008; Scherg & Berg, 1991; Van der Meer,Fallet & Van der Weel, 2008). Visual evoked potential(VEP) waveforms in EEG have been found to bedominated by a motion-sensitive negativity (N2) withits origin assumed to be in MT that occurs in adults atlatency around 130–150 ms (Heinrich, Renkl & Bach,2005; Probst, Plendl, Paulus, Wist & Scherg, 1993) and in8-month-old infants around 180–220 ms post-stimulus(Van der Meer et al., 2008).In conjunction with the use of VEPs, growing atten-
tion has also been given to EEG studies in the time-frequency domain. This has permitted the investigationof perceptual and cognitive functions through themanifestations of the natural frequencies in EEGoscillations (Basar, Basar-Eroglu, Karakas & Schur-mann, 1999). Frequency analyses detect events thatcannot be extracted from an ongoing EEG by simplelinear methods such as averaging techniques in VEPs, asthese event-related frequency changes are rather time-locked but not phase-locked to the events of interest(Pfurtscheller & Lopes da Silva, 1999). These frequencychanges are observed as event-related synchronization(ERS) or event-related desynchronization (ERD) oscil-lations and may suggest either an increase or a decreasein power or amplitude of given frequency bands, anindication of an increase or a decrease in synchrony ofunderlying neuronal populations (Hoechstetter, Born-fleth, Weckesser, Ille, Berg & Scherg, 2004).In recent years, several adult studies have found
evidence for the modulation of the natural frequenciesby motion stimuli (for a review, see Saby & Marshall,2012) while little evidence for such activity is known ininfants. Motion-induced power increases in gamma-band (30–80 Hz) activity (Hoogenboom, Schoffelen,Oostenveld, Parkes & Fries, 2006) and beta-band(14–30 Hz) activity (Carmeli, Knyazeva, Innocenti &De Feo, 2005; Van der Meer et al., 2008) over occipitalelectrodes in adults have been reported where synchro-nization within the alpha band (8–13 Hz) has beensuggested to represent an inactive state of underlyingcortical areas (Pfurtscheller, Stancak & Neuper, 1996). Inaddition, other studies have linked low-frequencytheta (4–7.5 Hz) rhythms in adults to the formation of
© 2014 John Wiley & Sons Ltd
2 Seth B. Agyei et al.
long-term memories (Khader, Jost, Ranganath & Rosler,2010; Klimesch, Doppelmayr, Russegger & Pachinger,1996). However, by analysing 1 Hz bins from 3 to 12 Hz,Marshall, Bar-Haim and Fox (2002) in a longitudinalstudy of infants found frequency peaks around 6–9 Hzto be a useful alpha-range band from the end of the firstyear of life into early childhood. Further, low-frequencyEEG rhythms have been particularly observed in infants,which have been primarily attributed to signs of imma-turity (Orekhova, Stroganova, Posikera & Elam, 2006).Pfurtscheller and Lopes da Silva (1999) proposed factorssuch as efficient task performance and increased taskcomplexity as contributing factors to the enhancement oflow-amplitude theta/alpha activities in infants. Theselow-amplitude activities have been further found toundergo systematic development from early childhood toadulthood (Stroganova, Orekhova & Posikera, 1999).Further, Van der Meer et al. (2008) reported low-amplitude values in theta-band activity over visual areasin infants at 8 months when motion stimuli werecompared with a static dot pattern, an observationwhich has implicated desynchronized theta-band activityin processing motion in infants especially as synchroni-zation in the same frequency band was observed wheninfants were presented with a static dot pattern. Psycho-physiological studies have further noted a transition ofEEG spectral amplitudes from lower to higher frequen-cies during development, an observation that has beenconsidered a sign of maturation (Hudspeth & Pribram,1992).
Self-produced locomotion experience has been sug-gested to be associated with the functional processing ofmotion stimuli, particularly optic flow (Higgins, Campos& Kermoian, 1996; Van der Meer et al., 2008) but notmuch is known about the development and processing ofthis fundamental type of stimulus in infancy. In relatingbehavioural changes during infancy to underlyingchanges in the brain, the present study adds to theincreasing knowledge of the relationship between thedeveloping brain and behaviour, while further providingevidence for the modulation of some of the naturalfrequencies by motion stimuli in infancy. These mayfurther help change ideas about the mechanism under-lying perceptual, motor, and cognitive development(Johnson, 2000; Nelson, Bloom, Cameron, Amaral,Dahl & Pine, 2002). It was the aim of the presentlongitudinal paper to study brain electrical activityduring the first year of life as infants were exposed tostructured optic flow and random visual motion byemploying a combination of VEP and time-frequencyanalyses using high-density EEG. It was assumed thatVEPs represent responses of cortical neurons to changesin afferent activity (Van der Meer et al., 2008) while
event-related time-frequency responses represent localcortical neuronal interactions that control the frequencycomponents of an ongoing EEG (Pfurtscheller & Lopesda Silva, 1999). It was hypothesized that perception ofoptic flow would rapidly improve in infants during thefirst year of life with no marked difference in perceptionof random visual motion, and that an induced amplitudedecrease in low frequencies would be observed.
Methods
Participants
We recruited 23 infants by contacting parents throughbirth announcements. Eighteen infants (nine girls andnine boys) provided sufficient artefact-free data for theanalyses. All babies were born healthy without birthcomplications or any neurological defects as determinedby parental report.
Testing followed a longitudinal design. First, infantswere tested at 3–4 months followed by a second testingwhen the infants were 11–12 months of age. For the firstsession, mean age of the infants was 17 weeks (SD = 3.0).None of the infants had any crawling experience at thistime, but most could roll over from back to stomach. Forthe second session, mean age of the infants was 49 weeks(SD = 2.1). None of the infants at this age hadcompletely mastered independent walking. Four of themcould walk with help while five had taken some stepsalone for 3 weeks prior to testing. However, all couldcomfortably crawl and had been doing so since32–42 weeks and on average for 10 weeks (SD = 5.1).
As a psychological procedure, EEG recordings causeno known physical harm to participants. Parents gavetheir informed consent and had the liberty to withdrawfrom the testing at any time before or during theexperiments. The Norwegian Regional Ethics Committeeand the Norwegian Data Services for the Social Sciencesapproved the study.
Experimental stimuli and paradigm
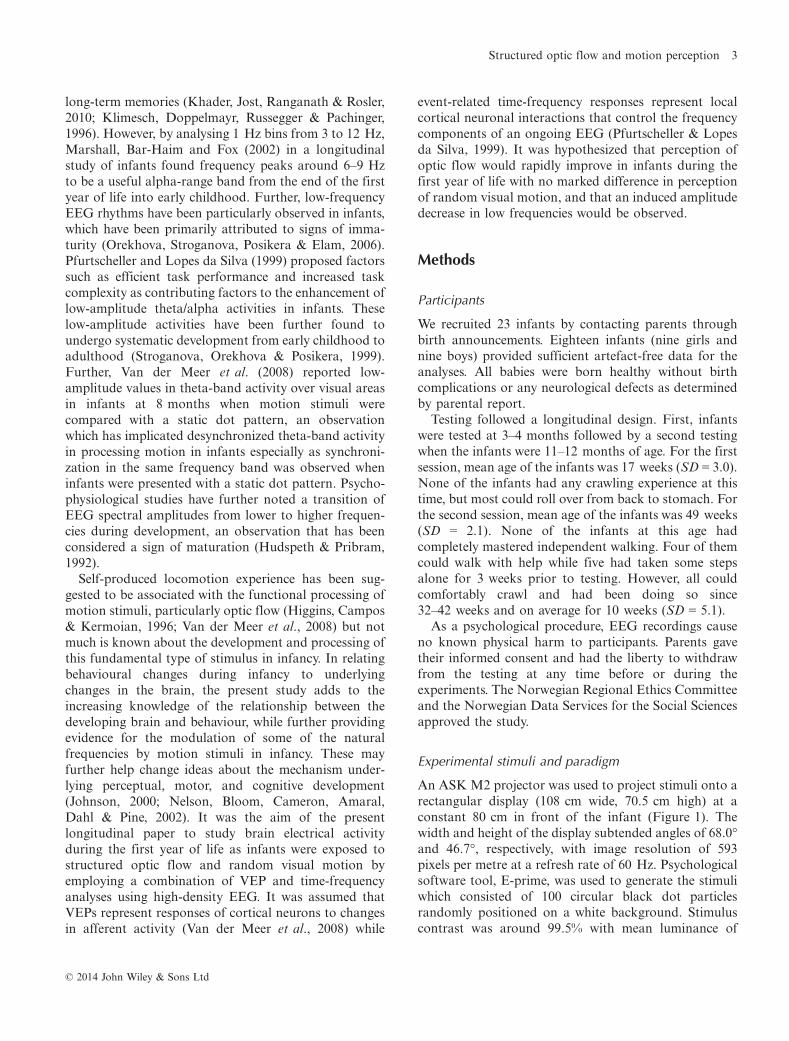
An ASK M2 projector was used to project stimuli onto arectangular display (108 cm wide, 70.5 cm high) at aconstant 80 cm in front of the infant (Figure 1). Thewidth and height of the display subtended angles of 68.0�and 46.7�, respectively, with image resolution of 593pixels per metre at a refresh rate of 60 Hz. Psychologicalsoftware tool, E-prime, was used to generate the stimuliwhich consisted of 100 circular black dot particlesrandomly positioned on a white background. Stimuluscontrast was around 99.5% with mean luminance of
© 2014 John Wiley & Sons Ltd
Structured optic flow and motion perception 3
68 cd/m2. The dots were 5 mm in virtual radius. Todiscriminate between coherent and incoherent radialmotion, three motion conditions were employed: for-wards optic flow, reversed optic flow, and randommotion. Each was presented for 1500 ms, the orderrandomly chosen. A static non-flow condition, alsooccurring for 1500 ms, was used as control condition. Inorder to reduce motion adaptation, each motion condi-tion was followed by the static condition. A referencefixation point, 1.69 mm in diameter, subtended an angleof 0.16� at the centre of the screen. The dots increased ordecreased in size at a rate of 0.025 pixels per pixel withreference to the position of the fixation point such thatthe particles appeared small when far away from the eyein virtual space and large when closer. Dot particles ineach of the three motion conditions moved inwards andtowards or outwards and away from the centre of thescreen at a constant rate of 30 mm per frame at a rate of60 fps.In the forwards optic flow condition, dots appeared to
coherently move towards the infant. Movement wasparallel to the z-axis towards the eye with velocities inthe x- and y-axes remaining zero. In the reversed opticflow condition, dots coherently moved in the oppositedirection to that of the forwards optic flow condition.Here, dots moved parallel to the z-axis as in the forwardsoptic flow condition but away from the eye withvelocities in the x- and y-axes also at zero. Unlike theabove two conditions, dot particles in the randommotion condition did not move in the same directionbut in a completely random direction in virtual spacewith the same properties as described above. Finally, thestatic non-flow condition, which was a frozen optic flowcondition, had dot particles that remained in the sameposition for the duration of the trial with zero velocity in
all directions. As in the motion conditions, dot particlesin the static non-flow condition had varying sizes on thescreen, the smallest being 2 mm in radius and the largest17 mm.Accretion of dots at the centre or edges of the screen in
the motion conditions was avoided by presenting stimulias a uniform dot distribution where dot particles had alimited lifespan such that dots that moved outside therange of sight on the screen (either appearing too smallin the centre when in a reversed movement or at a largersize as they moved outside the edges in the forwardsmovement) were automatically re-sized and repositionedwith an equal probability of placement for all particles ineach motion condition.
Data acquisition
EEG activity was recorded with a Geodesic Sensor Net(GSN) 200 (Tucker, 1993; Tucker, Liotti, Potts, Russell &Posner, 1994) consisting of an array of 128 sensors thatwere evenly distributed on the infant’s head (Figure 1).A high-input EGI amplifier connected to the net ensuredamplification of signals at maximum impedance of 50kΩ as recommended for an optimal signal-to-noise ratio(Budai, Contento, Locatelli & Comi, 1995; Ferree, Luu,Russell & Tucker, 2001; Picton, Bentin, Berg, Donchin,Hillyard, Johnson, Miller, Ritter, Ruchkin, Rugg &Taylor, 2000). Net Station software on a Macintoshcomputer recorded amplified EEG signals at a samplingrate of 500 Hz.In addition, each infant’s gaze was tracked using an
infrared Tobii X50 camera to control for whether theinfant was looking at the screen or not (Figure 1). Thevisual feed was processed with Clear View software on anHP computer. To track off-line the behaviour of theinfants during the experiments, digital videos wererecorded with two cameras positioned at different anglesin front of the infants. Recorded data were subsequentlystored for off-line analyses.
Procedure
Parents usually arrived with their infant several minutesprior to the experiment. The necessary information forthe signing of the consent form was then made availablewhile the infant was allowed some time to get used to thelaboratory surroundings. In the process, an assistantmeasured the infant’s head circumference for the correctsize selection of the net. After soaking the appropriatenet in a saline electrolyte to optimize electrical conduc-tivity, it was partially dried and mounted on the head ofthe infant while the infant was seated on the parent’s lap.The infant’s attention was distracted from the net with
Figure 1 Experimental set-up with an infant wearing theGeodesic Sensor Net. On the large screen in front of the infantmoving dots are projected that simulate forward and reversedself-motion, or random motion. Gaze is picked up from theTobii infrared camera placed on the table in front of the infant.
© 2014 John Wiley & Sons Ltd
4 Seth B. Agyei et al.

small noise-emitting toys and colourful soap bubbles.After the net was mounted, the infant was moved into adimly lit experimental room that was separated with atransparent glass partition from a control room wheretwo assistants operated the computers necessary for dataacquisition. The infant was positioned in front of thescreen while sitting on the parent’s lap during the firsttesting session, or in a baby car seat during the secondsession (Figure 1). The net was connected to theamplifier and the impedance of the electrodes waschecked. If necessary, contact of electrodes was improvedby adding saline electrolyte to the electrodes or simplyadjusting their position. For the entire duration of theexperiment, a parent was present in the experimentalroom to reduce any stressful effect resulting from theparent’s absence, while the presence of an assistant wasrequired to monitor the experiment and to help theinfant focus on the screen.
The experimental session began immediately after theinfant’s eye movement was calibrated in virtual space.The stimuli generated were presented in a randomsequential order on the screen for a varying number oftrials, typically 90–120 per infant, where half of thosewere static non-flow trials. Data acquisition was carriedout in one block. However, presentation was paused inthe event of an infant showing signs of disinterest orboredom, at which time the assistant and/or parentplayed for a little while with the infant to revive the levelof interest. Considerable disinterest, tiredness, or fussi-ness on the part of an infant signalled the end of theexperiment. The optic flow experiment, which tookabout 4–6 minutes on average, was usually the first ofthree visual motion experiments performed by eachinfant during an experimental session.
Analyses
Data analyses
EEG raw data were analysed with Brain ElectricalSource Analysis (BESA) research software version 5.3.The same methods were applied to data for both testingsessions. As an initial pre-processing step, recordingswere segmented with the Net Station software andexported as raw files with the appropriate auxiliary filesattached. Averaging epoch was from �200 ms to 800 msat a baseline definition of �100 ms to 0 ms. The notchfilter was set at 50 Hz to remove line interference fromthe recorded data. A low cut-off filter was set at 1.6 Hzto remove slow drift in the data, while a high cut-off wasset at 60 Hz. Artefact-contaminated channels andepochs resulting from head or body movements wereexcluded from further analyses or their signals estimated
using spherical spline interpolation (Perrin, Pernier,Bertrand & Echallier, 1989; Picton et al., 2000). Infantswith 10% of channels defined as bad were excluded.Using the recorded visual feed of each infant from theTobii tracker, trials where infants were not looking at thescreen were also excluded from further analyses. Mostly,data that could not be used were from the second testingsession. In scanning for artefacts, threshold values forgradient and low signal were set at 75 lV and 0.1 lV,respectively, while maximum amplitude was at 200/220 lV. Manual artefact correction designed to separatebrain activity from artefacts using spatial filters wasapplied to correct for physiological artefacts caused byblinking or eye movements (Berg & Scherg, 1994;Fujioka, Mourad, He & Trainor, 2011; Ille, Berg &Scherg, 2002). In rare instances where a manual selectioncould not be accomplished, an automatic artefactcorrection with preset default values (150 lV and250 lV for horizontal and vertical electrooculogramamplitude thresholds, respectively) was applied to defineand explain artefact topographies by principal compo-nent analysis (Ille et al., 2002; Zanotelli, Santos Filho &Tierra-Criollo, 2010).
The mean number of accepted trials for the 3- to4-month-old infants was 42 (SD = 6), and 38 (SD = 4) forthe 11- to 12-month-olds, more or less evenly distributedover the three radial motion conditions, while thecorresponding numbers in the static condition were 46(SD = 17) and 43 (SD = 15) at the two ages.
Peak analyses at the electrode level
EEG data were exported into the standardized 81-electrode configuration of the 10–10 international systemafter re-referencing to an artificial reference calculatedfrom the average potentials over the scalp such thatindividual averages were obtained. The individual aver-ages for infants in each of the two sessions were thencombined into a grand average for each session. The N2components of the individual VEP waveforms were thenidentified. This was done using 3D spherical splinewhole-head voltage maps of EEG scalp signal distribu-tions that visualized maximum N2 activity in occipito-parietal areas for the most dominant VEP waveform.Further, due to individual subject differences, grandaverage VEPs provided approximate time intervals onlyas reference for selecting individual N2 components atdifferent electrode sites. Values for peak latencies andpeak amplitudes of the individual averages were recordedand subjected to further VEP analyses. Peak latency wasmeasured as the time from stimulus onset to the peak ofeach scalp N2 component with peak amplitude recordedrelative to the pre-stimulus baseline.
© 2014 John Wiley & Sons Ltd
Structured optic flow and motion perception 5
Time-frequency analyses in brain space
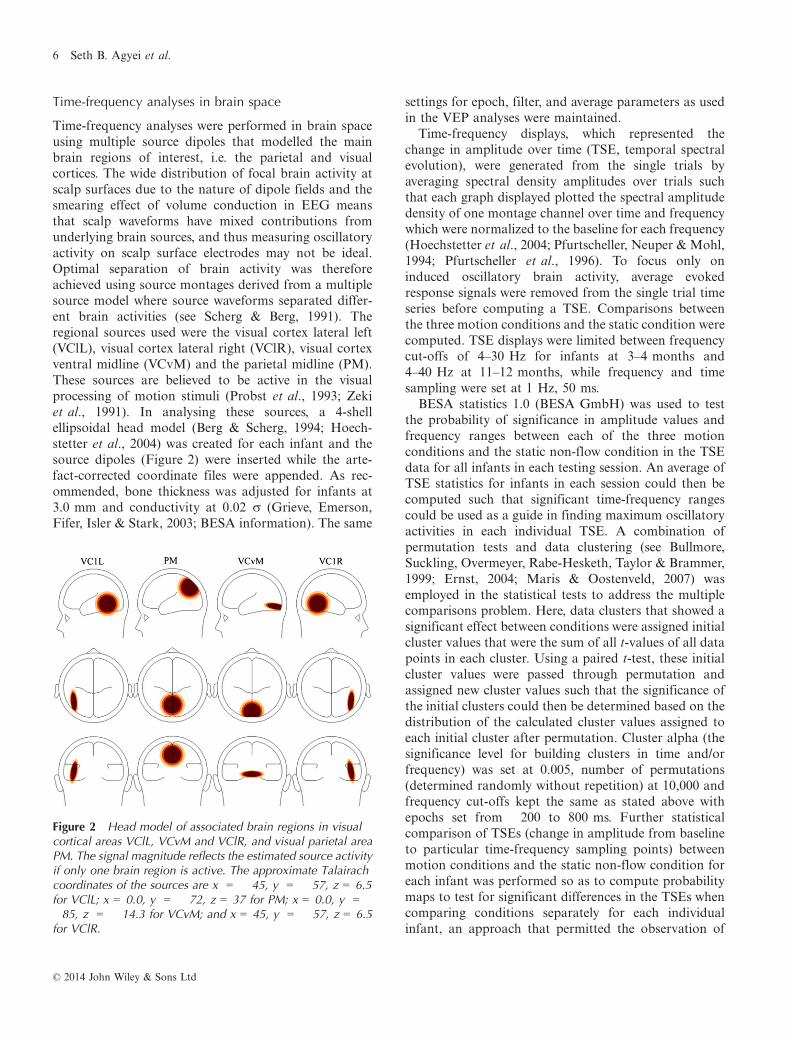
Time-frequency analyses were performed in brain spaceusing multiple source dipoles that modelled the mainbrain regions of interest, i.e. the parietal and visualcortices. The wide distribution of focal brain activity atscalp surfaces due to the nature of dipole fields and thesmearing effect of volume conduction in EEG meansthat scalp waveforms have mixed contributions fromunderlying brain sources, and thus measuring oscillatoryactivity on scalp surface electrodes may not be ideal.Optimal separation of brain activity was thereforeachieved using source montages derived from a multiplesource model where source waveforms separated differ-ent brain activities (see Scherg & Berg, 1991). Theregional sources used were the visual cortex lateral left(VClL), visual cortex lateral right (VClR), visual cortexventral midline (VCvM) and the parietal midline (PM).These sources are believed to be active in the visualprocessing of motion stimuli (Probst et al., 1993; Zekiet al., 1991). In analysing these sources, a 4-shellellipsoidal head model (Berg & Scherg, 1994; Hoech-stetter et al., 2004) was created for each infant and thesource dipoles (Figure 2) were inserted while the arte-fact-corrected coordinate files were appended. As rec-ommended, bone thickness was adjusted for infants at3.0 mm and conductivity at 0.02 r (Grieve, Emerson,Fifer, Isler & Stark, 2003; BESA information). The same
settings for epoch, filter, and average parameters as usedin the VEP analyses were maintained.Time-frequency displays, which represented the
change in amplitude over time (TSE, temporal spectralevolution), were generated from the single trials byaveraging spectral density amplitudes over trials suchthat each graph displayed plotted the spectral amplitudedensity of one montage channel over time and frequencywhich were normalized to the baseline for each frequency(Hoechstetter et al., 2004; Pfurtscheller, Neuper & Mohl,1994; Pfurtscheller et al., 1996). To focus only oninduced oscillatory brain activity, average evokedresponse signals were removed from the single trial timeseries before computing a TSE. Comparisons betweenthe three motion conditions and the static condition werecomputed. TSE displays were limited between frequencycut-offs of 4–30 Hz for infants at 3–4 months and4–40 Hz at 11–12 months, while frequency and timesampling were set at 1 Hz, 50 ms.BESA statistics 1.0 (BESA GmbH) was used to test
the probability of significance in amplitude values andfrequency ranges between each of the three motionconditions and the static non-flow condition in the TSEdata for all infants in each testing session. An average ofTSE statistics for infants in each session could then becomputed such that significant time-frequency rangescould be used as a guide in finding maximum oscillatoryactivities in each individual TSE. A combination ofpermutation tests and data clustering (see Bullmore,Suckling, Overmeyer, Rabe-Hesketh, Taylor & Brammer,1999; Ernst, 2004; Maris & Oostenveld, 2007) wasemployed in the statistical tests to address the multiplecomparisons problem. Here, data clusters that showed asignificant effect between conditions were assigned initialcluster values that were the sum of all t-values of all datapoints in each cluster. Using a paired t-test, these initialcluster values were passed through permutation andassigned new cluster values such that the significance ofthe initial clusters could then be determined based on thedistribution of the calculated cluster values assigned toeach initial cluster after permutation. Cluster alpha (thesignificance level for building clusters in time and/orfrequency) was set at 0.005, number of permutations(determined randomly without repetition) at 10,000 andfrequency cut-offs kept the same as stated above withepochs set from �200 to 800 ms. Further statisticalcomparison of TSEs (change in amplitude from baselineto particular time-frequency sampling points) betweenmotion conditions and the static non-flow condition foreach infant was performed so as to compute probabilitymaps to test for significant differences in the TSEs whencomparing conditions separately for each individualinfant, an approach that permitted the observation of
Figure 2 Head model of associated brain regions in visualcortical areas VClL, VCvM and VClR, and visual parietal areaPM. The signal magnitude reflects the estimated source activityif only one brain region is active. The approximate Talairachcoordinates of the sources are x = �45, y = �57, z = 6.5for VClL; x = 0.0, y = �72, z = 37 for PM; x = 0.0, y =�85, z = �14.3 for VCvM; and x = 45, y = �57, z = 6.5for VClR.
© 2014 John Wiley & Sons Ltd
6 Seth B. Agyei et al.
significantly dominant oscillatory activities across thevisual areas of interest for each infant in each testingsession. Here, Bonferroni procedure and permutationtests as described by Simes (1986) and Auranen (2002)were used and applied to each set of time samplesbelonging to one frequency bin so as to correct formultiple testing. Frequency cut-offs and sampling pointswere maintained as stated above.
Results
VEP responses
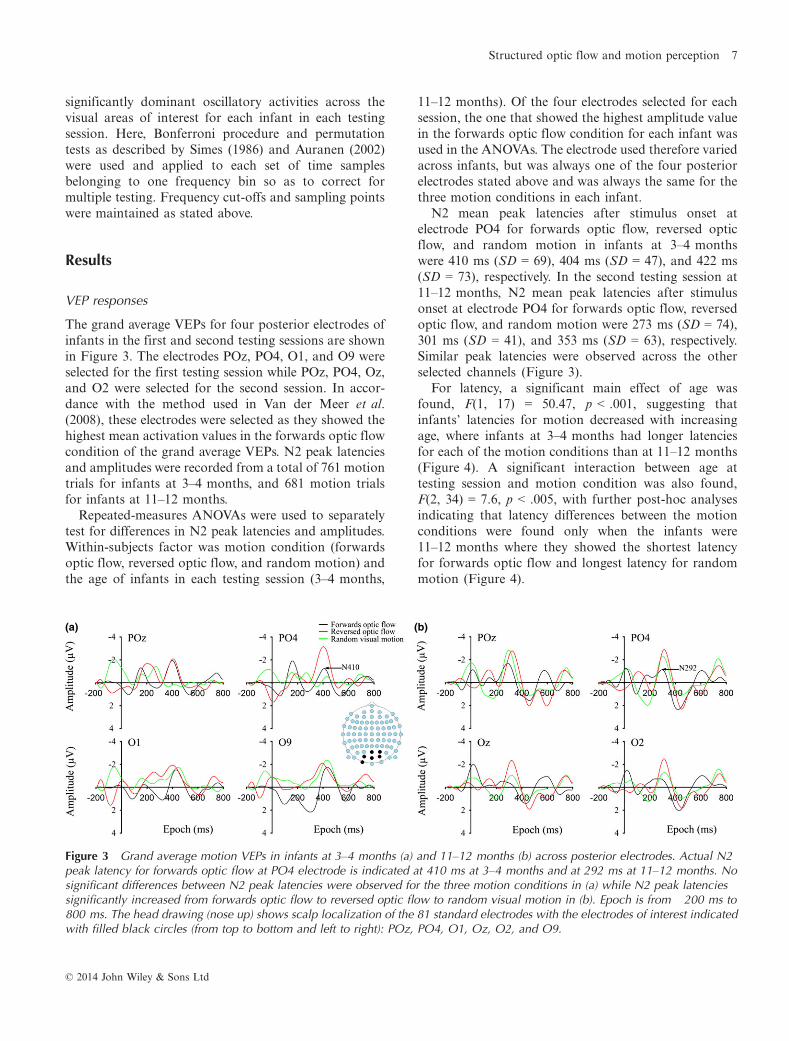
The grand average VEPs for four posterior electrodes ofinfants in the first and second testing sessions are shownin Figure 3. The electrodes POz, PO4, O1, and O9 wereselected for the first testing session while POz, PO4, Oz,and O2 were selected for the second session. In accor-dance with the method used in Van der Meer et al.(2008), these electrodes were selected as they showed thehighest mean activation values in the forwards optic flowcondition of the grand average VEPs. N2 peak latenciesand amplitudes were recorded from a total of 761 motiontrials for infants at 3–4 months, and 681 motion trialsfor infants at 11–12 months.
Repeated-measures ANOVAs were used to separatelytest for differences in N2 peak latencies and amplitudes.Within-subjects factor was motion condition (forwardsoptic flow, reversed optic flow, and random motion) andthe age of infants in each testing session (3–4 months,
11–12 months). Of the four electrodes selected for eachsession, the one that showed the highest amplitude valuein the forwards optic flow condition for each infant wasused in the ANOVAs. The electrode used therefore variedacross infants, but was always one of the four posteriorelectrodes stated above and was always the same for thethree motion conditions in each infant.
N2 mean peak latencies after stimulus onset atelectrode PO4 for forwards optic flow, reversed opticflow, and random motion in infants at 3–4 monthswere 410 ms (SD = 69), 404 ms (SD = 47), and 422 ms(SD = 73), respectively. In the second testing session at11–12 months, N2 mean peak latencies after stimulusonset at electrode PO4 for forwards optic flow, reversedoptic flow, and random motion were 273 ms (SD = 74),301 ms (SD = 41), and 353 ms (SD = 63), respectively.Similar peak latencies were observed across the otherselected channels (Figure 3).
For latency, a significant main effect of age wasfound, F(1, 17) = 50.47, p < .001, suggesting thatinfants’ latencies for motion decreased with increasingage, where infants at 3–4 months had longer latenciesfor each of the motion conditions than at 11–12 months(Figure 4). A significant interaction between age attesting session and motion condition was also found,F(2, 34) = 7.6, p < .005, with further post-hoc analysesindicating that latency differences between the motionconditions were found only when the infants were11–12 months where they showed the shortest latencyfor forwards optic flow and longest latency for randommotion (Figure 4).
(a) (b)
Figure 3 Grand average motion VEPs in infants at 3–4 months (a) and 11–12 months (b) across posterior electrodes. Actual N2peak latency for forwards optic flow at PO4 electrode is indicated at 410 ms at 3–4 months and at 292 ms at 11–12 months. Nosignificant differences between N2 peak latencies were observed for the three motion conditions in (a) while N2 peak latenciessignificantly increased from forwards optic flow to reversed optic flow to random visual motion in (b). Epoch is from �200 ms to800 ms. The head drawing (nose up) shows scalp localization of the 81 standard electrodes with the electrodes of interest indicatedwith filled black circles (from top to bottom and left to right): POz, PO4, O1, Oz, O2, and O9.
© 2014 John Wiley & Sons Ltd
Structured optic flow and motion perception 7
Mean N2 peak amplitudes at PO4 electrode in infantsat 3–4 months were 3.4 lV (SD = 3.6) for forwards opticflow, 3.7 lV (SD = 2.7) for reversed optic flow, and2.3 lV (SD = 1.6) for random motion while those ininfants at 11–12 months were 4.2 lV (SD = 3.1), 4.1 lV(SD = 2.4), and 2.7 lV (SD = 3.1), respectively. Foramplitudes, no significant main effects for motioncondition or age at testing session were found, nor wasthere a significant interaction, indicating that peakamplitudes in infants at 3–4 months were about thesame as at 11–12 months.
Time-frequency responses
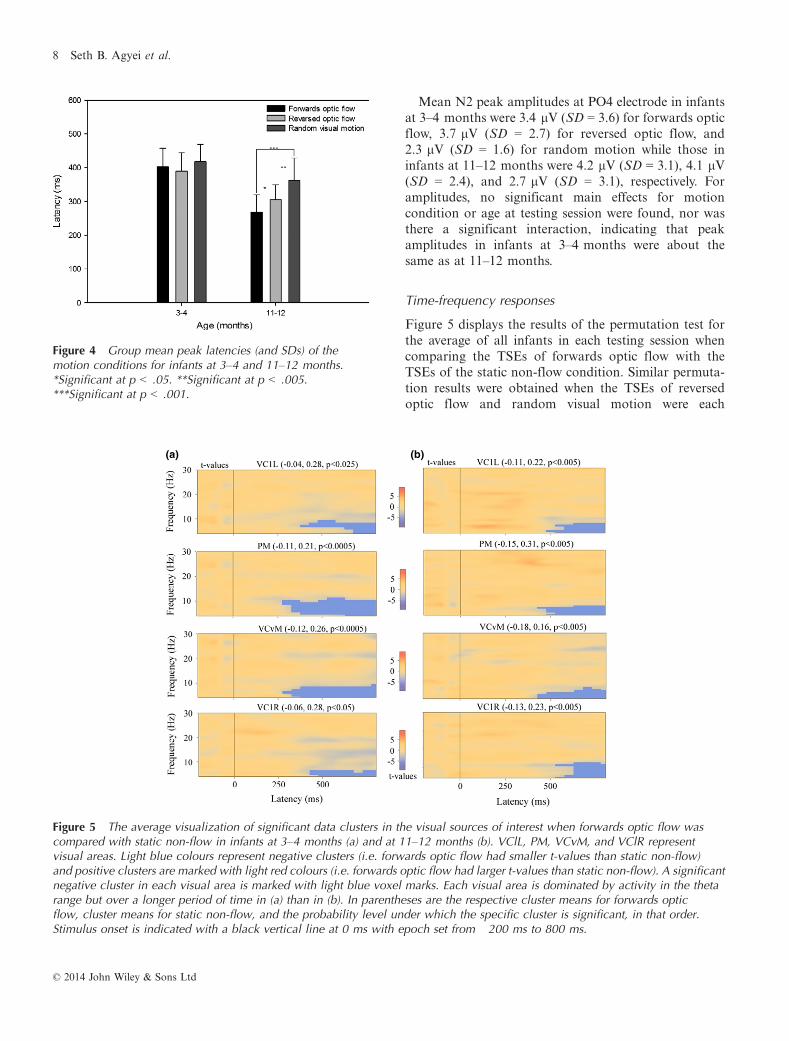
Figure 5 displays the results of the permutation test forthe average of all infants in each testing session whencomparing the TSEs of forwards optic flow with theTSEs of the static non-flow condition. Similar permuta-tion results were obtained when the TSEs of reversedoptic flow and random visual motion were each
Figure 4 Group mean peak latencies (and SDs) of themotion conditions for infants at 3–4 and 11–12 months.*Significant at p < .05. **Significant at p < .005.***Significant at p < .001.
(a) (b)
Figure 5 The average visualization of significant data clusters in the visual sources of interest when forwards optic flow wascompared with static non-flow in infants at 3–4 months (a) and at 11–12 months (b). VClL, PM, VCvM, and VClR representvisual areas. Light blue colours represent negative clusters (i.e. forwards optic flow had smaller t-values than static non-flow)and positive clusters are marked with light red colours (i.e. forwards optic flow had larger t-values than static non-flow). A significantnegative cluster in each visual area is marked with light blue voxel marks. Each visual area is dominated by activity in the thetarange but over a longer period of time in (a) than in (b). In parentheses are the respective cluster means for forwards opticflow, cluster means for static non-flow, and the probability level under which the specific cluster is significant, in that order.Stimulus onset is indicated with a black vertical line at 0 ms with epoch set from �200 ms to 800 ms.
© 2014 John Wiley & Sons Ltd
8 Seth B. Agyei et al.
compared with the TSEs of the static non-flow condi-tion, with no significant differences observed when theTSEs were compared between motion conditions. Thepermutation results showed four significant negativeclusters (indicating that forwards optic flow had signif-icantly smaller values than static non-flow), with onesignificant negative cluster found in each visual area ofinterest for infants at 3–4 months and at 11–12 months.Each visual area showed a significant cluster that seemedto be dominated by activity in the theta-range that wasmore prevalent over a relatively longer period of time ininfants at 3–4 months (Figure 5a) compared to a shorterperiod of time in infants at 11–12 months (Figure 5b).Thus, the TSE of forwards optic flow showed signifi-cantly lower amplitude values in theta-band activity thanthe static non-flow condition in the cortical areas ofinterest in infants at both 3–4 and 11–12 months. This
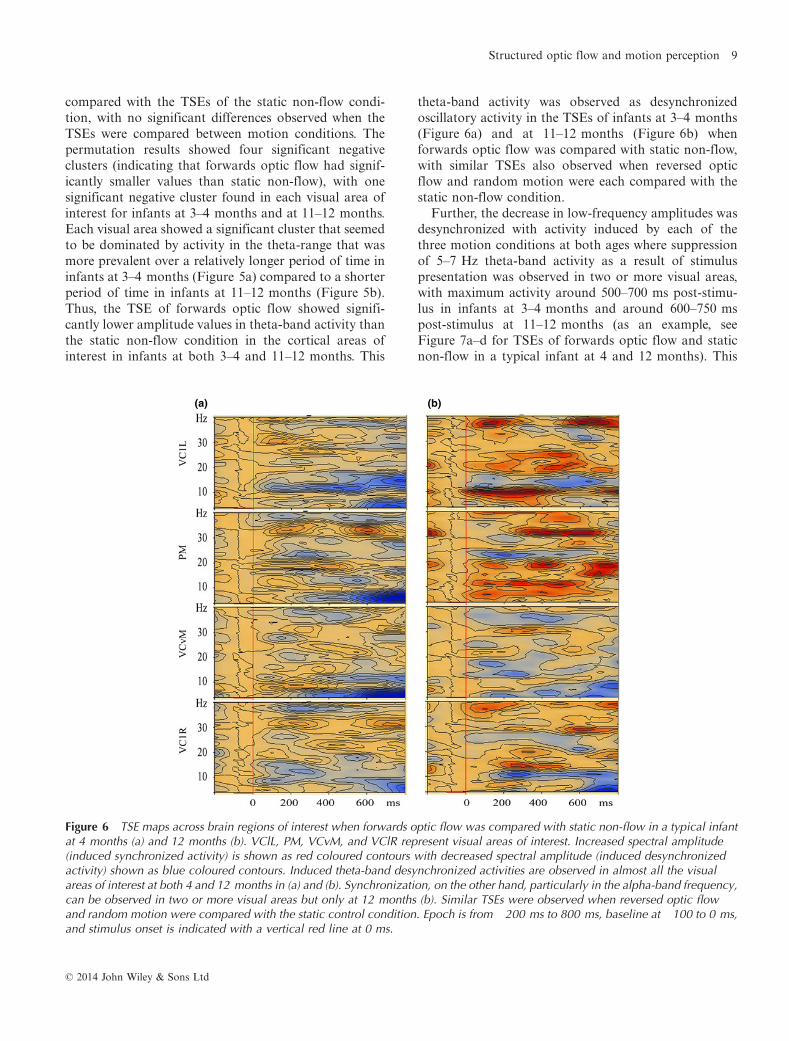
theta-band activity was observed as desynchronizedoscillatory activity in the TSEs of infants at 3–4 months(Figure 6a) and at 11–12 months (Figure 6b) whenforwards optic flow was compared with static non-flow,with similar TSEs also observed when reversed opticflow and random motion were each compared with thestatic non-flow condition.
Further, the decrease in low-frequency amplitudes wasdesynchronized with activity induced by each of thethree motion conditions at both ages where suppressionof 5–7 Hz theta-band activity as a result of stimuluspresentation was observed in two or more visual areas,with maximum activity around 500–700 ms post-stimu-lus in infants at 3–4 months and around 600–750 mspost-stimulus at 11–12 months (as an example, seeFigure 7a–d for TSEs of forwards optic flow and staticnon-flow in a typical infant at 4 and 12 months). This
(a) (b)
Figure 6 TSE maps across brain regions of interest when forwards optic flow was compared with static non-flow in a typical infantat 4 months (a) and 12 months (b). VClL, PM, VCvM, and VClR represent visual areas of interest. Increased spectral amplitude(induced synchronized activity) is shown as red coloured contours with decreased spectral amplitude (induced desynchronizedactivity) shown as blue coloured contours. Induced theta-band desynchronized activities are observed in almost all the visualareas of interest at both 4 and 12 months in (a) and (b). Synchronization, on the other hand, particularly in the alpha-band frequency,can be observed in two or more visual areas but only at 12 months (b). Similar TSEs were observed when reversed optic flowand random motion were compared with the static control condition. Epoch is from �200 ms to 800 ms, baseline at �100 to 0 ms,and stimulus onset is indicated with a vertical red line at 0 ms.
© 2014 John Wiley & Sons Ltd
Structured optic flow and motion perception 9
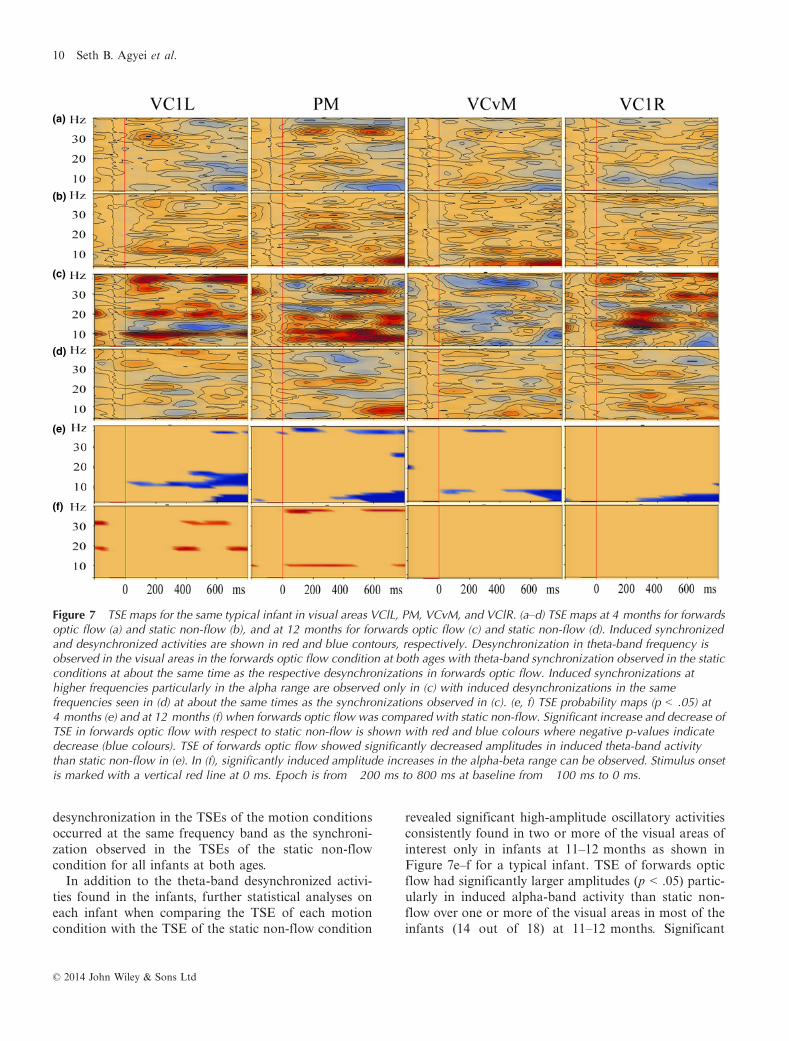
desynchronization in the TSEs of the motion conditionsoccurred at the same frequency band as the synchroni-zation observed in the TSEs of the static non-flowcondition for all infants at both ages.In addition to the theta-band desynchronized activi-
ties found in the infants, further statistical analyses oneach infant when comparing the TSE of each motioncondition with the TSE of the static non-flow condition
revealed significant high-amplitude oscillatory activitiesconsistently found in two or more of the visual areas ofinterest only in infants at 11–12 months as shown inFigure 7e–f for a typical infant. TSE of forwards opticflow had significantly larger amplitudes (p < .05) partic-ularly in induced alpha-band activity than static non-flow over one or more of the visual areas in most of theinfants (14 out of 18) at 11–12 months. Significant
(a)
(b)
(c)
(d)
(e)
(f)
Figure 7 TSE maps for the same typical infant in visual areas VClL, PM, VCvM, and VClR. (a–d) TSE maps at 4 months for forwardsoptic flow (a) and static non-flow (b), and at 12 months for forwards optic flow (c) and static non-flow (d). Induced synchronizedand desynchronized activities are shown in red and blue contours, respectively. Desynchronization in theta-band frequency isobserved in the visual areas in the forwards optic flow condition at both ages with theta-band synchronization observed in the staticconditions at about the same time as the respective desynchronizations in forwards optic flow. Induced synchronizations athigher frequencies particularly in the alpha range are observed only in (c) with induced desynchronizations in the samefrequencies seen in (d) at about the same times as the synchronizations observed in (c). (e, f) TSE probability maps (p < .05) at4 months (e) and at 12 months (f) when forwards optic flow was compared with static non-flow. Significant increase and decrease ofTSE in forwards optic flow with respect to static non-flow is shown with red and blue colours where negative p-values indicatedecrease (blue colours). TSE of forwards optic flow showed significantly decreased amplitudes in induced theta-band activitythan static non-flow in (e). In (f), significantly induced amplitude increases in the alpha-beta range can be observed. Stimulus onsetis marked with a vertical red line at 0 ms. Epoch is from �200 ms to 800 ms at baseline from �100 ms to 0 ms.
© 2014 John Wiley & Sons Ltd
10 Seth B. Agyei et al.
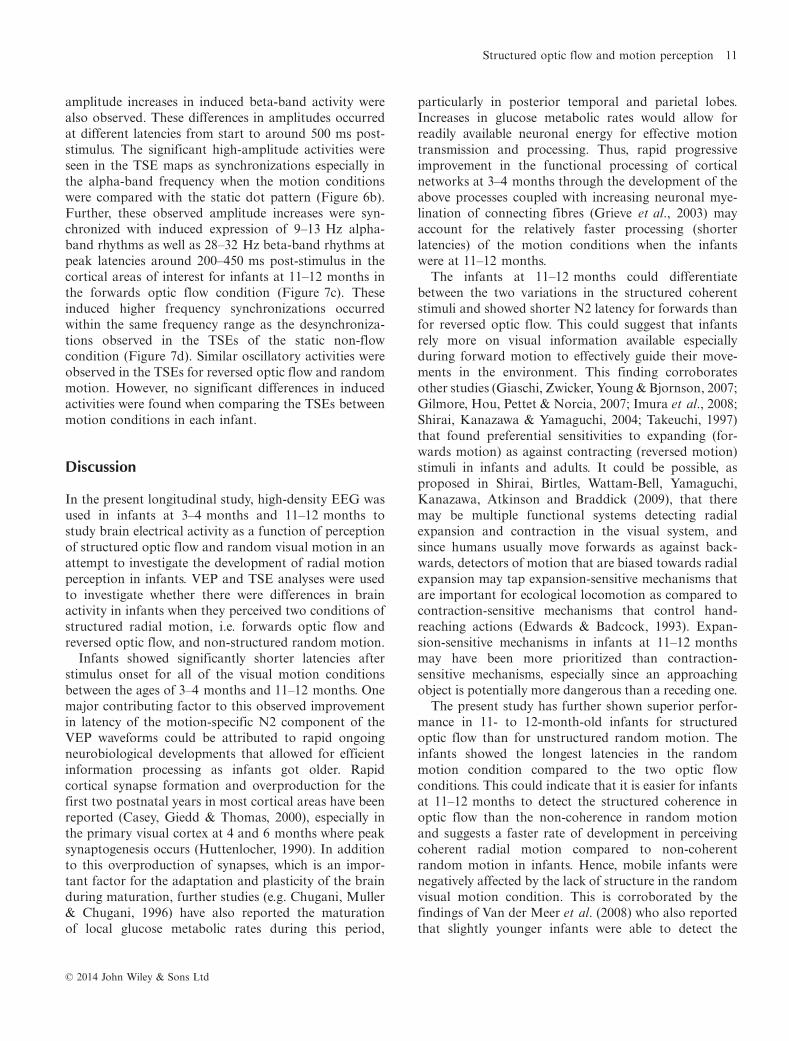
amplitude increases in induced beta-band activity werealso observed. These differences in amplitudes occurredat different latencies from start to around 500 ms post-stimulus. The significant high-amplitude activities wereseen in the TSE maps as synchronizations especially inthe alpha-band frequency when the motion conditionswere compared with the static dot pattern (Figure 6b).Further, these observed amplitude increases were syn-chronized with induced expression of 9–13 Hz alpha-band rhythms as well as 28–32 Hz beta-band rhythms atpeak latencies around 200–450 ms post-stimulus in thecortical areas of interest for infants at 11–12 months inthe forwards optic flow condition (Figure 7c). Theseinduced higher frequency synchronizations occurredwithin the same frequency range as the desynchroniza-tions observed in the TSEs of the static non-flowcondition (Figure 7d). Similar oscillatory activities wereobserved in the TSEs for reversed optic flow and randommotion. However, no significant differences in inducedactivities were found when comparing the TSEs betweenmotion conditions in each infant.
Discussion
In the present longitudinal study, high-density EEG wasused in infants at 3–4 months and 11–12 months tostudy brain electrical activity as a function of perceptionof structured optic flow and random visual motion in anattempt to investigate the development of radial motionperception in infants. VEP and TSE analyses were usedto investigate whether there were differences in brainactivity in infants when they perceived two conditions ofstructured radial motion, i.e. forwards optic flow andreversed optic flow, and non-structured random motion.
Infants showed significantly shorter latencies afterstimulus onset for all of the visual motion conditionsbetween the ages of 3–4 months and 11–12 months. Onemajor contributing factor to this observed improvementin latency of the motion-specific N2 component of theVEP waveforms could be attributed to rapid ongoingneurobiological developments that allowed for efficientinformation processing as infants got older. Rapidcortical synapse formation and overproduction for thefirst two postnatal years in most cortical areas have beenreported (Casey, Giedd & Thomas, 2000), especially inthe primary visual cortex at 4 and 6 months where peaksynaptogenesis occurs (Huttenlocher, 1990). In additionto this overproduction of synapses, which is an impor-tant factor for the adaptation and plasticity of the brainduring maturation, further studies (e.g. Chugani, Muller& Chugani, 1996) have also reported the maturationof local glucose metabolic rates during this period,
particularly in posterior temporal and parietal lobes.Increases in glucose metabolic rates would allow forreadily available neuronal energy for effective motiontransmission and processing. Thus, rapid progressiveimprovement in the functional processing of corticalnetworks at 3–4 months through the development of theabove processes coupled with increasing neuronal mye-lination of connecting fibres (Grieve et al., 2003) mayaccount for the relatively faster processing (shorterlatencies) of the motion conditions when the infantswere at 11–12 months.
The infants at 11–12 months could differentiatebetween the two variations in the structured coherentstimuli and showed shorter N2 latency for forwards thanfor reversed optic flow. This could suggest that infantsrely more on visual information available especiallyduring forward motion to effectively guide their move-ments in the environment. This finding corroboratesother studies (Giaschi, Zwicker, Young & Bjornson, 2007;Gilmore, Hou, Pettet & Norcia, 2007; Imura et al., 2008;Shirai, Kanazawa & Yamaguchi, 2004; Takeuchi, 1997)that found preferential sensitivities to expanding (for-wards motion) as against contracting (reversed motion)stimuli in infants and adults. It could be possible, asproposed in Shirai, Birtles, Wattam-Bell, Yamaguchi,Kanazawa, Atkinson and Braddick (2009), that theremay be multiple functional systems detecting radialexpansion and contraction in the visual system, andsince humans usually move forwards as against back-wards, detectors of motion that are biased towards radialexpansion may tap expansion-sensitive mechanisms thatare important for ecological locomotion as compared tocontraction-sensitive mechanisms that control hand-reaching actions (Edwards & Badcock, 1993). Expan-sion-sensitive mechanisms in infants at 11–12 monthsmay have been more prioritized than contraction-sensitive mechanisms, especially since an approachingobject is potentially more dangerous than a receding one.
The present study has further shown superior perfor-mance in 11- to 12-month-old infants for structuredoptic flow than for unstructured random motion. Theinfants showed the longest latencies in the randommotion condition compared to the two optic flowconditions. This could indicate that it is easier for infantsat 11–12 months to detect the structured coherence inoptic flow than the non-coherence in random motionand suggests a faster rate of development in perceivingcoherent radial motion compared to non-coherentrandom motion in infants. Hence, mobile infants werenegatively affected by the lack of structure in the randomvisual motion condition. This is corroborated by thefindings of Van der Meer et al. (2008) who also reportedthat slightly younger infants were able to detect the
© 2014 John Wiley & Sons Ltd
Structured optic flow and motion perception 11

coherence in structured optic flow faster than the non-coherence in random motion. They did, however, reportslightly shorter latencies (200 ms) in their optic flowcondition in infants at 8 months compared to thatreported in this study (273 ms) in the forwards optic flowcondition for the older infants which could be attributedto subtle differences in experimental conditions used ineach study. In the present study, dots were uniformlypresented as a more realistic 3D simulation of optic flowmotion instead of a simple 2D structure as in Van derMeer et al. (2008), with a further introduction of anadditional reversed optic flow condition. In line withShirai et al. (2009), it is possible that transitions betweentwo motion conditions presented compared to three,coupled with the different properties of the dot particles,could have made the stimuli used in this study morecomplex in structure, which in turn could explain thelonger latencies observed in the older infants.The relatively faster detection of optic flow compared
to random motion could further reflect the generalimportance of optic flow for effective self-navigation ininfancy (cf. Warren, Kay, Zosh, Duchon & Sahuc, 2001),particularly since these infants were at a developmentalstage where they had started using visual environmentalcues for active self-motion. Numerous studies havelinked locomotor experience to how animals perceiveand act on visual information about spatial relationsincluding aspects of optic flow (Adolph, 1997; Anderson,Campos, Anderson, Thomas, Witherington, Uchiyama& Barbu-Roth, 2001; Berger & Adolph, 2007;Bertenthal, Rose & Bai, 1997). Gilmore and Rettke(2003) found that infants at 4 months are not able togenerate substantial amounts of optic flow by means oftheir own self-movements and they show relatively pooroptic flow sensitivities until they begin to sit erect orcrawl. Since infants’ sensitivity to optic flow is signifi-cantly increased when they start crawling (Andersonet al., 2001), it has been suggested that the functionaldetection of optic flow develops hand in hand with self-produced locomotion (Van der Meer et al., 2008). In thepresent study, we estimated infants’ locomotion experi-ence from parental records and our observation of theinfants before experimental sessions. Here, infants werefirst tested at a pre-locomotor stage at 3–4 months whenthey had not begun crawling. Even though they weretested before the onset of crawling, they had nonethelessexperienced some form of locomotion, although not bytheir own self-movement but passively as they were beingcarried around and observed relative movementsbetween objects. In a recent fMRI study, however, Jamesand Swain (2011) found that only self-generated actionsresult in a stronger link between perception and action inthe developing brain, with Schwarzer, Freitag and
Schum (2013) further showing that infants with crawlingexperience and the ability to manually explore objects inthe environment are better able to generalize the habit-uation images of the same objects in a new orientationcompared to non-crawlers. Thus, even though the infantsat 3–4 months already had some experience with passivelocomotion, they were not able to distinguish betweenthe different patterns of the radial motions until11–12 months when they had gained experience withself-generated movements through crawling. All theinfants at 11–12 months had between 1 and 4 monthsof crawling experience, with five of them being able towalk for at least 3 weeks prior to testing. It is possiblethat experience with active locomotion through self-movements in contrast to passive experience may haveled to a relatively faster recruitment and activation ofneuronal networks responsible for motion recognition inthe older infants.High activation values were recorded for infants at
both 3–4 and 11–12 months. This could be a result ofinfants’ relatively thinner skulls (Grieve et al., 2003),which would allow less impedance in measuring corticalelectrical activity. However, since amplitude of oscilla-tions is suggested to be proportional to the numberof synchronously active neural elements (Elul, 1971;Pfurtscheller & Lopes da Silva, 1999), the large ampli-tudes could further suggest a generally large activationand less specialization of cortical areas when processingmotion stimuli in infants.Differences in induced activities at 3–4 months and 11–
12 months when perceiving visual motion were alsoinvestigated. When the TSE of the motion conditions(forwards optic flow, reversed optic flow, and randommotion) were each compared with the control condition(static non-flow), it was found that infants at 3–4 and 11–12 months showed low-amplitude values in the 5–7 Hztheta range over the visual areas of interest. These wereobserved as desynchronizations in the TSE plots. How-ever, when the infants were 11–12 months, high-ampli-tude values especially in the 9–13 Hz alpha range werefurther observed in the same visual areas which wererepresented in the TSE plots as synchronizations.Some studies (e.g. Pfurtscheller et al., 1994) have
found EEG in infants to be dominated by low-frequencyactivity of large amplitudes, an observation that has beenlargely attributed to general signs of immaturity ininfancy (see also Carmeli et al., 2005; Orekhova et al.,2006; Thierry, 2005). It was therefore not surprising thatdominance of induced change in theta-band frequency inthe TSEs of the motion and static conditions wasobserved. However, the more prevalent theta-banddesynchronization observed in the younger infantscompared to that in the older infants could suggest the
© 2014 John Wiley & Sons Ltd
12 Seth B. Agyei et al.
involvement of relatively larger neural networks or morecell assemblies when processing radial motion informa-tion at 3–4 months, a notion that is corroborated byprevious pioneering studies (Pfurtscheller & Lopes daSilva, 1999; Pfurtscheller et al., 1994). Given that recentstudies in adults (e.g. Khader et al., 2010) have foundtheta oscillations to modulate successful encoding oflong-term memory, it is possible that the observed hightheta-band activity in the infants could further reflectongoing rapid cortical synapse formation especially asthe infant brain is optimal for synaptic plasticity (Caseyet al., 2000; Stroganova & Orekhova, 2007).
Amplitude of oscillation has been found to beproportional to the number of neurons firing in syn-chrony, and thus slowly oscillating cell assemblies wouldgenerally comprise more neurons than fast oscillatingcell assemblies (Elul, 1971; Pfurtscheller & Klimesch,1992; Pfurtscheller & Lopes da Silva, 1999; Singer, 1993).Therefore, the slower oscillating 5–7 Hz theta-bandfrequency found in the infants as against the emergenceof the faster oscillating 9–13 Hz alpha-band frequencyfound only when they were 11–12 months old, couldindicate a gradual progression from less specialized andrelatively immature larger oscillatory cell assemblies to amore adult-like mature pattern of specialization inprocessing motion where cell assemblies have fewer butmore specialized neurons. This progression becomes evenmore apparent as some adult studies have found betaoscillatory activity to be a general property of distributedneural circuits underlying motion processing (Carmeliet al., 2005; Van der Meer et al., 2008), while otherstudies also report an increased gamma-band power inthe visual cortex (Hoogenboom et al., 2006; Krishnan,Skosnik, Vohs, Busey & O’Donnell, 2005; Singer, 1993),particularly since oscillations in the faster gamma-bandfrequency appear to be a more appropriate and effectiveway of establishing rapid coupling between cell assem-blies that are spatially separated (Singer, 1993).
While induced theta-band desynchronization wasobserved in the TSEs for the motion conditions in theinfants, induced theta-band synchronization was ratherobserved in the TSEs of the static condition. Neuronalcell assemblies therefore fired in synchrony under theperception of the static dot pattern but this synchronizedactivity was suppressed when the infants perceived theradial motion conditions. Desynchronization in thetheta-band frequency could therefore be an oscillatorymechanism for communication between underliningcortical networks when processing radial motion ininfancy. Further, Pfurtscheller et al. (1994) have sug-gested increased task complexity as a contributingfactor to the enhancement of theta desynchronization.The observed oscillatory differences when the infants
perceived the static dot pattern compared to the radialmotions could therefore be due to the differences incomplexities of the stimuli since task complexity in thisstudy increased from the relatively simple static non-flowcondition to the more complex radial motion conditions.
However, since amplitude enhancement in an ERS isbased on the cooperative or synchronized behaviour of alarge number of neurons (Pfurtscheller & Lopes da Silva,1999; Pfurtscheller et al., 1996), at 11–12 months the9–13 Hz synchronized activity observed in the TSEswhen the infants perceived radial motion could beattributed to synchronized behaviour of large corticalneuronal networks that were activated when perceivingradial motion, but not the static dot pattern which ratherelicited desynchronized activity within the same fre-quency band. Further, the synchronized alpha-bandoscillatory activities observed in the older infants cou-pled with the synchronized activities at higher frequen-cies (28–32 Hz) particularly in the parietal midline (e.g.in Figure 7c) could suggest the involvement of subsets ofactivated cortical areas when processing radial motion,implying the use of higher cortical structures in theglobal perception of motion. Thus, as infants grow older,it may be possible that a progressive shift in corticalcoupling occurs such that a slower theta-band desyn-chronized network communication gradually makes wayfor a much faster and effective cortical coupling usingsynchronized high-frequency oscillations particularly inthe alpha-band range when processing radial motions.
In conclusion, the present longitudinal study hasdemonstrated the development of radial motion sensi-tivities from infants at 3–4 months to 11–12 months.Differences in brain activity as observed in VEPs andTSEs were presented. The findings showed that thefunctional discrimination between different radialmotion patterns in infancy becomes more prominenttowards the end of the first year of life when infantsdetect forwards optic flow more efficiently than reversedoptic flow or random visual motion. In addition, whencomparing the TSE of forwards optic flow, reversedoptic flow, and random motion with the TSE of staticnon-flow, infants showed desynchronization in 5–7 Hztheta-band frequency, with synchronization around9–13 Hz alpha-band frequency further observed onlywhen they were 11–12 months. The observed differenceshave been attributed partly to experience with activelocomotion coupled with neurodevelopmental changes.
Acknowledgements
The authors would like to thank Broen van Besien andEirik Paulsen for programming the visual stimuli, and
© 2014 John Wiley & Sons Ltd
Structured optic flow and motion perception 13
are grateful to the infants and their parents who tookpart in the study. They also thank Noemie Taer and LisaSoltvedt for their help with testing.
References
Adolph, K.E. (1997). Learning in the development of infantlocomotion. Monographs of the Society for Research in ChildDevelopment, 62 (3, Serial No. 251).
Anderson, D.I., Campos, J.J., Anderson, D.E., Thomas, T.D.,Witherington, D.C., Uchiyama, I., & Barbu-Roth, M.A.(2001). The flip side of perception–action coupling: locomo-tor experience and the ontogeny of visual–postural coupling.Human Movement Science, 20, 461–487.
Auranen, T. (2002). Nonparametric statistical analysis oftime-frequency representation of magnetoencephalographicdata. Unpublished Master’s Thesis, Helsinki University ofTechnology, Espoo, Finland.
Bartels, A., Zeki, S., & Logothetis, N.K. (2008). Natural visionreveals regional specialization to local motion and tocontrast-invariant, global flow in the human brain. CerebralCortex, 18, 705–717.
Basar, E., Basar-Eroglu, C., Karakas, S., & Schurmann, M.(1999). Oscillatory brain theory: a new trend in neuroscience.IEEE Engineering in Medicine and Biology Magazine, 18,56–66.
Berg, P., & Scherg, M. (1991). Dipole modelling of eye activityand its application to the removal of eye artefacts from theEEG and MEG. Clinical Physics and Physiological Measure-ment, 12 (Suppl. A), 49–54.
Berg, P., & Scherg, M. (1994). A multiple source approach tothe correction of eye artifacts. Electroencephalography andClinical Neurophysiology, 90, 229–241.
Berger, S.E., & Adolph, K.E. (2007). Learning and develop-ment in infant locomotion. Progress in Brain Research, 164,237–255.
Bertenthal, B.I., Rose, J.L., & Bai, D.L. (1997). Perception–action coupling in the development of visual control ofposture. Journal of Experimental Psychology: Human Per-ception and Performance, 23, 1631–1643.
Braddick, O., & Atkinson, J. (2011). Development of humanvisual function. Vision Research, 189, 95–111.
Budai, R., Contento, G., Locatelli, T., & Comi, G. (1995).Non-invasive multielectrode array for high resolution sam-pling of scalp-recorded potential fields. Journal of MedicalEngineering and Technology, 19, 52–56.
Bullmore, E.T., Suckling, J., Overmeyer, S., Rabe-Hesketh, S.,Taylor, E., & Brammer, M.J. (1999). Global, voxel, andcluster tests, by theory and permutation, for a differencebetween two groups of structural MR images of the brain.IEEE Transactions on Medical Imaging, 18, 32–42.
Carmeli, C., Knyazeva, M.G., Innocenti, G.M., & De Feo, O.(2005). Assessment of EEG synchronization based onstate-space analysis. NeuroImage, 25, 339–354.
Casey, B.J., Giedd, J.N., & Thomas, K.M. (2000). Struc-tural and functional brain development and its relation
to cognitive development. Biological Psychology, 54,241–257.
Chugani, H.T., Muller, R.A., & Chugani, D.C. (1996). Func-tional brain reorganization in children. Brain and Develop-ment, 18, 347–356.
Dubowitz, L.M., Mushin, J., De Vries, L., & Arden, G.B.(1986). Visual function in the newborn infant: is it corticallymediated? Lancet, 1, 1139–1141.
Duffy, C.J., & Wurtz, R.H. (1991). Sensitivity of MST neuronsto optic flow stimuli. II. Mechanisms of response selectivityrevealed by small-field stimuli. Journal of Neurophysiology,65, 1346–1359.
Dukelow, S.P., DeSouza, J.F., Culham, J.C., van den Berg, A.V.,Menon, R.S., & Vilis, T. (2001). Distinguishing subregions ofthe human MT+ complex using visual fields and pursuit eyemovements. Journal of Neurophysiology, 86, 1991–2000.
Edwards, M., & Badcock, D.R. (1993). Asymmetries in thesensitivity to motion in depth: a centripetal bias. Perception,22, 1013–1023.
Elul, R. (1971). The genesis of the EEG. International Review ofNeurobiology, 15, 227–272.
Ernst, M.D. (2004). Permutation methods: a basis for exactinference. Statistical Science, 19, 676–685.
Ferree, T.C., Luu, P., Russell, G.S., & Tucker, D.M. (2001).Scalp electrode impedance, infection risk, and EEG dataquality. Clinical Neurophysiology, 112, 536–544.
Fujioka, T., Mourad, N., He, C., & Trainor, L.J. (2011).Comparison of artifact correction methods for infant EEGapplied to extraction of event-related potential signals.Clinical Neurophysiology, 122, 43–51.
Fukushima, K. (2008). Extraction of visual motion and opticflow. Neural Networks, 21, 774–785.
Giaschi, D., Zwicker, A., Young, S.A., & Bjornson, B. (2007).The role of cortical area V5/MT+ in speed-tuned directionalanisotropies in global motion perception. Vision Research,47, 887–898.
Gibson, J.J. (1979). The ecological approach to visual perception.Hillsdale, NJ: Lawrence Erlbaum Associates.
Gilmore, R.O., Baker, T.J., & Grobman, K.H. (2004). Stabilityin young infants’ discrimination of optic flow. DevelopmentalPsychology, 40, 259–270.
Gilmore, R.O., Hou, C., Pettet, M.W., & Norcia, A.M. (2007).Development of cortical responses to optic flow. VisualNeuroscience, 24, 845–856.
Gilmore, R.O., & Rettke, H.J. (2003). Four-month-olds’discrimination of optic flow patterns depicting differentdirections of observer motion. Infancy, 4, 177–200.
Graziano, M.S., Andersen, R.A., & Snowden, R.J. (1994).Tuning of MST neurons to spiral motions. Journal ofNeuroscience, 14, 54–67.
Grieve, P.G., Emerson, R.G., Fifer, W.P., Isler, J.R., & Stark,R.I. (2003). Spatial correlation of the infant and adultelectroencephalogram. Clinical Neurophysiology, 114,1594–1608.
Heinrich, S.P., Renkl, A.E., & Bach, M. (2005). Patternspecificity of human visual motion processing. VisionResearch, 45, 2137–2143.
© 2014 John Wiley & Sons Ltd
14 Seth B. Agyei et al.
Higgins, C.I., Campos, J.J., & Kermoian, R. (1996). Effect ofself-produced locomotion on infant postural compensationto optic flow. Developmental Psychology, 32, 836–841.
Hoechstetter, K., Bornfleth, H., Weckesser, D., Ille, N., Berg, P.,& Scherg, M. (2004). BESA source coherence: a new methodto study cortical oscillatory coupling. Brain Topography, 16,233–238.
Hoogenboom, N., Schoffelen, J.M., Oostenveld, R., Parkes,L.M., & Fries, P. (2006). Localizing human visual gamma--band activity in frequency, time and space. NeuroImage, 29,764–773.
Hudspeth, W.J., & Pribram, K.H. (1992). Psychophysiologicalindices of cerebral maturation. International Journal ofPsychophysiology, 12, 19–29.
Huttenlocher, P.R. (1990). Morphometric study of humancerebral cortex development. Neuropsychologia, 28, 517–527.
Ille, N., Berg, P., & Scherg, M. (2002). Artifact correction of theongoing EEG using spatial filters based on artifact and brainsignal topographies. Journal of Clinical Neurophysiology, 19,113–124.
Imura, T., Shirai, N., Tomonaga,M., Yamaguchi,M.K., &Yagi,A. (2008). Asymmetry in the perception of motion in depthinduced by moving cast shadows. Journal of Vision, 8 (13), 10.
James, K.H., & Swain, S.N. (2011). Only self-generated actionscreate sensori-motor systems in the developing brain. Devel-opmental Science, 14, 673–678.
Johnson, M.H. (2000). Functional brain development ininfants: elements of an interactive specialization framework.Child Development, 71, 75–81.
Kayed, N.S., & Van der Meer, A. (2000). Timing strategies usedin defensive blinking to optical collisions in 5- to 7-month-old infants. Infant Behavior and Development, 23, 253–270.
Kayed, N.S., & Van der Meer, A. (2007). Infants’ timingstrategies to optical collisions: a longitudinal study. InfantBehavior and Development, 30, 50–59.
Khader, P.H., Jost, K., Ranganath, C., & Rosler, F. (2010).Theta and alpha oscillations during working-memory main-tenance predict successful long-term memory encoding.Neuroscience Letters, 468, 339–343.
Klimesch, W., Doppelmayr, M., Russegger, H., & Pachinger, T.(1996). Theta band power in the human scalp EEG and theencoding of new information. NeuroReport, 7, 1235–1240.
Krishnan, G.P., Skosnik, P.D., Vohs, J.L., Busey, T.A., &O’Donnell, B.F. (2005). Relationship between steady-stateand induced gamma activity to motion. NeuroReport, 16,625–630.
Lappe, M., Bremmer, F., & Van den Berg, A.V. (1999).Perception of self-motion from visual flow. Trends inCognitive Sciences, 3, 329–336.
Maris, E., & Oostenveld, R. (2007). Nonparametric statisticaltesting of EEG- and MEG-data. Journal of NeuroscienceMethods, 164, 177–190.
Marshall, P.J., Bar-Haim, Y., & Fox, N.A. (2002). Developmentof the EEG from 5 months to 4 years of age. ClinicalNeurophysiology, 113, 1199–1208.
Nelson, C.A., Bloom, F.E., Cameron, J.L., Amaral, D., Dahl,R.E., & Pine, D. (2002). An integrative, multidisciplinary
approach to the study of brain–behavior relations in thecontext of typical and atypical development. Developmentand Psychopathology, 14, 499–520.
Orekhova, E.V., Stroganova, T.A., Posikera, I.N., & Elam, M.(2006). EEG theta rhythm in infants and preschool children.Clinical Neurophysiology, 117, 1047–1062.
Perrin, F., Pernier, J., Bertrand, O., & Echallier, J.F. (1989).Spherical splines for scalp potential and current densitymapping. Electroencephalography and Clinical Neurophysiol-ogy, 72, 184–187.
Pfurtscheller, G., & Klimesch, W. (1992). Functional topogra-phy during a visuoverbal judgment task studied withevent-related desynchronization mapping. Journal of ClinicalNeurophysiology, 9, 120–131.
Pfurtscheller, G., & Lopes da Silva, F.H. (1999). Event-relatedEEG/MEG synchronization and desynchronization: basicprinciples. Clinical Neurophysiology, 110, 1842–1857.
Pfurtscheller, G., Neuper, C., & Mohl, W. (1994). Event-relateddesynchronization (ERD) during visual processing. Interna-tional Journal of Psychophysiology, 16, 147–153.
Pfurtscheller, G., Stancak, A. Jr, & Neuper, C. (1996).Event-related synchronization (ERS) in the alpha band –an electrophysiological correlate of cortical idling: a review.International Journal of Psychophysiology, 24, 39–46.
Picton, T.W., Bentin, S., Berg, P., Donchin, E., Hillyard, S.A.,Johnson, R. Jr, Miller, G.A., Ritter, W., Ruchkin, D.S., Rugg,M.D., & Taylor, M.J. (2000). Guidelines for using humanevent-related potentials to study cognition: recordingstandards and publication criteria. Psychophysiology, 37,127–152.
Probst, T., Plendl, H., Paulus, W., Wist, E.R., & Scherg, M.(1993). Identification of the visual motion area (area V5) inthe human brain by dipole source analysis. ExperimentalBrain Research, 93, 345–351.
Rosander, K., Nystrom, P., Gredeback, G., & Von Hofsten, C.(2007). Cortical processing of visual motion in young infants.Vision Research, 47, 1614–1623.
Saby, J.N., & Marshall, P.J. (2012). The utility of EEG bandpower analysis in the study of infancy and early childhood.Developmental Neuropsychology, 37, 253–273.
Sack, A.T., Kohler, A., Linden, D.E., Goebel, R., & Muckli, L.(2006). The temporal characteristics of motion processing inhMT/V5 + : combining fMRI and neuronavigated TMS.NeuroImage, 29, 1326–1335.
Saito, H., Yukie, M., Tanaka, K., Hikosaka, K., Fukada, Y., &Iwai, E. (1986). Integration of direction signals of imagemotion in the superior temporal sulcus of the macaquemonkey. Journal of Neuroscience, 6, 145–157.
Sakkalis, V., Tsiaras, V., Michalopoulos, K., & Zervakis, M.(2008). Assessment of neural dynamic coupling and causalinteractions between independent EEG components fromcognitive tasks using linear and nonlinear methods. Confer-ence Proceedings – IEEE Engineering in Medicine andBiology Society, 2008, 3767–3770.
Scherg, M., & Berg, P. (1991). Use of prior knowledge in brainelectromagnetic source analysis. Brain Topography, 4,143–150.
© 2014 John Wiley & Sons Ltd
Structured optic flow and motion perception 15

Schmuckler, M.A. (1997). Children’s postural sway in responseto low- and high-frequency visual information for oscillation.Journal of Experimental Psychology: Human Perception andPerformance, 23, 528–545.
Schwarzer, G., Freitag, C., & Schum, N. (2013). How crawlingand manual object exploration are related to the mentalrotation abilities of 9-month-old infants. Frontiers in Psy-chology, 4, 97.
Shirai, N., Birtles, D., Wattam-Bell, J., Yamaguchi, M.K.,Kanazawa, S., Atkinson, J., & Braddick, O. (2009).Asymmetrical cortical processing of radial expansion/con-traction in infants and adults. Developmental Science, 12,946–955.
Shirai, N., Kanazawa, S., & Yamaguchi, M.K. (2004). Asym-metry for the perception of expansion/contraction in infancy.Infant Behavior and Development, 27, 315–322.
Simes, R.J. (1986). An improved Bonferroni procedure formultiple tests of significance. Biometrika, 73, 751–754.
Singer, W. (1993). Synchronization of cortical activity and itsputative role in information processing and learning. AnnualReview of Physiology, 55, 349–374.
Stevens, L.K., McGraw, P.V., Ledgeway, T., & Schluppeck, D.(2009). Temporal characteristics of global motion processingrevealed by transcranial magnetic stimulation. EuropeanJournal of Neuroscience, 30, 2415–2426.
Stroganova, T.A., & Orekhova, E.V. (2007). EEG and infantstates. In M.D. Hann (Ed.), Infant EEG and event-relatedpotentials (pp. 251–287). New York: Psychology Press.
Stroganova, T.A., Orekhova, E.V., & Posikera, I.N. (1999).EEG alpha rhythm in infants. Clinical Neurophysiology, 110,997–1012.
Takeuchi, T. (1997). Visual search of expansion and contrac-tion. Vision Research, 37, 2083–2090.
Thierry, G. (2005). The use of event-related potentials in thestudy of early cognitive development. Infant and ChildDevelopment, 14, 85–94.
Tohyama, K., & Fukushima, K. (2005). Neural network modelfor extracting optic flow. Neural Networks, 18, 549–556.
Tucker, D.M. (1993). Spatial sampling of head electrical fields:the geodesic sensor net. Electroencephalography and ClinicalNeurophysiology, 87, 154–163.
Tucker, D.M., Liotti, M., Potts, G.F., Russell, G.S., & Posner,M.I. (1994). Spatiotemporal analysis of brain electrical fields.Human Brain Mapping, 1, 134–152.
Vaina, L.M., & Rushton, S.K. (2000). What neurologicalpatients tell us about the use of optic flow. InternationalReview of Neurobiology, 44, 293–313.
Van der Meer, A.L., Fallet, G., & Van der Weel, F.R. (2008).Perception of structured optic flow and random visualmotion in infants and adults: a high-density EEG study.Experimental Brain Research, 186, 493–502.
Van der Meer, A.L., Svantesson, M., & Van der Weel, F.R.(2012). Longitudinal study of looming in infants withhigh-density EEG. Developmental Neuroscience, 34, 488–501.
Van der Weel, F.R., & Van der Meer, A.L. (2009). Seeing itcoming: infants’ brain responses to looming danger. Natur-wissenschaften, 96, 1385–1391.
Von Hofsten, C., & Rosander, K. (1996). The development ofgaze control and predictive tracking in young infants. VisionResearch, 36, 81–96.
Warren, W.H. Jr, Kay, B.A., Zosh, W.D., Duchon, A.P., &Sahuc, S. (2001). Optic flow is used to control humanwalking. Nature Neuroscience, 4, 213–216.
Wattam-Bell, J. (1996). Visual motion processing in one-mont-h-old infants: preferential looking experiments. VisionResearch, 36, 1671–1677.
Whittingstall, K., Bartels, A., Singh, V., Kwon, S., & Logothe-tis, N.K. (2010). Integration of EEG source imaging andfMRI during continuous viewing of natural movies. Mag-netic Resonance Imaging, 28, 1135–1142.
Zanotelli, T., Santos Filho, S.A., & Tierra-Criollo, C.J. (2010).Optimum principal components for spatial filtering of EEGto detect imaginary movement by coherence. ConferenceProceedings – IEEE Engineering in Medicine and BiologySociety, 2010, 3646–3649.
Zeki, S., Watson, J.D., Lueck, C.J., Friston, K.J., Kennard, C.,& Frackowiak, R.S. (1991). A direct demonstration offunctional specialization in human visual cortex. Journal ofNeuroscience, 11, 641–649.
Received: 11 November 2013Accepted: 13 May 2014
© 2014 John Wiley & Sons Ltd
16 Seth B. Agyei et al.