Supporting the social uses of television: sociability heuristics for social tv
Upload
independentCategory
view
1download
0
B R A I N R E S E A R C H 1 4 5 5 ( 2 0 1 2 ) 5 6 – 6 7
Ava i l ab l e on l i ne a t www.sc i enced i r ec t . com
www.e l sev i e r . com/ loca te /b ra i n res
Research Report
Longitudinal in-vivo diffusion tensor imaging for assessingbrain developmental changes in BALB/cJ mice, a model ofreduced sociability relevant to autism
Manoj Kumara, Sungheon Kimb, Stephen Pickupa, Rong Chena, Andrew H. Fairlessc,Ranjit Ittyeraha, Ted Abeld, Edward S. Brodkinc, Harish Poptania,⁎aDepartment of Radiology, Perelman School of Medicine at the University of Pennsylvania, B6 Blockley Hall, 423 Guardian Drive, Philadelphia,PA 19104, USAbCenter for Biomedical Imaging, Department of Radiology, New York University School of Medicine, 660 First Avenue, New York, NY, USAcCenter for Neurobiology and Behavior, Department of Psychiatry, Perelman School of Medicine at the University of Pennsylvania, TranslationalResearch Laboratory, 125 South 31st Street, Philadelphia, PA 19104, USAdDepartment of Biology, University of Pennsylvania, 10–133 Translational Research Center, 3400 Civic Center Boulevard, Building 421,Philadelphia, PA 19104, USA
A R T I C L E I N F O
⁎ Corresponding author at: Department of Ra2113, +1 215 662 3283.
E-mail address: [email protected]: ASD, Autism spectrum diso
sion tensor imaging; FA, Fractional anisotropeosin; Hippo, Hippocampus; IC, Internal capsto noise ratio; Th, Thalamus; WM, White ma
0006-8993/$ – see front matter © 2012 Elseviedoi:10.1016/j.brainres.2012.03.041
A B S T R A C T
Article history:Accepted 18 March 2012Available online 25 March 2012
Diffusion tensor imaging (DTI) is highly sensitive in detecting brain structure and con-nectivity phenotypes in autism spectrum disorders (ASD). Since one of the core symptomsof ASD is reduced sociability (reduced tendency to seek social interaction), we hypothesizedthat DTI will be sensitive in detecting neural phenotypes that correlate with decreased so-ciability in mouse models. Relative to C57BL/6J (B6) mice, juvenile BALB/cJ mice show re-duced sociability. We performed social approach test in a three-chambered apparatus andin-vivo longitudinal DTI at post-natal days 30, 50 and 70 days-of-age in BALB/cJ (n=32)and B6 (n=15) mice to assess the correlation between DTI and sociability and to evaluatedifferences in DTI parameters between these two strains. Fractional anisotropy (FA) andmean diffusivity (MD) values from in-vivo DTI data were analyzed from white matter (cor-pus callosum, internal and external capsule) and gray matter (cerebral cortex, frontalmotor cortex, hippocampus, thalamus and amygdaloid) regions based on their relevanceto ASD. A moderate but significant (p<0.05) negative correlation between sociability andFA in hippocampus and frontal motor cortex was noted for BALB/cJ mice at 30 days-of-age. Significant differences in FA and MD values between BALB/cJ and B6 mice were ob-served in most white and gray matter areas at all three time points. Significant differencesin developmental trajectories of FA and MD values from thalamus and frontal motor cortexwere also observed between BALB/cJ and B6, indicating relative under-connectivity in BALB/
Keywords:Autism spectrum disordersMouse modelsDiffusion tensor imagingFractional anisotropyMean diffusivitySocial behavior
diology, B6 Blockley Hall, 423 Guardian Drive, Philadelphia, PA 19104, USA. Fax: +1 215 573
nn.edu (H. Poptani).rders; Amg, Amygdaloid; B6, C57BL/6J; CC, Corpus callosum; Ctx, Cerebral cortex; DTI, Diffu-y; EC, External capsule; FMC, Frontal motor cortex; GM, Gray matter; H&E, Hematoxylin andule; LFB, Luxol fast blue; MD, Mean diffusivity; MRI, Magnetic resonance imaging; SNR, Signaltter
r B.V. All rights reserved.
57B R A I N R E S E A R C H 1 4 5 5 ( 2 0 1 2 ) 5 6 – 6 7
cJ mice. These results indicate that DTI may be used as an in-vivo, non-invasive imagingmethod to assess developmental trajectories of brain connectivity in mouse models of neu-rodevelopmental and behavioral disorders.
© 2012 Elsevier B.V. All rights reserved.
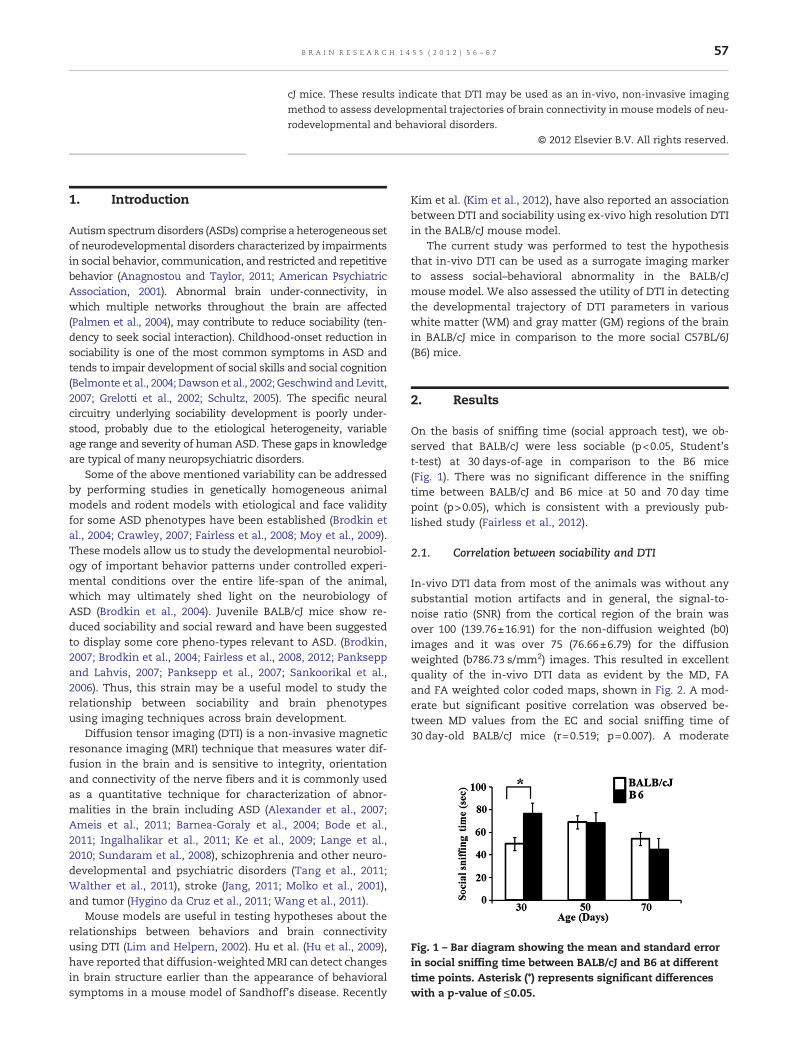
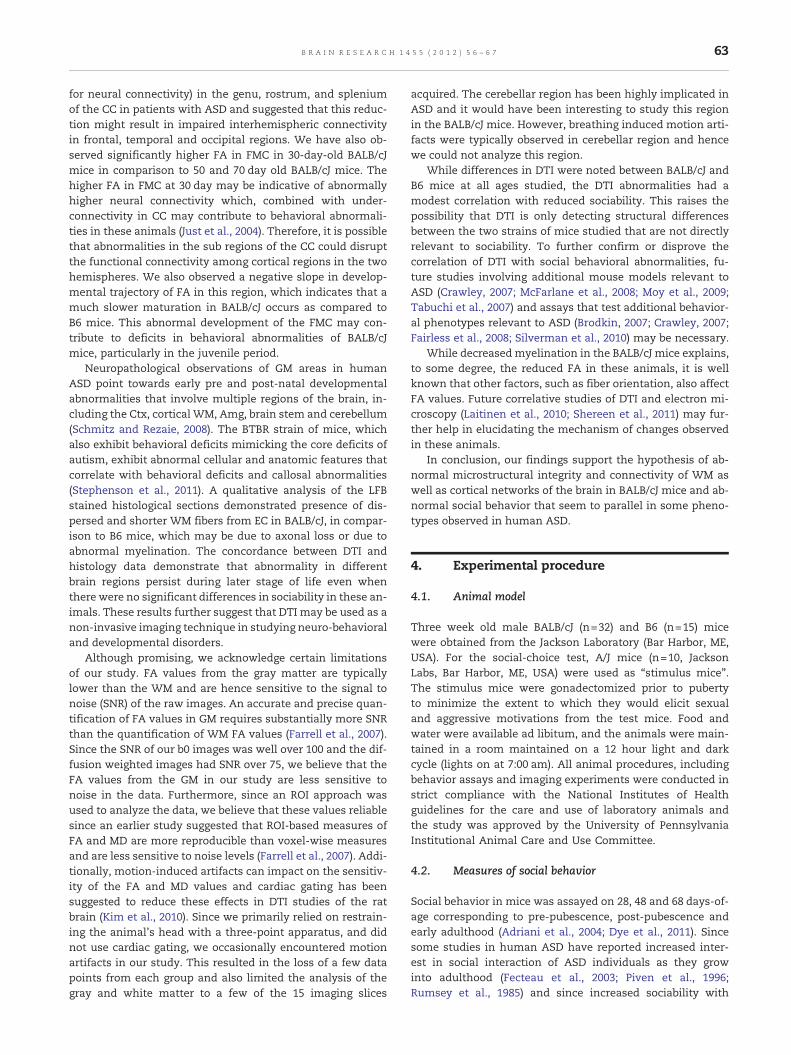
Fig. 1 – Bar diagram showing the mean and standard errorin social sniffing time between BALB/cJ and B6 at differenttime points. Asterisk (*) represents significant differenceswith a p-value of ≤0.05.
1. Introduction
Autismspectrumdisorders (ASDs) comprise a heterogeneous setof neurodevelopmental disorders characterized by impairmentsin social behavior, communication, and restricted and repetitivebehavior (Anagnostou and Taylor, 2011; American PsychiatricAssociation, 2001). Abnormal brain under-connectivity, inwhich multiple networks throughout the brain are affected(Palmen et al., 2004), may contribute to reduce sociability (ten-dency to seek social interaction). Childhood-onset reduction insociability is one of the most common symptoms in ASD andtends to impair development of social skills and social cognition(Belmonte et al., 2004; Dawson et al., 2002; Geschwind and Levitt,2007; Grelotti et al., 2002; Schultz, 2005). The specific neuralcircuitry underlying sociability development is poorly under-stood, probably due to the etiological heterogeneity, variableage range and severity of human ASD. These gaps in knowledgeare typical of many neuropsychiatric disorders.
Some of the above mentioned variability can be addressedby performing studies in genetically homogeneous animalmodels and rodent models with etiological and face validityfor some ASD phenotypes have been established (Brodkin etal., 2004; Crawley, 2007; Fairless et al., 2008; Moy et al., 2009).These models allow us to study the developmental neurobiol-ogy of important behavior patterns under controlled experi-mental conditions over the entire life-span of the animal,which may ultimately shed light on the neurobiology ofASD (Brodkin et al., 2004). Juvenile BALB/cJ mice show re-duced sociability and social reward and have been suggestedto display some core pheno-types relevant to ASD. (Brodkin,2007; Brodkin et al., 2004; Fairless et al., 2008, 2012; Pankseppand Lahvis, 2007; Panksepp et al., 2007; Sankoorikal et al.,2006). Thus, this strain may be a useful model to study therelationship between sociability and brain phenotypesusing imaging techniques across brain development.
Diffusion tensor imaging (DTI) is a non-invasive magneticresonance imaging (MRI) technique that measures water dif-fusion in the brain and is sensitive to integrity, orientationand connectivity of the nerve fibers and it is commonly usedas a quantitative technique for characterization of abnor-malities in the brain including ASD (Alexander et al., 2007;Ameis et al., 2011; Barnea-Goraly et al., 2004; Bode et al.,2011; Ingalhalikar et al., 2011; Ke et al., 2009; Lange et al.,2010; Sundaram et al., 2008), schizophrenia and other neuro-developmental and psychiatric disorders (Tang et al., 2011;Walther et al., 2011), stroke (Jang, 2011; Molko et al., 2001),and tumor (Hygino da Cruz et al., 2011; Wang et al., 2011).
Mouse models are useful in testing hypotheses about therelationships between behaviors and brain connectivityusing DTI (Lim and Helpern, 2002). Hu et al. (Hu et al., 2009),have reported that diffusion-weightedMRI can detect changesin brain structure earlier than the appearance of behavioralsymptoms in a mouse model of Sandhoff's disease. Recently
Kim et al. (Kim et al., 2012), have also reported an associationbetween DTI and sociability using ex-vivo high resolution DTIin the BALB/cJ mouse model.
The current study was performed to test the hypothesisthat in-vivo DTI can be used as a surrogate imaging markerto assess social–behavioral abnormality in the BALB/cJmouse model. We also assessed the utility of DTI in detectingthe developmental trajectory of DTI parameters in variouswhite matter (WM) and gray matter (GM) regions of the brainin BALB/cJ mice in comparison to the more social C57BL/6J(B6) mice.
2. Results
On the basis of sniffing time (social approach test), we ob-served that BALB/cJ were less sociable (p<0.05, Student'st-test) at 30 days-of-age in comparison to the B6 mice(Fig. 1). There was no significant difference in the sniffingtime between BALB/cJ and B6 mice at 50 and 70 day timepoint (p>0.05), which is consistent with a previously pub-lished study (Fairless et al., 2012).
2.1. Correlation between sociability and DTI
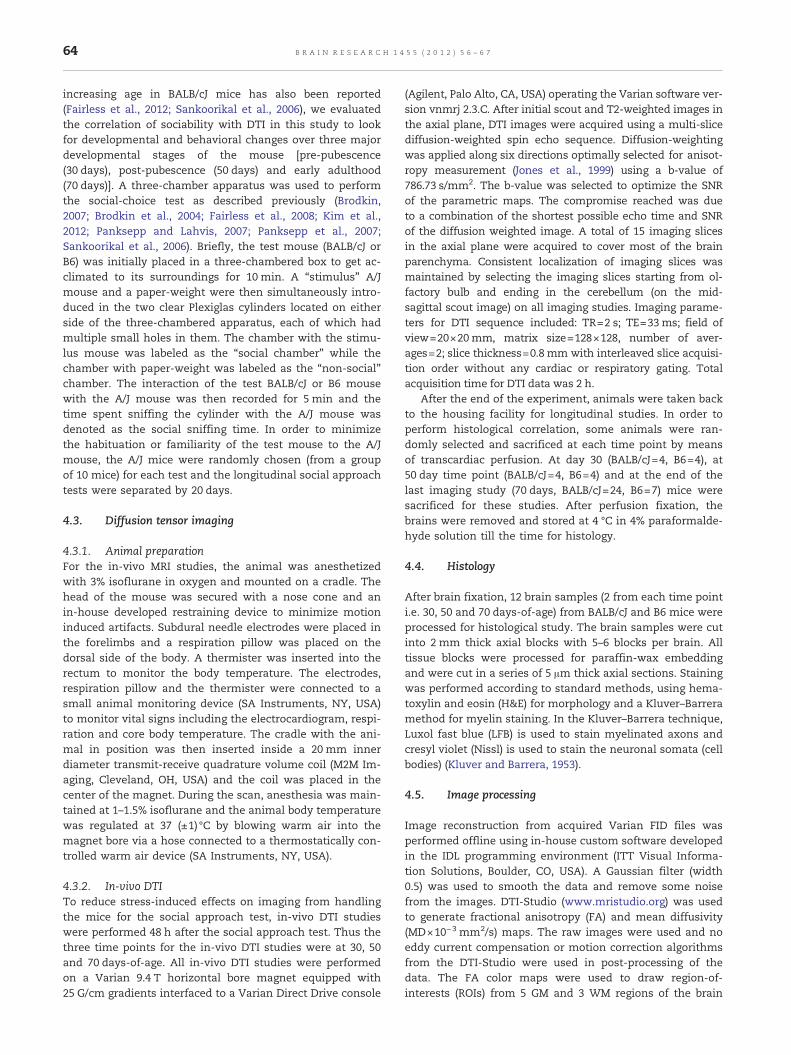
In-vivo DTI data from most of the animals was without anysubstantial motion artifacts and in general, the signal-to-noise ratio (SNR) from the cortical region of the brain wasover 100 (139.76±16.91) for the non-diffusion weighted (b0)images and it was over 75 (76.66±6.79) for the diffusionweighted (b786.73 s/mm2) images. This resulted in excellentquality of the in-vivo DTI data as evident by the MD, FAand FA weighted color coded maps, shown in Fig. 2. A mod-erate but significant positive correlation was observed be-tween MD values from the EC and social sniffing time of30 day-old BALB/cJ mice (r=0.519; p=0.007). A moderate
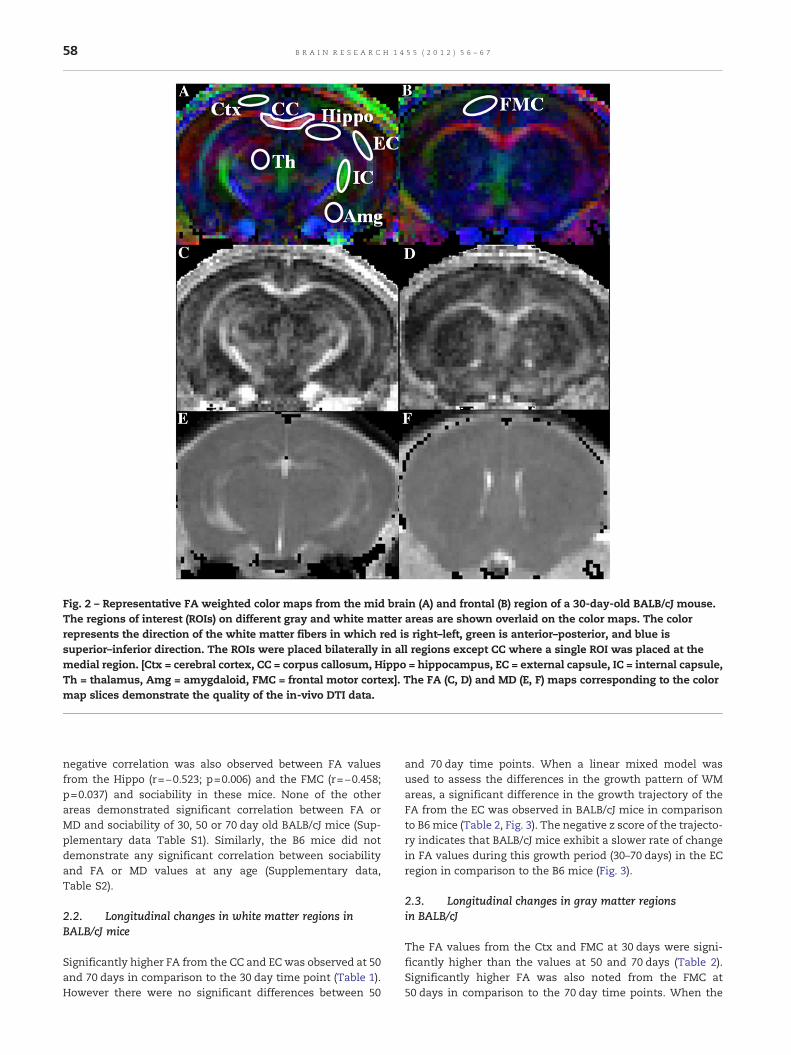
Fig. 2 – Representative FA weighted color maps from the mid brain (A) and frontal (B) region of a 30-day-old BALB/cJ mouse.The regions of interest (ROIs) on different gray and white matter areas are shown overlaid on the color maps. The colorrepresents the direction of the white matter fibers in which red is right–left, green is anterior–posterior, and blue issuperior–inferior direction. The ROIs were placed bilaterally in all regions except CC where a single ROI was placed at themedial region. [Ctx = cerebral cortex, CC = corpus callosum, Hippo = hippocampus, EC = external capsule, IC = internal capsule,Th = thalamus, Amg = amygdaloid, FMC = frontal motor cortex]. The FA (C, D) and MD (E, F) maps corresponding to the colormap slices demonstrate the quality of the in-vivo DTI data.
58 B R A I N R E S E A R C H 1 4 5 5 ( 2 0 1 2 ) 5 6 – 6 7
negative correlation was also observed between FA valuesfrom the Hippo (r=−0.523; p=0.006) and the FMC (r=−0.458;p=0.037) and sociability in these mice. None of the otherareas demonstrated significant correlation between FA orMD and sociability of 30, 50 or 70 day old BALB/cJ mice (Sup-plementary data Table S1). Similarly, the B6 mice did notdemonstrate any significant correlation between sociabilityand FA or MD values at any age (Supplementary data,Table S2).
2.2. Longitudinal changes in white matter regions inBALB/cJ mice
Significantly higher FA from the CC and EC was observed at 50and 70 days in comparison to the 30 day time point (Table 1).However there were no significant differences between 50
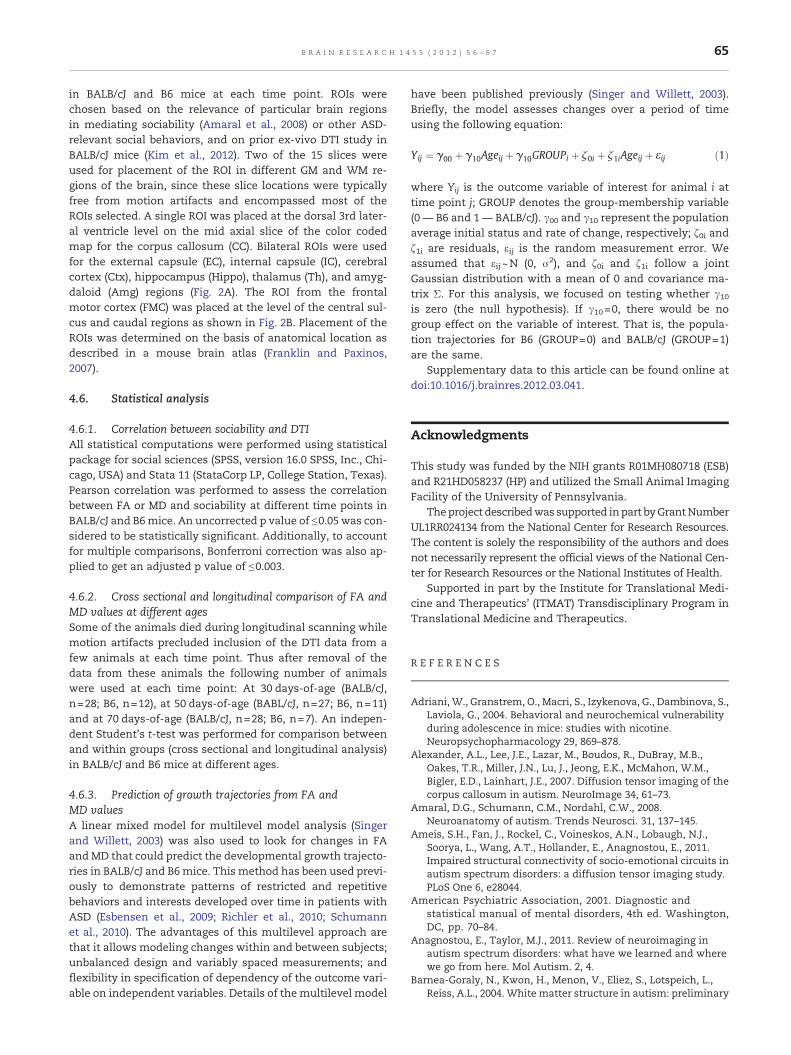
and 70 day time points. When a linear mixed model wasused to assess the differences in the growth pattern of WMareas, a significant difference in the growth trajectory of theFA from the EC was observed in BALB/cJ mice in comparisonto B6mice (Table 2, Fig. 3). The negative z score of the trajecto-ry indicates that BALB/cJ mice exhibit a slower rate of changein FA values during this growth period (30–70 days) in the ECregion in comparison to the B6 mice (Fig. 3).
2.3. Longitudinal changes in gray matter regionsin BALB/cJ
The FA values from the Ctx and FMC at 30 days were signi-ficantly higher than the values at 50 and 70 days (Table 2).Significantly higher FA was also noted from the FMC at50 days in comparison to the 70 day time points. When the
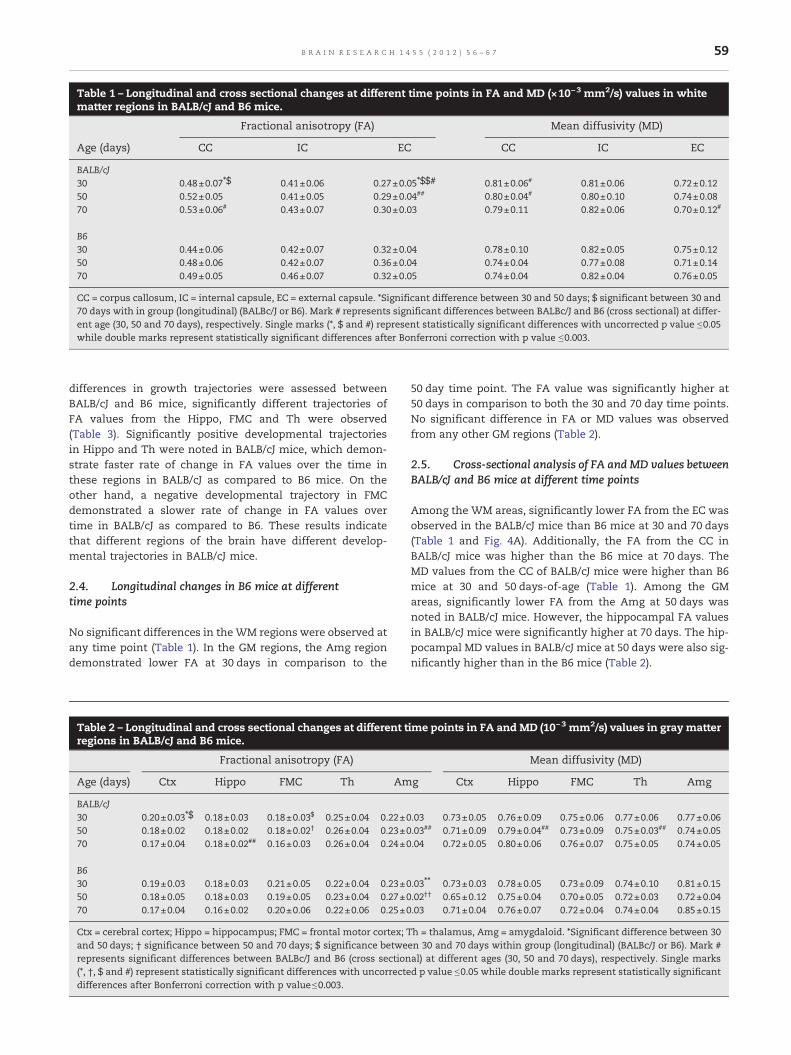
Table 1 – Longitudinal and cross sectional changes at different time points in FA and MD (×10−3 mm2/s) values in whitematter regions in BALB/cJ and B6 mice.
Fractional anisotropy (FA) Mean diffusivity (MD)
Age (days) CC IC EC CC IC EC
BALB/cJ30 0.48±0.07⁎$ 0.41±0.06 0.27±0.05⁎$$# 0.81±0.06# 0.81±0.06 0.72±0.1250 0.52±0.05 0.41±0.05 0.29±0.04## 0.80±0.04# 0.80±0.10 0.74±0.0870 0.53±0.06# 0.43±0.07 0.30±0.03 0.79±0.11 0.82±0.06 0.70±0.12#
B630 0.44±0.06 0.42±0.07 0.32±0.04 0.78±0.10 0.82±0.05 0.75±0.1250 0.48±0.06 0.42±0.07 0.36±0.04 0.74±0.04 0.77±0.08 0.71±0.1470 0.49±0.05 0.46±0.07 0.32±0.05 0.74±0.04 0.82±0.04 0.76±0.05
CC = corpus callosum, IC = internal capsule, EC = external capsule. *Significant difference between 30 and 50 days; $ significant between 30 and70 days with in group (longitudinal) (BALBc/J or B6). Mark # represents significant differences between BALBc/J and B6 (cross sectional) at differ-ent age (30, 50 and 70 days), respectively. Single marks (*, $ and #) represent statistically significant differences with uncorrected p value ≤0.05while double marks represent statistically significant differences after Bonferroni correction with p value ≤0.003.
59B R A I N R E S E A R C H 1 4 5 5 ( 2 0 1 2 ) 5 6 – 6 7
differences in growth trajectories were assessed betweenBALB/cJ and B6 mice, significantly different trajectories ofFA values from the Hippo, FMC and Th were observed(Table 3). Significantly positive developmental trajectoriesin Hippo and Th were noted in BALB/cJ mice, which demon-strate faster rate of change in FA values over the time inthese regions in BALB/cJ as compared to B6 mice. On theother hand, a negative developmental trajectory in FMCdemonstrated a slower rate of change in FA values overtime in BALB/cJ as compared to B6. These results indicatethat different regions of the brain have different develop-mental trajectories in BALB/cJ mice.
2.4. Longitudinal changes in B6 mice at differenttime points
No significant differences in theWM regions were observed atany time point (Table 1). In the GM regions, the Amg regiondemonstrated lower FA at 30 days in comparison to the
Table 2 – Longitudinal and cross sectional changes at different tregions in BALB/cJ and B6 mice.
Fractional anisotropy (FA)
Age (days) Ctx Hippo FMC Th Am
BALB/cJ30 0.20±0.03⁎$ 0.18±0.03 0.18±0.03$ 0.25±0.04 0.22±050 0.18±0.02 0.18±0.02 0.18±0.02† 0.26±0.04 0.23±070 0.17±0.04 0.18±0.02## 0.16±0.03 0.26±0.04 0.24±0
B630 0.19±0.03 0.18±0.03 0.21±0.05 0.22±0.04 0.23±050 0.18±0.05 0.18±0.03 0.19±0.05 0.23±0.04 0.27±070 0.17±0.04 0.16±0.02 0.20±0.06 0.22±0.06 0.25±0
Ctx = cerebral cortex; Hippo = hippocampus; FMC = frontal motor cortex; Tand 50 days; † significance between 50 and 70 days; $ significance betwerepresents significant differences between BALBc/J and B6 (cross section(*, †, $ and #) represent statistically significant differences with uncorrectedifferences after Bonferroni correction with p value≤0.003.
50 day time point. The FA value was significantly higher at50 days in comparison to both the 30 and 70 day time points.No significant difference in FA or MD values was observedfrom any other GM regions (Table 2).
2.5. Cross-sectional analysis of FA and MD values betweenBALB/cJ and B6 mice at different time points
Among the WM areas, significantly lower FA from the EC wasobserved in the BALB/cJ mice than B6 mice at 30 and 70 days(Table 1 and Fig. 4A). Additionally, the FA from the CC inBALB/cJ mice was higher than the B6 mice at 70 days. TheMD values from the CC of BALB/cJ mice were higher than B6mice at 30 and 50 days-of-age (Table 1). Among the GMareas, significantly lower FA from the Amg at 50 days wasnoted in BALB/cJ mice. However, the hippocampal FA valuesin BALB/cJ mice were significantly higher at 70 days. The hip-pocampal MD values in BALB/cJ mice at 50 days were also sig-nificantly higher than in the B6 mice (Table 2).
ime points in FA and MD (10−3 mm2/s) values in gray matter
Mean diffusivity (MD)
g Ctx Hippo FMC Th Amg
.03 0.73±0.05 0.76±0.09 0.75±0.06 0.77±0.06 0.77±0.06
.03## 0.71±0.09 0.79±0.04## 0.73±0.09 0.75±0.03## 0.74±0.05
.04 0.72±0.05 0.80±0.06 0.76±0.07 0.75±0.05 0.74±0.05
.03⁎⁎ 0.73±0.03 0.78±0.05 0.73±0.09 0.74±0.10 0.81±0.15
.02†† 0.65±0.12 0.75±0.04 0.70±0.05 0.72±0.03 0.72±0.04
.03 0.71±0.04 0.76±0.07 0.72±0.04 0.74±0.04 0.85±0.15
h = thalamus, Amg = amygdaloid. *Significant difference between 30en 30 and 70 days within group (longitudinal) (BALBc/J or B6). Mark #al) at different ages (30, 50 and 70 days), respectively. Single marksd p value ≤0.05 while double marks represent statistically significant
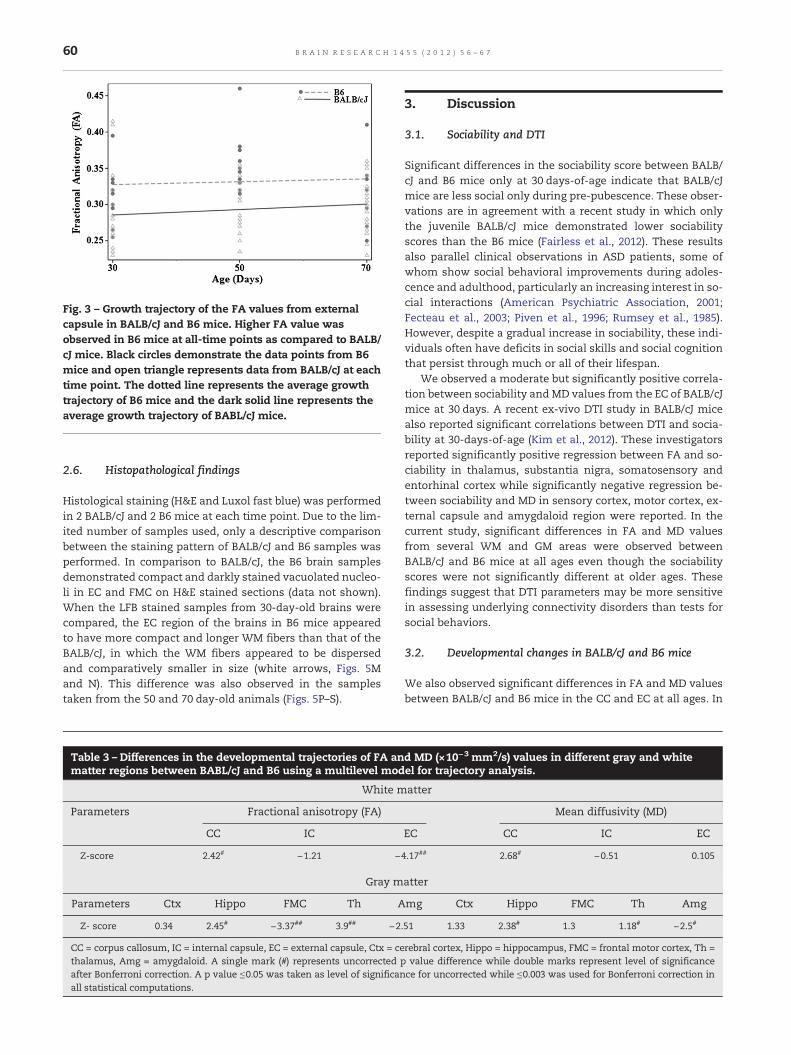
Fig. 3 – Growth trajectory of the FA values from externalcapsule in BALB/cJ and B6 mice. Higher FA value wasobserved in B6 mice at all-time points as compared to BALB/cJ mice. Black circles demonstrate the data points from B6mice and open triangle represents data from BALB/cJ at eachtime point. The dotted line represents the average growthtrajectory of B6 mice and the dark solid line represents theaverage growth trajectory of BABL/cJ mice.
60 B R A I N R E S E A R C H 1 4 5 5 ( 2 0 1 2 ) 5 6 – 6 7
2.6. Histopathological findings
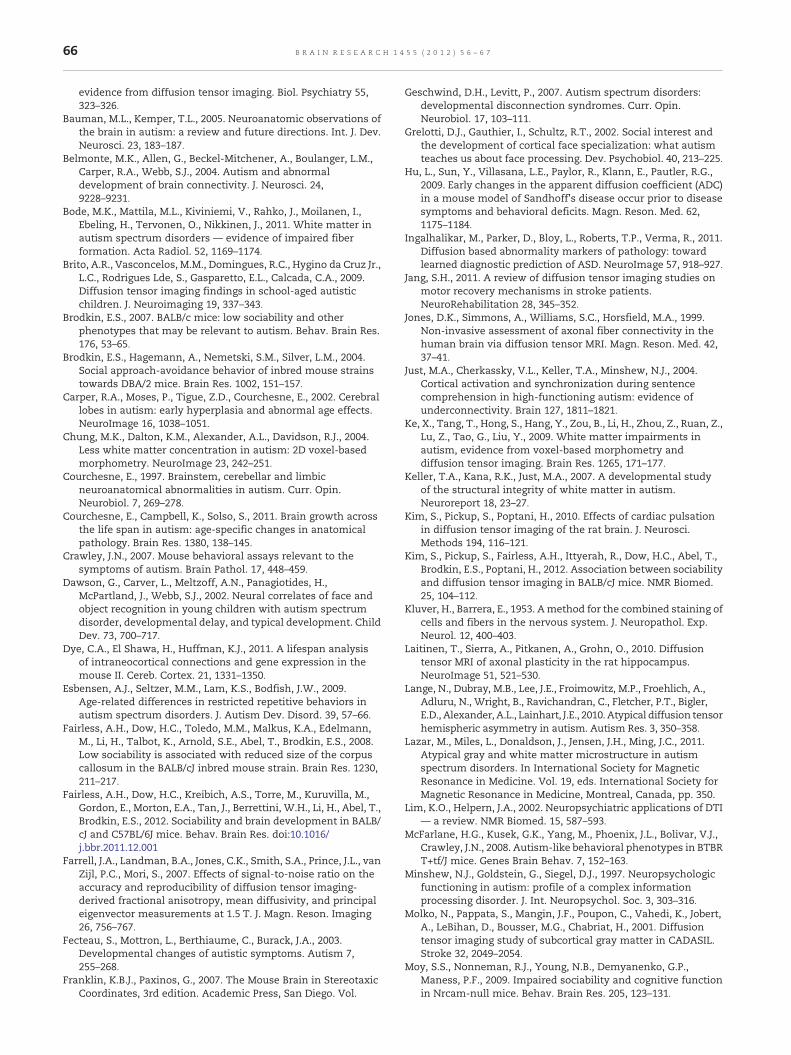
Histological staining (H&E and Luxol fast blue) was performedin 2 BALB/cJ and 2 B6 mice at each time point. Due to the lim-ited number of samples used, only a descriptive comparisonbetween the staining pattern of BALB/cJ and B6 samples wasperformed. In comparison to BALB/cJ, the B6 brain samplesdemonstrated compact and darkly stained vacuolated nucleo-li in EC and FMC on H&E stained sections (data not shown).When the LFB stained samples from 30-day-old brains werecompared, the EC region of the brains in B6 mice appearedto have more compact and longer WM fibers than that of theBALB/cJ, in which the WM fibers appeared to be dispersedand comparatively smaller in size (white arrows, Figs. 5Mand N). This difference was also observed in the samplestaken from the 50 and 70 day-old animals (Figs. 5P–S).
Table 3 – Differences in the developmental trajectories of FA anmatter regions between BABL/cJ and B6 using a multilevel mod
White m
Parameters Fractional anisotropy (FA)
CC IC
Z-score 2.42# −1.21 −
Gray m
Parameters Ctx Hippo FMC Th A
Z- score 0.34 2.45# −3.37## 3.9## −2
CC = corpus callosum, IC = internal capsule, EC = external capsule, Ctx = cethalamus, Amg = amygdaloid. A single mark (#) represents uncorrected pafter Bonferroni correction. A p value ≤0.05 was taken as level of significanall statistical computations.
3. Discussion
3.1. Sociability and DTI
Significant differences in the sociability score between BALB/cJ and B6 mice only at 30 days-of-age indicate that BALB/cJmice are less social only during pre-pubescence. These obser-vations are in agreement with a recent study in which onlythe juvenile BALB/cJ mice demonstrated lower sociabilityscores than the B6 mice (Fairless et al., 2012). These resultsalso parallel clinical observations in ASD patients, some ofwhom show social behavioral improvements during adoles-cence and adulthood, particularly an increasing interest in so-cial interactions (American Psychiatric Association, 2001;Fecteau et al., 2003; Piven et al., 1996; Rumsey et al., 1985).However, despite a gradual increase in sociability, these indi-viduals often have deficits in social skills and social cognitionthat persist through much or all of their lifespan.
We observed a moderate but significantly positive correla-tion between sociability and MD values from the EC of BALB/cJmice at 30 days. A recent ex-vivo DTI study in BALB/cJ micealso reported significant correlations between DTI and socia-bility at 30-days-of-age (Kim et al., 2012). These investigatorsreported significantly positive regression between FA and so-ciability in thalamus, substantia nigra, somatosensory andentorhinal cortex while significantly negative regression be-tween sociability and MD in sensory cortex, motor cortex, ex-ternal capsule and amygdaloid region were reported. In thecurrent study, significant differences in FA and MD valuesfrom several WM and GM areas were observed betweenBALB/cJ and B6 mice at all ages even though the sociabilityscores were not significantly different at older ages. Thesefindings suggest that DTI parameters may be more sensitivein assessing underlying connectivity disorders than tests forsocial behaviors.
3.2. Developmental changes in BALB/cJ and B6 mice
We also observed significant differences in FA and MD valuesbetween BALB/cJ and B6 mice in the CC and EC at all ages. In
d MD (×10−3 mm2/s) values in different gray and whiteel for trajectory analysis.
atter
Mean diffusivity (MD)
EC CC IC EC
4.17## 2.68# −0.51 0.105
atter
mg Ctx Hippo FMC Th Amg
.51 1.33 2.38# 1.3 1.18# −2.5#
rebral cortex, Hippo = hippocampus, FMC = frontal motor cortex, Th =value difference while double marks represent level of significancece for uncorrected while ≤0.003 was used for Bonferroni correction in
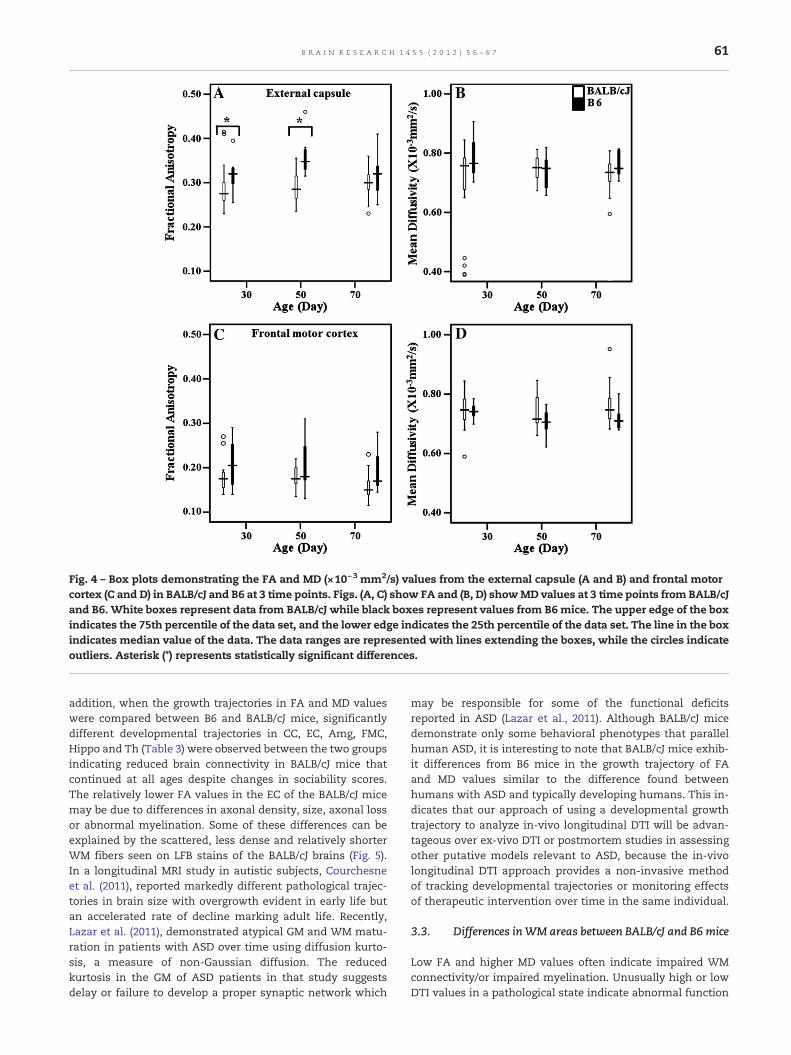
Fig. 4 – Box plots demonstrating the FA and MD (×10−3 mm2/s) values from the external capsule (A and B) and frontal motorcortex (C and D) in BALB/cJ and B6 at 3 time points. Figs. (A, C) show FA and (B, D) showMD values at 3 time points from BALB/cJand B6. White boxes represent data from BALB/cJ while black boxes represent values from B6 mice. The upper edge of the boxindicates the 75th percentile of the data set, and the lower edge indicates the 25th percentile of the data set. The line in the boxindicates median value of the data. The data ranges are represented with lines extending the boxes, while the circles indicateoutliers. Asterisk (*) represents statistically significant differences.
61B R A I N R E S E A R C H 1 4 5 5 ( 2 0 1 2 ) 5 6 – 6 7
addition, when the growth trajectories in FA and MD valueswere compared between B6 and BALB/cJ mice, significantlydifferent developmental trajectories in CC, EC, Amg, FMC,Hippo and Th (Table 3) were observed between the two groupsindicating reduced brain connectivity in BALB/cJ mice thatcontinued at all ages despite changes in sociability scores.The relatively lower FA values in the EC of the BALB/cJ micemay be due to differences in axonal density, size, axonal lossor abnormal myelination. Some of these differences can beexplained by the scattered, less dense and relatively shorterWM fibers seen on LFB stains of the BALB/cJ brains (Fig. 5).In a longitudinal MRI study in autistic subjects, Courchesneet al. (2011), reported markedly different pathological trajec-tories in brain size with overgrowth evident in early life butan accelerated rate of decline marking adult life. Recently,Lazar et al. (2011), demonstrated atypical GM and WM matu-ration in patients with ASD over time using diffusion kurto-sis, a measure of non-Gaussian diffusion. The reducedkurtosis in the GM of ASD patients in that study suggestsdelay or failure to develop a proper synaptic network which
may be responsible for some of the functional deficitsreported in ASD (Lazar et al., 2011). Although BALB/cJ micedemonstrate only some behavioral phenotypes that parallelhuman ASD, it is interesting to note that BALB/cJ mice exhib-it differences from B6 mice in the growth trajectory of FAand MD values similar to the difference found betweenhumans with ASD and typically developing humans. This in-dicates that our approach of using a developmental growthtrajectory to analyze in-vivo longitudinal DTI will be advan-tageous over ex-vivo DTI or postmortem studies in assessingother putative models relevant to ASD, because the in-vivolongitudinal DTI approach provides a non-invasive methodof tracking developmental trajectories or monitoring effectsof therapeutic intervention over time in the same individual.
3.3. Differences inWM areas between BALB/cJ and B6 mice
Low FA and higher MD values often indicate impaired WMconnectivity/or impaired myelination. Unusually high or lowDTI values in a pathological state indicate abnormal function
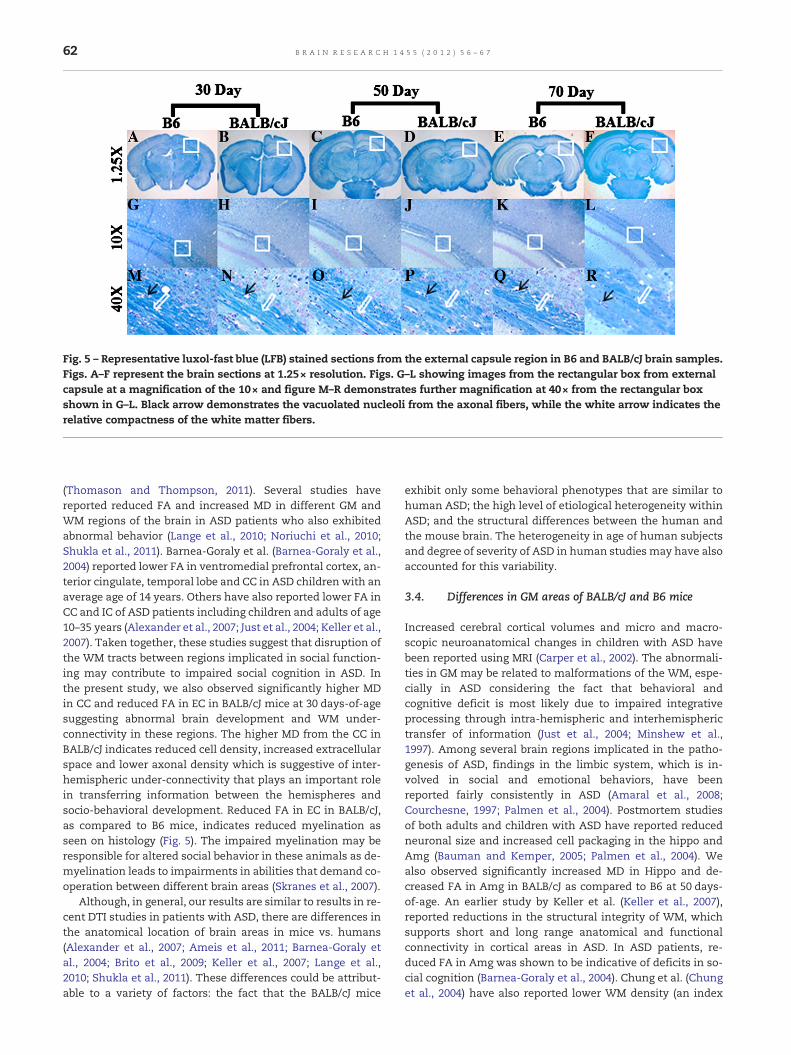
Fig. 5 – Representative luxol-fast blue (LFB) stained sections from the external capsule region in B6 and BALB/cJ brain samples.Figs. A–F represent the brain sections at 1.25× resolution. Figs. G–L showing images from the rectangular box from externalcapsule at a magnification of the 10× and figure M–R demonstrates further magnification at 40× from the rectangular boxshown in G–L. Black arrow demonstrates the vacuolated nucleoli from the axonal fibers, while the white arrow indicates therelative compactness of the white matter fibers.
62 B R A I N R E S E A R C H 1 4 5 5 ( 2 0 1 2 ) 5 6 – 6 7
(Thomason and Thompson, 2011). Several studies havereported reduced FA and increased MD in different GM andWM regions of the brain in ASD patients who also exhibitedabnormal behavior (Lange et al., 2010; Noriuchi et al., 2010;Shukla et al., 2011). Barnea-Goraly et al. (Barnea-Goraly et al.,2004) reported lower FA in ventromedial prefrontal cortex, an-terior cingulate, temporal lobe and CC in ASD children with anaverage age of 14 years. Others have also reported lower FA inCC and IC of ASD patients including children and adults of age10–35 years (Alexander et al., 2007; Just et al., 2004; Keller et al.,2007). Taken together, these studies suggest that disruption ofthe WM tracts between regions implicated in social function-ing may contribute to impaired social cognition in ASD. Inthe present study, we also observed significantly higher MDin CC and reduced FA in EC in BALB/cJ mice at 30 days-of-agesuggesting abnormal brain development and WM under-connectivity in these regions. The higher MD from the CC inBALB/cJ indicates reduced cell density, increased extracellularspace and lower axonal density which is suggestive of inter-hemispheric under-connectivity that plays an important rolein transferring information between the hemispheres andsocio-behavioral development. Reduced FA in EC in BALB/cJ,as compared to B6 mice, indicates reduced myelination asseen on histology (Fig. 5). The impaired myelination may beresponsible for altered social behavior in these animals as de-myelination leads to impairments in abilities that demand co-operation between different brain areas (Skranes et al., 2007).
Although, in general, our results are similar to results in re-cent DTI studies in patients with ASD, there are differences inthe anatomical location of brain areas in mice vs. humans(Alexander et al., 2007; Ameis et al., 2011; Barnea-Goraly etal., 2004; Brito et al., 2009; Keller et al., 2007; Lange et al.,2010; Shukla et al., 2011). These differences could be attribut-able to a variety of factors: the fact that the BALB/cJ mice
exhibit only some behavioral phenotypes that are similar tohuman ASD; the high level of etiological heterogeneity withinASD; and the structural differences between the human andthe mouse brain. The heterogeneity in age of human subjectsand degree of severity of ASD in human studies may have alsoaccounted for this variability.
3.4. Differences in GM areas of BALB/cJ and B6 mice
Increased cerebral cortical volumes and micro and macro-scopic neuroanatomical changes in children with ASD havebeen reported using MRI (Carper et al., 2002). The abnormali-ties in GM may be related to malformations of the WM, espe-cially in ASD considering the fact that behavioral andcognitive deficit is most likely due to impaired integrativeprocessing through intra-hemispheric and interhemispherictransfer of information (Just et al., 2004; Minshew et al.,1997). Among several brain regions implicated in the patho-genesis of ASD, findings in the limbic system, which is in-volved in social and emotional behaviors, have beenreported fairly consistently in ASD (Amaral et al., 2008;Courchesne, 1997; Palmen et al., 2004). Postmortem studiesof both adults and children with ASD have reported reducedneuronal size and increased cell packaging in the hippo andAmg (Bauman and Kemper, 2005; Palmen et al., 2004). Wealso observed significantly increased MD in Hippo and de-creased FA in Amg in BALB/cJ as compared to B6 at 50 days-of-age. An earlier study by Keller et al. (Keller et al., 2007),reported reductions in the structural integrity of WM, whichsupports short and long range anatomical and functionalconnectivity in cortical areas in ASD. In ASD patients, re-duced FA in Amg was shown to be indicative of deficits in so-cial cognition (Barnea-Goraly et al., 2004). Chung et al. (Chunget al., 2004) have also reported lower WM density (an index
63B R A I N R E S E A R C H 1 4 5 5 ( 2 0 1 2 ) 5 6 – 6 7
for neural connectivity) in the genu, rostrum, and spleniumof the CC in patients with ASD and suggested that this reduc-tion might result in impaired interhemispheric connectivityin frontal, temporal and occipital regions. We have also ob-served significantly higher FA in FMC in 30-day-old BALB/cJmice in comparison to 50 and 70 day old BALB/cJ mice. Thehigher FA in FMC at 30 day may be indicative of abnormallyhigher neural connectivity which, combined with under-connectivity in CC may contribute to behavioral abnormali-ties in these animals (Just et al., 2004). Therefore, it is possiblethat abnormalities in the sub regions of the CC could disruptthe functional connectivity among cortical regions in the twohemispheres. We also observed a negative slope in develop-mental trajectory of FA in this region, which indicates that amuch slower maturation in BALB/cJ occurs as compared toB6 mice. This abnormal development of the FMC may con-tribute to deficits in behavioral abnormalities of BALB/cJmice, particularly in the juvenile period.
Neuropathological observations of GM areas in humanASD point towards early pre and post-natal developmentalabnormalities that involve multiple regions of the brain, in-cluding the Ctx, cortical WM, Amg, brain stem and cerebellum(Schmitz and Rezaie, 2008). The BTBR strain of mice, whichalso exhibit behavioral deficits mimicking the core deficits ofautism, exhibit abnormal cellular and anatomic features thatcorrelate with behavioral deficits and callosal abnormalities(Stephenson et al., 2011). A qualitative analysis of the LFBstained histological sections demonstrated presence of dis-persed and shorter WM fibers from EC in BALB/cJ, in compar-ison to B6 mice, which may be due to axonal loss or due toabnormal myelination. The concordance between DTI andhistology data demonstrate that abnormality in differentbrain regions persist during later stage of life even whenthere were no significant differences in sociability in these an-imals. These results further suggest that DTI may be used as anon-invasive imaging technique in studying neuro-behavioraland developmental disorders.
Although promising, we acknowledge certain limitationsof our study. FA values from the gray matter are typicallylower than the WM and are hence sensitive to the signal tonoise (SNR) of the raw images. An accurate and precise quan-tification of FA values in GM requires substantially more SNRthan the quantification of WM FA values (Farrell et al., 2007).Since the SNR of our b0 images was well over 100 and the dif-fusion weighted images had SNR over 75, we believe that theFA values from the GM in our study are less sensitive tonoise in the data. Furthermore, since an ROI approach wasused to analyze the data, we believe that these values reliablesince an earlier study suggested that ROI-based measures ofFA and MD are more reproducible than voxel-wise measuresand are less sensitive to noise levels (Farrell et al., 2007). Addi-tionally, motion-induced artifacts can impact on the sensitiv-ity of the FA and MD values and cardiac gating has beensuggested to reduce these effects in DTI studies of the ratbrain (Kim et al., 2010). Since we primarily relied on restrain-ing the animal's head with a three-point apparatus, and didnot use cardiac gating, we occasionally encountered motionartifacts in our study. This resulted in the loss of a few datapoints from each group and also limited the analysis of thegray and white matter to a few of the 15 imaging slices
acquired. The cerebellar region has been highly implicated inASD and it would have been interesting to study this regionin the BALB/cJ mice. However, breathing induced motion arti-facts were typically observed in cerebellar region and hencewe could not analyze this region.
While differences in DTI were noted between BALB/cJ andB6 mice at all ages studied, the DTI abnormalities had amodest correlation with reduced sociability. This raises thepossibility that DTI is only detecting structural differencesbetween the two strains of mice studied that are not directlyrelevant to sociability. To further confirm or disprove thecorrelation of DTI with social behavioral abnormalities, fu-ture studies involving additional mouse models relevant toASD (Crawley, 2007; McFarlane et al., 2008; Moy et al., 2009;Tabuchi et al., 2007) and assays that test additional behavior-al phenotypes relevant to ASD (Brodkin, 2007; Crawley, 2007;Fairless et al., 2008; Silverman et al., 2010) may be necessary.
While decreasedmyelination in the BALB/cJ mice explains,to some degree, the reduced FA in these animals, it is wellknown that other factors, such as fiber orientation, also affectFA values. Future correlative studies of DTI and electron mi-croscopy (Laitinen et al., 2010; Shereen et al., 2011) may fur-ther help in elucidating the mechanism of changes observedin these animals.
In conclusion, our findings support the hypothesis of ab-normal microstructural integrity and connectivity of WM aswell as cortical networks of the brain in BALB/cJ mice and ab-normal social behavior that seem to parallel in some pheno-types observed in human ASD.
4. Experimental procedure
4.1. Animal model
Three week old male BALB/cJ (n=32) and B6 (n=15) micewere obtained from the Jackson Laboratory (Bar Harbor, ME,USA). For the social-choice test, A/J mice (n=10, JacksonLabs, Bar Harbor, ME, USA) were used as “stimulus mice”.The stimulus mice were gonadectomized prior to pubertyto minimize the extent to which they would elicit sexualand aggressive motivations from the test mice. Food andwater were available ad libitum, and the animals were main-tained in a room maintained on a 12 hour light and darkcycle (lights on at 7:00 am). All animal procedures, includingbehavior assays and imaging experiments were conducted instrict compliance with the National Institutes of Healthguidelines for the care and use of laboratory animals andthe study was approved by the University of PennsylvaniaInstitutional Animal Care and Use Committee.
4.2. Measures of social behavior
Social behavior in mice was assayed on 28, 48 and 68 days-of-age corresponding to pre-pubescence, post-pubescence andearly adulthood (Adriani et al., 2004; Dye et al., 2011). Sincesome studies in human ASD have reported increased inter-est in social interaction of ASD individuals as they growinto adulthood (Fecteau et al., 2003; Piven et al., 1996;Rumsey et al., 1985) and since increased sociability with
64 B R A I N R E S E A R C H 1 4 5 5 ( 2 0 1 2 ) 5 6 – 6 7
increasing age in BALB/cJ mice has also been reported(Fairless et al., 2012; Sankoorikal et al., 2006), we evaluatedthe correlation of sociability with DTI in this study to lookfor developmental and behavioral changes over three majordevelopmental stages of the mouse [pre-pubescence(30 days), post-pubescence (50 days) and early adulthood(70 days)]. A three-chamber apparatus was used to performthe social-choice test as described previously (Brodkin,2007; Brodkin et al., 2004; Fairless et al., 2008; Kim et al.,2012; Panksepp and Lahvis, 2007; Panksepp et al., 2007;Sankoorikal et al., 2006). Briefly, the test mouse (BALB/cJ orB6) was initially placed in a three-chambered box to get ac-climated to its surroundings for 10 min. A “stimulus” A/Jmouse and a paper-weight were then simultaneously intro-duced in the two clear Plexiglas cylinders located on eitherside of the three-chambered apparatus, each of which hadmultiple small holes in them. The chamber with the stimu-lus mouse was labeled as the “social chamber” while thechamber with paper-weight was labeled as the “non-social”chamber. The interaction of the test BALB/cJ or B6 mousewith the A/J mouse was then recorded for 5 min and thetime spent sniffing the cylinder with the A/J mouse wasdenoted as the social sniffing time. In order to minimizethe habituation or familiarity of the test mouse to the A/Jmouse, the A/J mice were randomly chosen (from a groupof 10 mice) for each test and the longitudinal social approachtests were separated by 20 days.
4.3. Diffusion tensor imaging
4.3.1. Animal preparationFor the in-vivo MRI studies, the animal was anesthetizedwith 3% isoflurane in oxygen and mounted on a cradle. Thehead of the mouse was secured with a nose cone and anin-house developed restraining device to minimize motioninduced artifacts. Subdural needle electrodes were placed inthe forelimbs and a respiration pillow was placed on thedorsal side of the body. A thermister was inserted into therectum to monitor the body temperature. The electrodes,respiration pillow and the thermister were connected to asmall animal monitoring device (SA Instruments, NY, USA)to monitor vital signs including the electrocardiogram, respi-ration and core body temperature. The cradle with the ani-mal in position was then inserted inside a 20 mm innerdiameter transmit-receive quadrature volume coil (M2M Im-aging, Cleveland, OH, USA) and the coil was placed in thecenter of the magnet. During the scan, anesthesia was main-tained at 1–1.5% isoflurane and the animal body temperaturewas regulated at 37 (±1)°C by blowing warm air into themagnet bore via a hose connected to a thermostatically con-trolled warm air device (SA Instruments, NY, USA).
4.3.2. In-vivo DTITo reduce stress-induced effects on imaging from handlingthe mice for the social approach test, in-vivo DTI studieswere performed 48 h after the social approach test. Thus thethree time points for the in-vivo DTI studies were at 30, 50and 70 days-of-age. All in-vivo DTI studies were performedon a Varian 9.4 T horizontal bore magnet equipped with25 G/cm gradients interfaced to a Varian Direct Drive console
(Agilent, Palo Alto, CA, USA) operating the Varian software ver-sion vnmrj 2.3.C. After initial scout and T2-weighted images inthe axial plane, DTI images were acquired using a multi-slicediffusion-weighted spin echo sequence. Diffusion-weightingwas applied along six directions optimally selected for anisot-ropy measurement (Jones et al., 1999) using a b-value of786.73 s/mm2. The b-value was selected to optimize the SNRof the parametric maps. The compromise reached was dueto a combination of the shortest possible echo time and SNRof the diffusion weighted image. A total of 15 imaging slicesin the axial plane were acquired to cover most of the brainparenchyma. Consistent localization of imaging slices wasmaintained by selecting the imaging slices starting from ol-factory bulb and ending in the cerebellum (on the mid-sagittal scout image) on all imaging studies. Imaging parame-ters for DTI sequence included: TR=2 s; TE=33ms; field ofview=20×20mm, matrix size=128×128, number of aver-ages=2; slice thickness=0.8 mm with interleaved slice acquisi-tion order without any cardiac or respiratory gating. Totalacquisition time for DTI data was 2 h.
After the end of the experiment, animals were taken backto the housing facility for longitudinal studies. In order toperform histological correlation, some animals were ran-domly selected and sacrificed at each time point by meansof transcardiac perfusion. At day 30 (BALB/cJ=4, B6=4), at50 day time point (BALB/cJ=4, B6=4) and at the end of thelast imaging study (70 days, BALB/cJ=24, B6=7) mice weresacrificed for these studies. After perfusion fixation, thebrains were removed and stored at 4 °C in 4% paraformalde-hyde solution till the time for histology.
4.4. Histology
After brain fixation, 12 brain samples (2 from each time pointi.e. 30, 50 and 70 days-of-age) from BALB/cJ and B6 mice wereprocessed for histological study. The brain samples were cutinto 2 mm thick axial blocks with 5–6 blocks per brain. Alltissue blocks were processed for paraffin-wax embeddingand were cut in a series of 5 μm thick axial sections. Stainingwas performed according to standard methods, using hema-toxylin and eosin (H&E) for morphology and a Kluver–Barreramethod for myelin staining. In the Kluver–Barrera technique,Luxol fast blue (LFB) is used to stain myelinated axons andcresyl violet (Nissl) is used to stain the neuronal somata (cellbodies) (Kluver and Barrera, 1953).
4.5. Image processing
Image reconstruction from acquired Varian FID files wasperformed offline using in-house custom software developedin the IDL programming environment (ITT Visual Informa-tion Solutions, Boulder, CO, USA). A Gaussian filter (width0.5) was used to smooth the data and remove some noisefrom the images. DTI-Studio (www.mristudio.org) was usedto generate fractional anisotropy (FA) and mean diffusivity(MD×10−3 mm2/s) maps. The raw images were used and noeddy current compensation or motion correction algorithmsfrom the DTI-Studio were used in post-processing of thedata. The FA color maps were used to draw region-of-interests (ROIs) from 5 GM and 3 WM regions of the brain
65B R A I N R E S E A R C H 1 4 5 5 ( 2 0 1 2 ) 5 6 – 6 7
in BALB/cJ and B6 mice at each time point. ROIs werechosen based on the relevance of particular brain regionsin mediating sociability (Amaral et al., 2008) or other ASD-relevant social behaviors, and on prior ex-vivo DTI study inBALB/cJ mice (Kim et al., 2012). Two of the 15 slices wereused for placement of the ROI in different GM and WM re-gions of the brain, since these slice locations were typicallyfree from motion artifacts and encompassed most of theROIs selected. A single ROI was placed at the dorsal 3rd later-al ventricle level on the mid axial slice of the color codedmap for the corpus callosum (CC). Bilateral ROIs were usedfor the external capsule (EC), internal capsule (IC), cerebralcortex (Ctx), hippocampus (Hippo), thalamus (Th), and amyg-daloid (Amg) regions (Fig. 2A). The ROI from the frontalmotor cortex (FMC) was placed at the level of the central sul-cus and caudal regions as shown in Fig. 2B. Placement of theROIs was determined on the basis of anatomical location asdescribed in a mouse brain atlas (Franklin and Paxinos,2007).
4.6. Statistical analysis
4.6.1. Correlation between sociability and DTIAll statistical computations were performed using statisticalpackage for social sciences (SPSS, version 16.0 SPSS, Inc., Chi-cago, USA) and Stata 11 (StataCorp LP, College Station, Texas).Pearson correlation was performed to assess the correlationbetween FA or MD and sociability at different time points inBALB/cJ and B6mice. An uncorrected p value of ≤0.05 was con-sidered to be statistically significant. Additionally, to accountfor multiple comparisons, Bonferroni correction was also ap-plied to get an adjusted p value of ≤0.003.
4.6.2. Cross sectional and longitudinal comparison of FA andMD values at different agesSome of the animals died during longitudinal scanning whilemotion artifacts precluded inclusion of the DTI data from afew animals at each time point. Thus after removal of thedata from these animals the following number of animalswere used at each time point: At 30 days-of-age (BALB/cJ,n=28; B6, n=12), at 50 days-of-age (BABL/cJ, n=27; B6, n=11)and at 70 days-of-age (BALB/cJ, n=28; B6, n=7). An indepen-dent Student's t-test was performed for comparison betweenand within groups (cross sectional and longitudinal analysis)in BALB/cJ and B6 mice at different ages.
4.6.3. Prediction of growth trajectories from FA andMD valuesA linear mixed model for multilevel model analysis (Singerand Willett, 2003) was also used to look for changes in FAandMD that could predict the developmental growth trajecto-ries in BALB/cJ and B6mice. This method has been used previ-ously to demonstrate patterns of restricted and repetitivebehaviors and interests developed over time in patients withASD (Esbensen et al., 2009; Richler et al., 2010; Schumannet al., 2010). The advantages of this multilevel approach arethat it allows modeling changes within and between subjects;unbalanced design and variably spaced measurements; andflexibility in specification of dependency of the outcome vari-able on independent variables. Details of the multilevel model
have been published previously (Singer and Willett, 2003).Briefly, the model assesses changes over a period of timeusing the following equation:
Yij ¼ γ00 þ γ10Ageij þ γ10GROUPi þ ζ0i þ ζ1iAgeij þ εij ð1Þ
where Yij is the outcome variable of interest for animal i attime point j; GROUP denotes the group-membership variable(0 — B6 and 1 — BALB/cJ). γ00 and γ10 represent the populationaverage initial status and rate of change, respectively; ζ0i andζ1i are residuals, εij is the random measurement error. Weassumed that εij~N (0, σ2), and ζ0i and ζ1i follow a jointGaussian distribution with a mean of 0 and covariance ma-trix Σ. For this analysis, we focused on testing whether γ10is zero (the null hypothesis). If γ10=0, there would be nogroup effect on the variable of interest. That is, the popula-tion trajectories for B6 (GROUP=0) and BALB/cJ (GROUP=1)are the same.
Supplementary data to this article can be found online atdoi:10.1016/j.brainres.2012.03.041.
Acknowledgments
This study was funded by the NIH grants R01MH080718 (ESB)and R21HD058237 (HP) and utilized the Small Animal ImagingFacility of the University of Pennsylvania.
Theproject describedwas supported inpart byGrantNumberUL1RR024134 from the National Center for Research Resources.The content is solely the responsibility of the authors and doesnot necessarily represent the official views of the National Cen-ter for Research Resources or the National Institutes of Health.
Supported in part by the Institute for Translational Medi-cine and Therapeutics' (ITMAT) Transdisciplinary Program inTranslational Medicine and Therapeutics.
R E F E R E N C E S
Adriani, W., Granstrem, O., Macri, S., Izykenova, G., Dambinova, S.,Laviola, G., 2004. Behavioral and neurochemical vulnerabilityduring adolescence in mice: studies with nicotine.Neuropsychopharmacology 29, 869–878.
Alexander, A.L., Lee, J.E., Lazar, M., Boudos, R., DuBray, M.B.,Oakes, T.R., Miller, J.N., Lu, J., Jeong, E.K., McMahon, W.M.,Bigler, E.D., Lainhart, J.E., 2007. Diffusion tensor imaging of thecorpus callosum in autism. NeuroImage 34, 61–73.
Amaral, D.G., Schumann, C.M., Nordahl, C.W., 2008.Neuroanatomy of autism. Trends Neurosci. 31, 137–145.
Ameis, S.H., Fan, J., Rockel, C., Voineskos, A.N., Lobaugh, N.J.,Soorya, L., Wang, A.T., Hollander, E., Anagnostou, E., 2011.Impaired structural connectivity of socio-emotional circuits inautism spectrum disorders: a diffusion tensor imaging study.PLoS One 6, e28044.
American Psychiatric Association, 2001. Diagnostic andstatistical manual of mental disorders, 4th ed. Washington,DC, pp. 70–84.
Anagnostou, E., Taylor, M.J., 2011. Review of neuroimaging inautism spectrum disorders: what have we learned and wherewe go from here. Mol Autism. 2, 4.
Barnea-Goraly, N., Kwon, H., Menon, V., Eliez, S., Lotspeich, L.,Reiss, A.L., 2004. White matter structure in autism: preliminary
66 B R A I N R E S E A R C H 1 4 5 5 ( 2 0 1 2 ) 5 6 – 6 7
evidence from diffusion tensor imaging. Biol. Psychiatry 55,323–326.
Bauman, M.L., Kemper, T.L., 2005. Neuroanatomic observations ofthe brain in autism: a review and future directions. Int. J. Dev.Neurosci. 23, 183–187.
Belmonte, M.K., Allen, G., Beckel-Mitchener, A., Boulanger, L.M.,Carper, R.A., Webb, S.J., 2004. Autism and abnormaldevelopment of brain connectivity. J. Neurosci. 24,9228–9231.
Bode, M.K., Mattila, M.L., Kiviniemi, V., Rahko, J., Moilanen, I.,Ebeling, H., Tervonen, O., Nikkinen, J., 2011. White matter inautism spectrum disorders — evidence of impaired fiberformation. Acta Radiol. 52, 1169–1174.
Brito, A.R., Vasconcelos, M.M., Domingues, R.C., Hygino da Cruz Jr.,L.C., Rodrigues Lde, S., Gasparetto, E.L., Calcada, C.A., 2009.Diffusion tensor imaging findings in school-aged autisticchildren. J. Neuroimaging 19, 337–343.
Brodkin, E.S., 2007. BALB/c mice: low sociability and otherphenotypes that may be relevant to autism. Behav. Brain Res.176, 53–65.
Brodkin, E.S., Hagemann, A., Nemetski, S.M., Silver, L.M., 2004.Social approach-avoidance behavior of inbred mouse strainstowards DBA/2 mice. Brain Res. 1002, 151–157.
Carper, R.A., Moses, P., Tigue, Z.D., Courchesne, E., 2002. Cerebrallobes in autism: early hyperplasia and abnormal age effects.NeuroImage 16, 1038–1051.
Chung, M.K., Dalton, K.M., Alexander, A.L., Davidson, R.J., 2004.Less white matter concentration in autism: 2D voxel-basedmorphometry. NeuroImage 23, 242–251.
Courchesne, E., 1997. Brainstem, cerebellar and limbicneuroanatomical abnormalities in autism. Curr. Opin.Neurobiol. 7, 269–278.
Courchesne, E., Campbell, K., Solso, S., 2011. Brain growth acrossthe life span in autism: age-specific changes in anatomicalpathology. Brain Res. 1380, 138–145.
Crawley, J.N., 2007. Mouse behavioral assays relevant to thesymptoms of autism. Brain Pathol. 17, 448–459.
Dawson, G., Carver, L., Meltzoff, A.N., Panagiotides, H.,McPartland, J., Webb, S.J., 2002. Neural correlates of face andobject recognition in young children with autism spectrumdisorder, developmental delay, and typical development. ChildDev. 73, 700–717.
Dye, C.A., El Shawa, H., Huffman, K.J., 2011. A lifespan analysisof intraneocortical connections and gene expression in themouse II. Cereb. Cortex. 21, 1331–1350.
Esbensen, A.J., Seltzer, M.M., Lam, K.S., Bodfish, J.W., 2009.Age-related differences in restricted repetitive behaviors inautism spectrum disorders. J. Autism Dev. Disord. 39, 57–66.
Fairless, A.H., Dow, H.C., Toledo, M.M., Malkus, K.A., Edelmann,M., Li, H., Talbot, K., Arnold, S.E., Abel, T., Brodkin, E.S., 2008.Low sociability is associated with reduced size of the corpuscallosum in the BALB/cJ inbred mouse strain. Brain Res. 1230,211–217.
Fairless, A.H., Dow, H.C., Kreibich, A.S., Torre, M., Kuruvilla, M.,Gordon, E., Morton, E.A., Tan, J., Berrettini, W.H., Li, H., Abel, T.,Brodkin, E.S., 2012. Sociability and brain development in BALB/cJ and C57BL/6J mice. Behav. Brain Res. doi:10.1016/j.bbr.2011.12.001
Farrell, J.A., Landman, B.A., Jones, C.K., Smith, S.A., Prince, J.L., vanZijl, P.C., Mori, S., 2007. Effects of signal-to-noise ratio on theaccuracy and reproducibility of diffusion tensor imaging-derived fractional anisotropy, mean diffusivity, and principaleigenvector measurements at 1.5 T. J. Magn. Reson. Imaging26, 756–767.
Fecteau, S., Mottron, L., Berthiaume, C., Burack, J.A., 2003.Developmental changes of autistic symptoms. Autism 7,255–268.
Franklin, K.B.J., Paxinos, G., 2007. The Mouse Brain in StereotaxicCoordinates, 3rd edition. Academic Press, San Diego. Vol.
Geschwind, D.H., Levitt, P., 2007. Autism spectrum disorders:developmental disconnection syndromes. Curr. Opin.Neurobiol. 17, 103–111.
Grelotti, D.J., Gauthier, I., Schultz, R.T., 2002. Social interest andthe development of cortical face specialization: what autismteaches us about face processing. Dev. Psychobiol. 40, 213–225.
Hu, L., Sun, Y., Villasana, L.E., Paylor, R., Klann, E., Pautler, R.G.,2009. Early changes in the apparent diffusion coefficient (ADC)in a mouse model of Sandhoff's disease occur prior to diseasesymptoms and behavioral deficits. Magn. Reson. Med. 62,1175–1184.
Ingalhalikar, M., Parker, D., Bloy, L., Roberts, T.P., Verma, R., 2011.Diffusion based abnormality markers of pathology: towardlearned diagnostic prediction of ASD. NeuroImage 57, 918–927.
Jang, S.H., 2011. A review of diffusion tensor imaging studies onmotor recovery mechanisms in stroke patients.NeuroRehabilitation 28, 345–352.
Jones, D.K., Simmons, A., Williams, S.C., Horsfield, M.A., 1999.Non-invasive assessment of axonal fiber connectivity in thehuman brain via diffusion tensor MRI. Magn. Reson. Med. 42,37–41.
Just, M.A., Cherkassky, V.L., Keller, T.A., Minshew, N.J., 2004.Cortical activation and synchronization during sentencecomprehension in high-functioning autism: evidence ofunderconnectivity. Brain 127, 1811–1821.
Ke, X., Tang, T., Hong, S., Hang, Y., Zou, B., Li, H., Zhou, Z., Ruan, Z.,Lu, Z., Tao, G., Liu, Y., 2009. White matter impairments inautism, evidence from voxel-based morphometry anddiffusion tensor imaging. Brain Res. 1265, 171–177.
Keller, T.A., Kana, R.K., Just, M.A., 2007. A developmental studyof the structural integrity of white matter in autism.Neuroreport 18, 23–27.
Kim, S., Pickup, S., Poptani, H., 2010. Effects of cardiac pulsationin diffusion tensor imaging of the rat brain. J. Neurosci.Methods 194, 116–121.
Kim, S., Pickup, S., Fairless, A.H., Ittyerah, R., Dow, H.C., Abel, T.,Brodkin, E.S., Poptani, H., 2012. Association between sociabilityand diffusion tensor imaging in BALB/cJ mice. NMR Biomed.25, 104–112.
Kluver, H., Barrera, E., 1953. Amethod for the combined staining ofcells and fibers in the nervous system. J. Neuropathol. Exp.Neurol. 12, 400–403.
Laitinen, T., Sierra, A., Pitkanen, A., Grohn, O., 2010. Diffusiontensor MRI of axonal plasticity in the rat hippocampus.NeuroImage 51, 521–530.
Lange, N., Dubray, M.B., Lee, J.E., Froimowitz, M.P., Froehlich, A.,Adluru, N., Wright, B., Ravichandran, C., Fletcher, P.T., Bigler,E.D., Alexander, A.L., Lainhart, J.E., 2010. Atypical diffusion tensorhemispheric asymmetry in autism. Autism Res. 3, 350–358.
Lazar, M., Miles, L., Donaldson, J., Jensen, J.H., Ming, J.C., 2011.Atypical gray and white matter microstructure in autismspectrum disorders. In International Society for MagneticResonance in Medicine. Vol. 19, eds. International Society forMagnetic Resonance in Medicine, Montreal, Canada, pp. 350.
Lim, K.O., Helpern, J.A., 2002. Neuropsychiatric applications of DTI— a review. NMR Biomed. 15, 587–593.
McFarlane, H.G., Kusek, G.K., Yang, M., Phoenix, J.L., Bolivar, V.J.,Crawley, J.N., 2008. Autism-like behavioral phenotypes in BTBRT+tf/J mice. Genes Brain Behav. 7, 152–163.
Minshew, N.J., Goldstein, G., Siegel, D.J., 1997. Neuropsychologicfunctioning in autism: profile of a complex informationprocessing disorder. J. Int. Neuropsychol. Soc. 3, 303–316.
Molko, N., Pappata, S., Mangin, J.F., Poupon, C., Vahedi, K., Jobert,A., LeBihan, D., Bousser, M.G., Chabriat, H., 2001. Diffusiontensor imaging study of subcortical gray matter in CADASIL.Stroke 32, 2049–2054.
Moy, S.S., Nonneman, R.J., Young, N.B., Demyanenko, G.P.,Maness, P.F., 2009. Impaired sociability and cognitive functionin Nrcam-null mice. Behav. Brain Res. 205, 123–131.
67B R A I N R E S E A R C H 1 4 5 5 ( 2 0 1 2 ) 5 6 – 6 7
Noriuchi, M., Kikuchi, Y., Yoshiura, T., Kira, R., Shigeto, H., Hara,T., Tobimatsu, S., Kamio, Y., 2010. Altered white matterfractional anisotropy and social impairment in children withautism spectrum disorder. Brain Res. 1362, 141–149.
Palmen, S.J., van Engeland, H., Hof, P.R., Schmitz, C., 2004.Neuropathological findings in autism. Brain 127,2572–2583.
Panksepp, J.B., Lahvis, G.P., 2007. Social reward among juvenilemice. Genes Brain Behav. 6, 661–671.
Panksepp, J.B., Jochman, K.A., Kim, J.U., Koy, J.J., Wilson, E.D.,Chen, Q., Wilson, C.R., Lahvis, G.P., 2007. Affiliative behavior,ultrasonic communication and social reward are influenced bygenetic variation in adolescent mice. PLoS One 2, e351.
Piven, J., Harper, J., Palmer, P., Arndt, S., 1996. Course ofbehavioral change in autism: a retrospective study of high-IQadolescents and adults. J. Am. Acad. Child Adolesc. Psychiatry35, 523–529.
Richler, J., Huerta, M., Bishop, S.L., Lord, C., 2010. Developmentaltrajectories of restricted and repetitive behaviors and interestsin children with autism spectrum disorders. Dev.Psychopathol. 22, 55–69.
Rumsey, J.M., Rapoport, J.L., Sceery, W.R., 1985. Autistic childrenas adults: psychiatric, social, and behavioral outcomes. J. Am.Acad. Child Psychiatry. 24, 465–473.
Sankoorikal, G.M., Kaercher, K.A., Boon, C.J., Lee, J.K., Brodkin, E.S.,2006. A mouse model system for genetic analysis of sociability:C57BL/6J versus BALB/cJ inbred mouse strains. Biol. Psychiatry59, 415–423.
Schmitz, C., Rezaie, P., 2008. The neuropathology of autism: wheredo we stand? Neuropathol. Appl. Neurobiol. 34, 4–11.
Schultz, R.T., 2005. Developmental deficits in social perception inautism: the role of the amygdala and fusiform face area. Int. J.Dev. Neurosci. 23, 125–141.
Schumann, C.M., Bloss, C.S., Barnes, C.C., Wideman, G.M., Carper,R.A., Akshoomoff, N., Pierce, K., Hagler, D., Schork, N., Lord, C.,Courchesne, E., 2010. Longitudinal magnetic resonanceimaging study of cortical development through earlychildhood in autism. J. Neurosci. 30, 4419–4427.
Shereen, A., Nemkul, N., Yang, D., Adhami, F., Dunn, R.S., Hazen,M.L., Nakafuku, M., Ning, G., Lindquist, D.M., Kuan, C.Y., 2011.Ex vivo diffusion tensor imaging and neuropathologicalcorrelation in a murine model of hypoxia–ischemia-inducedthrombotic stroke. J. Cereb. Blood Flow Metab. 31,1155–1169.
Shukla, D.K., Keehn, B., Smylie, D.M., Muller, R.A., 2011.Microstructural abnormalities of short-distance white mattertracts in autism spectrum disorder. Neuropsychologia 49,1378–1382.
Silverman, J.L., Yang, M., Lord, C., Crawley, J.N., 2010. Behaviouralphenotyping assays for mouse models of autism. Nat. Rev.Neurosci. 11, 490–502.
Singer, J.D., Willett, J.B., 2003. Introducing the multi-level modelfor change. In: Applied Longitudinal Data Analysis: ModelingChange and Event Occurrence. Oxford University Press,Oxford, pp. 45–74 (ISBN 0-19-515296-4).
Skranes, J., Vangberg, T.R., Kulseng, S., Indredavik, M.S., Evensen,K.A., Martinussen, M., Dale, A.M., Haraldseth, O., Brubakk,A.M., 2007. Clinical findings and white matter abnormalitiesseen on diffusion tensor imaging in adolescents with very lowbirth weight. Brain 130, 654–666.
Stephenson, D.T., O'Neill, S.M., Narayan, S., Tiwari, A., Arnold, E.,Samaroo, H.D., Du, F., Ring, R.H., Campbell, B., Pletcher, M.,Vaidya, V.A., Morton, D., 2011. Histopathologiccharacterization of the BTBR mouse model of autistic-likebehavior reveals selective changes in neurodevelopmentalproteins and adult hippocampal neurogenesis.Mol Autism. 2, 7.
Sundaram, S.K., Kumar, A., Makki, M.I., Behen, M.E., Chugani, H.T.,Chugani, D.C., 2008. Diffusion tensor imaging of frontal lobe inautism spectrum disorder. Cereb Cortex. 18, 2659–2665.
Tabuchi, K., Blundell, J., Etherton, M.R., Hammer, R.E., Liu, X.,Powell, C.M., Sudhof, T.C., 2007. A neuroligin-3 mutationimplicated in autism increases inhibitory synaptictransmission in mice. Science 318, 71–76.
Tang, C.Y., Friedman, J.I., Carpenter, D.M., Novakovic, V., Eaves, E.,Ng, J., Wu, Y.W., Gottlieb, S., Wallenstein, S., Moshier, E.,Parrella, M., White, L., Bowler, S., McGinn, T.G., Flanagan, L.,Davis, K.L., 2011. The effects of hypertension and body massindex on diffusion tensor imaging in schizophrenia. Schizophr.Res. 130, 94–100.
Thomason, M.E., Thompson, P.M., 2011. Diffusion imaging, whitematter, and psychopathology. Annu. Rev. Clin. Psychol. 7,63–85.
Hygino da Cruz Jr., L.C., Vieira, I.G., Domingues, R.C., 2011.Diffusion MR imaging: an important tool in the assessmentof brain tumors. Neuroimaging Clin. N. Am. 21, 27–49 vii.
Walther, S., Federspiel, A., Horn, H., Razavi, N., Wiest, R., Dierks,T., Strik, W., Muller, T.J., 2011. Alterations of white matterintegrity related to motor activity in schizophrenia. Neurobiol.Dis. 42, 276–283.
Wang, S., Kim, S., Chawla, S., Wolf, R.L., Knipp, D.E., Vossough, A.,O'Rourke, D.M., Judy, K.D., Poptani, H., Melhem, E.R., 2011.Differentiation between glioblastomas, solitary brainmetastases, and primary cerebral lymphomas using diffusiontensor and dynamic susceptibility contrast-enhanced MRimaging. AJNR Am J Neuroradiol. 32, 507–514.
Copyright © 2022 FDOKUMEN