Davis f. perceived udsefulness perceived ease of use and user acceptance of information technology

ARTICLE IN PRESS
www.elsevier.com/locate/compedu
Computers & Education xxx (2005) xxx–xxx
Measuring perceived sociability of computer-supportedcollaborative learning environments
Karel Kreijns a,*, Paul A. Kirschner b, Wim Jochems b, Hans van Buuren c
a Open Universiteit Nederland, Ruud de Moor Center for Teacher Professionalization, P.O. Box 2960,
6401 DL Heerlen, The Netherlandsb Open Universiteit Nederland, Educational Technology Expertise Center (OTEC), Heerlen, The Netherlands
c Open Universiteit Nederland, Department of Psychology, Heerlen, The Netherlands
Received 7 February 2005; accepted 13 May 2005
Abstract
Most asynchronous computer-supported collaborative learning (CSCL) environments can be charac-terized as functional environments because they focus on functional, task-specific support, often disre-garding explicit support for the social (emotional) aspects of learning in groups which areacknowledged by many educational researchers to be essential for effective collaborative learning. Incontrast, sociable CSCL environments emphasize the social (emotional) aspects of group learning.We define sociability as the extent to which a CSCL environment is perceived to be able to facilitatethe emergence of a sound social space with attributes as trust and belonging, a strong sense of com-munity, and good working relationships. Specific environmental characteristics, which we have desig-nated social affordances, determine sociability.
This explorative study deals with the construction and preliminary validation of a self-reporting (Dutchlanguage) Sociability Scale for determining the perceived degree of sociability of CSCL environments. It isone-dimensional Scale consisting of 10 items and has an internal consistency of 0.92. It was further vali-dated on the basis of a well-developed nomological network. The results of the explorative study are prom-ising and show that the sociability scale has the potential to be useful as a measure for perceived sociability.� 2005 Elsevier Ltd. All rights reserved.
0360-1315/$ - see front matter � 2005 Elsevier Ltd. All rights reserved.
doi:10.1016/j.compedu.2005.05.004
* Corresponding author.E-mail address: [email protected] (K. Kreijns).

2 K. Kreijns et al. / Computers & Education xxx (2005) xxx–xxx
ARTICLE IN PRESS
Keywords: Architectures for educational technology system; Computer-mediated communication; Cooperative/collaborative learning; Distributed learning environments
1. Introduction
The emergence of computer-mediated worldwide networks has enabled a shift from collab-orative learning in contiguous learning groups to collaborative learning in asynchronous dis-tributed learning groups (DLGs) by utilizing asynchronous and synchronous computer-supported collaborative learning (CSCL) environments connected to these networks. Toachieve such learning many developed countries have embraced both of these modes makinguse of synchronous techniques based upon broadband technology applications such as NetMe-eting� and asynchronous techniques based upon lean text-based technologies for chat, discus-sion forums, and e-mail. Developing countries, however, do not have this luxury and arerelegated to primarily using the latter. Also, the demographics of life-long learners (i.e., postinitial learners, often with a job, a family, or both) necessitate the organization, planning,and instrumentation of learning in a temporally distributed manner making asynchronousCSCL also both attractive and necessary in developed countries. In other words, the require-ments of worldwide learning and life long learning, both of which fulfill the requirements im-posed by the current and future demands of today�s knowledge society, favor the use ofasynchronous CSCL environments.
The communication between learners and instructors in asynchronous CSCL environmentsis mediated through subsystems (e-mail, discussion forums, chat) embedded or integrated with-in the CSCL environment. Although the CSCL environments support social interaction andcollaboration, empirical research and field observation show findings that are not always po-sitive about their working (Hallet & Cummings, 1997; see also Heath, 1998). Hobaugh (1997),for example, observed that inadequate group dynamics amongst group members in onlinegroups ‘‘is often the major cause of ineffective group action; unfortunately, either very littleattention is devoted to it, or it is not well understood by instructors or students, or both’’(�Planning for Interaction�). Indeed, educational researchers predominantly focus on the sup-port of social interaction aimed at cognitive processes for collaborative learning (the educa-tional dimension of social interaction) and less on the support of social interaction aimedat socio-emotional processes underlying group dynamics; the so-called social (psychological)dimension of social interaction. Moreover, the majority of these researchers – consciouslyor unconsciously – take for granted that group dynamic processes occur in CSCL environ-ments, just as in face-to-face settings, although this may be not true. In addition, it appearsthat researchers think that encouragement for group dynamics is not needed because they be-lieve that the only thing learners want to do is to learn and everything that distracts from that(i.e., group dynamics) should be avoided. Finally, there is also a group of researchers who for-get to pay attention to group dynamics because they are not aware of the importance ofgroup dynamics and its implications for collaborative learning. In sum, most researchers sim-ply forget, neglect or ignore to study and support the group dynamics within the CSCL envi-ronment. As a result functional CSCL environments are developed. This conclusion is

K. Kreijns et al. / Computers & Education xxx (2005) xxx–xxx 3
ARTICLE IN PRESS
confirmed by Cutler (1996) who remarked that the ‘‘current literature surrounding CMC(computer-mediated communication) is almost entirely task-based and focused on cost, effi-ciency, and productivity with little attention given either to the changes effected on the peopleor to the social relations created from using the communication technologies’’ (p. 320). In gen-eral, typical functional CSCL environments are those where the CMC subsystem is the CSCLenvironment.
However, a growing number of researchers from a variety of disciplines (e.g., computer-supported collaborative work, social psychology, organizational behavior) point out that thisfunctional perspective alone is a very limited one. Forgetting, neglecting or ignoring social psy-chological processes such as group forming, establishing group structures and sustaining socialrelationships is considered as a pitfall (see Kreijns, Kirschner, & Jochems, 2003). Sproull andFaraj (1997) stressed that ‘‘People on the net are not only solitary information processors but alsosocial beings. They are not only looking for information; they are also looking for affiliation, sup-port and affirmation. Thinking of people on the net as social actors evokes a metaphor of a gath-ering. Behaviors appropriate at the gathering include chatting, discussing, arguing, and confiding.People go to a gathering to find others with common interests and talk with or listen to them.When they find a gathering they like, they return to it again and again’’ (p. 38). Donath (1997)advocates the design of on-line social environments. She believes that in order to foster the devel-opment of vibrant and viable online communities, the environment must provide the means tocommunicate social cues and information. This means that users of an environment must be ableto perceive the social patterns of activity and affiliation and the community using it must be ableto develop a fluid and subtle cultural vocabulary. In other words, what we actually need are soci-able CSCL environments, that is CSCL environments with both educational functionality and so-cial functionality. Such sociable CSCL environments not only fulfill the learning needs of thestudents, but also fulfill their social (psychological) needs, thereby making a complete learningexperience.
Sociable CSCL environments enable and facilitate socio-emotional processes such as affilia-tion and getting to know each other which aim at developing interpersonal relationships, trustbuilding, social cohesiveness and a sense of community and the emergence of a sound socialspace. Johnson and Johnson (1989) see interpersonal trust as a major factor enabling effectivecollaboration: ‘‘To disclose one�s reasoning and information, one must trust the other individ-uals involved in the situation to listen with respect’’ (p. 72). Forsyth (1990), Shaw (1981), andGuzzo and Dickson (1996) all have found social cohesiveness positively mediates group per-formance. Wegerif (1998), for example, noted that ‘‘forming a sense of community, where peo-ple feel they will be treated sympathetically by their fellows, seems to be a necessary first stepfor collaborative learning. Without a feeling of community people are on their own, likely tobe anxious, defensive and unwilling to take the risks involved in learning’’ (p. 48). Gunawar-dena (1995) argues that online constructivist learning environments may promote collaborativelearning ‘‘only if participants can relate to one another, share a sense of community and acommon goal. The development of social presence [social presence will be explained hereafter]and a sense of online community becomes the key to promoting collaborative learning andknowledge building’’ (p. 164).
Within distance educational settings such as those found at open universities (e.g., the Open Uni-versiteit Nederland), the application of sociable CSCL environments can be a critical success fac-

4 K. Kreijns et al. / Computers & Education xxx (2005) xxx–xxx
ARTICLE IN PRESS
tor. When groups are formed in these settings, the group members do not initially know each otherand the group has no history. Sociable CSCL environments can help to develop group dynamics ina positive direction, and thus reduce feelings of loneliness and isolation thereby reducing drop-out(Phillips, 1990; Rovai, 2001).
Our research on fostering and enhancing social interaction in (asynchronous) distance learninggroups is aimed at the design and implementation of sociable CSCL environments. The researchis based upon a theoretical framework (see Kreijns & Kirschner, 2004; Kreijns, Kirschner, &Jochems, 2002) encompassing:
1. the ecological approach to social interaction, comprising the concept of social affordances(Gaver, 1996; Gibson, 1986);
2. the concept of the sociability of CSCL environments (Kreijns et al., 2002); and3. social presence theory (Gunawardena, 1995; Short, Williams, & Christie, 1976; Tammelin,
1998; Tu, 2000, 2002; Tu & McIsaacs, 2002).
It is beyond the scope of this article to discuss in full detail the first and last of these issues of theframework, but this discussion can be found in Kreijns et al. (2002) and Kreijns and Kirschner(2004). On the other hand, we cannot completely neglect these issues here since they are closelyrelated to sociability and the need for a very precise distinction between perceived sociabilityand perceived social presence is of the utmost importance.
The sociability of CSCL environments refers to how CSCL environments can differ intheir ability to facilitate the emergence of a social space; the human network of social rela-tionships between group members which is embedded in group structures of norms and val-ues, rules and roles, beliefs and ideals. To express the differences in ability in the creation ofa social space, the term sociability is introduced. We define sociability as the extent to whicha CSCL environment is perceived to be able to facilitate the emergence of a sound socialspace. We designate a social space to be �sound� if the social space is characterized by affec-tive work relationships, strong group cohesiveness, trust, respect and belonging, satisfaction,and a strong sense of community. In our perspective, sociability is determined by specificenvironmental characteristics, which we have designated social affordances (Kreijns et al.,2002).
In order to clarify the concept of social affordances a canonical example of a real life socialaffordance device is given here. The water cooler is a place where people gather and have ca-sual conversations and communicate informally with each other. These impromptu encountersoffer serendipitous moments to exchange not only task related information but also socio-emotional information. The water cooler becomes a place where people can get to know eachother and experience whom they can trust, who the experts are, what the interests of othersare, and so on. In sociable CSCL environments, electronic equivalents of the water coolershould be integrated in these environments. These electronic social affordance devices providegroup awareness information to the group members; up-to-the-minute understanding of thewhereabouts of the members of the group in the form of where they are and what theyare doing at the moment the information is inspected (cf., Gutwin, 1997). This creates a feel-ing of being in each other�s proximity. Of course, this is only true when group members areonline. When members are offline, the updating is stopped, but the information gathered is

K. Kreijns et al. / Computers & Education xxx (2005) xxx–xxx 5
ARTICLE IN PRESS
still available for inspection (i.e., the information can be interpreted as traces or footprints).Group awareness information is usually presented in a graphical manner and different typesof group awareness information can be displayed simultaneously (Kreijns et al., 2002). Finally,easy access to the CMC subsystem is warranted for approachable communication.
We hypothesize that sociability is a factor which influences social interaction: the greater thesociability of an environment, the more likely it is that social interaction will take place and thatit will result in the emergence of a sound social space.
Social presence is another factor influencing social interaction (Gunawardena, 1995; Tam-melin, 1998; Tu, 2000, 2002; Tu & Isaacs, 2002). Short et al. (1976) originally define socialpresence as the ‘‘degree of salience of the other person in the interaction and the consequentsalience of the interpersonal relationships’’ (p. 65). We define social presence as the perceiveddegree of illusion that the other in the communication appears to be a �real� physical personin either an immediate (i.e., real time or synchronous) or a delayed (i.e., time-deferred orasynchronous) communication episode. Tu (2000), linking social learning theory to the con-cept of social presence, contends that social presence ‘‘is required to enhance and foster on-line social interaction, which is the major vehicle of social learning’’ (p. 27). If ‘‘socialpresence is low, the foundation of social learning, social interaction, does not occur’’(p. 30). Rourke, Anderson, Garrison, and Archer (1999) point to two important functionsof social presence in their community of inquiry model: (1) it supports ‘‘cognitive objectivesthrough its ability to instigate, sustain, and support critical thinking’’ (p. 52); (2) it supports‘‘affective objectives by making group interactions appealing, engaging, and thus intrinsicallyrewarding’’ (p. 52).
Group awareness is hypothesized to be one of the factors that is contributing to the perceptionof social presence because it – by definition – presents dynamic information about the group mem-bers or their traces thereby enhancing the illusion of the �presence� of the other. In a sense it can beargued that sociability contributes to social presence because group awareness is part of the socialaffordance device, which, in turn, determines sociability.
Because our framework emphasizes the promotion of social interaction in the social (psy-chological) dimension, it complements existing pedagogical techniques that emphasize socialinteraction in the educational dimension. The framework acknowledges that in order to createa sound social space, the environment (i.e., the CSCL environment), the people �inhabiting� theenvironment (i.e., the learners/group members), and the activities they carry out (i.e., thoselearning activities that are determined by the pedagogical techniques) are all equally impor-tant. The theoretical framework uses a number of variables that affect social interaction inCSCL environments. Social interaction, in turn, affects the creation of a social space. Fig. 1summarizes the relationships between the variables and pinpoints the relative importance ofsociability in the whole picture.
To study the various relationships an instrument that measures the perceived sociability ofCSCL environments is needed. Such an instrument will be helpful for designers and imple-menters of CSCL environments by allowing them to determine whether and to what extentan environment has or lacks social functionality and whether and which changes in the envi-ronment lead to its improvement. Since the current body of literature revealed that there is noinstrument available that measures the sociability of CSCL environments, we needed to devel-

Fig. 1. Relationships between the variables sociability, social presence, pedagogical techniques, social interaction, andsocial space.
6 K. Kreijns et al. / Computers & Education xxx (2005) xxx–xxx
ARTICLE IN PRESS
op and validate such an instrument. The (refined) Sociability Scale is presented in the nextsection.
2. The Sociability Scale
The Sociability Scale is a self-reporting questionnaire for measuring the perceived sociability ofa CSCL environment. This scale consists of 10 items (see Table 1). The four last columns showstatistical data discussed in Section 5.
Table 1The Sociability Scale
No.item
Item M SD Factorsociability
1 This CSCL environment enables me to easily contact my team mates 3.30 1.03 0.772 I do not feel lonely in this CSCL environment 2.90 1.18 0.693 This CSCL environment enables me to get a good impression of my team
mates2.58 0.98 0.80
4 This CSCL environment allows spontaneous informal conversations 2.75 1.14 0.685 This CSCL environment enables us to develop into a well performing team 2.76 1.05 0.806 This CSCL environment enables me to develop good work relationships
with my team mates3.19 1.05 0.84
7 This CSCL environment enables me to identify myself with the team 2.96 1.07 0.798 I feel comfortable with this CSCL environment 3.44 1.06 0.839 This CSCL environment allows for non-task-related conversations 3.61 0.99 0.6910 This CSCL environment enables me to make close friendships with my
team mates2.49 1.13 0.73
Note. Judgments were made on 5-point Likert scales (1 = not applicable at all; 2 = rarely applicable; 3 = moderately
applicable; 4 = largely applicable; 5 = totally applicable).
K. Kreijns et al. / Computers & Education xxx (2005) xxx–xxx 7
ARTICLE IN PRESS
3. Method
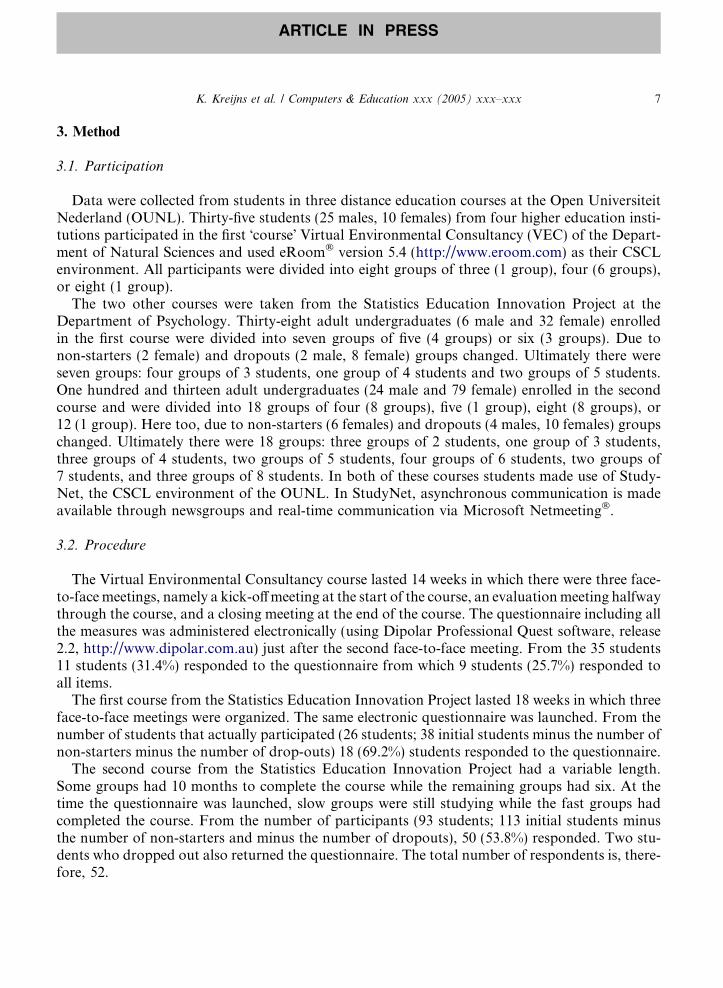
3.1. Participation
Data were collected from students in three distance education courses at the Open UniversiteitNederland (OUNL). Thirty-five students (25 males, 10 females) from four higher education insti-tutions participated in the first �course� Virtual Environmental Consultancy (VEC) of the Depart-ment of Natural Sciences and used eRoom� version 5.4 (http://www.eroom.com) as their CSCLenvironment. All participants were divided into eight groups of three (1 group), four (6 groups),or eight (1 group).
The two other courses were taken from the Statistics Education Innovation Project at theDepartment of Psychology. Thirty-eight adult undergraduates (6 male and 32 female) enrolledin the first course were divided into seven groups of five (4 groups) or six (3 groups). Due tonon-starters (2 female) and dropouts (2 male, 8 female) groups changed. Ultimately there wereseven groups: four groups of 3 students, one group of 4 students and two groups of 5 students.One hundred and thirteen adult undergraduates (24 male and 79 female) enrolled in the secondcourse and were divided into 18 groups of four (8 groups), five (1 group), eight (8 groups), or12 (1 group). Here too, due to non-starters (6 females) and dropouts (4 males, 10 females) groupschanged. Ultimately there were 18 groups: three groups of 2 students, one group of 3 students,three groups of 4 students, two groups of 5 students, four groups of 6 students, two groups of7 students, and three groups of 8 students. In both of these courses students made use of Study-Net, the CSCL environment of the OUNL. In StudyNet, asynchronous communication is madeavailable through newsgroups and real-time communication via Microsoft Netmeeting�.
3.2. Procedure
The Virtual Environmental Consultancy course lasted 14 weeks in which there were three face-to-facemeetings, namely a kick-offmeeting at the start of the course, an evaluationmeeting halfwaythrough the course, and a closing meeting at the end of the course. The questionnaire including allthe measures was administered electronically (using Dipolar Professional Quest software, release2.2, http://www.dipolar.com.au) just after the second face-to-face meeting. From the 35 students11 students (31.4%) responded to the questionnaire from which 9 students (25.7%) responded toall items.
The first course from the Statistics Education Innovation Project lasted 18 weeks in which threeface-to-face meetings were organized. The same electronic questionnaire was launched. From thenumber of students that actually participated (26 students; 38 initial students minus the number ofnon-starters minus the number of drop-outs) 18 (69.2%) students responded to the questionnaire.
The second course from the Statistics Education Innovation Project had a variable length.Some groups had 10 months to complete the course while the remaining groups had six. At thetime the questionnaire was launched, slow groups were still studying while the fast groups hadcompleted the course. From the number of participants (93 students; 113 initial students minusthe number of non-starters and minus the number of dropouts), 50 (53.8%) responded. Two stu-dents who dropped out also returned the questionnaire. The total number of respondents is, there-fore, 52.

8 K. Kreijns et al. / Computers & Education xxx (2005) xxx–xxx
ARTICLE IN PRESS
3.3. Instrumentation
In our validation process, we used five measures that deal with constructs that are related to thesociability construct. These measures are:
1. Social Space Scale (Kreijns, Kirschner, Jochems, & Van Buuren, 2004),2. Social Presence Indicators (Gunawardena, 1995),3. Social Presence Scale (Gunawardena & Zittle, 1997),4. Work-Group Cohesiveness Index (Price & Mueller, 1986),5. Group Atmosphere Scale (Fiedler, 1962, 1967).
We briefly describe each of these measures in the next sub-sections.
3.3.1. The Social Space ScaleThe Social Space Scale (Kreijns et al., 2004) measures the degree of the perceived quality of the
social space that exists in asynchronous distributed learning group. The scale has two dimensions:Positive Group Behavior and Negative Group Behavior. Each dimension contains 10, 5-pointLikert scale items. Examples of the test items are: �Group members felt free to criticize the ideas,statements, and/or opinions of others�, �Group members gave personal information on them-selves�, and �Group members grew to dislike others�. Because sociability contributes to socialspace, we expected a moderate correlation between the Social Space Scale and the SociabilityScale. A high correlation would mean that the Sociability Scale is measuring aspects of socialspace (or vice versa). Like the Sociability Scale, the Social Space Scale was constructed and val-idated in an explorative study.
3.3.2. The Gunawardena Social Presence IndicatorsGunawardena (1995) used a questionnaire of a total of 17, 5-point bipolar scale items (see
Appendix 1) to assess a range of feelings students have towards CMC. She equated this to theperceived social presence. In this study, we refer to these bi-polar scale items as the Social Pres-ence Indicators. We expected a high correlation between this measure and the Sociability Scalebecause we believed the test items measure, amongst other things, many aspects of the sociabilityof CMC (e.g., see the item �sociable–unsociable�). The items of the scale were translated intoDutch.
3.3.3. The Gunawardena and Zittle Social Presence ScaleThe Gunawardena and Zittle (1997) Social Presence Scale is an alternative scale for measuring
social presence and, thus, can be used interchangeably with the Social Presence Indicators. TheSocial Presence Scale consists of 14, 5-point Likert-scale items (see Appendix 2). Examples of testitems are: �I felt comfortable conversing through this text-based medium� and �The moderatorscreated a feeling of an on-line community�. We slightly adapted the items of their Social PresenceScale to fit our particular setting and then translated them into Dutch. For the same reasons aswith the Social Presence Indicators, we expected a high correlation between the Social Space Scaleand the Sociability Scale. In this study, we did not consider� the items 9, 10, and 11, because theygo beyond the scope of our interest (i.e., the sociability construct).

K. Kreijns et al. / Computers & Education xxx (2005) xxx–xxx 9
ARTICLE IN PRESS
3.3.4. The Price and Mueller Work Group Cohesion IndexPrice and Mueller (1986) developed their Work Group Cohesion Index to measure workgroup
cohesion in an organizational context. The Work Group Cohesion Index consists out of five,5-point Likert scale items (see Appendix 3). Sociability is affecting social space, and an attributeof social space is social cohesiveness. Therefore, we expected a moderate correlation between theSociability Scale and the Work Group Cohesion Index. The items of this measure were also trans-lated into Dutch.
3.3.5. Fiedler�s Group Atmosphere ScaleFiedler (1967) developed the Group Atmosphere Scale, which makes use of an 8-point scale for
determining the atmosphere in a group as perceived by the group members (see Appendix 4). In-stead of using 8-point scales we used 5-point scales to concur with the other scales used. Sociabil-ity is affecting group atmosphere (social climate). We, thus, expected a moderate correlationbetween our Sociability Scale and the Group Atmosphere Scale. Nevertheless, since the GroupAtmosphere Scale is also very similar to the Social Presence Indicators, we expected the correla-tion to be of the same magnitude as the correlation between Sociability Scale and Social PresenceIndicators. The items of the Group Atmosphere Scale were translated into Dutch.
4. Construction and refinement of the raw Sociability Scale
4.1. Constructing the raw Sociability Scale
When we constructed the raw Sociability Scale, we had no systematic approach in mind otherthan that we were guided by the literature (mainly the computer-supported cooperative work andhuman–computer interaction literature, e.g., Donath, 1997) to determinewhat good sociability con-sists of. Additionally, the construction of the test items of the Sociability Scale was based upon ourapproach to increase sociability, that is, group awareness, communication, and potential for facil-itating the creation of a community (of learning).As a result, the rawSociability Scalewas composedof 34 test items addressing these elements. This number of items deliberately overrepresented thesociability construct. We intended to remove redundant items in a later refinement process whichwould also remove those items that were psychometrically �rejected�. The advantage of such ameth-od was that we could postpone the decision of which items to include in the final Sociability Scale upto the moment that we would have gained a clearer picture of the meaning of the various items.
4.2. Removing test items of the Sociability Scale
The raw Sociability Scale was refined in three steps. In the first step, 24 items from the 34 initialtest items were removed because they either addressed a utility aspect (feature) such as �This CSCLenvironment enabled me to see who of the group members are logged in� or usability aspect such as‘This CSCL environment has easy access to the communicationmedia�. Although these items can beassociated with sociability, they are generally used for assessing the usefulness (Shneiderman, 1998)of a CSCL environment. Therefore, we decided not to include the items in the Sociability Scale forfurther analyses since these utility/usability items would be confounded with sociability items.

10 K. Kreijns et al. / Computers & Education xxx (2005) xxx–xxx
ARTICLE IN PRESS
In the second step, a Principal Component Analysis (no rotation) was performed on theremaining test items. This step revealed that the Sociability Scale is one-dimensional (using thescree test of Cattell, 1966). The step was also used to remove the few test items that did not loadhigher than 0.40 (see for this criterion, Stevens, 1992) exclusively on the first component (removedzero items).
The third and last step was to reduce the remaining test items further to 10 without losing toomuch of explained total variance (removed zero items, we already had 10 items).
The resulting refined Sociability Scale is depicted in Table 1. The three last columns showrespectively mean M, standard deviation SD, and loading on the first and only component (anew Principal Component Analysis (no rotation) was performed on the 10 final test items).The component explained 58.52% of the total variance.
5. Results
5.1. Internal consistency and validity
Cronbach�s a for the refined Sociability Scale was 0.92 revealing a high internal consistency.Content validity of the Sociability Scale was established via face-validity. The items were devel-oped based upon a search in the literature regarding social interaction via CMC, group develop-ment and group dynamics, social presence, trust building, and creating sense of community.
We applied a Pearson bi-variate correlation (two-tailed) analysis on the aggregate scores of thetest items of the Sociability Scale and each of the measures Social Space Scale, Social PresenceIndicators, Social Presence Scale, Work Group Cohesion Index, and Group Atmosphere Scale.Table 2 depicts the correlations. As can be seen, correlations are, with respect to both the strengthand direction, as expected. The low and negative correlation between the Negative Group Behav-ior-dimension of the Social Space Scale and the Sociability Scale is explained by the observationthat the Sociablity Scale does not measure negative experiences as does the Social Space Scale(Kreijns et al., 2004).
Finally, we applied Principal Component Analysis using Varimax rotation on the 10 test itemsof the refined Sociability Scale and the 20 test items of the Social Space Scale. We restricted the
Table 2Pearson bi-variate correlation coefficients between the different scales
Measure Sociability Scale
Social Space ScalePositive group behavior 0.60**
Negative group behavior �0.08Social Presence Indicators 0.83**
Social Presence Scale 0.85**
Work Group Cohesion Index 0.60**
Group Atmosphere Scale 0.78**
** p < 0.01, two-tailed.

Table 3Factor analysis of the scores of the items of the Social Space Scale and the Sociability Scale
No.item
Item Factor 1:Sociability
Factor 2:Positivegroupbehavior
Factor 3:Negativegroupbehavior
Social Space Scale: positive group behavior
1 Group members felt free to criticize ideas, statements, and/or opinions of others
0.01 0.76 �0.04
3 We reached a good understanding on how we had tofunction
0.10 0.80 0.06
5 Group members ensured that we kept in touch with eachother
0.21 0.75 �0.07
7 We worked hard on the group assignment 0.16 0.78 �0.079 I maintained contact with all other group members 0.25 0.73 �0.0811 Group members gave personal information on themselves 0.44 0.48 �0.1213 The group conducted open and lively conversations and/or
discussions0.23 0.82 �0.13
15 Group members took the initiative to get in touch withothers
0.32 0.79 �0.09
17 Group members spontaneously started conversations withothers
0.53 0.53 �0.10
19 Group members asked others how the work was going 0.37 0.56 �0.07
Social Space Scale: negative group behavior
2 Group members felt that they were attacked personallywhen their ideas, statements and/or opinions werecriticizeda
�0.05 �0.28 0.74
4 Group members were suspicious of othersa 0.00 �0.05 0.79
6 Group members grew to dislike othersa 0.02 0.02 0.66
8 I did the lion�s share of the worka �0.02 �0.14 0.57
10 Group members obstructed the progress of the worka 0.32 0.10 0.59
12 Group members were unreasonablea �0.13 0.02 0.90
14 Group members disagreed amongst each othera �0.05 �0.31 0.69
16 The group had conflictsa �0.25 �0.12 0.66
18 Group members gossiped about each othera �0.09 0.07 0.69
20 Group members did not take others seriouslya 0.08 0.02 0.60
Sociability Scale
1 This CSCL environment enables me to easily contact myteam mates
0.75 0.21 0.09
2 I do not feel lonely in this CSCL environment 0.77 �0.06 �0.163 This CSCL environment enables me to get a good
impression of my team mates0.75 0.28 �0.11
4 This CSCL environment allows spontaneous informalconversations
0.70 0.15 0.02
5 This CSCL environment enables us to develop into a wellperforming team
0.65 0.49 �0.14
6 This CSCL environment enables me to develop good workrelationships with my team mates
0.75 0.30 �0.02
(continued on next page)
K. Kreijns et al. / Computers & Education xxx (2005) xxx–xxx 11
ARTICLE IN PRESS

Table 3 (continued)
No.item
Item Factor 1:Sociability
Factor 2:Positivegroupbehavior
Factor 3:Negativegroupbehavior
7 This CSCL environment enables me to identify myself withthe team
0.62 0.50 �0.02
8 I feel comfortable with this CSCL environment 0.77 0.29 0.159 This CSCL environment allows for non-task-related
conversations0.68 0.18 0.15
10 This CSCL environment enables me to make closefriendships with my team mates
0.74 0.05 �0.16
Note. Bold numbers are loadings >0.40; roman numbers are loadings 60.40.a These items were reverse coded for analysis.
12 K. Kreijns et al. / Computers & Education xxx (2005) xxx–xxx
ARTICLE IN PRESS
extraction to only three components because the purpose of this analysis was not to reveal newcomponents, but rather to confirm the uniqueness of the scales with respect to each other. Be-cause the Social Space Scale has two dimensions and the Sociability Scale only one, the restric-tion was set to three. By uniqueness we mean that although the scales may be related (seecorrelation data in Table 2), they do not measure the same phenomena. The result of this analysisis given in Table 3. The loadings on the component show that the two scales measure two differentphenomena.
6. Weakness of the study
The validation of the Sociability Scale has some weak points. First, the number of cases was79. A general rule of thumb is that there must be at least 5 (Gorsuch, 1983) to 10 cases (Nun-nally, 1978) per item. The raw Sociability Scale contained 34 items, meaning that we needed170 up to 340 cases to derive this measure. However, as the raw Sociability Scale contained24 items related to utility/usability aspects rather than sociability, they could be removed be-fore any analyses. The actual scale we deal with contained only 10 items and, thus, the num-ber of cases required can be much lower: 50 up to 100 cases. In that perspective 79 cases willdo.
Second, there were three samples (VEC, first statistics course, second statistics course), thathave been collapsed in order to obtain the 79 cases. We agree that these samples have differentcharacteristics (e.g., time aspects, CSCL environments, task type) which mean that they actuallycannot be collapsed into one big sample. Indeed, a series of one-way ANOVA�s revealed thatalthough the samples VEC and first statistics course are comparable, these two samples are notcomparable with the sample of the second statistics course. However, as this study is exploratory,we did collapse the samples to obtain a higher number of cases.
Finally, we used the same cases for the Principal Component Analysis on the items of the re-fined Sociability Scale and the Social Space Scale. This means that the result (Table 3) might takeadvantage of the chance characteristic of the 79 cases from which both scales were derived.

K. Kreijns et al. / Computers & Education xxx (2005) xxx–xxx 13
ARTICLE IN PRESS
7. Conclusion
Social interaction is considered to be the dominant factor affecting collaboration in groupsand thus learning performances in those groups. In addition, social interaction is also a dominantfactor in group forming and group dynamics. That is, the social interaction found in group learn-ing is also responsible for developing new groups into mature well performing groups in which anaffective structure is established – characterized by social relationships, social cohesiveness and asense of community. These are the attributes of a social space. A sound social space allows foropen communication that is beneficial for the collaborative activities and the exchange of essentialinformation.
If we are to design and develop technologically, educationally, and socially functional CSCL-environments we need to not only consider these aspects in our designs and implementations(the designer�s perspective), but we also need to determine how the users (our students) per-ceive these environments. The Sociability Scale presented here on the one hand operationalizesthe different aspects of sociability so that the designer (technical and educational) can take ac-count of the different aspects of sociability in her/his design. On the other hand it gives thedesigners/developers a tool with which they can accurately measure whether their work hasborne fruit.
For this reason it is important that factors are identified that foster social interaction forsocio-emotional processes in a CSCL environment or that the CSCL environment in and byitself adds to an increase of this kind of social interaction, for example, through the incor-poration of social affordance devices that determine the sociability of the environment. Butthe effects of these latter strategies need to be measured in order to determine the effective-ness of each on sociability and thus on the creation of a sound social space. It is importantto develop a measurement instrument to determine the sociability of an environment, i.e., theSociability Scale. The Sociability Scale will, in our case, help to develop the right social affor-dance devices, in the sense that they are indeed effective in their contribution to thesociability.
This article presented the development and validation of a Sociability Scale. The results suggestthat the Sociability Scale has the potential to be useful as a measure for assessing the sociability ofCSCL environments. Though the findings are very promising, further work based on a larger sam-ple is warranted. As is the case with each (new) measurement instrument, continuous research isneeded for further improvements of the instrument and our Sociability Scale is no exception inthis practice.
Acknowledgments
The authors thank Hans van der Vleugel and Rolf van Geel for their comments on the meth-odological and statistical sections of the draft version of this paper, which have contributed to thequality of this article.

14 K. Kreijns et al. / Computers & Education xxx (2005) xxx–xxx
ARTICLE IN PRESS
Appendix 1
The Gunawardena Social Presence Indicators
No. item
Itema M SD1
stimulating–dull 3.73 1.13 2 personal–impersonal 3.05 1.04 3 sociable–unsociable 3.20 1.08 4 sensitive–insensitive 2.75 0.91 5 warm–cold 2.97 0.86 6 colorful–colorless 2.92 1.06 7 interesting–boring 3.81 1.04 8 appealing–not appealing 3.47 1.12 9 interactive–non-interactive 3.72 1.09 10 active–passive 3.44 1.15 11 reliable–unreliable 3.76 0.77 12 humanizing–dehumanizing 3.20 0.93 13 immediate–non-immediate 3.24 1.09 14 easy–difficult 3.46 1.21 15 efficient–inefficient 3.29 1.16 16 unthreatening–threatening 3.29 0.68 17 helpful–hindering 3.63 1.03Note. Judgements were made on 5-point bipolar scales (1 = positive rating, 5 = negative rating).a All items were reverse coded for analysis.
Appendix 2
The Gunawardena and Zittle Social Presence Scale (adapted)
No.
Item M SD1
Messages in the CSCL environment were impersonala 3.52 0.81 2 The CSCL environment is a an excellent medium for socialinteraction
3.01 1.033
I felt comfortable conversing through this text-based CSCLenvironment3.70
0.854
I felt comfortable introducing myself in the CSCLenvironment3.61
0.955
The introduction(s) enabled me to form a sense of on-linecommunity in which I was part of2.78
1.256
I felt comfortable participating in discussions in the CSCLenvironment3.67
0.897
The moderators created a feeling of an on-line community 2.32 1.07 (continued on next page)
K. Kreijns et al. / Computers & Education xxx (2005) xxx–xxx 15
ARTICLE IN PRESS
Appendix 2 (continued)
No.
Item M SD8
The moderators facilitated discussions in the CSCLenvironment2.44
1.199
Discussions in CSCL environments tend to be moreimpersonal than face-to-face discussionsa2.78
1.0010
Discussions in CSCL environments are more impersonalthan audio teleconference discussionsa2.95
1.0011
Discussions in CSCL environments are more impersonalthan video teleconference discussionsa2.75
1.0712
I felt comfortable interacting with other participants in theCSCL environment3.73
0.9613
I felt that my point of view was acknowledge by otherparticipants in the CSCL environment3.28
0.8214
I was able to form distinct individual impressions of someparticipants even though we communicated only via thistext-based CSCL environment2.92
1.07Note. Judgements were made on 5-point Likert scales (1 = strongly disagree, 2 = disagree, 3 = agree/disagree, 4 = agree,5 = strongly agree). The items 9, 10, and 11 were not considered in this study.a These items were reverse coded for analysis.
Appendix 3
The Price and Mueller Work Group Cohesion Index
No.
Item M SD1
To what extent were your team mates friendly?a 3.95 0.64 2 To what extent were your team mates helpful?a 3.76 0.98 3 To what extent did your team mates take a personal interest in you?a 3.09 0.99 4 To what extent did you trust your team mates?a 4.16 0.74 5 To what extent do you look forward to working again withthese team mates?a
3.11 1.14Note. Judgements were made on 5-point Likert scales.Item 1: 1 = very friendly, 2 = quite, 3 = somewhat, 4 = very little, 5 = not friendly at all.Item 2: 1 = very helpful, 2 = quite, 3 = somewhat, 4 = very little, 5 = not helpful at all.Item 3: 1 = very interested, 2 = quite, 3 = somewhat, 4 = very little, 5 = not interested at all.Item 4: 1 = a great deal, 2 = quite a lot, 3 = some, 4 = very little, 5 = no trust at all.Item 5: 1 = very much, 2 = quit a bit, 3 = some, 4 = very little, 5 = not at all.a These items were reverse coded for analysis.

16 K. Kreijns et al. / Computers & Education xxx (2005) xxx–xxx
ARTICLE IN PRESS
Appendix 4.
The Fiedler Group Atmosphere Scale
No. item
Item M SD1
warm–colda 2.97 0.86 2 interesting–boringa 3.81 1.04 3 accepting–rejectinga 3.73 0.80 4 satisfying–frustratinga 3.06 1.08 5 enthusiastic–unenthusiastica 3.37 1.15 6 productive–non-productivea 3.35 1.23 7 cooperative–uncooperativea 3.67 0.96 8 supportive–hostilea 3.86 0.78 9 successful–unsuccessfula 3.43 1.02Note. Judgments were made on 5-point bipolar scales (1 = positive rating, 5 = negative rating).a These items were reverse coded for analysis.
References
Cattell, R. B. (1966). The scree test for number of factors. Multivariate Behavioral Research, 1, 245–276.Cutler, R. H. (1996). Technologies, relations, and selves. In L. Strate, R. Jacobson, & S. B. Gibson (Eds.),
Communication and cyberspace: Social interaction in an electronic environment (pp. 317–333). Cresshill, NJ: HamptonPress, Inc.
Donath, J. S. (1997). Inhabiting the virtual city: The design of social environments for electronic communities.Unpublished doctoral dissertation, Massachusetts Institute of Technology, Cambridge, MA. Retrieved March 24,2004, from ftp://ftp.media.mit.edu/pub/donath/VirtualCity.ps.
Fiedler, F. E. (1962). Leader attitudes, group climate, and group creativity. Journal of Abnormal and Social Psychology,
65, 308–318.Fiedler, F. E. (1967). A theory of leadership effectiveness. New York: McGraw-Hill.Forsyth, D. R. (1990). Group dynamics (2nd ed.). Pacific Grove, CA: Brooks & Cole.Gaver, W. W. (1996). Situating action II: affordances for interaction: the social is material for design. Ecological
Psychology, 8(2), 111–129.Gibson, J. J. (1986). The ecological approach to visual perception. Hillsdale, NJ: Lawrence Erlbaum (Original work
published 1979).Gunawardena, C. N. (1995). Social presence theory and implications for interaction and collaborative learning in
computer conferences. International Journal of Educational Telecommunications, 1(2/3), 147–166.Gunawardena, C. N., & Zittle, F. (1997). Social presence as a predictor of satisfaction within a computer mediated
conferencing environment. American Journal of Distance Education, 11(3), 8–25.Gutwin, C. (1997). Workspace awareness in real-time distributed groupware. Unpublished doctoral dissertation,
University of Calgary, Calgary, Canada.Gorsuch, R. L. (1983). Factor analysis. Hillsdale, NJ: Lawrence Erlbaum.Guzzo, R. A., & Dickson, M. W. (1996). Teams in organizations: recent research on performance and effectiveness.
Annual Review of Psychology, 47, 307–338.Hallet, K., & Cummings, J. (1997). The virtual classroom as authentic experience. In Proceedings of the annual
conference on Distance teaching and learning: Competition-connection-collaboration (pp. 103–107). Madison, WI:University of Wisconsin-Madison.

K. Kreijns et al. / Computers & Education xxx (2005) xxx–xxx 17
ARTICLE IN PRESS
Heath, E. F. (1998). Two cheers and a pint of worry: an on-line course in political and social philosophy. Journal ofAsynchronous Learning Networks, 2(1), 15–33, Retrieved March 24, 2004, from http://www.aln.org/publications/ialn/v2nl/pdf/v2nlheath.pdf.
Hobaugh, C. F. (1997). Interactive strategies for collaborative learning. In Proceedings of the annual conference on
Distance teaching and learning: Competition-connection-collaboration (pp. 121–125). Madison, WI: University ofWisconsin-Madison.
Johnson, D. W., & Johnson, R. T. (1989). Cooperation and competition: Theory and research. Edina, MN: InteractionBook Company.
Kreijns, K., & Kirschner, P. A. (2004). Designing sociable CSCL environments: applying interaction design principles.In P. Dillenbourg (Series Ed.) & J. W. Strijbos, P. A. Kirschner, & R. L. Martens (Vol. Eds.), Computer-supported
collaborative learning: Vol. 3. What we know about CSCL. . . and implementing it in higher education (pp. 221–244).Boston, MA: Kluwer Academic Publishers.
Kreijns, K., Kirschner, P. A., & Jochems, W. (2002). The sociability of computer-supported collaborative learningenvironments. Journal of Education Technology & Society, 5(1), 8–22, Retrieved March 24, 2004, from http://ifets.ieee.org/periodical/vol_l_2002/v_l_2002.html.
Kreijns, K., Kirschner, P. A., & Jochems, W. (2003). Identifying the pitfalls for social interaction in computer-supported collaborative learning environments: a review of the research. Computers in Human Behavior, 19(3),335–353.
Kreijns, K., Kirschner, P. A., Jochems, W., & Van Buuren, H. (2004). Measuring perceived quality of social space indistributed learning groups. Computers in Human Behavior, 20(5), 607–632.
Nunnally, J. C. (1978). Psychometric theory. New York: McGraw-Hill.Phillips, C. (1990). Making friends in the electronic student lounge. Distance Education, 11(2), 320–333.Price, J. L., & Mueller, C. W. (1986). Handbook of organizational measurement. Marshfield, MA: Pitman Publishing
Inc.Rourke, L., Anderson, T., Garrison, D. R., & Archer, W. (1999). Assessing social presence in asynchronous, text-based
computer conferences. Journal of Distance Education, 14(3), 51–70.Rovai, A. P. (2001). Classroom community at a distance: a comparative analysis of two ALN-based university
programs. Internet and Higher Education, 4(2001), 105–118.Shaw, M. E. (1981). Group dynamics: The psychology of small group behavior (3rd ed.). NewYork: McGraw-Hill.Shneiderman, B. (1998). Designing the user interface: Strategies for effective human–computer interaction (3rd ed.). New
York: Addison-Wesley.Short, J., Williams, E., & Christie, B. (1976). The social psychology of telecommunications. London: Wiley.Sproull, L., & Faraj, S. (1997). Atheism, sex, and databases: The net as a social technology. In S. Kiesler (Ed.), Culture
of the internet (pp. 35–52). Mahwah, NJ: Lawrence Erlbaum.Stevens, J. P. (1992). Applied multivariate statistics for the social sciences (2nd ed.). Hillsdale, NJ: Lawrence Erlbaum.Tammelin, M. (1998). From telepresence to social presence: the role of presence in a network-based learning
environment. In S. Telia (Ed.). Aspects of media education: Vol. 8. Strategic imperatives in the information age
(pp. 219–231). Helsinki, Finland: Media Education Centre, University of Helsinki, Media Education Publications.Tu, C. H. (2000). On-line learning migration: from social learning theory to social presence theory in a CMC
environment. Journal of Network and Computer Application, 23(1), 27–37.Tu, C. H. (2002). The measurement of social presence in an online learning environment. International Journal of
Educational Telecommunications, 1(2), 34–45.Tu, C. H., & Isaacs, M. (2002). An examination of social presence to increase interaction in online classes. American
Journal of Distance Education, 16(3), 131–150.Wegerif, R. (1998). The social dimension of asynchronous learning networks. Journal of Asynchronous Learning
Networks, 2(1), 34–49, Retrieved October 26, 2003 from http://www.aln.org/publications/jaln/v2nl/pdf/v2nl_wegerif.pdf.
Copyright © 2022 FDOKUMEN