Perceived Benefits of Dance and Exercise
98
Numbers 1-8 to be completed by student Numbers 9-10 to be completed by Marker Please note that any case of suspected Plagiarism will be investigated according to current UHI Regulations. In submitting work using this assessment front sheet the responsible student is acknowledging they have read the Relevant sections of the Regulations and are aware of the possible penalties. Full information can be found on the following UHI web site: http://www.uhi.ac.uk/regulations/appendices/appendix_H.htm. For staff use only Marks allocated by first marker For staff use only Marks allocated by second marker For staff use only Agreed mark Final total/100% BA Health Studies Programme 1 Student College and College Number MO081515 2 Module Dissertation 3 Assessment Details 4 Student Adviser Leslie Bodie 5 Word Count 8500 6 Confirmed document submitted in rtf or word format word 7 Date Assessment Due 04/2012 8 Date Assessment Submitted 04/2012 9 Date Assessment Received 10 Weighting of Assessment
Transcript of Perceived Benefits of Dance and Exercise

Numbers 1-8 to be completed by student Numbers 9-10 to be completed by Marker Please note that any case of suspected Plagiarism will be investigated according to current UHI Regulations. In submitting work using this assessment front sheet the responsible student is acknowledging they have read the Relevant sections of the Regulations and are aware of the possible penalties. Full information can be found on the following UHI web site: http://www.uhi.ac.uk/regulations/appendices/appendix_H.htm.
For staff use only Marks allocated by first marker
For staff use only Marks allocated by second marker
For staff use only Agreed mark
Final total/100%
BA Health Studies Programme
1 Student College and College Number
MO081515
2 Module Dissertation
3 Assessment Details
4 Student Adviser Leslie Bodie
5 Word Count 8500
6 Confirmed document submitted in rtf or word format word
7 Date Assessment Due 04/2012
8 Date Assessment Submitted 04/2012
9 Date Assessment Received
10 Weighting of Assessment

MO081515/DISSERTATION/ 2011-2012
1
Physical Activity: A comparison between the perceived
benefits of participating in dance and physical exercise
Author: Stephen Calcutt

MO081515/DISSERTATION/ 2011-2012
2
Contents
About the author …………………………………………………… Page 3
Abstract ……………………………………………………………... Page 3
Introduction ……………………………………………………….. Page 4
Literature Review ………………………………………………….. Page 7
Methodology ………………………………………………………. Page 17
Results ……………………………………………………………… Page 21
Discussion ………………………………………………………… Page 73
Strengths and limitations ………………………………………… Page 74
Future studies ……………………………………………………… Page 77
Conclusion …………………………………………………………. Page 78
References ………………………………………………………… Page 80
Appendix ………………………………………………………….. Page 93

MO081515/DISSERTATION/ 2011-2012
3
Physical Activity: A comparison between the perceived
benefits of participating in dance and physical exercise
Author: Stephen Calcutt
About the author
The author is qualified with HNC Fitness Health and Exercise and is licenced to
teach Zumba Basic and Zumba Gold. The author is passionate about dancing
salsa and has taught classes in salsa and merengue. Part of the authors’
motive for this study’s literature review and research is also driven by an
interest in the relationship between psychological health and the act of dancing.
This was brought to the fore through the authors’ own personal experience of
depression and being at one point diagnosed with anxiety disorder. The study
focuses on the perceived benefits of dance and physical exercise, and is a
direct consequence of these factors.
Abstract
Objective: This study was designed to compare the perceived benefits of
dance with that of physical exercise. The study consisted of 65 dancers and 57
exercisers mixed gender. The study group were a random sample of people
who participate in either dance or physical exercise activities. The hypothesis
being, that ‘The perceived benefits of dance will be higher than the perceived

MO081515/DISSERTATION/ 2011-2012
4
benefits of exercise’. Methods: A Literature review was conducted to obtain a
comprehensive and robust selection of literature relevant and supportive of the
research study. Data for the study was collected through a closed question
questionnaire. The questionnaire was modelled on the EMI-2 exercise
motivation questionnaire. Results: By comparing frequencies and examining
the data through a series of t-tests (independent). It was found that dancers and
exercisers both perceived a broad range of benefits from participating in their
respective activities. However the perceived benefits for enjoyment and
affiliation were higher for dancers than exercisers. Weight management and
strength were valued higher with exercisers. Conclusion: Dancers did not
perceive higher benefits than exercisers from engaging in their activities.
Dance and exercise both perceive a broad spectrum of benefits to engaging in
their activities. Both dancers and exercisers value some benefits more than
others from participating in their activities. This occurs between their respective
study groups and within their respective study groups. By participating in either
physical exercise or dance it can be seen to contribute in varying degrees to a
person’s general health and wellbeing.
Introduction
This research project aims to compare the perceived benefit of dance with that
of physical exercise. The World Health Organisation (WHO) (2006b:4) state
that, ‘Factors positively associated with active living include …an expectation of
benefits’. This sentiment from the WHO (2006b:4) is fundamental to this
literature review and the subsequent research undertaken. The WHO (2006:1)
expresses the belief that health is, "A state of complete physical, mental and
social well-being and not merely the absence of disease". The WHO (2003)
also recognise that physical exercise can help combat obesity, protect against

MO081515/DISSERTATION/ 2011-2012
5
heart disease, diabetes in promoting a sense of wellbeing. The Department of
Health (2010) also recognise the contribution that dance makes as a physical
activity. Dance is recognised as a physical activity that contributes to health
and wellbeing. However Murcia, Kreutzb, Clift, and Bongard (2010) who
investigated the perceived benefits of dance believe that dance is not given
enough credit as a important and significant physical activity in the assistance of
wellbeing. Murcia, Kreutzb, Clift, and Bongard (2010) argue that dance should
receive greater prominence in health promotion. Murcia, Kreutzb, Clift, and
Bongard (2010) through their research found that dance had a significant
potential benefit on wellbeing. Murcia, Kreutzb, Clift, and Bongard (2010) found
dance had a positive effect on emotional, physical, social and spiritual
dimensions including self-esteem and coping strategies.
This concern was highlighted in the Department of Health report ‘Cold Facts,
Hot Feet Dancing to Health: A Review of the Evidence’. (2011). The
Department of Health (2011) report, is an extensive review of the evidence that
dance has wide reaching benefits to health and wellbeing. However the report
stated there is still resistance from the health sector in accepting the benefits of
dance to health. Other reports have come from a variety of sources, such as
BUPA (2011), BUPA (2011) state within their report that dances is a good form
of aerobic exercise. Biddle and Mutrie (2008:3) exclaim that, ‘Many forms of
physical activity are healthy!’ Nonetheless, Biddle and Mutrie’s (2008: 115-116)
comprehensive review of literature on the psychological benefits of physical
activity does not reference any studies that are attributed to dance. Dance has
a single mention along with aerobic dance. Biddle, Fox and Boutcher (2000:
108), in their comprehensive review of physical activity and psychological
wellbeing, also make a single reference to aerobic dance. The lack of dance
research included in literature like Biddle and Mutrie’s (2008) and Biddle, Fox
and Boutcher (2000: 108) however, does not mean there are not any studies to

MO081515/DISSERTATION/ 2011-2012
6
refer to. The author has found a dearth of dance related research that is
diverse in its methodology. The author chose not to include any research that is
based on dance or movement therapy. The type of dance that the author has
examined is mainly social and community dance, dance forms that were not
developed with health in mind. Some dance styles such as Zumba and Five
Rhythms are included. Zumba being an aerobic exercise program based on
interval training, which is also defined as dance. The second being Five
Rhythms which is expressive dance movement.
The authors own research will be to determine if there are any significant
differences in perceived benefits, between those who participate in physical
exercise activities and those that participate in dance activities. The author
hypothesises that ‘The perceived benefits of dance will be higher than the
perceived benefits of exercise’. This is based on the premise that exercisers
are more likely to focus on the perceived physical benefits of their activity.
Whereas dancer’s perceived benefits will be broader than physical benefits
alone. This is believed by the author to be a consequence of dance being a
strong cultural and social activity, which is part of the arts.
Dance is often classed as part of the arts, grouped with for example, crafts,
theatre, painting and music. This is reflected in a report on ‘Out of Reach’ an
arts based regeneration project in Merseyside. The report conducted by
Peerbhoy, Smith and Birchall (2002) found that dance had a positive impact on
the quality of life. Durdey (2006:39) states that, ‘Dance is one of the best-
placed art forms to work in all aspects of health…across cultures, communities,
disabilities and abilities’. However, dance also has a link with exercise. Dance
and physical exercise are two aspects of human pursuits found under the broad
umbrella of physical activity. The Cold Facts Hot Feet Dancing to Health: A
Review of the Evidence report (2011:29) cites The Department of Health as

MO081515/DISSERTATION/ 2011-2012
7
asserting, ‘arts and health are, and should be firmly recognised as being,
integral to health…’ By comparing the perceived benefits of dance with physical
exercise the author hopes to reveal that dance, as a significant cultural and
social activity, is also a physical activity that has perceived benefits that are
equally as important in maintaining a person’s wellbeing.
Literature review
This literature review will consist of studies that have examined the potential
benefits a person can attain through either dance or physical exercise. The
focus of this study will therefore be examining the physical activities of social
and community dances in comparison to persons who participate in physical
exercise activities. This will be followed by the authors own research that
compares the perceived benefits of dance with physical exercise.
According to Stroebe and Stroebe (1997) If people were asked as to what they
considered was an important contribution to a person’s health they would most
likely state exercise. Exercise, has long been accepted and established to be of
benefit to maintaining a person’s physical health, the prolific array of sports
clubs, gyms and leisure centres are a testimony to this. Exercise as a contrived
and deliberate physical activity has been a conscious objective of humanity for
a long time. Kokkinos (2010: 52) cites Hippocrates (460-370 B.C.) as saying; ‘If
we could give every individual the right amount of nourishment and exercise,
not too little and not too much, we would have found the safest way to health.’
The WHO (2003: 28) suggests that because of mechanisation, people need to
find new ways of building exercise into their lives. The benefits of exercise have
been studied extensively. Biddle and Mutrie (2008) bring together a
comprehensive account of research that has studied the psychology of physical

MO081515/DISSERTATION/ 2011-2012
8
activity. Biddle and Mutrie (2008) title their book ‘Psychology of Physical
Activity’ their reason being that the traditional term exercise psychology is too
restrictive. However, the field of study is still known as exercise psychology.
And the focus has still remained on activities that are exercise centred. There
are various aspects of exercise; these can be defined by ‘intention, outcome
and location’ (Ogden 2007: 157-172).
Ogden (2007: 157-172) and Biddle and Mutrie (2008) expand on this and define
exercise as physical activity that is contrived, thought out and consisting of
repetitive movement that has the intention of improving a person’s physical
fitness. However these definitions are not set in stone. Caspersen, Powell, and
Christensen (1985) define physical activity as bodily movement through the use
of skeletal muscles which results in the expenditure of energy. This therefore
can be inclusive of leisure activities, for example walking, gardening and dance
(WHO 2006b, Park, Shoemaker and Haub 2008).
There are many studies that have examined the benefits of physical exercise.
Exercise through research has also been shown to be effective in the treatment
of clinical depression and anxiety, enhancing mood states, improving physical
self-perception and global self-esteem (Fox 1999). The continuous
engagement in physical activities may increase an individual’s self-efficacy.
However the determinants of health recognise other factors that can contribute
to a person’s wellbeing, these may be social or environmental, and they may
also influence a person’s perception and motivation to participate in exercise
activities (Strobe and Strobe 1997).
Biddle and Mutrie (2008) collate and compare a vast expanse of research that
examines the psychology of physical activity. Biddle and Mutrie (2008) state
that there is breadth of descriptive data that captures for example the beliefs,
attitudes and motives of people who engage in physical activities. Biddle and

MO081515/DISSERTATION/ 2011-2012
9
Mutrie (2008) assert that the most important factors that motivate people to
exercise are to improve or maintain health, sense of achievement, weight
control and appearance. Biddle and Mutrie (2008) refer to a study of over
15,000 people that revealed the main reason was to maintain good health.
Socialisation was found to be one of the lower priorities in physical activity.
However many physical activities such as exercise classes do take place in a
social context (Biddle and Mutrie 2008). If however a physical activity
encourages social cohesion and a feeling of affiliation there can be a feeling of
support minimising division and inequalities and increase a sense of community
identity (WHO 2006a). The Health Education Authority (2000) conducted a
study of young people 11-15 years old and their parents. The Health Education
Authority (2000) found that the social aspect was a significant perceived benefit
of exercise activity. Callagan et al. (2009) in their study of women with
depression found that they valued the social aspect of exercising. However
Lovell, El Ansari, and Parker (2010) conducted a study on perceived exercise
benefits with non-exercising female university students. Lovell, El Ansari, and
Parker (2010), found that the highest rated perceived benefits of exercise were
physical performance and preventative health, social interaction was for them
rated the lowest.
Biddle and Mutrie (2008) provide a comprehensive review of evidence to
support the use of exercise as a tool, in improving mental wellbeing. However
the Mental Health foundation (2005) found that only 4% of GPs believe exercise
is a very effective treatment for mild to moderate depression. Nonetheless
Armstrong and Edwards (2003), in a study of young mothers found that
exercise intervention as well as improving physical health also improved
depressive symptomatology. Bartholomew, Morrison and Ciccolo (2005: 2032),
in a study of the effects of acute exercise on mood and wellbeing in patients
with Major Depressive Disorder found that the exercise group reported

MO081515/DISSERTATION/ 2011-2012
10
significant improvement in their wellbeing as well as significant reductions in,
‘psychological distress, depression, confusion, fatigue, tension, and anger’.
Hayes and Ross, (1986) looked at the characteristics of exercise, overweight,
and physical health and their relationship to psychological wellbeing. Hayes
and Ross, (1986) deducted from their results of a telephone survey of Illinois
residents, that exercise does have a positive effect on psychological wellbeing.
Scully et al. (1998: 111) in their review of research based on physical exercise,
covered amongst other factors, ‘…the relation between physical exercise and
depression, anxiety, stress … mood state [and] self-esteem.’ Scully et al.
(1998) found that evidence significantly supported exercises somatic benefits
for anxiety and stress, and enhancing mood state and self-esteem. Callagan et
al. (2009) also believe that exercise is a sustainable treatment choice for
maintaining psychological wellbeing.
Biddle and Mutrie (2008) deduce that if a perceived benefit of physical activity is
wellbeing then there must be an element of enjoyment. The WHO (2006b), that
an important factor in active living is enjoyment. Biddle and Mutrie (2008) state
that empirical evidence and intuition show that enjoyment is a key factor in
motivation. This for example was revealed in a study by Karageorghis,
Vlachopoulos and Terry (2000) the study was based on aerobic dance exercise
classes. Greater enjoyment was associated with those who had higher positive
engagement, revitalisation and tranquillity (Biddle and Mutrie 2008). However
the degree of enjoyment may also be determined by the activity participated in.
This was demonstrated by Kilpatrick, Hebert, and Bartholomew (2005) who
found that levels of enjoyment differ significantly between sports based physical
activities and exercise specific activities.
Fox (1999) in his study of physical activity and mental well-being ascertains that
there is sufficient evidence to support the use of exercise to treat stress. Blair

MO081515/DISSERTATION/ 2011-2012
11
et al (1984) found that teachers who participated in a 10 week health promotion
program which included exercise noticed improvement in their general
wellbeing and were more able to handle job stress. Biddle and Mutrie (2008)
refer to Crews and Landers (1987) who conducted a meta-analysis of thirty-
four studies that revealed a moderate effect of fitness on stress reactivity.
Those that showed less stress were either the fitter individuals or were less
responsive as a result of acute exercise activity. These studies however
focused on the physical measures such as blood pressure.
Sport England (2005: 4) discovered that ‘Weight management, social interaction
and enjoyment of exercise’ were some of the top reasons why people
participated in exercise. Ingledew and Markland (2008) also examined motives
that influence exercise participation. The study group consisted of 252 office
workers. They discovered that individuals had broadly different motivations for
participating in exercise. , Ingledew and Markland (2008) discovered that the
traditional appeal of appearance and weight management was seemingly not
the only driving force for someone to engage in physical exercise. Ingledew and
Markland (2008) when examining their results revealed for example social
engagement, health and fitness were also seen to be key influences in exercise
participation. Ingledew and Markland (2008) concluded that exercise promotion
should encourage these other factors.
Dance however is a physical activity primarily associated with music. Dance
has deep cultural and social significance across the world and throughout
history. The perceived benefits of dance have also been well documented. For
example, dance in pre-modern Europe was generally considered a preventative
medicine (Arcangeli 2000). Dance has also been use as a way of healing
through shamanic practices (Kassing 2007:30). Victory dances, for example,
were considered an important part of healthy development for the warriors of

MO081515/DISSERTATION/ 2011-2012
12
Sparta. (Kassing 2007:54) During the ‘Progressive Era’ in the USA, new
ideologies held that dance could improve emotional and physical wellbeing.
Dance was seen as a potential for developing social mobility and status
(McMains 2006). Dils and Cooper – Albright (2001), reveal that during the 50’s
and 60’s solo dance styles were becoming more popular within a social context
in western culture. Urmston et al. (2012) state there is a growing body of
research and anecdotal evidence that implies that, ‘dance benefits physical and
psychological health and wellbeing’.
Current dance activities, people may participate in, draw on humankind’s
cultural roots. For example there is the Afro-Cuban dance rumba and the
Middle Eastern belly dancing. There are dance activities drawing on Western
cultures recent past such as lindy hop, rock n roll and balboa. There are more
recent dance styles such as break dance and street dance that people may also
partake in. The importance of dance however may be deeply rooted. Research
indicates that the desire to dance has probable genetic roots for people.
Studies have shown how the human child will naturally move rhythmically to
music. Evidence has also shown a child is happy to learn rhythmic movements
to music at a very early age (Zentner and Eerola 2010, Phillips-Silver and
Trainor 2005). Dance has within societies been a method of expression from a
personal, social and cultural position, a way of also expressing and feeling
pleasure as well as meeting health and physical needs (Shrader 2005).
Research implies that the physical action of dance (as with exercise) can
increase norepinephrine and serotonin levels in the brain; chemicals that
improve well-being. This evidence is however mainly drawn on research that
has been exercise specific (Hanna 2007, Biddle and Mutrie 2008, Levin
2009:37). Dimondstein (1985) states that, ‘The practice of making dance an
adjunct of physical education has placed it in the same category as athletics or

MO081515/DISSERTATION/ 2011-2012
13
physical skills’. The cardiovascular benefits of dance have been observed
through aerobic dance forms such as Zumba. Zumba although dance orientated
is perceived as a physical exercise activity. Weight loss and muscle tone being
major factors for participation (Zumba 2012). Keogh, Kilding and Pidgeon
(2009) conducted a literature review that looked at social dance forms. Keogh,
Kilding and Pidgeon (2009) revealed that there is strong evidence to support the
physical benefits from dancing.
Pepper (1984) believes that dance is an alternative form of exercise suitable for
all. There is a broad and diverse spectrum of research that has looked into the
psychological benefits of dance as well as the physiological benefits. The
various benefits different dance styles can offer are the improvement of physical
fitness, social skills, mental health and wellbeing (Bremer 2007, Keogh, Kilding
and Pidgeon 2009). Research has explored the benefits of many dance forms
and genres from aerobic dance to tango (Murcia, Bongard, and Kreutz 2009,
Lane and Lovejoy 2000). Studies have revealed there are many variables that
may influence the benefits real or perceived by the participants. They have
shown dancing may improve mood, alleviating depression, and contribute to
wellbeing and the quality of life.
The benefits of dance are often cited in health promotion literature through
anecdotal observations and reference to the knowledge that being physically
active is a benefit to health. For example the physical action of dance is
believed to increase norepinephrine and serotonin levels in the brain; chemicals
that improve well-being, based on the findings of exercise research (Hanna,
2007, Biddle and Mutrie, 2008, Levin 2009:37). Another example of the physical
benefits was noted by Zhang et al (2008). Zhang et al. (2008) in a study of
social dancers (aged over 60) found that dancing improved postural stability
and strengthened leg muscles.

MO081515/DISSERTATION/ 2011-2012
14
Jeong et al. (2005) conducted a study with 112 adolescent girls who were not
being treated for or diagnosed with depression. They found that there was a
positive improvement in the participant’s depression. Lane and Lovejoy (2000)
however conducted a study of mood through an aerobic dance exercise class.
There were 80 participants split into two groups a non-depression and a
depressed mood group. Their findings indicated that there was a considerably
greater improvement of mood in the depressed mood group compared to those
who started with a low level of depression. Koch, Morlinhaus, and Fuchs
(2007) in a study consisted of 31 psychiatric patients found that dance had a
noticeable impact on lessening depression in the patients.
Genti, Goulimaris, and Yfantidou, (2009) carried out a study of [dance] aerobics,
Greek traditional dance and muscle strengthening. Their study group consisted
of 161 individuals split across the different activities. They discovered that both
dance activities showed they improved mood more effectively compared with a
muscular strengthening program. Genti, Goulimaris, and Yfantidou, (2009)
however, concluded that the social and group characteristics of the activities
may have some implication on the results.
Lima and Vieira (2007) focused their research on the elderly in Brazil. This
study looked at the wider implications of dance on the quality of life. There
were 60 participants of an age above 60 years of age. The results revealed
subjective responses from the participants that included them feeling ‘relaxed’
at ‘peace’ and ‘happy’. Birks (2007) conducted a study of salsa and depression,
which consisted of 24 adults with depression. The method of data collection
was with the Becks Depression Inventory (BDI). Despite the high dropout rate
Birks found a significant improvement in the BDI scores of the remaining
participants. A research design similar to Birks was the frame work for
Haboush et al. (2006). Unlike Birks, However, Haboush et al. (2006) did not

MO081515/DISSERTATION/ 2011-2012
15
look at salsa, instead the study comprised of a selection of ballroom dances,
foxtrot, waltz, rumba, swing, and tango. The study group consisted of 20
depressed older adults, average age 69. Eyigor et al. (2009) study was
developed around Turkish Folklore dance. The results revealed a reduction in
depression. Haboush et al. (2006) however, only found a moderate effect on
depression. They put this down to the sample size being too small and the
intervention being too short.
Persons however may take part in dance activities because a perceived benefit
is enjoyment. Ledger and Scott (2003) found from their research that people
felt, ‘[The] experience of 5 Rhythms [dance] was enjoyable, energising and
enlightening’. Zhang et al. (2008) in their study of social dancers and postural
stability believed that part of the reason people will maintain engagement with
this physical activity is because of the enjoyment level of dance potentially
preventing it from becoming boring. Gardner, Komesaroff, and Fensham (2008)
conducted a semi structured interview of 10 young people aged between 14-26
years old, who attending community based dance classes. Their study focused
on a variety of dances, including tango, Greek, ballet, hip-hop, ballroom, belly
dancing and flamenco. They established that all the participants found that their
dancing made them feel good about themselves. Connolly et al. (2009) in a
study of dance with adolescents in secondary schools found that one of the top
reasons for participating in dance was ‘fun’. Norfield and Nordin-Bates (2011)
piloted a study into community dance and well-being. The study group
comprised of a wide variety of dance styles, contemporary, jazz, ballet, street,
folk, belly, African and ballroom. They found that there was a strong link with
intrinsic motivation and enjoyment in participating. Heiberger et al. (2011) found
that in their study based on dance with people with Parkinson’s disease
revealed results confirming dance was engaging and enjoyable.

MO081515/DISSERTATION/ 2011-2012
16
Murcia, Bongard, and Kreutz (2009) found that tango dancing in the short term
can produce positive psycho-physiological changes. West et al. (2004)
compared the effects of African dance and Hatha yoga on a person’s mood.
They found that Hatha yoga and African dance in comparison to the controlled
condition produced significant reductions in perceived stress. Alpert et al.
(2007) when conducting a study centred on a jazz dance class looking at mood
(specifically depression) in conjunction with cognition and balance (The
participants were 15 women aged 50 years or older) however revealed no
impact on mood. The limitations were felt to be that it was a pilot study, and
that the participants may have been involved in other exercise activities thus
affecting the results.
Another highly rated aspect of dancing was socialisation. BUPA (2011) in their
report ‘Keep Dancing: The Health and Well-being Benefits of Dance for Older
People’, state that one of the benefits of dance is that it is social and inclusive.
The co-operation derived from partner dancing can potentially improve self-
esteem and social contact (Shoupe 2001, Bremer 2007). Self-esteem was also
found to be improved by Connolly et al. (2009) in their study of dance classes in
secondary schools Hampshire Dance and Laban (2007) conducted a study over
a two year period within seven local authorities. The study was to test the
effects of participation in dance on the physiological and psychological health
and wellbeing of young people. Hampshire Dance and Laban (2007) stated
that the evidence was robust enough for dance to be accepted alongside sport.
Trinity Laban Conservatoire of Music and Dance (unknown) also found from
looking at a diverse volume of research that dance generally elicits
psychological and physical benefit. An interesting point made by Goodlad,
Hamilton, and Taylor (2002) is that people may also be taking part in dance for
the sake of it, and then find as a consequence they benefit in improving various
aspects of their wellbeing.

MO081515/DISSERTATION/ 2011-2012
17
Methodology
Participants
A total of 120 people participated in the present study. This consisted of 27
males and 93 females. 63 people completed the perceived benefits of dance
questionnaire, consisting of 14 males and 49 females. 57 people completed the
perceived benefits of exercise questionnaire. This group consisted of 13 males
and 44 females. The target group were consenting adults over the age of
sixteen. The actual age range was between 18 and 64. As well as age and
gender the participant’s occupation was also noted.
Procedure
The data were gathered using a closed answer questionnaire (appendix: 1).
This was to be completed by participants who partook in various dance and
exercise activities. The questionnaires were also open to those who perceived
what the benefits of exercise or dance may be, however they did not have to be
participating in either dance or exercise activities.
The questionnaires were devised to be completed online. The questionnaires
were developed and produced through Qualtrics (unknown) an online survey
facility which offers a free account to create and distribute an online survey.
The free account provided limited usage of their survey tools, but was deemed
suitable for this research study. Because the questionnaires were accessible on
online there were no geographical barriers as to who could participate. The
only perceived barrier was not having access to the internet. Nevertheless this

MO081515/DISSERTATION/ 2011-2012
18
approach broadened the parameters of the study group thus providing the
possibility of a more global cross cultural response rate.
A scatter gun approach in distributing the questionnaire was undertaken. A link
to the questionnaires was posted on the author’s Facebook page. The
questionnaires link was also posted directly on selected friends Facebook
pages who were either dancers; dance tutors, or participated in, or taught some
form of physical activity. Some of these Facebook users have an internationally
broad friend or subscriber base. The amount of ‘friends’ or subscribers they
had was also a contributing factor as to whom to target to host the
questionnaires. Another reason for posting the link to specific dance or
exercise related social network and websites was to ensure a broad spectrum
of dancers and exercisers took part. However in order to get responses from
people who perceived the potential benefits of exercise or dance, particularly
those that may consider, or sometimes participate in dance or exercise
activities, the surveys were posted on general friends pages on Facebook.
Another Facebook page where there may be a random response to either
questionnaire was the UHISA VP Facebook page. Other tactics were to
instigate a key word search within the Facebook site itself to find pages that
were either exercise or dance related. If the page seemed suitable, the author
wrote on the exercise or dance page wall, explaining the purpose of the survey
ending with a link to the relevant questionnaire.
The questionnaires were also distributed via the social network twitter. These
too were aimed at contacts within the authors twitter network and sent to
possible interested twitter groups or individuals out with the author’s network.
The questionnaires were also emailed to potentially interested parties. The
author first sent a link to his immediate email contact list. Then by searching
MO081515/DISSERTATION/ 2011-2012
19
through Google found potential dance or exercise contacts that could either fill
in the questionnaires themselves or were in a position to distribute the
questionnaire to interested parties. Targeted groups included Moray leisure
Centre, based in Elgin who posted a link to the questionnaire on their website
events page. A link to the dance questionnaire was also emailed to Eden Court
Theatre in Inverness who distributed it to people who attended dance classes at
their venue. Eden Court was asked to support distribution of a link to the online
questionnaire. Eden Court had originally granted permission to gather data at
dance classes held at Eden Court.
Questionnaire structure
The opening of each questionnaire consisted of an introduction to what the
research study was about, ethical considerations and a disclaimer that stated
that the participant was partaking in the survey on their own free will. The first
part of the questionnaire was devised to gather some basic demographic
information about the exercisers/dancers age, gender type of activity/dance and
occupation. Although other researchers have combined multiple questionnaires
in their pursuit of data, it was decided that due to time constraints and the
possibility of questionnaire fatigue that only one questionnaire would be
presented for both dancers and exercisers.
To measure the perceived benefits of participating in the respective physical
activities, the Exercise Motivation Inventory - 2 (EMI-2) was used (Markland and
Ingledew 1997). The EMI-2 questionnaire was chosen because both dance and
exercise are perceived as forms of physical activity. It was felt that to adapt an
exercise motivation questionnaire was more in keeping than the adaption of a

MO081515/DISSERTATION/ 2011-2012
20
singing questionnaire as Murcia, Kreutzb, Clift, and Bongard (2010) did for
their research enquiry.
The questionnaire as with EMI-2 (Markland and Ingledew, 1997) consisted of 14
scales, these are Stress Management, Challenge, Revitalisation, Enjoyment,
Social Recognition, Affiliation, Competition, Health Pressures, Ill-Health
Avoidance, Positive Health, Weight Management, Appearance, Strength and
Endurance and finally Nimbleness. These were split into five categories. The
five categories consisted of 2 to 4 of the 14 scales in each one.
The EMI-2 questionnaire had primarily been devised to find out what motivates
or might motivate a person to exercise (Markland and Ingledew 1997). The
EMI-2 questionnaire has been chosen because it has been used in various
other studies such as Kilpatrick, Hebert and Bartholomew (2005). The EMI-2
and has been validated as a suitable method of gathering data in respect of
exercise and wellbeing (Markland and Ingledew 1997). Although the authors
modified versions of EMI-2 have not been validated.
The EMI-2 consists of a 6 point scale that goes from ‘Not true for me’ to ‘Very
true for me’. However for this study the amount of questions were reduced to
49 as it was felt that some of the questions did not translate suitably as
questions to be associated with dance. For those participating in dance
activities the questionnaire was modified further, the word ‘exercise’ was
replaced with the word ‘dance’. The purpose being that the responses in the
questionnaire for those who participated in dance activities would correlate with
the exerciser questions. Another modification was that the EMI-2 (Markland
and Ingledew 1997) had modified the questions to enable a response from
people who were not already exercising. This part of the question was removed
as it was felt that the main focus of the study group was on those already
participating in exercise or dance.

MO081515/DISSERTATION/ 2011-2012
21
Results
The results from the research undertaken do not support the given hypothesis.
The findings reveal that both exercise and dance participants valued most of the
perceived benefits within the 14 categories as denoted by the EMI-2. Also
specific benefits were shown to be of greater value to dancers than exercisers
and vice versa. However the greatest difference was ‘enjoyment’ which was
noticeably higher for dancers than exercisers. This was followed by ‘affiliation’
which scored much higher for dancers than exercisers. However exercisers
valued the benefit of addressing their ‘weight’ much more highly than dancers.
Exercisers were also more inclined to think of their ‘positive health’ than
dancers.
The data gathered from the participants was analysed through the t-test
(independent) using SPSS (Brace, Kemp and Snelgar 2009: 128-135). The
author decided that they would conduct a series of t-tests (independent)
between the dance and exercise results. It was decided that using the t-test
(independent) was the most suitable test. This was deducted by using the
‘decision chart 2’ as provided on the inside cover of by Greene and D’Oliveira
(1999) in their guide to statistical analysis. Each question within the 14
categories was analysed with the t-test (unrelated). To ensure data was
suitable for a parametric test, and that the t-test (unrelated) was an appropriate
test to analyse the data. The skewedness of the variables was tested. The
results of the test reveal that the skewedness data is approximately symmetric
(-.133 (Table: A, fig: A) and is therefore suitable for the proposed parametric
test; the t-test (independent) (Searle 2007:88). The effect size (Cohens d)
however, is not calculated by SPSS when conducting an independent group t-
test. Therefore to measure the effect size and find out to what extent the means
MO081515/DISSERTATION/ 2011-2012
22
for each study group differ in relation to their standard deviations the calculation
was conducted with the following formula. The effect size is calculated thus, d
= ( ) / ( + ) / 2 ( = mean, SD =standard deviation), (Brace,
Kemp and Snelgar 2009: 131)
Results: Between samples
Dancers compared with exercisers
The most significant differences of perception of benefits will be explored first
between samples. Across all 14 questionnaire categories the most valued
perceived benefit of partaking in either dance or exercise between the two
samples was discovered to be with dancers. This was with the category
‘enjoyment’.
There are four sub categories that made up the category ‘enjoyment’. Within
the category of ‘enjoyment’ it was found that 56 (86.2%) dancers perceived
satisfaction as ‘very true for me’ (table: 2, fig: 2). In comparison with 16 (28.1 %)
exercisers, (table: 2.2, fig: 2.2). The t-test (independent) results revealed
dancers rated the satisfaction of their activity in and of itself higher (mean =
4.74) than exercisers (mean = 3.60) (Table 5). The effect size was large d =
1.085. Levene’s Test shows p > .05 (.000) so is therefore significant. The
hypothesis (one-tailed) is p = .000 thus this result is significant (table 5.1).
The next highest score within the category of ‘enjoyment’ was in relation to
enjoyment and experience. 57 dancers (87.7%) (Table: 3) stated it was ‘very
true for me’. Whereas in comparison this was only perceived as very true for 15
exercisers (26.3%) (Table: 3.1 fig: 3.1). The t-test (independent) results show

MO081515/DISSERTATION/ 2011-2012
23
for enjoyment and experience that dancers activities were rated higher (mean =
4.77) than exercisers (mean = 3.77) (table 5). The effect size was large d =
1.00. Levene’s Test shows p > .05 (.001) so is therefore significant. The
hypothesis (one-tailed) is p = .000 so therefore this result is significant (table
5.1).
For feeling at their best the highest score for ‘very true for me’ was selected by
32 (49.2%) of the dancers (Table: 4 fig: 4). As opposed to 12 (21.1%) of the
exercisers (Table: 4.1 fig: 4.1). Dancers also rated ‘feeling at their best’ during
their activity (mean = 3.89) greater than exercisers (mean = 3.00) (Table 5).
The effect size was considered small d = 0.33. Levene’s Test shows p > .05
(.001) so is this result is consequently significant. The hypothesis (one-tailed) is
p = .000 so therefore this result is seen to be significant (table 5.1).
The ‘enjoyment of exertion’ highest score for ‘very true for me’ was selected by
22 (38.6%) of exercisers (Table: 1.1 fig:1.1), however this was perceived lower
for dancers, 14 (21.5%) (Table: 1 fig 1). Nevertheless the enjoyment of exertion
during the engagement in physical activities was higher for exercisers (mean =
3.67) than for dancers (mean = 3.37) (table: 5). The effect size was small d =
0.11. Levene’s Test shows p > .05 (.794) so is therefore significant. The
hypothesis (one-tailed) is p = .001 so consequently this result is significant
(table 5.1).

MO081515/DISSERTATION/ 2011-2012
24
Results for skewness
Table: A
(Fig: A)
2.4 2.1 1.8 1.5 1.2 0.9 0.6
EXERCISE/DANCE
100
80
60
40
20
0
Frequency
Mean =1.53 Std. Dev. =0.501
N =122
Histogram
Statistics
EXERCISE/DANCE 122
0 -.133 .219
Valid
Missing
N
Skewness Std. Error of Skewness

MO081515/DISSERTATION/ 2011-2012
25
Results: Enjoyment
Exertion
Dance:
Table: 1
(Fig: 1)
Be cause I enjoy the fee ling of exer ting mys elf
4 6.2 6.2 6.2
13 20.0 20.0 26.2
13 20.0 20.0 46.2
21 32.3 32.3 78.5
14 21.5 21.5 100.0
65 100.0 100.0
Not true for me
Click to w rite Choice 2
Click to w rite Choice 4
Click to w rite Choice 5
Very true for me
Total
Valid
Frequency Percent Valid Percent
Cumulative
Percent
Very true for me Click to write Choice 5
Click to write Choice 4
Click to write Choice 2
Not true for me
Because I enjoy the feeling of exerting myself
25
20
15
10
5
0
Personally I dance......
Frequency

MO081515/DISSERTATION/ 2011-2012
26
Exercisers:
Table: 1.1
(Fig: 1.1)
Because I enjoy the feeling of exerting myself
3 5.3 5.3 5.3 11 19.3 19.3 24.6 7 12.3 12.3 36.8
14 24.6 24.6 61.4
22 38.6 38.6 100.0 57 100.0 100.0
Not true for me Click to write Choice 2 Click to write Choice 4 Click to write Choice 5 Very true for me Total
Valid Frequency Percent Valid Percent
Cumulative Percent

MO081515/DISSERTATION/ 2011-2012
27
Satisfaction
Dancers:
Table: 2
(Fig: 2)
I find dancing s atisfying in and of itse lf
1 1.5 1.5 1.5
2 3.1 3.1 4.6
6 9.2 9.2 13.8
56 86.2 86.2 100.0
65 100.0 100.0
Not true for me
Click to w rite Choice 2
Click to w rite Choice 5
Very true for me
Total
Valid
Frequency Percent Valid Percent
Cumulative
Percent
Very true for me Click to write Choice 5 Click to write Choice 2 Not true for me
I find dancing satisfying in and of itself
60
50
40
30
20
10
0
Personally I dance because.......
Frequency

MO081515/DISSERTATION/ 2011-2012
28
Exercisers:
Table 2.2
(Fig: 2.2)
Be cause I find exercis e s atisfying in and of itse lf
3 5.3 5.3 5.3
8 14.0 14.0 19.3
11 19.3 19.3 38.6
19 33.3 33.3 71.9
16 28.1 28.1 100.0
57 100.0 100.0
Not true for me
Click to w rite Choice 2
Click to w rite Choice 4
Click to w rite Choice 5
Very true for me
Total
Valid
Frequency Percent Valid Percent
Cumulative
Percent
Very true for meClick to write Choice 5
Click to write Choice 4
Click to write Choice 2
Not true for me
Because I find exercise satisfying in and of itself
20
15
10
5
0
Fre
qu
en
cy
Personally I exercise ....

MO081515/DISSERTATION/ 2011-2012
29
Experience
Dance
Table: 3
(Fig: 3)
for the e njoyme nt of the expe r ie nce of dance
1 1.5 1.5 1.5
1 1.5 1.5 3.1
1 1.5 1.5 4.6
5 7.7 7.7 12.3
57 87.7 87.7 100.0
65 100.0 100.0
Not true for me
Click to w rite Choice 2
Click to w rite Choice 4
Click to w rite Choice 5
Very true for me
Total
Valid
Frequency Percent Valid Percent
Cumulative
Percent
Very true for me Click to write Choice 5
Click to write Choice 4
Click to write Choice 2
Not true for me
For the enjoyment of the experience of dance
60
50
40
30
20
10
0
Personally I dance because.......
Frequency

MO081515/DISSERTATION/ 2011-2012
30
Exercise Table 3.1
For the enjoyment of the experience of exercise
Frequency Percent Valid Percent Cumulative
Percent
Valid Not true for me 2 3.5 3.5 3.5
Click to write Choice 2 6 10.5 10.5 14.0
Click to write Choice 4 8 14.0 14.0 28.1
Click to write Choice 5 26 45.6 45.6 73.7
Very true for me 15 26.3 26.3 100.0
Total 57 100.0 100.0
(Fig: 3.1)
Very true for meClick to write Choice 5
Click to write Choice 4
Click to write Choice 2
Not true for me
for the enjoyment of the experience of exercise
30
25
20
15
10
5
0
Fre
qu
en
cy
Personally I exercise ....

MO081515/DISSERTATION/ 2011-2012
31
At best
Dance
Table: 4
(Fig: 4)
Be cause I fee l at my be st w he n dancing
2 3.1 3.1 3.1
11 16.9 16.9 20.0
9 13.8 13.8 33.8
11 16.9 16.9 50.8
32 49.2 49.2 100.0
65 100.0 100.0
Not true for me
Click to w rite Choice 2
Click to w rite Choice 4
Click to w rite Choice 5
Very true for me
Total
Valid
Frequency Percent Valid Percent
Cumulative
Percent
Very true for me Click to write Choice 5 Click to write
Choice 4 Click to write Choice 2 Not true for me
Because I feel at my best when dancing
40
30
20
10
0
Personally I dance because.......
Frequency

MO081515/DISSERTATION/ 2011-2012
32
Exercise
Table 4.1
(Fig: 4.1)
Be cause i fee l at my be st w he n e xe rcising
5 8.8 8.8 8.8
16 28.1 28.1 36.8
17 29.8 29.8 66.7
7 12.3 12.3 78.9
12 21.1 21.1 100.0
57 100.0 100.0
Not true for me
Click to w rite Choice 2
Click to w rite Choice 4
Click to w rite Choice 5
Very true for me
Total
Valid
Frequency Percent Valid Percent
Cumulative
Percent
Very true for meClick to write Choice 5
Click to write Choice 4
Click to write Choice 2
Not true for me
Because i feel at my best when exercising
20
15
10
5
0
Fre
qu
en
cy
Personally I exercise ....

MO081515/DISSERTATION/ 2011-2012
33
Enjoyment: t-test (independent) results for dancers and
exercisers.
Table: 5
Table 5.1
Independent Samples Test
.355 .552 1.179 120 .241 .297 .252 -.202 .797
1.175 115.893 .242 .297 .253 -.204 .799
20.484 .000 -5.780 120 .000 -1.142 .198 -1.533 -.751
-5.618 92.166 .000 -1.142 .203 -1.546 -.738
11.639 .001 -5.600 120 .000 -.997 .178 -1.350 -.645
-5.463 96.202 .000 -.997 .183 -1.360 -.635
.069 .794 -3.535 120 .001 -.892 .252 -1.392 -.392
-3.519 115.485 .001 -.892 .254 -1.395 -.390
Equal variances assumed Equal variances not assumed Equal variances assumed Equal variances not assumed
Equal variances assumed Equal variances not assumed Equal variances assumed Equal variances not assumed
Personally I exercise /dance..... because I enjoy
the feeling of exerting myself
Personally I exercise/dance because ...... I find exercise satisfying in and of itself
Personally I exercise/dance..... for the enjoyment of the experience of exercise
Personally I exercise/dance because ........ I feel at
my best when exercising
F Sig.
Levene's Test for Equality of Variances
t df Sig. (2-tailed) Mean
Difference Std. Error Difference Lower Upper
95% Confidence Interval of the
Difference
t-test for Equality of Means
Group Statistics
57 3.67 1.431 .190
65 3.37 1.353 .168
57 3.60 1.321 .175
65 4.74 .834 .103
57 3.77 1.165 .154 65 4.77 .786 .097 57 3.00 1.439 .191 65 3.89 1.348 .167
ACTIVITY Exercise
Dance
Exercise
Dance
Exercise Dance Exercise Dance
Personally I exercise/dance
... because i enjoy the feeling of exerting myself Personally I exercise/dance because ...... I find exercise satisfying in and of itself
Personally I exercise/dance..... for the enjoyment of the experience of exercise Personally I exercise/dance because ........ i feel at my best when exercising
N Mean Std. Deviation Std. Error
Mean

MO081515/DISSERTATION/ 2011-2012
34
Dancers second most valued perceived benefit: Affiliation
There were even greater perceived benefits in all aspects of affiliation from
those who participated in dance in comparison to exercisers. There were 14
(21.5%) who stated spending time with friends as being ‘very true for me’
(Table: 6 fig: 6). For exercisers however there were 2 (3.5%) who thought it was
‘very true for me’ (Table: 6.1 fig: 6.1). The t-test (independent) results revealed
that time spent with friends was considered to be more important to dancers
(mean = 3.12) than with exercisers (mean = 2.42) (Table: 10). The effect size
was small d = 0.241. Levene’s Test shows p > .05 (.426) so is therefore is a
significant result. The hypothesis (one-tailed) is p = .0045 so consequently this
result is significant (Table: 10.1).
Dancers rated enjoyment of the social aspect of their activity higher than
exercisers. There were 25 (38.5%) (Table: 7 fig: 7), of dancers who selected
‘very true for me’ compared with 10 (17.5%) of exercisers (Table: 7.1 fig: 7.1).
The t-test (independent) revealed dance (mean = 3.97) was more than
exercisers (mean = 2.70) (Table: 10). The effect size was medium d = 0.534.
Levene’s Test shows p > .05 (.007) so is therefore significant. The hypothesis
(one-tailed) is p = .000 so therefore this result is significant (Table: 10.1).
Having fun and being active with other people was more important to dancers.
There were 29 (44.6%) of dancers who stated ‘very true for me’ (Table: 8 fig: 8)
in relation to 6 (10.5%) exercisers (Table: 8.1 fig: 8.1). The t-test (independent)
revealed dance (mean = 3.98) was higher than exercisers (mean = 2.56)
(Table: 10). The effect size was large d = 1.40 Levene’s Test shows p > .05
(.070) so is therefore significant. The hypothesis (one-tailed) is p = .000 so
consequently this result is significant (Table 10.1).

MO081515/DISSERTATION/ 2011-2012
35
Making new friends was also rated higher for exercisers. There were 6 (9.2%)
of the exercisers (Table: 9.1 fig 9.1) and 6 (10.5%) dancers (Table: 9 fig:9.1).
the t-test (independent) revealed that dancers (mean=2.77) were significantly
greater than the result for exercisers (mean=1.98) (Table: 10). The effect size
was small d = 0.416. Levene’s Test shows p > .05 (.0733) so is therefore
significant. The hypothesis (one-tailed) is p = .001 so hence this result is
significant (Table: 10.1).
Affiliation: Results
Time with friends
Dancers:
Table: 6
to spend time w ith frie nds
7 10.8 10.8 10.8
14 21.5 21.5 32.3
15 23.1 23.1 55.4
15 23.1 23.1 78.5
14 21.5 21.5 100.0
65 100.0 100.0
Not true for me
Click to w rite Choice 2
Click to w rite Choice 4
Click to w rite Choice 5
Very true for me
Total
Valid
Frequency Percent Valid Percent
Cumulative
Percent

MO081515/DISSERTATION/ 2011-2012
36
(Fig: 6)
Exercisers:
Table: 6.1
Very true for meClick to write Choice 5
Click to write Choice 4
Click to write Choice 2
Not true for me
to spend time with friends
14
12
10
8
6
4
2
0
Fre
qu
en
cy
Personally I dance ...
to spend time w ith frie nds
9 15.8 15.8 15.8
22 38.6 38.6 54.4
12 21.1 21.1 75.4
12 21.1 21.1 96.5
2 3.5 3.5 100.0
57 100.0 100.0
Not true for me
Click to w rite Choice 2
Click to w rite Choice 4
Click to w rite Choice 5
Very true for me
Total
Valid
Frequency Percent Valid Percent
Cumulative
Percent

MO081515/DISSERTATION/ 2011-2012
37
(Fig: 6.1)
Social aspect
Dancers:
Table: 7
Very true for meClick to write Choice 5
Click to write Choice 4
Click to write Choice 2
Not true for me
to spend time with friends
25
20
15
10
5
0
Fre
qu
en
cy
Personally I exercise ...
to enjoy the social aspects of dancing
1 1.5 1.5 1.5
8 12.3 12.3 13.8
7 10.8 10.8 24.6
24 36.9 36.9 61.5
25 38.5 38.5 100.0
65 100.0 100.0
Not true for me
Click to w rite Choice 2
Click to w rite Choice 4
Click to w rite Choice 5
Very true for me
Total
Valid
Frequency Percent Valid Percent
Cumulative
Percent

MO081515/DISSERTATION/ 2011-2012
38
(Fig: 7)
Exercisers:
Table: 7.1
To enjoy the social aspects of exercising
Frequency Percent Valid Percent Cumulative
Percent
Valid Not true for me 6 10.5 10.5 10.5
Click to write Choice 2 26 45.6 45.6 56.1
Click to write Choice 4 8 14.0 14.0 70.2
Click to write Choice 5 7 12.3 12.3 82.5
Very true for me 10 17.5 17.5 100.0
Total 57 100.0 100.0
Very true for meClick to write Choice 5
Click to write Choice 4
Click to write Choice 2
Not true for me
to enjoy the social aspects of dancing
25
20
15
10
5
0
Fre
qu
en
cy
Personally I dance ....

MO081515/DISSERTATION/ 2011-2012
39
(Fig: 7.1)
_
Being active
Dancers:
Table: 8
Very true for meClick to write Choice 5
Click to write Choice 4
Click to write Choice 2
Not true for me
to enjoy the social aspects of exercising
30
25
20
15
10
5
0
Fre
qu
en
cy
Personally I exercise ...
to have fun being active w ith other pe ople
2 3.1 3.1 3.1
6 9.2 9.2 12.3
10 15.4 15.4 27.7
18 27.7 27.7 55.4
29 44.6 44.6 100.0
65 100.0 100.0
Not true for me
Click to w rite Choice 2
Click to w rite Choice 4
Click to w rite Choice 5
Very true for me
Total
Valid
Frequency Percent Valid Percent
Cumulative
Percent

MO081515/DISSERTATION/ 2011-2012
40
(Fig: 8)
Exercisers:
Table: 8.1
Very true for meClick to write Choice 5
Click to write Choice 4
Click to write Choice 2
Not true for me
to have fun being active with other people
30
25
20
15
10
5
0
Fre
qu
en
cy
Personally I dance ....
to have fun being active w ith other pe ople
10 17.5 17.5 17.5
15 26.3 26.3 43.9
18 31.6 31.6 75.4
8 14.0 14.0 89.5
6 10.5 10.5 100.0
57 100.0 100.0
Not true for me
Click to w rite Choice 2
Click to w rite Choice 4
Click to w rite Choice 5
Very true for me
Total
Valid
Frequency Percent Valid Percent
Cumulative
Percent

MO081515/DISSERTATION/ 2011-2012
41
(Fig: 8.1)
To make new friends
Dancers:
Table: 9
Very true for meClick to write Choice 5
Click to write Choice 4
Click to write Choice 2
Not true for me
to have fun being active with other people
20
15
10
5
0
Fre
qu
en
cy
Personally I exercise ...
to make new fr iends
6 9.2 9.2 9.2
22 33.8 33.8 43.1
18 27.7 27.7 70.8
13 20.0 20.0 90.8
6 9.2 9.2 100.0
65 100.0 100.0
Not true for me
Click to w rite Choice 2
Click to w rite Choice 4
Click to w rite Choice 5
Very true for me
Total
Valid
Frequency Percent Valid Percent
Cumulative
Percent

MO081515/DISSERTATION/ 2011-2012
42
(Fig: 9)
Exercisers:
Table: 9.1
Very true for meClick to write Choice 5
Click to write Choice 4
Click to write Choice 2
Not true for me
to make new friends
25
20
15
10
5
0
Fre
qu
en
cy
Personally I dance ...
to make new fr iends
14 24.6 24.6 24.6
28 49.1 49.1 73.7
9 15.8 15.8 89.5
6 10.5 10.5 100.0
57 100.0 100.0
Not true for me
Click to w rite Choice 2
Click to w rite Choice 4
Very true for me
Total
Valid
Frequency Percent Valid Percent
Cumulative
Percent

MO081515/DISSERTATION/ 2011-2012
43
(Fig: 9.1)
Affiliation: t-test (independent) results for dancers and
exercisers
Table: 10
Very true for meClick to write Choice 4Click to write Choice 2Not true for me
to make new friends
30
25
20
15
10
5
0
Fre
qu
en
cy
Personally I exercise ...
Group Statistics
57 2.42 1.362 .180 65 3.12 1.516 .188 57 2.70 1.476 .195
65 3.97 1.118 .139
57 2.56 1.500 .199 65 3.98 1.218 .151 57 1.98 1.458 .193 65 2.77 1.308 .162
ACTIVITY 1 2 1 2
1 2 1 2
Personally I exercise ...... to spend time with friends Personally I exercise ....... to enjoy the social aspects of exercising
Personally I exercise ...... to have fun being active with other people Personally I exercise ...... to make new friends
N Mean Std. Deviation Std. Error
Mean

MO081515/DISSERTATION/ 2011-2012
44
Table: 10.1
Exercisers compared with dancers
Strength and endurance
Within the sample group of exercisers it has been discovered that involvement
in a physical activity for building up strength was rated higher (mean = 3.42)
than dancers (mean = 2.38) (Table: 15). There were 14 (24.6%) exercisers
who stated ‘very true for me’ for the importance of building up of strength
(Table: 11 fig: 11). This is in comparison to 7 (10.8%) of dancers (Table: 11.1
fig: 11.1). The effect size was medium d = 0.666. Levene’s Test shows p > .05
Independe nt Sample s Te st
.637 .426 -2.675 120 .009 -.702 .262 -1.222 -.183
-2.694 119.921 .008 -.702 .261 -1.218 -.186
7.487 .007 -5.385 120 .000 -1.267 .235 -1.733 -.801
-5.290 103.578 .000 -1.267 .240 -1.743 -.792
3.339 .070 -5.779 120 .000 -1.423 .246 -1.911 -.936
-5.701 107.916 .000 -1.423 .250 -1.918 -.928
.117 .733 -3.142 120 .002 -.787 .250 -1.283 -.291
-3.120 113.503 .002 -.787 .252 -1.286 -.287
Equal variances
assumed
Equal variances
not assumed
Equal variances
assumed
Equal variances
not assumed
Equal variances
assumed
Equal variances
not assumed
Equal variances
assumed
Equal variances
not assumed
Personally I exerc ise ......
to spend time w ith f riends
Personally I exerc ise .......
to enjoy the social
aspects of exerc ising
Personally I exerc ise ......
to have fun being active
w ith other people
Personally I exerc ise ......
to make new f riends
F Sig.
Levene's Test for
Equality of Variances
t df Sig. (2-tailed)
Mean
Dif ference
Std. Error
Dif f erence Low er Upper
95% Confidence
Interval of the
Dif ference
t-test f or Equality of Means

MO081515/DISSERTATION/ 2011-2012
45
(.724) so is therefore significant. The hypothesis (one-tailed) is p = .000 so
consequently this result is significant (Table: 15.1).
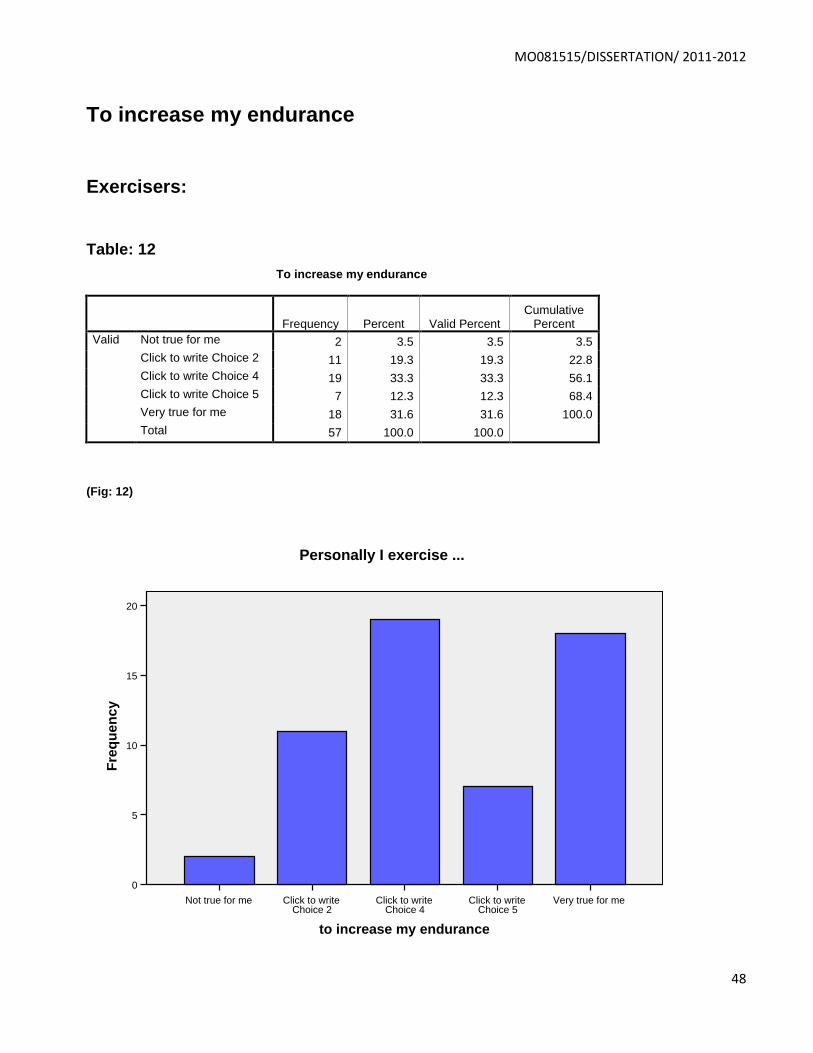
To increase endurance was also found to be higher for exercisers (mean =
3.46) than dancers (mean = 2.26) (Table: 15). 18 (31.6%) exercisers said for
endurance ‘very true for me’ (Table: 12 fig: 12). Whereas 5 (7.7%) of dancers
agreed with this statement (Table: 12.1 fig: 12.1). The effect size was Levene’s
Test shows p > .05 (.693) so is therefore significant. The hypothesis (one-tailed)
is p = .000 so hence this result is significant. (Table: 15.1).
Developing muscles was also rated higher by exercisers (mean = 2.96) than
dancers (mean = 1.86) (Table: 15). There were 10 (17.5%) of exercisers who
stated ‘very true for me’ (Table: 14 fig:14) the importance of developing
muscles. However only 3 (4.6%) of dancers felt it was true for them (Table:
14.1 fig: 14.1). The effect size was large d = 1.79. Levene’s Test shows p > .05
(.886) so is therefore significant. The hypothesis (one-tailed) is p = .000 so
therefore this result is significant (Table: 15.1).
To get stronger was rated higher by exercisers (mean = 3.32) than dancers
(mean =2.12) (Table: 15). 16 (28.1%) of exercisers felt that to get stronger was
‘very true for me’ (Table: 13). Conversely it was found that to get stronger only
applied to 5 (7.7%) of dancers (Table: 13.1 fig: 13.1). The effect size was small
0.33. Levene’s Test shows p > .05 (.667) so is therefore significant. The
hypothesis (one-tailed) is p = .000 so therefore this result is significant (Table:
15.1).

MO081515/DISSERTATION/ 2011-2012
46
Data results: To build up my strength
Exercisers:
Table: 11
(Fig: 11)
to build up my s trength
6 10.5 10.5 10.5
8 14.0 14.0 24.6
7 12.3 12.3 36.8
22 38.6 38.6 75.4
14 24.6 24.6 100.0
57 100.0 100.0
Not true for me
Click to w rite Choice 2
Click to w rite Choice 4
Click to w rite Choice 5
Very true for me
Total
Valid
Frequency Percent Valid Percent
Cumulative
Percent
Very true for meClick to write Choice 5
Click to write Choice 4
Click to write Choice 2
Not true for me
to build up my strength
25
20
15
10
5
0
Fre
qu
en
cy
Personally I exercise ...

MO081515/DISSERTATION/ 2011-2012
47
Dancers:
Table: 11.1
To build up my strength
Frequency Percent Valid Percent Cumulative
Percent
Valid Not true for me 12 18.5 18.5 18.5
Click to write Choice 2 24 36.9 36.9 55.4
Click to write Choice 4 16 24.6 24.6 80.0
Click to write Choice 5 6 9.2 9.2 89.2
Very true for me 7 10.8 10.8 100.0
Total 65 100.0 100.0
(Fig: 11.1)
Very true for meClick to write Choice 5
Click to write Choice 4
Click to write Choice 2
Not true for me
to build up my strength
25
20
15
10
5
0
Fre
qu
en
cy
Personally I dance ....
MO081515/DISSERTATION/ 2011-2012
48
To increase my endurance
Exercisers:
Table: 12
To increase my endurance
Frequency Percent Valid Percent Cumulative
Percent
Valid Not true for me 2 3.5 3.5 3.5
Click to write Choice 2 11 19.3 19.3 22.8
Click to write Choice 4 19 33.3 33.3 56.1
Click to write Choice 5 7 12.3 12.3 68.4
Very true for me 18 31.6 31.6 100.0
Total 57 100.0 100.0
(Fig: 12)
Very true for meClick to write Choice 5
Click to write Choice 4
Click to write Choice 2
Not true for me
to increase my endurance
20
15
10
5
0
Fre
qu
en
cy
Personally I exercise ...

MO081515/DISSERTATION/ 2011-2012
49
Dancers:
Table: 12.1
(Fig: 12.1)
to incre as e my endurance
14 21.5 21.5 21.5
24 36.9 36.9 58.5
14 21.5 21.5 80.0
8 12.3 12.3 92.3
5 7.7 7.7 100.0
65 100.0 100.0
Not true for me
Click to w rite Choice 2
Click to w rite Choice 4
Click to w rite Choice 5
Very true for me
Total
Valid
Frequency Percent Valid Percent
Cumulative
Percent
Very true for meClick to write Choice 5
Click to write Choice 4
Click to write Choice 2
Not true for me
to increase my endurance
25
20
15
10
5
0
Fre
qu
en
cy
Personally I dance ....

MO081515/DISSERTATION/ 2011-2012
50
To get stronger
Exercisers:
Table: 13
To get stronger
Frequency Percent Valid Percent Cumulative
Percent
Valid Not true for me 4 7.0 7.0 7.0
Click to write Choice 2 11 19.3 19.3 26.3
Click to write Choice 4 17 29.8 29.8 56.1
Click to write Choice 5 9 15.8 15.8 71.9
Very true for me 16 28.1 28.1 100.0
Total 57 100.0 100.0
(Fig: 13)
Very true for meClick to write Choice 5
Click to write Choice 4
Click to write Choice 2
Not true for me
to get stronger
20
15
10
5
0
Fre
qu
en
cy
Personally I exercise ...

MO081515/DISSERTATION/ 2011-2012
51
Dancers:
Table 13.1
to get stronger
Frequency Percent Valid Percent Cumulative
Percent
Valid Not true for me 15 23.1 23.1 23.1
Click to write Choice 2 29 44.6 44.6 67.7
Click to write Choice 4 9 13.8 13.8 81.5
Click to write Choice 5 7 10.8 10.8 92.3
Very true for me 5 7.7 7.7 100.0
Total 65 100.0 100.0
(Fig: 13.1)
Very true for meClick to write Choice 5
Click to write Choice 4
Click to write Choice 2
Not true for me
to get stronger
30
25
20
15
10
5
0
Fre
qu
en
cy
Personally I dance ....

MO081515/DISSERTATION/ 2011-2012
52
To develop my muscles
Exercisers:
Table: 14
To develop my muscles
Frequency Percent Valid Percent Cumulative
Percent
Valid Not true for me 8 14.0 14.0 14.0
Click to write Choice 2 10 17.5 17.5 31.6
Click to write Choice 4 17 29.8 29.8 61.4
Click to write Choice 5 12 21.1 21.1 82.5
Very true for me 10 17.5 17.5 100.0
Total 57 100.0 100.0
(Fig: 14)
Very true for meClick to write Choice 5
Click to write Choice 4
Click to write Choice 2
Not true for me
to develop my muscles
20
15
10
5
0
Fre
qu
en
cy
Personally I exercise ...

MO081515/DISSERTATION/ 2011-2012
53
Dancers:
Table 14.1
To develop my muscles
Frequency Percent Valid Percent Cumulative
Percent
Valid Not true for me 20 30.8 30.8 30.8
Click to write Choice 2 27 41.5 41.5 72.3
Click to write Choice 4 8 12.3 12.3 84.6
Click to write Choice 5 7 10.8 10.8 95.4
Very true for me 3 4.6 4.6 100.0
Total 65 100.0 100.0
(Fig: 14.1)
_
Strength and endurance: t-test (independent) results
Very true for meClick to write Choice 5
Click to write Choice 4
Click to write Choice 2
Not true for me
to develop my muscles
30
25
20
15
10
5
0
Fre
qu
en
cy
Personally I dance ....

MO081515/DISSERTATION/ 2011-2012
54
Table: 15
Table: 15.1
Weight management
The next highest perceived benefit for exercisers in comparison to dancers was
weight management.
Independe nt Sample s Te st
.125 .724 3.799 120 .000 1.036 .273 .496 1.577
3.793 117.119 .000 1.036 .273 .495 1.578
.157 .693 4.668 120 .000 1.195 .256 .688 1.701
4.708 119.999 .000 1.195 .254 .692 1.697
.186 .667 4.506 120 .000 1.193 .265 .669 1.717
4.517 118.941 .000 1.193 .264 .670 1.716
.021 .886 4.012 120 .000 1.103 .275 .559 1.648
4.001 116.602 .000 1.103 .276 .557 1.649
Equal variances
assumed
Equal variances
not assumed
Equal variances
assumed
Equal variances
not assumed
Equal variances
assumed
Equal variances
not assumed
Equal variances
assumed
Equal variances
not assumed
Personally I exerc ise .......
to build up my strength
Personally I exerc ise .......
to increase my endurance
Personally I exerc ise .......
to get stronger
Personally I exerc ise ......
to develop my musc les
F Sig.
Levene's Test for
Equality of Variances
t df Sig. (2-tailed)
Mean
Dif f erence
Std. Error
Dif f erence Low er Upper
95% Confidence
Interval of the
Dif f erence
t-test f or Equality of Means
Group Statistics
57 3.42 1.523 .202 65 2.38 1.486 .184 57 3.46 1.310 .174
65 2.26 1.492 .185
57 3.32 1.429 .189 65 2.12 1.484 .184 57 2.96 1.546 .205 65 1.86 1.488 .185
Personally I exercise.......
Exercise Dance Exercise
Dance
Exercise Dance Exercise Dance
To build up my strength
To increase my endurance
To get stronger
To develop my muscles
N Mean Std. Deviation Std. Error
Mean

MO081515/DISSERTATION/ 2011-2012
55
Stay slim
Exercisers perceived the benefits of their activities to be higher (mean = 3.14)
than dancers (mean = 1.98) in order to stay slim (Table: 20). There were 6
(10.5%) exercisers (Table: 16 fig: 16) compared with 1 dancer (1.5%) who
perceived staying slim was a benefit (Table 16.1 fig: 16.1). The effect size was
large 1.18. Levene’s Test shows p > .05 (.361) so is therefore significant. The
hypothesis (one-tailed) is p = .000 so therefore this result is significant (Table
20.1).
Lose weight
Exercisers were higher (mean = 3.77) than dancers (2.37) in their need to lose
weight (Table: 20). There were 10 (17.5%) exercisers who valued losing weight
as ‘very true for me’ (Table: 17 fig: 17.1). This is in comparison with 4 (6.2%)
dancers (Table: 17.1 fig: 17.1). Levene’s Test shows p > .05 (.067) so is
therefore significant. The hypothesis (one-tailed) is p = .000 so consequently
this result is significant (Table 20.1).
Control weight
Exercisers were also higher (mean = 3.25) than dancers (mean = 1.88) in
participating in their activity to control their weight (Table: 20). There were
14(24.6%) of exercisers who stated that it was ‘very true for me’ that controlling
their weight was a highly perceived benefit (Table: 18 fig: 18). Nonetheless, this
was not so strongly felt by dancers, this was only true for 4(6.2%), (Table: 18.1
fig: 18.1). The effect size was large d = 0.96. Levene’s Test shows p > .05
(.754) so is therefore significant. The hypothesis (one-tailed) is p = .000 so
hence this result is significant (Table 20.1).
MO081515/DISSERTATION/ 2011-2012
56
Burn calories
The perceived benefit that exercisers activities helped them to burn calories
was higher (mean = 3.25) than dancers (mean = 2.25). There were 13 (22.8%)
of exercisers who said ‘very true for me’ when they felt that burning calories was
a significant perceived benefit (Table: 19 fig: 19). Only 8 (12.3%) of dancers felt
it was true of them (Table 19.1 fig: 19.1). The effect size was medium d = 0.64.
Levene’s Test shows p > .05 (.186) so is therefore significant. The hypothesis
(one-tailed) is p = .001 so therefore this result is significant (Table 20.1).
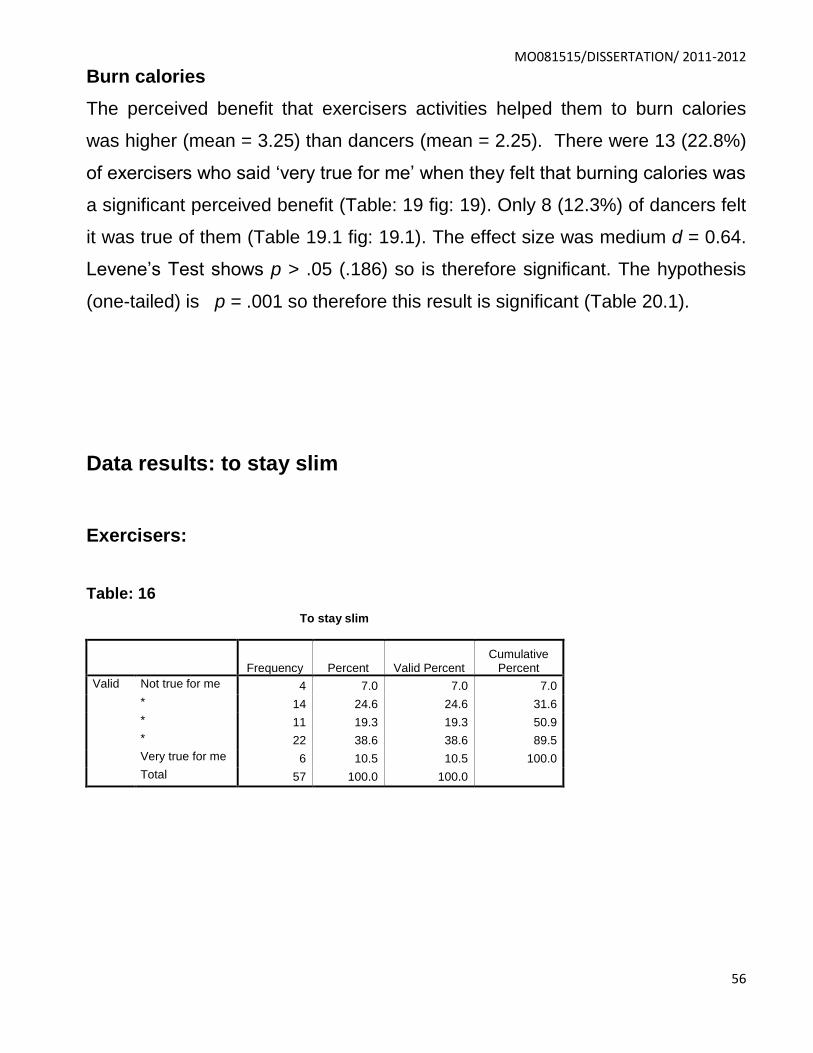
Data results: to stay slim
Exercisers:
Table: 16
To stay slim
Frequency Percent Valid Percent Cumulative
Percent
Valid Not true for me 4 7.0 7.0 7.0
* 14 24.6 24.6 31.6
* 11 19.3 19.3 50.9
* 22 38.6 38.6 89.5
Very true for me 6 10.5 10.5 100.0
Total 57 100.0 100.0

MO081515/DISSERTATION/ 2011-2012
57
(Fig: 16)
Dancers:
Table: 16.1
to stay slim
Frequency Percent Valid Percent Cumulative
Percent
Valid Not true for me 15 23.1 23.1 23.1
* 29 44.6 44.6 67.7
* 14 21.5 21.5 89.2
* 6 9.2 9.2 98.5
Very true for me 1 1.5 1.5 100.0
Total 65 100.0 100.0
Very true for me***Not true for me
to stay slim
25
20
15
10
5
0
Fre
qu
en
cy
Personally I exercise ...
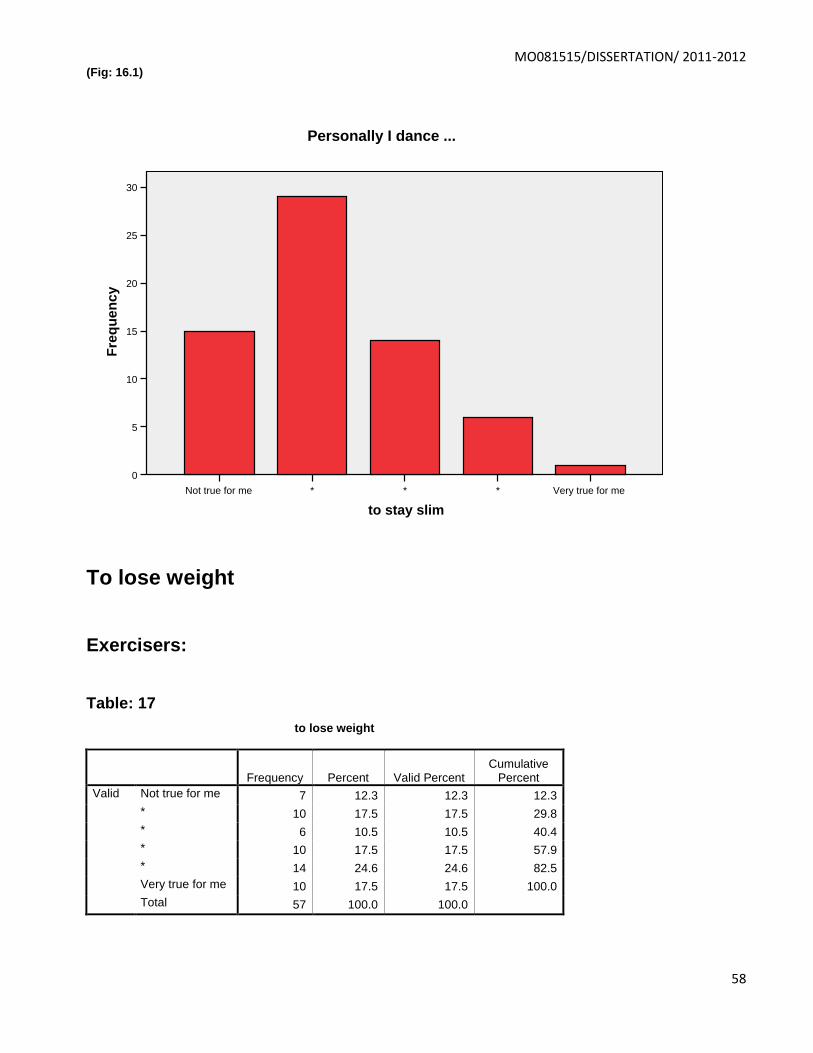
MO081515/DISSERTATION/ 2011-2012
58
(Fig: 16.1)
To lose weight
Exercisers:
Table: 17
to lose weight
Frequency Percent Valid Percent Cumulative
Percent
Valid Not true for me 7 12.3 12.3 12.3
* 10 17.5 17.5 29.8
* 6 10.5 10.5 40.4
* 10 17.5 17.5 57.9
* 14 24.6 24.6 82.5
Very true for me 10 17.5 17.5 100.0
Total 57 100.0 100.0
Very true for me***Not true for me
to stay slim
30
25
20
15
10
5
0
Fre
qu
en
cy
Personally I dance ...

MO081515/DISSERTATION/ 2011-2012
59
(Fig: 17)
Dancers:
Table: 17.1
To lose weight
Frequency Percent Valid Percent Cumulative
Percent
Valid Not true for me 23 35.4 35.4 35.4
* 19 29.2 29.2 64.6
* 9 13.8 13.8 78.5
* 8 12.3 12.3 90.8
* 2 3.1 3.1 93.8
Very true for me 4 6.2 6.2 100.0
Total 65 100.0 100.0
Very true for me
* * * * Not true for me
to lose weight
12.5
10.0
7.5
5.0
2.5
0.0
Frequency
Personally I exercise ...

MO081515/DISSERTATION/ 2011-2012
60
(Fig: 17.1)
To control my weight
Exercisers:
Table: 18
To help control my weight
Frequency Percent Valid Percent Cumulative
Percent
Valid Not true for me 4 7.0 7.0 7.0
Click to write Choice 2 15 26.3 26.3 33.3
Click to write Choice 4 11 19.3 19.3 52.6
Click to write Choice 5 13 22.8 22.8 75.4
Very true for me 14 24.6 24.6 100.0
Total 57 100.0 100.0
Very true for me
****Not true for me
to loose weight
25
20
15
10
5
0
Fre
qu
en
cy
Personally I dance ...
To lose weight

MO081515/DISSERTATION/ 2011-2012
61
(Fig: 18)
Dancers:
Table: 18.1
To help control my weight
Frequency Percent Valid Percent Cumulative
Percent
Valid Not true for me 20 30.8 30.8 30.8
Click to write Choice 2 28 43.1 43.1 73.8
Click to write Choice 4 6 9.2 9.2 83.1
Click to write Choice 5 7 10.8 10.8 93.8
Very true for me 4 6.2 6.2 100.0
Total 65 100.0 100.0
Very true for meClick to write Choice 5
Click to write Choice 4
Click to write Choice 2
Not true for me
to help control my weight
14
12
10
8
6
4
2
0
Fre
qu
en
cy
Personally I exercise ...

MO081515/DISSERTATION/ 2011-2012
62
(Fig: 18.1)
Helps me to burn calories
Exercisers:
Table: 19
Because ......exercise helps me to burn calories
Frequency Percent Valid Percent Cumulative
Percent
Valid Not true for me 4 7.0 7.0 7.0
Click to write Choice 2 15 26.3 26.3 33.3
Click to write Choice 4 10 17.5 17.5 50.9
Click to write Choice 5 15 26.3 26.3 77.2
Very true for me 13 22.8 22.8 100.0
Total 57 100.0 100.0
Very true for meClick to write Choice 5
Click to write Choice 4
Click to write Choice 2
Not true for me
to help control my weight
30
25
20
15
10
5
0
Fre
qu
en
cy
Personally I dance ...

MO081515/DISSERTATION/ 2011-2012
63
(Fig: 19)
Dancers:
Table: 19.1
Because dancing helps me to burn calories
Frequency Percent Valid Percent Cumulative
Percent
Valid Not true for me 18 27.7 27.7 27.7
Click to write Choice 2 22 33.8 33.8 61.5
Click to write Choice 4 6 9.2 9.2 70.8
Click to write Choice 5 11 16.9 16.9 87.7
Very true for me 8 12.3 12.3 100.0
Total 65 100.0 100.0
Very true for meClick to write Choice 5
Click to write Choice 4
Click to write Choice 2
Not true for me
Because exercise helps me to burn calories
14
12
10
8
6
4
2
0
Fre
qu
en
cy
Personally I exercise ...

MO081515/DISSERTATION/ 2011-2012
64
(Fig: 19.1)
Weight management: t-test (independent) results
Table: 20
Very true for meClick to write Choice 5
Click to write Choice 4
Click to write Choice 2
Not true for me
Because dancing helps me to burn calories
25
20
15
10
5
0
Fre
qu
en
cy
Personally I dance ...
Group Statistics
57 3.14 1.302 .172 65 1.98 1.293 .160 57 3.77 1.690 .224
65 2.37 1.464 .182
57 3.25 1.443 .191 65 1.88 1.526 .189 57 3.25 1.430 .189 65 2.25 1.723 .214
Personally I exercise…
Exercise Dance Exercise Dance
Exercise Dance Exercise Dance
To stay slim
To lose weight
To help control my weight
Because
it......exercise It helps me to burn calories
N Mean Std. Deviation Std. Error
Mean

MO081515/DISSERTATION/ 2011-2012
65
Table 20.1
Paired samples
An analysis of results within the two study groups was conducted. The purpose
was to understand what the two groups valued as the highest and lowest
perceived benefits within their own categories.
Exercisers highest rated perceived benefit between themselves
When looking at the highest perceived benefit of partaking in physical exercise
activities, enjoyment was found to be the greatest. Out of the four sub-
categories exercisers valued exerting themselves as ‘very true for me’ the
highest 22 (38.6%) (Table: 1.1 fig: 1.1). Followed by the satisfaction of exercise
by 16 (28.1%) (Table: 2.2 fig: 2.2). Then the enjoyment of experience by 15
(26.3%) (Table: 3.1). Then lastly feeling at their best whilst exercising by 12
(21.1%) (Table: 4.1).
Independe nt Sample s Te st
.841 .361 4.911 120 .000 1.156 .235 .690 1.622
4.908 117.718 .000 1.156 .235 .689 1.622
3.424 .067 4.912 120 .000 1.403 .286 .837 1.968
4.866 111.626 .000 1.403 .288 .831 1.974
.098 .754 5.070 120 .000 1.369 .270 .834 1.903
5.089 119.303 .000 1.369 .269 .836 1.901
1.773 .186 3.457 120 .001 .999 .289 .427 1.572
3.499 119.657 .001 .999 .286 .434 1.565
Equal variances
assumed
Equal variances
not assumed
Equal variances
assumed
Equal variances
not assumed
Equal variances
assumed
Equal variances
not assumed
Equal variances
assumed
Equal variances
not assumed
Personally I exerc ise .........
.to stay s lim
Personally I exerc ise ......
to loose w eight
Personally I exerc ise ......
to help control my w eight
Personally I exerc ise
because ......exercise
helps me to burn calories
F Sig.
Levene's Test for
Equality of Variances
t df Sig. (2-tailed)
Mean
Dif f erence
Std. Error
Dif f erence Low er Upper
95% Confidence
Interval of the
Dif f erence
t-test f or Equality of Means

MO081515/DISSERTATION/ 2011-2012
66
Exercisers lowest rated perceived benefit between themselves
The least rated perceived benefit of engaging in exercise was seen through
health pressures. Participating in exercise as a health benefit through advice
from a GP was seen to be ‘very true for me’ for 1(1.8%) of exercisers (Table:
21.1 fig: 21.1). 5 (8.8%) exercisers took up exercise in order to prevent illness
stated ‘very true for me’(Table 22.1 fig: 22.1). In order to help recover from
illness or injury, 2 (3.5%) of exercisers specified ‘very true for me’ (Table 23.1
fig: 23.1).
Highest rated benefit between themselves
Exercisers amongst themselves rated enjoyment the highest perceived benefit.
These results have already been stated when looking at the perceived benefits
between samples. (See results for enjoyment).
Dance: lowest rated perceived benefit between themselves
Dancers rated health pressures lowest in terms of perceived benefits. The
highest rating was from (1.5%) of dancers who stated that they danced because
their doctor advised them to exercise (Table: 21 fig: 21). Preventing an illness
that runs in the family was rated ‘very true for me’ by 3.1% of dancers (Table 22
fig: 22). However, 7.7% dancers found it to be ‘very true for me’ to participate in
dance to help them in recovering from an illness or injury (Table: 23 fig 23).

MO081515/DISSERTATION/ 2011-2012
67
Results: Health Pressures
Because my doctor advised me to exercise
Dancers:
Table: 21
(Fig: 21)
Be cause m y doctor advis ed me to e xe rcise
58 89.2 89.2 89.2
6 9.2 9.2 98.5
1 1.5 1.5 100.0
65 100.0 100.0
Not true for me
Click to w rite Choice 2
Click to w rite Choice 4
Total
Valid
Frequency Percent Valid Percent
Cumulative
Percent
Click to write Choice 4Click to write Choice 2Not true for me
Because my doctor advised me to exercise
60
50
40
30
20
10
0
Fre
qu
en
cy
Personally I dance ...

MO081515/DISSERTATION/ 2011-2012
68
Exercisers
Table: 21.1
my doctor advised me to exercise
Frequency Percent Valid Percent Cumulative
Percent
Valid Not true for me 39 68.4 68.4 68.4
Click to write Choice 2 13 22.8 22.8 91.2
Click to write Choice 4 4 7.0 7.0 98.2
Very true for me 1 1.8 1.8 100.0
Total 57 100.0 100.0
(Fig: 21.1)
Very true for meClick to write Choice 4Click to write Choice 2Not true for me
Because my doctor advised me to exercise
40
30
20
10
0
Fre
qu
en
cy
Personally I exercise ...

MO081515/DISSERTATION/ 2011-2012
69
To help prevent illness
Dancers:
Table: 22
(Fig: 22)
to he lp pre ve nt illne ss that runs in my family
51 78.5 78.5 78.5
10 15.4 15.4 93.8
2 3.1 3.1 96.9
2 3.1 3.1 100.0
65 100.0 100.0
Not true for me
Click to w rite Choice 2
Click to w rite Choice 4
Very true for me
Total
Valid
Frequency Percent Valid Percent
Cumulative
Percent
Very true for meClick to write Choice 4Click to write Choice 2Not true for me
to help prevent illness that runs in my family
60
50
40
30
20
10
0
Fre
qu
en
cy
Personally I dance ...

MO081515/DISSERTATION/ 2011-2012
70
Exercisers:
Table: 22.1
To help prevent illness that runs in my family
Frequency Percent Valid Percent Cumulative
Percent
Valid Not true for me 24 42.1 42.1 42.1
Click to write Choice 2 19 33.3 33.3 75.4
Click to write Choice 4 4 7.0 7.0 82.5
Click to write Choice 5 5 8.8 8.8 91.2
Very true for me 5 8.8 8.8 100.0
Total 57 100.0 100.0
(fig:22.1)
Very true for meClick to write Choice 5
Click to write Choice 4
Click to write Choice 2
Not true for me
to help prevent illness that runs in my family
25
20
15
10
5
0
Fre
qu
en
cy
Personally I exercise ...

MO081515/DISSERTATION/ 2011-2012
71
To help recover from an illness or an injury
Dancers:
Table: 23
(Fig: 23)
to he lp recover from an illne ss or injury
51 78.5 78.5 78.5
4 6.2 6.2 84.6
1 1.5 1.5 86.2
4 6.2 6.2 92.3
5 7.7 7.7 100.0
65 100.0 100.0
Not true for me
Click to w rite Choice 2
Click to w rite Choice 4
Click to w rite Choice 5
Very true for me
Total
Valid
Frequency Percent Valid Percent
Cumulative
Percent
Very true for meClick to write Choice 5
Click to write Choice 4
Click to write Choice 2
Not true for me
to help recover from an illness or injury
60
50
40
30
20
10
0
Fre
qu
en
cy
Personally I dance ...

MO081515/DISSERTATION/ 2011-2012
72
Exercisers:
(Table: 23.1)
Frequency Percent Valid Percent Cumulative
Percent
Valid Not true for me 28 49.1 49.1 49.1
Click to write Choice 2 18 31.6 31.6 80.7
Click to write Choice 4 8 14.0 14.0 94.7
Click to write Choice 5 1 1.8 1.8 96.5
Very true for me 2 3.5 3.5 100.0
Total 57 100.0 100.0
(Fig: 23.1)
Very true for meClick to write Choice 5
Click to write Choice 4
Click to write Choice 2
Not true for me
to help recover from an illness or injury
30
25
20
15
10
5
0
Fre
qu
en
cy
Personally I exercise ...

MO081515/DISSERTATION/ 2011-2012
73
Discussion
The results of the study reflect and support some of the existing research
findings and anecdotal knowledge within the literature review that attests to the
perceived benefits of physical exercise and dance. However the findings do not
support the authors’ hypothesis ‘The perceived benefits of dance will be higher
than the perceived benefits of exercise’. It appears that both dancers and
exercisers participate in their physical activity with varying importance applied to
the various perceived benefits. As the majority of the participants were actively
dancing or exercising it would be fair to say that the activity they participated in
served to fulfil certain benefits more than others. It appears from the results
that a person who engages in dance activities is more inclined to value dance
firstly, for the perceived benefits of ‘enjoyment’, and then followed by ‘affiliation’.
Exercisers; however seem to engage in their activities primarily because of
‘weight’ secondly for the aspects of ‘positive health’ in comparison with dancers.
After comparisons were made between samples comparisons were made within
the sample groups themselves. When observing exercisers highest and lowest
perceived benefits, exercisers perception of ‘enjoyment’ is actually the highest
rated perceived benefit. However benefits from ‘health pressures’ were found to
be the lowest. Dancers amongst themselves rated ‘enjoyment’ as the highest
perceived benefit and were least influenced by ‘health pressures’.
The study has therefore revealed that both dancers and exercisers have a
broad perception of the various benefits of their respective physical activities.
However when conducting a test of frequencies within each study group it was
found that there was a commonality with both groups. Both study samples

MO081515/DISSERTATION/ 2011-2012
74
valued ‘enjoyment’ highest. Subsequently both groups stated ‘health pressures’
as the lowest overall reason to be participating in their given activities.
People are more likely to participate in activities if they perceive the accrued
benefits exceed their perceived difficulties (El Ansari and Phillips 2004). This
observation was reflected in the study results which revealed that by comparing
the 14 categories of perceived benefits, certain benefits were rated noticeably
higher or lower for those who participated in dance when compared to those
who partook in exercise. For example those partaking in weight training or were
weightlifters rated enjoyment and affiliation as not being important where as
these factors were rated much higher across all the dance participants.
Strengths and Limitations
There are some points to consider that may have impacted the final results from
this research study and literature review. Firstly Markland and Ingledew (1997)
state that the EMI-2 questions were not inflexible due to the countless variations
each question could have been posed. Not only that, there many questions that
could be created to enquire about perceived benefits. Markland and Ingledew
(1997) state that there are many other possible questions that may be suitable
in finding out the various perceived benefits. Markland and Ingledew, (1997)
make it clear that the EMI-2 questionnaire despite their validation of its
robustness is therefore open to modification. However by modifying the
questions and the questionnaire for this study the validation of the EMI-2 by
Markland and Ingledew (1997) has therefore been negated.
Another limitation of this study for instance, is due to the methodology used in
gathering the data. The researcher was not able to for example to control the
balance of gender or the spectrum and quantity of physical actives. Because of

MO081515/DISSERTATION/ 2011-2012
75
this there was an imbalance in gender and activities. However, gender was not
taken into consideration for this particular study. Although the questionnaire
was designed to find out the perceived benefits of exercise or dance it cannot
be generalised because the perceived benefits were primarily from those who
were already partaking in a dance or exercise activities. The literature review
was also limited not only by time abut financial restrictions in obtaining some
potential relevant research findings.
As previously stated there is discrepancy over when physical activity becomes
exercise. Biddle and Mutrie (2008), state that the distinction between exercise
and physical activity does overlap. However there is for some a distinction
made between exercise and sport as revealed in the literature review and
exemplified by the study by Kilpatrick, Hebert and Bartholomew (2005).
Kilpatrick, Hebert and Bartholomew (2005) made a clear comparison between
sport and exercise, and found strong differences between exercise activities
and sporting pursuits. This is also highlighted in a document published by the
Right To Play (2010), who emphasise the importance of sport as an inclusive
and social activity as well as its physical benefits. Therefore it may have been
better to have either not included sports or said this study was a comparison
between dance and other physical activities. However the discrepancy over
sport and its relationship to exercise is subjective as Biddle and Mutrie
(2008:10 ) for their purposes defined sport as a sub category of exercise.
Although both categories of dance and physical exercise had a broad spectrum
of types, one factor that was distinctly different was that the dance activities
were mainly in a social context. The majority of the dances were partner based.
Despite the variety of styles such as lindy hop, salsa, tango, and bachata, the
dances all exhibit similar social constructs. Activities under the banner of
exercise were, however, far more diverse in terms of the possible social

MO081515/DISSERTATION/ 2011-2012
76
content. Example amongst the exercise categories were weightlifting and
kickboxing. However, using joggers as an example; jogging may often be a
solo activity, but there are also jogging groups.
The broader aspects of physical activity, gardening (for example), could also be
purposely included in future studies. Gardening was the exercise activity one
participant in this study chose to exemplify. Gardening as a physical activity is
believed to be a factor that leads to good mental and physical health (Parr
2005, Park, Shoemaker and Haub (2008). Coulson (2007: 221) lists gardening
as one of many other activities listed under housework, when talking about
exercise and energy expenditure.
Other respondents have also revealed through their choice of physical exercise,
that what people perceive as physical exercise can be very subjective. Some
participants when completing the exercise questionnaire, when stating their
chosen activity put dance. Another interesting consequence of people’s activity
choice was with Zumba. Zumba is an exercise activity that also promotes itself
as dance. The consequence of this was Zumba, as an activity appeared as an
answer in both exercise and dance questionnaires. This may put the validity of
the results to question but they may also be supportive of the notion that
exercise can be attributed to many activities. Finally if the author had more time
they may have been able to gather a greater amount of data to give a more
robust set of results and findings.

MO081515/DISSERTATION/ 2011-2012
77
Future studies
As this study is unique in its methodology it is therefore not possible to compare
the data with any existing studies. It may be worth considering repeat studies
using the same criteria in order to build a more robust case and hence more
resilient results. An additional issue that may be worth addressing in future is
that the types of dance or exercise were not differentiated in this study. The
type of dance or exercise would possibly influence the degree to which a person
would perceive the importance of the various factors. For example those who
were weightlifters or participating in weight training may rate elements of social
recognition, affiliation and competition with low scores. Whereas those whose
activities were running or jogging may rate these attributes as quite high.
Another area to be considered is that although there was a broad response in
terms of dance styles and exercise activities there were only a few respondents
for each style or activity. Therefore to obtain a more robust result future studies
may wish to ensure there are significant numbers of respondents for each
exercise or dance.
The author is also aware that gender or age was not considered in this study.
Future research may wish to factor these variables in.as they may also have
had a significant impact perceived benefits. Having no controls on who
participated in this study (apart from age) meant that there was an
overwhelming bias in response from females in comparison to males. The
author aimed the survey at a cross cultural global level. However, the
geographic location of the participants was not a requisite of the questionnaire.
Nonetheless it may be a useful element to consider in future studies. Another
important factor that was not recognised in this study was the level of
competence of the persons involved. In both fields of dance and physical

MO081515/DISSERTATION/ 2011-2012
78
exercise there will be ‘beginners’ through to ’advanced’, some of the people
involved were tutors too. These factors may have also impacted individual
responses.
Although there was a low response rate there was however a broad spectrum of
dance and exercise related activities to compare. As a general comparison this
ensured the responses were not from a single activity. Nonetheless this was a
weakness if specific dance or physical exercise activities were to be compared
as some activities generated more responses than others, some activities
received only one or two responses. Therefore future studies may wish to
ensure there is a significant enough response rate to compare specific
activities.
Conclusion
Although the hypothesis was not supported by the results of the study, the
results do however support the many findings in previous research and
anecdotal understanding about dance and physical exercise perceived benefits.
The study nonetheless does reveal that dancers do have a broad belief of the
perceived benefits of dancing. The results also reveal that exercisers likewise
perceive the benefits of exercise within the broader sense of health and
wellbeing. The comparison between dancers and exercisers has shown that
some benefits are felt to be more significant than others. This has also been
shown to be true when looking at the perceived benefit between dancers and
dancers, and exercisers and exercisers. The research results have therefore
shown that the perceived benefits that people associate with either dance or
physical exercise are probably key factors for people to participate in their
chosen activity. The study supports current research and anecdotal evidence in

MO081515/DISSERTATION/ 2011-2012
79
its findings both for exercise and dance perceived benefits. By participating in
the physical activities of dance or exercise various aspects of wellbeing can be
nurtured, from the physiological through to the psychological. By looking at the
holistic benefits of dance in terms of physical activity and active living, it can be
seen that dancers perceived benefits are as significant as the perceived
benefits of physical exercise. Therefore under the umbrella of physical activity
and active living, dance should be equally encouraged and respected alongside
physical exercise, as a catalyst for cultivating wellbeing.

MO081515/DISSERTATION/ 2011-2012
80
References
Alpert, T, P; Miller, K. S; Wallmann, H; Havey, R; Cross, C; Chevalia, T; Gillis,
B, C and Kodandapari, K. (2007) The effect of modified jazz dance on balance,
cognition, and mood in older adults Journal of the American Academy of Nurse
Practitioners Vol. 21,108-115.
Arcangeli, A. (2000) Dance and Health: The Renaissance Physicians’ View
The Journal of the Society for Dance Research, Vol. 18, (1) 3-30
Armstrong, K., and Edwards, H. (2003) The effects of exercise and social
support on mothers reporting depressive symptoms: A pilot randomized
controlled trial International Journal of Mental Health Nursing (12), 130–138
Bartholomew, B. J., Morrison, D. and Ciccolo,T. J. (2005) Effects of Acute
Exercise on Mood and Well-Being in Patients with Major Depressive Disorder
Medicine and Science in Sports and Exercise., Vol. 37, (12), 2032 -2036
Birks, M. (2007) The Benefits of Salsa Classes for People with Depression.
[online]
Available from <http://www.nursingtimes.net/nursing-practice-clinical-
research/the-benefits-of-salsa-classes-for-people-with-
depression/201751.article>
[9 May 2009]

MO081515/DISSERTATION/ 2011-2012
81
Blair,S., Collingwood, R,T., Reynolds, R., Smith, M., R. Hagan, D. and
Sterling, L, C. (1984) Health Promotion for Educators: Impact on Health
Behaviors, [sic] Satisfaction and General Well-Being Vol.74 (2), 147-149
Brace, N., Kemp,R. and Snelgar (2009) SPSS For Psychologists 4th Ed. UK:
Palgrave Macmillan
Bremer, Z. (2007) Dance as a Form of Exercise British Journal of General
Practice, Vol. 57 (533), 166
Biddle, S., Fox, R, K. and Boutcher, H, S. (2000) Physical activity and
psychological well-being USA: Routledge
Biddle, J, H, S. Mutrie, N. (2008) Psychology of Physical Activity: Determinants,
Well-being and Interventions. USA: Routledge
BUPA (2011) Keep Dancing: The health and well-being benefits
of dance for older people [online]
Available from
<http://www.bupa.co.uk/jahia/webdav/site/bupacouk/shared/Documents/PDFs/c
are-homes/general/shall-we-dance-report.pdf>
[12 April 2012]

MO081515/DISSERTATION/ 2011-2012
82
Callaghan, P., Khalil, E., Morres, I. (2011) Pragmatic Randomised Controlled
Trial of a Preferred Intensity Exercise Programme to Improve Wellbeing
Outcomes of Women Living with Depression Bio Medical Central Public Health
Vol.11, 465
Caspersen C, Powell K, and Christensen G. (1985) Physical Activity, Exercise,
and
Physical Fitness: Definitions and Distinctions for Health-Related Research.
Public Health Reports, Vol. 100 (2) 126–131
Connolly, K. M., Chorley, M., Quin, E., Redding, E. (2009) Dance 4 Your Life: A
Dance and Health Project [online]
Available from
<http://www.trinitylaban.ac.uk/media/56046/dance%204%20your%20life%20full
%20report.pdf>
[19 March 2012]
Coulson, M. (2007) The Fitness Instructors Handbook London: A and C Black
Publishers Ltd
Department of Health (2011) Healthy lives, Healthy people [online]
Available from
<http://www.dh.gov.uk/en/Publicationsandstatistics/Publications/PublicationsPol
icyAndGuidance/DH_128120>
[12 March 2012]
Department of Health (2011) Cold Facts Hot Feet Dancing to Health: A review
of the evidence. [online]

MO081515/DISSERTATION/ 2011-2012
83
Available from
<http://www.healthyweight4children.org.uk/resource/item.aspx?RID=92919>
[20 May 2011]
Dimondstein, G. (1985) Journal of Aesthetic Education. Vol.19 (4), 77-84
Dils, A. and Cooper –Albright, A (2001) Moving history / dancing cultures: a
dance history reader USA: Wesleyan University Press
Durdey, T. (2006) Advance: Creating Wellbeing through Movement and Dance:
Conference Report Nottingham: Dance 4
El Ansari, W. Phillips, C.J. (2004) The Costs and benefits of participants in
community partnerships. A Paradox? Health Promot. Pract. (5), 35-48.
Eyigor, S., Karapolat, H., Durmaz, B., Ibisoglu, U. and Cakir, S. (2009) A
randomized controlled trial of Turkish folklore dance on the physical
performance, balance, depression and quality of life in older women. Archives
of Gerontology and Geriatrics Vol.48, 84-88
Fox, R, K. (1999) The influence of physical activity on mental well-being Public
Health Nutrition 2 (3a), 44-418
Gardner, M, S., Komesaroff, P. and Fensham, R. (2008) Dancing beyond
exercise: young people’s experience in dance classes. Journal of youth studies.
Vol 11, (6), 701-109

MO081515/DISSERTATION/ 2011-2012
84
Genti, M., Goulimaris, D. and Yfantidou, G. (2009) The Psychological Mood of
Adult Participants in Aerobics, Greek Traditional Dances and Muscle
Strengthening Programs. International Journal of Sport Management
Recreation andTourism, Vol.4, 40-51
Goodlad, R. Hamilton, C., and Taylor, D. P. (2002) Not Just a Treat: Arts and
Social Inclusion: A report to the Scottish Arts Council Glasgow: Centre for
Cultural Policy Research and Department of Urban Studies
Haboush, A., Floyd, M., Caron, J., LaSota, M. and Alvarez, K. (2006) Ballroom
dance lessons for geriatric depression: An exploratory study The Arts in
Psychotherapy Vol. 33 (2), 89-97
Hampshire Dance and Laban (2007) NRG Youth Dance and Health Project
2005-06: Evaluation Report England: Hampshire Dance and Laban
Hanna, L, J. (2006) Dancing for Health: Conquering and Preventing Stress
USA: Alta Mira Press
Hall, T. (2008) The dance review: A report to Government on Dance Education
and Youth Dance in England. London: DCSF and DCMS.
Hayes, D. and Ross, E. C. (1986) Body and Mind: The Effect of Exercise,
Overweight, and Physical Health on Psychological Well-Being Journal of Health
and Social Behavior [sic] Vol. 27, 387-400

MO081515/DISSERTATION/ 2011-2012
85
Heiberger, L., Maurer, C., Amtage, F., Mendez-Balbuena, I., Schulte-
Mönting,J., Hepp-Reymond, C-M. and Kristeva, R. (2011) Impact of a weekly
dance class on the functional mobility and on the quality of life of individuals
with Parkinson’s disease Frontiers in Ageing Neuroscience Vol. 3, 1-15
Health Education Authority (2000) Physical Activity ‘at our time’ Great Britain:
Health Education Authority
Ingledew, K, D., and Markland, D. (2008) The Role of Motives in Exercise
Participation Psychology and Health 23 (7), 807-828
Jeong, Y., Hong, S., Lee, M., Park, M., Kim,Y. and Suh, C. (2005) Dance
Movement Therapy Improves Emotional Responses and Modulates
Neurohormones in Adolecents with Mild Depression. International Journal of
Neuroscience (115), 1711-1720
Kassing G. (2007) History of dance: An interactive arts approach USA: Human
Kinetics
Keogh J.W, Kilding A., and Pidgeon P. (2009) Physical Benefits of Dancing for
Healthy Older Adults: A Review. Journal of Aging and Physical Activity (17),
479-500
Kilpatrick, M. Hebert, E., and Bartholomew, J (2005) College Students’
Motivation for Physical Activity: Differentiating Men’s and Women’s Motives for

MO081515/DISSERTATION/ 2011-2012
86
Sport Participation and Exercise Journal of American College Health Vol. 54 (2),
87-94
Koch, C, S., Morlinhaus, K., and Fuchs, T. (2007) The Joy dance Specific
effects of a single dance intervention on psychiatric patients with depression
The Arts in Psychotherapy Vol. 34, 340-349
Kokkinos P. (2010) Physical Activity and Cardiovascular Disease Prevention
USA: Library of Congress
Lane, M, A. and Lovejoy, J, D. (2000) The Effects of Exercise on Mood Change:
The Moderating Effect of Depressed Mood. [online]
Available from
<http://www.google.co.uk/#hl=en&source=hp&biw=1276&bih=823&q=The+Effe
cts+of+Exercise+on+Mood+Change:+The+Moderating+Effect+of+Depressed+
Mood.+&btnG=Google+Search&aq=f&aqi=&aql=&oq=&bav=on.2,or.r_gc.r_pw.
&fp=22855bf2502a6627>
[20 May 2011]
Ledger, K. and Scott, N. (2003) Women’s experience of 5 Rhythms dance and
the effects on their emotional wellbeing UK: UK Advocacy Network
Levin, J. (2009) Depression and Mood Disorders USA: The Rosen Publishing
Group Inc.
Lima, S, M, M. and Vieira, P. A. (2007) Ballroom Dance as Therapy for the
Elderly in Brazil American Journal of Dance Therapy Vol. 29, ( 2), 129-142

MO081515/DISSERTATION/ 2011-2012
87
Lovell, G. P., El Ansari, W. and Parker, K. J. (2010) Perceived Exercise Benefits
and Barriers of Non-Exercising Female University Students in the United
Kingdom Vol.7 (3), 784-798
MacMains, E, J. (2006) Glamour addiction: inside the American ballroom dance
industry USA: Wesleyan University Press
Markland, D. and Ingledew, D.K. (1997) The measurement of exercise motives:
Factorial validity and invariance across gender of a revised Exercise
Motivations Inventory. British Journal of Health Psychology Vol. 2, 361-367
Mental Health Foundation (2005) Up and Running? Exercise therapy and the
treatment of mild or moderate depression in primary care UK: Mental Health
Foundation
Murcia, Q, C., Bongard, S., and Kreutz, G. (2009) Emotional and Neurohumoral
Responses to Dancing Tango Argentino: The Effects of Music and Partner
Music and Medicine Vol. 1 (1), 14-20
Murcia, Q, C., Kreutzb, G., Clift, S. and Bongard, S. (2010) Shall we dance?
An exploration of the perceived benefits of dancing on well-being Arts and
Health: An International Journal for Research, Policy and Practice, Vol. 2 (2),
149-163

MO081515/DISSERTATION/ 2011-2012
88
Norfield,J. and Nordin-Bates (2011) How community dance leads to positive
outcomes:A self-determination theory perspective Journal of Applied Arts and
Health Vol. 2 (3), 257–272
Ogden, J. (2007) Health Psychology: a text book 4th Ed. England: Open
University Press
Park, A-S, Shoemaker,C. and Haub, M. (2008) Can Older Gardeners Meet the
Physical Activity Recommendation through Gardening? Horticultural
Technology 18 (4), 639- 643
Parr, H. (2005) Sustainable Communities? Nature Work and Mental Health
Scotland: Economic and Social Research Council
Pepper, S, M. (1984) Dance - a suitable form of exercise? A physiological
appraisal SA Medical Journal (66), 883- 888
Phillips-Silver, J. and Trainor,J, L. (2005) Feeling the Beat: Movement
Influences Infant Rhythm Perception Science Vol. 308, 1430
Peerbhoy, D., Smith, A. and Birchall, J. (2002) Out of Reach: A Merseyside
Dance Initiative (MDI) practical evaluation project on the impact of dance as a
tool of social interaction UK: Merseyside Dance Initiative

MO081515/DISSERTATION/ 2011-2012
89
Right To Play (2010) Sport and Health: Preventing Disease and Promoting
Health [online]
Available from
<http://www.righttoplay.com/International/news-and-
media/Documents/Policy%20Reports%20docs/Harnessing%20the%20Power%
20-%20FULL/Chapter2_SportandHealth.pdf>
[10 Jan 2012]
Scully, D., Kremer, J., Meade, M. M., Graham, R. and Dudgeon, K. (1998)
Physical Exercise and Psychological Wellbeing: A Critical Review British
Journal of Sports Medicine 32, 111-120
Searle, A. (2007) Introducing Research and Data in Psychology: A Guide to
Methods and Analysis USA: Taylor and Francis Books UK. Kindle Edition.
Shoupe, A. C. (2001) Communities of Practice: Traditional Music and Dance
Western Folklore, Vol. 60 (2/3), 125-148

MO081515/DISSERTATION/ 2011-2012
90
Shrader, A, C (2005) A Sense of Dance: Exploring Your Movement Potential
USA: Versa Press
Sport England (2005) Understanding Participation In Sport: A Systematic
Review – September 2005 UK: Sports England
Stroebe, W., and Stroebe,M. (1997) Social Psychology and Health Great
Britain: St Edmundsbury Press
Trinity Laban Conservatoire of Music and Dance (unknown ) Dancing towards
well-being in the Third Age Literature Review on the impact of dance on health
and well-being among older people [online]
Available from
<http://www.trinitylaban.ac.uk/media/315435/literature%20review%20impact%2
0of%20dance%20elderly%20populations%20final%20draft%20with%20logos.p
df>
[19 April 2012]
Urmston, E. Chater, A., Spampinato-Korn, A. and Kozub, S. (2012)Go Dance
Inspiring children to dance to 2012 and beyond UK: East Youth Dance
West, J; Otte, C; Geher, K; Johnson,J. and Mohr,C,D. (2004) Effects of Hatha
Yoga and African Dance on Perceived Stress, Affect, and Salivary Cortisol.
Annals of Behavioural Medicine. Vol.28 (2), 114-118
World Health Organisation (2006a) Constitution of the World Health
Organisation [online]
Available from <http://www.who.int/governance/eb/who_constitution_en.pdf>

MO081515/DISSERTATION/ 2011-2012
91
[13 March 2012]
World Health Organisation (2006b) Promoting Physical Activity and Active
Living in Urban Environments: The Role of Local Governments [online]
Available from
<http://www.euro.who.int/__data/assets/pdf_file/0009/98424/E89498.pdf >
[13 March 2012]
World Health Organisation (2003) Social Determinants of Health: The Solid
Facts 2nd ED [online]
Available from <http://www.euro.who.int/en/what-we-publish/abstracts/social-
determinants-of-health.-the-solid-facts>
[10 April 2012]
Qualtrics (unknown) Free Account [online] Available from
<http://www.qualtrics.com/ >
[13 May 2012]
Zentner,M, and Eerola,T. (2010) Rhythmic engagement with music in infancy
PNAS Vol. 107 (13) 5768–5773

MO081515/DISSERTATION/ 2011-2012
92
Zhang, G-J., Ishikawa-Takata, K., Yamazaki, H. Morita, T. and Ohta, T. (2008)
Postural stability and physical performance in social dancers Gait and Posture
(27) p 697-701
Zumba (2012) Zumba fitness [online] available at: <http://www.zumba.com/>
[21 April 2012]

MO081515/DISSERTATION/ 2011-2012
93
Appendix
1)
Questionnaire
The version of the questionnaires represented here are the exact same
questions as found on the electronic version created online. This is the exercise
version, the dance one being exactly the same except the word ‘dance’
replaces the word ‘exercise’. However the disclaimer is not available as it was
developed online during the creation of the online version of the questionnaire.

MO081515/DISSERTATION/ 2011-2012
94
Exercise
On the following pages are a number of statements concerning the reasons people often give when
asked why they exercise. Please read each statement carefully and indicate, by circling the
appropriate number, whether or not each statement is true for you personally. If you do not consider
a statement to be true for you at all, circle the ‘0’. If you think that a statement is very true for you
indeed, circle the ‘5’. If you think that a statement is partly true for you, then circle the ‘1’, ‘2’, ‘3’ or
‘4’, according to how strongly you feel that it reflects why you partake in exercise activities.
Remember, we want to know why you personally choose to exercise, not whether you think the
statements are good reasons for anybody to exercise.
It helps us to have basic personal information about those who complete this questionnaire. We
would be grateful for the following information:
age ………… years gender …… male/female
Exercise activity …………
Occupation …………….
Personally, I exercise …
1 To stay slim 0 1 2 3 4 5
2
To avoid ill-health
0
1
2
3
4
5
3
Because it makes me feel good
0
1
2
3
4
5
4
To help me look younger
0
1
2
3
4
5
5
To show my worth to others
0
1
2
3
4
5
Not true
for me
Very true
for me
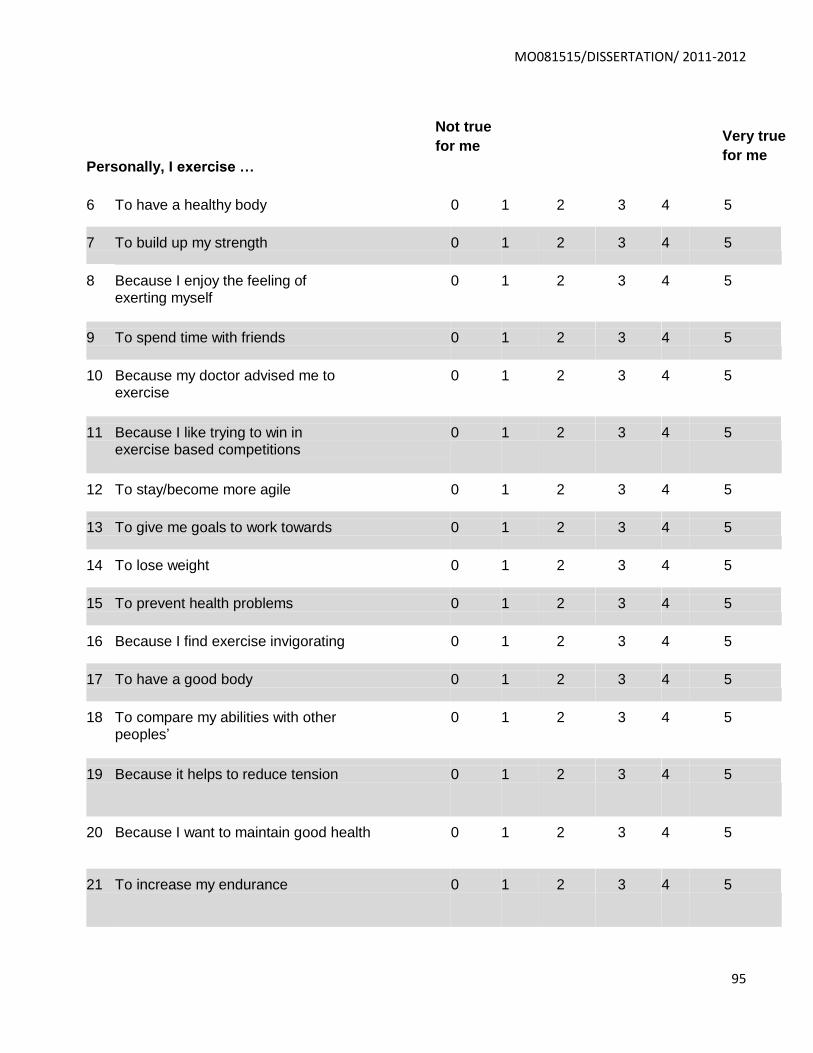
MO081515/DISSERTATION/ 2011-2012
95
Personally, I exercise …
6
To have a healthy body
0
1
2
3
4
5
7
To build up my strength
0
1
2
3
4
5
8
Because I enjoy the feeling of exerting myself
0
1
2
3
4
5
9
To spend time with friends
0
1
2
3
4
5
10
Because my doctor advised me to exercise
0
1
2
3
4
5
11
Because I like trying to win in exercise based competitions
0
1
2
3
4
5
12
To stay/become more agile
0
1
2
3
4
5
13
To give me goals to work towards
0
1
2
3
4
5
14
To lose weight
0
1
2
3
4
5
15
To prevent health problems
0
1
2
3
4
5
16
Because I find exercise invigorating
0
1
2
3
4
5
17
To have a good body
0
1
2
3
4
5
18
To compare my abilities with other peoples’
0
1
2
3
4
5
19
Because it helps to reduce tension
0
1
2
3
4
5
20
Because I want to maintain good health
0
1
2
3
4
5
21
To increase my endurance
0
1
2
3
4
5
Not true
for me
Very true
for me

MO081515/DISSERTATION/ 2011-2012
96
22
Because I find exercise satisfying in and of itself
0
1
2
3
4
5
Personally, I exercise …
23
To enjoy the social aspects of exercise
0
1
2
3
4
5
24
To help prevent an illness that runs in my family
0
1
2
3
4
5
25
Because I enjoy competing
0
1
2
3
4
5
26
To maintain flexibility
0
1
2
3
4
5
27
To give me personal challenges to face
0
1
2
3
4
5
28
To help control my weight
0
1
2
3
4
5
29
To avoid heart disease
0
1
2
3
4
5
30
To recharge my batteries
0
1
2
3
4
5
31
To improve my appearance
0
1
2
3
4
5
32
To gain recognition for my accomplishments
0
1
2
3
4
5
33
To help manage stress
0
1
2
3
4
5
34
To feel more healthy
0
1
2
3
4
5
35
To get stronger
0
1
2
3
4
5
36
For enjoyment of the experience of
exercise
0
1
2
3
4
5
37
To have fun being active with other people
0
1
2
3
4
5
Not true
for me
Very true
for me

MO081515/DISSERTATION/ 2011-2012
97
Personally, I exercise …
Thank you for completing this questionnaire
38 To help recover from an illness/injury 0 1 2 3 4 5
39
Because I enjoy the competitiveness of exercise
0
1
2
3
4
5
40
To stay/become flexible
0
1
2
3
4
5
41
To develop personal skills
0
1
2
3
4
5
42
Because exercise helps me to burn calories
0
1
2
3
4
5
43
To look more attractive
0
1
2
3
4
5
44
To accomplish things that others are incapable of
0
1
2
3
4
5
45
To release tension
0
1
2
3
4
5
46
To develop my muscles
0
1
2
3
4
5
47
Because I feel at my best when
exercising
0
1
2
3
4
5
48
To make new friends
0
1
2
3
4
5
49
To measure myself against personal standards
0
1
2
3
4
5
Not true
for me
Very true
for me