Localization of the neurons active during paradoxical (REM) sleep and projecting to the locus...
14
Localization of the Neurons Active during Paradoxical (REM) Sleep and Projecting to the Locus Coeruleus Noradrenergic Neurons in the Rat LAURE VERRET, 1,2 PATRICE FORT, 1,2 DAMIEN GERVASONI, 1,2 LUCIENNE LE ´ GER, 1,2 AND PIERRE-HERVE ´ LUPPI 1,2 * 1 Centre National de la Recherche Scientifique, Unite ´ Mixte de Recherche 5167, Institut Fe ´de ´ratif des Neurosciences de Lyon (IFR19), Lyon F-69372, France 2 Faculte ´ de Me ´decine Laennec, Universite ´ Claude Bernard, Lyon I, F-69622 Villeurbanne, France ABSTRACT Locus coeruleus (LC) noradrenergic neurons are active during wakefulness, slow their discharge rate during slow wave sleep, and stop firing during paradoxical sleep (PS). A large body of data indicates that their inactivation during PS is due to a tonic GABAergic inhibi- tion. To localize the neurons responsible for such inhibition, we first examined the distribu- tion of retrogradely and Fos double-immunostained neurons following cholera toxin b subunit (CTb) injection in the LC of control rats, rats selectively deprived of PS for 3 days, and rats allowed to recover for 3 hours from such deprivation. We found a significant number of CTb/Fos double-labeled cells only in the recovery group. The largest number of CTb/Fos double-labeled cells was found in the dorsal paragigantocellular reticular nucleus (DPGi). It indeed contained 19% of the CTb/Fos double-labeled neurons, whereas the ventrolateral periaqueductal gray (vlPAG) contained 18.3% of these neurons, the lateral paragigantocel- lular reticular nucleus (LPGi) 15%, the lateral hypothalamic area 9%, the lateral PAG 6.7%, and the rostral PAG 6%. In addition, CTb/Fos double-labeled cells constituted 43% of all the singly CTb-labeled cells counted in the DPGi compared with 29% for the LPGi, 18% for the rostral PAG, and 10% or less for the other structures. Although all these populations of CTb/Fos double-labeled neurons could be GABAergic and tonically inhibit LC neurons during PS, our results indicate that neurons from the DPGi constitute the best candidate for this role. J. Comp. Neurol. 495:573–586, 2006. © 2006 Wiley-Liss, Inc. Indexing terms: REM sleep; Fos; retrograde tracer; cholera toxin B subunit; noradrenaline; GABA; arousal systems Noradrenergic neurons of the locus coeruleus (LC), with their cell bodies in the brainstem and widespread projec- tions within the central nervous system, are strategically positioned to exert a broad influence over higher physio- logical functions, including the regulation of the sleep– waking cycle (Jouvet, 1972; Aston-Jones et al., 1991). In- deed, it has long been known that the activity of LC noradrenergic neurons is closely related to behavioral states since they fire tonically during wakefulness (W), decrease their firing during slow wave sleep (SWS), and become virtually quiescent during paradoxical sleep (PS) (Aston-Jones and Bloom, 1981). According to the classical “reciprocal interaction” models (Hobson et al., 1975; Sa- kai, 1985), their cessation of firing would result from PS- specific inhibitory processes. Recent data indeed demon- strated that the inhibition of LC noradrenergic neurons during PS is mediated by a tonic GABAergic inhibition (Nitz and Siegel, 1997; Gervasoni et al., 1998). First, it has Grant sponsor: Centre National de la Recherche Scientifique (Unite ´ Mixte de Recherche 5167); Grant sponsor: Universite ´ C. Bernard Lyon I; Grant sponsor: French Ministe ` re de la Recherche and Lilly Institute (Ph.D. grant to L.V.). *Correspondence to: Pierre-Herve ´ Luppi, Physiopathologie des Re ´seaux Neuronaux du Cycle Veille-Sommeil, CNRS UMR 5167, Faculte ´ de me ´- decine RTH Laennec, 7 rue Guillaume Paradin, 69372, Lyon cedex 08, France. E-mail: [email protected] Received 5 April 2005; Revised 9 August 2005; Accepted 2 November 2005 DOI 10.1002/cne.20891 Published online in Wiley InterScience (www.interscience.wiley.com). THE JOURNAL OF COMPARATIVE NEUROLOGY 495:573–586 (2006) © 2006 WILEY-LISS, INC.
-
Upload
univ-lyon1 -
Category
Documents
-
view
3 -
download
0
Transcript of Localization of the neurons active during paradoxical (REM) sleep and projecting to the locus...
Localization of the Neurons Activeduring Paradoxical (REM) Sleep and
Projecting to the Locus CoeruleusNoradrenergic Neurons in the Rat
LAURE VERRET,1,2 PATRICE FORT,1,2 DAMIEN GERVASONI,1,2
LUCIENNE LEGER,1,2 AND PIERRE-HERVE LUPPI1,2*1Centre National de la Recherche Scientifique, Unite Mixte de Recherche 5167, Institut
Federatif des Neurosciences de Lyon (IFR19), Lyon F-69372, France2 Faculte de Medecine Laennec, Universite Claude Bernard, Lyon I, F-69622 Villeurbanne,
France
ABSTRACTLocus coeruleus (LC) noradrenergic neurons are active during wakefulness, slow their
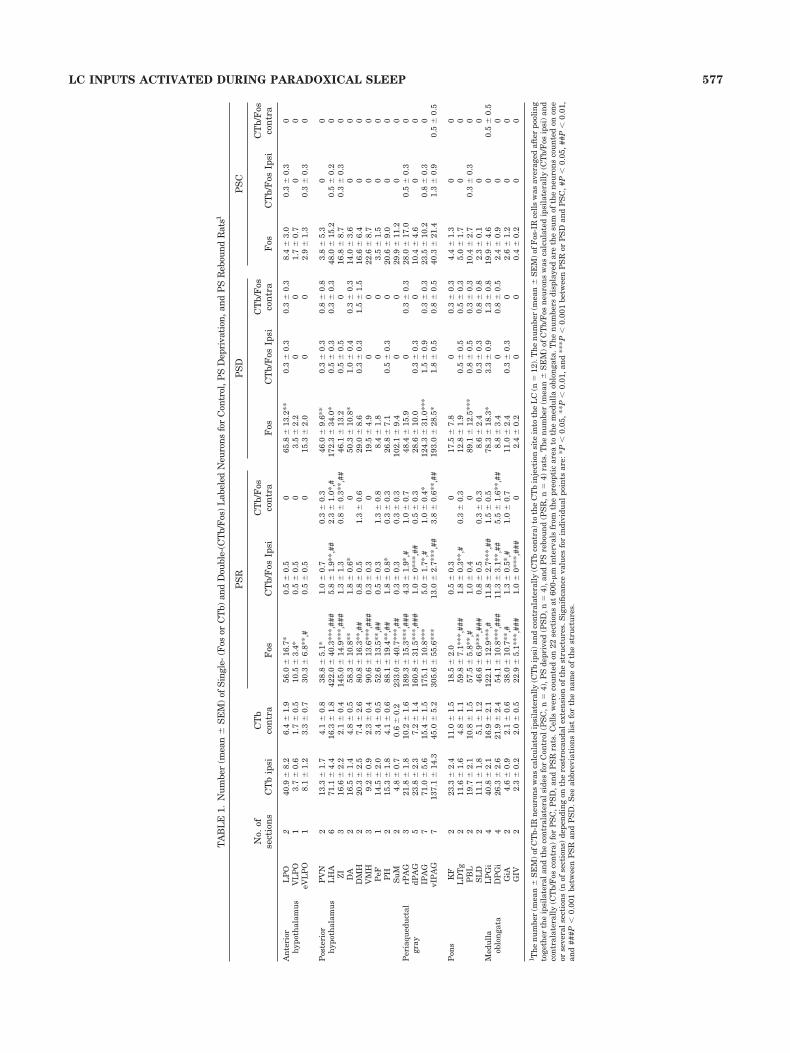
discharge rate during slow wave sleep, and stop firing during paradoxical sleep (PS). A largebody of data indicates that their inactivation during PS is due to a tonic GABAergic inhibi-tion. To localize the neurons responsible for such inhibition, we first examined the distribu-tion of retrogradely and Fos double-immunostained neurons following cholera toxin b subunit(CTb) injection in the LC of control rats, rats selectively deprived of PS for 3 days, and ratsallowed to recover for 3 hours from such deprivation. We found a significant number ofCTb/Fos double-labeled cells only in the recovery group. The largest number of CTb/Fosdouble-labeled cells was found in the dorsal paragigantocellular reticular nucleus (DPGi). Itindeed contained 19% of the CTb/Fos double-labeled neurons, whereas the ventrolateralperiaqueductal gray (vlPAG) contained 18.3% of these neurons, the lateral paragigantocel-lular reticular nucleus (LPGi) 15%, the lateral hypothalamic area 9%, the lateral PAG 6.7%,and the rostral PAG 6%. In addition, CTb/Fos double-labeled cells constituted 43% of all thesingly CTb-labeled cells counted in the DPGi compared with 29% for the LPGi, 18% for therostral PAG, and 10% or less for the other structures. Although all these populations ofCTb/Fos double-labeled neurons could be GABAergic and tonically inhibit LC neurons duringPS, our results indicate that neurons from the DPGi constitute the best candidate for thisrole. J. Comp. Neurol. 495:573–586, 2006. © 2006 Wiley-Liss, Inc.
Indexing terms: REM sleep; Fos; retrograde tracer; cholera toxin B subunit; noradrenaline;GABA; arousal systems
Noradrenergic neurons of the locus coeruleus (LC), withtheir cell bodies in the brainstem and widespread projec-tions within the central nervous system, are strategicallypositioned to exert a broad influence over higher physio-logical functions, including the regulation of the sleep–waking cycle (Jouvet, 1972; Aston-Jones et al., 1991). In-deed, it has long been known that the activity of LCnoradrenergic neurons is closely related to behavioralstates since they fire tonically during wakefulness (W),decrease their firing during slow wave sleep (SWS), andbecome virtually quiescent during paradoxical sleep (PS)(Aston-Jones and Bloom, 1981). According to the classical“reciprocal interaction” models (Hobson et al., 1975; Sa-kai, 1985), their cessation of firing would result from PS-specific inhibitory processes. Recent data indeed demon-strated that the inhibition of LC noradrenergic neurons
during PS is mediated by a tonic GABAergic inhibition(Nitz and Siegel, 1997; Gervasoni et al., 1998). First, it has
Grant sponsor: Centre National de la Recherche Scientifique (UniteMixte de Recherche 5167); Grant sponsor: Universite C. Bernard Lyon I;Grant sponsor: French Ministere de la Recherche and Lilly Institute (Ph.D.grant to L.V.).
*Correspondence to: Pierre-Herve Luppi, Physiopathologie des ReseauxNeuronaux du Cycle Veille-Sommeil, CNRS UMR 5167, Faculte de me-decine RTH Laennec, 7 rue Guillaume Paradin, 69372, Lyon cedex 08,France. E-mail: [email protected]
Received 5 April 2005; Revised 9 August 2005; Accepted 2 November2005
DOI 10.1002/cne.20891Published online in Wiley InterScience (www.interscience.wiley.com).
THE JOURNAL OF COMPARATIVE NEUROLOGY 495:573–586 (2006)
© 2006 WILEY-LISS, INC.
been shown using microdialysis that the release of GABAis increased during PS in the LC (Nitz and Siegel, 1997).Then, by extracellular single-unit recordings in head-restrained nonanesthetized rats, Gervasoni et al. (1998)showed that iontophoretic application of bicuculline, aspecific GABAA-receptor antagonist, during PS restores afiring activity in LC noradrenergic neurons similar to thatof waking. These data highly suggest that GABA is max-imally released within the LC from inputs activated spe-cifically during PS. Although the afferents to the LC arewell known (Luppi et al., 1995), those GABAergic andspecifically active during PS remain to be identified. As afirst step to fulfill this gap, the present work was designedto localize the neurons activated during PS and projectingto the LC by combining injection of cholera toxin b subunit(CTb) in the LC with the immunohistochemistry of theprotein Fos, in control rats, rats deprived of PS during 3days with the “flowerpot” (platform) method, and ratsallowed to recover for 3 hours from such deprivation. Thisstudy was prompted by our recent experiments using thesame sleep-deprivation protocol showing that severalbrainstem nuclei sending GABAergic projections to the LC(including the DPGi, LPGi, and vlPAG) contain a largenumber of Fos-positive cells specifically after PS recovery(Verret et al., 2005).
MATERIALS AND METHODSPreparation of the rats
CTb injections into the LC. Adult male Sprague-Dawley rats (280–320 g; IFFA Credo, France) were anes-thetized with chloral hydrate (1 g/kg, i.p.) and mounted ina stereotaxic frame (David Kopf Instruments, Tujunga,
CA). Following incision of the scalp, the skull was placedat a 12° angle (nose tilted down) to spare the transversesinus during electrode penetrations. A hole was drilled inthe skull overlying the LC and the dura was reflected. Aborosilicate glass micropipette (1 mm o.d., 3-5 !m externaltip diameter) was backfilled with a low salt CTb solution(0.5% in 0.1 M PB, pH 6; List Biological Laboratories,Campbell, CA) and connected to a P16 preamplifier (GrassInstruments, Quincy, MA). It was then slowly loweredinto the LC according to its stereotaxic coordinates (4 mmposterior to the lambda, 1.2 mm lateral to the midline, and6 mm below dural surface) by means of a hydraulic mi-cropositioner (David Kopf Instruments). Extracellularunit activities encountered were displayed with conven-tional electronics on a digital storage oscilloscope. In anes-thetized rats, LC neurons were easily identified by theirelectrophysiological characteristics (Aston-Jones et al.,1991), i.e., a broad action potential, a slow and regularspontaneous firing (around 1 Hz), and their response tonoxious stimuli (e.g., foot-pinch test). As soon as three LCneurons were positively identified over 300 !m depth inone electrode track, the tracer was iontophoreticallyejected (Rampon et al., 1999). For this purpose, the pipettewas connected by a silver wire immersed in the CTb so-lution to a current generator (CS4, Transkinetics, Canton,MA) that delivered pulsed positive current (7 seconds on/7seconds off) for 15 minutes (Luppi et al., 1995). At the endof the ejection, the pipette was left in place for at least 10minutes to avoid leakage of the tracer along the pipettetrack.
Polygraphic recordings of the sleep–waking cycle.The rats, while still under anesthesia, were rapidly im-planted with three cortical (stainless steel screws) and
Abbreviations
3V third ventricleac anterior commissureAmb ambiguus nucleusAq Sylvius aqueductChAT cholineacetyltransferasecp cerebral peduncleCTb cholera toxin b subunitDA dorsal hypothalamic areaDMH dorsomedial hypothalamic nucleusdPAG dorsal periaqueductal grayDPGi dorsal paragigantocellular nucleusDPMe deep mesencephalic nucleusDtg dorsal tegmental nucleusEEG electroencephalogramEMG electromyogrameVLPO extended ventrolateral preoptic areaf fornixGiA gigantocellular reticular nucleus, alpha partGiV gigantocellular reticular nucleus, ventral partIC inferior colliculusIO inferior olivary nucleusIR immunoreactiveKF Kolliker-Fuse nucleusLC locus coeruleusLDTg laterodorsal tegmental nucleusLHA lateral hypothalamic areaLL lateral lemniscuslPAG lateral periaqueductal grayLPGi lateral paragigantocellular nucleusLPO lateral preoptic areamlf medial longitudinal fasciculusMPO medial preoptic area
mt mammillo-thalamic tractMVe medial vestibular nucleusox optic chiasmaPAG periaqueductal grayPB phosphate bufferPBST triton saline PBPBL parabrachial lateral nucleusPeF perifornical nucleusPH posterior hypothalamic nucleusPn pontine nucleiPr prepositus nucleusPS paradoxical sleepPSC PS ControlPSD PS DeprivationPSR PS ReboundPVN paraventricular hypothalamic nucleuspy pyramidal tractrPAG rostral periaqueductal grayscp superior cerebellar peduncleSLD sublaterodorsal nucleusSol nucleus of the solitary tractsp5 spinal trigeminal tractSp5l spinal trigeminal nucleus, lateral partSpVe spinal vestibular nucleusSuM supramammillary nucleusSWS slow wave sleepvlPAG ventrolateral periaqueductal grayVMH ventromedial hypothalamic nucleusTM tuberomammillary nucleusVLPO ventrolateral preoptic nucleusW wakingZI zona incerta
574 L. VERRET ET AL.

three neck muscle (stainless wires) electrodes to recordEEG and EMG signals and monitor the sleep–wakingcycle. Since EEG characteristics vary on cortical sites, theelectrode placement was standardized across all rats. TheEEG screws were inserted into the dura through holes (0.5mm) made in the skull, located in the right frontal (1 mmlateral and anterior to bregma) and bilaterally in parietal(1 mm lateral to the midline at the midpoint betweenbregma and lambda, above hippocampus) cortices. Allelectrodes were soldered to a 6-pin connector secured tothe skull with dental acrylic cement (Superbond, SunMedical, Japan). Then the scalp was sutured and the ratswere allowed to recover from the surgical procedure. Theywere housed individually in Plexiglas jars (30 cm diame-ter, 40 cm high) with a bed of woodchips and placed in aninsulated soundproofed recording box maintained understandard laboratory conditions: 12/12-hour light-dark cy-cle with lights on at 6:00 AM, 22–24°C ambient tempera-ture, access to food pellets (Extra Labo, Lyon, France) andwater ad libitum.
Two days after completion of surgery, rats were placedin the recording box and connected by a cable to a rotatingcollector for 8 additional days of habituation to the exper-imental conditions. During this period continuous record-ings of the sleep–waking cycle were made. Both EEG andEMG signals were amplified, digitized, and collected on anApple computer via a CED-1401 Plus interface and theSpike-2 software (Cambridge Electronic Design, UK). Theday prior the beginning of the PS deprivation a 24-hourbaseline recording was made for each rat.
Experimental procedure for PS deprivationand recovery
PS deprivation was performed with the classical “flow-erpot” or platform method that has previously been shownto cause in rats a fairly selective deprivation of PS, with-out severe levels of stress (Mendelson et al., 1974; Ma-loney et al., 1999). While placed on a platform (6.5 cm indiameter) surrounded by water in the jar, the rat is pre-vented from engaging in PS by the risk of falling into thewater when the muscle tonus decreases at the entry intoPS. During the 72-hour PS deprivation, food and waterremained easily accessible to the rats. The rats were re-moved daily (1:00 PM) from the platform for a few minutes(30 minutes) to allow motor activity while the jars werecleaned.
The CTb-injected rats were segregated into three differ-ent experimental groups: 1) the control rats (PSC) thatremained for 75 hours in their jar until sacrifice (at 5:00PM); 2) the PS-deprived rats (PSD) that were placed on theplatform for 75 hours before sacrifice (at 4:30–5:00 PM);and 3) the PS-rebound rats (PSR) which experienced, atthe end of the 72-hour PS deprivation, a 3-hour period ofsleep recovery (start at 1:00 PM) in their recording jar witha dry bed of woodchips. Rats of this group usually fellasleep after a 30-minute period of environmental explora-tion and grooming. They were finally sacrificed (at 4:00–4:30 PM) 150 minutes after the first episode of PS, a delayrequired for the maximal production of Fos protein in-duced by PS hypersomnia (Dragunow and Faull, 1989;Herdegen and Leah, 1998).
Sleep scoring and analysisFor each rat the 24-hour baseline recording and that of
the 180 minutes before killing were analyzed offline. The
vigilance states were scored from 10-second epochs aswaking (W), slow wave sleep (SWS), or paradoxical sleep(PS) by visual examination of polygraphic signals and thehelp of a sliding window showing the EEG power spec-trum analyzed during the same 10-second epoch by fastFourier transform. During W, desynchronized (activated)low-amplitude EEG was accompanied by a sustainedEMG activity with phasic bursts; SWS was distinguishedby high-voltage slow waves (1.5–4.0 Hz) and spindles(10–14 Hz) and the disappearance of phasic muscle activ-ity in an animal immobile with closed eyes. A decrease inthe EEG amplitude associated with a flat EMG (i.e., mus-cle atonia) signaled the onset of PS, further characterizedby a regular and pronounced theta rhythm (4–9 Hz). Hyp-nograms were then drawn directly using a custom scriptin Spike-2. The values were finally exported from Spike-2to Microsoft Excel to calculate the standard parametersfor each vigilance state (quantities, percentage, number,and duration of bouts).
HistologyUnder profound anesthesia, rats of the three experi-
mental groups were perfused with Ringer’s lactate solu-tion containing 0.1% heparin, followed by 500 ml of afixative composed of 4% paraformaldehyde and 0.2% picricacid in 0.1 M PB, (pH 7.4). The brains were then stored at4°C for at least 2 days in 30% sucrose in 0.1 M PB. Theywere rapidly frozen with CO2 gas and 25-!m-thick coronalsections were cut on a cryostat. The free-floating sectionswere rinsed and stored until use in 0.1 M PB, containing0.9% NaCl, 0.3% Triton X-100 (PBST), and 0.1% sodiumazide (PBST-Az).
For CTb immunohistochemistry, free-floating sectionswere incubated in: 1) a goat antiserum to CTb (1:40,000 inPBST-Az; List Biological) over 3 days at 4°C; 2) a biotin-ylated rabbit antigoat IgG (1:2,000 in PBST; Vector Lab-oratories, Burlingame, CA) for 90 minutes at room tem-perature; and 3) an ABC-HRP solution (1:1,000 in PBST;Elite kit, Vector Laboratories) for 90 minutes at roomtemperature. Then the sections were immersed in a 0.05M Tris-HCl buffer (pH 7.6) containing 0.025% 3,3"-diaminobenzidine-4HCl (DAB; Sigma, France), 0.003%H2O2, and 0.6% nickel ammonium sulfate for 10 minutesat room temperature. The histochemical reaction wasstopped by extensive rinses in PBST-Az. These free-floating sections were then submitted to the Fos immuno-detection by sequential incubation in i) a rabbit antiserumto Fos (1:5,000 in PBST-Az; Oncogene, Cambridge, MA)over 3 days at 4°C; ii) a biotinylated goat antirabbit IgG(1:1,000 in PBST; Vector Laboratories) for 90 minutes atroom temperature; and iii) an ABC-HRP solution (1:1,000in PBST; Elite kit, Vector Laboratories) for 90 minutes atroom temperature. Finally, the sections were immersedfor 15 minutes at room temperature in DAB solution with-out nickel. As a result, the nuclei of Fos-immunoreactive(Fos-IR) cells were colored brown. Double-labeled cells(CTb/Fos) were easily identified by the presence of blackcytoplasmic granules of CTb and brown nuclear Fos stain-ing. The sections were finally mounted on gelatin-coatedslides, dried, dehydrated, and coverslipped with Depex.
Controls by omitting primary antibodies were routinelyrun to ensure the specificity of single or dual immuno-stainings in the material. In that regard, it should beemphasized that although the antirabbit IgG used in thesecond immunohistochemical procedure to label Fos
575LC INPUTS ACTIVATED DURING PARADOXICAL SLEEP
should have recognized the rabbit antigoat IgG used forCTb immunodetection in the first immunohistochemicalprocedure, this was never seen in our material, as con-vincingly demonstrated by the lack of a brown staining ofCTb granules (see Fig. 9E,F). The most likely explanationfor this is that the antirabbit IgG was not able to bind tothe rabbit antigoat IgG. One possibility is that the DAB-nickel deposit covered it or that it was destroyed or nolonger antigenic because the sections were incubated for 3days in PBST-Az containing the Fos antibody before theapplication of the antirabbit IgG.
All photomicrographs were taken using a digital DC-290 Kodak camera. The images were then adjusted forcontrast and brightness with PhotoShop 7.0 (Adobe Sys-tems, San Jose, CA).
Cell counts and analysisDrawings of double-immunostained sections were made
with a Zeiss microscope equipped with a motorized X/Ysensitive stage and a video camera connected to a comput-erized image analysis system (Mercator, ExploraNova,France). To provide quantitative data, four rats with CTbinjection centered to the LC were selected in each exper-imental group (PSC, PSD, and PSR). Since the purpose ofthis work was to localize, among the neurons sendingaxons to the LC, those that are activated during PS, onlythe areas containing CTb/Fos double-labeled cells in PSRcondition were considered. The analysis was performed onsections taken at 600-!m intervals from the preoptic areato the medulla oblongata (22 sections between AP –0.30and –12.90 from bregma) (Paxinos and Watson, 1997).Therefore, the number of sections counted for a givennucleus directly depended on its rostrocaudal extension.Sections were analyzed at the same level for all animals toensure that a correct representation of each structure,even the smallest ones, was obtained. The surface of eachstructure drawn was also calculated in all animals usingMercator tools to verify that it was similar across animals.The Fos-IR, CTb-IR, and CTb/Fos double-labeled neuronswere counted per structure automatically using Mercator.When a structure was present on more than one sectionthe neurons counted on all sections were summed. Foreach structure of interest the mean # SEM numbers ofFos-IR cells counted in the sides ipsilateral and contralat-eral to the CTb injection were then averaged (mean #SEM) and are reported in Table 1. The mean # SEM ofCTb-IR and CTb/Fos double-labeled cells were determinedipsilaterally and contralaterally for each structure.
Analysis of variance (ANOVA) tests were performed onthe different vigilance states across experimental condi-tions. A post-hoc PLSD Fisher test was used to identifysignificant pairwise differences. For each structure, a one-way ANOVA was performed with group (PSC, PSD, andPSR) as a factor in order to test the differences in thenumber of labeled neurons between the experimentalgroups. A post-hoc PLSD Fisher test was also used toidentify significant pairwise differences. All statisticswere performed using Statview 5.0.
RESULTSThe present results are based on three experimental
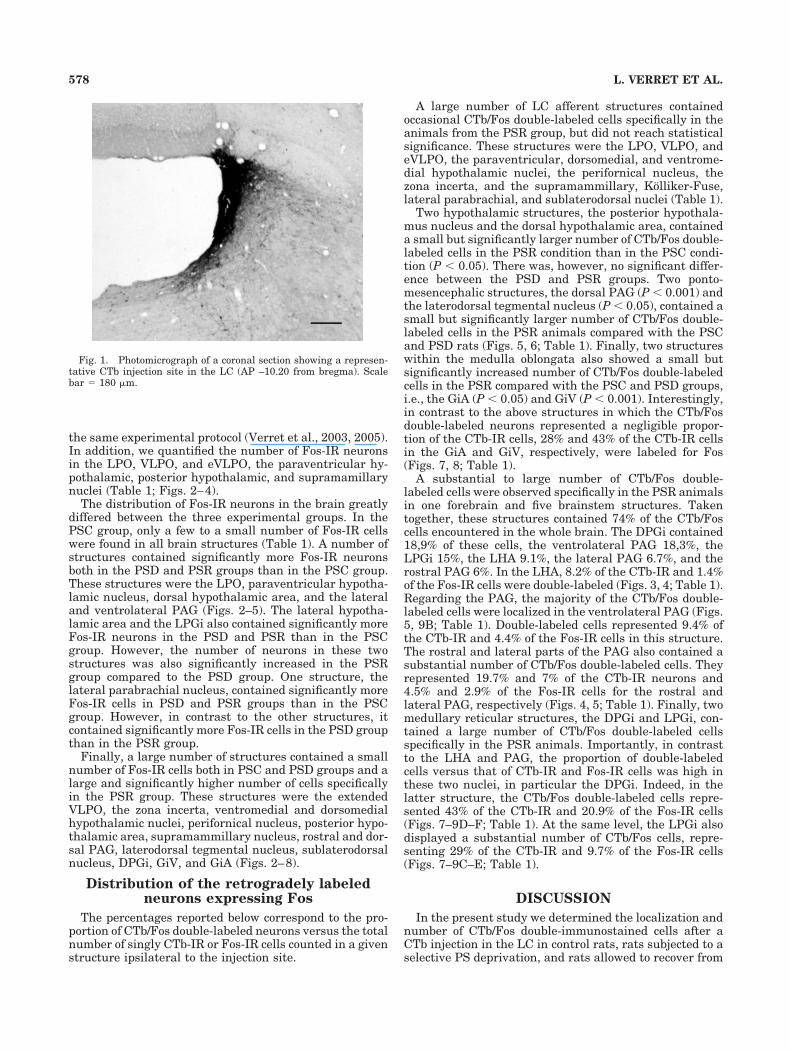
groups (PSC, PSD, and PSR) that each included four ratswith a CTb injection site in the LC, centered on the nu-cleus with only a slight spread of the tracer in the sur-
rounding pontine area, i.e., the peri-LC area (Fig. 1)(Luppi et al., 1995). Rats with injections that only en-croached the LC or were too large in size were not furtherconsidered for analysis of sleep and anatomical data.
Sleep recording dataIn all rats of the PSD and PSR groups, the platform
(“flowerpot”) method was effective in producing a completeelimination of PS for 72 hours. During the 150 minutespreceding sacrifice, the quantities of PS were significantlydifferent in the PSD, PSR, and PSC groups (P $ 0.05).Indeed, PS constituted 15% of this period in PSC rats, 50%in PSR rats, and 0% of PSD rats. The increase in PSquantities in PSR rats was due to a significant increase inthe duration of the PS bouts (PSC, 1.1 # 0.1 minutes; PSR,2.1 # 0.1 minutes) (P $ 0.0001). The number of PS boutsdid not vary significantly between the two groups (PSC,20.3 # 2.9; PSR, 25.0 # 5.1). Regarding SWS, quantitieswere similar in PSD and PSR groups (29% and 31%,respectively) but reduced compared to the PSC group(52%, P $ 0.05). Finally, PSD rats presented a largequantity of W (71%) compared to the PSC (33%) and PSR(20%) groups.
Localization of the retrogradelylabeled cells
No significant difference was observed between rats inthe distribution and number of retrogradely labeled (CTb-IR) neurons. Further, the distribution of CTb-IR cells wassimilar to that reported in our previous studies of LCafferents using CTb as a retrograde tracer (Luppi et al.,1995; Rampon et al., 1999). In addition to these studies,which were either semiquantitative or quantitative butlimited to a few brainstem structures, we counted thenumber of CTb-IR neurons in all the LC afferents contain-ing CTb/Fos double-labeled cells taking into account theirrostrocaudal extension by means of a regular sampling ofsections (every 600 !m) (Table 1). The largest number ofCTb-IR cells was counted in the vlPAG, indicating thatthis structure constitutes by far the strongest afferent tothe LC. The lateral hypothalamic area and the lateralPAG followed in terms of number of CTb-IR cells and aretherefore two other major inputs to the LC (Figs. 3, 4).Two structures, the lateral preoptic area (LPO) (Fig. 2;Table 1) and the LPGi, contained a large number ofCTb-IR cells and significantly contribute to the LC inner-vation. In addition, the rostral and dorsal PAG, theKolliker-Fuse, and the DPGi contained a substantial num-ber of CTb-IR cells (Figs. 4–8). A small number of cellswere observed in the paraventricular nucleus, zona in-certa, dorsal hypothalamic area, perifornical nucleus, pos-terior hypothalamic area (Figs. 3, 4), laterodorsal tegmen-tal nucleus, and sublaterodorsal nucleus. Finally, a fewCTb-IR cells were seen in the ventrolateral preoptic nu-cleus (VLPO) and the extended VLPO (eVLPO), the ven-tromedial hypothalamic nucleus, supramammillary nu-cleus, and the gigantocellular ventral (GiV) and alpha(GiA) reticular nuclei.
Distribution of the Fos-labeled neurons inthe PSC, PSD, and PSR groups
In the present study we confirmed the distribution ofFos-IR neurons described at the level of the brainstem andthe perifornical nucleus in our two previous studies using
576 L. VERRET ET AL.
TA
BL
E1.
Num
ber
(mea
n#
SEM
)ofS
ingl
e-(F
osor
CT
b)an
dD
oubl
e-(C
Tb/
Fos
)Lab
eled
Neu
rons
for
Con
trol
,PS
Dep
riva
tion
,and
PS
Reb
ound
Rat
s1
No.
ofse
ctio
nsC
Tb
ipsi
CT
bco
ntra
PSR
PSD
PSC
Fos
CT
b/F
osIp
siC
Tb/
Fos
cont
raF
osC
Tb/
Fos
Ipsi
CT
b/F
osco
ntra
Fos
CT
b/F
osIp
siC
Tb/
Fos
cont
ra
Ant
erio
rhy
poth
alam
usL
PO
240
.9#
8.2
6.4
#1.
956
.0#
16.7
*0.
5#
0.5
065
.8#
13.2
**0.
3#
0.3
0.3
#0.
38.
4#
3.0
0.3
#0.
30
VL
PO
13.
7#
0.6
1.7
#0.
510
.5#
3.4*
0.5
#0.
50
3.5
#2.
20
01.
7#
0.7
00
eVL
PO
18.
1#
1.2
3.3
#0.
730
.3#
6.8*
*,#
0.5
#0.
50
15.3
#2.
00
02.
9#
1.3
0.3
#0.
30
Pos
teri
orhy
poth
alam
usP
VN
213
.3#
1.7
4.1
#0.
838
.8#
5.1*
1.0
#0.
70.
3#
0.3
46.0
#9.
6**
0.3
#0.
30.
8#
0.8
3.8
#5.
30
0L
HA
671
.1#
4.4
16.3
#1.
842
2.0
#40
.3**
*,##
#5.
8#
1.9*
*,##
2.3
#1.
0*,#
172.
3#
34.0
*0.
5#
0.3
0.3
#0.
348
.0#
15.2
0.5
#0.
20
ZI3
16.6
#2.
22.
1#
0.4
145.
0#
14.9
***,
###
1.3
#1.
30.
8#
0.3*
*,##
46.1
#13
.20.
5#
0.5
016
.8#
8.7
0.3
#0.
30
DA
216
.5#
1.4
4.8
#0.
558
.3#
10.8
**1.
8#
0.6*
050
.3#
10.8
*1.
0#
0.4
0.3
#0.
314
.0#
3.6
00
DM
H2
20.3
#2.
57.
4#
2.6
80.8
#16
.3**
,##
0.8
#0.
51.
3#
0.6
29.0
#8.
60.
3#
0.3
1.5
#1.
516
.6#
6.4
00
VM
H3
9.2
#0.
92.
3#
0.4
90.6
#13
.6**
*,##
#0.
3#
0.3
019
.5#
4.9
00
22.6
#8.
70
0P
eF1
14.5
#2.
03.
4#
0.5
52.6
#13
.5**
,##
0.5
#0.
31.
3#
0.8
8.4
#1.
80
03.
5#
1.5
00
PH
215
.3#
1.8
4.1
#0.
688
.1#
19.4
**,#
#1.
8#
0.8*
0.3
#0.
326
.8#
7.1
0.5
#0.
30
20.6
#9.
00
0Su
M2
4.8
#0.
70.
6#
0.2
233.
0#
40.7
***,
##0.
3#
0.3
0.3
#0.
310
2.1
#9.
40
029
.9#
11.2
00
Per
iaqu
educ
tal
gray
rPA
G3
21.8
#1.
810
.2#
1.6
189.
3#
15.3
***,
###
4.3
#1.
9*,#
1.0
#0.
748
.4#
15.9
00.
3#
0.3
28.0
#17
.00.
5#
0.3
0dP
AG
523
.8#
2.3
7.2
#1.
416
0.8
#31
.5**
*,##
#1.
0#
0***
,##
0.5
#0.
328
.6#
10.0
0.3
#0.
30
10.4
#4.
60
0IP
AG
771
.0#
5.6
15.4
#1.
517
5.1
#10
.8**
*5.
0#
1.7*
,#1.
0#
0.4*
124.
3#
31.0
***
1.5
#0.
90.
3#
0.3
23.5
#10
.20.
8#
0.3
0vI
PA
G7
137.
1#
14.3
45.0
#5.
230
5.6
#55
.6**
*13
.0#
2.7*
**,#
#3.
8#
0.6*
*,##
193.
0#
28.5
*1.
8#
0.5
0.8
#0.
540
.3#
21.4
1.3
#0.
90.
5#
0.5
Pon
sK
F2
23.3
#2.
411
.0#
1.5
18.5
#2.
00.
5#
0.3
017
.5#
7.8
00.
3#
0.3
4.4
#1.
30
0L
DT
g2
11.6
#1.
64.
8#
1.1
59.8
#7.
1***
,###
1.8
#0.
3**,
#0.
3#
0.3
12.8
#1.
90.
5#
0.5
0.5
#0.
35.
0#
1.7
00
PB
L2
19.7
#2.
110
.8#
1.5
57.5
#5.
8**,
#1.
0#
0.4
089
.1#
12.5
***
0.8
#0.
50.
3#
0.3
10.4
#2.
70.
3#
0.3
0SL
D2
11.1
#1.
85.
1#
1.2
46.6
#6.
9***
,###
0.8
#0.
50.
3#
0.3
8.6
#2.
40.
3#
0.3
0.8
#0.
82.
3#
0.1
00
Med
ulla
oblo
ngat
aL
PG
i4
40.8
#2.
116
.9#
2.1
122.
1#
12.9
***,
#11
.8#
2.7*
**,#
#1.
5#
0.5
78.3
#18
.3*
3.3
#0.
91.
3#
0.8
19.9
#4.
60
0.5
#0.
5D
PG
i4
26.3
#2.
621
.9#
2.4
54.1
#10
.8**
*,##
#11
.3#
3.1*
*,##
5.5
#1.
6**,
##8.
8#
3.4
00.
8#
0.5
2.4
#0.
90
0G
iA2
4.6
#0.
92.
1#
0.6
38.0
#10
.7**
,#1.
3#
0.5*
,#1.
0#
0.7
11.0
#2.
40.
3#
0.3
02.
6#
1.2
00
GIV
22.
3#
0.2
2.0
#0.
522
.9#
5.1*
**,#
##1.
0#
0***
,###
02.
4#
0.2
00
0.4
#0.
20
0
1 The
num
ber
(mea
n#
SEM
)ofC
Tb-
IRne
uron
sw
asca
lcul
ated
ipsi
late
rally
(CT
bip
si)a
ndco
ntra
late
rally
(CT
bco
ntra
)to
the
CT
bin
ject
ion
site
into
the
LC
(n%
12).
The
num
ber
(mea
n#
SEM
)ofF
os-I
Rce
llsw
asav
erag
edaf
ter
pool
ing
toge
ther
the
ipsi
late
rala
ndth
eco
ntra
late
rals
ides
for
Con
trol
(PSC
,n%
4),P
Sde
priv
ed(P
SD,n
%4)
,and
PS
rebo
und
(PSR
,n%
4)ra
ts.T
henu
mbe
r(m
ean
#SE
M)o
fCT
b/F
osne
uron
sw
asca
lcul
ated
ipsi
late
rally
(CT
b/F
osip
si)a
ndco
ntra
late
rally
(CT
b/F
osco
ntra
)for
PSC
,PSD
,and
PSR
rats
.Cel
lsw
ere
coun
ted
on22
sect
ions
at60
0-!
min
terv
als
from
the
preo
ptic
area
toth
em
edul
laob
long
ata.
The
num
bers
disp
laye
dar
eth
esu
mof
the
neur
ons
coun
ted
onon
eor
seve
rals
ecti
ons
(nof
sect
ions
)dep
endi
ngon
the
rost
roca
udal
exte
nsio
nof
the
stru
ctur
es.S
igni
fican
ceva
lues
for
indi
vidu
alpo
ints
are:
*P$
0.05
,**P
$0.
01,a
nd**
*P$
0.00
1be
twee
nP
SRor
PSD
and
PSC
,#P
$0.
05,#
#P$
0.01
,an
d##
#P$
0.00
1be
twee
nP
SRan
dP
SD.S
eeab
brev
iati
ons
list
for
the
nam
eof
the
stru
ctur
es.
577LC INPUTS ACTIVATED DURING PARADOXICAL SLEEP
the same experimental protocol (Verret et al., 2003, 2005).In addition, we quantified the number of Fos-IR neuronsin the LPO, VLPO, and eVLPO, the paraventricular hy-pothalamic, posterior hypothalamic, and supramamillarynuclei (Table 1; Figs. 2–4).
The distribution of Fos-IR neurons in the brain greatlydiffered between the three experimental groups. In thePSC group, only a few to a small number of Fos-IR cellswere found in all brain structures (Table 1). A number ofstructures contained significantly more Fos-IR neuronsboth in the PSD and PSR groups than in the PSC group.These structures were the LPO, paraventricular hypotha-lamic nucleus, dorsal hypothalamic area, and the lateraland ventrolateral PAG (Figs. 2–5). The lateral hypotha-lamic area and the LPGi also contained significantly moreFos-IR neurons in the PSD and PSR than in the PSCgroup. However, the number of neurons in these twostructures was also significantly increased in the PSRgroup compared to the PSD group. One structure, thelateral parabrachial nucleus, contained significantly moreFos-IR cells in PSD and PSR groups than in the PSCgroup. However, in contrast to the other structures, itcontained significantly more Fos-IR cells in the PSD groupthan in the PSR group.
Finally, a large number of structures contained a smallnumber of Fos-IR cells both in PSC and PSD groups and alarge and significantly higher number of cells specificallyin the PSR group. These structures were the extendedVLPO, the zona incerta, ventromedial and dorsomedialhypothalamic nuclei, perifornical nucleus, posterior hypo-thalamic area, supramammillary nucleus, rostral and dor-sal PAG, laterodorsal tegmental nucleus, sublaterodorsalnucleus, DPGi, GiV, and GiA (Figs. 2–8).
Distribution of the retrogradely labeledneurons expressing Fos
The percentages reported below correspond to the pro-portion of CTb/Fos double-labeled neurons versus the totalnumber of singly CTb-IR or Fos-IR cells counted in a givenstructure ipsilateral to the injection site.
A large number of LC afferent structures containedoccasional CTb/Fos double-labeled cells specifically in theanimals from the PSR group, but did not reach statisticalsignificance. These structures were the LPO, VLPO, andeVLPO, the paraventricular, dorsomedial, and ventrome-dial hypothalamic nuclei, the perifornical nucleus, thezona incerta, and the supramammillary, Kolliker-Fuse,lateral parabrachial, and sublaterodorsal nuclei (Table 1).
Two hypothalamic structures, the posterior hypothala-mus nucleus and the dorsal hypothalamic area, containeda small but significantly larger number of CTb/Fos double-labeled cells in the PSR condition than in the PSC condi-tion (P $ 0.05). There was, however, no significant differ-ence between the PSD and PSR groups. Two ponto-mesencephalic structures, the dorsal PAG (P $ 0.001) andthe laterodorsal tegmental nucleus (P $ 0.05), contained asmall but significantly larger number of CTb/Fos double-labeled cells in the PSR animals compared with the PSCand PSD rats (Figs. 5, 6; Table 1). Finally, two structureswithin the medulla oblongata also showed a small butsignificantly increased number of CTb/Fos double-labeledcells in the PSR compared with the PSC and PSD groups,i.e., the GiA (P $ 0.05) and GiV (P $ 0.001). Interestingly,in contrast to the above structures in which the CTb/Fosdouble-labeled neurons represented a negligible propor-tion of the CTb-IR cells, 28% and 43% of the CTb-IR cellsin the GiA and GiV, respectively, were labeled for Fos(Figs. 7, 8; Table 1).
A substantial to large number of CTb/Fos double-labeled cells were observed specifically in the PSR animalsin one forebrain and five brainstem structures. Takentogether, these structures contained 74% of the CTb/Foscells encountered in the whole brain. The DPGi contained18,9% of these cells, the ventrolateral PAG 18,3%, theLPGi 15%, the LHA 9.1%, the lateral PAG 6.7%, and therostral PAG 6%. In the LHA, 8.2% of the CTb-IR and 1.4%of the Fos-IR cells were double-labeled (Figs. 3, 4; Table 1).Regarding the PAG, the majority of the CTb/Fos double-labeled cells were localized in the ventrolateral PAG (Figs.5, 9B; Table 1). Double-labeled cells represented 9.4% ofthe CTb-IR and 4.4% of the Fos-IR cells in this structure.The rostral and lateral parts of the PAG also contained asubstantial number of CTb/Fos double-labeled cells. Theyrepresented 19.7% and 7% of the CTb-IR neurons and4.5% and 2.9% of the Fos-IR cells for the rostral andlateral PAG, respectively (Figs. 4, 5; Table 1). Finally, twomedullary reticular structures, the DPGi and LPGi, con-tained a large number of CTb/Fos double-labeled cellsspecifically in the PSR animals. Importantly, in contrastto the LHA and PAG, the proportion of double-labeledcells versus that of CTb-IR and Fos-IR cells was high inthese two nuclei, in particular the DPGi. Indeed, in thelatter structure, the CTb/Fos double-labeled cells repre-sented 43% of the CTb-IR and 20.9% of the Fos-IR cells(Figs. 7–9D–F; Table 1). At the same level, the LPGi alsodisplayed a substantial number of CTb/Fos cells, repre-senting 29% of the CTb-IR and 9.7% of the Fos-IR cells(Figs. 7–9C–E; Table 1).
DISCUSSIONIn the present study we determined the localization and
number of CTb/Fos double-immunostained cells after aCTb injection in the LC in control rats, rats subjected to aselective PS deprivation, and rats allowed to recover from
Fig. 1. Photomicrograph of a coronal section showing a represen-tative CTb injection site in the LC (AP –10.20 from bregma). Scalebar % 180 !m.
578 L. VERRET ET AL.

such a deprivation. We observed a significant number ofdouble-labeled cells only in the recovery group. In thisgroup, they were restricted to one hypothalamic and fivebrainstem afferent structures. The brainstem structures,namely, the ventrolateral, lateral and rostral PAG, DPGi,and LPGi, contained a large number of double-labeledcells, whereas the hypothalamic structure, the LHA, con-tained a substantial number of such cells. Of importance,the percentage of CTb/Fos double-labeled cells versus thatof CTb-IR cells was 10% or less for the LHA and PAG and43% and 29% for the DPGi and LPGi, respectively. Theseresults suggest that a substantial portion of the pathwaysfrom the DPGi and LPGi to the LC is activated during PS,while only a marginal portion of those from the LHA andPAG are. In the following we discuss the methodologicalissues of our approach and then the results obtained withregard to previous literature and their functional signifi-cance.
Methodological considerationsIn the present study we used Fos as a marker of neuro-
nal activity (Morgan and Curran, 1986; Dragunow andFaull, 1989). We have discussed in detail our experimen-tal paradigm in two recent publications (Verret et al.,2003, 2005). In the present work, we further combined Foslabeling with retrograde tracing using CTb. Such a com-bination has previously been used successfully to identifyactivated pathways in response to selective PS (Morales etal., 1999; Lu et al., 2002) or total sleep increases (Sherin etal., 1996) induced pharmacologically or by gentle handlingtotal sleep deprivation. In the present study, to visualizethe neurons specifically active during PS, we comparedthe distribution of neurons labeled for Fos in control ani-mals, animals selectively deprived of PS for 72 hours (75hours, 3 days) with the platform method and animalsallowed to recover their debt of PS for 3 hours after sucha deprivation. We chose this method since no or only a fewFos-IR neurons were visible in control animals, in thebrainstem structures known to contain neurons responsi-ble for PS onset and maintenance. This indicates that the15% PS displayed by these animals were not sufficient toinduce Fos expression in these structures. Our protocol isbased on the postulate that, on the contrary, neuronsactive during PS in animals perfused after 150 minutes ofa recovery period during which PS represent 50% of thetime will be immunoreactive to Fos. Supporting the accu-racy of this postulate, we confirm here our recent resultsshowing that structures known to contain PS-active neu-rons such as the sublaterodorsal nucleus, laterodorsal teg-mental nucleus, GiA, and GiV display a large number ofFos-IR neurons specifically after PS recovery (Verret etal., 2005). We also corroborate our results showing thatthe zona incerta, dorsomedial and ventromedial hypotha-lamic nuclei, perifornical nucleus, dorsal PAG, LPGi, andDPGi contained a large number of Fos-IR cells specifically
Figs. 2–8. Schematic distribution of the Fos-IR cells contralateral(left-hand side of the sections, black dots) and the CTb-IR and CTb/Fos double-labeled neurons ipsilateral to the CTb injection site in theLC (right-hand side of the sections, open circle and black stars, re-spectively) at seven brain levels in representative animals for Control(top), PS Deprivation (middle), and PS Recovery (bottom) conditions.Fig. 2. Sections at the preoptic level (AP –0.3 from bregma).
579LC INPUTS ACTIVATED DURING PARADOXICAL SLEEP

after PS recovery, suggesting that these nuclei containnumerous neurons active during PS. We further confirmthat the LHA and LPGi contain an increased number ofFos-IR cells following PS deprivation compared to control
and a further significant increase after PS recovery. Wefinally confirm that the dorsal area of the hypothalamus,lateral parabrachial nucleus, lateral PAG, and ventrolat-eral PAG contain a large number of Fos-IR cells both afterPS deprivation and PS recovery. In the present study wefurther report a specific and strong increase in the numberof Fos-IR cells after PS rebound in the posterior hypotha-lamic and supramammillary nuclei. A number of studiesshowed that these two structures might act as relays inthe ascending theta-synchronizing system (Robinson andWhishaw, 1974; Kirk and McNaughton, 1991; Vertes,1992; Kirk, 1998). Since theta activity is very pronouncedduring PS, it is therefore possible that Fos-IR neurons inthese nuclei during PS rebound play a role in the thetaactivity of PS.
In previous studies we also found that neurons activeduring W, such as the LC noradrenergic neurons (Verretet al., 2005) and the hypocretin-containing neurons (Ver-ret et al., 2003), were not immunoreactive to Fos after 72hours (long-lasting) deprivation, despite the fact that theanimals were awake 71% of the time during this period.We further demonstrated here that nearly no neuronsprojecting to the LC were Fos-IR after PS deprivation.These results indicate that neither excitatory nor inhibi-tory afferents to the LC are tonically activated during PSdeprivation. These results fit well with the absence ofFos-labeling of LC neurons in that condition. They suggestthat the activity of LC neurons and that of their excitatoryinputs is not sustained enough during PS deprivation toinduce Fos in these neurons. This might also be due to thefact that although W predominates during PS deprivation,it mainly consists of quiet W regularly interrupted byperiods of SWS. Indeed, noradrenergic neurons from theLC have pacemaker properties and are known to dis-charge at a low rate during quiet W and a decrease of Fossynthesis is likely to occur in all brain structures duringSWS periods except the VLPO (Sherin et al., 1996). Inaddition, it is likely that the well-known decrease in Fosexpression occurring during conditions of chronic stress(Chen and Herbert, 1995) contributes to the absence ofFos-labeling of wake-active neurons
In the present work we used CTb as a retrograde tracerin order to reveal the afferents of the LC. The distributionand number of retrogradely labeled cells is similar to thatreported in our previous publications using the same pro-tocol (Luppi et al., 1995; Rampon et al., 1999). Since theprojections revealed were for the majority confirmed byanterograde tracing (Luppi et al., 1995), we will thereforenot discuss the specificity of the projections revealed here.Nevertheless, it is worth mentioning that the presentquantitative analysis, compared to the semiquantitativeanalysis used previously, allows a more accurate evalua-tion of the respective weight of each LC afferent. Thisreveals that the largest LC afferent is the vlPAG, followedby the LHA and the lPAG. Two structures, the LPGi andLPO, followed in terms of number of CTb-IR cells. Thenthe dorsomedial hypothalamic nucleus, rostral and dorsalPAG, lateral parabrachial nucleus, Kolliker-Fuse nucleus,and DPGi contained a substantial number of CTb-IR cells.In our previous semiquantitative study, all these struc-tures were ranked together as large afferents (Luppi et al.,1995).
Besides, we recently showed that LC noradrenergic neu-rons are not immunoreactive to Fos after PS recovery(Verret et al., 2005). This indicates that the LC noradren-
Fig. 3. Sections at intermediate hypothalamic level (AP –3.30from bregma).
580 L. VERRET ET AL.

Fig. 4. Sections at the posterior hypothalamic level (AP –3.90 frombregma).
Fig. 5. Sections at the periaqueductal gray level (AP –7.50 frombregma).

ergic neurons are not active during PS and supports pre-vious electrophysiological data showing that they are ton-ically inhibited by GABA during this state (Nitz andSiegel, 1997; Gervasoni et al., 1998). In contrast, here weshowed that a substantial number of neurons in threebrainstem and one hypothalamic structures projecting tothe LC are immunoreactive to Fos after PS recovery. It istherefore likely that these populations of neurons are ac-tive during PS. They can be GABAergic and responsiblefor the tonic inhibition of LC neurons during PS. They can
Fig. 6. Sections at the pontine level (AP –9.30 from bregma).
Fig. 7. Sections at the rostral medulla oblongata level (AP –11.70from bregma).
582 L. VERRET ET AL.

also use other inhibitory neurotransmitters or even exci-tatory neurotransmitters such as glutamate. It is indeedpossible that LC neurons, as previously described for thelumbar motoneurons, receive a barrage of excitatory to-gether with inhibitory inputs during PS (Soja et al., 1995).However, even if we did not provide in the present study
an unambiguous demonstration by means of a triple la-beling, previous results together with our present resultsare sufficient to strongly suggest that among the popula-tions of neurons expressing Fos and projecting to the LCafter PS recovery, one or several are GABAergic and re-sponsible for the inhibition of the noradrenergic neuronsduring PS.
Functional role of the different populationsof neurons immunoreactive to Fos after PS
recovery and projecting to the LCA number of arguments indicate that the DPGi is the
best candidate for the inhibition of LC neurons during PS.First, this structure contained the largest number of CTb/Fos double-labeled cells in the PS recovery animals, ac-counting for 19% of all the CTb/Fos double-labeled neu-rons. In addition, the DPGi was the structure with thehighest percentage of CTb/Fos double-labeled neuronsversus that of singly CTb-IR cells (43%). Further, theDPGi contained a large number of GAD-immunoreactivecells projecting to the LC (Peyron et al., 1995; Luppi et al.,1999), while the inhibition of LC neurons by electricalstimulation of the DPGi is abolished by the application ofbicuculline, a GABAA-receptor antagonist (Ennis andAston-Jones, 1989). Moreover, it has been shown thatelectrical stimulation of the DPGi increases PS and thatthis effect is reversed by the administration of picrotoxin aGABAA-receptor antagonist in the LC (Kaur et al., 2001).Together, these and our data highly suggest that nearlyhalf of the pathway from the DPGi to the LC is composedof GABAergic neurons inhibiting LC noradrenergic neu-rons during PS.
We also observed that the LPGi contains 15% of all theCTb/Fos double-labeled cells counted in the PS recovery an-imals. These cells constitute 29% of all the CTb-IR cellsfound in this nucleus. This result is quite puzzling, since anumber of studies indicate that the pathway from the LPGito the LC is mainly excitatory and responsible for the burstof activity of LC neurons induced by sensory stimulation.Indeed, electrical stimulation of the LPGi induces an excita-tion of a large majority of LC neurons (73%), while only aminority (16%) exhibit a purely inhibitory response (Ennisand Aston-Jones, 1988). The LPGi excitatory influence ismediated by glutamate, as it is blocked by glutamatergicantagonists (Ennis and Aston-Jones, 1988). The pharmaco-logical blockade of glutamate inputs unmasks an underlyinginhibitory response in part mediated by adrenaline (Aston-Jones et al., 1992). Further, microinjection of lidocaine intothe LPGi or blockade of glutamate inputs by kynurenateapplication in the LC reversibly attenuates the foot-shock-evoked activation of LC cells (Ennis and Aston-Jones, 1988;Chiang and Aston-Jones, 1993). Nevertheless, anatomicalstudies showed that in addition to glutamatergic and adren-ergic projections, the LPGi sends glycine (Rampon et al.,1999), GABA (Pieribone et al., 1990; Peyron et al., 1995), andenkephalin (Drolet et al., 1992) inputs to the LC. Theseneurotransmitters induce an inhibition when applied on LCnoradrenergic cells (Bird and Kuhar, 1977; Ennis and Aston-Jones, 1989; Darracq et al., 1997). Together, these resultsindicate that, although the glutamatergic portion of thepathway from the LPGi to the LC might be the most preem-inent component, the pathway is very heterogeneous in na-ture and might also provide adrenergic, GABAergic, glycin-ergic, and/or enkephalinergic inhibition to the LC neurons.
Fig. 8. Sections at the midlevel of the medulla oblongata level (AP–12.30 from bregma). See the abbreviations list for the name of thestructures.
583LC INPUTS ACTIVATED DURING PARADOXICAL SLEEP

To determine whether the CTb/Fos double-labeled neuronsobserved in the present study contain one of these neuro-transmitters, additional studies are now necessary.
The ventrolateral PAG contained 18% of all the CTb/Fos-labeled neurons found in the PSR group. Two othersubdivisions of the PAG, the lateral and rostral PAG, each
Fig. 9. A: Photomicrograph showing the VLPO on a section double-immunostained with Fos (brown nuclear staining) and CTb (black cyto-plasmic granular staining) in a PSR rat. Note the absence of double-labeled cells. B: Photomicrograph showing the vlPAG on a sectiondouble-immunostained with Fos (brown nuclear staining) and CTb(black cytoplasmic granular staining) in a PSR rat. Note the presence ofFos-IR, CTb-IR, and CTb/Fos double-labeled cells (arrow). C: Photomi-crograph showing the LPGi on a section double-immunostained with Fos(brown nuclear staining) and CTb (black cytoplasmic granular staining)
in a PSR rat. Note the presence of Fos-IR, CTb-IR, and CTb/Fos double-labeled cells (arrow). D: Photomicrographs showing the DPGi on a sec-tion double-immunostained with Fos (brown nuclear staining) and CTb(black cytoplasmic granular staining) in a PSR rat. Note the presence ofFos-IR, CTb-IR, and CTb/Fos double-labeled cells (arrow) in this nucleusipsi- (right-hand side of the section) and contralaterally (left-hand side ofthe section) to the CTb injection in the LC. E: Enlargement of C. F: En-largement of D. Scale bars % 250 !m in A; 60 !m in B; 100 !m in C,D;15 !m in E; 25 !m in F.
584 L. VERRET ET AL.
contained an additional 6% of all the CTb/Fos double-labeled cells. However, except for the rostral PAG, inwhich 20% of the CTb-IR cells were Fos-positive, less than10% of the CTb-IR cells in the PAG were immunoreactiveto Fos. These results suggest that the pathway from thePAG to the LC is composed in its vast majority of neuronsnot active during PS. However, this does not rule out thepossibility that the small number of CTb/Fos double-labeled neurons from the PAG are GABAergic in natureand thus participate in the inactivation of LC noradren-ergic neurons during PS. Indeed, combining GAD immu-nostaining and CTb retrograde labeling from the LC, weshowed that part of the neurons retrogradely labeled fromthe lateral and ventrolateral PAG were immunoreactiveto GAD (Peyron et al., 1995; Luppi et al., 1999). Further,Maloney et al. (1999) showed with a PS deprivation pro-tocol close to ours that the PAG contained significantlymore Fos-IR cells in the PSR group compared to the PSCand PSD groups and that a significant number of thesecells were immunoreactive to GAD. However, the CTb/Fosdouble-labeled neurons in the vlPAG could also be glycin-ergic (Rampon et al., 1999) or glutamatergic (Clements etal., 1987; Barbaresi et al., 1997). Thus, additional studiesare necessary to determine the neurochemical identity ofthe neurons from the PAG active during PS and projectingto the LC.
The lateral hypothalamic area contained 9% of the CTb/Fos double-labeled cells found in PSR animals. They rep-resented 8% of all the CTb-IR neurons distributed in thisstructure. These results indicate that a nonnegligible, al-though small portion of the neurons from the LHA pro-jecting to the LC are active during PS. This finding is quitesurprising, since it is well accepted that the neuronalnetwork responsible for PS is restricted to the brainstem,including therefore the neurons responsible for the inhi-bition of LC noradrenergic neurons. Nevertheless, inagreement with the present findings, we recently de-scribed that the LHA contains a large number of Fos-IRneurons specifically during PS recovery (Verret et al.,2003), indicating that this structure might play an unsus-pected and important role in PS regulation. Further, wedemonstrated that 60% of the Fos-IR cells found after PSrecovery in the LHA were immunoreactive to melanin-concentrating hormone (MCH) (Verret et al., 2003). It hasalso been observed that MCH neurons co-contain GABA(Dallvechia-Adams et al., 2002). In addition, MCH inducesa strong PS hypersomnia when injected into the lateralventricle of rats (Verret et al., 2003). Finally, MCH-immunoreactive fibers and MCH receptor mRNA arepresent in rat LC (Saito et al., 2001) and MCH is rather aninhibitory peptide (Gao and van den Pol, 2001). From allthese results, it can therefore be hypothesized that aninhibitory projection from the MCH neurons to the norad-renergic LC neurons could enhance PS, although it isunlikely that the MCH neurons are responsible for thetonic inhibition of LC neurons during PS given that alter-nance of PS and wakefulness still occurs in cats in whichthe forebrain is removed (Jouvet, 1962). In addition, thelargest portion of the pathway from the LHA to the LCmight rather be excitatory than inhibitory. Indeed, astrong projection to the LC from hypocretin-containingneurons localized in the LHA has been demonstrated(Peyron et al., 1998) and application of hypocretin on LCnoradrenergic neurons strongly excites them (Horvath etal., 1999). In addition, it has been shown that hypocretin-
containing neurons are active during W and inactive dur-ing PS (Estabrooke et al., 2001; Verret et al., 2003). Todetermine the role of the CTb/Fos-labeled neurons foundin the present study, it is first necessary to determinewhether they indeed contain MCH and/or GABA.
In agreement with a recent study (Lu et al., 2002), weobserved significantly more Fos-IR cells in the extendedVLPO in PSR than in the PSD and PSC groups. We alsofound approximately twice more CTb-IR neurons in theextended VLPO compared to the VLPO. However, in con-trast to this study, we did not find a significant number ofCTb/Fos double-labeled neurons in these two structures inany of our groups. Such a discrepancy could be due todifferent protocols used to induce an increase in PS quan-tities. Indeed, Lu et al. (2002) used dark-treatment thatonly induced a modest increase in PS quantities comparedto our protocol with the platform (an average of 18% of PSduring the 3 hours prior to sacrifice versus 50% in ourstudy).
Finally, we also did not find a significant number ofCTb/Fos double-labeled neurons in the sublaterodorsaland laterodorsal tegmental nuclei in PSR animals. Thesestructures contain PS-executive neurons that, accordingto the classical “reciprocal interaction” models (McCarleyand Hobson, 1975; Sakai, 1985), would be responsible forthe inactivation of LC noradrenergic neurons during PSvia a direct monosynaptic projection. Our results indicatethat this is unlikely to be the case.
Besides, it has been shown with a protocol similar toours that PS recovery resulted in an increase in the num-ber of Fos-expressing GABAergic neurons in the vicinity ofthe LC noradrenergic cells (Maloney et al., 1999). It hasbeen thus proposed that these neurons might be respon-sible for the tonic inhibition of LC neurons during PS.Although we cannot completely rule out such a possibilitybecause these neurons can be inside or very close to ourinjection sites, it seems unlikely because the LC containsonly a few interneurons and we did not observe CTb/Fos-labeled cells in close proximity to the LC.
In conclusion, our results indicate that the neuronsactive during PS and projecting to the LC are mainlylocalized in the DPGi and to a minor extent in the LPGiand the ventrolateral PAG. These results and previousones showing that the DPGi provides to the LC noradren-ergic neurons a powerful GABAergic input strongly sug-gest that it contains the GABAergic neurons responsiblefor the tonic inhibition of LC noradrenergic neurons dur-ing PS.
LITERATURE CITEDAston-Jones G, Bloom FE. 1981. Activity of norepinephrine-containing
locus coeruleus neurons in behaving rats anticipates fluctuations in thesleep-waking cycle. J Neurosci 1:876–886.
Aston-Jones G, Chiang C, Alexinsky T. 1991. Discharge of noradrenergiclocus coeruleus neurons in behaving rats and monkeys suggests a rolein vigilance. Prog Brain Res 88:501–520.
Aston-Jones G, Astier B, Ennis M. 1992. Inhibition of noradrenergic locuscoeruleus neurons by C1 adrenergic cells in the rostral ventral me-dulla. Neuroscience 48:371–381.
Barbaresi P, Gazzanelli G, Malatesta M. 1997. Glutamate-positive neuronsand terminals in the cat periaqueductal gray matter (PAG): a light andelectron microscopic immunocytochemical study. J Comp Neurol 383:381–396.
Bird SJ, Kuhar MJ. 1977. Iontophoretic application of opiates to the locuscoeruleus. Brain Res 122:523–533.
Chen X, Herbert J. 1995. Regional changes in c-fos expression in the basal
585LC INPUTS ACTIVATED DURING PARADOXICAL SLEEP
forebrain and brainstem during adaptation to repeated stress: correla-tions with cardiovascular, hypothermic and endocrine responses. Neu-roscience 64:675–685.
Chiang C, Aston-Jones G. 1993. Response of locus coeruleus neurons tofootshock stimulation is mediated by neurons in the rostral ventralmedulla. Neuroscience 53:705–715.
Clements JR, Madl JE, Johnson RL, Larson AA, Beitz AJ. 1987. Localiza-tion of glutamate, glutaminase, aspartate and aspartate aminotrans-ferase in the rat midbrain periaqueductal gray. Exp Brain Res 67:594–602.
Dallvechia-Adams S, Kuhar MJ, Smith Y. 2002. Cocaine- andamphetamine-regulated transcript peptide projections in the ventralmidbrain: colocalization with gamma-aminobutyric acid, melanin-concentrating hormone, dynorphin, and synaptic interactions with do-pamine neurons. J Comp Neurol 448:360–372.
Dragunow M, Faull R. 1989. The use of c-fos as a metabolic marker inneuronal pathway tracing. J Neurosci Methods 29:261–265.
Drolet G, Van Bockstaele EJ, Aston-Jones G. 1992. Robust enkephalininnervation of the locus coeruleus from the rostral medulla. J Neurosci12:3162–3174.
Ennis M, Aston-Jones G. 1988. Activation of locus coeruleus from nucleusparagigantocellularis: a new excitatory amino acid pathway in brain.J Neurosci 8:3644–3657.
Ennis M, Aston-Jones G. 1989. GABA-mediated inhibition of locus coer-uleus from the dorsomedial rostral medulla. J Neurosci 9:2973–2981.
Estabrooke IV, McCarthy MT, Ko E, Chou TC, Chemelli RM, YanagisawaM, Saper CB, Scammell TE. 2001. Fos expression in orexin neuronsvaries with behavioral state. J Neurosci 21:1656–1662.
Gao XB, van den Pol AN. 2001. Melanin concentrating hormone depressessynaptic activity of glutamate and GABA neurons from rat lateralhypothalamus. J Physiol 533:237–252.
Gervasoni D, Darracq L, Fort P, Souliere F, Chouvet G, Luppi PH. 1998.Electrophysiological evidence that noradrenergic neurons of the ratlocus coeruleus are tonically inhibited by GABA during sleep. EurJ Neurosci 10:964–970.
Herdegen T, Leah JD. 1998. Inducible and constitutive transcription fac-tors in the mammalian nervous system: control of gene expression byJun, Fos and Krox, and CREB/ATF proteins. Brain Res Brain Res Rev28:370–490.
Hobson JA, McCarley RW, Wyzinski PW. 1975. Sleep cycle oscillation:reciprocal discharge by two brainstem neuronal groups. Science 189:55–58.
Horvath TL, Peyron C, Diano S, Ivanov A, Aston-Jones G, Kilduff TS, vanDen Pol AN. 1999. Hypocretin (orexin) activation and synaptic inner-vation of the locus coeruleus noradrenergic system. J Comp Neurol415:145–159.
Jouvet M. 1962. Recherches sur les structures nerveuses et les mecanismesresponsables des differentes phases du sommeil physiologique. ArchItal Biol 100:125–206.
Jouvet M. 1972. The role of monoamines and acetylcholine-containingneurons in the regulation of the sleep-waking cycle. Ergeb Physiol64:166–307.
Kaur S, Saxena RN, Mallick BN. 2001. GABAergic neurons in prepositushypoglossi regulate REM sleep by its action on locus coeruleus in freelymoving rats. Synapse 42:141–150.
Kirk IJ. 1998. Frequency modulation of hippocampal theta by the supra-mammillary nucleus, and other hypothalamo-hippocampal interac-tions: mechanisms and functional implications. Neurosci Biobehav Rev22:291–302.
Kirk IJ, McNaughton N. 1991. Supramammillary cell firing and hippocam-pal rhythmical slow activity. Neuroreport 2:723–725.
Lu J, Bjorkum AA, Xu M, Gaus SE, Shiromani PJ, Saper CB. 2002.Selective activation of the extended ventrolateral preoptic nucleus dur-ing rapid eye movement sleep. J Neurosci 22:4568–4576.
Luppi PH, Aston-Jones G, Akaoka H, Chouvet G, Jouvet M. 1995. Afferentprojections to the rat locus coeruleus demonstrated by retrograde and
anterograde tracing with cholera-toxin B subunit and Phaseolus vul-garis leucoagglutinin. Neuroscience 65:119–160.
Luppi PH, Peyron C, Rampon C, Gervasoni D, Barbagli B, Boissard R, FortP. 1999. Inhibitory mechanisms in the dorsal raphe nucleus and locuscoeruleus during sleep. In: Lydic R, Baghdoyan HA, editors. Handbookof behavioral state control. Boca Raton, FL: CRC Press. p 195–211.
Maloney KJ, Mainville L, Jones BE. 1999. Differential c-Fos expression incholinergic, monoaminergic, and GABAergic cell groups of the pon-tomesencephalic tegmentum after paradoxical sleep deprivation andrecovery. J Neurosci 19:3057–3072.
McCarley RW, Hobson JA. 1975. Neuronal excitability modulation over thesleep cycle: a structural and mathematical model. Science 189:58–60.
Mendelson WB, Guthrie RD, Frederick G, Wyatt RJ. 1974. The flower pottechnique of rapid eye movement (REM) sleep deprivation. PharmacolBiochem Behav 2:553–556.
Morales FR, Sampogna S, Yamuy J, Chase MH. 1999. c-Fos expression inbrainstem premotor interneurons during cholinergically induced activesleep in the cat. J Neurosci 19:9508–9518.
Morgan JI, Curran T. 1986. Role of ion flux in the control of c-fos expres-sion. Nature 322:552–555.
Nitz D, Siegel JM. 1997. GABA release in the locus coeruleus as a functionof sleep/wake state. Neuroscience 78:795–801.
Paxinos G, Watson C. 1997. The rat brain in stereotaxic coordinates. NewYork: Academic Press.
Peyron C, Luppi PH, Rampon C, Jouvet M. 1995. Localization of theGABAergic neurons projecting to the dorsal raphe and locus coeruleus.Soc Neurosci (Abstr) 21:373.
Peyron C, Tighe DK, van den Pol AN, de Lecea L, Heller HC, Sutcliffe JG,Kilduff TS. 1998. Neurons containing hypocretin (orexin) project tomultiple neuronal systems. J Neurosci 18:9996–10015.
Pieribone V, Shipley MT, Ennis M, Aston-Jones G. 1990. Anatomicalevidence for GABAergic afferents to the rat locus coeruleus in thedorsal medial medulla: an immunocytochemical and retrograde trans-port study. Soc Neurosci (Abstr) 16:300.
Rampon C, Peyron C, Gervasoni D, Pow DV, Luppi PH, Fort P. 1999.Origins of the glycinergic inputs to the rat locus coeruleus and dorsalraphe nuclei: a study combining retrograde tracing with glycine immu-nohistochemistry. Eur J Neurosci 11:1058–1066.
Robinson TE, Whishaw IQ. 1974. Effects of posterior hypothalamic lesionson voluntary behavior and hippocampal electroencephalograms in therat. J Comp Physiol Psychol 86:768–786.
Rosin DL, Weston MC, Sevigny CP, Stornetta RL, Guyenet PG. 2003.Hypothalamic orexin (hypocretin) neurons express vesicular glutamatetransporters VGLUT1 or VGLUT2. J Comp Neurol 465:593–603.
Saito Y, Cheng M, Leslie FM, Civelli O. 2001. Expression of the melanin-concentrating hormone (MCH) receptor mRNA in the rat brain. J CompNeurol 435:26–40.
Sakai K. 1985. Anatomical and physiological basis of paradoxical sleep. In:McGinty DJ, editor. Brain mechanisms of sleep. New York: RavenPress. p 111–137.
Sherin JE, Shiromani PJ, McCarley RW, Saper CB. 1996. Activation ofventrolateral preoptic neurons during sleep. Science 271:216–219.
Soja PJ, Lopez-Rodriguez F, Morales FR, Chase MH. 1995. Effects ofexcitatory amino acid antagonists on the phasic depolarizing eventsthat occur in lumbar motoneurons during REM periods of active sleep.J Neurosci 15:4068–4076.
Verret L, Goutagny R, Fort P, Cagnon L, Salvert D, Leger L, Boissard R,Salin P, Peyron C, Luppi PH. 2003. A role of melanin-concentratinghormone producing neurons in the central regulation of paradoxicalsleep. BMC Neurosci 4:19.
Verret L, Leger L, Fort P, Luppi PH. 2005. Cholinergic and noncholinergicbrainstem neurons expressing Fos after paradoxical (REM) sleepdeprivation and recovery. Eur J Neurosci 21:2488–2504.
Vertes RP. 1992. PHA-L analysis of projections from the supramammillarynucleus in the rat. J Comp Neurol 326:595–622.
586 L. VERRET ET AL.