load distribution and connection design for precast stemmed ...
147
287 NATIONAL COOPERATIVE HIGHWAY RESEARCH PROGRAM REPORT 2B7 LOAD DISTRIBUTION AND CONNECTION DESIGN FOR PRECAST STEMMED MULTIBEAM BRIDGE SUPERSTRUCTURES TRANSPORTATION RESEARCH BOARD NATIONAL RESEARCH COUNCIL
-
Upload
khangminh22 -
Category
Documents
-
view
0 -
download
0
Transcript of load distribution and connection design for precast stemmed ...
287
NATIONAL COOPERATIVE HIGHWAY RESEARCH PROGRAM REPORT 2B7
LOAD DISTRIBUTION AND CONNECTION DESIGN FOR PRECAST STEMMED
MULTIBEAM BRIDGE SUPERSTRUCTURES
TRANSPORTATION RESEARCH BOARD NATIONAL RESEARCH COUNCIL

TRANSPORTATION RESEARCH BOARD EXECUTIVE COMMITTEE 1986
Officers
Chairman
LESTER A. HOEL, Hamilton Professor and Chairman, Department of Civil Engineering, University of Virginia
Vice Chairman
LOWELL B. JACKSON, Secretary, Wisconsin Department of Transportation
Secretary
THOMAS B. DEEN, Executive Director, Transportation Research Board
Members
RAY A. BARNHART, Federal Highway Administrator, U.S. Department of Transportation (ex officio) JOSEPH M. CLAPP, President and Vice Chairman, Roadway Services, Inc. (ex officio), Past Chairman, 1984) JOHN A. CLEMENTS, Vice President, Sverdrup Corporation (ex officio, Past Chairman, 1985) DONALD D. ENGEN, Federal Aviation Administrator, U.S. Department of Transportation (ex officio) FRANCIS B. FRANCOIS, Executive Director, American Association of State Highway and Transportation Officials (ex officio) RALPH STANLEY, Urban Mass Transportation Administrator, U.S. Department of Transportation (ex officio) DIANE STEED, National Highway Traffic Safety Administrator, U.S. Department of Transportation (ex officio) GEORGE H. WAY, Vice President for Research and Test Department, Association of American Railroads (ex officio) ALAN A. ALTSHULER, Dean, Graduate School of Public Administration, New York University JOHN R. BORCHERT, Regents Professor, Department of Geography, University of Minnesota ROBERT D. BUGHER, Executive Director, American Public Works Association DANA F. CONNORS, Commissioner, Maine Department of Transportation MORTIMER L. DOWNEY, Deputy Executive Director for Capital Programs, New York Metropolitan Transportation Authority THOMAS E. DRAWDY, SR., Secretary of Transportation, Florida Department of Transportation PAUL B. GAINES, Director of Aviation, Houston Department of Aviation JACK R. GILSTRAP, Executive Vice President, American Public Transit Association
WILLIAM K. HELLMAN, Secretary, Maryland Department of Transportation JOHN B. KEMP, Secretary, Kansas Department of Transportation ALAN F. KIEPPER, General Manager, Metropolitan Transit Authority, Houston JAMES E. MARTIN, President and Chief Operating Officer, Illinois Central Gulf Railroad DENMAN K. McNEAR, Chairman, President and Chief Executive Officer, Southern Pacflc Transportation Company FRED D. MILLER, Director, Oregon Department of Transportation JAMES K. MITCHELL, Professor, Department of Civil Engineering, University of California H. CARL MUNSON, JR., Vice President for Strategic Planning, The Boeing Commercial Airplane Company MILTON PIKARSKY, Distinguished Professor of Civil Engineering, City College of New York HERBERT H. RICHARDSON, Vice Chancellor and Dean of Engineering. Texas A & M University LEO J. TROMBATORE, Director, California Department of Transportation CARL S. YOUNG, Broome County Executive, New York
NATIONAL COOPERATIVE HIGHWAY RESEARCH PROGRAM
Transportation Research Board Executive Committee Subcommittee for NCHRP
LESTER A. HOEL, University of Virginia (Chairman)
LOWELL B. JACKSON, Wisconsin Department of Transportation JOHN A. CLEMENTS, Sverdrup Corporation
Field of Design
Area of Bridges
Project Panel. C12-24
ADRIANUS VANKAMPEN, Consultant (Chairman) ALEX AS WAD, Stanley Structures, Inc.
ROBERT B. JARVIS, Idaho Dept. of Transportation BILL JONES, California Dept. of Transportation THOMAS J. MOON, New York State Dept. of Transportation
FRANCIS B. FRANCOIS, Amer. Assn. of State Hwy. & Transp. Officials RAY A. BARNHART, U.S. Dept. of Transp. THOMAS B. DEEM, Transportation Research Board
CLAUDE S. NAPIER, JR., Federal Highway Administration JOHN J. PANAK, Texas State Dept. of Hwys. and Public Transp. HERMAN TACHAU, H. W. Lochner, Inc. CRAIG A. BALLINGER, FHWA Liaison Representative GEORGE W. RING, III, TRB Liaison Representative
Program Staff
ROBERT J. REILLY, Director, Cooperative Research Programs
ROBERT E. SPICHER, Deputy Director
LOUIS M. MAcGREGOR, Program Officer IAN M. FRIEDLAND, Senior Program Officer
CRAWFORD F. JENCKS, Senior Program Officer DAN A. ROSEN, Senior Program Officer HARRY A. SMITH, Senior Program Officer HELEN MACK, Editor
NATIONAL COOPERATIVE /
HIGHWAY RESEARCH PROGRAM 287 REPORT
V LOAD DISTRIBUTION AND CONNECTION DESIGN FOR PRECAST STEMMED
MULTIBEAM BRIDGE SUPERSTRUCTURES
J.F. STANTON and A. H. MATTOCK Department of Civil Engineering
University of Washington Seattle Washington
RESEARCH SPONSORED BY THE AMERICAN ASSOCIATION OF STATE HIGHWAY AND TRANSPORTATION OFFICIALS IN COOPERATION WITH THE FEDERAL HIGHWAY ADMINISTRATION
AREAS OF INTEREST:
STRUCTURES DESIGN AND PERFORMANCE
CONSTRUCTION (HIGHWAY TRANSPORTATION)
TRANSPORTATION RESEARCH BOARD
NATIONAL RESEARCH COUNCIL WASHINGTON, D.C. NOVEMBER 1986
NATIONAL COOPERATIVE HIGHWAY RESEARCH PROGRAM
Systematic, well-designed research provides the most effec-tive approach to the solution of many problems facing high-way administrators and engineers. Often, highway problems are of local interest and can best be studied by highway de-partments individually or in cooperation with their state universities and others. However, the accelerating growth of highway transportation develops increasingly complex problems of wide interest to highway authorities. These problems are best studied through a coordinated program of cooperative research.
In recognition of these needs, the highway administrators of the American Association of State Highway and Transpor-tation Officials initiated in 1962 an objective national high-way research program employing modern scientific tech-niques. This program is supported on a continuing basis by funds from participating member states of the Association and it receives the full cooperation and support of the Fed-eral Highway Administration, United States Department of Transportation.
The Transportation Research Board of the National Re-search Council was requested by the Association to admin-ister the research program because of the Board's recognized objectivity and understanding of modern research practices. The Board is uniquely suited for this purpose as: it maintains an extensive committee structure from which authorities on any highway transportation subject may be drawn; it possesses avenues of communications and cooper-ation with federal, state, and local governmental agencies, universities, and industry; its relationship to the National Research Council is an insurance of objectivity; it maintains a full-time research correlation staff of specialists in high-way transportation matters to bring the fmdings of research directly to those who are in a position to use them.
The program is developed on the basis of research needs identified by chief administrators of the highway and trans-portation departments and by committees of AASHTO. Each year, specific areas of research needs to be included in the program are proposed to the National Research Council and the Board by the American Association of State High-way and Transportation Officials. Research projects to fulfill these needs are defined by the Board, and qualified research agencies are selected from those that have submitted' pro-posals. Administration and surveillance of research contracts are the responsibilities of the National Research Council and the Transportation Research Board.
The needs for highway research are many, and the National Cooperative Highway Research Program can make signifi-cant contributions to the solution of highway transportation problems of mutual concern to many responsible groups. The program,' however, is intended to complement rather than to substitute for or duplicate other highway research programs.
NCHRP REPORT 287
Project 12-24 FY'83
ISSN 0077-5614
ISBN 0-309-04021-3
L. C. Catalog Card No. 86-51604
Price $11.80
NOTICE The project that is the subject of this report was a part of the National Co-operative Highway Research Program conducted by the Transportation Re-search tlOatd with the approval of the Governing Board of the Natiojial Research Council. Such approval reflects the Governing Board's judgment that the program concerned is of national importance and appropriate with respect to both the purposes and resources of the National Research Council.
The members of the technical committee selected to monitor this project and to review this report were chosen for recognized scholarly competence and with due consideration for the balance of disciplines appropriate to the proj-ect. The opinions and conclusions expressed or implied are those of the re-search agency that performed the research, and, while they have been accepted as appropriate by the technical committee, they are not necessarily those of the Transportation Research Board, the National Research Council, the American Association of State Highway and Transportation officials, or the Federal Highway Administration, U.S. Department of Transportation.
Each report is reviewed and accepted for publication by the technical com-mittee according to procedures established and monitored by the Transpor-tation Research Board Executive Committee and the. Governing Board of the National Research Council.
The National Research Council was established by the National Academy of Sciences in 1916 to associate the broad community of science and technology with the Academy's purposes of furthering knowledge and of advising the Federal Government. The 'Council has become the principal operating agency of both the National Academy of Sciences and the National Academy of En-gineering in the conduct of their services to the government, the public, and the scientific and engineering communities. It is administered jointly by both Academies and the Institute of Medicine. The National Academy of Engi-neering and the Institute of Medicine were established in 1964 and 1970, re-spectively, under the charter of the National Academy of Sciences.
The Transportation Research Board evolved in 1974 from the Highway Re-search Board which was established in 1920. The TRB incorporates all for-mer HRB activities and also performs additional functions under a broader scope involving all modes of transportation and the interactions of transpor-tation with society.
Special Notice The Transportation Research Board, the National Research Council, the Fed-eral Highway Administration, the American Association of State Highway and Transportation Officials, and the individual states participating in the National Cooperative Highway Research Program do not endorse products or manufacturers. Trade or manufacturers' names appear herein solely because they are considered essential to the object of this report.
Published reports of the
NATIONAL COOPERATIVE HIGHWAY RESEARCH PROGRAM
are available from:
Transportation Research Board National Research Council 2101 Constitution Avenue, N.W. Washington, D.C. 20418
Printed in the United States of America

v1-
FOREWO RD This report contains the findings of a study that was undertaken to provide guidance for the design of multibeam precast bridges made from single and multi-
By Staff stemmed members. The report includes recommendations for revisions to the load Transportation distribution requirements for multibeam precast bridges presently existing in the
Research Board AASHTO Standard Spec jflcations for Highway Bridges along with recommendations for the joint design between precast panels. The contents of the report will be of immediate interest and use to bridge engineers, construction engineers, researchers, specification writing bodies, and others concerned with the design of multibeam precast bridges.
Because of their relative economy and the speed and ease of construction, the popularity and use of multibeam precast bridge superstructures has grown considerably in recent years. These types of bridges are constructed by placing a number of precast concrete members next to each other. Typically the members are then connected to one another along their edges through a grouted keyway and welded steel connectors. The grouted keyway will transmit shear, but very little moment, between members.
The present load distribution requirements for multibeam precast bridges that are contained in the AASHTO Standard Specifications for Highway Bridges are based on recommendations from a previous NCHRP study documented in NCHRP Report 83, "Distribution of Wheel Loads on Highway Bridges," and published in 1970. That study examined a limited number of multibeam bridge geometries.
This report contains the findings of NCHRP Project 12-24, "Design of Multi-Beam Precast Bridge Superstructures." The primary objectives of this study were twofold: the first was to develop specification recommendations for the lateral dis-tribution of wheel loads for a wide variety of precast multibeam bridge superstructures made from single and multistemmed members, and the second was to develop criteria for the design of the connections between adjacent precast members.
The first part of the report provides a review and evaluation of existing domestic and foreign codes of practice, research findings, and performance data on lateral wheel load distribution for multibeam bridge superstructures. On the basis of this infor-mation, key parameters for the development and refinement of distribution factors are identified. Numerous case studies were performed to investigate the effects of parameters such as span length, skew, number of stems, member properties, warping, along with many others. Based on an assessment of the results of these case studies, a revised lateral load distribution formula is recommended that is safe for multibeam bridges up to four lanes wide with as much as a 45-degree skew.

The existing provisions in the AASHTO code, based upon the recommendations of NCHRF Report 83, were found to be satisfactory for most bridge geometries, with the exception of very short, wide bridges. Fortunately, not many bridges actually fall in this category.
The second part of the report relates primarily to an evaluation and a set of recommendations for the design of the grouted keyway and steel connectors between multibeam precast members. The current AASHTO Specifications give no guidance on the forces that these joints must carry, nor do they contain methods for determining the minimum size, shape, or spacing for the keyway and connectors.
An extensive review and evaluation of existing research findings and performance data disclosed that very limited data were available on which to base recommendations. Therefore, laboratory experiments were conducted to verify the applicability of design guidelines proposed by the researchers. The report provides methods for predicting the shear strength of the embedded steel connectors, and recommendations are made for a modified keyway geometry that will provide a greater cracking strength than exists for standard keyway geometries in use today.
The report also includes a comprehensive bibliography containing detailed ref-erences for both multibeam load distribution and connection analysis and design.

CONTENTS
1 SUMMARY
PART I
3 CHAPTER ONE Introduction and Research Approach
4 CHAPTER Two State of the Art of Multibeam Precast Bridges Construction and Use Behavior Characteristics Analytical Studies
8 CHAPTER THREE Load Distribution Studies—Choice, Development, and Verification of Analytical Method
Introduction and Choice of Method Warping Torsion Stiffress Program Output Transverse Stiffness Program Package and Verification
16 CHAPTER FOUR Load Distribution Studies—Effects of Individual Variables
Introduction Bridge Geometry and Member Properties Effect of Member Width Effect of Warping Stiffness Effect of Diaphragms Effect of Curb Size End Flexibility Skew Shear Edge Stiffening and Edge Loads Connector Forces I
44 CHAPTER FIVE Development of Design Procedures and Proposed Revisions to Ref. 11
47 CHAPTER six Connection Methodology and Experimental Study Introduction Current Practice Review of Related Design Practices and Research Experimental Study of Connections
71 CHAPTER SEVEN Conclusions and Recommendations Conclusions Relative to Load Distribution Conclusions On Connections Recommendations for the Design of Connections Recommendations for Further Research
PART II
74 APPENDIX A Survey Results
134 APPENDIX B References
136 APPENDIX C Glossary

ACKNOWLEDGMENTS
The research reported herein was performed under NCHRP Project Graduate students Mark Aden, Paul Brallier, and Roberto Rubio made
12-24 by the Department of Civil Engineering, University of Washing- extensive contributions, without which the work could not have been
ton. It was supervised and performed by the Principal Investigators, done. Associate Professor John F. Stanton and Professor Alan H. Mattock.

LOAD DISTRIBUTION AND CONNECTION DESIGN FOR PRECAST
STEMMED MULTIBEAM BRIDGE SUPERSTRUCTURES
SUMMARY The research conducted under NCHRP Project 12-24 and reported herein was undertaken to provide guidance on the design of multibeam precast bridges. These types of bridges are made from separate precast members that are set side by side on the abutments and are connected to each other by a grouted key and welded steel connectors. Shear can thus be transmitted between the members, but the joint acts much like a hinge, thereby preventing the transfer of moments. Single-stem and multistemmed members are widely used, respectively in the ranges of about 40 to 180 ft and 25 to 85 ft.
The research documented in this report addresses two areas of study. The first is the distribution of truck wheel loads for design of individual members. The 1983 AASHTO Standard Spec jfications for Highway Bridges contains provisions suitable for many multibeam bridge types, but not for precast multistemmed members. These provisions are expressed in the form of a load fraction given by a relatively simple formula, and this approach is followed in the present study. The data on which the formula is based were obtained by analyzing a wide variety of bridges with different geometries, member types, and stiffness ratios. The analyses were performed with a griulage analysis computer program, especially modified to account for torsional effects arising from the restraint of warping.
The research indicated that two variables (the ratio of bridge span to bridge width and the ratio of flexural-to-torsional stiffness of the members) have the most influence over the load fraction, and that two bridges having the same values for these ratios will have the same load fraction regardless of the shape of the cross section. Warping effects exert little influence on common member sizes and standard truck wheel spacings, so the results of this study should be approximately applicable to bridges made from any cross section, within the limits of the stiffnesses studied.
Results were obtained for a wider range of bridge geometries than was the case in the study (NCHRF Report 83) on which the present AASHTO specifications are based. The existing provisions were found to be significantly unconservative for very short, wide bridges, but fortunately not many bridges fall in that category. An alter-native formula that is safe for bridges up to four lanes wide and 45-deg skew is proposed for the wheel load fraction given in Article 3.23.4 of the Standard Speci-fications for Highway Bridges (thirteenth edition):
Load fraction = S/D
where: D = (5.75 - O.SNL) + 0.7NL(l - 0.2C)2, C < 5; D = (5.75 - O.SNL), C > 5; NL = number of lanes; S = width of precast member; and C = a constant which represents the section properties and is presently defined in Article 3.23.4, and would remain the same. It is proposed that the constant K on which C depends should have the same value of 2.2 for all single-stem and multistemmed members, including channels.
2
This formula gives wheel load fractions that are very similar to those presently in use except for short wide bridges, for which the proposed value is higher. Precast bridges wider than four lanes were not studied because they were found to be seldom used, and, in view of this, it was considered impractical and too expensive to carry out a detailed analysis of such types. However, the dependence of D on NL is relatively small, and it is believed that the proposed formula could be applicable to five-lane or six-lane bridges without incurring an error greater than about 5 percent. Skews greater than 45 deg were not studied.
The second area of study was the joint between members. The AASHTO speci-fications presently provide no guidance on the forces to be carried or methods of establishing the strength of the grout key and connectors. In practice, these are sized using rule of thumb and historical performance rather than rational mechanics. In this study, methods for predicting the shear strength of the embedded steel connectors were derived using published data and existing design methods. Because the available information was limited, a series of laboratory experiments were then conducted to verify the applicability of the proposed methods.
The results showed that the primary loads to be carried are shear forces perpen-dicular to the deck. Loads imposed before grouting by leveling of any differential cambers must be carried by the connectors alone. Those caused by wheel loads are transferred almost entirely through the grout joint, because it is much stiffer than the steel connectors. The grouted keyway was found to fail by cracking of the tips of the member flanges where they project above and below the grout key rather than in the grout itself, even when the concrete was 75 percent stronger than the grout. A modified design for the keyway geometry provided greater cracking strength. In order to prevent a brittle failure after cracking, a minimum tensile strength is recommended for the steel connectors. This is so that they can provide a clamping force, between the members, which gives rise to a shear resistance across the joint analogous to shear friction.
Analyses were also performed to establish the shear loads in the joint caused by truck wheel loads. The values obtained were very sensitive to the way in which the structure was modeled in the vicinity of the joint. However, in all cases the shear was concentrated over a very short length of the joint when a wheel was placed next to it. Comparison of these predicted loads with the cracking strengths obtained in the tests showed that for commonly used sizes the safety factors against cracking are greater than 1.0, but less than those required by standard AASHTO strength design methods. Because of the sensitivity of the analysis to the modeling used, this result should be viewed with caution and further study is recommended.

CHAPTER ONE
INTRODUCTION AND RESEARCH APPROACH
A multibeam precast bridge is one made by placing a number of precast concrete units next to each other to form the super-structure. The members are most often connected by welding together steel inserts embedded in their edges at intervals along the span. A grouted keyway is almost always used as well, and is so shaped as to transfer vertical shear between members. The superstructure requires little or no poured-in-place concrete and this fact provides the principal advantage of the method, namely, erection is fast and relatively easy even at remote sites. The market for such bridges lies in the short-to-medium span range, up to a maximum of about 180 ft. The shorter spans generally use closed sections such as solid or voided slabs, box sections, or multistem members with two to five stems per unit. Deck bulb tees are popular for longer spans.
In a previous NCHRP study (5), load fractions, now embod-ied in the AASHTO specifications (11), were established for many bridge types including a variety of multibeam cross sec-tions. However, the only stemmed members addressed were channels. Since then, sections such as double tees, which had previously found their main application in buildings, have come into common use for bridges and design procedures suitable for suchapplications are needed. The AASHTO specifications also contain no guidelines for connectors embedded in members of any cross section, and connector designs have therefore evolved on what amounts to a trial-and-error basis. A wide variety of connection types exist with rather different strengths and stiff-nesses, even though they have all been designed for the same purpose.
The overall objective of this research was to develop infor-mation on the behavior characteristics of multibeam precast bridges with particular consideration gien to the distribution of wheel loads in the deck and on the methodology for designing the steel connectors. The specific objectives of this research were: (1) to investigate the distribution of truck wheel loads in the decks of bridges made from single-stem and multistemmed pre-cast concrete tee-shaped members, and to make recommenda-tions for their design in a form suitable for inclusion in the AASHTO Standard Spec Wcations for Highway Bridges; and (2) to establish a methodology for designing steel connectors embed-ded in the fla'nges of such members.
The two objectives were pursued simultaneously, and the organization of the report reflects the approach followed in conducting the research. A chapter is provided for each major task of the research effort. The state of the art is discussed in Chapter Two. The work on load distribution occupies Chapters Three and Four, and Chapter Five contains the development of the design procedures and proposed revisions to the AASHTO specifications. The investigation of connector design method-ology and the laboratory experiments on connectors are reported in Chapter Six. Conclusions and areas in need of further in-vestigation are identified in Chapter Seven. The material in the
appendixes includes, in Appendix A, the results of a survey on present practice; and in Appendix B, a bibliography. The ref-erences in the bibliography are separated into those on load distribution (1 to 52) and those on connector design (53 to 77) in order to simplify access for readers interested in only one of the two subjects. There is inevitably some minor duplication in each. To give the reader clear definitions of the notation used throughout this report, a glossary of symbols has been provided in Appendix C.
The following discussion is intended to serve as an introduc-tion to the research documented in the remaining chapters of this report.
AASHTO guidelines for wheel load distribution in all bridge types have for many years been expressed in terms of the quotient S/D, where S is the girder spacing (either actual or an effective one defined by a formula in the AASHTO Standard Specifi-cations for Highway Bridges), and D is a characteristic width associated with the particular bridge type and geometry. This quotient is referred to as the load fraction. The longitudinal girders are designed for flexure by finding the worst bending moment caused by a single longitudinal line of wheels placed at spacings representing a standard truck on an isolated girder, and then multiplying that moment by the load fraction to take into account the effect of a truck placed in each lane of the bridge. Lane load reduction factors are also specified to account for the improbability of all lanes being fully loaded at the same time. Design for shear follows similar lines, using the same value of D as for the moment. (This is strictly not reflective of the true distribution of shear forces, but has proved an adequate approximation for many years.)
It is clearly desirable to continue to use this load fraction format for multibeam bridges for the sake of consistency with other types. Since S either is defined by existing formula or is self-evident for a particular section, the problem reduces to one of defining Din such a way that the load fraction has the correct value. It may be done with different levels of sophistication and accuracy. An example of the simplest approach involves the D values in the AASHTO specifications for beam and slab bridges, which are constants for particular types of construction and are independent of the bridge geometry. The Ontario Highway Bridge Design Code (OHBDC) (18) takes a more sophisticated approach, and supplies charts for establishing D, which take into account bridge geometry, member priorities, number of traffic lanes, etc. The behavior and analysis of bridge decks, in general, and the basis for the OHBDC, in particular, are well explained in Ref. (10).
It can be shown that in any bridge deck the important pa-rameters to model are the plan geometry and the flexural and torsional stiffnesses in the two directions. In multibeam precast bridges the transverse stiffness is discontinuous, having a finite
value within the members and reducing to essentially zero at the joints between them. In fact, some moment may be trans-ferred across the joint, particularly if the members are trans-versely post-tensioned, but unless the amount is a substantial portion of that which would exist in a beam and slab bridge with a monolithic deck, the effect on the distribution of lon-gitudinal moments is small. Because the size of the transverse moment is uncertain and depends on the joint details, it is generally assumed to be zero. This assumption is generally be-lieved to lead to conservative results, and it is used in this study for lack of a better one. However, in Chapter Four, it is shown that the assumption is not always conservative. In those cases where it leads to results that are nominally unsafe, the differences are small.
For proper analysis of multistemmed girders another set of effects should be included, namely, the stresses and additional torsional resistance caused by restraint of warping in open sec-tions such as double tees. The additional responses are a bi-moment (resembling a negative moment in one stem and a positive one in the other) and a restraint-of-warping torque (manifested as an upwards shear force in one stem and down-wards one in the other). These exist in addition to the conven-tional bending moments, shears and Saint-Venant torques. They result in greater torsional stiffness, which helps the load distri-bution, and additional stresses, which cause larger response for a given load arrangement, giving the appearance of worse load distribution. They thus counteract each other, but the degree of cancellation depends on the particular structure and load arrangement. They are often ignored by designers, partly be-cause the underlying theory is slightly more complicated than engineering beam theory, and partly because very few standard computer analysis packages include their effects. It was found here that ignoring all warping effects gave slightly conservative results in all critical cases of those studied here, but that, with different loading arrangements such as oversized trucks with wide wheel spacing, the opposite might be true.
Wide varieties of methods are available for analyzing bridge decks, and they are discussed in some detail in Chapter Two. A grillage method was finally selected because it was the only one capable of analyzing skew bridges at a reasonable compu-tational cost. It was modified to incorporate warping effects and was verified by comparing its predictions with closed-form so-lutions, with results obtained by previous investigators and with
the results of laboratory experiments on full-sized double tees, as described in Chapter Three. Chapter Four describes a pa-rameter study in which wide varieties of bridges were analyzed to investigate the effects of individual variables such as bridge geometry, member properties, inclusion of warping, diaphragms, edge distance of the load, skew, edge loading from precast bar-riers, and so on. Forces in the steel connectors and grout key were also investigated using the grillage program, a special pur-pose finite-strip program and closed-form analyses.
If wheel loads are to be distributed among the members, the joints must be capable of transferring shear forces. The AASHTO specifications presently provide no guidance on the strength required of the joint or on design of the steel connectors. The survey revealed a variety of connector designs covering a considerable range of strengths and stiffnesses. Analyses were in general not available to justify the designs, most of which appeared to have been developed on a try-it-and-see basis.
In this study efforts were made to improve the state of knowl-edge relative to connections in three areas. First, design meth-odologies for embedded connectors in bridges and other forms of construction were reviewed and equations were derived for establishing the strength of the connectors and their anchorages commonly used in multibeam bridges. Next, a series of exper-iments was performed to study the behavior of the connectors both alone and in conjunction with a grouted keyed joint and to verify the applicability of the strength equations previously derived. These two activities are reported in detail in Chapter Six. Third, analytical studies were performed to establish the intensity of shear forces transferred across the joint. This analysis is more complicated than it first appears. Shear forces are in-duced in the connectors if differential cambers between adjacent beams have to be removed prior to grouting. However, wheel loads are transferred almost exclusively through the grout joint because it is much stiffer than the connectors. The longitudinal shear distribution due to wheel loads is rather peaked and, because the joint is unreinforced, the maximum intensity must be known so that it can be compared with the cracking strength of the joint. In addition, tension forces act on the connectors both as a result of twisting of the beams and from the need to provide a clamping force across the joint by which some ductile shear strength may be obtained. The analyses are described in Chapter Four, where also the strengths measured in the exper-iments are compared with the predicted shear loads:
CHAPTER TWO
STATE OF THE ART OF MULTIBEAM PRECAST BRIDGES
CONSTRUCTION AND USE
Multibeam precast bridges have proved to be economical for ft (1); thus, there is a considerable market for precast multibeam
short-to-medium spans (about 25 ft to 180 ft). Ninety percent systems. By precasting (and often prestressing) under plant con-
of road bridges in the United States have spans of less than 100 ditions, high-quality concrete can be obtained with good resist-

5
ance to the hostile environmental conditions present in most bridges. Precasting also leads to rapid construction, particularly for completely precast systems. These prove advantageous when speed is important, such as in those cases when an existing bridge is to be replaced (2). Totally precast bridges are also suitable for use in remote regions where transportation of freshly
SPAN RANGE 25 TO 55'
oi
mixed concrete poses problems. In such regions, access for main-tenance is usually inconvenient as well, so the durability and minimal maintenance requirements of precast concrete consti-tute further desirable features. Commonly used member cross sections are shown in Figure 1, and a typical bridge cross section is shown in Figure 2.
4-0' to 6-0'
SPAN RANGE 30 TO 60'
TRI - TEE
SPAN RANGE 25' TO 70'
SMALL DOUBLE TEE
4'O"
SPAN RANGE 45' TO 00'
CHANNEL
6-0 to 0-0'
.5 - 0
SPAN RANGE 50' TO 80'
LARGE DOUBLE TEE
4'-0" to 6-0"
rx if
2-0"
SPAN RANGE 60' TO 135'
SPAN RANGE 50 TO 80'
SPAN RANGE 40 1 TO 20'
BULB TEE
DECK BULB TEE
SINGLE TEE
Figure 1. Typical stemmed members.
Figure 2. Typical precast multibeam bridge cross sections.

Many totally precast bridges are single span. The sequence of construction is to erect the abutments and wing-walls, which may themselves be precast, and to then set the girders on elas-tomeric bearings on the abutments. Adjacent girders are next connected. Several different means are used and are illustrated in Figures 83, 84, and 85 in Chapter Six. Flanged members may be connected either by welding loose plates or bars between steel inserts embedded in the flanges or by means of rods or strands in ducts running transversely to the longitudinal axis, and channels may be connected by bolting through adjacent webs. These connectors are discussed in detail in Chapter Six.
BEHAVIOR CHARACTERISTICS
When wheel loads are applied to a multibeam precast bridge deck, adjacent members are forced to deflect simultaneously. Thus the load on one member is distributed among the others, transferred by vertical shear forces at the joints. The extent of the load distribution and the magnitude of the joint forces are of interest to the designer.
In bridges with cast-in-place decks, vertical loads are distrib-uted transversely largely by flexure, torsion, and shear in the slab, and to some extent by diaphragms, if they exist. In mul-tibeam precast bridges the joints between members are fre-quently unable to transmit moments in the transverse direction and so they act like hinges. Vertical load is transmitted across the joint by shear, but then must be carried across the member to the joint on the other side by torsion alone. The result is that at any location along the bridge the cross sections of individual members displace and rotate almost as rigid bodies with very little deformation. This behavior, shown in Figure 3 for double tees, has been verified experimentally (3). It is clear that the load distribution properties must depend on the torsional stiff-ness of the member and that closed members that are torsionally stiff, such as voided slabs, will have more favorable distribution characteristics than open members that are torsionally flexible, such as double tees, other properties being equal. Furthermore the precise shape of the cross section (e.g., double tee or quad tee) is not important, provided the section properties are known. For the same reasons, each member must be prevented from rotating at its ends, so the stiffest possible end diaphragm is desirable. This is particularly true of single-stemmed members that lack the inherent torsional end-restraint of a multistemmed member; but, even in members like double tees, the lack of an end diaphragm and the flexibility of the elastomeric bearing pads on which it is supported can introduce sufficient flexibility to detract somewhat from the load distribution properties (3).
The connectors must be able to carry shear forces normal to the deck, but they will also be subjected to imposed rotations that cause the joint to act like a hinge. When the members are multistemmed, direct tension or compression will also be pres-ent. This may be explained by considering two multistemmed girders connected along the joint, with a wheel load placed at the joint. If the members were not connected they would twist about their individual shear centers, which are located a small distance above the deck slab, causing the two flanges to move away from one another. However, the connectors prevent this from happening, so tension is induced in them. The magnitude will depend on the load, the torsional properties of the members, and the location of the members within the bridge. The worst case is likely to occur at the outermost joint.
ANALYTICAL STUDIES
Analysis of load distribution effects in bridge decks is the subject of an enormous literature. A number of references (4-10) contain good bibliographies. Almost all of the literature concerns linear elastic methods. Based on the survey results, sophisticated methods appear to be used sparingly by most bridge designers in the United States. The vast majority of respondents to the survey conducted at the outset of this research (see Appendix A) reported using the AASHTO specifications (11), and some specifically named Article 1.3.1(D). (This article number refers to the twelfth and earlier editions. It was changed in the thirteenth edition.) That article was introduced as a result of the most recent research effort (5) to update the complete section on load distribution; unfortunately, it does not address stemmed members other than channels. It reflects an effort to render the results of many complex analyses in a format simple enough to be readily used by designers on an everyday basis. The penalty for such a simplification is a loss in accuracy, and the inevitable introduction of approximations of which some may not be conservative (10).
Many methods of bridge deck analysis have been proposed, all of them necessarily approximate. They vary in the facets of structural behavior which they replicate best and in the com-putational effort involved. For convenience they may be loosely grouped into four categories:
Equivalent-plate methods. Equivalent-beam-grillage methods. Finite-element methods. Special-purpose methods.
In the equivalent-plate approach, the actual bridge super-structure is represented by an orthotropic plate having properties in the longitudinal and transverse directions which represent the average, or smeared, properties of the prototype. The re-sulting plate problem is most easily solved when the supports are simple and there is no skew, because the deflection can then be modeled in the longitudinal direction as a Fourier sine series, which converges relatively rapidly. The method was first pro-posed by Guyon (12) and was modified by Massonnet (13) to better account for torsional stiffness; and by Rowe (14), to account for Poisson's ratio. Spindel (15) appears to have been the first to extend the orthotropic-plate analysis by setting the transverse stiffness to zero for the purpose of reproducing the behavior of the hinged joints in multibeam bridges. The method is now commonly called the "articulated-plate" method. Later, Watanabe (16) added a restraint-of-warping torsion term. Local stiffening by edge beams (17) may also be accounted for.
The method is convenient because it permits analysis of many bridge types in terms only of their overall geometry and stiffness parameters, which can lead to representation of their response on a small number of dimensionless charts (18). It works best when the analytical assumption of uniformly distributed stiffness is most nearly valid, that is, when the bridge is made of many closely spaced beams, but it has been successfully applied (19) to other cases such as multispine box girder bridges with at least three spines. The inclusion of transverse diaphragms in the analysis can be achieved simply, but approximately, by spreading out their stiffness over the length of the bridge, or more ex-plicitly, but at considerable loss of simplicity, by imposing suit-
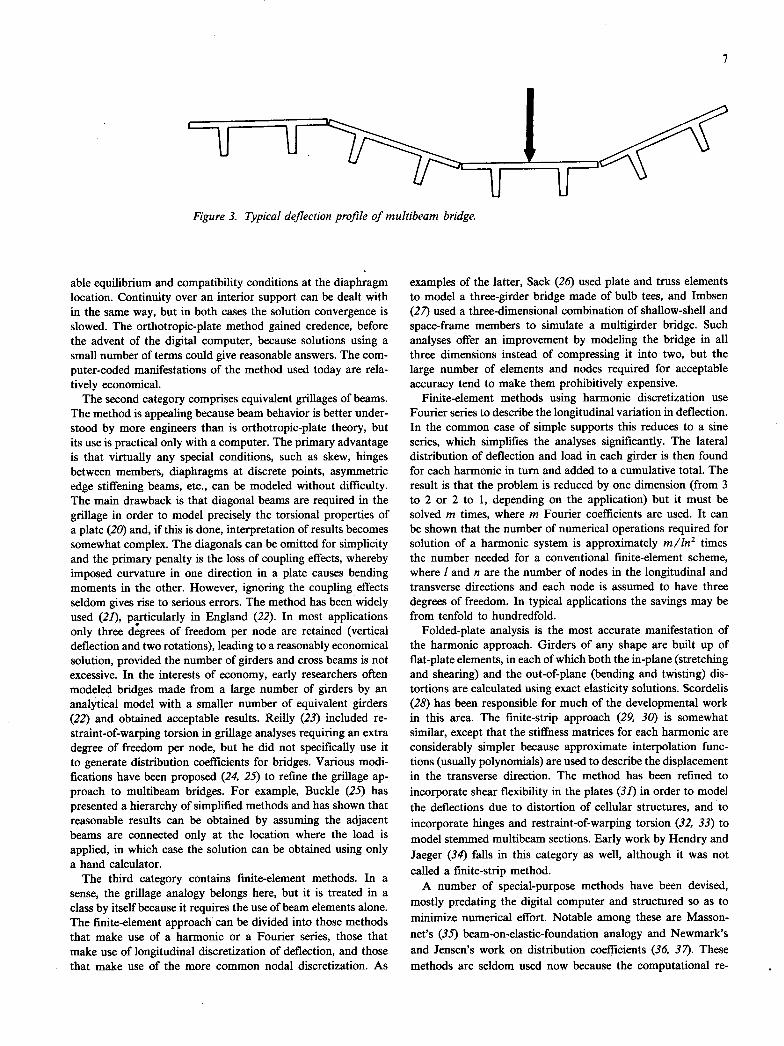
Figure 3. Typical deflection profile of multibeam bridge.
able equilibrium and compatibility conditions at the diaphragm location. Continuity over an interior support can be dealt with in the same way, but in both cases the solution convergence is slowed. The orthotropic-plate method gained credence, before the advent of the digital computer, because solutions using a small number of terms could give reasonable answers. The com-puter-coded manifestations of the method used today are rela-tively economical.
The second category comprises equivalent grillages of beams. The method is appealing because beam behavior is better under-stood by more engineers than is orthotropic-plate theory, but its use is practical only with a computer. The primary advantage is that virtually any special conditions, such as skew, hinges between members, diaphragms at discrete points, asymmetric edge stiffening beams, etc., can be modeled without difficulty. The main drawback is that diagonal beams are required in the grillage in order to model precisely the torsional properties of a plate (20) and, if this is done, interpretation of results becomes somewhat complex. The diagonals can be omitted for simplicity and the primary penalty is the loss of coupling effects, whereby imposed curvature in one direction in a plate causes bending moments in the other. However, ignoring the coupling effects seldom gives rise to serious errors. The method has been widely used (21), particularly in England (22). In most applications only three degrees of freedom per node are retained (vertical deflection and two rotations), leading to a reasonably economical solution, provided the number of girders and cross beams is not excessive. In the interests of economy, early researchers often modeled bridges made from a large number of girders by an analytical model with a smaller number of equivalent girders (22) and obtained acceptable results. Reilly (23) included re-straint-of-warping torsion in grillage analyses requiring an extra degree of freedom per node, but he did not specifically use it to generate distribution coefficients for bridges. Various modi-fications have been proposed (24, 25) to refine the grillage ap-proach to multibeam bridges. For example, Buckle (25) has presented a hierarchy of simplified methods and has shown that reasonable results can be obtained by assuming the adjacent beams are connected only at the location where the load is applied, in which case the solution can be obtained using only a hand calculator.
The third category contains finite-element methods. In a sense, the grillage analogy belongs here, but it is treated in a class by itself because it requires the use of beam elements alone. The finite-element approach can be divided into those methods that make use of a harmonic or a Fourier series, those that make use of longitudinal discretization of deflection, and those that make use of the more common nodal discretization. As
examples of the latter, Sack (26) used plate and truss elements to model a three-girder bridge made of bulb tees, and Imbsen
used a three-dimensional combination of shallow-shell and space-frame members to simulate a multigirder bridge. Such analyses offer an improvement by modeling the bridge in all three dimensions instead of compressing it into two, but the large number of elements and nodes required for acceptable accuracy tend to make them prohibitively expensive.
Finite-element methods using harmonic discretization use Fourier series to describe the longitudinal variation in deflection. In the common case of simple supports this reduces to a sine series, which simplifies the analyses significantly. The lateral distribution of deflection and load in each girder is then found for each harmonic in turn and added to a cumulative total. The result is that the problem is reduced by one dimension (from 3 to 2 or 2 to 1, depending on the application) but it must be solved in times, where in Fourier coefficients are used. It can be shown that the number of numerical operations required for solution of a harmonic system is approximately rn/In2 times the number needed for a conventional finite-element scheme, where 1 and n are the number of nodes in the longitudinal and transverse directions and each node is assumed to have three degrees of freedom. In typical applications the savings may be from tenfold to hundredfold.
Folded-plate analysis is the most accurate manifestation of the harmonic approach. Girders of any shape are built up of flat-plate elements, in each of which both the in-plane (stretching and shearing) and the out-of-plane (bending and twisting) dis-tortions are calculated using exact elasticity solutions. Scordelis
has been responsible for much of the developmental work in this area. The finite-strip approach (29, 30) is somewhat similar, except that the stiffness matrices for each harmonic are considerably simpler because approximate interpolation func-tions (usually polynomials) are used to describe the displacement in the transverse direction. The method has been refined to incorporate shear flexibility in the plates (31) in order to model the deflections due to distortion of cellular structures, and to incorporate hinges and restraint-of-warping torsion (32, 33) to model stemmed multibeam sections. Early work by Hendry and Jaeger (34) falls in this category as well, although it was not called a finite-strip method.
A number of special-purpose methods have been devised, mostly predating the digital computer and structured so as to minimize numerical effort. Notable among these are Masson-
net's (35) beam-on-elastic-foundation analogy and Newmark's and Jensen's work on distribution coefficients (36, 37). These methods are seldom used now because the computational re-

sources available today have made their simplifications unnec-essary.
Since the publication of the latest major NCHRP report on load distribution (5), two significant events have taken place. One is the development of the finite-strip method, on which initial work was begun in the late 1960's. The other is the development of the Ontario Highway Bridge Design Code (OHBDC) (18). Much of the development work that went into this code is well summarized by Bakht and Jaeger (10). The OHBDC contains design provisions for load distribution that are relatively sophisticated (being based on extensive parameter studies using orthotropic-plate theory and grillage analysis), but are easy to use because they are presented in the foi-m of di-mensionless charts. They are considerably more versatile than the existing AASHTO specifications in that they not only rec-ognize the influence of bridge geometry and member stiffnesses on the load distribution coefficients but they also take into account the fact that shear and moment are distributed differ-ently. Yet, the design is still accomplished using the traditional format of the AASHTO specifications. Reference 10 retains the OHBDC's goal of simple design guidelines and is perhaps the most complete single reference on the subject of load distribu-tion.
Prediction of connector forces in multibeam bridges is an integral part of a load distribution analysis in which the bridge is modeled accurately by a sophisticated method. However, be-cause the methods in common use (11) have used simplified methods which bypass such complex analysis, information on predicted connector forces is relatively scarce. In the survey conducted at the outset of the research only one agency reported
using a rational analytical method for prediction of connector forces. Most others avoided both the prediction of the force in the connector and execution of the connector design by relying on a standard configuration that has gained acceptance by long use. A wide variety of connector designs, strengths, and stiff-nesses are in use; yet, few problems have been reported. The subject is discussed in detail in Chapter Six. Bakht et al. (10, 38) used articulated-plate theory to generate charts of live-load shear force per unit length of joint for the OHBDC, but it should be noted that forces and deformations other than those predicted may also exist. Examples are vertical shear due to leveling of differential camber or to the effects of temperature gradients, and direct tension between multistemmed members induced by restraint of torsion. Furthermore, even the vertical shear due to wheel loads is likely to be different in practice from the value predicted by orthotropic (or articulated) plate theory, because it will in fact be influenced by the local geometry and stiffnesses, whereas orthotropic-plate theory uses average prop-erties more suitable for predicting global response. Jones and Boaz (39) used an analysis based on the force method and singularity functions and included individual connector stiff-nesses. They showed that total shear force transferred between any two beams was almost independent of the number of con-nectors, so that the connectors attract shear force in roughly inverse proportion to their number. In recent work at Iowa State University, Ong (40) used the methods of Pool et al. (32) to show that in one particular application, the connector shear was equal to 42.95 percent of the applied (wheel) load. The behavior and design of individual connector types are addressed in Chap-ter Six.
CHAPTER THREE
LOAD DISTRIBUTION STUDIES-CHOICE, DEVELOPMENT, AND VERIFICATION OF ANALYTICAL METHOD
INTRODUCTION AND CHOICE OF METHOD
Certain features of geometry and behavior were to be studied; therefore, it was essential that the chosen analytical method be capable of replicating them as faithfully as possible. Some of the more important features were the ability to simulate both wide and narrow members, skew supports, continuous members, diaphragm effects and effects of including the restraint-of-warp-ing torsion stiffness. The methods considered were the fmite-element method (using plate elements to build up the multistem members), the finite-strip method, the orthotropic-plate ap-proach, and the beam grillage analogy. Initial experiments using the SAP IV (41) fmite-element program with the Clough and Felippa plate element (42) showed that the approach was too expensive. A program for finite-strip analysis, including re-
straint-of-warping, was both available and economical, but the difficulties of adapting it to deal with skew support and dia-phragms appeared too great. The orthotropic-plate method, or rather the special case called the articulated-plate theory, is unable to distinguish between a bridge made from many narrow beams and one of the same width, but made from a few wide beams, if both have the same total flexural and torsion stiffness. Difficulties also exist over the interpretation of the value to be used for warping torsion stiffness per unit width, since this cross-sectional property varies as length to the fifth power, whereas the flexural and torsional parameters D,, D,,,, etc., vary only as length to the third power. So, if the size of their members is halved and their number is doubled, it is possible to keep the same values for D. and D, but the value for restraint-of-warping torsional stiffness will be different. Thus, the simplicity
of the nondimensional results usually obtainable with ortho-tropic-plate theory is lost. Further disadvantages are presented by skew supports and diaphragms, so the method was rejected in favor of the beam-grillage approach, which could deal with all of the required conditions, with the only potentially serious drawback being cost.
WARPING TORSION STIFFNESS
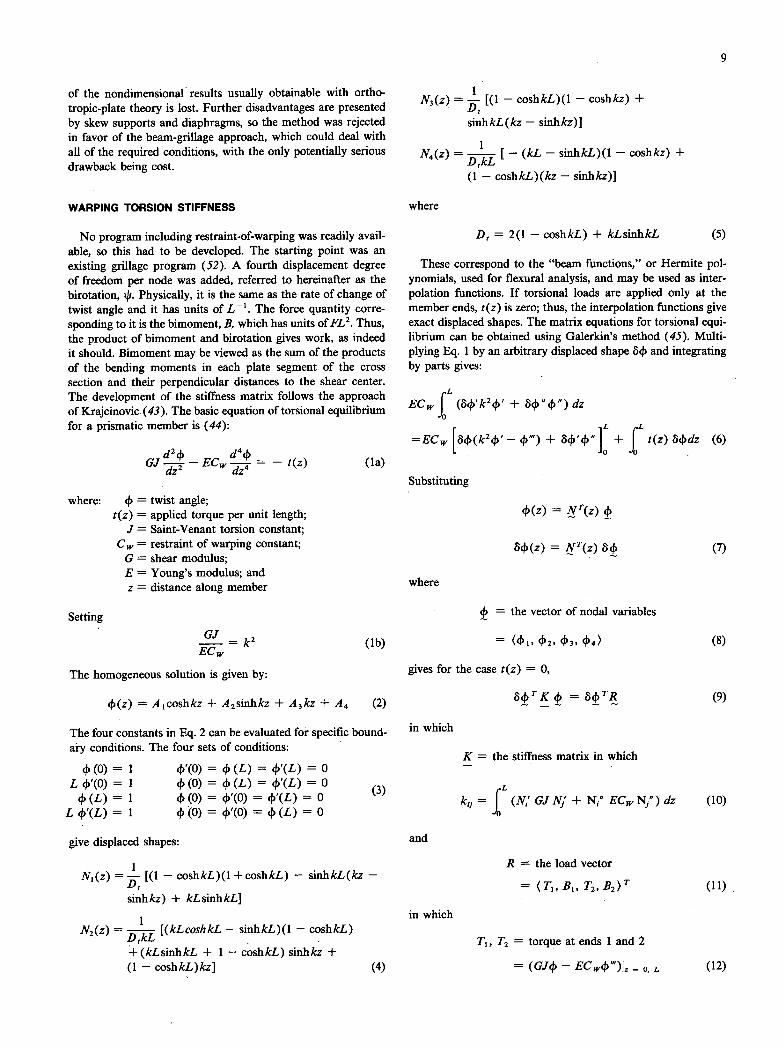
No program including restraint-of-warping was readily avail-able, so this had to be developed. The starting point was an existing grillage program (52). A fourth displacement degree of freedom per node was added, referred to hereinafter as the birotation, 43. Physically, it is the same as the rate of change of twist angle and it has units of L'. The force quantity corre-sponding to it is the bimoment, B, which has units of FL2. Thus, the product of bimoment and birotation gives work, as indeed it should. Bimoment may be viewed as the sum of the products of the bending moments in each plate segment of the cross section and their perpendicular distances to the shear center. The development of the stiffness matrix follows the approach of Krajcinovic(43). The basic equation of torsional equilibrium for a prismatic member is (44):
GJ4 - ECw j4 = - t(z) (la)
where: 43 = twist angle; t(z) = applied torque per unit length;
J = Saint-Venant torsion constant; C = restraint of warping constant;
C = shear modulus; E = Young's modulus; and z = distance along member
Setting
GJ _.=k 2 (ib) EC
The homogeneous solution is given by:
43(z) coshkz + A 2sinhkz + A 3 kz + A4 (2)
The four constants in Eq. 2 can be evaluated for specific bound-ary conditions. The four sets of conditions:
43(0) = 1 43'(0) = 43(L) = 43'(L) = 0
L43'(0) = 1 .0 (0) = .0 (L) = 43'(L) = 0
43 (L) = 1 43 (0) = 43'(0) = 43'(L) = o
L43'(L)= 1 43(0)=43'(0)=43(L)=0
give displaced shapes:
9
N3(z) = [(1 - coshkL)(l - coshkz) +
sinhkL(kz - sinhkz)}
N4(z) =[ — (kL - sinhkL)(l — coshkz) +
(1 - coshkL)(kz — sinhkz)]
where
= 2(1 - coshkL) + kLsinhkL (5)
These correspond to the "beam functions," or Hermite pol-ynomials, used for flexural analysis, and may be used as inter-polation functions. If torsional loads are applied only at the member ends, t(z) is zero; thus, the interpolation functions give exact displaced shapes. The matrix equations for torsional equi-librium can be obtained using Galerkin's method (45). Multi-plying Eq. 1 by an arbitrary displaced shape 643 and integrating by parts gives:
f L ECw (643'k 243'+""dz
1L f L =EC 643(k 2 43'— 43") + 643'43"] + t(z) 643dz (6)
0
Substituting
43(z) = NT(z)
643(z) = NT(z) 643 (7)
where
43 = the vector of nodal variables
= (4) 432' 433, 434) (8)
gives for the case t(z) = 0,
843 T K43=643 T R (9)
in which
K = the stiffness matrix in which
k1 =
f L (Ni' GJ JVJ + Ni" EC Ni") dz (10)
and
R = the load vector
= (TI ,BI , T2,B2 )T (11)
T1, T2 = torque at ends 1 and 2
= (GJ43 - EC 43") = 0, L (12)
N1(z) = - [(1 - coshkL)(l +coshkL) - sinhkL(kz -
sinhkz) + kLsinhkL] inwhich
N2(z) = [(kLcoshkL — sinhkL)(l - coshkL) tkL
±(kLsinhkL + 1 — coshkL) sinhkz + (1 - coshkL)kz] (4)
GJ kL _ K1 - L kL-2
10
and
B1 , B2 = bimoment at ends 1 and 2
=ECW 4' Z .. O.L (13)
Performing the integration in Eq. 10 gives the symmetric stiff-ness matrix
K1 '2 —K1 K2
J( 3 A2 K4 K = - K1 —K2
Symmetric K3
where
K1 = GJ DL kL
sinhkL
GJ K2 = - (1 - coshkL) Tt
GJL K3 = (coshkL - sinhkL/kL)
K4 = GJL -h- ( sinhkL/kL - 1)
This is the exact stiffness matrix for the torsional and biro-tational degrees of freedom. However, if it is used as shown, numerical difficulties may arise. At small kL values, both the numerator and denominator in Eq. 15 approach zero and the accuracy becomes poor. At large kL, accuracy is also lost; and at very large kL (greater than about 100, depending on the computer), evaluation of the hyperbolic functions causes over-flow or underfiow. To overcome the problems, the expressions for K1 through K4 were replaced at extreme kL values by others based on their series expansions or on neglect of small terms.
For small kL:
(kL) 2r 1 = 1Dt
'
1)! (l - -) ,= 2 (2r—
K GJ = -ii: kL sinhkL
:i.j
GJ ., (kL)2'
2r!
K3 GJL (kL)2 r
D,,i(2r— 1)!(2r+1)
GJL (kL)2 K4 = ( 2r+l)!
(16)
And for large kL:
= GJ kL —2
K3 = GJL
K4 = GJL - (17) kL(kL - 2)
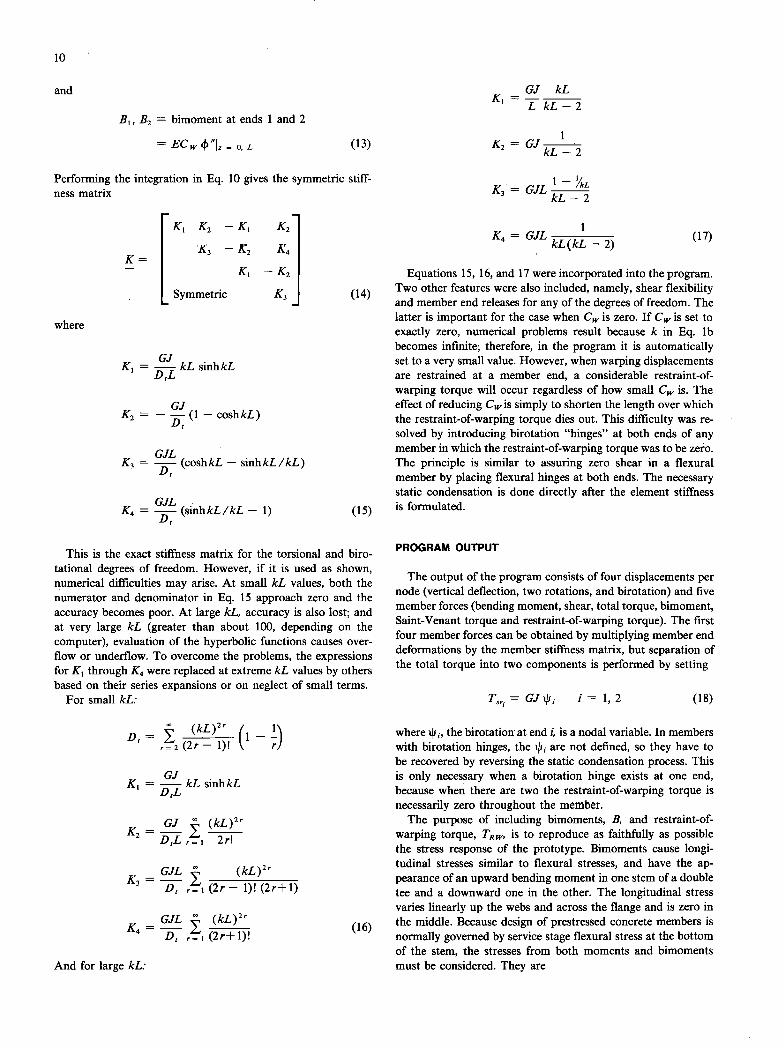
Equations 15, 16, and 17 were incorporated into the program. Two other features were also included, namely, shear flexibility and member end releases for any of the degrees of freedom. The latter is important for the case when Cw is zero. If C is set to exactly zero, numerical problems result because k in Eq. lb becomes infinite; therefore, in the program it is automatically set to a very small value. However, when warping displacements are restrained at a member end, a considerable restraint-of-warping torque will occur regardless of how small Cw is. The effect of reducing Cw is simply to shorten the length over which the restraint-of-warping torque dies out. This difficulty was re-solved by introducing birotation "hinges" at both ends of any member in which the restraint-of-warping torque was to be zero. The principle is similar to assuring zero shear in a flexural member by placing flexural hinges at both ends. The necessary static condensation is done directly after the element stiffness is formulated.
PROGRAM OUTPUT
The output of the program consists of four displacements per node (vertical deflection, two rotations, and birotation) and five member forces (bending moment, shear, total torque, bimoment, Saint-Venant torque and restraint-of-warping torque). The first four member forces can be obtained by multiplying member end deformations by the member stiffness matrix, but separation of the total torque into two components is performed by setting
T. = GJip, I = 1,2 (18)
where the birotation at end i, is a nodal variable. In members with birotation hinges, the qi j are not defined, so they have to be recovered by reversing the static condensation process. This is only necessary when a birotation hinge exists at one end, because when there are two the restraint-of-warping torque is necessarily zero throughout the member.
The purpose of including bimoments, B, and restraint-of-warping torque, TRW, is to reproduce as faithfully as possible the stress response of the prototype. Bimoments cause longi-tudinal stresses similar to flexural stresses, and have the ap-pearance of an upward bending moment in one stem of a double tee and a downward one in the other. The longitudinal stress varies linearly up the webs and across the flange and is zero in the middle. Because design of prestressed concrete members is normally governed by service stage flexural stress at the bottom of the stem, the stresses from both moments and bimoments must be considered. They are

11
Mc Ba (19)
I C
Where c = the warping function which has units of length, L 2 and describes the variation in bimoment stress over the cross section. It is discussed in detail in Ref. (44).
The same maximum stress would be caused by application of only an equivalent moment:
M q M+BIOJ
(20) Cc
in which I and Cw are calculated for the whole cross section. This equivalent bending moment was used in subsequent cal-
culations for determining load fractions. In the same way, restraint-of-warping torque causes shears
in the stems of multistemmed members (up on one side and down on the other). The shear in the most heavily loaded stem is
(21) ns b
so the equivalent shear on the whole member to cause the same maximum stem shear is
Vgfl,Vs V+?TRW (22)
Here: n = number of stems per member; b = effective center-to-center spacing of outer stem
= Y, (b)/(bsi ); and _ I
b 1 = center-to-center spacing of the ith pair of stems (starting with 1 at the outside). Therefore, b 1 is the distance between the two outermost stems.
In members with an odd number of stems, the center one contributes nothing to TR w and in double tees b, reduces to
b . In single-stemmed members such as bulb tees, the question does not arise because C, is taken as zero.
TRANSVERSE STIFFNESS
Cross beams were used in the analysis to simulate the struc-tural properties of the deck portion of the members. Because most of the transverse flexural rotation was expected to occur at the hinged joints between members, precise modeling of the cross-beam stiffnesses was not critical. Good results have been obtained using a finite-strip model in which the flanges are assumed to be totally rigid (3). However, their stiffnesses were chosen so that the tip deflection of the cross beam in the analysis would have the same deflection as the tip of the outstanding flange in the real structure when both were subjected to the same load. The main girders were treated as line members with properties concentrated along their axes. Thus the length of a cantilever segment of cross beam was half the member width. It was assumed that the deformation of the slab between stems would be small (and so could be neglected) compared to that
of the outstanding part. The deflection of the latter was com-puted from Timoshenko's numerical solutions (46) using Jar-amillo's approach (47) for a point load on the tip of a cantilever strip. In the real flange, loading one connection causes displace-ments at all of the others, so their degrees-of-freedom should be coupled. However, results from Ref. (46) show that the coupling is small if the spacing between connectors is at least twice the outstanding flange width, so it was ignored. The cross-beam stiffness was then chosen so that its cantilever deflection and that of the true flange would be identical under the same vertical load, as shown in Figure 4. This requires that
p (b/2)3 = 0.168 P12
3E1 Df
or (23)
El = 0.248
where D1is the flexural stiffness of the flange, I is its outstanding length and b is the width of the double tee. These cross beams were connected to those of the adjacent girder at nodes along the joints. For most of the runs flexural, torsional, and biro-tational hinges were introduced at these nodes; however, in one series they were made flexurally continuous in order to compare behavior with and without hinges. Vertical shear forces in the connectors are equal to the shear in the cross beams and so could be read directly from the output. In-plane tension .forces could not be computed by the program because the deck is represented as a 2-D grillage; however, a discussion of these forces and an estimate of their magnitude are given in Chapter Four.
The use of cross beams to simulate the effects of continuous flanges with discrete connectors is an approximation. It results in good predictions of the load carried by each girder, but it cannot represent well the continuous shear force in the grout key.
Diaphragms were introduced by replacing a cross beam by a member with appropriate properties. Flexible supports, such as elastomeric bearing pads, were simulated in one series of runs by introducing shear flexibility into the end segment of each main girder, because there was no direct provision in the pro-gram for modeling support flexibility. Girder shear deflections were modeled using the formulation of Ref. (48).
p longitudinal member
b/2 b/2 b/2 b/2
real member computer model
Figure 4. Deflection of true flange and fictitious cross beam.

LP
PROGRAM PACKAGE AND VERIFICATION
The features discussed above were used in the grillage analysis program. In addition, three other programs were written to fulfill supporting functions. The first was a preprocessor to simplify and speed input to the grillage program. It makes use of special-purpose mesh-generating schemes that take advantage of aspects of geometry common to all bridges analyzed. It works for both nonskew and skew bridges and for cross beams either perpendicular to the girders or parallel to the supports. A second program was then written to create influence surfaces for user-selected response quantities from the grillage program output. The last program takes the influence surface and applies different truck arrangements across the bridge to fmd the worst loading, then reports the results as load fractions.
The original grillage program contained both beam and plate elements, and has been in use without problems since 1967 at the University of California at Berkeley, and since 1978 at the University of Washington. Incompatibility between the plate elements and the birotation degrees of freedom which were added required that the plate elements be removed. Checks on sample beam grid structures before and after removal gave iden-tical results.
The major feature to be verified was the inclusion of the birotation degrees of freedom and restraint-of-warping torques. This was done by comparison with closed-form solutions and with experimental results. First, a single girder was simulated by a number of elements joined longitudinally, and torques were applied at different locations along the span. End conditions representing warping freedom and fixity were both used in sep-arate trials. In both cases the computer results returned the exact solution (44) for all numbers of elements tried. This was correct because the torsional stiffnesses matrix (Eq. 14) was formulated exactly. Two girders were then joined by cross beams with hinges at their midlength, thus simulating a deck made of two adjacent girders such as double tees. Loads placed at those hinges caused the structure to deflect symmetrically, so that the computed response of each member could be compared with the closed-form solution. Again, exact results were obtained in all cases.
Comparison with results from a model built of plate elements, using a program such as SAP IV, was considered. A model of a double tee, using one plate element through the depth of each web, was found to be much too coarse a mesh. Tests on smaller patches of plate elements showed that even 4 elements deep in each web could not be expected to yield accuracy even in bending better than 5 percent, and it was estimated that the cost of running one load case on one girder so constructed would con-sume a significant percentage of the whole computer budget. Furthermore, modeling a single girder would only reproduce the results already obtained in closed-form. The comparison was thus abandoned. -
A check was made instead by comparing the program's pre-dictions against experimental results (3) in which deflections, twist angles, and strains had all been measured. These enabled verifications of the program's warping features to be made. However, it should be noted that all experimental results contain some scatter and exact correspondence at each point cannot be expected. Inasmuch as the program's ability to reproduce exactly closed-form results for simple structures had already been dem-onstrated, any errors in it would have to be of such a kind as
2 1/2' 7'-9 3/4" (typical)
Figure 5. Geometry of Concrete Technology Corporation test deck
to arise only when previously unused features were used. Such errors were likely to be gross and visible, stemming from in-correct connectivity, sign errors, etc. Furthermore, since the deck used in the experiments (3) was made from 10-ft wide double tees without topping, it resembled closely the type of structure to be analyzed in the subsequent parameter study.
The deck was tested in the laboratory of Concrete Technology Corporation and its geometry is shown in Figure 5. It was instrumented with a potentiometer under each stem at midspan, strain gages above and below each stem at L/8 spacing, and with a load cell under each end of each stem. Midspan deflection profiles, strain profiles at a number of locations, and end reaction profiles were therefore available. Point loads were applied in many locations in one quadrant of the deck to provide a number of opportunities for comparing measured and predicted values. The applied loads were approximately 10 hip for locations over the stems, but they had to be restricted to 5 hip over the flanges to avoid cracking. The meaured responses were thus fairly small, with consequent implications for the accuracy with which they could be measured. The load cells were supported on elastomeric pads and there were no end diaphragms, both of which con-ditions are seldom modeled in analysis.
Four load cases, designated 3.1, 3.4, 3.5, and 3.7, each con-sisting of a single point load, were selected for comparison, and are shown in Figure 5. Structural properties used in the grillage analysis were:
A = 865 in.' Yb = 7.888 in. J = 8,612 in.4 I = 57,711 in.' b = 120 in. C,. = 54.56 X 106 in.4 E = 5,100 ksi G = 2,180 ksi
The member dimensions were checked against their nominal values and I was calculated using conventional methods. E was obtained from deflection data from the members before they were welded together. G was then derived from E assuming v = 0.17, which value was obtained from tests on companion cylinders. (The cylinders gave an E value that was only 82 percent of the value obtained from the double tees themselves, but Poisson's ratio was assumed to be the same in both for lack of better information. G is not very sensitive to it anyway.) G and C. were then checked by comparing measured values for eôcentric load with exact, closed-form predictions (44). The influence of end flexibility, provided mainly by the 3/8-in. elas-tomeric pads, was observed, increasing the midspan twist angle by about 15 percent when the load was at midspan and by the
= =
- - - - - -
I
-
13
0
same absolute amount but a larger percentage when the load was elsewhere. The theoretically derived J and C. values ap-peared to fit the data well when the end flexibility was allowed for.
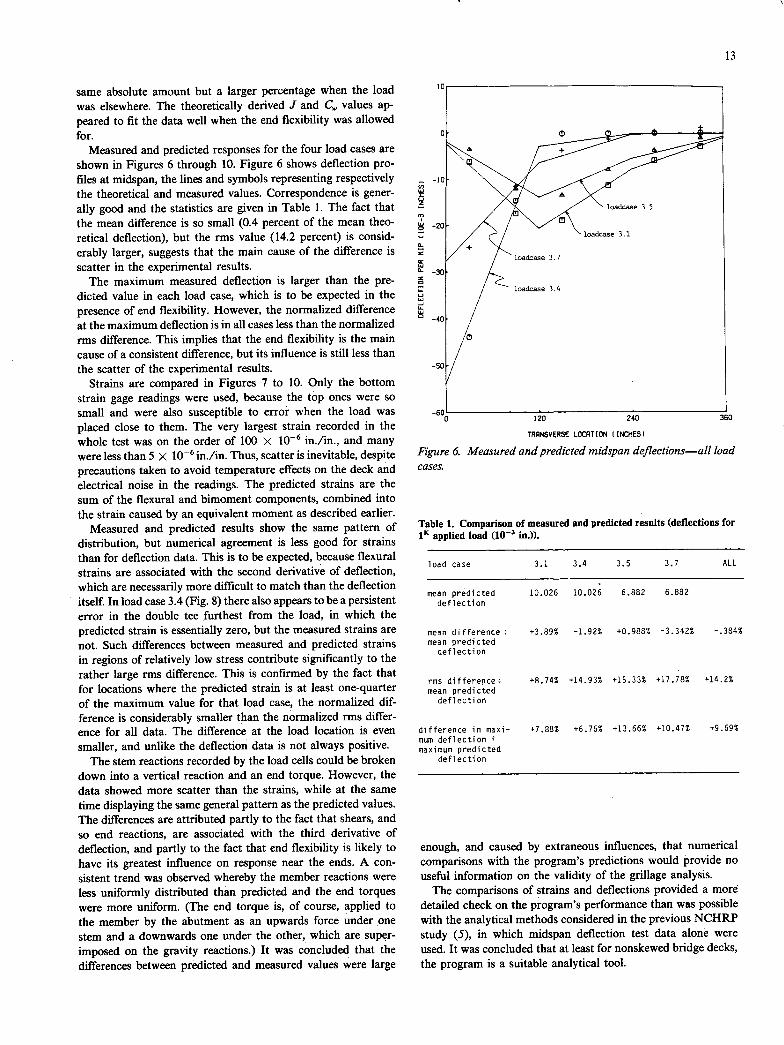
Measured and predicted responses for the four load cases are shown in Figures 6 through 10. Figure 6 shows deflection pro-files at midspan, the lines and symbols representing respectively the theoretical and measured values. Correspondence is gener-ally good and the statistics are given in Table 1. The fact that the mean difference is so small (0.4 percent of the mean theo-retical deflection), but the rms value (14.2 percent) is consid-erably larger, suggests that the main cause of the difference is scatter in the experimental results.
The maximum measured deflection is larger than the pre-dicted value in each load case, which is to be expected in the presence of end flexibility. However, the normalized difference at the maximum deflection is in all cases less than the normalized rms difference. This implies that the end flexibility is the main cause of a consistent difference, but its influence is still less than the scatter of the experimental results.
Strains are compared in Figures 7 to 10. Only the bottom strain gage readings were used, because the top ones were so small and were also susceptible to error when the load was placed close to them. The very largest strain recorded in the whole test was on the order of 100 x 10_6 in./in., and many were less than 5 X 10_6 in./in. Thus, scatter is inevitable, despite precautions taken to avoid temperature effects on the deck and electrical noise in the readings. The predicted strains are the sum of the flexural and bimoment components, combined into the strain caused by an equivalent moment as described earlier.
Measured and predicted results show the same pattern of distribution, but numerical agreement is less good for strains than for deflection data. This is to be expected, because flexural strains are associated with the second derivative of deflection, which are necessarily more difficult to match than the deflection itself. In load case 3.4 (Fig. 8) there also appears to be a persistent error in the double tee furthest from the load, in which the predicted strain is essentially zero, but the measured strains are not. Such differences between measured and predicted strains in regions of relatively low stress contribute significantly to the rather large rms difference. This is confirmed by the fact that for locations where the predicted strain is at least one-quarter of the maximum value for that load case, the normalized dif-ference is considerably smaller than the normalized rms differ-ence for all data. The difference at the load location is even smaller, and unlike the deflection data is not always positive.
The stem reactions recorded by the load cells could be broken down into a vertical reaction and an end torque. However, the data showed more scatter than the strains, while at the same time displaying the same general pattern as the predicted values. The differences are attributed partly to the fact that shears, and so end reactions, are associated with the third derivative of deflection, and partly to the fact that end flexibility is likely to have its greatest influence on response near the ends. A con-sistent trend was observed whereby the member reactions were less uniformly distributed than predicted and the end torques were more uniform. (The end torque is, of course, applied to the member by the abutment as an upwards force under one stem and a downwards one under the other, which are super-imposed on the gravity reactions.) It was concluded that the differences between predicted and measured values were large
io 1
0
\ /
-IC
N loadcase 3.5
-20 loadcase 3.1.
+ loadcase 3.7
-30
loadcase 3.4
-40
/0
50/
-60 120 240 3E
TRRNSVERSC LOCATION ( INCHES)
Figure 6. Measured and predicted midspan deflections—all load cases.
Table 1. Comparison of measured and predicted results (deflections for 1' applied load (10 - in.)).
load case 3.1 3.4 3.5 3.7 ALL
mean predicted 10.026 10.026 6.882 6.882
deflection
mean difference 1- +3.89% -1.92% +0.988% -3.342% -.384%
mean predicted deflection
rms difference- +8.74% +14.93% +15.33% +17.78% +14.2%
mean predicted deflection
difference in maxi- +7.88% +6.75% +13.56% +10.47% +9.69%
mum deflection maximum predicted
deflection
enough, and caused by extraneous influences, that numerical comparisons with the program's predictions would provide no useful information on the validity of the grillage analysis.
The comparisons of strains and deflections provided a more detailed check on the program's performance than was possible with the analytical methods considered in the previous NCHRP study (5), in which midspan deflection test data alone were used. It was concluded that at least for nonskewed bridge decks, the program is a suitable analytical tool.

L od 11.
cL 120 240 360
TRANSVERSE LOCATION (INCHES)
Figure Z Measured and predicted strains—load case 3.1. Figure & Measured and predicted strains—load case 3.4.
0
14
z z
120 240 360
TRANSVERSE LOCATION (INCHES)
Figure 9. Measured and predicted strains—load case 3.5.
0 3L 47 47
20
25 0 120 7411
TRANSVERSE LOCATION (INCHES)
Figure 10. Measured and predicted strains—load case 3.7.
Performance on skew multibeam decks was appraised by com-paring the programs predictions with Buckle's (25) analytical results. The latter did not include the effects of restraint-of-warping torque, so that feature could not be tested under skew conditions. No experimental data were known to be available which both contain skew and warping and are sufficiently re-liable to act as a yardstick. However, if the program gave good results in nonskewed structures, there was no reason to believe that it should do otherwise in skewed ones. In one respect, comparing results against those of another program rather than experimental data is an advantage, because it is possible to
compare like-with-like by entering the same conditions for both analyses. For example, the torsional connectivity between the end diaphragm and the precast girder in a field structure could be less than perfect, and this would influence the measured results by an unknown amount. It would then be difficult to know whether differences were caused by fundamental errors in the analytical method or because the wrong structural prop-erties were being used in the analysis, albeit unwittingly.
Comparisons with Buckle's results for the special case of zero skew are shown in Figures 11 and 12. In each figure the five different lines represent different modeling and assumptions in
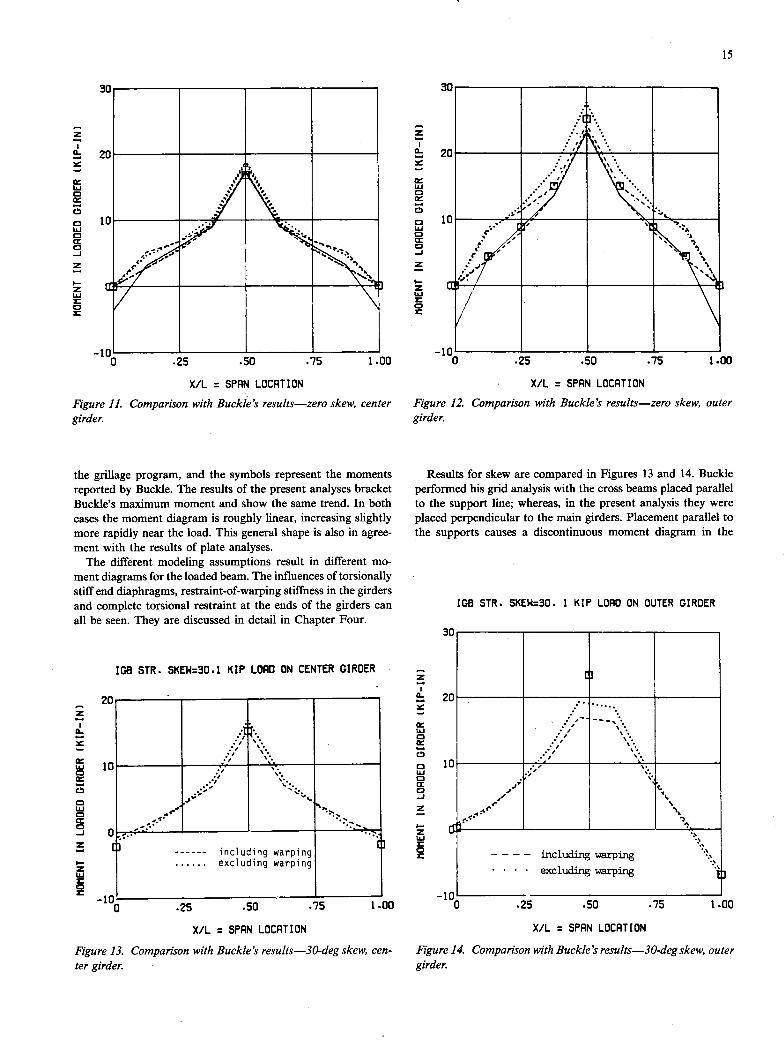
30
z 20
15
—10 0 .25 .50 .75 1.00
X/L = SPAN LOCATION
Figure 12. Comparison with Buckle's results—zero skew, outer girder.
z 20
30
F
-10 O .25 .50 .75 1.00
X/L = SPAN LOCATION
Figure 14. Comparison with Buckle's results-30-deg skew, outer girder.
z 20
3C
..••, '.•.
.1
;
e I.
- - - - including warping excluding warping
20 z
.25 .50 .75 1.00
X/L = SPAN LOCATION
Figure 11. Comparison with Buckle's results—zero skew, center girder.
the grillage program, and the symbols represent the moments reported by Buckle. The results of the present analyses bracket Buckle's maximum moment and show the same trend. In both cases the moment diagram is roughly linear, increasing slightly more rapidly near the load. This general shape is also in agree-ment with the results of plate analyses.
The different modeling assumptions result in different mo-ment diagrams for the loaded beam. The influences of torsionally stiff end diaphragms, restraint-of-warping stiffness in the girders and complete torsional restraint at the ends of the girders can all be seen. They are discussed in detail in Chapter Four.
106 SIR. SKEH=30.1 KIP LORD ON CENTER GIRDER
.1
-F ..•,
including warping excluding warping
.25 .50 .75 1.00
X/L = SPAN LOCATION
Figure 13. Comparison with Buckle's results-30-deg skew, cen-ter girder.
Results for skew are compared in Figures 13 and 14. Buckle performed his grid analysis with the cross beams placed parallel to the support line; whereas, in the present analysis they were placed perpendicular to the main girders. Placement parallel to the supports causes a discontinuous moment diagram in the
108 STR. SKEW=30. 1 KIP LOAD ON OUTER GIRDER
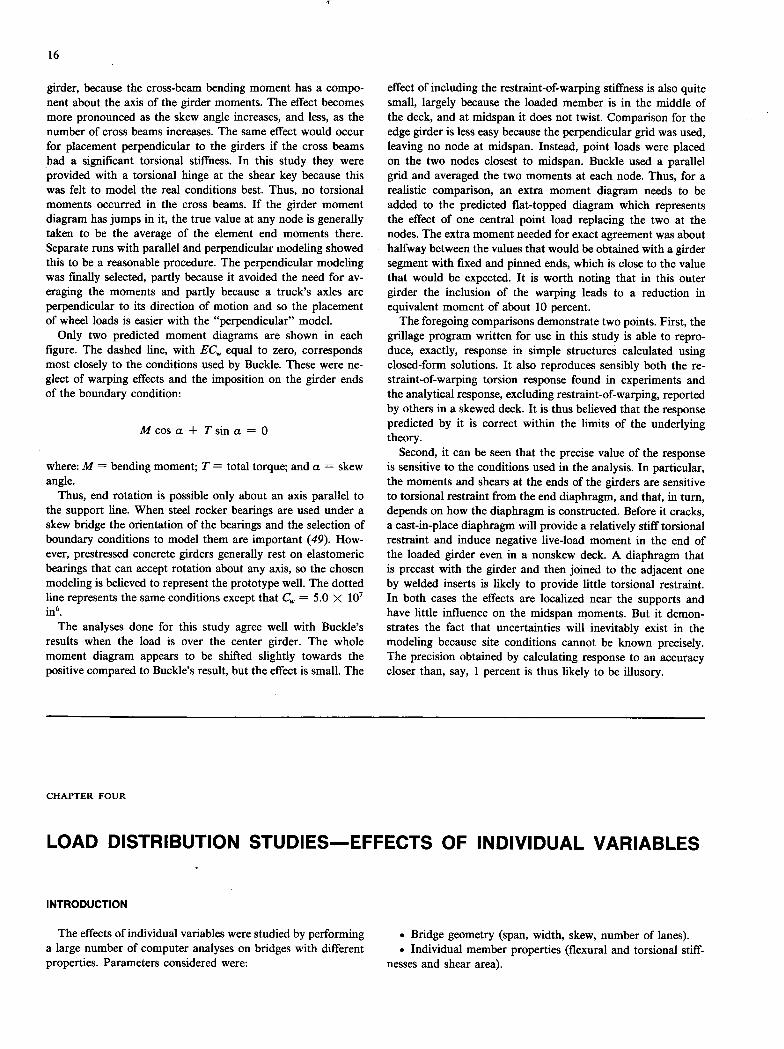
16
girder, because the cross-beam bending moment has a compo-nent about the axis of the girder moments. The effect becomes more pronounced as the skew angle increases, and less, as the number of cross beams increases. The same effect would occur for placement perpendicular to the girders if the cross beams had a significant torsional stiffness. In this study they were provided with a torsional hinge at the shear key because this was felt to model the real conditions best. Thus, no torsional moments occurred in the cross beams. If the girder moment diagram has jumps in it, the true value at any node is generally taken to be the average of the element end moments there. Separate runs with parallel and perpendicular modeling showed this to be a reasonable procedure. The perpendicular modeling was finally selected, partly because it avoided the need for av-eraging the moments and partly because a truck's axles are perpendicular to its direction of motion and so the placement of wheel loads is easier with the "perpendicular" model.
Only two predicted moment diagrams are shown in each figure. The dashed line, with EC,,., equal to zero, corresponds most closely to the conditions used by Buckle. These were ne-glect of warping effects and the imposition on the girder ends of the boundary condition:
Mcosa + Tsina = 0
where: M = bending moment; T = total torque; and a = skew angle.
Thus, end rotation is possible only about an axis parallel to the support line. When steel rocker bearings are used under a skew bridge the orientation of the bearings and the selection of boundary conditions to model them are important (49). How-ever, prestressed concrete girders generally rest on elastomeric bearings that can accept rotation about any axis, so the chosen modeling is believed to represent the prototype well. The dotted line represents the same conditions except that C. = 5.0 X 10 in6.
The analyses done for this study agree well with Buckle's results when the load is over the center girder. The whole moment diagram appears to be shifted slightly towards the positive compared to Buckle's result, but the effect is small. The
effect of including the restraint-of-warping stiffness is also quite small, largely because the loaded member is in the middle of the deck, and at midspan it does not twist. Comparison for the edge girder is less easy because the perpendicular grid was used, leaving no node at midspan. Instead, point loads were placed on the two nodes closest to midspan. Buckle used a parallel grid and averaged the two moments at each node. Thus, for a realistic comparison, an extra moment diagram needs to be added to the predicted flat-topped diagram which represents the effect of one central point load replacing the two at the nodes. The extra moment needed for exact agreement was about halfway between the values that would be obtained with a girder segment with fixed and pinned ends, which is close to the value that would be expected. It is worth noting that in this outer girder the inclusion of the warping leads to a reduction in equivalent moment of about 10 percent.
The foregoing comparisons demonstrate two points. First, the grillage program written for use in this study is able to repro-duce, exactly, response in simple structures calculated using closed-form solutions. It also reproduces sensibly both the re-straint-of-warping torsion response found in experiments and the analytical response, excluding restraint-of-warping, reported by others in a skewed deck. It is thus believed that the response predicted by it is correct within the limits of the underlying theory.
Second, it can be seen that the precise value of the response is sensitive to the conditions used in the analysis. In particular, the moments and shears at the ends of the girders are sensitive to torsional restraint from the end diaphragm, and that, in turn, depends on how the diaphragm is constructed. Before it cracks, a cast-in-place diaphragm will provide a relatively stiff torsional restraint and induce negative live-load moment in the end of the loaded girder even in a nonskew deck. A diaphragm that is precast with the girder and then joined to the adjacent one by welded inserts is likely to provide little torsional restraint. In both cases the effects are localized near the supports and have little influence on the midspan moments. But it demon-strates the fact that uncertainties will inevitably exist in the modeling because site conditions cannot be known precisely. The precision obtained by calculating response to an accuracy closer than, say, 1 percent is thus likely to be illusory.
CHAPTER FOUR
LOAD DISTRIBUTION STUDIES-EFFECTS OF INDIVIDUAL VARIABLES
INTRODUCTION
The effects of individual variables were studied by performing . Bridge geometry (span, width, skew, number of lanes). a large number of computer analyses on bridges with different • Individual member properties (flexural and torsional stiff- properties. Parameters considered were: nesses and shear area).

17
Individual girder width. Modeling of hinged joints between girders. Truck arrangement (number of trucks, edge distance). Inclusion of warping. Diaphragms. Skew. Response location. Response type (moment, shear, connector force, etc.).
The effects of these parameters are discussed in the following. Most results are presented in terms of D, the length parameter used in the AASHTO specifications to define wheel load frac-tions for girder design:
Load fraction = -
where S is the girder spacing. Unless otherwise noted, the load fraction is calculated for midspan bending moment because that condition generally controls the girder design. The equivalent bending moment, comprised of the flexural moment itself and the flexural equivalent of the bimoment, was calculated for each stem, and the higher value was taken. D was calculated from that value, so that the load fraction could be calculated in the conventional manner.
BRIDGE GEOMETRY AND MEMBER PROPERTIES
The bridge half-width to span ratio, W/2L, and the ratio of flexural to torsional stiffness are two of the most important variables. They are considered here for the case of zero skew.
Many researchers have used Massonnet's two variables:
- D + + D1 + D2 a
- 2(DD,)°
W D'°° 25
to characterize the behavior of bridges with monolithic decks. Here:
D,, D,,, = torsional stiffness per unit width and length; D1, D2 = flexural coupling rigidities (moments induced in
one direction by curvature in the other); D, D = flexural stiffness per unit width and length; and
W, L = width and length of bridge.
Multibeam decks have often been modeled as being monolithic but having no transverse stiffness, so Dy = 0. Then, 0 and a both become infinite, but the ratio 0/,jEi remains finite. It, or a multiple of it, is generally used as the single characterizing parameter for multibeam bridges. Because this study was per-formed using a grillage analysis without diagonal elements, D1 and .D2 were both necessarily zero. This is also in keeping with the assumption that D, is zero. The combined stiffnesses were taken as
D,,, + D, = GJ/S (25)
= El/S (26)
where: GJ = torsional stiffness of one girder; EI,= flexural stiffness of one girder; and S = girder spacing.
Then o = w fri (27)
A parameter 4) was defined as
4)=_ fV-!l
(28) 2L
which is simply a constant multiple of oi-.J, and was used as the characterizing parameter. Figures 15 to 26 show D for midspan moment plotted against 4) for various conditions. The success with which 4) works as a characterizing parameter can be judged from these figures.
Span lengths to be considered ranged from about 20 ft to 120 ft. The results of previous research appeared to suggest that response is a roughly logarithmic function of 4), so four span lengths (16, 32, 64, and 128 ft) were chosen which covered the range of interest and lay in a simple geometric progression. Inspection of the properties of typically used channels, double tees, quad tees, and bulb tees showed that in all cases -,/17i lay between 1.25 and 5.0. Three values (1.25, 2.50, and 5.0) were chosen for use in the analysis, because they covered the necessary range and would allow analysis of a number of different bridges with exactly the same 4) value. (For example, for a given W, L = 64 ft and IJ17i = 2.5, and L = 32 ft and Ji7i = 1.25—both give 4) = W/25.6. However, the restraint-of-warping tor-sion stiffness might be different for each case.) If the response for the two bridges with the same 4) is the same, then 4) can be considered a reasonable parameter for calculating response. At 128-ft span, the value /Li = 1.25 was omitted as being unrealistic.
In each of Figures 15 through 26, results for five different truck arrangements are shown for each structure, namely, three eccentric load cases (EO0, E18, E36) representing curb widths of 0, 18 in., and 36 in. and two central load cases (CC1 and CC2). The one giving the lowest D controls the design if all girders are to be identical. The eccentric load cases were formed by placing one 12-ft traffic lane up against the curb, and then as many more 12-ft lanes as would fit on the bridge. One 10-ft load lane with a truck in the middle of it was placed as ec-centrically as possible within the edge lane, and the response was computed. A second was then placed in the next traffic lane, and the response was recomputed. The procedure was repeated until all traffic lanes were filled and the worst case was recorded. All three eccentric load cases are shown schematically in Figure 27. It was drawn for 8-ft wide double tees with an 18-in, curb, and so represents load case E18 to scale. For the other two load cases, the positions of the trucks relative to the curb face would be the same, but they would be shifted to the left or right to allow for the smaller or larger curb. The central load case (CC1) is shown in Figure 28. One truck was placed in the very middle of the bridge, with an assumed lane sym-metrical about it. Other 10-ft load lanes were then added in pairs on either side of the truck placed at the inner edges of the 12-ft traffic lanes in order to find the worst response. Load-case CC2 (Fig. 29) was similar except that initially two trucks were placed symmetrically about the bridge centerline.
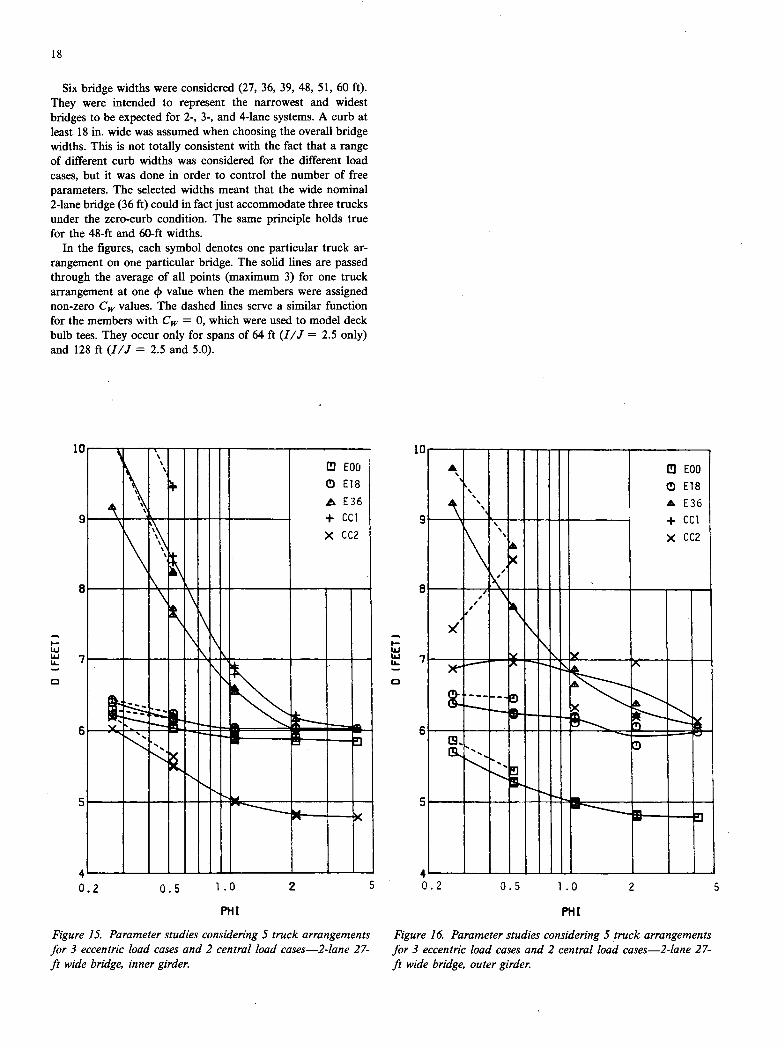
4 - 0.2 0.5 1.0 2 5
PHI
Figure 16. Parameter studies considering 5 truck arrangements for 3 eccentric load cases and 2 central load cases-2-lane 27-ft wide bridge, outer girder.
'C
C
S
NO
0E18 A E36
+cc1
\\ " XCC2
'-I
—23
18
Six bridge widths were considered (27, 36, 39, 48, 51, 60 ft). They were intended to represent the narrowest and widest bridges to be expected for 2-, 3-, and 4-lane systems. A curb at least 18 in. wide was assumed when choosing the overall bridge widths. This is not totally consistent with the fact that a range of different curb widths was considered for the different load cases, but it was done in order to control the number of free parameters. The selected widths meant that the wide nominal 2-lane bridge (36 ft) could in fact just accommodate three trucks under the zero-curb condition. The same principle holds true for the 48-ft and 60-ft widths.
In the figures, each symbol denotes one particular truck ar-rangement on one particular bridge. The solid lines are passed through the average of all points (maximum 3) for one truck arrangement at one 4 value when the members were assigned non-zero C values. The dashed lines serve a similar function for the members with C = 0, which were used to model deck bulb tees. They occur only for spans of 64 ft (I/J = 2.5 only) and 128 ft (I/J = 2.5 and 5.0).
11111111 1 iiI!iIII____ I
IIiiHii II M!I!iI1I_III
IlIllIllill
10
C
E
C
4 0.2 0.5 1.0 2 5
PH I
Figure 15. Parameter studies considering 5 truck arrangements for 3 eccentric load cases and 2 central load cases-2-lane 27-ft wide bridge, inner girder.

4 0.2 0.5 1.0 2 5
PHI
Figure 17. Parameter studies considering 5 truck arrangements for 3 eccentric load cases and 2 central load cases-2-1ane 36-ft wide bridge, inner girder.
11
C
€
mi __IIIIIIIl
111111 III
__IIiHhi!I! 1111111 liii
1111111 :1'
"III 1111111 liii
iIIhi!iiiiI 1111111 iiii1
PHI
Figure 18. Parameter studies considering 5 truck arrangements for 3 eccentric load cases and 2 central load cases-2-1ane 36-ft wide bridge, outer girder.
'C
6
I- Lu Lu U-
D
S
4 0.3 0.5 1 2 5 7

PH I
Figure 19. Parameter studies considering 5 truck arrangements for 3 eccentric load cases and 2 central load cases-3-1ane 39-ft wide bridge, inner girder.
'C
4 0.3 0.5 1.0 2 5 7
5
6
!pIilII hniii!iII
hIIIni liii IlIlIllUlilil
: EOO
1111111
1111111 III
__IIIliii!IIiih 1111111 liii
10
€
4 0.2 0.5 1.0 2 5
PHI
Figure 20. Parameter studies considering 5 truck crrangements for 3 eccentric load cases and 2 central load cases-3-1ane 39-ft wide bridge, outer girder.
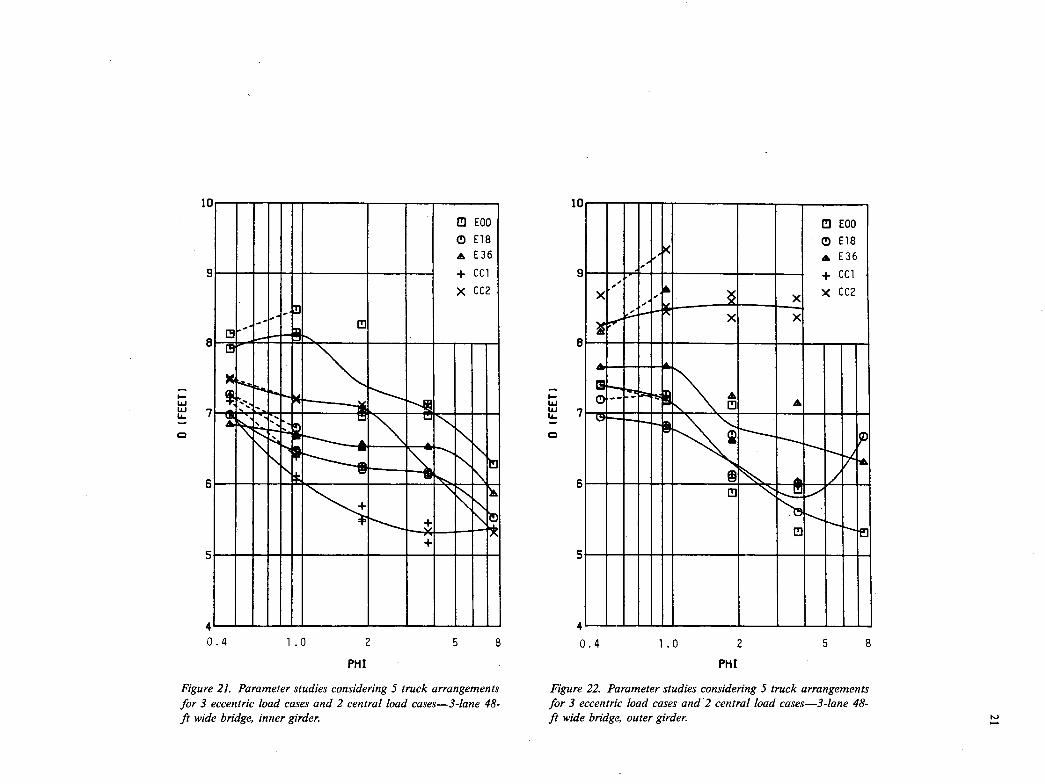
I-LU LU U-
4
0.4 1.0 2 5 8
PHI
Figure 22. Parameter studies considering 5 truck arrangements for 3 eccentric load cases and 2 central load cases-3 -lane 48-ft wide bridge, outer girder.
10
5
6
C
:
i
uuuI! Ii
11111 ___ 111111 11111 11111
I- LU LU
10
6
5
6
C 11111 11111 UI
piIIi.uuIIII IIIIII!flhi 111111 11111 4 0.4 1.0 2 5 8
PHI
Figure 21. Parameter studies considering 5 truck arrangements for 3 eccentric load cases and 2 central load cases-3-1ane 48-ft wide bridge, inner girder.
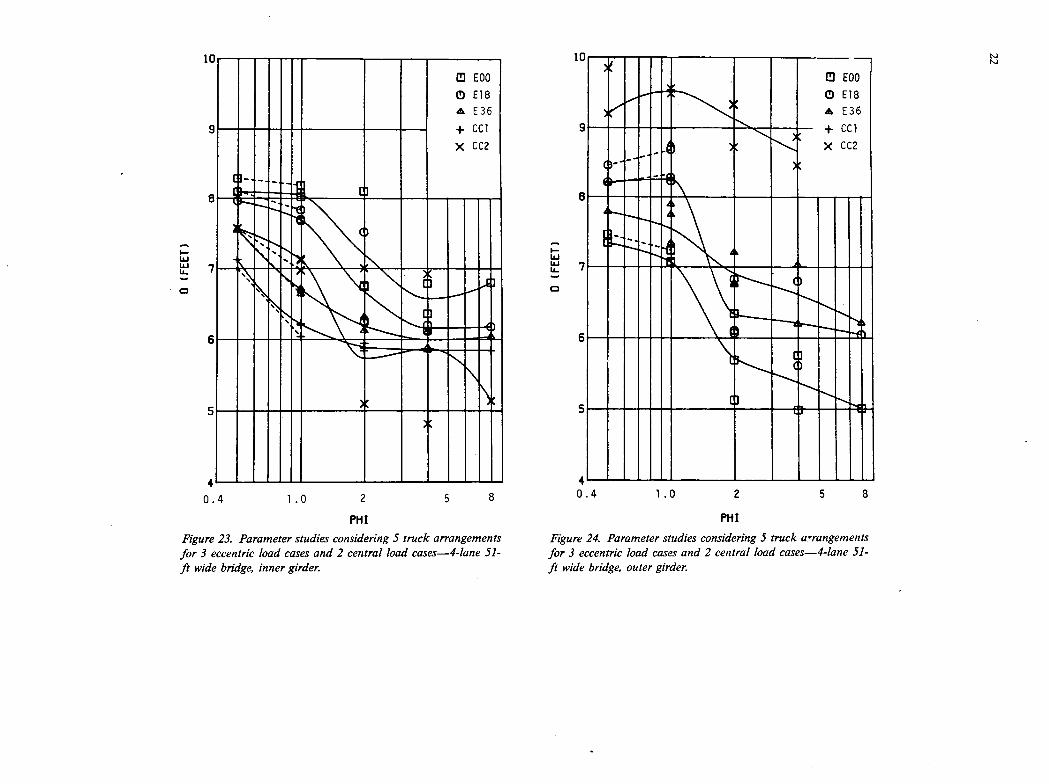
11111 __ I lIAR ii I i11hIlIIIII 111111 -. iliHA 111111 111111 0.4 1.0 2 5 8
FM I
Figure 23. Parameter studies considering 5 truck arrangements for 3 eccentric load cases and 2 central load cases-4-1ane 51-ft wide bridge, inner girder.
E00
0 E18
E36
9 -I.. CO
X CC2
I- LU LU
6
5
41111111 I I I I I I
0.4 1.0 2 5 8
PH I
Figure 24. Parameter studies considering 5 truck arangements for 3 eccentric load cases and 2 central load cases-4-lane 51-ft wide bridge, outer girder.

4 0.5 1.0 2 5 10
PHI
Figure 25. Parameter studies considering 5 truck arrangements for 3 eccentric load cases and 2 central load cases-4-lane 60-ft wide bridge, inner girder.
IC
5
E
EOO 11111 i_ill
lIIIiiii!i II
11111__'iIHhIi! 11111 11111 1111111
8
I-Ui Lu U-
I
1111111_II nhllil IIIIIiIiP'l 11111 '[ullilik 11111 III hiP 11111 1111111 4 --- I
0.5 1.0 2 5 10
PHI
Figure 26. Parameter studies considering 5 truck arrangements for 3 eccentric load cases and 2 central load cases-4-lane 60-ft wide bridge, outer girder.
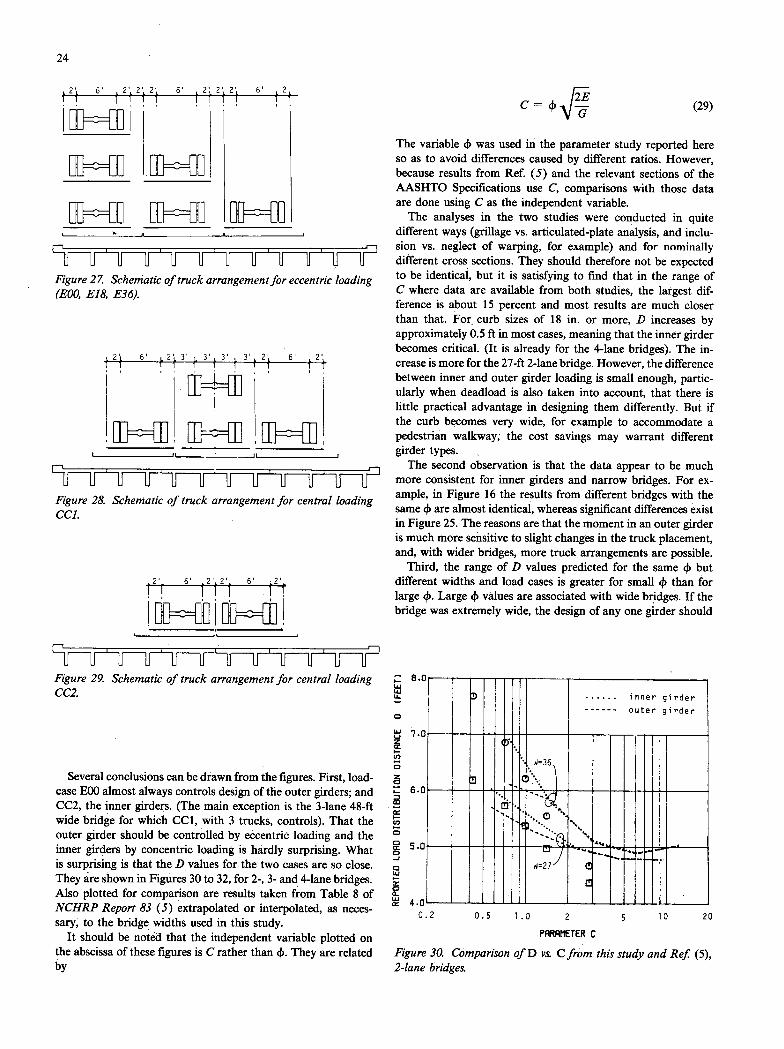
24
2 6' 2 2 2 6' 2 2 2 6 2
H
Figure 27. Schematic of truck arrangement for eccentric loading (EOO, E18, E36).
L 3' 3' 3 2 6 , 2'
Figure 28. Schematic of truck arrangement for central loading ccl.
121 6' 122 6
c=4V (29)
The variable 4> was used in the parameter study reported here so as to avoid differences caused by different ratios. However, because results from Ref. (5) and the relevant sections of the AASHTO Specifications use C, comparisons with those data are done using C as the independent variable.
The analyses in the two studies were conducted in quite different ways (grillage vs. articulated-plate analysis, and inclu-sion vs. neglect of warping, for example) and for nominally different cross sections. They should therefore not be expected to be identical, but it is satisfying to find that in the range of C where data are available from both studies, the largest dif-ference is about 15 percent and most results are much closer than that. For, curb sizes of 18 in. or more, D increases by approximately 0.5 ft in most cases, meaning that the inner girder becomes critical. (It is already for the 4-lane bridges). The in-crease is more for the 27-ft 2-lane bridge. However, the difference between inner and outer girder loading is small enough, partic-ularly when deadload is also taken into account, that there is little practical advantage in designing them differently. But if the curb becomes very wide, for example to accommodate a pedestrian walkway, the cost savings may warrant different girder types.
The second observation is that the data appear to be much more consistent for inner girders and narrow bridges. For ex-ample, in Figure 16 the results from different bridges with the same 4) are almost identical, whereas significant differences exist in Figure 25. The reasons are that the moment in an outer girder is much more sensitive to slight changes in the truck placement, and, with wider bridges, more truck arrangements are possible.
Third, the range of D values predicted for the same 4) but different widths and load cases is greater for small (P than for large 4). Large 4) values are associated with wide bridges. If the bridge was extremely wide, the design of any one girder should
Figure 29. Schematic of truck arrangement for central loading CC2
Several conclusions can be drawn from the figures. First, load-case E00 almost always controls design of the outer girders; and CC2, the inner girders. (The main exception is the 3-lane 48-ft wide bridge for which CC1, with 3 trucks, controls). That the outer girder should be controlled by eccentric loading and the inner girders by concentric loading is hardly surprising. What is surprising is that the D values for the two cases are so close. They are shown in Figures 30 to 32, for 2-, 3- and 4-lane bridges. Also plotted for comparison are results taken from Table 8 of NCHRP Report 83 (5) extrapolated or interpolated, as neces-sary, to the bridge widths used in this study.
It should be noted that the independent variable plotted on the abscissa of these figures is C rather than 4). They are related by
) inner girder
outer girder
0.2 0.5 1.3 2 5 10 20
PRRRfIEIER C
Figure 30. Comparison of D vs. C from this study and Ref (5), 2-lane bridges.
Ui 8.0
uJ L&.
C
uj 7.0 z cc - U, C z C
S.0
cm
U, -- C
C C
C
at
-J
C In
- I1 4.0
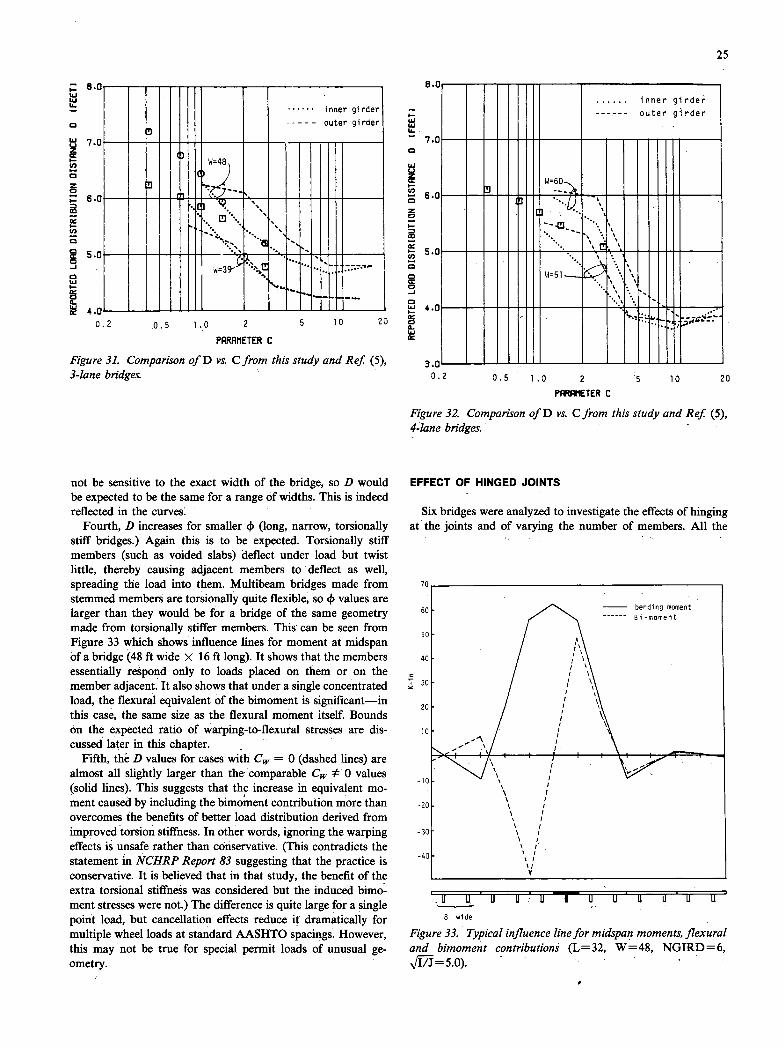
8.0
- 7.0 a
'U
25
inner girder
outer girder
W=48
Eu'
pri
0.2 0.5 1.0 2 5 10 20
PARPM€TER C
Figure 31. Comparison of D vs. C from this study and Ref (5), 3-1ane bridges.
inner girde
- outer girder
W=51—._ — :...-
\\ .
-
0.2 0.5 1.0 2 5 10 20
PR1TER C
Figure 32 Comparison of D vs. C from this study and Ref (5), 4-1ane bridges.
not be sensitive to the exact width of the bridge, so D would be expected to be the same for a range of widths. This is indeed reflected in the curves:
Fourth, .D increases for smaller 4) (long, narrow, torsionally stiff bridges.) Again this is to be expected. Torsionally stiff members (such as voided slabs) deflect under load but twist little, thereby causing adjacent members to - deflect as well, spreading the load into them. Multibeam bridges made from stemmed members are torsionally quite flexible, so 4) values are larger than they would be for a bridge of the same geometry made from torsionally stiffer members. This can be seen from Figure 33 which shows influence lines for moment at midspan of a bridge (48 ft wide x 16 ft long). It shows that the members essentially respond only to loads placed on them or on the member adjacent. It also shows that under a single concentrated load, the flexural equivalent of the bimoment is significant—in this case, the same size as the flexural moment itself. Bounds on the expected ratio of warping-to-flexural stresses are dis-cussed later in this chapter.
Fifth, the 1) values for cases with C = 0 (dashed lines) are almost all slightly larger than the comparable C * 0 values (solid lines). This suggests that the increase in equivalent mo-ment caused by including the bimoment contribution more than overcomes the benefits of better load distribution derived from improved torsion stiffness. In other words, ignoring the warping effects is unsafe rather than cOnservative. (This contradicts the statement in NCHRP Report 83 suggesting that the practice is conservative. It is believed that in that study, the benefit of the extra torsional stiffness was considered but the induced bimo-ment stresses were not.) The difference is quite large for a single point load, but cancellation effects reduce it dramatically for multiple wheel loads at standard AASHTO spacings. However, this may not be true for special permit loads of unusual ge-ometry.
EFFECT OF HINGED JOINTS
Six bridges were analyzed to investigate the effects of hinging at the joints and of varying the number of members. All the
50
40
30
10
10
20
30
--jL___L• U uiilu u-u uu U
8 wide
Figure 33. Typical influence line for midspan moments, flexural and bimoment contributions (L 32, W = 48, NGIRD = 6, -ji7=5.o). -.
11
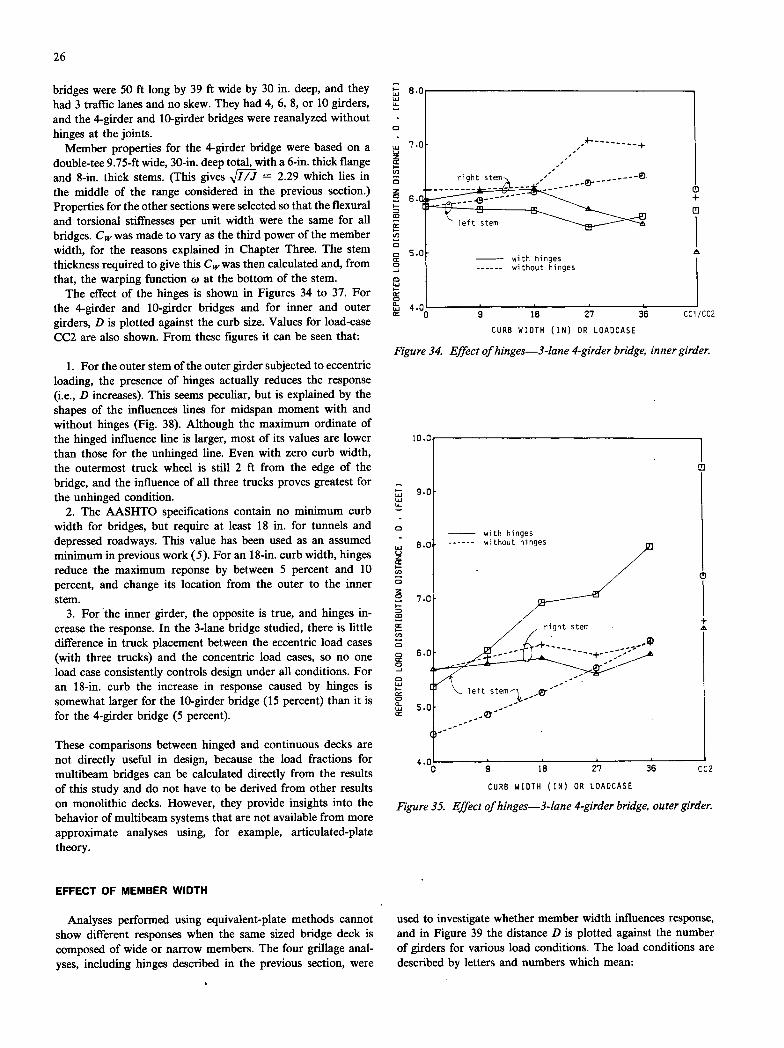
UJ Lu 55.
left stem
.0
with hinges
without hinges
r
18 27 36 Ccl /CC2
CURB WIDTH (IN) OR LOADCASE
Figure 34. Effect of hinges-3 -lane 4-girder bridge, inner girder.
26
bridges were 50 ft long by 39 ft wide by 30 in. deep, and they had 3 traffic lanes and no skew. They had 4, 6, 8, or 10 girders, and the 4-girder and 10-girder bridges were reanalyzed without hinges at the joints.
Member properties for the 4-girder bridge were based on a double-tee 9.75-ft wide, 30-in, deep total, with a 6-in, thick flange and 8-in, thick stems. (This gives Ji7i = 2.29 which lies in the middle of the range considered in the previous section.) Properties for the other sections were selected so that the flexural and torsional stiffnesses per unit width were the same for all bridges. C was made to vary as the third power of the member width, for the reasons explained in Chapter Three. The stem thickness required to give this Cw was then calculated and, from that, the warping function 0) at the bottom of the stem.
The effect of the hinges is shown in Figures 34 to 37. For the 4-girder and 10-girder bridges and for inner and outer girders, D is plotted against the curb size. Values for load-case CC2 are also shown. From these figures it can be seen that:
For the outer stem of the outer girder subjected to eccentric loading, the presence of hinges actually reduces the response (i.e., D increases). This seems peculiar, but is explained by the shapes of the influences lines for midspan moment with and without hinges (Fig. 38). Although the maximum ordinate of the hinged influence line is larger, most of its values are lower than those for the unhinged line. Even with zero curb width, the outermost truck wheel is still 2 ft from the edge of the bridge, and the influence of all three trucks proves greatest for the unhinged condition.
The AASHTO specifications contain no minimum curb width for bridges, but require at least 18 in. for tunnels and depressed roadways. This value has been used as an assumed minimum in previous work (5). For an 18-in, curb width, hinges reduce the maximum reponse by between 5 percent and 10 percent, and change its location from the outer to the inner stem.
For the inner girder, the opposite is true, and hinges in-crease the response. In the 3-lane bridge studied, there is little difference in truck placement between the eccentric load cases (with three trucks) and the concentric load cases, so no one load case consistently controls design under all conditions. For an 18-in, curb the increase in response caused by hinges is somewhat larger for the 10-girder bridge (15 percent) than it is for the 4-girder bridge (5 percent).
These comparisons between hinged and continuous decks are not directly useful in design, because the load fractions for multibeam bridges can be calculated directly from the results of this study and do not have to be derived from other results on monolithic decks. However, they provide insights into the behavior of multibeam systems that are not available from more approximate analyses using, for example, articulated-plate theory.
EFFECT OF MEMBER WIDTH
Analyses performed using equivalent-plate methods cannot show different responses when the same sized bridge deck is composed of wide or narrow members. The four grillage anal-yses, including hinges described in the previous section, were
9.0 55.1 U-
C with hinges
8.0 without hinges
7.0
right stem
6.0
left stem
5.0
4 .0 0 9 18 27 36 CC2
CURB WIDTH (IN) OR IOADCASE
Figure 35. Effect of hinges-3 -lane 4-girder bridge, outer girder.
used to investigate whether member width influences response, and in Figure 39 the distance D is plotted against the number of girders for various load conditions. The load conditions are described by letters and numbers which mean:
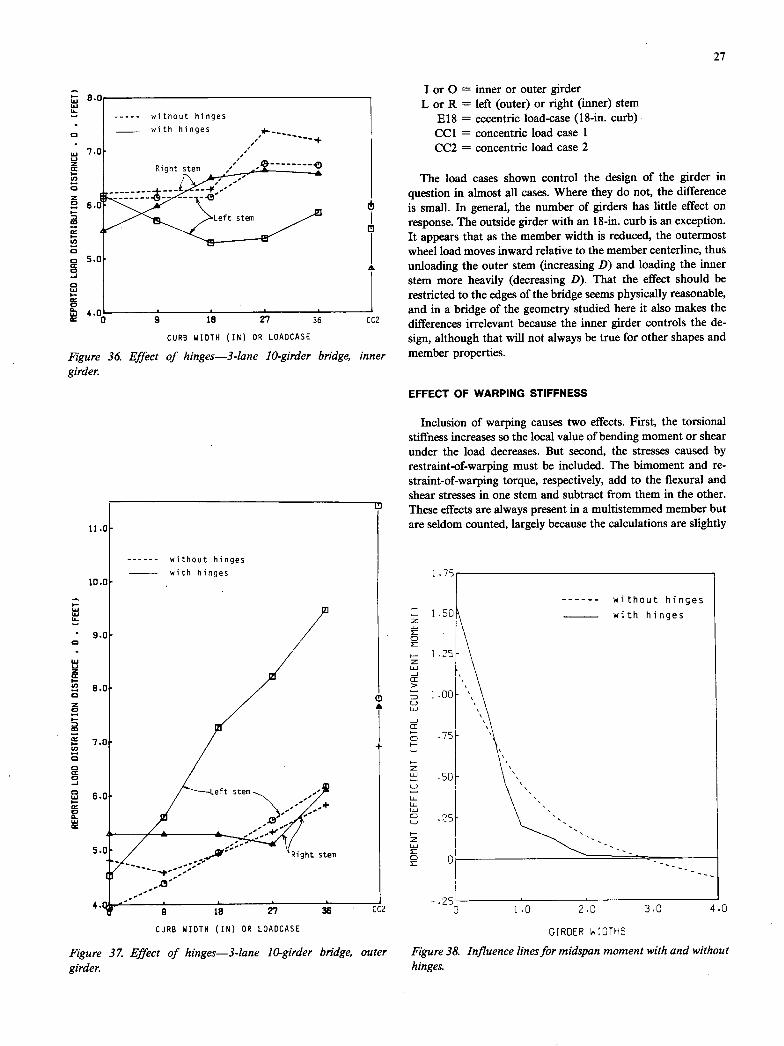
II
9
8
7
6
S
4
10 1.75
1.50 z
Cr
LU _J
1.00
LU
CD .75 C-
C-
.50 U)
LU LU LU CD
F- z LU
CD Of
0
27
CURS WIDTH (IN) OR LOADCASE
Figure 36. Effect of hinges-3-lane 10-girder bridge, inner girder.
-
CJRB WIDTH (IN) OR LOADCASE
Figure 37. Effect of hinges-3 -lane 10-girder bridge, outer girder.
I or 0 = inner or outer girder L or R = left (outer) or right (inner) stem
E18 = eccentric load-case (18-in, curb) CC1 = concentric load case 1 CC2 = concentric load case 2
The load cases shown control the design of the girder in question in almost all cases. Where they do not, the difference is small. In general, the number of girders has little effect on response. The outside girder with an 18-in, curb is an exception. It appears that as the member width is reduced, the outermost wheel load moves inward relative to the member centerline, thus unloading the outer stem (increasing D) and loading the inner stem more heavily (decreasing D). That the effect should be restricted to the edges of the bridge seems physically reasonable, and in a bridge of the geometry studied here it also makes the differences irrelevant because the inner girder controls the de-sign, although that will not always be true for other shapes and member properties.
EFFECT OF WARPING STIFFNESS
Inclusion of warping causes two effects. First, the torsional stiffness increases so the local value of bending moment or shear under the load decreases. But second, the stresses caused by restraint-of-warping must be included. The bimoment and re-straint-of-warping torque, respectively, add to the flexural and shear stresses in one stem and subtract from them in the other. These effects are always present in a multistemmed member but are seldom counted, largely because the calculations are slightly
without hinges
with hinges
1.0 2.0 3.0 4.0
-
GIROER W10THS
Figure 38. Influence lines for midspan moment with and without hinges.
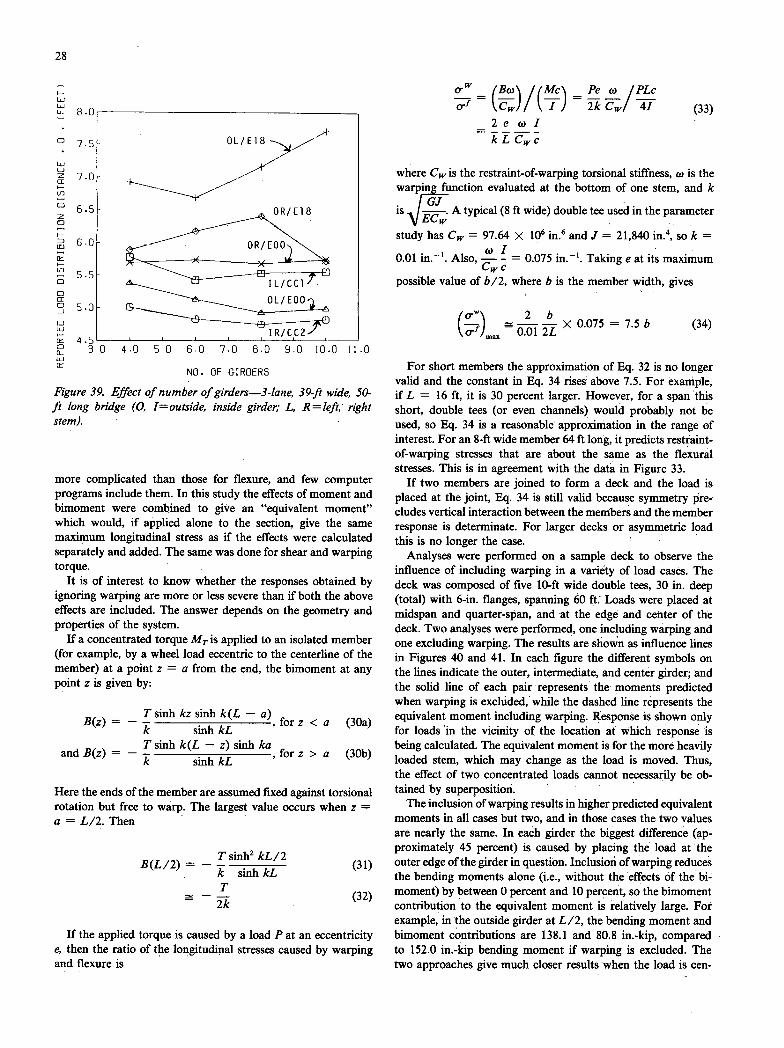
28
I-
8.0
u-i
CE 7.0
(I) 8 6.5 z 0
6.0
I- ii 5.5 D D Cr CD 5.0
0 u-i
4.5 0 a-uJ
0 LE8-
OR/El 8
OREO0 N
L ICC
OL/E00
IR/CC2-1 4.0 5.0 6.0 7.0 8.0 9.0 10.0 11.0
Crw - (Bø\ /(Mc\ - Fe w IPLc
c)/ .. i) 2k c 41 (33) 2eøI k L C, c
where Cw is the restraint-of-warping torsional stiffness, 0 is the warpin function evaluated at the bottom of one stem, and k
isVj~C~' A typical (8 ft wide) double tee used in the parameter
study has C, = 97.64 x 106 in.' and J = 21,840 in.", so k =
0.01 in.'. Also, -- = cw C
0.075 in. Taking e at its maximum
possible value of b/2, where b is the member width, gives
CL o:oi x 0.075 = 7.5 b (34)
NO. OF GIRDERS
Figure 39. Effect of number of girders-3 -lane, 39-ft wide, 50-ft long bridge (0, 1—outside, inside girder; L, R = left, right stem).
more complicated than those for flexure, and few computer programs include them. In this study the effects of moment and bimoment were combined to give an "equivalent moment" which would, if applied alone to the section, give the same maximum longitudinal stress as if the effects were calculated separately and added. The same was done for shear and warping torque.
It is of interest to know whether the responses obtained by ignoring warping are more or less severe than if both the above effects are included. The answer depends on the geometry and properties of the system.
If a concentrated torque MT is applied to an isolated member (for example, by a wheel load eccentric to the centerline of the member) at a point z = a from the end, the bimoment at any point z is given by:
T sinh kz sinh k(L -
a) forz <a (30a)
B(z)— sinhkL
T sinh k(L - z) sinh ka, for z > a (30b)
and B(z) -
sinh kL
Here the ends of the member are assumed fixed against torsional rotation but free to warp. The largest value occurs when z a = L/2. Then
Tsinh2 kL/2 B(L/2) = - - (31)
k sinhkL T
(32) Yk-
If the applied torque is caused by a load P at an eccentricity e, then the ratio of the longitudinal stresses caused by warping and flexure is
For short members the approximation of Eq. 32 is no longer valid and the constant in Eq. 34 rises above 7.5. For example, if L = 16 ft, it is 30 percent larger. However, for a span this short, double tees (or even channels) would probably not be used, so Eq. 34 is a reasonable approximation in the range of interest. For an 8-ft wide member 64 ft long, it predicts restraint-of-warping stresses that are about the same as the flexural stresses. This is in agreement with the data in Figure 33.
If two members are joined to form a deck and the load is placed at the joint, Eq. 34 is still valid because symmetry pre-cludes vertical interaction between the members and the member response is determinate. For larger decks or asymmetric load this is no longer the case.
Analyses were performed on a sample deck to observe the influence of including warping in a variety of load cases. The deck was composed of five 10-ft wide double tees, 30 in. deep (total) with 6-in, flanges, spanning 60 ft: Loads were placed at midspan and quarter-span, and at the edge and center of the deck. Two analyses were performed, one including warping and one excluding warping. The results are shown as influence lines in Figures 40 and 41. In each figure the different symbols on the lines indicate the outer, intermediate, and center girder; and the solid line of each pair represents the moments predicted when warping is excluded, while the dashed line represents the equivalent moment including warping. Response is shown only for loads in the vicinity of the location at which response is being calculated. The equivalent moment is for the more heavily loaded stem, which may change as the load is moved. Thus, the effect of two concentrated loads cannot necessarily be ob-tained by superposition.
The inclusion of warping results in higher predicted equivalent moments in all cases but two, and in those cases the two values are nearly the same. In each girder the biggest difference (ap-proximately 45 percent) is caused by placing the load at the outer edge of the girder in questiOn. Inclusion of warping reduces the bending moments alone (i.e., without the effects of the bi moment) by between 0 percent and 10 percent, so the bimoment contribution to the equivalent moment is relatively large. For example, in the outside girder at L/2, the bending moment and bimoment contributions are 138.1 and 80.8 in.-kip, compared to 152.0 in.-kip bending moment if warping is excluded. The two approaches give much closer results when the load is cen-
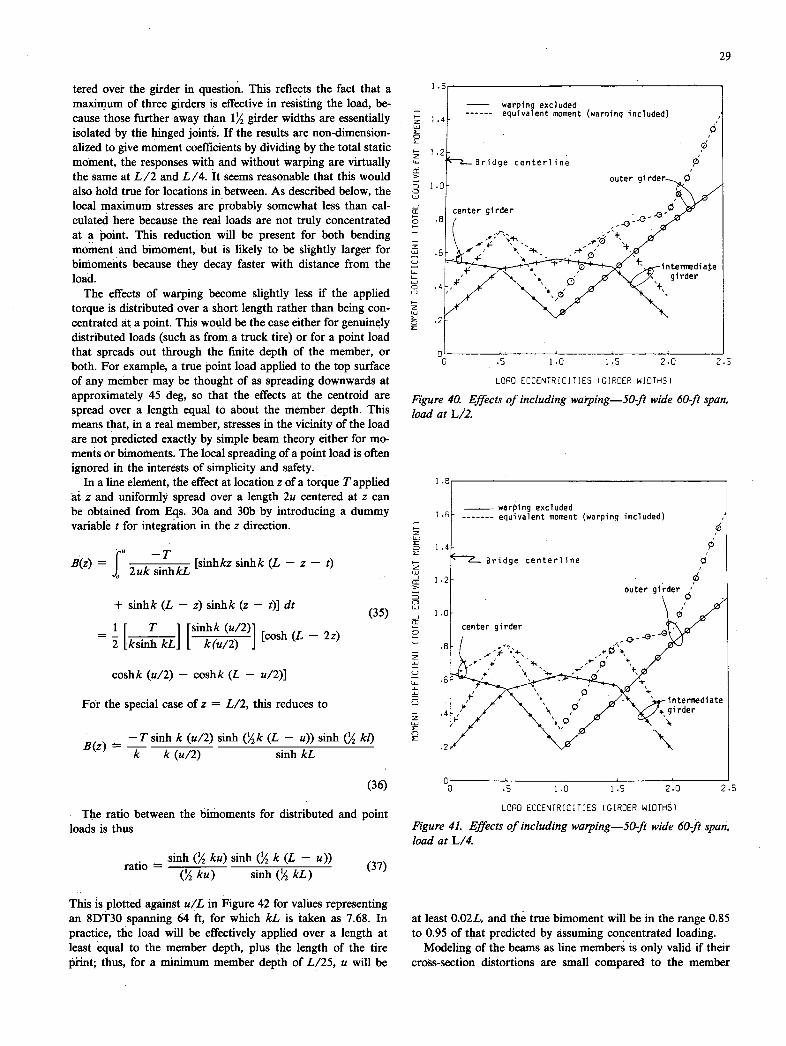
29
tered over the girder in question. This reflects the fact that a maximum of three girders is effective in resisting the load, be-cause those further away than l'/2 girder widths are essentially isolated by the hinged joint. If the results are non-dimension-alized to give moment coefficients by dividing by the total static moment, the responses with and without warping are virtually the same at L/2 and L/4. It seems reasonable that this would also hold true for locations in between. As described below, the local maximum stresses are probably somewhat less than cal-culated here because the real loads are not truly concentrated at a point. This reduction will be present for both bending moment and bimoment, but is likely to be slightly larger for bimoments because they decay faster with distance from the load.
The effects of warping become slightly less if the applied torque is distributed over a short length rather than being con-centrated at a point. This would be the case either for genuinely distributed loads (such as from a truck tire) or for a point load that spreads out through the fmite depth of the member, or both. For example, a true point load applied to the top surface of any member may be thought of as spreading downwards at approximately 45 deg, so that the effects at the centroid are spread over a length equal to about the member depth. This means that, in a real member, stresses in the vicinity of the load are not predicted exactly by simple beam theory either for mo-ments or bimoments. The local spreading of a point load is often ignored in the interests of simplicity and safety.
in a line element, the effect at location z of a torque T applied at z and uniformly spread over a length 2u centered at z can be obtained from Eqs. 30a and 30b by introducing a dummy variable t for integration in the z direction.
B(z) J
T =
[sinhkz sinhk (L - z - t) , 2uksinhkL
+ sinhk (L - z) sinhk (z - t)] dt (35)
1[ T ] [sinhk (u/2) L - 2z)
= 2 [ksinh kU ku/2) ] [cosh
coshk (u/2) - coshk (L - u/2)]
For .the special case of z = L/2, this reduces to
B(z) - T sinh k (u/2) sinh ( 2k (L - u)) sinh ('/2 kI) k k (u/2) sinh kL
(36)
The ratio between the bimoments for distributed and point loads is thus
sinh (4 ku) sinh (4 k (L - u)) ratio = (37)
('/2 ku) sinh ( kL)
This is plotted against u/L in Figure 42 for values representing an 8DT30 spanning 64 ft, for which kL is taken as 7.68. In practice, the load will be effectively applied over a length at least equal to the member depth, plus the length of the tire print; thus, for a minimum member depth of L/25, u will be
- warping excluded equivalent moment (warning included)
2 / Bridge centerline P
center girder der
intermediate girder
LORD ECCENTRICITIES (GIRDER WIOTHS(
Figure 40. Effects of including warping-50-ft wide 60-ft span, load at L/2.
warping excluded equivalent moment (warping included)
0
4 2 - Bridge centerline
2 outer girder
center girder
4- girder
0 .5 1.0 1.5 2.0 2.5
LORD ECCENTRICITIES (GIRDER WIDTHS)
Figure 41. Effects of including warping-50-ft wide 60-ft span, load at L/4.
at least 0.02L, and the true bimoment will be in the range 0.85 to 0.95 of that predicted by assuming concentrated loading.
Modeling of the beams as line members is only valid if their cross-section distortions are small compared to the member
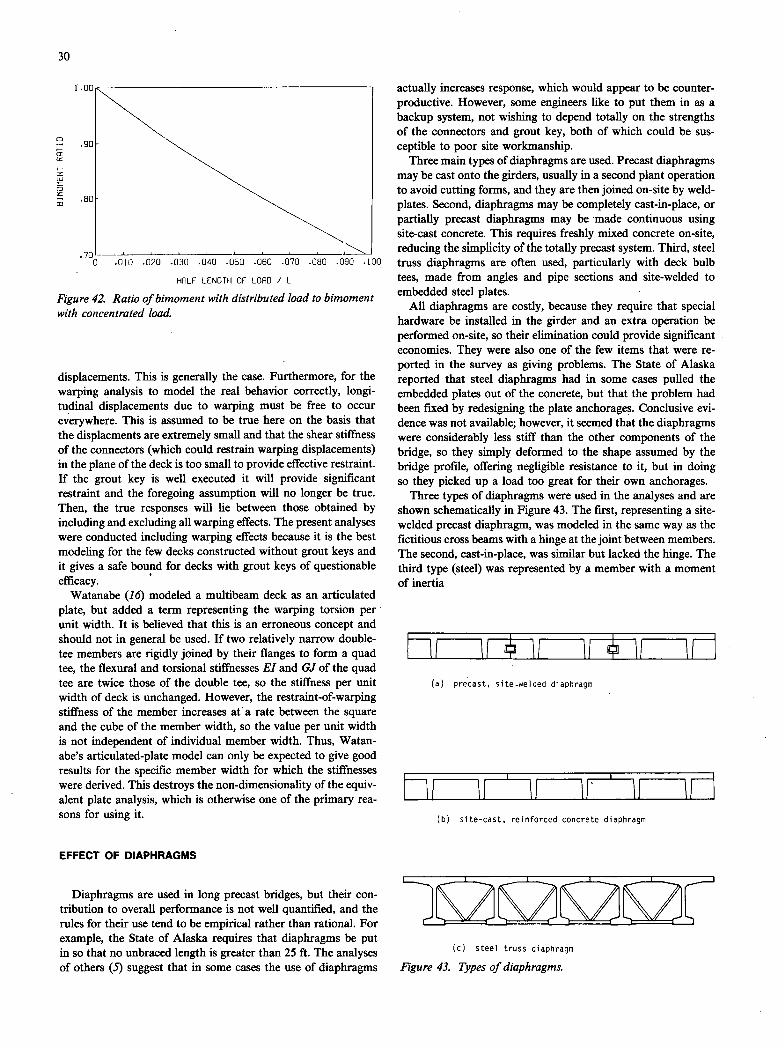
IJ
1 .130
.90 Cr
.80
70 0 .010 .020 .030 .040 .050 .060 .070 .080 .090 .100
HRLF LENGTH OF LORD / L
Figure 42 Ratio of bimoment with distributed load to bimoment with concentrated load.
displacements. This is generally the case. Furthermore, for the warping analysis to model the real behavior correctly, longi-tudinal displacements due to warping must be free to occur everywhere. This is assumed to be true here on the basis that the displacments are extremely small and that the shear stiffness of the connectors (which could restrain warping displacements) in the plane of the deck is too small to provide effective restraint. If the grout key is well executed it will provide significant restraint and the foregoing assumption will no longer be true. Then, the true responses will lie between those obtained by including and excluding all warping effects. The present analyses were conducted including warping effects because it is the best modeling for the few decks constructed without grout keys and it gives a safe bound for decks with grout keys of questionable efficacy.
Watanabe (16) modeled a multibeam deck as an articulated plate, but added a term representing the warping torsion per unit width. It is believed that this is an erroneous concept and should not in general be used. If two relatively narrow double-tee members are rigidly joined by their flanges to form a quad tee, the flexural and torsional stiffnesses El and GJ of the quad tee are twice those of the double tee, so the stiffness per unit width of deck is unchanged. However, the restraint-of-warping stiffness of the member increases at• a rate between the square and the cube of the member width, so the value per unit width is not independent of individual member width. Thus, Watan-abe's articulated-plate model can only be expected to give good results for the specific member width for which the stiffnesses were derived. This destroys the non-dimensionality of the equiv-alent plate analysis, which is otherwise one of the primary rea-sons for using it.
actually increases response, which would appear to be counter-productive. However, some engineers like to put them in as a backup system, not wishing to depend totally on the strengths of the connectors and grout key, both of which could be sus-ceptible to poor site workmanship.
Three main types of diaphragms are used. Precast diaphragms may be cast onto the girders, usually in a second plant operation to avoid cutting forms, and they are then joined on-site by weld-plates. Second, diaphragms may be completely cast-in-place, or partially precast diaphragms may be made continuous using site-cast concrete. This requires freshly mixed concrete on-site, reducing the simplicity of the totally precast system. Third, steel truss diaphragms are often used, particularly with deck bulb tees, made from angles and pipe sections and site-welded to embedded steel plates.
All diaphragms are costly, because they require that special hardware be installed in the girder and an extra operation be performed on-site, so their elimination could provide significant economies. They were also one of the few items that were re-ported in the survey as giving problems. The State of Alaska reported that steel diaphragms had in some cases pulled the embedded plates out of the concrete, but that the problem had been fixed by redesigning the plate anchorages. Conclusive evi-dence was not available; however, it seemed that the diaphragms were considerably less stiff than the other components of the bridge, so they simply deformed to the shape assumed by the bridge profile, offering negligible resistance to it, but in doing so they picked up a load too great for their own anchorages.
Three types of diaphragms were used in the analyses and are shown schematically in Figure 43. The first, representing a site-welded precast diaphragm, was modeled in the same way as the fictitious cross beams with a hinge at the joint between members. The second, cast-in-place, was similar but lacked the hinge. The third type (steel) was represented by a member with a moment of inertia
(a) precast, site-welded diaphragm
(b) site-cast, reinforced concrete diaphragm
EFFECT OF DIAPHRAGMS
Diaphragms are used in long precast bridges, but their con-tribution to overall performance is not well quantified, and the rules for their use tend to be empirical rather than rational. For example, the State of Alaska requires that diaphragms be put in so that no unbraced length is greater than 25 ft. The analyses of others (5) suggest that in some cases the use of diaphragms
(c) steel truss diaphragm
Figure 43. Types of diaphragms.

31
= Ah2 (38)
where A is the cross-sectional area of bottom chord member (3 in. x 3 in. X % in. angle minimum), and h is the center-to-center distance between the girder flange and the diaphragm bottom chord. This formulation is based on the assumption that the girder flange is infinitely stiff in transverse compression compared to the diaphragm bottom chord in tension. The mem-ber was given a relatively small shear area based on the shear stiffness of the steel truss.
Nineteen analyses were conducted with the intention of study-ing the effect on diaphragm performance of:
Bridge width. Number of lanes. Number of girders. Span length. Member properties (JLi). Diaphragm type. Number of diaphragms.
The results are shown in Figures 44 to 54, in which the D values do not contain the influence of lane load reduction factors.
Several general observations can be made. First, the hinged precast diaphragms appeared to serve no useful purpose when they were included. The largest change in midspan moment response was 1.46 percent and all the others were less than 1 percent. The analytical model neglected any couple that could be developed by tension in the weld-plates (assumed to be at middepth of the diaphragm) and compression in the flange, but such a couple would likely be small because of local flexibiities in the connections. Thus, neglecting it is unlikely to make much difference. The primary effect of such a diaphragm is to stiffen the flanges against bending, but the flange deformations are already so small compared to the rigid body displacements of the cross section that they are negligible anyway.
Second, the cast-in-place (continuous) diaphragms tended to worsen response at the edge and improve it near the centerline of the bridge. The effect is similar to that of making the hinges at the joints rigid (discussed earlier) and the reasons are the same.
The influence of the bridge width for a given number of lanes is illustrated in Figure 44 for a 3-lane bridge 64 ft long. D values for midspan moment are plotted against load case for the nar-rowest (39 ft) and the widest (48 ft) plausible 3-lane bridges, both with (solid lines) and without (dashed lines) diaphragms. For each load case the most heavily loaded stem was selected. Without diaphragms, design is controlled by the central load-cases CC1 or CC2. The introduction of a diaphragm increases D fairly dramatically at the middle of the bridge and reduces it at the edge. For a zero curb width, the eccentric load-case EO0 then controls for both widths and the girders must be stronger than if diaphragms are absent. For an 18-in, curb, the edge girder still controls in both cases, but the required strength is less for the 39 ft width and more for the 48 ft width than if no diaphragms were used. The results with diaphragms are noticeably less sensitive to precise load placement than those without. The sensitivity of the latter makes drawing of universal conclusions difficult.
The influence of the number of lanes is illustrated in Figure 45, which shows a trend similar to that of Figure 44. The
presence of a diaphragm reduces D for the eccentric load cases (outer girders) and increases it for concentric load cases (inner girders). Apart from the CC! load case with the 27-ft bridge (which contains only 1 truck), the D values for different numbers of lanes are remarkably similar, both with and without dia-phragms.
With the minimum bridge width used here and an 18-in, curb, use of a diaphragm does reduce the required strength of the girders slightly (D = 4.0 ft, controlled by load-case E18, rather than 3.8 ft, controlled by load-case CC2).
The influence of the number of girders is shown in Figure 46. It is drawn for a 3-lane, 39-ft wide by 64-ft long bridge with JLJ = 5.0. In the absence of the cast-in-place diaphragms the
value of .D is quite sensitive to the number of girders, especially
U-
no diaphragms
a 1 diaphragm
7. 0
5.
39
4.
CURS WIDTH (IN) OR LOADCASE
Figure 44. Effect of bridge width on diaphragm performance—L = 64 ft, 3 lanes, 6 girders.
no diaphragms 1 diaphragm
ft
A. 1 ft
51 ft
39 27 35 rri CC
CURS WIDTH (IN) OR LOADCASE
Figure 45. Effect of number of lanes on diaphragm perform-ance—L= 64ft minimum widths.

LU
C
LU
8 C
32
Li
- no diaphragms
1 diaphragm
C
Ng=8
cc
CURB WIDTH (IN) OR IOADCASE
Figure 46. Effect of number of girders on diaphragm perform-ance—W=39ft, 3 lanes.
for eccentric load cases. One midspan diaphragm makes D al-most independent of the number of girders. No information was obtained for the case of a diaphragm at midspan and a truck at quarter-span, but it is presumed that the results would be similar to those arising from a bridge half as long, with no diaphragm and a truck at midspan.
The influence of span is shown in Figures 47 to 49. They are drawn for a 3-lane, 39-ft wide 6-girder bridge; J7Zi was 5.0 for all spans. The 16-ft span is based on quad tees, the 32-ft and 64-ft spans on double tees, and the 128-ft span on deck bulb tees. The latter have C. = 0. As before the diaphragm benefits the concentric load cases and is a disadvantage in the eccentric load cases. In general, the greatest change occurs between 32 ft and 64 ft, although a bigger change might have been been predicted between the 64 ft and 128 ft had the longest girders included warping effects. The practice of requiring diaphragms in longer bridges can be appraised using Figures 47 to 49. For the 128-ft span, the smallest D with a diaphragm is 4.47 ft (E00) compared with 5.24 ft (CC2) without. For 16-ft and 32-ft spans, the EO0 load cases just control and give essentially the same D both with and without a diaphragm. If the E00 load case is rejected as being too extreme, the El 8 and CC2 load cases show that a diaphragm provides a benefit at 16 ft and 32 ft, makes little difference at 64 ft, and imposes a penalty at 128 ft. This suggests that present policies for providing diaphragms should be reevaluated.
The influence of member properties, represented as ,JJ?Z is shown in Figures 50 to 52. As would be expected, the torsionally stiffer bridges (lower JiZi) show higher D values under all circumstances, and they also show less change when a dia-phragm is added. When VI—IJ is 1.25, the diaphragm imposes no significant penalty under eccentric load cases, so its influence is merely neutral.
Figures 53 and 54 show how different diaphragm types affect response for L = 64 ft and 128 ft. The pattern is the same at both spans. The precast, hinged diaphragm (type 1) has no effect. The fully cast-in-place diaphragm (type 3) has the most effect, increasing the effects of eccentric loads and decreasing the effects of concentric loads. The steel diaphragm generally has an in-
no diaphragms 1 diaphragm
40! I I 11 1 11 I I I
10 50 100 150
5PN FEET)
Figure 4Z Effect of span on diaphragm performance—W=39 ft. 3 lanes, 6 girders, load-case EOO.
no diaphragms 1 diaphragm
.0
.0- — — -
.0
10 50 100 150
SPRN FEET)
Figure 48. Effect of span on diaphragm performance—W= 39 ft, 3 lanes. 6 girders, load-case E18.
termediate influence, except for the E18 load case at L = 64-ft span, where the reason for the anomolous behavior is un-known.
The last variable studied was the number of diaphragms. Two analyses were performed on a 64-ft span, one with one dia-phragm at midspan and the other with a total of three dia-phragms, placed at the quarter points and midspan. For loads

9.'
6 .1 C
4.
33
to 50 100 150
SPRN FEET)
Figure 49. Effect of span on diaphragm performance-W39
ft 3 lanes, 6 girders, load-case GC'2.
_______ no diaphragms
1 diaphragm
0.5 1.0 5.0
PRRI7METER C
Figure 51. Effect of member properties on diaphragm perform-ance-L= 64ft W =39 ft. 3 lanes, 6 girders, load-case E18.
'- 8 LU U-
U: 7 Li a: (I) UI z
UI cm UI
UI 0 5 a: UI -J UI LU cm C
8.0
8.0
no diaphragms
1 diaphragm
Li U-
UI
U: 7.0 Li z a: UI UI z
6.0 F- UI cm UI
UI o 5.0 a: UI -j UI LU cm UI 9 4.0
no diaphragms
1 diaphragm
'• .5 1.0
5.0
PRRRMETER C
Figure 50. Effect of member properties on diaphragm perform-ance-L = 64ft W39 ft. 3 lanes, 6 girders, load-cases E00.
(.5 1.0 5.0
PRRAFIETER C
Figure 52. Effect of member properties on diaphragm perform-ance-L = 64ft, W = 39ft 3 lanes, 6 girders, load-case CC2.
placed at midspan the difference in response between one and three diaphragms was less than 2 percent, so no plot was made. Results were not obtained for loads placed at the quarter points, but it is believed that a reasonable approximation could be obtained as follows. For a 128-ft bridge with loads at quarter-span and one diaphragm at midspan, the wheel load fraction could be taken as that for a 64-ft bridge with the load at midspan, i.e., the wheel load fraction from a 64-ft bridge with one internal diaphragm at midspan could be used.
EFFECT OF CURB SIZE
Article 3.24.2.1 of the AASHTO Standard Spec jflcations for Highway Bridges (11) states that, for the slab design, the center of a double wheel should be placed 1 ft from the curb face, implying the outer tire is just touching the curb. For girder design, no such ruling exists and trucks are assumed to be located in the middle of a 10-ft wide load lane (AASHTO Fig. 3.7.7.A) but that load lane may be placed anywhere within the 12-ft
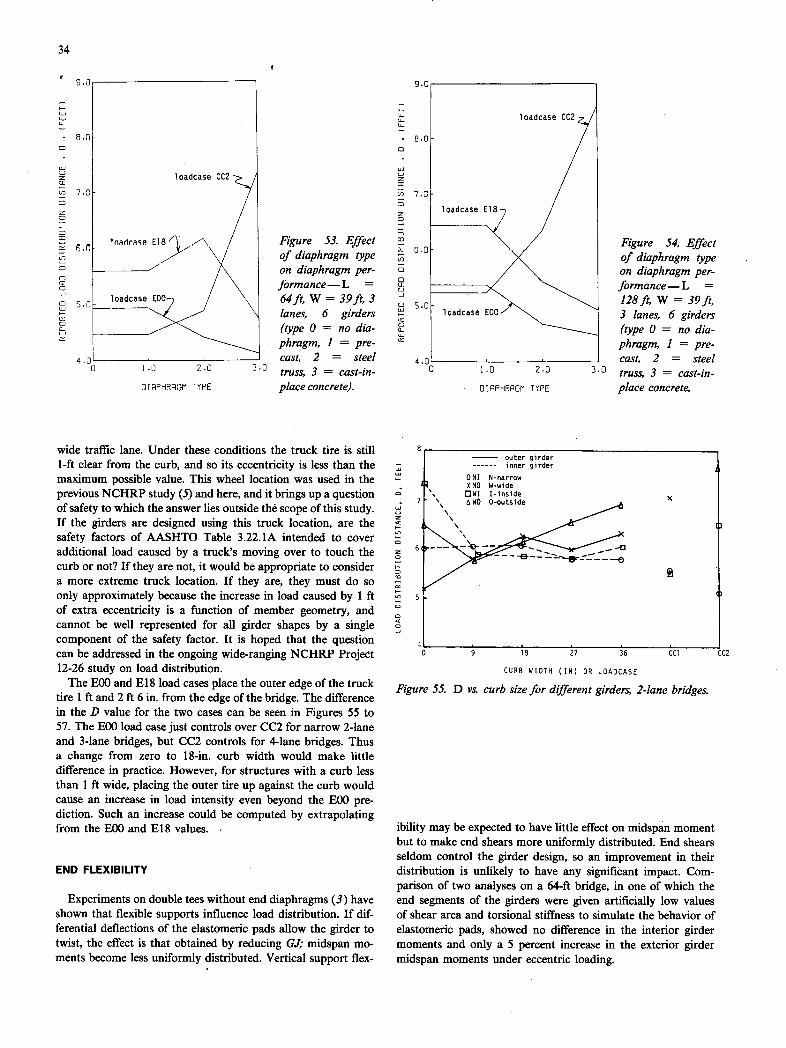
5.0 U)
LU
loadcase CC2 U)
if) 7.0
34
U) I
nartrase
U) I U)
U) I U) U) Un
loadcase
U) I
4 ,QL
0
1.0 2.0 3.0
OIflPHRPGI1 TYPE
Figure 53. Effect of diaphragm type on diaphragm per-formance—L = 64ft, W = 3 9 ft3 lanes, 6 girders (type 0 = no dia-phragm, 1 = pre-cast, 2 = steel truss, 3 = cast-in-place concrete).
9.0
LU Un
loadcase CC2
5.0 U)
loadcase E18U) /
LU Li
U)
) 7.0 U)
z C
U) U)
U 3.0 U)
U)
C U) 0
CO
-J
5.0 loadcase EOO
0 U-.
4.0- 0
1.0 2.0 3.0
0tPHRPCi'1 TYPE
Figure 54. Effect of diaphragm type on diaphragm per-formance—L = 128 ft. W = 39f4 3 lanes, 6 girders (type 0 = no dia- phragm, 1 pre- cast, 2 steel truss, 3 = cast-in-place concrete.
wide traffic lane. Under these conditions the truck tire is still 1-ft clear from the curb, and so its eccentricity is less than the maximum possible value. This wheel location was used in the previous NCHRP study (5) and here, and it brings up a question of safety to which the answer lies outside the scope of this study. If the girders are designed using this truck location, are the safety factors of AASHTO Table 3.22. 1A intended to cover additional load caused by a truck's moving over to touch the curb or not? If they are not, it would be appropriate to consider a more extreme truck location. If they are, they must do so only approximately because the increase in load caused by 1 ft of extra eccentricity is a function of member geometry, and cannot be well represented for all girder shapes by a single component of the safety factor. It is hoped that the question can be addressed in the ongoing wide-ranging NCHRP Project 12-26 study on load distribution.
The EOO and E18 load cases place the outer edge of the truck tire 1 ft and 2 ft 6 in. from the edge of the bridge. The difference in the D value for the two cases can be seen in Figures 55 to 57. The EOO load case just controls over CC2 for narrow 2-lane and 3-lane bridges, but CC2 controls for 4-lane bridges. Thus a change from zero to 18-in, curb width would make little difference in practice. However, for structures with a curb less than 1 ft wide, placing the outer tire up against the curb would cause an increase in load intensity even beyond the EOO pre-diction. Such an increase could be computed by extrapolating from the EOO and El 8 values.
END FLEXIBILITY
Experiments on double tees without end diaphragms (3) have shown that flexible supports influence load distribution. If dif-ferential deflections of the elastomeric pads allow the girder to twist, the effect is that obtained by reducing GJ; midspan mo-ments become less uniformly distributed. Vertical support flex-
outer girder inner girder
ON! N-narrow 880 W-wide OW! 1-inside
9 18 27 36 CC1 CC2
CURS WIDTh (IN) OR LOADCASE
Figure 55. D vs. curb size for djfferent girders, 2-1ane bridges.
ibility may be expected to have little effect on midspan moment but to make end shears more uniformly distributed. End shears seldom control the girder design, so an improvement in their distribution is unlikely to have any signifiôant impact. Com-parison of two analyses on a 64-ft bridge, in one of which the end segments of the girders were given artificially low values of shear area and torsional stiffness to simulate the behavior of elastomeric pads, showed no difference in the interior girder moments and only a 5 percent increase in the exterior girder midspan moments under eccentric loading.
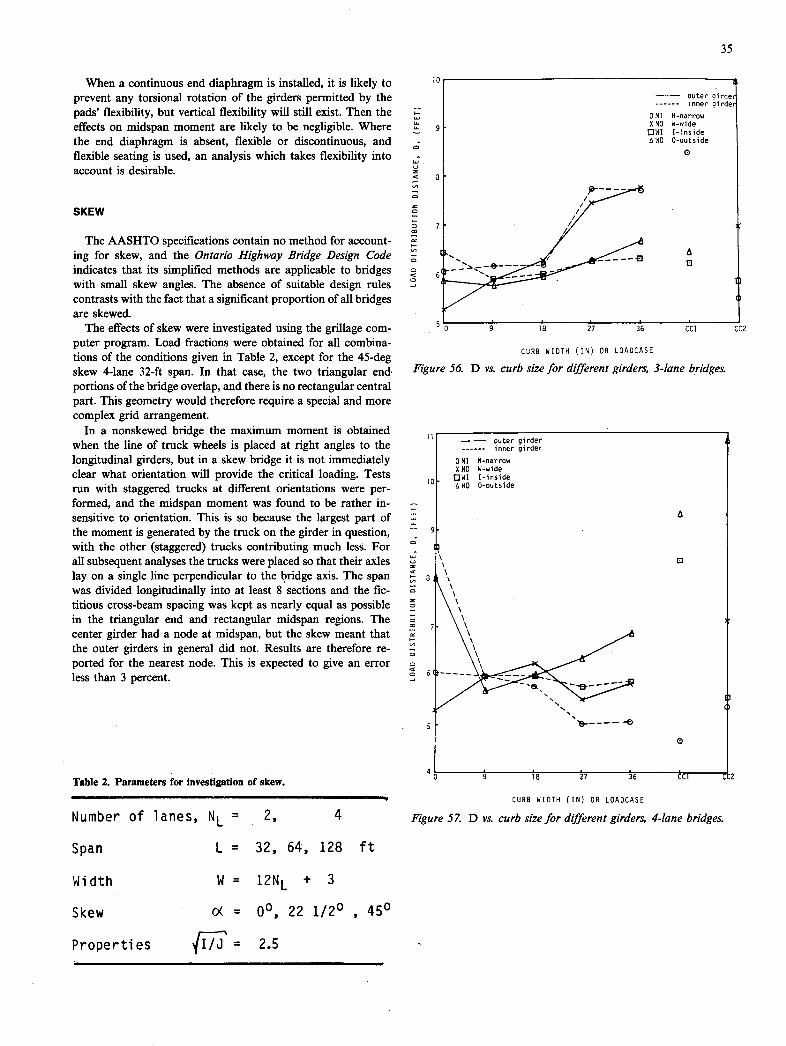
35
When a continuous end diaphragm is installed, it is likely to prevent any torsional rotation of the girders permitted by the pads' flexibility, but vertical flexibility will still exist. Then the effects on midspan moment are likely to be negligible. Where the end diaphragm is absent, flexible or discontinuous, and flexible seating is used, an analysis which takes flexibility into account is desirable.
SKEW
The AASHTO specifications contain no method for account-ing for skew, and the Ontario Highway Bridge Design Code indicates that its simplified methods are applicable to bridges with small skew angles. The absence of suitable design rules contrasts with the fact that a significant proportion of all bridges are skewed.
The effects of skew were investigated using the grillage com-puter program. Load fractions were obtained for all combina-tions of the conditions given in Table 2, except for the 45-deg skew 4-lane 32-ft span. In that case, the two triangular end portions of the bridge overlap, and there is no rectangular central part. This geometry would therefore require a special and more complex grid arrangement.
In a nonskewed bridge the maximum moment is obtained when the line of truck wheels is placed at right angles to the longitudinal girders, but in a skew bridge it is not immediately clear what orientation will provide the critical loading. Tests run with staggered trucks at different orientations were per-formed, and the midspan moment was found to be rather in-sensitive to orientation. This is so because the largest part of the moment is generated by the truck on the girder in question, with the other (staggered) trucks contributing much less. For all subsequent analyses the trucks were placed so that their axles lay on a single line perpendicular to the bridge axis. The span was divided longitudinally into at least 8 sections and the fic-titious cross-beam spacing was kept as nearly equal as possible in the triangular end and rectangular midspan regions. The center girder had a node at midspan, but the skew meant that the outer girders in general did not. Results are therefore re-ported for the nearest node. This is expected to give an error less than 3 percent.
Table 2. Parameters for investigation of skew.
Number of lanes, NL = 2, 4
Span L = 32, 64, 128 ft
Width W = 12N + 3
Skew c( = 00, 22 1/20 , 450
'C
outer qirde inner qirde
DM1 N-narrow 000 H-wide
WI I-inside AWO 0-outside
(17
CC
CURB WIDTH (IN) OR LOADCASE
Figure 56. D vs. curb size for different girders, 3-1ane bridges.
outer girder inner girder
ONI N-narrow XNO W-wide
UWI 1-inside UWO D-outside
Al
El
C1 L
CURB WIDTH (IN) OR LOADCASE
Figure 57. D vs. curb size for different girders, 4-1ane bridges.
Properties = 2.5
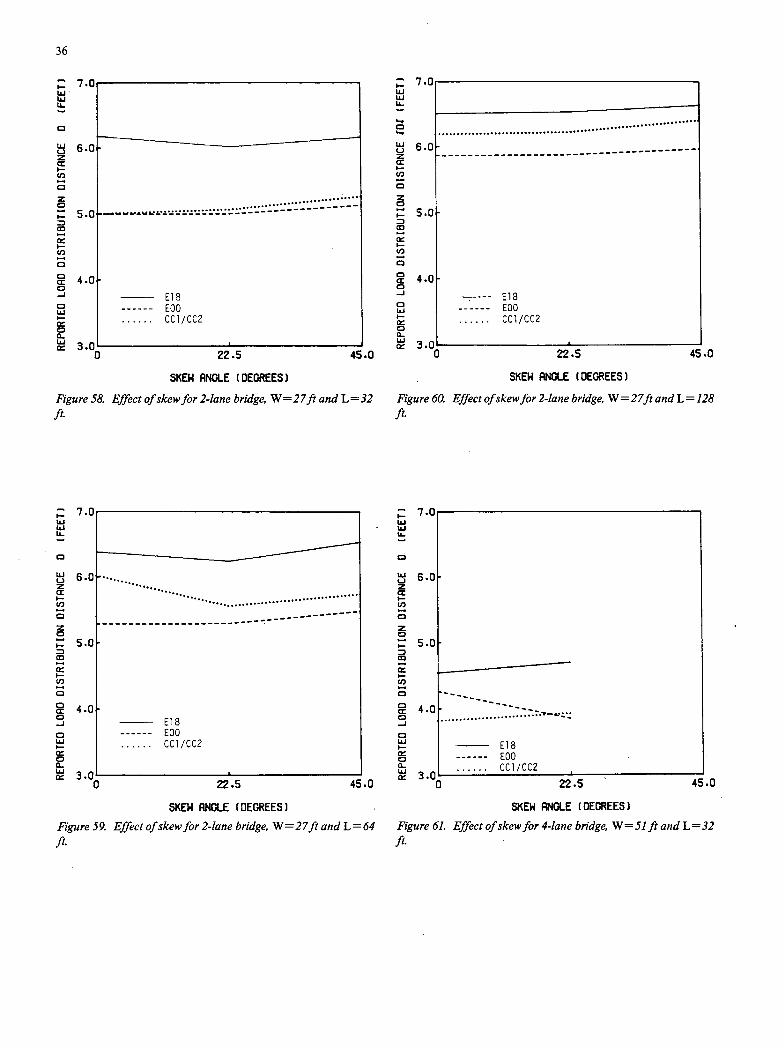
36
7. LU LU LL-
LU (.4 z Cr - U, a z a
5. a
I-U, a a cc 4. Co -4
a LU C- a a. LU 3.
7.0 LU LU LI-
a
uUJ 6.0 z Cr - a z a
5.0 a
I-
a a 4.0 -J a LU ac- C a- LU
E13 - EOO
CC1/CC2
1[ ... ............................................................
E18 EOO CC1/CC2
- - 22.5 45.0
SKEW ANGLE (DEGREES)
Figure 58. Effect of skew for 2-lane bridge, W27ft and L32 ft
- - 0 22.5 45.0
SKEW ANGLE (DEGREES)
Figure 60. Effect ofskew for 2-lane bridge, W27ft and L= 128 ft
LU LU U-
z Cr - C,, a z a
CC U, a a a -4
a LU
at-a a..
rn
1.......i.
E18 EOO CC1/CC2
7.0 LU LU U-
a
Uj 6.0 z cc - U, a z a
5.0 a I— U, a a a -4
a LU C- - a a.
El 8 EOO CC1/CC2
22.5 45.0 '0 22.5 45.0
SKEW ANGLE (DEGREES) SKEW ANGLE (DEGREES)
Figure 59. Effect of skew for 2-lane bridge, W=27ft and L = 64 Figure 61. Effect of skew for 4-lane bridge, W= 51ft and L =32 ft. ft

37
PC 7. Lu Lu
Lu Lu
a
6. Lu U z cc — U, a z 0 I—cc
I— U,
a a cc
a Lu
Cr— 0 a- LU
S.
Lu U z cc - U,
z 0
cc Cr - U, 0
a 0 —J
a Lu I- 0 0 Lu
450 22.5 22.5 45.0
SKEW ANGIE (DEGREES)
Figure 62. Effect of skew for 4-1ane bridge, W= 51ft and L = 64 ft.
SKEW ANGLE (DEGREES)
Figure 63. Effect of skew for 4-1ane bridge, W51ft and L = 128
ft
The variation with skew angle of the midspan moment load fraction is shown in Figures 58 to 63 for the different geometries. The figures show that the variation is very small and that the presence of skew reduces the midspan moment. Jones and Boaz (39) used a different method of analysis and obtained a similar result for the particular bridge they investigated. They found that a 45-deg skew reduced the midspan moment by between 5 percent and 10 percent, depending on the torsional stiffness used. For -JiZi = 2.5 as used here, their results predict ap-proximately 7 percent reduction in moment.
Common practice today is to ignore skew when calculating midspan moments. The results shown here corroborate that approach when the skew is less than or equal to 45 deg and the two triangular end regions of the bridge do not meet.
SHEAR
The AASHTO Specifications (11) state that design for shear may be conducted using the same load fraction as is used for bending moments. However, the OHBDC (18) advocates the use of smaller load fractions for shear than for bending. This is in agreement with results from plate theory, which show that the shears due to a concentrated load are more localized than the moments.
Analyses were performed to investigate load fractions for shear for both skewed and nonskewed bridges. Because the effects of shear are more concentrated around the load than are the effects of bending, the local modeling of the structure has more influence on the results obtained. For convenience and consistency the anlytical scheme used for shear was the same as that used previously for moments, so the results may in general be expected to be slightly less accurate. Thus, highly refined design formulas are not warranted.
Skew angles of 0 deg, 22.5 deg, and 45 deg were considered for 2-lane bridges. Initial analyses showed that end shears are more sensitive than midspan moments to the modeling of the structure near the supports. It was found that the largest shears were obtained by including the warping torsion in the girders, by preventing any end rotation about an axis perpendicular to the support line, and by including the torsional stiffness of the end diaphragm. These conditions were then used for all sub-sequent analyses.
The inclusion of the diaphragm torsional stiffness causes neg-ative end moments even in nonskewed decks, and skew induces end moments even if the diaphragm is assumed to have no torsional stiffness. These moments attenuate rapidly with dis-tance from the support and influence the local distribution of shears. However, the direct stresses they induce are small enough that they may be neglected in design. (In the cases studied they were less than 25 psi at the bottom of the web.)
The results of the analyses showed that for nonskewed bridges the parameter C characterized response well, since different bridge geometries having the same C value showed almost iden-tical responses. The value of D5 (the D calculated for shear) was in all cases larger than the comparable value for midspan moment, so the AASHTO approach of using the latter for both flexural and shear design appears safe. This finding appears to contradict the fact that shears due to concentrated loads are more localized than moments. It was found that for single point loads the shears are indeed more localized, but that consider-ation of many truck wheel loads counteracts the effect.
When skew was included as well, the maximum shears in-creased and in many cases the distribution width for shear fell below that for midspan bending. The parameter C was found to characterize the response less well but still adequately, since for a given C value, different bridge geometries resulted in D5 values that differed by up to about 10 percent. Twice the number

10.0
iIIIIhIIuiiu , E 181
111111__11111 _ IIhiI 11111111
11111 11111111 IIEli!!!IIhII 1111111 11111111
9.0 IiiuhIuIII .11111 IIInNi!i!
IlAhIllilIllIll IIi!IIULflhIhII II111it1!1!IIIO 1111111 11111111
5.0 5.0
2 5 10 1.0 2 4.0 -
0.3 5 10
4.0 0.3
38
PARAMETER C PARAMETER C
Figure 64. Ds vs. C for 2-1ane 27-ft wide bridge, 45-deg skew, Figure 65. D vs. C for 2-1ane 27-ft wide bridge, 45-deg skew, and inner girder H. and inner girder 12.
of response locations had to be considered because a skew bridge is not symmetric. Results for each of the four girders are shown in Figures 64 to 67 for 45-deg skew. The girder notation 0 and I mean outer and inner, and 1 is the acute corner side. Each symbol represents one load case, and solid lines are drawn for each load case through the average D5 at each C. The dashed lines represent results for single or deck bulb tees for which C. = 0. Results for 22.5-deg skew were close to those for 45-deg skew.
The critical response was found in the outer girders, caused by load-case EO0. In girder 01 (the outer one at the acute corner) response for load cases other than E00 gave much lower response and higher D5 values, so if this load case is rejected as being too extreme, the response in cases where girder 01 is critical would be reduced. This is the case for C greater than 1.5. For C values less than 1.5, girder 02, at the obtuse corner, dominated. For C values less than 1.5 several load cases gave similar D3 values, so rejection of load-case E00 would make no difference.
For girder 02, the relationship between .D5 and C shows no clear trend like those for midspan moment. The minimum 1)
value for each girder is shown in Figure 68. It can be seen that while D5 generally decreases for larger C, the minimum Ds for
all girders is nearly independent of C and is equal to 4.5 ft for design purposes. This is approximately 80 percent of the D value for midspan bending moment.
The analyses thus show that D5 can be smaller than the D calculated for bending in some circumstances, but that the re-lationship between the two varies with skew angle, curb size, and the dimensionless parameter C. It may also depend on the number of traffic lanes, but that variable was not studied. The minimum value of D5/D (namely 0.80) corresponded to long narrow bridges.
It is reasonable to suppose that bridges other than multibeam precast bridges may have D5/D less than 1.0 under. some cir-cumstances, so that any changes in the design specifications should be made across all bridge types after the appropriate research has been carried out. It is thus proposed that for the sake of consistency in the specifications, and because only one bridge width was studied here, special provisions for shear in multibeam precast bridges should not be introduced now. This may appear to be unsafe, but is worth noting that in most cases precise values for shear distribution are not critical because design of highway bridges is generally dominated by flexure rather than shear. Furthermore, no cases of shear failure in practice have been reported.
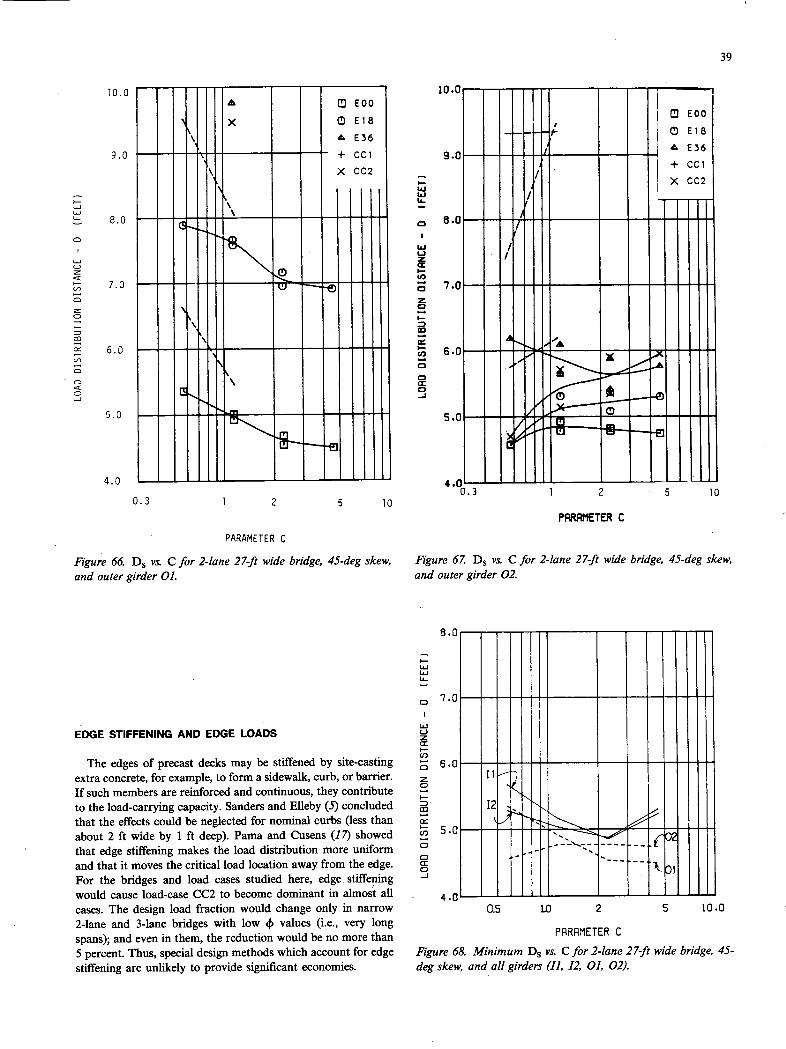
10.0 10.0 EOO iIIIIIIuII
IIIIIHIII IIFiii'uIIIIII III III 11111111 IE!!!iUIIIIIIII
9.0 B.0
I- LU LU U-
8.0
5.0 5.0
4.0 0.3
II!!HI _ III 1111111__III 11111111111111 I AIDIIIIIIIII IlflIi iiiiiir- i
1 2 5 10
4.0 -
0.3 1 2 5 10
PARPIIETER C
39
PARAMETER C
Figure 66. Ds vs. C for 2-lane 27-ft wide bridge, 45-deg skew, Figure 67 D5 vs. C for 2-lane 27-ft wide bridge, 45-deg skew,
and outer girder 01. and outer girder 02.
8.0
4- LU Ui U-
C 7.0
EDGE STIFFENING AND EDGE LOADS
The edges of precast decks may be stiffened by site-casting 6.0 extra concrete, for example, to form a sidewalk, curb, or barrier. If such members are reinforced and continuous, they contnbute
C -.
to the load-carrying capacity. Sanders and Elleby (5) concluded that the effects could be neglected for nominal curbs (less than about 2 ft wide by 1 ft deep). Pama and Cusens (17) showed 5.0
that edge stiffening makes the load distribution more uniform C
and that it moves the critical load location away from the edge. cc
For the bridges and load cases studied here, edge stiffening - would cause load-case CC2 to become dominant in almost all cases. The design load fraction would change only in narrow 0.5 LU 2 5 10.0 2-lane and 3-lane bridges with low 4) values (i.e., very long spans); and even in them, the reduction would be no more than FRRRMETER C
5 percent. Thus, special design methods which account for edge Figure 68. Minimum D5 vs. C for 2-lane 27-ft wide bridge, 45- stiffening are unlikely to provide significant economies. deg skew, and all girders (Ii, 12, 01, 02).
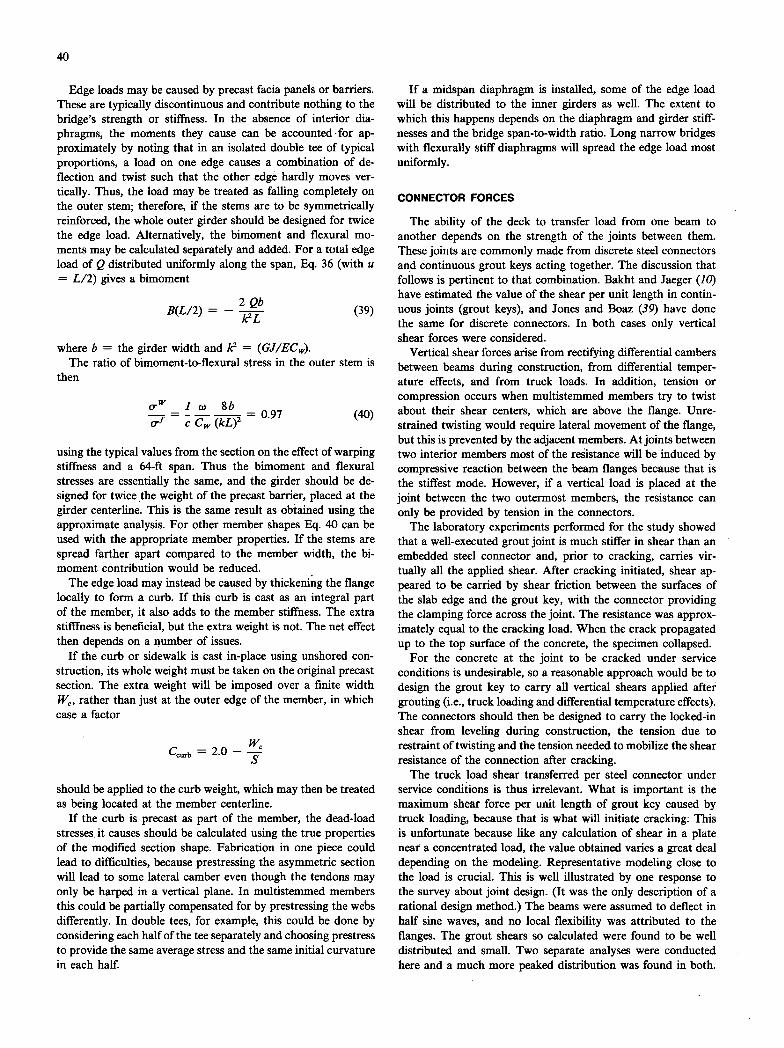
Edge loads may be caused by precast facia panels or barriers. These are typically discontinuous and contribute nothing to the bridge's strength or stiffness. In the absence of interior dia-phragms, the moments they cause can be accounted for ap-proximately by noting that in an isolated double tee of typical proportions, a load on one edge causes a combination of de-flection and twist such that the other edge hardly moves ver-tically. Thus, the load may be treated as failing completely on the outer stem; therefore, if the stems are to be symmetrically reinforced, the whole outer girder should be designed for twice the edge load. Alternatively, the bimoment and flexural mo-ments may be calculated separately and added. For a total edge load of Q distributed uniformly along the span, Eq. 36 (with u = L/2) gives a bimoment
B(L/2) - 2 Qb = (39)
where b = the girder width and k2 = (GJ/EC). The ratio of bimoment-to-flexural stress in the outer stem is
then
0WJ(J 8b _7 0.97 (40)
using the typical values from the section on the effect of warping stiffness and a 64-ft span. Thus the bimoment and flexural stresses are essentially the same, and the girder should be de-signed for twice the weight of the precast barrier, placed at the girder centerline. This is the same result as obiained using the approximate analysis. For other member shapes Eq. 40 can be used with the appropriate member properties. If the stems are spread farther apart compared to the member width, the bi-moment contribution would be reduced.
The edge load may instead be caused by thickening the flange locally to form a curb. If this curb is cast as an integral part of the member, it also adds to the member stiffness. The extra stiffness is beneficial, but the extra weight is not. The net effect then depends on a number of issues.
If the curb or sidewalk is cast in-place using unshored con-struction, its whole weight must be taken on the original precast section. The extra weight will be imposed over a finite width W, rather than just at the outer edge of the member, in which case a factor
CCU,b = 2.0 -
should be applied to the curb weight, which may then be treated as being located at the member centerline.
If the curb is precast as part of the member, the dead-load stresses it causes should be calculated using the true properties of the modified section shape. Fabrication in one piece could lead to difficulties, because prestressing the asymmetric section will lead to some lateral camber even though the tendons may only be harped in a vertical plane. In multistemmed members this could be partially compensated for by prestressing the webs differently. In double tees, for example, this could be done by considering each half of the tee separately and choosing prestress to provide the same average stress and the same initial curvature in each half.
If a midspan diaphragm is installed, some of the edge load will be distributed to the inner girders as well. The extent to which this happens depends on the diaphragm and girder stiff-nesses and the bridge span-to-width ratio. Long narrow bridges with flexurally stiff diaphragms will spread the edge load most uniformly.
CONNECTOR FORCES
The ability of the deck to transfer load from one beam to another depends on the strength of the joints between them. These joints are commonly made from discrete steel connectors and continuous grout keys acting together. The discussion that follows is pertinent to that combination. Bakht and Jaeger (10) have estimated the value of the shear per unit length in contin-uous joints (grout keys), and Jones and Boaz (39) have done the same for discrete connectors. In both cases only vertical shear forces were considered.
Vertical shear forces arise from rectifying differential cambers between beams during construction, from differential temper-ature effects, and from truck loads. In addition, tension or compression occurs when multistemmed members try to twist about their shear centers, which are above the flange. Unre-strained twisting would require lateral movement of the flange, but this is prevented by the adjacent members. At joints between two interior members most of the resistance will be induced by compressive reaction between the beam flanges because that is the stiffest mode. However, if a vertical load is placed at the joint between the two outermost members, the resistance can only be provided by tension in the connectors.
The laboratory experiments performed for the study showed that a well-executed grout joint is much stiffer in shear than an embedded steel connector and, prior to cracking, carries vir-tually all the applied shear. After cracking initiated, shear ap-peared to be carried by shear friction between the surfaces of the slab edge and the grout key, with the connector providing the clamping force across the joint. The resistance was approx-imately equal to the cracking load. When the crack propagated up to the top surface of the concrete, the specimen collapsed.
For the concrete at the joint to be cracked under service conditions is undesirable, so a reasonable approach would be to design the grout key to carry all vertical shears applied after grouting (i.e., truck loading and differential temperature effects). The connectors should then be designed to carry the locked-in shear from leveling during construction, the tension due to restraint of twisting and the tension heeded to mobilize the shear resistance of the connection after cracking.
The truck load shear transferred per steel connector under service conditions is thus irrelevant. What is important is the maximum shear force per unit length of grout key caused by truck loading, because that is what will initiate cracking; This is unfortunate because like any calculation of shear in a plate near a concentrated load, the value obtained varies a great deal depending on the modeling. Representative modeling close to the load is crucial. This is well illustrated by one response to the survey about joint design. (It was the only description of a rational design method.) The beams were assumed to deflect in half sine waves, and no local flexibility was attributed to the flanges. The grout shears so calculated were found to be well distributed and small. Two separate analyses were conducted here and a much more peaked distribution was found in both.

It is believed that they represent more closely the true conditions, but no experimental evidence is known. It is not even clear how to set about obtaining reliable measurements of shearing stress in the interior of a grout joint.
The analyses showed that the critical loading consisted of placing a load as close as possible to the joint. The first analysis used the grillage model, in which the flanges are modeled as fictitious cross beams, necessarily connected at discrete loca-tions. Loads placed on the cross beam at different transverse locations showed that the vast majority of the shear transfer occurred through the connector closest to the load. Further-more, loads applied elsewhere had only a small effect. Thus, a crude approximation would suggest that if the grout key could transmit a shear force equal to half a (double) wheel load over a longitudinal length equal to that of the tire print, no further analysis would be necessary. Assuming a 15-in, long tire print, in accordance with AASHTO Article 3.3.0, 30 percent impact fraction, combined load factors of 1.3 and 1.67 (Group 1 strength design), and a 0.9 under strength factor, requires
Lhz0T 41
0.9 q, X 15 in. > /'2 X 1.30 x 1.3 X 1.67 x 16 kip (41)
or q,, > 1.67 kip/in. Specimen 1C cracked at about 15.3-kip shear applied on a
60-in, total length. The distribution of shear along the length of the specimen was unknown. A uniform distribution would give a cracking strength of 0.26 kip/in., and a distribution that was uniform over a length equal to the distance between the two applied loads plus twice the edge distance would lead to a q, of 0.45 kip/in., which is still too low.
Multibeam bridge decks are not suffering widespread joint failure, so either the safety factors are adequate to supply the apparent shortfall in strength or the shear forces are less lo-calized than assumed by this approximate model. Discussion of more detailed analyses follows.
The grillage analysis was conducted first. In several special runs to study connector forces the cross beams representing the flanges were modeled with two elements. One very stiff element was arbitrarily taken as half the moment of inertia of the girder, extending from the girder axis out to the stem centerline. The second element, representing the cantilevered part of the flange, had a stiffness chosen to give the same deflection as a tip loaded cantilever plate, with the latter calculations based on Jaramillo's work (47). An influence line for shear transferred across the hinged joint in the beams, which represented the grout key, is shown in Figure 69. The girders were 8-ft wide double-tees spanning 64 ft with "cross beams" at 8-ft centers, and the load was applied at the worst location, at midspan. The shear due to two double wheels, each 2 ft wide and 6 ft on centers is 0.355 x 16 hip for the near wheels and 0.037 x 16 hip for the far ones, together giving a total shear equal to 0.39 of a nominal double-wheel load or 6.3 hip. This is the value predicted using the grillage analysis for the total shear transferred across the grout joint within an 8-ft length symmetrically located about the wheel. It gives no information on the longitudinal distri-bution of that load within that length. Further analyses including plate elements in the grid program suggested that some of the 7.0 hip might be transferred at locations somewhat more remote from the load. However, because output is only reported at the center of each element, it was impossible to pick up sufficiently reliable local values without an absurdly fine mesh.
-0.5
TRANSVERSE LOCATION (GIRDER WIDTHS)
Figure 69. Influence line across bridge at midspan for shear in connector (grillage analysis, 8DT36).
When a point load was placed over one of the stems of the girder it was apparent that a much better longitudinal distri-bution resulted. The maximum shear transferred at the midspan connector lay between 0.14 and 0.29 of the applied point load, depending on the modeling, with 0.18 believed to be the best value. This result appears reasonable, in that the load was placed over a longitudinally stiff element that was able to spread it longitudinally to a number of (relatively flexible) cross beams.
A second analysis was done using a refined finite-strip com-puter program, containing special double-tee elements (50). It only became available 'late in the study after the connector experiments were complete. The double tees are modeled as line elements possessing one vertical and one torsional nodal-line degree of freedbm. The line element has a finite width (within which no cross-sectional distortion is possible) equal to the distance between double-tee stems. The flanges are modeled as thin plate strips, the stiffness of which is developed using the exact Levy solution. They are thus really folded plates attached to the central line element. Loads were applied as short longi-tudinal line loads. This modeling permits the local shear force per unit length of grout key to be calculated at the longitudinal location of the load, and it is believed to be the best estimate available. A bridge similar to Jones and Boaz's (39) was ana-lyzed. It was made of the same four 8-ft double-tees, had a 48-ft span and no skew. Point loads were applied at a grid of locations on beam 2, on a mesh with spacing 12 ft longitudinally by 1 ft transversely. By scaling and adding, the response of a slightly shortened HS-20/AASHTO truck could be obtained.

42
For a i-hp line load 6 in. long placed at midwidth (of beam 2) at midspan, the longitudinal shear distribution in joint 2/3 is shown in Figure 70. The area under the curve is 0.32 kip and represents the total shear transferred from beam 2 to beam 3. The deflection profile at midspan is shown in Figure 71, from which intuition would suggest a load distribution of about 25 percent, 50 percent, 25 percent, and 0 percent; thus, the cal-culated joint shear of 0.32 kip seems plausible. Results for a 15-in. long line load were identical except for a 0.7 percent differ-ence in intensity directly under the load.
Loads eccentric to the beam's axis produced very much more peaked shear distributions, as shown in Figure 72 (to a log scale). Figure 73 shows an influence line for joint shear (in kips/ inch) at midspan in the joint between members 2 and 3, from which the joint shear caused by a symmetrically placed 32-kip axle is found to be 0.21 kip/in.
1.5
If this is taken as the best estimate of the maximum shear and the influence of other wheel loads at different locations is ignored, design values become:
Factored load and impact = 1.3 x 1.3 X 1.67 X 0.21 kip/in. = 0.59 kip/in. . (42a)
Design strength = 0.9 X 0.45 kip/in. = 0.41 kip/in. (42b)
Thus the best estimate of the factored load is 145 percent of the design strength derived from the measured cracking load. (The collapse load was 13 percent higher than the cracking load.) This is an undesirable situation, but the margin is smaller than it was with the more approximate analysis. In the absence of safety factors, but including the maximum impact fraction of 30 percent, the service load is only 61 percent of the cracking load. This may explain the absence of failures in the field.
It is shown elsewhere (33) that an in-plane direct force exists between the flanges of two connected double tees that is given by:
h(z) = e El;,,
When the member is loaded with a concentrated torque T at z = a, the twist angle is (44):
4(z) = T a sinh k (L - a) sinh kz}
GJk _L)cz_ sinh kL (43a)
100 0L. 0 .5
1.0
LONGITUDINPL LOCATION tX/LI Load at
Figure 70. Longitudinal distribution of joint shear-finite-strip 7/8 b model, load at midwidth.
3/4 b
012.3,0EFLECTION PROFILE AT (110-5PAN (FINITE STRIP MODELI
D 0.1 L.
0
1.0 2.0 3.0 4.0
0
25 .50 .75
1.00
TRANSVERSE LOCATION (GIRDER WIDTHS)
LONGITUDINAL LOCATION IX/LI
Figure 71. Midspan deflection profile-finite-strip model, load Figure 72. Longitudinal distribution of joint shear-finite-strip at midwidth. model, eccentric load.
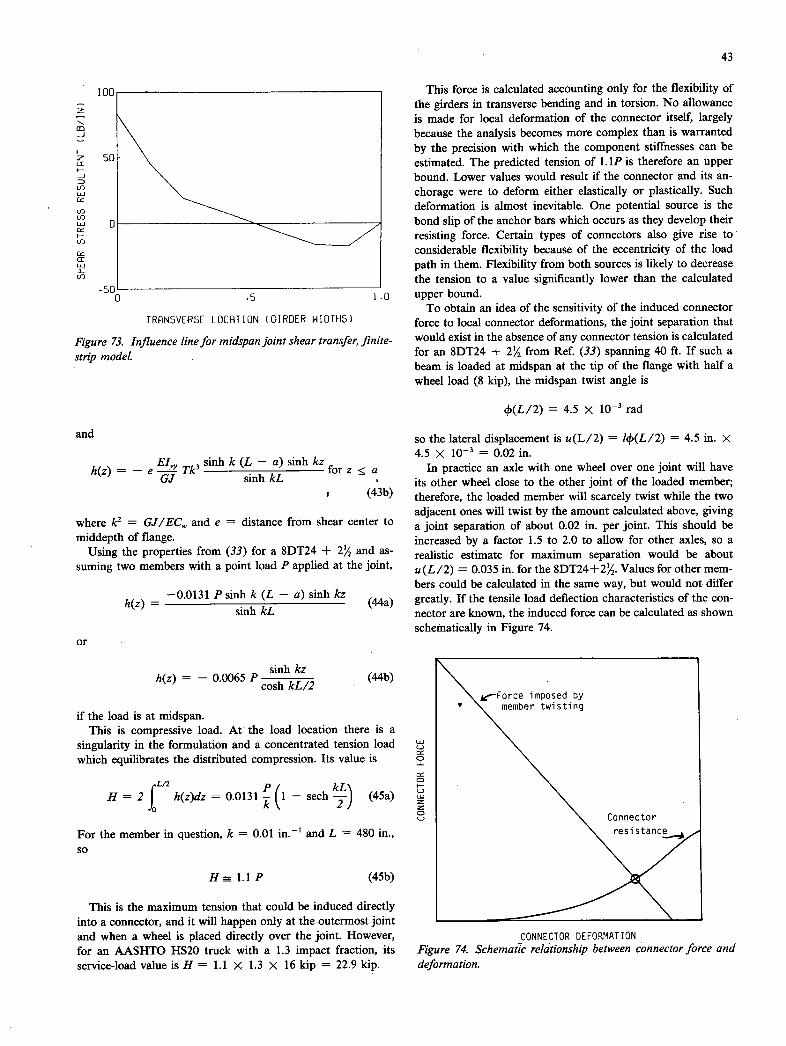
43
III
_50L 0
TRANSVERSE LOCATION (GIRDER NIDTHS[
Figure 73. Influence line for midspan joint shear transfer, finite-strip model.
and
for z < a h(z) = - e Tk3 sinh k (L - a) sinh kz
GJ sinhkL - (43b)
where k2 = GJ/EC,,, and e = distance from shear center to middepth of flange.
Using the properties from (33) for a 8DT24 + 24 and as-suming two members with a point load P applied at the joint,
h(z) = —0.0131 P sinh k (L - a) sinh kz
sinh kL (44a)
or
h(z) = - 0.0065 P sinh kz
(44b) cosh kL/2
if the load is at midspan. This is compressive load. At the load location there is a
singularity in the formulation and a concentrated tension load which equilibrates the distributed compression. Its value is
This force is calculated accounting only for the flexibility of the girders in transverse bending and in torsion. No allowance is made for local deformation of the connector itself, largely because the analysis becomes more complex than is warranted by the precision with which the component stiffnesses can be estimated. The predicted tension of 1. iF is therefore an upper bound. Lower values would result if the connector and its an-chorage were to deform either elastically or plastically. Such deformation is almost inevitable. One potential source is the bond slip of the anchor bars which occurs as they develop their resisting force. Certain types of connectors also give rise to considerable flexibility because of the eccentricity of the load path in them. Flexibility from both sources is likely to decrease the tension to a value significantly lower than the calculated upper bound.
To obtain an idea of the sensitivity of the induced connector force to local connector deformations, the joint separation that would exist in the absence of any connector tension is calculated for an 8DT24 + 2'/2 from Ref. (33) spanning 40 ft. If such a beam is loaded at midspan at the tip of the flange with half a wheel load (8 kip), the midspan twist angle is
4(L/2) = 4.5 x 10- rad
so the lateral displacement is u(L/2) = 14(L/2) = 4.5 in. X 4.5 X 10 = 0.02 in.
In practice an axle with one wheel over one joint will have its other wheel close to the other joint of the loaded member; therefore, the loaded member will scarcely twist while the two adjacent ones will twist by the amount calculated above, giving a joint separation of about 0.02 in. per joint. This should be increased by a factor 1.5 to 2.0 to allow for other axles, so a realistic estimate for maximum separation would be about u(L/2) = 0.035 in. for the 8DT24+24. Values for other mem-bers could be calculated in the same way, but would not differ greatly. If the tensile load deflection characteristics of the con-nector are known, the induced force can be calculated as shown schematically in Figure 74.
\ s—Force imposed by ' \ member twisting
1.0
f/2
H = 2 h(z)dz = 0.0131 i - sech 7) (45a) Q C)
For the member in question, k = 0.01 in.' and L = 480 in., so
Connector
resi stance
Hl.lP (45b)
This is the maximum tension that could be induced directly into a connector, and it will happen only at the outermost joint and when a wheel is placed directly over the joint. However, for an AASHTO HS20 truck with a 1.3 impact fraction, its service-load value is H = 1.1 x 1.3 x 16 kip = 22.9 kip.
CONNECTOR DEFORMATION
Figure 74. Schematic relationshiio between connector force and deformation.

44
The tension force can be seen to arise largely from compat-ibility rather than equilibrium requirements, so inadequate con-nector resistance to the tension force will not lead to immediate
catastrophe. However, flexible connectors will allow the sepa-ration to occur more freely, which could result in an accumu-lation of damage to the grout joint as it works open and shuts.
CHAPTER FIVE
DEVELOPMENT OF DESIGN PROCEDURES AND PROPOSED REVISIONS TO REF. 11
Article 3.23.4 of the 1983 AASHTO Standard SpecfIcations for Highway Bridges (11) contains provisions for designing mul-tibeam bridge girders. They stem from the findings in Ref. (5) and, with minor changes in notation, are
Load fraction = S,ff/Deff
Seff =(12NL + 9)/Ng = effective girder spacing D~ff =5 + 0.1NL + (3 - 2NL/7) (1 - C/3)2
C < 3 (46) D=5+O.lNL C > 3
where: NL = total number of traffic lanes; N5 = Number of longitudinal girders; C =KWIL (a stiffness parameter); W = overall width of the bridge, ft; L = span length, ft; and K =0.7 for nonvoided rectangular beams, 0.8 for rec-
tangular beams with circular voids, 1.0 for box section beams, and 2.2 for channel beams.
The same load fraction is used for bending and shear. As the parameter C increases from 0 to 3 •these relations
provide smaller values of D, resulting in larger load fractions. After inclusion of the lane load reduction factor, the predicted D values always lie between 5.1 and 7.81, and so they span quite a narrow range.
No provisiOns exist explicitly for precast single and multistem T sections. However, it is reasonable to suppose that multibeam bridges made from them would have a dependence on the pa-rameter C similar to that of Eq. 46. Figures 75 to 77 show the D values for moments calculated in this study (dashed lines for outer girders and dotted lines for inner girders), the individual values from the previous (Ref. 5) NCHRP study (symbols), and the present AASHTO formula, Eq. 46 (solid lines), for 2- lane, 3-lane, and 4-lane bridges. The data in the figures were computed taking into account two different influences on D, but have been converted to a common basis to facilitate comparison.
The first influence on D concerns the lane load reduction factor (AASHTO Article 3.12). The data from Ref. (5) were apparently derived without regard to it, but in this study the load fraction caused by each truck arrangement on a given bridge
was multiplied by the reduction factor appropriate to that num-ber of loaded lanes, and then the lowest value was taken. (The D values in Figures 15 and 26 still contain the factor). In order to convert to a value ostensibly free of reduction factors, the .D values from this study were then multiplied by 1.0, 0.9, and 0.75 for the three figures (Figs. 75, 76, and 77).
The second influence on D is the use of an "effective" S in the existing AASHTO formulas. This was introduced in Ref. (5) to reduce the number of variables on which D depended by omitting the influence of the actual bridge width. Since each figure contains data for a minimum (12NL + 3) and a maximum (12NL + 12) plausible bridge width for each number of lanes, the AASHTO formula (Eq. 46) was converted to "true" D values by keeping the load fraction the same, based on the relationship:
= -1 eff X St,., e
S,,,,, was taken as the actual girder spacing. Several features of the graphs are worth noting:
In the range of C where data from both studies are avail-able, the agreement is reasonable. For C values of about 1, agreement is very close for all geometries (60-ft wide 4-lane bridges were not treated in Ref. (5), so no data are shown in Figure 77 for that geometry). At lower C values, the results of this study give smaller D for 4 lanes and larger D for 2 lanes than does Ref. (5).
In Ref. (5) the same range of C values (0.14 to 2.8) was used for all bridge widths. In this study, larger values of C were used for the wider bridges, because C is directly proportional to Wand the stiffness parameter K (= VE-112GJ for the girders) was found to vary but little over the range of practical sections. Particularly for the 4-lane bridges, the results of this study show significantly smaller D values than the smallest from Ref. (5). It appears that Eq. 46 was formulated for beam and slab bridges, from which the data suggested a constant D for C greater than 3.0. Because no data were generated in that study for multibeam bridges with C greater than 3.0, the trend could not be checked. The data from this study suggest that the cut-off should occur at a C value of 5 to 10, with a lower minimum D than that recommended in Ref. (5).

1IiIiiiiIIIIIIIII___ II huh IIIIIIL__
B.0 uJ LU I'-
B.0
LU LU U- - 7.0 C
45
The existence of a constant D at high C values is in agree-ment with the physical response of the deck. Once a bridge becomes wide enough compared to its length, the effects of a load on one side will die out before they reach the other side. Extra width then has no influence on response under the load.
The use of an Seff in Eq. 46 causes a wider range of true .D values in bridges with less lanes. In 2-lane bridges, for ex-ample, this results in D values that are too conservative for minimum width (27 ft) bridges and unsafe in maximum width (36 ft) bridges.
Equation 46 is significantly unsafe at high C for 4-lane bridges.
Equation 46 does not reflect the number of lanes very well. Equation 46 does not incorporate the lane load reduction
factor. It must be applied after the load fraction is calculated, without knowing the number of loaded lanes on which the B value was based.
Because single and multistemmed tees are just a subset of all multibeam bridges, it is desirable to produce design formulas that are consistent with Article 3.23.4 of the AASHTO Standard Spec Wcations for Highway Bridges (11). However, a dilemma arises if the results do not fit neatly into the existing framework, and two courses of action are thus proposed. The first provides temporary measures that make use of the existing framework. The second provides a slightly different formulation which, it is hoped, will be useful when Section 3 Part C on load distri-bution is revised as a whole. The second proposal is considered preferable.
Proposal 1 Article 3.23.4 of the AASHTO Standard Specifications
for Highway Bridges (11) should be amended. The last line in the table for "Values of K to be Used in C = K (W/L)" should be changed from "Channel beams 2.2" to read:
single and multistemmed tee sections and channels 2.2
IC t .tJ
0.2 0.5 1 2 5 10 20
PRRRMTER C
Figure 76. D vs. C for 3-1ane bridges—existing AASHTO for-mulation.
IIIIIIIIIE AASHTO
uIiiiiii 11111111 111111
WEi iiiiniiiii
111111111111111110 111111110111111110
0.5 1 2 5 10 20
zU
.
. J
CL
-
iue7. D v. C fr21n rde—xsigAST o- uain
PRRRMETER C
Figure 7Z D vs. C for 4-lane bridges—existing AASHTO for-mulation.
3.0 0.2
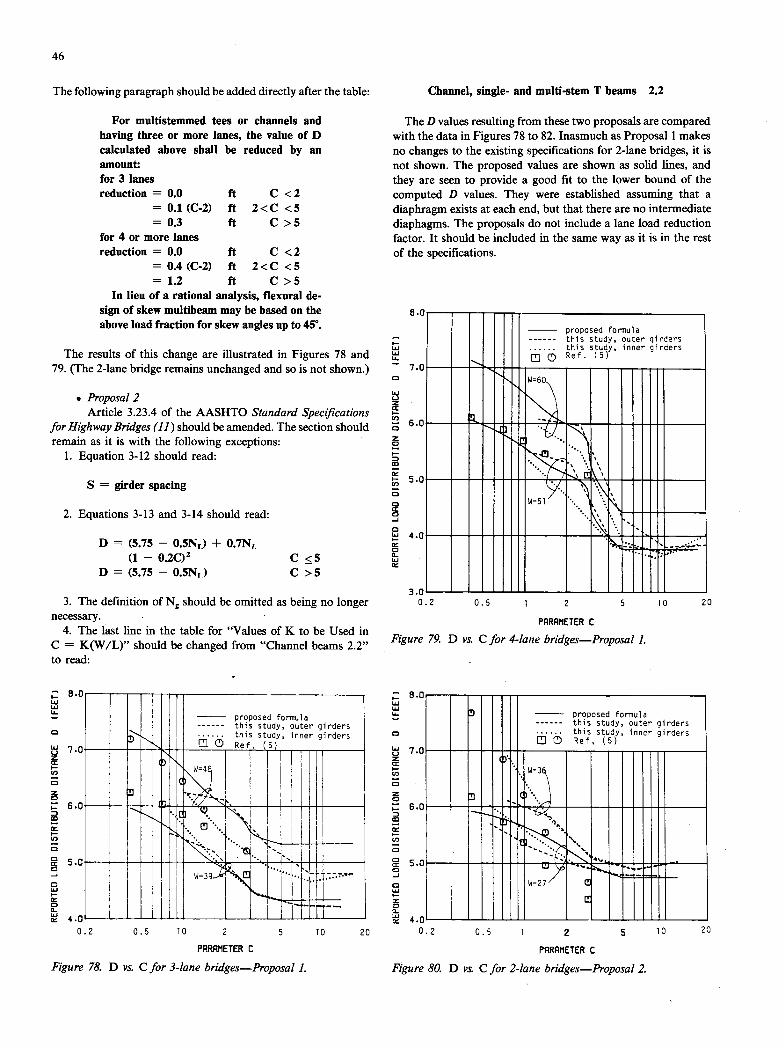
8.c
LU LU U. - 7.0 C
LU
cc 5.0
CD
5.0
C C Cr -J C
4.0 Cr CL cc
46
The following paragraph should be added directly after the table:
For multistemmed tees or channels and having three or more lanes, the value of D calculated above shall be reduced by an amount: for 3 lanes
reduction = 0.0 ft C <2 = 0.1 (C-2) ft 2<C <5
=0.3 ft C>5 for 4 or more lanes
reduction = 0.0 ft C <2 = 0.4 (C-2) ft 2<C <5
=1.2 ft C>5 In lieu of a rational analysis, flexural de-
sign of skew multibeam may be based on the above load fraction for skew angles up to 450
The results of this change are illustrated in Figures 78 and 79. (The 2-lane bridge remains unchanged and so is not shown.)
Proposal 2 Article 3.23.4 of the AASHTO Standard Specifications
for Highway Bridges (11) should be amended. The section should remain as it is with the following exceptions:
Equation 3-12 should read:
S = girder spacing
Equations 3-13 and 3-14 should read:
D = (5.75 - 0.5N1) + 0.7NL (1 - 0.2C)2 C <5
D = (5.75 - 0.5NL) C >5
The defmition of Ng should be omitted as being no longer necessary.
The last line in the table for "Values of K to be Used in C = K(W/L)" should be changed from "Channel beams 2.2" to read:
proposed formula this study, outer girders this study, inner girders
0 Ref 5)
Channel, single- and multi-stem T beams 2.2
The D values resulting from these two proposals are compared with the data in Figures 78 to 82. Inasmuch as Proposal 1 makes no changes to the existing specifications for 2-lane bridges, it is not shown. The proposed values are shown as solid lines, and they are seen to provide a good fit to the lower bound of the computed D values. They were established assuming that a diaphragm exists at each end, but that there are no intermediate diaphagms. The proposals do not include a lane load reduction factor. It should be included in the same way as it is in the rest of the specifications.
iuiiiiii 11111111 IIIIIIIIirIIII___ 11111
11111111 1Iiiiiii 10 20
1IiIIIILL1*Ii' :
II!IiiI!IIIIIIII___ 11111111'. UIIII -
8.0 LU LU
LUIJ 7.0 z cc - 'I,
6.0
Cr
-U,
C -j C LU
C 0
3.0 0.2 0.5 1 2 5
PARRMETER C
Figure 79. D vs. C for 4-1ane bridges-Proposal 1.
; 8.0 LU LU U. C
uuj 7.0 I-U,
C z C
6.0
U,
C
C
C
C LU
C a-
Ar, X . 0.2 0.5 10 2 5 10
20 0.2 0.5 1 2 5 10 20
PPRRIIETER C
PRRflMETR C
Figure 78. D vs. C for 3-1ane bridges-Proposal 1. Figure 80. D vs. C for 2-1ane bridges-Proposal 2
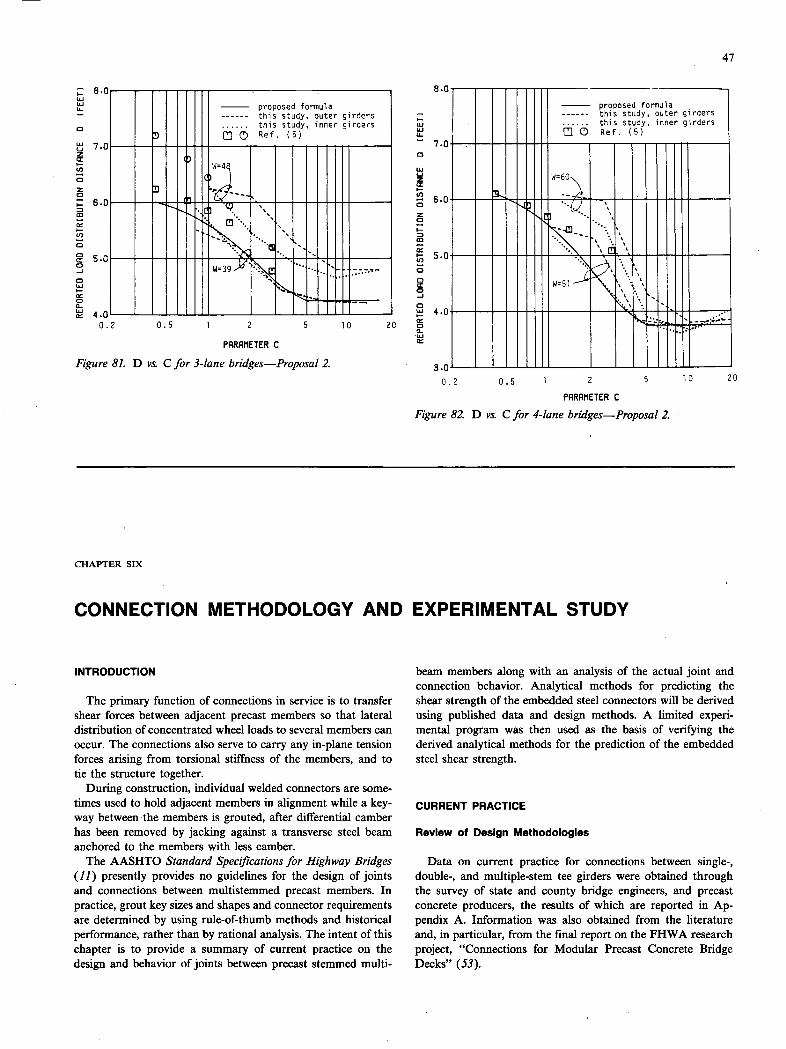
- 7.0
47
B.0
IIiIIIIL1!1uuI'' girders
II!IHI 11111111 uIiiiii1uIIIII__ 1111111101, ,11011011'- -
0.2 0.5 1 2 5 10 20
PRRRMETER C
Figure 81. D vs. C for 3-lane bridges—Proposal 2.
proposed formula this study, outer girders this study, inner girders
CD Ref. (5)
W=60
:—
III
ws -
10 20 3.0--—-
0.2 0.5 1 2 5
PRRRMETER C
Figure 82. D vs. C for 4-lane bridges—Proposal 2.
CHAPTER SIX
CONNECTION METHODOLOGY AND EXPERIMENTAL STUDY
INTRODUCTION
The primary function of connections in service is to transfer shear forces between adjacent precast members so that lateral distribution of concentrated wheel loads to several members can occur. The connections also serve to carry any in-plane tension forces arising from torsional stiffness of the members, and to tie the structure together.
During construction, individual welded connectors are some-times used to hold adjacent members in alignment while a key-way between the members is grouted, after differential camber has been removed by jacking against a transverse steel beam anchored to the members with less camber.
The AASHTO Standard Spec Wcations for Highway Bridges (11) presently provides no guidelines for the design of joints and connections between multistemmed precast members. In practice, grout key sizes and shapes and connector requirements are determined by using rule-of-thumb methods and historical performance, rather than by rational analysis. The intent of this chapter is to provide a summary of current practice on the design and behavior of joints between precast stemmed multi-
beam members along with an analysis of the actual joint and connection behavior. Analytical methods for predicting the shear strength of the embedded steel connectors will be derived using published data and design methods. A limited experi-mental program was then used as the basis of verifying the derived analytical methods for the prediction of the embedded steel shear strength.
CURRENT PRACTICE
Review of Design Methodologies
Data on current practice for connections between single-, double-, and multiple-stem tee girders were obtained through the survey of state and county bridge engineers, and precast concrete producers, the results of which are reported in Ap-pendix A. Information was also obtained from the literature and, in particular, from the final report on the FHWA research project, "Connections for Modular Precast Concrete Bridge Decks" (53).
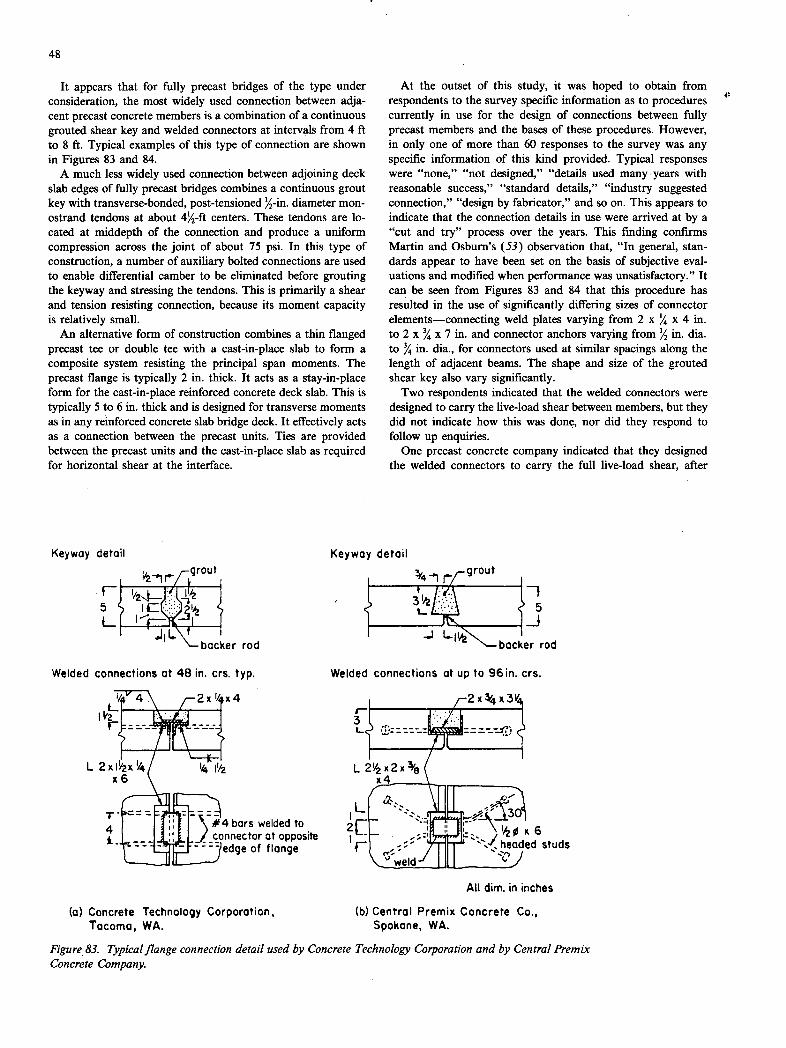
48
It appears that for fully precast bridges of the type under consideration, the most widely used connection between adja-cent precast concrete members is a combination of a continuous grouted shear key and welded connectors at intervals from 4 ft to 8 ft. Typical examples of this type of connection are shown in Figures 83 and 84.
A much less widely used connection between adjoining deck slab edges of fully precast bridges combines a continuous grout key with transverse-bonded, post-tensioned '/2-in. diameter mon-ostrand tendons at about 4/2ft centers. These tendons are lo-cated at middepth of the connection and produce a uniform compression across the joint of about 75 psi. In this type of construction, a number of auxiliary bolted connections are used to enable differential camber to be eliminated before grouting the keyway and stressing the tendons. This is primarily a shear and tension resisting connection, because its moment capacity is relatively small.
An alternative form of construction combines a thin flanged precast tee or double tee with a cast-in-place slab to form a composite system resisting the principal span moments. The precast flange is typically 2 in. thick. It acts as a stay-in-place form for the cast-in-place reinforced concrete deck slab. This is typically 5 to 6 in. thick and is designed for transverse moments as in any reinforced concrete slab bridge deck. It effectively acts as a connection between the precast units. Ties are provided between the precast units and the cast-in-place slab as required for horizontal shear at the interface.
At the outset of this study, it was hoped to obtain from respondents to the survey specific information as to procedures currently in use for the design of connections between fully precast members and the bases of these procedures. However, in only one of more than 60 responses to the survey was any specific information of this kind provided. Typical responses were "none," "not designed," "details used many years with reasonable success," "standard details," "industry suggested connection," "design by fabricator," and so on. This appears to indicate that the connection details in use were arrived at by a "cut and try" process over the years. This finding confirms Martin and Osburn's (53) observation that, "In general, stan-dards appear to have been set on the basis of subjective eval-uations and modified when performance was unsatisfactory." It can be seen from Figures 83 and 84 that this procedure has resulted in the use of significantly differing sizes of connector elements—connecting weld plates varying from 2 x x 4 in. to 2 x Y, x 7 in. and connector anchors varying from '2 in. dia. to % in. dia., for connectors used at similar spacings along the length of adjacent beams. The shape and size of the grouted shear key also vary significantly.
Two respondents indicated that the welded connectors were designed to carry the live-load shear between members, but they did not indicate how this was done, nor did they respond to follow up enquiries.
One precast concrete company indicated that they designed the welded connectors to carry the full live-load shear, after
Keyway detail Keyway detail
grout r[out
. - I 5 iC:.. 2 5
..J1L. backer rod LllNN_backer rod
Welded connections at 48 in. cr5. typ. Welded connections at up to 96 in. crs.
L I :12 LLXX 3/8 ___
i-connector site I eaded studs
All dim, in inches
(a) Concrete Technology Corporation, (b) Central Premix Concrete Co., Tacoma, WA. Spokane, WA.
Figure 83. Typicalfiange connection detail used by Concrete Technology Corporation and by Central Premix Concrete Company.
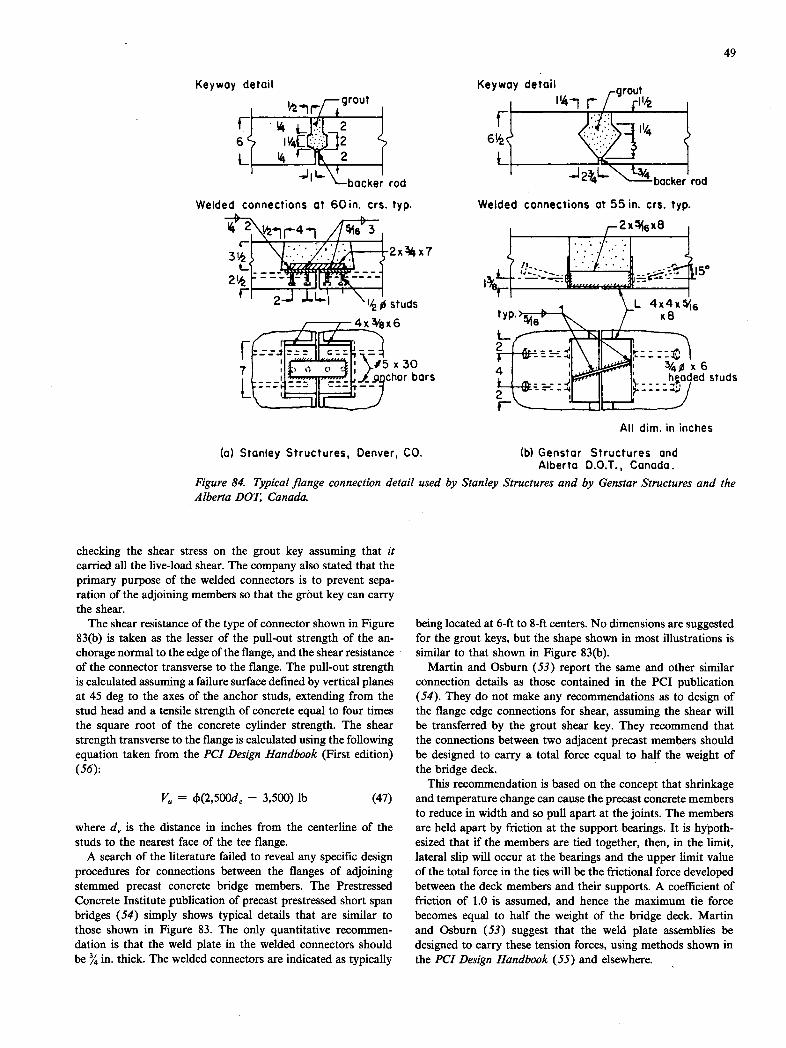
Keyway detail ,—grout
ri LI4:I 2 6 1 v4C.2
L 4 K 2 iJlL\_backer rod
Welded connections at 60 in. crs. typ.
ta-4,4ii63
3;3_
iW=4 2x3
r 2-j 140 studs
4 X Ns x 6
:,j
(a) Stanley Structures, Denver, CO.
49
Keywoy detail
1/2.
L backer rod
Welded connections at 55 in. crs. typ.
I ,-2x 6x8
i4 450 L 4x4x 6
typ.
41 I 34px6 ______ headed studs
All dim. in inches
(b) Genstar Structures and Alberta D.0.T.. Canada.
Figure 84. Typical flange connection detail used by Stanley Structures and by Genstar Structures and the Alberta DOT. Canada.
checking the shear stress on the grout key assuming that it carried all the live-load shear. The company also stated that the primary purpose of the welded connectors is to prevent sepa-ration of the adjoining members so that the grout key can carry the shear.
The shear resistance of the type of connector shown in Figure 83(b) is taken as the lesser of the pull-out strength of the an-chorage normal to the edge of the flange, and the shear resistance of the connector transverse to the flange. The pull-out strength is calculated assuming a failure surface defined by vertical planes at 45 deg to the axes of the anchor studs, extending from the stud head and a tensile strength of concrete equal to four times the square root of the concrete cylinder strength. The shear strength transverse to the flange is calculated using the following equation taken from the PCI Design Handbook (First edition) (56):
V. = 4(2,500d, - 3,500) lb (47)
where d, is the distance in inches from the centerline of the studs to the nearest face of the tee flange.
A search of the literature failed to reveal any specific design procedures for connections between the flanges of adjoining stemmed precast concrete bridge members. The Prestressed Concrete Institute publication of precast prestressed short span bridges (54) simply shows typical details that are similar to those shown in Figure 83. The only quantitative recommen-dation is that the weld plate in the welded connectors should be % in. thick. The welded connectors are indicated as typically
being located at 6-ft to 8-ft centers. No dimensions are suggested for the grout keys, but the shape shown in most illustrations is similar to that shown in Figure 8 3(b).
Martin and Osbum (53) report the same and other similar connection details as those contained in the PCI publication (54). They do not make any recommendations as to design of the flange edge connections for shear, assuming the shear will be transferred by the grout shear key. They recommend that the connections between two adjacent precast members should be designed to carry a total force equal to half the weight of the bridge deck.
This recommendation is based on the concept that shrinkage and temperature change can cause the precast concrete members to reduce in width and so pull apart at the joints. The members are held apart by friction at the support bearings. It is hypoth-esized that if the members are tied together, then, in the limit, lateral slip will occur at the bearings and the upper limit value of the total force in the ties will be the frictional force developed between the deck members and their supports. A coefficient of friction of 1.0 is assumed, and hence the maximum tie force becomes equal to half the weight of the bridge deck. Martin and Osburn (53) suggest that the weld plate assemblies be designed to carry these tension forces, using methods shown in the PCI Design Handbook (55) and elsewhere.
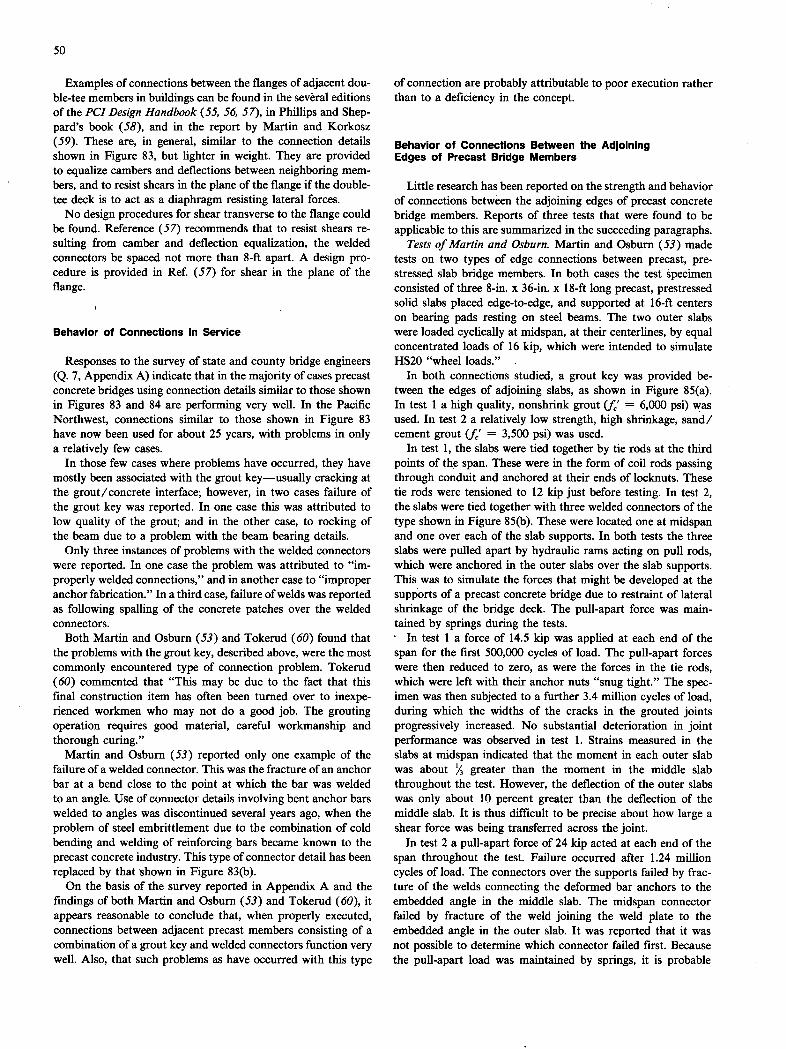
50
Examples of connections between the flanges of adjacent dou-ble-tee members in buildings can be found in the several editions of the PCI Design Handbook (55, 56, 57), in Phillips and Shep-pard's book (58), and in the report by Martin and Korkosz (59). These are, in general, similar to the connection details shown in Figure 83, but lighter in weight. They are provided to equalize cambers and deflections between neighboring mem-bers, and to resist shears in the plane of the flange if the double-tee deck is to act as a diaphragm resisting lateral forces.
No design procedures for shear transverse to the flange could be found. Reference (57) recommends that to resist shears re-sulting from camber and deflection equalization, the welded connectors be spaced not more than 8-ft apart. A design pro-cedure is provided in Ref. (57) for shear in the plane of the flange.
Behavior of Connections in Service
Responses to the survey of state and county bridge engineers
(Q. 7, Appendix A) indicate that in the majority of cases precast concrete bridges using connection details similar to those shown in Figures 83 and 84 are performing very well. In the Pacific Northwest, connections similar to those shown in Figure 83 have now been used for about 25 years, with problems in only a relatively few cases.
In those few cases where problems have occurred, they have mostly been associated with the grout key—usually cracking at the grout/concrete interface; however, in two cases failure of the grout key was reported. In one case this was attributed to low quality of the grout; and in the other case, to rocking of the beam due to a problem with the beam bearing details.
Only three instances of problems with the welded connectors were reported. In one case the problem was attributed to "im-properly welded connections," and in another case to "improper anchor fabrication." In a third case, failure of welds was reported as following spalling of the concrete patches over the welded connectors.
Both Martin and Osburn (53) and Tokerud (60) found that the problems with the grout key, described above, were the most commonly encountered type of connection problem. Tokerud (60) commented that "This may be due to the fact that this final construction item has often been turned over to inexpe-rienced workmen who may not do a good job. The grouting operation requires good material, careful workmanship and thorough curing."
Martin and Osburn (53) reported only one example of the failure of a welded connector. This was the fracture of an anchor bar at a bend close to the point at which the bar was welded to an angle. Use of connector details involving bent anchor bars welded to angles was discontinued several years ago, when the problem of steel embrittlement due to the combination of cold bending and welding of reinforcing bars became known to the precast concrete industry. This type of connector detail has been replaced by that shown in Figure 83(b).
On the basis of the survey reported in Appendix A and the findings of both Martin and Osburn (53) and Tokerud (60), it appears reasonable to conclude that, when properly executed, connections between adjacent precast members consisting of a combination of a grout key and welded connectors function very well. Also, that such problems as have occurred with this type
of connection are probably attributable to poor execution rather than to a deficiency in the concept.
Behavior of Connections Between the Adjoining Edges of Precast Bridge Members
Little research has been reported on the strength and behavior of connections between the adjoining edges of precast concrete bridge members. Reports of three tests that were found to be applicable to this are summarized in the succeeding paragraphs.
Tests of Martin and Osburn. Martin and Osburn (53) made tests on two types of edge connections between precast, pre-stressed slab bridge members. In both cases the test specimen consisted of three 8-in. x 36-in. x 18-ft long precast, prestressed solid slabs placed edge-to-edge, and supported at 16-ft centers on bearing pads resting on steel beams. The two outer slabs were loaded cyclically at midspan, at their centerlines, by equal concentrated loads of 16 kip, which were intended to simulate HS20 "wheel loads."
In both connections studied, a grout key was provided be-tween the edges of adjoining slabs, as shown in Figure 8 5(a). In test 1 a high quality, nonshrink grout (J' = 6,000 psi) was used. In test 2 a relatively low strength, high shrinkage, sand/ cement grout (fl = 3,500 psi) was used.
In test 1, the slabs were tied together by tie rods at the third points of the span. These were in the form of coil rods passing through conduit and anchored at their ends of locknuts. These tie rods were tensioned to 12 hip just before testing. In test 2, the slabs were tied together with three welded connectors of the type shown in Figure 85(b). These were located one at midspan and one over each of the slab supports. In both tests the three slabs were pulled apart by hydraulic rams acting on pull rods, which were anchored in the outer slabs over the slab supports. This was to simulate the forces that might be developed at the supports of a precast concrete bridge due to restraint of lateral shrinkage of the bridge deck. The pull-apart force was main-tained by springs during the tests.
In test 1 a force of 14.5 hip was applied at each end of the span for the first 500,000 cycles of load. The pull-apart forces were then reduced to zero, as were the forces in the tie rods, which were left with their anchor nuts "snug tight." The spec-imen was then subjected to a further 3.4 million cycles of load, during which the widths of the cracks in the grouted joints progressively increased. No substantial deterioration in joint performance was observed in test 1. Strains measured in the slabs at midspan indicated that the moment in each outer slab was about '/ greater than the moment in the middle slab throughout the test. However, the deflection of the outer slabs was only about 10 percent greater than the deflection of the middle slab. It is thus difficult to be precise about how large a shear force was being transferred across the joint.
In test 2 a pull-apart force of 24 hip acted at each end of the span throughout the test. Failure occurred after 1.24 million cycles of load. The connectors over the supports failed by frac-ture of the welds connecting the deformed bar anchors to the embedded angle in the middle slab. The midspan connector failed by fracture of the weld joining the weld plate to the embedded angle in the outer slab. It was reported that it was not possible to determine which connector failed first. Because the pull-apart load was maintained by springs, it is probable

Figure 85. Details of specimens tested by Martin and Osburn (53). (a) Grout key
%x2x3 plate
2' 4Øx.l2 2 deformed bar anchors
44
V 3
rstuds 2- $Ø L3X2X%X4
All dim. in in.
(b) Welded connector, test 2
51
r
8
that after failure of one of the connectors, the load on the other two connectors suddenly increased, causing their failure.
A separate tensile test on half a welded connector assembly ended in failure of the weld connecting the anchor bar to the angle, at a load of 13.9 kip. Martin and Osburn (53) reported that "The test data indicate that the maximum axial force in a deformed bar anchor, assuming that the headed studs resisted about 6 kips, was 8 kips or nearly 60 percent of the static strength. It is estimated that this axial force was reduced to about 6.5 kips at the end of test No. 2 due to increased partic-ipation of the midspan connector."
It was observed that the low strength grout in the joint had not undergone any significant deterioration as a result of the cyclic loading. The ratio of the measured strains and deflections in the middle and outer slabs at midspan were approximately the same as in test 1.
The range of strain in the weld plate of the midspan connector increased from about 250 millionths at the beginning of the test to about 500 millionths at the end of the test, as compared with a range of strain of about 100 millionths throughout the test in the weld plates of the end connectors. This was presumably due to the greater bending of the midspan weld plate as it partici-pated to some extent in the transfer of shear across the joint.
Martin and Osbum (53) observed that the total pull-apart force was not distributed equally between the three welded con-nectors, as assumed in design of the specimen. They estimated that the load carried by the middle connector varied from about 8 percent of the total pull-apart force at 'the beginning of the test, to about 21 percent at the end of the test. This resulted in overstressing of the end connectors. They concluded that the "connections performed remarkably well under vary arduous test conditions."
The tests indicate that a properly grouted keyway in com-bination with either transverse tie rods or welded connectors between adjacent member edges is a very effective way to transfer shear between adjacent members.
Tests of N. N. Ong. Ong (61) reported tests of specimens intended to simulate welded connectors of the type shown in Figure 83(b), between adjacent bulb-tee bridge beams. The test specimens consisted of pairs of reinforced concrete beams, 6 x 6 x 36 in. long, placed side-by-side on simple supports which were 30-in, apart. The beams were connected together at mid-span by a welded connector, as shown in Figure 86. Two cases were studied. In one case the beams were supported at the same level and the /8- x x 3-in, bar was welded in place transverse to the span, as shown in Figure 86(a). In the second case, one of the beams was supported '/4-in. higher than the other. In this case the 7/, x 7/ x 3-in, bar was welded in place parallel to the adjoining beam faces, as shown in Figure 86(b). One of the pair of beams was loaded concentrically at midspan.
Initially, two tests were made of single beams and the max-imum load that could be carried over a 30-in, span was found to be 46.3 kip. Tests were then made of one of each of the specimen types shown in Figure 86. The maximum loads carried were 42.9 kip and 39.6 kip for the specimen types 1 and 2 respectively. Failure of the loaded beam occurred without failure of the connection. The recorded deflections indicate considerable twisting of the pair of beams. The ratios of midspan deflection of the loaded beam to midspan deflection of the unloaded beam were 2.22 and 5.12 for specimen types 1 and 2 respectively.
The remaining six specimens were tested with a support under the unloaded beam at midspan (details of the support are not reported). The other beam was again loaded at midspan. There was considerable scatter in the results. The maximum loads were 58.6, 51.2, and 53.9 kip for the type 1 specimens, and 69.8, 52.1, and 58.8 kip for the type 2 specimens. Ong (61) states that the connectors in the type 1 specimens "failed in tension," and that the connectors in the type 2 specimens "failed in shear." This presumably refers to the welds, the size of which is not reported. If, as assumed by Ong (61), all the applied load was transferred through the connector, and E70 welding electrodes were used, the weld size would have had to be about '2 in. No
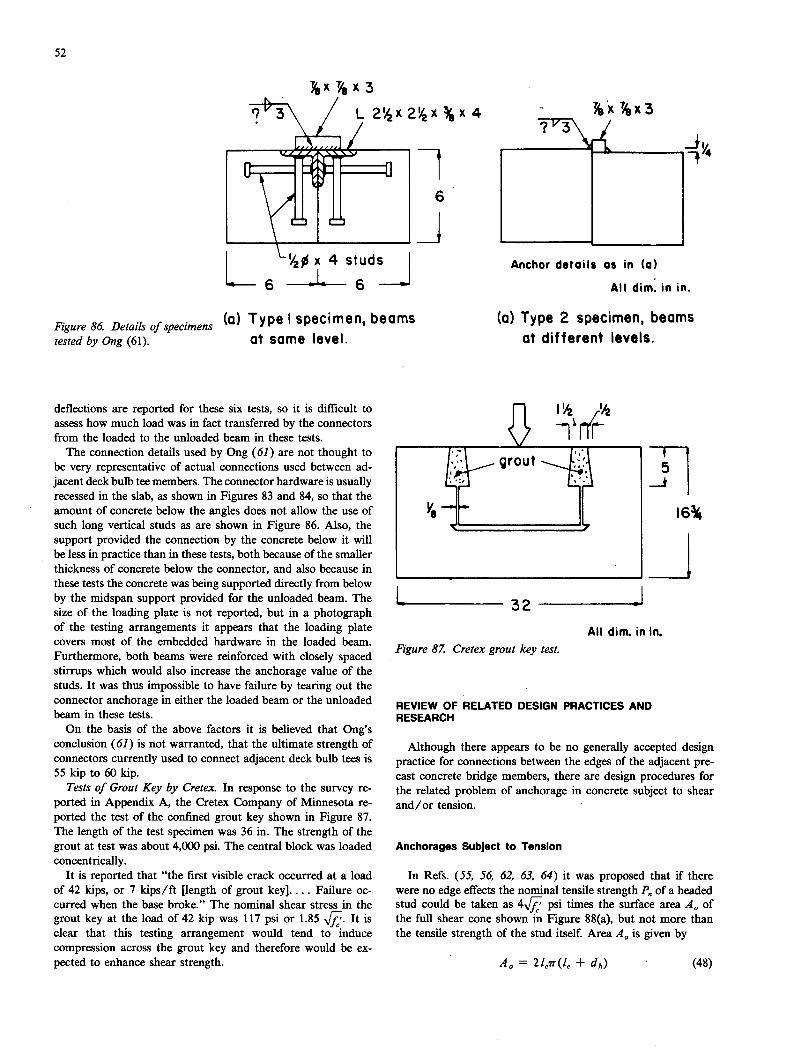
JI
L '2P A t
6 - I - 6 :--~ Anchor details as in (a)
AU dim. in in.
52
1
j
Figure 86. Details of specimens tested by Ong (61).
(a) Type I specimen, beams at some level.
(a) Type 2 specimen, beams at different levels.
deflections are reported for these six tests, so it is difficult to assess how much load was in fact transferred by the connectors from the loaded to the unloaded beam in these tests.
The connection details used by Ong (61) are not thought to be very representative of actual connections used between ad-jacent deck bulb tee members. The connector hardware is usually recessed in the slab, as shown in Figures 83 and 84, so that the amount of concrete below the angles does not allow the use of such long vertical studs as are shown in Figure 86. Also, the support provided the connection by the concrete below it will be less in practice than in these tests, both because of the smaller thickness of concrete below the connector, and also because in these tests the concrete was being supported directly from below by the midspan support provided for the unloadedbeam. The size of the loading plate is not reported, but in a photograph of the testing arrangements it appears that the loading plate covers most of the embedded hardware in the loaded beam. Furthermore, both beams were reinforced with closely spaced stirrups which would also increase the anchorage value of the studs. It was thus impossible to have failure by tearing out the connector anchorage in either the loaded beam or the unloaded beam in these tests.
On the basis of the above factors it is believed that Ong's conclusion (61) is not warranted, that the ultimate strength of connectors currently used to connect adjacent deck bulb tees is 55 trip to 60 hip.
Tests of Grout Key by Cretex. In response to the survey re-ported in Appendix A, the Cretex Company of Minnesota re-ported the test of the confined grout key shown in Figure 87. The length of the test specimen was 36 in. The strength of the grout at test was about 4,000 psi. The central block was loaded concentrically.
It is reported that "the first visible crack occurred at a load of 42 hips, or 7 hips/ft [length of grout key].... Failure oc-curred when the base broke." The nominal shear stress in the grout key at the load of 42 hip was 117 psi or 1.85 Vf7,. It is clear that this testing arrangement would tend to induce compression across the grout key and therefore would be ex-pected to enhance shear strength.
w2
grout
1634
32
All dim. in In.
Figure 87. Cretex grout key test.
REVIEW OF RELATED DESIGN PRACTICES AND RESEARCH
Although there appears to be no generally accepted design practice for connections between the edges of the adjacent pre-cast concrete bridge members, there are design procedures for the related problem of anchorage in concrete subject to shear and/or tension.
Anchorages Subject to Tension
In Refs. (55, 56, 62, 63, 64) it was proposed that if there were no edge effects the nominal tensile strength P. of a headed stud could be taken as 4..j7 psi times the surface area A. of the full shear cone shown in Figure 88(a), but not more than the tensile strength of the stud itself. Area A. is given by
A 0 = 21,,T(le + dh) (48)
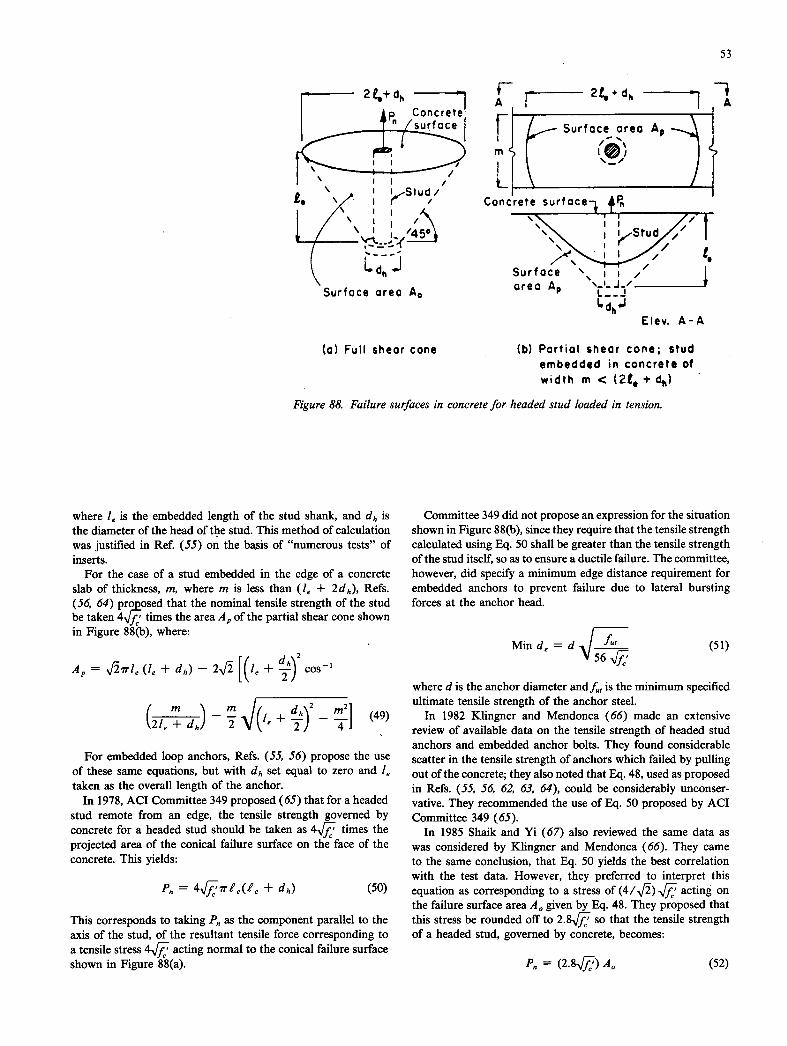
53
2+dh Concret r 21,+dh
__ rface Surface area
rn
I
\
Stud.' £• ( / Concrete surfaceP. -
iKStud /450
L.dh _i Surface area A 'LJ'
Surface area A
Elev. A-A
(a) Full shear cone (b) Partial shear cone; stud embedded in concrete of width m < ( 2Ev + dk)
Figure 88. Failure surfaces in concrete for headed stud loaded in tension.
where I, is the embedded length of the stud shank, and dh is the diameter of the head of the stud. This method of calculation was justified in Ref. (55) on the basis of "numerous tests" of inserts.
For the case of a stud embedded in the edge of a concrete slab of thickness, m, where m is less than (le + 2d,3, Refs. (56, 64) pro2osed that the nominal tensile strength of the stud be taken 4'f' times the area A of the partial shear cone shown in Figure 88(b), where:
A = f1Tle (le + dh) - 2j K
1, + h) cos'
/ m \m
V(l, l, + dh) - i- + - (49) dh )2
(2
For embedded loop anchors, Refs. (55, 56) propose the use of these same equations, but with d,, set equal to zero and 1, taken as the overall length of the anchor.
In 1978, ACI Committee 349 proposed (65) that for a headed stud remote from an edge, the tensile strength governed by concrete for a headed stud should be taken as 4J7 times the projected area of the conical failure surface on the face of the concrete. This yields:
P0 = 4'7rL(1. + dh) (50)
This corresponds to taking P. as the component parallel to the axis of the stud, of the resultant tensile force corresponding to a tensile stress 4J acting normal to the conical failure surface shown in Figure 8 8(a).
Committee 349 did not propose an expression for the situation shown in Figure 8 8(b), since they require that the tensile strength calculated using Eq. 50 shall be greater than the tensile strength of the stud itself, so as to ensure a ductile failure. The committee, however, did specify a minimum edge distance requirement for embedded anchors to prevent failure due to lateral bursting forces at the anchor head.
Mind = d (51) V56
where d is the anchor diameter andJ is the minimum specified ultimate tensile strength of the anchor steel.
In 1982 Klingner and Mendonca (66) made an extensive review of available data on the tensile strength of headed stud anchors and embedded anchor bolts. They found considerable scatter in the tensile strength of anchors which failed by pulling out of the concrete; they also noted that Eq. 48, used as proposed in Refs. (55, 56, 62, 63, 64), could be considerably unconser-vative. They recommended the use of Eq. 50 proposed by ACI Committee 349 (65).
In 1985 Shaik and Yi (67) also reviewed the same data as was considered by Klingner and Mendonca (66). They came to the same conclusion, that Eq. 50 yields the best correlation with the test data. However, they preferred to interpret this equation as corresponding to a stress of (4/J) acting on the failure surface area A. given by Eq. 48. They proposed that this stress be rounded off to 2.8J so that the tensile strength of a headed stud, governed by concrete, becomes:
P. = (2.8J) A. (52)
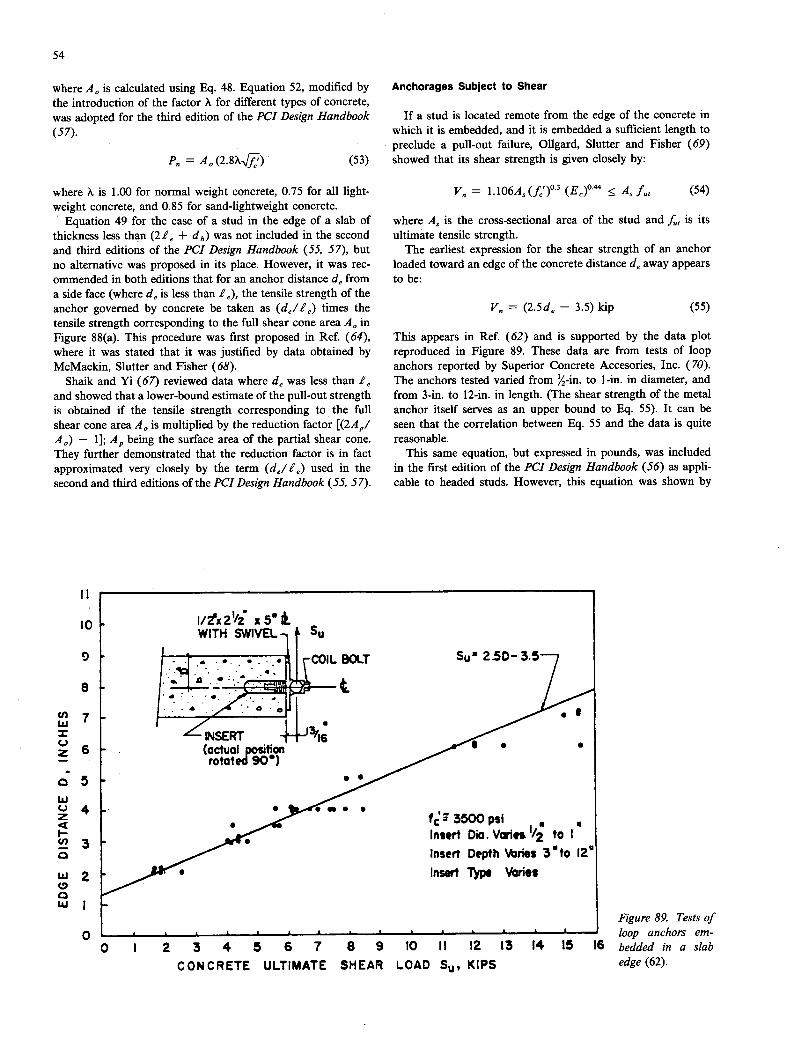
II.
10
9
8
[áI
54
where A. is calculated using Eq. 48. Equation 52, modified by the introduction of the factor X for different types of concrete, was adopted for the third edition of the PCI Design Handbook (57).
F,, = A 0 (2.8XJ) (53)
where X is 1.00 for normal weight concrete, 0.75 for all light-weight concrete, and 0.85 for sand-lightweight concrete.
Equation 49 for the case of a stud in the edge of a slab of thickness less than (2/ 0 + d) was not included in the second and third editions of the PCI Design Handbook (55, 57), but no alternative was proposed in its place. However, it was rec-ommended in both editions that for an anchor distance d, from a side face (where de is less than /), the tensile strength of the anchor governed by concrete be taken as (d0/10) times the tensile strength corresponding to the full shear cone area A. in Figure 88(a). This procedure was first proposed in Ref. (64), where it was stated that it was justified by data obtained by McMackin, Slutter and Fisher (68).
Shaik and Yi (67) reviewed data where de was less than / and showed that a lower-bound estimate of the pull-out strength is obtained if the tensile strength corresponding to the full shear cone area A,, is multiplied by the reduction factor [(2A/ A,,) - 1]; A
,, being the surface area of the partial shear cone.
They further demonstrated that the reduction factor is in fact approximated very closely by the term (deli,,) used in the second and third editions of the PCI Design Handbook (55, 57).
Anchorages Subject to Shear
If a stud is located remote from the edge of the concrete in which it is embedded, and it is embedded a sufficient length to preclude a pull-out failure, 011gard, Slutter and Fisher (69) showed that its shear strength is given closely by:
V0 = 1.106A. (f0')°• 3 (E0)° :~ A, f, (54)
where A. is the cross-sectional area of the stud and J, is its ultimate tensile strength.
The earliest expression for the shear strength of an anchor loaded toward an edge of the concrete distance d, away appears to be:
V0 = (2.5d, - 3.5) kip (55)
This appears in Ref. (62) and is supported by the data plot reproduced in Figure 89. These data are from tests of loop anchors reported by Superior Concrete Accesories, Inc. (70). The anchors tested varied from '2-in. to 1-in, in diameter, and from 3-in, to 12-in, in length. (The shear strength of the metal anchor itself serves as an upper bound to Eq. 55). It can be seen that the correlation between Eq. 55 and the data is quite reasonable.
This same equation, but expressed in pounds, was included in the first edition of the PCI Design Handbook (56) as appli-cable to headed studs. However, this equation was shown by
t/'x2112 x5'&
WITH SWiVEL- Su
rcOIL BOLT SUZ 25D3.5
1< ZSERT 43,,;
(actual position $ . S
rotated 901 55
. ._. S
f35OOpsi Insert Dia. Vies 1/2 to I
Insert Depth 'bnes 3to 120
Insert Type Varies
O I 2 3 4 5 6 7 8 9 tO II 12 13 14 IS 16
CONCRETE ULTIMATE SHEAR LOAD S, KIPS
Figure 89. Tests of loop anchors em-bedded in a slab edge (62).

55
x '4d
(a) ACI 349 failure surface
(b) Alternative failure surface
Figure 90. Spalling failure surfaces for shear loading toward an edge (65).
McMackin, Slutter and Fisher (68) to be conservative. They proposed that for headed studs loaded toward an edge of the concrete, the shear strength was that given by Eq. 54, multiplied by a reduction factor equal to [(d, - 1)/8d], in which d is the stud diameter.
Based on the data reported in Ref. (68), the following alter-native equation was proposed in Ref. (64):
V = X(3,250)(d, - 1)C~5,&00 pounds (56)
This is a lower-bound equation to the data and yields more conservative results than are obtained using the procedure pro-posed in Ref. (68). Equation 56 was subsequently incorporated in the second edition of the PCI Design Handbook (55).
In 1978 AC! Committee 349 proposed (65) that the shear resistance of an anchor loaded toward an edge of the concrete distance d, from its centerline, should be based on the load required to cause a spalling tensile failure on the half-conical surface shown in Figure 90(a). At failure, a tensile stress of 4jj was assumed to occur on this failure surface, and the failure load was taken to be the component of the resultant force acting parallel to the shear load V. This yields:
V = 4[ ()
= 2fr Td02
In 1982 Klingner and Mendonca (71) reviewed available data on the shear resistance of headed studs and short anchor bolts, and compared the test strengths with the strengths predicted by the equations discussed above. They recommended that for fully embedded anchors, the shear capacity governed by failure of the concrete should be calculated using Eq. 57.
Shaik and Yi (67) subsequently reviewed the same data as Klingner and Mendonca (71). They came to the same conclu-sion with regard to Eq. 57, but also recommended that use of the calculated pull-out strength as an upper limit on the cal-culated shear strength be abandoned. On their recommendation, Eq. 57 was included in the third edition of the PCI Design Handbook (57) in place of Eq. 56.
As part of this study, the data summarized by Kiingner and Mendonca (71) was reexamined. It was found that for small values of d,/d, such as are encountered when studs are embed-ded in the edge of a precast deck slab, Eq. 57 could be very conservative. It is felt that the failure surface on which Eq. 57 is based implies too small a bearing area between the stud and the apex of the half-cone of concrete being pushed out. It is therefore proposed that the alternative failure surface shown in Figure 90(b) be used. This results in a failure surface area of:
A 0 = [3(3d/4)(do V) + (1Tde)(doV)/2] (58) = 1J(2.25d. d, + 7rd22/2)
Assuming a tensile failure stress of 4Jj on this failure surface, the component of this failure stress parallel to the direction of shear V is V0 is then given by:
V = )[ (2.25d . d, + 7rd02/2)] (59)
= /7 (9d. d, + 277-d22)
In Figure 91, Eqs. 57 and 59 are compared with the test data summarized by Klinger and Mendonca (71) for which d2/d is less than or equal to 8. It can be seen that with the exception of three 3/4-in.-diameter bolt specimens, Eq. 59 provides a rea-sonable lower bound to the data for anchors varying from 3/4
in. to 2 in. in diameter. This figure shows the conservatism of Eq. 57 for those situations in which d0/d is small, and also shows the scatter in the available test data.
Anchorage Subject to Shear and Tension
For the case of anchorage failure governed by concrete failure, the following interaction equation was proposed in Ref. (62) on the basis of "unpublished test data."
VV 4/3
) -
1 (60)
where P and V are the factored applied tension and shear loads

56
20
15
- !•• dia. studs o - 3/4in. dia. bolts A— I in. dia. bolts
v 21TdJ
I I I I 0 2 4 6
de/d
8 re Figure 91. Comparison of test data and shear strengths pre- dicted by Eqs. 57 and 59.
respectively, and P and V are both based on the nominal tensile strength of the anchorage
This equation was incorporated into the first and second editions of the PCI Design Handbook (56, 55) and Ref. (63), but V. was taken equal to O.75Aj0 (providing d is not less than 4E). These publications als'b included the following equa-tion for the case of failure governed by yield of the steel anchor.
()
P2 2
+ U V
) < 1 (61)
This equation was based on Section 1.6.3 of the 1969 edition of the "AISC Commentary" (72). (PP0 and 4) V were taken as 0.90Aj and 0.75A5 f0,, respectively.
in 1973 McMackin, Slutter and Fisher (68) reported tests of headed stud shear connectors subject to combined shear and tension. They found that for both failures governed by concrete failure and failures of fully embedded studs, the strength under combined loading was best represented by the equation:
i (T F)
)53
+ ( < 1 (62)
For both failure conditions, V was calculated using Eq. 54. For concrete failure, P. was taken as 4Cf, A0, where A. was cal-culated using Eq. 48. For the fully embedded stud, P. was taken as A,,f 1.
Equation 62 was incorporated into the PCI Manual for Struc-tural Design of Architectural Precast Concrete (73) published in 1977. However, the third edition of the PCI Design Handbook
(57) reverted to the use of Eq. 61 for both steel and concrete anchorage failures. But the strength reduction factor 4) is in-trodüced into the equation in a different way, as shown below.
1 P 2
(Tn) +
(V.) < 1 (63)
where 4) is 0.85 for failure governed by concrete and 1.0 for failure governed by yield of steel. For concrete failure, P. is calculated using Eq. 53 and V. is taken as the lesser of V. given by Eq. 57 and P0. For steel yield, P. and V. are taken equal to 0.9Af0, and 0.75A,,/ respectively.
Using the specified values for 4), P0, and V0, Eq. 63 yields the same results for steel as Eq. 61. However, for concrete the equation is less conservative than is normal practice for shear or tension acting alone, e.g., if V is zero, Eq. 63 requires P to be = ,JP0 rather than = 4)P,,; and similarly if P is zero, Eq. 63 requires V to be = V,, rather than = 4) V0.
AC! Committee 349 proposed (in Section B6.3.2, Ref. 65) that, "For bolts, studs and bars the area of steel required for tension and shear shall be considered additive." This is equiv-alent to assuming a linear interaction relationship for shear and tension.
Shear Strength of Grouted Keyed Joints
Nb test data were located on the shear strength of a single groUted key, as is used between adjoining edges of precast con-crete bridge members. However, the Danish Building Research Institute has reported (74) on tests of keyed joints between
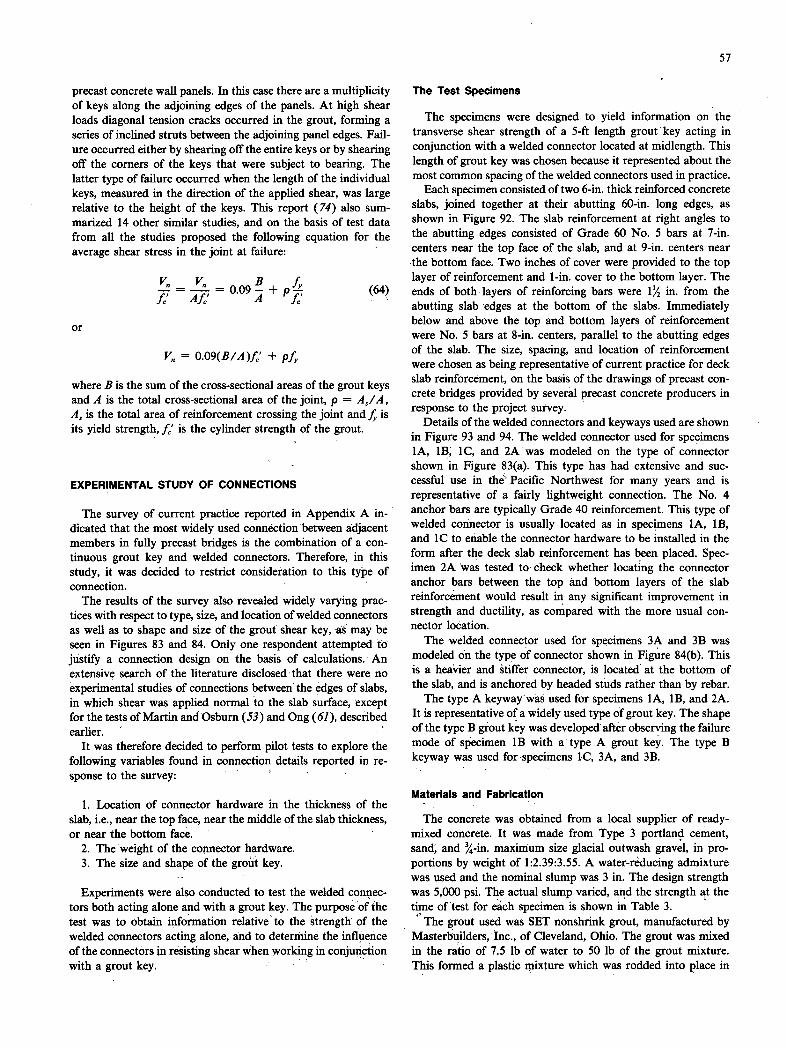
57
precast concrete wall panels. In this case there are a multiplicity of keys along the adjoining edges of the panels. At high shear loads diagonal tension cracks occurred in the grout, forming a series of inclined struts between the adjoining panel edges. Fail-ure occurred either by shearing off the entire keys or by shearing off the corners of the keys that were subject to bearing. The latter type of failure occurred when the length of the individual keys, measured in the direction of the applied shear, was large relative to the height of the keys. This report (74) also sum-marized 14 other similar studies, and on the basis of test data from all the studies proposed the following equation for the average shear stress in the joint at failure:
(64)
or
= 0.09(B/A)f,' + pf,
where B is the sum of the cross-sectional areas of the grout keys and A is the total cross-sectional area of the joint, p = A,/A, A, is the total area of reinforcement crossing the joint and f, is its yield strength, f, is the cylinder strength of the grout.
EXPERIMENTAL STUDY OF CONNECTIONS
The survey of current practice reported in Appendix A in-dicated that the most widely used connection between adjacent members in fully precast bridges is the combination of a con-tinuous grout key and welded connectors. Therefore, in this study, it was decided to restrict consideration to this type of connection.
The results of the survey also revealed widely varying prac-tices with respect to type, size, and location of welded connectors as well as to shape and size of the grout shear key, as may be seen in Figures 83 and 84. Only one respondent attempted to justify a connection design on the basis of calculations. An extensive search of the literature disclosed that there were no experimental studies of connections between the edges of slabs, in which shear was applied normal to the slab surface, except for the tests of Martin and Osburn (53) and Ong (61), described earlier.
It was therefore decided to perform pilot tests to explore the following variables found in connection details reported in re-sponse to the survey:
Location of connector hardware in the thickness of the slab, i.e., near the top face, near the middle of the slab thickness, or near the bottom face.
The weight of the connector hardware. The size and shape of the grout key.
Experiments were also conducted to test the welded connec-tors both acting alone and with a grout key. The purpose of the test was to obtain information relative to the strength of the welded connectors acting alone, and to determine the influence of the connectors in resisting shear when working in conjunction with a grout key.
The Test Specimens
The specimens were designed to yield information on the transverse shear strength of a 5-ft length grout key acting in conjunction with a welded connector located at midlength. This length of grout key was chosen because it represented about the most common spacing of the welded connectors used in practice.
Each specimen consisted of two 6-in. thick reinforced concrete slabs, joined together at their abutting 60-in, long edges, as shown in Figure 92. The slab reinforcement at right angles to the abutting edges consisted of Grade 60 No. 5 bars at 7-in. centers near the top face of the slab, and at 9-in, centers near the bottom face. Two inches of cover were provided to the top layer of reinforcement and 1-in, cover to the bottom layer. The ends of both layers of reinforcing bars were l/2 in. from the abutting slab edges at the bottom of the slabs. Immediately below and above the top and bottom layers of reinforcement were No. 5 bars at 8-in, centers, parallel to the abutting edges of the slab. The size, spacing, and location of reinforcement were chosen as being representative of current practice for deck slab reinforcement, on the basis of the drawings of precast con-crete bridges provided by several precast concrete producers in response to the project survey.
Details of the welded connectors and keyways used are shown in Figure 93 and 94. The welded connector used for specimens lA, 1B lC, and 2A was modeled on the type of connector shown in Figure 83(a). This type has had extensive and suc-cessful use in the Pacific Northwest for many years and is representative of a fairly lightweight connection. The No. 4 anchor bars are typically Grade 40 reinforcement. This type of welded connector is usually located as in specimens 1A, 18, and 1C to enable the connector hardware to be installed in the form after the deck slab reinforcement has been placed. Spec-imen 2A was tested to check whether locating the connector anchor bars between the top and bottom layers of the slab reinforcement would result in any significant improvement in strength and ductility, as compared with the more usual con-nector location.
The welded connector used for specimens 3A and 3B was modeled on the type of connector shown in Figure 84(b). This is a heavier and stiffer connector, is located at the bottom of the slab, and is anchored by headed studs rather than by rebar.
The type A keywaywai used for specimens 1A, 113, and 2A. It is representative of a widely used type of grout key. The shape of the type B grout key was developed after observing the failure mode of specimen lB with a type A grout key. The type B keyway was used for specimens lC, 3A, and 3B.
Materials and Fabrication
The concrete was obtained from a local supplier of ready-mixed concrete. It was made from Type 3 portland cement, sand, and %-in. maximum size glacial outwash gravel, in pro-portions by weight of 1:2.39:3.55. A water-reducing admixture was used and the nominal slump was 3 in. The design strength was 5,000 psi. The actual slump varied, and the strength at the time of test for each specimen is shown in Table 3.
The grout used was SET nonshrink grout, manufactured by Masterbuilders, Inc., of Cleveland, Ohio. The grout was mixed in the ratio of 7.5 lb of water to 50 lb of the grout mixture. This formed a plastic mixture which was rodded into place in

58
reaction frame 161
36 36
60k ram 1 ' load
460k
_I
connector distribution ram load cell A under test beam cell A
_______
6x6xl "0 z 6 54x1/2 -
_____ _______ I l0+l0 1 'S
Ox54 6 II I A
ii support : lB I load cell l2 block I iIjI-load celIBi
B- LI
Sec. B-B \l 0 bars) each Elevation SI
tensiored to
r- 28 -47 'll.l2'4 8 '40 kips
I
f I6x6xl I 6
20 I loading I Lf.J -i
fT_Il Plan
,plates I 16
6020 16 Sec. A-A
HEf3--I 20
i I 16 All dimensions _- in inches.
31
Figure 92 Arrangements for tests offlange connections.
Table 3. Spechnen data.
Specimen Concrete Grout Shear in No. Strength Strength Connection
(psi) (psi) at Failure (1) (2) (kips)
1A 5470 - 4.78
lB 5895 3380 11.60
1C 5775 3615 17.35
2A 5680 - 4.95
3A 5600 - 6.70
38 4400 4175 20.38
)1) Measured on 6 x 12 in. cylinders.
(2) Measured on 2 x 4 in. cylinders.

L IL 2kd'c length 6
4 ' 4-..
2x14x4 -I--i J2
I-Il ' 1 F2
05 bar slab orcement
ors
: f15*
I6X 8 r-'- :1-" .fl'ihII)1t 1% L%J,L -
05 bar slab reinforcemei
gg6 I eaded studs
r--—- AU dim. in inches
(b) Connector details, specimens 3A a 3B
Figure 94. Connector details, specimens 2A, 3A, and 3B.
ft 6 r :
L 4*4x length 8
4
2 v 1j.x 4
L 2slx, length 6
12
-H *5 bar slab reinforcement
4 '4-- I
24 bars
59
(a) Connector details, specimens IA, lB & IC
'2 1,2 I
structural grout
foam
Type A Type B
(b) Keywoy details All dim, in inches
Figure 93. Connector details, specimens 1A, lB. and 1C; and keyway detaik
(a) Connector details, specimen 2A
the keyway. Its strength at the time of the test, 2 days after placing, was about 3,500 psi (measured on 2-in, diameter X 4-in. long cylinders). The actual group strengths at the time of test are given in Table 3.
The reinforcing bars used conformed to ASTM A615. The No. 5 bars were Grade 60, but their actual yield strength was 75.2 ksi. The No. 4 bars used to anchor the welded connectors were Grade 40, but their actual yield strengths were 51.3 ksi in specimens 1A and 1B, and 52.5 ksi in specimens 1C and 2A. Both sizes of bar had a clearly defmed yield point.
The %-in. diameter headed studs "as supplied" had no clearly defmed yield point and had an ultimate tensile strength of 68.7 ksi. To fabricate the connector hardware for specimens 3A and 3B, it was necessary to heat the studs in order to bend them 15 deg after welding them to the angles. A straight stud heated in the same manner developed an upper yield point of 60.0 ksi, a yield plateau of 50.7 ksi, and an ultimate tensile strength of 68.1 ksi.

60
The slabs were cast in plastic-coated plywood forms. They were cured for 2 days in forms covered by polythene sheeting; and subsequently in air, in the laboratory, until the time of testing.
After removal from the form, the smaller slab was placed on a 4-in. thick bed of mortar on the support block, as shown in Figure 92. The four 1-in, diameter bars were hand-tightened at this time. Shortly before testing, these bars were each tensioned to 40 kip. This ensured that for connection forces of up to 40 kip, the mortar joint between the slab and the support block would remain entirely in compression. This was intended to provide fixity for the cantilever portion of this slab.
Steel bars, each 1 )< l/2 X 4 in., were bolted to the underside of the cantilever slab 44 in. from each end, so that they projected
in. beyond the edge at which the connection was to be made. The second slab was then placed in position, supported on the projecting bars and on roller bearings at the opposite edge, as shown in Figure 92. This slab was temporarily bolted to the projecting bars, to hold it in position while the connection was made. The weld plate was next welded in position, and after it had cooled a strain gage was attached to it at the centerline of the connection. Grouting of the keyway was then carried out for specimens 1B, 1C, and 313. The exposed surface of the grout was kept moist until it was time to conduct the test.
Instrumentation and Data Acquisition
Instrumentation was as follows:
One-eighth-inch gage length strain gages were attached to the top and bottom of one anchor bar or stud on each side of the connection, located 1-in, from the angle to which the bar or stud was welded.
A 8-in. gage length strain gage was attached to the middle of the top surface of the weld plate, in specimens 1A, 113, 1C, and 2A.
A vertically mounted LVDT was attached to brass fittings epoxied to the slabs on opposite sides of the keyway, immediately to one side of the welded connector. This LVDT measured vertical displacement of one side of the connection relative to the other.
Horizontally mounted LVDT's were attached to brass fit-tings epoxied to the slabs on opposite sides of the keyway, one LVDT near each end of the keyway. The readings of these LVDT's were averaged to obtain the horizontal separation oc-curring at the connection.
The applied load and the reaction at the outer edge of the loaded slab were measured by load cells A and B shown in Figure 92. The data from the strain gages, the LVDT's, and the load cells were monitored initially and after each increment of load by Vishay digital recorder.
Testing Arrangements and Procedures
The general arrangements for testing the specimens may be seen in Figure 92. The load was applied through crossed roller bearings and 6-in. X 6-in, loading plates at points 7 in. from the centerline of the connection and 10 in. each side of the center of the keyway. Two-point loading was used so that the connector would be free to fail by tearing out of the top face of the slab, without restraint from the load.
The dimensions of the specimen at right angles to the keyway, and the locations of the loading plates and supporting bearings, were chosen so that if the slabs were continuous with one another and of uniform flexural stiffness, there would be zero moment at the connection. This assumes that full fixity exists for the cantilever slab. For this idealized situation, the shear in the connection due to the applied load would be 80 percent of that load.
In the tests, the actual shear in the connection was obtained from the readings of load cells A and B. For specimens lA, 2A, and 3A in which the keyway was not grouted, the actual shear in the connection due to applied load was almost exactly 80 percent of that load, indicating zero moment in the connec-tion. This also corresponds to the connectors acting like hinges.
At ultimate, the shear in connections lB, 1C, and 313 was 79, 80, and 72 percent of the applied load respectively. This indicates that specimen lB behaved as intended, whereas in specimen 3B a small positive moment existed at the connection, and in spec-imen 1C a small negative moment existed at the connection. This corresponds to some loss of fixity of the cantilever slab in specimen 313, and some settlement of the outer support in spec-imen lC.
In the tests, zero strain and displacement readings were taken with the slab to be loaded still supported on the steel bars bolted to the cantilever slab. The steel bars were then unbolted from the cantilever slab, so that the dead load shear was now carried by the connection. The strains and displacements were again read. The applied load was then increased incrementally until failure occurred. After each increment of load, the load, the outer reaction, and the strains and displacements were recorded, and any new cracks in the slabs were marked.
Specimen Behavior
Ungrouted Connections
In specimen lA, in which the connector anchor bars were above the slab reinforcement, the angle embedded in the loaded slab started to lift at its front edge at a shear of 2.55 kip. Above this shear the vertical displacement between opposite faces of the connection increased more rapidly, as may be seen in Figure 95. Up to this shear, the variation of the strains in the anchor bar in the loaded slab indicated increasing bending of the bar (see Fig. 96). Above this shear, the measured strains indicate decreasing bending at this location, but a more rapidly increasing tension force in the anchor bars, as may be seen in Figure 97. It seems likely that a horizontal splitting crack in the plane of the anchor bars in the loaded slab initiated at this shear, and that the point of maximum bending in the anchor bars moved further into the slab.
As the shear was further increased, the angle embedded in the loaded slab was seen to be lifting more, but no cracking of concrete was visible until a shear of 4.48 kip. At this point, a 2.3-in, long crack appeared on the top face of the loaded slab, running into the slab at 45 deg to the slab edge, starting at one corner of the block-out in which the connector angle was re-cessed. When the shear was increased to 4.78 kip, additional cracking occurred and the shear dropped to 3.77 kip. This cracking was similar to the first crack, but originated at the other corner of the block-out. Also, an inclined crack appeared on the edge of the slab, traveling upward to the top face, from
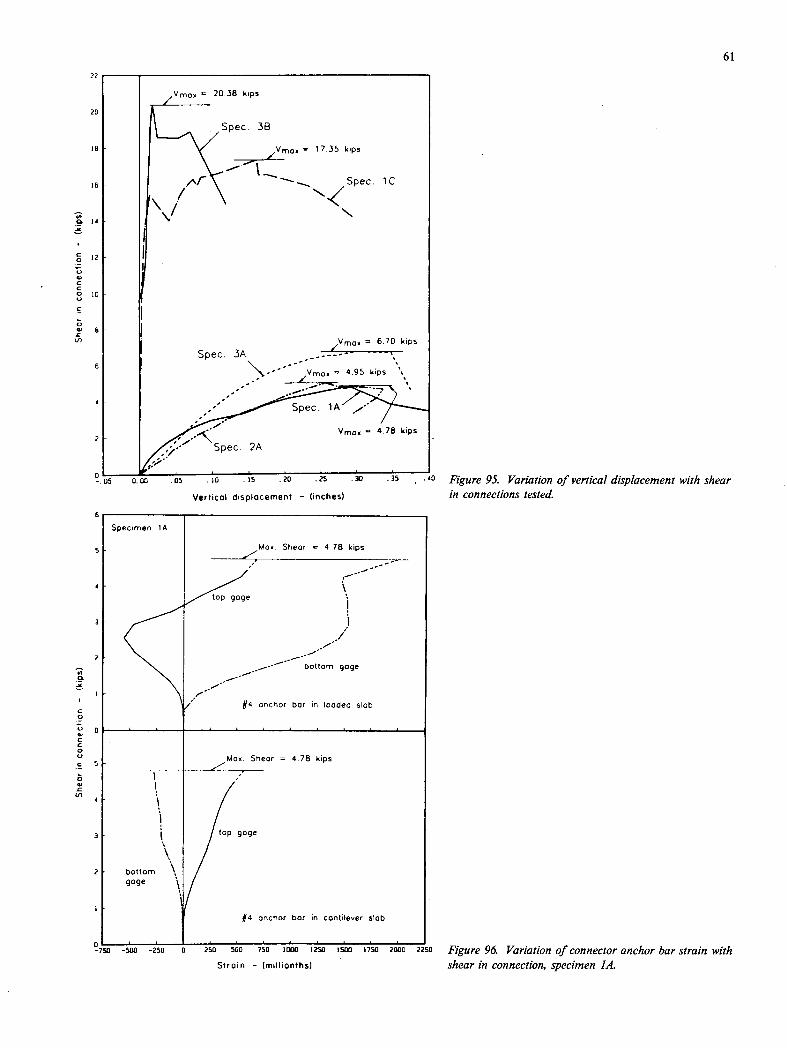
22
20
18
16
S
2
61
/Vmox 20.36 kips
Lpec
3B
Vmo4 17.35 kips
r .. Spec.1C
N
1AVmo. 78kips
I 'Spec. 2A
nOn .65 .10 .15 .20 .25
0 Figure 95. Variation of vertical displacement with shear Vertical displacement - (inches)
in connections tested.
Specimen 1A
Max,Shear 4 78 kips
top gage
/ \
-bottom gage e
#4 anchor bar inloaded slab
Max. Shear = 4.78 kips
top gage
bottom gage
#4 anchor bar in contilexer slab
-750-500 -250 0 250 500 750 1000 1250 1500 1750 2000 2250 Figure 96. Variation of connector anchor bar strain with Strain - (millionths) shear in connection, specimen JA.
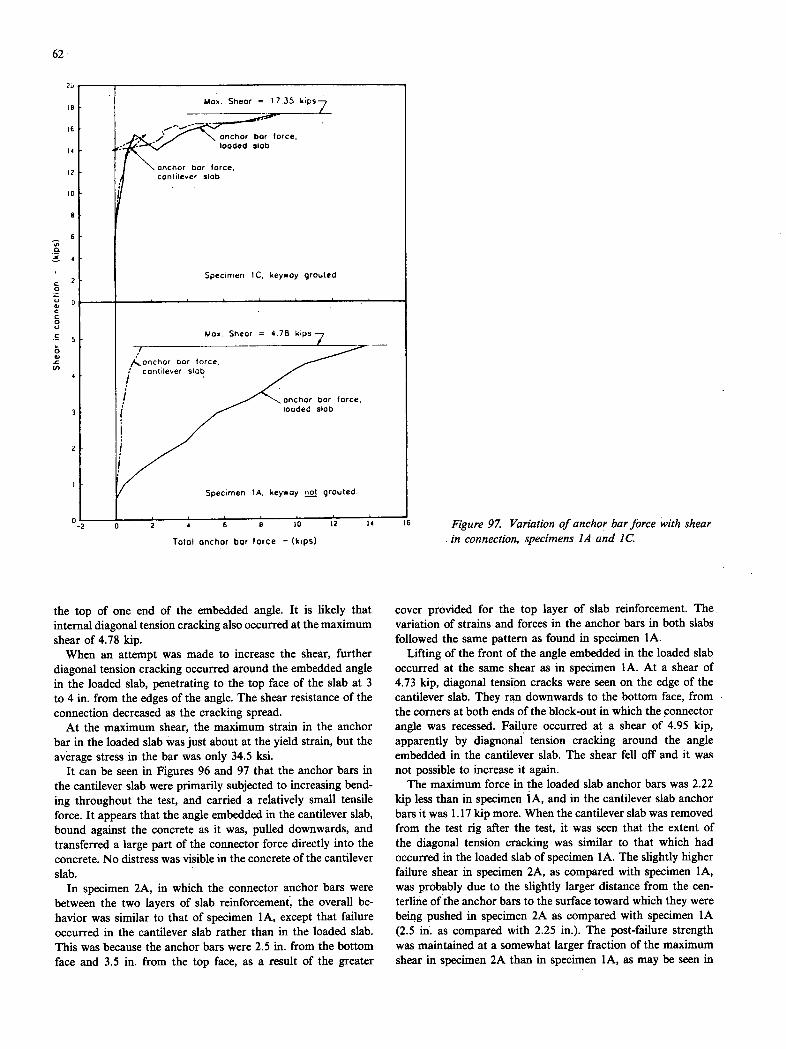
0 -2
Max. Shear 17.35 kips
oncor
force,
ranchor
illf
Specimen 1 C, keywoy grouted.
Max. Shear 4.78 kips 7 ,4orichOr bar force.
cantileverslab
anchor bar force. loaded slab
Specimen 1A. keywoy CQ! grouted.
Total anchor bar force - (kips)
62
20
16 Figure 97. Variation of anchor bar force with shear in connection, specimens 1A and 1C.
the top of one end of the embedded angle. It is likely that internal diagonal tension cracking also occurred at the maximum shear of 4.78 kip.
When an attempt was made to increase the shear, further diagonal tension cracking occurred around the embedded angle in the loaded slab, penetrating to the top face of the slab at 3 to 4 in. from the edges of the angle. The shear resistance of the connection decreased as the cracking spread.
At the maximum shear, the maximum strain in the anchor bar in the loaded slab was just about at the yield strain, but the average stress in the bar was only 34.5 ksi.
It can be seen in Figures 96 and 97 that the anchor bars in the cantilever slab were primarily subjected to increasing bend-ing throughout the test, and carried a relatively small tensile force. It appears that the angle embedded in the cantilever slab, bound against the concrete as it was, pulled downwards, and transferred a large part of the connector force directly into the concrete. No distress was visible in the concrete of the cantilever slab.
In specimen 2A, in which the connector anchor bars were between the two layers of slab reinforcement, the overall be-havior was similar to that of specimen 1A, except that failure occurred in the cantilever slab rather than in the loaded slab. This was because the anchor bars were 2.5 in. from the bottom face and 3.5 in. from the top face, as a result of the greater
cover provided for the top layer of slab reinforcement. The. variation of strains and forces in the anchor bars in both slabs followed the same pattern as found in specimen lA.
Lifting of the front of the angle embedded in the loaded slab occurred at the same shear as in specimen 1A. At a shear of 4.73 kip, diagonal tension cracks were seen on the edge of the cantilever slab. They ran downwards to the bottom face, from the corners at both ends of the block-out in which the connector angle was recessed. Failure occurred at a shear of 4.95 kip, apparently by diagnonal tension cracking around the angle embedded in the cantilever slab. The shear fell off and it was not possible to increase it again.
The maximum force in the loaded slab anchor bars was 2.22 kip less than in specimen lA, and in the cantilever slab anchor bars it was 1.17 kip more. When the cantilever slab was removed from the test rig after the test, it was seen that the extent of the diagonal tension cracking was similar to that which had occurred in the loaded slab of specimen 1A. The slightly higher failure shear in specimen 2A, as compared with specimen lA, was probably due to the slightly larger distance from the cen-terline of the anchor bars to the surface toward which they were being pushed in specimen 2A as compared with specimen lA (2.5 in. as compared with 2.25 in.). The post-failure strength was maintained at a somewhat larger fraction of the maximum shear in specimen 2A than in specimen 1A, as may be seen in
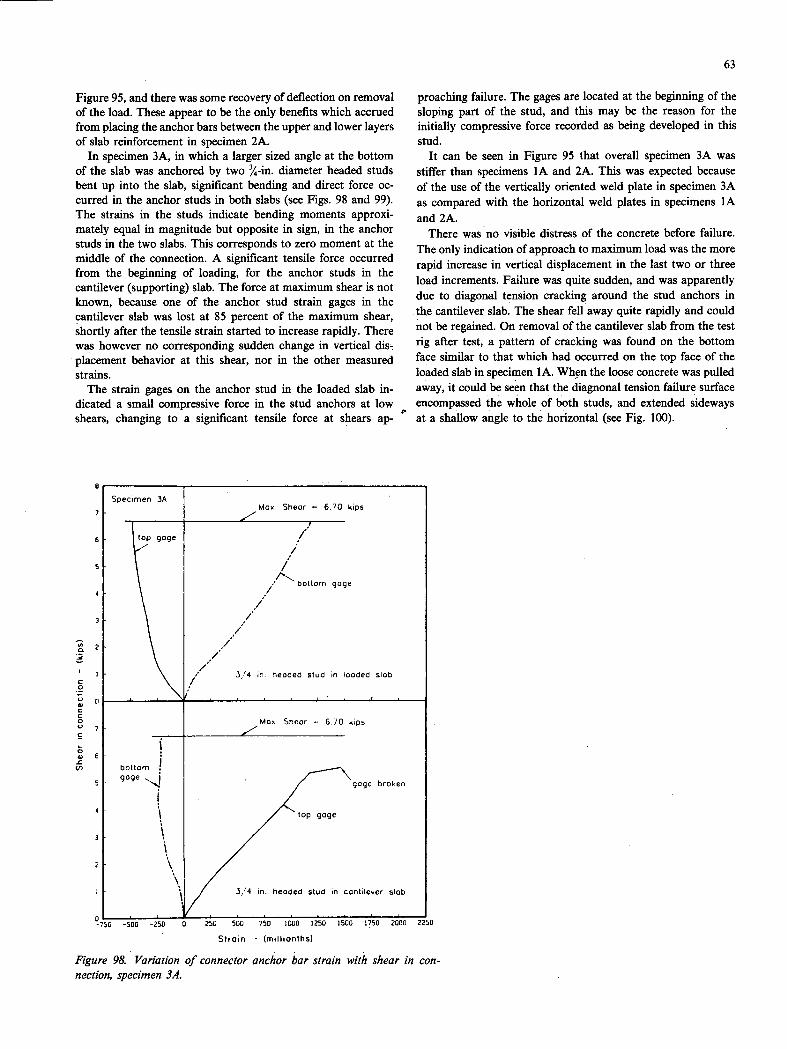
63
Figure 95, and there was some recovery of deflection on removal of the load. These appear to be the only benefits which accrued from placing the anchor bars between the upper and lower layers of slab reinforcement in specimen 2A.
In specimen 3A, in which a larger sized angle at the bottom of the slab was anchored by two %-in. diameter headed studs bent up into the slab, significant bending and direct force oc-curred in the anchor studs in both slabs (see Figs. 98 and 99). The strains in the studs indicate bending moments approxi-mately equal in magnitude but opposite in sign, in the anchor studs in the two slabs. This corresponds to zero moment at the middle of the connection. A significant tensile force occurred from the beginning of loading, for the anchor studs in the cantilever (supporting) slab. The force at maximum shear is not known, because one of the anchor stud strain gages in the cantilever slab was lost at 85 percent of the maximum shear, shortly after the tensile strain started to increase rapidly. There was however no corresponding sudden change in vertical dis-placement behavior at this shear, nor in the other measured strains.
The strain gages on the anchor stud in the loaded slab in-dicated a small compressive force in the stud anchors at low shears, changing to a significant tensile force at shears ap-
proaching failure. The gages are located at the beginning of the sloping part of the stud, and this may be the reason for the initially compressive force recorded as being developed in this stud.
It can be seen in Figure 95 that overall specimen 3A was stiffer than specimens lA and 2A. This was expected because of the use of the vertically oriented weld plate in specimen 3A as compared with the horizontal weld plates in specimens lA and 2A.
There was no visible distress of the concrete before failure. The only indication of approach to maximum load was the more rapid increase in vertical displacement in the last two or three load increments. Failure was quite sudden, and was apparently due to diagonal tension cracking around the stud anchors in the cantilever slab. The shear fell away quite rapidly and could not be regained. On removal of the cantilever slab from the test rig after test, a pattern of cracking was found on the bottom face similar to that which had occurred on the top face of the loaded slab in specimen 1A. When the loose concrete was pulled away, it could be seen that the diagnonal tension failure surface encompassed the whole of both studs, and extended sideways at a shallow angle to the horizontal (see Fig. 100).
Specimen 3A Max. Shear 6.70 kips
top gage 7
Y / /
bottom gage
3/4 in heoded stud in loaded slab /
Max Shear - 6 70 kips
bottom gage
gage broken
,,7' "top gage
\
\ 3,4 in. headed stud in cantilever slab
-750 -500 -250 0 250 500 750 1000 1250 1500 1750 2000 2270
Strain - (millionths)
Figure 98. Variation of connector anchor bar strain with shear in con-nection, specimen 3A.

Ma Shear - 20.38
anchor trce, - COntilener slab
/
1i II
/ anchor lorce, loaded slab
Specimen 38, keywoy grouted.
Mo. Shear 610 kips
uJcl1or lwi.u, loaded slob -
(/ ,1 Specimen 3A, keywoy not grouted
p/ . . .,•
- -T_
-2 0 2 4 6 6 JO 12 14 19 is 20 22
Total onchor force - (kips)
Figure 99. Variation of anchor bar force with shear in connection, sped-mens 3A and 3B.
Figure 100. Specimen 3A, underside of £ant'icvcr slab after tesr—loose concrete removed and connector hardware rep/aced in oKginal position.
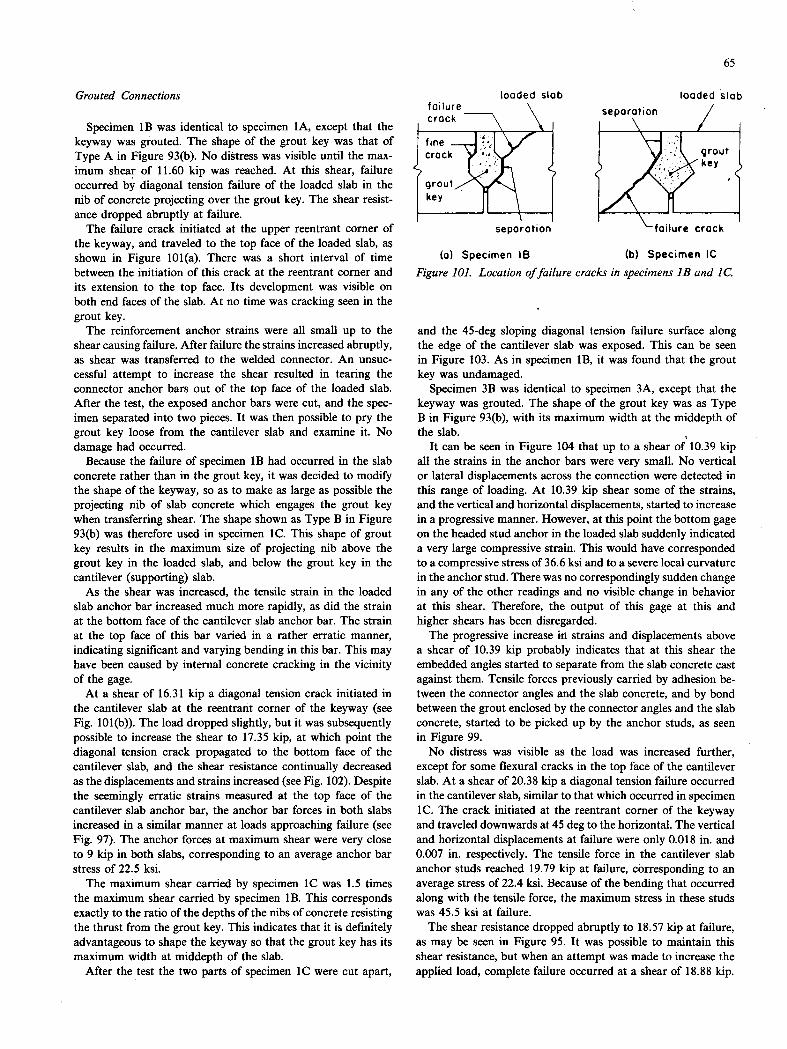
65
Grouted Connections
Specimen lB was identical to specimen lA, except that the keyway was grouted. The shape of the grout key was that of Type A in Figure 93(b). No distress was visible until the max-imum shear of 11.60 kip was reached. At this shear, failure occurred by diagonal tension failure of the loaded slab in the nib of concrete projecting over the grout key. The shear resist-ance dropped abruptly at failure.
The failure crack initiated at the upper reentrant corner of the keyway, and traveled to the top face of the loaded slab, as shown in Figure 101(a). There was a short interval of time between the initiation of this crack at the reentrant corner and its extension to the top face. Its development was visible on both end faces of the slab. At no time was cracking seen in the grout key.
The reinforcement anchor strains were all small up to the shear causing failure. After failure the strains increased abruptly, as shear was transferred to the welded connector. An unsuc-cessful attempt to increase the shear resulted in tearing the connector anchor bars out of the top face of the loaded slab. After the test, the exposed anchor bars were cut, and the spec-imen separated into two pieces. It was then possible to pry the grout key loose from the cantilever slab and examine it. No damage had occurred.
Because the failure of specimen lB had occurred in the slab concrete rather than in the grout key, it was decided to modify the shape of the keyway, so as to make as large as possible the projecting nib of slab concrete which engages the grout key when transferring shear. The shape shown as Type B in Figure 93(b) was therefore used in specimen 1C. This shape of grout key results in the maximum size of projecting nib above the grout key in the loaded slab, and below the grout key in the cantilever (supporting) slab.
As the shear was increased, the tensile strain in the loaded slab anchor bar increased much more rapidly, as did the strain at the bottom face of the cantilever slab anchor bar. The strain at the top face of this bar varied in a rather erratic manner, indicating significant and varying bending in this bar. This may have been caused by internal concrete cracking in the vicinity of the gage.
At a shear of 16.31 kip a diagonal tension crack initiated in the cantilever slab at the reentrant corner of the keyway (see Fig. 101(b)). The load dropped slightly, but it was subsequently possible to increase the shear to 17.35 kip, at which point the diagonal tension crack propagated to the bottom face of the cantilever slab, and the shear resistance continually decreased as the displacements and strains increased (see Fig. 102). Despite the seemingly erratic strains measured at the top face of the cantilever slab anchor bar, the anchor bar forces in both slabs increased in a similar manner at loads approaching failure (see Fig. 97). The anchor forces at maximum shear were very close to 9 kip in both slabs, corresponding to an average anchor bar stress of 22.5 ksi.
The maximum shear carried by specimen 1 C was 1.5 times the maximum shear carried by specimen lB. This corresponds exactly to the ratio of the depths of the nibs of concrete resisting the thrust from the grout key. This indicates that it is definitely advantageous to shape the keyway so that the grout key has its maximum width at middepth of the slab.
After the test the two parts of specimen 1 C were cut apart,
loaded slab loaded slab failure separation crock
/
line crack
' 1 L
grout
key
separation 'failure crack
(o) Specimen lB (b) Specimen IC
Figure 101. Location offailure cracks in specimens lB and IC.
and the 45-deg sloping diagonal tension failure surface along the edge of the cantilever slab was exposed. This can be seen in Figure 103. As in specimen 113, it was found that the grout key was undamaged.
Specimen 3B was identical to specimen 3A, except that the keyway was grouted. The shape of the grout key was as Type B in Figure 93(b), with its maximum width at the middepth of the slab.
It can be seen in Figure 104 that up to a shear of 10.39 kip all the strains in the anchor bars were very small. No vertical or lateral displacements across the connection were detected in this range of loading. At 10.39 kip shear some of the strains, and the vertical and horizontal displacements, started to increase in a progressive manner. However, at this point the bottom gage on the headed stud anchor in the loaded slab suddenly indicated a very large compressive strain. This would have corresponded to a compressive stress of 36.6 ksi and to a severe local curvature in the anchor stud. There was no correspondingly sudden change in any of the other readings and no visible change in behavior at this shear. Therefore, the output of this gage at this and higher shears has been disregarded.
The progressive increase in strains and displacements above a shear of 10.39 kip probably indicates that at this shear the embedded angles started to separate from the slab concrete cast against them. Tensile forces previously carried by adhesion be-tween the connector angles and the slab concrete, and by bond between the grout enclosed by the connector angles and the slab concrete, started to be picked up by the anchor studs, as seen in Figure 99.
No distress was visible as the load was increased further, except for some flexural cracks in the top face of the cantilever slab. At a shear of 20.38 kip a diagonal tension failure occurred in the cantilever slab, similar to that which occurred in specimen lC. The crack initiated at the reentrant corner of the keyway and traveled downwards at 45 deg to the horizontal. The vertical and horizontal displacements at failure were only 0.018 in. and 0.007 in. respectively. The tensile force in the cantilever slab anchor studs reached 19.79 kip at failure, corresponding to an average stress of 22.4 ksi. Because of the bending that occurred along with the tensile force, the maximum stress in these studs was 45.5 ksi at failure.
The shear resistance dropped abruptly to 18.57 kip at failure, as may be seen in Figure 95. It was possible to maintain this shear resistance, but when an attempt was made to increase the applied load, complete failure occurred at a shear of 18.88 kip.

050 -500 -250 - 0 250 500 750 1008 12581580 1750 20002250
Strain - (millionths)
Figure 102. Variation of connector anchor bar strain with shear in con-nection, specimen JC'.
20
8
IS
II
2
10
l0
8
6
2
Specmerr 1C Mo Shear = 1735 SIps
top goge=
# 4 onchor bar in loaded slob
Max. Shear 17 35 Sips
"top gage
# 4 anchor bar in canliener Slob
Figure 103. Specimen IC, underside of cantilever slab after test.

-750 -500 -750 0 250 500 750 1000 1250 1500 1750 dIIIII 2250
Strain - (millionths)
Figure 104. Variation of connector anchor bar strain with shear in con-nection, specimen 3B.
24
22
26
lb
16
14
12
ID
14
2
0
8
6
Spec.men 361 Mo Shear = 2038 eps
jK / bottom goge
/ top gcge
3 4 in, headed Stud in bOded slob
Max.Shear = 20.38 klps
gage
.op gag
3/4 in. headed stud in cantileser slab
67
Discussion of Test Results
Service Load Behavior
It can be seen in Figure 95 that the grouted connections are vastly more stiff than the ungrouted connections. This indicates that in a grouted connection at service load, virtually no shear is carried by the welded connector because of the rigidity of the grout key. This is also reflected in the very small connector anchor forces measured at service load in the grouted connec-tions (see Figs. 97 and 99).
No tension force was applied across the connection in these tests. However, if anchor reinforcement sufficient to carry tensile forces due to causes other than shear is provided in addition to that required for shear resistance, then it is considered that any crack at the grout key—concrete interface at service load will be fine, and the shear behavior will be as seen in these tests.
A similar situation occurs in the transfer of shear across a rough crack in concrete. At service load there is little or no stress in the "shear friction reinforcement" crossing the crack, the shear being transferred primarily by interlocking of projec-
tions on the rough crack faces. Only at high loads does the shear friction reinforcement become highly stressed as slip and separation occur between the faces of the crack. Shear is then resisted by a combination of the interlocking effect and friction between the crack faces. It has been shown (75) that if sufficient reinforcement to carry any tensile force acting across the crack is provided in addition to the shear friction reinforcement, the shear strength is not reduced and the service load behavior is not degraded by the presence of the tensile force.
The negligible displacement between opposite sides of the connections and the small connector anchor forces at service load are an indication of why grouted connections of this type have given good service for many years in the great majority of cases. If a wearing surface is placed on the deck, small displacements across the connection will not cause distress in the wearing surface. Also, the likelihood of fatigue failure of the connector anchors, because of repeated application of service load, is remote due to the small stresses produced in the anchors by service loads.
The much larger displacement and anchor stresses at service load in the ungrouted connections make them unsuitable for anything but temporary use in a light duty situation.
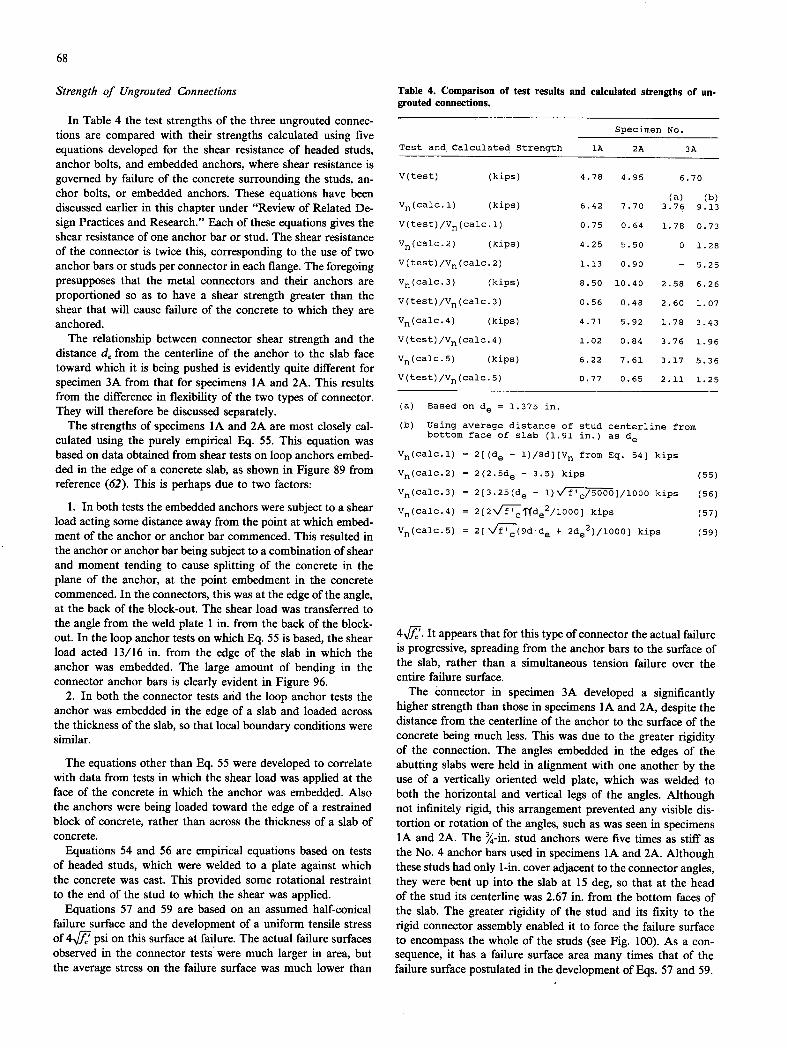
68
Strength of Ungrouted Connections
In Table 4 the test strengths of the three ungrouted connec-tions are compared with their strengths calculated using five equations developed for the shear resistance of headed studs, anchor bolts, and embedded anchors, where shear resistance is governed by failure of the concrete surrounding the studs, an-chor bolts, or embedded anchors. These equations have been discussed earlier in this chapter under "Review of Related De-sign Practices and Research." Each of these equations gives the shear resistance of one anchor bar or stud. The shear resistance of the connector is twice this, corresponding to the use of two anchor bars or studs per connector in each flange. The foregoing presupposes that the metal connectors and their anchors are proportioned so as to have a shear strength greater than the shear that will cause failure of the concrete to which they are anchored.
The relationship between connector shear strength and the distance d from the centerline of the anchor to the slab face toward which it is being pushed is evidently quite different for specimen 3A from that for specimens 1A and 2A. This results from the difference in flexibility of the two types of connector. They will therefore be discussed separately.
The strengths of specimens 1A and 2A are most closely cal-culated using the purely empirical Eq. 55. This equation was based on data obtained from shear tests on loop anchors embed-ded in the edge of a concrete slab, as shown in Figure 89 from reference (62). This is perhaps due to two factors:
In both tests the embedded anchors were subject to a shear load acting some distance away from the point at which embed-ment of the anchor or anchor bar commenced. This resulted in the anchor or anchor bar being subject to a combination of shear and moment tending to cause splitting of the concrete in the plane of the anchor, at the point embedment in the concrete commenced. In the connectors, this was at the edge of the angle, at the back of the block-out. The shear load was transferred to the angle from the weld plate 1 in. from the back of the block-out. In the loop anchor tests on which Eq. 55 is based, the shear load acted 13/16 in. from the edge of the slab in which the anchor was embedded. The large amount of bending in the connector anchor bars is clearly evident in Figure 96.
In both the connector tests and the loop anchor tests the anchor was embedded in the edge of a slab and loaded across the thickness of the slab, so that local boundary conditions were similar.
The equations other than Eq. 55 were developed to correlate with data from tests in which the shear load was applied at the face of the concrete in which the anchor was embedded. Also the anchors were being loaded toward the edge of a restrained block of concrete, rather than across the thickness of a slab of concrete.
Equations 54 and 56 are empirical equations based on tests of headed studs, which were welded to a plate against which the concrete was cast. This provided some rotational restraint to the end of the stud to which the shear was applied.
Equations 57 and 59 are based on an assumed half-conical failure surface and the development of a uniform tensile stress of 4-.j7 psi on this surface at failure. The actual failure surfaces observed in the connector tests were much larger in area, but the average stress on the failure surface was much lower than
Table 4. Comparison of test results and calculated strengths of un-grouted connections.
Specimen No.
Test and Calculated Strength 1A 2A 3A
V(test) (kips) 4.78 4.95 6.70
(a) (b) V(calc.l) (kips) 6.42 7.70 3.76 9.13
V(test)/Vn(calc.1) 0.75 0.64 1.78 0.73
v(calc.2) (kips) 4.25 5.50 0 1.28
V(test)/Vn(calc.2) 1.13 0.90 - 5.25
Vn(calc.3) (kips) 8.50 10.40 2.58 6.26
V(test)/Vn(calc.3) 0.56 0.48 2.60 1.07
Vn(calc.4) (kips) 4.71 5.92 1.78 3.43
V(test)/V0(calc.4) 1.02 0.84 3.76 1.96
V(ca1c.5) (kips) 6.22 7.61 3.17 5.36
V(test)/Vn(calc.5) 0.77 0.65 2.11 1.25
Based on de = 1.375 in.
using average distance of stud centerline from bottom face of slab (1.91 in.) as de
Vn(calc.1) = 2((de - l)/Sd][Vn from Eq. 54] kips
Vn(calc.2) = 2(25de - 3.5) kips (55)
Vn(calc.3) = 2[3.25(de - 1)''f'c/5000]/1000 kips (56)
V(ca1c.4) = 2[2\/•iflde2/1000] kips (57)
V(ca1c.5) = 2[V' (9dd5 + 2de2)/l000] kips (59)
4,j}J. It appears that for this type of connector the actual failure is progressive, spreading from the anchor bars to the surface of the slab, rather than a simultaneous tension failure over the entire failure surface.
The connector in specimen 3A developed a significantly higher strength than those in specimens IA and 2A, despite the distance from the centerline of the anchor to the surface of the concrete being much less. This was due to the greater rigidity of the connection. The angles embedded in the edges of the abutting slabs were held in alignment with one another by the use of a vertically oriented weld plate, which was welded to both the horizontal and vertical legs of the angles. Although not infinitely rigid, this arrangement prevented any visible dis-tortion or rotation of the angles, such as was seen in specimens 1A and 2A. The %-in. stud anchors were five times as stiff as the No. 4 anchor bars used in specimens 1A and 2A. Although these studs had only 1-in, cover adjacent to the connector angles, they were bent up into the slab at 15 deg, so that at the head of the stud its centerline was 2.67 in. from the bottom faces of the slab. The greater rigidity of the stud and its fixity to the rigid connector assembly enabled it to force the failure surface to encompass the whole of the studs (see Fig. 100). As a con-sequence, it has a failure surface area many times that of the failure surface postulated in the development of Eqs. 57 and 59.
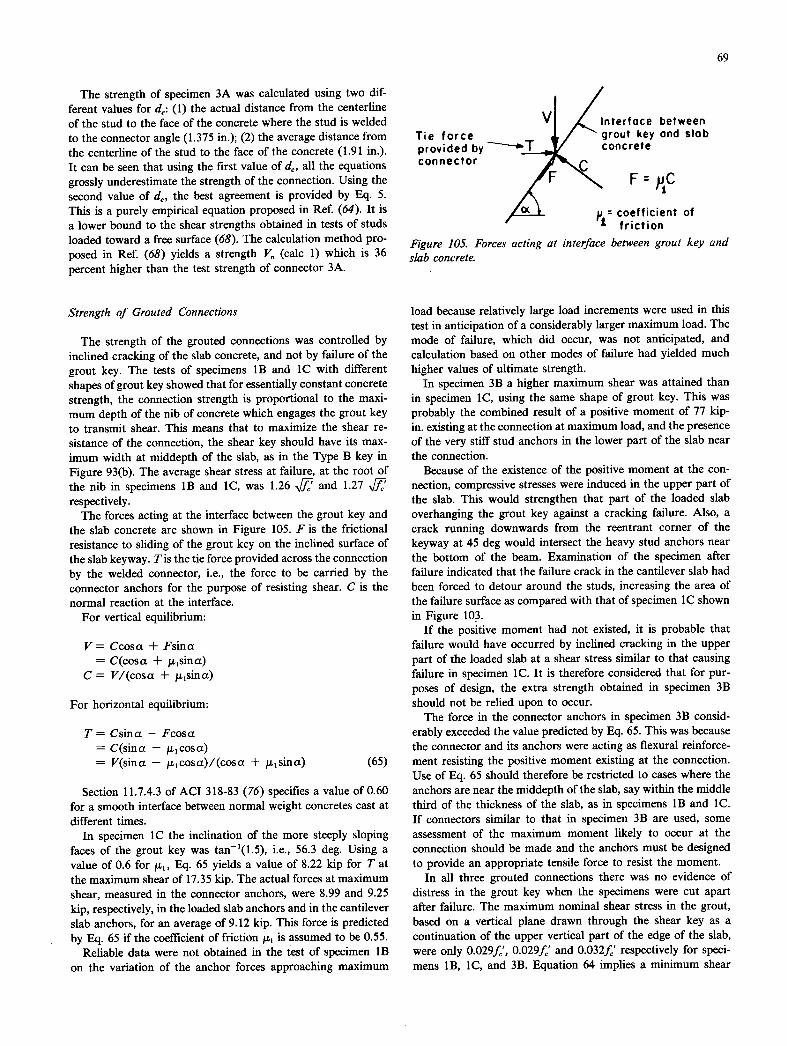
69
The strength of specimen 3A was calculated using two dif-ferent values for d: (1) the actual distance from the centerline of the stud to the face of the concrete where the stud is welded to the connector angle (1.375 in.); (2) the average distance from the centerline of the stud to the face of the concrete (1.91 in.). It can be seen that using the first value of d, all the equations grossly underestimate the strength of the connection. Using the second value of d, the best agreement is provided by Eq. 5. This is a purely empirical equation proposed in Ref. (64). It is a lower bound to the shear strengths obtained in tests of studs loaded toward a free surface (68). The calculation method pro-posed in Ref. (68) yields a strength V. (calc 1) which is 36 percent higher than the test strength of connector 3A.
nterfoce between rout key and slab
concrete
F = '1
coefficient of friction
Figure 105. Forces acting at interface between grout key and slab concrete.
Tie force provided by connector
Strength of Grouted Connections
The strength of the grouted connections was controlled by inclined cracking of the slab concrete, and not by failure of the grout key. The tests of specimens lB and 1C with different shapes of grout key showed that for essentially constant concrete strength, the connection strength is proportional to the maxi-mum depth of the nib of concrete which engages the grout key to transmit shear. This means that to maximize the shear re-sistance of the connection, the shear key should have its max-imum width at middepth of the slab, as in the Type B key in Figure 93(b). The average shear stress at failure, at the root of the nib in specimens lB and 1C, was 1.26 Y7 and 1.27 J] respectively.
The forces acting at the interface between the grout key and the slab concrete are shown in Figure 105. F is the frictional resistance to sliding of the grout key on the inclined surface of the slab keyway. Tis the tie force provided across the connection by the welded connector, i.e., the force to be carried by the connector anchors for the purpose of resisting shear. C is the normal reaction at the interface.
For vertical equilibrium:
V = Ccosa + Fsina = C(cosa + 1sina)
C = V/ (cos a + IL ,sina)
For horizontal equilibrium:
T = Csina - Fcosa = C(sina - .L 1 cosa) = V(sina - t1 cosa)/(cosa + 1sina) (65)
Section 11.7.4.3 of ACI 3 18-83 (76) specifies a value of 0.60 for a smooth interface between normal weight concretes cast at different times.
In specimen 1C the inclination of the more steeply sloping faces of the grout key was tan(1.5), i.e., 56.3 deg. Using a value of 0.6 for , Eq. 65 yields a value of 8.22 kip for T at the maximum shear of 17.35 kip. The actual forces at maximum shear, measured in the connector anchors, were 8.99 and 9.25 kip, respectively, in the loaded slab anchors and in the cantilever slab anchors, for an average of 9.12 kip. This force is predicted by Eq. 65 if the coefficient of friction p, is assumed to be 0.55.
Reliable data were not obtained in the test of specimen lB on the variation of the anchor forces approaching maximum
load because relatively large load increments were used in this test in anticipation of a considerably larger maximum load. The mode of failure, which did occur, was not anticipated, and calculation based on other modes of failure had yielded much higher values of ultimate strength.
In specimen 3B a higher maximum shear was attained than in specimen 1C, using the same shape of grout key. This was probably the combined result of a positive moment of 77 kip-in. existing at the connection at maximum load, and the presence of the very stiff stud anchors in the lower part of the slab near the connection.
Because of the existence of the positive moment at the con-nection, compressive stresses were induced in the upper part of the slab. This would strengthen that part of the loaded slab overhanging the grout key against a cracking failure. Also, a crack running downwards from the reentrant corner of the keyway at 45 deg would intersect the heavy stud anchors near the bottom of the beam. Examination of the specimen after failure indicated that the failure crack in the cantilever slab had been forced to detour around the studs, increasing the area of the failure surface as compared with that of specimen 1C shown in Figure 103.
If the positive moment had not existed, it is probable that failure would have occurred by inclined cracking in the upper part of the loaded slab at a shear stress similar to that causing failure in specimen 1C. It is therefore considered that for pur-poses of design, the extra strength obtained in specimen 3B should not be relied upon to occur.
The force in the connector anchors in specimen 3B consid-erably exceeded the value predicted by Eq. 65. This was because the connector and its anchors were acting as flexural reinforce-ment resisting the positive moment existing at the connection. Use of Eq. 65 should therefore be restricted to cases where the anchors are near the middepth of the slab, say within the middle third of the thickness of the slab, as in specimens lB and 1C. If connectors similar to that in specimen 3B are used, some assessment of the maximum moment likely to occur at the connection should be made and the anchors must be designed to provide an appropriate tensile force to resist the moment.
In all three grouted connections there was no evidence of distress in the grout key when the specimens were cut apart after failure. The maximum nominal shear stress in the grout, based on a vertical plane drawn through the shear key as a continuation of the upper vertical part of the edge of the slab, were only 0.029j', 0.029J' and 0.032J' respectively for speci-mens lB, 1C, and 3B. Equation 64 implies a minimum shear
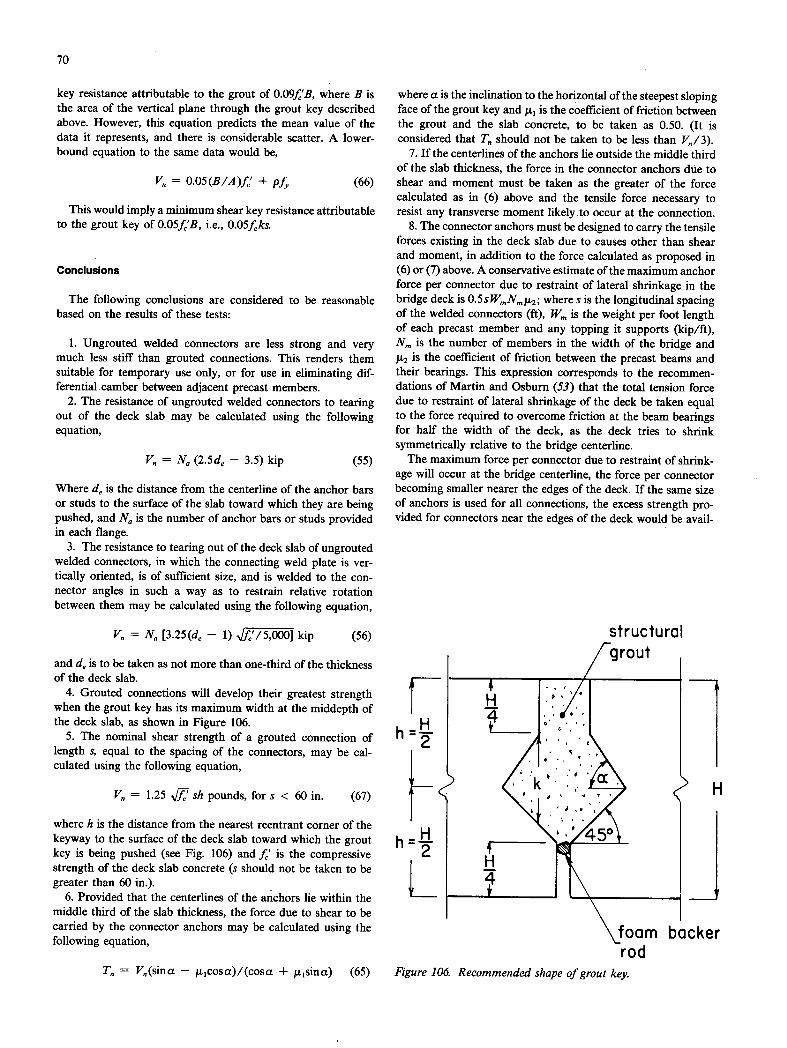
70
key resistance attributable to the grout of 0.09f'B, where B is the area of the vertical plane through the grout key described above. However, this equation predicts the mean value of the data it represents, and there is considerable scatter. A lower-bound equation to the same data would be,
V = 0.05 (B/A )f' + pf, (66)
This would imply a minimum shear key resistance attributable to the grout key of 0.05JB, i.e., 0.05fks.
Conclusions
The following conclusions are considered to be reasonable based on the results of these tests:
Ungrouted welded connectors are less strong and very much less stiff than grouted connections. This renders them suitable for temporary use only, or for use in eliminating dif-ferential camber between adjacent precast members.
The resistance of ungrouted welded connectors to tearing out of the deck slab may be calculated using the following equation,
V. = N. (2.5de - 3.5) Up (55)
Where d is the distance from the centerline of the anchor bars or studs to the surface of the slab toward which they are being pushed, and N. is the number of anchor bars or studs provided in each flange.
The resistance to tearing out of the deck slab of ungrouted welded connectors, in which the connecting weld plate is ver-tically oriented, is of sufficient size, and is welded to the con-nector angles in such a way as to restrain relative rotation between them may be calculated using the following equation,
V = N. [3.25(4e - D Vf'/5,000] hip (56)
and de is to be taken as not more than one-third of the thickness of the deck slab.
Grouted connections will develop their greatest strength when the grout key has its maximum width at the middepth of the deck slab, as shown in Figure 106.
The nominal shear strength of a grouted connection of length s, equal to the spacing of the connectors, may be cal-culated using the following equation,
V = 1.25 J] sh pounds, for s < 60 in. (67)
where h is the distance from the nearest reentrant corner of the keyway to the surface of the deck slab toward which the grout key is being pushed (see Fig. 106) and J' is the compressive strength of the deck slab concrete (s should not be taken to be greater than 60 in.).
Provided that the centerlines of the anchors lie within the middle third of the slab thickness, the force due to shear to be carried by the connector anchors may be calculated using the following equation,
where a is the inclination to the horizontal of the steepest sloping face of the grout key and is the coefficient of friction between the grout and the slab concrete, to be taken as 0.50. (It is considered that T. should not be taken to be less than V/3).
If the centerlines of the anchors lie outside the middle third of the slab thickness, the force in the connector anchors due to shear and moment must be taken as the greater of the force calculated as in (6) above and the tensile force necessary to resist any transverse moment likelyto occur at the connection.
The connector anchors must be designed to carry the tensile forces existing in the deck slab due to causes other than shear and moment, in addition to the force calculated as proposed in (6) or (7) above. A conservative estimate of the maximum anchor force per connector due to restraint of lateral shrinkage in the bridge deck is 0.5sW,N,,,t2; where s is the longitudinal spacing of the welded connectors (ft), W. is the weight per foot length of each precast member and any topping it supports (kip/ft), N. is the number of members in the width of the bridge and I-½ is the coefficient of friction between the precast beams and their bearings. This expression corresponds to the recommen-dations of Martin and Osburn (53) that the total tension force due to restraint of lateral shrinkage of the deck be taken equal to the force required to overcome friction at the beam bearings for half the width of the deck, as the deck tries to shrink symmetrically relative to the bridge centerline.
The maximum force per connector due to restraint of shrink-age will occur at the bridge centerline, the force per connector becoming smaller nearer the edges of the deck. If the same size of anchors is used for all connections, the excess strength pro-vided for connectors near the edges of the deck would be avail-
structural rout
h _ 1 _ H
-li 50
foam backer rod
T,, = V,(sina - j. 1cosa)/(cosa + 1sina) (65) Figure 106. Recommended shape of grout key.
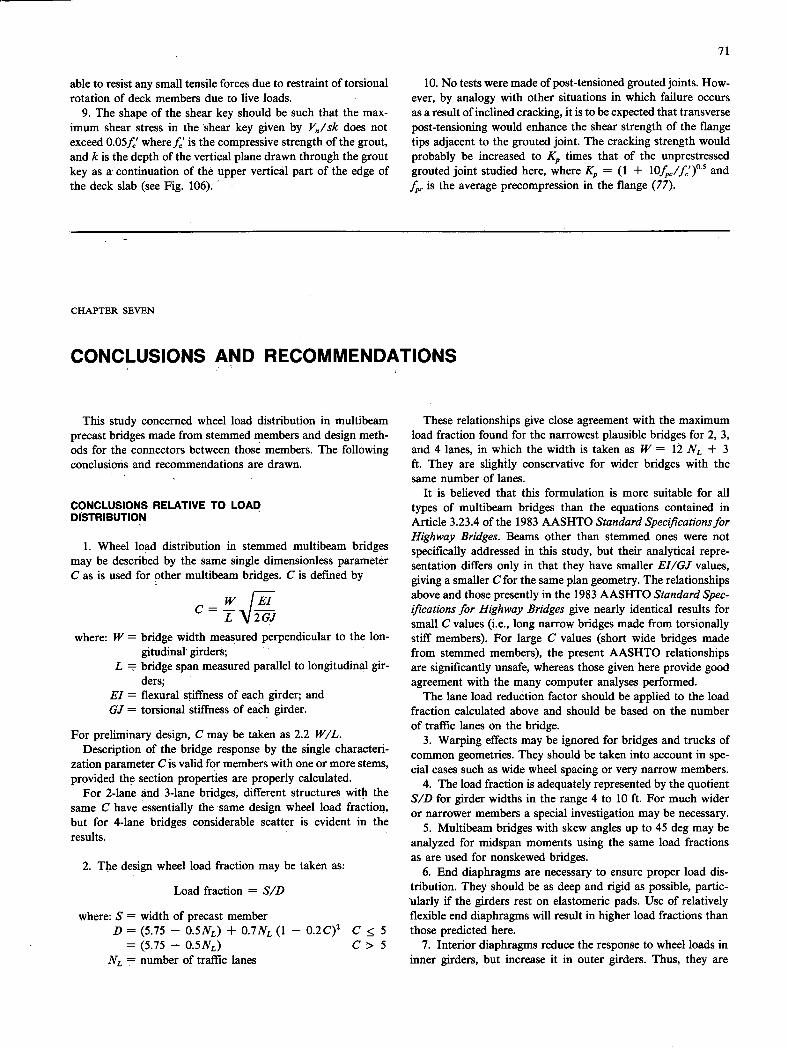
71
able to resist any small tensile forces due to restraint of torsional rotation of deck members due to live loads.
9. The shape of the shear key should be such that the max-imum shear stress in the shear key given by V/sk does not exceed 0.05ff' whereJ' is the compressive strength of the grout, and k is the depth of the vertical plane drawn through the grout key as a continuation of the upper vertical part of the edge of the deck slab (see Fig. 106):
10. No tests were made of post-tensioned grouted joints. How-ever, by analogy with other situations in which failure occurs as a result of inclined cracking, it is to be expected that transverse post-tensioning would enhance the shear strength of the flange tips adjacent to the grouted joint. The cracking strength would probably be increased to K,, times that of the unprestressed grouted joint studied here, where K,, = (1 + l0f,,,,/J')05 and
f,, is the average precompression in the flange (77).
CHAPTER SEVEN
CONCLUSIONS AND RECOMMENDATIONS
This study concerned wheel load distribution in multibeam precast bridges made from stemmed members and design meth-ods for the connectors between those members. The following conclusions and recommendations are drawn.
CONCLUSIONS RELATIVE TO LOAD DISTRIBUTION
Wheel load distribution in stemmed multibeam bridges may be described by the same single dimensionless parameter C as is used for other multibeam bridges. C is defined by
_w/J L\J 2GJ
where: W = bridge width measured perpendicular to the ion-gitudinal girders;
L = bridge span measured parallel to longitudinal gir-ders;
El = flexural stiffness of each girder; and GJ = torsional stiffness of each girder.
For preliminary design, C may be taken as 2.2 W/L. Description of the bridge response by the single characteri-
zation parameter C is valid for members with one or more stems, provided the section properties are properly calculated.
For 2-lane and 3-lane bridges, different structures with the same C have essentially the same design wheel load fraction, but for 4-lane bridges considerable scatter is evident in the results.
The design wheel load fraction may be taken as:
Load fraction = S/D
where: S = width of precast member D = (5.75 - O.SNL) + 0.7NL (1 - 0.2C)2 C < 5
= (5.75 - 0.5NL) C > 5 NL = number of traffic lanes
These relationships give close agreement with the maximum load fraction found for the narrowest plausible bridges for 2, 3, and 4 lanes, in which the width is taken as W = 12 NL + 3 ft. They are slightly conservative for wider bridges with the same number of lanes.
It is believed that this formulation is more suitable for all types of multibeam bridges than the equations contained in Article 3.23.4 of the 1983 AASHTO Standard Specflcations for Highway Bridges. Beams other than stemmed ones were not specifically addressed in this study, but their analytical repre-sentation differs only in that they have smaller EI/GJ values, giving a smaller C for the same plan geometry. The relationships above and those presently in the 1983 AASHTO Standard Spec-ijIcations for Highway Bridges give nearly identical results for small C values (i.e., long narrow bridges made from torsionally stiff members). For large C values (short wide bridges made from stemmed members), the present AASHTO relationships are significantly unsafe, whereas those given here provide good agreement with the many computer analyses performed.
The lane load reduction factor should be applied to the load fraction calculated above and should be based on the number of traffic lanes on the bridge.
Warping effects may be ignored for bridges and trucks of common geometries. They should be taken into account in spe-cial cases such as wide wheel spacing or very narrow members.
The load fraction is adequately represented by the quotient S/D for girder widths in the range 4 to 10 ft. For much wider or narrower members a special investigation may be necessary.
Multibeam bridges with skew angles up to 45 deg may be analyzed for midspan moments using the same load fractions as are used for nonskewed bridges.
End diaphragms are necessary to ensure proper load dis-tribution. They should be as deep and rigid as possible, partic-ulariy if the girders rest on elastomeric pads. Use of relatively flexible end diaphragms will result in higher load fractions than those predicted here.
Interior diaphragms reduce the response to wheel loads in inner girders, but increase it in outer girders. Thus, they are

72
only beneficial in cases where the inner girder provides the critical load case by a significant margin. Such cases are rare. In most cases, and particularly for long narrow bridges, the presence of a midspan diaphragm actually increases the load fraction. If interior diaphragms are used, they should be as deep and rigid as possible. Precast diaphragms must have a stiff, full-strength moment connection at the joint between members if they are to be effective. Steel truss diaphragms are considerably less efficient than full-depth cast-in-place diaphragms. Interior diaphragms in addition to a midspan diaphragm have an insig-nificant influence on the load fraction for midspan moment. In most cases this dominates design, and additional diaphragms provide no significant reduction in wheel load fraction.
8. Precast barriers and facia panels that are segmented cause edge loads, but contribute nothing to the bridge's strength. They may be accounted for by either the approximate or the more precise method presented in Chapter Four.
CONCLUSIONS ON CONNECTIONS
Where a grout key and steel connectors are used to join members, forces from wheel loads are transferred through the grout key. The steel connectors carry shear forces induced before grouting (for example due to removal of differential camber), tension forces due to shrinkage, and tension forces due to twist-ing under truck loading. They must also provide the clamping force to mobilize the full shear resistance of the connection, while simultaneously undergoing any imposed rotations.
The strength of the grouted joint is govered by inclined cracking of the tips of the member flanges where they project above and below the grout key rather than by failure of the grout itself. (This was so even when the concrete was 75 percent stronger than the grout.) An improved keyway geometry was developed which provided higher strength by maximizing the thickness of flange concrete which must be cracked to cause failure of the joint. Use of this shape of grout key, which has its maximum width at middepth of the flange, is strongly rec-ommended (see Fig. 106).
Although high grout strength is not necessary to maximize the joint strength, a good quality nonshrink grout should be used to provide resistance to joint degradation due to environ-mental factors. It is also recommended that close attention be paid to the quality of workmanship in installing the grout and to its curing.
The shear force per unit length of grout key is localized in the vicinity of the wheel which causes it. Exact values are very sensitive to the way in which it is modeled mathematically. The best estimates obtained in this study- show that the service load intensity, including the maximum impact fraction of 30 percent, is 61 percent of the strength at cracking measured in the experiments, but that the shear due to the specified factored load is 145 percent of that strength. The strength is that of the improved keyway detail. The design is thus inadequate in a formal sense, but there have been no reports of field failure in well-executed grout joints. It is recommended that flanges thin-ner than 6 in. not be used in order to maintain in the grouted key at least the strength found in the experiments.
Post-tensioned grouted joints were not studied experimen-tally. However analogy with other situations in which inclined cracking of concrete is critical suggests that transverse post-
tensioning would enhance the shear strength of the flange tips adjacent to the joint. The cracking strength would probably be increased to K,, times that of the unprestressed case studied here, where
K,, = (1 + 10f,,,/f,')°-5
and f is the average prestress in the flange. For 5,000 psi concrete, a prestress of 200 psi would increase the cracking strength 18 percent. However, to achieve this in a 6-in, thick flange would require 4-in. diameter 270K strands at 20-in. centers.
The spacing and strength of steel flange connectors should be based on shear forces induced before grouting and tension and moments induced afterwards. Twisting of the girders under live loads is shown to induce' tension in the connectors along the joint between the two outer members of a bridge. However, this tension arises largely from compatibility and not equilibrium requirements, and its value is significantly reduced by small deformations of the connectors. For connectors anchored by commonly used methods it may be disregarded in design.
RECOMMENDATIONS FOR THE DESIGN OF CONNECTIONS
The_edge thickness of precast member flanges should be 6j5,000/J' in. but not less than 6 in.
The shape of the grout key should be as shown in Figure 106.
The spacing, s, of welded connectors should be not more than the lesser of 5 ft and the width of the flange of the precast member.
Welded connector anchors should be located within the middle third of the slab thickness.
The tensile strength of each connector and of its anchors should be not less than
= T1 + T2 kip
where:
T1 = 16(sin a - ju l cosa)/(cosa + p.l sin a) kip, but not less than 6 kip
and
= 0.5 sW,,, N,,, /L2 kip
If the connector is to be used to resist shears due to the elimination of differential camber before grouting the keyway, both the shear strength of the metal connector and the resistance to shear of the anchors calculated using
V,, = N(2.5d - 3.5) kip
must be not less than twice the calculated shear per connector due to the leveling operation.
In the above, T1 = anchor force required to develop a shear resistance of
16 kip, in a length s of grouted connection (Note: The shear force of 16 kip is the maximum shear that can be resisted by a 60-in, length precast member flange
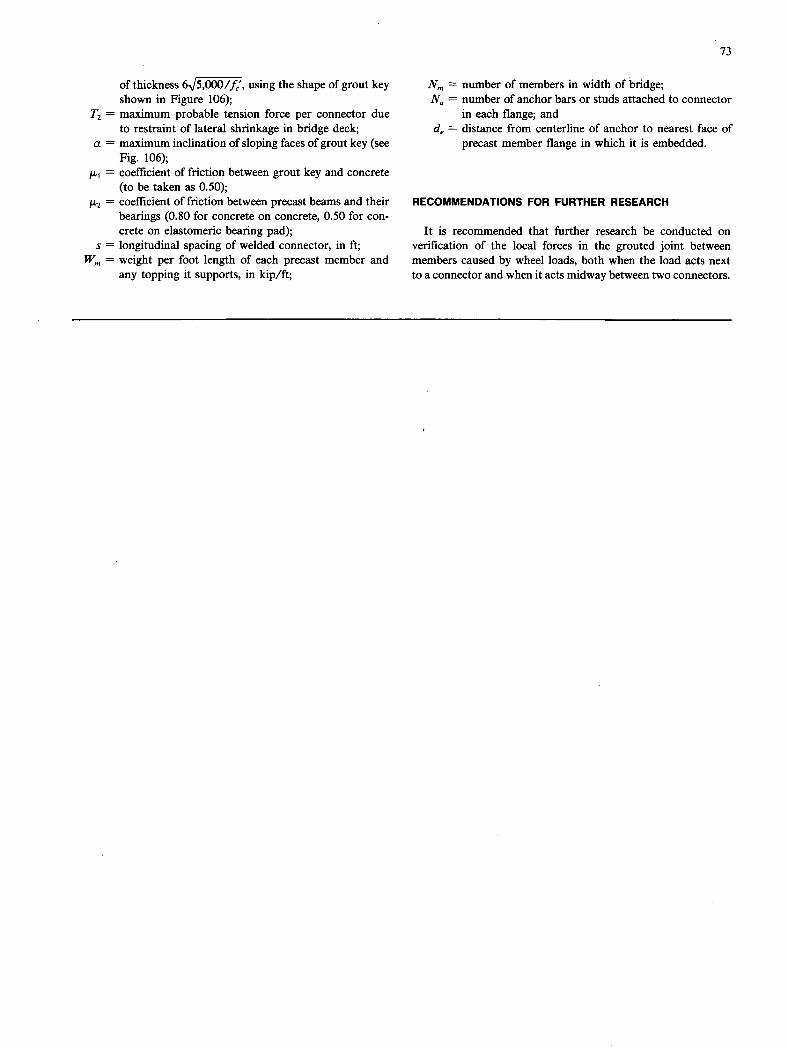
73
of thickness &/5,0OO/f0', using the shape of grout key shown in Figure 106);
T2 = maximum probable tension force per connector due to restraint of lateral shrinkage in bridge deck;
a = maximum inclination of sloping faces of grout key (see Fig. 106);
= coefficient of friction between grout key and concrete (to be taken as 0.50);
= coefficient of friction between precast beams and their bearings (0.80 for concrete on concrete, 0.50 for con-crete on elastomeric bearing pad);
s = longitudinal spacing of welded connector, in ft; W, = weight per foot length of each precast member and
any topping it supports, in kip/ft;
Nm number of members in width of bridge; N0 = number of anchor bars or studs attached to connector
in each flange; and d, = distance from centerline of anchor to nearest face of
precast member flange in which it is embedded.
RECOMMENDATIONS FOR FURTHER RESEARCH
It is recommended that further research be conducted on verification of the local forces in the grouted joint between members caused by wheel loads, both when the load acts next to a connector and when it acts midway between two connectors.
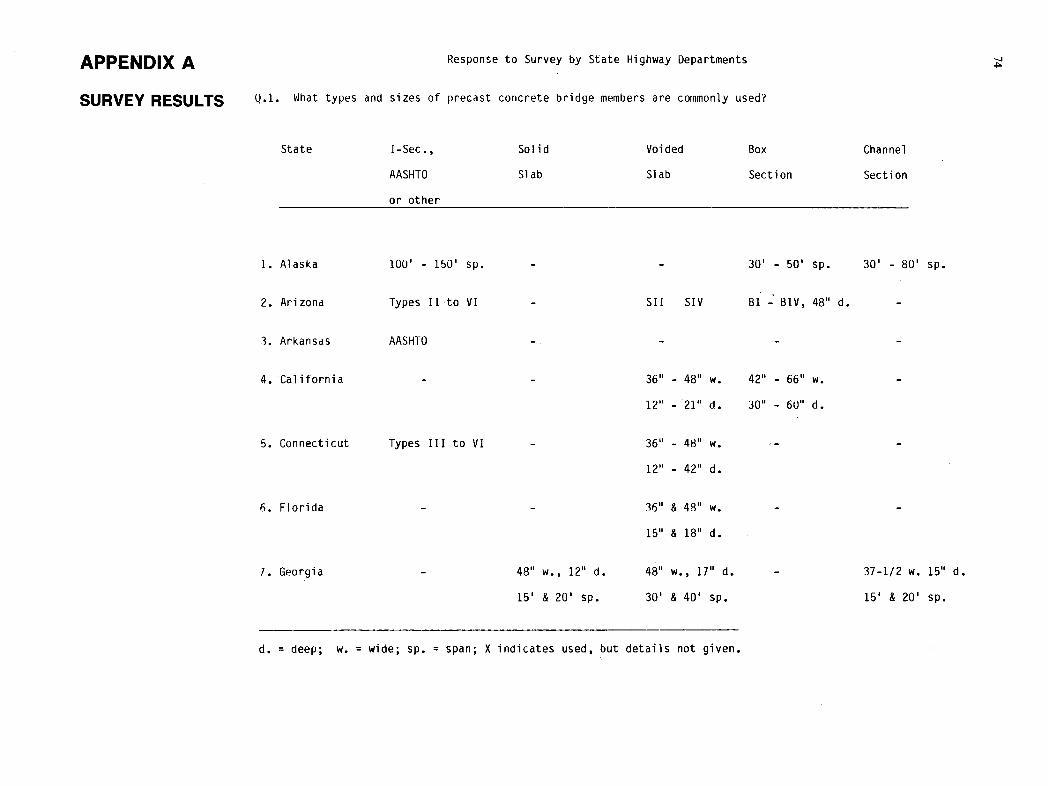
APPENDIX A Response to Survey by State Highway Departments
SURVEY RESULTS Q.1. What types and sizes of precast concrete bridge members are commonly used?
State I-Sec., Solid Voided Box
Channel
AASHTO Slab Slab Section
Secti on
or other
Alaska 100' - 150' sp. -
Arizona Types II to VI -
Arkansas AASF-ITO -
California - -
Connecticut Types III to VI
Florida
Georgia
48" w., 12" d.
15' & 20' sp.
- 30' - 50' sp. 30' - 80' sp.
Sil SIV BI -' BIV, 48" d. -
36" - 48" w. 42" - 66" w. -
12" - 21" d. 30" - 60" d.
36" - 48" w. - -
12" - 42" d.
36" & 48" w. - -
15" & 18" d.
48" w., 17" d. - 37-1/2 w. 15" d.
30' & 40' sp. 15' & 20' sp.
d. = deep; w. = wide; sp. = span; X indicates used, but details not given.
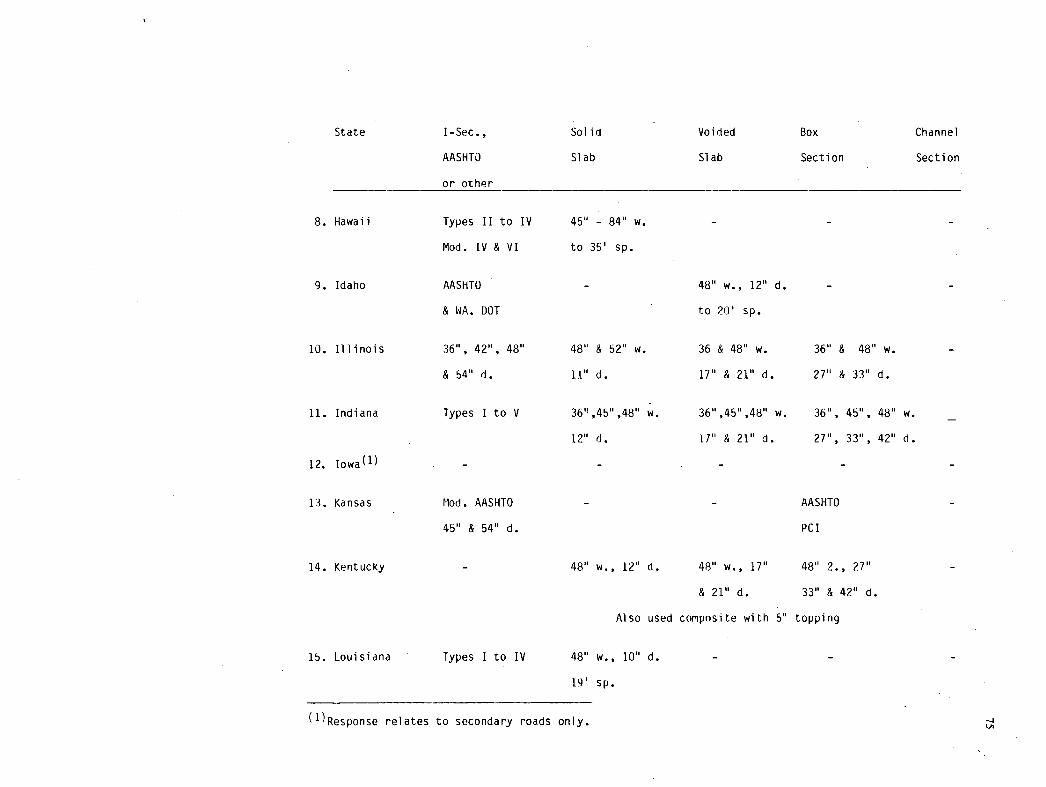
State I-Sec.,
AASHTO
Solid
Slab
or other
Voided
Slab
Box Channel
Section Section
Hawaii Types II to IV 45" - 84" w. - - -
Mod. IV & VI to 35 sp.
Idaho AASHTO - 48" w., 12" d. - -
& WA. DOT to 20' sp.
Illinois 36 11 , 42 11 , 48" 48" & 52" w. 36 & 48" w. 36' & 48" w. -
& 5411 d. ii" d. 17" & 21" d. 27" & 33" d.
Indiana Types I to V 361,4511,4811 W. 36,45,48" W. 36 11 , 45", 48" w. -
12" d. 11" & 21" d. 27", 33", 42" d.
iowa(1) - - - - -
Kansas Mod. AASHTO - - AASHTO -
45" & 54" d. PCI
Kentucky - 48" w., 12" d. 48" w., 17" 48" 2., 27" -
& 21" d. 33" & 42" d.
Also used composite with 5" topping
Louisiana Types I to IV 48" w., 10" d. - - -
19' sp.
( 1)Response relates to secondary roads only.
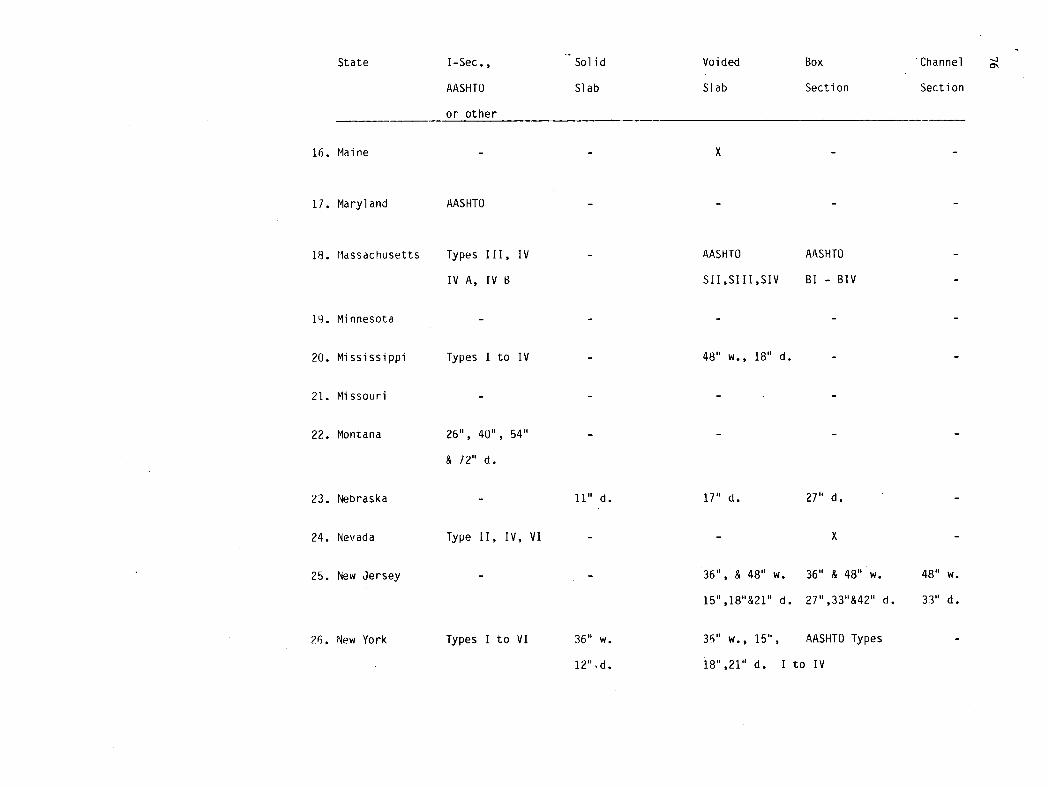
State I-Sec., Solid
AASHTO Slab
or other
Maine - -
Maryland AASHTO -
Massachusetts Types III, IV -
IV A, IV B
Minnesota - -
Mississippi Types I to IV -
Missouri - -
Montana 26", 40, 54" -
& 72" d.
Nebraska - 11" d.
Nevada Type II, IV, VI -
New Jersey
New York Types I to VI 36' W.
12".d.
Voided Box
Slab Section
x -
AASHTO AASHTO
S1I,SIII,SIV BI - BIV
48' w., 18" d. -
17" d. 27" d. -
- x -
36", & 48" w 36" & 48" w 48" w
15" ,18"&21" d. 27" ,33"&4?" d. 33" d.
36" w., 15", AASHTO Types -
18,211 d. I to IV
Channel ON -
Sect ion

State I-Sec., Solid Voiled Box Channel
AASHTO Slab Slab Section Section
or other
North Carolina - - 36" w. - -
18 & 21" d.
North Dakota 36, 45, 63" d. - - 36" w., 21", 26" -
33", 39', 42" d.
Oklahoma Type I to IV - - - -
Oregon Types II to IV 48" w. 48" w., 15", - -
12' d. 18", 21", 26" '1
12' - 28' sp. 20' - 70' sp.
pennsyi vania( 2 ) - - - - 36" w., 18",
21", 24" d.
18' 35' sp.
37 • South Carolina Types II & 11.1 - - - -
33. South Dakota Type II to IV - - - 46" w.
23" & 30' d.
10' - 65' sp.
(2) Response limited to precast reinforced concrete bridyes.

Stdte I-Sec., Solid Voided Box Channel
AASHTO Slab Slab Section Section
orother
34. Tennessee Types I - IV -
35. Utah - -
36. Vermont Type III -
37. Virginia Types II - VI -
401 - 150' sp.
3. West Virgina Types III & IV -
39. Wisconsin 36", 45", 54" 36" & 48" w.
& 70" d. 12" d.
36" & 48" w. 36" & 48" w. 36" w.
12" d. 12' - 72 d. 19" d.
- 48" w., 27' , 33 60' & 72' w.
39" & 42" d.
36 & 48" w. - -
40' - 50' sp.
x -
18' - 50' sp. 42' - 90' sp.
- 17" & 33" d. -
- 36' A 48" w. -
17', 21", 27, 35", & 42" d.
No. of states using section
25 10
19 17 7
S
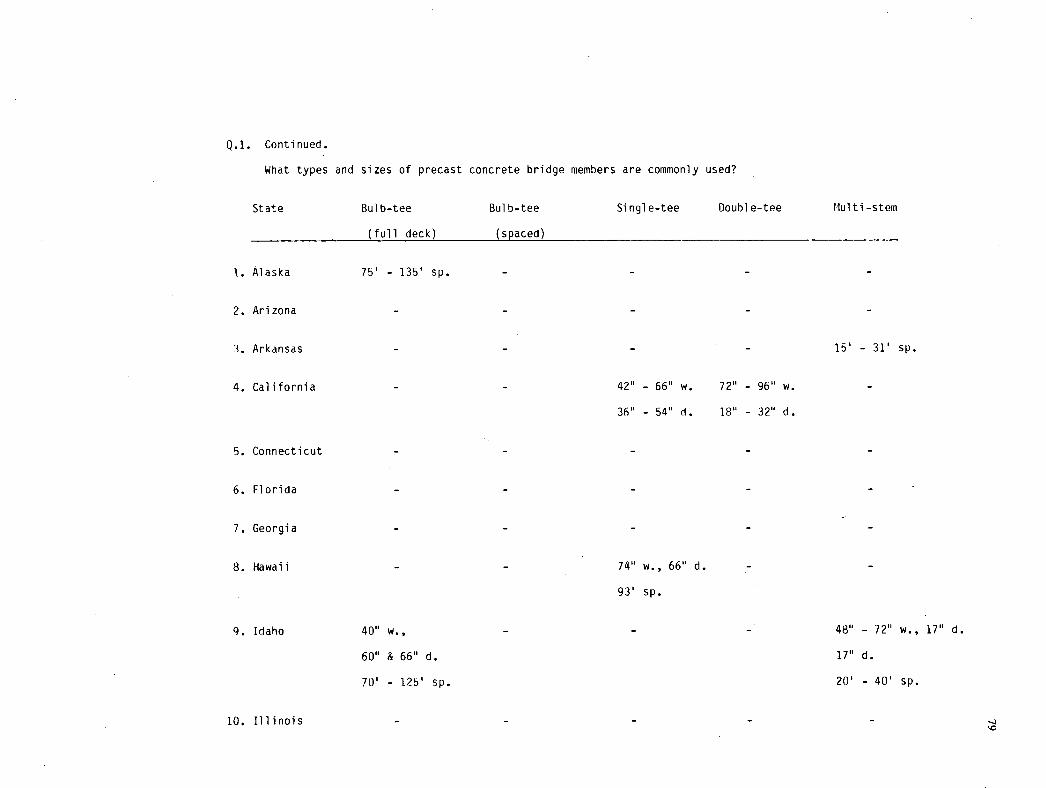
Q.1. Continued.
What types and sizes of precast concrete bridge members are commonly used?
State Bul b-tee Bul b-tee Si ngl e-tee Doubi e-tee liul ti-stem
(full deck) (spaced)
Alaska 75' - 135' sp. - - - -
Arizona - - - - -
Arkansas - - - - is' - 31' sp.
California - - 42" - 66" W. 72" - 96" w. -
36" - 54" d. 18" - 32" d.
Connecticut - - - - -
Florida - - - - -
Georgia - - - - -
Hawaii - - 74" w., 66" d. - -
93' sp.
Idaho 40" w., - - - 48" - 12" w., 17" d.
60" & 66" d. 17" d.
70' - 125' sp. 20' - 40' sp.
Illinois - - - - -
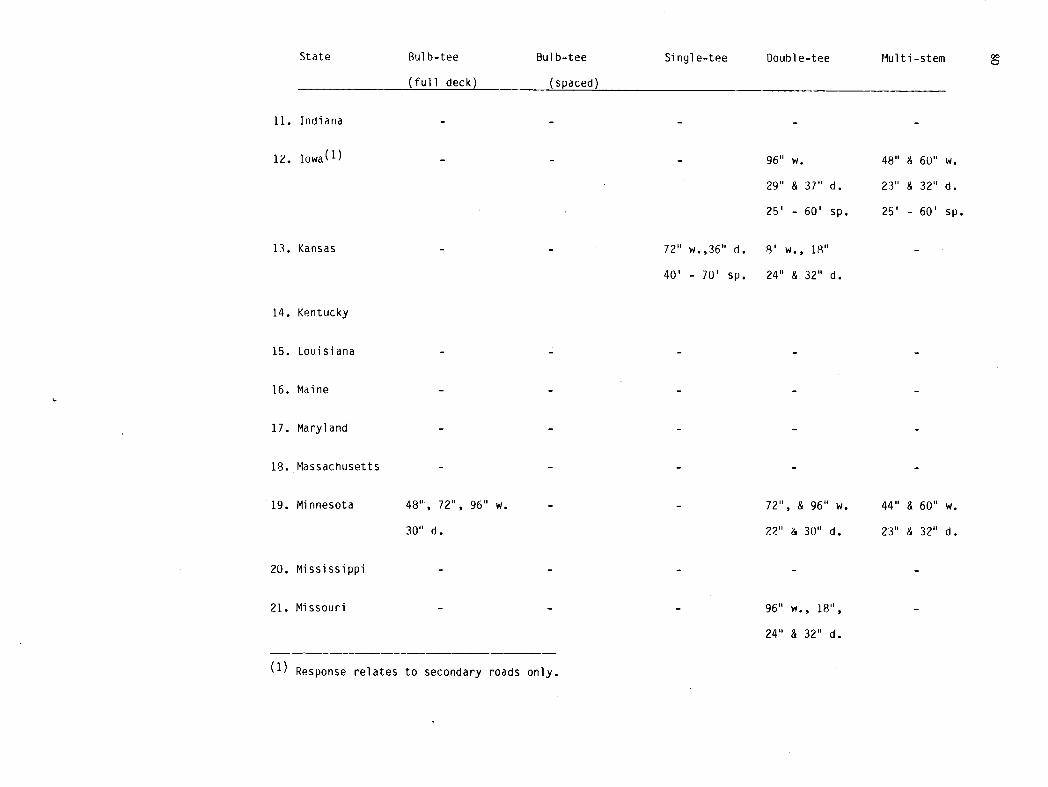
State Bul b-tee u1 b-tee
(full deck) (space
Indiana - -
Iowa() - -
Kansas - -
Single-tee Double-tee Multi-stem 00 0
- 96" w. 48" & 60" w.
29" & 37" d. 23" & 32" d.
25' - 60' sp. 25' - 60' sp.
72" w.,36" d. 8' w., 18" -
40' - 70' sp. 24" & 32" d.
4-
Kentucky
Louisiana -
Maine - -
Maryland - -
Massachusetts - -
Minnesota 48", 72", 96" w. -
30" d.
Mississippi - -
Missouri - -
(1) Response relates to secondary roads only.
- 72", 8 96" w. 44" & 60" w.
22" & 30" d. 23" & 32" d.
- 96" w., 18", -
24" & 32" d.
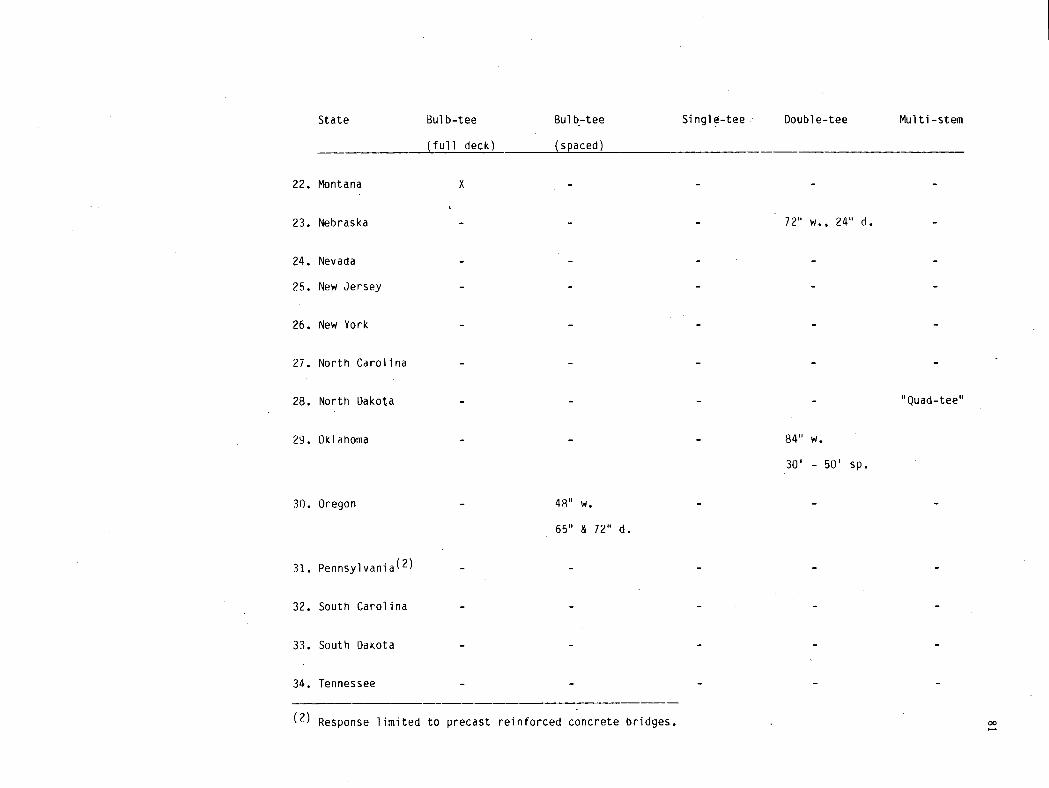
State
Bulb-tee Bulb-tee Single-tee Double-tee Multi -stem
(full deck) (spaced)
Montana x - - - -
Nebraska - - - 72" w., 24" d. -
Nevada
New Jersey
New York
North Carolina
North Dakota - - - - "Quad-tee"
Oklahoma - - - 84" w.
30' - 50' sp.
Oregon - 48" w. - - -
65" & 72" d.
pennsyi vania(2) - - - - -
South Carolina - - - - -
South Dakota - - - - -
Tennessee - - - - -
(2) Response limited to precast reinforced concrete bridges. 22
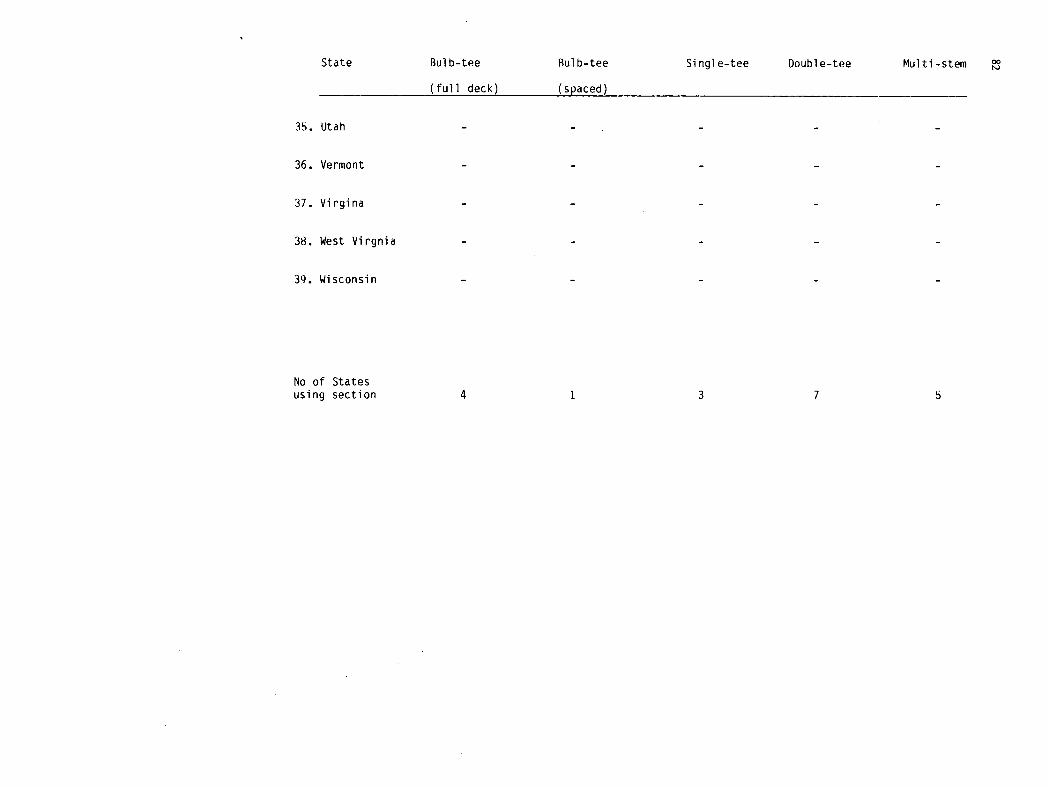
State Bul b-tee Bul b-tee
(full deck) (spaced)
Utah - -
Vermont - -
Virgina - -
West Virgnia - -
Wisconsin - -
Single-tee Double-tee Multi-stem 00
No of States using section 4 1 3 7 5

Q.2. What precast concrete bridge configurations are commonly used? [For example, number of spans, span lengths, use of
between spans, number of precast members in transverse direction, types of supports, etc.]
1. Alaska - -
Continuity? No. of P.C. Type of Other
Units in Supports Comments
Width
No - - up to 400'
btwn. exp.
State
No. of Spans Span Lengths
2. Arizona multiple - Spans contin. -
but not taken
into acct. in
design of sec.
joints
elastomeric 400' limit
on cont.
spans
Arkansas usually mi -
of 3
California Slabs - 1 sp. 20' - 50'
- multi-sp. 50' - 120'
"TI" - multi-sp. 30' - 60'
Box 50' - 80'
Connecticut Slabs - 1 sp. 90'
I - multi-sp. 120'
7-9
No -
No -
LL only -
No -
No -
LL only
trestle bent usually on
country roads
pinned" -
1.
exp. joint filler -
el astomeric 00
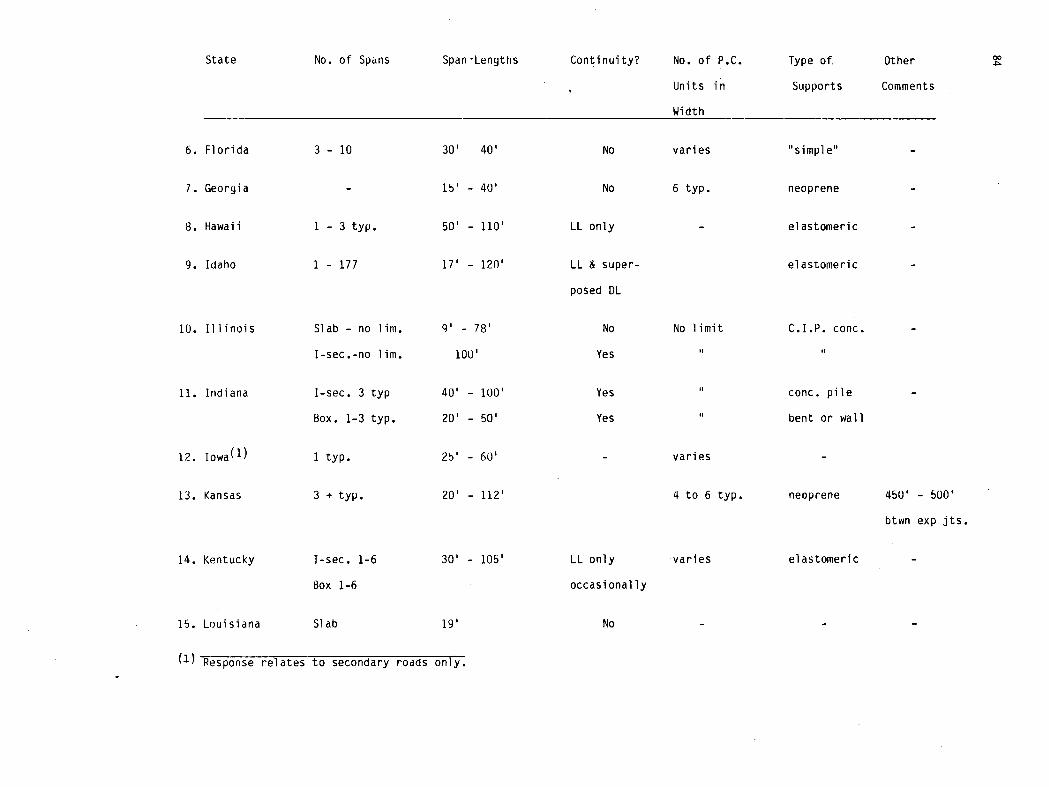
State No. of Spans Span-Lengths Continuity? No. of P.C.
Units in
Width
Type of.
Supports
Other
Comments
6. Florida 3 - 10 30' 40' No varies "simple" -
1. Georgia - 15' - 40' No 6 typ. neoprene -
Hawaii 1 - 3 typ. 50' - 110' LL only - elastomeric -
Idaho 1 - 177 17' - 120' LL & super- elastomeric - posed DL
Illinois Slab - no un. 9' - 78' No No limit C.I.P. conc. - I-sec.-no urn. 100' Yes it
Indiana I-sec. 3 typ 40' - 100' Yes " conc. pile - Box. 1-3 typ. 20' - 50' Yes " bent or wall
Iowa(1) 1 typ. 25' - 60' - varies -
Kansas 3 + typ. 20' - 112' 4 to 6 typ. neoprene 450' - 500'
btwn exp jts.
Kentucky I-sec. 1-6 30' - 105' LL only varies elastomeric - Box 1-6 occasionally
Louisiana Slab 19' No - - -
(1) Response relates to secondary roads only.
00

State No. of Spans
Span Lengths
16. Maine
Maryland 3 typ.
Massachusetts Slab -
Box -
I-sec.-
Minnesota 1 - 3
Mississippi varies
Missouri
20' - 50'
Montana
3-4
35' - 130'
Nebraska
Slabs - 3
20' - 70'
TI - 3
20' - 40'
Nevada 1 - 2 60' - 110'
mostly simple sp.
New Jersey 1 typ. 30' - 75'
Continuity? No. of P.C.
Units in
Width
LL -
LL only varies
LL & super- No limit
posed DL
No mm. 4
No -
No -
LL + super- 5 - 10
posed DL
No
Type of Other
Supports Comments
- little used
el astomeric
conc. pile piers -
frame or pile bents -
conc. pile -
bents
elastomeric -
pile bents No topping
or walls composite -
5" topping 5" topping
- -7777
up to 100'
27' - 50'
52' - 107'
55' - 115'
35' - 55'
30' - 112'
00
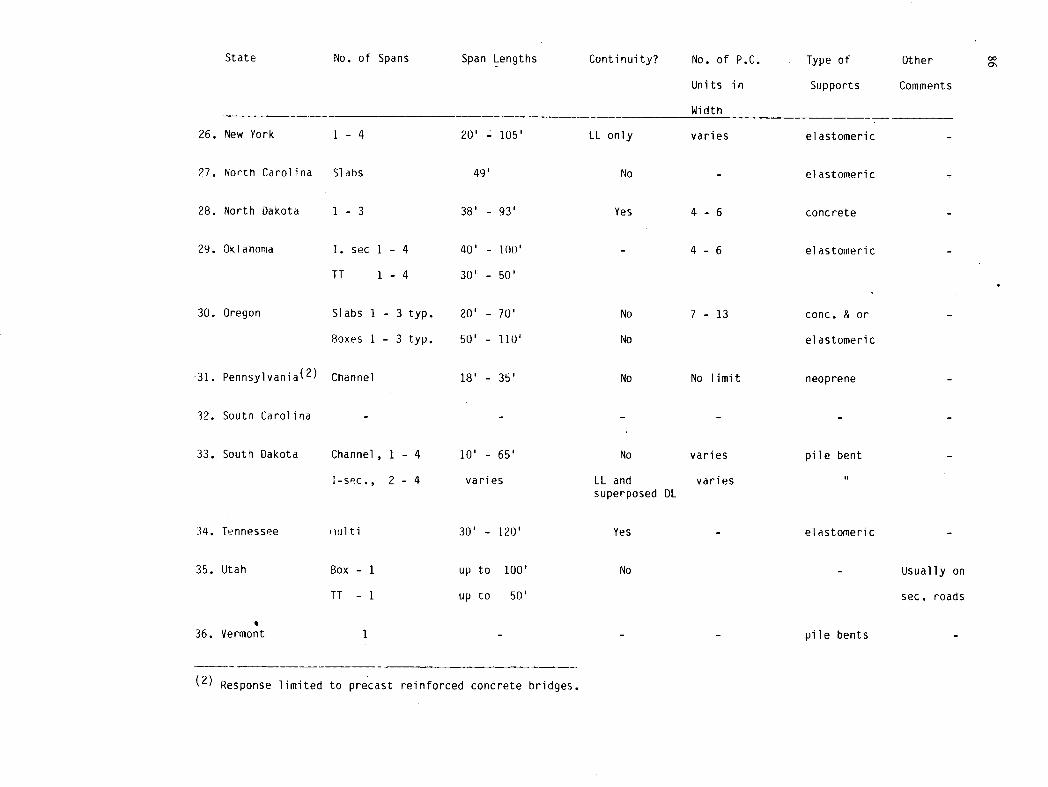
Continuity? No. of P.C.
Units in
Width
LL only varies
No -
Yes 4-6
- 4-6
Type of
Supports
el astomeric
el astomeri C
concrete
el astomeric
Other 00
Comments
No 7 - 13
No
No No limit
No varies
LL and varies superposed DL
Yes -
No
conc. & or
el astomeric
neoprene
pile bent
11
el astomeri c
Usually on
sec. roads
State No. of Spans Span Lengths
26. New York 1 - 4 20' - 105'
27. North Carolina Slabs 49'
28. North Dakota 1 - 3 38' - 93'
29. Oklahoma 1. Sec 1 - 4 40' - 1(H)'
TI 1 - 4 30' - 50'
30. Oregon Slabs 1 - 3 typ. 20' - 70'
Boxes 1 - 3 typ. 50' - ilU'
31. Pennsylvania(2) Channel 18' - 35'
32. Soutn Carolina -
33. South Dakota Channel , 1 - 4 10' - 65'
I - soc., 2 - 4 varies
34. Tennessee iulti 30' - 120'
35. Utah Box - 1 up to 100'
TI - 1 up to 50'
S
36. Vermont
pile bents
(2) Response limited to precast reinforced concrete bridges.
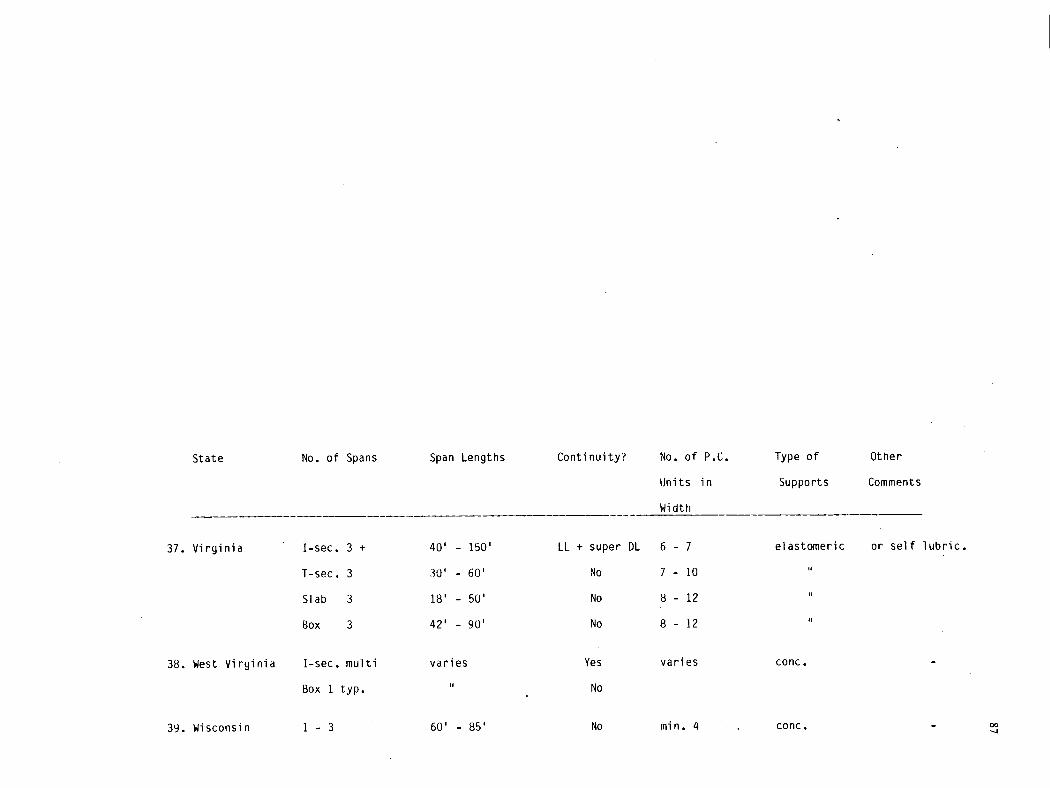
State No. of Spans Span Lengths Continuity? No. of P.C.
units in
Width
Type of Other
Supports Comments
37. Virginia I-sec. 3 + 40' - 150' LL + super DL 6 - 7 elastomeric or self lubric.
T-sec. 3 30' - 60' No 7 - 10
Slab 3 18' - 50' No 8 - 12
Box 3 42' - 90' No 8 - 12
38. West Virginia I-sec. multi varies Yes varies conc. -
Box 1 typ. " No
39. Wisconsin 1 - 3 60' - 85' No mm. 4 conc. -

Q.3. (a) How common are skewed precast bridges and
what range of skew angles are commonly used?
How is skew taken into account in design?
State How comnion? Range How taken
into Account?
Alaska "common" - 0 450 Shear increased
at obtuse cnr.
Arizona - 450 abs. max. Provide arbitrary
max. of 300 - 350 pref. additl. reinft.
Arkansas "uncommon" 300 max. preferred 'Not considered
in design."
California "common" 00 - 300 "No special design."
Connecticut - - "No special design."
Florida 30% 00 - 300 "Poured in place
concrete over caps."
Georgia - maximum 450 "Not accounted for in
design."
00 00
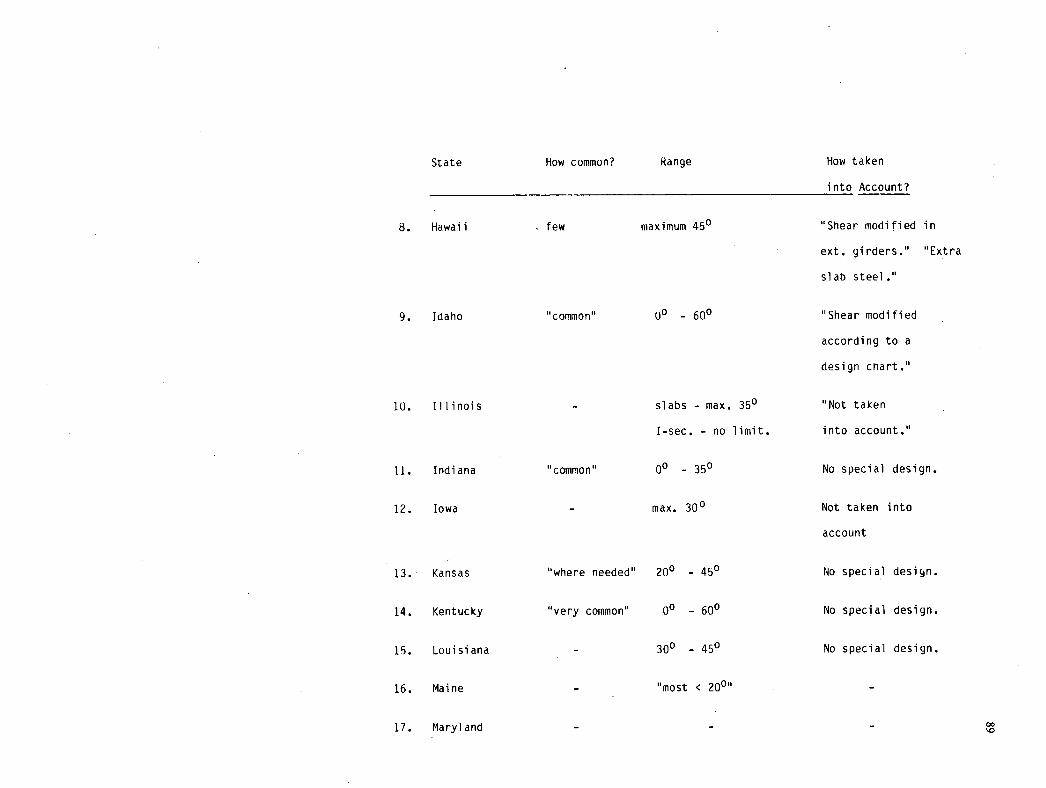
How taken
into Account?
"Shear modified in
ext. girders." "Extra
slab steel ."
"Shear modified
according to a
design chart."
"Not taken
into account."
No special design.
Not taken into
account
No special design.
No special design.
No special design.
State
Hawaii
Idaho
Illinois
ii. Indiana
12. Iowa
Kansas
Kentucky
Louisiana
Maine
Maryland
How common? Range
few maximum 450
"common" 00 - 600
- slabs - max. 350
I-sec. - no limit.
"common" 00 - 350
- max. 300
"where needed" 200 - 450
"very common" 00 - 600
- 30° _450
- "most < 200"
00 '.0
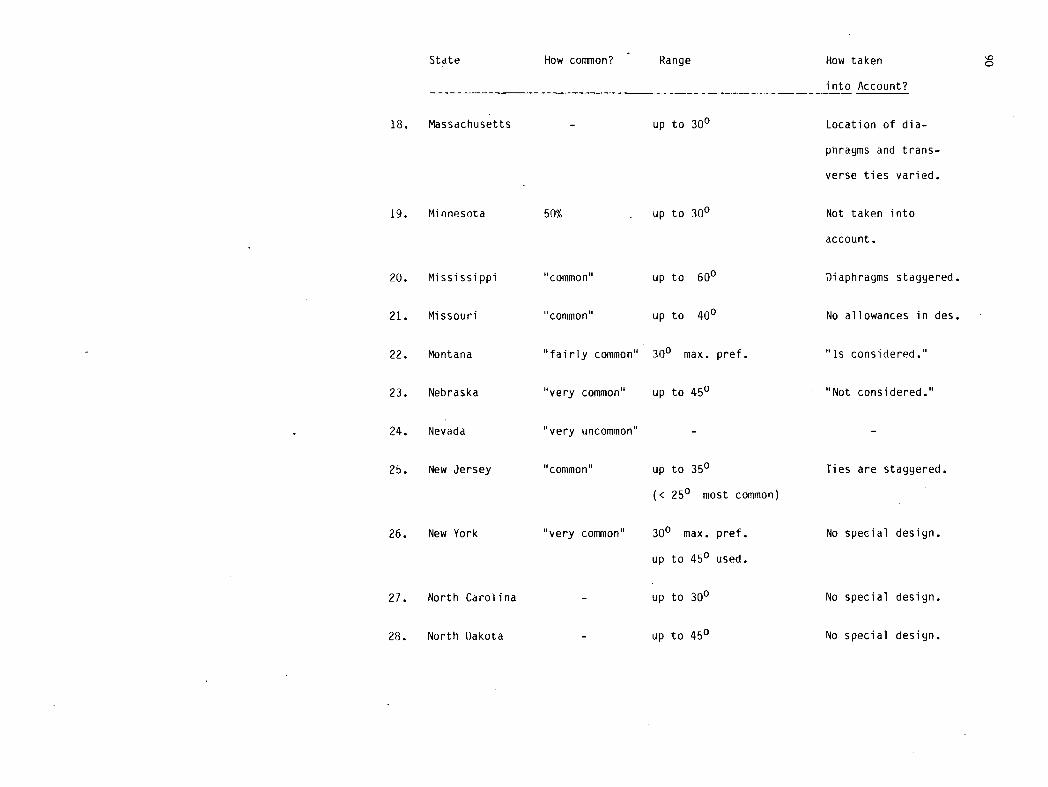
State How common? - Range How taken
into Account?
Massachusetts - up to 300 Location of dia-
phragms and trans-
verse ties varied.
Minnesota 50% up to 300 Not taken into
account.
Mississippi 'common" up to 600 Diaphragms staggered.
Missouri 'common" up to 400 No allowances in des.
Montana "fairly common" 300 max. pref. "Is considered."
Nebraska "very common" up to 450 "Not considered."
Nevada livery uncommon" - -
New Jersey "common" up to 350 Ties are staggered.
(< 250 most common)
New York "very common" 300 max. pref. No special design.
up to 450 used.
North Carolina - up to 300 No special design.
North t)akota - up to 450 No special design.
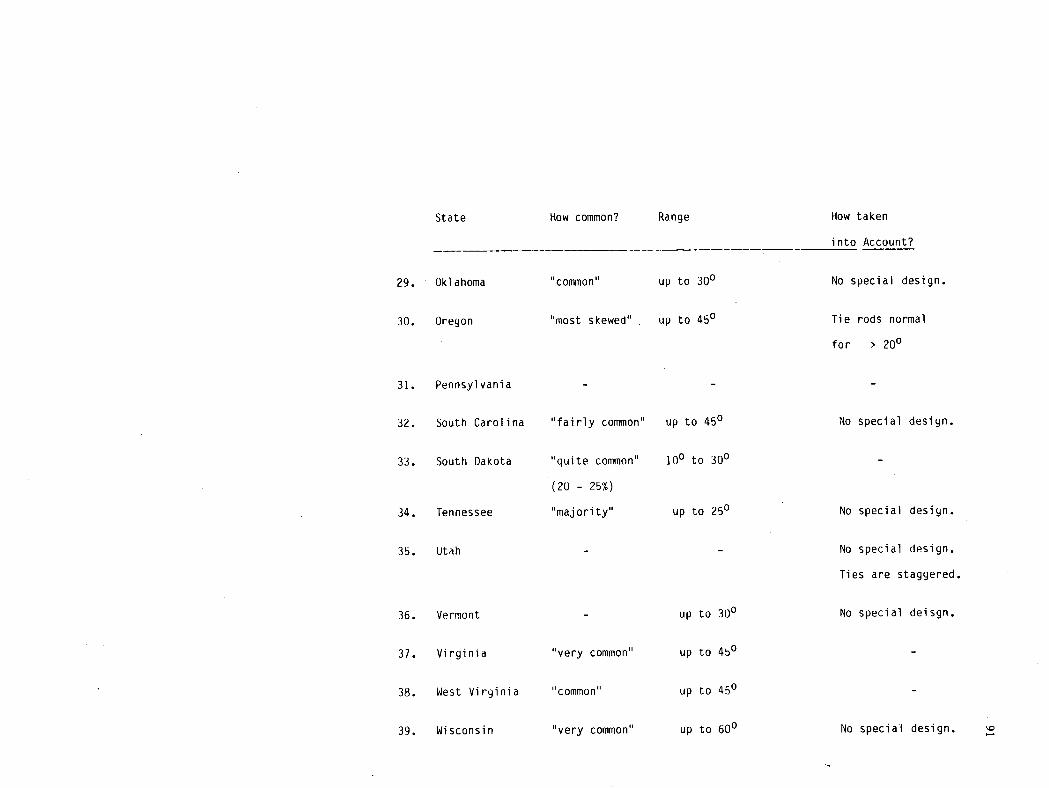
State 110w common? Range
Oklahoma "common" up to 300
Oregon "most skewed" up to 450
How taken
into Account?
No special design.
Tie rods normal
for > 20°
31. Pennsylvania
South Carolina "fairly common" up to 450
South Dakota "quite common" 100 to 300
(20 - 25)
Tennessee "majority" up to 250
Utah - -
Vermont
Virginia
West Virginia
Wisconsin
up to 300
"very common"
up to 45°
"common"
up to 45°
"very common"
up to 60°
No special design.
No special design.
No special design.
Ties are staggered.
No special deisyn.
No special design.
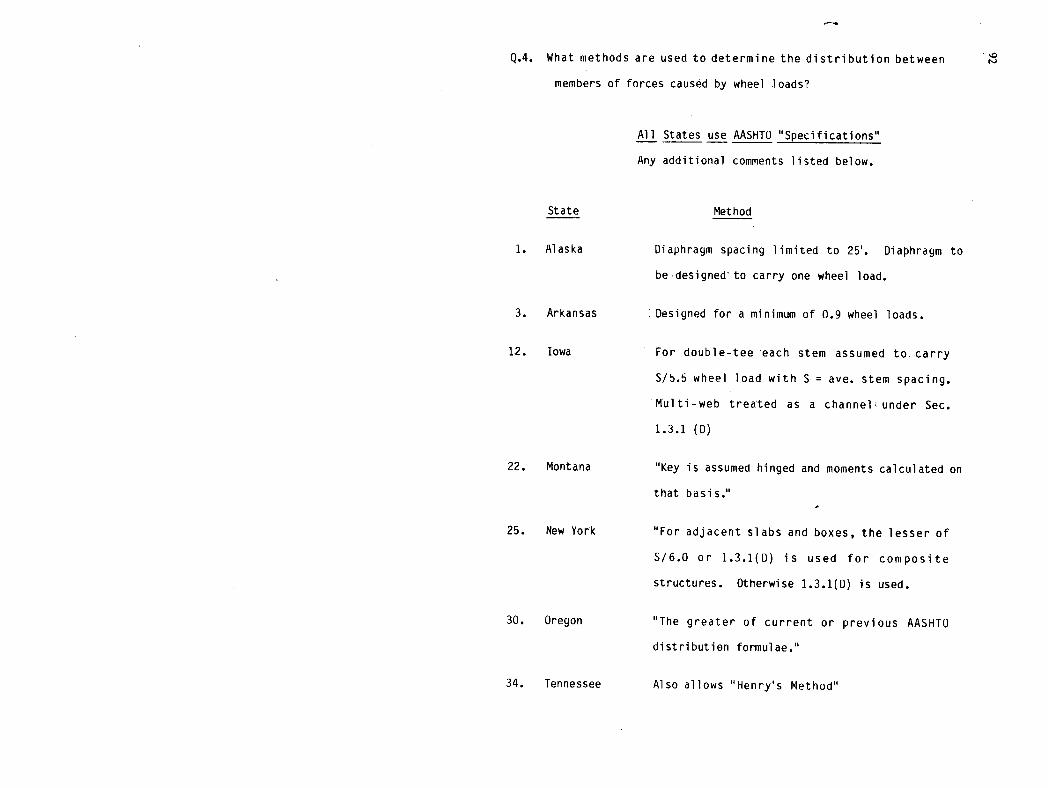
Q.4. What methods are used to determine the distribution between
members of forces caused by wheel loads?
All States use AASHTO "Specifications"
Any additional comments listed below.
State Method
1. Alaska Diaphragm spacing limited to 25'. Diaphragm to
be designed to carry one wheel load.
3. Arkansas Designed for a minimum of 0.9 wheel loads.
12. Iowa For double-tee each stem assumed to. carry
S/5.5 wheel load with S = ave. stem spacing.
Multi-web treated as a channel under Sec.
1.3.1 (0)
22. Montana "Key is assumed hinged and moments calculated on
that basis."
25. New York "For adjacent slabs and boxes, the lesser of
S/6.0 or 1.3.1(0) is used for composite
structures. Otherwise 1.3.1(D) is used.
30. Oregon "The greater of current or previous AASHTO
distribution formulae."
34. Tennessee Also allows "Henry's Method"

What types of connections between adjacent precast members are used?
What procedures are used for the design of theseconnections? Upon what are these
procedures based?
State Q5 Q6
1. Alaska Welded flange connectors
Provided at 4' crs.
Arizona Boxes and voided slabs tied
laterally as recommended by
PCI and AASHO Br. Cttee.
Shear key packed with non-
shrink grout after tensioning
1-1/4"0 mild steel tie rods.
Have reservations, about welded
ties proposed by PCI.
Arkansas Bolts + grouted shear key.
None.
Based on tests to 2.5 times
design load in early 1950's.
Differences of opinion about
loads and load distribution.
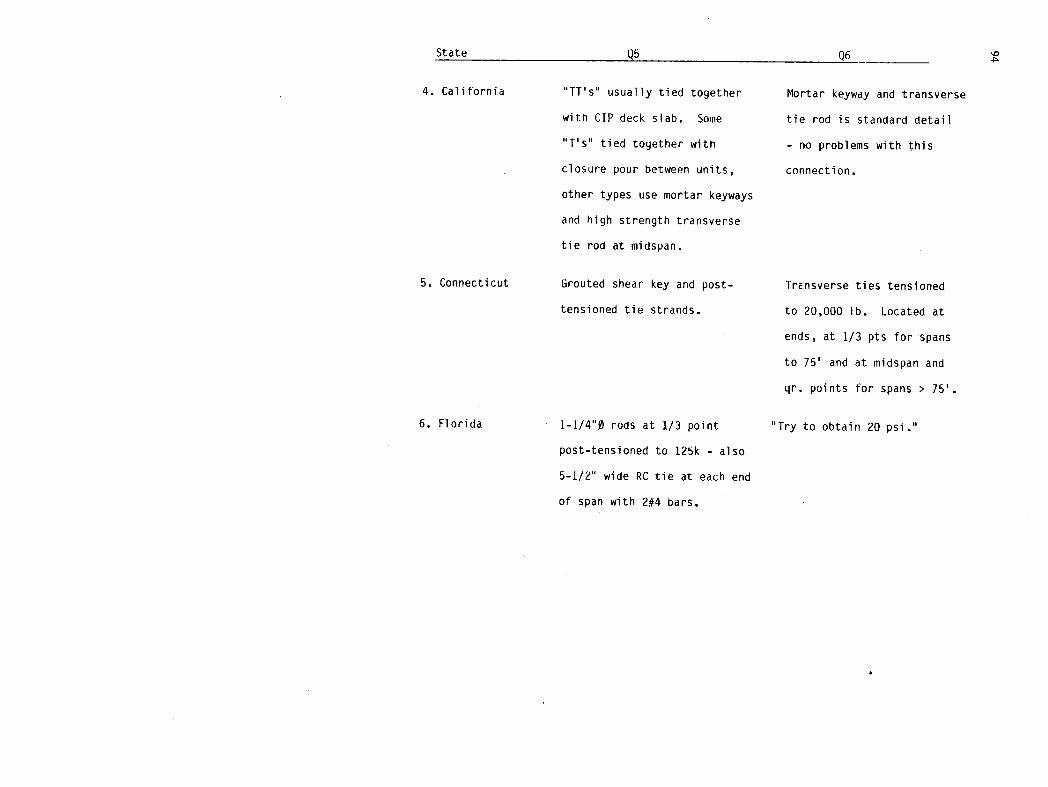
State
4. California "Ti's" usually tied together
with CIP deck slab. Some
"T's" tied together with
closure pour between units,
other types use mortar keyways
and high strength transverse
tie rod at midspan.
Mortar keyway and transverse
tie rod is standard detail
- no problems with this
connection.
5. Connecticut Grouted shear key and post-
tensioned tie strands.
irnsverse ties tensioned
to 20,000 lb. Located at
ends, at 1/3 pts for spans
to 75' and at midspan and
qr. points for spans >
6. Florida 1-1/40 rods at 1/3 point Try to obtain 20 psi."
post-tensioned to 125k - also
5-1/2" wide RC tie at each end
of span with 2#4 bars.

State
Q5
Georgia Channel secs. connected by No formal design project.
short 3/40 tie bolts
through adjacent webs, on 5'
crs. Slabs - grouted shear
key and 10 m.s. tie rod
at midspan for 20' span,
1-1/20 for 30' and 40'.
Hawaii With I girders - deck slab None.
and diaphragms. Slabs -
keyway filled with epoxy
grout.
Idaho Slabs - grouted keyway and None.
tie bolt,s or tie strand (4' spacing arrived at after
stressed to 30 kips. Multi- consultation with engineers
web sections - with 4" of Yakima County, WA, who
concrete topping - grouted found this durable after
keyway + welded connectors 10 yrs service.)
at 6 ft. crs., - without
topping - ditto but 4' crs.
Illinois Slabs - grouted shear key. 'Shear keys designed to
transfer wheel loads
between adjacent beams."
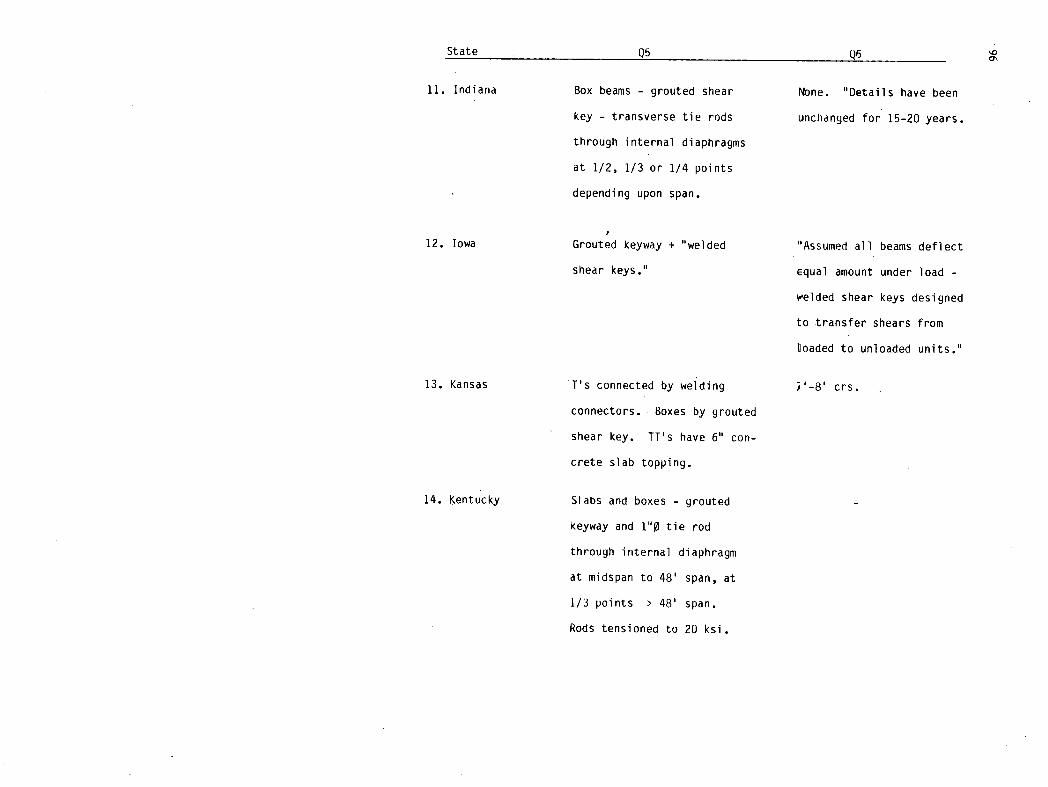
State
Indiana Box beams - grouted shear
key - transverse tie rods
through internal diaphragms
at 1/2, 1/3 or 1/4 points
depending upon span.
Iowa Grouted keyway + "welded
shear keys."
Kansas Il's connected by welding
connectors. Boxes by grouted
shear key. Ti's have 6" con-
crete slab topping.
Kentucky Slabs and boxes - grouted
keyway and 1"Ø tie rod
through internal diaphragm
at midspan to 48' span, at
1/3 points > 48' span.
Rods tensioned to 20 ksi.
None. "Details have been
unchanyed for 15-20 years.
"Assumed all beams deflect
Equal amount under load -
welded shear keys designed
to transfer shears from
'oaded to unloaded units."
'-8' crs.
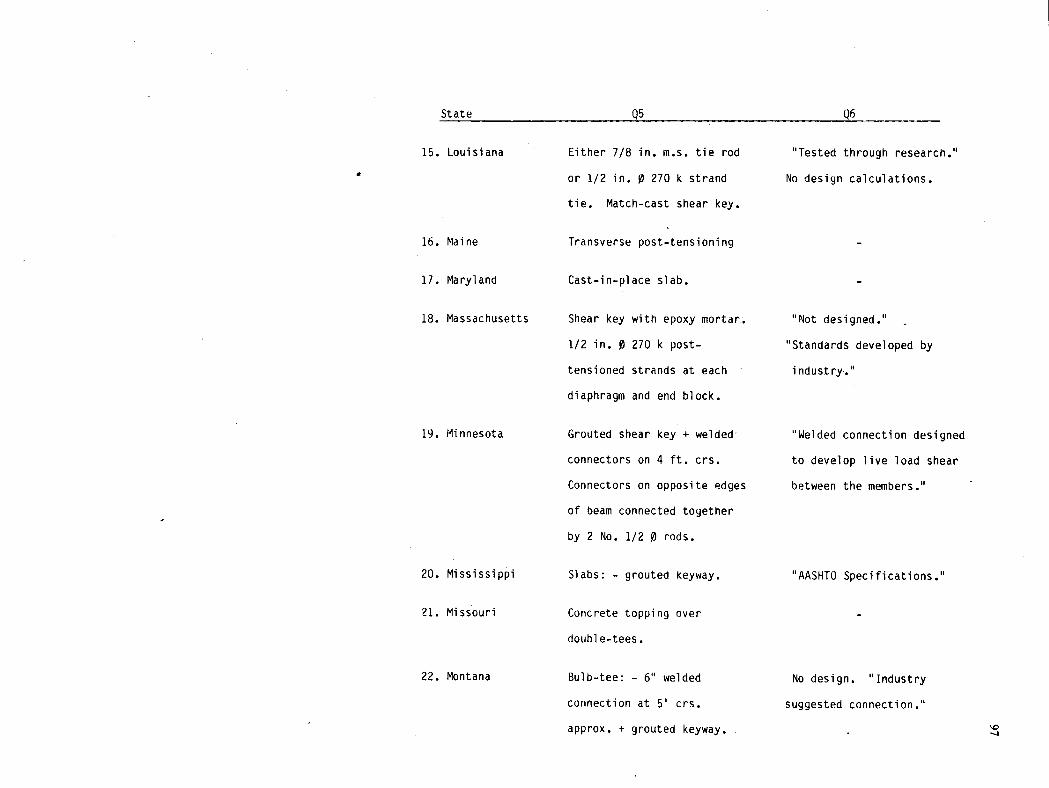
State
Louisiana Either 7/8 in. m.s. tie rod 'Tested through research."
or 1/2 in. 0 270 k strand No design calculations.
tie. Match-cast shear key.
Maine Transverse post-tensioning -
Maryland Cast-in-place slab. -
Massachusetts Shear key with epoxy mortar. "Not designed."
1/2 in. 0 270 k post- "Standards developed by
tensioned strands at each industry."
diaphragm and end block.
Minnesota Grouted shear key + welded 'Welded connection designed
connectors on 4 ft. crs. to develop live load shear
Connectors on opposite edges between the members."
of beam connected together
by 2 No. 1/2 0 rods.
Mississippi Slabs: - grouted keyway. 'AASHTO Specifications."
Missouri Concrete topping over - double-tees.
Montana Bulb-tee: - 6' welded No design. "Industry
connection at 5' crs. suggested connection."
approx. + grouted keyway.
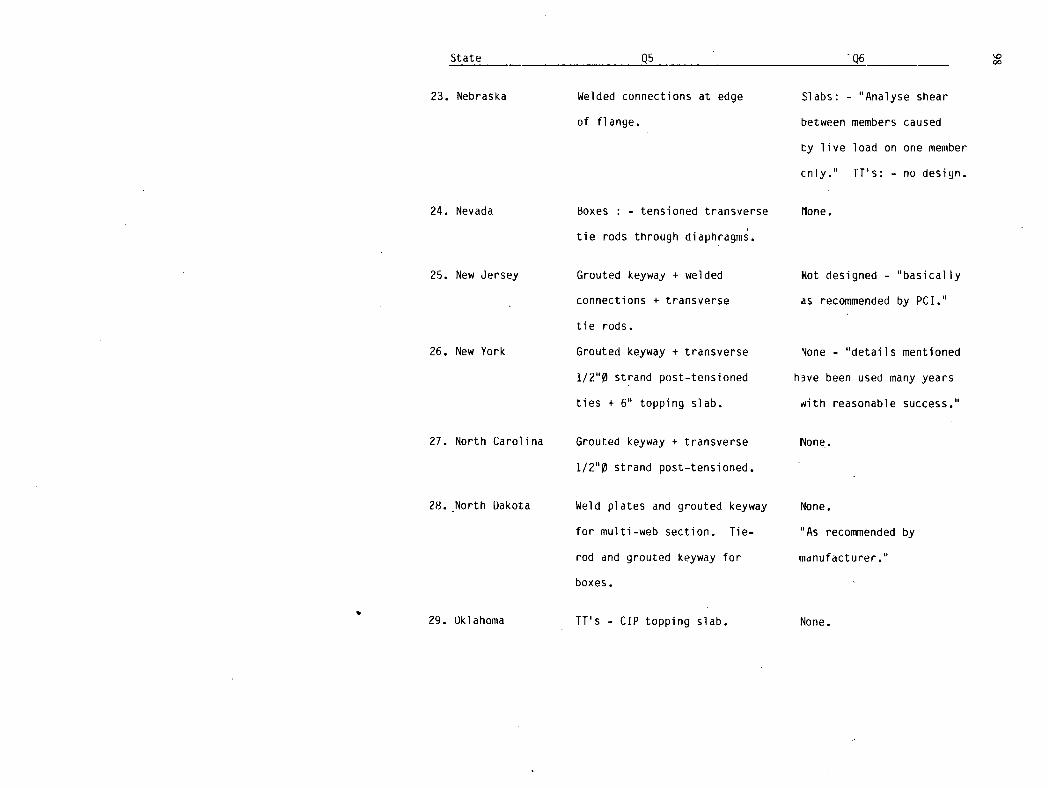
State
Nebraska Welded connections at edge Slabs: - "Analyse shear
of flange, between members caused
by live load on one member
cniy." Ti's: - no design.
Nevada Boxes : - tensioned transverse lone.
tie rods through diaphragms.
New Jersey Grouted keyway + welded Not designed - "basically
- connections + transverse as recommended by PCI."
tie rods.
New York Grouted keyway + transverse "one - "details mentioned
1/20 strand post-tensioned h3ve been used many years
ties + 6" topping slab. with reasonable success."
North Carolina Grouted keyway + transverse Fone.
1/20 strand post-tensioned.
North Dakota Weld plates and grouted keyway None.
for multi-web section. Tie- "As recommended by
rod and grouted keyway for manufacturer."
boxes.
Oklahoma Ti's - CIP topping slab. None.
00

State
Oregon Slabs and Boxes: - m.s. tie 'Experience and specifi-
rods and grouted shear key cations."
Bulb-Tees: - Steel diaphragms
and welded key."
Pennsylvania Grouted keyway. -
South Carolina - -
South Dakota Grouted shear key + welded ties "Design by fabricators -
on 5 ft. crs. Two 1-1/2 x 1-1/2 checked by consultant.
angles anchored with two #3 Procedures?
bars 18" long.
Tennessee Continuous R.C. deck slab. -
Utdh Bar or strand ties at midspan None.
and qr. points (tensioned to
30 k.) + yrouted keyway.
Vermont Grouted keyway + welded None.
connections at 6' crs.
Viryina Grouted keyway and transverse None.
post-tensioning.
West Viryinia Grouted shear keys + transverse "Standard details."
bolts. Basis for design unknown.
Wisconsin Transverse post-tensioning. None.
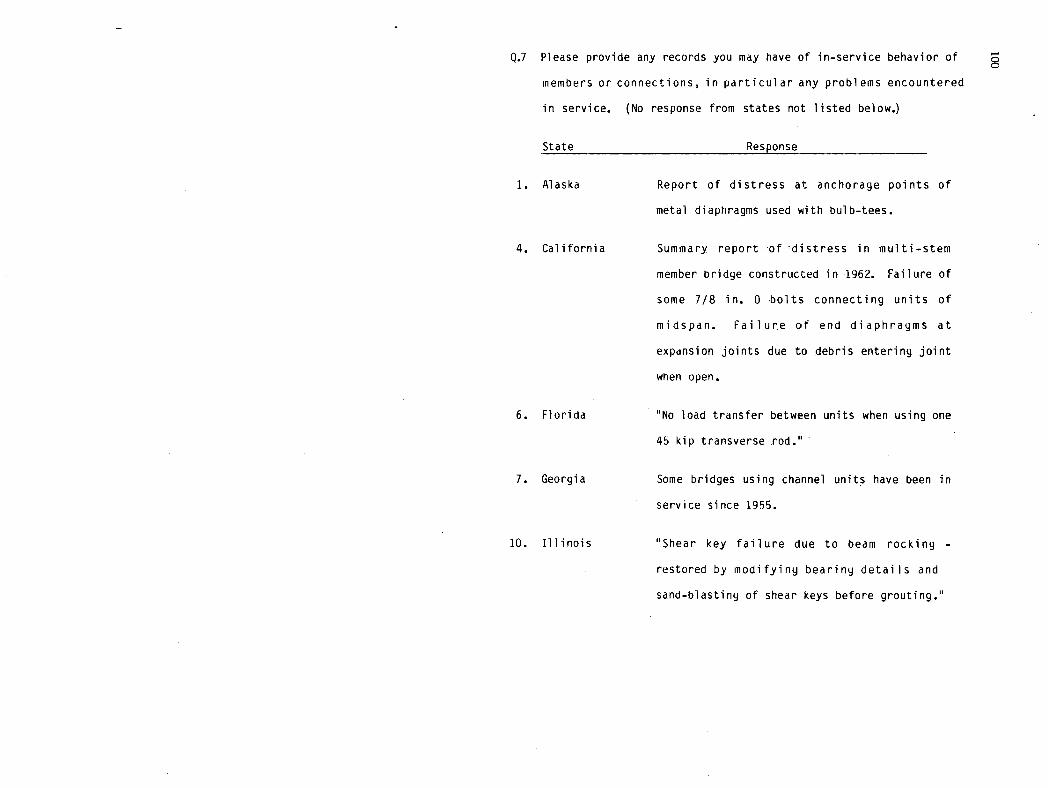
Q.7 Please provide any records you may have of in-service behavior of
members or connections, in particular any problems encountered
in service. (No response from states not listed below.)
State Response
1. Alaska Report of distress at anchorage points of
metal diaphragms used with bulb-tees.
4. California Summary report of distress in multi-stem
member bridge constructed in 1962. Failure of
some 7/8 in. 0 bolts connecting units of
midspan. Failure of end diaphragms at
expansion joints due to debris entering joint
when open.
Florida "No load transfer between units when using one
45 kip transverse rod."
Georgia Some bridges using channel units have been in
service since 1955.
10. Illinois "Shear key failure due to beam rocking -
restored by modifying bearing details and
sand-blasting of shear keys before grouting."
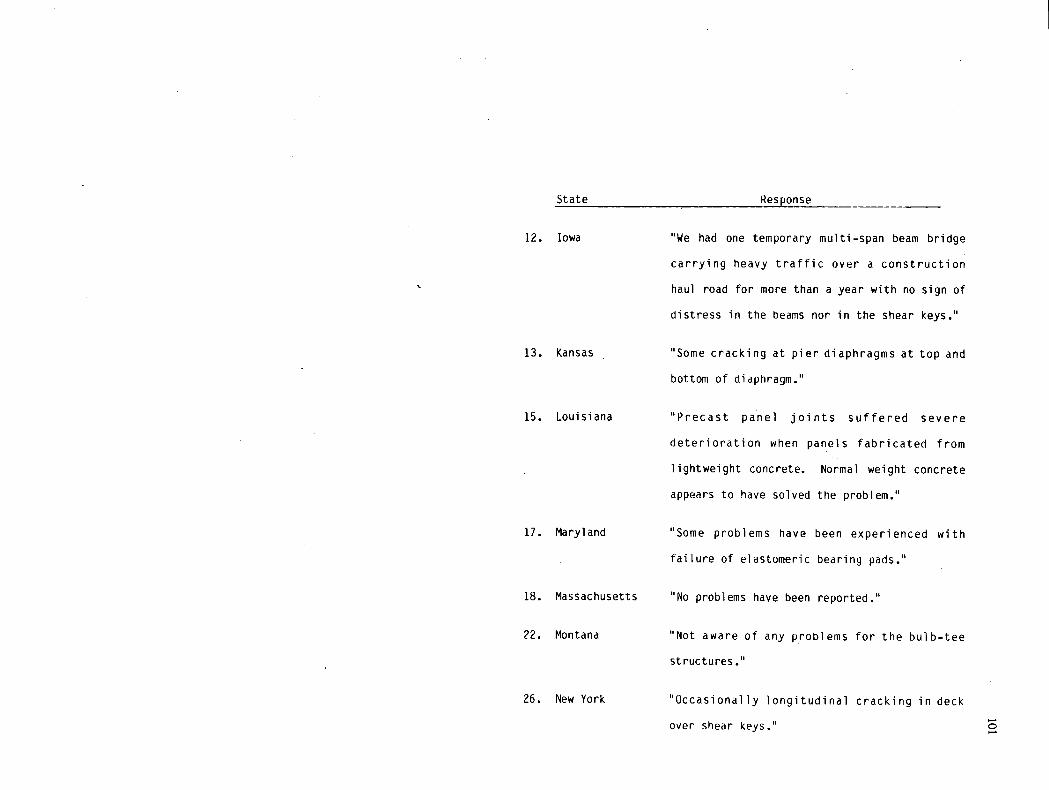
State Response
Iowa 'We had one temporary multi-span beam bridge
carrying heavy traffic over a construction
haul road for more than a year with no sign of
distress in the beams nor in the shear keys."
Kansas "Some cracking at pier diaphragms at top and
bottom of diaphragm."
15. Louisiana "Precast panel joints suffered severe
deterioration when panels fabricated from
lightweight concrete. Normal weight concrete
appears to have solved the problem."
Maryland "Some problems have been experienced with
failure of elastomeric bearing pads."
Massachusetts "No problems have been reported."
22. Montana "Not aware of any problems for the bulb-tee
structures
26. New York "Occasionally longitudinal cracking in deck
over shear keys."
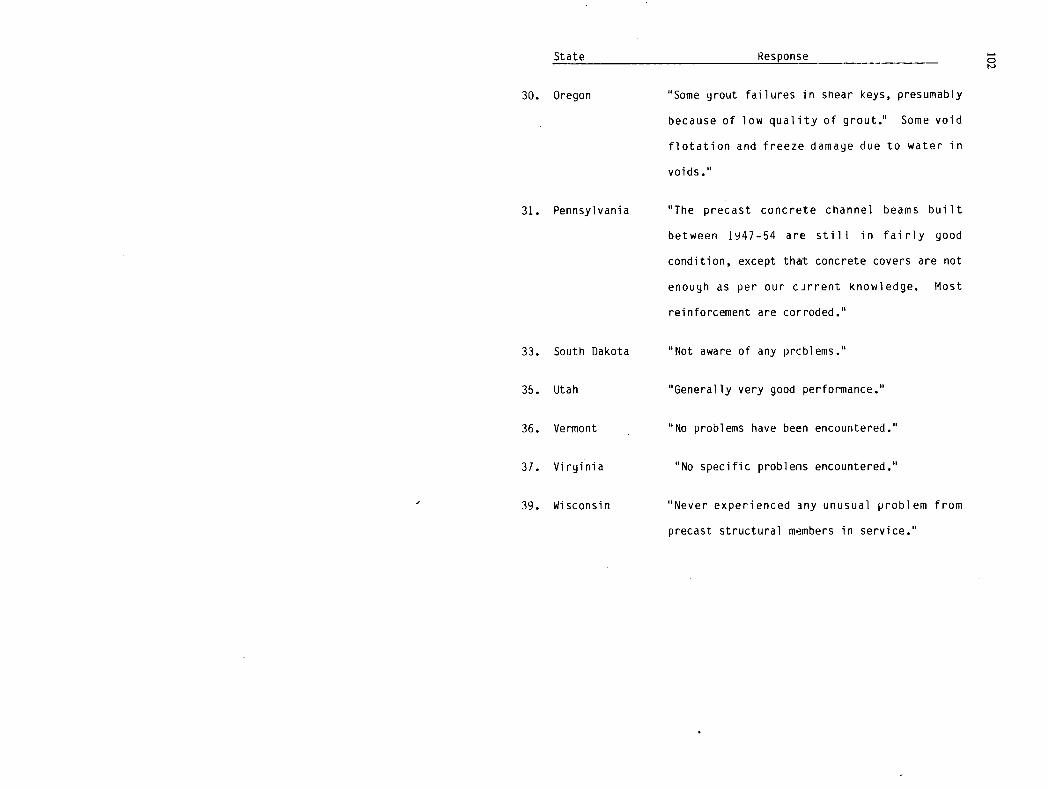
State Response
Oregon 'Some grout failures in shear keys, presumably
because of low quality of grout." Some void
flotation and freeze damage due to water in
voids."
Pennsylvania "The precast concrete channel beams built
between 1947-54 are still in fairly good
condition, except that concrete covers are not
enough as per our cJrrent knowledge. Most
reinforcement are corroded."
33. South Dakota "Not aware of any prcblems."
Utah "Generally very good performance."
Vemont - No problems have been encountered."
Virginia "No specific probleris encountered."
39. Wisconsin "Never experienced 3ny unusual problem from
precast structural members in service."
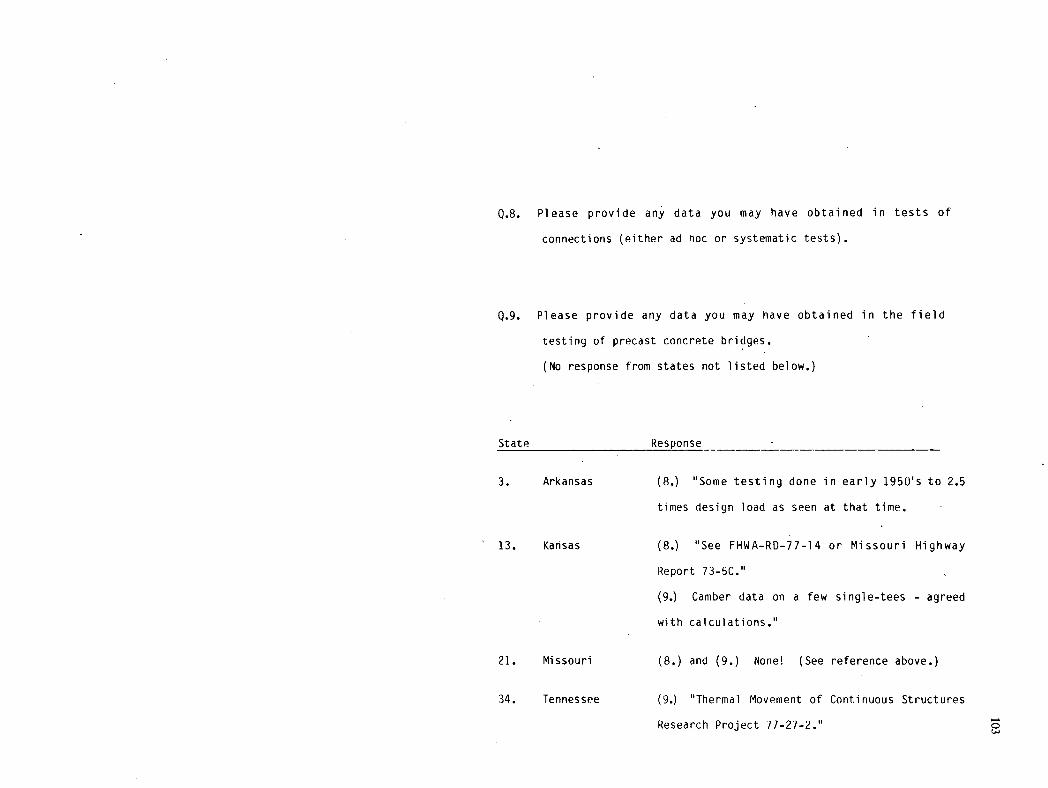
Please provide any data you may have obtained in tests of
connections (either ad hoc or systematic tests).
Please provide any data you may have obtained in the field
testing of precast concrete bridges.
(No response from states not listed below.)
State Response
3. Arkansas (8.) 'Some testing done in early 1950's to 2.5
times design load as seen at that time.
13. Kansas (8.) "See FHWA-RD-77-14 or Missouri Highway
Report 73-5C."
(9.) Camber data on a few single-tees - agreed
with calculations."
21. Missouri (8.) and (9.) None! (See reference above.)
34. Tennessee (9.) "Thermal Movement of Continuous Structures
Research Project 77-27-2."

Response to Survey by Washington Counties
Q.1. What types of precast concrete bridge members are commonly used?
I-Sec.
AASHTO Solid Voided Box
County or other Slab Slab Section
Benton - - 48" w. -
to 20' sp.
Chelan WA DOT - 12" d. -
to 100' sp. to 20' sp.
Clallam - - - -
Clark Not involved in bridge design.
Garfield Uses products of Central Premix, Spokane.
Span range 10' - 50', no details given.
Grays Harbor WA DOT 12" d. 15" & 18"
80' + sp. to 31' sp. 31' sp.
Island Not involved in bridge design.
King WA DOT 48' w. 48" w, 14"d.
80-100' sp. 15-20' sp. 20' sp.
d. = deep; w. = wide; sp. = span; X indicates used but details not given.
Channel
Secti on

County
9. Lewis
San Juan
Skagit
Spokane
Stevens
Thurston
15.Walla Walla
Whatcom
Yakima
I-Sec.
AASHTO Solid Voided Box Channel
or other Slab Slab Section Section
WA DOT 48" w., 12" d. - - - to 30' sp.
NotinvoIved in bridge design.
- - x - -
WA DOT 12" - 15" d. - - 30" d.

Response to Survey by Washington Counties 0
Q.1. Continued. What types of precast concrete bridge members are commonly used?
County Bulb-Tee Bulb-Tee Single-Tee Double-Tee Multi-Stem
(full deck) (Spaced)
Benton - - - - 48" - 72" w.
20-55' sp.
Chel an 48" w. - 48" w. - 16" - 18" d.
to 95' sp. to 100' sp. 48" - 18" d.
to 40' sp.
Clallam 63" - 92" w. - - - -
41" & 53" d.
65' - 85' sp.
Clark - - - - -
Gartield - - - - -
Grays Harbor Conc. Tech. - - X -
Sections.
to 100' sp.
Island - - - -
King - - 48" w. 48" w. -
40-60' sp. 16-50' sp.
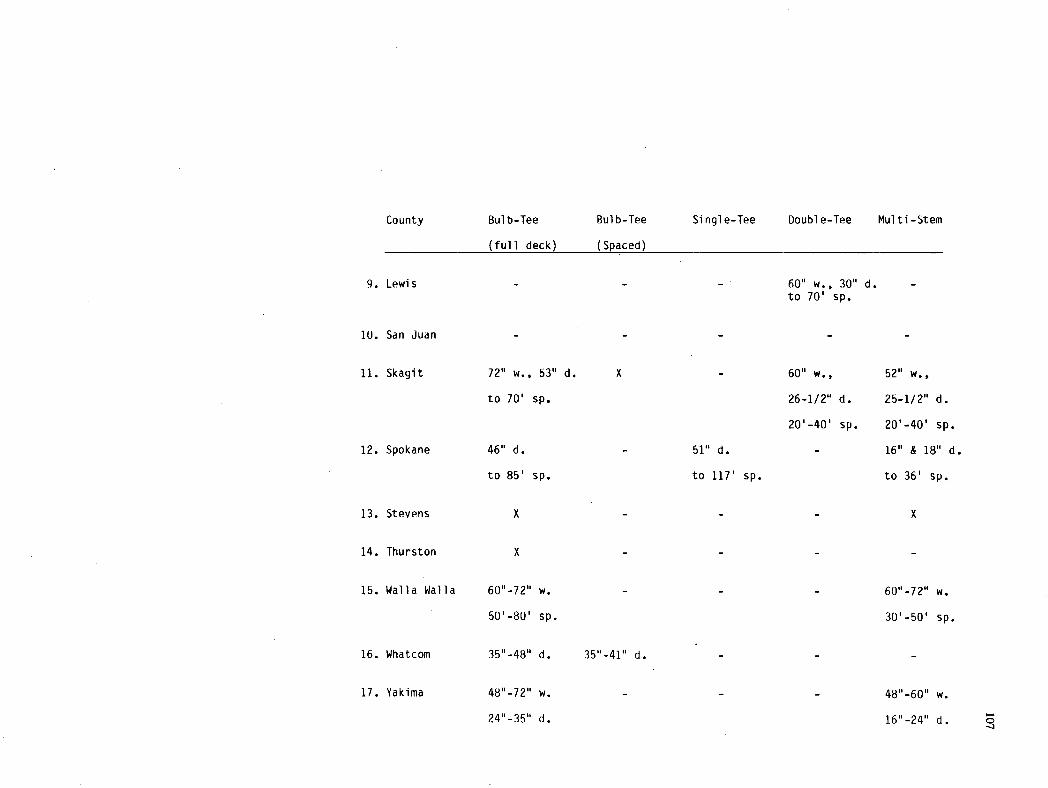
County Bulb-Tee Bulb-Tee
Single-Tee Double-Tee Multi -Stem
(full deck) (Spaced)
9. Lewis - - 60" w., 30" d. to 70' sp.
San Juan - -
Skagit 72" w., 53" d. X
to 70' sp.
Spokane 46" d. - to 85' sp.
Stevens X -
Thurston X -
Walla Walla 60-72" w. -
50'-80' sp.
Whatcom 35-48" d. 35-41' d.
Yakima 48"-72" w. -
24-35" d.
- 60" w., 52" w.,
26-1/2" d. 25-1/2" d.
20-40' sp. 20'-40' sp.
51" d. - 16" & 18" d.
to 117' sp. to 36' sp.
- - x
- - 60-72" w.
30'-50' sp.
- - 48-60" w.
16-24" d.
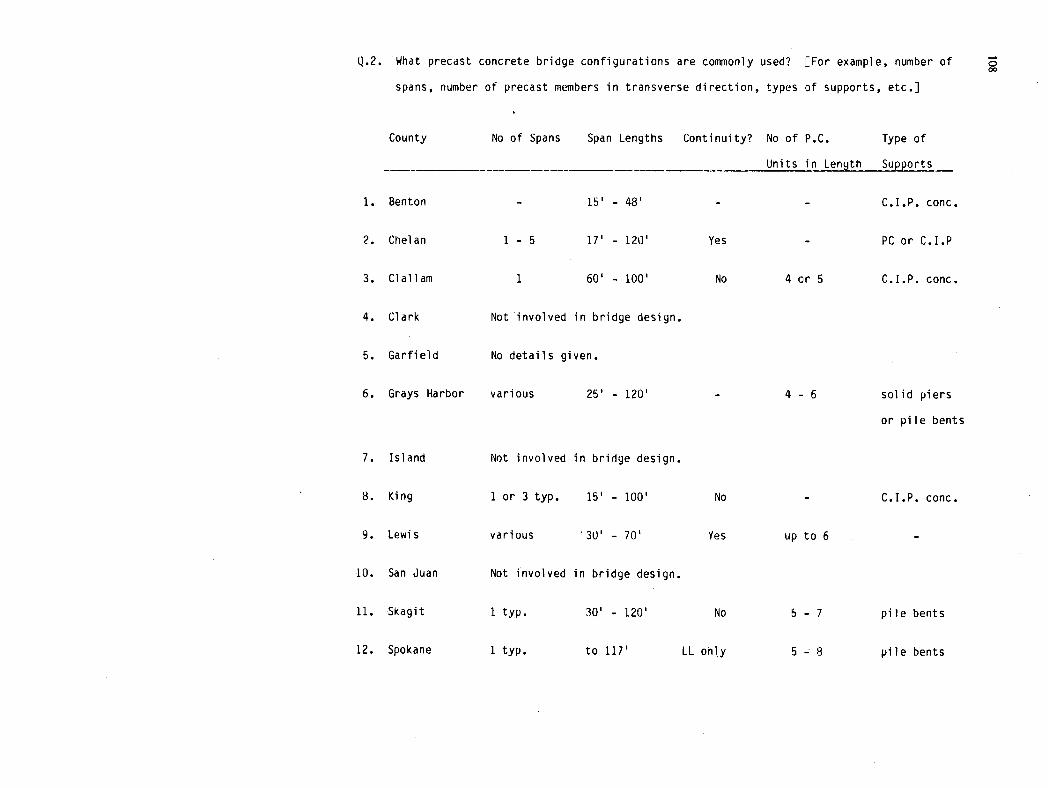
Q.2. What precast concrete bridge configurations are commonly used? [For example, number of
spans, number of precast members in transverse direction, types of supports, etc.]
County No of Spans Span Lengths Continuity? No of P.C. Type of
Units in Lenqth Supports
Benton - 15' - 48' - - C.I.P. conc.
Chelan 1 - 5 17' - 120' Yes - PC or C.I.P
Clallam 1 60' - 100' No 4 or 5 C.I.P. conc.
Clark Not involved in bridge design.
Garfield No details given.
Grays Harbor various 25' - 120' - 4 - 6 solid piers
or pile bents
Island Not involved in bridge design.
King 1 or 3 typ. 15' - 100' No - C.I.P. conc.
Lewis various 30' - 70' Yes up to 6 -
San Juan Not involved in bridge design.
Skagit 1 typ. 30' - 120' No 5 - 7 pile bents
Spokane 1 typ. to 117' LL only 5 8 pile bents
C 00
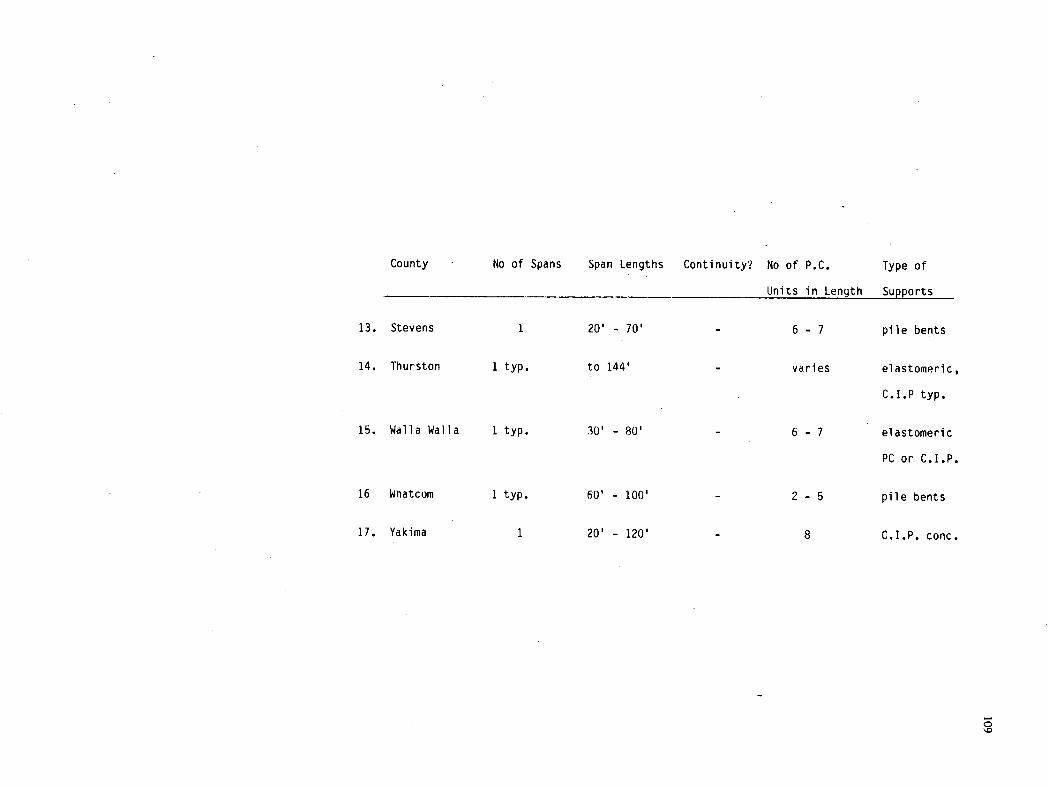
County - No of Spans Span Lengths Continuity? No of P.C. Type of
Units in Length Supports
Stevens 1 20' - 70' - 6 - 7 pile bents
Thurston 1 typ. to 144' - varies elastomeric,
C.I.P typ.
Walla Walla 1 typ. 30' - 80' - 6 - 7 elastomeric
PC or C.I.P.
16 Whatcom 1 typ. 60' - 100' - 2 - 5 pile bents
17. Yakima 1 20' - 120' - 8 C.I.P. conc.
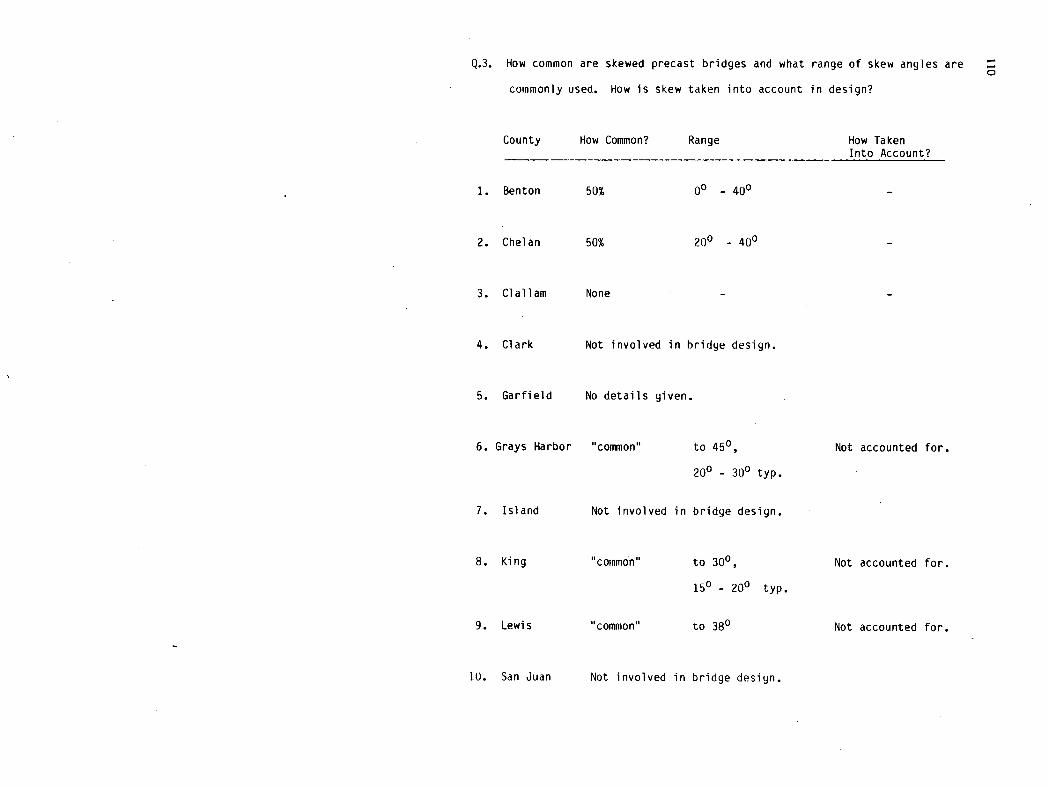
Q.3. How common are skewed precast bridges and what range of skew angles are
commonly used. How is skew taken into account in design?
County How Common? Range How Taken Into Account?
Benton 50% 00 - 400 -
Chelan 50% 200 - 400 -
Clallam None - -
Clark Not involved in bridge design.
Garfield No details given.
Grays Harbor 'common" to 450, Not accounted for.
200 - 300 typ.
Island Not involved in bridge design.
King "common" to 300, Not accounted for.
150 - 200 typ.
Lewis "common" to 380 Not accounted for.
San Juan Not involved in bridge design.

County How Common? Range
Skagit "common" 150 - 500
Spokane "common" to 450
Stevens - 00 - 150
Thurston "common" 00 - 300
WalIa Walla "common" 00 - 350
Whatcom 'uncommon" -
Yakima 20% - 30% 00 - 300
How Taken Into Account?
Not accounted for.
Not accounted for.
Not accounted for.
Not accounted for.
"Reinft., increased
at ends of units."

Q.4. What methods are used to determine the distribution between the members of
forces caused by wheel loads?
County Method
Benton 'Use manufacturer's rcommendations."
Chelan -
Clallam "Use S/6.0 for deck bulb tees."
Clark -
Garfield -
Grays Harbor 'AASHTO Sec. 1.3.1."
Island -
King "AASSHTO Sec. 3, Distribution of Loads."
Lewis "AASHTU"
San Juan -
Skagit "Consultant design analysis. Industry experience
and field inspection."
Spokane "Use S/5.5 for bulb-tee and single-tee. For rib
decks use AASHTO multi-beam."

County Method
Stevens "Fabricator provides engineering."
Thurston "AASHTO Sec. 1.3.1."
Walla Walla "Fabricator provides engineering."
Whatcom - "Lateral distribution of 'oads not determined.
A cantilever loading of each girder is assumed."
Yakima "AASHTO Sec. 1.3.1."

What types of connections between adjacent precast members are used?
What procedures are used for the design of these connections? Upon what
are these procedures based?
County Q.5 Q.6
Benton Weld ties or bolts Manufacturer's
through adjacent ribs, recommendations.
Chelan Steel or concrete diaphragms.
Clallam Welded flange connectors at
4' crs. and yrouted shear
keys.
Clark -
Garfield -
Grays Harbor Slabs - yrouted shear keys
and tie rod at midspan.
Bulb-tee - welded flange
connectors at 5' crs and
yrouted shear keys.
Island -
Nbne - rely on past
experience and/or testing
by fabricator.
Rely on industry practice.
o failures experienced
in 20 years.

County Q.5 Q.6____ -________
King Grouted shear keys with
transverse tie rods or
welded flange connectors.
Lewis Slabs - grouted shear keys
and tie rod at midspan.
Double-tee has 4 in. CIP
deck and diaphragms.
San Juan
Rule of thumb based
on past experience.
"Standard engineering
methods." Design by
consultant.
Skagit Steel or concrete diaphragms.
Grouted shear key and welded
flange connectors at 4' crs.
or transverse post-tensioning.
Spokane Weld ties at 6' crs (max.)
Stevens Weld clips.
Thurston Slabs - grouted shear keys
and transverse tie rods.
Bulb tees - welded flange
connectors and CIP diaphragms.
"Experience based on prior
use. Industry experience.
Consultant input."
Industry practice.
Engineering provided
by fabricated.
WA 1)01 standard details.
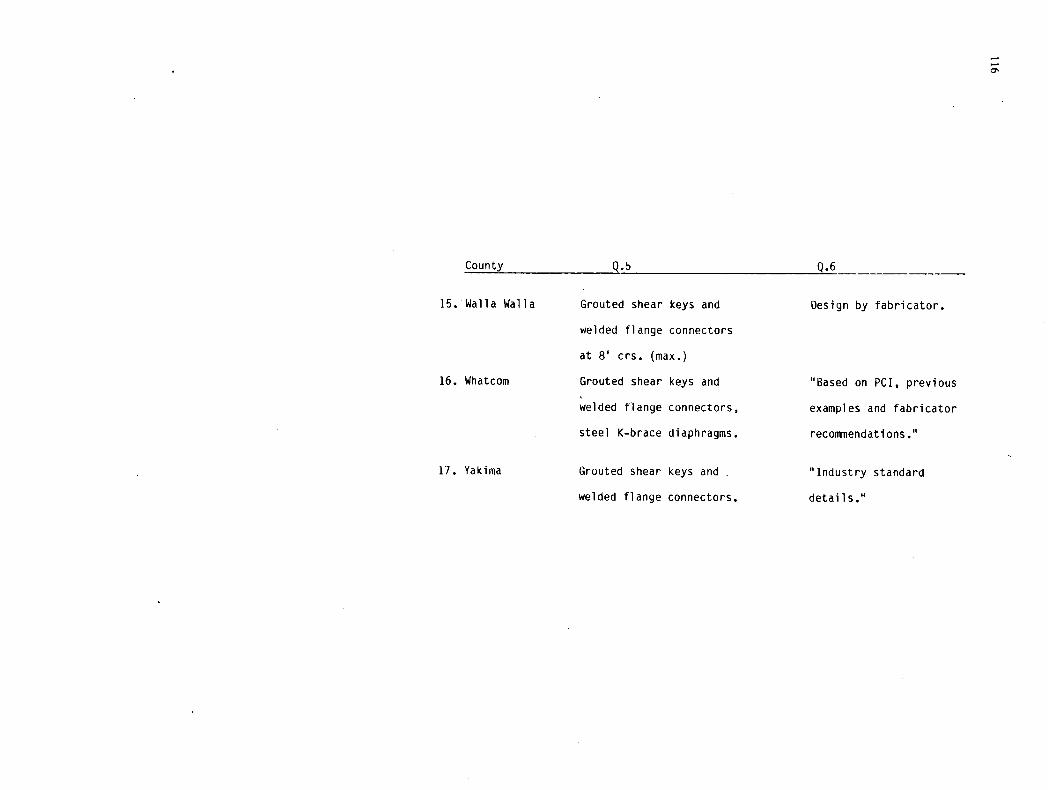
County 0.5 .6
Walla Walla Grouted shear keys and
welded flange connectors
at 8' crs. (max.)
Whatcom Grouted shear keys and
welded flange connectors,
steel K-brace diaphragms.
Design by fabricator.
"Based on PCI, previous
examples and fabricator
recommendations •u1
17. Yakima Grouted shear keys and "Industry standard
welded flange connectors, details."
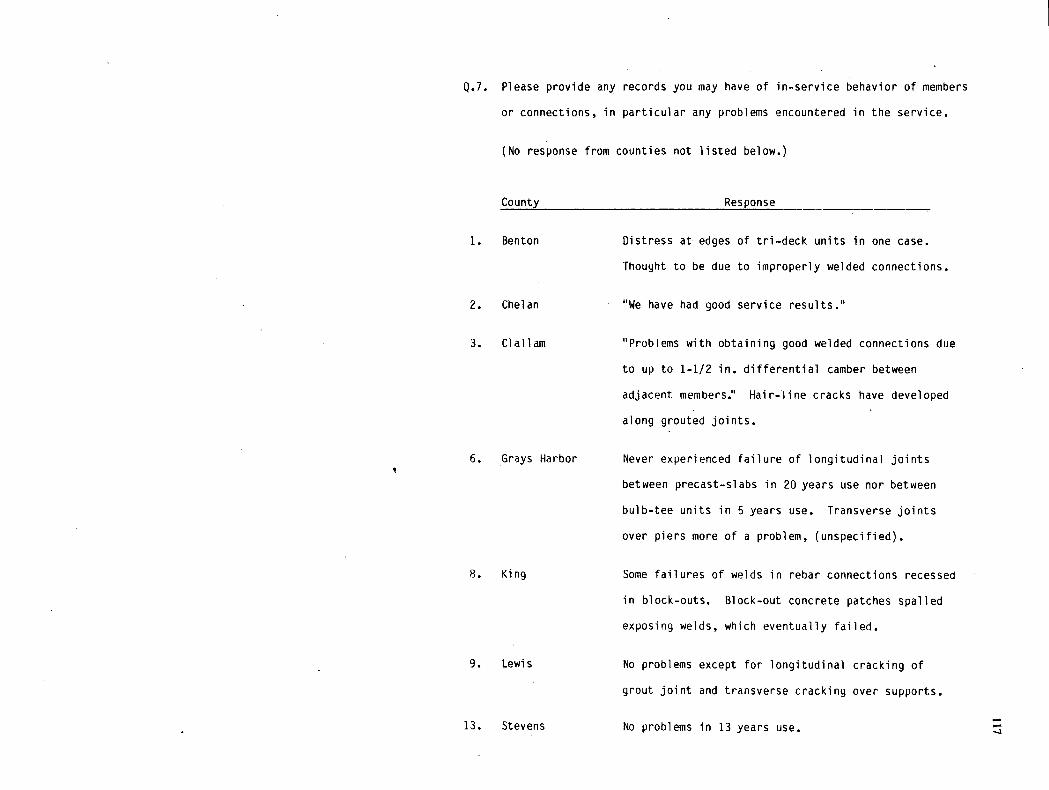
Q.7. Please provide any records you may have of in-service behavior of members
or connections, in particular any problems encountered in the service.
(No response from counties not listed below.)
County Response
Benton Distress at edges of tn-deck units in one case.
Thought to be due to improperly welded connections.
Chelan I"We have had good service results."
Clallam "Problems with obtaining good welded connections due
to up to 1-1/2 in. differential camber between
adjacent members." Hair-line cracks have developed
along grouted joints.
6. Grays Harbor Never experienced failure of longitudinal joints
between precast-slabs in 20 years use nor between
bulb-tee units in 5 years use. Transverse joints
over piers more of a problem, (unspecified).
King Some failures of welds in rebar connections recessed
in block-outs. Block-out concrete patches spalled
exposing welds, which eventually failed.
Lewis No problems except for longitudinal cracking of
grout joint and transverse cracking over supports.
13. Stevens No problems in 13 years use.

County Response00
Walla Walla Cracking along interface between grout and beam
in longitudinal joints.
Whatcom "No problems encountered."
Yakima "has many precast bridges with excellent service
records." Only two bridges suffered weld tie
failure due to improper anchor fabrication.
Please provide any data you may have obtained in tests of connections,
(either.ad hoc or systematic tests).
Please provide any data you may have obtained in the field testing of
precast concrete bridges.
No testing has been carried out by any county.

Response to Survey -by Precast Concrete Producers
Q.1. What types and sizes of precast concrete bridge members are commonly used?
Producer I-Sec.,
(AASHTO
or other
Solid Voided Box Channel
Slab Slab Section Section
Hurlbut Co. 36, 45"
Wisconsin & 54" d.
Morse Bros. Types II to V
Oregon
Eugene S & G X
Oregon
Central Premix -
Washi ngton
CPI Products Types I, II
Tennessee & III
Cretex -
Minnesota
36" & 48" w. - 36" & 48" w. 36" w.
12" d. 17" to 42" d. 16" d.
48" w., 12" d. 48" w., 15", 48" w. 48" w.
18" ,21" ,26" d. 33" to 48" d. 33" to 48" d.
48" w., 12" d. 48" w., 15" d. - -
12" w., 12" d. 18", 21", 26" d.
- 48" w., 12" d. - -
to 20' sp.
- - 36" & 48" w. -
48" w., 10" d. - 36" & 48" 38" w., 15" d.
8' - 14' sp. 21" to 42" d. 19' - 31' sp.
30' - 103' sp.
d. = deep; w. = wide; sp. = span; X indicates used, but details not given.

Producer I-Sec., Solid
(AASHTO Slab
or other)
Prestress Eng. 3611, 4211, 48" - Illinois & 54" d.
Ill. State Sec.
Lonestar/ Types III 36" & 42" w.
San Vel to VI 12 to 18' d.
Massachusetts
Schuykill Prod. 24" to 96" d. -
Pennsylvania to 150' sp.
Southern Types I, II 48" w.
Prestress III & IV 12" d.
Florida
Stanley Struc. X 96" w.
Colorado 8" - 12" d.
Concrete Tech. X x
Corp., Washington
Voided Box Channel C
Slab Section Section
36", 48" 52" w. - -
11" to 33" d.
- Types Bl& -
811 36" & 48" w.
- 36" & 48" w. -
12" to 60" d.
- to 150' sp.
48" w. - X
is" a 18" d.
- 48" & 72" w. -
24" to 44" d.
- - x

Q.1. Continued.
What types and
Producer
sizes of precast
Bu b-tee
(full deck)
concrete bridge
Bul b-tee
(spaced)
members are commonly
Si rigl e-tee
used?
Doubi e-tee Multi -stern
-
Huribut Co. - - - - -
Morse Bros. 60", 72 11 , 8411 , 48" w. - 120" w. -
Oregon 96' w., 36" & 65" & 72" d. 36 1 9 48" d.
54" d.
Eugene S & G as (2) as (2) - - -
Oregon
Central Premix 56" w. - 56" w., 51" d. - 48" & 72" w.
Washington 34" - 64" d. 80' - 125' sp. 16" d.
58' - 150' sp. 20' - 40' sp.
CPI Prod. - - - - -
Tennessee
Cretex 48", 72", 96" w. - - 48", 72", 96" w. 48" & 60" w.
Minnesota 3 9 " d.. 23" , 29" , 37" d. 23" & 32" d.
60' - 90' sp. 18' - 63' sp. 19' to 63' sp.
Prestress Eng. - - - - -
Illinois
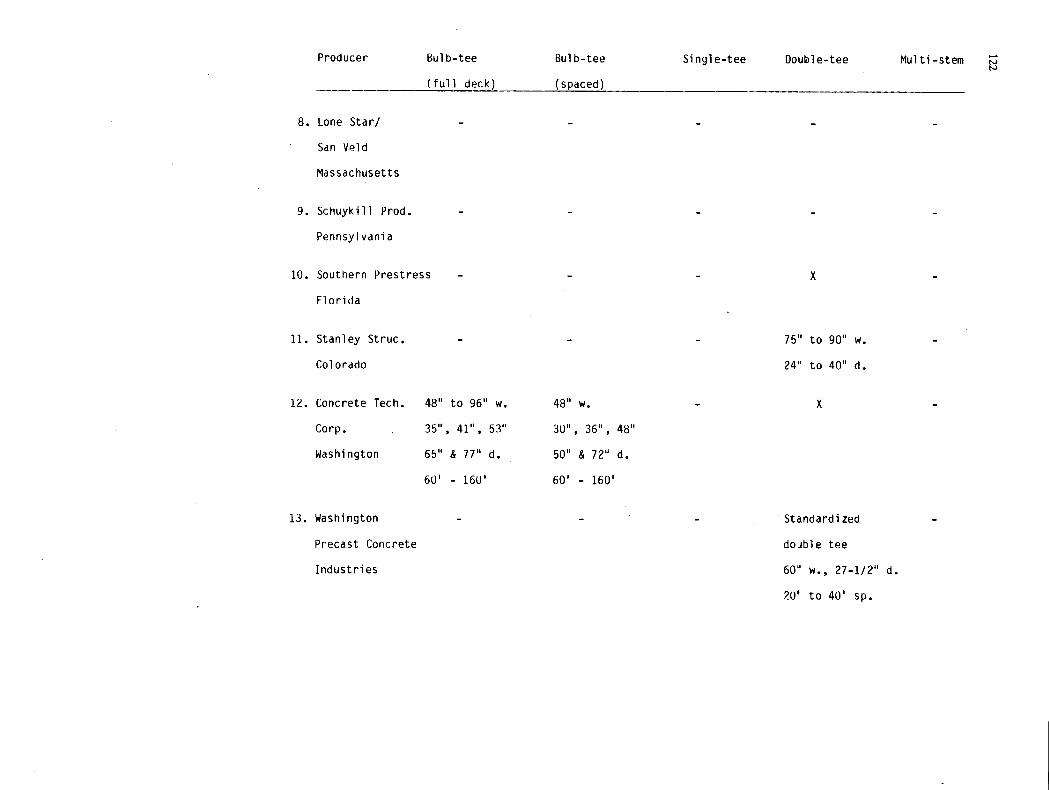
Producer Bulb-tee Bulb-tee Single-tee Double-tee Multi-stem
(full deck) (spaced)
Lone Star! - - - - -
San Veld
Massachusetts
Schuykill Prod. - - - - -
Pennsylvania
Southern Prestress - - - x -
Fl or i (I a
Stanley Struc. - - - 75" to 90 w. -
Col orado 24" to 40" d.
Concrete Tech. 48" to 96" w. 48" w. - X -
Corp. 3511 , 4111, 53" 30 11 , 36 , 48"
Washington 65" & 77" d. 50" & 72" d.
60' - 160' 60' - 160'
Washington - - - Standardized -
Precast Concrete doible tee
Industries 60' w., 27-1/2" d.
20' to 40' sp.

Q.2. What precast concrete bridge configurations are commonly used? [For example, number of spans, span lengths, use of
between spans, number of precast members in transverse direction, types of supports, etc.]
Producer No. of Spans Span .Lengths Continuity? No. of P.C. Type of
Units in Supports
Width
Hurlbut Co. Usually 1 - occasionally, - sill
Wisconsin - 2 or 3 spans
- box sec.
C.I.P. conn.
Morse Bros. 1 - 12 20' - 145' occasionally, - -
Oregon Sinip. sup. C.I.P. conn. or
most common, by post-tens.
Eugene S & G - 12' - 70' infrequently, up to 14 -
Oregon C.I.P. conn. (56' wide)
Central Premix Usually 1. usual range only with usually -
Washington 25' - 85' C.I.P. deck. 5 or 6
C.P.I. Products vary vary for live load - C.I.P. Conc.
Tennessee - C.I.P. conn.
Cretex 1, 2 or 3 19' - 103' No. - Fixed at
Minnesota one end.

Producer No. of Spans Span Lengths Continuity? No. of P.C.
Units in
Width
7. Prestress Eng. - - No. 6 to 9
Illinois
Lonestar/San Vel Usually 1.
Massachusetts
Scuylkill Prod. 1 and up. to 150'
Pennsyl vania
Southern Prestress varies -
Florida
Stanley Structures 2 - 4 25' - 85'
Colorado
Concrete Technology Mostly simple 60' - 160'
Corp., Washington span.
Washington Precast 1 20' - 40'
Concrete Industries
A few
2 span.
For LL
superposed DL
Type of
Supports
C.I.P. conc.
Conc.
C.I.P.
Sometimes 4 - 5 rural neoprene
with box sec. 8 - 10 cities
Sometimes - elastomeric
for live load.
No. 6 fcr 2 lane C.I.P. conc.
bricge.

Q.3. (a) How common are skewed precast bridges and
what range of skew angles are commonly used?
How is skew taken into account in design?
Producer How common? Range How taken
into Account?
Huribut Co. 33 - 50% 0 to 450, Not known.
Wisconsin typ. 150 - 250
Morse Bros. abt. 50% 200 + Tie rod & diaphragm
Oregon spacing varied.
Eugene S & G - U to 550 Diaphragms thickened.
Oregon More strand in slabs
with > 200 skew.
Central Premix 30% - 40% 0 to 450 in slabs By increasing deck
Washington 0 to 300 multi- slab thickness at
web sec. acute angle corners.
C.P.I. Products common "various" -
Tennessee
Cretex abt. 33% 0 to 300 End deck steel is
Minnesota "fanned' in slabs.

Producer How common? Range How taken
into Account?
Prestress Eng. "very common" 0 to 450 End blocks enlarged.
Illinois Shim pads to ensure
unit, bearing.
Lonestar/San Vel "common" 0 to 450, -
Massachusetts typ. 200 - 300 -
Schuyikill Prod. "majority of br." 0 to 450 - 600 'Follow AASHTO Specs."
Pennsylvani a
Southern Prestress - "rather large" Not known.
Florida
Stanley Structures "common" 100 to 450 Generally neglected
Colorado by design engineers.
Concrete Technology About one third.. 00 to 450 Some designers
Corp., Washington typ. 15 to 300 stagger diaphragms.
Washington Precast Standardized double=tee bridge primarily intended
Concrete Industries for right spans. "Appropriate modifications can
be made for skew spans."

Q.4. What methods are used to determine the distribution between
members of forces caused by wheel loads?
Producer Method
Huribut Co. AASHTO Sec. 13.1 (Box & channel sec.)
WI sconson
Morse Bros. AASHTO Table 1.3.1(B) spaced girders
Oregon AASHTO 1.3.1(D) side-by-side beams
Eugene S & G 'AASHTO'
Oregon
Central Premix AASHTO 1.3.1(D)
Washi ngton
CPI Prod. AASHTO'
Tennessee
Cretex AASHTO 1.3.1(D)
Minnesota
Prestress Eng. AASHTO 83 Specs.
Illinois
Lonestar/San Vel AASHTO
Massachusetts
9, Schoy 1k i 11 Prod AASHT J
Pnnsy1 van ia

00
Producer Method
Southern Prestress AASHTO
"Joint capacities checked to ensure they are
adequate to transfer wheel loads."
Stanley Structures AASHTO 1.3.1(D)
Concrete Technology Not indicated.
Washington Precast AASHTO
Concrete Industries

What types of connections between adjacent precast members are used?
What procedures are used for the design of these connections? Upon what are these
procedures based?
Produce Q.5 Q.6
Hurlbut Co. Box & Channel - shear key
Wisconsin plus tie rod.
Morse Bros. Multi-beam system - grouted
Oregon shear key & welded flange
connection plus diaphragms.
Eugene S & G Shear key & tie rods.
Shear key & welded flange
connection.
Central Premix Shear key & welded connection
Washi ngton
CPI Prod. Shear key & tie rods.
Tennessee
Diaphragms - AASHTO.
Shear key & connectors
by "shear transfer method"
"Unknown."
Connectors designed for
IIS-20 wheel load + 30% I.F.
Keyway also designed to
transfer total HS-20 + 30%.
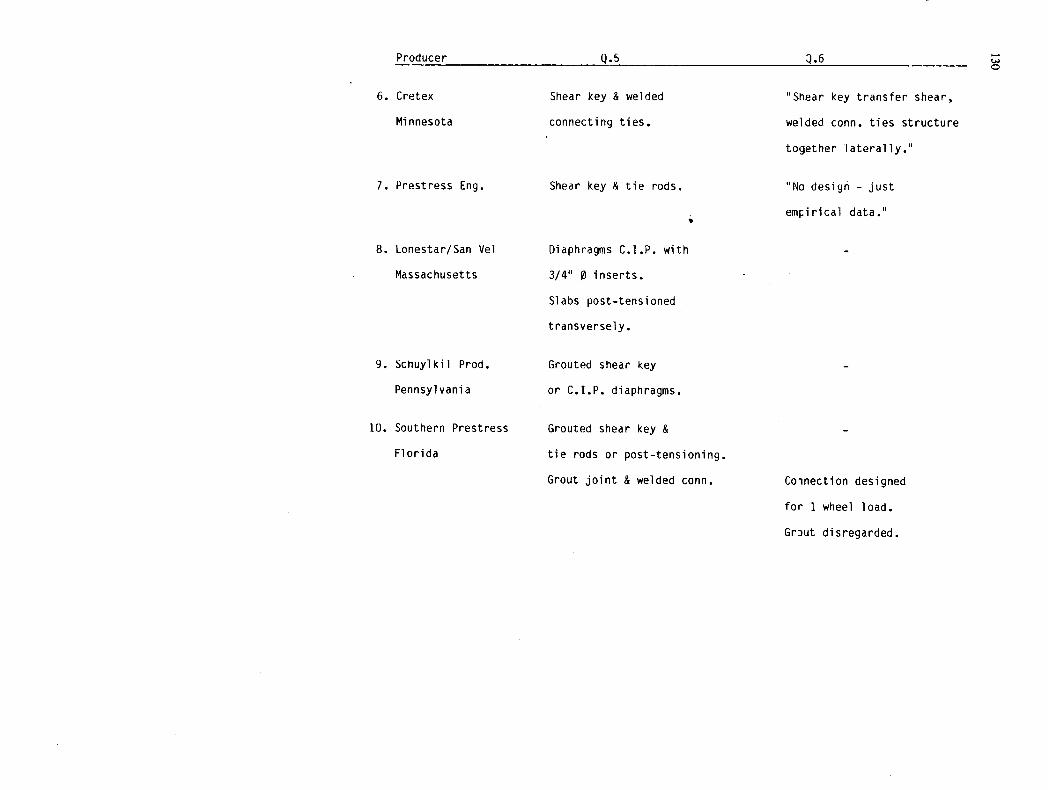
Producer
Cretex
Minnesota
Prestress Eng.
.5
Shear key & welded
connecting ties.
Shear key & tie rods.
.6
"Shear key transfer shear,
welded conn. ties structure
together laterally."
"No design - just
empirical data."
8. Lonestar/San Vel
Diaphragms C.I.P. with
Massachusetts
3/41 0 inserts.
Slabs post-tensioned
transversely.
Schuylkil Prod.
Pennsylvani a
Southern Prestress
Florida
Grouted shear key
or C.I.P. diaphragms.
Grouted shear key &
tie rods or post-tensioning.
Grout joint & welded conn. Coinection designed
for 1 wheel load.
Grout disregarded.
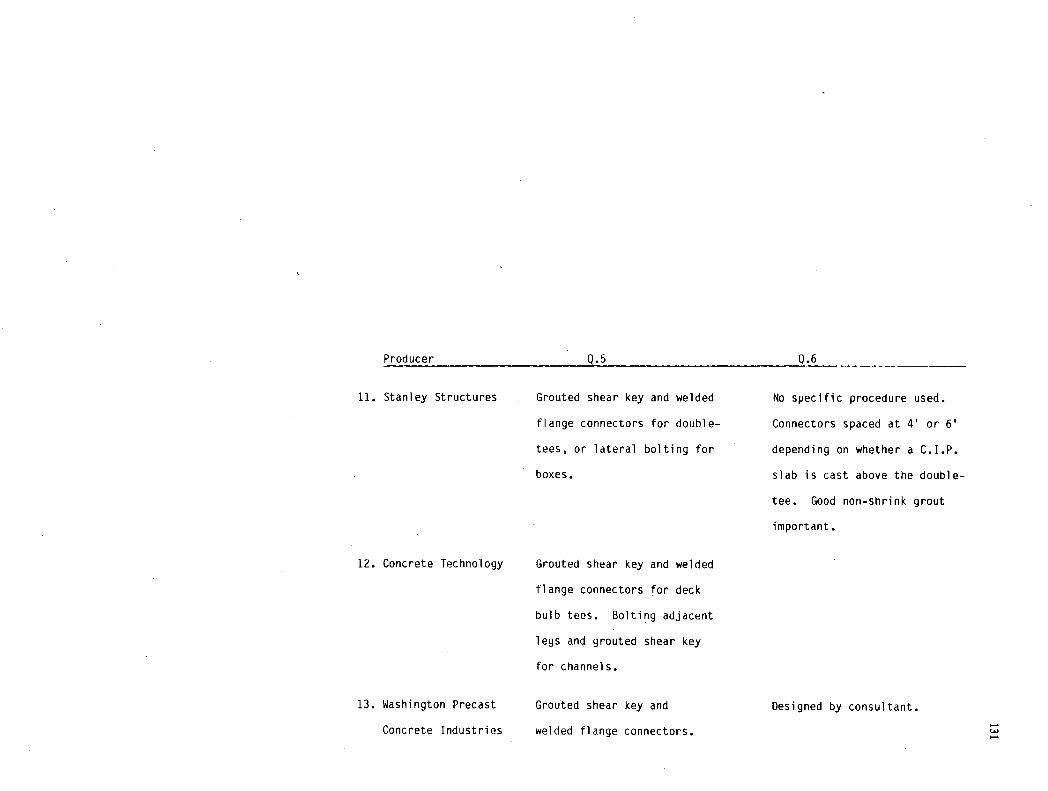
Producer 0.5 .6
Stanley Structures Grouted shear key and welded
flange connectors for double-
tees, or lateral bolting for
boxes.
Concrete Technology Grouted shear key and welded
flange connectors for deck
bulb tees. Bolting adjacent
legs and grouted shear key
for channels.
Washington Precast Grouted shear key and
Concrete Industries welded flange connectors.
No specific procedure used.
Connectors spaced at 4' or 6'
depending on whether a C.I.P.
slab is cast above the double-
tee. Good non-shrink grout
important.
Designed by consultant.

Please provide any records you may have of in-service behavior of
members or connections, in particular any problems encountered
in service.
Please provide any data you may have obtained in tests of
connections (either ad hoc or systematic tests).
Please provide any data you may have obtaned in the field
testing of precast concrete bridges.
(Producers not responding not listed below.)
Producer Response
2. Morse Bros. (7.) See Alaska diaphragm study.
Oregon
4. Central Premix (7.) No indications of problems of same
nature recurring.
(9.) "Dale Perry at Uiiversity of Idaho has
done a finite e1ment study on interaction
of diaphragms and weld ties."

Producer Response
Cretex (8.) See Appendix B for details of grout-key
Minnesota test by Cretex.
Prestress Eng. (7.) (a) Grout shrinkage from keys
Illinois (b) Longitudinal cracking in asphalt
topping over joints.
9. Schuylkill Prod. (7.) "Service record excellent, no problems
Pennsylvania reported."
(9.) See Lehigh U. reports on load dist. in
box beam bridges.
11. Stanley Structures (7.) "Very old bridges with grout that shrank
Colorado resulted in connection distress and stem
overloading ."
Some test data made available.
No data available.
12. Concrete Technology (7.) See Alaska response.
Corp., Washington

134
APPENDIX B
REFERENCES
REFERENCES RELATED TO LOAD DISTRIBUTION
HURD, M. K., "Economical Short-Span Bridges." Concrete Construction (Aug. 1985) pp. 649-655. ROSENBERG, F., "Getting the Biggest Bang for Your Bridge Buck." Public Works (June 1983) pp. 90-92. STANTON, J. F., "Distribution of Vertical Load." Bulletin No. 81.B5, Concrete Technology Associates, Tacoma, Wash. (May 1983). AKTAS, Z., AND VANHORN, D. A., "Bibliography on Load Distribution in Beam-Slab Highway Bridges." Fritz Engi-neering Laboratory Report No. 349.1, Lehigh University (Sept. 1986) 68 pp. SANDERS, W. W., AND ELLEBY, H. A., "Distribution of Wheel Loads on Highway Bridges." NCHRP Report 83 (1970) 56 pp. WEST, R., "The Use of a Grillage Analogy for the Analysis of Slab and Pseudo-Slab Bridge Decks." Research Report No. 21, Cement and Concrete Association, London (1973) 104 pp. HAMBLY, E. C., Bridge Deck Behavior. John Wiley and Sons, N. Y. (1976) 272 pp. Lao, Y. C., AND CUSENS, A. R., The Finite Strip Method in Bridge Engineering. Viewpoint Publications, London (1978). SANDERS, W. W., "Distribution of Wheel Loads on High-way Bridges." NCHRP Synthesis of Highway Practice 111 (1984) 22 pp. BAKHT, B., AND JAEGER, L. G., Bridge Analysis Simpl(fled. McGraw Hill (1985). AMERICAN ASSOCIATION OF STATE HIGHWAY AND TRANSPORTATION OFFICIALS, "Standard Specifications for Highway Bridges." Thirteenth Ed., Washington, D.C. (1983) GUYON, Y., "Calcul des Ponts Larges a Poutres Multiples Solidarisées par les Entretroises" (in French: "Analysis of Wide Multibeam Bridges Connected by Cross Beams"). Annales des Ponts et Chaussees, 116 (1946) pp. 553-612. MASSONNET, C., "Methode de Calcul des Ponts a Poutres Multiples Tenant Compte de Leur Resistance a la Torsion" (In French: "Method of Calculation for Bridges with Several Longitudinal Beams Taking Into Account Their Torsional Resistance"). IABSE Publications Vol. 10 (1950) pp. 147-182. ROWE, R. E., "A Load Distribution Theory for Bridge Slabs Allowing for the Effect of Poissons Ratio." Concrete Re-search, Vol. 7, No. 20 (1955) pp. 69-78. SPINDEL, J. E., "A Study of Bridge Slabs Having no Trans-verse Stiffness." Ph.D thesis, London University, London (1961). WATANABE, E., "Study of Load Distribution in Multibeam
Highway Bridges." Unpublished M.S. thesis, Iowa State University (1968). PAMA, R. P., and CUSENS, A. R., "Edge Stiffening of Mul-tibeam Bridges." Proc. ASCE, Journal of the Structural Division, Vol. 93, No. ST2 (Apr. 1967)'jp. 141-161. MINISTRY OF TRANSPORTATION AND COMMUNICATIONS, Ontario Highway Bridge Design Code (OHBDC). Second Ed., Downsview, Ontario, Canada (1983). CHEUNG, M. S., BAKHT, B., AND JAEGER, L. G., "Analysis of Box Girder by Grillage and Orthotropic Plate Methods." Canadian Journal of Civil Engineering, Vol. 9, No. 4 (1982) pp. 595-601. YErFRAM, A. L., and HUSAIN, H. M., "Grid-Framework Method for Plates in Flexure." Proc. ASCE, Journal of the Engineering Mechanics Division, EM3 (June 1965) pp. 53-64. JAEGER, L. G., and BAKHT, B., "The Grillage Analogy in Bridge Analysis," Canadian Journal of Civil Engineering, Vol. 9 (1982) pp. 224-235. KIRKPATRICK, J., LONG, A. E., and THOMPSON, A., "Load Distribution Characteristics of M-Beams Bridge Decks." The Structural Engineer Vol. 60B, No. 3 (June 1982). REILLY, R. J., "Stiffness Analysisof Grids Including Warp-ing." Proc. ASCE, Journal of the Structural Division, ST7 (July 1972) pp. 1511-1523. SAWKO, F., and SWAMINADHAN, D., "A New Method for the Analysis of Articulated Cellular Bridge Decks." Fourth Australian Conference on the Mechanics of Structures and Materials, University of Queensland, Brisbane, Australia (Aug. 1973) pp. 236-243. BUCKLE, I. 0., "Methods of Analysis of Multibeam Bridges." Road Research Unit Bulletin 72, National Roads Board, Wellington, New Zealand (1984). SACK, R. L., "An Investigation of Precast and Prestressed Concrete Bulb Tee Multibeam Bridges," FHWA Report No. FHWA-RD-75-84. IMBSEN, R. A., and Nurr, R. V., "Load Distribution Study on Highway Bridges Using STRUDL Finite Element Anal-ysis Capabilities." First Conference on Computing in Civil Engineering, Atlanta, Ga. (June 1978). SCORDELIS, A. C., and VAN ZYL, S. F., "Analysis of Curved Prestressed Segmental Bridges." Proc., ASCE, Journal of the Structural Division, Vol. 105, ST1 1 (Nov. 1979). Lao, Y. C., and CUSENS, A. R., The Finite Strip Method in Bridge Engineering. Viewpoint Publications, London (1978). CHEUNG, Y., K., The Finite Strip Method in Structural Analysis. Pergamon Press (1976) 232 pp. MAWENYA, A. S., "The Analysis of Thin, Thick and Sand-wich Plates by the Finite Strip Method." IABSE Publica-tions, Vol. 35, No. 1 (1975).
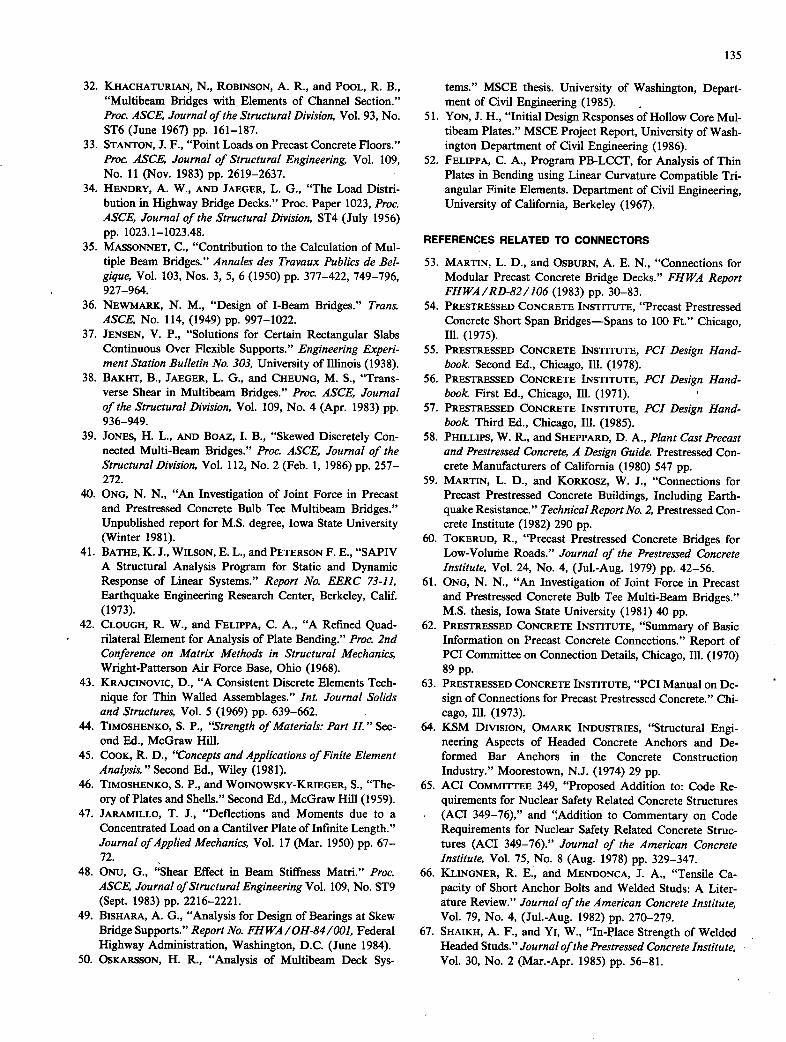
135
KHACHATURIAN, N., ROBINSON, A. R., and PooL, R. B., "Multibeam Bridges with Elements of Channel Section." Proc. ASCE, Journal of the Structural Division, Vol. 93, No. ST6 (June 1967) pp. 161-187. STANTON, J. F., "Point Loads on Precast Concrete Floors." Proc. ASCE, Journal of Structural Engineering, Vol. 109, No. 11 (Nov. 1983) pp. 2619-2637. HENDRY, A. W., AND JAEGER, L. G., "The Load Distri-bution in Highway Bridge Decks." Proc. Paper 1023, Proc. ASCE, Journal of the Structural Division, 5T4 (July 1956) pp. 1023.1-1023.48. MASSONNET, C., "Contribution to the Calculation of Mul-tiple Beam Bridges." Annales des Travaux Publics de Bel-gique, Vol. 103, Nos. 3, 5, 6 (1950) pp. 377-422, 749-796, 927-964. NEWMARK, N. M., "Design of I-Beam Bridges." Trans. ASCE, No. 114, (1949) pp. 997-1022. JENSEN, V. P., "Solutions for Certain Rectangular Slabs Continuous Over Flexible Supports." Engineering Experi-ment Station Bulletin No. 303, University of Illinois (1938). BAKHT, B., JAEGER, L. G., and CHEUNG, M. S., "Trans-verse Shear in Multibeam Bridges." Proc. ASCE, Journal of the Structural Division, Vol. 109, No. 4 (Apr. 1983) pp. 936-949. JONEs, H. L., AND BOAZ, I. B., "Skewed Discretely Con-nected Multi-Beam Bridges." Proc. ASCE, Journal of the Structural Division, Vol. 112, No. 2 (Feb. 1, 1986) pp. 257-272. ONG, N. N., "An Investigation of Joint Force in Precast and Prestressed Concrete Bulb Tee Multibeam Bridges." Unpublished report for M.S. degree, Iowa State University (Winter 1981). BATHE, K. J., WILSON, E. L., and PETERSON F. E., "SAPIV A Structural Analysis Program for Static and Dynamic Response of Linear Systems." Report No. EERC 73-11, Earthquake Engineering Research Center, Berkeley, Calif. (1973). CLOUGH, R. W., and FELIPPA, C. A., "A Refmed Quad-rilateral Element for Analysis of Plate Bending." Proc. 2nd Conference on Matrix Methods in Structural Mechanics, Wright-Patterson Air Force Base, Ohio (1968). KRAJCINOVIC, D., "A Consistent Discrete Elements Tech-nique for Thin Walled Assemblages." mt. Journal Solids and Structures, Vol. 5 (1969) pp. 639-662. TIMOSHENKO, S. P., "Strength of Materials: Part IL" Sec-ond Ed., McGraw Hill. COOK, R. D., "Concepts and Applications of Finite Element Analysis." Second Ed., Wiley (1981). TIMOSHENKO, S. P., and WOLNOWSKY-KRIEGER, S., "The-ory of Plates and Shells." Second Ed., McGraw Hill (1959). JARAMILLO, T. J., "Deflections and Moments due to a Concentrated Load on a Cantilver Plate of Infinite Length." Journal of Applied Mechanics, Vol. 17 (Mar. 1950) pp. 67-72. ONu, G., "Shear Effect in Beam Stiffness Matri." Proc. ASCE, Journal of Structural Engineering Vol. 109, No. ST9 (Sept. 1983) pp. 2216-2221. BISHARA, A. G., "Analysis for Design of Bearings at Skew Bridge Supports." Report No. FHWA /OH-84/001, Federal Highway Administration, Washington, D.C. (June 1984). OSKARSSON, H. R., "Analysis of Multibeam Deck Sys-
tems." MSCE thesis. University of Washington, Depart-ment of Civil Engineering (1985). Y0N, J. H., "Initial Design Responses of Hollow Core Mul-tibeam Plates." MSCE Project Report, University of Wash-ington Department of Civil Engineering (1986). FELIPPA, C. A., Program PB-LCCT, for Analysis of Thin Plates in Bending using Linear Curvature Compatible Tri-angular Finite Elements. Department of Civil Engineering, University of California, Berkeley (1967).
REFERENCES RELATED TO CONNECTORS
MARTIN, L. D., and OSBURN, A. E. N., "Connections for Modular Precast Concrete Bridge Decks." FHWA Report FHWA/RD-82/106 (1983) pp. 30-83. PRESTRESSED CONCRETE INSTITUTE, "Precast Prestressed Concrete Short Span Bridges-Spans to 100 Ft." Chicago, Ill. (1975). PRESTRESSED CONCRETE INSTITUTE, PCI Design Hand-book Second Ed., Chicago, Ill. (1978). PRESTRESSED CONCRETE INSTITUTE, PCI Design Hand-book First Ed., Chicago, Ill. (1971). PRESTRESSED CONCRETE INSTITUTE, PCI Design Hand-book Third Ed., Chicago, Ill. (1985). PHILLIPS, W. R., and SHEPPARD, D. A., Plant Cast Precast and Prestressed Concrete, A Design Guide. Prestressed Con-crete Manufacturers of California (1980) 547 pp. MARTIN, L. D., and KORKOSZ, W. J., "Connections for Precast Prestressed Concrete Buildings, Including Earth-quake Resistance." Technical Report No. 2, Prestressed Con-crete Institute (1982) 290 pp. TOKERUD, R., "Precast Prestressed Concrete Bridges for Low-Volume Roads." Journal of the Prestressed Concrete Institute, Vol. 24, No. 4, (Jul.-Aug. 1979) pp. 42-56. ONG, N. N., "An Investigation of Joint Force in Precast and Prestressed Concrete Bulb Tee Multi-Beam Bridges." M.S. thesis, Iowa State University (1981) 40 pp. PRESTRESSED CONCRETE INSTITUTE, "Summary of Basic Information on Precast Concrete Connections." Report of PCI Committee on Connection Details, Chicago, Ill. (1970) 89 pp. PRESTRESSED CONCRETE INSTITUTE, "PCI Manual on De-sign of Connections for Precast Prestressed Concrete." Chi-cago, Ill. (1973). KSM DIVISION, OMARK INDUSTRIES, "Structural Engi-neering Aspects of Headed Concrete Anchors and De-formed Bar Anchors in the Concrete Construction Industry." Moorestown, N.J. (1974) 29 pp. ACI COMMIrrEE 349, "Proposed Addition to: Code Re-quirements for Nuclear Safety Related Concrete Structures (ACI 349-76)," and 'Addition to Commentary on Code Requirements for Nuclear Safety Related Concrete Struc-tures (ACI 349-76)." Journal of the American Concrete Institute, Vol. 75, No. 8 (Aug. 1978) pp. 329-347. KLINGNER, R. E., and MENDONCA, J. A., "Tensile Ca-pacity of Short Anchor Bolts and Welded Studs: A Liter-ature Review." Journal of the American Concrete Institute, Vol. 79, No. 4, (Jul.-Aug. 1982) pp. 270-279. SHAIKH, A. F., and Yi, W., "In-Place Strength of Welded Headed Studs." Journal of the Prestressed Concrete Institute, Vol. 30, No. 2 (Mar.-Apr. 1985) pp. 56-81.
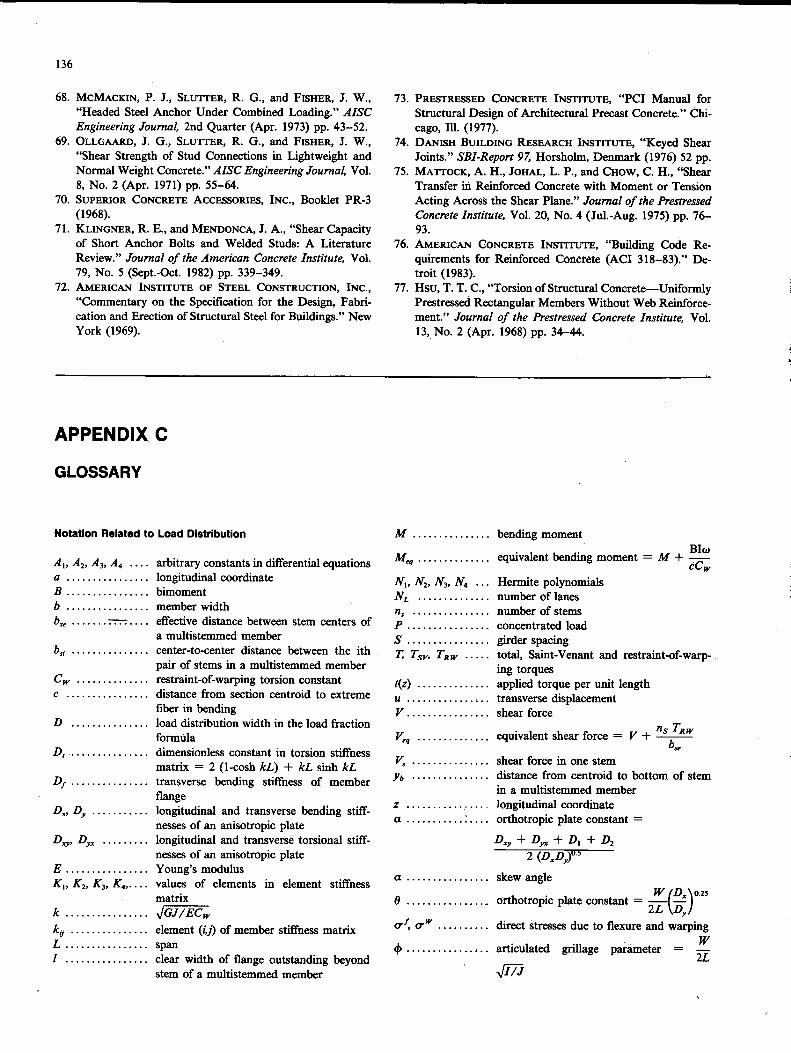
136
MCMACKIN, P. J., SLUTFER, R. G., and FISHER, J. W., "Headed Steel Anchor Under Combined Loading." AISC Engineering Journal, 2nd Quarter (Apr. 1973) pp. 43-52. OLLGAARD, J. G., SLUrFER, R. G., and FISHER, J. W., "Shear Strength of Stud Connections in Lightweight and Normal Weight Concrete." AISC Engineering Journal, Vol. 8, No. 2 (Apr. 1971) pp. 55-64. SUPERIOR CONCRETE ACCESSORIES, INC., Booklet PR-3 (1968). KLLNGNER, R. E., and MENDONCA, J. A., "Shear Capacity of Short Anchor Bolts and Welded Studs: A Literature Review." Journal of the American Concrete Institute, Vol. 79, No. 5 (Sept.-Oct. 1982) pp. 339-349. AMERICAN INSTITUTE OF STEEL CONSTRUCTION, INC., "Commentary on the Specification for the Design, Fabri-cation and Erection of Structural Steel for Buildings." New York (1969).
PRESTRESSED CONCRETE INSTITUTE, "PCI Manual for Structural Design of Architectural Precast Concrete." Chi-cago, III. (1977). DANISH BUILDING RESEARCH INSTITUTE, "Keyed Shear Joints." SBI-Report 97, Horsholm, Denmark (1976) 52 pp. MATFOCK, A. H., JOHAL, L. P., and CHOW, C. H., "Shear Transfer in Reinforced Concrete with Moment or Tension Acting Across the Shear Plane." Journal of the Prestressed Concrete Institute, Vol. 20, No. 4 (Jul.-Aug. 1975) pp. 76-93. AMERICAN CONCRETE INSTITUTE, "Building Code Re-quirements for Reinforced Concrete (ACI 3 18-83)." De-troit (1983). HSU, T. T. C., "Torsion of Structural Concrete—Uniformly Prestressed Rectangular Members Without Web Reinforce-ment." Journal of the Prestressed Concrete Institute, Vol. 13,No. 2 (Apr. 1968) pp. 34-44.
APPENDIX C
GLOSSARY
Notation Related to Load Distribution
A1 , A2, A3, A4 .... arbitrary constants in differential equations a ................ longitudinal coordinate B ................ bimoment b ................ member width b. ....... . ...... effective distance between stem centers of
a multistemmed member ........ center-to-center distance between the ith
pair of stems in a multistemmed member CW ........ restraint-of-warping torsion constant c ................ distance from section centroid to extreme
fiber in bending 1) ............... load distribution width in the load fraction
formula 1).. ............... dimensionless constant in torsion stiffness
matrix = 2 (1-cosh kL) + kL sinh kL Df ........ transverse bending stiffness of member
flange D, 1), ........... longitudinal and transverse bending stiff-
nesses of an anisotropic plate D,, ......... longitudinal and transverse torsional stiff-
nesses of an anisotropic plate E ................ Young's modulus K1, K2, K3, K4..... values of elements in element stiffness
matrix k ................ JGJ/EC11, k, ............... element (ij) of member stiffness matrix L ................ span I ................ clear width of flange outstanding beyond
stem of a multistemmed member
M ............... bending moment
M .............. equivalent bending moment = M +
N1, N2, N3, N4 ... Hermite polynomials NL .............. number of lanes n . ............... number of stems P ................ concentrated load S ................ girder spacing T, T51,, TRW ..... total, Saint-Venant and restraint-of-warp-
ing torques t(z) .............. applied torque per unit length u ................ transverse displacement V ................ shear force
Veg .............. equivalent shear force = V + flS TRW b.
V. ............... shear force in one stem Yb ............... distance from centroid to bottom of stem
in a multistemmed member z ................ longitudinal coordinate a ........... . .... orthotropic plate constant =
D,,, + Dy. + D + 1)2 2 (1),1),)05
a ................skew angle WD025
0 ................orthotropic plate constant =
y1, .......... direct stresses due to flexure and warping w
4, ................articulated gnllage parameter =

137
4)(Z) . twist angle 4) • nodal twist angle
...birotation w(x,y) ........... warping function
Notation Related to Connections
A ................ total cross-sectional area of joint (Ref. 74) A,, ............... surface area of full shear cone A,, ............... surface area of partial shear cone A. ............... cross-sectional area of a stud or anchor bar B ................ sum of cross-sectional area of grout keys
(Ref. 74) C ................ normal compression force acting on a slop-
ing grout key face (Fig. 105) d ................ diameter of anchor bar or stud de ............... distance from centerline of anchor to edge
of concrete, toward which shear acts dh ............... diameter of head of stud E,, ............... modulus of elasticity of concrete F ................ friction force up a sloping grout key face
... compressive strength of concrete measured on a 6-in. X 12-in. cylinder
f,. ............... minimum specified ultimate tensile strength of anchor steel (Refs. 65, 69)
.... yield strength of steel
.... average precompression in the flange H ............... overall thickness of flange h ................ distance from nearest reentrant corner of
the keyway to the surface of the deck slab toward which the grout key is being pushed
K,,.. .............. prestress coefficient = (1 + lOf,,,,/f,,')°5
k ................. depth of vertical plane drawn through the grout key, as a continuation of the upper vertical part of the edge of the deck slab (Fig. 106)
................ length of stud, measured to underside of head
m ............... thickness of slab in edge of which a stud is embedded (Fig. 88)
N,, ............... number of anchor bars or studs attached to connector in each flange
Nm .............. number of precast members in width of bridge
P ................ tension force acting on an anchor at failure under combined tension and shear
F,, ............... nominal tensile strength of anchorage s ................ spacing of welded connectors along length
of precast member T ................ tie force provided by connector (Fig. 105) 7',, ............... nominal tensile strength of connector an-
chors V ................ shear force acting on an anchor at failure
under combined tension and shear V,, ............... nominal shear strength of anchorage V ............... design shear strength of anchorage
nominal ultimate shear stress = V,,/A a ................ slope of most steeply sloping grout key face
(Fig. 106) A ................ coefficient for lightweight concrete; 0.75 for
all lightweight concrete, 0.85 for sand-light- weight concrete coefficient of friction ratio of circumference of a circle to its di- ameter
p ................ reinforcement ratio = A,IA (Ref. 74) 4) ................ strength reduction factor, ratio of design
strength to nominal strength
THE TRANSPORTATION RESEARCH BOARD is a unit of the National Research Council, which serves the National Academy of Sciences and the National Academy of En-gineering. The Board's purpose is to stimulate research concerning the nature and performance of transportation systems, to disseminate information that the research produces, and to en-courage the application of appropriate research findings. The Board's program is carried out by more than 270 committees, task forces, and panels composed of more than 3,300 admin-istrators, engineers, social scientists, attorneys, educators, and others concerned with transpor-tation; they serve without compensation. The program is supported by state transportation and highway departments, the modal administrations of the U.S. Department of Transportation, the Association of American Railroads, the National Highway Traffic Safety Administration, and other organizations and individuals interested in the development of transportation.
The National Research Council was established by the National Academy of Sciences in 1916 to associate the broad community of science and technology with the Academy's purposes of furthering knowledge and of advising the Federal Government. The Research Council has become the principal operating agency of both the National Academy of Sciences and the National Academy of Engineering in the conduct of their services to the government, the public, and the scientific and engineering communities. It is administered jointly by both Academies and the Institute of Medicine.
The National Academy of Sciences was established in 1863 by Act of Congress as a private, nonprofit, self-governing membership corporation for the furtherance of science and technology, required to advise the Federal Government upon request within its fields of competence. Under its corporate charter the Academy established the National Research Council in 1916, the National Academy of Engineering in 1964, and the Institute of Medicine in 1970.

TRANSPORTATION RESEARCH BOARD Naftonal Research Council
2101 ConstItution Avenue, N.W.
Washington, D.C. 20418
ADDRESS CORRECTION REQUESTED