Livestock stations as foci of groundwater recharge and nitrate leaching in a sandy desert of the...
12
Livestock stations as foci of groundwater recharge and nitrate leaching in a sandy desert of the Central Monte, Argentina Pablo A. Meglioli, 1 * Julieta N. Aranibar, 1,2 Pablo E. Villagra, 1,3 Juan A. Alvarez 1,3 and Esteban G. Jobbágy 4,5 1 Instituto Argentino de Nivología, Glaciología y Ciencias Ambientales (IANIGLA), Consejo Nacional de Investigaciones Científicas y Técnicas, CONICET – CCT Mendoza. Av. Ruiz Leal s/n, Parque General San Martín, CP 5500, Mendoza, Argentina 2 Instituto de Ciencias Básicas, Universidad Nacional de Cuyo, Padre Contreras 1300, Parque General San Martín, CP M5502JMA, Mendoza, Argentina 3 Facultad de Ciencias Agrarias, Universidad Nacional de Cuyo, Almirante Brown 500, CP 5505, Chacras de Coria, Mendoza, Argentina 4 Grupo de Estudios Ambientales (GEA), IMASL, CONICET. Avda. Ejército de los Andes 950, 1º piso, San Luis, Argentina 5 Departamento de Agronomía, FICES, Universidad Nacional de San Luis, San Luis, Argentina ABSTRACT In arid ecosystems, evapotranspiration generally exceeds precipitation, preventing deep drainage and groundwater recharge. We propose that vegetation changes associated with the establishment of pastoralist settlements (i.e. livestock stations) can disrupt the ecological and hydrological linkages in arid groundwater-coupled ecosystems of the Monte desert (Argentina), allowing local groundwater recharge and nitrate leaching to the aquifer, affecting groundwater quality. We tested this hypothesis by analysing vegetation, land use indicators, water and nitrate dynamics in three pairs of livestock stations and relatively undisturbed control woodlands. Livestock stations had lower vegetation and dead wood but higher dung covers than control woodlands, indicating soil and vegetation changes associated to land use. Water and nitrate dynamics were also affected by land use. Soil nitrate and water contents sampled down to the water table were higher, and soil chloride and salinity were lower in livestock stations, indicating higher water percolation and N input/transport rates. Higher groundwater nitrate concentrations in livestock stations indicate that these areas behave as foci of N and water export from ecosystems to the phreatic aquifer. Our study supports the idea that vegetation in arid areas prevents downward surface–groundwater interactions, but it also indicates that human modifications of vegetation disrupt this control, reducing soil water consumption and allowing vertical movement of water and solutes to the aquifer, which can modify groundwater quality. Disruptions of ecological processes by livestock activities clearly affect the hydrological links between surface and groundwater. Copyright © 2013 John Wiley & Sons, Ltd. KEY WORDS land use changes; Prosopis flexuosa woodlands; grazing systems; shallow groundwater; soil profiles; vegetation structure Received 2 July 2012; Revised 6 December 2012; Accepted 17 February 2013 INTRODUCTION Arid and semi-arid areas host an important proportion of the global human population, whose different economic activities depend mainly on surface water availability (FAO, 2011). Drylands are characterized by low and patchy precipitation, always exceeded by potential evapotranspiration (Noy-Meir, 1973; Loik et al., 2004; Schwinning et al., 2004). Without permanent surface water availability, shallow groundwater found in some areas of the Monte Desert is a key resource for plants and people, sustaining biological activity, primary productivity and human development levels above those expected from local precipitation alone (Contreras et al., 2011; Jobbágy et al., 2011). Climate projections for the next 100 years in the Monte Desert of Argentina suggest an increase in rainfall and temperatures, mostly during summertime (Labraga and Villalba, 2009). Under this scenario, groundwater may play an increasing role on the develop- ment of local communities. In desert ecosystems, where water availability is the main limiting factor, direct evaporation and plant roots often make an exhaustive use of rainfall inputs, preventing deep percolation and local groundwater recharge. In these systems, vegetation has large root systems that exceed the canopy area and explore the unsaturated zone to great depths, controlling soil water dynamics and recharge (Noy-Meir, 1973; Wilcox et al., 2003; Newman et al., 2006). Plant roots absorb water and nutrients from the soil and exclude other ions such as chloride, which can be used as a tracer of water dynamics (Allison et al., 1994; Phillips, 1994). Leaching of large soil chloride stocks in desert systems subject to disturbances indicates low water uptake rates and the occurrence of deep drainage and aquifer recharge (Jackson et al., 2000; Jobbágy and Jackson, 2001; Scanlon et al., 2005). Successional changes from a non-vegetated to a fully vegetated condition may reduce groundwater recharge to a null level (Scanlon et al., 2006), whereas replacement of native woodland with pastures or crops has been shown to increase recharge *Correspondence to: Pablo A. Meglioli, Instituto Argentino de Nivología, Glaciología y Ciencias Ambientales (IANIGLA), Consejo Nacional de Investigaciones Científicas y Técnicas, CONICET – CCT Mendoza. Av. Ruiz Leal s/n, Parque General San Martín, Mendoza, Argentina. E-mail: [email protected] ECOHYDROLOGY Ecohydrol. (2013) Published online in Wiley Online Library (wileyonlinelibrary.com) DOI: 10.1002/eco.1381 Copyright © 2013 John Wiley & Sons, Ltd.
-
Upload
independent -
Category
Documents
-
view
2 -
download
0
Transcript of Livestock stations as foci of groundwater recharge and nitrate leaching in a sandy desert of the...

ECOHYDROLOGYEcohydrol. (2013)Published online in Wiley Online Library(wileyonlinelibrary.com) DOI: 10.1002/eco.1381
Livestock stations as foci of groundwater recharge and nitrateleaching in a sandy desert of the Central Monte, Argentina
Pablo A. Meglioli,1* Julieta N. Aranibar,1,2 Pablo E. Villagra,1,3 Juan A. Alvarez1,3
and Esteban G. Jobbágy4,51 Instituto Argentino de Nivología, Glaciología y Ciencias Ambientales (IANIGLA), Consejo Nacional de Investigaciones Científicas y Técnicas,
CONICET – CCT Mendoza. Av. Ruiz Leal s/n, Parque General San Martín, CP 5500, Mendoza, Argentina2 Instituto de Ciencias Básicas, Universidad Nacional de Cuyo, Padre Contreras 1300, Parque General San Martín, CP M5502JMA, Mendoza, Argentina
3 Facultad de Ciencias Agrarias, Universidad Nacional de Cuyo, Almirante Brown 500, CP 5505, Chacras de Coria, Mendoza, Argentina4 Grupo de Estudios Ambientales (GEA), IMASL, CONICET. Avda. Ejército de los Andes 950, 1º piso, San Luis, Argentina
5 Departamento de Agronomía, FICES, Universidad Nacional de San Luis, San Luis, Argentina
*CGlaInvRuE-m
Co
ABSTRACT
In arid ecosystems, evapotranspiration generally exceeds precipitation, preventing deep drainage and groundwater recharge. Wepropose that vegetation changes associated with the establishment of pastoralist settlements (i.e. livestock stations) can disruptthe ecological and hydrological linkages in arid groundwater-coupled ecosystems of the Monte desert (Argentina), allowing localgroundwater recharge and nitrate leaching to the aquifer, affecting groundwater quality. We tested this hypothesis by analysingvegetation, land use indicators, water and nitrate dynamics in three pairs of livestock stations and relatively undisturbed controlwoodlands. Livestock stations had lower vegetation and dead wood but higher dung covers than control woodlands, indicatingsoil and vegetation changes associated to land use. Water and nitrate dynamics were also affected by land use. Soil nitrate andwater contents sampled down to the water table were higher, and soil chloride and salinity were lower in livestock stations,indicating higher water percolation and N input/transport rates. Higher groundwater nitrate concentrations in livestock stationsindicate that these areas behave as foci of N and water export from ecosystems to the phreatic aquifer. Our study supports the ideathat vegetation in arid areas prevents downward surface–groundwater interactions, but it also indicates that human modificationsof vegetation disrupt this control, reducing soil water consumption and allowing vertical movement of water and solutes to theaquifer, which can modify groundwater quality. Disruptions of ecological processes by livestock activities clearly affect thehydrological links between surface and groundwater. Copyright © 2013 John Wiley & Sons, Ltd.
KEY WORDS land use changes; Prosopis flexuosa woodlands; grazing systems; shallow groundwater; soil profiles; vegetationstructure
Received 2 July 2012; Revised 6 December 2012; Accepted 17 February 2013
INTRODUCTION
Arid and semi-arid areas host an important proportion ofthe global human population, whose different economicactivities depend mainly on surface water availability(FAO, 2011). Drylands are characterized by low andpatchy precipitation, always exceeded by potentialevapotranspiration (Noy-Meir, 1973; Loik et al., 2004;Schwinning et al., 2004). Without permanent surface wateravailability, shallow groundwater found in some areas ofthe Monte Desert is a key resource for plants and people,sustaining biological activity, primary productivity andhuman development levels above those expected fromlocal precipitation alone (Contreras et al., 2011; Jobbágyet al., 2011). Climate projections for the next 100 years inthe Monte Desert of Argentina suggest an increase inrainfall and temperatures, mostly during summertime
orrespondence to: Pablo A. Meglioli, Instituto Argentino de Nivología,ciología y Ciencias Ambientales (IANIGLA), Consejo Nacional deestigaciones Científicas y Técnicas, CONICET – CCT Mendoza. Av.iz Leal s/n, Parque General San Martín, Mendoza, Argentina.ail: [email protected]
pyright © 2013 John Wiley & Sons, Ltd.
(Labraga and Villalba, 2009). Under this scenario,groundwater may play an increasing role on the develop-ment of local communities.
In desert ecosystems, where water availability is themain limiting factor, direct evaporation and plant rootsoften make an exhaustive use of rainfall inputs, preventingdeep percolation and local groundwater recharge. Inthese systems, vegetation has large root systems thatexceed the canopy area and explore the unsaturated zone togreat depths, controlling soil water dynamics and recharge(Noy-Meir, 1973; Wilcox et al., 2003; Newman et al.,2006). Plant roots absorb water and nutrients from thesoil and exclude other ions such as chloride, which can beused as a tracer of water dynamics (Allison et al., 1994;Phillips, 1994). Leaching of large soil chloride stocks indesert systems subject to disturbances indicates low wateruptake rates and the occurrence of deep drainage andaquifer recharge (Jackson et al., 2000; Jobbágy andJackson, 2001; Scanlon et al., 2005). Successional changesfrom a non-vegetated to a fully vegetated condition mayreduce groundwater recharge to a null level (Scanlon et al.,2006), whereas replacement of native woodland withpastures or crops has been shown to increase recharge

P. A. MEGLIOLI ET AL.
rates (Santoni et al., 2010; Moore et al., 2012; Nosettoet al., 2012).Grazing and wood extraction in human settlements
can permanently reduce vegetation cover, altering theirstructure and nutrient, and water cycles (Hobbs andHuenneke, 1992; Asner et al., 2004; Reynolds et al., 2007).Even under very low livestock and human populationdensities, as found in most of the Monte desert, the periodicconcentration of animals close towater points and corrals, andclose to human settlements may concentrate nutrientscaptured in a broad grazing range into highly disturbed foci.The combination of vegetation degradation and nutrientimports may couple increased deep water drainage withhorizontal nutrient imports and downward transport togroundwater, modifying hydrological and biogeochemicalconnections and altering water resource quality (Jacksonet al., 2009; Nosetto et al., 2012).In the Central Monte desert (Argentina), Prosopis
flexuosa D.C. (Fabaceae, Mimosoideae, ‘algarrobo dulce’)woodlands have provided valuable resources (i.e. fruits,wood) to rural populations since pre-Hispanic times (Roig,1993; Prieto, 2000; Chiavazza, 2002). Huarpe descendantsstill live in the area and now practice subsistence livestockproduction, using woodland resources and groundwater(Ladio and Lozada, 2009; Inojosa et al., 2010). Because ahigh proportion of Prosopis woodlands was cut down forbuilding railroads and vineyards in the 20th century (Rojaset al., 2009), the remaining woodlands are now protectedby law. The rich Huarpe identity and cultural legacy of thelocal inhabitants have been recognized by governmentauthorities, granting land rights to Huarpe communities(Inojosa et al., 2010). A sustainable use of these woodlandsdepends on a good understanding and sound managementof the interactions among human activities and the environ-ment, including interactions among livestock stations,nutrients and water cycles.Local settlers, when establishing a livestock station in the
woodlands of the CentralMonte, generate a set of disturbancesin the environment (Villagra et al., 2009). In general, newfamilies settle near their elders’ home, if groundwater andwoodland resources are available. Hand-dug wells, houses
Dune Interdune Woodland
Water
Nitrates
Discharg
ET > P
Absorption
Infiltration
Aquifer
Dune Interdune Woodland
Water
Nitrates
Discharg
ET > P
Absorption
Infiltration
Dune Interdune Woodland
Water
Nitrates
Discharg
ET > P
Absorption
Infiltration
Dune Interdune Woodland
Water
Nitrates
Water
Nitrates
Discharg
ET > P
Absorption
Infiltration
Aquifer
Figure 1. Hypothetical mechanisms of water and nitrate fluxes for livestock secosystems. Livestock stations facilitate water percolation and nitrate leachvertical water flux down to the phreatic aquifer is interrupted by vegetatiphreatophyte trees, exceeds precipitation and does not allow deep drainage,
Copyright © 2013 John Wiley & Sons, Ltd.
and corrals are built with forest products (Torres, 2008). Inthese areas, relatively large numbers of free grazing livestock(predominantly goats and cattle) concentrate overnight aroundwater wells and corrals during the entire year. As a result, cleargradients of degradation develop across the landscape, withreduced vegetation cover up to 2 km away from livestockstations (Goirán et al., 2012). In addition, livestock depositlarge amounts of urine and dung in these stations, likelycausing a centripetal concentration of nutrients, as shown inother rangelands (Tolsma et al., 1987; Smet andWard, 2006).Nitrate leaching to the subsoil has been observed in scarcelyvegetated areas, which may reach the aquifer and jeopardizewater quality for human consumption, because of its negativeeffects on human health (Aranibar et al., 2011; ATSDR, 2011).
We hypothesize that in livestock stations, the reductionsin vegetation cover and the deposition of urine and dung bylivestock favour downward water and nutrient transport inthe soil, increasing local recharge and nitrate leaching tothe aquifer (Figure 1). We evaluate this hypothesis bycomparing paired stands in relatively undisturbed (controlwoodlands) and disturbed (livestock stations) interdunevalleys in the Central Monte desert in Argentina. We expectlivestock stations to have (i) lower vegetation cover,(ii) higher soil moisture and nitrate contents, (iii) lowervadose chloride and total salt stocks than control woodlands,(iv) and higher groundwater nitrate concentrations thancontrol woodlands.
MATERIALS AND METHODS
Study site
The study sites are located in the Telteca Natural and CulturalReserve, inMendoza, Argentina (32�S, 67�–68�W; 500–550mof elevation). Biogeographically, the area corresponds tothe Central Monte and is characterized by a warm aridclimate, with mean annual precipitation of 156mm, mostlyconcentrated in the austral summer (from October to March).Absolute extreme temperatures vary from �10 �C in winterto 48 �C in summer, with a long-term mean of 18�5 �C(Alvarez et al., 2006).
Dune Livestock Station
Leaching
Recharge
e
EvapoTranspiration < Precipitation
Dune Livestock Station
Leaching
Recharge
e
EvapoTranspiration < Precipitation
Dune Livestock Station
Leaching
Recharge
e
EvapoTranspiration < Precipitation
Dune Livestock Station
Leaching
Recharge
e
EvapoTranspiration < Precipitation
tations and relatively undisturbed woodlands in arid, groundwater-coupleding to groundwater, increasing local recharge. In control woodlands, theon roots. In these places groundwater use, through transpiration of thedetermining a local discharge regime (Evapotranspiration>Precipitation).
Ecohydrol. (2013)

LIVESTOCK STATIONS AS FOCI OF GROUNDWATER RECHARGE AND NITRATE LEACHING
The area is located in an aeolian plain, which was formedby fluvial and aeolian sediments that developed dune-interdune systems of NNW–SSE orientation, with activesand dunes partially stabilized by the vegetation. The regionhosts discontinuous valleys with elevation gradients of 10 to30 m (Gomez et al., 2010). Livestock stations are establishedin interdune valleys (Figures 1 and 2), where the water tablelies at depths of 6–15m. This shallow groundwater is usedby phreatophyte vegetation dominated by P.flexuosa trees(5–10m tall), coexisting with small tree species, such asGeoffroea decorticans, and shrub species, as Larreadivaricata, Bulnesia retama, Atriplex lampa, and Suaedadivaricata (Morello, 1958). Dune flanks are dominated by L.divaricata, Tricomaria usillo, small individuals of P flexuosa(lower than 4m) and the grassPanicum urvilleanum (Villagraet al., 2004; Alvarez et al., 2006).These woodlands have been used by human populations
for several centuries and are still used today by the local
Graphic Scale
0 100 m
Gra
0
Monte Desert
Graphic Scale
0 100 m
Gra
0
Graphic Scale
0 100 m
Gra
0
Graphic Scale
0 100 m
Graphic Scale
0 100 m
Graphic Scale
0 100 m
Graphic Scale
0 100 m
Graphic Scale
0 100 m
Graphic Scale
0 100 m
Gra
0
Gra
0
Gra
0
Gra
0
Gra
0
(a) (b)
(c)
(d)
Figure 2. Map of South America with the extension of the Monte Desert (a).and control woodlands (black mark) in the Telteca Reserve (Lavalle-Mendozland use intensity is greater (c), and of paired relatively undisturbed woodla
analyzed soils and vegetation. Source for the satellit
Copyright © 2013 John Wiley & Sons, Ltd.
inhabitants. In the past, trees were exploited for buildingrailroads and vineyards without any management plan,causing irreversible changes in some areas where treeshave been completely eliminated (Abraham et al., 2009;Rojas et al., 2009). Difficult access on motorized vehiclesinto the sand dune fields has prevented deforestation inthe study region, where old Prosopis individuals stillremain. Presently, the woodlands are protected by law,and wood can only be extracted by the local populationfor fuel and construction of the house, wells and corrals.The Telteca reserve hosts approximately 34 family unitsin an area of ~200 km2 (Bosch, 2008). Many settlementsare isolated from access roads, commercialization centresand points of public drinking water supply and haveno access to electricity. Livestock, mainly goats and alower number of horses and cattle, feed on localvegetation and rely on groundwater extracted fromhand-dug wells. Most of these wells are cased with
Graphic Scale
0 100 m
well
corral
corral
house
phic Scale
5 km
Graphic Scale
0 100 m
well
corral
corral
house
phic Scale
5 km
Graphic Scale
0 100 m
well
corral
corral
house
phic Scale
5 km
Graphic Scale
0 100 m
well
corral
corral
house
Graphic Scale
0 100 m
well
corral
corral
house
Graphic Scale
0 100 m
Graphic Scale
0 100 m
Graphic Scale
0 100 m
well
corral
corral
house
well
corral
corral
house
phic Scale
5 km
phic Scale
5 km
phic Scale
5 km
phic Scale
5 km
phic Scale
5 km
A satellite image marks the location of the livestock stations (white mark)a) (b). Satellite images with zoom of a livestock concentration area, wherends (d). In these images, we highlighted with a circle the area where wee images was Google Earth http://earth.google.es.
Ecohydrol. (2013)

P. A. MEGLIOLI ET AL.
wooden frames, and water is extracted by hand or withanimal-powered devices.
Experimental design
To assess the effects of livestock stations (i.e. nutrientdeposition and vegetation removal) on water and nutrientdynamics, we compared soils and vegetation in three pairsof livestock stations and relatively undisturbed ‘control’woodlands (Figure 2). Livestock stations and paired controlwoodland stands were in the same geomorphologicalsetting (interdune valleys), 1�5–2�0 km from each other(Table I). All three paired sites were considered indepen-dent replicates.
Field observations
Because there is no information about livestock densities andtheir spatial distribution on our study sites, we evaluated thedifferences in livestock and human activities through severalvariables that are typically considered good indicators of landuse intensity. With higher livestock density, we expect higherdung deposition and Prosopis pod consumption (Bertilleret al., 2009), lower cover of biological soil crusts (Gómezet al., 2012) and enhanced germination rates of Prosopisseeds (Campos and Ojeda, 1997). Low abundance ofProsopis pods may also indicate human activity, becauselocal inhabitants use them as a source of food (seed flour andpod sugar) and forage (Inojosa et al., 2010). Similarly, lowabundance of dead wood on the ground may reflect its use forfuel or construction (Alvarez and Villagra, 2009; Vázquezet al., 2011). We visually estimated the cover/abundance ofdomestic animal dung, biological soil crusts, woody debris>5-cm diameter, and the density of Prosopis pods andseedlings in 15 plots of 9m2 at each stand.We distributed fiveplots every 20m, along three randomly located 100-m-longtransects. For each land cover indicator, we used the mean ofthe 15 square plots of each site for statistical analysis.We determined vegetation structure with the point-quadrat
method using three 30-m linear transects randomly distrib-uted on each experimental site. We sampled 100 points per
Table I. Location of study sites in the T
Site Land use Location
1-La Primavera Livestock station 32�24045.100 (S), 67�54053�800
1-La Primavera Controlwoodland
32�34047�800 (S), 67�56031�400
2-Las Delicias Livestock station 32�26022�600 (S), 67�57032�500
2-Las Delicias Controlwoodland
32�25005�600 (S), 67�56054�600
3-Las Hormigas Livestock station 32�25026�400 (S), 68�01008�700
3-Las Hormigas Controlwoodland
32�25043�200 (S), 68�01059�900
a Because there are no agricultural data for these areas, the number of animalsb Distance of wells to corrals is equal to the distance from soil sampling po
Copyright © 2013 John Wiley & Sons, Ltd.
transect, every 30 cm (Passera et al., 1983). In each point, weregistered the presence of bare soil, litter, trees, shrubs, forbsand grasses and calculated the percentage cover of each soilcover type in each transect. Final results were an average ofthe three transects per each stand.
Soil sampling and chemical analyses
To characterize soil nutrient and water stocks and theirvertical distribution, we measured moisture, chloride andnitrate contents, electric conductivity and pH along soilprofiles down to the water table. Chloride is often used as atracer of water transport, particularly in arid and semi-aridsystems, because it is highly mobile in water, its source ismainly atmospheric and roots tend to exclude it duringwater absorption (Allison et al., 1994; Phillips, 1994).Therefore, chloride concentration and distribution in thesoil are indicators of water dynamics, including drainage andevapotranspiration (Scanlon et al., 2006; Jobbágy et al.,2011). Soil nitrate, which also has high mobility, is affectedby animal transport and deposition (horizontal transporttowards livestock stations) and vegetation activity (drainagecontrol and nitrogen absorption and retention).
We obtained soil samples from deep soil profiles in eachof the six experimental units, at intervals of 0�25m for thefirst 0�5m and 0�5m down to the water table, which waslocated at a depth of 8�3 to 9�6m. We collected soil sampleswith a hand soil auger (10-cm diameter) and applied a PVCcasing to avoid borehole collapse. Soil subsamples wereweighed in the field (100 g) for later determination ofgravimetric soil moisture, after drying at 100 �C for 24 h.Soil samples for chemical analysis were immediatelyhomogenized, stored in plastic bags, air dried in the fieldand oven-dried at 60 �C for 24 h before chemical analyses.
Chloride concentration, pH and electric conductivity weremeasured on soil extracts (25 g of soil and 50ml of deionizedwater) using a solid state ion-selective electrode (DenverInstrument UP-25), a pH electrode (Denver InstrumentUP-25) and a conductimeter (HACH, Sension5), respective-ly. Soil extracts were shaken mechanically during 30min,filtered and frozen until analysis. Total salt content of soil
elteca reserve and their characteristics.
Groundwaterdepth (m)
Corrals(n)
Animals(n) a
Distance of wellsto corral (m) b
(W) 9�6 2 80 goats 31�080 cattle
(W) 8�3 —
(W) 8�3 3 90 goats 24�670 cattle
(W) 9�5 —
(W) 9�5 3 150 goats 28�630 cattle
(W) 9�5 —
was visually estimated during field studies, indicating approximate values.int to perimeter of the nearest corral.
Ecohydrol. (2013)

LIVESTOCK STATIONS AS FOCI OF GROUNDWATER RECHARGE AND NITRATE LEACHING
extracts was estimated using a conversion factor of0�491 ppmms cm�1, which assumes that all solutes are NaCl(Bresler et al., 1982). Chloride concentrations and soilsalinity (gm�3 of soil) were calculated using a bulk densityvalue of 1�47 g cm�3, previously obtained for interdunevalleys of the Telteca reserve (Guevara et al., 2010). Nitrateconcentrationwas determined in soil extracts of 5 g of soil and25ml of extracting solution, composed of 2�5 g of CuSO45H2O, 0�15 g of Ag2SO4 and 0�62 g of BO3H3 in 1000ml ofdeionizedwater. Soil extractswere shaken during 1 h,filtered,adjusted to pH 7with sodium hydroxide (1%) and frozen untilanalysis. Nitrate concentrations were determined by spectro-photometry (HACH DR 2800) with the cadmium reductionmethod. We also determined nitrate concentration, electricconductivity and pH in groundwater samples with the samemethods as in the soil extracts. Groundwater samples wereobtained from the bottom of each soil profile, refrigerated inthe field and immediately analysed in the laboratory afterreturn from the field.
Table II. Vegetation structure and surface soil characterization incontrol woodlands and livestock stations, expressed in percentcover, except in Prosopis seedlings and pods, which are expressed
as number per plot.
Variable/indicatorsLivestockStation
ControlWoodland p
Forbs–grasses a 0�33 (1�0) 22�44 (15�91) 0�0023Shrubs a 1�56 (3�13) 33�89 (9�8) <0�0001Trees a 19�78 (19�7) 31�67 (17�56) 0�1754Total vegetation a 21�67 (22�27) 88�00 (19�86) <0�0001Bare soil a 62�22 (16�4) 20�11 (13�52) 0�0001Litter a 2�22 (3�67) 47�44 (21�21) <0�0001Dung b 12�27 (2�18) 4�12 (0�71) <0�0001Soil wood b 1�11 (0�25) 10�23 (1�56) <0�0001Biological Soil crusts b 0�24 (0�22) 2�00 (1�44) 0�214Prosopis pods b 0�38 (0�18) 12�51 (4�8) 0�0169Prosopis seedlings b 1�56 (0�57) 0�73 (0�2) 0�1870
Data represent mean values �1 standard error of the mean betweenbrackets.a Data obtained with the point-quadrat method for vegetation struc-ture. p-values are significance levels obtained with Kruskal–Wallis test.Significant test statistics a= 0�05 are highlighted in bold.b Data obtained with the square plot method for indicators of livestock andhuman activity. p-values are significance levels by fixed factor obtainedwith generalized linear mixed model.
Data analysis
Differences in vegetation structure (grass–forbs, shrubs andtrees), bare soil and litter among livestock station andwoodland sites were analysed using Kruskal–Wallis testwith non-parametric comparisons, because of the highheterogeneity of variances (Zar, 1984). Indicators of livestockand human activity (dung, woody debris, soil crusts,seedlings and pods) were analysed using generalized linearmixed model (GLMM) fit by the Laplace approximation,considering land use (livestock stations vs control wood-lands) as a fixed factor and site (1, 2 and 3) as a random factor.The indicators had Poisson distributions.We also used GLMM to analyse soil variables, considering
land use with two levels (livestock stations vs controlwoodlands) and soil depth as fixed factors, and site as arandom factor with three levels. We conducted the GLMManalyses using the ‘lmer’ function of the ‘lme4’ package(Bates and Maechler, 2009) with R statistical software(R Development Core Team, 2009). We ran models with andwithout the interaction (models 2 and 1, respectively)between land use and soil depth. In the analysis, we onlyconsidered samples of the vadose zone, excluding those fromthe saturated zone, to avoid the influence of groundwater. Weselected the best model using Akaike’s information criterion(dAIC> 2). We estimated significance of fixed factors withMarkov Chain Monte Carlo simulations (n=100000), usingthe ‘pvals.fnc’ function of the ‘languageR’ package forR (Baayen, 2008), which estimates p-values for GLMMparameters, considering p< 0�05 as significant. Moisture,chloride, nitrate and salinity were log-transformation toapproximate normality.Soil water content (% dry weight), chloride concentration
(gm�3), nitrate concentration (gm�3), pH and salinity(gm�3) were plotted with depth. We also constructed curvesof cumulative chloride and nitrate (gm�2) versus cumulativewater (m3m�2) for each soil profile, using a bulk density of1�47 g cm�3 (Guevara et al., 2010). Different cumulativechloride : water slopes indicate concentration shifts and
Copyright © 2013 John Wiley & Sons, Ltd.
therefore changes in the drainage regimes (Phillips, 1994;Santoni et al., 2010).
RESULTS
Land use intensity indicators and vegetation structure
Livestock stations had higher bare soil and dung cover,lower plant litter and dead wood cover, and Prosopis poddensity than their neighbouring control woodlands. Controlwoodlands had higher covers of all vegetation groups(grasses, shrubs and trees) than livestock stations, althoughdifferences in tree cover were not significant (Table II).Livestock stations were very poor in grass and forb species,with their vegetation being characterized by the presence ofa few large P. flexuosa trees. In control woodlands, the treelayer was dominated by P. flexuosa as well but alsoincluded individuals of Geoffroea decorticans. The mostfrequent shrub species were Capparis atamisquea, Lyciumtenuispinosum and Suaeda divaricata. The grass layer wascharacterized mainly by Trichloris crinita, with a lowercover of Bouteloua aristidoides, Aristida mendocina andSetaria leucophila.
Soil water and solutes
Compared with control woodlands, livestock stations hadhigher soil moisture, nitrate concentrations and lowerchloride in the unsaturated zone (Figure 3).
Soil water content in the unsaturated zone was higher inlivestock stations than in control woodlands, showing asharp increase in both cases when the water table wasapproached. Moisture differences were greatest between3�25 and 6�75-m depth (Figure 3(a–c)). The effects of landuse and soil depth showed significant differences (MarkovChain Monte Carlo simulations) in model 1 (Table III).
Ecohydrol. (2013)

Site 3
Moisture (% dry weight)0 2 4 6 12 18 24
Dep
th (
m)
-10
-8
-6
-4
-2
0Site 2
Moisture (% dry weight)0 2 4 6 12 18 24
Dep
th (
m)
-10
-8
-6
-4
-2
0
Site 1
Moisture (% dry weight)0 2 4 6 12 18 24
Dep
th (
m)
-10
-8
-6
-4
-2
0
Site 3
Chloride (g m-3) 0 300 600 900 1200
Dep
th (
m)
-10
-8
-6
-4
-2
0
Site 1
Chloride (g m-3) 0 300 600 900 1200
Dep
th (
m)
-10
-8
-6
-4
-2
0
Site 2
Chloride (g m-3) 0 300 600 900 1200
Dep
th (
m)
-10
-8
-6
-4
-2
0
Site 3
Nitrates-N (g m-3)0 10 20 30 40 50
Dep
th (
m)
-10
-8
-6
-4
-2
0
Site 2
Nitrates-N (g m-3)0 10 20 30 40 50
Dep
th (
m)
-10
-8
-6
-4
-2
0
Site 1
Nitrates-N (g m-3)0 10 20 30 40 50
Dep
th (
m)
-10
-8
-6
-4
-2
0
a b c
d e f
hg i
Figure 3. Vertical distribution of moisture content (a–c), chloride concentration per cubit metre of soil (d–f) and nitrate-N concentration per cubit metreof soil (g–i) in control woodlands (filled circles) and livestock stations (open circles). Each symbol represents a single measurement. The horizontal solid
and dotted lines indicate the water table level for control woodlands and livestock stations, respectively.
P. A. MEGLIOLI ET AL.
Chloride concentrations had contrasting vertical distribu-tions in livestock stations and control woodlands, with higherstocks and increasing concentrations with soil depth in thelatter. Chloride accumulation increased dramatically below 4,2 and 1m depth in control woodlands at sites 1, 2 and 3,respectively (Figure 3(d–f)). Model 2 had a lower AIC valuethan model 1 and showed a significant interaction (Table III).Nitrate concentrations were higher in livestock stations
than in control woodlands, with the exception of site 1.Maximum nitrate contents were found at 5�75 and 8�25m ofdepth in livestock stations at sites 2 and 3, respectively(Figure 3(g–i)).We observed increasing nitrate concentrations
Copyright © 2013 John Wiley & Sons, Ltd.
with soil depth in livestock stations and the opposite trendin control woodlands, which is also indicated by thesignificance of the interaction between land use and soildepth (Table III).
Soil pH indicated alkaline conditions at all sites, whichvaried markedly with soil depth but not with land use(Figure 4(a–c)). The model without interaction betweenfixed factors had lower AIC values. Markov Chain MonteCarlo simulations only showed a marginal significance forland use effect (Table III).
Soil salinity values were slightly higher in controlwoodlands than in livestock stations and increased with
Ecohydrol. (2013)
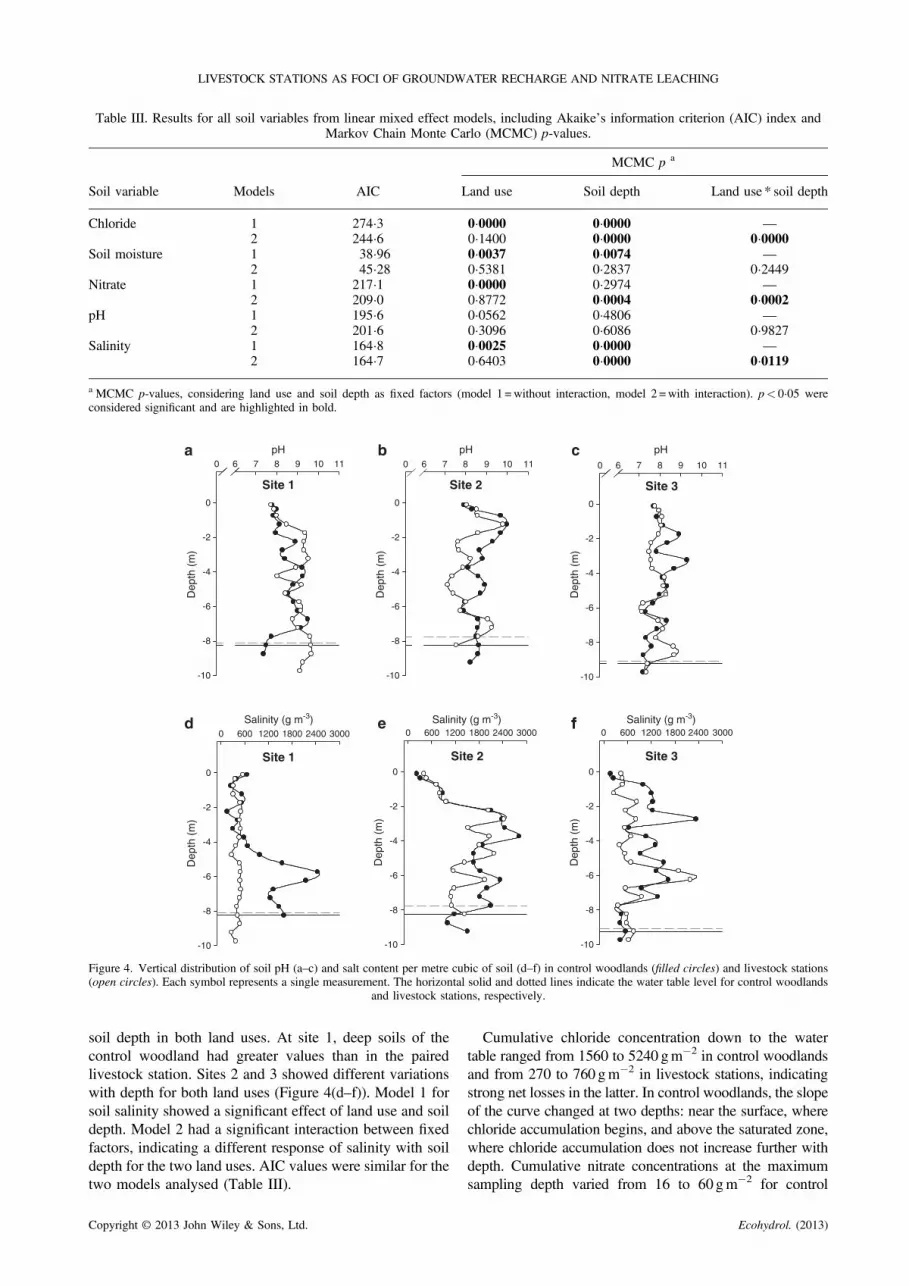
Table III. Results for all soil variables from linear mixed effect models, including Akaike’s information criterion (AIC) index andMarkov Chain Monte Carlo (MCMC) p-values.
Soil variable Models AIC
MCMC p a
Land use Soil depth Land use * soil depth
Chloride 1 274�3 0�0000 0�0000 —2 244�6 0�1400 0�0000 0�0000
Soil moisture 1 38�96 0�0037 0�0074 —2 45�28 0�5381 0�2837 0�2449
Nitrate 1 217�1 0�0000 0�2974 —2 209�0 0�8772 0�0004 0�0002
pH 1 195�6 0�0562 0�4806 —2 201�6 0�3096 0�6086 0�9827
Salinity 1 164�8 0�0025 0�0000 —2 164�7 0�6403 0�0000 0�0119
a MCMC p-values, considering land use and soil depth as fixed factors (model 1 =without interaction, model 2 =with interaction). p< 0�05 wereconsidered significant and are highlighted in bold.
Site 1 Site 3Site 2
Site 3Site 2Site 1
d e f
Site 1 Site 3Site 2Site 1
0 6 7 8 9 10 11
Dep
th (
m)
-10
-8
-6
-4
-2
0
Site 3
pHpH0 6 7 8 9 10 11
Dep
th (
m)
-10
-8
-6
-4
-2
0
Site 2
pH0 6 7 8 9 10 11
Dep
th (
m)
-10
-8
-6
-4
-2
0
a b c
0f
Site 3
Salinity (g m-3)Salinity (g m-3)Salinity (g m-3)0 600 1200 1800 2400 3000
Dep
th (
m)
-10
-8
-6
-4
-2
0
Site 2
0 600 1200 1800 2400 3000
Dep
th (
m)
-10
-8
-6
-4
-2
0
Site 1
600 1200 1800 2400 3000
Dep
th (
m)
-10
-8
-6
-4
-2
0
f
Figure 4. Vertical distribution of soil pH (a–c) and salt content per metre cubic of soil (d–f) in control woodlands (filled circles) and livestock stations(open circles). Each symbol represents a single measurement. The horizontal solid and dotted lines indicate the water table level for control woodlands
and livestock stations, respectively.
LIVESTOCK STATIONS AS FOCI OF GROUNDWATER RECHARGE AND NITRATE LEACHING
soil depth in both land uses. At site 1, deep soils of thecontrol woodland had greater values than in the pairedlivestock station. Sites 2 and 3 showed different variationswith depth for both land uses (Figure 4(d–f)). Model 1 forsoil salinity showed a significant effect of land use and soildepth. Model 2 had a significant interaction between fixedfactors, indicating a different response of salinity with soildepth for the two land uses. AIC values were similar for thetwo models analysed (Table III).
Copyright © 2013 John Wiley & Sons, Ltd.
Cumulative chloride concentration down to the watertable ranged from 1560 to 5240 gm�2 in control woodlandsand from 270 to 760 gm�2 in livestock stations, indicatingstrong net losses in the latter. In control woodlands, the slopeof the curve changed at two depths: near the surface, wherechloride accumulation begins, and above the saturated zone,where chloride accumulation does not increase further withdepth. Cumulative nitrate concentrations at the maximumsampling depth varied from 16 to 60 gm�2 for control
Ecohydrol. (2013)

Table IV. Results of generalized linear mixed model for soilvariables from models (1 =without, 2 =with interactions),
including variance of the random effects ‘site’, standard deviation(SD) and percentage of the variance explained by ‘site’ for each
response variable (%).
Variable Models Variance SD %
Chloride 1 0�499 0�706 38�122 0�412 0�642 37�45
Soil moisture 1 0�012 0�112 15�982 0�0125 0�112 16�05
Nitrates 1 0�2854 0�534 43�092 0�2873 0�536 46�39
pH 1 0�1144 0�338 24�542 0�114 0�338 24�32
P. A. MEGLIOLI ET AL.
woodlands and from55 to 150 gm�2 for livestock stations.Atsite 1, cumulative nitrate concentrations for both land useswere similar, whereas at sites 2 and 3, these values werehigher in livestock stations (Figure 5).We found considerable variations among the different
sites analysed for most variables, with the random factorexplaining from 16�0% to 46�3% of the total variability fordifferent response variables (Table IV). Groundwatermeasurements of nitrate concentrations were higher in thethree livestock stations than in their paired controlwoodlands, salinity showed variations among the differentsites analysed and pH had similar values at paired sites,except for site 2’ (Table V).
Salinity 1 0�179 0�424 41�972 0�180 0�424 43�53
a The data of model with lower Akaike’s information criterion index arehighlighted in bold.
DISCUSSION
Land use indicators support our assumption of high-useintensity near livestock station. These results may becaused by the combined effects of grazing and logging,which are difficult to separate in our study site (Villagraet al., 2009). Livestock (mainly goats) consume vegetationand disturb the soil through trampling, leading to increasedbare soil and dung deposition, and reduced litter and podabundance. In addition, local settlers remove and use woodand pods for different purposes, maintaining lowerdensities near livestock stations. Acting as the centres of
0 50 100 150 200
-0,5
-0,4
-0,3
-0,2
-0,1
0,0
0 50
-0,5
-0,4
-0,3
-0,2
-0,1
0,0Site 1 S
0 2000 4000 6000
-0,5
-0,4
-0,3
-0,2
-0,1
0,0
0 200
-0,5
-0,4
-0,3
-0,2
-0,1
0,0Site 1 S
d e
a b
Figure 5. Cumulative chloride versus cumulative water content (a–c) andwoodlands (filled circles) and livestock stations (open circles). Each symbo
saturated
Copyright © 2013 John Wiley & Sons, Ltd.
animal concentration, pastoralist settlements and wateringpoints have been shown to strongly modify nutrient cyclesin other areas (Tolsma et al., 1987; Bisigato and Bertiller,1997; Bisigato et al., 2005). Grazing may also promoteestablishment of woody seedlings (Asner et al., 2004) byconsumption and posterior deposition of hard seeds. Ourresults suggest that this effect is unimportant in our study
100 150 200 0 50 100 150 200
-0,5
-0,4
-0,3
-0,2
-0,1
0,0ite 2 Site 3
0 2000 4000 6000
-0,5
-0,4
-0,3
-0,2
-0,1
0,0
0 4000 6000
ite 2 Site 3
f
c
cumulative soil nitrate versus cumulative water content (d–f) in controll represents a single measurement. Arrows indicate the beginning of thezone.
Ecohydrol. (2013)

Table V. Groundwater characteristics, including nitrateconcentration, electric conductivity and pH.
Land use SiteNitrate(mg l�1)
Electricconductivity(ms cm�2) pH
Livestock station 1 23�0 3�43 7�69Control woodland 1 0�2 6�07 7�83Livestock station 2 8�6 7�34 7�52Control woodland 2 4�9 3�58 9�03Livestock station 3 38�7 4�03 8�66Control woodland 3 0�4 4�32 8�17
LIVESTOCK STATIONS AS FOCI OF GROUNDWATER RECHARGE AND NITRATE LEACHING
area (Table II). Perhaps the high intensity of livestock andhuman activities in the station prevents the successfulestablishment of Prosopis seedlings in the area.Our results indicate a significant change in vegetation
structure and composition with the establishment oflivestock stations, as described for other arid areas (Asneret al., 2004; Reynolds et al., 2007). The lower vegetationstrata (shrubs and grasses) were the most affected ones,whereas tree cover showed lower contrasts, possibly as aresult of increasing tree size compensating for reduceddensity in livestock stations. Noticeably, large individualsof P. flexuosa are still present in stations, likely preservedby settlers as a source of shade and fruits for humans andlivestock (Alvarez and Villagra, 2009). Because large treesare the most remarkable feature of vegetation in the area,common remote sensing indices and perception of localinhabitants may suggest a low effect of livestock stationson vegetation. However, total plant cover was lower inlivestock stations, highlighting the importance of shrubsand grasses on the structure and composition of the woodland(Table II). At the Telteca Reserve sites, vegetation changeswere also detected by soil-adjusted total vegetation index,showing gradients of landscape degradation, which decreasegradually with increasing distances to the pastoralistsettlements (Goirán et al., 2012). As a result, vegetationchanges by livestock alter the belowground structure of plants(Milchunas and Lauenroth, 1993). In arid areas, woodyspecies tend to be more deeply rooted than grasses andherbaceous plants (Bucci et al., 2009; Villagra et al., 2011).Vegetation shifts, such as a decrease in shrub and grass coverin livestock stations, may change vertical and horizontal rootdistributions and consequently modify the absorption of soilresources (Jackson et al., 2000; Moore et al., 2010).The establishment of livestock stations affected biogeo-
chemical and hydrological transport between the ecosystemand groundwater. The lower chloride, and higher moistureand nitrate contents in soils from livestock stations supportour hypothesis that water and solute transport from thesurface to the phreatic aquifer is facilitated in these areas,which function as foci of local deep drainage, nitrate leachingand groundwater pollution. Chloride concentration in soils,which is inversely proportional to the downward water flux(Scanlon, 1991; Phillips, 1994), indicated higher waterpercolation rates in livestock stations, similar to thosereported for bare lowlands in a nearby active dune field(Jobbágy et al., 2011). In control woodlands, chloride profiles
Copyright © 2013 John Wiley & Sons, Ltd.
(Figure 3) indicate that progressive evaporation and waterextraction by plant roots are likely consuming all precipitationinputs, preventing recharge (Allison et al., 1994; Phillips,1994). In agreement with chloride concentrations, livestockstations showed the expected pattern of slightly lower soilsalinities, probably given by solute transport to groundwater.Salts accumulated in the soils may also be transported to theaquifer with increasing local recharge and probably decreasegroundwater quality.
The differences in water dynamics found between both landuses are likely caused by differences in plant biomass bothaboveground and belowground. In woodlands, plant rootsystems can exhaustively absorb soil resources (water andnutrients) with their horizontally extended root system(Breshears and Barnes, 1999; Bucci et al., 2011; Villagraet al., 2011). Under the sparse vegetation of livestock stations,rainfall inputs have a better chance to escape root uptake andpercolate to deep soil layers (deep drainage) (Seyfried et al.,2005). Changes fromnativewoodlands to pastures in semi-aridrangelands of southern Texas also modified water dynamics,decreasing chloride concentrations in the soil profile. Aquiferrecharge was estimated to increase in root-plowed areas byabout 2�6mmyear�1 (Moore et al., 2012), but the effects ofthese changes in groundwater quality were not considered.
Domestic animals seem to mediate the increased nitrateconcentrations in soil profiles that we found in livestockstations (Figure 3). Biomass consumption in nearbywoodlands, and transport and deposition of its associatednutrients as dung and urine in livestock settlements couldchange the vertical and horizontal distribution of nutrientsat different scales (Tolsma et al., 1987; Rossi, 2004). Theobserved variability of nitrate contents with depth in thedifferent profiles may be related to spatial variability invegetation (e.g. the presence of a tree near the profile),vegetation history (livestock station age and use), livestockbehaviour (e.g. there might be preferential resting areas atdifferent distances from each soil profile) and previousprecipitation events at the different sites (Walvoord et al.,2003; Jackson et al., 2004). Nitrates accumulated in thesoils of livestock stations are not completely absorbed bythe scarce vegetation and may be leached to deep soilsduring intense rainfall events, forming undergroundnitrate reservoirs, as shown in other deserts of the world(Walvoord et al., 2003; Austin, 2011). These nitratereservoirs can reach groundwater with successive deepdrainage events, affecting groundwater quality, as shown inthe wells of our study sites and in other wells of the area(Aranibar et al., 2011). If there are no mechanisms for thesurrounding vegetation to recapture groundwater nitrates,this nitrate movement may represent net nitrogen lossesfrom the ecosystem. However, groundwater flow, withestimated velocities from 0�1 to 0�25m per day (Gomezet al., 2010; Aranibar et al., 2011), may transport thisnitrate to neighbouring woodlands, where phreatophytevegetation could absorb it and return it to the surfaceenvironment. Further studies are needed to determine thefinal fate of groundwater nitrate.
The curves of cumulative chloride versus water content(Figure 5) showed slope changes under both land uses. In
Ecohydrol. (2013)

P. A. MEGLIOLI ET AL.
control woodlands, maximum slope was approximately anorder of magnitude higher than in livestock stations,whereas the same curves for nitrate versus water contentshowed an opposite pattern, with slopes being less thanhalf of those found in livestock stations at two study sites.These contrasts suggest higher water drainage fluxes withhigher nitrate contents along the soil profile of livestockstations. The combined effect of higher nitrate content insoil water and faster downward water fluxes suggests evenfaster nitrate transport rates beneath livestock stationscompared with woodlands. A rough estimate of thisincreased transport can be achieved by comparing soil atintermediate depths (4�25–4�75m) where little effects ofboth root uptake and capillary rise can be expected. Thenitrate-N : chloride ratio is a good indicator of the nitratetransport difference increase and approached 20, 50 and1100-fold increases at sites 1, 2 and 3, respectively. Theextremely high value of site 3 suggests that nitrate flux in thecontrol woodland is virtually nil. Accompanying this trend,groundwater nitrate concentrations in the three livestockstations were higher than in their paired control woodlands(Table V). None of the groundwater samples exceeded therecommended local drinking water standards (45mg l�1;Código Alimentario Argentino, 2007), but two of themexceeded those accepted in the USA (10mg l�1; Environ-mental Protection Agency, United States, 2009). In theregion, domestic wells for human and animal use are oftenfound a few metres from corrals or livestock gathering areas.Traditional, subsistence livestock production is the main
economic activity in this challenging environment (Torres,2008; Guevara et al., 2009). Because government author-ities are granting land rights and providing some basicservices (e.g. drinking water supply in access roads andinstallation of solar panels in settlements) to Huarpecommunities, density of livestock stations in the reserve andsurrounding areas may increase in the near future. Therefore,management programs are crucial to maintain or improveforests and groundwater quality (Alvarez et al., 2006). Forexample, new livestock stations should consider theseobservations to locate wells in upstream and directions fromcorrals, to avoid groundwater pollution with nitrate. Inaddition, the practice of leaving adultP.flexuosa trees standingin livestock stations should be encouraged, to provide shadeand fruits for domestic animals and reduce nitrate leaching.Other arid and semi-arid systems may be similarly
vulnerable to land use changes. Although vegetation removalhas been shown to increase groundwater recharge in aridareas (Moore et al., 2012), nitrate, salt and surfacecontaminants may also be transported to the aquifer,decreasing groundwater quality. Our and previous studies(Jobbágy et al., 2011) show that vegetation activity preventsthe downward movement of water and solutes, protectinggroundwater from surface pollution.
CONCLUSION
This research reinforces the idea of a strong vegetationcontrol over water and nitrogen cycles in arid lands andshows how human activities, even in low density grazing
Copyright © 2013 John Wiley & Sons, Ltd.
systems, can disrupt the interactions among vegetation,water and nutrients in the soil–plant–groundwater system.Disruptions of ecological processes by livestock activitiesclearly affect the hydrological links between surface andgroundwater. The removal of vegetation by humans anddomestic animals in livestock stations allows deeper waterpercolation, which transports nitrate deposited as dung andurine, an increasing groundwater nitrate concentration.
ACKNOWLEDGEMENTS
We thank the Dirección de Recursos Naturales Renovables ofMendoza province for their permission to work in TeltecaNatural Reserve, and park rangers, Leandro, Roberto andRicardo. We thank Cecilia Vega Riveros, Silvana Goirán,Florencia Spirito, Aranzazú Guevara, Graciela López, LauraGomez, Erica Cesca, Bruno Del Olmo, Maximiliano Viale,Alejandro Serrano, Marcelo Quiroga, Gualberto Zalazar andDiego Odales who helped us with field sampling. We arethankful to CarmenMayorga and SozanteMayorga, and theirrespective families, Chicho, Valeria, Argentina, Cecilia andMariano for their warm hospitality and help during fieldwork.We thank Carla Giordano and Mario Medero for theirpermission to work in the laboratories, Nelly Horak for herassistance with the English language, and two anonymousreviewers for their suggestions and comments. This researchwas supported by Agencia Nacional de Promoción Científicay Tecnológica PICT 2007–01222 and SECTYP, UniversidadNacional de Cuyo, Mendoza.
REFERENCES
Abraham E, del Valle HF, Roig F, Torres L, Ares JO, Coronato F,Godagnone R. 2009. Overview of the geography of the Monte Desertbiome (Argentina). Journal of Arid Environments 73(2): 144–153.DOI:10.1016/j.jaridenv.2008.09.028.
Allison GB, Gee GW, Tyler SW. 1994. Vadose-zone techniques forestimating groundwater recharge in arid and semiarid regions. SoilScience Society of America Journal 58(1): 6–14. DOI:10.2136/sssaj1994.03615995005800010002x.
Alvarez JA, Villagra PE. 2009. Prosopis flexuosa DC. (Fabaceae,Mimosoideae). Kurtziana 35(1): 49–63.
Alvarez JA, Villagra PE, Cony MA, Cesca E, Boninsegna JA. 2006.Estructura y estado de conservación de los bosques de Prosopisflexuosa D.C. en el Noreste de Mendoza, Argentina. Revista Chilena deHistoria Natural 79: 75–87.
Aranibar JN, Villagra PE, Gomez ML, Jobbágy EG, Quiroga M, WuilloudRG, Monasterio RP, Guevara A. 2011. Nitrate dynamics in the soil andunconfined aquifer in arid groundwater coupled ecosystems of theMonte desert, Argentina. Journal of Geophysical Research 116:G04015. DOI:10.1029/2010jg001618.
Asner GP, Elmore AJ, Olander LP, Martin RE, Harris AT. 2004. Grazingsystems, ecosystem responses, and global change. Annual Review ofEnvironment and Resources 29: 261–299. DOI:10.1146/annurev.energy.29.062403.102142.
ATSDR. 2011. Agency for toxic substances and diseases registry. CaseStudies in Environmental Medicine: Nitrate/Nitrite Toxicity.
Austin AT. 2011. Has water limited our imagination for aridlandbiogeochemistry? Trends in Ecology & Evolution 26: 229–235.DOI:10.1016/j.tree.2011.02.003.
Baayen RH. 2008. languageR: data sets and functions with “AnalyzingLinguistic Data: A Practical Introduction to Statistics”. R packageversion 0.953.
Bates D, Maechler M. 2009. lme4: linear mixed-effects models using S4classes. R package version 0.999375-32.
Bertiller MB, Marone L, Baldi R, Ares JO. 2009. Biological interactions atdifferent spatial scales in the Monte desert of Argentina. Journal of AridEnvironments 73: 212–221. DOI:10.1016/j.jaridenv.2007.08.008.
Ecohydrol. (2013)

LIVESTOCK STATIONS AS FOCI OF GROUNDWATER RECHARGE AND NITRATE LEACHING
BisigatoAJ,BertillerMB. 1997.Grazing effects on patchy dryland vegetationin northern Patagonia. Journal of Arid Environments 36: 639–653.
Bisigato AJ, Bertiller MB, Ares JO, Pazos GE. 2005. Effect of grazing onplant patterns in arid ecosystems of Patagonian Monte. Ecography 28:561–572. DOI:10.1111/j.2005.0906-7590.04170.x.
Bosch EA. 2008. Informe sobre monitoreo de pozos baldes y jagüeles enla Reserva Telteca. Gobierno de la Provincia de Mendoza. Secretaria deMedio Ambiente. Dirección de Saneamiento y Control Ambiental,unpublished report.
Breshears DD, Barnes FJ. 1999. Interrelationships between plantfunctional types and soil moisture heterogeneity for semiarid landscapeswithin the grassland/forest continuum: a unified conceptual model.Landscape Ecology 14: 465–478.
Bresler E, McNeal BL, Carter DL. 1982. Saline and Sodic Soils. Principles –Dynamics – Modeling. Springer-Verlag edition, Berlin, Germany.
Bucci SJ, Scholz FG, Goldstein G, Meinzer FC, Arce ME. 2009. Soilwater availability and rooting depth as determinants of hydraulicarchitecture of Patagonian woody species. Oecologia 160: 631–641.
Bucci SJ, Scholz FG, Iogna PA, Goldstein G. 2011. Economía del agua deespecies arbustivas de las Estepas Patagónicas. Ecologia Austral 21: 43–60.
CAA, 2007. Código Alimentario Argentino 982 Res Conj SPRyRS ySAGPyA N� 68/2007 y N� 196/2007.
Campos CM, Ojeda RA. 1997. Dispersal and germination of Prosopisflexuosa (Fabaceae) seeds by desert mammals in Argentina. Journal ofArid Environments 35: 707–714.
Chiavazza HD. 2002. Processes of prehistorical settlement and environ-mental change in the Northeastern plain of Mendoza: perspectives fromarchaeology IANIGLA, 30 Years of Basic and Applied Research onEnvironmental Sciences. Instituto Argentino de Nivología, Glaciologíay Ciencias Ambientales (eds Trombotto, DT & R Villalba) pp 11–15.Mendoza, Argentina.
Contreras LS, Jobbágy EG, Villagra PE, Nosetto MD, Puigdefábregas J.2011. Remote sensing estimates of supplementary water consumptionby arid ecosystems of central Argentina. Journal of Hydrology 397: 10–22.DOI:10.1016/j.jhydrol.2010.11.014.
EPA, 2009. Environmental Protection Agency, United States. http://water.epa.gov/drink/contaminants/basicinformation/nitrate.cfm.
FAO, 2011. Food and Agriculture Organization. The State of the World’sLand and Water Resources for Food and Agriculture. Rome, Italy.http://www.fao.org/nr/water/docs/SOLAW_EX_SUMM_WEB_EN.pdf.
Goirán S, Aranibar JN, Gomez ML. 2012. Heterogeneous spatialdistribution of traditional livestock settlements and their effects onvegetation cover in arid groundwater coupled ecosystems in the Montedesert (Argentina). Journal of Arid Environments 87: 188–197.
Gomez ML, Aranibar JN, Wuilloud R, Monasterio R. 2010.Hydrogeological study of the phreatic aquifer in groundwater coupledarid ecosystems under a world-wide climate change context. Interna-tional Conference: Arid and Semi Arid Development through WaterAugmentation Valparaiso, Chile.
Gómez DA, Aranibar JN, Tabeni S, Villagra PE, Garibotti IA, Atencio A.2012. Biological soil crust recovery after long-term grazing exclusion inthe Monte Desert (Argentina). Changes in coverage, spatial distribution,and soil nitrogen. Acta Oecologica 38: 33–40. DOI:10.1016/j.actao.2011.09.001.
Guevara JC, Grünwaldt E, Estevez OR, Bisigato AJ, Blanco LJ, BiurrunFN, Ferrando CA, Chirino CC, Morici EF, Fernández B, Allegretti LI,Passera CB. 2009. Range and livestock production in the Monte Desert,Argentina. Journal of Arid Environments 73: 228–237.
Guevara A, Giordano CV, Aranibar JN, Quiroga M, Villagra PE. 2010.Phenotypic plasticity of the coarse root system of Prosopis flexuosa, aphreatophyte tree, in the Monte Desert (Argentina). Plant and Soil 330:447–464. DOI:10.1007/s11104-009-0218-4.
Hobbs RJ, Huenneke LF. 1992. Disturbance, diversity and invasion:implications for conservation. Conservation Biology 6(3): 324–337.
Inojosa M, Meglioli PA, Karlin UO. 2010. Nuestra Identidad HuarpeRaíces Huarpes: Uso medicinal de plantas en la comunidad de Lagunasdel Rosario, Mendoza, Argentina (eds Montani, MC & CC VegaRiveros) pp 17–32. San Juan, Argentina.
Jackson RB, Schenk HJ, Jobbágy EG, Canadell J, Colello GD, DickinsonRE, Field CB, Friedlingstein P, Heimann M, Hibbard K, KicklighterDW, Kleidon A, Neilson RP, Parton WJ, Sala OE, Sykes MT. 2000.Belowground consequences of vegetation change and their treatment inmodels. Ecological Applications 10(2): 470–483. DOI:10.2307/2641107.
Jackson RB, Berthrong ST, Cook CW, Jobbágy EG, McCulley RL. 2004.Comment on “A Reservoir of Nitrate Beneath Desert Soils”. Nature304: 51. DOI:10.1126/science.109429.
Copyright © 2013 John Wiley & Sons, Ltd.
Jackson RB, Jobbágy EG, Nosetto MD. 2009. Ecohydrology in a human-dominated landscape. Ecohydrology 2: 383–389. DOI:10.1002/eco.81.
Jobbágy EG, Jackson RB. 2001. The distribution of soil nutrients with depth:global patterns and the imprint of plants. Biogeochemistry 53: 51–77.
Jobbágy EG, Nosetto MD, Villagra PE, Jackson RB. 2011. Watersubsidies from mountains to deserts: their role in sustaininggroundwater-fed oases in a sandy landscape. Ecological Applications21 (3): 678–694. DOI:10.1890/09-1427.1.
Labraga JC, Villalba R. 2009. Climate in the Monte Desert: past trends,present conditions, and future projections. Journal of Arid Environ-ments 73: 154–163. DOI:10.1016/j.jaridenv.2008.03.016.
Ladio AH, Lozada M. 2009. Human ecology, ethnobotany and traditionalpractices in rural populations inhabiting the Monte region: resilienceand ecological knowledge. Journal of Arid Environments 73: 222–227.DOI:10.1016/j.jaridenv.2008.02.006.
Loik ME, Breshears DD, Lauenroth WK, Belnap J. 2004. A multi-scaleperspective of water pulses in dryland ecosystems: climatology andecohydrology of the western USA. Oecologia 141(2): 269–281.
Milchunas DG, Lauenroth WK. 1993. A quantitative assessment of theeffects of grazing on vegetation and soils over a global range ofenvironments. Ecological Monographs 63: 327–366.
Moore GW, Barre DA, Owens MK. 2010. Changes in soil chloridefollowing shrub removal and subsequent regrowth. Geoderma 158:148–155.
Moore GW, Barre DA, Owens MK. 2012. Does shrub removal increasegroundwater recharge in southwestern Texas semiarid rangelands?Rangeland Ecology & Management 65(1): 1–10. DOI:10.2111/REM-D-11-00055.1.
Morello J 1958. La Provincia Fitogeográfica del Monte. Opera Lilloana 2:5–115.
Newman BD, Wilcox BP, Archer SR, Breshears DD, Dahm CN, DuffyCJ, McDowell NG, Phillips FM, Scanlon BR, Vivoni ER. 2006.Ecohydrology of water-limited environments: a scientific vision.Water Resources Research 42 : W06302. DOI:10.1029/2005WR004141.
Nosetto MD, Jobbágy EG, Brizuela AB, Jackson RB. 2012. Thehydrologic consequences of land cover change in central Argentina.Agriculture, Ecosystems and Environment 154: 2–11. DOI:10.1016/j.agee.2011.01.008.
Noy-Meir I 1973. Desert ecosystems: environment and producers. AnnualReview of Ecology and Systematics 4: 25–51.
Passera CB, Dalmasso AD, Borsetto O. 1983. Método de "point quadratmodificado". Taller de arbustos forrajeros para zonas áridas ysemiáridas. Subcomité Asesor del Arido Subtropical Argentino de laSecretaría de Ciencia y Tecnología - Orientación Gráfica Argentina.pp.71-79. Buenos Aires, Argentina.
Phillips FM. 1994. Environmental tracers for water movement in desertsoils of the American southwest. Soil Science Society of AmericaJournal 58: 15–24.
Prieto MR. 2000. Formación y consolidación de una sociedad en un áreamarginal del Reino de Chile: La Provincia de Cuyo en el siglo XVII.Anales de Arqueología y Etnología 52–53: 18–366.
Reynolds JF, Stafford Smith M, Lambin EF, Turner BL, Mortimore M,Batterbury SP, Downing TE, Dowlatabadi H, Fernández RB, HerrickJE, Huber-Sannwald E, Jiang H, Leemans R, Lynam T, Maestre FT,Ayarza M, Walker B. 2007. Global desertification: building a sciencefor dryland development. Science 316: 847–851. DOI:10.1126/science.1131634.
Roig FA. 1993. Aportes a la etnobotánica del género ProsopisContribuciones Mendocinas a la Quinta Reunión de Regional paraAmérica Latina y el Caribe de la Red de Forestación del CIID.Conservación y Mejoramiento de Especies del Género Prosopis (edsIADIZA) pp 99–119. Mendoza, Argentina.
Rojas JF, Prieto MR, Alvarez JA, Cesca E. 2009. Procesossocioeconómicos y territoriales en el uso de los recursos forestales enMendoza desde fines del siglo XIX hasta mediados del XX. Proyección7: 1–33.
Rossi BE. 2004. Flora y vegetación de la Reserva de Biosfera de Ñacuñándespués de 25 años de clausura. Heterogeneidad espacial a distintasescalas. Tesis doctoral. Universidad Nacional de Cuyo. Mendoza.
Santoni CS, Jobbágy EG, Contreras S. 2010. Vadose zone transport in dryforests of central Argentina: the role of land use. Water ResourcesResearch 46(10): W10541. DOI:10.1029/2009WR008784.
Scanlon BR. 1991. Evaluation of moisture flux from chloride data indesert soils. Journal of Hydrology 128: 137–156.
Scanlon TM, Caylor KK, Manfreda S, Levin SA, Rodriguez-Iturbe I.2005. Dynamic response of grass cover to rainfall variability:
Ecohydrol. (2013)

P. A. MEGLIOLI ET AL.
implications for the function and persistence of savanna ecosystems.Advances in Water Resources 28(3): 291–302.
Scanlon BR, Keese KE, Flint AL, Flint LE, Gaye CB, Edmunds WM,Simmers I. 2006. Global synthesis of groundwater recharge in semiaridand arid regions. Hydrological Processes 20: 3335–3370.DOI:10.1002/hyp.6335.
Schwinning S, Sala OE, Loik ME, Ehleringer JR. 2004. Thresholds,memory, and seasonality: understanding pulse dynamics in arid/semi-arid ecosystems. Oecologia 141(2): 191–193.
Seyfried MS, Schwinning S, Walvoord MA, Pockman WT, Newman BD,Jackson RB, Phillips FM. 2005. Ecohydrological control of deepdrainage in arid and semiarid regions. Ecology 86(2): 277–287.DOI:10.1890/03-0568.
Smet M, Ward D. 2006. Soil quality gradients around water-points underdifferent management systems in a semi-arid savanna, South Africa. Journalof Arid Environments 64(2): 251–269. DOI:10.1016/j.jaridenv.2005.04.014.
Team RDC. 2009. R: a Language and Environment for StatisticalComputing. R Foundation for Statistical Computing, Vienna, Austria.
Tolsma DJ, Ernst WHO, Verwey RA. 1987. Nutrients in soil andvegetation around two artificial waterpoints in Eastern Botswana.Journal of Applied Ecology 24: 991–1000.
Torres ML. 2008. Hilos de agua, lazos de sangre: enfrentando la escasez en eldesierto de Lavalle (Mendoza, Argentina). Ecosistemas 19(1): 46–59.
Vázquez DP, Alvarez JA, Debandi G, Aranibar JN, Villagra PE. 2011.Ecological consequences of dead wood extraction in an arid ecosystem.
Copyright © 2013 John Wiley & Sons, Ltd.
Basic and Applied Ecology 12(8): 722–732. DOI:10.1016/j.baae.2011.08.009.
Villagra PE, Cony MA, Mantován NG, Rossi BE, González Loyarte MM,Villalba R, Marone L. 2004. Ecología y Manejo de los algarrobales dela Provincia Fitogeográfica del Monte Ecología y Manejo de BosquesNativos de Argentina (eds Arturi, MF, JL Frangi, & JF Goya) pp. 32.Mendoza, Argentina.
Villagra PE, Defossé G, Del Valle H, Tabeni MS, Rostagno CM, Cesca E,Abraham EM. 2009. Land use and disturbance effects on the dynamicsof natural ecosystems of the Monte Desert. Implications for theirmanagement. Journal of Arid Environments 73: 202–211.DOI:10.1016/j.jaridenv.2008.08.002.
Villagra PE, Giordano CV, Alvarez JA, Cavagnaro JB, Guevara A, SartorC, Passera CB, Greco S. 2011. Ser planta en el desierto: estrategias deuso de agua y resistencia al estrés hídrico en el Monte Central deArgentina. Ecologia Austral 21: 29–42.
Walvoord MA, Phillips FM, Stonestrom DA, Evans RD, HartsoughPC, Newman BD, Striegl RG. 2003. A reservoir of nitratebeneath desert soils. Science 302: 1021–1024. DOI:10.1126/science.1086435.
Wilcox BP, Breshears DD, Seyfried MS. 2003. Water balance onrangelands. In Encyclopedia of Water Science, Stewart, BA & TAHowell (eds). Marcel Dekker: New York: 791–794.
Zar JH. 1984. Biostatistical Analysis. 2nd edn, Prentice-Hall InternationalEditions.
Ecohydrol. (2013)