Littoral slope as a predictor of the maximum biomass of submerged macrophyte communities
9
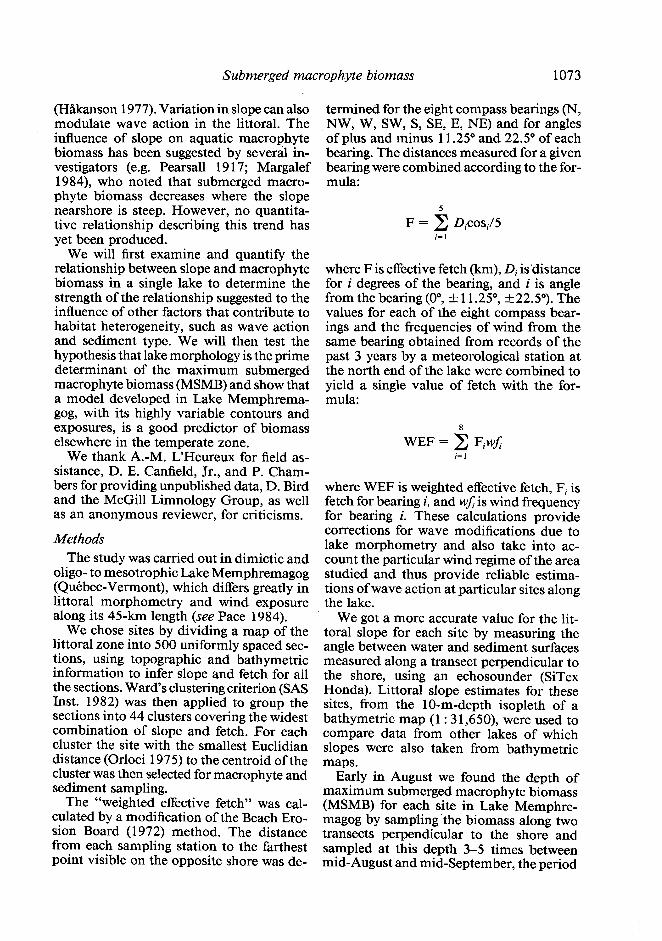
Limnol. Oceanogr.. 31(5), 1986, 1072-1080 0 1986, by the American Society of Limnology and Oceanography, Inc. Littoral slope as a predictor of the maximum biomass of submerged macrophyte communities1y2 Carlos M. Duarte and Jacob Kalf Department of Biology, McGill University, 1205 Ave. Dr. Penfield, Montreal, Quebec H3A 1Bl Abstract The hypothesis that the morphometric characteristics of the littoral zone of lakes are a major determinant of submerged macrophyte biomass was tested in Lake Memphremagog (Quebec- Vermont) by studying the relationship between maximum biomass of submerged macrophytes and physical and sediment characteristics of the littoral zone. The slope of the littoral zone accounted for 72% of the observed variability in maximum submerged macrophyte biomass (MSMB). By also incorporating sediment organic matter the variance explained was raised to 88% (P < 0.000 1). A model based on only slope as predictor of MSMB was improved by considering slopes >( 5.33%: slope < 5.33% MSMB (g fresh wt m-‘) = -29.8 + 1,403 slope-0.*1; slope > 5.33% MSMB (g fresh wt m-2) = 13.2 + 3,434 slope-“.81. The power of these two equations to predict the MSMB in a variety of temperate lakes was high (r = 0.90, P < 0.0001). However, the temperate zone model overestimates the MSMB in highly turbid lakes where irradiance rather than slope is pre-eminent and underestimates the biomass in semitropical and tropical lakes. Submerged aquatic macrophytes play a major role in the dynamics of shallow lakes and the littoral zone of many large lakes. Their abundance influences the trophic sta- tus (Carpenter 1983) and phytoplankton biomass levels (Landers 1982) of shallow lakes. Their surfaces provide a substrate for readily grazeable epiphytes (Cattaneo and Kalff 1980) and their abundance affects fish populations (Wiley et al. 1984). When their growth is excessive, it affects the economic potential of lakes (Holm et al. 1969). Con- sequently, there is growing interest in the factors that control macrophyte develop- ment and the extent of their impact on lake ecosystems (e.g. Adams and Prentki 1982). Since the successful development of nu- trient-based models for predicting phyto- plankton biomass (Vollenweider 1968; Dil- lon and Rigler 1974), studies have focused on nutrients as the principal determinants of macrophyte growth and biomass. How- ever the results have been inconclusive, with some workers reporting nutrient limitation * A contribution to the Lake Memphremagog Proj- ect, McGill Limnology Research Center. 2 The work was supported by the Natural Sciences and Engineering Research Council of Canada to J. Kalff, a Quebec Government FCAR equipe grant to J. Kalff, W. Leggett, and R. Peters, and a World University Service of Canada scholarship to C. Duarte. of submerged macrophyte biomass (e.g. Schlott and Malicky 1984; Lind and Cottam 1969) and a positive effect of nutrients on biomass (Ozimek 1978) and others report- ing that macrophyte populations are un- likely to be limited by nutrient levels (e.g. Carpenter and Adams 1977). In contrast to the clear coupling of nutrient levels and phytoplankton biomass, the link between nutrient levels and submerged macrophytes has remained unclear (Devol and Wissmar 1978) and macrophyte control remains an elusive goal. Although some research has shown the effect of light (e.g. Jupp and Spence 1977a; Barko et al. 1982) and wave action (e.g. Jupp and Spence 19776) on macrophyte biomass, this information is in- sufficient to explain differences in sub- merged macrophyte biomass. It may be that the relative weakness of such relationships for macrophytes derives from the physical heterogeneity of the lit- toral area. Topographic and morphometric differences result in differences in littoral dynamics caused by associated variations in slope, wave action, and the input of al- lochthonous materials. Slope in particular can be a major factor controlling the phys- ical characteristics of the sediments by affecting sediment stability and the deposition of fine nutrient-rich materials 1072
-
Upload
independent -
Category
Documents
-
view
0 -
download
0
Transcript of Littoral slope as a predictor of the maximum biomass of submerged macrophyte communities
Limnol. Oceanogr.. 31(5), 1986, 1072-1080 0 1986, by the American Society of Limnology and Oceanography, Inc.
Littoral slope as a predictor of the maximum biomass of submerged macrophyte communities1y2
Carlos M. Duarte and Jacob Kalf Department of Biology, McGill University, 1205 Ave. Dr. Penfield, Montreal, Quebec H3A 1Bl
Abstract
The hypothesis that the morphometric characteristics of the littoral zone of lakes are a major determinant of submerged macrophyte biomass was tested in Lake Memphremagog (Quebec- Vermont) by studying the relationship between maximum biomass of submerged macrophytes and physical and sediment characteristics of the littoral zone. The slope of the littoral zone accounted for 72% of the observed variability in maximum submerged macrophyte biomass (MSMB). By also incorporating sediment organic matter the variance explained was raised to 88% (P < 0.000 1). A model based on only slope as predictor of MSMB was improved by considering slopes >( 5.33%:
slope < 5.33% MSMB (g fresh wt m-‘) = -29.8 + 1,403 slope-0.*1;
slope > 5.33% MSMB (g fresh wt m-2) = 13.2 + 3,434 slope-“.81.
The power of these two equations to predict the MSMB in a variety of temperate lakes was high (r = 0.90, P < 0.0001). However, the temperate zone model overestimates the MSMB in highly turbid lakes where irradiance rather than slope is pre-eminent and underestimates the biomass in semitropical and tropical lakes.
Submerged aquatic macrophytes play a major role in the dynamics of shallow lakes and the littoral zone of many large lakes. Their abundance influences the trophic sta- tus (Carpenter 1983) and phytoplankton biomass levels (Landers 1982) of shallow lakes. Their surfaces provide a substrate for readily grazeable epiphytes (Cattaneo and Kalff 1980) and their abundance affects fish populations (Wiley et al. 1984). When their growth is excessive, it affects the economic potential of lakes (Holm et al. 1969). Con- sequently, there is growing interest in the factors that control macrophyte develop- ment and the extent of their impact on lake ecosystems (e.g. Adams and Prentki 1982).
Since the successful development of nu- trient-based models for predicting phyto- plankton biomass (Vollenweider 1968; Dil- lon and Rigler 1974), studies have focused on nutrients as the principal determinants of macrophyte growth and biomass. How- ever the results have been inconclusive, with some workers reporting nutrient limitation
* A contribution to the Lake Memphremagog Proj- ect, McGill Limnology Research Center.
2 The work was supported by the Natural Sciences and Engineering Research Council of Canada to J. Kalff, a Quebec Government FCAR equipe grant to J. Kalff, W. Leggett, and R. Peters, and a World University Service of Canada scholarship to C. Duarte.
of submerged macrophyte biomass (e.g. Schlott and Malicky 1984; Lind and Cottam 1969) and a positive effect of nutrients on biomass (Ozimek 1978) and others report- ing that macrophyte populations are un- likely to be limited by nutrient levels (e.g. Carpenter and Adams 1977). In contrast to the clear coupling of nutrient levels and phytoplankton biomass, the link between nutrient levels and submerged macrophytes has remained unclear (Devol and Wissmar 1978) and macrophyte control remains an elusive goal. Although some research has shown the effect of light (e.g. Jupp and Spence 1977a; Barko et al. 1982) and wave action (e.g. Jupp and Spence 19776) on macrophyte biomass, this information is in- sufficient to explain differences in sub- merged macrophyte biomass.
It may be that the relative weakness of such relationships for macrophytes derives from the physical heterogeneity of the lit- toral area. Topographic and morphometric differences result in differences in littoral dynamics caused by associated variations in slope, wave action, and the input of al- lochthonous materials. Slope in particular can be a major factor controlling the phys- ical characteristics of the sediments by affecting sediment stability and the deposition of fine nutrient-rich materials
1072
Submerged macrophyte biomass 1073
(HAkanson 1977). Variation in slope can also modulate wave action in the littoral. The influence of slope on aquatic macrophyte biomass has been suggested by several in- vestigators (e.g. Pearsall 19 17; Margalef 1984), who noted that submerged macro- phyte biomass decreases where the slope nearshore is steep. However, no quantita- tive relationship describing this trend has yet been produced.
We will first examine and quantify the relationship between slope and macrophyte biomass in a single lake to determine the strength of the relationship suggested to the influence of other factors that contribute to habitat heterogeneity, such as wave action and sediment type. We will then test the hypothesis that lake morphology is the prime determinant of the maximum submerged macrophyte biomass (MSMB) and show that a model developed in Lake Memphrema- gog, with its highly variable contours and exposures, is a good predictor of biomass elsewhere in the temperate zone.
We thank A.-M. L’Heureux for field as- sistance, D. E. Canfield, Jr., and P. Cham- bers for providing unpublished data, D. Bird and the McGill Limnology Group, as well as an anonymous reviewer, for criticisms.
Methods The study was carried out in dimictic and
oligo- to mesotrophic Lake Memphremagog (Quebec-Vermont), which differs greatly in littoral morphometry and wind exposure along its 45-km length (see Pace 1984).
We chose sites by dividing a map of the littoral zone into 500 uniformly spaced sec- tions, using topographic and bathymetric information to infer slope and fetch for all the sections. Ward’s clustering criterion (SAS Inst. 1982) was then applied to group the sections into 44 clusters covering the widest combination of slope and fetch. For each cluster the site with the smallest Euclidian distance (Orloci 1975) to the centroid of the cluster was then selected for macrophyte and sediment sampling.
The “weighted effective fetch” was cal- culated by a modification of the Beach Ero- sion Board (1972) method. The distance from each sampling station to the farthest point visible on the opposite shore was dc-
termined for the eight compass bearings (N, NW, W, SW, S, SE, E, NE) and for angles of plus and minus 11.25” and 22.5” of each bearing. The distances measured for a given bearing were combined according to the for- mula:
5
F = x DiCOSil5 i=l
where F is effective fetch (km), Di is’distance for i degrees of the bearing, and i is angle from the bearing (OO, + 11.25”, k22.5”). The values for each of the eight compass bear- ings and the frequencies of wind from the same bearing obtained from records of the past 3 years by a meteorological station at the north end of the lake were combined to yield a single value of fetch with the for- mula:
WEF = C FiWJ;: i=l
where WEF is weighted effective fetch, Fi is fetch for bearing i, and wJJ: is wind frequency for bearing i. These calculations provide corrections for wave modifications due to lake morphometry and also take into ac- count the particular wind regime of the area studied and thus provide reliable estima- tions of wave action at particular sites along the lake.
We got a more accurate value for the lit- toral slope for each site by measuring the angle between water and sediment surfaces measured along a transect perpendicular to the shore, using an echosounder (SiTex Honda). Littoral slope estimates for these sites, from the lo-m-depth isopleth of a bathymetric map (1 : 3 1,650), were used to compare data from other lakes of which slopes were also taken from bathymetric maps.
Early in August we found the depth of maximum submerged macrophyte biomass (MSMB) for each site in Lake Memphre- magog by sampling ‘the biomass along two transects perpendicular to the shore and sampled at this depth 3-5 times between mid-August and mid-September, the period
1074 Duarte and Kalf
of maximum submerged biomass. All plants within a quadrat (0.78 m2) were harvested by SCUBA divers and kept refrigerated for l-2 days until processed. Plant material was washed free of animals and detritus and the fresh weight determined after drying the plants by spinning them for 3 min in a salad spin-dryer.
We measured sediment characteristics from two cores (4-cm i.d.) taken within the quadrats on each sampling date and kept refrigerated until processed (within 24 h). The upper 5-cm stratum was extruded, and, for each core, water content was calculated from the decrease in weight after drying overnight at 110°C. Organic matter was de- termined after oxidizing the sediments overnight at 550°C. Total phosphorus was measured according to Andersen (1976). We measured the Secchi disk depth early in Sep- tember at 30 of the 44 stations as an index of the possible limitation of macrophyte biomass by light.
To allow comparison of our data with those from the literature, we determined the slopes at the sampling sites reported from bathymetric maps, using the slope between the shoreline and the 5- or 10-m depth con- tour, where the MSMB was measured at the time of maximum biomass (August to mid- September for temperate lakes). All litera- ture data were transformed to grams fresh weight per square meter by assuming dry weight to be 10% of fresh weight, and dry weight to have an ash content of 20% and an organic carbon content of 37% (Westlake 1963).
Linear regression was used to model the relationships between variables unless we found an increased precision or a significant improvement in the distribution of resid- uals by using nonlinear models. A stepwise linear regression procedure was used to se- lect the independent variables for each model. Independent variables were, when necessary, transformed (Box and Tidwell 1962) to meet the statistical requirements of linear regression. When the relationship between the dependent and independent variable changed for different values of the independent variable, the data set was split for additional analysis at the midpoint be- tween those two adjacent values of the in-
dependent variable where the following expression was maximal (see Breiman et al. 1984):
RSS = DSS - (DlSS + D2SS)
where RSS is the remaining sum of squares about the mean, DSS the sum of squares about the mean for the entire data set, and Dl SS and D2SS the sum of squares about the means of groups 1 and 2. Linear regres- sions were then determined between the de- pendent and the independent variables for each group and the slopes of the regression compared with a t-test. When the slopes of the two groups were significantly different (P < 0.0 l), the separate equations were used to model the relationship between the vari- ables.
Results The range covered by the variables stud-
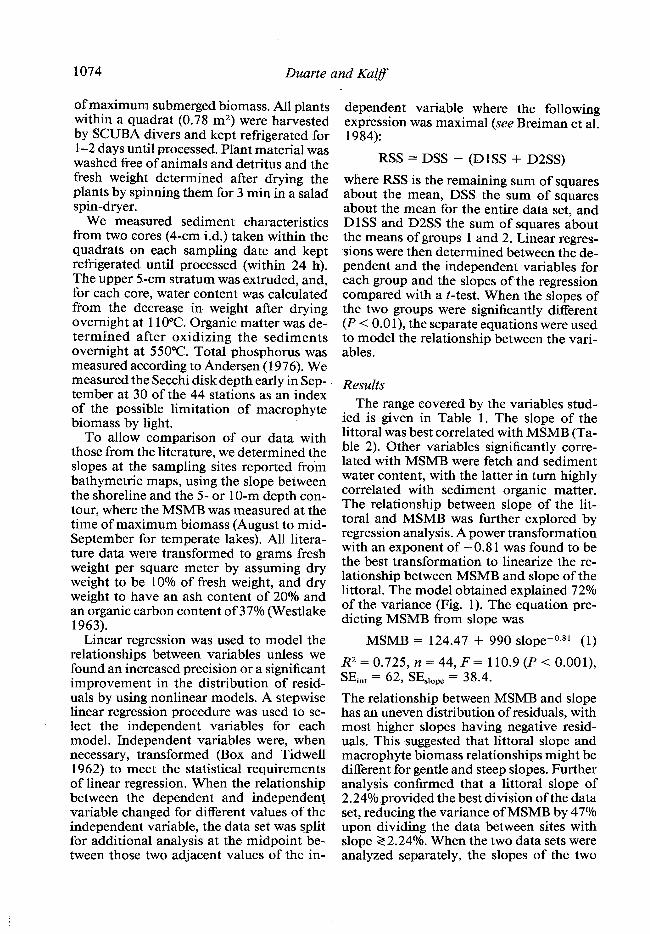
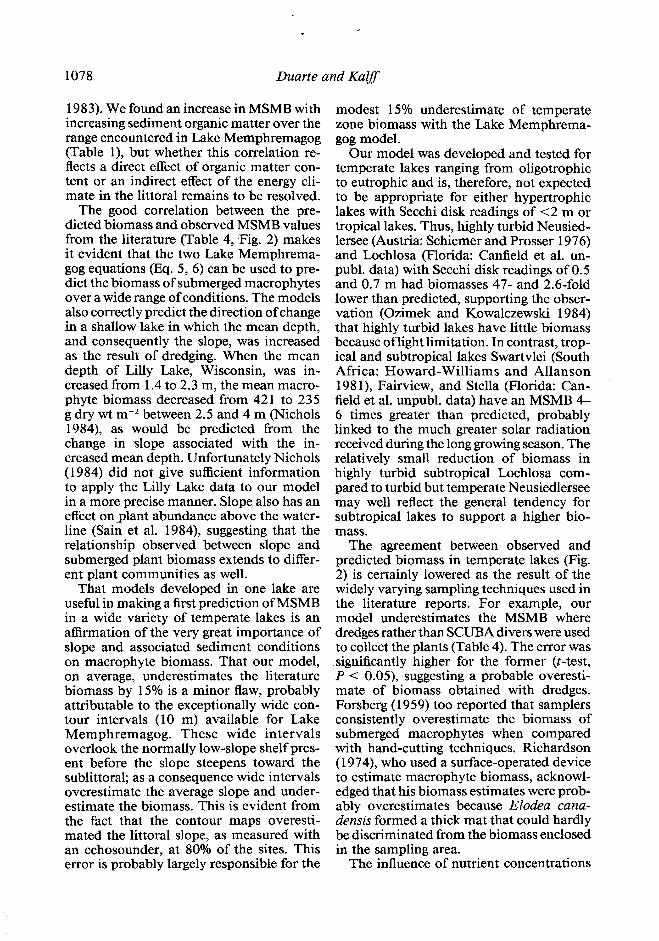
ied is given in Table 1. The slope of the littoral was best correlated with MSMB (Ta- ble 2). Other variables significantly corre- lated with MSMB were fetch and sediment water content, with the latter in turn highly correlated with sediment organic matter. The relationship between slope of the lit- toral and MSMB was further explored by regression analysis. A power transformation with an exponent of -0.8 1 was found to be the best transformation to linearize the re- lationship between MSMB and slope of the littoral. The model obtained explained 72% of the variance (Fig. 1). The equation pre- dicting MSMB from slope was
MSMB = 124.47 + 990 slope-o.81 (1)
Fe.= 0.725, n = 44, F- 110.9 (P < O.OOl), ,nt = 62, SEslope = 38.4.
The relationship between MSMB and slope has an uneven distribution of residuals, with most higher slopes having negative resid- uals, This suggested that littoral slope and macrophyte biomass relationships might be different for gentle and steep slopes. Further analysis confirmed that a littoral slope of 2.24% provided the best division of the data set, reducing the variance of MSMB by 47% upon dividing the data between sites with slope 22.24%. When the two data sets were analyzed separately, the slopes of the two
Submerged macrophyte biomass 1075
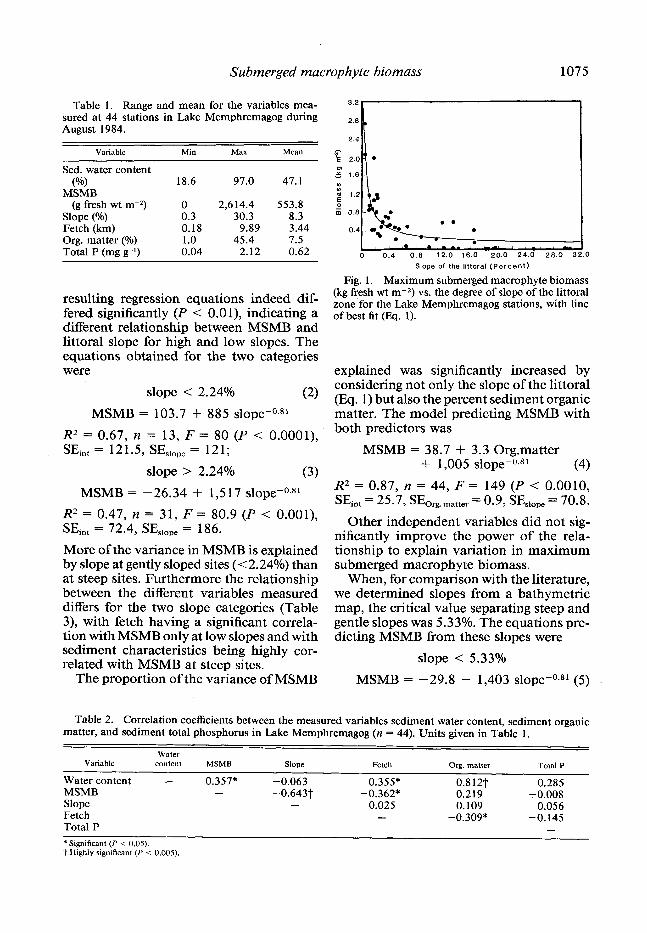
Table 1. Range and mean for the variables mea- sured at 44 stations in Lake Memphremagog during August 1984.
Variable
Sed. water content
Min Max Mean
( w 18.6 97.0 47.1 MSMB
(g fresh wt m-2) 0 2,614.4 553.8 Slope (%) 0.3 30.3 8.3 Fetch (km) 0.18 9.89 3.44 Org. matter (%) 1.0 45.4 7.5 Total P (mg g-l) 0.04 2.12 0.62
il ji)L-.*, , ,_, , _,_ 20.0 24.0 28.0 3
Slope of the littoral (Percent)
0
resulting regression equations indeed dif- fered significantly (P < O.Ol), indicating a different relationship between MSMB and littoral slope for high and low slopes. The equations obtained for the two categories were
Fig. 1. Maximum submerged macrophyte biomass (kg fresh wt m-2) vs. the degree of slope of the littoral zone for the Lake Memphremagog stations, with line of best fit (Eq. 1).
slope < 2.24% (2)
MSMB = 103.7 + 885 slope-0.81 R2 = 0.67, n = 13, F = 80 (P < 0.000 I), S&t = 121.5, SEslopc = 121;
slope > 2.24% (3)
MSMB = -26.34 + 1,517 slope-0.81
explained was significantly increased by considering not only the slope of the littoral (Eq. 1) but also the percent sediment organic matter. The model predicting MSMB with both predictors was
R2 = 0.47, n = 3 1, F = 80.9 (P < O.OOl), SEint = 72.4, SEslope = 186.
More of the variance in MSMB is explained by slope at gently sloped sites (~2.24%) than at steep sites. Furthermore the relationship between the different variables measured differs for the two slope categories (Table 3), with fetch having a significant correla- tion with MSMB only at low slopes and with sediment characteristics being highly cor- related with MSMB at steep sites.
MSMB = 38.7 + 3.3 Org.matter + 1,005 slope-0.8L (4)
R2 = 0.87, n = 44, F = 149 (P < 0.0010, SEint = 25.7, SEOrg.matter = 0.9, SEslope = 70.8.
Other independent variables did not sig- nificantly improve the power of the rela- tionship to explain variation in maximum submerged macrophyte biomass.
When, for comparison with the literature, we determined slopes from a bathymetric map, the critical value separating steep and gentle slopes was 5.33%. The equations pre- dicting MSMB from these slopes were
slope < 5.33%
The proportion of the variance of MSMB MSMB = -29.8 + 1,403 slope-o.81 (5)
Table 2. Correlation coefficients between the measured variables sediment water content, sediment organic matter, and sediment total phosphorus in Lake Memphremagog (n = 44). Units given in Table 1.
Water Variable content
Water content - MSMB Slope Fetch Total P
MSMB
0.357*
Slope
-0.063 -0.643$
-
Fetch
-0.355* -0.362*
0.025 -
Org. matter
0.812? 0.219 0.109
-0.309*
Tolal P
0.285 -0.008
0.056 -0.145
* Significant (P < 0.05). .k Highly significant (P < 0.005).
1076 Duarte and Ka1,9’
L. Swartvlei A’
Ax L. Fairview
Slope of the littoral (Percent)
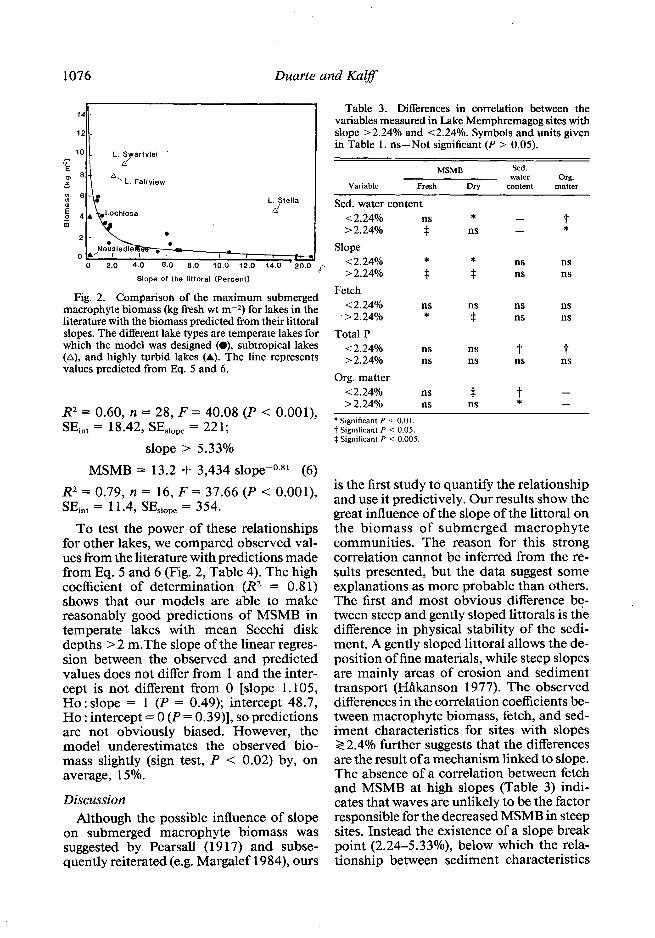
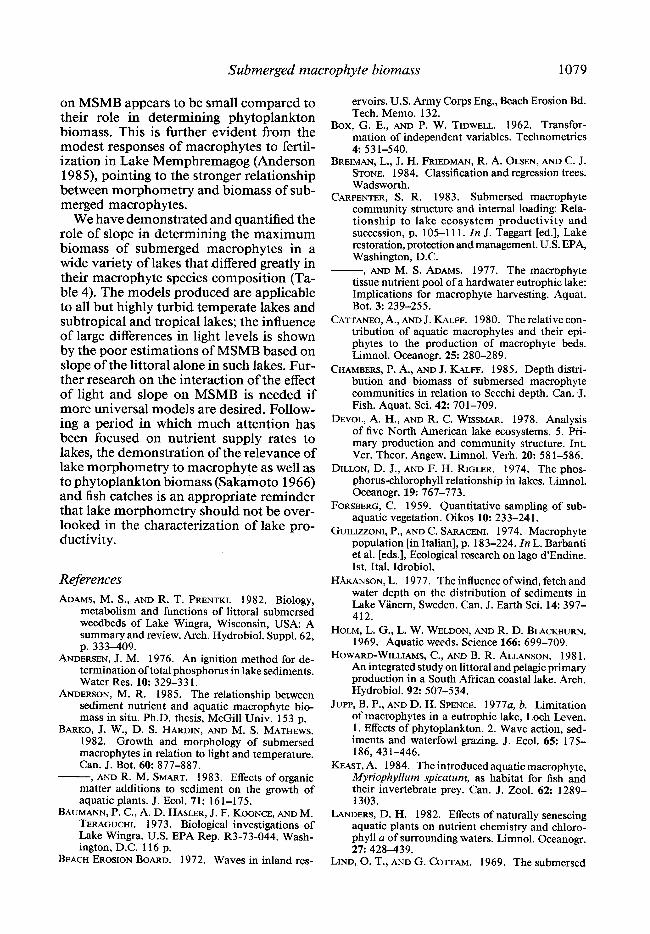
Fig. 2. Comparison of the maximum submerged macrophyte biomass (kg fresh wt m-2) for lakes in the literature with the biomass predicted from their littoral slopes. The different lake types are temperate lakes for which the model was designed (O), subtropical lakes (A), and highly turbid lakes (A). The line represents values predicted from Eq. 5 and 6.
R2 = 0.60, n = 28, F = 40.08 (P < O.OOl), SEi,t = 18.42, SEslope = 22 1;
slope > 5.33%
MSMB = 13.2 + 3,434 slope-o.81 (6)
R2 = 0.79, n = 16, F = 37.66 (P < O.OOl), SEint = 11.4, SEslope = 354.
To test the power of these relationships for other lakes, we compared observed val- ues from the literature with predictions made from Eq. 5 and 6 (Fig. 2, Table 4). The high coefficient of determination (R2 = 0.8 1) shows that our models are able to make reasonably good predictions of MSMB in temperate lakes with mean Secchi disk depths > 2 m.The slope of the linear regres- sion between the observed and predicted values does not differ from 1 and the inter- cept is not different from 0 [slope 1.105, Ho : slope = 1 (P = 0.49); intercept 48.7, Ho : intercept = 0 (P = 0.39)], so predictions are not obviously biased. However, the model underestimates the observed bio- mass slightly (sign test, P -C 0.02) by, on average, 15%.
Discussion Although the possible influence of slope
on submerged macrophyte biomass was suggested by Pearsall (19 17) and subse- quently reiterated (e.g. Margalef 1984), ours
Table 3. Differences in correlation between the variables measured in Lake Memphremagog sites with slop > 2.24% and < 2.24%. Symbols and units given in Table 1. ns-Not significant (P > 0.05).
MSMB Sed. water Org.
Variable Fresh Dry content matter
Sed. water content < 2.24% ns * - > 2.24% * ns - 1
Slope ~2.24% > 2.24% ; ; nn: :“s
Fetch < 2.24% ns ns ns ns
- > 2.24% * * ns ns Total P
~2.24% ns ns t t > 2.24% ns ns ns ns
Org. matter ~2.24% ns * > 2.24% ns ns % - -
* Significant P < 0.01. t Significant P < 0.05. $ Significant P <: 0.005.
is the first study to quantify the relationship and use it predictively. Our results show the great influence of the slope of the littoral on the biomass of submerged macrophyte communities. The reason for this strong correlation cannot be inferred from the re- sults presented, but the data suggest some explanations as more probable than others. The first and most obvious difference be- tween steep and gently sloped littorals is the difference in physical stability of the sedi- ment. A gently sloped littoral allows the de- position of fine materials, while steep slopes are mainly areas of erosion and sediment transport (Hakanson 1977). The observed differences in the correlation coefficients be- tween macrophyte biomass, fetch, and sed- iment characteristics for sites with slopes 22.4% further suggests that the differences are the result of a mechanism linked to slope. The absence of a correlation between fetch and MSMB at high slopes (Table 3) indi- cates that waves are unlikely to be the factor responsible for the decreased MSMB in steep sites. Instead the existence of a slope break point (2.24-5.33%), below which the rela- tionship between sediment characteristics
Submerged macrophyte biomass 1077
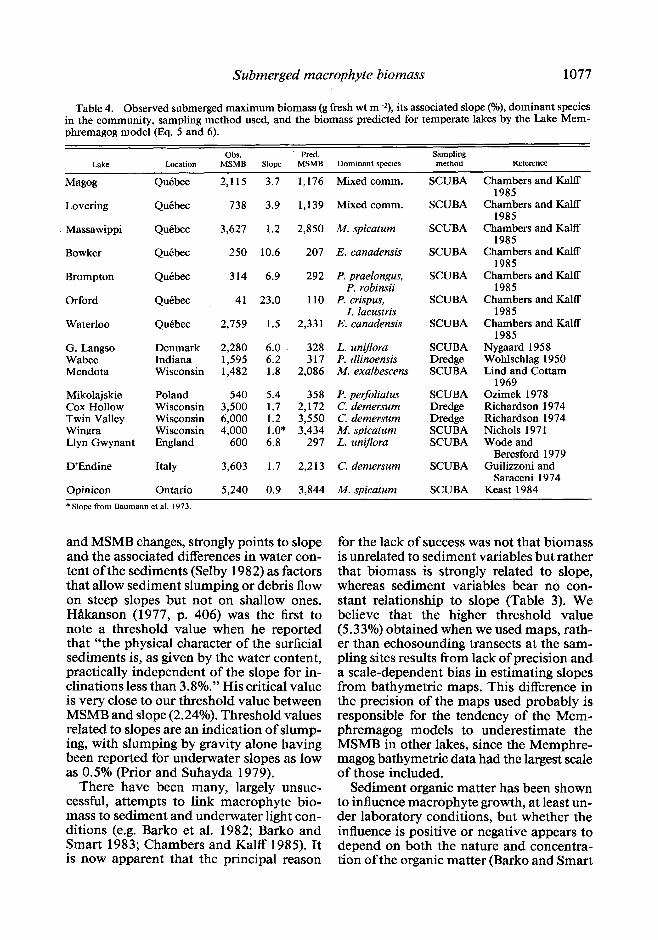
Table 4. Observed submerged maximum biomass (g fresh wt m-2), its associated slope (o/o), dominant species in the community, sampling method used, and the biomass predicted for temperate lakes by the Lake Mem- phremagog model (Eq. 5 and 6).
Obs. . Pred. Sampling Lake Location MSMB Slope MSMB Dominant spccics method Reference
Maws Quebec 2,115 3.7 1,176 Mixed comm. SCUBA Chambers and Kalff 1985
Lovering Quebec 738 3.9 1,139 Mixed comm. SCUBA Chambers and Kalff 1985
Massawippi Quebec 3,627 1.2 2,850 M. spicatum SCUBA Chambers and Kalff 1985
Bowker Quebec 250 10.6 207 E. canadensis SCUBA Chambers and Kalff 1985
Brompton Quebec 314 6.9 292 P. praelongus, SCUBA Chambers and Kalff P. robinsii 1985
Orford Quebec 41 23.0 110 P. crispus, SCUBA Chambers and Kalff I. Iacustris 1985
Waterloo Quebec 2,759 1.5 2,331 E. canadensis SCUBA Chambers and Kalff 1985
G. Langso Denmark 2,280 6.0 328 L. unljlora SCUBA Nygaard 1958 Wabee Indiana 1,595 6.2 317 P. illinoensis Dredge Wohlschlag 1950 Mendota Wisconsin 1,482 1.8 2,086 M. exalbescens SCUBA Lind and Cottam
1969 Mikolajskie Poland 540 5.4 358 P. perfoliatus SCUBA Ozimek 1978 Cox Hollow Wisconsin 3,500 1.7 2,172 C. demersum Dredge Richardson 1974 Twin Valley Wisconsin 6,000 1.2 3,550 C. demersum Dredge Richardson 1974 Wingra Wisconsin 4,000 1.0* 3,434 M. spicatum SCUBA Nichols 197 1 Llyn Gwynant England 600 6.8 297 L. uniflora SCUBA Wode and
Beresford 1979 D’Endine Italy 3,603 1.7 2,213 C. demersum SCUBA Guilizzoni and
Saraceni 1974 Opinicon Ontario 5,240 0.9 3,844 M. spicatum SCUBA Keast 1984 * Slope from Baumann et al. 1973.
and MSMB changes, strongly points to slope for the lack of success was not that biomass and the associated differences in water con- is unrelated to sediment variables but rather tent of the sediments (Selby 1982) as factors that biomass is strongly related to slope, that allow sediment slumping or debris flow whereas sediment variables bear no con- on steep slopes but not on shallow ones. stant relationship to slope (Table 3). We Hakanson (1977, p. 406) was the first to believe that the higher threshold value note a threshold value when he reported (5.33%) obtained when we used maps, rath- that “the physical character of the surficial er than echosounding transects at the sam- sediments is, as given by the water content, pling sites results from lack of precision and practically independent of the slope for in- a scale-dependent bias in estimating slopes clinations less than 3.8%.” His critical value from bathymetric maps. This difference in is very close to our threshold value between the precision of the maps used probably is MSMB and slope (2.24%). Threshold values responsible for the tendency of the Mem- related to slopes are an indication of slump- phremagog models to underestimate the ing, with slumping by gravity alone having MSMB in other lakes, since the Memphre- been reported for underwater slopes as low magog bathymetric data had the largest scale as 0.5% (Prior and Suhayda 1979). of those included.
There have been many, largely unsuc- cessful, attempts to link macrophyte bio- mass to sediment and underwater light con- ditions (e.g. Barko et al. 1982; Barko and Smart 1983; Chambers and Kalff 1985). It is now apparent that the principal reason
Sediment organic matter has been shown to influence macrophyte growth, at least un- der laboratory conditions, but whether the influence is positive or negative appears to depend on both the nature and concentra- tion of the organic matter (Bark0 and Smart
1078 Duarte and Kalfl
1983). We found an increase in MSMB with increasing sediment organic matter over the range encountered in Lake Memphremagog (Table l), but whether this correlation re- flects a direct effect of organic matter con- tent or an indirect effect of the energy cli- mate in the littoral remains to be resolved.
The good correlation between the pre- dicted biomass and observed MSMB values from the literature (Table 4, Fig. 2) makes it evident that the two Lake Memphrema- gog equations (Eq. 5, 6) can be used to pre- dict the biomass of submerged macrophytes over a wide range of conditions. The models also correctly predict the direction of change in a shallow lake in which the mean depth, and consequently the slope, was increased as the result of dredging. When the mean depth of Lilly Lake, Wisconsin, was in- creased from 1.4 to 2.3 m, the mean macro- phyte biomass decreased from 42 1 to 235 g dry w-t mm2 between 2.5 and 4 m (Nichols 1984) as would be predicted from the change in slope associated with the in- creased mean depth. Unfortunately Nichols (1984) did not give sufficient information to apply the Lilly Lake data to our model in a more precise manner. Slope also has an effect on plant abundance above the water- line (Sain et al. 1984), suggesting that the relationship observed between slope and submerged plant biomass extends to differ- ent plant communities as well.
That models developed in one lake are useful in making a first prediction of MSMB in a wide variety of temperate lakes is an affirmation of the very great importance of slope and associated sediment conditions on macrophyte biomass. That our model, on average, underestimates the literature biomass by 15% is a minor flaw, probably attributable to the exceptionally wide con- tour intervals (10 m) available for Lake Memphremagog. These wide intervals overlook the normally low-slope shelf pres- ent before the slope steepens toward the sublittoral; as a consequence wide intervals overestimate the average slope and under- estimate the biomass. This is evident from the fact that the contour maps overesti- mated the littoral slope, as measured with an echosounder, at 80% of the sites. This error is probably largely responsible for the
modest 15% underestimate of temperate zone biomass with the Lake Memphrema- gog model.
Our model was developed and tested for temperate lakes ranging from oligotrophic to eutrophic and is, therefore, not expected to be appropriate for either hypertrophic lakes with Secchi disk readings of <2 m or tropical lakes. Thus, highly turbid Neusied- lersee (Austria: Schiemer and Prosser 1976) and Lochlosa (Florida: Canfield et al. un- publ. data) with Secchi disk readings of 0.5 and 0.7 m had biomasses 47- and 2.6-fold lower than predicted, supporting the obser- vation (Ozimek and Kowalczewski 1984) that highly turbid lakes have little biomass because of light limitation. In contrast, trop- ical and subtropical lakes Swartvlei (South Africa: Howard-Williams and Allanson 198 l), Fairview, and Stella (Florida: Can- field et al. unpubl. data) have an MSMB 4- 6 times greater than predicted, probably linked to the much greater solar radiation received during the long growing season. The relatively small reduction of biomass in highly turbid subtropical Lochlosa com- pared to turbid but temperate Neusiedlersee may well reflect the general tendency for subtropical lakes to support a higher bio- mass.
The agreement between observed and predicted biomass in temperate lakes (Fig. 2) is certainly lowered as the result of the widely varying sampling techniques used in the literature reports. For example, our model underestimates the MSMB where dredges rather than SCUBA divers were used to collect the plants (Table 4). The error was significantly higher for the former (t-test, P < 0.05), suggesting a probable overesti- mate of biomass obtained with dredges. Forsberg (1959) too reported that samplers consistently overestimate the biomass of submerged macrophytes when compared with hand-cutting techniques. Richardson (1974), who used a surface-operated device to estimate macrophyte biomass, acknowl- edged that his biomass estimates were prob- ably overestimates because Elodea cana- densis formed a thick mat that could hardly be discriminated from the biomass enclosed in the sampling area.
The influence of nutrient concentrations
Submerged macrophyte biomass 1079
on MSMB appears to be small compared to their role in determining phytoplankton biomass. This is further evident from the modest responses of macrophytes to fertil- ization in Lake Memphremagog (Anderson 1985), pointing to the stronger relationship between morphometry and biomass of sub- merged macrophytes.
ervoirs. U.S. Army Corps Eng., Beach Erosion Bd. Tech. Memo. 132.
BOX, G. E., AND P. W. TIDWELL. 1962. Transfor- mation of independent variables. Technometrics 4: 53 l-540.
We have demonstrated and quantified the role of slope in determining the maximum biomass of submerged macrophytes in a wide variety of lakes that differed greatly in their macrophyte species composition (Ta- ble 4). The models produced are applicable to all but highly turbid temperate lakes and subtropical and tropical lakes; the influence of large differences in light levels is shown by the poor estimations of MSMB based on slope of the littoral alone in such lakes. Fur- ther research on the interaction of the effect of light and slope on MSMB is needed if more universal models are desired. Follow- ing a period in which much attention has been focused on nutrient supply rates to lakes, the demonstration of the relevance of lake morphometry to macrophyte as well as to phytoplankton biomass (Sakamoto 1966) and fish catches is an appropriate reminder that lake morphometry should not be over- looked in the characterization of lake pro- ductivity.
BREIMAN, L., J. H. FRIEDMAN, R. A. OLSEN, AND C. J. STONE. 1984. Classification and regression trees. Wadsworth.
CARPENTER, S. R. 1983. Submersed macrophyte community structure and internal loading: Rela- tionship to lake ecosystem productivity and succession, p. 105-l 11. In J. Taggart [ed.], Lake restoration, protection and management. U.S. EPA, Washington, D.C.
-, AND M. S. ADAMS. 1977. The macrophyte tissue nutrient pool of a hardwater eutrophic lake: Implications for macrophyte harvesting. Aquat. Bot. 3: 239-255.
CATTANEO, A., AND J. KALFF. 1980. The relative con- tribution of aquatic macrophytes and their epi- phytes to the production of macrophyte beds. Limnol. Oceanogr. 25: 280-289.
CHAMBERS, P. A., AND J. KALFF. 1985. Depth distri- bution and biomass of submersed macrophyte communities in relation to Secchi depth. Can. J. Fish. Aquat. Sci. 42: 701-709.
DEVOL, A. H., AND R. C. WISSMAR. 1978. Analysis of five North American lake ecosystems. 5. Pri- mary production and community structure. Int. Ver. Theor. Angew. Limnol. Verh. 20: 581-586.
DILLON, D. J., AND F. H. RIGLER. 1974. The phos- phorus-chlorophyll relationship in lakes. Limnol. Oceanogr. 19: 767-773.
References ADAMS, M. S., AND R. T. PRENTKI. 1982. Biology,
metabolism and functions of littoral submersed weedbeds of Lake Wingra, Wisconsin, USA: A summary and review. Arch. Hydrobiol. Suppl. 62, p. 333-409.
FORSBERG, C. 1959. Quantitative sampling of sub- aquatic vegetation. Oikos 10: 233-24 1.
GUILIZZONI, P., AND C. SARACENI. 1974. Macrophyte population [in Italian], p. 183-224. In L. Barbanti et al. [eds.], Ecological research on lago d’Endine. 1st. Ital. Idrobiol.
H%J(ANsoN, L. 1977. The influence of wind, fetch and water depth on the distribution of sediments in Lake Vanem, Sweden. Can. J. Earth Sci. 14: 397- 412.
ANDERSEN, J. M. 1976. An ignition method for de- termination of total phosphorus in lake sediments. Water Res. 10: 329-33 1.
ANDERSON, M. R. 1985. The relationship between sediment nutrient and aquatic macrophyte bio- mass in situ. Ph.D. thesis, McGill Univ. 153 p.
BARKO, J. W., D. S. HARDIN, AND M. S. MATHEWS. 1982. Growth and morphology of submersed macrophytes in relation to light and temperature. Can. J. Bot. 60: 877-887.
HOLM, L. G., L. W. WELDON, AND R. D. BLACKBURN. 1969. Aquatic weeds. Science 166: 699-709.
HOWARD-WILLIAMS, C., AND B. R. ALLANSON. 1981. An integrated study on littoral and pelagic primary production in a South African coastal lake. Arch. Hydrobiol. 92: 507-534.
JUPP, B. P., AND D. H. SPENCE. 1977a, b. Limitation of macrophytes in a eutrophic lake, Loch Leven. 1. Effects of phytoplankton. 2. Wave action, sed- iments and waterfowl grazing. J. Ecol. 65: 175- 186,43 l-446.
- AND R. M. SMART. 1983. Effects of organic matter additions to sediment on the growth of aquatic plants. J. Ecol. 71: 161-175.
BAUMANN, P. C., A. D. HASLER, J. F. KOONCE, AND M. TERAGUCHI. 1973. Biological investigations of Lake Wingra. U.S. EPA Rep. R3-73-044. Wash- ington, D.C. 116 p.
KEAST, A. 1984. The introduced aquatic macrophyte, Myriophyhm spicutum, as habitat for fish and their invertebrate prey. Can. J. Zool. 62: 1289- 1303.
LANDERS, D. H. 1982. Effects of naturally senescing aquatic plants on nutrient chemistry and chloro- phyll a of surrounding waters. Limnol. Oceanogr, 27: 428-439.
BEACH EROSION BOARD. 1972. Waves in inland res- LIND, 0. T., AND G. COTTAM. 1969. The submersed
. -
1080 Duarte and Kalf
aquatics of University Bay: A study in eutrophi- cation. Am. Midl. Nat. 81: 353-369.
MARGALEF, R. 1984. Limnologia. Omega. NICHOLS, S. A. 197 1. The distribution and control of
macrophyte biomass in Lake Wingra. Ph.D. the- sis, Univ. Wisconsin, Madison. 111 p.
- 1984. Macrophyte community dynamics in a dredged Wisconsin lake. Water Res. Bull. 20: 573-576.
NYGAARD, G. 1958. On the productivity of the bot- tom vegetation in Lake Grane Langs. Int. Ver. Theor. Angew. Limnol. Verh. 13: 144-156.
ORLOCI, L. 1975. Multivariate analysis in vegetation research. Junk.
OZIMEK, T. 1978. Effect of municipal sewage on the submerged macrophytes of a lake littoral. Ekol. Pol. 26: 3-39.
-, AND A. KOWALCZEWSKI. 1984. Long term changes in the submerged macrophytes in eutro- phic Lake Mikolajskie (North Poland). Aquat. Bot. 19: l-l 1.
PACE, M. 1984. Zooplankton community structure, but not biomass influences the phosphorus-chlo- rophyll a relationship. Can. J. Fish. Aquat. Sci. 41: 1089-1096.
PEARSALL, W. H. 19 17. The aquatic and marsh vege- tation of Esthwaite Water. J. Ecol. 5: 180-20 1.
PRIOR, D. B., AND J. N. SUHAYDA. 1979. Application of infinite slope analysis to subaqueous sediment instability, Mississippi Delta. Eng. Geol. 14: l-10.
RICHARDSON, F. B. 1974. Environmental analysis of the Kickapoo River impoundment. Center for Biotic Systems, Inst. Environ. Stud. IES Rep. 28. Madison, Wis.
SAIN, R. S., W. J. FONFEREK, M. S. SIMPSON, AND K. W. WHITTINGHILL. 1984. First-year vegetation following exposure of the Edmonson lake bed,
Erratum
Washington county, Virginia. Castanea 49: 158- 166.
SAKAMOTO, M. 1966. Primary production in some Japanese lakes and its dependence on depth. Arch. Hydrobiol. 62: l-28.
SAS INSTITUTE, INC. 1982. SAS user’s guide: Statis- tics.
SCHIEMER, F., AND M. PROSSER. 1976. Distribution and biomass of submerged macrophytes in Neu- siedlersee. Aquat. Bot. 2: 3-39.
SCHLOTT, V. G., AND G. MALICKY. 1984. Biomasse und Phosphorgehalt der Makrophyten in der NO- Bucht das Lunzer Untersees (Austria) in Abhan- gigkeit von nahrstoffreichen Zuflussen und vom Sediment. Arch. Hydrobiol. 101: 265-277.
SELBY, M. J. 1982. Hillslope materials and processes. Oxford.
VOLLENWEIDER, R. A. 1968. Water management re- search. OECD Paris. DASICSY68.27.
WESTLAKE, D. F. 1963. Comparisons of plant pro- ductivity. Biol. Rev. 38: 385-425.
WILEY, J. M., R. W. GORDEN, S. W. WAITE, AND T. POWLESS. 1984. The relationship between aquat- ic macrophytes and fish production in Illinois ponds: A simple model. N. Am. J. Fish. Manag. 4: 11-119.
WODE, P. M., AND J. E. BERESFORD. 1979. The aquat- ic flora of a Snowdonia lake: Llyn Gwynant, p. 87-97. In Progress in underwater science, v. 5. Pentech.
WOHLSCHLAG, D. E. 1950. Vegetation and inverte- brate life in a marl lake. Ind. Stud. Lakes Streams 3: 321-372.
Submitted: 20 May 1985 Accepted: 4 April 1986
In the paper by R. H. Spigel et al. in the May issue (Vol. 3 1, No. 3), the first term inside the square brackets on the right-hand side of Eq. 33 (p. 546) should be
dh A&x.