Rapid Amygdala Responses during Trace Fear Conditioning without Awareness
Upload
independentCategory
view
4download
0
Lipopolysaccharide induces delayed FosB/DeltaFosBimmunostaining within the mouse extended amygdala,hippocampus and hypothalamus, that parallel the expression ofdepressive-like behavior
François Frenois1, Maïté Moreau2, Jason O’ Connor1, Marc Lawson1, Charlotte Micon2,Jacques Lestage2, Keith W. Kelley1, Robert Dantzer1,*, and Nathalie Castanon2
1 Integrative Immunology and Behavior Program, University of Illinois at Urbana-Champaign, 212 EdwardR. Madigan Laboratory, 1201 West Gregory Drive, Urbana, IL 61801, USA
2 INRA UMR 1244 – CNRS FRE 2723 “Neurobiologie Intégrative”, INSERM Institut François Magendie,146 rue Léo Saignat, 33077 Bordeaux cedex France
AbstractProinflammatory cytokines induce both sickness behavior and depression, but their respectiveneurobiological correlates are still poorly understood. The aim of the present study was therefore toidentify in mice the neural substrates of sickness and depressive-like behavior induced bylipopolysaccharide (LPS, 830 μg/kg, intraperitoneal). LPS-induced depressive-like behavior wasdissociated from LPS-induced sickness by testing mice either at 6 h (at which time sickness wasexpected to be maximal) or at 24 h post-LPS (at which time sickness was expected to be minimaland not to bias the measurement of depressive-like behavior). Concurrently, the expression of acuteand chronic cellular reactivity markers (c-Fos and FosB/ΔFosB respectively) was mapped byimmunohistochemistry at these two time points. In comparison to saline, LPS decreased motoractivity in a new cage at 6 but not at 24 h. In contrast, the duration of immobility in the tail suspensiontest was increased at both 6 and 24 h. This dissociation between decreased motor activity anddepressive-like behavior was confirmed at 24 h post-LPS in the forced swim test. LPS also decreasedsucrose consumption at 24 and 48 h, despite normal food and water consumption by that time. At 24h post-LPS, LPS-induced depressive-like behavior was associated with a delayed cellular activity(as assessed by FosB/ΔFosB immunostaining) in specific brain structures, particularly within theextended amygdala, hippocampus and hypothalamus, whereas c-Fos labeling was markedlydecreased by that time in all the brain areas at 6 h post-LPS. These results provide the first evidencein favor of a functional dissociation between the brain structures that underlie cytokine-inducedsickness behavior and cytokine-induced depressive-like behavior, and provide important cues aboutthe neuroanatomical brain circuits through which cytokines could have an impact on affect.
Corresponding Author Robert Dantzer, D.V.M., Ph.D, University of Illinois at Urbana-Champaign, Integrative Immunology andBehavior Program, 212 ERML, 1201 W Gregory Drive, Urbana, Illinois 61801, Phone 217-244-4075, Fax 217-244-5617, [email protected].*Corresponding author. FF and MM contributed equally to the work.Publisher's Disclaimer: This is a PDF file of an unedited manuscript that has been accepted for publication. As a service to our customerswe are providing this early version of the manuscript. The manuscript will undergo copyediting, typesetting, and review of the resultingproof before it is published in its final citable form. Please note that during the production process errors may be discovered which couldaffect the content, and all legal disclaimers that apply to the journal pertain.
NIH Public AccessAuthor ManuscriptPsychoneuroendocrinology. Author manuscript; available in PMC 2007 September 18.
Published in final edited form as:Psychoneuroendocrinology. 2007 June ; 32(5): 516–531.
NIH
-PA Author Manuscript
NIH
-PA Author Manuscript
NIH
-PA Author Manuscript

KeywordsSickness behavior; depression; tail suspension test; forced swim test; functional neuroanatomy; c-Fos; FosB/ΔFosB; mapping; lipopolysaccharide; cytokines; extended amygdala; hippocampus,mouse
INTRODUCTIONSeveral features of cytokines-induced sickness behavior overlap with the clinical symptomsof depression (for reviews: Dantzer et al., 1999; Yirmiya, 2000; Leonard, 2001; Castanon etal., 2002; Matthews et al., 2004). These points of convergence include mood and cognitivealterations, behavioral changes such as decreased motor activity, attenuated sensitivity toreward and reduced food intake, alterations in brain monoaminergic neurotransmission(Hirschfeld, 2000) and activation of the hypothalamic-pituitary-adrenal axis (Checkley,1996). However, there is only partial overlap between cytokine-induced sickness behavior anddepression as revealed by longitudinal clinical studies on patients treated by cytokineimmunotherapy and showing a chronic activation of the immune system. Whereas all patientsresponded to first injections of cytokine immunotherapy by sickness symptoms, only one thirdof them developed major depressive episodes after a few days or several weeks of treatmentdepending on the cytokines (Capuron et al., 2000; Capuron et al., 2001). Furthermore,pretreatment with the selective serotonin reuptake inhibitor paroxetine had no effect onneurovegetative symptoms such as fatigue and anorexia experienced by patients receivingcytokine immunotherapy (Capuron et al., 2002a) whereas it prevented the occurrence ofanhedonia and depressed mood. Taken together, these data indicate that there is a functionaldissociation between cytokine-induced sickness behavior and depression.
The mechanisms of the behavioral action of cytokines are usually studied in animals injectedwith the cytokine inducer lipopolysaccharide (LPS) or with recombinant proinflammatorycytokines (Dantzer, 2001; Konsman et al., 2002). Attempts to assess the neurobiological basesof cytokine-induced depression in animal models have concentrated on LPS or cytokine-induced anhedonia, as assessed by decreased preference for sucrose (De La Garza, 2005),reduced response to rewarding brain stimulation (Anisman et al., 2002) and attenuation ofcocaine-induced place preference (Suzuki et al., 1994). Proinflammatory cytokines have alsobeen shown to be able to increase the duration of immobility in the forced swim test (Makinoet al., 2000; Yamano et al., 2000; Dunn & Swiergiel, 2005). However, the depressive-likebehavior induced by administration of LPS or specific cytokines is confounded in most of theseexperiments by the profound reduction in motor activity that occurs during the hours followingtreatment. Based on the clinical evidence showing that depression develops later than sicknessin cytokine-treated patients, we decided in the present experiment to assess depressive-likebehavior induced by cytokines at a time at which animals had recovered from LPS-induceddepression of motor activity. Based on our previous extensive studies on LPS-induced sicknessbehavior (Dantzer, 2001), we hypothesized that sickness should be maximal at 6 h post-LPSand minimal at 24 h post-LPS whereas LPS-induced depressive-like behavior should still beapparent at 24 h post-LPS. We tested this hypothesis by submitting mice to well-accepted testsof depressive-like behavior including the tail suspension test, the forced swim test and thesucrose consumption test (Cryan et al., 2002, 2005). At the neuroanatomical level, activationof the peripheral innate immune system has already been shown to induce the expression of c-Fos in a rapid and transient manner in a number of brain areas that have been proposed tounderlie the different behavioral and metabolic components of cytokine-induced sicknessbehavior (e.g., Hansen et al., 2000a; Konsman et al., 2000). To determine the neuroanatomicalsubstrates of LPS-induced depressive-like behavior, we decided to map the brain distributionof Delta FosB in addition to c-Fos since this truncated splice variant of FosB is characterized
Frenois et al. Page 2
Psychoneuroendocrinology. Author manuscript; available in PMC 2007 September 18.
NIH
-PA Author Manuscript
NIH
-PA Author Manuscript
NIH
-PA Author Manuscript

by a long half-life leading to its accumulation during repeated or long lasting stimulation(Nestler et al., 2001). Our results show a partial dissociation in the neural correlates of LPS-induced sickness behavior and depressive-like behavior.
MATERIALS AND METHODSAnimals and treatments
All experiments were performed on 8-weeks old male CD1 Crl:CD-1 (ICR) mice obtainedfrom Charles River or from a colony raised in the laboratory and weighing 35–40 g at thebeginning of the experiments. Animals were randomly assigned to treatments, housedindividually in polypropylene cages (24 × 14 × 13 cm), and maintained under standard colonyconditions on corn cob litter, in a thermoregulated (23 ± 1°C) and humidity (40%) controlledroom on a 12:12 hours light/dark cycle (light on from 7.00 AM to 7.00 PM). Food and waterwere available ad libitum. Mice were handled individually everyday for 10 days before theexperiments. All surgical and experimental procedures were performed in accordance with theNational Institute of Health (NIH) guidelines, and with the European Communities CouncilDirective of 24 November 1986 (86/609/EEC) and were approved by the Institutional AnimalCare and Use Committees.
LPS was phenol-extracted from Escherichia coli (serotype 0127:B8; RBI/Sigma). On the testday, it was dissolved in sterile endotoxin-free isotonic saline (for LPS) and administeredintraperitoneally (i.p.). The dose of LPS (830 μg/kg) was selected on the basis of its ability toinduce the full spectrum of sickness (Mormede et al., 2004) and a reliably increase of brainindoleamine 2,3 dioxygenase (IDO) activity, a putative mechanism in the depressive-likebehavior induced by LPS (Lestage et al., 2002).
Behavioral experimentsAll behavioral experiments were performed during the illuminated part of the cycle (between9:00 and 12:00 AM), under conditions of dim light and low noise. Behavior was monitoredvia a video camera and videotaped to be scored later by a trained observer blind to drugtreatments, using the “Observer Basic” software (Noldus, Netherlands). Behavioral data (mean± SEM) were analyzed using a two-way (treatment × time) ANOVA with repeatedmeasurement on the time factor, followed by a post-hoc pair wise multiple comparisonprocedure using the Bonferroni method if the interaction treatment × time was significant.
Motor activity—The effects of LPS on motor activity were assessed in mice individuallyplaced into either a clean cage similar to the home cage but devoid of bedding litter (tailsuspension experiment) or in a larger polypropylene cage (30 × 11 × 12 cm) divided into twocommunicating compartments that were separated by a plexiglas wall containing a smallopening (2.5 × 3 cm) (forced swim experiment). In the first case, the cage was divided intofour virtual quadrants and motor activity was measured by counting the number of linecrossings and rearings over a five-min period. In the second case, activity was evaluated bycounting the number of between-compartments crossings performed by each mouse over aperiod of 6 minutes and the number of rearings. In both cases, the cage was cleaned thoroughlybetween each test.
Tail suspension test—The tail suspension test (TST) was conducted in a similar manneras described by Steru et al. (Steru et al., 1985). The mice were taken from their home cage anda small piece of adhesive tape was placed approximately two cm from the tip of the tail. Asingle hole was punched in the tape and the mice were hung individually for a period of sixmin on a hook connected to a strain gauge. A computerized system for processing the forceexerted on the gauge (Mouse Tail Suspension Package, MED-TSS-MS, Med Associates, St.
Frenois et al. Page 3
Psychoneuroendocrinology. Author manuscript; available in PMC 2007 September 18.
NIH
-PA Author Manuscript
NIH
-PA Author Manuscript
NIH
-PA Author Manuscript
Albans, VT) allowed to automatically collect and analyze the movements of each individualmouse. The time of immobility was determined after establishing an upper threshold level foreach individual mouse that was set precisely at the activity level that would exclude allmovements and only encompass immobility. Time below this threshold indicated the time ofimmobility.
For the purpose of the present experiment, mice received an i.p. injection of either saline (n=12)or LPS (830 μg/kg, n=12) and were immediately returned to their home cage. At 6 or 24 h post-treatment, mice were submitted to the measure of motor activity, returned immediately to theirhome cage, and tested in the tail suspension test apparatus less than five minutes after. The 6and 24 h time points were studied at exactly the same time of the light cycle.
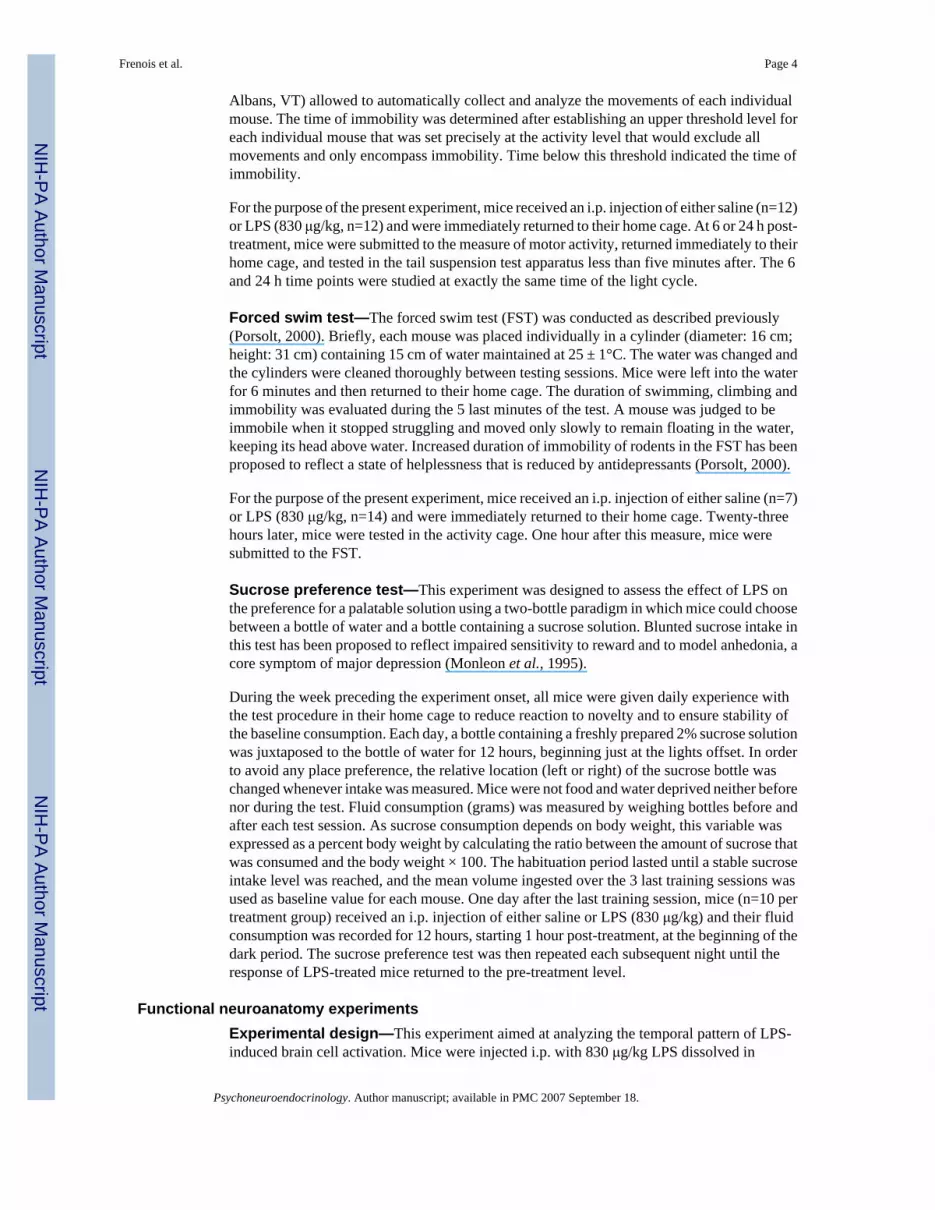
Forced swim test—The forced swim test (FST) was conducted as described previously(Porsolt, 2000). Briefly, each mouse was placed individually in a cylinder (diameter: 16 cm;height: 31 cm) containing 15 cm of water maintained at 25 ± 1°C. The water was changed andthe cylinders were cleaned thoroughly between testing sessions. Mice were left into the waterfor 6 minutes and then returned to their home cage. The duration of swimming, climbing andimmobility was evaluated during the 5 last minutes of the test. A mouse was judged to beimmobile when it stopped struggling and moved only slowly to remain floating in the water,keeping its head above water. Increased duration of immobility of rodents in the FST has beenproposed to reflect a state of helplessness that is reduced by antidepressants (Porsolt, 2000).
For the purpose of the present experiment, mice received an i.p. injection of either saline (n=7)or LPS (830 μg/kg, n=14) and were immediately returned to their home cage. Twenty-threehours later, mice were tested in the activity cage. One hour after this measure, mice weresubmitted to the FST.
Sucrose preference test—This experiment was designed to assess the effect of LPS onthe preference for a palatable solution using a two-bottle paradigm in which mice could choosebetween a bottle of water and a bottle containing a sucrose solution. Blunted sucrose intake inthis test has been proposed to reflect impaired sensitivity to reward and to model anhedonia, acore symptom of major depression (Monleon et al., 1995).
During the week preceding the experiment onset, all mice were given daily experience withthe test procedure in their home cage to reduce reaction to novelty and to ensure stability ofthe baseline consumption. Each day, a bottle containing a freshly prepared 2% sucrose solutionwas juxtaposed to the bottle of water for 12 hours, beginning just at the lights offset. In orderto avoid any place preference, the relative location (left or right) of the sucrose bottle waschanged whenever intake was measured. Mice were not food and water deprived neither beforenor during the test. Fluid consumption (grams) was measured by weighing bottles before andafter each test session. As sucrose consumption depends on body weight, this variable wasexpressed as a percent body weight by calculating the ratio between the amount of sucrose thatwas consumed and the body weight × 100. The habituation period lasted until a stable sucroseintake level was reached, and the mean volume ingested over the 3 last training sessions wasused as baseline value for each mouse. One day after the last training session, mice (n=10 pertreatment group) received an i.p. injection of either saline or LPS (830 μg/kg) and their fluidconsumption was recorded for 12 hours, starting 1 hour post-treatment, at the beginning of thedark period. The sucrose preference test was then repeated each subsequent night until theresponse of LPS-treated mice returned to the pre-treatment level.
Functional neuroanatomy experimentsExperimental design—This experiment aimed at analyzing the temporal pattern of LPS-induced brain cell activation. Mice were injected i.p. with 830 μg/kg LPS dissolved in
Frenois et al. Page 4
Psychoneuroendocrinology. Author manuscript; available in PMC 2007 September 18.
NIH
-PA Author Manuscript
NIH
-PA Author Manuscript
NIH
-PA Author Manuscript

endotoxin-free isotonic saline or with endotoxin-free isotonic saline as control. Mice were thensacrified 6 and 24 hours later (n = 6 for each treatment group).
Choice of markers of cellular reactivity—Immunohistochemistry was used to measurethe expression of c-Fos (revealed by antiserum SC52, Santa Cruz Biotechnology, California,USA) as a marker of acute cellular reactivity, and the expression of FosB/ΔFosB (revealed byantiserum SC48, Santa Cruz Biotechnology, California, USA) as a marker of chronic cellularreactivity (see discussion below for more details about these markers). The SC52 antiserumwas raised in rabbits against a synthetic peptide corresponding to amino acids 3–16 at the N-terminal of human and mouse c-Fos which does not cross-react with FosB according to themanufacturer’s Western blot analysis. The SC48 antiserum was raised against a syntheticpeptide mapping with an internal N-terminal region of mouse FosB which does not cross-reactwith c-Fos according to the manufacturer’s Western blot analysis. In addition, since thetruncated form ΔFosB lacks part of the FosB C-terminal (101 amino acid at the C-terminalregion), but is identical to FosB at the N-terminal (Dobrazanski et al., 1991), the SC48antiserum detects both full-length FosB and ΔFosB (Perrotti et al., 2004).
Tissue preparation—All immunohistochemistry experiments for the study of theexpression of c-Fos and FosB/ΔFosB were carried out on tissue fixed with 4%paraformaldehyde (PFA). Immediately after a mild CO2 asphyxia, mice were sacrificed atvarious time points after treatment by intracardiac perfusion via the ascending aorta of sodiumchloride (NaCl 9‰) at 4°C during 5 minutes followed by 100 ml of a 4% PFA solution at 4°C prepared in a 0.2 M phosphate buffer (pH=7.2). Brains were then dissected out and postfixedovernight in 4% PFA at 4°C. Brains were then placed for at least 2 hours in a cryoprotectantsolution of 0.01 M phosphate buffer saline (PBS, pH=7.2) containing 20% sucrose, beforebeing frozen into vapors of liquid nitrogen and preserved at −80°C. Free-floating serial coronalcryostat sections (30 μm) were then collected and preserved in 0.01 M PBS at pH=7.2containing 0.03% sodium azide at 4°C until use.
Immunohistochemistry experiments—For immunohistochemistry, sections were rinsedin 0.01 M PBS at pH=7.2 for 10 min, then placed in 0.01 M PBS at pH=7.2 containing 1%H2O2 in order to inactivate endogenous peroxidases. After rinsing (0.01 M PBS at pH=7.2, 2× 5 min), sections were preincubated in 0.01 M PBS at pH=7.2/1.5% Triton X100/3% normaldonkey serum under agitation for 1 hour at room temperature. Sections were then incubatedovernight at room temperature under agitation with the anti-c-Fos or the anti-FosB/ΔFosBprimary antibody diluted 1/1000 in 0.01 M PBS at pH=7.2/0.3% Triton X100/0.03% sodiumazide. The following day, sections were rinsed (0.01 M PBS, pH=7.2, 3 × 10 min) and incubatedunder agitation during 2 hours at room temperature with a biotinylated donkey anti-rabbitsecondary antibody (Amersham Biosciences, Freiburg, Germany) diluted 1/200 in PBS 0.01MpH=7.2. Sections were rinsed in 0.01 MPBS pH=7.2, 3 × 10 min then incubated 90 min underagitation at room temperature in the ABC complex (Vector Laboratories, Peterborough, UK)diluted 1/200 in 0.01 M PBS at pH=7.2. After rinsing (PBS 0.01 M, pH=7.2, 2 × 10 min),sections were put into TBS 1X (pH=7.6; 3 × 5 min), before being revealed by diaminobenzidinediluted 1/20 in 1X TBS, pH=7.6, in the presence of 60 μl H 2O2 (which catalyses the reaction).Sections were then rinsed into 1X TBS, pH=7.6 (2 × 5 min) and into distilled water (2 × 5min), then spread out over slides, air dried then and mounted in DePeX.
Data analysis—The anatomical levels and the brain structures of interest are presented inFigure 1 (Paxinos & Franklin, 2001). In a first step, c-Fos and FosB/ΔFosB labeling was semi-quantitatively analyzed by optical microscopy using a Nikon Eclipse E400 microscope andclassified according to the number (n) of positive nuclei within a given structure: 0, no labeling;+/−, very few labeling, n < 5; +, few labeling, 5 < n < 25; ++, intense labeling, 25 < n < 50; +
Frenois et al. Page 5
Psychoneuroendocrinology. Author manuscript; available in PMC 2007 September 18.
NIH
-PA Author Manuscript
NIH
-PA Author Manuscript
NIH
-PA Author Manuscript

++, very intense labeling, 50 < n < 85; ++++, extremely intense labeling, n > 85. In a secondstep, quantitative measurements for the expression of the proteins c-Fos and FosB/ΔFosB werecarried out within specific areas of interest. For this, immunostained sections were examinedwith a light microscope (Nikon Eclipse E400) and for each area of interest, RGB images werecaptured and digitized by a high-resolution CCD video camera system (Nikon DXM1200).Adobe Photoshop CS (Adobe Systems Incorporated, CA, USA) was then used to adjustcontrast, brightness and to reduce image size into 800 × 640 pixels with a resolution of 300pixels per inch; RGB images were then converted into 8-bit grayscale images. Therefore,grayscale images of some representative sections were compared with light microscopic viewsof these same sections before measurements in order to establish which gray levels of thestained profiles corresponded to c-Fos or FosB/ΔFosB immunolabelled nuclei; onceestablished, these threshold parameters remained unchanged throughout the analysis of aparticular brain structure. Image analysis and immunolabelled particles counting wasperformed using a PC version of NIH imaging software (ImageJ 1.33u, NIH, USA). Eachgrayscale image was first thresholded to the gray levels previously determined and then thenumber of immunoreactive nuclei was counted into a specific area drawn on the image, whichcorresponds to a particular brain structure. At least two sections per animal were counted fora given cerebral structure. To eliminate any bias in the selection of the brain analyzed, thebrains were sectioned in a serial way that was the same for all the mice. All the brain structuresof interest were quantified in their totality and at least two sections per mouse were countedfor a given brain structure. Data were expressed as the mean ± SEM number of positive nucleiper surface unit (megapixel²). Statistical analyses were performed on individual raw data by atwo-way treatment × time ANOVA, followed by a post-hoc multiple comparison procedureusing the Bonferroni method if the interaction treatment × time interaction was significant, inorder to compare LPS-induced c-Fos and FosB/ΔFosB expression to control at different timepoints (6 and 24 hours).
RESULTSLPS induces depressive-like behavior at 24 h in the absence of any effect on motor activity
Fig. 2A shows the motor activity data in mice submitted to the tail suspension experiment. Atwo way ANOVA on the number of line crossings showed a significant time × treatmentinteraction (F1,44 = 6.75, P<0.05). Post-hoc comparison of individual group means revealedthat compared to saline LPS decreased the number of line crossings at 6 h (P<0.001) but notat 24 h, and that there were fewer line crossings in the LPS-treated group at 6 than at 24 h(P<0.001). Essentially similar results were obtained for the number of rearings (time ×treatment interaction: F1,44 = 14.0, P<0.001).
Fig. 2B show the duration of immobility in mice submitted to the tail suspension test. A two-way ANOVA revealed a significant effect of the treatment (F1,44 = 10.6, P<0.01) but not thetime factor nor the treatment × time interaction. LPS-treated mice spent significantly longertime immobile than saline-treated mice. The data collected in the forced swim experiment arerepresented in Fig. 3 . Behavioral observation only took place at 24 h post-LPS. There was noeffect of the treatment (LPS vs. saline) on motor activity, as assessed by the number of crossingsand rearings performed in the two-compartment cage (P>0.05) (Fig. 3A). However, theduration of immobility measured in the FST was markedly enhanced in LPS-treated mice(F1,18=9.3, P<0.01) as compared to controls (Fig. 3B). This increase in immobility wasassociated with a marked reduction of the time spent swimming (F1,18=10.7, P<0.01), whereasthe duration of climbing was not significantly altered.
Fig. 4 shows the time-course of sucrose intake expressed as a percent body weight. At the endof the habituation period and before treatment, sucrose and water intakes were comparable inboth the saline and LPS-treated groups. However, sucrose consumption declined as soon as 24
Frenois et al. Page 6
Psychoneuroendocrinology. Author manuscript; available in PMC 2007 September 18.
NIH
-PA Author Manuscript
NIH
-PA Author Manuscript
NIH
-PA Author Manuscript

hours after treatment in LPS-treated mice (LPS: F1,54=20.3, P<0.001; time: F3,54=38.4,P<0.001; LPS × time interaction: F3,54=35.1, P<0.001) and it did not reach consumption levelsof control mice within 3 days. Indeed, LPS-treated mice clearly drank less sucrose than controlsat 24 hours ( P<0.001) and 48 hours (P<0.001) after treatment, but not any longer 72 hourslater (P=0.78). Water intake remained unaltered in LPS- compared to saline-treated mice(F1,54=1.1, P>0.3; data not shown).
Temporal pattern of LPS-induced brain cell reactivityMapping of LPS-induced c-Fos expression in the mouse brain over time—Basallevels of c-Fos protein expression were very low in the brain of mice treated with saline 6 and24 h before euthanasia (Tables 1 and 2, and pictures A, D, G and J in Figs. 5 and 6). There wasvirtually no staining in any of the brain structures analyzed, except for some sparse labeledneurons within a few hypothalamic or limbic areas (see Table 1 for more details).
Six hours following LPS injection, there was a marked expression of c-Fos within a set ofinterconnected limbic structures (Tables 1 and 2, and pictures B, E, H and K in Fig. 5). Thecorresponding brains areas precisely outline the extended amygdala, that includes the shell partof the nucleus accumbens (AcbS), the bed nucleus of the stria terminalis (BNST) and the centralnucleus of the amygdala (CeA). While c-Fos expression was not altered within the core partof the nucleus accumbens (AcbC; Fig. 5B) at this time, quantitative analysis (Table 2) showedthat c-Fos immunoreactivity was strongly increased in the AcbS (+863%, P<0.001 vs. saline),as well as in the dorsal (BNSTd; Fig. 5E) and ventral (BNSTv; Fig. 5H) parts of the BNST(+1203% for BNSTd and +1137% for BNSTv, P<0.001 vs. saline in both cases). Within themany amygdaloid nuclei, LPS-induced c-Fos expression was very heterogeneous, with no orlittle labeling in the medial, basomedial, and anterior cortical nuclei (Table 1), and a strong c-Fos induction in the CeA (+848%, P<0.001 vs. control) which was apparent to a lesser extentin the basolateral nucleus (BLA; Fig. 5K). Among the other telencephalic areas analyzed, thelateral septum (LS) also displayed strong increases in c-Fos protein expression, whereas no c-Fos variation was detected in the fields of the hippocampus (Table 1). LPS also induced c-Fosin many parts of the diencephalon (Table 1), including the medial and median preoptic areas(MPA and MnPO respectively), the paraventricular nucleus of the thalamus (PV), thesupraoptic nucleus (SO; Fig. 6H) and its retrochiasmatic part (SOR; Fig. 6K). Increases in thedensity of c-Fos immunolabeled cells were also detected within many other hypothalamicareas, such as in the periventricular (Pe; Fig. 6B) and paraventricular (PVN; Fig. 6E) nuclei,the dorsomedial nucleus (DM), the lateral hypothalamic area (LH), and the arcuate nucleus(Arc; Fig. 6K). Within the PVN and Arc, quantitative analysis revealed a marked increase inc-Fos immunoreactivity (+2994% for PVN and +1321% for Arc, P<0.001 vs. saline in bothcases; Table 2). In more posterior brain areas, LPS treatment had no or little effect on c-Fosexpression (Table 1), especially within the ventral tegmental area (VTA), periaqueductal gray(PAG) and central gray pons (CGPn). By contrast, noradrenergic nuclei, such as the locuscoeruleus (LC) and nucleus of the solitary tract (NTS), displayed a marked increase in c-Fosimmunoreactivity. This was also the case for the area postrema (AP). Among all the brainstructures analyzed, the NTS was the most LPS-sensitive area since quantitative analysisrevealed that this nucleus exhibited the strongest inductions of c-Fos immunoreactivity(+3563%, P<0.001 vs. saline; Table 2).
Twenty-four hours after LPS treatment, c-Fos immunoreactivity was globally lower in all thebrain sites that were recruited by 6 hours (Tables 1 and 2, and pictures C, F, I and L in Figs. 5and 6). Quantitative analysis confirmed that between 6 and 24 hours, c-Fos immunolabelingdecreased by 35% in the AcbS, 60% in the BNSTd, 41% in the BNSTv, 55% in the CeA, 66%in the PVN, 42% in the Arc and 56% in the NTS (Table 2). In addition, no structure was newlyrecruited at this later time point, in comparison with the brain areas that displayed c-Fos
Frenois et al. Page 7
Psychoneuroendocrinology. Author manuscript; available in PMC 2007 September 18.
NIH
-PA Author Manuscript
NIH
-PA Author Manuscript
NIH
-PA Author Manuscript
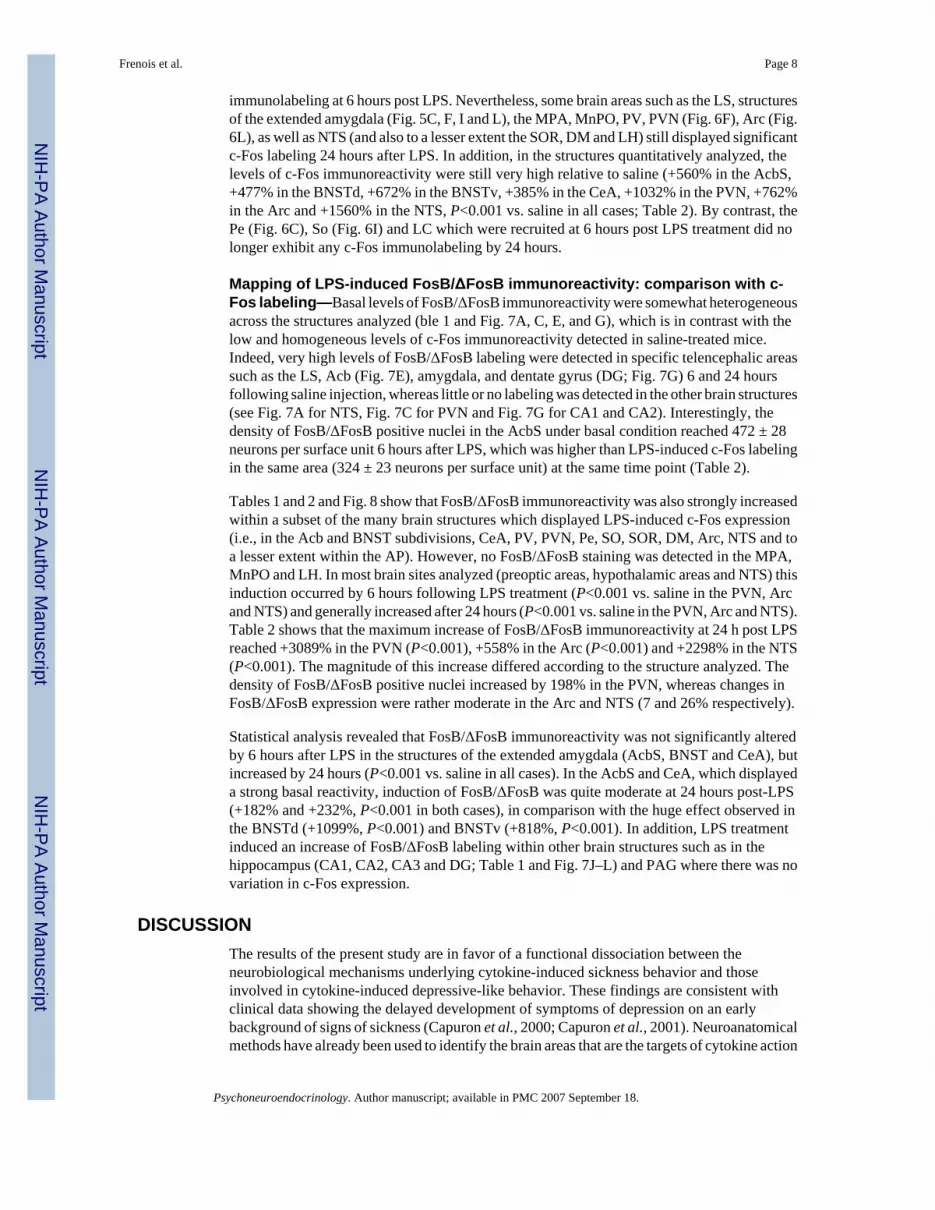
immunolabeling at 6 hours post LPS. Nevertheless, some brain areas such as the LS, structuresof the extended amygdala (Fig. 5C, F, I and L), the MPA, MnPO, PV, PVN (Fig. 6F), Arc (Fig.6L), as well as NTS (and also to a lesser extent the SOR, DM and LH) still displayed significantc-Fos labeling 24 hours after LPS. In addition, in the structures quantitatively analyzed, thelevels of c-Fos immunoreactivity were still very high relative to saline (+560% in the AcbS,+477% in the BNSTd, +672% in the BNSTv, +385% in the CeA, +1032% in the PVN, +762%in the Arc and +1560% in the NTS, P<0.001 vs. saline in all cases; Table 2). By contrast, thePe (Fig. 6C), So (Fig. 6I) and LC which were recruited at 6 hours post LPS treatment did nolonger exhibit any c-Fos immunolabeling by 24 hours.
Mapping of LPS-induced FosB/ΔFosB immunoreactivity: comparison with c-Fos labeling—Basal levels of FosB/ΔFosB immunoreactivity were somewhat heterogeneousacross the structures analyzed (ble 1 and Fig. 7A, C, E, and G), which is in contrast with thelow and homogeneous levels of c-Fos immunoreactivity detected in saline-treated mice.Indeed, very high levels of FosB/ΔFosB labeling were detected in specific telencephalic areassuch as the LS, Acb (Fig. 7E), amygdala, and dentate gyrus (DG; Fig. 7G) 6 and 24 hoursfollowing saline injection, whereas little or no labeling was detected in the other brain structures(see Fig. 7A for NTS, Fig. 7C for PVN and Fig. 7G for CA1 and CA2). Interestingly, thedensity of FosB/ΔFosB positive nuclei in the AcbS under basal condition reached 472 ± 28neurons per surface unit 6 hours after LPS, which was higher than LPS-induced c-Fos labelingin the same area (324 ± 23 neurons per surface unit) at the same time point (Table 2).
Tables 1 and 2 and Fig. 8 show that FosB/ΔFosB immunoreactivity was also strongly increasedwithin a subset of the many brain structures which displayed LPS-induced c-Fos expression(i.e., in the Acb and BNST subdivisions, CeA, PV, PVN, Pe, SO, SOR, DM, Arc, NTS and toa lesser extent within the AP). However, no FosB/ΔFosB staining was detected in the MPA,MnPO and LH. In most brain sites analyzed (preoptic areas, hypothalamic areas and NTS) thisinduction occurred by 6 hours following LPS treatment (P<0.001 vs. saline in the PVN, Arcand NTS) and generally increased after 24 hours (P<0.001 vs. saline in the PVN, Arc and NTS).Table 2 shows that the maximum increase of FosB/ΔFosB immunoreactivity at 24 h post LPSreached +3089% in the PVN (P<0.001), +558% in the Arc (P<0.001) and +2298% in the NTS(P<0.001). The magnitude of this increase differed according to the structure analyzed. Thedensity of FosB/ΔFosB positive nuclei increased by 198% in the PVN, whereas changes inFosB/ΔFosB expression were rather moderate in the Arc and NTS (7 and 26% respectively).
Statistical analysis revealed that FosB/ΔFosB immunoreactivity was not significantly alteredby 6 hours after LPS in the structures of the extended amygdala (AcbS, BNST and CeA), butincreased by 24 hours (P<0.001 vs. saline in all cases). In the AcbS and CeA, which displayeda strong basal reactivity, induction of FosB/ΔFosB was quite moderate at 24 hours post-LPS(+182% and +232%, P<0.001 in both cases), in comparison with the huge effect observed inthe BNSTd (+1099%, P<0.001) and BNSTv (+818%, P<0.001). In addition, LPS treatmentinduced an increase of FosB/ΔFosB labeling within other brain structures such as in thehippocampus (CA1, CA2, CA3 and DG; Table 1 and Fig. 7J–L) and PAG where there was novariation in c-Fos expression.
DISCUSSIONThe results of the present study are in favor of a functional dissociation between theneurobiological mechanisms underlying cytokine-induced sickness behavior and thoseinvolved in cytokine-induced depressive-like behavior. These findings are consistent withclinical data showing the delayed development of symptoms of depression on an earlybackground of signs of sickness (Capuron et al., 2000; Capuron et al., 2001). Neuroanatomicalmethods have already been used to identify the brain areas that are the targets of cytokine action
Frenois et al. Page 8
Psychoneuroendocrinology. Author manuscript; available in PMC 2007 September 18.
NIH
-PA Author Manuscript
NIH
-PA Author Manuscript
NIH
-PA Author Manuscript

(e.g., Elmquist et al., 1996; Konsman et al., 1999; Konsman et al., 2000). Most of these studieshave been carried out at time intervals shorter than 24 h and in the Rat that is the species ofchoice for neuroanatomical studies. Using mice, we confirm in the present study that c-Fosimmunoreactivity is strongly increased by 6 hours in the many brain areas already known tocoordinate the behavioral, endocrine and autonomic responses to LPS. In particular, we showhere that the NTS is the most LPS-responsive structure, and that several hypothalamic andpreoptic areas along with a number of telencephalic structures (LS, AcbS, BNST and CeA)display intense c-Fos induction. However, the neural basis of LPS-induced depressive-likebehavior had not yet been established. Inflammatory stimuli have already been shown to inducedepressive-like behavior in rodent models of depression (Jain et al., 2001; Anisman & Merali,2002; 2003; De La Garza, 2005; Dunn & Swiergiel, 2005). Unfortunately, most of these studieswere carried out during the few hours that immediately follow LPS or cytokine treatment sothat they did not allow discarding the possibility of a confounding effect of sickness. Thisexplains why we took care in the present report to select a time point at which LPS-induceddepressive-like behavior was not associated with decreased motor activity. At this time point,LPS-induced c-Fos protein expression tended to decrease and return to baseline in the majorityof the brain sites analyzed. Despite this trend c-Fos was still significantly induced withinspecific brain sites (extended amygdala, preoptic areas, PVN, Arc, and NTS). Furthermore,the use of FosB/ΔFosB as a marker of chronic cellular reactivity revealed the presence of lateoccurring sustained activity changes in specific brain sites including structures of the extendedamygdala and several hypothalamic areas. These structures constitute only a subset of the braincircuitry that displayed intense c-Fos expression 6 hours after LPS. In addition, subdivisionsof the hippocampus, which were not recruited in terms of c-Fos immunoreactivity at any timefollowing LPS challenge, displayed increased FosB/ΔFosB immunoreactivity during thedepressive-like phase of the response to LPS.
LPS induces depressive-like symptoms in miceAlthough the use of rodents model for depression could appear limiting in the present study(Dunn et al., 2005), the development of consistent and reliable behavioral tests modelingdifferent core symptoms of major depression rather than the entire depressive syndrome hasprovided very useful tools to study the pathophysiology of depression and investigate thepotential for new therapies (for review: Cryan et al., 2002). The tail suspension test and theforced swim test are widely used rodent models of depression because of their predictivevalidity, that is, their ability to identify new antidepressant drugs, based on the reduction of thetime mice spent immobile in a helplessness or resignated-like state (Steru et al., 1985; Porsolt,2000). In the present study, we confirmed that LPS increased the duration of immobility inthese two tests. Similar effects had already been reported shortly after treatment with LPS orIL-1 (Jain et al., 2001; Dunn & Swiergiel, 2005), although there are also negative reports (DelCerro & Borrell, 1990; Deak et al., 2005), probably because of differences in the experimentalprocedures.
In addition to its ability to increase the duration of immobility in the tail suspension test andthe forced swim test, LPS also depressed sucrose consumption in the sucrose preference test.This test models anhedonia, a core symptom of major depressive disorders (Monleon et al.,1995; Shen et al., 1999). The finding that LPS reduced the intake of a palatable solution agreeswith previously published data (for review: De La Garza, 2005). Nevertheless, it could still beargued that the appetite suppressing effect of LPS accounts for the decrease in sucroseconsumption independently of any anhedonia. However, several data, including ours, argueagainst this interpretation. Firstly, we observed here that LPS-treated mice displayed bluntedsucrose intake up to 48 hours post-treatment, at a time at which food and water consumptionwas back to normal. Such a dissociation between relatively short-term depressing effects ofcytokines on food intake and more sustained anhedonic effects had already been reported in
Frenois et al. Page 9
Psychoneuroendocrinology. Author manuscript; available in PMC 2007 September 18.
NIH
-PA Author Manuscript
NIH
-PA Author Manuscript
NIH
-PA Author Manuscript

response to chronic IL-2 treatment (Anisman & Merali, 2003) and in mice chronically infectedwith an IFN-γ adenovector (Kwant & Sakic, 2004). Secondly, our experimental paradigmallowed mice to have free access to food and water before and during the test, which increasedthe probability that intake of the highly palatable sucrose solution was mostly based on itsrewarding properties (Shen et al., 1999; Merali et al., 2003; De La Garza, 2005). Thirdly, thehypothesis that cytokines induce anhedonic-like changes is supported by the fact that chronicantidepressant treatment has already been shown to reverse these effects (Yirmiya, 1996;Sammut et al., 2002). Fourthly, LPS treatment also abolished the reinforcing effect of cocainein a conditioned place preference paradigm (Suzuki et al., 1994), increased intracranial self-stimulation thresholds, indicating a reduction in the reward produced by the electric stimulationof the lateral hypothalamic area (Borowski et al., 1998), and reduced sexual behavior (Avitsur& Yirmiya, 1999). These results also argue against the possibility of a reduced gustatorydiscrimination in LPS-treated animals as an explanation for reduced sucrose preference.
All these data point to the ability of LPS to induce depressive-like behavior independently ofits sickness inducing properties.
LPS induces delayed cellular activities in the extended amygdala, hippocampus andhypothalamus which parallel the development of depressive-like behavior
Functional significance of c-Fos and FosB/ΔFosB protein expression—Theanalysis of immediate-early genes (IEGs) is commonly used for assessing neuronal reactivity.IEGs are inducible transcription factors which tightly control the expression of other genescoding for essential proteins involved in the neuronal response to several stimuli. Until now,members of the c-fos family have largely been studied to map in situ the cerebral structuresrecruited following various types of stimulation (for reviews: Morgan & Curran, 1995;Herdegen & Leah, 1998; Kovacs, 1998). Among the members of this family, the protein c-Fos(55 kDa), coded by the c-fos gene, is induced between 1 and 3 hours after an acute stimulation,and it has a half-life of 2 hours. The FosB protein (46/48 kDa) is a product of the fosB geneand its half-life is of approximately 9 hours. The expression of c-Fos and FosB desensitizesacross time (Nestler et al., 1999; Perrotti et al., 2004). The fosB gene also codes for varioussplice variants, among which the stable protein ΔFosB (33 kDa) that is generally induced by6 hours following stimulation (Nestler et al., 2001). ΔFosB also possesses a half-life muchlonger than the other members of the c-fos family and accumulates in cells up to one month.The ΔFosB protein is induced by several chronic experimental conditions (Chen et al., 1997;McClung et al., 2004) such as prolonged exposure to drugs of abuse (Nestler et al., 1999;Nestler et al., 2001), stressors (Perrotti et al., 2004), or antipsychotic drugs (Atkins et al.,1999; Rodriguez et al., 2001). Although seemingly paradoxical, the observation in saline-treated mice of a relatively high expression of FosB/ΔFosB within a few specific brain areas(Acb, amygdala and hippocampus), especially when compared with the very low basal levelsof c-Fos expression had already been made in other studies. High levels of ΔFosB expressionwere for instance observed under basal conditions within the Acb as well as in cortical areas(Rodriguez et al., 2001; Perrotti et al., 2004). Given the fundamental role of ΔFosB in mediatinglong-term adaptations in the brain (Nestler et al., 1999), this phenomenon can be easilyexplained since these telencephalic brain areas continuously integrate multimodalinteroceptive and exteroceptive sensory information.
There is no one-to-one relationship between IEGs expression and the firing rate of neuronseven though there may be a good correlation in some brain areas in response to different typesof stimuli including cytokines. For instance, the electrophysiological activity of LC neuronsis increased following an acute immune challenge (Borsody & Weiss, 2002; 2004; 2005).Accordingly, we show in the present study that the LC displays intense c-Fos labeling 6 hoursfollowing LPS injection. The absence of c-Fos immunoreactivity in a given brain area does
Frenois et al. Page 10
Psychoneuroendocrinology. Author manuscript; available in PMC 2007 September 18.
NIH
-PA Author Manuscript
NIH
-PA Author Manuscript
NIH
-PA Author Manuscript
not exclude a particular cell or group of cell nuclei participation in the physiological responseof interest since inhibitory responses are normally not associated with c-Fos induction (Chanet al., 1993; Kovacs & Sawchenko, 1993; Kovacs, 1998). Also, a decrease in the number ofneurons displaying c-fos gene expression in a given structure does not necessarily mean thatthe neuronal population is inhibited since this decrease can be accounted for by the activationof only a few neurons in this population (Frenois et al., 2005b). Despite these limitations, theanalysis of IEGs expression remains an useful tool for extensively mapping the neural pathwayswhose activity is acutely and chronically modified during LPS challenge.
Potential mechanisms for LPS-induced transient and sustained brain reactivity—LPS-induced sickness behavior is triggered by central actions of proinflammatory cytokineswhich are transiently expressed within the brain in response to peripherally released cytokines(for reviews: Konsman et al., 2002; Dantzer, 2004). Subdiaphragmatic section of the vagusnerves (Hansen et al., 2000a; Konsman et al., 2000) together with extensive c-Fos imaging(Konsman et al., 2000) have revealed that the vagal sensory pathway along with its primary(NTS) and secondary (extended amygdala and some hypothalamic structures) projection areasare strongly involved in the behavioral responses to cytokines. The transient pattern of c-Fosprotein induction that was observed in the present study is in total agreement with the alreadyavailable data on the mechanisms of action of cytokines in the brain and in particular thenormalization of the LPS-induced expression of brain cytokines within a few hours (Laye etal., 1994; Castanon et al., 2004). Since LPS-induced depressive-like behavior occurred muchlater and lasted much longer than these early events, it is probably not caused directly byproinflammatory cytokines. LPS-induced depressive-like behavior is more likely to bemediated by other neurobiological processes that are recruited as a consequence of theincreased expression of proinflammatory cytokines. This hypothesis is strengthened by thepresent set of neuroanatomical results that show that despite some spatial overlap, distincttemporal patterns of brain reactivity are associated with LPS-induced sickness behavior at 6 hand depressive-like behavior at 24 h post-LPS respectively.
Correlation with behavioral data and functional outcomes—The extendedamygdala, which showed LPS-induced sustained cellular reactivity, as assessed by increasesin c-Fos and FosB/ΔFosB expression, is a clearly-defined anatomical and functional entitywhich includes a set of interconnected subcortical limbic brain areas (for review: Alheid,2003). Dysfunction of the extended amygdala has been proposed to be responsible for thepathophysiology of several neuropsychiatric disorders such as addiction and depression, thatare both characterized by cognitive, emotional and motivational alterations (Liotti & Mayberg,2001; Cardinal et al., 2002; Nestler et al., 2002; Frenois et al., 2005a). Typically, the centraldivision of the extended amygdala encompasses the central nucleus of the amygdala (CeA),the dorsolateral part of the BNST (BNSTd) and the medial shell part of the nucleus accumbens(AcbS), which is considered as an anterior extension of the central extended amygdala (Alheid& Heimer, 1988; 1996; Heimer et al., 1997a; Heimer et al., 1997b). All of these limbic basalforebrain areas exhibit significant accumulation of FosB/ΔFosB 24 hours post-LPS whichmeans that these structures could mediate LPS-induced depressive-like behavior.
A delayed and sustained increase of FosB/ΔFosB immunoreacitvity also took place in all thesubdivisions of the hippocampus (CA1, CA2, CA3 and DG) in response to LPS. These originalresults are in accordance with the observation that cytokines impair normal hippocampusfunctioning. LPS triggers an increase of IL-1 β within the hippocampus (Laye et al., 1994;Hansen et al., 2000b) which is independent of the vagal pathway (Hansen et al., 2000b). ThisLPS-induced IL1-β expression is responsible for a sustained increase in GABAergic inhibitionin hippocampal CA1 pyramidal neurons (Hellstrom et al., 2005). Cytokines also decrease thenumber of functional NMDA receptors in the hippocampus (Rosi et al., 2004) and theexpression of Arc, an IEG involved in synaptic plasticity (Rosi et al., 2005). In addition,
Frenois et al. Page 11
Psychoneuroendocrinology. Author manuscript; available in PMC 2007 September 18.
NIH
-PA Author Manuscript
NIH
-PA Author Manuscript
NIH
-PA Author Manuscript
neurotoxic processes within the hippocampus have been linked to depression (Sheline et al.,1999; Bremner et al., 2000) and the activation of glial cells that produce proinflammatorycytokines and neurotoxic factors such as free radicals and nitric oxide during inflammation isknown to promote alterations in synaptic plasticity and neuronal cell death (for review: Allan& Rothwell, 2001). Altogether, these data favor a possible role of the hippocampus in LPS-induced depressive-like behavior.
Although not considered in the present study, LPS-induced depressive-like behavior isprobably related to the profound effects of peripheral immune activation on brainneurotransmission (e.g., Dunn et al., 1999) and HPA axis activity (for review: Besedovsky &Del Rey, 1996). A possible pathophysiological mechanism for the delayed LPS-induceddepressive-like behavior is the activation of the indoleamine 2,3 dioxygenase (IDO) enzyme.This tryptophan catabolizing enzyme is potently induced by cytokines in primary cultures ofmonocytes, macrophages and brain microglia, leading to a decrease of the bioavailability oftryptophan for serotonin synthesis (Capuron et al., 2002b; Capuron & Dantzer, 2003; Wichers& Maes, 2004) and the generation of potentially neurotoxic tryptophan metabolites such as 3-hydroxykynurenine and quinolinic acid (Stone, 2001; Wichers et al., 2005). In accordance withthis hypothesis, we have already shown that LPS-induced IDO activation is a late event thatpeaks at 24 h post-LPS (Lestage et al., 2002). The impact of this enzymatic activation on brainserotoninergic activity, and its potential implication in the enhanced depressive-like behaviordisplayed by LPS-treated mice, are currently under study.
ConclusionIn the present report, we demonstrate that LPS can induce depressive-like behaviorindependently of any change in motor activity. This depressive-like behavior is associated witha sustained cellular reactivity in the extended amygdala, hippocampus and hypothalamus.Although only correlative, these findings are highly suggestive of a dissociation in theneurobiological mechanisms that underlie LPS-induced sickness from those involved in thedepressive-like behavioral response to activation of the innate immune system.
Acknowledgements
M. Moreau was supported by a predoctoral fellowship from the FRM (Fondation pour la Recherche Médicale). Thisstudy was funded by NIMH (R01 MH-71349 and MH-079829 to RD), INRA, CNRS, Région Aquitaine, and theFrench Ministry of Research (ACI “Neurosciences Intégratives et Computationnelles” to NC).
ReferencesAlheid GF. Extended amygdala and basal forebrain. Ann NY Acad Sci 2003;985:185–205. [PubMed:
12724159]Alheid GF, Heimer L. New perspectives in basal forebrain organization of special relevance for
neuropsychiatric disorders: the striatopallidal, amygdaloid, and corticopetal components of substantiainnominata. Neuroscience 1988;27:1–39. [PubMed: 3059226]
Alheid GF, Heimer L. Theories of basal forebrain organization and the “emotional motor system”. ProgBrain Res 1996;107:461–484. [PubMed: 8782537]
Allan SM, Rothwell NJ. Cytokines and acute neurodegeneration. Nat Rev Neurosci 2001;2:734–744.[PubMed: 11584311]
Anisman H, Kokkinidis L, Merali Z. Further evidence for the depressive effects of cytokines: anhedoniaand neurochemical changes. Brain Behav Immun 2002;16:544–556. [PubMed: 12401468]
Anisman H, Merali Z. Cytokines, stress, and depressive illness. Brain Behav Immun 2002;16:513–524.[PubMed: 12401465]
Anisman H, Merali Z. Cytokines, stress and depressive illness: brain-immune interactions. Ann Med2003;35:2–11. [PubMed: 12693607]
Frenois et al. Page 12
Psychoneuroendocrinology. Author manuscript; available in PMC 2007 September 18.
NIH
-PA Author Manuscript
NIH
-PA Author Manuscript
NIH
-PA Author Manuscript
Atkins JB, Chlan-Fourney J, Nye HE, Hiroi N, Carlezon WA Jr, Nestler EJ. Region-specific inductionof deltaFosB by repeated administration of typical versus atypical antipsychotic drugs. Synapse1999;33:118–128. [PubMed: 10400890]
Avitsur R, Yirmiya R. The immunobiology of sexual behavior: gender differences in the suppression ofsexual activity during illness. Pharmacol Biochem Behav 1999;64:787–796. [PubMed: 10593202]
Besedovsky HO, Del Rey A. Immune-neuro-endocrine interactions: facts and hypotheses. Endocr Rev1996;17:64–102. [PubMed: 8641224]
Borowski T, Kokkinidis L, Merali Z, Anisman H. Lipopolysaccharide, central in vivo biogenic aminevariations, and anhedonia. Neuroreport 1998;9:3797–3802. [PubMed: 9875707]
Borsody MK, Weiss JM. Alteration of locus coeruleus neuronal activity by interleukin-1 and theinvolvement of endogenous corticotropin-releasing hormone. Neuroimmunomodulation2002;10:101–121. [PubMed: 12372984]
Borsody MK, Weiss JM. The effects of endogenous interleukin-1 bioactivity on locus coeruleus neuronsin response to bacterial and viral substances. Brain Res 2004;1007:39–56. [PubMed: 15064134]
Borsody MK, Weiss JM. The subdiaphragmatic vagus nerves mediate activation of locus coeruleusneurons by peripherally administered microbial substances. Neuroscience 2005;131:235–245.[PubMed: 15680706]
Bremner JD, Narayan M, Anderson ER, Staib LH, Miller HL, Charney DS. Hippocampal volumereduction in major depression. Am J Psychiatry 2000;157:115–118. [PubMed: 10618023]
Capuron L, Dantzer R. Cytokines and depression: the need for a new paradigm. Brain Behav Immun2003;17(Suppl 1):S119–124. [PubMed: 12615197]
Capuron L, Gumnick JF, Musselman DL, Lawson DH, Reemsnyder A, Nemeroff CB, Miller AH.Neurobehavioral effects of interferon-alpha in cancer patients: phenomenology and paroxetineresponsiveness of symptom dimensions. Neuropsychopharmacology 2002a;26:643–652. [PubMed:11927189]
Capuron L, Ravaud A, Dantzer R. Early depressive symptoms in cancer patients receiving interleukin 2and/or interferon alfa-2b therapy. J Clin Oncol 2000;18:2143–2151. [PubMed: 10811680]
Capuron L, Ravaud A, Gualde N, Bosmans E, Dantzer R, Maes M, Neveu PJ. Association betweenimmune activation and early depressive symptoms in cancer patients treated with interleukin-2-basedtherapy. Psychoneuroendocrinology 2001;26:797–808. [PubMed: 11585680]
Capuron L, Ravaud A, Neveu PJ, Miller AH, Maes M, Dantzer R. Association between decreased serumtryptophan concentrations and depressive symptoms in cancer patients undergoing cytokine therapy.Mol Psychiatry 2002b;7:468–473. [PubMed: 12082564]
Cardinal RN, Parkinson JA, Hall J, Everitt BJ. Emotion and motivation: the role of the amygdala, ventralstriatum, and prefrontal cortex. Neurosci Biobehav Rev 2002;26:321–352. [PubMed: 12034134]
Castanon N, Leonard BE, Neveu PJ, Yirmiya R. Effects of antidepressants on cytokine production andactions. Brain Behav Immun 2002;16:569–574. [PubMed: 12401470]
Castanon N, Medina C, Mormede C, Dantzer R. Chronic administration of tianeptine balanceslipopolysaccharide-induced expression of cytokines in the spleen and hypothalamus of rats.Psychoneuroendocrinology 2004;29:778–790. [PubMed: 15110927]
Chan RK, Brown ER, Ericsson A, Kovacs KJ, Sawchenko PE. A comparison of two immediate-earlygenes, c-fos and NGFI-B, as markers for functional activation in stress-related neuroendocrinecircuitry. J Neurosci 1993;13:5126–5138. [PubMed: 8254363]
Checkley S. The neuroendocrinology of depression and chronic stress. Br Med Bull 1996;52:597–617.[PubMed: 8949260]
Chen J, Kelz MB, Hope BT, Nakabeppu Y, Nestler EJ. Chronic Fos-related antigens: stable variants ofdeltaFosB induced in brain by chronic treatments. J Neurosci 1997;17:4933–4941. [PubMed:9185531]
Cryan JF, Markou A, Lucki I. Assessing antidepressant activity in rodents: recent developments andfuture needs. Trends Pharmacol Sci 2002;23:238–245. [PubMed: 12008002]
Cryan JF, Mombereau C, Vassout A. The tail suspension test as a model for assessing antidepressantactivity: Review of pharmacological and genetic studies in mice. Neurosci Biobehav Rev2005;29:571–625. [PubMed: 15890404]
Frenois et al. Page 13
Psychoneuroendocrinology. Author manuscript; available in PMC 2007 September 18.
NIH
-PA Author Manuscript
NIH
-PA Author Manuscript
NIH
-PA Author Manuscript
Dantzer R. Cytokine-induced sickness behavior: mechanisms and implications. Ann N Y Acad Sci2001;933:222–234. [PubMed: 12000023]
Dantzer R. Cytokine-induced sickness behaviour: a neuroimmune response to activation of innateimmunity. Eur J Pharmacol 2004;500:399–411. [PubMed: 15464048]
Dantzer R, Wollman E, Vitkovic L, Yirmiya R. Cytokines and depression: fortuitous or causativeassociation? Mol Psychiatry 1999;4:328–332. [PubMed: 10483048]
De La Garza R 2nd. Endotoxin- or pro-inflammatory cytokine-induced sickness behavior as an animalmodel of depression: focus on anhedonia. Neurosci Biobehav Rev 2005;29:761–770. [PubMed:15878621]
Deak T, Bellamy C, D’Agostino LG, Rosanoff M, McElderry NK, Bordner KA. Behavioral responsesduring the forced swim test are not affected by anti-inflammatory agents or acute illness induced bylipopolysaccharide. Behav Brain Res 2005;160:125–134. [PubMed: 15836907]
Del Cerro S, Borrell J. Interleukin-1 affects the behavioral despair response in rats by an indirectmechanism which requires endogenous CRF. Brain Res 1990;528:162–164. [PubMed: 2245334]
Dobrazanski P, Noguchi T, Kovary K, Rizzo CA, Lazo PS, Bravo R. Both products of the fosB gene,FosB and its short form, FosB/SF, are transcriptional activators in fibroblasts. Mol Cell Biol1991;11:5470–5478. [PubMed: 1922060]
Dunn AJ, Swiergiel AH. Effects of interleukin-1 and endotoxin in the forced swim and tail suspensiontests in mice. Pharmacol Biochem Behav 2005;81:688–693. [PubMed: 15982728]
Dunn AJ, Swiergiel AH, de Beaurepaire R. Cytokines as mediators of depression: what can we learnfrom animal studies? Neurosci Biobehav Rev 2005;29:891–909. [PubMed: 15885777]
Dunn AJ, Wang J, Ando T. Effects of cytokines on cerebral neurotransmission. Comparison with theeffects of stress. Adv Exp Med Biol 1999;461:117–127. [PubMed: 10442171]
Elmquist JK, Scammell TE, Jacobson CD, Saper CB. Distribution of Fos-like immunoreactivity in therat brain following intravenous lipopolysaccharide administration. J Comp Neurol 1996;371:85–103.[PubMed: 8835720]
Frenois F, Le Moine C, Cador M. The motivational component of withdrawal in opiate addiction: roleof associative learning and aversive memory in opiate addiction from a behavioral, anatomical andfunctional perspective. Rev Neurosci 2005a;16:255–276. [PubMed: 16323564]
Frenois F, Stinus L, Di Blasi F, Cador M, Le Moine C. A specific limbic circuit underlies opiatewithdrawal memories. J Neurosci 2005b;25:1366–1374. [PubMed: 15703390]
Hansen MK, Daniels S, Goehler LE, Gaykema RP, Maier SF, Watkins LR. Subdiaphragmatic vagotomydoes not block intraperitoneal lipopolysaccharide-induced fever. Auton Neurosci 2000a;85:83–87.[PubMed: 11189031]
Hansen MK, Nguyen KT, Goehler LE, Gaykema RP, Fleshner M, Maier SF, Watkins LR. Effects ofvagotomy on lipopolysaccharide-induced brain interleukin-1beta protein in rats. Auton Neurosci2000b;85:119–126. [PubMed: 11189018]
Heimer L, Alheid GF, De Olmos JS, Groenewegen HJ, Haber SN, Harlan RE, Zahm DS. The accumbens:beyond the core-shell dichotomy. J Neuropsychiatry Clin Neurosci 1997a;9:354–381. [PubMed:9276840]
Heimer L, Harlan RE, Alheid GF, Garcia MM, De Olmos J. Substantia innominata: a notion whichimpedes clinical-anatomical correlations in neuropsychiatric disorders. Neuroscience 1997b;76:957–1006. [PubMed: 9027863]
Hellstrom IC, Danik M, Luheshi GN, Williams S. Chronic LPS exposure produces changes in intrinsicmembrane properties and a sustained IL-beta-dependent increase in GABAergic inhibition inhippocampal CA1 pyramidal neurons. Hippocampus 2005;15:656–664. [PubMed: 15889405]
Herdegen T, Leah JD. Inducible and constitutive transcription factors in the mammalian nervous system:control of gene expression by Jun, Fos and Krox, and CREB/ATF proteins. Brain Res Rev1998;28:370–490. [PubMed: 9858769]
Hirschfeld RM. History and evolution of the monoamine hypothesis of depression. J Clin, Psychiatry2000;61(Suppl 6):4–6. [PubMed: 10775017]
Jain NK, Kulkarni SK, Singh A. Lipopolysaccharide-mediated immobility in mice: reversal bycyclooxygenase enzyme inhibitors. Methods Find Exp Clin Pharmacol 2001;23:441–444. [PubMed:11838318]
Frenois et al. Page 14
Psychoneuroendocrinology. Author manuscript; available in PMC 2007 September 18.
NIH
-PA Author Manuscript
NIH
-PA Author Manuscript
NIH
-PA Author Manuscript

Konsman JP, Kelley K, Dantzer R. Temporal and spatial relationships between lipopolysaccharide-induced expression of Fos, interleukin-1beta and inducible nitric oxide synthase in rat brain.Neuroscience 1999;89:535–548. [PubMed: 10077334]
Konsman JP, Luheshi GN, Bluthe RM, Dantzer R. The vagus nerve mediates behavioural depression,but not fever, in response to peripheral immune signals; a functional anatomical analysis. Eur JNeurosci 2000;12:4434–4446. [PubMed: 11122354]
Konsman JP, Parnet P, Dantzer R. Cytokine-induced sickness behaviour: mechanisms and implications.Trends Neurosci 2002;25:154–159. [PubMed: 11852148]
Kovacs KJ. C-Fos as a transcription factor: a stressful (re)view from a functional map. Neurochem Int1998;33:287–297. [PubMed: 9840219]
Kovacs KJ, Sawchenko PE. Mediation of osmoregulatory influences on neuroendocrine corticotropin-releasing factor expression by the ventral lamina terminalis. Proc Natl Acad Sci USA 1993;90:7681–7685. [PubMed: 8356069]
Kwant A, Sakic B. Behavioral effects of infection with interferon-gamma adenovector. Behav Brain Res2004;151:73–82. [PubMed: 15084423]
Laye S, Parnet P, Goujon E, Dantzer R. Peripheral administration of lipopolysaccharide induces theexpression of cytokine transcripts in the brain and pituitary of mice. Brain Res Mol Brain Res1994;27:157–162. [PubMed: 7877446]
Leonard BE. The immune system, depression and the action of antidepressants. ProgNeuropsychopharmacol Biol Psychiatry 2001;25:767–780. [PubMed: 11383977]
Lestage J, Verrier D, Palin K, Dantzer R. The enzyme indoleamine 2,3-dioxygenase is induced in themouse brain in response to peripheral administration of lipopolysaccharide and superantigen. BrainBehav Immun 2002;16:596–601. [PubMed: 12401474]
Liotti M, Mayberg HS. The role of functional neuroimaging in the neuropsychology of depression. J ClinExp Neuropsychol 2001;23:121–136. [PubMed: 11320448]
Makino M, Kitano Y, Komiyama C, Takasuna K. Human interferon-alpha increases immobility in theforced swimming test in rats. Psychopharmacology (Berl) 2000;148:106–110. [PubMed: 10663424]
Matthews SC, Paulus MP, Dimsdale JE. Contribution of functional neuroimaging to understandingneuropsychiatric side effects of interferon in hepatitis C. Psychosomatics 2004;45:281–286.[PubMed: 15232040]
McClung CA, Ulery PG, Perrotti LI, Zachariou V, Berton O, Nestler EJ. DeltaFosB: a molecular switchfor long-term adaptation in the brain. Mol Brain Res 2004;132:146–154. [PubMed: 15582154]
Merali Z, Brennan K, Brau P, Anisman H. Dissociating anorexia and anhedonia elicited byinterleukin-1beta: antidepressant and gender effects on responding for “free chow” and “earned”sucrose intake. Psychopharmacology (Berl) 2003;165:413–418. [PubMed: 12459927]
Monleon S, D’Aquila P, Parra A, Simon VM, Brain PF, Willner P. Attenuation of sucrose consumptionin mice by chronic mild stress and its restoration by imipramine. Psychopharmacology (Berl)1995;117:453–457. [PubMed: 7604147]
Morgan JI, Curran T. Immediate-early genes: ten years on. Trends Neurosci 1995;18:66–67. [PubMed:7537412]
Mormede C, Palin K, Kelley KW, Castanon N, Dantzer R. Conditioned taste aversion withlipopolysaccharide and peptidoglycan does not activate cytokine gene expression in the spleen andhypothalamus of mice. Brain Behav Immun 2004;18:186–200. [PubMed: 14759596]
Nestler EJ, Barrot M, DiLeone RJ, Eisch AJ, Gold SJ, Monteggia LM. Neurobiology of depression.Neuron 2002;34:13–25. [PubMed: 11931738]
Nestler EJ, Barrot M, Self DW. Delta FosB: A sustained molecular switch for addiction. Proc Natl AcadSci USA 2001;98:11042–11046. [PubMed: 11572966]
Nestler EJ, Kelz MB, Chen J. DeltaFosB: a molecular mediator of long-term neural and behavioralplasticity. Brain Res 1999;835:10–17. [PubMed: 10448191]
Paxinos, G.; Franklin, KBJ. The mouse brain in stereotaxic coordinates. Academic Press; San Diego:2001.
Perrotti LI, Hadeishi Y, Ulery PG, Barrot M, Monteggia L, Duman RS, Nestler EJ. Induction of DeltaFosBin reward-related brain structures after chronic stress. J Neurosci 2004;24:10594–10602. [PubMed:15564575]
Frenois et al. Page 15
Psychoneuroendocrinology. Author manuscript; available in PMC 2007 September 18.
NIH
-PA Author Manuscript
NIH
-PA Author Manuscript
NIH
-PA Author Manuscript

Porsolt RD. Animal models of depression: utility for transgenic research. Rev Neurosci 2000;11:53–58.[PubMed: 10716655]
Rodriguez JJ, Garcia DR, Nakabeppu Y, Pickel VM. Enhancement of laminar FosB expression in frontalcortex of rats receiving long chronic clozapine administration. Exp Neurol 2001;168:392–401.[PubMed: 11259127]
Rosi S, Ramirez-Amaya V, Hauss-Wegrzyniak B, Wenk GL. Chronic brain inflammation leads to adecline in hippocampal NMDA-R1 receptors. J Neuroinflammation 2004;1:12. [PubMed: 15285803]
Rosi S, Ramirez-Amaya V, Vazdarjanova A, Worley PF, Barnes CA, Wenk GL. Neuroinflammationalters the hippocampal pattern of behaviorally induced Arc expression. J Neurosci 2005;25:723–731.[PubMed: 15659610]
Sammut S, Bethus I, Goodall G, Muscat R. Antidepressant reversal of interferon-alpha-inducedanhedonia. Physiol Behav 2002;75:765–772. [PubMed: 12020742]
Sheline YI, Sanghavi M, Mintun MA, Gado MH. Depression duration but not age predicts hippocampalvolume loss in medically healthy women with recurrent major depression. J Neurosci 1999;19:5034–5043. [PubMed: 10366636]
Shen Y, Connor TJ, Nolan Y, Kelly JP, Leonard BE. Differential effect of chronic antidepressanttreatments on lipopolysaccharide-induced depressive-like behavioural symptoms in the rat. Life Sci1999;65:1773–1786. [PubMed: 10576557]
Steru L, Chermat R, Thierry B, Simon P. The tail suspension test: A new method for screeningantidepressants in mice. Psychopharmacology 1985;85:367–370. [PubMed: 3923523]
Stone TW. Endogenous neurotoxins from tryptophan. Toxicon 2001;39:61–73. [PubMed: 10936623]Suzuki T, Funada M, Sugano Y, Misawa M, Okutomi T, Soma G, Mizuno D. Effects of a
lipopolysaccharide from Pantoea agglomerans on the cocaine-induced place preference. Life Sci1994;54:PL75–80. [PubMed: 8295482]
Wichers MC, Koek GH, Robaeys G, Verkerk R, Scharpe S, Maes M. IDO and interferon-alpha-induceddepressive symptoms: a shift in hypothesis from tryptophan depletion to neurotoxicity. MolPsychiatry 2005;10:538–544. [PubMed: 15494706]
Wichers MC, Maes M. The role of indoleamine 2,3-dioxygenase (IDO) in the pathophysiology ofinterferon-alpha-induced depression. J Psychiatry Neurosci 2004;29:11–17. [PubMed: 14719046]
Yamano M, Yuki H, Yasuda S, Miyata K. Corticotropin-releasing hormone receptors mediate consensusinterferon-alpha YM643-induced depression-like behavior in mice. J Pharmacol Exp Ther2000;292:181–187. [PubMed: 10604946]
Yirmiya R. Endotoxin produces a depressive-like episode in rats. Brain Res 1996;711:163–174.[PubMed: 8680860]
Yirmiya R. Depression in medical illness: the role of the immune system. West J Med 2000;173:333–336. [PubMed: 11069873]
ABBREVIATIONSFST
forced swim test
IDO indoleamine 2,3 dioxygenase
IEGs immediate-early genes
LPS lipopolysaccharide
PBS phosphate buffer saline
PFA
Frenois et al. Page 16
Psychoneuroendocrinology. Author manuscript; available in PMC 2007 September 18.
NIH
-PA Author Manuscript
NIH
-PA Author Manuscript
NIH
-PA Author Manuscript

paraformaldehydeFor the abbreviations of the brain structures, see Table 1
Frenois et al. Page 17
Psychoneuroendocrinology. Author manuscript; available in PMC 2007 September 18.
NIH
-PA Author Manuscript
NIH
-PA Author Manuscript
NIH
-PA Author Manuscript

Fig. 1. Anatomical levels and cerebral structures analyzed for the expression of c-Fos and FosB/ΔFosB (adapted from: Paxinos & Franklin, 2001)Rostro-caudal anatomical levels used for the analysis of the expression of c-Fos and FosB/ΔFosB and their distance from Bregma in mm. Thirty-one brain areas were semi-quantitativelyanalyzed: 1, lateral septum; 2, core part of the nucleus accumbens; 3, shell part of the nucleusaccumbens; 4, medial preoptic area; 5, dorsal part of the bed nucleus of the stria terminalis; 6,ventral part of the bed nucleus of the stria terminalis; 7, median preoptic nucleus; 8, medialnucleus of the amygdala; 9, basomedial nucleus of the amygdala; 10, anterior cortical nucleusof the amygdala; 11, central nucleus of the amygdala; 12, basolateral nucleus of the amygdala;13, paraventricular nucleus of the thalamus; 14, paraventricular nucleus of the hypothalamus;15, periventricular nucleus of the hypothalamus; 16, supraoptic nucleus; 17, field CA1 of thehippocampus; 18, field CA2 of the hippocampus; 19, field CA3 of the hippocampus; 20, dentategyrus; 21, retrochiasmatic part of the supraoptic nucleus; 22, dorsomedial hypothalamicnucleus; 23, arcuate nucleus; 24, lateral hypothalamic area; 25, ventral tegmental area; 26,periaqueductal gray; 27, locus coeruleus; 28, central gray pons; 29, anterior part of the nucleustractus solitarius; 30, posterior part of the nucleus tractus solitarius; 31, area postrema.Abbreviations : LV, lateral ventricule;3V, third ventricule; D3V, dorsal part of the thirdventricule; Aq, Sylvius aqueduct; 4V, fourth ventricule.
Frenois et al. Page 18
Psychoneuroendocrinology. Author manuscript; available in PMC 2007 September 18.
NIH
-PA Author Manuscript
NIH
-PA Author Manuscript
NIH
-PA Author Manuscript

Figure 2. Depressive-like behavioral effects of LPS in the tail suspension testMice were injected i.p. with either saline (n = 12) or LPS (n = 12). Five and twenty-three hourslater, motor activity was assessed by the total number of crossings and rearings performed inan activity cage (A). One hour later, mice were placed into the tail suspension test for 6 minutesand the duration of immobility was measured (B), Bars represent the mean + S.E.M. ***P<0.001 for the effect of treatment (LPS vs. saline).
Frenois et al. Page 19
Psychoneuroendocrinology. Author manuscript; available in PMC 2007 September 18.
NIH
-PA Author Manuscript
NIH
-PA Author Manuscript
NIH
-PA Author Manuscript

Figure 3. Depressive-like behavioral effects of LPS in the forced swim testMice were injected i.p with either saline (n = 7) or LPS (n = 14). Twenty-three hours later,motor activity was assessed by the total number of crossings and rearings performed in theactivity cage (A). One hour later, mice were placed into the forced swim test for 6 min and thedurations of immobility, swimming and climbing were measured during the last 5 min of thetest (B). Bars represent the mean ± SEM. ** P<0.01 for the effect of treatment (LPS vs. Saline).
Frenois et al. Page 20
Psychoneuroendocrinology. Author manuscript; available in PMC 2007 September 18.
NIH
-PA Author Manuscript
NIH
-PA Author Manuscript
NIH
-PA Author Manuscript

Figure 4. Depressive-like behavioral effect of LPS in the sucrose preference testMice were injected i.p. with either saline or LPS and their relative sucrose intake, expressedas percent bodyweight, was measured overnight during 4 consecutive days post-LPS. Valuesrepresent the mean ± SEM of 10 mice/group. ** P<0.01; *** P<0.001 for the effect of treatment(LPS vs. Saline).
Frenois et al. Page 21
Psychoneuroendocrinology. Author manuscript; available in PMC 2007 September 18.
NIH
-PA Author Manuscript
NIH
-PA Author Manuscript
NIH
-PA Author Manuscript

Figure 5. Photomicrographs illustrating LPS-induced c-Fos immunoreactivity within structures ofthe extended amygdalaThe “saline” pictures where little or no c-Fos immunostaining was detected (A, D, G and J)are representative of saline-treated mice euthanized 6 hours after treatment. C-Fosimmunolabeling was increased 6 hours after LPS treatment in the AcbS, BNSTd, BNSTv, CeAand BLA (B, E, H and K), but the expression of c-Fos decreased between 6 and 24 hours (C,F, I and L). Note also that in the Acb, c-Fos induction following LPS was restricted to the shellpart and that in the BNSTd, LPS-induced c-Fos immunoreactivity was detected in the lateraland juxtacapsular parts. Abbreviations: ac, anterior commissure; LV, lateral ventricule. Scalebar: 300 μm.
Frenois et al. Page 22
Psychoneuroendocrinology. Author manuscript; available in PMC 2007 September 18.
NIH
-PA Author Manuscript
NIH
-PA Author Manuscript
NIH
-PA Author Manuscript
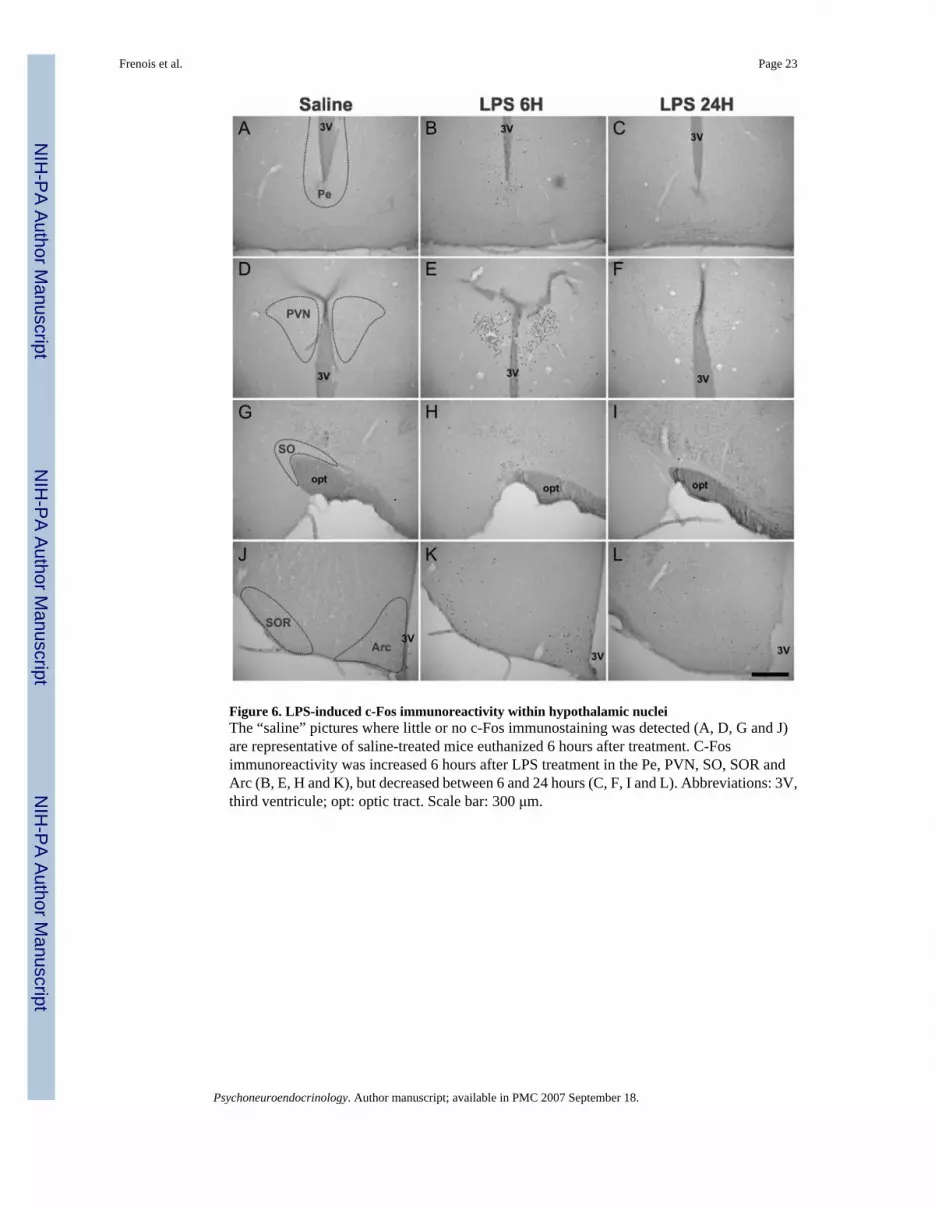
Figure 6. LPS-induced c-Fos immunoreactivity within hypothalamic nucleiThe “saline” pictures where little or no c-Fos immunostaining was detected (A, D, G and J)are representative of saline-treated mice euthanized 6 hours after treatment. C-Fosimmunoreactivity was increased 6 hours after LPS treatment in the Pe, PVN, SO, SOR andArc (B, E, H and K), but decreased between 6 and 24 hours (C, F, I and L). Abbreviations: 3V,third ventricule; opt: optic tract. Scale bar: 300 μm.
Frenois et al. Page 23
Psychoneuroendocrinology. Author manuscript; available in PMC 2007 September 18.
NIH
-PA Author Manuscript
NIH
-PA Author Manuscript
NIH
-PA Author Manuscript

Figure 7. FosB/ΔFosB immunoreactivity in the NTSa, PVN, Acb and hippocampusBasal levels of FosB/ΔFosB immunoreactivity were noticeably heterogeneous across thestructures analyzed, as little or no FosB/ΔFosB immunostaining could be detected within theNTSa (A), PVN (D), and CA1 and CA2 (J), whereas a high basal staining level was detectedwithin the Acb (G) and DG (J). In the brain structures with a low basal level [NTSa (B and C),PVN (E and F), and CA1 and CA2 (K and L)] as well as in the DG (K and L), LPS treatmentinduced a time-dependent increase of FosB/ΔFosB immunoreactivity with a maximumexpression level at 24 hours after treatment. In contrast, in the Acb (H and I), FosB/ΔFosBexpression was significantly increased only at 24 hours after LPS. Abbreviations: 3V, thirdventricule; 4V, fourth ventricule; ac, anterior commissure; LV, lateral ventricule. Scale bar:300 μm.
Frenois et al. Page 24
Psychoneuroendocrinology. Author manuscript; available in PMC 2007 September 18.
NIH
-PA Author Manuscript
NIH
-PA Author Manuscript
NIH
-PA Author Manuscript

NIH
-PA Author Manuscript
NIH
-PA Author Manuscript
NIH
-PA Author Manuscript
Frenois et al. Page 25Ta
ble
ISe
mi-q
uant
itativ
e an
alys
is o
f the
exp
ress
ion
of c
-Fos
and
Fos
B/Δ
FosB
in th
e br
ain
of m
ice
inje
cted
with
salin
e or
LPS
6 o
r 24
hbe
fore
bei
ng e
utha
nize
dTh
irty-
one
brai
n ar
eas (
see
Fig.
1) w
ere
anal
yzed
at v
ario
us le
vels
from
Bre
gma.
Lab
elin
g w
ithin
a g
iven
stru
ctur
e w
as sc
ored
acc
ordi
ngto
the
num
ber o
f pos
itive
nuc
lei (
n) a
s 0
(virt
ually
no
labe
ling)
, +/−
(ver
y fe
w la
belin
g, n
<5),
+ (f
ew la
belin
g, 5
<n<2
5), +
+ (in
tens
ela
belin
g, 2
5<n<
50),
+++
(ver
y in
tens
e la
belin
g, 5
0<n<
85),
++++
(ext
rem
ely
inte
nse
labe
ling,
n>8
5).
C-F
os e
xpre
ssio
nFo
sB/Δ
FosB
exp
ress
ion
6H24
H6H
24 H
Cer
ebra
l str
uctu
res
Bre
gma
(mm
)Fi
g. 1
Salin
eL
PSSa
line
LPS
Salin
eL
PSSa
line
LPS
Tel
ence
phal
on
Late
ral s
eptu
m (L
S)1.
101
0++
0+
++
++++
N
ucle
us a
ccum
bens
(Aob
)
Cor
e (A
cbC
)1.
102
00
00
+++
+++
+++
+++
Shel
l (Ac
bS)
1.10
30
+++
0++
+++
+++
+++
+++
B
ed n
ucle
us o
f the
stria
term
inal
is(B
NST
)
Dor
sal p
art (
BNST
d)0.
265
0++
+0
++
+0
+++
Vent
ral p
art (
BNST
v)02
66
+/−
+++
+/−
+++
++/−
++
Am
ygda
la
Med
ial n
ucle
us (M
eA)
−0.9
48
00
+/−
+/−
++
++++
Baso
med
ial n
ucle
us (D
MA)
−0.9
49
00
00
++
++++
Ante
rior
cor
tical
nuc
leus
(Aco
)−0
.94
100
0+
++
+++
++
Cen
tral
nuc
leus
(CeA
)−0
.94
110
+++
0+
++++
++++
++
Base
-late
ral n
ucle
us (8
LA)
−0.9
412
0+
00
++++
++++
H
ippo
cam
pus
CA1
−1.4
617
00
00
+/−
++/−
++
CA2
−1.4
618
00
00
+/−
++/−
+
CAS
−1.4
619
00
00
+/−
++/−
++
Den
tate
gyr
us (D
G)
−1.4
620
00
00
+++
+++
+++
+++
Die
ncep
halo
n
Med
ial p
reop
tic a
rea
(MPA
)0.
504
+/−
+++
+/−
+0
00
0
Med
ian
preo
ptic
nuc
leus
(MnP
O)
0.26
70
++0
+0
00
0
Thal
amus
Para
vent
ricu
lar n
ucle
us (P
V)−0
.94
13+
+++
+++
0+
0++
+
Hyp
otha
lam
us
Para
vent
ricu
lar n
ucle
us (P
VN)
−0.9
414
0++
+0
+0
++0
+++
Per/
vent
ricu
lar n
ucle
us (P
e)−0
.94
150
++0
00
+0
+
Supr
aopt
ic n
ucle
us (S
O)
−0.9
416
0++
00
0+
0++
Retr
ochi
asm
atic
par
t of t
hesu
prao
ptic
nuc
leus
(SO
R)−1
.46
210
+++/−
++
+++
+++
Dor
som
edia
l nuc
leus
(DM
)−1
.46
220
+++
+/−
+0
+0
++
Arcu
ate
nucl
eus (
Arc)
−1.4
623
0++
+0
+++
+++
+++
Late
ral h
ypot
hala
mic
are
a (L
H)
−1 4
624
0++
0+
00
00
Mes
ence
phal
on
Ven
tral t
eg m
enta
l are
a (V
TA)
−3.2
825
00
00
00
00
Pe
riaqu
educ
tal g
ray
(PA
G)
−3.2
826
0+/−
0+/−
+++
+++
Met
ence
phal
on
Locu
s coe
rule
us (L
C)
−5.6
827
0++
+0
00
00
0
Cen
tral g
ray
pons
(CG
Pn)
−5.6
828
00
00
00
00
Mye
lenc
epha
lon
N
ucle
us tr
actu
s sol
itariu
s (N
TS)
Ante
rior
par
t (N
TSa)
−708
290
++++
0++
0++
0++
Post
erio
r par
t (N
TSp)
−7.4
830
0++
++0
++0
++0
++
Psychoneuroendocrinology. Author manuscript; available in PMC 2007 September 18.

NIH
-PA Author Manuscript
NIH
-PA Author Manuscript
NIH
-PA Author Manuscript
Frenois et al. Page 26C
-Fos
exp
ress
ion
FosB
/ΔFo
sB e
xpre
ssio
n
6H24
H6H
24 H
Cer
ebra
l str
uctu
res
Bre
gma
(mm
)Fi
g. 1
Salin
eL
PSSa
line
LPS
Salin
eL
PSSa
line
LPS
A
rea
post
rem
a (A
P)−7
.48
310
+++
0+/−
0+/−
0+/−
Psychoneuroendocrinology. Author manuscript; available in PMC 2007 September 18.
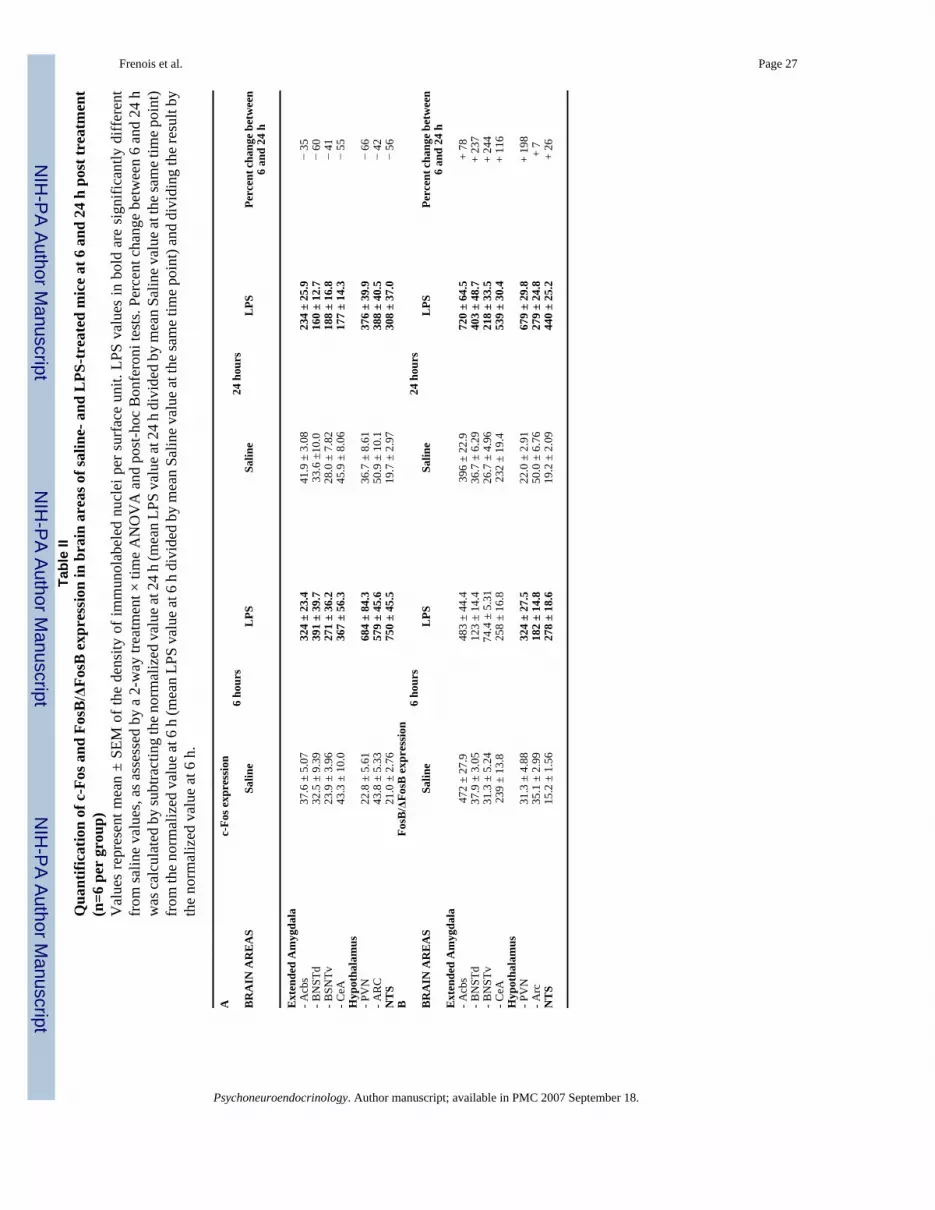
NIH
-PA Author Manuscript
NIH
-PA Author Manuscript
NIH
-PA Author Manuscript
Frenois et al. Page 27Ta
ble
IIQ
uant
ifica
tion
of c
-Fos
and
Fos
B/Δ
FosB
exp
ress
ion
in b
rain
are
as o
f sal
ine-
and
LPS
-trea
ted
mic
e at
6 a
nd 2
4 h
post
trea
tmen
t(n
=6 p
er g
roup
)V
alue
s re
pres
ent m
ean
± SE
M o
f the
den
sity
of i
mm
unol
abel
ed n
ucle
i per
sur
face
uni
t. LP
S va
lues
in b
old
are
sign
ifica
ntly
diff
eren
tfr
om sa
line
valu
es, a
s ass
esse
d by
a 2
-way
trea
tmen
t × ti
me
AN
OV
A a
nd p
ost-h
oc B
onfe
roni
test
s. Pe
rcen
t cha
nge
betw
een
6 an
d 24
hw
as ca
lcul
ated
by
subt
ract
ing
the n
orm
aliz
ed v
alue
at 2
4 h
(mea
n LP
S va
lue a
t 24
h di
vide
d by
mea
n Sa
line v
alue
at th
e sam
e tim
e poi
nt)
from
the
norm
aliz
ed v
alue
at 6
h (m
ean
LPS
valu
e at
6 h
div
ided
by
mea
n Sa
line
valu
e at
the
sam
e tim
e po
int)
and
divi
ding
the
resu
lt by
the
norm
aliz
ed v
alue
at 6
h.
Ac-
Fos e
xpre
ssio
n6
hour
s24
hou
rsB
RA
IN A
RE
AS
Salin
eL
PSSa
line
LPS
Perc
ent c
hang
e bet
wee
n6
and
24 h
Ext
ende
d A
myg
dala
- Acb
s37
.6 ±
5.0
732
4 ±
23.4
41.9
± 3
.08
234
± 25
.9−
35- B
NST
d32
.5 ±
9.3
939
1 ±
39.7
33.6
±10
.016
0 ±
12.7
− 60
- BSN
Tv23
.9 ±
3.9
627
1 ±
36.2
28.0
± 7
.82
188
± 16
.8−
41- C
eA43
.3 ±
10.
036
7 ±
56.3
45.9
± 8
.06
177
± 14
.3−
55H
ypot
hala
mus
- PV
N22
.8 ±
5.6
168
4 ±
84.3
36.7
± 8
.61
376
± 39
.9−
66- A
RC
43.8
± 5
.33
579
± 45
.650
.9 ±
10.
138
8 ±
40.5
− 42
NT
S21
.0 ±
2.7
675
0 ±
45.5
19.7
± 2
.97
308
± 37
.0−
56B
FosB
/ΔFo
sB e
xpre
ssio
n6
hour
s24
hou
rsB
RA
IN A
RE
AS
Salin
eL
PSSa
line
LPS
Perc
ent c
hang
e bet
wee
n6
and
24 h
Ext
ende
d A
myg
dala
- Acb
s47
2 ±
27.9
483
± 44
.439
6 ±
22.9
720
± 64
.5+
78- B
NST
d37
.9 ±
3.0
512
3 ±
14.4
36.7
± 6
.29
403
± 48
.7+
237
- BN
STv
31.3
± 5
.24
74.4
± 5
.31
26.7
± 4
.96
218
± 33
.5+
244
- CeA
239
± 13
.825
8 ±
16.8
232
± 19
.453
9 ±
30.4
+ 11
6H
ypot
hala
mus
- PV
N31
.3 ±
4.8
832
4 ±
27.5
22.0
± 2
.91
679
± 29
.8+
198
- Arc
35.1
± 2
.99
182
± 14
.850
.0 ±
6.7
627
9 ±
24.8
+ 7
NT
S15
.2 ±
1.5
627
8 ±
18.6
19.2
± 2
.09
440
± 25
.2+
26
Psychoneuroendocrinology. Author manuscript; available in PMC 2007 September 18.
Copyright © 2022 FDOKUMEN