Characterization of Horizontal Lipid Bilayers as a Model System to Study Lipid Phase Separation
Upload
khangminh22Category
view
0download
0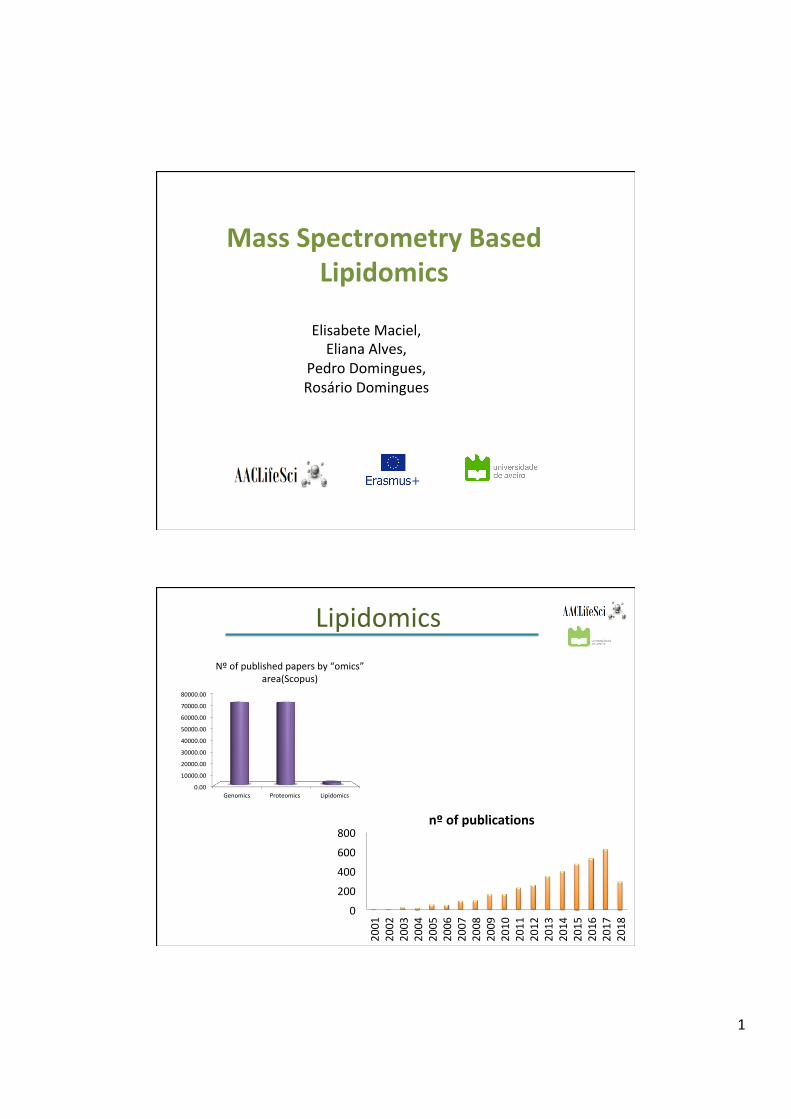
1
MassSpectrometryBasedLipidomics
ElisabeteMaciel,ElianaAlves,
PedroDomingues,RosárioDomingues
Nºofpublishedpapersby“omics”area(Scopus)
0.00
10000.00
20000.00
30000.00
40000.00
50000.00
60000.00
70000.00
80000.00
Genomics Proteomics Lipidomics
Lipidomics
0
200
400
600
800
2001
2002
2003
2004
2005
2006
2007
2008
2009
2010
2011
2012
2013
2014
2015
2016
2017
2018
nºofpublications
2
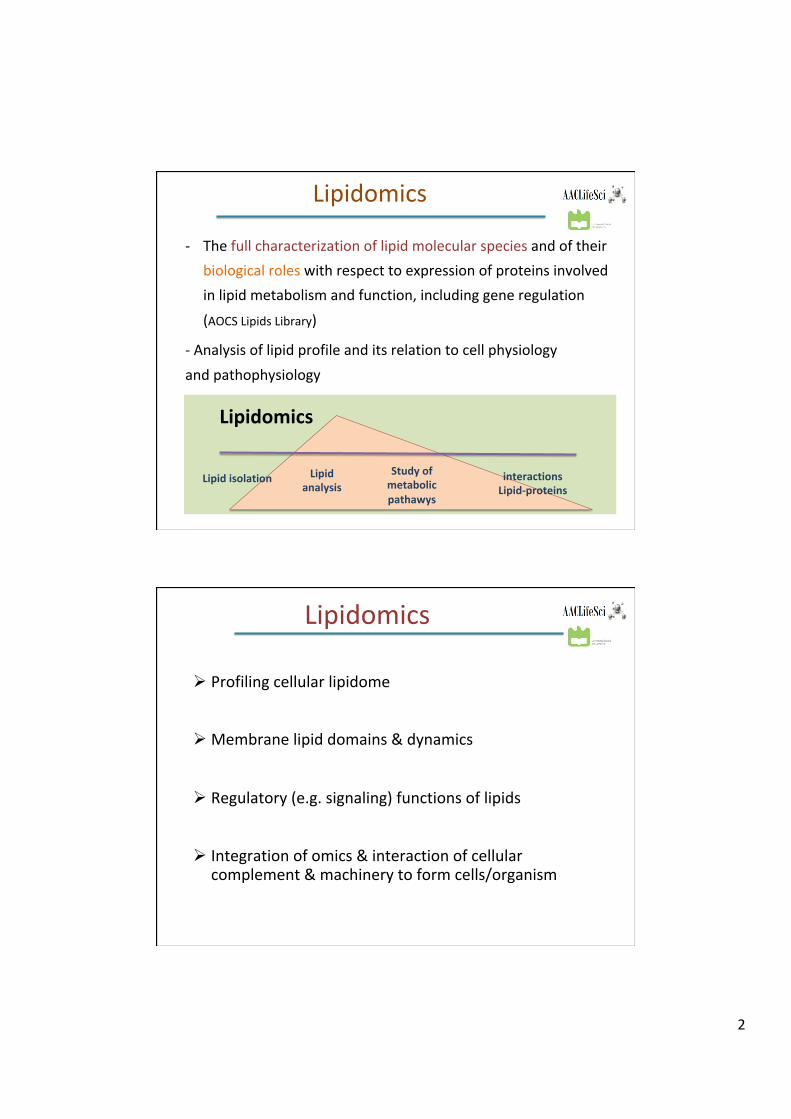
Lipidomics
- Thefullcharacterizationoflipidmolecularspeciesandoftheirbiologicalroleswithrespecttoexpressionofproteinsinvolvedinlipidmetabolismandfunction,includinggeneregulation
(AOCSLipidsLibrary)
-Analysisoflipidprofileanditsrelationtocellphysiologyandpathophysiology
Lipidomics
Lipidisolation Lipidanalysis
Studyofmetabolicpathawys
interactionsLipid-proteins
Ø Profilingcellularlipidome
Ø Membranelipiddomains&dynamics
Ø Regulatory(e.g.signaling)functionsoflipids
Ø Integrationofomics&interactionofcellularcomplement&machinerytoformcells/organism
Lipidomics
3
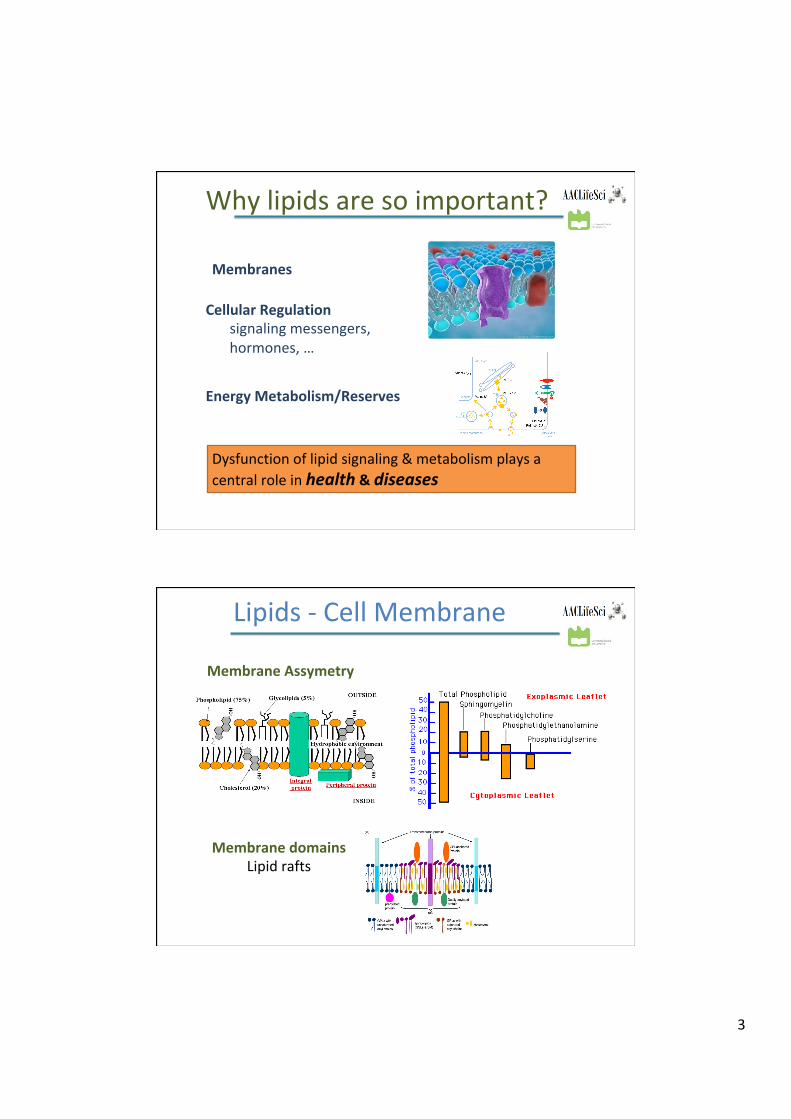
Whylipidsaresoimportant?
EnergyMetabolism/Reserves
Membranes
CellularRegulationsignalingmessengers,hormones,…
Cell membranes
Dysfunctionoflipidsignaling&metabolismplaysacentralroleinhealth&diseases
Lipids-CellMembrane
MembraneAssymetry
MembranedomainsLipidrafts

4
Lipidprofilingincell,tissuesandbiofluids
% of total acyl lipid content
GlycerolipidsChloroplast
thylakoid
innermitochondrial
membraneplasmamembrane
MGDG 51% 0 0DGDG 26 0 0SQDG 7 0 0PC 3 27 32PS 0 25 0PG 9 0 0PE 0 29 46PI 1 0 19CL 0 20 0
Eachtypeofcell,tissueandbodyfluidhaveacharacteristiclipidprofilewithadefinedlipidcompositions.
Identificationofallcellularlipids-
ProfileofPhospholipidclasses
Cardiomyocytescellline
BreastcancercellLines
Phospholipid classes quantification
Main classes of phospholipids
Rel
ativ
e ab
unda
nce
(%)
SM PC PIPS PE PA CL
0
10
20
30
40
50CTLStress**
** *
Moussebrain
LPC SM PC PI
PG PE CL-10
0
10
20
30
40
50 CONT
T1DM*
*
PL Classes
Rela
tive
Perc
enta
ge (%
)
MitochondriafromheartMitochondriafrommuscle

5
ProfileofFattyAcids
EffectsofPLfattyacidcompositioninmembraneproperties
6
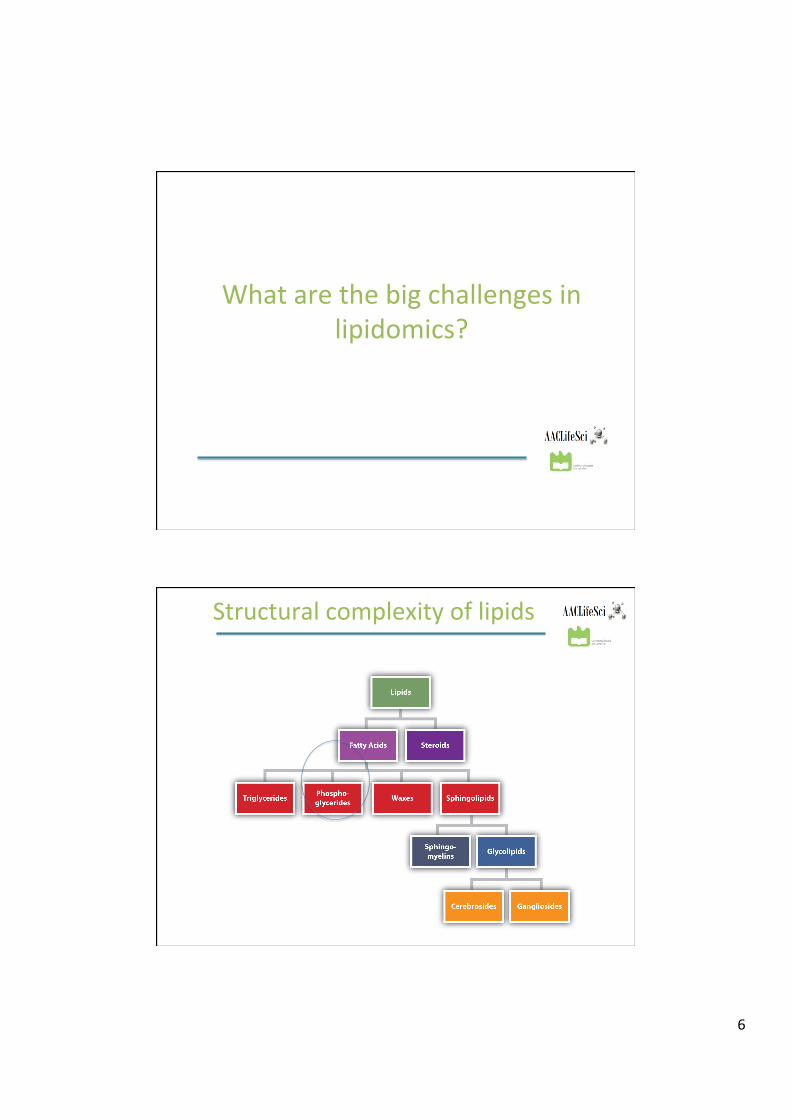
Whatarethebigchallengesinlipidomics?
Structuralcomplexityoflipids
7
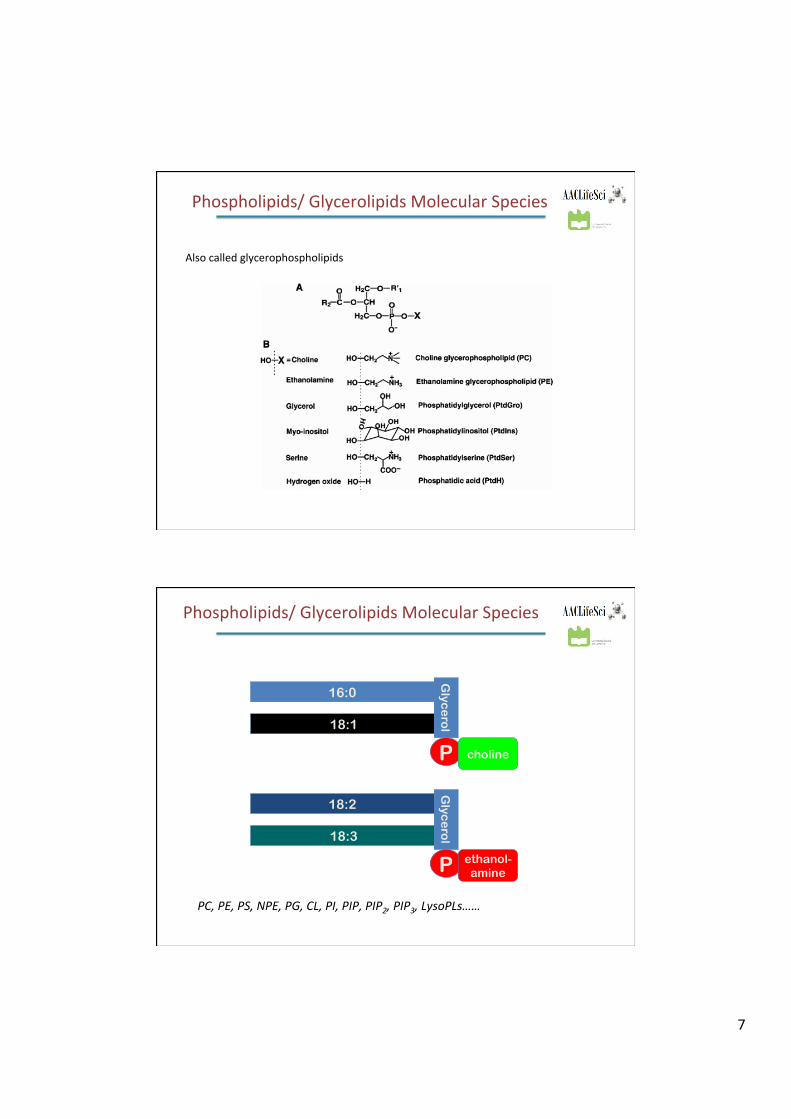
Phospholipids
Alsocalledglycerophospholipids
Phospholipids/GlycerolipidsMolecularSpecies
Phospholipids/GlycerolipidsMolecularSpecies
16:0
18:1
P choline
Glyc
ero
l
18:2
18:3
P ethanol- amine
Glyc
ero
l
PC,PE,PS,NPE,PG,CL,PI,PIP,PIP2,PIP3,LysoPLs……
8
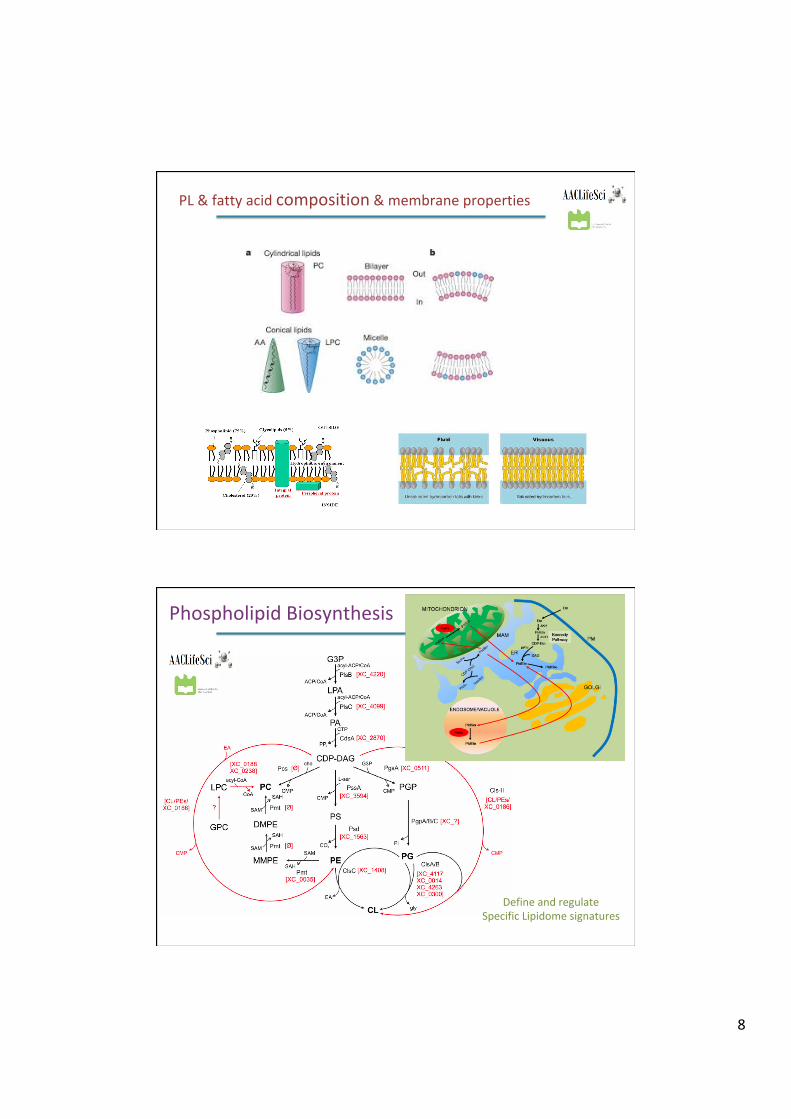
PhospholipidshapeandmembranesPL&fattyacidcomposition&membraneproperties
PhospholipidBiosynthesis
DefineandregulateSpecificLipidomesignatures
9
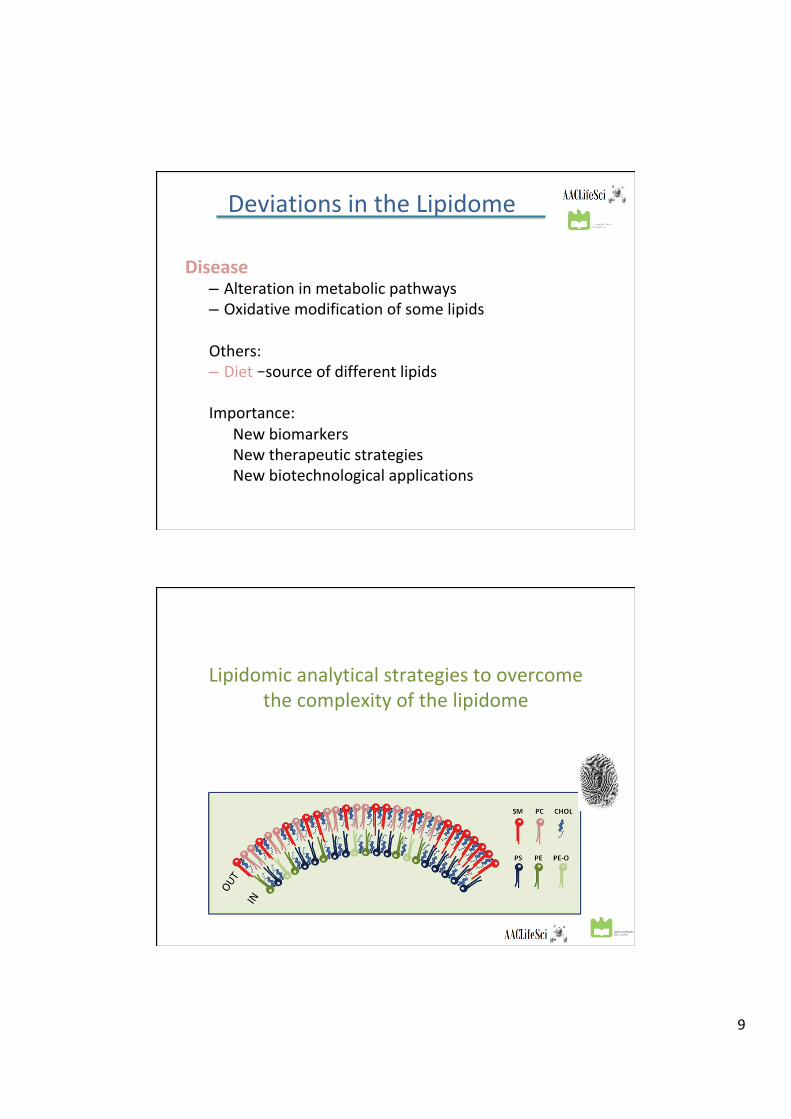
DeviationsintheLipidome
Disease– Alterationinmetabolicpathways– OxidativemodificationofsomelipidsOthers:– Diet–sourceofdifferentlipids
Importance:NewbiomarkersNewtherapeuticstrategiesNewbiotechnologicalapplications
Lipidomicanalyticalstrategiestoovercomethecomplexityofthelipidome
10
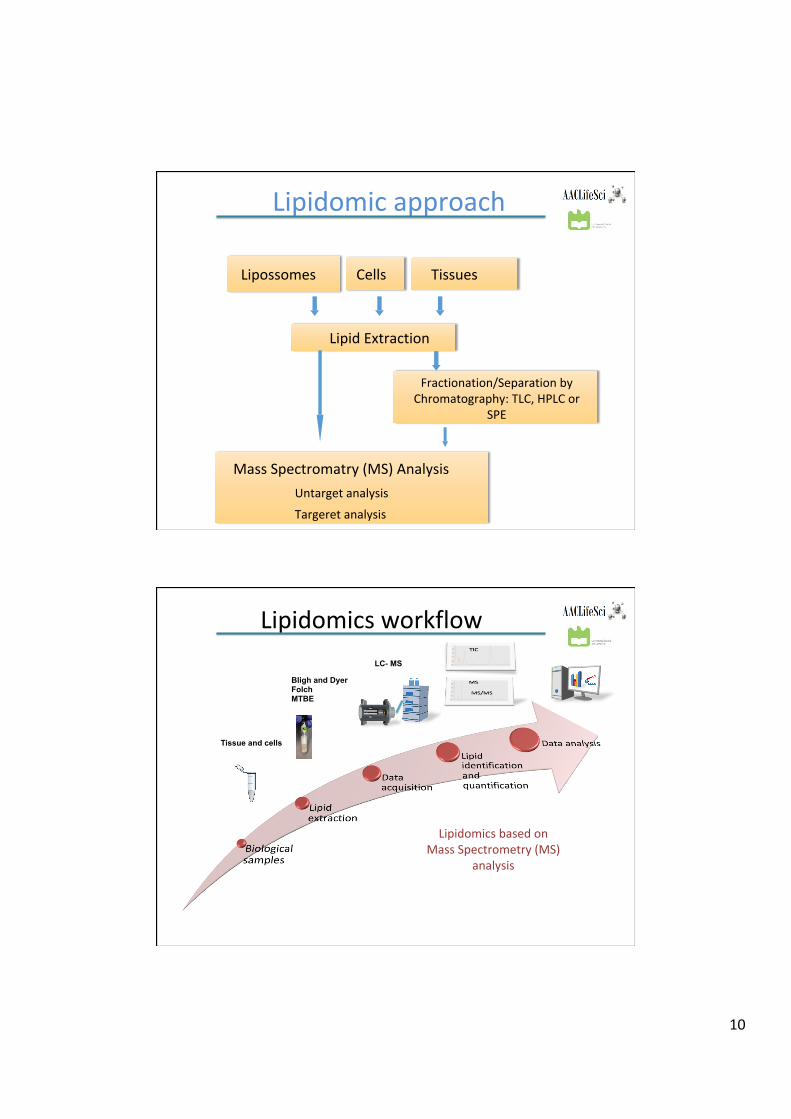
Lipidomicapproach
Lipossomes TissuesCells
LipidExtraction
Fractionation/SeparationbyChromatography:TLC,HPLCor
SPE
MassSpectromatry(MS)AnalysisUntargetanalysisTargeretanalysis
Lipidomicsworkflow
Tissue and cells
Bligh and Dyer Folch MTBE
LC- MS
LipidomicsbasedonMassSpectrometry(MS)
analysis
11
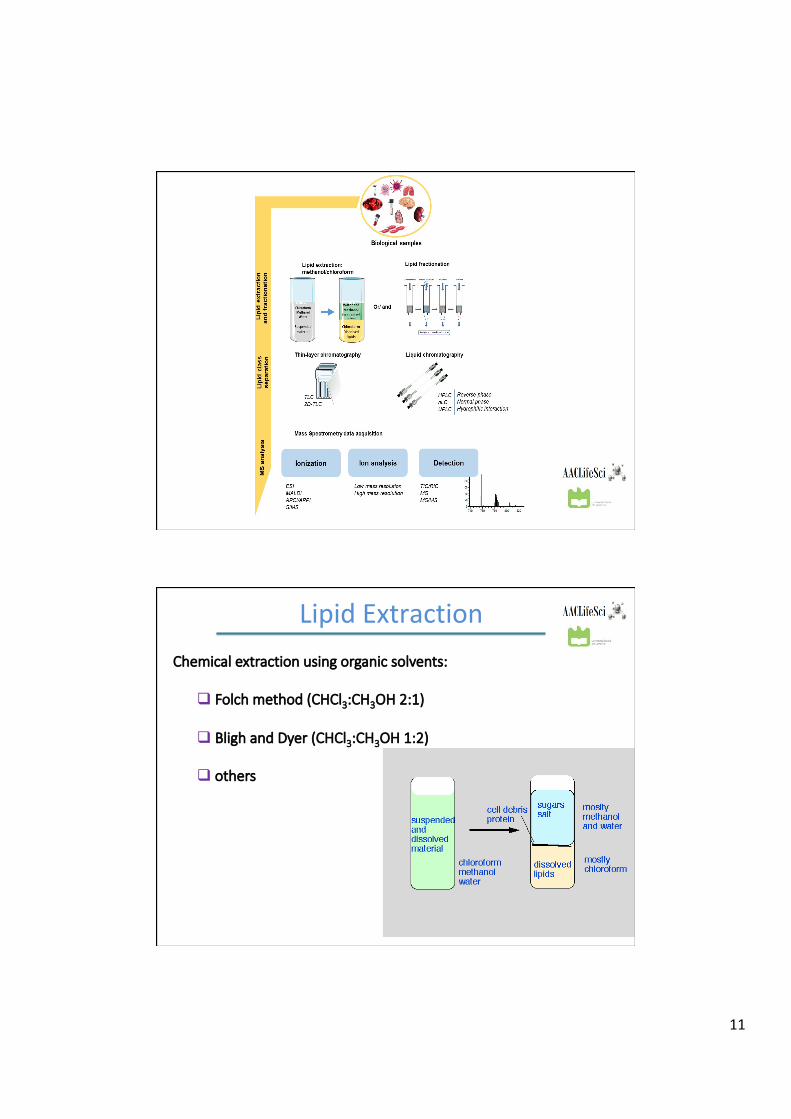
LipidExtractionChemical extraction using organic solvents:
q Folch method (CHCl3:CH3OH 2:1)
q Bligh and Dyer (CHCl3:CH3OH 1:2)
q others
12
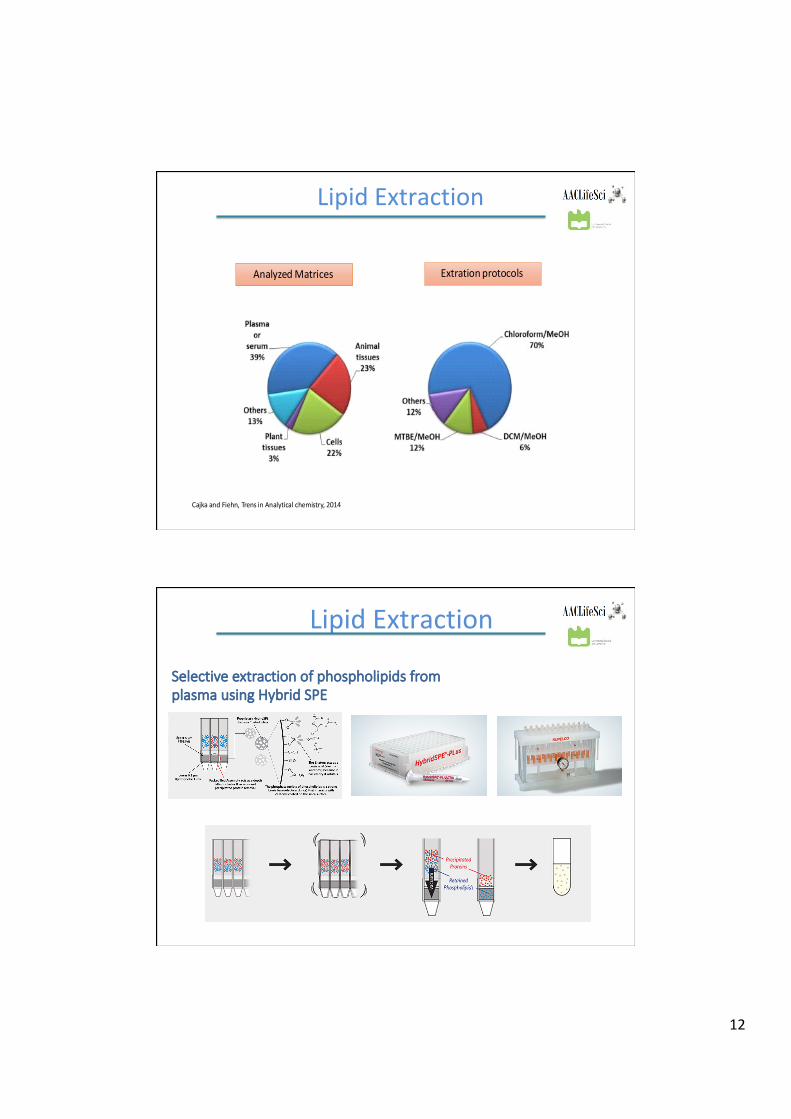
LipidExtraction
AnalyzedMatrices Extrationprotocols
CajkaandFiehn,TrensinAnalyticalchemistry,2014
LipidExtraction
Selective extraction of phospholipids from plasma using Hybrid SPE
13
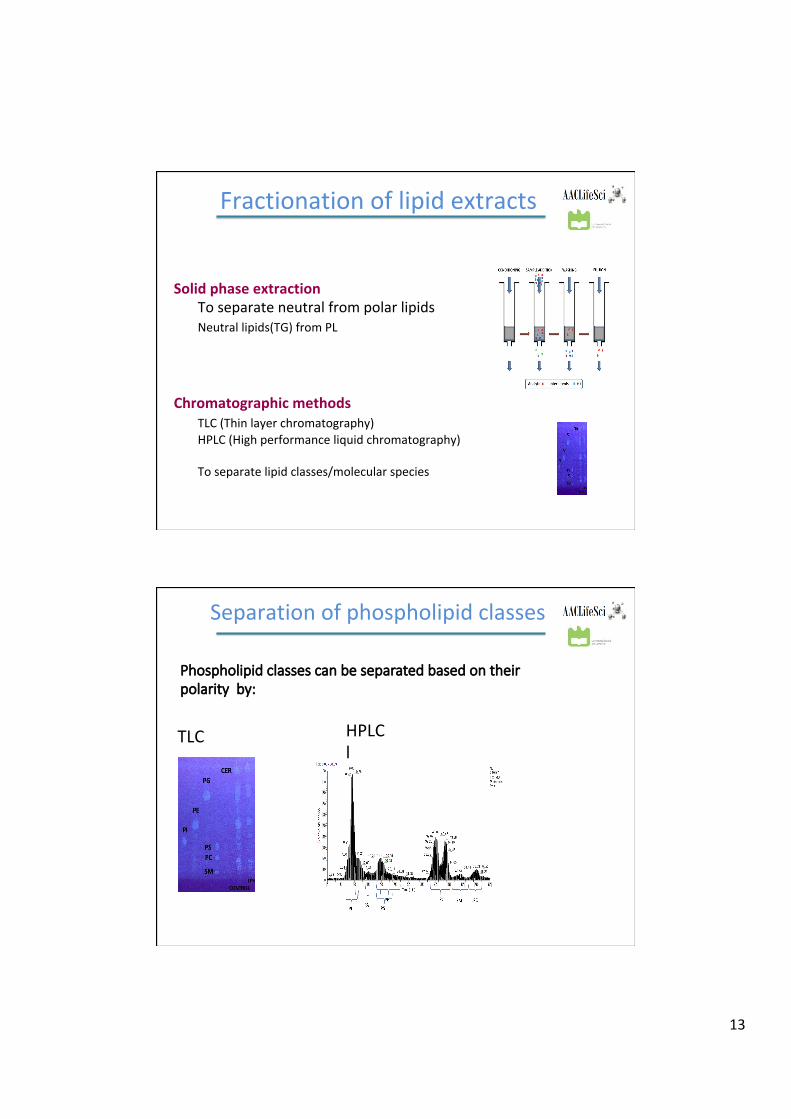
Fractionationoflipidextracts
SolidphaseextractionToseparateneutralfrompolarlipidsNeutrallipids(TG)fromPL
Chromatographicmethods
TLC(Thinlayerchromatography)HPLC(Highperformanceliquidchromatography)
Toseparatelipidclasses/molecularspecies
A
Separationofphospholipidclasses
TLC HPLCl
Phospholipid classes can be separated based on their polarity by:
14
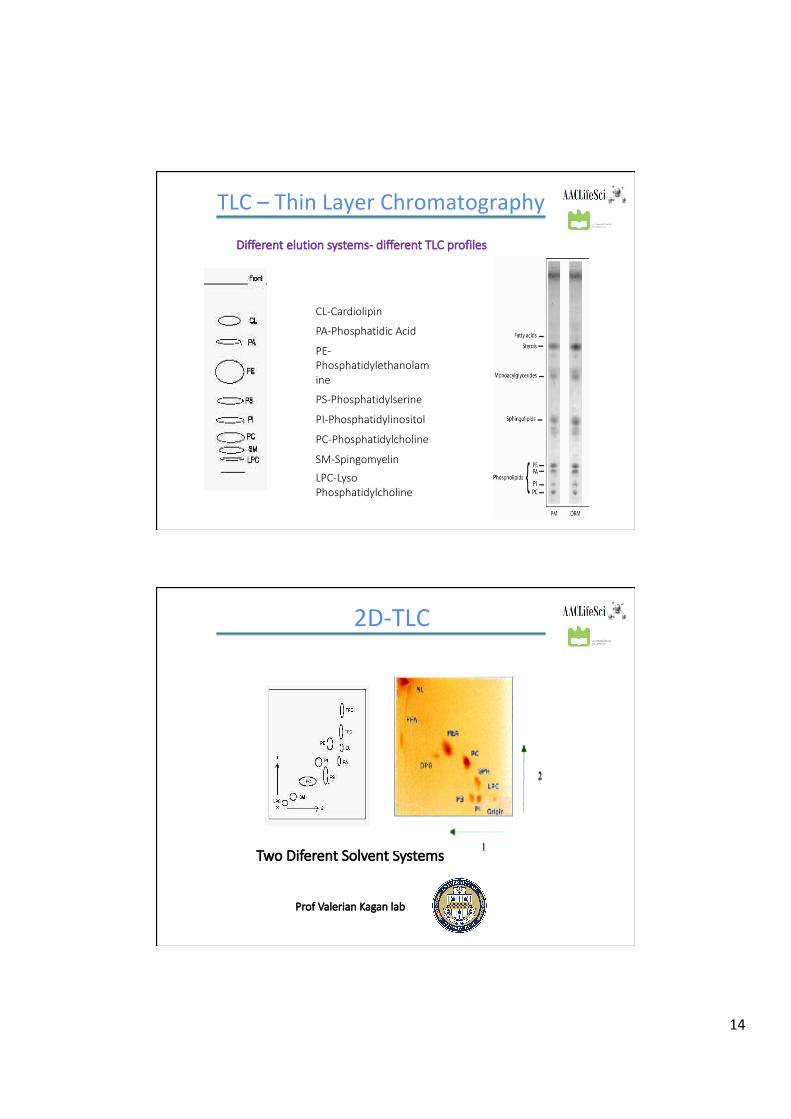
TLC–ThinLayerChromatography
CL-Cardiolipin
PA-Phosphatidic Acid
PE-Phosphatidylethanolamine
PS-Phosphatidylserine
PI-Phosphatidylinositol
PC-Phosphatidylcholine
SM-Spingomyelin
LPC-Lyso Phosphatidylcholine
Different elution systems- different TLC profiles
2D-TLC
Two Diferent Solvent Systems
Prof Valerian Kagan lab
15
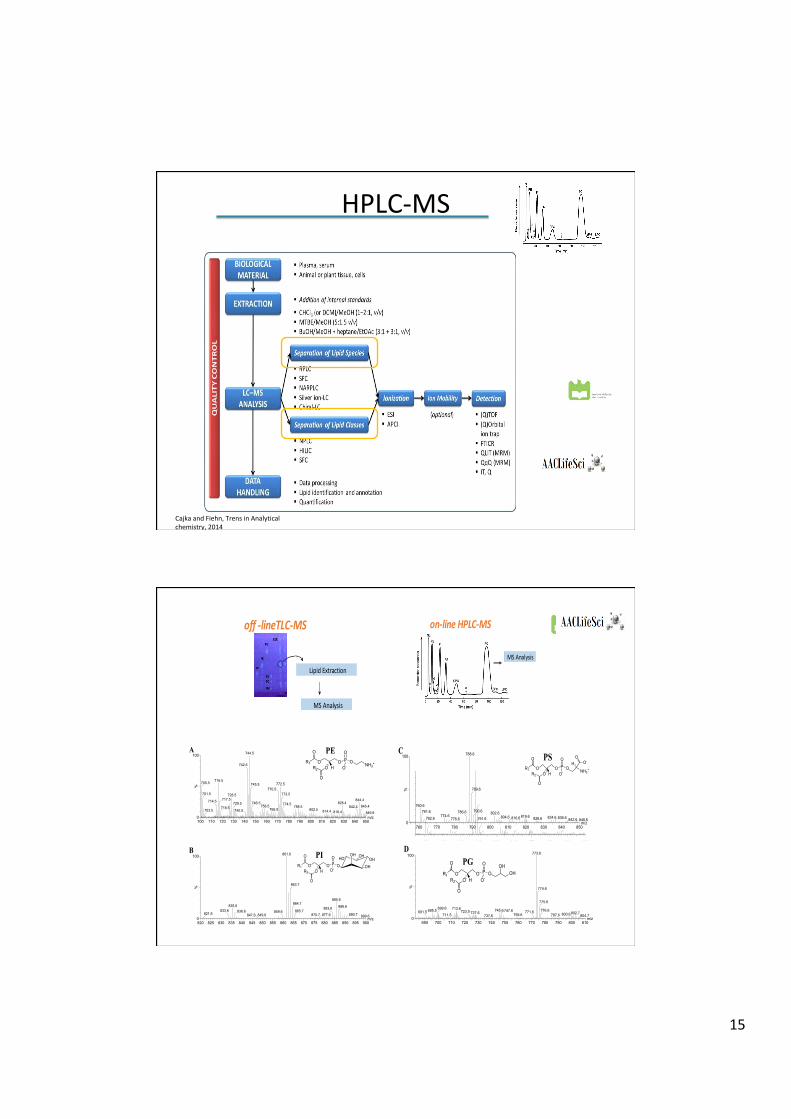
HPLC-MS
CajkaandFiehn,TrensinAnalyticalchemistry,2014
on-lineHPLC-MS
MSAnalysis
off-lineTLC-MS
LipidExtraction
MSAnalysis
m/z700 710 720 730 740 750 760 770 780 790 800 810 820 830 840 850
%
0
100 744.5
742.5
716.5700.5
701.5
714.5
703.5
728.5717.5
718.5729.5
740.5
772.5745.5770.5
746.5758.5
766.5
773.5844.4
828.4774.5788.5
802.5 814.4 818.4842.4 845.4
849.8
A
HPO-
O
O
NH3+OR1 O
O
OR2
O
PE
B PI
CPS
DPG
A PE
B PI
m/z760 770 780 790 800 810 820 830 840 850
%
0
100 788.6
760.6761.6 786.6
774.6762.6 776.6
789.6
802.6790.6
791.6 819.6804.6 810.6 834.6826.6 836.6 842.6 848.6
C
H NH3+
OO-H
PO-
O
O
O
O
OR1OR2
O
PS
DPG
A PE
m/z820 825 830 835 840 845 850 855 860 865 870 875 880 885 890 895 900
%
0
100 861.6
835.6833.6
821.6 836.6 859.6849.6847.6
863.7
885.6864.7
883.6865.7
875.7 877.6
886.6
890.7 899.6
BHO
OH
OHOH
OH
PO
O-O
R2
O
R1
O
O HO O
PI
CPS
DPG
A PE
B PI
m/z760 770 780 790 800 810 820 830 840 850
%
0
100 788.6
760.6761.6 786.6
774.6762.6 776.6
789.6
802.6790.6
791.6 819.6804.6 810.6 834.6826.6 836.6 842.6 848.6
CPS
m/z690 700 710 720 730 740 750 760 770 780 790 800 810
%
0
100 773.6
713.6695.5691.5699.6
711.5745.6727.6723.5
737.6747.6 771.6
759.6
774.6
775.6
776.6802.7800.6787.6 804.7
D
HOH
OHPO-
O
O
O
O
OR1OR2
O
PG
16
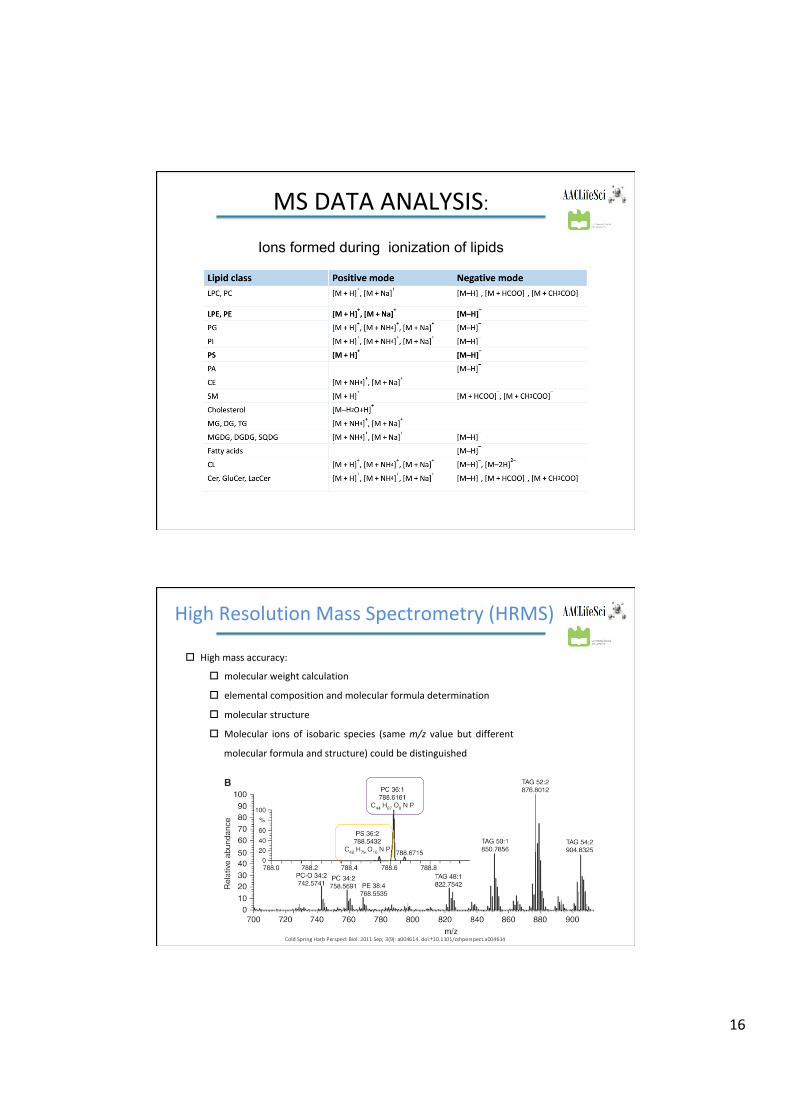
MSDATAANALYSIS:
Ions formed during ionization of lipids
HighResolutionMassSpectrometry(HRMS)
Cold Spring Harb Perspect Biol. 2011 Sep; 3(9): a004614. doi:† 10.1101/cshperspect.a004614
o Highmassaccuracy:
o molecularweightcalculation
o elementalcompositionandmolecularformuladetermination
o molecularstructure
o Molecular ions of isobaric species (samem/z value but different
molecularformulaandstructure)couldbedistinguished
17
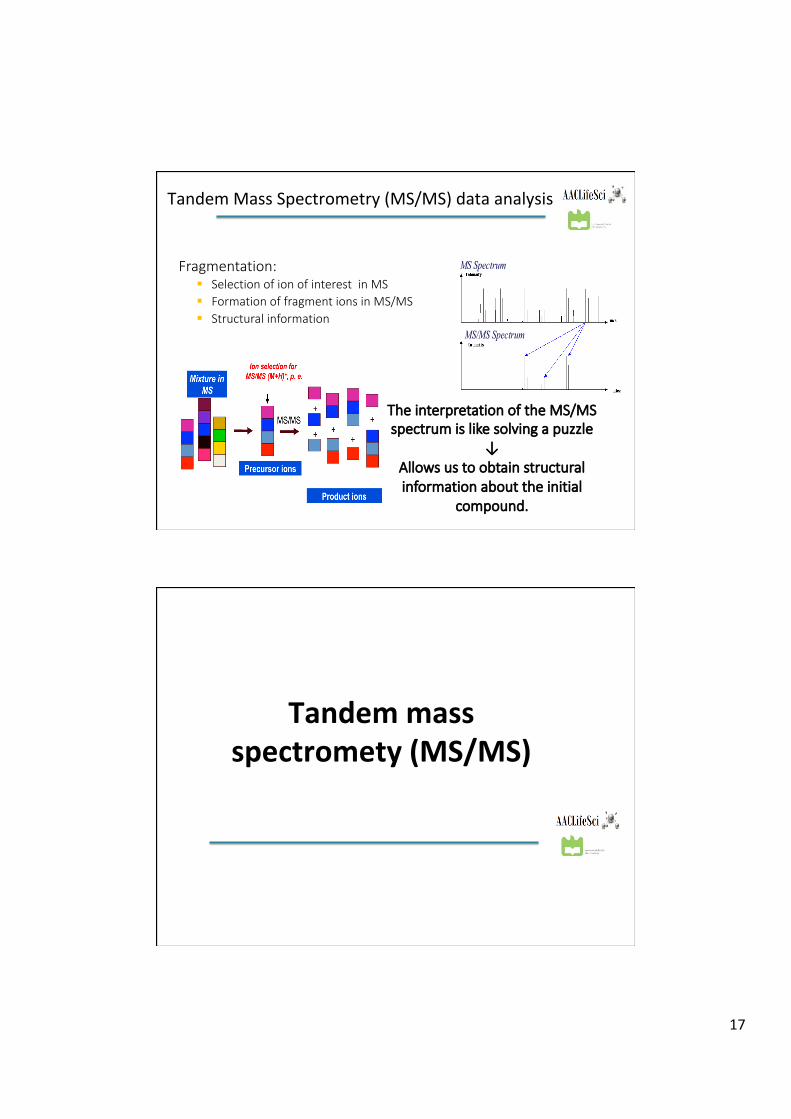
TandemMassSpectrometry(MS/MS)dataanalysis
Fragmentation: § Selection of ion of interest in MS § Formation of fragment ions in MS/MS § Structural information
MS Spectrum
MS/MS Spectrum
The interpretation of the MS/MS spectrum is like solving a puzzle
↓ Allows us to obtain structural information about the initial
compound.
Tandemmassspectromety(MS/MS)Glycerophospholipids
18
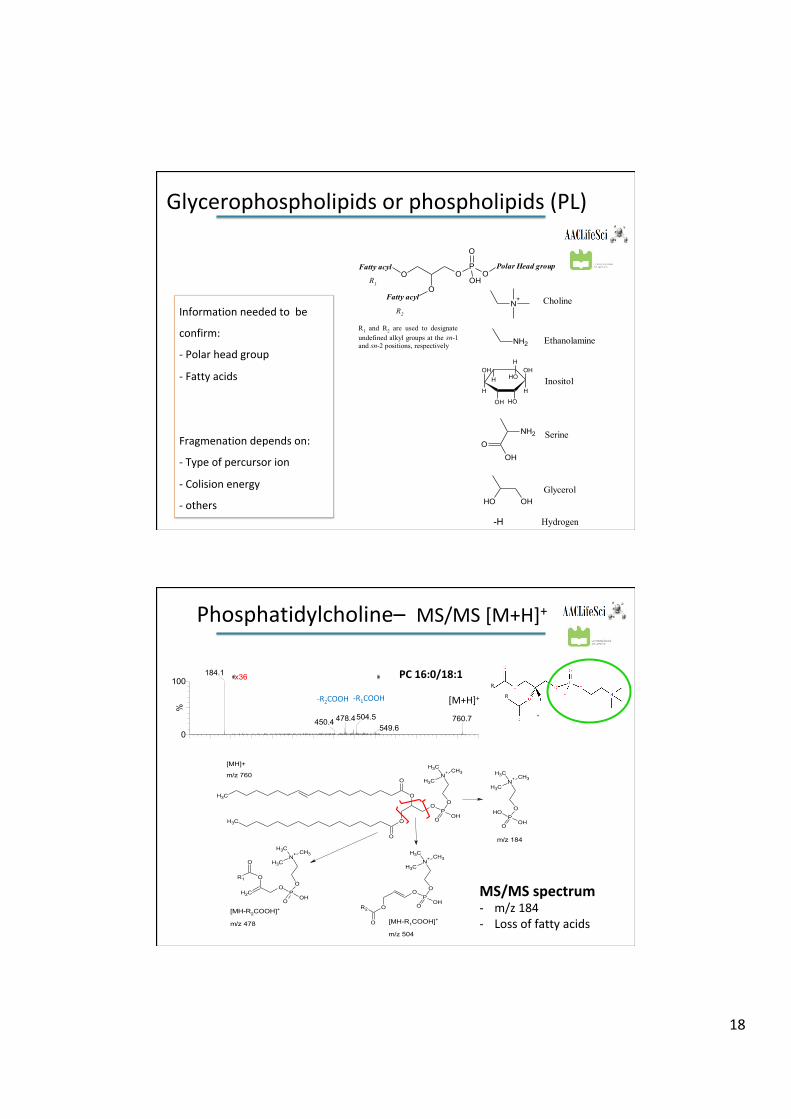
Glycerophospholipidsorphospholipids(PL)
O OP
OPolar Head group
O
O
OH
Fatty acyl
Fatty acyl
R1
R2
R1 and R2 are used to designate undefined alkyl groups at the sn-1 and sn-2 positions, respectively
N+
NH2
H
OHOH
OHOH
H
H
H
OH
NH2O
OH
OHOH
Choline
Ethanolamine
Inositol
Serine
Glycerol
-H Hydrogen
Informationneededtobe
confirm:
-Polarheadgroup
-Fattyacids
Fragmenationdependson:
-Typeofpercursorion
-Colisionenergy
-others
m/z100 200 300 400 500 600 700 800
%
0
100
%
0
100 x36184.1
478.4450.4 760.7504.5549.6
x82 599.5
147.0184.1 478.3441.2
247.3
504.4
505.2
723.5782.6
O
O
O
POH
O
O
N+ CH3
CH3
CH3
CH3
O
CH3
O
[MH-R1COOH]+
m/z 504
CH2O
O
POH
O
O
N+ CH3
CH3
CH3
R1
O
[MH-R2COOH]+
m/z 478
O
OP
OH
O
O
N+ CH3
CH3
CH3
R2
O
OHP
OH
O
O
N+ CH3
CH3
CH3
m/z 184
[MH]+
m/z 760
-R1COOH-R2COOH [M+H]+
Phosphatidylcholine–MS/MS[M+H]+
MS/MSspectrum- m/z184- Lossoffattyacids
PC16:0/18:1R
R
+
19
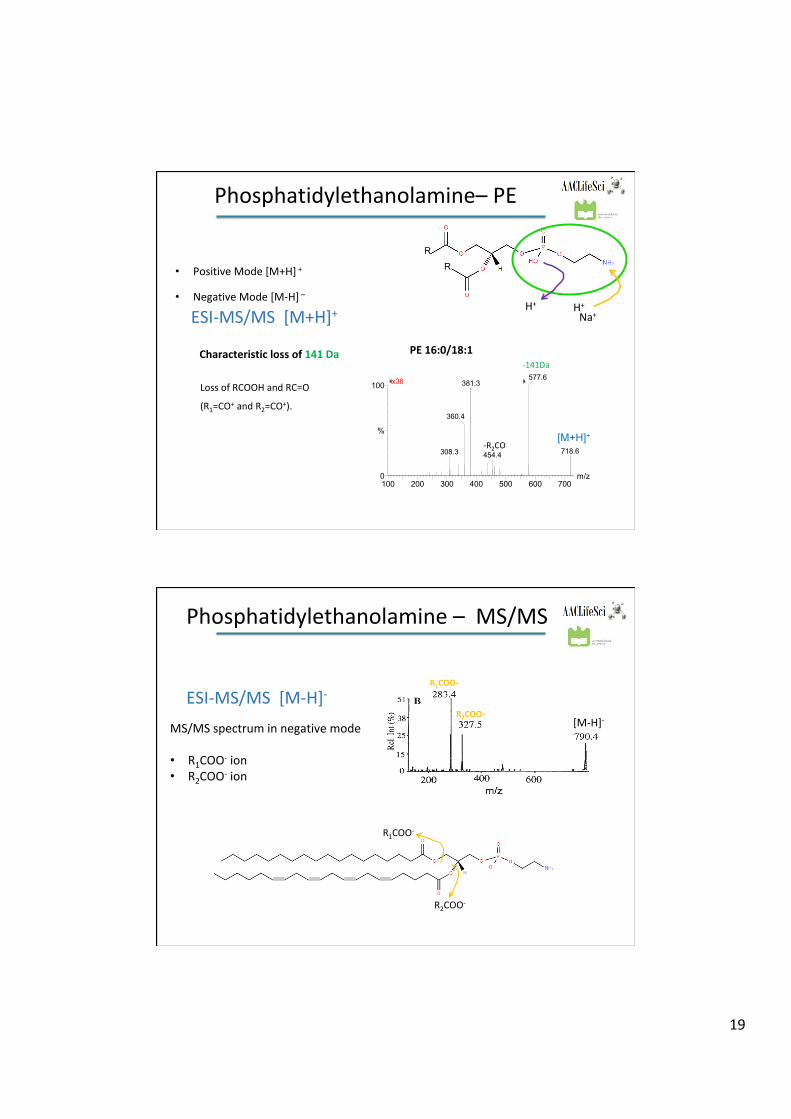
• PositiveMode[M+H]+
• NegativeMode[M-H]–
100 200 300 400 500 600 700m/z0
100
%
x36 577.6381.3
360.4
308.3 454.4 718.6-R2CO
-141Da
Phosphatidylethanolamine–PE
[M+H]+
H+Na+H+
Characteristiclossof141Da
LossofRCOOHandRC=O
(R1=CO+andR2=CO+).
ESI-MS/MS[M+H]+
R
R
PE16:0/18:1
R1COO-
R2COO- [M-H]-
[M-H]-
Phosphatidylethanolamine–MS/MS
MS/MSspectruminnegativemode• R1COO-ion• R2COO-ion
R2COO-
R1COO-
-O
ESI-MS/MS[M-H]-
20
03-Mar-201009:49:39
.
m/z500 550 600 650 700 750
%
0
100RO-RK PLPS MS760 76 (0.802) Sm (SG, 5x3.00); Cm (15:113)
1.07e3575.4
760.4576.4
[M+H]+
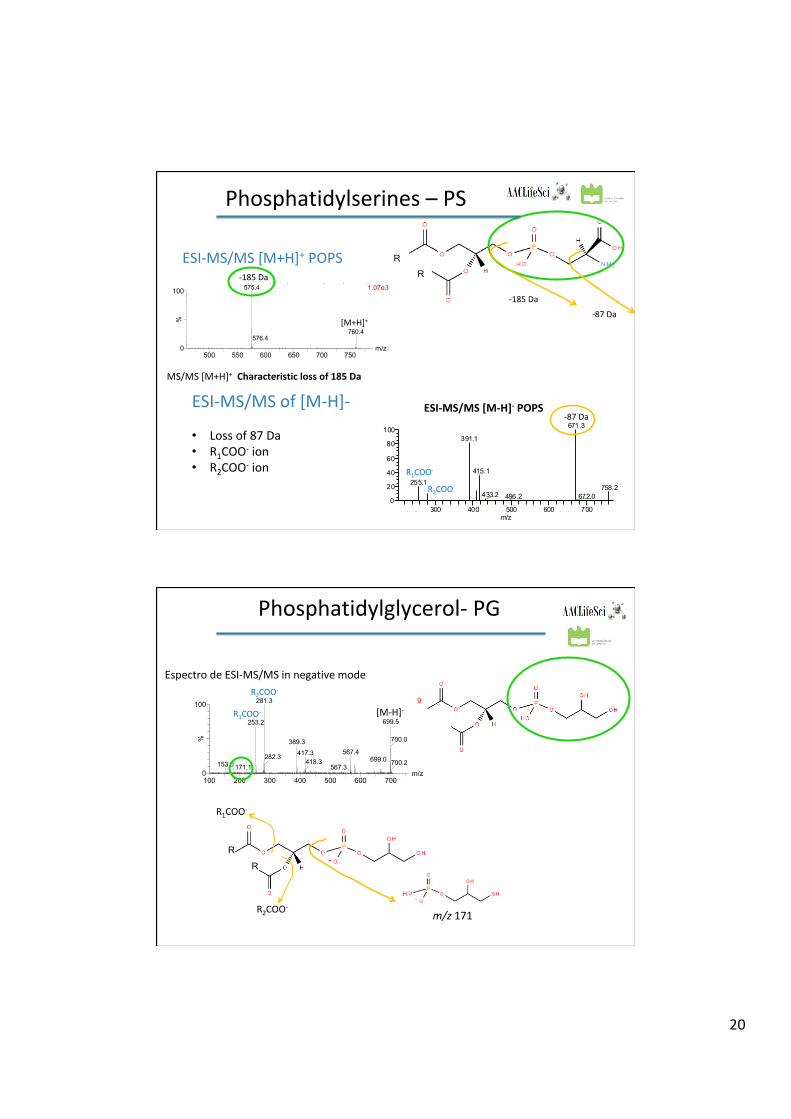
-185Da
ESI-MS/MS[M+H]+POPS
Phosphatidylserines–PS
R
R
MS/MS[M+H]+Characteristiclossof185Da
RK-PLPS neg #134-260 RT: 0.70-1.46 AV: 127 NL: 3.94E5T: ITMS - c ESI Full ms2 [email protected] [ 205.00-770.00]
300 400 500 600 700m/z
0
20
40
60
80
100
Rela
tive
Abu
ndan
ce
671.3
391.1
415.1255.1
758.2433.2 496.2 672.0
x10 -87DaESI-MS/MS[M-H]-POPSESI-MS/MSof[M-H]-
• Lossof87Da• R1COO-ion• R2COO-ion
R2COO-
R1COO-
-87Da
-185Da
m/z100 200 300 400 500 600 700
%
0
100R-D-TLC-DC-CONT-PG-2904MS699 64 (0.674) Cm (58:140)
95281.3
253.2
153.0 171.1
699.5
389.3
282.3567.4417.3
418.3567.3
699.0
700.0
700.2
[M-H]-
EspectrodeESI-MS/MSinnegativemode
Phosphatidylglycerol-PG
v
-
m/z171
H
R2COO-
R1COO-
R
R
R2COO-
R1COO-
21
R R
-
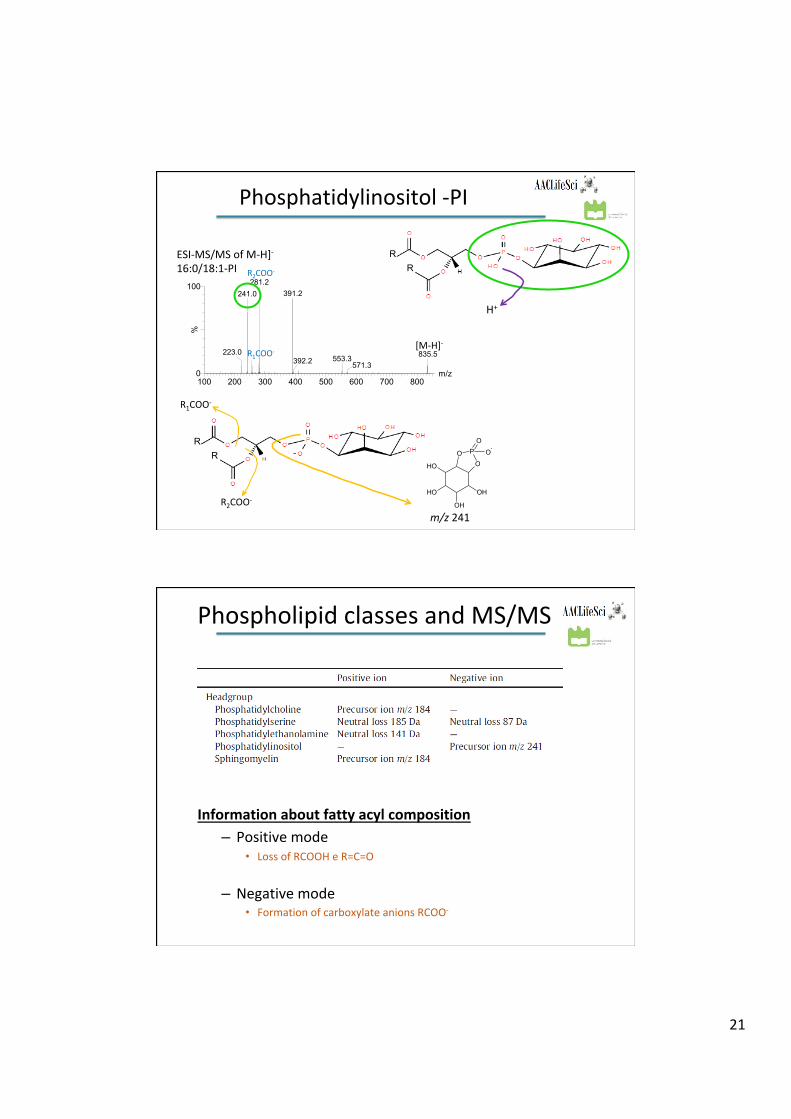
m/z241
ESI-MS/MSofM-H]-16:0/18:1-PI
Phosphatidylinositol-PI
m/z100 200 300 400 500 600 700 800
%
0
100R-GPIL-IBMC-1MS835 82 (1.266) TOF MSMS 835.50ES-
82.8281.2241.0
223.0
391.2
835.5553.3392.2 571.3
R R
H+
OH
OH
OH
OH
O PO
O
O-
R2COO-
R1COO-
[M-H]-
R2COO-
R1COO-
PhospholipidclassesandMS/MS
Informationaboutfattyacylcomposition– Positivemode
• LossofRCOOHeR=C=O
– Negativemode• FormationofcarboxylateanionsRCOO-
22
RT: 0.0 - 30.0 SM: 9B
0 5 10 15 20 25 30Time (min)
0
20
40
60
80
100
Relat
ive A
bund
ance
19.2
24.15.63.1
7.7 14.811.8
NL: 3.30E7Base Peak m/z= 480.00-525.00+700.00-1500.00 F: FTMS + p ESI Full ms [200.0000-1600.0000] MS oxHaCaT_2h_1
HT2 #5478-6045 RT: 15.75-17.33 AV: 26 NL: 8.26E7T: FTMS + p ESI Full ms [200.00-1600.00]
700 750 800 850m/z
0
20
40
60
80
100
Relat
ive A
bund
ance
782.6760.6
784.6
780.5 786.6756.6
787.6778.5 806.6 868.7840.6754.5732.5703.5
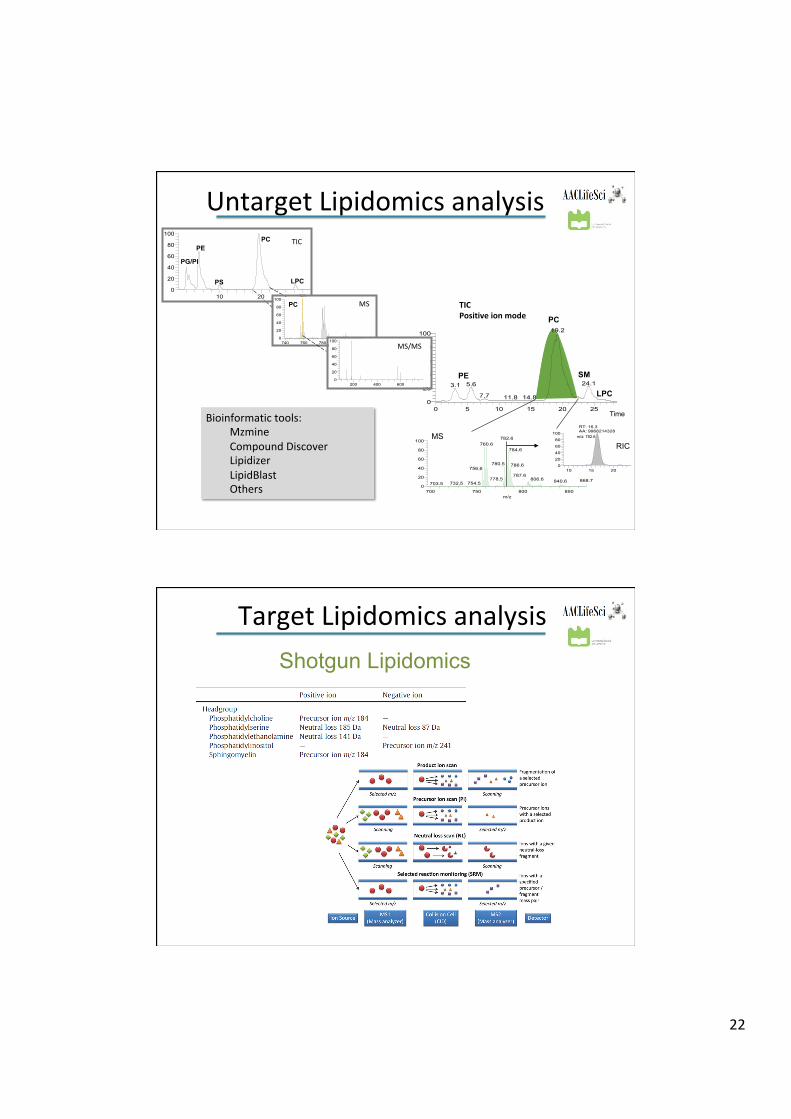
TICPositiveionmode
PE
PC
LPC
Time
10 15 20 25Time (min)
0
20
40
60
80
100
Relat
ive A
bund
ance
RT: 16.3AA: 9968214328
NL: 1.16E8m/z= 782.56-782.57 F: FTMS + p ESI Full ms [200.00-1600.00] MS ICIS HT2RIC
MS m/z: 782.6
SM
10 20 30Time (min)
0
20
40
60
80
100
Rela
tive
Abun
danc
e
740 760 780 800 820m/z
0
20
40
60
80
100
Rela
tive
Abun
danc
e
TIC
MS
200 400 600m/z
0
20
40
60
80
100
Rela
tive
Abun
danc
e MS/MS
PG/PI
PE PC
LPC PS
PC
Bioinformatictools:MzmineCompoundDiscoverLipidizerLipidBlastOthers
UntargetLipidomicsanalysis
Shotgun Lipidomics
TargetLipidomicsanalysis
23
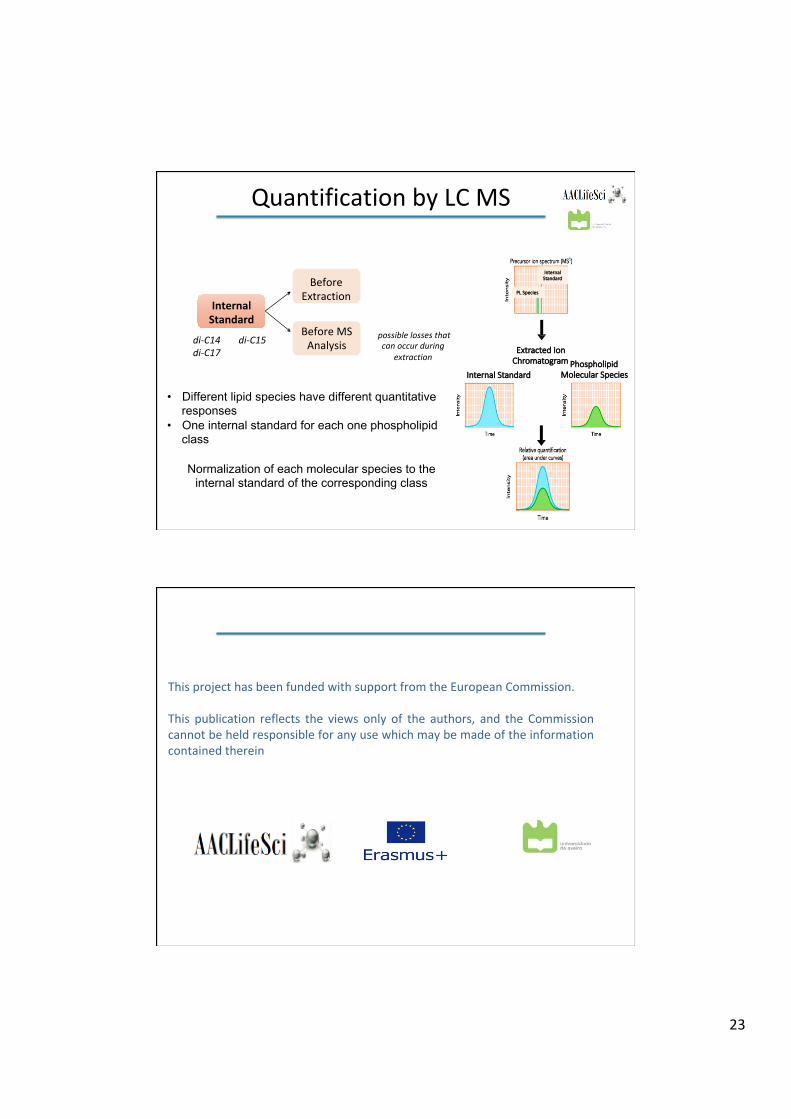
QuantificationbyLCMS
InternalStandard
BeforeMSAnalysis
• Different lipid species have different quantitative responses
• One internal standard for each one phospholipid class
Normalization of each molecular species to the internal standard of the corresponding class
possiblelossesthatcanoccurduring
extraction
di-C14 di-C15di-C17
BeforeExtraction
Internal Standard Phospholipid
Molecular Species
PL Species
Internal Standard
Extracted Ion Chromatogram
ThisprojecthasbeenfundedwithsupportfromtheEuropeanCommission.This publication reflects the views only of the authors, and the Commissioncannotbeheldresponsibleforanyusewhichmaybemadeoftheinformationcontainedtherein
Copyright © 2022 FDOKUMEN