Light-ion-induced multifragmentation: The ISiS project
67
arXiv:nucl-ex/0604012v1 20 Apr 2006 Light-Ion-Induced Multifragmentation: The ISiS Project V.E. Viola a , K. Kwiatkowski a, b , L. Beaulieu a, c , D.S. Bracken a, b , H. Breuer d , J. Brzychczyk a, e , R.T. de Souza a , D.S. Ginger a, f , W-c. Hsi a , R.G. Korteling g , T.Lefort a, h , W.G. Lynch i , K.B. Morley a, b , R. Legrain ℓ, p , L. Pienkowski k , E.C. Pollacco j , E. Renshaw a, ℓ , A. Ruangma m, n M.B. Tsang i , C. Volant j , G. Wang a, o , S.J. Yennello m a Indiana University,Bloomington, IN 47405 b present address: Los Alamos National Laboratory, Los Alamos, NM 87545 c present address: Laval University, Quebec City, Canada G1K 7P4 d University of Maryland, College Park, MD 20740 e Jagellonian University, Krakow, Poland f present address: University of Washington, Seattle, WA g Simon Fraser University, Burnaby BC, Canada V5A IS6 h present address: University of Caen, Caen, France i National Superconducting Laboratory, Michigan State University, East Lansing, MI 48824 j CEA Saclay, Saclay, France k Warsaw University, Warsaw, Poland ℓ present address: Microsoft Corporation,Redmond, WA 98052 m Texas A& M University, College Station, TX 77843 n present address: Siriraj Hospital, Bangkok, 10700 Thailand o present address: Epsilon Corp., Irving, TX p deceased Abstract An extensive study of GeV light-ion-induced multifragmentation and its possible interpretation in terms of a nuclear liquid-gas phase transition has been performed with the Indiana Silicon Sphere (ISiS) 4π detector array. Measurements were per- formed with 5-15 GeV/c p, p, and π − beams incident on 197 Au and 2-5 GeV 3 He incident on nat Ag and 197 Au targets. Both the reaction dynamics and the subse- quent decay of the heavy residues have been explored. The data provide evidence Preprint submitted to Elsevier Science 8 February 2008
Transcript of Light-ion-induced multifragmentation: The ISiS project

arX
iv:n
ucl-
ex/0
6040
12v1
20
Apr
200
6
Light-Ion-Induced Multifragmentation:
The ISiS Project
V.E. Viola a, K. Kwiatkowskia, b, L. Beaulieua, c,
D.S. Brackena, b, H. Breuer d, J. Brzychczyka, e, R.T. de Souza a,D.S. Gingera, f , W-c. Hsi a, R.G. Korteling g, T.Leforta, h,
W.G. Lynch i, K.B. Morleya, b, R. Legrainℓ, p, L. Pienkowski k,E.C. Pollacco j, E. Renshawa, ℓ, A. Ruangmam, n M.B. Tsang i,
C. Volant j, G. Wanga, o, S.J. Yennello m
aIndiana University,Bloomington, IN 47405
bpresent address: Los Alamos National Laboratory, Los Alamos, NM 87545
cpresent address: Laval University, Quebec City, Canada G1K 7P4
dUniversity of Maryland, College Park, MD 20740
eJagellonian University, Krakow, Poland
fpresent address: University of Washington, Seattle, WA
gSimon Fraser University, Burnaby BC, Canada V5A IS6
hpresent address: University of Caen, Caen, France
iNational Superconducting Laboratory, Michigan State University, East Lansing,
MI 48824
jCEA Saclay, Saclay, France
kWarsaw University, Warsaw, Poland
ℓpresent address: Microsoft Corporation,Redmond, WA 98052
mTexas A& M University, College Station, TX 77843
npresent address: Siriraj Hospital, Bangkok, 10700 Thailand
opresent address: Epsilon Corp., Irving, TX
pdeceased
Abstract
An extensive study of GeV light-ion-induced multifragmentation and its possibleinterpretation in terms of a nuclear liquid-gas phase transition has been performedwith the Indiana Silicon Sphere (ISiS) 4π detector array. Measurements were per-formed with 5-15 GeV/c p, p, and π− beams incident on 197Au and 2-5 GeV 3Heincident on natAg and 197Au targets. Both the reaction dynamics and the subse-quent decay of the heavy residues have been explored. The data provide evidence
Preprint submitted to Elsevier Science 8 February 2008

for a dramatic change in the reaction observables near an excitation energy of E*/A= 4-5 MeV per residue nucleon. In this region, fragment multiplicities and energyspectra indicate emission from an expanded/dilute source on a very short time scale(20-50 fm/c). These properties, along with caloric curve and scaling-law behavior,yield a pattern that is consistent with a nuclear liquid-gas phase transition.
Key words: 4π detector array,multifragmentation,reaction dynamics, nucleardensity, reaction time scale, caloric curve, scaling laws, liquid-gas phase transitionPACS: 25.70.Pq, 25.55.-e
Contents
1. Introduction
2. The ISiS Experimental Program
3. Reaction Dynamics
3.1 Excitation Energy Deposition
3.2 BUU Simulations
3.3 Sideways Peaking
4. Statistical Decay Multifragmentation
4.1 Calorimetry
4.2 Thermal Observables
4.2.1 Fragment Spectra
4.2.2 Multiplicities
4.2.3 Charge Distributions
4.3.4 Cross Sections
4.2.5 Source Charge
4.3 Breakup Density and Expansion
4.4 Breakup Time Scale
5. Thermodynamics
2

5.1 The Caloric Curve: Isotope-ratio Temperatures
5.2 The Caloric Curve: Density-dependent Fermi Gas Temperatures
5.3 Heat Capacity
6. The Liquid-Gas Phase Transition: Scaling Law Behavior
7. Summary and Conclusions
8. Acknowledgements
1 Introduction
One of the most important signals of the formation of hot nuclear matter isthe emission of nuclear clusters, or intermediate-mass fragments (IMF: 3 ≤ Z. 20). From studies of the IMF yields in energetic nuclear reactions one hopesto gain greater insight into the thermodynamics of highly-excited nuclei andthe nuclear equation-of-state at low densities. An important aspect of suchstudies is the identification of a possible nuclear liquid-gas phase transition[1,2,3].
IMF emission was first observed in the 1950’s, when beams of protons andalpha particles with energies in the GeV range became available. Emulsionand radiochemical measurements of the reaction products showed that theprobability for cluster emission increased strongly with beam energy, sug-gesting their association with the decay of highly excited nuclei. The emul-sion measurements also provided evidence for multiple fragment emission, ormultifragmentation. These data led to the concept that the reaction mecha-nism could be schematically viewed in terms of a two-step intranuclear cas-cade/statistical emission model, with IMFs emitted primarily in the evapora-tion stage. One complication with this model was the observation that lighterclusters exhibited forward-peaked angular distributions, suggesting that aprompt non-statistical mechanism must also be present. Another perceptiveproposal was that pion production and reabsorbtion could be a major mecha-nism for excitation-energy deposition in the heavy residual nucleus[4,5]. Thesestudies, carried out at Lawrence Berkeley Laboratory, Brookhaven NationalLaboratory and in Russia, laid the groundwork for future studies and arereviewed in [6,7,8,9].
The development of silicon semiconductor detectors in the 1960’s made itpossible to perform measurements of inclusive IMF yields and kinetic energyspectra. Bombardments of heavy targets with 5 GeV protons provided a moresystematic understanding of the earlier work, and showed clearly the exis-
3

tence of two mechanisms for IMF production – one equilibrium-like and theother a fast nonequilibrium process [10,11]. An important aspect of the spec-tra was a downward shift in the apparent Coulomb barrier relative to lowerenergy reactions. It was suggested that this shift was due to a modified densitydistribution, perhaps due to an expanded source. Later, similar inclusive mea-surements with protons up to 350 GeV [12] confirmed radiochemical studiesthat indicated the IMF emission probability reaches a maximum near 10 GeVand remains constant thereafter [13]. These later measurements also trackedthe evolution of the Coulomb peak displacement with beam energy, and foundits onset to be near 4 GeV. This result was interpreted as a possible sign ofcritical behavior [1,14], and stimulated widespread interest in this possibility.
To search for more conclusive evidence of a phase transition and critical be-havior, it was necessary to develop large-solid angle detector arrays to providefragment kinetic-energy spectra, multiplicity information, event topology andcalorimetry. Among the most important features of such a device are: (1) nu-clide (Z and A) identification of all products, including neutrons, (2) spatialcharacterization with good granularity; (3) low detection thresholds; (4) goodenergy resolution over a large dynamic range and (5) efficient, reliable de-tector calibration techniques. Another important factor in detector design isthe geometry imposed by reaction kinematics; e.g. IMF fragment distributionsare nearly isotropic in light-ion-induced reactions, with a small component inthe beam direction, whereas they are strongly forward-focused in heavy-ionreactions.
With improvements in detector and data-acquisition techniques, it becamepossible to construct complex detector arrays for performing exclusive mea-surements that met most, but not all, of the above conditions for complexfragments. The first such array was the LBL Plastic Ball/Wall [15], whichdemonstrated the existence of events with high multiplicities of IMFs andlight-charged particles (LCP: Z = 1,2) [16]. Later measurements at LNS Saclayconfirmed the high IMF multiplicities and yield dependence on bombardingenergy [17]. These measurements also showed that the IMF spectral peak en-ergies decreased as a function of increasing multiplicity, consistent with theexpansion scenario. Subsequently, several 4π detector arrays were constructedfor the study of light-ion induced multifragmentation: the EOS TPC [18], theBerlin Silicon/Neutron Ball [19], the Dubna FASA array [20] and the IndianaSilicon Sphere (ISiS) [21]. At the same time heavy-ion accelerator technologyhad advanced to the stage where it became possible to study multifragmenta-tion in A + A reactions, which lead to the construction of several additionaldetectors [22,23,24,25,26,27]. At the outset it should be stressed that there isgeneral concordance among the results of all of these projects with those fromISiS, as can be found in [27]. In the following sections, we survey the salientresults of the ISiS program with GeV light-ion projectiles, and address thequestion: is there evidence for a nuclear liquid-gas phase transition?
4

2 The ISiS Experimental Program
The Indiana Silicon Sphere project was initiated in the late 1980’s with a spe-cific focus on GeV light-ion-induced reactions on heavy nuclei. Light ions bringa unique perspective to multifragmentation studies in that they emphasize thethermal properties of the disintegrating residue, with minimal distortions ofthe spectra due to rotational and compressional effects. Experimentally, GeVlight ion beams form only one emitting source, which decays in a referenceframe that is very close to that of the source frame (source velocities ∼ 0.01c).In addition, the energy-deposition mechanism produces a continuous distribu-tion of excitation energies, permitting broad coverage of the excitation energydistribution in a single reaction.
Based upon previous inclusive and semi-exclusive studies [17], the ISiS 4πarray was designed in a spherical geometry, with very low detector thresholdsand a large dynamic range for LCPs [LCP = H and He] and IMFs [21]. Particleidentification was based on triple telescopes composed of an ion-implantedsilicon detector, preceded by a gas-ion chamber for low energy fragments andfollowed by a CsI (Tℓ) crystal for the most energetic particles, primarily LCPs.An overall schematic diagram of ISiS is shown in Fig. 1, accompanied by aphoto in Fig. 2. The array consists of 162 particle-identification telescopes, 90covering the angles 14◦-86.4◦ and 72 spanning 93.6◦-166◦. The telescopes arearranged in eight rings, each of which is composed of 18 truncated ion-chamberhousings. In the forward-most ring, the Si and CsI detectors were divided intotwo segments to increase granularity. Detector acceptance was 74% of 4π.
A schematic drawing of the detector telescopes is shown in Fig. 3. The de-tectors are mounted in gold-plated, high-conductivity copper cans. The firstelement in each telescope (∆E) is an axial-field gas-ionization chamber (GIC),operated at ∼ 200 V and a pressure of 15-20 Torr of C3F8 gas. These con-ditions permitted identification of fragments with energies as low as ∼ 0.8MeV/nucleon. All detectors operate in a common gas volume in each hemi-sphere, with vacuum isolation provided by a ∼ 120-150 µg/cm2 stretchedpolypropylene window covered with a thin graphite coating. The ion cham-bers are followed by an ion-implanted silicon detector of thickness 500 µm,which is sufficient to stop E/A ∼ 8 MeV LCPs and IMFs. The GIC-Si tele-scopes provided Z resolution for Z = 1 – 16 fragments in the energy intervalfrom E/A ∼ 0.8-8.0 MeV. Due to the GIC energy resolution, mass identifica-tion was not possible in the GIC/Si pair. The final element of each telescopewas a 28 mm-thick CsI(Tℓ) crystal, read out by a photodiode. These crystalsprovided an energy acceptance of 1 MeV . E/A ≤ 92 MeV. The Si-CsI(Tl)pair provided Z and A identification for 8 MeV ≤ E/A ≤ 92 MeV particlesand “grey particle” detection for fast protons and pions up to ∼ 350 MeV.The ISiS telescopes did not detect neutrons or Z-identify heavy residues and
5

Fig. 1. Assembly drawing of the ISiS detector array. Components are as follows: (1)center support ring; (2) gas-vacuum separation window; (3) arc support bars; (4)partition disks; (5) beamline support cones; (6) target ladder assembly; (7) steelrails for opening housing cans and (8) vacuum chamber.
fission fragments.
Detector signals were shaped and amplified by means of charge-sensing pream-plifier/linear shaper NIM units, with gains custom-designed for each detectortype. Analog signals were digitized by 12-bit 16-channel peak-sensing ADCsand fast signal discrimination and multiplicity sensing was accomplished with16-channel discriminators and time-to-digital converters. Voltages for each de-tector type were supplied by in-house-designed, computer-controlled bias sup-ply units.
The event hardware trigger was generated from the fast outputs of the dis-criminators and required a minimum of three detected particles. This criterionwas imposed by the high backgrounds associated with synchrotrom accelera-tors and biased the data against low-excitation energy events (E*A . 1 MeV).In software, only events with three thermal particles, one of which with Z ≥ 2,were accepted. More complete details for the ISiS array can be found in [21].
6

Fig. 2. Photograph of the ISiS detector loaded with detector telescopes.
Three multifragmentation campaigns were carried out with ISiS: (1) E228 with1.8 -4.8 GeV 3He ions at the Laboratoire National Saturne in Saclay, France;(2) E900 at the Brookhaven AGS accelerator with 5.0-14.6 GeV/c proton andπ− beams; and (3) E900a at AGS with tagged 8.0 GeV/c antiproton and π−
beams. The number of events with each beam is summarized in Table 1.
In the following sections we present the results obtained with ISiS. We firstexamine the collision dynamics, then the thermal observables, and finally thethermodynamics and scaling-law behavior of the data.
3 Reaction Dynamics
3.1 Excitation Energy Deposition
In GeV light-ion-induced reactions the dissipation of radial beam energy intointernal excitation of the target-like residue proceeds through a complex fastcascade of nucleon-nucleon collisions. This mechanism is abetted by the ex-citation of ∆ and higher resonances, followed by the reabsorbtion of some ofthe decay pions [28,29,30,31,32]. For antiproton beams, excitation-energy de-position is further enhanced by the reabsorbtion of some fraction of the 4-5
7

Fig. 3. Drawing of an ISiS arc bar segment for the forward hemisphere with theangular coverage of each telescope labeled. Each segment is part of an 18-memberring; the forward-most element is divided into two segments. Forward-angle ringsare identified as follows: 14-22◦; 22-33◦; 33-52◦; 52-69◦; 69-86.4◦ . Backward-anglerings are: 93.6-111◦ ; 111-128◦ ; 128-147◦ ; and 147-166◦ .
annihilation pions [33]. Although the energy dissipation process is relativelyinefficient, the cascade step is capable of imparting up to ∼ 2 GeV of excitationenergy in heavy nuclei. Equally important, randomized/equilibrated residuesare produced with a continuous distribution of excitation energies, essentiallyproviding nearly a complete excitation function in a single reaction.
Fig. 4 depicts the predictions of a BUU (Boltzmann-Uehling-Uhlenbeck) cal-culation [34,35] that traces the time and density evolution of a central (b =2.0 fm) collision between a 14.6 GeV/c proton and a 197Au nucleus. Initially,a local density depletion develops along the projectile trajectory as forward-focused nucleons are ejected on a fast time scale. After about 30 fm/c thenuclear matter density becomes more uniform, indicating a random distribu-tion of nucleons. However, the average density is observed to be significantlylower than that of the original target, creating a hot, dilute nucleus. As thereaction time increases, the angular distribution of the emitted particles be-comes more isotropic. At this point the distinction between low-energy cascadenucleons (nonequilibrium) and evaporative nucleons becomes blurred. Also, itis significant to notice that the heavy residue trajectory has a componenttransverse to the beam direction.
8

Table 1Number of events analyzed for each system (in parentheses). Event acceptance re-quires at least three thermal charged particles in silicon detectors, one of whichmust have Z ≥ 2.
Beam Target Energy/Momentum
π− 197Au 5.0 GeV/c 8.0 GeV/c∗ 8.2 GeV/c 9.2 GeV/c
(1.0 × 10⁶) (2.5 × 10⁶) (2.4 × 10⁶) (1.4 × 10⁶)
p 197Au 6.2 GeV/c 9.2 GeV/c 12.8 GeV/c 14.6 GeV/c
(2.4 × 10⁵) (1.7 × 10⁶ ) (1.4 × 10⁶) (1.1 × 10⁶)
p̄ 197Au 8.0 GeV/c∗
(5.5 × 10⁴)
3He natAg 1.8 GeV 3.6 GeV 4.8 GeV
(4.9 × 10⁶) (3.0 × 10⁶) (1.9 × 10⁶)
197Au 1.8 GeV 4.8 GeV
(4.0 × 10⁵) (2.9 × 10⁶)
∗tagged beam
In Fig. 5 the effect of entrance-channel beam momentum on excitation energyper nucleon (E*/A), average density (< ρ>/ρ0), entropy per nucleon (S/A)and residue mass (A) is explored as a function of time. Calculations are foran impact parameter b = 2.0 fm for the p + 197Au reaction at momentaof 6.2, 10.2, 12.8 and 14.6 GeV/c. It is observed that the excitation energyand entropy per nucleon increase with beam momenta, while the source massand average density decrease. At long reaction times there is little differencein E*/A and < ρ>/ρo indicating a saturation in these variables. Also, inall cases the entropy per nucleon remains nearly constant beyond 30-40 fm/c,consistent with the existence of a randomized system. The most significant de-pendence on increasing beam momentum is the systematic decrease in residuemass, or in terms of the emitted particles, a greater contribution to the cas-cade/nonequilibrium yield.
All p + A reaction dynamics calculations predict that the excitation energyprobability decreases exponentially with increasing excitation energy. For thisreason, it is of interest to investigate the relative efficiency of different hadronprobes in depositing excitation energy. Fig. 6 shows results of an intranuclearcascade calculation [31,36,37] for the average excitation energy (E* > 50 MeV)as a function of beam momentum for proton, negative pion and antiprotonbeams. For the p and π− cases there is little difference, since the cascadesfollow similar paths. On the other hand, the annihilation pions from the p̄interaction enhance <E*> significantly. The inset in Fig. 6 demonstrates thatthe excitation-energy distribution for antiprotons is expected to extend to
9

Fig. 4. Nuclear density within the reaction plane XZ around the position coordinateY=0, where Z is along the beam axis at different times in the p + 197Au reactionat 14.6 GeV/c. Calculation is for b=2 fm, with the (σin, Up) transport simulationsdiscussed in Sec. 3.2.[35]
higher values than for protons and pions.
In comparing the predictions of the dynamics codes with experimental data,the primary quantities of interest are the energy deposited in the statisticalresidue E* and its mass A. To do so, however, requires separation of cas-cade/preequilibrium emissions from those associated with the equilibrium-likeheavy residue prior to event reconstruction. This calorimetry procedure is de-scribed in Sec. 4.1.
In Fig. 7 we show the reconstructed probability distributions for excitationenergy and residue mass for several systems studied in this work. The recon-structed E* distributions shown in the left panel of Fig. 7 demonstrate thatthe largest population of high excitation-energy events is achieved with the 8.0GeV/c p̄ beam and the lowest with the 5.0 GeV π− beam. Thus, the data arequalitatively in agreement with the INC calculations (intranuclear cascade)shown in Fig. 6, although the calculations extend to somewhat higher ener-gies than the data. The residue mass distributions in the right panel of Fig.7 show a different pattern. In this case the 14.6 GeV/c proton beam producesthe lightest residues and the 5.0 GeV/c π− beam the heaviest, a result rel-atively well reproduced by the calculations. This mass dependence on beammomentum can be understood as a consequence of the fast cascade, whichproduces an increasing number of fast knock-out particles as the beam mo-
10

Fig. 5. Excitation energy per nucleon of the source, mean density, entropy pernucleon and residue mass number, as a function of time in the p + Au reaction atb=2 fm and different incident momenta, from the (σin, Up) transport simulations[35], discussed in Sec. 3.2.
mentum increases [28,32]. This process produces the saturation in excitationenergy observed for hadrons with momenta greater than ∼ 8 GeV/c. Thatis, the increase in total beam energy available for E* deposition is counter-balanced by the the loss of energy due to mass loss ∆A during the fast cascade.
The relative effectiveness of various beams in depositing high excitation ener-gies (Fig. 7) is emphasized in the bottom panel of Fig. 8. Included here arecomparable data from the 4.8 GeV 3He + 197Au reaction [38] and from the1.2 GeV p̄ + 197Au reaction [39]. In order to emphazise the probability forforming highly excited systems, all data are normalized to probability P(E*)= 1 at E* = 400 MeV.
Fig. 8 confirms that the 8.0 GeV/c p̄ beam produces a significant enhancementof high excitation energy events, particularly in the multifragmentation region
11

Fig. 6. Intranuclear cascade predictions [31] of the average excitation energy forevents with E* > 50 MeV are shown as a function of beam momentum for p, π−
and p̄ beams incident on 197Au. Inset compares the excitation energy probabilitydistributions for 8 GeV/c π− and p̄ beams
above E* & 800 MeV. This figure further supports the predictions of thecascade code; i.e., enhanced E* with p̄ beams, saturation above ∼ 8 GeV/cbeam momentum, and exponentially-decreasing probabilities for high E*/Avalues. The behavior of the 3He beam can be understood as due to its averagebeam momentum of 2.6 GeV/c per nucleon.
Another perspective on the influence of reaction dynamics is provided by stud-ies with 3He beams [40,41]. Fig. 9 shows the probability distribution of thetotal observed thermalized energy and the correlation with the transverse frag-ment kinetic energies for the 3He + natAg and 197Au reactions. The thermalenergy, which is strongly correlated with excitation energy, is significantlylower for the lighter natAg target. However, when source mass corrections aremade, the energy per nucleon distributions are very similar for both targets[40]. The projectile-target effect on the saturation of excitation energy withbeam energy is in good agreement with INC calculations [30,41] for this lowermomentum, complex projectile. The lower right-hand frame of Fig. 9 showsthat the probability distributions are identical for the 3He + natAg at 3.6 and
12

Fig. 7. Measured excitation energy (left frame) and residue mass (right frame)probabilities for several of the systems studied in this work, as indicated on thefigure.
∑
P (E∗) = 1. Data for 6.2 and 12.8 GeV are not shown but are consistent.Values < 250 MeV are uncertain because of missing neutrons in the calorimetryprocedure.
4.8 GeV, indicating the onset of deposition energy saturation near 3.6 GeV.The slight difference at 3.6 and 4.8 GeV for the transverse energy correla-tions is due to the difficulty in removing nonequilibrium events from this sum,which illustrates the uncertainties involved with the use of transverse energyas a gauge of excitation energy depostion.
3.2 BUU Simulations
While the equilibrium-like events are of primary interest for multifragmen-tation studies, the nonequilibrium component of the spectrum is importantfor understanding the reaction dynamics. In order to investigate this facet ofthe data, predictions of a BUU code that includes d, t and 3He cluster for-mation have been compared with cascade/preequilibrium d/p, t/p and 3He/p
13

Fig. 8. Bottom: the probability for observing events with excitation energy greaterthan E* ≥ 400 MeV relative to the probability for events with E* = 400 MeV.Systems are indicated on the figure. Top: average mass loss ∆A in the fast cascadeas a function of excitation energy. Systems are defined in bottom frame.
ratios for the p + 197Au reaction between 6.2 and 14.6 GeV/c [34,35]. BUUcalculations were performed for various reaction times with and without amomentum-dependent potential and with both free and in-medium cross-section options. Results for the 14.6 GeV/c p + 197Au reaction are shownin Fig. 10. From examination of the LCP ratios for all four bombarding ener-gies, the best agreement with all the data is found when both a momentum-dependent potential and in-medium cross-sections are employed in BUU code,with a most probable reaction time of t ∼ 65 fm/c. From comparison with Fig.5, entropy considerations suggest that randomization of the nucleon momentain the heavy residue occurs after about t ∼ 30 fm/c, indicating an additional30-40 fm/c is required to reach a state of quasiequilibrium, after which theresidue undergoes statistical decay.
14

Fig. 9. Lower frames: distributions of observed total thermalized energy per event for3He + 197Au(left) and 3He + natAg (right); upper frames: correlation between totalthermalized energy and transverse energy. Error bars indicate standard deviationsof distribution widths (±σ) and are representative of data. Systems are defined onfigure.
Further, the BUU calculation that incorporates clusters, a momentum-dependentpotential, in-medium cross sections and a time scale of t ∼ 65 fm/c is able todescribe the excitation-energy probability distribution and the average sourceZ and A as a function of E*/A. One important aspect of this code is that theinclusion of clusters serves to enhance energy deposition in the heavy residue.This feature is missing in other codes designed for transport calculations withGeV hadron beams.
3.3 Sideways Peaking
Finally, the ISiS data demonstrate the important role that reaction dynam-ics exert on the statistical decay properties of hot residues. Earlier inclusive
15

Fig. 10. Normalized yields of nonequilibrium light charged particles as a functionof the source excitation energy for the p+Au reaction at 14.6 GeV/c. Circles repre-sent data and lines represent filtered ratios from different versions of the transportcalculations, at different times in the reaction.
studies [42,43,44] showed the existence of sideways peaking of IMF angulardistributions for p + A reactions above ∼ 10 GeV. This result was interpretedas possible evidence for dynamical IMF emission during the initial phases ofthe cascade, possibly signaling the existence of nuclear shock wave effects. Ex-clusive IMF angular distributions obtained with ISiS support a more mundaneorigin for the sideways peaking.
In [45] it is confirmed that the sideways peaking develops only above beam mo-menta of 8-10 GeV/c and that degree of peaking increases as IMF multiplicity
16

Fig. 11. Dependence of relative angular distributions on IMF kinetic energy for Z =5 - 9 fragments formed in events with IMF multiplicity M ≥ 4 for 5.0 GeV/c (left)and 14.6 GeV/c proton (right) beams incident on 197Au [45]. Angular distributionsare normalized to 1.0 at 160◦. IMF kinetic-energy bins are indicated in the figure.Solid lines in the left and center panels are results of moving-source fits. Right-handpanel shows prediction of an INC/SMM calculation [31,46] for the 14 GeV/c p +197Au reaction, binned the same as the data.
and charge increase. This result indicates that the peaking is associated withhigh deposition energy collisions, where multifragmentation is the major decaymode. In Fig. 11 relative angular distributions for Z = 5-9 fragments producedin MIMF ≥ 4 events are compared for reactions with 5.0 GeV/c π− (left panel)and 14.6 GeV/c p (center panel) beams on a 197Au target. Fragment kinetic-energy cuts of E/A = 1.2-3.0, 3.0-5.0 and 5.0-10.0 MeV are imposed on thespectra and all angular distributions are normalized to unity at 160◦. (In thisregard it should be stressed that most of the cross section is concentrated inthe kinetic energy bins below 5 MeV.) It is observed that as the IMF kineticenergy decreases, the angular distributions become increasingly isotropic forboth energies. However, whereas for the π− beam the angular distributionsremain forward-peaked, for the 14.6 GeV/c proton case sideways peaking isobserved – and the maximum differential cross section evolves to larger anglesas the IMF velocity decreases.
The observation that sideways emission is favored by high beam momentum,high IMF charge and low IMF kinetic energy suggests a possible origin in thekinematics of the residue rather than in dynamical emission. The diffractive
17

nature of the initial N-N collision at GeV momenta preferentially produces asecondary nucleon or N* that recoils 70◦ - 90◦ to the beam axis, with the anglegrowing as the beam momentum increases. Subsequent dissipation during thecascade imparts a transverse velocity component to the heavy residue. The netresult is that statistical fragment emission from the residue is focused non-axialto the beam direction – which affects the lowest energy IMFs most strongly.This conjecture is reinforced by INC/SMM (Statistical MultifragmentationModel) calculations [31,46], shown in the right-hand frame of Fig. 11 and isalso illustrated in Fig. 4. Thus, these results, coupled with IMF-IMF angularcorrelations and sphericity and coplanarity distributions, described in [47], donot support arguments for dynamical effects such as shock waves as a sourceof sideways-peaking observed in inclusive angular distribution studies.
4 Statistical Decay: Multifragmentation
4.1 Calorimetry
In any attempt to describe a system in terms of thermodynamics, a knowledgeof the heat content is fundamental. For hot nuclei, this energetic factor isexpressed in terms of the excitation energy per residue nucleon, E*/A. In thissection we examine the procedures for determining E* and A for the ISiS data[40,48,49].
For each reconstructed event, the excitation energy of the emitting source iscalculated as follows:
E∗source =
Mcp∑
i
Kcp(i) + Mn < Kn > +Eγ − Q. (4.1)
Here Kcp is the kinetic energy for all thermal charged particles, Mn is themultiplicity of thermal neutrons with average kinetic energy < Kn >, Eγ
is the total energy emitted by gammas, and -Q is the removal energy (thenegative of the reaction Q-value). Each of these terms requires assumptions,as described in the following.
In calculating the charged particle contribution to E* in Eq.(1), cascade/preequilibriumemissions prior to thermalization must be removed from the sum. Separationon an event-by-event basis is not fully transparent due to the time evolutionof the cooling process. Fig. 12 presents angle-integrated spectra for Z = 1,2,3and 6 nuclei from the 8.0 GeV/c π− + 197Au reaction. Because source veloc-ities are low (∼ 0.01 c), kinematic effects are small. The principal featuresof the spectra are a Maxwellian low-energy component, which we attribute
18

to thermal events, and an exponentially-decreasing high-energy tail due tononequilibrium processes.
The spectra have been decomposed [41,48,49] with a two-component moving-source model [50]. In Fig. 12 the thermal source [51,52] is described by thedashed lines, the nonequilibrium source [50] by dotted lines and the totalby the solid line. The nonequilibrium component is most important for thehydrogen isotopes, but is also a significant fraction of the He yield. In theproton case the two-component model is insufficient to account for the high-energy portion of the spectrum, suggesting evidence for three components:thermal at low energies, preequilibrium at intermediate energies, and fast cas-cade particles at the highest energies. Such a picture is consistent with theBUU transport calculations in Sec. 3. As seen in Fig. 13, nonequilibrium emis-sion persists, even at the most backward angles. Fig. 13 also illustrates theweak-angular dependence of the spectra. For IMFs, the nonequilibrium com-ponent decreases in yield as the IMF charge inreases. For carbon and heavierIMFs, the angle-integrated preequilibrium yield is negligible.
Since H and He isotopes constitute most of the charged-particle yield, calorime-try requires a systematic procedure for distinguishing between thermal andnonequilibrium emissions on an event-by-event basis. This need was a primarymotivation for the moving-source fits to the spectra. From moving-source anal-yses of all the spectra from the 1.8-4.8 GeV 3He + 197Au reaction [41], it wasconcluded that a sharp cutoff approximation gave a satisfactory account ofthe fraction of thermal events in the spectra. The thermal cutoff values were:
Kcp(Z = 1) ≤ 30MeV and (4.2)
Kcp(Z ≥ 2) ≤ (9Z + 40)MeV. (4.3)
These cutoffs are indicated by the arrows in Fig. 12, and correspond approx-imately to the break in the slope of the spectral tails. This method of deter-mining the thermal yield was also compared with the integrated yield fromthe two-component fits, which led to slightly lower E* values [48]. For thecalculation of excitation energy in this work, the cutoff values of Eqs. (4.2)and (4.3) were employed. The resulting thermal yields are isotropic in thecenter-of-mass frame [48].
In contrast the E* analysis of the EOS 1 GeV 197Au + 12C data [53] used asharp cutoff assumption of E/A ≤ 30 MeV for all fragments. This approachyields significantly higher E* values, as shown in Fig. 14, largely due to theinclusion of preequilibrium He ions in the sum of Eq. (1). When this differenceis taken into account, the ISiS and EOS experiments are in good agreementin those areas where they overlap. While the EOS calibration may lead tohigh E* values, the ISiS sharp cutoff approximation may underestimate E*
19

10-1
10-3
10-2
10-1
10-3
10-2
10-3
10-2
0 20 40 60 80 100
Kinetic Energy (MeV)
Z=1
Z=2
Z=3
Z=6
dσ/d
E (
arb.
uni
ts)
Fig. 12. Angle-integrated kinetic-energy spectra in the laboratory frame for Z = 1, 2,3 and 6, as indicated in each panel, emitted in the 8.0 GeV/c π− + 197Au reaction.Open points correspond to data. Dashed (dotted) lines represent the thermal-like(nonequilibrated) component of the moving-source fit. The solid line is the sum ofthe two fits. Upper cutoff energies [41] are shown by vertical arrows.
20

Fig. 13. Angle-dependent spectra for Z = 1. Reaction is 8.0 GeV/c π− + 197Au.
for high excitation energies. This problem is illustrated in Fig. 15 where theLCP kinetic energy spectra are plotted for several E*/A bins. The sharp cutoffdistinction is clear at low excitation energies, but the two components blendinto one as E*/A increases, blurring the separation.
The second major uncertainty in determining E*/A for the ISiS data is theunmeasured neutron contribution to both the thermal sum in Eq. (1) andthe cascade/preequilibrium multiplicity as it affects the source mass [40,48].In order to estimate the thermal-like neutron component, we have normal-ized the neutron charged-particle correlations reported by [39] to the ISiScharged-particle results. The measured correlations, shown in Fig. 16, are rea-sonably well described for charged-particle multiplicity M ≥ 4 by model sim-ulations [46,54] and show the same qualitative behavior as has been observedin heavy-ion reactions [55]. A mass-balance procedure [56] does not work wellfor the ISiS data. The rapid rise in neutron multiplicity at low energies, wherecharged-particle multiplicities are low, makes the ISiS E* values increasinglyuncertain below E* . 200 MeV.
Several assumptions have been employed in order to estimate the average
21

Fig. 14. Excitation-energy distributions for sharp cutoff assumptions of Eqs.(4.2)and (4.3) compared with a cutoff value of Kcp < 30A MeV.
neutron kinetic energy as a function of E*/A. For the 4.8 GeV 3He reactions <Kn > was estimated from Coulomb-corrected proton spectra and then iteratedto obtain a consistent value < Kn >= 2Tth, where Tth = (E ∗ /a)1/2 and a =A/11 MeV−1 [40]. For the hadron-induced reactions several relationships wereexplored, including Fermi-gas and It should be noted that the IMF yield isactually largest for the E/A = 1.2-3.0 MeV bin and smallest for the 5.0-10.0MeV bin. Maxwell-gas assumptions with level density parameters a = A/8MeV−1 and a = A/13 MeV−1 [48]. Comparisons were also made with SMM[46] and SIMON [54] evaporation codes. Based on this analysis, the SMMpredictions were used as a conservative estimate of the neutron kinetic energycontribution to E*. Eq.(4.1) is then iterated to obtain self-consistency. Thisprocedure produced a somewhat lower neutron kinetic energy contributionthan in [40]. For both the neutron multiplicities and kinetic energies, theuse of averages leads to loss of fluctuation information in the final excitationenergies.
The sharp-cutoff and neutron assumptions, along with the detector geometry,are included in the detector filter. The minor contribution to Eq. (4.1) fromgamma emission is assumed to be Eγ = 2(Mcp + Mn) MeV in [40] and Eγ= M(Z ≥ 3) MeV [48]. In order to calculate the removal energy (-Q), thecharge and mass of the source must be reconstructed. The source charge isdetermined from
Zsource = Ztgt −Mneq∑
i
Zi(neq), (4.4)
22

10 2
10 3
10
10 2
10 3
0 20 40 60 80 100
Kinetic Energy (MeV)
Z=1
Z=2
E*/A
2-4
4-6
6-9
dσ/d
E (
arb.
uni
ts)
Fig. 15. Angle-integrated kinetic-energy spectra in the laboratory for Z=1 and Z=2as indicated in each panel, and for three bins in E*/A calculated with the cut-off assumptions of Eqs. (4.2) and (4.3) [41]. The symbols correspond to bins ofE*/A=2-4 (open circles), E*/A=4-6 (filled triangles), and E*/A=6-9 MeV (opentriangles). Reaction is 8.0 GeV/c π− + 197Au.
and the mass from
Asource = Atgt −Mneq∑
i
Zi(neq)− < Mn(neq) >, (4.5)
where Ztgt and Atgt are the charge and mass of the target, Zi(neq) is thecharge of the measured cascade/preequilibrium particles, and the nonequilib-rium neutron multiplicity is related to the nonequilibrium proton multiplicityby < M (neq)
n >= 1.93M (neq)p . The assumption for < M (neq)
n > is consistentwith BUU calculations [35] and experimental results [59], and is intermediatebetween the A/Z of the target and experimental systematics [60]. The un-measured IMF mass is based on the isotopically-resolved data of [61]. In thecalculation of E*/A the resultant Q values and neutron multiplicities partially
23

_
Mea
n ne
utro
n m
ulti
plic
ity
Charged-particle multiplicity (Z=1-16)
Fig. 16. Relation between the mean neutron multiplicity and the charged-particlemultiplicity. Solid line corresponds to data points reported for LEAR data by Ref.[39]; dotted line shows the SMM calculation, and the SIMON evaporation result isgiven by the dashed line. The open squares give the mean multiplicities estimatedwith the mass conservation assumption [56,57].
offset one another in Eq. (4.1); e.g., if the neutron term is over-estimated, thenthe removal energy is reduced, and vice versa.
Several second-order corrections have been investigated and found to have nosignificant effects, among them: the source velocity (∼ 0.01c), source emissionangle [58], and detector threshold effects. Since ISiS does not measure heavyresidues, the additional assumption is made that all missing mass and chargeare contained in a single residue. The residue mass distribution obtained in thisway is in good agreement with measured results from [53]. The consistencyof the ISiS calorimetry filter has been tested with SMM [46] and SIMON[54] calculations that use the measured source mass, charge and excitationenergy as inputs to the codes [48]. One final consideration is the effect of theexponential decrease in the E*/A probability with increasing E*/A, whichserves to decrease the excitation energy relative to the bin average. This effectis most significant for the highest excitation energy bins when the measureddistribution is deconvoluted.
The relative fractions of the excitation energy for the LCP, IMF and neutronkinetic energy contributions to Eq. (4.1) are plotted in the top frame of Fig.17. Over the full range of E*/A the LCP fraction ranges from 25-30%, and
24

00.050.1
0.150.2
0.250.3
0.350.4
0.450.5
K.E. LCPK.E. neutronK.E. IMF
00.10.20.30.40.50.60.70.80.9
0 2 4 6 8 10 12
Kinetic energyQvalue
Fig. 17. Relative share of excitation energy for various components of the recon-struction procedure of Eq.(4.1) as a function of E*/A for the 8.0 GeV π− + 197Aureaction. Top frame: light-charged particle kinetic energy (solid squares), neutron ki-netic energy (open circles), and IMF kinetic energy (open triangles). Bottom frame:total particle kinetic energy (open circles) and Q values (solid squares).
that for neutrons from 20-25%, accounting for over half of the total E*. TheIMF kinetic energy fraction is relatively small, ranging from negligible valuesat low excitation energies to a near-constant value of ∼ 10-12% above E*/A≈ 6 MeV. In the bottom frame of Fig. 17 the excitation energy fraction dueto removal energy (-Q) is compared with the fraction for total kinetic energy.Except for low E*/A, where the calorimetry is most uncertain, the total kineticenergy sum is a near-constant factor of two greater than the removal energy.
Overall we estimate that the values chosen for the ISiS E*/A data and as-sociated assumptions could reasonably be lowered by ∼ 5% or increased by∼ 15%. In the following sections we examine the data as a function of thecalorimetric E*/A procedure described in this section.
25

4.2 Thermal Observables
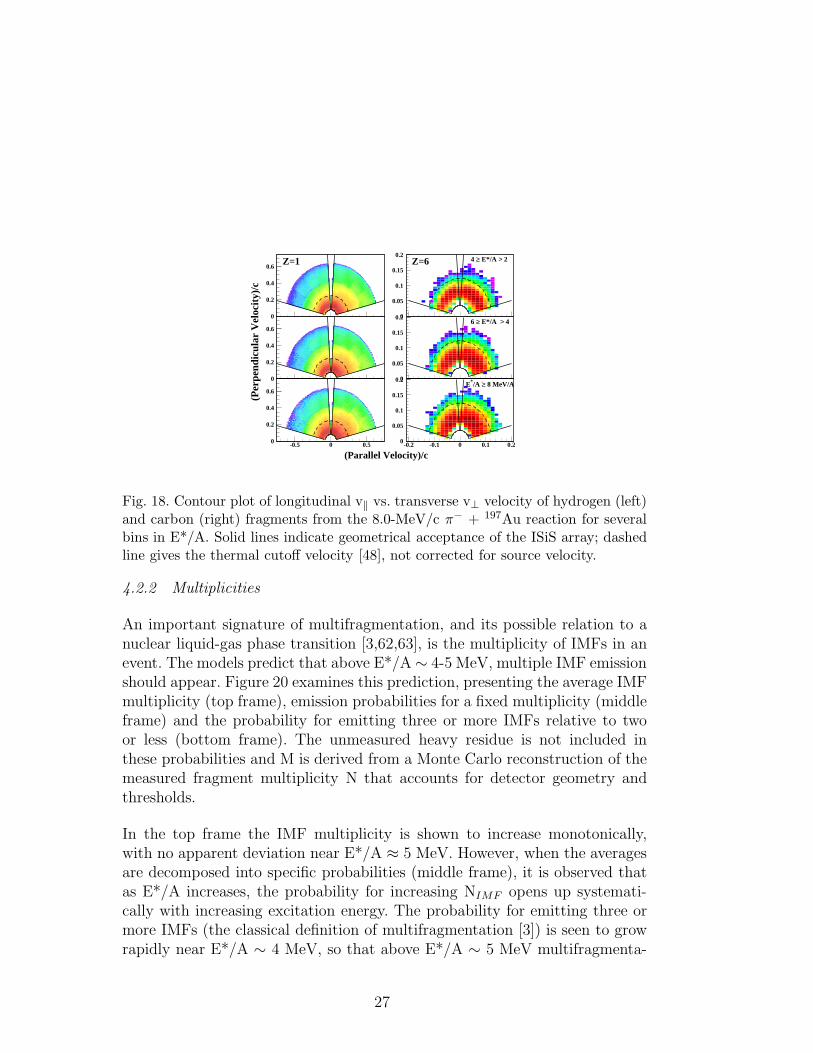
Of the many experimental signals for thermal behavior in hot nuclei, themost transparent are found in the evolution of the spectra as a function ofexcitation energy. Two fundamental tests that a statistically-decaying systemmust face are: (1) is particle emission isotropic? and (2) are the kinetic energyspectra Maxwellian? In Fig. 18 invariant cross sections (parallel v‖ versusperpendicular v⊥) velocity components are shown as a function of excitation-energy bins for hydrogen and carbon ions measured for the 8.0 GeV/c π− +197Au reaction. For energetic hydrogen ions (v & 0.2c) at all E*/A one observesa spray of forward-emitted particles that originates in cascade/preequilibriumprocesses. The low-energy part of these plots is nearly symmetric about zerovelocity, indicating emission from a randomized source moving with an averagevelocity of ∼ 0.01c. The ISiS acceptance for thermal-like particles is defined bythe dashed line in Fig. 18, i.e., the sharp cutoff assumption of [41]. The isotropyof the projected angular distributions for thermal LCP and IMF emission, aswell as the relative insensivity to excitation energy, has been demonstrated in[47,48]. In addition, an event-shape analysis for the thermal IMFs from the4.8 GeV 3He + 197Au reaction is found to be consistent with the existence ofa randomized system that disintegrates on a very short time scale [47].
4.2.1 Fragment Spectra
The Maxwellian character of the LCP and IMF kinetic-energy spectra is il-lustrated in Figs. 12, 13, and 15. Figures 12, 13 and 18 show the systematicCoulomb shift in the spectral peaks due to kinematic behavior and fragmentcharge. Figure 12 reveals two opposing trends that become apparent whenthe LCP spectra are gated on E*/A. First, the thermal slopes become flat-ter as E*/A increases, the expected result of the increasing temperatures. Incontrast, instead of showing the expected temperature-dependent increase inthe spectral (Coulomb) peak energies for a system at normal nuclear density,the spectral peak energies decrease. The net effect of these opposing effectsis that the average mean kinetic energy for thermal particles is essentiallyindependent of excitation energy, as shown in Fig. 19. This figure also showsthe expected increase in the average kinetic energy as a function of fragmentcharge. Within the context of Figs. 15 and 19, the observed fragment meankinetic energies can be interpreted in terms of a compensation between twocompeting factors: an increase in temperature offset by a decrease in the sourcedensity as the excitation energy increases. This behavior is explored in greaterdetail in Sec. 4.3.
26
0
0.2
0.4
0.6
0
0.05
0.1
0.15
0.2
0
0.2
0.4
0.6
0
0.05
0.1
0.15
0.2
0
0.2
0.4
0.6
-0.5 0 0.5 0
0.05
0.1
0.15
0.2
-0.2 -0.1 0 0.1 0.2
(Parallel Velocity)/c
Z=1 Z=6 4 ≥ E*/A > 2
6 ≥ E*/A > 4
E*/A ≥ 8 MeV/A
(Per
pend
icul
ar V
eloc
ity)
/c
Fig. 18. Contour plot of longitudinal v‖ vs. transverse v⊥ velocity of hydrogen (left)and carbon (right) fragments from the 8.0-MeV/c π− + 197Au reaction for severalbins in E*/A. Solid lines indicate geometrical acceptance of the ISiS array; dashedline gives the thermal cutoff velocity [48], not corrected for source velocity.
4.2.2 Multiplicities
An important signature of multifragmentation, and its possible relation to anuclear liquid-gas phase transition [3,62,63], is the multiplicity of IMFs in anevent. The models predict that above E*/A ∼ 4-5 MeV, multiple IMF emissionshould appear. Figure 20 examines this prediction, presenting the average IMFmultiplicity (top frame), emission probabilities for a fixed multiplicity (middleframe) and the probability for emitting three or more IMFs relative to twoor less (bottom frame). The unmeasured heavy residue is not included inthese probabilities and M is derived from a Monte Carlo reconstruction of themeasured fragment multiplicity N that accounts for detector geometry andthresholds.
In the top frame the IMF multiplicity is shown to increase monotonically,with no apparent deviation near E*/A ≈ 5 MeV. However, when the averagesare decomposed into specific probabilities (middle frame), it is observed thatas E*/A increases, the probability for increasing NIMF opens up systemati-cally with increasing excitation energy. The probability for emitting three ormore IMFs (the classical definition of multifragmentation [3]) is seen to growrapidly near E*/A ∼ 4 MeV, so that above E*/A ∼ 5 MeV multifragmenta-
27

0
10
20
30
40
50
60
70
80
0 2 4 6 8 10 12 14 16 18
E*/A ≥ 8 MeV 8 ≥ E*/A > 6 6 ≥ E*/A > 4 4 ≥ E*/A > 2
Fragment charge
Mea
n ki
neti
c en
ergy
(M
eV)
Fig. 19. Fragment mean kinetic energy as a function of IMF charge calculated inthe source frame for four bins of excitation energy, as indicated on the figure. Dataare from the 8.0-GeV/c π−-induced reaction on 197Au.
tion becomes the dominant decay channel. This growth in IMF multiplicity isaccompanied by a corresponding growth in the thermal LCP multiplicity.
4.2.3 Charge Distributions
Another important aspect of the multifragmentation mechanism is the distri-bution of fragment sizes (Z), of relevance to the question of critical phenomenaand the liquid-gas phase transition. The ISiS charge distributions have beenanalyzed in terms of a power-law function, σ(Z) ∝ Z−τ , shown in Fig. 21. Theresults are nearly identical for all of the hadron-induced reactions and behavesimilarly for the 3He + 197Au data [47]. At the lowest excitation energies, thelarge values of the power-law exponent τ imply that small fragments dominatethe charge distribution, consistent with lower-energy proton-induced reactions[61,64,65]. As the system is heated, τ values decrease, signifying the increas-ing tendency to form larger clusters. A minimum in τ is reached near E*/A ≈5-6 MeV, corresponding to the rapid increase in IMF multiplicities. The ten-dency to form lighter clusters at high excitation energy is most likely due tothe dissolution of the larger clusters in the heat bath and/or the formation ofhighly-excited clusters that undergo secondary decay. The average variancesof the Z distributions have also been measured [66] and the relation of both τ
28

0
2
4
6
ExperimentalCorrection ICorrection II
10-2
10-1
1
0
0.25
0.5
0.75
1
0 1 2 3 4 5 6 7 8 9 10 11
P(Mimf = 0,1,2)
P(Mimf ≥ 3)
E*/A (MeV)
< N
imf >
P(N
imf)
P(M
imf)
Fig. 20. Top: average number of IMFs for the observed yield (closed circles), the yieldcorrected for geometry (solid triangles), and the yield corrected for both geometryand fragment energy thresholds (open triangles) as a function of E*/A for the 8GeV/c π− + 197Au reaction. Middle: probability for given number of detected IMFsas a function of E*/A. Bottom: probability for IMF multiplicity M ≥ 3 (circles) andM<3 (triangles).
and the average variance is discussed in Sec.6 with regard to phase transitionarguments.
4.2.4 Cross Sections
Comparison of the excitation-energy distribution in Figs.7 and 14 and the IMFmultiplicity probabilities in Fig. 20 demonstrates that multifragmentation isa small fraction (≤ 10%) of the total cross section in these light-ion reactions,most likely originating in the lowest impact-parameter collisions. For the 3Hebeams the calculated total reaction cross section is approximately 2000 mbfor the 197Au target and 1400 mb for natAg [67,68]. For the hadron-inducedreactions, the reaction cross section is about 1900 mb [67,68]. The multifrag-mentation (MIMF ≥ 3) cross section ranges from about 50 mb for the 5 GeV/cπ− beam to 100-125 mb at the higher energies, where excitation-energy satu-ration occurs.
29

Fig. 21. Top: average ratio of observed and geometry-corrected IMFs per residuenucleon as a function of E*/A; symbols are defined in the bottom frame. Bottom:power law parameters τ from fits to the charge distributions as a function of E*/Aof the residue.
In Table 2 the cross section dependence on target, beam energy and IMF mul-tiplicity is presented for the 3He-induced reactions. The yields clearly increasewith target mass and projectile energy, with cross sections that range from 9mb for the 1.8 GeV 3He + natAg case to 190 mb for the 197Au target at 4.8GeV. The effect of excitation-energy saturation in the natAg system near 3.5GeV bombarding energy is evident.
4.2.5 Source Charge
Determination of the Z and A of the emitting source, as well as the unmea-sured heavy residue(s), is also an important component of the reconstructionprocess described in Sec. 4.1. In the top frame of Fig. 22 the average fraction ofthe source charge relative to the target charge is shown as a function of E*/A.As the excitation energy increases, the effect of nonthermal particle emissionbecomes quite strong, leading to average source charges of Z ∼ 60 at E*/A ∼8 MeV. The middle frame of Fig. 22 shows the average missing charge in ourreconstruction procedure, assumed here to be a single fragment. Comparisonwith the SMM model [46] gives good agreement and these values closely corre-spond to the largest fragment distribution observed in the EOS 1 GeV 197Au
30

Table 2Cross sections for the 3He-induced reactions
3He + natAg 3He + 197Au
Ebeam (GeV) 1.8 3.6 4.8 1.8 4.8
MIMF cross section (mb)
1 140 160 190 270 300
2 28 77 98 66 170
3 7.4 26 28 14 110
4 1.3 6.4 6.5 2.9 54
5 0.2 1.2 1.2 0.5 20
6 0.03 0.2 0.2 0.1 6.6
7 - - - - 1.8
8 - - - - 0.4
9 - - - - 0.1
10 - - - - 0.02
– – – – –
σ(MIMF ≥ 3) 8.9 34 36 18 190
σIMF (M ≥ 1) 170 270 320 350 660
σIMF (total) 220 430 490 460 1300
+ 12C reaction (when corrected for differences in thermal excitation energy).[53].
Beyond E*/A & 6 MeV the assumed fragment corresponding to the missingcharge (Zmax1) is an IMF (Z . 20). Finally, in the bottom frame of Fig. 22the average charges of the second (Zmax2) and third (Zmax3) largest fragmentsare shown as a function of excitation energy. The sizes of the second and thirdlargest fragments remain nearly constant above E*/A ∼ 5-6 MeV, in line withthe results of Fig. 21, and are also in relative accord with SMM predictions upto E*/A ∼ 7-8 MeV. At higher excitation energies the data and SMM diverge,most likely due to the storage of excess excitation energy in fragments in themodel, leading to secondary decay. This divergence suggests that the fragmentsare emitted relatively cold, as argued in [69].
In summary, the thermal observables from the ISiS data present a picture of asystem that decays isotropically from a source with velocity ∼ 0.01 c. AboveE*/A ∼ 5 MeV multifragmentation (MIMF ≥ 3) becomes the dominant decaymode and the spectra suggest emission from a dilute/expanded source. Nearthis energy the largest fragments are formed. Thus, these signals are qualita-
31

0
0.25
0.5
0.75
1
0
20
40
60
80
Missing charge SMMZmax SMM
Missing charge data
0
2
4
6
8
0 1 2 3 4 5 6 7 8 9 10 11
E*/A (MeV)
ZM
issi
ng (
Zm
ax 1
)<
Zs /
Zt >
Zm
ax 2
, 3
Fig. 22. Dependence of fractional source charge and IMF charges as a function ofE*/A for the 8 GeV/c π− + 197Au reaction. Top: fractional source charge. Middle:missing charge in ISiS, assumed to be the largest fragment, and SMM predictionfor missing charge (solid line) and for largest fragment (dashed line), both passedthrough the ISiS filter. Bottom: charge of two largest observed fragments, solid lineis the SMM prediction for second largest fragment (Zmax2) and dashed line for thirdlargest fragment (Zmax3).
tively consistent with expected observables from a liquid-gas phase transitionand in the following sections we examine this question in greater depth.
4.3 Breakup Density and Expansion
A knowledge of the dependence of nuclear density on thermal excitation is ofcentral importance to our understanding of nuclear compressibility and theequation-of-state of finite nuclear matter. In addition, the breakup density isparticularly relevant to models of multifragmentation phenomena, which as-sume that at sufficiently high temperatures, thermal pressure and Coulombforces drive nuclear expansion and subsequent disintegration of the system[3,46,54,62,63]. Perhaps the most direct experimental signal of the breakupdensity is provided by the centroids of the peaks of the IMF kinetic en-
32

Fig. 23. Energy spectra at 43◦ and 137◦ for carbon fragments emitted from the4.8 GeV 3He + 197Au reaction as a function of excitation energy. Symbols are asfollows:<E*/A> = 3.4 MeV (•); 4.6 MeV (2); 5.7 MeV (△); 6.8 MeV (3); 7.9 MeV(▽).
ergy spectra as a function of E*/A, as mentioned in previous sections andin [10,13,47,48,64,70].
Breakup densities have been derived from the systematic Coulomb shifts ofthe spectral peaks for a series of IMF data sets that span the excitation-energyrange E*/A = 0.9 to 7.9 MeV. Inclusive data were analyzed for the 200-MeV4He + 197Au [71] and E/A = 20-100 MeV 14N + 197Au [70] reactions. Exclusivedata were based on the 4.8 GeV 3He + 197Au reaction [72]. The spectra for eachsystem were measured with low kinetic-energy thresholds and covered nearlythe entire 180 degree angular range. The threshold/angle criteria are essentialfor obtaining stable moving-source fits, which require very good definition ofthe low-energy component of the spectra. Details of the analysis are discussedin greater detail in [72] and [73]. Representative IMF kinetic-energy spectra forcarbon fragments from the 4.8 GeV 3He + 197Au system are shown in Fig.23as a function of E*/A. The decrease in the peak centroids with increasingexcitation, opposite of expectations for a thermal source at normal density, isevident.
The spectra were analyzed in terms of a two-component (three for 14N) moving-source model [50] consisting of a thermal-source described by a transition-stateformalism [51,52], a nonequilibrium source that assumes a Maxwellian shape,
33

and for 14N, a projectile-breakup source. The thermal source, of primary in-terest for this analysis, included the following parameters: the source velocity,a fractional Coulomb term kC , a spectral slope temperature and a barrier fluc-tuation variable. The decreasing Z of the source with E*/A was also taken intoaccount. This formalism is designed primarily for binary breakups. For multi-fragmentation events, it is assumed that this procedure provides a first-orderapproximation to the Coulomb field that exists between a given IMF and theaverage of the residual nucleons. For density determinations the average frac-tional Coulomb parameter <kC> for IMFs is the sensitive parameter and isdetermined relative to fission fragment kinetic energy systematics [72,73]. Inthe top frame of Fig. 24 values of the Coulomb parameter are plotted versusE*/A, where kC = 1 corresponds to nuclei at normal density ρ0. Most strikingabout Fig. 24 is the sharp decrease in < kC > in the excitation-energy intervalE*/A ≈ 2-4 MeV, suggesting emission from a source with a modified Coulombfield. It is also of note that this decrease matches the major changes in otherreaction variables, as shown in Sec. 4.2.
In order to obtain the breakup density, it is assumed that for these light-ion-induced reactions the thermal source is spherical and expansion is radiallysymmetric. In this case, from Coulomb’s law the density expression reducesto
< ρ > /ρ0 = k3C , (4.6)
since < kC > α< rC >−3, where rC is the mean separation distance at breakup.The result is shown in Fig. 24 where <ρ >/ρ0 is plotted as a function of E*/A.Up to E*/A ≈ 2 MeV the density appears to correspond to normal density.Between E*/A ≈ 2 and 5 MeV, Fig. 24 indicates a systematic decrease indensity from <ρ >/ρ0 ≈ 1.0 to <ρ >/ρ0 ≈ 0.3. Above E*/A & 4 MeV, anearly constant value of <ρ >/ρ0 . 0.30 is found within experimental error.
In summary, this spectral-shape analysis indicates that above E*/A & 2 MeV,nuclear breakup occurs from an increasingly expanded/dilute configuration.Beyond E*/A & 4 MeV, a value of <ρ/ρ0 >≈ 0.3 is found, consistent withthe predictions of multifragmentation models [46,62]. Finally, the relative con-stancy of <ρ/ρ0 > at high excitation energies suggests that a limiting breakupdensity has been reached [74,75].
The energy that drives expansion and subsequent multifragmentation is usu-ally attributed to either internal thermal pressure [76] or the response to com-pressional forces produced in the early stages of the target-projectile interac-tion [77]. As discussed in Sec. 3, model calculations of the reaction dynamics forthe systems studied in this work provide little or no evidence for compression-decompression effects. Instead, the fast cascade creates an initial residue withlower than normal nuclear density and high thermal energy. Thus, in highly
34

Fig. 24. Top: Dependence of the average fractional Coulomb parameter < kC >as a function of excitation energy. Symbols are as follows: 200 MeV 4He (solidsquare);14N (solid triangle); 4.8 GeV 3He (open square). Bottom: Average density<ρ/ρ0 > as a function of E*/A derived from the kC values in the top panel.
asymmetric collisions at GeV energies, only the thermal pressure and Coulombfield are of primary relevance to the subsequent expansion process.
Two stages of thermal expansion leading to multifragmentation can be schemat-ically defined. The first drives the nucleus to the breakup configuration, whererepulsive Coulomb forces exceed the restoring nuclear force. Although thebreakup density beyond this point may remain nearly constant, as in Fig. 24,the increasing heat content of the source may lead to an additional sourceof radial expansion energy (or flow); i.e., the thermal energy that exceeds theminimum necessary to reach the breakup density, defined here as excess expan-sion energy, ǫth. The impact of the excess expansion energy on the spectra willbe an increased flattening of the high-energy spectral slope, over and beyondthat expected for the freezeout density and temperature [78].
In order to investigate the possible contribution of ǫth, it is necessary to choosea reference point that accounts for thermal and Coulomb contributions to thefragment kinetic energies. For this purpose, three statistical models have beenemployed: SMM [46,79], SIMON-explosion and SIMON-evaporation [56]. In
35

0
20
40
60
80
9 ≥ E*/A > 6 6 ≥ E*/A > 4
SIMON-evaporation 9 ≥ E*/A > 6 6 ≥ E*/A > 4
0
20
40
60
80 SIMON-explosion 9 ≥ E*/A > 6 6 ≥ E*/A > 4
0
20
40
60
80
0 2 4 6 8 10 12 14 16 18
SMM 9 ≥ E*/A > 6 6 ≥ E*/A > 4
Fragment charge
Mea
n ki
neti
c en
ergy
(M
eV)
Fig. 25. Comparison between experimental and simulated fragment mean kinetic en-ergies calculated for two bins in excitation energy. In each panel, data are shown withopen and solid circles and simulations with dashed and solid lines. The correspond-ing bins of excitation energy are indicated on the figure. SMM and SIMON-explosioncalculations have been performed without additional expansion energy.
order to minimize any contamination from possible preequilibrium emissionsin the data, we compare the calculations with the measured average frag-ment kinetic energy, for which preequilibrium contributions to the tails of thespectra are negligible. The inputs to all three models were the same, usingthe source charge, mass, velocity and excitation-energy distributions for thereconstructed data (Sec.4.1), and then passed through the ISiS filter.
In Fig. 25 the calculations are compared with mean fragment kinetic energiesas a function of fragment charge for excitation-energy bins, E*/A = 4-6 and 6-9MeV. The evaporative model underpredicts the data substantially, although itdoes give reasonable agreement for E*/A . 3 MeV. Both of the simultaneousmultifragmentation models describe the mean kinetic energies, as well as themultiplicity and charge distributions, for E*/A = 4-6 MeV bin. However, for
36

the E*/A = 6-9 MeV bin both models fall below the data. This shortfall isattributed to the existence of excess thermal expansion energy. Using the SMMmodel as a reference point, the excess expansion energy is extracted from thedifference between the model and the data. In Fig. 26 the results are plottedversus E*/A. This analysis indicates that the ǫth threshold occurs near E*/A ∼=4 MeV and then gradually increases to 0.5 AIMF MeV at E*/A = 9 MeV. Thisamount of energy, while small, must be taken into account when performingthe calorimetry (Sec. 2). In contrast, central heavy-ion reactions show a muchmore dramatic increase in the excess expansion energy, also shown in Fig. 26,suggesting that the excess expansion energy observed in heavy-ion collisionsmay be related to the dynamical stage, perhaps due to initial compression.
To summarize, moving-source analyses of the IMF spectra show a system-atic downward shift in the Coulomb peaks, supporting a picture in whichthe breakup density decreases as a function of excitation energy, even aftercorrecting for nonequilibrium charge loss. While the density remains nearlyconstant above E*/A = 5 MeV, the flattening of the spectral slopes suggestsa small, but measurable excess breakup energy that increases nearly linearlyas ǫth/AIMF = (0.1 E*/A)-0.4 MeV.
4.4 Breakup Time Scale
Central to any interpretation of multifragmentation events in terms of a liquid-gas phase transition is the question of time scale. For evaporative clusteremission from the liquid phase at low excitation energies, fragments are pro-duced from the surface via a binary sequential decay mechanism. This processrequires relatively long emission times of order 1000 fm/c at low excitationenergies [80]. In contrast, when the spinodal boundary of the phase diagramis crossed, the system falls apart on a near-simultaneous time scale via bulkemission from the entire nuclear volume.
Information about the emission time scale can be extracted by means of theintensity-interferometry technique, which probes the mutual Coulomb repul-sion between fragment pairs emitted in proximity to one another in space andtime [81,82,83,84]. This technique constructs the correlation function R forfragment pairs of reduced velocity vred,
R(vred) + 1 = CNcorr(vred)
Nuncorr(vred). (4.7)
Ncorr is the measured coincidence yield, while Nuncorr is the uncorrelated yieldcalculated with the event-mixing technique [83], and the normalization C isperformed relative to the integral yields of each [85].
37

Fig. 26. Upper panel: See Fig. 20. Lower panel: comparison between 8 GeV/cπ−+197Au reactions and central heavy-ion collisions [78]. The shaded area corre-sponds to the ISiS excess expansion energies extracted with SMM at 3V0 (upperlimit) and 2V0 (lower limit). The dashed line summarizes the excess expansion en-ergies extracted in central heavy-ion collisions with various assumptions regardingthe source characteristics.
The reduced velocity is given by
vred =| v1 − v2 |√
Z1 + Z2
, (4.8)
where vi and Zi are the laboratory velocity and charge of the fragments, re-spectively. The denominator permits comparison of different IMF Z values.
Experimental IMF-IMF (4 ≤ Z ≤ 9) correlation functions from hadron-inducedreactions on 197Au between 8.0 and 11.2 GeV/c are shown in Fig. 27 for sev-
38

Fig. 27. Reduced-velocity correlation functions generated for four different excitationenergy energy per nucleon bins. IMF kinetic energy acceptance in the source frameis EIMF /A = 1-10 MeV.
eral excitation-energy bins. Pairs emitted in close proximity to one another inspace and time (low vred) experience a supression in yield due to their mutualCoulomb interaction (Coulomb hole). Between E*/A = 2.25 and 5.0 MeV theCoulomb hole increases, followed by a nearly constant supression at higher ex-citation energies. This effect is in qualitative agreement with heavy-ion studies[86,87].
In order to extract the emission time scale, an N-body Coulomb trajectorycalculation [84,88] has been performed, using the experimental source and fi-nal product properties as input [85]. The only adjustable parameters in thesimulation are the source volume, or separation distance between the residueand the fragments. The filtered output of the simulation must reproduce boththe small- and large-angle correlation data, as well as the fragment chargedistribution and kinetic energy spectra. These conditions impose a significantconstraint on space-time ambiguities in the simulation. For purposes of calcu-lating the Coulomb energy, the separation distance is defined as
39

R12 = r0(A1/3res + A
1/3IMF ) + d
where r0 = 1.22 fm. Values of d between 2-6 fm provide the best fits to the dataand are consistent with the density results described in the previous section.The emission time t is assigned via an exponential probability distribution,et/t0 , where t0 is the decay lifetime.
In Fig. 28 the experimental correlation functions are compared with simula-tions for a range of d and time values that yield minimum chi-squared values.Between E*/A= 2.0-2.5 and 4.5-5.5 MeV the emission time decreases by anorder of magnitude, from ∼ 500 fm/c to 20-50 fm/c. Above E*/A ∼ 5 MeVthe emission time becomes very short and nearly independent of excitationenergy, consistent with a near-instantaneous breakup scenario. Similar resultshave been shown for the 4.8 GeV 3He + 197Au reaction, as shown in Fig. 29[89]. Here the experimental gating is performed for all fragments from eventswith E*/A ≥ 5 MeV. Again the results are consistent with breakup timesbetween 20-50 fm/c for that fraction of the yield that falls in the multifrag-mentation regime.
The lower panel of Fig. 30 presents the best-fit decay times for events in which
two or more IMFs are emitted in hadron-induced thermal multifragmentationof 197Au nuclei. For reference the individual IMF multiplicities are shown in theupper panel. The decay lifetimes at low excitation energy are consistent withan evaporative mechanism, while at higher energies the very short lifetimessupport a near-simultaneous breakup. The shaded band in Fig. 30 covers therange of space-time values that provide a consistent fit to all of the observables.Also shown in Fig. 30 are results for heavy-ion reactions [90], which yieldsimilar results, but somewhat longer lifetimes at low energies.
In summary, the time scales derived from the intensity-interferometry anal-ysis demonstrates the evolution from the evaporative to near-simultaneousbreakup regime. As with the multiplicity, spectra and density evolution dis-cussed in Secs. 4.1-4.3, the time scale determinations provide a strong case foran interpretation in terms of a transition from surface to bulk emission in theexcitation energy interval between E*/A ∼ 3-5 MeV.
40

Fig. 28. Correlation function for Z = 4-9 IMFs as a function of reduced velocity(open circles). IMF kinetic energy acceptance in the source frame is EIMF /A =2–10 MeV. Data are gated on source E*/A = 2.0–2.5 MeV (top), 4.5–5.5 MeV(center) and 8.5–8.5 MeV (bottom). Solid and dashed lines are results of a Coulombtrajectory calculation for fit parameters indicated on the figure.
5 Thermodynamics
5.1 The Caloric Curve: Isotope-ratio Temperatures
One of the most stimulating early results of multifragmentation studies wasthe excitation energy versus temperature curve, or caloric curve, proposedby the ALADIN group [91]. By plotting temperatures derived from double-isotope ratios [92] as a function of excitation energy, a result was obtained thatresembles the heating of liquid water to the vaporization phase. Subsequentexperiments, including those described in this section, produced similar results[75]. From the systematic behavior of these data, Natowitz has derived a valueof the critical temperature of 16 ± 1 MeV for infinite nuclear matter and anuclear compressibility constant K = 232 ± 30 MeV [93].
41

Fig. 29. Reduced-velocity correlations as a function of reduced velocity for the 4.8GeV 3He + 197Au reaction (points)[89]. Data were selected for pairs of events inwhich Nth ≥ 11 and kinetic energy (E/A)IMF = 0.7-3.0 MeV and are shown forZ = 3,4 fragments (upper frame) and Z = 5-9 fragments (lower frame). Lines areresults of an N-body simulation with ρ/ρ0 = 0.25 and maximum residue size, Zres
= 12. Time scales are indicated in the figure.
In order to construct the heating curve for the ISiS data, the heat contentwas based on the calorimetry described in Sec.4.1. The double-isotope-ratiotechnique for defining temperature is limited for the ISiS data due to thehigh thresholds for isotope identification. The isotope-ratio temperatures Twere calculated according to the prescription of Albergo [92], with correctionfactors κ proposed by Tsang [94],
1/T =ln(aR) − lnκ
B. (5.1)
Here B is a binding-energy parameter, a is a statistical factor dependent onground-state spins, and R is the double-isotope ratio. For ISiS, useful isotope
42

Fig. 30. Upper frame: IMF probability as a function of E*/A. Bottom frame: emis-sion time as a function of E*/A. Open points are ISiS data under two extremes offitting procedure. Solid points are heavy-ion data from [90]. Parameters for expo-nential fits to the data are given on the figure.
identification is restricted to LCPs so that the relevant ratios are
Rpd−He = (p/d)/(3He/4He) and (5.2)
Rdt−He = (d/t)/(3He/4He), (5.3)
where all ratios involve only thermal LCPs.
The definition of thermal LCPs, as discussed in Sec. 4.1, can lead to variabil-ity in the value of T that is obtained. For p/d and d/t ratios, there is only asmall sensitivity to particle kinetic energy [49,72], so the distinction betweenthermal and preequilibrium particles is of minor significance due to the loga-rithmic nature of Eq. 5.1. In contrast, as shown in Fig. 31, the 3He/4He ratioincreases strongly with kinetic energy [40,49,72]. Thus the controlling factorin determining T is the 3He/4He ratio, which is dependent on the thermal
43

Fig. 31. He isotope ratios [40] as a function of He energy observed at 43 and 137degrees for the 4.8 GeV 3He reaction on Ag (left panel) and Au (right panel). Linesare INC/EES model predictions [62,95] for 137 degrees (solid ) and 43 degrees(dashed). Error bars are statistical only.
cutoffs assumed in the calorimetry.
In Figs. 32 and 33 the temperature versus E*/A curves are shown for the 4.8GeV 3He + 197Au system [40] and the 8.0 GeV/c π− + 197Au system [49],respectively. For the 3He-induced reaction, which uses only the dt-He ratio,there is no plateau, but a slope change is observed above E*/A ≈ 2 MeV.While the temperature increases from about T = 5-7 MeV in the E*/A ≈2-10 MeV range, it deviates markedly from a simple Fermi gas prediction(dotted curves in Fig. 32).
Also shown in Fig.32 are comparisons with INC/EES (Expanding, EmittingSource) [30,62] and INC/SMM [30,46] models. SMM comparisons assume thefragments are emitted cold; comparisons with model parameters that producehot fragments deviate strongly from the data [49]. For both model comparisonsthe solid lines are predictions with the experimental cuts defined in Sec.4.1imposed on the model spectra. The results provide fair agreement with thedata. With the experimental cuts removed (dashed curves), the caloric curvesare lowered by ∼ 1-1.5 MeV per nucleon, yielding better agreement with othercaloric curves. The difference between the results with and without the exper-imental cuts on the model is traced to the fact that the thresholds for isotopeidentificaton in ISiS fall above the spectral peaks, where the 3He/4He ratio ismuch lower [96,61] (i.e., R is larger and T is smaller). Also shown in the rightframe of Fig. 32 is the thermodynamic temperature predicted by the SMMmodel.
44

Fig. 32. (d/t)/(3He/4He) isotope-ratio temperature vs. reconstructed E*/A for the4.8 GeV 3He + 197Au reaction. Left frame compares data with the INC/EES model[62,30] and right frame compares with the INC/SMM model [46,30]. Solid curves aremodel predictions with experimental cuts imposed on H and He kinetic energy spec-tra. Dashed curves show the effect of removing the experimental cuts. Dotted curvesshow Fermi gas behavior with a=11 MeV−1. For the SMM case the dot-dashed curvegives the thermodynamic temperature of the source.
In Fig. 33 the caloric curves for the π− + 197Au reaction are compared forthe pd-He and dt-He thermometers. The top frame shows the results withoutthe Tsang [94] corrections. With the correction applied, both thermometersdemonstrate a break in the curve above E*/A ≈ 3-4 MeV, with the pd-Heratio yielding a more distinct plateau. At the highest excitation energies forthe dt-He case there is an indication of an upturn in the caloric curve aboveE*/A ≈ 10 MeV, suggestive of possible entrance into the vaporization regime.Similar results have been observed in other experiments and are also seen inthe 4.8 GeV 3He data, although the effect occurs at excitations where statisticsare low and fluctuations large. However, this behavior is absent with the pd-He thermometer. Thus, while the high E*/A dt-He results are intriguing, theyare not convincing.
The differences in temperature between the slope/plateau regions for the 4.8GeV 3He and 8.0 GeV/c π− reactions can be traced to two factors. First, thekinetic-energy thresholds were lower in the former case and second, the energyacceptance bins were not quite the same. The net effect is that the 3He/4Heratio is lower for the 4.8 GeV 3He measurements; i.e., R is larger and T lower.
45

Fig. 33. Caloric curve for 8 GeV/c π− + 197Au from (p/d)/ (3He/4He) and (d/t)3He/4He) thermometers using measured yields to calculate temperature (top panel)and temperatures corrected for secondary decay (bottom panel).
The temperature dependences on 3He/4He ratio can be used to track theevolution of the de-excitation process leading up to thermalization, under theassumption that the most energetic emissions are emitted earliest [97,98,99].Such a “cooling curve” is shown in Fig. 34 for the 8.0 GeV/c π− + 197Aureaction, where Coulomb-corrected 10-MeV-wide bins have been placed onLCP spectra [49]. Note that the higher energy bins correspond to the hardexponential tails of the spectra in Fig. 12. The corresponding T vs. E*/Acalculation reveals a systematic decrease in the isotope-ratio temperaturesas the kinetic energy bin for the LCPs decreases. The observed sequence ofcaloric curves can be interpreted as evidence for the preequilibrium coolingstage between the initial cascade and thermalization stages. An alternativeexplanation is provided by time-dependent EES model, for which particlesare emitted sequentially from an expanding, cooling source [62].
46

Fig. 34. The caloric curves for the 8 GeV/c π− + 197Au reaction from the(d/t)/(3He/4He) thermometer, corrected for secondary decay, using four differentkinetic energy acceptances as given in the graph. The shaded area represents thecaloric curve region extrapolated to the evaporative region of the H and He spectralpeaks.
Due to the systematic trends of Fig. 34 and the lack of mass-resolved datain ISiS in the Coulomb-peak region below E/A = 8 MeV, the isotope- ratiotemperatures would be lower if extrapolated to the thermal LCP peak yields.To examine this correction, a linear fit was performed on the cooling curvesof Fig. 34 and then extrapolated to the Coulomb peak region for element-identified LCPs, shown in Fig. 12. The shaded area in Fig. 34 shows thisextrapolation. Figure 35 compares the caloric curves from similar systems withthe ISiS data. The left-hand frame shows the difference between the observedand corrected ISiS results and emphasizes the sensitivity of the isotope-ratiothermometer to the energy acceptance for the LCPs. The center- and right-hand frames compare the ISiS results with the ALADIN peripheral Au + Au[91] and EOS Au + 12C results [18,53] respectively. Reasonable consistency isobserved with the corrected ISiS caloric curve and the systematics of Natowitz[75].
47

Fig. 35. Left: Summary of caloric curves from the ISiS data in Figs.32-34, comparedwith ALADIN data [91] (center) and EOS data [18,53] right.
5.2 The Caloric Curve: Density-Dependent Fermi-Gas Temperatures
The density determinations described in Sec. 4.3 suggest an alternative ap-proach to measuring the nuclear temperature. Inherent in the Fermi gas modelis the first-order relationship
E∗/A =T 2
K(ρ)(
ρ
ρ0)2/3 m∗(ρo)
m∗(ρ), (5.4)
where K(ρ) is the density-dependent inverse level density parameter (1/a)and m* is the effective mass. This predicted dependence of temperature ondensity provides a method for determining nuclear temperatures, independent
of isotope ratios. If one assumes that the effective mass ratio is near unity atthese high excitation energies, then the ratio of K(ρ) to K0, the value of K atnormal density, becomes
K(ρ) = K0(ρ/ρ0)2/3 = T 2/(E∗/A). (5.5)
From fits to data below E*/A ≤ 2.0 MeV, an empirical inverse level densityparameter of K0 = 11.3 MeV for a density-independent Fermi gas is obtained,
48

Fig. 36. First-order density-dependent Fermi-gas temperatures as a function of ex-citation energy. The dashed line is the normal-density Fermi-gas prediction, with T=
√
11.3(E ∗ /A) MeV. Symbols are the same as in Figure 24.
shown as a dashed curve in Fig. 36. Using this value, Eq. 5.5 becomes
T (MeV ) = [11.3(ρ/ρ0)2/3(E∗/A)]1/2. (5.6)
When the average densities derived from the IMF spectra [Sec. 4.3 and Fig.24] are inserted into Eq. 5.6, the resultant temperatures produce the caloriccurve shown in Fig. 36. Up to E*/A ≈ 2 MeV the temperature rises accordingto Fermi gas predictions for nuclei at normal density. In the region E*/A = 2-5MeV a distinct slope change occurs, corresponding to the decrease in breakupdensity of the emitting source. Above E*/A ≈ 5 MeV, Eq. 5.6 with a constantvalue of ρ/ρ0 ≈ 0.30 predicts a simple gradual increase in temperatures given
by T = 2.2√
E∗/A. Overall, the density-dependent Fermi gas model yieldsa caloric curve that is strikingly similar to other caloric curve measurementsfor similar reactions [91,53], as well as the corrected caloric curves from ISiS,shown in Fig. 34. This result is consistent with statistical model calculationsthat assume ρ/ρ0 ≈ 1/3 at breakup [3,46,63] and in qualitative agreement withthe metastable mononucleus model of Sobotka [100]. A second-order analysis[73] of the density data, in which expansion energy is taken into account,shows a 1-2 MeV dip in the plateau near E*/A ≈ 5 MeV, but is otherwisesimilar. Overall, the temperatures derived from the density-dependent Fermigas model and those from double isotope ratios [94] are in agreement, lendingadditional support to the concept of caloric curve behavior for hot nuclei.
49

Fig. 37. Panel shows Cv and χ2 calculated from data. The minimum of χ2 and themaximum of Cv coincide within experimental uncertainty.
5.3 Heat Capacity
In heavy-ion studies evidence for a negative excursion in the heat-capacity ver-sus excitation-energy curve has been presented by the MULTICS-MINIBALLCollaboration [101]. Based on thermodynamic considerations, this result pro-vides possible evidence for a first-order phase transition [102]. The ISiS datahave been examined for such an effect [103] and the results are shown in Fig.37. A sharp negative deviation in the heat capacity Cv is observed near E*/A≈ 4-5 MeV, consistent with the heavy-ion results [101]. Within experimentaluncertainties the minimum in the χ-squared distribution coincides with themaximum in the Cv curve.
The first-order phase transition argument is reflected in the observations inearlier sections that show near E*/A ≈ 4-5 MeV there is a sharp increase inthe IMF multiplicity, a rapidly decreasing emission time and density, the onsetof excess expansion energy, and a distinct slope change in the caloric curve.The order of the phase transition is discussed further in the following section.
In summary, both the corrected isotope-ratio and density-dependent Fermi-gastemperature versus excitation energy plots show quasi-caloric curve behaviorwith a transition in the region E*/A ≈ 3-5 MeV. Rather than a plateau, the
50

resultant caloric curves show a gradual increase in temperature with addedheat, but are well below normal Fermi-gas expectations. By gating on LCPkinetic energies, it is also possible to construct a ”cooling curve” that describesthe evolution of the reaction mechanism from the cascade step to thermaliza-tion. In addition, a signal for a negative excursion in the heat capacity curvesupports heavy-ion data [102] that are interpreted in terms of a first-orderphase transition.
6 The Liquid-Gas Phase Transition: Scaling Law Behavior
Given the overall agreement of the ISiS data with the qualitative expectationsfor a liquid-gas phase transition, several further questions of a more quan-titative nature arise. For example, do the cluster size distributions behaveaccording to statistical expectations? How well do the data conform to scalinglaws for a phase transition? If so, what are the critical parameters and whatis the order of the phase transition?
Statistical behavior is an important question, not a priori obvious for systemsthat evolve as rapidly as those formed in GeV hadron-induced reactions. Atlower energies, where statistical concepts are more appropriate, cluster emis-sion probability distributions can be well-described in terms of a binomialdistribution [104],
P nm(E∗) =
m!
n!(m − n)!P n(1 − p)m−n. (6.1)
Here,n is the IMF multiplicity, m is the number of chances to emit an IMF,and p is the binary elementary probability. The values of p and m can beextracted from the experimental average multiplicity < N > and its variance,
< N >= mp and σ2n =< N > (1 − p). (6.2)
At lower energies it has been found that p is a function of excitation energy,giving rise to the concept of thermal scaling [104]. In order to test whether theISiS results follow this same statistical pattern, the 8.0 GeV/c π−+197Au datahave been fit with Eqs. 6.1 and 6.2 [38]. The binomial distribution analysisgives very good agreement with the data up to NIMF = 5, as shown in themultiplicity distributions in Fig. 38. Some deviations appear for NIMF ≥ 6,where statistics become increasingly poor. To investigate the possible depen-dence of the binomial parameters on collision violence, the reciprocal of theprobability factor p was plotted versus the total transverse energy, thermaltransverse energy and E*/A. The total transverse energy Et diverges strongly
51

Fig. 38. The experimental (symbols) and calculated (lines) n-fold IMF probabil-ity distributions as a function of E*/A. The lines assume a binomial probabilitydistribution according to Eq. 6.1 and p and m were extracted from Eq. 6.2.
Table 3Values of the binomial parameter m, the primary source size Asrc, the observedcharge Zobs, and the Qvalue for various E*/A bins.
E*/A (MeV) 2.0 3.0 4.0 5.0 6.0 7.0 8.0 9.0
m 3.36 4.82 5.61 6.29 6.72 7.67 8.31 7.79
Zsrc 74.3 71.2 68.4 65.8 63.5 61.1 59.0 57.1
Aobs 8.75 15.2 21.9 28.1 33.5 38.1 42.2 45.4
Qvalue(MeV) -160 -204 -249 -295 -341 -383 -420 -451
at high energies, reflecting the contribution of preequilibrium processes to theyield. Removal of the preequilibrium component yields an improved scalingfit to the data for the thermal transverse energy. The strongest correlation isfound when scaled as a function of E*/A, where a nearly linear dependence isobserved, supporting an interpretation in terms of thermal scaling [38].
The evolution of the parameter m with excitation energy is shown in Table 3,where correlations with the size of the source Zsrc, total observed charge Zobs
and the removal energy(-Q). The one variable that tracks most closely with mis the removal energy, suggesting that m represents an energy constraint thatallows only certain partitions.
52

The agreement with the thermal scaling concept indicates that p can be ex-pressed by a partial decay width
p =Γ
~ωo
= e−B/T (6.3)
where ωo is interpreted as the frequency of assault on the barrier B at tem-peratures T [38,104]. Defining the intrinsic emission time as t0 = 1/ω0, theemission time is given by
t = t0eB/T , or p = t0/t. (6.4)
Using the emission times derived in Sec. 4.4, a plot as a function of the ther-mal scaling variable (E*/A)1/2 shows nearly linear behavior, as seen in the topframe of Fig. 39. The bottom frame of Fig. 39 shows the relation between thelifetime t and 1/p. A simple linear relationship is observed down to emissiontimes of 20 fm/c near E*/A ≈ 6 MeV. The evolution of the inverse probability1/p at higher energies appears to be independent of time, indicating a mecha-nism charge that favors a space-like (bulk) emission scenario, rather than onethat is sequential, as is the case at lower excitations.
The apparent statistical nature of the thermal component of the data justifiesfurther investigation of expected liquid-gas phase transition properties. Onemethod for extracting information relevant to this issue is through a momentanalysis of the fragment charge distributions [1,105]. Calculations with bothpercolation and statistical multifragmentation models predict that the relativevariance γ2 of the charge distributions will exhibit maxima of γ2 ≈ 2.1-2.3 nearthe critical point. Brzychczyk [66] analyzed the relative moments of the 4.8GeV 3He + 197Au reaction and found a variance of γ2 = 2.3 ± 0.1 near E*/A≈ 5.5 MeV. Thus, the ISiS data are in good agreement with phase transitionmodels and provide further consistency with arguments for a liquid-gas phasetransition and possible critical behavior in hot nuclei.
Berkenbusch et al. [106] carried out a global percolation analysis on the 10.2GeV/c p + 197Au data from ISiS. The bond-breaking probability for the modelis determined from the excitation energy via the relation [107]
Eb(E∗) = 1 −
√
2
πΓ(3/2, 0, B/T (E∗)) (6.5)
where Γ is the generalized incomplete gamma function, B is the binding energyper nucleon of the source and T is the source temperature, determined from
the excitation energy T =√
E ∗ /a and a = A/13 MeV−1. Input to the modelutilized experimental values for the excitation energy and source size, with the
53

Fig. 39. Top panel: IMF emission time t as a function of (E*/A)−1/2, from Fig.30. The line corresponds to a fit using Eq. 6.4. Bottom panel: plot of 1/p vs time.The solid line is a linear fit to the data. The dotted line indicates the “apparent”saturation in emission time.
lattice size fixed by the size of the thermal residue. An important feature ofthe calculation is that account is taken of the secondary decay of the excitedprimary fragments, which is particularly important for the fragile Z = 3-5fragments that comprise most of the IMF cross section.
Figure 40 compares the charge distributions from the data with both filteredand unfiltered percolation values. The discontinuity just above Z = 16 is a con-sequence of the discrete charge-identification limit in ISiS and the assumptionthat all unmeasured charge resides in a single fragment. Overall, the filteredpercolation yields are in excellent agreement with the data.
For values of the control parameter p near the critical value, pc, the clusternumber ns is predicted to scale as
ns(p) = s−τf [(p − pc)Sσ] (for p ≈ pc), (6.6)
where s is the size of the cluster (Z) and τ and σ are the two critical exponentsof percolation theory. The scaling function f has the property that f(0) = 1;i.e., the power-law dependence is valid only near p = pc. By associating the
54

Fig. 40. Inclusive charge yield spectra for the reaction p +197 Au at 10.2 GeV. Theround symbols represent the ISiS data. The dotted histogram is the result of thecorresponding percolation model calculation. The thick histogram represents theoutput of the calculations, filtered through the detector acceptance.
bond-breaking probability with the temperature and assuming an exponentialfunction for f, the fractional IMF yield < nz > becomes
< nz >= q0Z−τexp[
(T − Tc)Zσ
T]) (6.7)
where q0 is a normalization parameter and Tc is the critical temperature. Thus,one expects a plot of
< nz > /q0Z−τ
to scale exponentially with (T − Tc)Zσ/T for all fragment sizes.
The result of a χ2 optimization procedure for the theoretical percolation chargedistributions for this system yields values of the critical parameters σ = 0.5±0.1 and τ = 2.18 ± 0.01, in good agreement with percolation analysis for aninfinite lattice, σ = 0.45 and τ = 2.18. A similar analysis of the ZIMF = 3-6data from ISiS produces the results shown in Fig. 41. The right frame showsthe inability to achieve scaling when sequential-decay corrections are omittedfrom the analysis. When corrected for sequential decay, as shown in the left
55

Fig. 41. Scaled fragment yields as a function of the scaled control parameter for Z= 3, 4, 5 and 6. The left-hand side shows the results of inclusion of secondary decaycorrections and the right-hand side shows the fit when omitting these corrections.
frame of Fig. 41, much better scaling behavior is found. The critical exponentsfor this finite system, derived from the data, are σ = 0.5±0.1, τ = 2.35±0.05and (E*/A)c = 5.3 MeV (or Tc = 8.3 MeV for a simple Fermi gas with a =A/13 MeV−1).
Since the infinite size limit of the model contains a continuous phase transitionfor the range of excitation energies covered by the present data set, the scalingagreement between the data and percolation theory can be interpreted asevidence for a continuous phase transition in nuclear matter.
The Fisher Droplet Model [108] provides another avenue for examining the cor-respondence between IMF emission and a liquid-gas phase transition. Fisher’smodel describes the aggregation of molecules in a vapor into clusters. Theabundance of a given cluster size A can be written as
nA = q0A−τexp[(A∆µ − CoǫAσ)/T ], (6.8)
where in addition to the critical exponents τ and σ of Eq. 6.7, nA = NA/A0, thenumber of droplets of mass A normalized to the system size A0; the differencebetween the actual and liquid chemical potentials is ∆µ = µ − µℓ; Co is thezero temperature surface energy coefficient, and ǫ = (Tc−T )/Tc. This equationreduces to Eq. 6.7 if ∆µ = 0.
One approach taken by Elliott et al. [109] is to modify Eq. 6.8 to take intoaccount the Coulomb energy release when a particle moves from the liquid to
56

the vapor phase, which assumes
nA = q0A−τexp[(A∆µ + ECoul − CoǫA
σ)/T ], (6.9)
where ECoul is defined as follows
ECoul =1.44(Zsrc − ZIMF )ZIMF
r0[(Asrc − AIMF )1/3 + A1/3IMF ]
× (1 − e−χǫ)fm − MeV. (6.10)
Here r0 = 1.22 fm and the exponent χǫ insures that the Coulomb energydisappears at the critical point. Since IMF masses are not measured in ISiS, itwas assumed that A/Z = 2. Temperatures were determined by the Fermi gasapproximation of Raduta [110]. IMF acceptance was for IMFs with 5 ≤ Z ≤15, for which preequilibrium effects are small [109]. Subsequent modificationsof the Fisher model can be found in [111,112].
The results of scaling the data according to Eq. (6.9) are shown in Fig.42,where the fragment mass yield is scaled by the power-law prefactor, the chem-ical potential term and the Coulomb energy. This quantity is scaled by temper-ature and the surface energy parameter Aσ
ǫ /T. The scaled data follow Fisherscaling over six orders of magnitude, which suggests that this line representsthe liquid-vapor coexistence line. As supporting evidence, also shown in Fig.42 is the scaled cluster distribution from a d=3 Ising model calculation [113]for a system that undergoes a phase transition.
The values of the critical parameters from the χ-squared minimization routineare summarized in Table 4 for both the percolation and Fisher scaling analyses.Within errors, the Fisher model values of τ = 2.28 ± 0.14 and σ = 0.54 ± 0.01are in good agreement with those from percolation as well as with earlier work[114,115]. The surface-energy coefficient Co = 18.3 ± 0.5 MeV is in generalaccord with the liquid drop value of 16.8 MeV. An important result relevantto previous scaling analyses is that for the first time it has been possibleto measure ∆µ. The measured value of ∆µ = 0.06± 0.03 substantiates theassumption that ∆µ ∼= 0 in previous analyses. Similarly, the value of x = 1.0± .06 insures that the Coulomb energy is small and does not affect the scalingsignificantly.
Based on this analysis, the phase transition is first order up to the criticalpoint of excitation energy E∗
c/A =3.8 ± 0.3 MeV, above which it becomescontinuous. Analysis of the EOS data [18] yielded a value of E∗
c/A = 4.75MeV. However, as discussed in Sec. 3, when the excitation energies are calcu-lated with the same assumptions for elimination of preequilibrium particles,the ISiS and EOS critical energies are the same. The critical temperaturefor finite nuclei derived from the Fisher scaling analysis is Tc = 6.7± 0.2
57

Fig. 42. The scaled yield distribution versus the scaled temperature for the ISiSdata (upper) and d = 3 Ising model calculation (lower). For the Ising model, thequantity nZ/q0A
−τ/10 is plotted against the quantity Aσǫ/1.435T . Data for T > Tc
are scaled only as nA/q0A−τ .
Table 4Comparison of percolation and Fisher scaling resutls.
parameter percolation Fisher
τ 2.35 ± 0.05 2.18 ± 0.14
σ 0.5 ± 0.1 0.54 ± 0.01
Tcrit 8.3 ± 0.2 MeV 6.7 ± 0.2 MeV
(E*/A)crit 5.3 ± 0.3 MeV 3.8 ± 0.3 MeV
Co – 18.3 ± 0.5 MeV
∆µ – 0.06 ± 0.03 MeV/A
χ – 1.00 ± 0.06
58

MeV. Based on the Fisher scaling parameters derived from the data, it is thenpossible to construct the two-phase (liquid-gas) coexistence line over a largeenergy/temperature interval, extending up to the critical point, from whichthe full phase diagram of nuclear matter can be defined [108].
In summary, the ISiS data are well-described by binomial reducibility andthermal scaling analyses, providing a strong argument for the statistical natureof multifragmentation. Further, scaling with the Fisher model can be used todefine the liquid-gas coexistence line, while a percolation analysis supports acontinuous phase transition at higher excitation energies.
7 Summary and Conclusions
Both the reaction dynamics and the subsequent decay of hot residues formedin GeV light-ion-induced reactions on heavy nuclei have been investigated withthe ISiS detector array. Of primary concern in this effort has been the isolationand characterization of multifragmentation events, believed to be the possiblesignature of a nuclear liquid-gas phase transition in finite nuclei.
Bombardments with proton, antiproton, pion and 3He beams produce anexponentially-decreasing distribution of excitation energies that extend up to∼ 2 GeV in reactions on 197Au nuclei. The deposition of excitation energy isfound to increase as a function of beam energy up to a momentum of about 8GeV/c for reactions of hadrons with 197Au and an energy of ∼ 4 GeV for the3He + natAg system. For higher beam energies there is little additional increasein deposition energy, presumably due to a tradeoff between beam energy andtarget transparency. Relative to other hadron beams, the optimum projectilefor achieving high excitation energies is found for 8 GeV/c antiprotons, forwhich the reabsorbtion of some fraction of the decay pions can produce en-hanced excitation of the residue. For the same beam momentum, proton andpion beams are nearly identical in their excitation-energy distributions.
The fast LCP component of the spectra has been analyzed with a BUU modelthat incorporates A = 2 and 3 nuclei in the scattering matrix. Best fits to thedata are obtained with a version that includes modified in-medium scatteringcross sections and a momentum-dependent potential. As shown in Figs. 4 and5, the BUU calculations indicate that for central collisions the hot residuesare formed in a state of depleted density – due to fast knockout followedby preequilibrium processes that occur on a time scale much faster that therelaxation time. Simulation of the time evolution of the collision dynamicspredicts that the entropy per nucleon becomes nearly constant after about 30fm/c, suggesting a randomized, but not necessarily thermalized system. Fromcomparison of the BUU code with the fast LCP spectra, it is inferred that a
59

total time of about 60 fm/c is required to reach a state of quasi-thermalization.
The most fundamental signature of a liquid-gas phase transition is the obser-vation of events in which an equilibrated hot nucleus disintegrates into multpleLCPs and IMFs. For this purpose, thermal events have been selected that areshown to decay isotropically in the center-of-mass system with Maxwelliankinetic energy spectra from which nonequilibrium components have been re-moved. The cross sections for these events is of order 100 mb.
Figure 43 summarizes several important features of the data that demonstratea distinct change in reaction mechanism at an excitation energy of E*/A ∼= 4-5MeV – all of which support a phase-transition interpretation. In the E*/A ∼=4-5 MeV interval the emission of two or more IMFs (accompanied by multiplethermal LCPs) becomes the dominant disintegration mode. From a power-lawfit to the charge distributions, it is found that the fraction of large clusters inan average event is a maximum just above the transition excitation energy,as predicted by theory. Evidence for the conversion of extra thermal energyinto enhanced IMF kinetic energy appears near E*/A ∼ 5 MeV, although theeffect is small relative to heavy-ion studies, where compressional heating maycontribute.
Two unique results derived from ISiS are the evolution of the breakup den-sity and the disintegration time scale as a function of excitation energy. Thebreakup density derived from analyses of the IMF kinetic-energy spectra,provides evidence for emission from an expanded/dilute source. The derivedbreakup densities evolve from normal density at low E*/A to a nearly con-stant value of ρ/ρ0 ∼ 0.3 near E*/A = 5 MeV and above, again consistent withthe theoretical predictions based on phase transition assumptions. The timescale for events with MIMF > 2 evolves from values characteristic of sequentialstatistical decay at low excitation energy to times of the order of 20-50 fm/cfor events at E*/A ∼ 4 MeV and above, indicative of a near-simultaneousdecomposition mechanism.
Similar to previous reports, the data also show evidence for a slope change inthe dependence of temperature on heat content, suggestive of caloric curve be-havior, although a distinct plateau is not observed. Using a density-dependentFermi-gas model to derive temperatures, instead of the conventional isotope-ratio thermometer, a caloric curve is obtained that is in good agreement withother results. By gating on bins of the preequilibrium spectra, it has also beenpossible to derive a cooling curve for these hot systems.
Finally, scaling-law fits to the IMF yield distributions provide important con-firmation of the statistical nature of the thermal events observed in these stud-ies. A Fisher model analysis reveals excellent scaling behavior up to E*/A ∼ 4MeV, where sequential evaporative emission dominates. This result has been
60

Fig. 43. From top to bottom, the probability distribution for individual IMF mul-tiplicities, the power-law exponent that describes the IMF charge distributions, thebreakup density, excess expansion energy and time scale as a function of excitationenergy for the reaction of 8.0 GeV/c pions with gold nuclei.
used to define the two-phase coexistence line for nuclear matter and servesas the basis for derivation of the nuclear phase diagram shown in Fig. 44.A percolation model analysis that includes IMF secondary decay correctionsalso describes the data well and indicates that at higher excitaton energies,the data are described by a continuous phase transition.
In summary, all of the experimental evidence obtained in these studies isconsistent with the concept of a nuclear liquid-gas phase transition. However,the caveat must be added that given the finite system size and very short timescales involved, the classical picture of a phase transition must be invoked withcaution. It is perhaps better to say that if a nuclear phase transition exists innuclei of a few hundred particles, this is what it looks like.
61

Fig. 44. The reduced density-temperature phase diagram: the thick line is the calcu-lated low density branch of the coexistence curve, the points are selected calculatederrors, and the thin lines are a fit to the reflection of Guggenheim’s equation.
8 Acknowledgments
Over the fifteen year lifetime of the ISiS project numerous individuals haveprovided invaluable support. We wish to express our sincere gratitude to thefollowing for their help: computer support: R.N. Yoder; ISiS design and con-struction: Andy Alexander, Kenny Bastin, John Dorsett, Jack Ottarson, JohnPoehlman, Larry Sexton and Lai Wan Woo; theoretical support: AlexandreBotvina, Wolfgang Bauer, Pawel Danielewicz, C.B. Das, Jim Elliott, Bill Fried-man, Subal das Gupta, M. Kleine Berkenbusch, L.G. Moretto, and ViktorToneev; and undergraduates: Chris Powell and Greg Porter. We also thank thefollowing for their advice and counsel: Joe Natowitz, Brian Serot and Wolf-gang Trautmann. We also thank John Vanderwerp, Kevin Komisarcik, SteveGushue, Lou Remsberg and Birger Back for their help in various aspects ofthis project. Diana McGovern played an indispensible role in coordinatingmany aspects of the ISiS program and in manuscript preparation. Finally,we express our appreciation to accelerator staffs at the Indiana UniversityCyclotron Facility, LNS Saclay and Brookhaven AGS.
62

References
[1] J.E. Finn et al. Phys. Rev. Lett 49 (1982) 1321.
[2] G.F. Bertsch and P.J. Siemens, Phys. Lett 126B (1983) 9.
[3] J.P. Bondorf et al. Nucl. Phys. A443 (1985) 221.
[4] G. Friedlander et al. Phys. Rev. 94 (1954) 727.
[5] R. Wolfgang et al., Phys. Rev. 103 (1956) 394.
[6] N.A. Perfilov, O.V. Lozhkin and V.P. Shamov, Sov. Phys. Usp. 3 (1960) 1.
[7] V.P. Crespo et al., Phys. Rev. 131 (1963) 1765
[8] G. Hudis, in Nuclear Chemistry, edited by L. Yaffe (Academic Press, NY 1968).
[9] W.G. Lynch, Ann. Rev. Nucl. and Part. Sci. 37 (1987) 493.
[10] A.M. Poskanzer, G.W. Butler and E.K. Hyde, Phys. Rev. C 3 (1971) 882; 4(1971) 1759.
[11] R.G. Korteling,C.R. Toren, E.K. Hyde, Phys. Rev. C 7 (1973) 1611.
[12] A. Hirsch et al. Phys. Rev. C 29 (1984) 508
[13] N.T. Porile et al., Phys. Rev. C 39 (1989) 1914.
[14] A.D. Panagiotou, M.W. Curtin, H. Toki, D.K. Scott and P.J. Siemens, Phus.Rev. Lett. 52 (1984) 496.
[15] A. Baden et al., Nucl. Instrum. Meth. 203 (1982) 189.
[16] A.I. Warwick, H.H. Wieman, H.H. Gutbrod, M.R. Maier, J. Peter, H.G. Pitter,H. Stelzer and F. Welk, Phys. Rev. C 27 (1983) 1083.
[17] S.J. Yennello et al., Phys. Rev. C 48 (1993) 1092.
[18] J. Hauger et al., Phys. Rev. C 57 (1998) 764; Phys. Rev. C 62 (2000) 024616.
[19] J. Galin and U. Jahnke, J. Phys. G; Nucl. Part. Phys. 20 (1994) 1105; P.Figuera et al., Z. Phys. A352 (1995) 315.
[20] S.P.Avdeyev et al. Nucl. Instrum. Meth. A332 (1993) 149.
[21] K. Kwiatkowski et al. Nucl. Instrum. Meth. A360 (1995) 571.
[22] D.A. Cebra et al., Nucl. Instrum. Meth A300 (1991) 518.
[23] R.T. deSouza et al., Nucl. Instrum. Meth. A295 (1993) 29.
[24] J. Pouthas et al. Nucl. Instrum. Meth. A357 (1995) 418, ibid. A369 (1996)222..
[25] NIMROD, http://cyclotron.tamu.edu/nimrod.
63

[26] U. Lynen, ALADIN Collaboration, GSI no. GSI-02-89 (1989).
[27] Dynamics and Thermodynamics with Nucleonic Degrees of Freedom, eds. F.Gulminelli, W. Trautmann and S.J. Yennello, Springer-Verlag, to be published;see also www.kp3.gsi.de/www.kp3/aladinhome; S.P. Avadeyev et al. Nucl.Phys. A 709 (2002) 392 and [18] and [39].
[28] J. Cugnon, T. Mizutani and J. Vandermuelen, Nucl. Phys.A 352, (1981) 505.
[29] L.W. Woo, K. Kwiatkowski and V.E. Viola, Phys. Lett. B 132 (1983) 283.
[30] Y. Yariv and Z. Fraenkel, Phys. Rev C 20 (1979) 2227; 24 (1981) 488; 41(1990).
[31] T.Toneev, N.S. Amelin, K.K. Gudima and S. Yu, Sivoklokov, Nucl. Phys. A519 (1990) 463c.
[32] G. Wang, K. Kwiatkowski, V.E. Viola, W. Bauer and P. Danielewicz, Phys.Rev. C 53 (1996) 1811.
[33] D. Strottman and W.R. Gibbs, Phys. Lett. B 149 (1984) 288.
[34] P. Danielewicz and G.F. Bertsch, Nucl. Phys. A533 (1991) 712; P. Danielewicz,ibid. A673 (2000) 375.
[35] S. Turbide et al. Phys. Rev. C 70(2004)014608.
[36] T. Lefort et al., Phys. Rev. Lett. 83 (1999) 4033.
[37] L. Beaulieu,et al., Phys. Lett. B 463 (1999) 159.
[38] L. Beaulieu et al., Phys. Rev. C 63 (2001) 031302.
[39] F. Goldenbaum et al. Phys. Rev. Lett. 77 (1996) 1230.
[40] K. Kwiatkowski al. Phys. Lett. B 423 (1998) 21.
[41] K.B. Morley et.al. Phys. Rev. C 54 (1996) 737.
[42] J.B. Cumming, J. Hudis, A.M. Poskanzer and S. Kaufman, Phys. Rev. B 134(1964) 167; Phys. Rev. B 132 (1964) 1262.
[43] L.P. Remsberg and D.G. Perry, Phys. Rev. Lett.35 (1975) 361.
[44] D.R. Forney and N.T. Porile, Phys. Lett. B 76 (1978) 553.
[45] W.-c. Hsi et al., Phys. Rev. C 60 (1999) 014609.
[46] A. Botvina, A.S. Iljinov and I.N. Mishustin, Nucl. Phys. A507 (1990) 649.
[47] E. Renshaw Foxford et al., Phys. Rev. C 54 (1996) 749.
[48] T. Lefort et al., Phys. Rev. C 64 (2001) 064603
[49] A. Ruangma et al., Phys. Rev. C 66 (2002) 044603.
64

[50] G.D. Westfall, R.G. Sextro, A.M. Poskanzer, A.M. Zebelman, G.W. Butlerand E. Hyde, Phys. Rev. C 17 (1978) 1368.
[51] L.G. Moretto, Nucl. Phys. A 247 (1975) 211.
[52] K. Kwiatkowski, J. Bashkin, H. Karwowski, M. Fatyga and V.E. Viola, Phys.Lett. B 171 (1986) 41.
[53] B. Hauger et al., Phys. Rev. Lett. 77 (1996) 235.
[54] D. Durand, Nucl. Phys. A 541 (1992) 266.
[55] J. Toke et al. Phys. Rev. Lett. 75 (1995) 292.
[56] Y.G. Ma et al., Phys. Lett. B (1997) 41.
[57] L. Beaulieu et al., Phys. Rev. C 54 (1995) R973.
[58] W.-c. Hsi et al., Phys. Rev. C 58 (1998) R13.
[59] T. Egidy et al. Eur. Phys. J A8 (2000) 197.
[60] D. Polster et al., Phys. Rev. C 51 (1995) 1167.
[61] R.E.L. Green, R.G. Korteling, and K.P. Jackson, Phys. Rev. C 29 (1984) 1806.
[62] W.A. Friedman, Phys. Rev. C 42 (1990) 667.
[63] D.H.E. Gross, Rep. Prog. Phys. 53 (1990) 605.
[64] S.J. Yennello et al., Phys. Rev C 41 (1990) 79.
[65] E. Renshaw et al., Phys. Rev. C 44 (1991) 2618.
[66] J. Brzychczyk et al. Phys. Rev. C 58 (1998) R1372.
[67] P. Karol, Phys. Rev. C 11 (1975) 1203.
[68] S. Kox, A. Gamp, I. Cherkoani, A.J. Cole, N. Longequeue, J. Menet, C. Perrinand J.B. Viano, Nucl. Phys. 420 (1984) 162.
[69] S. Hudan et al., Phys. Rev. C 70 (2004)031601R.
[70] J.L. Wile et al, Phys. Rev. C 45 (1992) 2300.
[71] J. Zhang et al., Phys. Rev. C 56 (1997) 1918.
[72] D.S. Bracken et al., Phys. Rev. C 69 (2004) 034612.
[73] V.E. Viola, K. Kwiatkowski, J.B. Natowitz and S.J. Yennello, Phys. Rev. Lett93 (2004) 132701.
[74] P. Bonche et al., Nucl. Phys. A 427 (1984) 278; Nucl. Phys. A 436 (1986) 265.
[75] J.B. Natowitz et al., Phys. Rev. C 65 (2002) 034618.
[76] R.T. de Souza et al. Phys. Lett. B 300 (1993) 29.
65

[77] W. Reisdorf et al., Nucl. Phys. A 612 (1997) 493.
[78] T. Lefort et al, Phys. Rev. C 62 (2000) 031604(R).
[79] J.P. Bondorf, A.S. Botvina, A.S. Iljinov, I.N. Mishustin and K. Sneppen, Phys.Rep. 257 (1995) 133.
[80] R.J. Charity et al., Nucl. Phys. A 483 (1988) 371.
[81] D.H. Boal, C.K. Belbke and K.B. Jennings, Rev. Mod. Phys. 62 (1990) 553.
[82] R. Trockel et al., Phys. Rev. Lett. 59 (1987) 2844.
[83] Y.D. Kim et al., Phys. Rev. Lett. 67 (1991) 14; Phys. Rev. C 45 (1992) 338;45 (1992) 387.
[84] T. Glasmacher et al. Phys. Rev. C 50 (1994) 952.
[85] L. Beaulieu et al., Phys. Rev. Lett. 84 (2000) 5971.
[86] E. Bauge et al., Phys. Rev. Lett. 70 (1993) 3705.
[87] M. Louvel et al., Phys. Lett. B 320 (1994) 221.
[88] R. Popescu et al. Phys. Rev. C 58 (1998) 270.
[89] G.Wang et al. Phys. Rev. C 57 (1998) R2786; 59 (1998) 014603.
[90] D. Durand, Nucl. Phys. A 630 (1998) 52c and references therein.
[91] J. Pochodzalla et al., Phys. Rev. Lett. 75 (1995) 1040; see alsohttp://www-kp3.gsi.de/www/kp3/aladin.html.
[92] J. Albergo, S. Costa, E. Costanzo and A. Rubbino, Nuovo Cim. 89A (1985) 1.
[93] J.B. Natowitz et al. Phys. Rev. C 66 (2002) 031601(R).
[94] M.B. Tsang, W.G. Lynch, H. Xi and W.A. Friedman, Phys. Rev. Lett. 78(1997) 3836.
[95] Y. Yariv and Z. Fraenkel, Phys. Rev. C 26 (1982) 2138.
[96] J.R. Wu, C.C. Chang and H.D. Holmgren, Phys. Rev. C 19 (1979) 370; 19(1979) 659.
[97] K. Kwiatkowski et al. Nucl. Phys. A 630 (1998) 168c.
[98] T.X.Liu et al.,arxiv.nucl.-ex/0602020(2006).
[99] H. Gutbrod et al. in Winter School on Relativistic Heavy Ions, D.M.Sheppard(editor), BANF, Canada, p. 1 (1992).
[100] L.G.Sobotka, R. Charity, U. Schroeder and J. Toke, Phys. Rev. Lett. 93 (2004)132702.
[101] M.D. D’Agostino et al. Phys. Lett B 473 (2000) 219.
66
[102] F. Gulminelli and P. Chomaz, Phys. Rev. Lett. 82 (1999) 1402.
[103] C.B. Das et al., Phys. Rev. C 66 (2002) 044602.
[104] L.G. Moretto et al. Phys. Rev. Lett 74 (1995) 1530.
[105] X. Campi, J. Phys. A 19 (1986) L917; Phys. Lett. B 208 (1988) 351.
[106] M. Kleine Berkenbusch et al. Phys. Rev. Lett. 88 (2002) 022701.
[107] W. Bauer et al., Phys. Lett. B 150 (1985) 53; Nucl. Phys. A 452 (1986) 699;Phys. Rev. C 38 (1988) 1297.
[108] M.E. Fisher, Physics 3 (1967) 255.
[109] J.B. Elliott et al., Phys. Rev. Lett.88 (2002) 042701
[110] A.H. Raduta et al., Phys. Rev. C 55 (1997) 1344.
[111] L.G. Moretto and L. Phair, Phys. Rev. C 71 (2005) 024607.et al. (2005).
[112] L.G. Moretto et al. Phys. Rev. Lett 94 (2005) 202701.
[113] C.M. Mader et al. Phys. Rev. C 68 (2003) 064601.
[114] M. D’Agostino et al., Nucl. Phys. A 650 (1999) 328.
[115] J.B. Elliott et al. Phys. Rev. Lett. 85 (2000) 1194.
67