
LIGHT & ENGINEERING
192
Volume 26, Number 2, 2018 LIGHT & ENGINEERING Editorial of Journal “Light & Engineering” (Svetotekhnika), Moscow ISSN 0236-2945
-
Upload
khangminh22 -
Category
Documents
-
view
1 -
download
0
Transcript of LIGHT & ENGINEERING

Volume 26, Number 2, 2018
LIGHT & ENGINEERING
Editorial of Journal “Light & Engineering” (Svetotekhnika), Moscow
ISSN 0236-2945

On the Competition of Scientific and Technical JournalsIn early 2017, the Ministry of Education an-nounced the All-Russian competition of Scientific and Technical Journals. Winners should receive state financial support for three years: 2018–2020.
The competition was held in three rounds, and after the first round there were to remain 500 journals (out of 2500 issues presented at the contest). After the second round – there were only 100 journals that went to the last decisive third round.
It should be noted that during the last round of the competition, the remaining 100 editions were additionally subjected to a very rigorous exami-nation of two specialists singled out for this pur-pose by the organizers of the contest. The experts carefully considered the programs submitted by each editorial board for their development in 2018 with financial justification for each of the points of the submitted programs. Our program was forced in a number of cases to disagree with the exper-tise and provided additional justification for the proposed program (its individual items). It’s nice to note that the commission that examined the documents submitted for the third round basical-ly agreed with our arguments. Unfortunately, the amount of anticipated state funding for 2018 was cut three times and amounted to only 1, 000, 000 rub what means, including VAT – 847457. 63 rub.
It can be assumed that one of the most im-portant pledges of our success was the following circumstances:
– Provided full processing of the site in Russian and English languages and access to automatic mode of the site;
– The foundation 26 years ago in New York of the English version of the “Light & Engineering” Journal, the relocation of its publication in Mos-cow in 1999 and the transformation of it over the years into an international journal;
– The issue has been endorsed by CIE Board of Administration as one of the three best lighting journals that meet the CIE requirements and cri-teria (Leukos, Light & Engineering / Svetotechnika,
Lighting Research & Technology), and for many years our editorial board cooperates directly with international scientometric agencies, such as Web of Science and Scopus.
None of the competitor’s participants had such a history with access to the international arena.
It also seems that the establishment of a net-work of foreign correspondent points in countries such as Argentina, India, Turkey, Slovenia, as well as Israel, Iran, South Korea and Finland played an important role in this plan.
But most importantly, in our opinion, this is the active position of our journal, its role in uniting specialists working in various branches of the national economy in the field of illumination, conducting systematic discussions on the most important problems of the development of sci-ence and technology, increasing the scientific and technical level in the field of light and engi-neering in the hundreds specialists who do not have lighting engineering education, systematic expansion of the authors’ team and assistance to new authors in the preparation of materials for publication.
Thus, at present the Journal “Light & Engineer-ing” is one of the in-demand lighting technical journals in the world and it is in a group of the best scientific and technical journals of the Rus-sian Federation.
We are proud of the victory in such a large-scale competition. However, there is a big and difficult work ahead to implement the approved program and preserve our leading positions for our favourite issue.
J.B. Aizenberg
N.S. Sherri
V.P. Budak

Moscow, 2018
Editorial of Journal “Light & Engineering/Svetotekhnika”
General Editor: Julian B. AizenbergEditor-in-Chief: Vladimir P. Budak
Deputy Chief Editor: Raisa I. Stolyarevskaya
Journal “Light & Engineering” had been founded by Prof. Julian B. Aizenberg in 1993
Editorial Board Chairman: George V. Boos, Moscow Power Engineering Institute
Editorial Board:Sergei G. Ashurkov, Editorial of JournalLou Bedocs, Thorn Lighting Limited, United KingdomTony Bergen, Technical Director of Photometric Solutions International, AustraliaAlexander A. Bogdanov, OJSC, “INTER RAO LEDs Systems”Wout van Bommel, Philips Lighting, the NetherlandsPeter R. Boyce, Lighting Research Center, USALars Bylund, Bergen’s School of architecture, NorwayNatalya V. Bystryantseva, ITMO University, St. PetersburgStanislav Darula, Academy Institute of Construction and Architecture, Bratislava, SlovakiaPeter Dehoff, Zumtobel Lighting, Dornbirn, Austria Andrei A. Grigoryev, Deputy Head of the “Light and Engineering” Chair, MPEI, MoscowFranz Hengstberger, National Metrology Institute of South AfricaWarren G. Julian, University of Sydney, Australia Alexei A. Korobko, BL Group, MoscowEvan Mills, Lawrence Berkeley Laboratory, USALeonid G. Novakovsky, Closed Corporation “Faros-Aleph”
Yoshi Ohno, NIST Fellow, (CIE President 2015–2019), USAAlexander T. Ovcharov, Tomsk State Arch. – Building University, TomskLeonid B. Prikupets, VNISI named after S.I. Vavilov, MoscowVladimir M. Pyatigorsky, VNISI named after S.I. Vavilov, MoscowLucia R. Ronchi, Higher School of Specialization for Optics, University of Florence, ItalyAnna G. Shakhparunyants, General Director of VNISI named after S.I. Vavilov, MoscowNikolay I. Shchepetkov, SA MARchi, MoscowAlexei K. Solovyov, State Building University, MoscowKonstantin A. Tomsky, St. Petersburg State University of Film and TelevisionLeonid P. Varfolomeev, MoscowNicolay Vasilev, Sofia Technical University, BulgariaJennifer Veitch, National Research Council of CanadaPavel P. Zak, Emanuel Institute of Biochemical Physics of Russian Academy of Science (IBCP RAS)Olga E. Zheleznyakova, Head of the “Light and Engineering” Ghair, N.P. Ogarev Mordovia State University, Saransk

© Svetotekhnika
Light & Engineering” is an international scientific Journal subscribed to by readers in many different countries. It is the English edition of the journal “Svetotekhnika” the oldest scientific publication in Russia, established in 1932.
Establishing the English edition “Light and Engineering” in 1993 allowed Russian illumination science to be presented the colleagues abroad. It attracted the attention of experts and a new generation of scientists from different countries to Russian domestic achievements in light and engineering science. It also introduced the results of international research and their industrial application on the Russian lighting market.
The scope of our publication is to present the most current results of fundamental research in the field of illumination science. This includes theoretical bases of light
source development, physiological optics, lighting technology, photometry, colorimetry, radiometry and metrology, visual perception, health and hazard, energy efficiency, semiconductor sources of light and many others related directions. The journal also aims to cover the application illumination science in technology of light sources, lighting devices, lighting installations, control systems, standards, lighting art and design, and so on.
“Light & Engineering” is well known by its brand and design in the field of light and illumination. Each annual volume has four issues, with about 80–140 pages per issue. Each paper is reviewed by recognized world experts.
To promote the work of the Journal, the editorial staff is in active communication with Thomson Scientific (Citation index) and other international publishing houses and agencies, such as Elsevier and EBSCO Publishing.
Editorial Office:
Russia, VNISI, Rooms 327 and 334106 Prospekt Mira, Moscow 129626
Tel: +7.495.682.26.54Tel./Fax: +7.495.682.58.46E-mail: [email protected]://www.sveto-tekhnika.ru
Scientific Editors:
Sergei G. AshurkovEvgene I. RozovskyRaisa I. StolyarevskayaArt and CAD EditorAndrei M. BogdanovStyle EditorMarsha D. Vinogradova
Light & Engineering / Svetotekhnika Journal Country Correspondents:
Argentina Pablo Ixitaina National and Technological La Plata Universities
France Georges Zissis University of ToulouseIndia Saswati Mazumdar Jadavpur UniversitySlovenia Grega Bizjak University of LjubljanaTurkey Tugse Kazanasmaz Izmir Institute of Technology (Urla)
Erdal Sehirli Kastamonu University (Kastamonu)Rengin Unver Yildiz Technical University (Istanbul)

3
CONTENTS
VOLUME 26 NUMBER 2 2018
LIGHT & ENGINEERING
Boris A. VeklenkoThe Nature of the Photon and Quantum Optics ....... 4George V. Boos The Probability of Detecting Coloured Objects on Coloured Backgrounds Based on a Statistical Model of the Threshold of Colour Vision ...........................14Alexander T. Ovcharov, Yuri N. Selyanin, and Yaroslav V. Antsupov A Hybrid Illumination Complex For Combined Illumination Systems: Concepts, State of the Problem, Practical Experience ......................20Vladimir M. Pchelin and Irina E. MakarovaAssessment of the Current State and Prospects for Development of Irradiation Systems in Modern Greenhouse Facilities .............................................29Sergei A. Pavlov, Sergei L. Koryakin, Natalia E. Sherstenyova, ElenaYu. Maksimova, and Eugene M. Antipov Highly Effective Covering Materials with Quantum Dots for Greenhouses .............................36Hongwu ZENG Optimization of Classroom Illumination System Based on Neural Network Algorithm ......................45Wenhao DUN Optimization of Intelligent Illumination in University Classroom Based on FMRAS Control Algorithm ..................................................52Henrika Pihlajaniemi, Anna Luusua, and Eveliina Juntunen SenCity – Evaluating Users’ Experiences of Intelligent Lighting for Well-Being in Smart Cities ..60Kai Broszio, Martine Knoop, Mathias Niedling, and Stephan VölkerEffective Radiant Flux for Non-image Forming Effects – is the Illuminance and the Melanopic Irradiance at the Eye Really the Right Measure? .....68Gertjan Hilde Scheir, Peter Hanselaer, and Wouter Rita RyckaertReceptive Field Mechanism and Pupilary Light Reflex for the Assessment of Visual Discomfort .......75Karin Bieske, Ulla Hartwig, Christoph Schierz, Alexander Wilm, and Carolin HorstTM-30–15 and CIE-CRI-Ra: Investigation of Сolour Rendering of White PC LEDs .................81
Valérie Muzet and Joseph AbdoOn Site Photometric Characterisation of Cement Concrete Pavements with COLUROUTE Device ....88Sanaz Bozorg Chenani, Rami-Samuli Räsänen, and Eino Tetri Advancement in Road Lighting ...............................99Suddhasatwa Chakraborty, Pritha Barua, Soumendu Bhattacharjee and Saswati MazumdarRoad Classification Based Energy Efficient Design and its Validation for Indian Roads ............ 110Ya’ou ZHANGInfluence of Governmental Subsidies on Growth of Photovoltaic Enterprises: Empirical Evidence from China ........................................................... 122Yaxin HE and Changheng ZHAO Impact of Media Reports on Innovative Behaviours of Photovoltaic Enterprises: Experience View from China ........................................................... 129Arzu CILASUN KUNDURACI, Tuğçe KAZANASMAZ and Truus HORDIJK Examining Occupancy and Architectural Aspects Affecting Manual Lighting Control Behaviour in Offices Based on a User Survey ......................... 139Yanjiang GONG, Jiang LI, Wenshuang YU, Runbing YANG, and Tiejun ZHOUCost-Benefit Analysis under the DSM Model of Green Lighting ................................................. 148Alexei K. SolovyevDaylight in Underground Spaces .......................... 156Alexander T. Dvoretsky, Alexander V. Spiridonov, Igor L. Shubin, and Ksenia N. KlevetsAccounting of Climatic Features in Designing Solar Shading Devices .......................................... 162Haiwei FU LED Industrial Spatial Structure and its Evolution Trend in Hangzhou Bay Area, China..................... 167Lijun WANG, Yongbo YU, and Jialong XIETechnological Innovation and LED Lighting Industry Development in China ............................ 174Canan PERDAHCI Advantages of LED Lighting System in Comparison with Traditional Fluorescent Lamps for Simple Examination Rooms in Healthcare Facilities ......... 180Content #3 ........................................................... 189

4
Light & Engineering SvetotekhnikaVol. 26, No. 2, pp. 4–13, 2018 No. 1, 2018, pp. 7–14
THE NATURE OF THE PHOTON AND QUANTUM OPTICS
Boris A. Veklenko
Joint Institute for High Temperatures RAS, Moscow E-mail: [email protected]
Everything has to be made so simple, as possible, but not easierA. Einstein
ABSTRACT
In a concise, but accessible for the first acquaint-ance form the procedure for the quantization of linear oscillator is set out. By analogy with this procedure the procedure of quantization (second quantization) of classical Maxwell’s electrodynamics is set up. The physical sense of the wave func-tions arguments of transverse electromagnetic field and its Fourier transformation is set up. One pay attention as for quantum coherent (almost a clas-sic) states of the electromagnetic field and for pho-tonics Fock states. Attention is drawn to the fact of absence the power of the universal content of such concepts as field amplitude, phase and num-ber of particles (photons), which are used by ex-perimenter’s to describe the states of a quantized field. The semi quantitative description the interac-tion processes of a quantum electromagnetic field with substance is set up. Specified situations are shown in which the discrepancy between the pre-dictions of classical and quantum electrodynamics is noticeable at the macroscopic level.
Keywords: classical electrodynamics, quantum electrodynamics, quantum coherent states, Fock states, photon
1. INTRODUCTION
About a hundred years ago, a famous French physicist L. de Broglie (1892–1987) posed the prob-lem to describe the diffraction and interference pho-ton properties, which existence was theoretical-
ly predicted by M. Planck (1858–1947) in 1905. On the basis of his theory [1] de Broglie put the thenknown equations E ω= and 2E mc= . This way led him to the conclusion that the photon pos-sesses a small, but a finite mass. At the same time it remains unclear what are the principal differen-ces between the photon and the other “massive” el-ementary particles. And then de Broglie came up to the brilliant idea: if the fundamental differences between the particles are absent than, on the contra-ry, all “massive particles” like a photon have to pos-sess the wave properties. In such way the quantum mechanics of particles of the final mass was con-structed. But formulated above the primary prob-lem hasn’t been fulfilled by de Broglie. The theory of a photon possessing both corpuscular and wave properties, was constructed later, in five years, by the work of other scientists. This theory turned out to be rather rich and complex, requiring the com-mon efforts of many people. Below in elementary terms one presents its main concepts.
The idea of the light and its internal structure by the development of scientific knowledge has under-gone dramatic perturbations. The concept of “ray of light” has ancient origin. There are two author of the law of refraction: V. Snellius (1580–1626) and R. Descartes (1596–1650). In works of С. Huygens (1629–1695), R. Hooke (1635–1703), and particle I. Newton (1643–1727) was opened the wave nature of light. But the date of establishment of this theo-ry should considered the 1865, when J.C. Maxwell (1831–1879) got from his theory of electricity and magnetism the conclusion of the existence of elec-

Light & Engineering Vol. 26, No. 2
5
tromagnetic waves. Describing by electric Ev (r,t) and magnetic ( , )H r tν strength posed at each point of space r at any time t, these waves perfectly defi-nite quantity the interference, diffraction and the po-larization of light. As for radiation and absorption of light, this theory is coming across the difficulties.
Investigating this question, firstly from thermo-dynamic point of view, and then developing the hypothesis of L. Bolsman (1844–1906) about the inevitability in the nature of the jumpfigurative processes, M. Planck introduced the concept “pho-ton” into the theory, which was reported by him at a meeting in German Physical Society 14 Decem-ber 1905 year. Introduction the “photon” has made possible the understanding of atomic phenomena. As for the properties of the photon until the end of the twentieth years of last century one know nothing apart the expressions for its energy ω (ω is the fre-quency) and momentum k (k is the wave vector). As soon as one speaks about the photons, he/she had to forget about the attributes of Maxwell theo-ry ( ),E r tν and ( ),H r tν . So the Planck’s constant
271,05 10 ' s−= ⋅ ⋅erg
came to the theory. But rather soon it became clear that this constant is applicable not to light only, but also to bodies of finite mass.
In the works in the first place N. Bohr (1885–1962), L. de Broglie, W. Heisenberg (1901–1976) and E. Schrödinger (1887–1961) the quantum me-chanics of particles of final mass was constructed. It was this theory that pointed the way and the need of building a consistent quantum theory of optical phe-nomena. The necessity of such theory directly fol-lows from the definition of electric strength ( ),E r tν as the force acting from the force on a single point charge. In quantum theory, any charged body de-scribes by the wave function, the concept of locali-zation blurs. Together with it, the classical concept of electric strength is blurred. The quantum theory of the electromagnetic field was built in the papers of P. Dirac (1902–1984), V. Heisenberg, V. Pau-li (1900–1958), P. Jordan (1902–1980) and E. Fer-mi (1901–1954) in the period from 1927 to 1930. This theory combines classical (wave) and quan-tum (corpuscular) properties of photons. On a ques-tion “What is a photon?” this theory gives a clear answer: “Photon is an electromagnetic object de-scribed by its wave function”. The explicit form of the wave function is well known, whereas with her interpretation the situation is more complicat-ed. Here are stored all problems, characteristic of quantum mechanics wave function of particles of fi-
nite mass, often discussed up to now [2]. But at the same time be more questions about the methods of its calculation. In spite of the fact that such a theo-ry is now well developed, in engineering practice it still has not found its application. This review aims to introduce the reader to enter into the non-trivial circle of quantum theory of electromagnetic field ideas. I want to believe that, if the reader with pencils in hand will review the proposed review of more than one under consideration, it will signifi-cantly facilitate him /her further acquaintance with voluminous manuals [3] on the subject.
2. THE CLASSICAL ELECTROMAGNETIC FIELD AND THE QUANTUM OSCILLATOR
According to Maxwell’s equations, electromag-netic waves characterizing the propagation of light in the vacuum can be described by introducing the vector potential ( )A r,tν that satisfy the wave equa-tions [4]:
22
2 2
1( , ) ( , ) 0.ν ν∂∇ − =∂
A r t A r tc t
(1)
Instead of the vector potential one traditionally use vectors
1( , ) ( , ) andν ν∂= −∂
E r t A r tc t (2)
( , ) ( , ).ν ν=H r t rotA r t
The solution of equation (1) can be represented in the form of superposition of plane waves
( )( , ) ,ν νλ λ λ
λγ α α− ∗ − += +∑ i ikct i ikct
kA r t e e ekr krk k k
k(3)
where k is the wave vector with components
, ,x y zk k k , λαk is dimensionless constants that de-
pends on wavelength 2 / kπ= and the index of transverse ( ) 0kke λ = polarization 1,2λ = . By eνλk the unit vectors are designated perpendicular to the direction of wave propagation that is to vector k. Next, c is the speed of light in vacuum, and the functions kγ , having the dimension of a vector po-tential are introduced for the convenience of fur-ther consideration. If one put ( )exp iλ λ λα α ϑ=k k k we get:

Light & Engineering Vol. 26, No. 2
6
( )(r, ) cos ,A t e A kctν νλ λ λ
λϑ= − +∑ k k k
kkr
(4)2 .kA λ λα γ=k k
According to (4) the classical electromagnet-ic waves described by entering the classical oscil-lator at each point of space r , which performs the
harmonic oscillations ( )cosA kctλ λϑ− +krk k with
the frequency k kcω = . This suggests that one de-scribes the quantum the electromagnetic wave then the classical oscillators must be replaced by quan-tum one.
Recall that under the classical oscillator one means the material point with mass m, which coor-dinate ( )x t under the action of elastic forces
( ) ( )f t x tχ= − performs the harmonic oscillations with the frequency ω. From the Newton’s law ( )2 2/ ( ) ( )m d dt x t x tχ= − it follows that
( )0( ) cosx t x tω ϑ= + where / mω χ= .
How to construct a quantum theory of the oscil-lator? In quantum theory is to replace the coordinate of the material x and its momentum p are given by operators ˆx x x→ ≡ and ˆ /p p i x→ = − ∂ ∂ . By such replacement the expression of classical point total energy E has to be replaced by operator ex-pression named “Hamiltonian” or the total energy operator H
22
2 22 2 22 2
2
2 2
ˆ .2 2 2 2
pE xm
m mp x x Hm m x
χ
ω ω
= + =
∂= + → − + =∂
In quantum mechanics the state of a quantum particle is described by the wave function ( )xψ obeying the equation to the name of E. Schrödinger:
22 22
2 ( ) ( ) or2 2
m x x E xm x
ω ψ ψ ∂− + = ∂
(5)ˆ ( ) ( ).H x E xψ ψ=
The square of the wave function ( ) ( )x x dxψ ψ∗
determines the probability of detection of the clas-sical coordinates of the particle in the interval dx
around the point x, if such experiment will be deli-vered. Therefore,
( ) ( ) 1.x x dxψ ψ∞
∗
−∞
=∫We write several formal properties of the quan-
tum oscillator [5]. After the change the variables
xς β= , mωβ =
, 2Eλω
=
,
the Schrödinger equation (5) takes the form2
22 ( ) ( )d
dς ψ ς λψ ς
ς
− = .
Of course, instead of ( )ψ ς could be used
( )/x mψ ω , but it is inconvenient. The expres-
sion in brackets resembles an algebraic difference of squares. That is why is seems to be the natural to use the operators
1ˆ2
α ςς
∂= + ∂ , 1ˆ
2α ς
ς+ ∂= − ∂
.
By means of these operators the Schrödinger equation may be rewritten the form
( ) ( ) ( )ˆ ˆ ˆ ˆ ,2
Eω α α αα ψ ς ψ ς+ ++ =
(6)( )ˆ ˆ ˆ ˆ ˆ .
2H ω α α αα+ += +
Under additional condition
( ) ( ) 1dψ ς ψ ς ς∞
∗
−∞
=∫this equation has many solutions, determined by the index 0,1,2,...n = Let us denote these solutions
through ( )nϕ ς
2
2( ) ( ) ,nn H eς
ϕ ς ς−
=(7)( ) 2 21
( ) .2 !
n n
n nn
dH e edn
ς ςςςπ
−−=
Function ( )nH ς is called the Hermit polynomi-als. To each solution ( )nϕ ς its own parameter E corresponds, determing permissible discrete valu-es of the oscillator energy ( )1/ 2nE nω= + , if on it

Light & Engineering Vol. 26, No. 2
7
there are no external forces. Functions (7) are found to be real and possessing the following properties
ˆ ( ) ( 1),n n nαϕ ς ϕ ς= −
(8)ˆ ( ) 1 ( 1),n n nα ϕ ς ϕ ς+ = + +
( ) ( ) .nnn n dϕ ς ϕ ς ς δ∞
′−∞
=′∫
It follows from these equations that
ˆ ˆ ( ) ( )n n nα αϕ ς ϕ ς+ = .
The operator ˆ ˆn α α+= denomination is operator number. With its help the photons operator number will be constructed. If the wave function ( )ψ ς is not the same with any ( )nϕ ς , the number of photons in such state have not a specific meaning, and one can only talk about their average quantum number
ˆ ˆ( ) ( )n n dψ ς ψ ς ς∞
∗
−∞
= ∫ . In General, if the oscillator
is acting by externally force, then the wave func-tion can essentially depends on time. Instead of equation (5), its behaviour is now defines a tempo-rary Schrödinger equation:
( , ) ˆ ( , )x ti H x tt
∂Ψ = Ψ∂
.
3. THE PROCEDURE OF QUANTIZATION OF THE ELECTROMAGNETIC FIELD
We will say that some set of parameters de-scribes the state of any material object in some mo-ment of time 0t = , if this set is sufficient to the pre-diction of the results of any potential experiment carried out on this object in a future time 0t > . In classical mechanics the state of a point particle in the one-dimensional space is described by coor-dinate x and momentum p . In the transition from classical mechanics to the quantum one the coordi-nate of a particle and the momentum are replaced by the corresponding operators. A similar situation ari-ses in the field theory. In classical theory of electro-magnetic field the state of the field is determines by its amplitude ( , )A tν r . It means that by the transi-tion from classical optics to quantum one the field amplitude has to be replaced with an operator ex-
pression. The state of any system in quantum theory describes the wave function ψ satisfying to Schrödinger equation. The explicit form of the Hamiltonian in this equation will be predicted by procedure of quantization of classical oscillator with the replacement of electromagnetic energy by its quantum analogue. In classical physics, the ener-gy of plane electromagnetic waves occupying the volume V is described by formula:
2 2 2( , ) ( , ) ( , )8 8 4V V V
E t H t E tE d d dπ π π
= + =∫ ∫ ∫rr r rr r .
Here is taken into account that at plane electro-magnetic waves the energy falling on the electric and magnetic components is equal to each other. Let us assume that electromagnetic field is placed in a cube with edge L and volume 3V L= . At the borders of the cube one use the periodic boundary conditions ( ) ( ) ( )exp exp exp 1.x y zik L ik L ik L= = = In the case, using (2) and (3), we obtain
( )2
22 , .
4k
k kV
E ckc λ λ λ λ
λ
ω γ α α α α ωπ
∗ ∗= + =∑ k k k kk
(9)
This form of energy emphasizes its reality. The transition to infinite volume carries out by proce-dure V →∞ . Comparison of expressions (6) and (9) indicates that the quantization procedure demands the replacement
22 ,kk
cV
πγω
→
1ˆ ,2λ λ λ
λ
α α ςς
∂→ = + ∂ k k kk
(10)1ˆ .2λ λ λ
λ
α α ςς
∗ + ∂→ = − ∂ k k kk
At the same time, vector potential (3) and total field energy (9) are replaced by operator expressions
( )ˆ ˆ ˆ( , ) ,i ikct i ikctkA t e eν ν
λ λ λλ
γ α α− + − += +∑ kr krk k k
kr
(11)
( )ˆ ˆ ˆ ˆ ˆ .2
kH λ λ λ λλ
ω α α α α+ += +∑ k k k kk
View of the Schrödinger equation containing this operator H (Hamiltonian) was given above

Light & Engineering Vol. 26, No. 2
8
ˆ (V) (V)H Eψ ψ= .
The solution to this equation is the product of functions
( ) ( )nλ λλ
ϕ ϕ ς=∏ k kk
Nς , 12kE nλ λω = + k k ,
E E λλ
= ∑ kk
.
Here, the multidimensional vector ς means a set of arguments ...., ,...λςk with varyous ( ),λk , the multidimensional vector N means a set of numbers ..., ,...n λk . Function ( )nλ λϕ ςk k satisfies the equation
( ) ( ) ( )ˆ ˆ ˆ ˆ2
k n E nλ λ λ λ λ λ λ λ λω α α α α ϕ ϕ ϕ ϕ+ ++ =k k k k k k k k k .
The energy ( )1/ 2kE nλ λω= +k k corresponds
to each solution ( )nλ λϕ ϕk k . Since we are always interested in energy difference
/ 2 ,k kE n λλ λ
ω ω− =∑ ∑ kk k (12)
then on the amount / 2kλ
ω∑k one could not pay at-
tention. The sum in the left side of equality (12) is energy full electromagnetic fields associated with the specific set of numbers n λk that is, a specific set of photons, each with energy kω . Thus n λk means number of photons in the mode ( , )λk .
So, the photon ( )1n λ =k of the mode ( , )λk is the state of the electromagnetic field to which corre-sponds the wave function
( ) ( )( )
21
1/4 2
1 (V )exp / 2
2 exp / 2 .
Hλ λ λ
λ λ
ϕ ς ς
π ς ς−
= − =
= −
k k k
k k
(13)
This is the answer to the question in the title of this article. In infinite space, such states in its pure form cannot exist, as well as in the classical phys-ics strictly monochromatic waves cannot exist. It’s impossible just because monochromatic waves have no boundaries. But researching their properties is extremely fruitful, as soon as any really existing electromagnetic field can be represented in the form of their superposition. The same property is pos-
sessed by the photon states. Any realistically state of the field can be built of them, as from bricks.
To understand the physical meaning of a func-tion (13), it is necessary to find out the physical meaning of arguments λςk . The procedure of quan-tization of fields in accordance with (10) demands the replacement
cos2 2k
Aλ λ λλ λ
α α ϑ ςγ
∗+ = →k k kk k
(14)sin .
2 2k
Aiλ λ λλ
λ
α α ϑςγ
∗− ∂= →∂
k k kk
k
The argument of the wave function λςk corre-
sponds to “classical value” cos / 2kA λ λϑ γk k . The
word “classical” we take in inverted commas, be-cause kγ contents . Of course, it would be possible
to write in such form ( )cos / 2kA nλ λ λϕ ϑ γk k k , but
this is inconvenient, so one is writing ( )nλ λϕ ςk k .
According to quantum principles, construc-
tion ( ) 2n dλ λ λϕ ς ςk k k determines the probability
about detection argument λςk (or “classical” con-
struction cos / 2kA λ λϑ γk k ) in the interval d λςk , if
such experiment will be delivered. In such a way one founds the distribution function of the “classi-cal” variable cos / 2kA λ λϑ γk k .
We consider the Fourier transform (indices k, λ are omitted)
( ) ( )1 ,2
ie dηςϕ ς ϕ η ηπ
∞
−∞
= ∫
( ) ( )1 .2
ie dηςϕ η ϕ ς ςπ
∞−
−∞
= ∫
From the properties of the Fourier transforma-tion it follows that this procedure is accompanied by replacement
( ) ( )ϕ ς ϕ η↔ , iςη∂↔∂
, i ης∂− ↔∂
Light & Engineering Vol. 26, No. 2
9
Therefore, instead of (14) as quantization rules of the electromagnetic fields can serve as the following:
cos ,2 2k
A iλ λ λλ
λ
α α ϑηγ
∗+ ∂= →∂
k k kk
k(15)
sin .2 2k
Ai iλ λ λλ λ
α α ϑ ηγ
∗−= →k k k
k k
Thus, the argument of the function ( )λϕ ηk meets
the value of the classic sin / 2kA λ λϑ γk k . Con-
struction ( ) 2λϕ ηk determines the probability distri-
bution “classical” values sin / 2kA λ λϑ γk k . Be-
cause the function ( )λϕ ηk follows from ( )λϕ ςk by
a Fourier transformation, then according to (13)
( ) ( )1/4 21 2 exp / 2iλ λ λϕ η π η η−= −k k k .
So, for one-photon states we have:
( ) ( )2 2 221 expλ λ λϕ ς ς ςπ
= −k k k ,
( ) ( )2 2 221 expλ λ λϕ η η ηπ
= −k k k .
These are even functions of their arguments, so quantum averages
( )
( )
2
2
0
d
d
λ λ λ λ λ
λ λ λ
ς η ς ϕ ς ς
η ϕ η η
∞
−∞
∞
−∞
= = =
= =
∫
∫
k k k k k
k k k
turned to zero. In other words, in one-photon states
the quantum average cos sin 0A Aλ λ λ λϑ ϑ= =k k k k
is vanishing. For this reason, the classical parame-ters A λk and λϑk cannot describe the single-pho-ton states. Let’s emphasize separately and once again that the single-photon state of the electromag-netic field do not has such attributes as amplitude A λk and phase λϑk .
But such property is inherent not only to one-photon states, but also to any states with pre-cisely defined number of photons (Fock states). Re-
ally, after averaging over any defined by func-
tion ( )nλ λϕ ςk k the quantum average of a vector
potential (11)
( )ˆ (r, )
ˆ ˆ 0i ikct i ikctk
A t
e e e
ν
νλ λ λ
λγ α α− + − +
=
= + =∑ kr krk k k
k
turns to zero, which follows from the relations (8).
But the quantum average ˆ ( , )A tν r cannot be van-
ish, if we are dealing with superposition of wave functions with different numbers n λk . It is among these superposition’s necessary to find the wave function describing the quantum state that most closely approximates a classic field. Such a super-position is (again, we omit the indices k ,λ ):
( ) ( )2
2
0 !
n
ne n
n
α αϕ ς α ϕ ς∞−
=
= ∑ ,
( ) ( ) 1dϕ ς α ϕ ς α ς∞
∗
−∞
=∫ ,
where α is any number. It is customary to speak, that this superposition describes the “quantum co-herent” state. It is easy to see that ( )αϕ ς α =αφ(ς|α). If the operator α to describe in explicit form (10), we get the equation
( ) ( )12
ς ϕ ς α αϕ ς ας
∂+ = ∂ , the solution of
which is a function
( ) ( )2
1/4 21exp 2 .4 2
α αϕ ς α π ας ς
∗−
+ = − + −
(16)
When working with quantum coherent states the following integral is useful:
( )2
2exp exp4
d π δδς βς ςβ β
∞
−∞
− = ∫ .
Now, it is clear that ( ) ( ) 1dϕ ς α ϕ ς α ς∞
∗
−∞
=∫ .
We use the Fourier transform

Light & Engineering Vol. 26, No. 2
10
( ) ( )
( )2
1/4 2 2
12
1exp 2 .4 2
ie d
i
ηςϕ η α ϕ ς α ςπ
α απ α αη η
∞−
−∞
∗−
= =
+ = − + − −
∫
It follows from (16) and (17) that
( )2
2 1 exp ,2
α αϕ ς α ςπ
∗ += − − (18)
( )2
2 1 exp .2i
α αϕ η α ηπ
∗ −= − −
If one use the ideas ( )exp iα α ϑ= and
( )exp iα α ϑ∗ = − , then the most probable values of
exς and exη according to (14) and (15) will be:
( )cos / 2 2 cos2ex k ex
A α ας ϑ γ α ϑ∗+= = = ,
( )sin / 2 2 sin2ex k ex
Ai
α αη ϑ γ α ϑ∗−= = = .
At 2 k Aγ α = from these ratios, the expressions
followed which are valid for classical waves.Next, we need an auxiliary equality
( ) ( )
( ) ( )
ˆ ˆ
ˆ
n d
d
ϕ ς α α αϕ ς α ς
α ϕ ς α α ϕ ς α ς
∞∗ +
−∞∞
∗ +
−∞
= =
= =
∫
∫
( ) ( )ˆ dα αϕ ς α ϕ ς α ς αα∞
∗ ∗
−∞
= =∫ .
Because the averaging on coherent states gets
( )ˆ ( , ) i ikct i ikctkA t e e eν ν
λ λ λλ
γ α α− ∗ − += +∑ kr krk k k
kr ,
( )
1( , ) ( , )
sink kk
E r t E r tc t
e E kr kct
ν ν
νλ λ
λϑ
∂= − =∂
= − +∑ ,
22 kEVλ λπ ω α= −k k ,
so for these states, taking into account the auxiliary
equality written in the form nα = , one is find-
ing 2 / 8 kE V nλ λπ ω=k k . Introducing the concept
of effective amplitude of the field / 2E Eλ λ=k k ,
we conclude 2 / 4 kE V nλ λπ ω=k k . So, if the elec-
tromagnetic wave is in a quantum coherent state, it does not possess a fixed number of photons, but its energy can be calculated as a quantum formula and classical one.
A quantum averages and the most probable pa-rameters of the electromagnetic field coincide with their classical analogues, if the free field is in quan-tum coherent state. But that doesn’t mean that each experiment will give the values of classical parame-ters. According to the distributions (18), there will be dispersion of points. The magnitude of this dis-persion is determined by the dispersions of the dis-tributions (18), which do not depend on the ampli-tudes of the fields. For this reason, if the amplitudes are large, then the dispersions can be neglected.
In this case, a flat electromagnetic wave, find-ing in the quantum coherent state, is described well by the classical theory. But that doesn’t mean, that the result of the interaction of such waves with the environment always admits a classical description. Such example is set out below. Once again, empha-size that large value of the quantum coherent field by itself is not enough to use classical Maxwell equation.
It is useful to notice that in Fock state standing field with a large number of photons can to give a very high energy and destructive force, but the classical description of such a field does not exist.
4. THE INTERACTION OF THE ELECTROMAGNETIC FIELD WITH THE ENVIRONMENT
We will discuss examples showing that the evo-lution as strong as one wants and being in the quan-
tum coherent state ˆ( , ) 0A t ≠r electromagnetic
fields may not obey the laws of classical physics.Consider a system consisting of excited atom
and quantized electromagnetic field interacting each

Light & Engineering Vol. 26, No. 2
11
to another. For the sake of simplicity, we suppose, that the atom has one valence electron and two ener-gy levels: ground and excited. The wave function of an electron in an excited atom denote by ( )
exjψ r ,
in the ground state via ( )gj
ψ r . Spin effects will neglect.
Let the atom, placed in an excited state ( )exjψ r
undergoes action of the single –mode ( )0 0λk radia-
tion, placed in a quantum coherent state ( )ϕ ς α .
As a result of the scattering process, the total wave function atomfield system takes the form
(t) (t) ( ) (t) ( ).ex ex g gj j j jf fψ ψΨ = +r r (19)
Function (t)exf describes the coherent channel of scattering, as a result of which the scattering atom remains in the initial excited state. Function (t)gf
describes the scattering channel, as a result of which the atom of changes its state on ground state. This channel will be called incoherent. Since in the initial state electromagnetic field has “quantum average”
value of the amplitude ˆ ( , )A tν r , then after scatter-
ing this construction will not turn to zero. Below, in-
stead of operator ( )ˆ ,A tν r one will use the operator
of tension of the electric field
( )
ˆ1 ( , )ˆ ( , )
ˆ ˆ .i ikct i ikctk
A tE k tc t
i e k e
νν
νλ λ λ
λγ α α− + − +
∂= − =∂
= −∑ kr krk k k
k
r
“Quantum average” of electric tension of elec-tromagnetic field after scattering is calculating by conventional rule
ˆ ˆ( , ) ( , )
ˆ ( , )
ˆ ( , )
ex ex
g g
ex j ex j
g j g j
E t E t
f E t f
f E t f
ν ν
ν
ν
ψ ψ
ψ ψ
= Ψ Ψ =
= +
+ =
r r
r
r
(c) (n)
ˆ ˆ( , ) ( , )
( , ) ( , ).
ex ex g gf E t f f E t f
E t E t
ν ν
ν ν
= + =
= +
r r
r r(20)
Here in explicit form the function (t)Ψ describ-ing by expression (19) is shown, with the help of which the quantum averaging is performed, and it is
taken into account that the operator ( )ˆ ,E tν r does
not change the mutually orthogonal j jψ ψ ′ =
( ) ( )j j jjψ ψ δ∗′ ′= =∫ r r and normalized per unit the
wave atoms functions. For these reasons, atomic functions fall out of this formulas, as well as fall out the interference term
ˆ ( , ) 0ex gex j g jf A t fνψ ψ =r .
It is important to note that interference term turns to zero because of orthogonality of atomic functions, which eliminates the “quantum interfe-rence terms” of the electromagnetic field. The clas-sical physics does not possess such property. Let’s to say that coherent and incoherent channels of scat-tering are not quantum incoherent. But classical co-herence in the form of summation of amplitudes with according to (20) is retained. From the coher-ent scattering channel the process of stimulated ra-diation that changes the state of the scattering atoms fall out. Thus, it should be distinguished two types of coherence: “quantum” depending on phase of full wave function of the system, and “classical”, deter-mined by the phase of averaged amplitude of the field. At the process of averaging the quantum phas-es disappear.
Suppose now we are interested in the energy characteristics of the scattered field, describing the “quantum averages” from the bilinear combinations of the field operators
ˆ ˆ ˆ ˆ( , ) ( , ) ( , ) ( , )E t E t E t E tν ν ν ν= Ψ Ψ =r r r r
(21)ˆ ˆ( , ) ( , )
ˆ ˆ( , ) ( , ) .
ex ex
g g
ex j ex j
g j g j
f E t E t f
f E t E t f
ν ν
ν ν
ψ ψ
ψ ψ
= +
+
r r
r r
Here again and for the same reason there is no cross term. Both terms are positively determined.

Light & Engineering Vol. 26, No. 2
12
Thus, the energy characteristics of the scattered field are determined independently by two channels of reactions and then algebraically add up. Accord-ing to (21) the interference between channels is ab-sent. Very important is to note that there is no inter-ference between placed in the incoherent channel processes of induced radiation and scattering pro-cesses that do not change states of the atom sys-tem. In this sense, incoherent properties of induced processes, which rarely stressed, can significant-ly change the macroscopic pattern of the scattered field.
The value of the averaged bilinear structures (21) it is convenient to estimate using the well-known inequality
ˆ ˆ ˆ ˆ ˆ ˆ ,BB BB BB
true for any operators and any procedure of averag-ing. Applying this inequality to both terms equality (21), we obtain the lower estimate for the research construction
(c) (c) (n) (n)
ˆ ˆ( , ) ( , )
( , ) ( , ) ( , ) ( , ).
E t E t
E t E t E t E t
ν ν
ν ν ν ν+
r r
r r r r(22)
If only the non-coherent channel (and the pro-cesses of induced radiation) are absent or on any reason the coherent channel of scattering is absent, the energy of the scattered electromagnetic field is determined by the squared of scattering amplitude, which resemble equality, at in classic field. In other words, the classical physics can correctly describe the scattering process of resonant radiation only in exceptional cases. In general, if the scattering radiation is almost classical and is in a quantum coherent state the scattered radiation loses this pro-perty. According to (22), the energy of the scat-tered radiation consists of two terms that are de-fined by different channels of scattering. Energy characteristics of these channels summed. “Quan-tum coherence states” do not obey such properties. One can say that in the scattered radiation, along the quantum coherent component the “Fock’s” component appears. The value of “Fock’s” compo-nent can reach rather hundred percents of the to-tal radiation. Such radiation in the representations of classical physics can’t be described. This is the case with Fresnel reflection of resonance radia-tion from excited media [6]. They say that in these
cases we have dealing with the discrepancy bet-ween the predictions of the classical and quantum physics at a macroscopic level.
5. CONCLUSION
Pay attention to the equality
( ) ( )2
1/4 21exp 24 2
α αϕ ς α π ας ς
∗−
+ = − + − =
( )2
2
0,
!
n
ne n
n
α α ϕ ς∞−
=
= ∑
which is indicating that the closest to the classical presentation the concepts of “quantum coherence states” of electromagnetic field can be represented as a sum of photons (Fock states) states having no classical analogues. It is a “quantum coherent state”
( )ϕ ς α can be described verbally with the help of
concepts “amplitude”, “phase” and “dispersions” of these quantities, then as photons (Fock) states
( )nϕ ς of these attributes lack. In Fock states we
use the adoption of a “photon”. There is also an in-verse relationship [7]:
( ) ( )21
221!
n
n e dn
ααϕ ς ϕ ς α απ
∗ −= ∫∫ ,
( ) ( )2 Re Imd d dα α α= ,
which is indicating that photons (Fock) states, in-cognizant the concepts of “phase” and “amplitude”, can be present in the form of a superposition of “quantum coherent states”, which are characterized by such concepts. One can speak that we solve the problem in photon (Fock) or in a coherent rep-resentation. Therefore, the objective characteristic of the electromagnetic field is its state described by the wave function. For depending on the mathema-tical background chosen by us, the specific view of this function can be strongly various. It may be rep-resenting by the series of functions ( )nϕ ς as well
as functions ( )nϕ ς .

Light & Engineering Vol. 26, No. 2
13
The attributes such as amplitude, phase, and number of photons, are inherent to concrete rep-resentations and are not invariant with respect to the choice that depends on us. Thus, these attributes do not follow absolutely sense and do not possess uni-versal meaning.
The need for quantization of the electromagne-tic field follows from logical considerations and from different results of calculations using quan-tized and classical fields that qualitatively demon-strated above on some examples.
REFERENCES
1. de Broglie, L. Waves and quanta. Selected scientific works. M: Logos, Vol.1, 2010.
2. Greenstein George, Zajonc Arthur G. The Quan-tum Challenge (Modern Research on the Foundations
of Quantum Mecanics). JONES AND BARTLETT PUB-LISHERS. BOSTON, TORONTO, LONDON, SINGA-PORE. 2006.
3. Rodney Loudon. The Quantum Theory of Light. Clrendon Press, Oxford 1973.
4. Landau L.D. & Lifshitz E.M. The Classical Theory of Fields (Volume 2 of A Course of Theoretical Physics) Pergamon Press, 1971.
5. THE QUANTUM THEORY OF RADIATION by W.HEITLER. Oxford at the Clarendon Press, 1954.
6. Veklenko B.A. The breaking of Fresnel’s formu-la by reflection of resonant radiation from excited media. Applied Physics (Russian) 2011, 1, pp. 5–14.
7. Klauder J.R. and Sudarshan E.C.G. Fundaments of Quantum Optics// Syracuse University, New York, Amsterdam 1968.
Boris A. Veklenko, Prof., Dr. of Phys.Math. Sc., graduated from the Moscow Power Institute in 1955, defended doctor theses in 1991. At present, he is a Chief Researcher of the JIHT RAS and solves problems of quantum theory of radiation

14
Light & Engineering SvetotekhnikaVol. 26, No. 2, pp. 14–19, 2018 No. 6, 2017, pp. 27–31
THE PROBABILITY OF DETECTING COLOURED OBJECTS ON COLOURED BACKGROUNDS BASED ON A STATISTICAL
MODEL OF THE THRESHOLD OF COLOUR VISION
George V. Boos
The Moscow Power Institute NRU, Moscow E-mail: [email protected]
ABSTRACT
Using a statistical model of the threshold of co-lour vision, a new expression is obtained to cal-culate the detection probability of colour objects against colour backgrounds. The method shows that in the day sight area, this probability is complete-ly determined by the individual criterion of deci-sion making about an object’s presence, by addi-tion functions of the RGB colorimetric system, by radiance spectral concentrations of the object and background, and by the angular dimensions of the object.
Keywords: visual system of a person, theory of statistical solutions, optimum receiver, detec-tion probability, direct and reverse problems
1. INTRODUCTION AND PROBLEM FORMULATION
The existing theories of colour vision focus on the explanation of the psychophysical aspects of colour perception [1], in particular on an observ-er’s ability to equalise colours visually. Theories ex-plaining the reasons for the existence of colour dis-crimination thresholds, which allow calculating the probability of detection of colour objects, were not identified in the existing literature.
Modern methods of calculating colour detec-tion thresholds are based on an empirical approach, which does not explain why colour discrimina-tion threshold arise.
Since the effectiveness of the application of the statistical solution theory to the calculation of the detection thresholds of monochrome images in [2–4] has been proved, it can be considered a natu-ral generalisation of the statistical approach to the processes of detecting coloured objects, i.e. there is scope for developing a statistical theory of the threshold of colour sight.
As the statistical approach is based on the spec-tral sensitivity of radiation receivers, and the most appropriate theory of colour sight is three-compo-nent theory of YoungHelmholtz [1], the most sound approach is to develop a statistical theory based on the RGB physiological colorimetric system. This approach is both fundamental and practical. The International Commission on Illumination (CIE) recommends using the general colour rendering index [5] to evaluate the quality of colour rendi-tion when developing new illumination devices. In accordance with [6, 7], calculations of a gene-ral colour rendition index are carried out in the CIE uniformchromaticityscale system 1964 U*V*W*. These Ra calculations use von Kries coefficients to exclude a systematic error arising due to the dif-ferent colour adaptation of the visual system (VS) to the reference and examined light sources. These are also calculated in the RGB colorimetric sys-tem. The calculation of colour co-ordinates is per-formed according to the classical radiation expres-sions [6, 7]:
780
380
( ) ( )eL dλ λ ξ λ λΞ = ∫ , (1)

Light & Engineering Vol. 26, No. 2
15
here Ξ = R, G, B, Leλ(λ) is radiance spectral con-centration, λ is radiation wavelength, so the error in the definition of the addition functions
( ) ( ), ( ), ( )r g bξ λ λ λ λ= inevitably affects the
reliability of the obtained values of the general co-lour rendering index.
As has been shown in [8], classical methods for determining specific colour coordinates of the RGB colorimetric system, based on experiments with di-chromate, lead to unpredictable errors. Therefore it becomes necessary to determine the curve for a sub-ject with normal vision under natural eye adapta-tion conditions. The first step is to derive expres-sions for the detection probability of colour objects on colour backgrounds at specific RGB colour co-ordinates. Since such probabilities can be obtained through experimental studies of visual systems, solving this mathematically for a subject with nor-mal colour vision can identify specific RGB colour coordinates.
This paper is devoted to solving the problem at hand and assumes that the known functions of the RGB colorimetric system are known.
2. METHOD OF SOLVING THE FORMULATED PROBLEM
Works [2–4], consider threshold characteristics of a human visual system in detail, based on a sta-tistical approach. The main limitations of the me-thods they propose is that it can be only used for low levels of adaptation luminance and for observa-tion of one-colour images, when only the rods ap-paratus of the visual system works. The first suc-cessful attempts to apply a statistical approach to explanation of colour thresholds of visual system were made in [9, 10], however this only addressed the detection of thresholds for monochromatic ob-jects against white backgrounds. Obtaining calcu-lation expressions for detection probability of ar-bitrary colour objects against colour backgrounds requires further study.
With regard to solving problems of single-col-our image detection by the human visual system, a block diagram of the VS mathematical model is provided in [4, Fig. 1], based on an optimal sta-tistical receiver [11]. A fundamental difference of the threshold colour vision mathematical model (TCVMM) from that given in [4] is the three re-
ceiver types (R, G and B) with reactions μri, μgi, μbi and with a nonlinear dependence of these reactions on adaptation luminance.
According to the block diagram, a person’s field of vision can have either an image of a colou-red object on a colour background, or an image of a coloured background, differing only in chroma-ticity and luminance from the image of the object. Random output signals R, G and B of receptors (μri, μgi, μbi) are transmitted via optic nerve fibres to the brain, which is represented in the block diagram by memory, analysis device (AD) and decisionmaking device (DMD), which decided whether an object is present or not in the visual field.
According to the theory of the optimum statis-tical receiver [4, 11], on which TCVMM is based, the analysis device (AD) calculates onedimension-al function of the credibility relation (Λ) equal to the relation of emergence probability (Р [Y/S]) of ran-dom two-dimensional distributions of signals μri, μgi, μbi (random Y implementation) at the output of radi-ation receivers matrix (RR) under the condition of emergence of the studied colour object against a co-lour background in the visual field, to emergence probability of (Р [Y/0]) of the same Y implementa-tion under the condition of colour background emer-gence without an object in the visual field.
[ / ][ / 0]
p P Y Sq P Y
Λ = , (2)
where p and q are priori probabilities of object and background emergence (p + q = 1).
The decision-making device (threshold device ThD) makes a decision on the presence of a colour object against a colour background in the visual field every time the calculated value Λ exceeds threshold value Λth. Otherwise, it makes the deci-sion on the presence a background without an object in the visual field. The optimum receiver algorithm allows using the results of the previous work detec-ting one-colour objects [4] for analysing the thres-hold of colour sight as a mathematical model.
Using the results of [4], it is simple to obtain an expression to determine the logarithm of credibil-ity relation (Z) in problems of calculating detec-tion probability of a colour object against a colour backgrounds for the distribution law (P[Z]):
2
2
( )1[ ] exp2 2
Z mP Zπσ σ
Λ
Λ Λ
−= −
, (3)

Light & Engineering Vol. 26, No. 2
16
where 1 1
ln ln ( )N N
îii îi ôi
i iôi
ÕZ Õ X
Xµ
= =
= Λ = − −
∑ ∑ ,
μi is the totality of random output signals of the ra-diation receiver (RR): μri, μgi, μbi; Xoi, Xфi are ma-thematical expectations of matrix i RR output signal under the condition that a colour object is observed on a colour background and respectively that a co-lour background is observed without an object.
For statistically independent RRs, it is sim-ple to obtain expressions [4] for mathematical ex-pectation mΛ and for dispersions 2σ Λ of the cre-dibility relation logarithm provided that an object is in visual field:
1 1
2 2
1
ln ( ),
ln ,
N Nîi
îi îi ôii iôi
Nîi
îii ôi
Õm Õ Õ X
X
ÕÕ
Xσ
Λ= =
Λ=
= − −
=
∑ ∑
∑ (4)
where N is number of RGB receivers in the RR matrix.
As the optimum receiver makes a decision on the presence of an object, if Λ ≥ Λп, then taking into con-sideration the monotony of the logarithmic func-tion provided that an object is within the visual field, the probability of correct detection is deter-mined by the integration of the conventional distri-bution law ln(Λ) over values area ln(Λ) from ln(Λп) to infinity:
ï
2
2ln
( )1exp ( )
2 2det
Z mP dZ Ô y
πσ σ
∞Λ
Λ ΛΛ
−= − = ∫ , (5)
ïlnmyσ
Λ
Λ
− Λ= , (6)
where 2 21
( ) e2
ytÔ y dt
π−
−∞
= ∫ is probability integral [12].
According to [13], with increasing luminance, the relation of “action current” pulse frequency at the receptor output of the visual system to the pho-ton flux incident on the receptors decreases. There-fore, the effective transformation coefficient used in [4] for determining the receptor signal distri-bution law will be much less than one with day-
light luminance. This makes it possible to use Pois-son distribution law to descript receptor reactions in TCSMM as well. In this case, at p = q, the expres-sion for credibility relation [2] will be as follows:
( )1
exp ( )iN
îiîi ýi
i ýi
ÕÕ X
X
µ
=
Λ = − − ∏ . (7)
As it was noted already, human colour vision is connected with presence of three types of receptors in the visual system with output signals μri, μgi, μbi generating μi. Therefore, these signals should be ex-plicitly added to the expression. With statistically independent (under the threshold conditions) RRs, we will group (similar to [10]) reactions of R, G and B receptors. Then expression (7) for the credibility relation will be as follows:
1
( ) ( )exp ,
( )
êi çi ñinîêi îçi îñi
i ôêi ôçi ôñi
îêi ôêi îçi ôçi
îñi ôñi
Õ Õ Õ
X X X
Õ X Õ X
Õ X
µ µ µ
=
Λ =
− − − − − − −
∏ (8)
where n is the number of RGB triads in whole num-ber N of model receivers, and Xoкi, Xoзi, Xoсi, Xфкi, Xфзi, Xфсi are conventional mathematical expecta-tions of R, G, B receptors output signals in the pre-sence of an object and background in visual field respectively.
After taking the logarithm of the left and right parts (8), we will obtain an expression for ln(Λ) as:
1
ln( ) ln
ln( ) ln( ) ln( ),
n
ê ç ñi
ê ç ñ
=
Λ = Λ Λ Λ = = Λ + Λ + Λ
∏ (9)
where Λr, Λg, Λb are particular credibility relations calculated for reactions of R, G, B receptors;
( ) 1
exp ( ) , , , .
ê inî i
i ý i
î i ý i
Õ
X
Õ X r g b
ξµξ
ξξ
ξ ξ ξ
=
Λ =
− − =
∏ (10)
Thus, the detection probability of an object by chromaticity or luminance against a colour back-ground will be determined by expressions (5) – (6), in which parameters of the distribution law ln(Λ) are specified by expressions:

Light & Engineering Vol. 26, No. 2
17
2 2 2 2,r g b r g bm m m m σ σ σ σΛ Λ Λ Λ Λ Λ Λ Λ= + + = + + , (11)
where
1 1
2 2
1
ln ( ),
ln , , , .
N Nî i
î i î i ô ii iô i
Nî i
î ii ô i
Õm Õ Õ X
X
ÕÕ r g b
X
ξξ ξ ξ ξ
ξ
ξξ ξ
ξ
σ ξ
Λ= =
Λ=
= − −
= =
∑ ∑
∑ (12)
3. DETERMINATION OF TCVMM RECEPTOR REACTION DEPENDENCE ON THE OBSERVED LUMINANCE
To derive an expression for the detection proba-bility of colour objects, we need to find the mathe-matical model receiver output reaction dependence on the visionable luminance. This is not straight for-wards, as the receptor is nonlinear within the day sight area (Lv ≥ 10 cd/m2), i.e. with a nonlinear de-pendence of the “action current” pulse frequency in the fibres of the optic nerve [13] on photon radi-ation flux. This leads to the fact that the photomet-ric contrast of the observed objects differs from the signal contrast of the mathematical model RR out-put. In [3, 10] an RR reaction’s dependence on the sought luminance is presented, however it is ob-tained for only one type of receptor, which is insuf-ficient for a colour sight model.
One of the basic colorimetric principles asserts that in daytime vision the chromaticity of perma-nent spectral composition objects does not depend on the changing luminance of the objects [7]. Ac-cording to expression (1) reactions of R, G and B receptors ( , ,ê ç ñX X X ) are proportional to colour co-ordinates of the RGB physiological colorimetric system. It follows from this:
, , ,r
r g b
X X X r g bX X X ξξ ξ ξ= → = =
+ +, (13)
where r g bX X X X= + + is the sum of R, G, B re-ceptor reactions depending on background lumi-nance, and r, g, b are colour co-ordinates indepen-dent of luminance.
Using expression (13) one can determine the contrast connection at the receptor KR = ∆X/X out-put with photometric contrast K = ∆Lv/Lv:
î ê î ç î ñ ô ê ô ç ô ñR
ô ê ô ç ô ñ
X X X X X XK
X X X+ + − − −
=+ +
, (14)
where , ,îr îg îbX X X and , ,ôr ôg ôbX X X are mathe-matical expectations of output reactions of any R, G and B receptor sought an area within object con-tour under the condition of observing a colour ob-ject against a background and colour background only, respectively.
With due regard for (14) it is simple to derive:
î ôR
ô
X XK
X
−= , (15)
where îX , ôX are sums of mathematical expec-tations of receiver signals under the condition of sighting of an object and background respectively.
Standard objects, which are used in colorime-try, have angular dimensions from two to ten de-grees. With such angular dimensions and with an adaptive luminance greater than 10 cd/m2, valu-es of thres hold luminance contrasts on any back-ground and any object chromaticity, as well as sig-nal contrast values at the receptor output, are much less than one [7].
This allows limiting by two terms of Taylor’s se-ries expansion of function ( )îX L [12] in expres-sion (15) at vicinity X=Xф. Then:
RL LdX dXK K
dL X dL Xν ν
ν ν
∆= = . (16)
Use of this expression in TCVMM makes it pos-sible to derive a differential equation for X (Lv) de-pendence. Let’s now transform expressions (12) for mΛ and 2σ Λ as well, having used difference of the re-ceiver signals (ΔXi) sighting object and background:
( )1 1
2 2
1
ln 1 ,
( ) ln .
n ni
i i ii ii
ni i
i ii i
Õm Õ X X
X
Õ XÕ X
Xσ
Λ= =
Λ=
∆= + ∆ + − ∆
+ ∆= + ∆
∑ ∑
∑ (17)
Having expanded logarithm in (17) into Taylor’s series in vicinity of one, we will be limited by two expansion terms and consider a frequent case of ob-serving equallybright objects against a uniform background. Under these conditions, out of object
Light & Engineering Vol. 26, No. 2
18
contour ΔXi = 0 and within it, the difference of re-ceiver signals has a constant value ΔX.
Within the object contour, Xi doesn’t de-pend on the receiver number as well and is equal to X. Therefore, expressions (17) become simpler:
( ) ( )
( ) ( )
2 2
1
2 2
2
1
1 1,
2 2
,
ni
i i
ni
i i
Õ Õm t
X X
Õ Õt
X Xσ
Λ=
Λ=
∆ ∆= =
∆ ∆= =
∑
∑ (18)
where t is number of RRs sighting a space area within the object contour.
With little differences ΔX typical for threshold contrasts of big angular size objects, it can be ex-pressed by a derivative of searched dependence of receiver reaction X of background luminance Lv in the form of v vÕ L dX dL∆ = ∆ , where ΔLv is ob-ject – background luminance difference. Then ex-pression (6) for probability integral argument de-termining probability of object detection will be as follows:
ïln
2
my
mΛ
Λ
− Λ= . (19)
According to experimental studies of lumi-nance threshold contrasts [7], with angular object dimensions greater than 2o and background lumi-nance greater than 10 cd/m2, WeberFechner law is valid, i.e. when the background luminance changes, threshold contrast remains constant. This means that detection probability also does not depend on back-ground luminance, so derivative 0vdy dL = . As un-der the threshold conditions (Pob = 0.5) argument of the probability integral is equal to zero [12], then from expression (19) a differential equation for X dependence on luminance Lv can be obtained:
22 =0
2 vvv
t d dXK L XdLdL
. (20)
As photometric contrast v vK L L= ∆ in the We-ber-Fechner area does not depend on luminance, solution (20) is a function of luminance square logarithm:
( )21 2ln vÕ Ñ C L= , (21)
where C1 and C2 are arbitrary integration constants not dependent on luminance.
With due regard for (13), the obtained result al-lows drawing the conclusion that nonlinearity of all three types of cones is identical and is determined by expression (21) with different C1 values and co-inciding C2 values.
4. CALCULATION RATIO FOR DETECTION PROBABILITY OF A COLOUR OBJECT AGAINST A COLOUR BACKGROUND
Detection probability of a colour object against a colour background is determined by expressions (5) and (6). The expression for probability integral argument (6) can be transformed in accordance with (11) and (18) as follows:
( )
ï
2
ln
, 2
, = , , .2
Ï
yÏ
t L dX dLÏ r g b
X
ξξ
ξξ
ξ ξ ξξ
ξ
ξ
− Λ=
∆=
∑
∑ (22)
Taking into account the obtained dependence of RR reactions on luminance (21), components jÏ of expression (22) will be as follows:
2
12L
Ï tÑL
ξξ ξ
ξ
∆=
, (23)
where according to [7],
780
380
683 ( ) ( )eL L dλξ ξβ λ ξ λ λ= ∫ , (24)
( )780
380
683 ( ) ( ) ( )e î eL L L dλ λξ ξβ λ λ ξ λ λ∆ = −∫ , (25)
where Leλо(λ) object, Leλ(λ) is radiance spectral con-centration of the background, βξ are luminance co-efficients of RGB colorimetric system, ξ = r, g, b,
( ) ( ), ( ), ( )r g bξ λ λ λ λ= , С1r, С1g, С1b are con-

Light & Engineering Vol. 26, No. 2
19
stants not dependent either on the object and back-ground spectrum or on the object angular size.
If to introduce solid angles Ω of the object and of instant visual field ω of any RR, then the number of R, G, B triads of the receivers in RR matrix sighting an area within the object contour will be determined by the following expression:
3t
ωΩ= . (26)
Formulas (22) – (26) completely determine cal-culation expression for y.
5. CONCLUSIONS
Applying the optimum statistical receiver theory to the detection processes of a colour object against a colour background allowed obtaining a calcu-lation expression for the probability of its detec-tion which showed the following:
1. Luminance coefficients of primary colours of the RGB colorimetric system do not influence the detection probability of colour objects against co-lour backgrounds. When detecting a colour object, the influence of addition functions of the RGB col-orimetric system is principal, and maximum values of addition functions also do not influence the de-tection probability.
2. In case addition functions are known, the de-tection probability of colour objects on a colour background is unambiguously determined by value Λп, by spectral luminance distributions over surfac-es of the object and background and by angular di-mensions of the object.
3. Constant coefficients of the mathematical model, including a criterion for decision making by a person (the criterion is determined by ln(Λп) va-lue), do not depend on the angular size of the object and on the spectral luminance distribution over the object and background and can be determined when normalising the mathematical model.
4. The obtained expression allows calculating the detection probability of colour objects on colour backgrounds with arbitrary spectra (chromaticities) of the objects and backgrounds.
5. However, to solve a reverse problem of find-ing ( ), ( ), ( )r g bλ λ λ values experimentally study-ing the detection probability of colour objects using expressions (5) and (22) – (26), the development of a special protocol and criteria for the experimental installation are required.
REFERENCES
1. Judd D., Vyshetski G. Colour in science and technology. Moscow: Publishing house MIR, 1978, 592 p.
2. Grigoriev A.A. Application of the statistical solution the-ory for calculation of probability and threshold characteristics of vision organ // Svetotekhnika, 2000, #6, pp. 23–25.
3. Grigoriev A.A. Statistical theory of image perception in optoelectronic systems of visualisation: 05.11.07– Optical and optoelectronic devices and systems: Abstract of Doctor of En-gineering / Moscow: The Moscow Power Institute (MPI TU, 2001, 40 p.
4. Boos G. V., Grigoriev A.A. New approach in the de-termination of qualitative characteristics of outdoor illumi-nation installations // Light&Engineering, 2016, V.24, #1, pp. 51–57.
5. GOST 23198–94. Electric lamps. Methods of measuring spectral and colour characteristics.
6. Reference book on lighting engineering / Under the ed-itorship of Yu.B. Aizenberg. The 3rd revised edition, Moscow: Znak, 2006.– 972 p.
7. Meshkov V. V., Matveev A.B. Fundamentals of Light-ing engineering: Manual for high education institutions: part 2. Physiological optics and colorimetry. The 2nd revised edition, Moscow: Energoatomizdat, 1989, 450 p.
8. Boos G. V., Grigoriev A.A. On colour co-ordinates of primary colours of the RGB colorimetric system // Sve-totekhnika, 2016, #3, pp. 30–34.
9. Gordyukhina S. V., Grigoriev A.A. A Metod of deter-mining sensitivity of RGB receptors based on the statistical model of vision organ // The Moscow Power Institute Bulle-tin. – Мoscow: The Moscow Power Institute publishing house, 2010, #2, pp. 174–178.
10. Grigoriev A. A., Gordyukhina S.V. Determina-tion of specific colour co-ordinates of physiological sys-tem // Semiconductor lighting engineering, 2011, #1, pp. 44–47.
11. Shestov N.S. Segregation of optical signals against random noise background. Moscow: Sovetskoye radio, 1967, 348 p.
12. Korn G., Korn T. Handbook on mathematics (for scien-tists and engineers). Moscow: Nauka, 1978, 832 p.
13. Meshkov V.V. Fundamentals of Lighting engineering: Manual for high education institutions: part.1, the 2nd revised edition, Moscow: Energiya, 1979, 368 p.
George V. Boos,Ph.D. Graduated from the Light and Engineering Chair of the Moscow Power Institute (1986).President of BL GROUP holding. The Head of the Chair “Light and
Engineering” of the Moscow Power Institute National Research University, Editorial Board Chairman of Light & Engineering Journal
20
Light & Engineering SvetotekhnikaVol. 26, No. 2, pp. 20–28, 2018 No. 1, 2018, pp. 28–34
A HYBRID ILLUMINATION COMPLEX FOR COMBINED ILLUMINATION SYSTEMS: CONCEPTS, STATE OF THE PROBLEM,
PRACTICAL EXPERIENCE
Alexander T. Ovcharov 1, 2, Yuri N. Selyanin 3, and Yaroslav V. Antsupov 1, 2
1 The Tomsky State Architectural and Construction University (TSACU), Tomsk 2 Svetovye sistemy (Ligh systems) LLC, Tomsk
3 Solar LLC, Krasnodar Email: [email protected]
ABSTRACT
Hybrid illumination complexes for systems of combined illumination are considered, including the concept of their development as a structural element of high energy efficiency and high quality light en-vironment. The first practical application experience is described, of the project installed in a building of the MEGA Adygea Family Shopping Centre.
Keywords: combined illumination system, auto-matic control system, hybrid illumination complex, natural light, artificial light, hollow tubular light guide, artificial light LED unit
INTRODUCTION
In 2015–2016, a pilot project of the com-bined illumination system (CIS) based on the hy-brid illumination complex (HIC) was installed in the MEGA Adygea Family Shopping Centre 1 (FSC) building. The entrance complex of the FSC “ASHAN” store served as the object of the illumi-nation system reconstruction. Commissioning an il-lumination system reconstruction using innovative illumination technology naturally raises caution ex-acerbated by the relatively high capital costs of CIS construction. Without doubt, convincing and objec-tive information about the prospects of CIS on the
1 MEGA Adygea FSC address: Republic Adygeya, Takhtamukaysky district, Novayaew Adygea aul
basis of HIC, their technical advantages and favour-able economic indicators, in particular, their attrac-tive payback period for innovative lighting systems, should play a decisive role in dispelling doubts and influencing the right decision.
HIC Concept for CISs
A significant increase in the economic, environ-mental and social efficiency of lighting, together with increased safety and comfort, can be achieved through the use of new and improved innovative technologies. HICs are especially attractive because they realise the potential of costless natural light. Engineering and technological approaches to real-ising natural light potential include advanced facili-ties of light transmission using hollow tubular light guides (HTLG)[1, 2]. Their use in buildings be-comes a source of creative inspiration for architects and designers. Using a combination of natural light resources with energy efficient artificial light pow-ered by automatic control systems (ACS), together forms CISs. Their distinctive criterion is stability of light environment characteristics due to compensa-tion of the natural component changing in time by a correspondent correction using the artificial com-ponent (electric illumination). CISs based on HIC offer a holistic solution for modern architectural ap-proaches to high energy efficiency illumination sys-tems. The advantages of HICs in comparison with traditional solutions offer the challenge of their ap-

Light & Engineering Vol. 26, No. 2
21
plication: a compactness of architectural and design structural solutions; a comfortable light environ-ment; high energy efficiency; a dynamic control pa-rameter of a room’s light environment.
The flexibility and high energy efficiency of CISs have inspired very original engineering solu-tions [3–7]. A natural result of the evolution of a computercontrolled CIS is that the three inter-connected components: an HTLG (natural light), an LED light source (artificial light) and an ACS [8–11], determine the characteristics of the system only when acting in unison. Such a system is corre-spondent to the HIC term and according to GOST [12], the following definition is applicable: HIC is a device intended for a combined illumination unit-ing two light source types (natural and artificial) in-tegrated into one whole structure together with an automatic control system and with general techno-logical documentation ensuring a combined illumi-nation and performing its functions to the consumer in the assembled condition.
HICs combine a hollow tubular light guide (HTLG) and an artificial light unit (ALU) with radiators which are “built-in LED modules with a built-in control device” [13]. Photometric tech-niques, metrological concepts and lighting cha-racteristics of illumination devices are applicable to HICs in accordance with GOST [13].
The relevance of CISs based on HIC increas-es with new trends of architecture and of buil-dings with limited natural illumination (sporting, shopping, civil, industrial, agricultural buildings and underground spaces associated with new ur-ban policies). Large new build projects usually fail to provide for effective natural illumination solu-tions when meeting microclimate requirements. Standard solutions for light openings (vertical win-dows, skylights, transparent roof) fulfil standard re-quirements for illumination but do not solve the problem of optimising the room’s energy balance. A suitable alternative to a standard light opening is a HIC based on HTLG, which has the advantages of lighting- and heat-engineering characteristics [14–16]. Development and introduction of CISs based on HICs is an important step in the evolution of highquality and energyeffecient illumination tech-nology. Each HIC component is simultaneously au-tonomous, and interdependent, and its energy sav-ing capabilities provide critical efficiencies to the complex:
• Natural illumination based on HTLGs – (50–75) %;
• Artificial illumination of a high energy effi-ciency based on LED light sources – (20–70) %;
• Automatic control system – (30–70) %.
A Review of CISs and Development of the Concept
In its primitive version, CISs are present at any room with an outside outlet, because they contain at least two components: a system of natural illumi-nation (vertical or top light openings) and illumina-tion devices (ID) of artificial light. These CISs op-erate along natural light cycles, and their efficiency depends completely on the parameters and quality of the light openings, on efficiency and rationality of the ID. For such systems, low efficiency IDs and their irrational use due to a lack or randomness of control are typical.
As an example of a first attempt to implement a computercontrolled CIS, a combination of roof lights and luminaires with fluorescent lamps can be considered [3]. With an obvious imperfection, such illumination systems nevertheless produce an ener-gy saving effect and confirm the benefits of the CIS concept.
A large-scale project of a heliostat-and-light guide illumination system of a school recrea-tion halls in SaintGallen, Switzerland (the Helio-bus system) demonstrated the huge potential of a computercontrolled CIS through the quality of the created light environment and its energy sav-ings [1, 5, 6].
The development of HTLGs with their unique characteristics was a new stage in CIS evolu-tion. Several engineering solutions of HICs based on HTLGs are known: LED + Solarspot [10], Mon-odraught [11, 14] and Solatube М74 Smart LED [9]. Every solution has its merits and drawbacks but all of them confirm the potential of the integrated il-lumination system concept, the important advan-tages of which are an almost complete lack of heat loss and heat input. The latter is an important ad-vantage in comparison with standard light opening solutions.
Application of such HICs as LED + Solarspot [10, 17] for office room illumination tangibly re-duces power consumption with an almost complete reduction of heat loss and of heat inputs. A fea-ture of the LED + Solarspot HIC structure is that

Light & Engineering Vol. 26, No. 2
22
its ALU consists of light emitting diodes placed on the external circular contour of the HTLG diffu-ser (Fig. 1). Disadvantages of the LED + Solarspot luminaire are their blinding and perhaps phototoxic effects in office rooms with low ceilings because of a high dimensional luminance of the LEDs, as well as maintenance challenges when installed at height. (Specifications of the five LED + Solarspot HIC model types are given in [10].)
The Monodraught HICs are similar to the LED + Solarspot in their structure of light-emitting diode ALU but the blinding effect is eliminated by the LuxLoop LED panels (Fig. 2). However, the Mon-odraught HIC range [11] is limited by the light guide’s diameter (530 mm), by ALU power (30 W) and by luminous flux, which is less than 4000 lm. These limitations restrict the application field of these HICs in rooms with high ceilings.
The above described LED + Solarspot and Mon-odraught HICs have a peculiar design, which is not favoured by all users, and the luminous body geometry changes depending on the time of day. In the day-time it looks like a central disc of the HTLG diffuser, and in the night-time it is a LED ring around the dark diffuser (Fig. 2). During tran-sition periods, luminous parts are the diffuser cen-tral disc and the ALU ring surrounding it, which change luminance dynamically. A common disad-vantage of these HICs is that the combined illumi-nation is created visually by an observable radia-tion of two separate light sources: HTLG and ALU, the spectral characteristics and luminance of which are different. Furthermore, a transition from natu-ral light to artificial and vice versa is followed by significant changes of HIC light distribution creat-ing a continuously changing light environment and indoor discomfort. It was likely these limitations which led to the restriction on the use of CIS speci-fied by standard documents: СП 251.1325800.2016 and СП 52.13330.2016.
The Solatube M74 Smart LED HIC [9] based on the Solatube® HTLG is an optimal structure in terms of lighting characteristics, size, and of de-sign. Blinding and phototoxic effects of the HICs were completely eliminated by a decreases dimen-sional luminance of the LEDs using diffusers. De-pending on room parameters, different diameter So-latube® HTLGs and ALUs of different power can be installed. A powerful HIC model based on the Sola-tube® M74 HTLG – the SkyVault [2] series (tube di-ameter is 740 mm), deserves special attention as the new generation roof light, providing some advanced solutions beyond those of its competitors. Natural light is very important in buildings with large areas and high ceilings – this supports the application of high efficiency and power CISs.
Advanced features of the Solatube® M74 HTLG structure and respectively of the Solatube M74 Smart LED HIC are its collector and collimator
Fig. 1. LED + Solarspot hybrid illumination complex (light guide diameter is 375 mm). Installed in 2010 by Solarspot
International S.r.l Company
Fig. 2. Monodraught HIC. Operating modes under day and night time conditions are shown (the left half of the picture is daytime: natural light penetrates through the diffuser)
and night-time, when the LED panel radiates (the right half of the picture: HTLG diffuser as a dark disc)
Fig. 3. Input HIC node on the FSC roof:1 –collector; 2 – LightTracker™ reflecting plate; 3 – border
flashing; 4 – cable of anti-wind loading; 5 – border
Light & Engineering Vol. 26, No. 2
23
[9]. The collector (Fig. 3 and 4) considerably ex-pands the captured area increasing the efficiency of light collection. It is a cylinder made out of transpa-rent material. In the collector, on the inner surface of the semi-cylinder, the LightTracker™ plate with the Spectralight® Infinity highreflecting coating is placed. In comparison with systems without col-lectors, the collector optical cylinder increase triple light collection, because of the large area of the re-flecting plate equal to 1/2 area of inner side surface of the cylinder and its large volume.
The cone-shaped collimator of the Solatube® M74 HTLG [2, 9] is convenient for placing an ALU, which in the Solatube M74 Smart LED HIC struc-ture consists of four radiating elements built into the collimator plates (Fig. 4 and 5).
In HICs of any structure, the basic element is the HTLG, which is a finished industrial product brought to perfection. Having analysed different models of HIC by leading manufacturers, we se-
lected the Solatube M74 Smart LED HIC as an an-alogue for development of domestic Solar-LED HICs, and a project of FSC illumination reconstruc-tion using the Solar-LED was developed.
Initial State and Characteristics of the Lighting System
Before the reconstruction, the project’s 1920 m2 area was mainly illuminated with artificial light IDs of 6.6 kW installed power containing bellshaped luminaires with MHLs of average illuminance ≤ 140 lx (Fig. 6). Natural illumination added ≤ 20 lx and came from four roof lights.
The reconstruction specifications required the following:
– Increase of average illuminance of the com-bined illumination at the entrance area pier level of the Ashan shop FSC up to 300 lx (in day-time main-ly from natural light);
– Maintaining illumination at a constant level during the FSC’s full working hours by means of an ACS;
– Support of good colour rendition (Ra > 80);
Fig. 5. A layout of placing four radiating elements (LED modules) of Solatube Smart LED HICs on the inner surface
of the collimator and special transparent caps lenses 1 directing light to the diffuser plane. On the collimator ex-
ternal surface 2, power supply and control units, as well as cooling radiators of the specified elements are installed
Fig. 4. General view of Solatube Smart LED HIC based on HTLG Solatube® M74: 1 – collector; 2 – LightTracker™
reflecting plate; 3 – collector dome; 4 – light guide dome; 5 –light guide tube; 6 – collimator; 7 – LED module,
built in collimator.Complex parameters: collector height is 1067 mm; tube
diameter is 740 mm; diffuser diameter is 949 mm; collima-tor height is 600 mm; tube potential length is up to 30 m; installation height is from 6 to 20 m; luminous flux of the natural light is 18–35 klm; luminous flux of the artificial
light unit is up to 9700 lm
Fig. 6. The illumination system before reconstruction – permanent artificial light IDs. Light sources are HP MHLs

Light & Engineering Vol. 26, No. 2
24
– Increased energy efficiency compared with the baseline MHL IDs, up to 60 %;
– Increased reliability and durability.
Design Solution
The solution solved the problem of illumina-tion fo the object using eighteen Solar-LED HICs (Fig. 7). Structurally the HIC unites the Solatube M74 hollow tubular light guide, a LED unit of the preset power artificial light, an ACS (includ-ing a light sensor, a controller, a controlled power supply unit of the LED modules) and a fixture for HIC assembling and for fastening functional units around the collimator (Fig. 8). The installed CIS de-sign parameters are given in Table 1.
HIC Efficiency Factor
A parameter was introduced which allows es-timating the economic efficiency of an illumina-tion system, in order to evaluate the costs and effi-ciencies of the CIS at the design stage and inform a reasoned decision. This parameter is especially important, as the published works [1–8] dedicat-ed to HICs do not discuss parameters needed to es-timate CIS economic efficiency. This is a normal situation arising as a rule: when describing inno-vation products or technologies, one should move away from standard terms and definitions. This is connected with the fact that luminous efficacy be-ing a standard evaluation factor of energy efficiency of an illumination device do not describe in full all innovation properties of the product. The CISs and their components HICs are such new products in the light engineering field.
Hence, to evaluate energy efficiency, it is pro-posed to adapt for inner illumination the relative specific power factor of utilitarian external illumi-nation device according to СП 52.13330.2016. The formula for calculation of CIS average annual re-lative specific power based on HIC, taking into ac-count a specific character of the component opera-tion, can be expressed as:
/ ( ),p r d niD P K E A= ⋅ ⋅
where Dp is the average annual relative specific power of an illumination system, W/(m2 · lx); Pr is rated power of an illumination system, W; Kd is ave-rage annual coefficient of ALU lightemitting diode power demand; Eni is normalised illuminance on the working surface (it has a constant value maintained
Fig. 7. A hall view after illumination system reconstruction using Solar-LED HICs
Fig. 8. Solar-LED HIC in the FSC:1 –Solatube®M74 tube; 2 – collimator; 3 – diffuser lumi-nant disc; 4 –illuminanse sensor; 5 – LED module power
supply unit; 6 – assembly ring; 7 – suspension cable; 8 – reinforcement and joint ribs of the collimator with the
assembly ring; 9 – power supply and control cables

Light & Engineering Vol. 26, No. 2
25
Table 1. Design Factors of the CIS Object
Factor name Factor value
Calculation rated capacity (installed power) #, Pinst, kW max. 9.45
Applicability for emergency illumination 4.9
Repairability of HIS **** 0.30–0.45
Electric power of ALU HIC, PHICmax, W max. 500
HIC Power factor (сosφ) 0.95
Electric power supply circuit 220/380 V, 50 Hz
Controllability of HIC (interval of luminous flux change),% (0–10) – 100 compatible with ACS
Energy saving effect **,% ≥ 60
Luminous flux of the complex
HTLG (natural), lm max. 35000
LED ALU (artificial), lm max. 49000
HTLG + ALU + ACS*** (combined), lm ≥35000
Average illuminan-ce of the object
HTLG (natural), lx ≥300
LED ALU (artificial), lx ≥300
HTLG + ALU + ACS*** (combined), lx ≥300
Quality of colour rendition in ALU mode, Ra / Тс > 80 / 3500–4000 K
Lifetime, years/hoursHTLG 30
LED ALU 10 / 50000
Warranty operation period, yearsHTLG 10
LED ALU 5
ALU protection degree from external environment exposure, IP 42
Operation temperature interval, °C - 20 – + 40
Applicability for emergency illumination Yes
HIC repairability **** High
Control mode Automatic
Notes:*Due to natural light, the power demand coefficient in the illumination system is equal to 0.30–0.45. Therefore,
power consumption decreases more than twice in comparison with the baseline;**comparison with IDs with MHL luminaires; ***during the periods of natural illuminance decrease lower than 300 lx;**** The HIS has unit (block) structure; #according to Table 2.

Light & Engineering Vol. 26, No. 2
26
by ACS at a preset level), lx; А is area of the illumi-nated surface, m2.
Kd value is determined as
0
(1 / ) ( ) ,t
d dK T k dτ τ= ∫
where kd is light-emitting diode ALU power de-mand coefficient changing in time dependent on the object natural illumination level and set by ACS from 0 to 1; t is use duration of the CIS artificial component during a time cycle, h; T is CIS use du-ration during a time cycle, h.
The Dp calculation technique assumes determin-ing the annual resource of natural light within the lo-cation according to meteorological observation data, its change over time, as well as an operation sche dule for the HIC artificial component. Calculation para-meters of average annual relative specific power for the described object (MEGA Adygeya FSC) for va-rious illumination systems are given in Table 2.
Implementation of the CIS Project Based on Hybrid Illumination Complexes
In December 2016, the upgraded CIS with the reached design parameters was commissioned (Fig. 7). The light environment parameters of the in-stallation (as of April 2017) are as follows: average horizontal illuminance Eav = 493 lx and illuminance uniformity coefficient Emin/Eav ≥ 0.4 during the daytime, natural Eav in fine weather were ≥ 400 lx. The ACS monitored natural Eav outside changes depen-ding on the weather and time of day maintaining the design Eav level for the combined illumination in-side the FSC so that it would be more than 300 lx. Input node and appearance of the HIC with mount-
ing elements, general view of the FSC roof (with in-stalled collectors and HIC) respectively, are shown in Figs. 3, 8 and 9.
The CIS ACS is functionally separated into se-ven groups (there are from 2 to 4 HICs in a group) according to the illuminated area zoning principle. Within the groups, a group control is included. ACS of each group consists of the DALI-Sensor02 5DPI 41sr light sensor with remote control, a controller and the HIC ALU controlled power supply units for lightemitting diode modules. ACS adjustment is performed for a HIC group using radio link after the illumination system is mounted.
After the IDs are switched on, the ACS reaches an equilibrium and provides a constant standard il-lumination level of the space.
To provide the rooms with systems of emergen-cy and evacuation illumination, three HICs are in-cluded in their operative circuits. During the light part of a day, CIS HTLGs provide comfortable illu-mination in case of the FSC electric power supply emergency conditions.
Table 2. An Example of Dp Calculation for Various Illumination Installations
ID type Рr, kW Kd Еni, lx А, m2 T, h t, h Dp·103,W/(m2·lx)
CIS based on HIC 9.45 0.3
300 1920 4380
1230 4.9
IDs with LED luminaires 12.6
1 4380
21.8
IDs with MHL luminaires 16.5 28.6
IDs with IL luminaires 137.5 238.7
Fig. 9. General view of the FSC roof

Light & Engineering Vol. 26, No. 2
27
Energy savings are achieved due to a greater lu-minous efficacy of the light emitting diode ALU than of luminaires with MHLs and because of a de-crease of ID power demand coefficient (Table 2) owing to an effective use of natural light.
A comparative analysis 2 of the CISs based on HICs and of light opening standard solutions of upper natural illumination for the implemented pro-ject in the MEGA Adygea FSC has revealed higher light and heatengineering characteristics of HICs and their indisputable advantage both during warm year period (small solar radiation heat input), and in cold period (low thermal losses).
In the process of implementing a pilot project of the combined illumination system based on the HICs, the experience of designing and installing a hybrid illumination systems was obtained, which has allowed developing a new HIC series 3 free from the disadvantages of the first. The most tangible disadvantage of the implemented CIS is a bright glow of the collectors because of a high level of the reflected light. According to the calculations it is about 22 %. This is an indicator of the ALU optical path imperfection. Another disadvantage of this CIS is the challenge of installing and servicing the HIC, as the ALU and ACS diffusers are mounted high.
CONCLUSION
The conceptual solution of CISs based on HIC structural construction proposed in this article has many advantages compared with traditional sys-tems of general artificial illumination and with the standard openings for natural light. High quality and efficiency parameters and the holistic solution are prerequisites for a widespread introduction of HICs into illumination systems, where the main determin-ing factors are light comfort and energy savings. Based on an analysis of HIC models by leading manufacturers, as comparator for domestic HICs, the Solatube M74 Smart LED HIC was selected. Based on its designed structure, a domestic So-lar-LED HIC was created, and illumination project was developed to illuminate MEGA Adygeya FSC rooms. The project implementation phase has con-firmed the main design parameters of the illumi-
2 A separate article of the authors, which will be published in one of the next issues of the journal, is dedicated to the full engi-neeringandeconomic feasibility of HIC application as an alternative to standard traditional light openings.
3 The authors prepare for publication in the journal an article about new upgrades of HIC high efficiency, of their classification and mounting and operation universality.
nation system and revealed some disadvantages, which allowed formulating principles of designing new and improved HICs.
The authors of the CIS project for the Me-ga-Adygea FSC are grateful to the international IKEA Corporation for an opportunity to imple-ment the project, as well as to Yu.B. Aizenberg and A.A. Korobko for constructive discussion of the article.
REFERENCES
1. Aizenberg J.B. Hollow Light Guides. – Moscow: Znack Publishing House, 2009. 208 p.
2. Ovcharov A. T., Selyanin Yu.N. Solatube® Tech-nology: Prospect in architecture and building in Rus-sia // Light & Engineering, 2016, V.24, #2, pp. 4–11.
3. Brones D. A., Lesley R.P. Upper light integrat-ed lamps: a combination of natural and artificial illu-mination for energy saving // Svetotekhnika, 2002, #6, pp. 33–37.
4. Mingozzi A., Bottiglioni S., Kasalone R. The Arthelio combined illumination installation with hollow light guides // Svetotekhnika, 2002, #1, pp. 18–22.
5. Ayzenberg Yu.B., Buob E., Zigner R., Korob-ko A.A., Pyatigorsky V.M. A heliostat-LED illumina-tion system for school recreation halls // Svetotekhnika, 1996, #8, pp. 8–25.
6. Ayzenberg Yu. B., Buob E., Meissen T. A heliostat-LED illumination system for school recrea-tion halls // Svetotekhnika, 2002, # 4, pp. 24–25.
7. Ayzenberg Yu.B. Integral systems of room illumi-nation without a sufficient natural light // Svetotekhnika, 2003, #1, pp. 22–28.
8. Ovcharov A.T. Hybrid luminaires of combined il-lumination with an automatic control system // Electronic information systems, 2015, #4(7), pp. 22–34.
9. Solatube® M74 Smart LED//SOLAR hybrid il-lumination system: magic light. [Company Website]. Cop. 2004–2015. URL: http://www.solatube.su/kata-logmodeleysolatubeisolarstar/zenitnyiefonarino-vogo-pokoleniya-sistemyi-solnechnogo-osveshheniya-so-latubem74skyvault/ (addressing date: 9/15/2017).
10. Solarspot® LED systems – Intelligent Lighting Solutions // SOLARSPOT: Tubular Daylighting Systems. [Company website]. Cop.2017 URL: http://solarspot.it/en/

Light & Engineering Vol. 26, No. 2
28
productscomm/solarspotledsystems (дата обращения: 15.09.2017).
11. Delivering healthy natural light inside// Mon-odraught Ltd. [Company website]. Cop.2017 URL: https://www.monodraught.com/products/natural-lighting (дата обращения: 15.09.2017).
12. GOST P 55392–2012 Illumination devices and systems. Terms and definittions.
13. GOST P 54814–2011/IEC/TS62504:2011 Light emitting diodes and LED modules for general illumina-tion. Terms and definitions.
14. Pain T. Development of hollow light guides in Great Britain // Svetotekhnika, 2004, #3, pp. 39–45.
15. Solovyov A. K. A comparative heat-engineer-ing calculation of upper natural illumination systems (roof lights and hollow tubular light guides) // Engineer-ing-construction journal, 2014, #2, pp. 24–35.
16. Solovyov A.K. Hollow tubular light guides: their application for natural building illumination and for ener-gy saving // Svetotekhnika, 2011, #5, pp. 41–47.
17. Kuznetsov A. L., Oseledets E. Yu., Solovy-ov A.K., Stolyarov M.V. An experience of applica-tion of hollow tubular light guides for natural illumina-tion in Russia // Svetotekhnika, 2011, #6, pp. 4–11.
Alexander T. Ovcharov,Doctor of Technical Science, Professor, graduated from the Tomsky Institute of Radio Electronics and Electronic Engineering in 1966. At present, he is the Professor of the Chair “Architectural design” of the TGASU and Director of Lighting systems LLC, full member of the MANEB, member of editorial Board of Svetotekhnika and Light & Engineering journals
Yuri N. Selyanin, an engineer, graduated from the Taganrog Radio Engineering Institute in 1973, the Military academy of F.E. Dzerzhinsky in 1981 and its graduate military course in 1992. Director General of SOLAR LLC being an official distributor of the Solatube® Daylighting Systems technology on the territory of the Russian Federation, Belarus and Kazakhstan
Yaroslav V. Antsupov, Master Dg. of electrical energy industry and electrical engineering, graduated from the Tomsk Polytechnic University (TPU) in 2017. At present, he is an engineer of Lighting Systems LLC and a 1st year postgraduate student of the TPU NI

29
Light & Engineering SvetotekhnikaVol. 26, No. 2, pp. 29–35, 2018 No. 1, 2018, pp. 23–27
ASSESSMENT OF THE CURRENT STATE AND PROSPECTS FOR DEVELOPMENT OF IRRADIATION SYSTEMS IN MODERN
GREENHOUSE FACILITIES
Vladimir M. Pchelin and Irina E. Makarova
Reflux LLC, Moscow E-mail: [email protected]
ABSTRACT
An analysis of the artificial irradiation system used in modern greenhouses using photoculture is conducted. An assessment of the prospects for the introduction of irradiators with LEDs into this sys-tem is given, taking into account the payback period in comparison with traditional irradiators with spec-ular sodium HP lamps.
Keywords: greenhouse irradiation, photocul-ture, discharge sodium lamps, sodium specular lamps (SSL), light emitting diodes, effective sys-tems of irradiation, irradiating installations, payoff period
Industrial vegetable cultivation in protected soil is a key segment of the agroindustrial complex of the domestic economy; it is currently undergoing a period of rapid development.
According to the Greenhouse Associa-tion of Russia, the total area of industrial green-houses in the country is at 2500 hectares, with more than 500 hectares equipped with systems of tech-nological irradiation, providing year-round vege-tables cultivation, Fig. 1. Intensive construction of new greenhouses is enabled by growing consu-mer demand for fresh vegetables out of season and a state ban on the import of greenhouse vegetables to Russia. The programme of agricultural develop-ment in Russia for the period 2013–2020 includes projects creating and developing of greenhouse fa-cilities with artificial irradiation. These projects are a part of a list of actions with priority financing.
Just in 2017, the size of the photoculture enabled area grew by 150 %.
Amongst the photoculture enabled greenhouse cultivation, cucumbers represent 60 % of all cul-tivation, tomatoes account for 30 %, and 10 % is covered by leaf vegetables, i.e. salad cultures. Cu-cumbers are most sensitive to change in the level of irradiation. Upgrading greenhouses with irradi-ation systems increases cucumber yield from (40–50) kg/m2 to (120–150) kg/m2. The main increase comes in the winter period, when prices for fresh vegetables are at their highest.
Greenhouse irradiation is one of the most ener-gy-intensive uses of light. To provide for the normal growth of plants and achieve a high yield capacity, a high illuminance level is required: from 10 to 30 klx. Largescale greenhouse facilities are compara-
Fig. 1. Winter greenhouse using artificial irradiation sys-tems (Maysky greenhouse facility, Kazan)

Light & Engineering Vol. 26, No. 2
30
ble with small cities or settlements by their energy consumption,. Their light can be seen at a distance of many kilometres. It is obvious that with such power consumption, the cost of electricity is a con-siderable part of the product cost, reaching as much as (30–40)%. Consequently, raising the efficiency of the radiation sources (RS) and irradiator optical equipment becomes a critical challenge for lighting manufacturers for the greenhouse industry.
More than 20 years ago, a Russian greenhouse facility (GF) called Maysky in Kazan pioneered ex-periments with various systems of preliminary ir-radiation for plant cultivation. The managers were interested in specular Reflux HP sodium lamps (HPSLs), which had just appeared on the green-house market. The first batch of lamps showed good results and became the main RSs for plant irradia-tion at this facility. Specular HPSLs of Reflux LLC production are still used at Maysky GF today. More than 120,000 irradiators with Reflux specular sodi-um lamps (SSL) HPSLs of 600 W are installed there today.
After Maysky, other greenhouse facilities also caught on to the economic benefits, and began to in-
troduce artificial irradiation. The development of photoculture evolved an effective process which is based on the use of irradiators with HPSLs of 600 and 1000 W. This process is applied today by an absolute majority of greenhouse facilities in Rus-sia and around the world. Using this technolo-gy, leading domestic greenhouse enterprises like LipetskAgro, Vyborzhets, Novosibirsky, Churilo-vo, Teplichny and Yaroslavskyl harvest cucumber yields of (130–150) kg/m2 every year, and Maysky GF is the greenhouse industry leader, collecting up to 180 kg/m2, Fig. 2.
It should be noted that the use of irradiating in-stallations (II) with HPSLs in the GF not only rais-es the yield capacity, but also ensures higher le-vels of profitability demonstrated by GF economic indicators.
Today about 80 % of Russian GFs use effective irradiation systems based on specular Reflux SSL HPSLs, exclusive to Russia, Fig. 3.
Due to the design features of theReflux SSL HPSL, (its reflector is a specularised part of a spe-
Fig. 3. Irradiator and HP specula sodium lamp Reflux SSL
Fig. 2. Cucumber photoculture
Fig. 4. Optical layout of a SSL Reflux lamp

Light & Engineering Vol. 26, No. 2
31
cial configuration envelope on the inner surface) these lamps of identical rated capacity generate a higher irradiance compared with normal HPSLs. The envelope is designed in such a way that reflec-ted rays do not reflect back onto the torch. This pro-vides a high efficiency (more than 95 %), a stable lu-minous efficacy and a long lifetime of the Reflux SSL HPSLs, Fig. 4.
Specular HPSLs have a wide luminous intensi-ty distribution curve (LIDC) in the transverse plane, Fig. 4, which makes the irradiation uniform and ex-tensive. This type of irradiation facilitates a strong plant growth and development. This is especial-ly important for tall plants, such as cucumbers and tomatoes, because as the plant grows the effective penetration of vertical radiation abruptly decreas-es as each lower leaf receives five times less radi-ation than the upper leaves. Taking into considera-tion the direction of growth and leaf structure, most effective type of irradiation for these plants com-bines vertically directed upper radiation and late-ral penetrating into the growing plant uniformly and deeply. Specular HPSLs with a wide luminous in-tensity curve in the transverse plane, installed above the spaces between each row, create rays, which fall not only from the top but also laterally onto the external surface of a leaf at an angle close to 90º, whilst not overheating the plants. In this case, ex-tra lamps in the spaces between the rows are not needed, Fig. 5.
The inner surface of the lamp is itself a reflec-tor in a vacuum and loses none of its properties, avoiding oxidation and dust pollution, which can decrease the luminous flux. The deposition mate-rial for the Reflux/Ag 600W/400V lamps is made
of fine silver with the highest reflection factor of 99.9.
Additional benefits of Reflux HPSLs arise from the use of electron ballasts with at least 96 % efficiency.
Greenhouse installations use highly efficient ir-radiators enabling high yield and profitability. Ir-radiators in use today have electron ballasts and (mainly specular) HPSLs with passive optical sys-tems. They have a luminous efficacy of up to 150 lm/W, radiation efficiency factor (ФPPF/РW) equal to 2 µmol/s·W and a lifetime of over 20,000 h.
However, technologies continue to change and evolve, and today there is an active search for new
Fig. 5. Reflux SSL lamps in a greenhouse
Fig. 6. Stages of light emitting diodes introduction by directions

Light & Engineering Vol. 26, No. 2
32
effective radiation sources (RSs) on the greenhouse irradiation market. LED RSs are competitors in this race for improved methods.
The introduction of LED light sources is an itera-tive process, which involves promoting them on the market, whilst simultaneously improving their per-formance and driving down their cost. Logically, those market segments where LEDs can bring the greatest economies are first to respond to these new technologies.
According to the theory of product service life, market capture occurs in six steps: introduc-tion to the market, implantation, growth, maturity, saturation and decay, Fig. 6.
Fig. 6 shows that the development of LED RS in the three applications mentioned above is at dif-ferent stages; this largely depends on the competi-tiveness of traditional RSs forced out by LED RSs. The replacement process is most successful where energy inefficient RSs are replaced: incandescent lamps in household illumination or mercury arc lamps (MAL) in street illumination. However, in the greenhouse irradiation space, where massive radia-tion is required, LED RSs have a very strong com-petitor in HPSLs, which lose slightly to LED RSs by their performance features, but are significant-ly cheaper.
Currently, in the sphere of greenhouse irradia-tion LED RSs are at the initial stage of market in-troduction, which implies many experimental appli-cation projects, with a high uncertainty of success. At this stage, it is difficult to determine the like-ly economic benefit. The products are expensive due to their continuing modernisation and a limited scale of production. There is also a need to drama-tically improve and adapt their output characteris-tics to the requirements of the market. These are the processes taking place today in the sphere of green-house irradiation.
LED manufacturers propose different types of LED irradiators, promising considerable electric energy savings, increased harvest yields, or both.
Many greenhouse facilities have taken an interest in irradiation using these RSs, and experiment with their installation, so far with mixed results, Fig. 7.
Considering the tangible interest in this techno-logy expressed in the greenhouse industry, the fol-lowing section attempts to compare payback peri-ods for artificial irradiation with traditional HPSLs and LEDs, and estimates the prospect LED RS introduction.
As there are no objective economic results of the commercial use of LED irradiators available, only approximate evaluations based on generalised ex-pert estimates are possible.
We will consider a hypothetical case, when managers of a modern greenhouse facility decide to introduce an artificial plant irradiation system to increase the profitability of growing cucumbers during winter and spring periods.
Photoculture technology increases yield during winter periods by an average of 60 kg per 1m2 of greenhouse area per year. With a price of 80 rou-bles for 1 kg, the assumed additional income for the greenhouse can be around 4800 roubles per 1m2.
As a rule, achieving this level of yield increase needs about 200 W/m2 of irradiance or photosynthe-sis photon flux density (PPFI) of about 300 µmol /m2·s. This can be generated by irradiator type ЖСП 25 with electron ballast and complete with a lamp type Reflux/Ag 600W/400V. The cost of equipment per 1m2 in this case is 2500 roubles, as one SSL RS irradiates 3m2 area and costs 7500 roubles.
For the comparison we will take an irradiator set of the GreenPower LED series by Philips used for upper irradiation and for inter-row reirradiation. Ac-cording to the manufacturer, the GreenPower LED irradiators surpass HPSL irradiators by 25 % in re-spect of photosynthesis photon flux (PPF). These ir-radiator sets would cost greenhouses about 25,000 roubles per 1m2, based on average market prices.
If the cost of electricity for these facilities, taking into account depreciation and operational costs, is 2.5 rub/kW·h and the operating time is 4000 h per
Fig. 7. LED irradiators for plant cultivation

Light & Engineering Vol. 26, No. 2
33
year, then the annual specific cost of electricity is as follows:
• For an irradiator with Reflux/Ag 600/400 SSL:200 W/m2 · 2.5 rub/kW·h · 4000 h = 2000
rub/m2;• For an irradiator with Philips GreenPower
LED:2000 rub/m2 · 0.75 = 1500 rub/m2.Assuming that about 30 % of the additional in-
come generated as a result of the introduction of photoculture covers the expenses for product cost, not related to irradiation, 70 % is the available to pay back on capital expenditure and electrici-ty costs. This is equal to 3360 rub/m2 per year, and represents a compensation income (Icomp).
Irradiation expenditure consist of capital ex-penditure for the purchasing of equipment and of electricity costs. In this calculation, SSL replace-ment and the decrease of radiation flux of LED ir-radiators, as well as assembly cost and expenda-ble material cost for light point installation are not
accounted for as they are approximately identical in both cases.
The pay back period of the project finishes when capital and operational costs for the adoption of ar-tificial irradiation in a greenhouse are covered by an additional (compensation) income Icomp accumula-ted for a certain period:
C + E · Тpay-off = Icomp · Tpay-off,
where C is equipment capital expenditure; E is an-nual electricity costs; Tpay-off is payoff period, years.
It follows here from:
Tpay-off = C/(Icomp – E), (1)
and incorporting C, Icomp and E values from the above, the results are:
• For Reflux/Ag 600/400 SSL irradiators;Tpay-off = 2500 rub / (3,360 rub/year – 2000 rub/
year) = 1.8 years;
Fig. 9. An evaluation of relative dynamics of LED irradiating installation indicator change in greenhouse irradiation
Fig. 8. An evaluation of irradiating installation payoff period in greenhouse irradiation

Light & Engineering Vol. 26, No. 2
34
• For Philips GreenPower LED irradiatorsTpay-off = 25,000 rub/(3360 rub/year – 1500 rub/
year) = 13.4 years.Clearly, such a drastic difference in Tpay-off,
Fig. 8, restricts the transition to LED irradiators for greenhouse facilities.
Nevertheless, LEDs for greenhouse irradia-tion are being developed, and in the years to come a considerable decrease in their cost can be expec-ted, together with further gains in their efficiency, further reducing the annual electricity consump-tion and number of LED irradiators.
Taking Fig. 9 as the base assumption for cost re-duction and efficiency gains, LED irradiator pri-ces will fall by 1.5 times in three years, and their energy efficiency will increase by 1.3 times: based on preliminary estimates, this will allow saving up to 30 % on electricity costs (in this case it will cost about 1000 roubles per 1m2).
Taking into account the projected improvement in LED characteristics, a new capital expenditure le-vel can be estimated using the following formula:
Cnew = Cbase /(1.5·1.3),
where Cnew is capital expenditure in the context of improved LED parameters (in three years); Cbase is capital expenditure today.
According to this expression, and to the valu-es given above, Cnew = 25,000 rub / (1.5 · 1.3) = 12,820 rub.
Therefore, the capital expenditure for LED ir-radiation will decrease almost twice in three years, Fig. 10.
Using these data, a new payback period Tpay-off-n can be estimated taking into account the improved
LED parameters with a formula similar to formu-la (1):
Tpay-off-n = Cnew / (Icomp – Enew),
where Enew is electric energy cost a year taking into account improved LED parameters (in three years):
Tpay-off-n = 12,800 rub / (3,360 rub/year1000 rub/year) = 5.4 years.
It can be seen from Fig. 10 that LED irradia-tion equipment installed in three years’ time will pay off twice as quickly, as and much earlier than any equipment bought and installed today.
Anyone in a big hurry to install now will lose out in the long term due to large investments and a long pay back period; they will miss out on the gains which will become available three or five years lat-er. By waiting, it will be possible not only to pay off the LED irradiation source (IS) but also to generate profit once the LED IS pay back is reduced.
At present, the large-scale introduction of LED irradiators into greenhouse facilities implies un-reasonable economic risks. But to become a pio-neer in this industry requires the gradual introduc-tion of these irradiators experimentally. In this case, the LED equipment manufacturer should take on all of the financial risk and compensate any incurred costs. If as a result an increased yield capacity is obtained and the economic benefit is obvious, then in due course the uptake of LED irradiators will increase.
In the case of a positive outcome, LED manu-facturers will be interested in expanding their mar-ket outlet as much as possible. The greenhouse facilities participating in the experimental installa-
Fig. 10. An evaluation of irradiating installation payback periods in greenhouse irradiation, accounting for LED parameter change

Light & Engineering Vol. 26, No. 2
35
tion will gain a small increase in yield with great risks and labour expenditures, whilst their compet-itors will benefit from maintaining approved tech-nology without additional costs and efforts. Du ring this experimental phase, new LED irradiator mo-dels will appear, which will be twice as efficient and significantly cheaper. The competitors will in-stall these models having avoided costs previously, and will reap the benefits over those who were first to market in their increased yields and energy effi-ciency, Fig. 10.
Financing such volatile market experiments can only be undertaken by largescale LED equipment manufacturers, or by state investors ready to pro-mote these products and to invest long term into the introduction of LEDs into greenhouse irradiation.
CONCLUSION
• The process of introducing light emitting di-odes into greenhouse irradiation is significantly restricted by proven technologies, like HPSL ir-radiators with highly effective Reflux/Ag SSLs, the technological parameters of which are similar to LED irradiators, but their cost is ten times lower.
A comparative evaluation of pay back periods gives evidence against LED ISs.
• With the present LED irradiator prices and performance characteristics, HPSL irradiator re-placement with LED ISs is premature. Addition-al inter-row irradiation (reirradiation) options with upper radiation remaining as HPSL, for example for tomatoes, can be an option. However, this rais-es the capital expenditure without guaranteeing an tangible increase in harvest. LEDs can also be used to grow herbs, salads and other plants with a short vegetation period, as well as different types of seed-lings using rack cultivation.
• LED irradiators have strong prospects in terms of their future efficiency and lifetime. But in order to become competitive in the greenhouse market, their profitability through reduced electricity costs must increase further, and their price must fall. Their technologies must be developed and approved. In-tensive work is currently under way to achieve this, which allows predicting that significant gains will be made in the next three or five years. Until then, the commercial introduction of LEDs into green-house irradiation is a gamble, when business profits are at stake, and probability of success is not more than 10 %.
Vladimir M. Pchelin, Ph.D., graduated from the Moscow Power Institute with a specialisation in “Lighting engineering and light sources”. Since 1985 he represents Russia in CIE Division 4. In 1986 he developed HPSLs with a specular reflector (Reflux SSL). At present, he is the General Director of Reflux LLC Company
Irina E. Makarova, a marketing expert and philology teacher, graduated from the Russian Institute of Marketing (based on SMU and the Holland University of Applied Sciences, the Netherlands), as well as philological department of the MSOTU of M.A. Sholokhov, the Head of the Marketing department of Reflux LLC Company
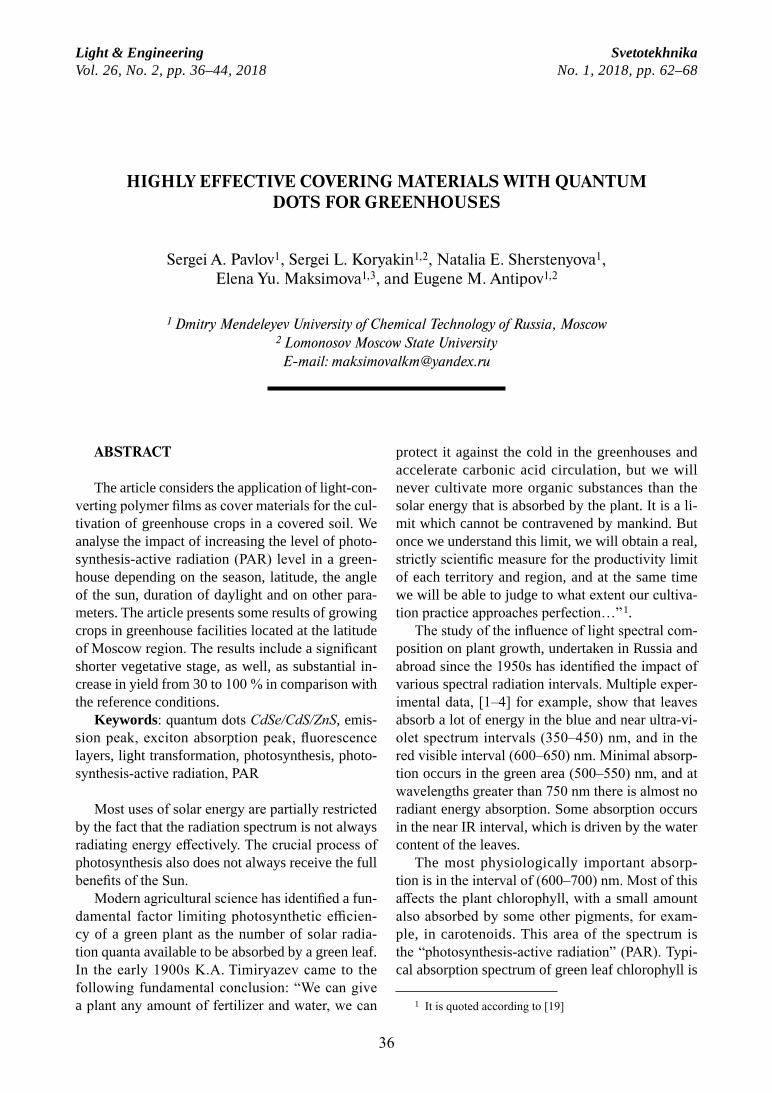
36
Light & Engineering SvetotekhnikaVol. 26, No. 2, pp. 36–44, 2018 No. 1, 2018, pp. 62–68
HIGHLY EFFECTIVE COVERING MATERIALS WITH QUANTUM DOTS FOR GREENHOUSES
Sergei A. Pavlov1, Sergei L. Koryakin1,2, Natalia E. Sherstenyova1, Elena Yu. Maksimova1,3, and Eugene M. Antipov1,2
1 Dmitry Mendeleyev University of Chemical Technology of Russia, Moscow 2 Lomonosov Moscow State University
E-mail: [email protected]
ABSTRACT
The article considers the application of light-con-verting polymer films as cover materials for the cul-tivation of greenhouse crops in a covered soil. We analyse the impact of increasing the level of photo-synthesis-active radiation (PAR) level in a green-house depending on the season, latitude, the angle of the sun, duration of daylight and on other para-meters. The article presents some results of growing crops in greenhouse facilities located at the latitude of Moscow region. The results include a significant shorter vegetative stage, as well, as substantial in-crease in yield from 30 to 100 % in comparison with the reference conditions.
Keywords: quantum dots CdSe/CdS/ZnS, emis-sion peak, exciton absorption peak, fluorescence layers, light transformation, photosynthesis, photo-synthesisactive radiation, PAR
Most uses of solar energy are partially restricted by the fact that the radiation spectrum is not always radiating energy effectively. The crucial process of photosynthesis also does not always receive the full benefits of the Sun.
Modern agricultural science has identified a fun-damental factor limiting photosynthetic efficien-cy of a green plant as the number of solar radia-tion quanta available to be absorbed by a green leaf. In the early 1900s K.A. Timiryazev came to the following fundamental conclusion: “We can give a plant any amount of fertilizer and water, we can
protect it against the cold in the greenhouses and accelerate carbonic acid circulation, but we will never cultivate more organic substances than the solar energy that is absorbed by the plant. It is a li-mit which cannot be contravened by mankind. But once we understand this limit, we will obtain a real, strictly scientific measure for the productivity limit of each territory and region, and at the same time we will be able to judge to what extent our cultiva-tion practice approaches perfection…” 1.
The study of the influence of light spectral com-position on plant growth, undertaken in Russia and abroad since the 1950s has identified the impact of various spectral radiation intervals. Multiple exper-imental data, [1–4] for example, show that leaves absorb a lot of energy in the blue and near ultra-vi-olet spectrum intervals (350–450) nm, and in the red visible interval (600–650) nm. Minimal absorp-tion occurs in the green area (500–550) nm, and at wavelengths greater than 750 nm there is almost no radiant energy absorption. Some absorption occurs in the near IR interval, which is driven by the water content of the leaves.
The most physiologically important absorp-tion is in the interval of (600–700) nm. Most of this affects the plant chlorophyll, with a small amount also absorbed by some other pigments, for exam-ple, in carotenoids. This area of the spectrum is the “photosynthesisactive radiation” (PAR). Typi-cal absorption spectrum of green leaf chlorophyll is
1 It is quoted according to [19]
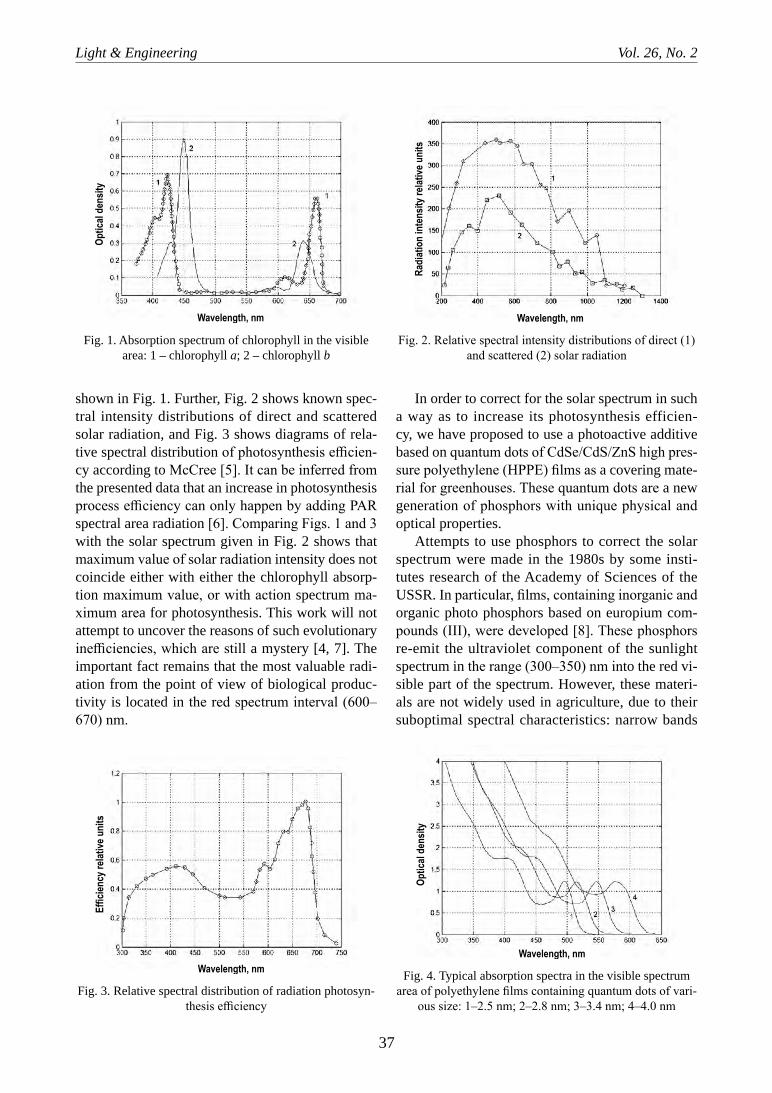
Light & Engineering Vol. 26, No. 2
37
shown in Fig. 1. Further, Fig. 2 shows known spec-tral intensity distributions of direct and scattered solar radiation, and Fig. 3 shows diagrams of rela-tive spectral distribution of photosynthesis efficien-cy according to McCree [5]. It can be inferred from the presented data that an increase in photosynthesis process efficiency can only happen by adding PAR spectral area radiation [6]. Comparing Figs. 1 and 3 with the solar spectrum given in Fig. 2 shows that maximum value of solar radiation intensity does not coincide either with either the chlorophyll absorp-tion maximum value, or with action spectrum ma-ximum area for photosynthesis. This work will not attempt to uncover the reasons of such evolutionary inefficiencies, which are still a mystery [4, 7]. The important fact remains that the most valuable radi-ation from the point of view of biological produc-tivity is located in the red spectrum interval (600–670) nm.
In order to correct for the solar spectrum in such a way as to increase its photosynthesis efficien-cy, we have proposed to use a photoactive additive based on quantum dots of CdSe/CdS/ZnS high pres-sure polyethylene (HPPE) films as a covering mate-rial for greenhouses. These quantum dots are a new generation of phosphors with unique physical and optical properties.
Attempts to use phosphors to correct the solar spectrum were made in the 1980s by some insti-tutes research of the Academy of Sciences of the USSR. In particular, films, containing inorganic and organic photo phosphors based on europium com-pounds (III), were developed [8]. These phosphors re-emit the ultraviolet component of the sunlight spectrum in the range (300–350) nm into the red vi-sible part of the spectrum. However, these materi-als are not widely used in agriculture, due to their suboptimal spectral characteristics: narrow bands
Fig. 1. Absorption spectrum of chlorophyll in the visible area: 1 – chlorophyll a; 2 – chlorophyll b
Fig. 2. Relative spectral intensity distributions of direct (1) and scattered (2) solar radiation
Fig. 3. Relative spectral distribution of radiation photosyn-thesis efficiency
Fig. 4. Typical absorption spectra in the visible spectrum area of polyethylene films containing quantum dots of vari-
ous size: 1–2.5 nm; 2–2.8 nm; 3–3.4 nm; 4–4.0 nm

Light & Engineering Vol. 26, No. 2
38
of absorption and emission, an insufficient value of Stokes shift, a high level of light scattering and low photo stability as well, as a complexity of introduc-ing them into polyethylene matrices.
The creation of a new generation of phosphor based on the CdSe/CdS/ZnS semiconductor colloi-dal materials has uncovered new possibilities in the development of light transformative materials [9]. Phosphors of this type have some unique optical and colloidal properties, which make them especial-ly attractive for agriculture, because they are mate-rials transforming light. In particular, they are char-acterised by a wide absorption spectrum in the blue and near ultraviolet regions, Fig. 4, and fluorescence in the form of a relatively narrow peak in practically any range of the visible spectrum.
The general principles of spectral transfor-mation with phosphors were first formulated by S.I. Vavilov. The transformation efficiency is deter-mined by fluorescence energy efficacy, which can-not be greater than 1. In case of antiStokes excita-tion, i.e. in case νexit < ν , where ν is frequency average value in the emission band, photo fluores-cence and energy efficacy should decrease with an increase in the frequency difference (ν - νexit) (10]. It should be noticed that fluorescence quantum effi-cacy of the considered materials is close to 1, which is much useful for practical application.
Along with quantum efficacy, an important factor determining the spectrum transformation efficiency is fluorescence energy efficacy. So, flux Фph radiat-ed by phosphor as a result of its excitation in some wide spectrum interval can be derived by the fol-lowing expression:
Ƞen = φph(λ)/φexit(λ), (1)
where φph(λ) and φexit(λ) are correspondent spectral radiation fluxes, ηen is fluorescence energy efficacy:
( ) ( ) ( )ph ph exit end dφ λ λ φ λ η λ λΦ = =∫ ∫ . (2)
The ultimate goal of solar spectrum transforma-tion is the increase of radiation flux in the photosyn-thesis active radiation (PAR) region [11]:
700
400
( ) ( )PARE c I dλ λ λ= ∫ , (3)
where с(λ) is the action spectrum for photosyn-thesis, I(λ) is the spectral distribution of solar ra-diation strength. Comparing the quantum yield of photosynthesis, Fig. 3, and the spectra of excita-tion and emission of quantum dots, Fig. 5 clearly indicates the expediency of quantum dots for these purposes.
Under natural illumination conditions, PAR flux depends on a number of factors. First, as shown by the curves in Fig. 2, the spectra of direct and scat-tered natural radiation are substantially different. Direct radiation strikes the Earth’s surface as a col-limated flux. Scattered radiation falls on the Earth after its particles are reflected and dispersed by air, water droplets, by ice crystals and atmospheric im-purities. Total flux includes both types of radiation, and the ratio of those components depends simul-taneously on the state of the atmosphere and on the season, as well on the Sun’s altitude above the hori-zon. For instance, scattered radiation strikes plants before sunrise, but with the increasing height of the Sun, the share of direct radiation increases, and the scattered share decreases.
Fig. 5. Excitation spectra (solid line) and radiation spectra (dashed line) of CdSe/CdS/ZnS quantum dots
Fig. 6. Sun’s declination angle at Moscow latitude (55.7о N)

Light & Engineering Vol. 26, No. 2
39
Secondly, the efficiency of radiation transformed by a phosphor layer depends on the irradiation con-ditions mentioned above, namely, on the ray an-gles incidence, which in their turn depend on the Sun declination, on daylight duration, on the scat-tered component share of flux and on other parame-ters. Studying the generic principles of fluorescence in optical layers in detail, which we have previous-ly published in [13–15], determined some factors to be considered when predicting the light transfor-mation process. As the “astronomic” aspects of so-lar radiation are widely known, we will use them to explain other observed patterns.
Total solar radiation flux (per unit area) falling upon a horizontal plane can be calculated by a for-mula similar to the one given in [11]:
00
cos cos sin,2
sin sin360
ss
s
Wt G
H W
φ δππ φ δ
⋅ ⋅ + = + ⋅
(4)
where G0 is the solar constant (G0 = 1.34 kW/m2); φ is geographic locality latitude; ts is daylight dura-tion, s; δ is the Sun declination angle; Ws is hour an-gle of the Sun at sunset.
Further, declination of the Sun δ can be deter-mined as
[ ]0 sin 360 (284 ) / 365nδ δ= ⋅ + , (5)
where δ0 = 23,5о, n is the number of the day of the year. Duration of daylight in hours can be calculat-ed using the formula:
( )2arccos tan tan
15st φ δ= − . (6)
Sunset time (by average universal solar time) is calculated by the formula:
( )126 arcsin tan tanzt φ δ
π= + . (7)
The results of the calculations according to for-mulas (5–7) are essential for evaluating the light transformation use efficiency. They are given in Figs. 6–8.
As Earth orbit is not circular but elliptic, ellipti-city should be included using the formula [11]:
0
3601 cos
365
nH e H
= + ⋅ , (8)
where e = 0.333 is a constant, which reflects the Earth’s orbit ellipticity.
It is considered that solar radiation reaches Earth surface as a sum of direct and scattered fluxes [11]. As direct and scattered fluxes have various spectral compositions, Fig. 2, this influences the efficiency of the light transformation process. Let’s evaluate a “clarity index” kT, which is a relation of the total daily solar radiation flux incident on the Earth’s sur-face unit area of a horizontal site to the correspond-ent solar radiation flux outside the atmosphere.
1( )( )
( )T
H nk n
H n= , (9)
Fig. 7. Annual dependence of hour angle at sunset at Moscow latitude (55.7o N), days are counted
from January 1
Fig. 8. Results of determining daylight duration, as well as sunrise and sunset time at Moscow latitude of (55.7o N) by average universal solar time: 1 – duration of daylight;
2 – sunrise time; 3 – sunset time

Light & Engineering Vol. 26, No. 2
40
where H1(n) is value of solar radiation flux, which reaches the Earth’s surface.
Further, diffuse radiation share HD can be deter-mined using the formula:
2 3
1
1.39 4.03 5.53 3.11DT T T
Hk k k
H= − + − . (10)
In essence, the process of solar spectrum trans-formation constitutes emission (reradiation) at a certain light wavelength absorbed in a wide spec-tral interval. Examples of absorption spectra for the materials, which we have developed based on HPPE containing quantum dots of various dimensions, are given in Fig. 4. A unique feature of the quantum dot
optics is a wide, almost continuous absorption spec-trum in the blue and near ultra-violet ranges in an interval of wavelength lesser than the excitonic ab-sorption peak. This is non-typical for traditional ce-ramic and organic phosphors, including rare-earths. Another feature of the developed materials is a dependence of spectrum transformation efficiency on the collimated solar radiation angle when pass-ing through the fluorescence layer. This is caused both by a change of the physical properties of light (in particular, its spectral composition), and by the efficiency of the light transformation process itself by the layer with change of incidence angle h. Prob-lems of light transformation efficiency connected with changing light ray angle when passing through the layer have been previously considered [13].
Further, incidence angle of collimated solar radi-ation is determined by a known formula [16]
sin( ) sin( )sin( ) cos( )cos( )cos( )h tφ δ φ δ= + . (11)
The incidence angle of collimated solar ra-diation flux at Moscow latitude at noon is given in Fig. 6. Determination of the collimated and scat-tered fluxes ratio was carried out formerly based on the tripleflux approximation [16]. PAR increase is estimated depending on natural illumination con-ditions. A calculation of full PAR flux (or dose) was carried out using the formula:
ÔÀÐ phQ A S B D= + +Φ∑ ∑ ∑ , (12)
where А = 0.6, В is transition coefficient from daytime sums of direct solar radiation to the day-time sums of direct PAR (Table 1); S∑ is full flux of
Fig. 9. Time change of clarity coefficient (1) and of scat-tered flux share (2), relative units
Fig. 11. Natural irradiance spectrum under HPPE film (50 µ thickness) containing various concentrations of a
photoactive component: 1 – unmodified film, 2 – contains 0.1 mg/g of quantum dots, 3–0.2 mg/g, 3–0.4 mg/g, 5–0.6
mg/g, 6–0.8 mg/g, 7–1.0 mg/g
Fig. 10. Total exposure of solar radiation (1), exposure of scattered radiation (2), and total exposure of the trans-
formed radiation in the PAR interval (3)
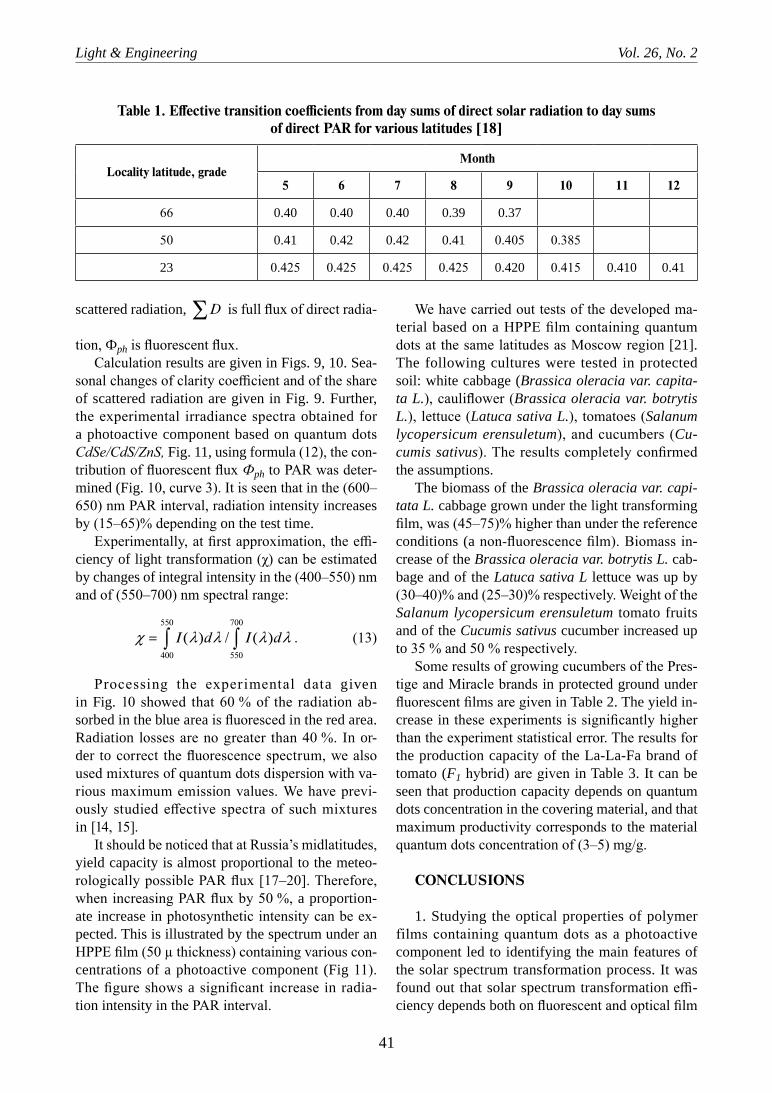
Light & Engineering Vol. 26, No. 2
41
scattered radiation, D∑ is full flux of direct radia-
tion, Фph is fluorescent flux.Calculation results are given in Figs. 9, 10. Sea-
sonal changes of clarity coefficient and of the share of scattered radiation are given in Fig. 9. Further, the experimental irradiance spectra obtained for a photoactive component based on quantum dots CdSe/CdS/ZnS, Fig. 11, using formula (12), the con-tribution of fluorescent flux Фph to PAR was deter-mined (Fig. 10, curve 3). It is seen that in the (600–650) nm PAR interval, radiation intensity increases by (15–65)% depending on the test time.
Experimentally, at first approximation, the effi-ciency of light transformation (χ) can be estimated by changes of integral intensity in the (400–550) nm and of (550–700) nm spectral range:
550 700
400 550
( ) / ( )I d I dχ λ λ λ λ= ∫ ∫ . (13)
Processing the experimental data given in Fig. 10 showed that 60 % of the radiation ab-sorbed in the blue area is fluoresced in the red area. Radiation losses are no greater than 40 %. In or-der to correct the fluorescence spectrum, we also used mixtures of quantum dots dispersion with va-rious maximum emission values. We have previ-ously studied effective spectra of such mixtures in [14, 15].
It should be noticed that at Russia’s midlatitudes, yield capacity is almost proportional to the meteo-rologically possible PAR flux [17–20]. Therefore, when increasing PAR flux by 50 %, a proportion-ate increase in photosynthetic intensity can be ex-pected. This is illustrated by the spectrum under an HPPE film (50 µ thickness) containing various con-centrations of a photoactive component (Fig 11). The figure shows a significant increase in radia-tion intensity in the PAR interval.
We have carried out tests of the developed ma-terial based on a HPPE film containing quantum dots at the same latitudes as Moscow region [21]. The following cultures were tested in protected soil: white cabbage (Brassica oleracia var. capita-ta L.), cauliflower (Brassica oleracia var. botrytis L.), lettuce (Latuca sativa L.), tomatoes (Salanum lycopersicum erensuletum), and cucumbers (Cu-cumis sativus). The results completely confirmed the assumptions.
The biomass of the Brassica oleracia var. capi-tata L. cabbage grown under the light transforming film, was (45–75)% higher than under the reference conditions (a nonfluorescence film). Biomass in-crease of the Brassica oleracia var. botrytis L. cab-bage and of the Latuca sativa L lettuce was up by (30–40)% and (25–30)% respectively. Weight of the Salanum lycopersicum erensuletum tomato fruits and of the Cucumis sativus cucumber increased up to 35 % and 50 % respectively.
Some results of growing cucumbers of the Pres-tige and Miracle brands in protected ground under fluorescent films are given in Table 2. The yield in-crease in these experiments is significantly higher than the experiment statistical error. The results for the production capacity of the La-La-Fa brand of tomato (F1 hybrid) are given in Table 3. It can be seen that production capacity depends on quantum dots concentration in the covering material, and that maximum productivity corresponds to the material quantum dots concentration of (3–5) mg/g.
CONCLUSIONS
1. Studying the optical properties of polymer films containing quantum dots as a photoactive component led to identifying the main features of the solar spectrum transformation process. It was found out that solar spectrum transformation effi-ciency depends both on fluorescent and optical film
Table 1. Effective transition coefficients from day sums of direct solar radiation to day sums of direct PAR for various latitudes [18]
Locality latitude, gradeMonth
5 6 7 8 9 10 11 12
66 0.40 0.40 0.40 0.39 0.37
50 0.41 0.42 0.42 0.41 0.405 0.385
23 0.425 0.425 0.425 0.425 0.420 0.415 0.410 0.41

Light & Engineering Vol. 26, No. 2
42
properties, and on some meteorological and astro-nomic factors. In particular, on latitude, the Sun declination, daylight duration, shares of direct and scattered solar flux.
2. The dependence of fluorescence flux on the Sun declination angle is mainly connected with the factor of radiation reflection from the geometric sur-face of angular dependence of the layer transform-ing light and to a lesser extent, on the scattered flux share in total flux of incident solar radiation.
3. It is found out that the additional impact of fluorescent flux to the natural PAR flux at Rus-sia midland latitudes increases during autumn and winter seasons and decreases during the summer months. Similarly, the efficiency of light transfor-mation increases with latitude. This allows to draw the conclusion that the use of light transforming materials in order to intensify the photosynthesis process is very effective for the midland region of Russia, where there is an obvious PAR, practically during the vegetative stage of crops. Therefore, the use of light transforming materials is expedient both during the basic (summer) harvest period, and dur-ing the autumn and winter periods.
4. The efficiency of light transformation can reach 50 %. There is very little loss (no more than 40 %) of radiant flux from absorption by the film
in the blue and near ultraviolet regions of the spec-trum, and it is of little value for photosynthesis.
5. Preliminary cultivation experiments made with some greenhouse cultures showed a significant increase both of the general biomass, and in the fruit mass caused by the general intensification of photo-synthesis as a result of PAR flux increase.
6. The optimum concentration of quantum dots in the covering material is estimated to be between 3 and 5 mg/g.
ACKNOWLEDGEMENT
The work was performed with financial sup-port from the Ministry of Education and Science of the Russian Federation, Agreement on grant-ing a subsidy #14.574.21.0064 (unique identifier of the applied scientific research (of the project) is RFMEFI57414X0064).
REFERENCES
1. Tikhomirov A.A., Sharupich V.P., Lisovsky G.M. Photoculture of plants: biophysical and biochemical fundamentals. Novosibirsk: The publishing house of the Siberian Branch of the Russian Academy of Sci-ence, 2000, 213 p.
Table 3. Results of Studying Yield of the La – la – fа Brand Tomato (F1 hybrid) Cultivated in Protected Ground Under a Light Transforming Film Containing Quantum Points in Various Concentrations
CoatingConcentration of a photoactive component in the film, mg/g
2.0 3.0 5.0 8.0 10.0
Yield, kg/m2 9.1 11.7 11.5 9.3 7.7
Yield increase,% in comparison with reference conditions 136 150 148 136 124
Table 2. Cucumbers Yields (Prestige and Miracle brands) at 90 days of Age, Grown in Protected Ground Under the Developed Fluorescing Films
Brand Experiment series Yield, kg/m2 Number of fruits, piece/m2 Average fruit weight, g
PrestigeReference 6.2 65 95
Light transforming film, 2 mg/g * 21.0 140 150
MiracleReference 13.2 110 120
Light transforming film, 2 mg/g * 20.8 160 130
* Concentration of the photoactive component

Light & Engineering Vol. 26, No. 2
43
2. Shpolsky E.V. Absorption spectrum of chloro-phyll in a solution and in natural state // Bulletin of the Academy of Sciences of the USSR. Biology series, 1947, #3, pp. 391–406.
3. Sventitsky I.I. Evaluation of photosynthesis effi-ciency of optical radiation // Svetotekhnika, 1965, #4, pp. 19–24.
4. Tikhomirov A.A., Lisovsky G.M., Sid-ko F. Ya. Spectral light composition and producing ca-pacity of plants// Novosibirsk: Nauka, 1991.
5. McCree, K.J. The Action Spectrum, Ab-sorptance and Quantum Yield of Photosynthesis in Crop Plants // Agricultural and Forest Meteorology, 1972, Vol. 9, pp. 191–216.
6. Molchanov A.G., Samoylenko V.V. Energy sav-ing optical irradiation of industrial greenhouses// Stav-ropol: ARGUS, 2013, 120 p.
7. Shulgin I.A. A plant and the Sun// Leningrad: Gi-drometeoizdat, 1973.
8. Ivanitsky A.E., Koval E.O., Rayda V.S. Flu-orescent properties of polyethylene films with pho-tophosphor additives // Fluorescence and accom-panying phenomena. Transactions of the VIIth
All-Russian workshop, November 13–18, 2001, Irkutsk, 2002.
9. Vasilyev R.B., Dirin D.N. Quantum dots: syn-thesis, properties, application. Moscow: FNM, 2007.
10. Adirovich E.M. Fluorescence and laws of spectrum transformation // Achievements of physi-cal sciences// 1950, V. 4, #3, pp. 341–368.
11. Kondratyev K. Ya. Actinometry// Leningrad.: The hydrometeorological publishing house, 1965, 685 p.
12. Pavlov S.A., Maksimova E. Yu., Koryakin S.L., Sherstneva N.E., Antipov E.M. An evaluation of sub-pixel luminosity of a fluorescent video monitor based
on quantum dots of CdSe/CdS/ZnS // Russian nano-technologies, 2016, V. 11, #3–4, pp. 64–68.
13. Pavlov S.A., Krikushenko V.V., Antipov E.M., Voronets N.B. Maksimova E. Yu., Shersneva N.V., Ko-ryakin S.L. Luminuos efficacy and efficiency of fluo-rescence of polymeric layers containing colloidal sem-iconductor phosphors based on quantum dots of CdSe/CdS/ZnS // Optics and spectroscopy. 2015. V. 119, #2, pp. 133–137.
14. Antipov E.M., Koryakin S.L., Maksimo-va E. Yu., Pavlov S.A., Sherstneva N.E. Forma-tion features of radiation chromaticity of CdSe/CdS/ZnS quantum dots dispersions in multicomponent sys-tems // Svetotekhnika, 2017, #4, pp. 31–34.
15. Antipov, E.M., Sergey L. Koryakin, S.L., Ele-na Yu. Maksimova, E.Y., Sergey A. Pavlov, S.A., Na-talya E. Sherestnyova, N.E. Features of Forming CdSe/CdS/ZnS Quantum Points Dispersion Radiation Chro-maticity in Multicomponent Systems // Light & Engi-neering, 2017, Vol. 25, No. 3, pp. 244–249.
16. Sivkov S.I. Calculation methods of solar radia-tion characteristics// Leningrad: The hydrometeorolog-ical publishing house, 1968, 232 p.
17. Tooming H.G. Solar radiation and harvest for-mation – Leningrad: Gidrometeoizdat, 1977, 200 p.
18. Tooming H., Niylisk H. Transition coefficients from integral radiation to PAR under natural condi-tions // In: Photoactinometric studies of plant cover. Tallinn: Valgus, 1967, pp. 140–149.
19. Shain S.S., et. al. Light and plant development. Moscow: Selkhozizdat, 1963, 622 p.
20. Leman V.M. A course of plant photoculture. Moscow: Vysshaya Shkola, 1976, 271 p.
21. Pavlov S.A., Voronets N.B. Quantum points and harvest // ESU. Chemical sciences, 2014, #10, pp. 89–91.
Sergei A. Pavlov, Prof., Dr. of Chemical Sc., graduated from Russian University of Chemical Technology named after D.I. Mendeleyev. At present, he is Chief Specialist at the Department of Chemical Technology of Polymer Composite Paints and Coatings, and his field of interests are rheology of macromolecular compounds, colloidal phosphors (quantum dots) in polymer’s composite coverings, materials for optical information output devices

Light & Engineering Vol. 26, No. 2
44
Sergei L. Koryakin, chemist, graduated from Russian University of Chemical Technology named after D.I. Mendeleyev in 2014. At present, he is a technician at the Department of Chemical Technology of Polymer Composite Paints and Coatings of this university and post-graduate student at the Faculty of Fundamental Physical and Chemical Engineering of Moscow State University named after M.V. Lomonosov. His scientific interests are connected with polymers composite paint and varnish materials and coverings, with anticorrosive materials for special purposes
Natalia E. Sherstenyova, chemist, graduated from Russian University of Chemical Technology named after D.I. Mendeleyev in 2010. At present, she is an engineer at the Department of Chemical Technology of Polymer Composite Paints and Coatings. Her field of scientific interest is connected with polymers composite paint and varnish materials and coverings and rheology of macromolecular compounds
Elena Yu. Maksimova, chemist, graduated from Russian University of Chemical Technology named after D.I. Mendeleyev in 1982. At present, she is a head of laboratory at the Department of Chemical Technology of Polymer Composite Paints and Coatings of this university. Her field of research is connected with polymers composite paint and varnish materials and coverings and rheology of macromolecular compounds
Eugene M. Antipov, Prof., Dr. of Chemical Science, graduated from Moscow Physical Engineering Institute in 1972. At present, he is a head of Department of Chemical Technology of Polymer Composite Paints and Coatings at the Russian University of Chemical Technology named after D.I. Mendeleyev and deputy dean of the scientific work of the Faculty of Fundamental Physical and Chemical Engineering at the Moscow State University named after M.V. Lomonosov. His field of interests is connected with polymers composite paint and varnish materials and coverings and rheology of macromolecular compounds

45
Light & Engineering SvetotekhnikaVol. 26, No. 2, pp. 45–51, 2018 No. 4, 2018
OPTIMIZATION OF CLASSROOM ILLUMINATION SYSTEM BASED ON NEURAL NETWORK ALGORITHM
Hongwu ZENG
Chongqing Medical University Institute of Medical Information, Chongqing, 400016 China E-mail: [email protected]
ABSTRACT
The optimization of classroom illumination sys-tem based on neural network algorithm was studied in order to optimize the classroom illumination sys-tem, which can effectively relieve the students ‘ visual fatigue and promote the learning efficiency. The neural network algorithm was used. First of all, on the basis of objective evaluation of classroom illumination system, the design algorithm of uni-versity illumination based on neural network was designed creatively. Secondly, the lower-machine program of intelligent Illumination system in uni-versity was designed, and the algorithm and model of the design at last were tested. Finally, the design algorithm and the model were tested. The results show that the design can play a good role in opti-mizing the classroom illumination system.
Keywords: neural network algorithm, classroom lighting, optimization design
1. INTRODUCTION
In recent years, the economic strength of our country has been greatly improved and the degree of civilization of the society is increasing, which is inseparable from the development of education. Ed-ucation has also reached an unprecedented level of attention in the whole society [1]. The size and num-ber of education for education is also rising, espe-cially for higher education, carrying the culture for the motherland and the task of scientific research gave birth to a man of tremendous promise, which has attracted the attention of the whole society. Col-
leges and universities are not only large and more personnel, but also the distribution of personnel is more scattered [2]. Because most of the universi-ties in our country are still taking traditional ma-nagement, the waste of energy is still common. It is understood that the water and electricity expend-iture of most colleges and universities in China can reach about twenty percent of the annual total ex-penditure of the school [3]. Especially for the con-sumption of electric energy, the proportion of total energy consumption is increasing, and the light-ing system can make up more than fifty percent of the total energy consumption. Colleges and uni-versities are different from primary and secondary schools, and the time and time of teaching and rest are relatively irregular [4]. And there are plenty of rooms; basically every classroom can not guarantee the people all day long. All day long in the class-room illumination in each period are different, so the lamp can not be timely closed waste of energy phenomenon, even “long light” phenomenon is still widespread there. Now most colleges and universi-ties have adopted the way of multimedia teaching, using projectors to play slides instead of tradition-al teaching. Then you need to pull the curtains open lamps. The majority of colleges and universities teaching building for the first wave morning stu-dents turn on the lights, the class also no one thinks until the evening before the seal floor attendant uni-form closed. Such a waste of energy not only brings a heavy burden to the running of colleges and uni-versities, but also brings adverse effects to the de-velopment of public welfare activities of “energy saving and emission reduction” in the whole socie-

Light & Engineering Vol. 26, No. 2
46
ty [5]. Therefore, how to effectively save energy has become a problem to be solved by the institutions of higher learning.
2. STATE OF THE ART
Intelligent lighting control system is an impor-tant part of intelligent building. With the conti-nuous development of intelligent building, lighting system is no longer just for bringing light and sim-plicity to people, but is developing towards com-fort and energy saving direction [6]. Especially for energy saving, for the important mission of intel-ligent lighting control system, it also takes on the task of building a saving society and promoting the sustainable development of the country. The main form of power generation at the present stage of our country is still thermal power generation. Especially in the north, if the intelligent lighting control system can be developed vigorously, the consumption of electricity can be reduced and the consumption of coal is reduced. This is of the same significance for improving the air quality and re-ducing the fog. In recent years, with the continuous development and mutual promotion of computer technology, automatic control technology, network communication technology and microelectronic technology, the development of intelligent light-ing control system is also deepening [7]. Accord-ing to the different environment, the users can make use of the intelligent lighting control system to set different requirements according to their own ac-tual conditions. The environmental information is collected through the automatic acquisition system. The information is analyzed logically and inferred by the system, and the feedback processing signal
Fig.1. Neuronal structure
......
X2
X1
Xn
Wi1
Wi2
Win
X0 = -1
yi
Wi0 = 0
f ( )
is formed so as to achieve the best lighting control effect [8].
3. METHODOLOGY
3.1. Neural Network Based Lighting Design Algorithm for Colleges and Universities
Neural networks, also called artificial neural networks or neural computing, can be seen as the abstraction and modelling of a human brain or a bi-ological neural network. In order to adapt to the en-vironment and learning environment in the way of simulating biological interaction, it is an important part of artificial intelligence science and can solve all kinds of complex problems that human beings can’t solve. The three main parts of the neural net-work are neuron, network topology and training al-gorithm. A neural network can be seen as a paral-lel processing system composed of many neurons or nodes connected by each other. The structure and function of single neuron seem simple, but the sto-rage system formed by multiple neurons is distrib-uted. Because of such characteristics, neural net-work has strong self-learning ability and high fault tolerance rate. The structure of the neuron is shown in Fig. 1.
Among them, —1 nx x represent the input sig-nal of the neuron. ijw - represents the weight of the connection between the neuron j and the neuron i, θ stands for the threshold value also called bias. The expression of the relationship between the input and output of the neuron i is
( )1
n
i ij j i ij
net w x y f netθ=
= − =∑ . (1)
The output of the neuron i is 1y . net is called net activation. The function f is called an activa-tion function. If the threshold value as the weight of a 0iw input to 0x neurons in I, while type 1 can be simplified as
( )1
n
i ij j i ij
net w x y f net=
= =∑ . (2)
If X is defined as an input vector, W is defined as a weight vector, then:
[ ]0 1 2, , ,..., nX x x x x= , (3)

Light & Engineering Vol. 26, No. 2
47
0
1
2
i
i
i
in
ωωω
ω
ω
⋅= ⋅ ⋅
. (4)
The output of the neuron can be transformed into the product of the vector.
( ) ( );i
i i
net Xy f net f X
ωω
=
= = . (5)
If the net value of neurons is positive, it can be defined that neurons are in active state or ex-cited state. If neuron net is negative, neurons can be defined as inhibitory state. Such as “threshold weighted and” neuron model is embodied in the form called MP model (McCullochPitts Model), also called the processing unit in a neural network (PE, Processing Element).
Network topology is divided into two types of feedforward and feedback networks in neural net-works, including the structure of the network and the connection mode between neurons. Feedfor-ward networks, when there is no feedback in the middle, each neuron outputs the input of the pre-vious layer to the next layer. The feedback net-work refers to the existence of feedback loops bet-ween neurons. Training algorithm (also known as learning algorithm) refers to the way of adjusting weights in training process, which determines the initial weights of each connection neuron and can meet the performance of the network. The train-ing algorithms can be roughly divided into two kinds of learning methods: supervised and un-supervised. Supervised learning can provide in-put mode and output mode to the network at the same time of training. And adjust weights through continuous input of different training modes so as to make output mode get closer to the expected mode. Unsupervised learning is to adjust its own parameters completely according to the input va-lue, and the output value can accurately reflect the purpose of the characteristics of the input train-ing sample.
3.2. Intelligent Lighting Program Design for Colleges and Universities Based on BP Neural Network Algorithm
The working process of the system determines the working state and the purpose of the system. De-signing a correct and reasonable system workflow is also very important for the normal and stable opera-tion of the system. The work flow chart can clearly reflect the design idea and the purpose that the de-signer wants to achieve for the whole system ope-ration. The working mode and process of the sys-tem software are also determined according to the sequence of the system flow chart. This design has carried on the detailed exploration and selec-tion to the system hardware equipment. Can we ma-ximize the functions of this hardware, ensure the smooth operation of the hardware, and achieve the intelligent control requirements for the lighting sys-tem. The design of the work flow chart should be as accurate and reasonable as possible.
According to the related concepts of the modu-le, the monitoring programs of the system general-ly include the two types of the command proces-sing subroutine and the monitoring master program. The monitoring master can invoke a subroutine at any time. In general, when the system runs, multi-ple subroutines within the system can be called by the same main program at the same time. Howev-er, due to the low cost requirement of the design, the AT89S52 microcontroller may run in the run-ning process, and the main program continuously calls the subroutine or even the dead cycle. In order to prevent the emergence of infinite circulation, we can match the main program of the slave machine into a large circular process according to a logical relationship. The functions of the lower machine in the process can be realized by calling various subroutines. In the process of designing the low-er machine process, we should focus on the sim-ple main program. The related functional modules in the system should be regarded as the subroutine under the main program. The function of the sys-tem is realized by calling the subroutine according to the design requirements. Therefore, it will be-come clearer and clearer to design the next machine software with this way of thinking. Even if there are any problems encountered during debugging, the causes can be found out and solved at the first time. The main program of the lower computer includes the initialization system, the related subroutine, the

Light & Engineering Vol. 26, No. 2
48
input and output pin, the instant switch and so on. Besides the initialization and pin definition of the system, other subroutines of the system are execu-ted repeatedly according to the workflow of the sys-tem, and each sub program will not interfere with each other. As a single chip computer program runs, it can be seen as a process to execute commands in a certain order. It is inevitable that there are some delays when running, but in fact, the speed of en-vironment change and personnel flow in the class-room is relatively slow, and the delay of single-chip microcomputer can be ignored, which can meet the normal operation of the system. The flowchart of the main program of the lower machine is shown in Fig. 2.
The basic learning algorithm of the BP neural network is called the gradient maximum descent method. It is defined as the adjustment of weights to minimize the total error of the network, which is the gradient search technique. With expectation, the mean square error of the actual output value and the expected output value of the network is the small-est. Its network learning process can be regarded as a process of error correction and transmission coef-ficient correction. In the structure of BP neural net-work, the three layer network structure is composed of the input layer, the hidden layer and the output layer. There is no direct relationship between the hidden layer (middle layer) and the outside world, but the neuron state of the hidden layer can affect
and change the input and output. The algorithm idea is the weight of network ( ,ij liTω ) and thresh-old (θ ) revised, so that the error along the negative gradient direction is of continuous decline, finally we obtain the satisfactory results. The learning for-mula of the BP neural network is as follows: among them, ijω is the network weight value between the input node and the hidden layer node. liT is the net-work weight value between the hidden node and the output node. 1t is the expected value of the input node. The output node is lO . We input in the input node jx , the output of the middle node:
( )i ij j iy f xω θ= −∑ . (6)
Output node:
l ij li
O f T θ = − ∑ . (7)
Among them, the connection weight value is .ijω The node domain value is lθ . For the output layer, the output node expects to output 1t , and the error formula is as follows:
( )( )1 1 1 1 11t o o oδ = − − . (8)
Error control:
1
pkk
E e=
= <∈∑ , (9)
( ) ( )1 1
1
nk k
kl
e t o=
= − ∑ . (10)
Weight correction:
( ) ( ) 11li li iT k T k yηδ+ = + , (11)
where k is the number of iterations. The threshold value correction:
( ) ( ) 11l i ik k yθ θ ηδ+ = + . (12)
Among them, p is a sample number, E is a sam-ple error, and n is the number of output nodes. For the correction formula of the middle layer (the input node to the intermediate node), the error formula:
( )1i i i l lii
y y Tδ δ= − ∑ (13)
Weight correction formula:
Fig.2. System work flow chart
Setting a timer、interruption
Start
System initialization
Light intensity detection
Infrared acquisition
Receive forced switch command
Receive forced switch command
Opening and closing lamps
Send data
Y
Y
N
N

Light & Engineering Vol. 26, No. 2
49
( ) ( )1ij ij i jk k xω ω ηδ+ = + . (14)
The threshold value correction:
( ) ( )1i i ik kθ θ ηδ+ = + . (15)
4. RESULT ANALYSIS AND DISCUSSION
4.1. Simulation Experiment of BP Neural Network
In order to satisfy the standard value of illu-minance, the most energy-saving lamp installa-tion scheme is designed, which can be simulated by BP neural network. Generally in different en-vironment, the installation position and power of
the lamps and lanterns will have a certain influ-ence on the lighting effect. The model can be built through the BP neural network. The illuminance standard and the lamp power are defined as the in-put quantity, the installation position of the lamp is defined as the output, and the training is carried out. The experiment selected a classroom of the teach-ing building as the experimental object. The in-put data of the BP algorithm is normalized. The input and output parameters of the network are de-termined, and the selection and determination of the parameters are selected according to the ac-tual situation. The distribution of lamps and lan-terns in the classroom and the measured data are shown in Table 1, and the sample data are shown in Table 2.
Pe, Pf, and Pw are the characteristics of the lamp.
Table 1. Classroom Lighting Monitoring Data
Input quantity Output
Standard of illumination (h) Luminaire power (W) X axis coordinates (cm) Y axis coordinates (cm)
150
40 171 225
30 133 180
20 100 150
15 92 82
200
40 200 150
30 100 180
20 75 150
15 86 69
300
40 171 129
30 100 129
20 80 100
15 50 82
Table 2. The Sample Data (for Table 1)
Input sample Output sample
H (10m)
ϕ (1041m)
A (102m2) η K
cP fP wP avE (103 lx)
N (10) avE (103 lx)
0.36 0.3112 1.08 0.7 1.3 0.55 0.26 0.35 0.35 28 0.304
0.36 0.2865 1.08 0.7 1.3 0.36 0.33 0.36 0.39 35 0.350
0.36 0.2553 1.08 0.7 1.3 0.39 0.36 0.37 0.299 36 0.318
0.36 0.2006 1.08 0.7 1.3 0.12 0.41 0.61 0.15 28 0.196

Light & Engineering Vol. 26, No. 2
50
The data used in the test show that the input amount is lighting luminance (LC) and luminaire power (W). The output is the minimum distance between the horizontal and vertical lights installed in a given classroom (the unit is cm). The default size of the classroom is 12m * 9m. For different sizes of classrooms, data can be modified by test-ing. The fluorescent lamp is used as the test lamp in the test. Because the 16W LED lamp in the de-sign is basically the same with the 40W fluorescent lamp on the illumination, so the simulation results of 40W lamps in the test can be used as the basis for the installation location of lamps in the design. The total error of training obtained from many times is shown in Fig. 3 (a, b, c). The algorithm’s error is
displayed graphically, and there are shown every 10 iterations.
Then the test results are obtained. We can cal-culate the result of the test. Meeting the illumina-tion requirement, if we choose 40W lamps, we can install 5 lamps in the 12m * 9m classroom in the range of X 9m. We can install 6 lamps in the scope of Y axis, and we need to install 30 lamps in the whole classroom.
4.2. Logical Relationship
Generally speaking, the intelligent lighting control system can be divided into three working modes: class mode, self-study mode and manda-tory mode. The logical relationship between dif-ferent modes is also different. When using class mode, there are two kinds of people in the class-room. There is a light intensity in the classroom. If the indoor light intensity is enough, no matter whether the indoor lights are on or off, they should be closed. If the intensity of the indoor light is insuf-ficient, the lamps in the classroom should be open, and the lights in the unmanned classroom should be closed. When designing binary logic relation-ship, it should be consistent with the output signal of the illuminance acquisition module. When the il-lumination intensity is enough, it is set to “0”, and when the illumination intensity is insufficient, it is set to “1”. If indoor activity is set to “1”, no indoor activity is set to “0”, indoor lighting is set to “1”, and indoor lighting is set to “0”. According to the requirements of the design, the logical relationship is formed. When using the selfstudy mode, a cer-tain priority can be set for the self-study room in or-der to save energy. If the indoor illumination of the highest priority classroom is insufficient and the room is detected, the luminaire will be in the open state. Secondly, the first class classroom will start the intelligent control system only if the upper level lamps are turned on. The human body detection mo-dule is used to decide whether someone is indoors or not, and then decides that lamps are still open for opening. In the design of a binary logic relation-ship, if someone in a high priority room can be set to “1” room, no one is set to “0”. High priority in-door lamps and lanterns are set to “1”, and the lumi-naire is set to “0”. The next level of indoor lighting is set to “1”, and the lamp closes to “0”. According to the design requirements, a logical relationship is formed. When using coercive mode, the system will
(a)
20 40 60 80 100 120 140 1601000
2000
3000
4000
5000
6000
7000
Tota
l err
or
Count
(b)
20 40 60 80 100
2000
4000
6000
8000
10000
Tota
l err
or
Count
(c)Fig.3. The BP neural network algorithm
20 4035 6030
2000
4000
6000
8000
10000
Tota
l err
or
Count451510 25

Light & Engineering Vol. 26, No. 2
51
force the selected classroom lamps to be opened or closed to deal with all kinds of special situations. This control mode is only for simple opening and closing, and there is no logical relationship. There will be no more introductions here. In conclusion, the test results show that the design of this paper can optimize the lighting system of classroom, and classroom lighting should be optimized from light-ing level, glare sensation, luminance distribution, lighting and indoor layout.
5. CONCLUSION
This paper took energy conservation as the start-ing point, takes such a large group of colleges and universities as the main research object, and took the electricity consumption in colleges and univer-sities as the main research object. The classroom lighting system of teaching building, which is easy to cause waste, is the main research object. This pa-per put forward an intelligent lighting control sys-tem suitable for modern teaching buildings in col-leges and universities. First of all, the algorithm and model used in this paper were described in de-tail. Secondly, in the overall design of the system, author learned the current development of intelli-gent control technology and the advantages, compo-nents, and development of intelligent lighting sys-tem by consulting related information. Based on the analysis of the existing intelligent lighting control system at home and abroad, and combined with the current situation of classroom lighting in colle-ges and universities in China, a classroom lighting optimization system based on neural network was constructed. In order to improve the efficiency of energy saving, the original fluorescent lamp was re-placed by LED lamp. Finally, this paper simulated the best fixtures of lamps and lanterns through neu-
ral network algorithm. In short, classroom lighting: the level of illumination, glare, brightness distribu-tion should be formed by the layout optimization of lighting and interior.
REFERENCES:
1. Chen J F., Hsieh H N., Do Q H. Evaluating teach-ing performance based on fuzzy AHP and comprehensive evaluation approach. Applied Soft Computing, 2015. V28, pp.100–108.
2. Zhang H., Sun X. Research on low carbon sup-ply chain performance evaluation based on AHP and fuzzy comprehensive evaluation method. Journal of Shan-dong University of Technology (Natural Science Edition), 2016. V1, p.16.
3. Zhaoben F., Peijie Y., Ganlin P. Empirical research on credit risk management for electric power clients. Au-tomation of Electric Power Systems, 2005. V1, p. 17.
4. Li X., Yang S., Zhang H. Research on assessment method for power supply service quality. Power System Technology, 2004. V12, p. 8.
5. Bentaleb, Fatimazahra., Charif Mabrouki., Alami Semma. “A multi-criteria approach for risk assessment of dry portseaport system.” Supply Chain Forum: An In-ternational Journal, 2015. V16, #4, pp.32–49.
6. Huanhuan, Wei., Lu Yuan. “Evaluation of auto dealers credit based on AHP and fuzzy comprehensive evaluation method.” Modern Manufacturing Engineer-ing, 2017. V3, p. 4.
7. Zhang N., Tao Q. Engineering Project Risk Evalu-ation Based on Grades Fuzzy Comprehensive Evaluation. Construction Economy, 2009. pp.S1.
8. Zhengrong, Nie. “On the Appraisal of Xincheng Tourism Resources Based on AHPFuzzy Comprehensive Evaluation Method.” Journal of Tourism College of Zhe-jiang, 2016. V3, p. 6.
Hongwu ZENG, lecturer of the School of Medical Information, Medical University of Chongqing. Graduated from Chongqing University in 2017 and majored in computer science. His research interests include data mining and Internet of things

52
Light & Engineering SvetotekhnikaVol. 26, No. 2, pp. 52-59, 2018 No. 4, 2018
OPTIMIZATION OF INTELLIGENT ILLUMINATION IN UNIVERSITY CLASSROOM BASED ON FMRAS
CONTROL ALGORITHM
Wenhao DUN
School of Civil Engineering & Architecture of Wuhan University of Technology / Hubei Institute of Fine Arts, Wuhan, Hubei, China;
E-mail: [email protected]
ABSTRACT
Based on the FMRAS control algorithm, the optimization of the intelligent illumination in the classroom was studied, aiming at optimizing the classroom illumination and improving the energy utilization. The FMRAS control algorithm, based on technology, was used to design a fuzzy control system of intelligent illumination in college class-room. The analysis is based on the improved adap-tive algorithm – FMRAS. After the PWM code is automatically generated, the system can automati-cally control the lighting of the lamps. Through the research, the result has been obtained: the method designed can meet the needs of the optimization of intelligent lighting in the classroom, and can further improve the efficiency and intelligence of classroom lighting in universities.
Keywords: fuzzy model reference adaptive sys-tem (FMRAS) control algorithm, college class-rooms, intelligent lighting
1. INTRODUCTION
China has put energy saving work as the focus of the “11th FiveYear” work. The call for “building a conservation oriented society” was put forward. The Ministry of education has also actively re-sponded to the call for “building a conservation ori-ented campus”. As an important place for college teaching, the university classroom usually adopts the open management model. Students basically
have no fixed classrooms and seats, while the build-ing managers are only responsible for health or se-curity [1]. Therefore, there is a waste of lights, un-turned lights and less people because of the large number of lamps and lanterns in the classroom and the long time of use. The proportion of lighting in the whole school’s electricity consumption has always been high. If a school has 200 classrooms in accordance with the 100m2 [2], the intelligent lighting control is adopted to make the electricity saving rate of 30 %, and the electricity fee is saving from 150 to 200 thousand yuan per year. The above estimates are not including in the line loss and the ageing of the luminaire [3]. The above data show that the energy saving work in the classroom is a long-term and arduous task. The intelligent light-ing control in university classrooms should not only meet the requirements of indoor lighting, but also prolong the life of lamps and lanterns, reduce ope-ration costs, simplify distribution control devices and reduce wiring workload under the premise of energy saving [4]. A new wireless network techno-logy with short distance, low speed, low complex-ity, low power consumption and low cost Zigbee technology has its unique advantages: power sav-ing, reliability, short delay, large network capaci-ty, high security, licensed frequency band, selfor-ganization and so on [5]. It is very suitable for the wireless connection of the sensor nodes in the class-room. It not only conforms to the characteristics of the school network communication, but also saves a lot of manpower and material resources. There-

Light & Engineering Vol. 26, No. 2
53
fore, the research and Realization of intelligent lighting control system has very important practi-cal significance.
2. STATE OF THE ART
The key technology of intelligent lighting sys-tem is information transmission and intelligent con-trol. The power carrier technology, the integrated wiring technology and the wireless network tech-nology are the three main technologies of the in-formation transmission in the current intelligent lighting control system in China. The integrated wiring technology connects the central controller, the switch, and the terminal with the unshielded twisted pair and the optical cable as the medium [6]. The central controller transfers the wireless signals sent by the remote control to the terminals in a wired way, and the terminal completes the cor-responding instructions. This method needs to set up the extra weak power control line to achieve the stable signal, which is more suitable for the large area control of the building and the district intelli-gence. But there are the following shortcomings: the specialized technical installation and maintenance large amount of engineering, long installation cycle, high cost, and poor compatibility of equipment. The wireless network realizes intercommunication and intelligent control of all kinds of electronic devi-ces through infrared, Bluetooth, Zigbee and oth-er technologies [7]. Wireless networks can provide greater mobility and convenience, which makes the use of space more flexible. The cost and ener-gy spent on the generic cabling were saved. The application of wireless network technology to the school network has become an unstoppable trend. As a technology of low power consumption, low data rate and low cost, Zigbee is more suitable for classroom lighting automation system and low-cost equipment for low rate rate transmission. Zigbee is
the best choice for intelligent lighting control sys-tem in Colleges and Universities [8].
3. METHODOLOGY
3.1. Design of Illumination Acquisition Module and Vibration Sensing Module
First of all, it is designed for the optical illumi-nation acquisition module, which fully uses natu-ral light. The combination of natural light and light is not only an effective way to save energy, but also to create a good visual effect. Therefore, a light il-lumination acquisition module is designed, and its structure diagram is shown in Fig. 1.
The module consists of three parts, which are data acquisition, data processing and PWM drive control. Among them, data processing and driving control are mainly completed by CC2430. The illu-minance sensor is used by ON Company to produce a visible light sensor (ON9658). The sensor is an optoelectronic integrated sensor, with a built-in UN-IKA sensor receiver, which automatically attenuates near infrared. The spectral response is close to the human eye function. It is highly sensitive in the vi-sible range, and the output current varies linear-ly with illumination. The main function is to col-lect the bad illuminance signal of the classroom and send the signal to the data processing unit through the digital I/O pin P0.7 of the CC2430, whose cir-cuit is realized as shown in Fig. 2.
As the core of data processing and driving con-trol, Zigbee chip CC2430F128 integrates ADC with 14 bit modulus / number conversion, and it can write the result of conversion to memory controller through DMA mode without CPU interference. This cannot only make the detection results more accu-rate, but also improve the overall efficiency of the system and reduce the power consumption. Con-figure the 16 bit timer of the CC2430, TIMER1.
Fig.1. Structure diagram of illuminance acquisition module
Natural light input
Illuminance sensor
LED light
Data acquisition
Fuzzy controller PWM code compensation illuminance outputA/D
CC2430
Data processing Drive control

Light & Engineering Vol. 26, No. 2
54
The centre aligned PWM output can be genera-ted. First, TIMER1 is selected as a positive count / down count mode, and the channel output com-parison mode selects 5. Secondly, the period of the PWM signal is stored in the T1CC0. Finally, the PWM duty ratio is calculated according to the con-trol changes of the fuzzy inference output. It is used to adjust the effective value of the output voltage to compensate the natural light illumination to stabi-lize the light environment of the classroom.
The second is the design of the vibration sens-ing module. At present, the multimedia classrooms in colleges and universities are quite common, and such classrooms have special requirements for the illumination. It is not only to meet the students’ reading and note taking, but also to ensure the clari-ty of the projection screen. So, the vibration sensing module was designed and installed in the projector. When the fan is rotated, the module senses and de-termines that the classroom is in the projective state. At the same time, the lamp in the rostrum area is closed, while the reserved seat area keeps 50 % of the standard illuminance. The circuit diagram of this module is shown in Fig. 3.
In this design, the vibration sensing element, SW180–10P, is used as a type of non-directional vibration induction device, which can be triggered at any angle. It is the open OFF state at any angle at rest. When the external force is collided or vibrate, the spring deformation and the contact of the central electrode make the two pins turn into the ON state instantaneously. When the external force is disap-
pearing, the circuit is restored to the open OFF state. Considering the cost factor, the LMV324 operatio-nal amplifier is used as the comparator in this de-sign. Its integration makes it smaller than the inde-pendent comparator occupying the circuit board, thus further saving the cost.
3.2. Adaptive FMRAS Algorithm Based on Fuzzy Control System Design
Fuzzy control is a kind of computer model based on fuzzy set theory; fuzzy language is vari-able and fuzzy logic reasoning. Fuzzy control sys-tem is a di gital automatic control system based on fuzzy mathematics, fuzzy language form know-ledge representation and fuzzy logic rule inference, and a closed loop structure with feedback channel, which is composed of computer control technology. The structural form of its system is shown in Fig. 4.
The fuzzy control system is usually composed of five parts, such as fuzzy controller, input / output interface, actuator, wave control object and detec-tion device (sensor).
The basic structure of the fuzzy controller is shown in Fig. 5.
As shown in Fig. 5, in this system, fuzzy adap-tive mechanism produces a fuzzy adaptive signal based on the difference between the output of YM and the output YF of the controlled system accor-ding to the reference model, controlling the output of the controlled system to the reference model out-put. However, in the actual situation, there will be changes in the object parameters, state interference
Fig.3. Vibration sensor module
-+
3.3V
100K 10K
104SW-180-10p
LMV324
P1.7
Fig.2. Optical illumination acquisition module circuit
Visible light
+
On9658
1kΩ 104pF
Fig.4. Structure block diagram of fuzzy control system
+-
Set valueA/D Fuzzy controller Executive agency Controlled object
Controlled quantity
sensor

Light & Engineering Vol. 26, No. 2
55
and so on. Therefore, the TS fuzzy model is adop-ted in this mechanism, and the following implica-tion is adopted.
If e =A and ec=B then u=g(e). (1)
Among them, A and B are fuzzy subset; g (e) is a continuous function of e, as shown in Table 1.
g1(e), g2(e), g3(e) in the table are K0e, 0.6 K0e and 0.3 K0e, respectively. K0 is the ratio coeffi-cient. According to the fuzzy inference algorithm, the adaptive fuzzy query can be obtained as shown in Table 2.
The product of any element in the table and the K0e is the output Uf of the fuzzy adaptive mecha-nism of the corresponding system state. Obvious-ly there is:
Uf = f (e , ec) K0e. (2)
In the form, f represents a kind of nonlinearity, whose value can be queried in Table 2. The Mat-lab’s Fuzzy Logic Toolbox provides a seamless con-
nection with Simulink. After the fuzzy inference system is established in the fuzzy logic toolbox, it can be simulated and analyzed in the Simulink si-mulation environment immediately. In Simulink, there is a corresponding block diagram of fuzzy logic control, and the block diagram is copied to the Simulink simulation model established by the user. The name of the fuzzy reasoning matrix of the block diagram of the fuzzy logic controller is the same as the name of the fuzzy inference system which is es-tablished by the user in the Matlab workspace. The connection between the fuzzy inference system and the Simulink can be completed. The core part of the model is described as follows: the step signal issued by Step represents the set value of the standard illu-minance. In this simulation, it is set as 400 lx. Con-sidering the diversity of the light source, the con-trolled model uses the first order and the two order two transfer functions to verify the practicability of the algorithm. The reference model describes the dynamics of the controlled object or represents an ideal dynamic, and does not need to establish an accurate mathematical model. In this design, the
Fig.5. Fuzzy control structure diagram
Input membership function
Control rules Give membership functionKnowledge base
Fuzzy relation
Data processing
Fuzzification Fuzzy inference
Set up quantitative
Defuzzification ProcessControlled variable
Measured value
Table 1. Fuzzy Rules Table of Fuzzy Adaptive Mechanism
UEC
PB PM PS Z NS NM NB
E
PB g1(e) g1(e) g2(e) g3(e) 0 0 0
PM g1(e) g1(e) g2(e) g3(e) 0 0 g3(e)
PS g1(e) g2(e) g3(e) 0 0 g3(e) g2(e)
Z g1(e) g3(e) 0 0 0 g3(e) g1(e)
NS g2(e) g3(e) 0 0 g3(e) g2(e) g1(e)
NM g3(e) 0 0 g3(e) g2(e) g1(e) g1(e)
NB 0 0 0 g3(e) g2(e) g1(e) g1(e)

Light & Engineering Vol. 26, No. 2
56
adaptive mechanism uses the fuzzy inference me-thod of the post – part as the function form. This method cannot be compiled directly with a Matlab fuzzy editor. The value of Table 2 needs to be filled in the two-dimensional table Look-Up Table (2D). At the same time, the Matlab Function dialog box is changed to four to five into the round function. The feedback fuzzy controller uses the incremental sig-nal as the output, and then outputs the output to the controlled object. This is equivalent to the introduc-tion of integral action, which is beneficial to elimi-nate static deviation.
4. RESULT ANALYSIS AND DISCUSSION
4.1. Research on Fuzzy Feedback Controller
The input / output variable of the feedback con-troller is determined. In this design, the feedback controller is a two dimensional fuzzy controller, which is the dual input output mode. The input va-riable is the illumination deviation e and the devia-tion rate ec. This method can not only guarantee the stability of the control system, but also reduce the overshoot and concussion.
For the determination of membership func-tion of input / output M, the function of Li is a fuzzy set, which should be applied to practical problems.
In this system, the common triangle membership function is used, and the Matlab fuzzy toolbox graphic interface is used to determine the func-tion editor. For example, Fig. 6.
The domain of the input variable is used for this fuzzy controller for the selection of the do-main and factor of the input / output variable. Ac-cording to the experience of the expert, if the va-lue of the system deviation e is greater than 20 lx, it should be “PB” for the maximum value of the lan-guage. The value of e is less than equal to –20 lx, which is “NB”. Therefore, the domain of the devia-tion e is [–20, 20], and the fuzzy set domain is [–5, 5]. The value of the quantizing factor Ke is 0.25. It is worth noting that the domain of the deviation e of the input variable of the fuzzy controller is not equal to the range of the deviation in the system operation. In actual control, a limiter should be add-ed to ensure that the error value is within the allow-able range.
In the same way, the domain and its factors of the controller output and error change can be de-termined. According to the illuminance standard of China’s civil building lighting design standard and international vision ergonomics indoor lighting sys-tem, 420 lx is used as the standard illumination va-lue, and the illumination area of luminaire is set to [300, 500]. Therefore, the ratio factor Ku of the
Table 2. Fuzzy Self-Adaptive Mechanism Fuzzy Query Table
fec
6 5 -4 -3 -2 -1 0 1 2 3 4 5 6
e
6 1 1 0.93 0.82 0.66 0.46 0.38 0 0 0.3 0.3 0.3 0.3
5 1 1 0.9 0.81 0.65 0.45 0.37 0 0 0.3 0.3 0.3 0.3
-4 0.97 0.95 0.87 0.77 0.62 0.44 0.36 0 0.1 0.32 0.35 0.38 0.4
-3 0.96 0.91 0.85 0.67 0.53 0.41 0.35 0 0.1 0.34 0.38 0.4 0.43
-2 0.92 0.83 0.71 0.58 0.5 0.36 0.34 0 0.3 0.36 0.41 0.46 0.53
-1 0.86 0.77 0.66 0.48 0.35 0.3 0.3 0 0.3 0.38 0.47 0.51 0.6
0 0.8 0.67 0.5 0.4 0.3 0 0 0 0.3 0.4 0.5 0.67 0.8
1 0.6 0.51 0.47 0.38 0.3 0 0.3 0.3 0.35 0.48 0.66 0.77 0.86
2 0.53 0.46 0.41 0.36 0.3 0 0.34 0.36 0.5 0.58 0.71 0.83 0.92
3 0.43 0.4 0.38 0.34 0.1 0 0.35 0.41 0.53 0.67 0.85 0.91 0.96
4 0.4 0.38 0.35 0.32 0.1 0 0.36 0.44 0.62 0.77 0.87 0.95 0.97
5 0.3 0.3 0.3 0.3 0 0 0.37 0.45 0.65 0.81 0.9 1 1
6 0.3 0.3 0.3 0.3 0 0 0.38 0.46 0.66 0.82 0.93 1 1

Light & Engineering Vol. 26, No. 2
57
controller output should be 5. And the error chan-ges need to be set according to the actual needs, Kec=0.01 in this controller.
In actual control, the continuous domain needs to be discretized. For example, the fuzzy set theo-ry domain of the error e is divided into 7 grades. Each level corresponds to a fuzzy subset. That is, –5, –4, –3, –2, –1, 0, 1, 2, 3, 4, 5 respective-ly (NB, NM, NS, ZO, PS, PM,). Then determine the membership degree of the element in the do-main on the fuzzy language variable.
The fuzzy control rule is the core of fuzzy con-troller for the determination of the fuzzy control rule table and the descendant table, reflecting the knowledge collection of a particular control prob-lem, such as offset. When making fuzzy rules, the following requirements should be met: intuitively, fuzzy control models should always be able to get a proper control for every process state reasoning. This feature is called “completeness”. It means you can’t get out of control. For the number of fuzzy control rules, if the input of fuzzy controller is m, the fuzzy classification number of each input is n1, n2,…, nm, respectively. The maximum possible fuzzy rule number is Nmax= n1n2… nm. How much
the actual fuzzy control number should be deter-mined depends on many factors. The general prin-ciple is that, under the condition of completeness, the number of rules is taken as much as possible so as to simplify the design and implementation of the fuzzy controller. For the consistency of fuzzy control rules, fuzzy control rules are mainly based on the experience of the operator, depending on the requirements for a variety of performance, and the requirements of different performance indicators are often mutually restrictive and even contradicto-ry to each other. This requires the inconsis tency of fuzzy control.
In the light control, the illuminance value of the light is mainly influenced by the external natural light. The natural light is high and the lamps in the classroom should be closed. Low natural illumina-tion, room lamps and lanterns should be opened, and the standard value of illuminance is guaranteed. This is the work of the actual lighting control. Ac-cording to the actual situation and the experience of artificial lighting control, the fuzzy control rule table can be obtained. In the results, E, EC and U are fuzzy language variables of illumination devia-tion e, deviation rate EC and output cancellation u.
Fig.6. The subordinate function of the fuzzy controller
-4 -3 -2 -1 0 1 2 3 4 550
0.5
1 HB NM NS Z PS PM PB
y
Input variable E
-2 0 1 2 3-30
0.5
1 HB NS Z PS PB
y
Input variable EC -1
-3 0 1 2 4-40
0.5
1 HB NM Z PS PB
y
Input variable U -1
(a) The membership function of illuminance deviation E
(b) The membership function of the variation rate of illuminance EC
(c) The membership function of the incremental U of the controlled system
NS PM
-2 3
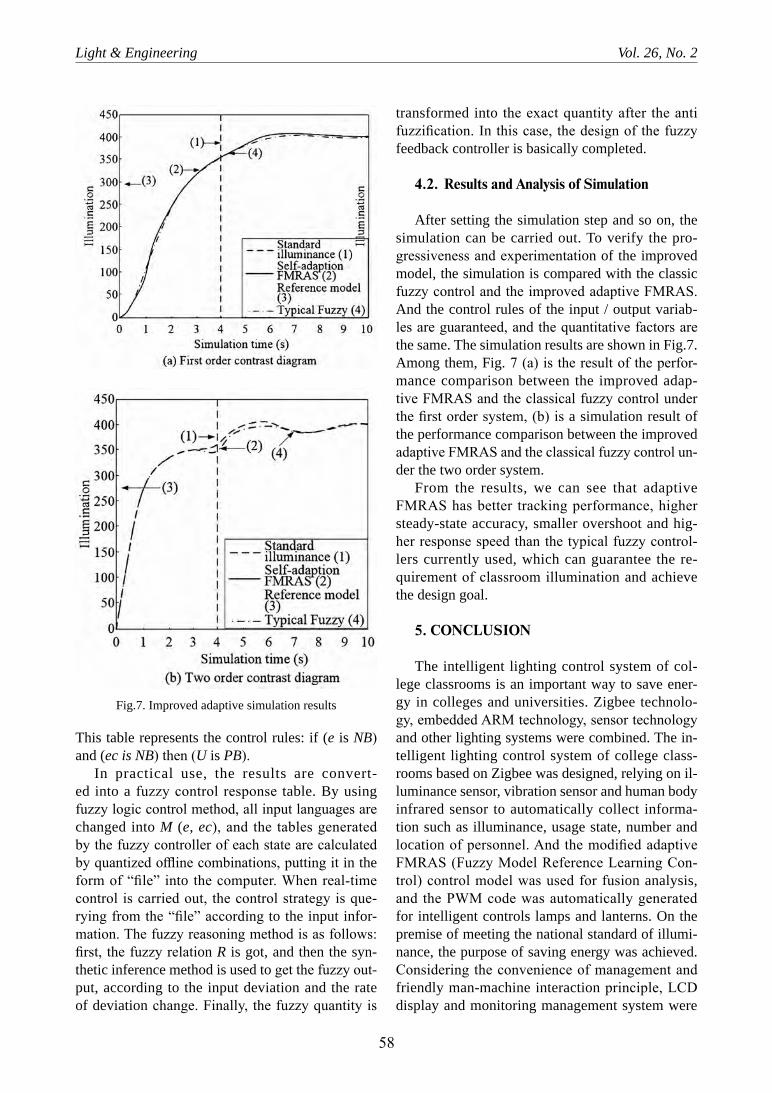
Light & Engineering Vol. 26, No. 2
58
This table represents the control rules: if (e is NB) and (ec is NB) then (U is PB).
In practical use, the results are convert-ed into a fuzzy control response table. By using fuzzy logic control method, all input languages are changed into M (e, ec), and the tables generated by the fuzzy controller of each state are calculated by quantized offline combinations, putting it in the form of “file” into the computer. When realtime control is carried out, the control strategy is que-rying from the “file” according to the input infor-mation. The fuzzy reasoning method is as follows: first, the fuzzy relation R is got, and then the syn-thetic inference method is used to get the fuzzy out-put, according to the input deviation and the rate of deviation change. Finally, the fuzzy quantity is
transformed into the exact quantity after the anti fuzzification. In this case, the design of the fuzzy feedback controller is basically completed.
4.2. Results and Analysis of Simulation
After setting the simulation step and so on, the simulation can be carried out. To verify the pro-gressiveness and experimentation of the improved model, the simulation is compared with the classic fuzzy control and the improved adaptive FMRAS. And the control rules of the input / output variab-les are guaranteed, and the quantitative factors are the same. The simulation results are shown in Fig.7. Among them, Fig. 7 (a) is the result of the perfor-mance comparison between the improved adap-tive FMRAS and the classical fuzzy control under the first order system, (b) is a simulation result of the performance comparison between the improved adaptive FMRAS and the classical fuzzy control un-der the two order system.
From the results, we can see that adaptive FMRAS has better tracking performance, higher steady-state accuracy, smaller overshoot and hig-her response speed than the typical fuzzy control-lers currently used, which can guarantee the re-quirement of classroom illumination and achieve the design goal.
5. CONCLUSION
The intelligent lighting control system of col-lege classrooms is an important way to save ener-gy in colleges and universities. Zigbee technolo-gy, embedded ARM technology, sensor technology and other lighting systems were combined. The in-telligent lighting control system of college class-rooms based on Zigbee was designed, relying on il-luminance sensor, vibration sensor and human body infrared sensor to automatically collect informa-tion such as illuminance, usage state, number and location of personnel. And the modified adaptive FMRAS (Fuzzy Model Reference Learning Con-trol) control model was used for fusion analysis, and the PWM code was automatically generated for intelligent controls lamps and lanterns. On the premise of meeting the national standard of illumi-nance, the purpose of saving energy was achieved. Considering the convenience of management and friendly man-machine interaction principle, LCD display and monitoring management system were
Fig.7. Improved adaptive simulation results

Light & Engineering Vol. 26, No. 2
59
attached to facilitate monitoring and viewing of ma-nagers, teachers and students. The function of mak-ing lamps and lanterns achieve standard illumina-tion automatically was realized, quickly and stably based on indoor personnel location, natural illumi-nation and classroom usage state. At the same time, the service life of the lamps and lanterns was pro-longed, the workload of wiring was reduced, and the purpose of energy saving was achieved.
REFERENCES:
1. Zhang Y., Li B., Su X., et al. A Study of School-room Lighting Fuzzy Control System. International Jour-nal of Control and Automation, 2015. V8, #1, pp.189–196.
2. Morey M S., Virulkar V B., Dhomane G A. MRAS based Speed identification and online updating of rotor time constant for sensorless field oriented controlled in-duction motor. Emerging Trends in Electrical Electronics & Sustainable Energy Systems (ICETEESES), Interna-tional Conference on. IEEE, 2016. pp.179–185.
3. Kirkby, J. L., Deng, S. “Static hedging and pric-ing of exotic options with payoff frames.” Available at SSRN2501812, 2017.
4. Zumbrunn S., McKim C., Buhs E., et al. Support, belonging, motivation, and engagement in the college classroom: A mixed method study. Instructional Science, 2014. V42, #5, pp.661–684.
5. Biddix J P., Chung C J., Park H W. The hybrid shift: Evidencing a student-driven restructuring of the college classroom. Computers & Education, 2015. V80, pp.162–175.
6. Berry M J., Westfall A. Dial D for distraction: The making and breaking of cell phone policies in the college classroom. College Teaching, 2015. V63, #2, pp.62–71.
7. Georgieva D., Schledermann K M., Nielsen S M L., et al. Designing User Centred Intelligent Classroom Lighting. Interactivity, Game Creation, Design, Learn-ing, and Innovation. Springer, Cham, 2017. pp.314–323.
8. Wei W., Tao Y., Baosen T., et al. Design of intelli-gent multifunctional LED lighting system. Microcomput-er & Its Applications, 2016. V15, p. 31.
Wenhao DUN, Onthejob Doctorate, Lecturer. Graduated from the School of Civil Engineering and Architecture of Wuhan University of Technology. The research direction is lighting design for underground engineering. He is the Fellow of Indian Society of Lighting Engineers (ISLE), member of The Institution of Engineers (India), and member of IESNA

60
Light & Engineering SvetotekhnikaVol. 26, No. 2, pp. 60–67, 2018 No. 2, 2018, pp. 22–27
SENCITY – EVALUATING USERS’ EXPERIENCES OF INTELLIGENT LIGHTING FOR WELL-BEING IN SMART CITIES*
Henrika Pihlajaniemi1, Anna Luusua1, and Eveliina Juntunen2
1Oulu School of Architecture, University of Oulu, Finland 2VTT Technical Research Centre of Finland, Oulu, Finland
E-mails: [email protected], [email protected], [email protected]
ABSTRACT
1This paper presents the evaluation of users’ ex-periences in three intelligent lighting pilots in Fin-land. Two of the case studies are related to the use of intelligent lighting in different kinds of traffic ar-eas, having emphasis on aspects of visibility, traf-fic and movement safety, and sense of security. The last case study presents a more complex view to the experience of intelligent lighting in smart city contexts. The evaluation methods, tailored to each pilot context, include questionnaires, an urban dashboard, in-situ interviews and observa-tions, evaluation probes, and system data analyses. The applicability of the selected and tested methods is discussed reflecting the process and achieved results.
Keywords: evaluation, intelligent lighting, me-thod, smart lighting, user experience
I. INTRODUCTION
Applications of intelligent or smart lighting will be spreading in the near future to various types of urban context. If designed wisely, smart lighting can, besides energy savings, offer added value for urban environments on various levels of experience [1]. However, as the implementations are still rather rare and recent, there is a lack of knowledge on us-
* On basis of report at the European conference LUX EUROPA 2017, Ljubljana, Slovenia, 1820 September
er’s experiences to support design processes. Thus, in our research and development, we aim to in-crease understanding of user’s multifaceted expe-rience of intelligent lighting and of the methods for evaluating it.
1.1. SenCity Project
SenCity – Intelligent Lighting as a Service Plat-form for Innovative Cities is a national research and development project between Finnish cities, compa-nies and research partners [2]. The project aims at employing lighting infrastructure as a service plat-form – an IoT (Internet of Things) backbone – for smart lighting solutions and innovative, user-ori-ented services in urban environments. The project develops intelligent LED lighting pilots in the par-ticipating cities, to which the companies involved develop solutions to better respond to the cities’ needs. The research partners integrate the project together through the design of pilot contents and re-alization, user experience evaluation and technical development and testing.
The project pilots smart lighting solutions in six Finnish cities in different kinds of urban environ-ments. The research focus is dual: to study user needs and experiences of smart solutions, and to de-velop and test technology needed for such solutions. Together, separate pilots in different cities around Finland create a living lab ecosystem for develo-ping and testing innovative solutions. Each pilot has a focus in a different theme or application con-

Light & Engineering Vol. 26, No. 2
61
text. The themes include interactive and commu-nicative lighting and digital services; traffic safety in a residential area; smart lighting and services for kids and young people; and presence-based light-ing in bicycle routes and road environments. The pilots are realized in 2016–2018. As the pilots have varying research focuses and contexts, the SenCi-ty project provides an excellent opportunity to test different kind of evaluation methods in real world contexts.
1.2. Aims and Content
In the paper, three pilot case studies are in-troduced presenting objectives, contexts, smart lighting applications, and methods that are used in evaluation of users’ experiences. The evalua-tion methods, which are tailored to each pilot con-text, include questionnaires, insitu interviews and observations, evaluation probes, and system data analyses. The applicability of the selected and tested methods to each pilot and its specific context, research target, and user group is discussed reflect-ing the process and achieved results.
2. EVALUATION OF INTELLIGENT LIGHTING IN URBAN CONTEXTS – PREVIOUS RESEACH ON USERS’ EXPERIENCES
There has not yet been wide research of the ex-perience of intelligent lighting in real-world urban contexts, as the lighting solutions are international-ly still in the process of development and piloting. However, some previous research exists and some examples can be mentioned here. The research con-cerning experiences of adaptive and intelligent ur-ban lighting has covered aspects of safety [3,4], social experiences [5, 6, 7] meanings, and [6, 7] at-mosphere and aesthetic experience [5, 6], partici-pation [6], and communication [7]. Most of those aforementioned aspects have also been relevant in experiences of media architecture and described, for example, in [8] and [9]. The evaluation methods that have been used, include, for example, a psycho-physical method based on questionnaires [3], and semi-structured interviews and observation [6].
Our previous research has related to understand-ing of the multifaceted and emplaced experiences of adaptive and intelligent urban lighting, cover-ing all the aforementioned aspects [1, 10]. In our re-
al-world studies in park and streetscape environ-ments, we have applied qualitative methods inspired by ethnographic research. These include the expe-rience gauging walking interview method, which means in situ participant observations coupled with a semi-structured walking interview [1,10]. Be-sides this, we have applied semi-structured inter-views and questionnaires in electronic and printed form [11].
3. EXPERIENCE EVALUATION IN THE SENCITY PILOTS
In this section, we describe the arrangement and evaluation procedures and methods of three pilot projects, and in the next one, the methods are reflected and discussed. Two of the case stu-dies are related to the use of intelligent lighting in different kinds of traffic areas, having emphasis on aspects of visibility, traffic and movement safe-ty, and sense of security. The last case study pre-sents a more complex view to the issue of intelli-gent lighting in smart city contexts: How lighting can serve citizens on various levels of experience and what kind of digital services can lighting infra-structure provide for the users? The SenCity project is still on-going and all of the evaluation proces-ses are not yet finished. Thus, the presentation and discussion of methods is based to some extent still on evaluation plans.
3.1. Case Study 1: Intelligent Road Lighting in a Housing Area, Salo
The first case study concerns an intelligent light-ing pilot in a housing area in Salo, where presence sensitive roadway lighting, adapting both to the mo-tor vehicles using the road and to the measured traf-fic density along it, was tested. Users’ experiences of the lighting have been collected with the help of questionnaires from the community of about 1000 households using the road in their daily traffic as well as from other interested inhabitants of the city. The evaluation was accomplished in three parts. These were connected with different phases in the development of the lighting system, the publicity of the project, and how much information was pub-lished about it.
In the first phase (23.1.–5.2.2017), the new light-ing was controlled in a very basic way (Daylight le-vel based control): during the bright period of the

Light & Engineering Vol. 26, No. 2
62
day, lights were turned off, and during the dark pe-riod, they were on at 100 % control level. The sen-sor detected the threshold illuminance level and turned lights on and off automatically. During the second phase (6.2.–26.2.), this basic control con-tinued but a presence-based dynamic control was added. The lighting was controlled dynamically so that it was always brightened around a car to the maximum control level of 100 %, and in those parts of the road where the traffic was absent, it was dimmed down to 20 % control level. The dimming and brightening was done softly using 3 seconds ramp. The bright area around a car consisted of five streetlights: the one which detected the car with PIR (passive infrared) sensor and two forward and two backward. In the third phase (lighting control from 6.3. onward, questionnaire 19.6.–2.7.), a third con-trol method was introduced along the two former ones, based on the measurement of traffic density. Now the lower control level of lighting was adapt-ing to the amount of traffic detected along the route. When the traffic was dense, for example, during the commutation periods in the morning and in the evening, the control level of lighting was dropped to 70 % on those parts of the road were there was no traffic. With the moderate traffic, the level was 40 %, and with the lowest traffic during the night, it was 20 %.
In the first and in the second phase, the question-naires used were almost identical. Before answering to the questions, the participants were asked to drive the road with test lighting on during the dark peri-od of the day. There was no sidewalk on the side of the collector road, so we were not able to gain feed-back from walkers and cyclists. We asked about the answerers’ use of the road and conditions on it dur-ing the driving when they eva luated lighting, as the background information. Other questions con-cerned overall impression of lighting; colour of lighting; amount of lighting on the road surface and on the environment; evenness of lighting; and glare. The participants were also asked how well they could see the roadway and other people mo-ving on the road or in the environment. They could also comment what good was in the lighting, and whether there was something that bothered them in it. In addition, they were asked if they had no-ticed any changes in the lighting during different times of the day or during driving the test route. The people answering to the second questionnaire were asked whether they had noticed any change
in lighting after the first questionnaire. Most of the questions were based on rating on a scale of 0 to 5 and with a possibility to comment freely the subject in question.
During the first two phases, the participants were not given any information about the new lighting in the area except that it was realized with LEDs and that the control of lighting was develo-ped during the winter and spring. In the first two phases, we wanted to gain feedback of the genu-ine experiences on site, unaffected by any previ-ous knowledge. In the third phase, our approach was totally different: the participants were given detailed information of the three different control methods of lighting that had been tested. At this phase, we were more interested in the participants’ attitudes towards lighting in general and especial-ly towards intelligent lighting and the three tested control methods. The influence of the shared infor-mation on users’ experiences, attitudes, and values was also interesting to us. At this phase, the parti-cipants were not specifically asked to visit and ob-serve the lighting on site. During the third ques-tionnaire, outdoor lights were completely turned off except for a couple of hours in the dead of night, be-cause of the long daylit periods in northern latitudes during the summer months.
For information sharing needs we had de-signed and developed a test version of an urban dashboard – the City Monitor for Salo [12]. In the dashboard web page, dynamic visualization of the lighting behaviour, scalable charts illustrating the average lighting and energy consumption le-vels, and textual descriptions of each lighting con-trol type were presented (http://sencity.cloudapp.net:8888/). The visualization of adaptive lighting behaviour was realized in the form of a dynamic light map, presented on the aerial photograph of the housing area with dynamically altering illus-trations of light distribution along the routes. The interface was interactive so that the users could themselves change between different control me-thods and zoom to different time spans of the cho-sen date. The PIR sensor data of a single date (8.2.) was used for simulating lighting behaviour with the three different control methods, allowing com-parison of the energy consumption [12]. The third questionnaire, both in a electronic version and a printed one, contained the same information but in picture and textual mode, without interactive and dynamic simulations.

Light & Engineering Vol. 26, No. 2
63
3.2. Case Study 2: Presence-Based Lighting on a Light-Traffic Route, Helsinki
The second case study concerns evalua-tion of presence-based lighting on a lighttraffic route in Siltasaari housing area in Helsinki. In this still on-going pilot, the target is to find out what kind of a detailed lighting behaviour is suitable for presence-based lighting on routes used by pedes-trians and cyclists. The aim is to design and test an optimal lighting behaviour, which saves substan-tial amounts of energy without lessening traffic or moving safety, or the sense of security of route us-ers during the dark. The piloted intelligent system has the ability of detecting the direction of move-ment of route users. Thus, the lighting control can be adapted to this information so that the lighting is brightened further ahead a walker or a cyclist than behind.
In the evaluation, two well-designed pres-ence-based lighting behaviours will be tested and compared. The one will be designed to be percepti-ble by route users and the other to be imperceptible by them, changing the distance how far ahead the route users the lighting is brightened. Lighting will be dimmed to 20 % control level in those parts of the route, where no-one is moving, and brightened to 100 % control level around the route users. The brightening and dimming is done softly. Feedback of the experiences will be collected on site with the help of a questionnaire and a short, structured inter-view. In addition, questionnaires will be delivered to the apartments near the route, which have a view towards it, in order to find out how presencebased lighting is experienced from the interiors. For ex-ample, can dynamic changes in lighting cause dis-turbance to the inhabitants?
We conducted a preliminary evaluation in order to test our method, during two nights in the begin-ning of April 2017. We had invited participants from educational institutions for young adults around the test site. Altogether we had ten participants, two of them being primary school and high school aged children, who came with their parents. The evalu-ation protocol was arranged so that we had three interviewers with questionnaires, standing in the meeting point that was located in the mid-point of the route. First, we had a short introductory discus-sion with each participant, where we collected the background information. After that, each partici-pant was asked first to walk to the one end of the
test route and back. At this point, the first interview and filling of questionnaire was done. Then a par-ticipant walked to the other end of the route and came back for the second part of the interview and questionnaire. Each participant was walking and in-terviewed alone. The lighting control was designed so, that in the other half of the route, the brightened area in front of a walker was longer than in the se-cond half of the route, and respectively, the first type of lighting behaviour intended to be impercep-tible and the second type intended to be perceptible. The evaluation was conducted from 9 pm to 10 pm, when there was not many other users of the route and it was dark enough outdoors.
The questions after each lighting type concerned the general impression of lighting; amount of light-ing; possible sensations of glare; visibility of the surface of the route; visibility of other people; and visibility of surrounding environment. There was also two questions regarding safety: one on the safety of movement and the other on the feeling of safety. Most of the questions were asked based on rating on a scale of 0 to 5 and with a possibili-ty to add comments of the subject in question. The participants were also asked what was good about the lighting and whether there was something about the lighting that bothered them. Finally, they were asked if the lighting changed in any way as they were moving along the route, and if it did so in their opinion, they were asked to describe it and tell at which point they noticed something.
3.3. Case Study 3: Intelligent lighting with services in the Harbour Promenade, Lahti
In Lahti, a lake harbour promenade is being de-veloped into an active recreational environment for citizens through introducing there intelligent light-ing and new digital services. The 1.5 km long pe-destrian route spans from the Sibelius music Hall in the main harbour area towards Sports and Fair Centre in the other end. The area has an interesting history with an important inland harbour, rail traf-fic, and industry.
The new, intelligent lighting for the area was devised with the help of a user-centric design and development process with city representatives, business partners, researchers, and users of the area. For the process and participatory methods, see [13]. The process is still on-going as the deve-lopment of the area and its lighting is continuing.

Light & Engineering Vol. 26, No. 2
64
TAB
LE I
. An
alys
is o
f Eva
luat
ion
Cas
e S
tudi
es
Cas
eS
tudy
Anal
ysis
of E
valu
atio
n C
ase
Stu
dies
Con
text
& E
xper
ienc
e A
spec
tsM
etho
dsS
ucce
sses
Cha
lleng
esD
evel
opm
ent I
deas
1
Roa
dway
:–
Visu
al im
pres
sion
– Li
ghtin
g qu
ality
– V
isib
ility
– Pe
rcep
tibili
ty o
f lig
htin
g be
havi
our
– Tr
affic
safe
ty–
Atti
tude
s & v
alue
s–
Acc
epta
nce
- Ele
ctro
nic
and
prin
ted
ques
tionn
aire
– R
atin
g sc
ales
and
ope
n qu
estio
ns–
Driv
ing
and
obse
rvin
g re
al-w
orld
road
with
two
light
ing
type
s–
Urb
an d
ashb
oard
for i
n-fo
rmat
ion
shar
ing
- Goo
d sa
mpl
e:Ph
ase
1: 1
30 p
eopl
ePh
ase
2: 1
06 p
eopl
ePh
ase
3: 5
2 pe
ople
– M
otiv
ated
par
ticip
ants
– Sh
arin
g of
info
rmat
ion
was
val
-ue
d by
the
parti
cipa
nts
– C
ombi
natio
n of
ratin
g sc
ales
an
d co
mm
ents
– El
ectro
nic
and
prin
ted
ques
tionn
aire
s
Com
para
bilit
y of
resu
ltsw
eath
er c
ondi
tions
traffi
c de
nsity
– Te
chno
logy
bar
rier w
ith
the
urba
n da
shbo
ard
and
sim
ulat
ions
Wea
ther
con
ditio
ns m
ore
easy
to c
ontro
l in
the
autu
mn
– O
bser
vatio
n tim
e fix
ed to
lo
w tr
affic
situ
atio
n–
Dev
elop
men
t of t
he
dash
boar
d ac
cord
ing
to th
e fe
edba
ck
2
Lig
ht tr
affic
r out
e:–
V isu
al im
pres
sion
– Li
ghtin
g qu
ality
– V
isib
ility
– M
ovem
ent s
afet
y–
Sens
e of
safe
ty–
Dis
turb
ance
Int
ervi
ew w
ith q
uest
ion-
naire
on
site
– C
ompa
rison
of t
wo
light
ing
type
s in
diffe
rent
pa
rts o
f the
rout
e–
Que
stio
n- n
aire
s del
ive-
red
into
nea
rby
apar
tmen
ts
Com
bina
tion
of ra
ting
scal
es a
nd
com
men
ts–
Mot
ivat
ed p
artic
ipan
ts–
Goo
d tim
ing
in th
e la
te e
veni
ng
- Attr
actin
g en
ough
par
tici-
pant
s for
a g
ood
sam
ple,
in th
e te
st e
valu
atio
n 10
par
ticip
ants
– In
fluen
ce o
f a d
iffer
ent c
on-
text
on
the
expe
rienc
e–
Rea
l-wor
ld c
halle
nges
of t
he
sens
or te
chno
logy
: win
d an
d ve
geta
tion
– Pe
rcep
tibili
ty o
f lig
htin
g be
havi
our
Co
oper
atio
n w
ith lo
cal
scho
ols a
nd se
nior
serv
ice
cent
re, d
iffer
ent a
ge g
roup
s (te
ache
rs, p
upils
, par
ents
, se
nior
s)–
The
sam
e te
st ro
ute
for a
ll lig
htin
g ty
pes
3
Har
bour
Pro
men
ade:
– In
tera
ctio
n an
dpa
rtici
patio
n–
Com
mun
icat
ion
and
info
rmat
ion
– So
cial
exp
erie
nce
– A
tmos
pher
e–
Mov
emen
t saf
ety
– Se
nse
of sa
fety
- Sem
i-stru
ctur
ed in
ter-
view
and
obs
erva
tion
on
site
, exp
erie
nce
gaug
ing
– Ev
alua
tion
prob
es–
Syst
em d
ata
anal
ysis
– Q
uest
ionn
aire
for s
er-
vice
use
rs
Part
icip
atio
n pr
oces
s and
eva
lu-
atio
n of
his
tory
aug
men
tatio
n:–
Mot
ivat
edpa
rtici
pant
s–
Con
text
ual
know
ledg
e an
d id
eas
Com
plex
real
wor
ld e
nviro
n-m
ent a
nd e
xper
ienc
es–
Tech
nolo
gica
l cha
lleng
es o
f th
e pi
lot
Util
izin
g ur
ban
dash
boar
d in
info
rmat
ion
shar
ing
and
eval
uatio
n
Light & Engineering Vol. 26, No. 2
65
In the final design, smart lighting is employed, be-sides for creating energyefficient and safe envi-ronment with good visibility, for activating and engaging, artistically communicative and inform-ative purposes. Four sub-areas of design area with different kinds of characters were recognized, and supporting lighting and service concepts for them were designed: an active event promenade by the harbour; a historical rail track promenade in between two lakes; a dangerous crossing area of a busy road; and the backyard-type of area with small-scale industry in the vicinity of the sports and fair centre. The final solution combines even-ly distributed neutral white LED lighting, which is dimmed when no one is moving along the route, with an atmospheric play of dynamically con-trolled light dots on the path, capable of having co-lours, for example, for communicative purposes or seasonal themes.
The lighting infrastructure will be a combina-tion of intelligent LED route lighting with PIR sen-sors, and effect lighting by RGBW LED spotlights and DMX control. Additionally, base stations for a free WiFi connection, webcameras, loudspeak-ers, and assembly spaces for extra sensors will be integrated in the smart, wooden lighting poles. Thus, the ensemble will form a development plat-form for smart city services. The first phase of the project will be finished by the autumn 2017 and the rest during the year 2018. The participation process will continue in the autumn 2017 with a question-naire about the needs and ideas for using the intel-ligent lighting system for digital services.
A history augmentation application was pilot-ed and evaluated with users in November 2016, as the idea of presenting information about the histo-ry of the area through a service came up in the par-ticipation process. The evaluation was conducted with a testing session with a semi-structured in-terview and observation on site. When the lighting design will be realized and applied in services, for example in a light game application and in com-municative purposes, further evaluation of experi-ences will be conducted. A suitable method could be, besides interviewing and observing on site, the evaluation probes method [14], which we have de-veloped in our earlier research. It is inspired by cultural probes methodology [15], which was al-ready applied in the user-centric design process of the lighting [13].
4. REFLECTION OF THE EVALUATION METHODS
In the Table 1, we have summarized a reflec-tion of evaluation processes of the case studies, from the following viewpoints: 1) perspectives of experience aspects that are of specific interest, 2) evaluation methods, 3) successes we encountered, 4) challenges or problems detected, and 5) further ideas for development of methods.
The case study evaluations, the preliminary and the final ones, have been successful in many ways and provided us with interesting research material. Additionally, the challenges have aided us to deve-lop the methods. In the case 1, involving a commu-nity with a close contact to the research area helped us to gain an excellent sample of answers from mo-tivated participants. In the case 3 as well, we have already a group of participants who have been in-volved in usercentric design process. With case 2, we can expect challenges in attracting enough par-ticipants for a good sample, especially if we want to interview both walkers and cyclists. Communi-ty-oriented approach with co-operation with neigh-bouring schools and the local senior service centre will be applied.
Real-world studies are challenging due to the complexity of environments and experiences, which makes the research environment and situations not easily controllable. According to our experience, qualitative research methods are usually well suit-ed to them as they are robust. Thus, with case 3, the plan is to apply a combination of qualitative me-thods. Evaluation probes [14] let the participants experience the site and give feedback in their own time without a presence of a researcher. On the oth-er hand, interview and observation on site, in a form of experience gauging walking interview [1,10], can as a more interactive method reveal other aspects of experience. However, in the cases 1 and 2, we are also targeting to get some quantifiable data and large enough sample for analysis. For that purpose, the free-form comments supported well the rating scales and were essential in some parts in inter-pretation of results as the numbers only could eas-ily have been misinterpreted. This was the situa-tion with the case 2, where we realized from the comments that differences in the two parts of the route were influencing more the answers than the differences in lighting. This notion has led us to ad-just our research protocol.
Light & Engineering Vol. 26, No. 2
66
Using both printed and electronic questionnaire proved to be a good solution as it enabled parti-cipants of different age and technological abilities to take part. In the case 1, the sharing of informa-tion about intelligent lighting solutions was appre-ciated by many participants and they gave positive feedback of the interesting study and the ability to participate in the development of lighting in their city. Even though the shared information was val-ued, there was also some critical comments of the dashboard details and some feedback that it did not work. The risk of technology barrier and usabili-ty issues should be solved in further development. Nevertheless, this kind of bidirectional learning process is essential in participatory design and re-search and a good way to engage people in studies and in developing their communities.
ACKNOWLEDGEMENT
SenCity Project is funded by TEKES The Finn-ish Funding Agency for Innovation and by partic-ipating cities (Helsinki, Lahti, Oulu, Raahe, Salo, and Tampere), companies (C2 Smartlight, Elisa, GreenLED, Misal, Nokia, and Valopaa), and re-search institutions (University of Oulu and VTT Technical Research Centre of Finland). The authors gratefully acknowledge S. Kourunen, T. Österlund, T. Pukinkorva, and Lê Anh Huy from the Univer-sity of Oulu and E.M. Sarjanoja, R. Vääräniemi, J. Eskeli, M. Hakkarainen, and P. Suorsa from VTT, and S. Huuskonen from Aalto University for their contributions to the case study pilot projects.
REFERENCES
1. H. Pihlajaniemi, “Designing and experiencing adaptive lighting. Case studies with adaptation, inter-action and participation,” Doctoral thesis, University of Oulu, Acta Universitatis Ouluensis, H3 Architec-tonica, 2016 [Online]. Available: http://jultika.oulu.fi/Record/isbn978–952–62–1090–2.
2. H. Pihlajaniemi, E. Juntunen, A. Luusua, M. TarkkaSalin and J. Juntunen, “SenCity – Pilot-ing Intelligent Lighting and User-Oriented Services in Complex Smart City Environments,” in Proceedings of eCAADe 2016, pp. 669–680.
3. V. Viliūnas, et al. “Subject ive evalua-tion of luminance distribution for intelligent outdoor lighting,” Lighting Research & Technology, 2014, 46(4), pp. 421–433.
4. A. Haans and Y. A. de Kort, “Light distribution in dynamic street lighting: Two experimental studies on its effects on perceived safety, prospect, concealment, and escape,” Journal of Environmental Psychology, 2012, 32(4), pp. 342–352.
5. D. Casciani, “Urban social lighting. Exploring the social dimension of urban lighting for more sustainable urban nightscapes,” Doctoral dissertation. Politecnico di Milano, Dipartimento di design, 2014.
6. E.S. Poulsen, A. Morrison, H.J. Andersen and O.B. Jensen, “Responsive lighting: the city becomes alive, “ in Proceedings of the 15th international confe-rence on Human-computer interaction with mobile de-vices and services 2013, ACM, pp. 217–226.
7. S. Seitinger, “Liberated pixels: alternative narra-tives for lighting future cities,” Doctoral dissertation, MIT, 2010.
8. A. Wiethoff and S. Gehring, “Designing interac-tion with media façades: a case study,” in Proceedings of the Designing Interactive Systems Conference 2012. ACM, pp. 308–317.
9. J. Fritsch & M. Brynskov, “Between experience, affect, and information: Experimental urban interfaces in the climate change debate,” in From Social Butter-fly to Engaged Citizen: Urban Informatics, Social Me-dia, Ubiquitous Computing, and Mobile Technology to Support Citizen Engagement, M. Foth, L. Forlano, C. Satchell and M. Gibbs, Eds. The MIT Press, 2011, pp. 115–134.
10. A. Luusua, H. Pihlajaniemi, J. Ylipulli, “North-ern Urban Lights: Emplaced Experiences of Ur-ban Lighting as Digital Augmentation,” in Architec-ture and Interaction, N. Dalton, H. Schnädelbach, M. Wiberg and T. Varoudis, Eds. Human–Comput-er Interaction Series, Springer, Cham, 2016, pp. 275–297 [Online]. Available: https://link.springer.com/chapter/10.1007/978–3–319–30028–3_13.
11. H. Pihlajaniemi, A. Luusua, M. Teirilä, T. Öster-lund and T. Tanska, “Experiencing participatory and communicative urban lighting through LightStories,” in Proceedings of the 4th Media Architecture Biennale Conference 2014: Participation, ACM, pp. 65–74.
12. H. Pihlajaniemi, A. Luusua, E.M. Sarjanoja, R. Vääräniemi, E. Juntunen and S. Kourunen, “SenC-ity City Monitor as a platform for user involvement, innovation and service development,” in Proceedings of eCAADe 2017, in press.13.
13. H. Pihlajaniemi, S. Huuskonen, Lê Anh H. and E. Juntunen, “Smart Lighting for Urban Experienc-es – Engaging Users for Better Services,” in Proceed-

Light & Engineering Vol. 26, No. 2
67
ings of PLDC6th Professional Lighting Design Conven-tion 2017, in press.
14. A. Luusua, J. Ylipulli, M. Jurmu, H. Pih-lajaniemi, P. Markkanen and T. Ojala, “Evalua-tion probes,” in Proceedings SIGCHI Conference
on Human Factors in Computing Systems 2015, New York, NY, USA, ACM Press.
15. W. Gaver, T. Dunne and E. Pacenti, (1999) “Cul-tural probes,” Interactions, 1999, 6(1), pp. 21–29.
Henrika Pihlajaniemi, M. Sc. (Arch.), D. Sc. (Tech.), researches and lectures Architectural and Urban Lighting in the Oulu School of Architecture, University of Oulu. Her research interests include especially adaptive and intelligent lighting, participatory design and users’ experiences. In 2016, she defended her doctoral thesis “Designing and experiencing adaptive lighting – Case studies with adaptation, interaction and participation”. Since 2017, she works as a post-doctoral researcher funded by the Academy of Finland, researching intelligent lighting and well-being in northern learning environments, and, additionally, she works as a lighting design consultant in her architectural office (M3 Architects)
Anna Luusua, Dr. Tech., Architect, is employed as a post-doctoral researcher at the Oulu School of Architecture, where she also defended her Ph.D. thesis “Experiencing and Evaluating Digital Augmentation in Public Urban Places” in 2016. Her research interests revolve around the themes of user experience, participatory design and methods, urban technology and urban design
Eveliina Juntunen received the M. Sc. (Tech.) and D. Sc. (Tech.) degrees in electrical engineering from the University of Oulu, Finland, in 2004 and 2014 respectively. In 2004, she joined VTT Technical Research Centre of Finland where she works as a Senior Scientist in the sensing and integration research area. Her research interests are in the area of smart system integration, packaging and thermal management. Since 2007, she has been focusing on these topics from the LED lighting point of view

68
Light & Engineering SvetotekhnikaVol. 26, No. 2, pp. 68–74, 2018 No. 2, 2018, pp. 28–32
EFFECTIVE RADIANT FLUX FOR NON-IMAGE FORMING EFFECTS – IS THE ILLUMINANCE AND THE MELANOPIC IRRADIANCE
AT THE EYE REALLY THE RIGHT MEASURE?*
Kai Broszio, Martine Knoop, Mathias Niedling, and Stephan Völker
Lighting Technology Technische Universität Berlin, Germany [email protected]
* On basis of report at the European conference LUX EUROPA 2017, Ljubljana, Slovenia, 1820 September
ABSTRACT
1Research indicates that intrinsically photosen-sitive Retinal Ganglion Cells are not evenly dis-tributed or evenly sensitive throughout the retina. Still, most research looking into non-image forming (NIF) effects uses an integral measured quantity, il-luminance or melanopic weighted irradiance, to rep-resent the amount of light at the participants’ eye level. This paper describes a theoretical approach to define the effective radiant flux for stimulating the ipRGCs, taking into account a spatially resolved sensitivity. Research on retinal sensitivity is scares and not yet substantial, but the methodology can easily be adopted when areas of specific sensitivity are set. Preliminary results indicate that, with simi-lar vertical illuminances and spectral power distri-bution, typical office lighting solutions might have a lower NIF effectiveness than settings with higher luminances in the central part of the field of view. This could explain why research on NIF effects is inconclusive, even though reported lighting condi-tions are similar.
Keywords: inferior light exposure, nasal light exposure, NIF effects, office lighting, retinal sensitivity
I. INTRODUCTION
Since the discovery of the intrinsically photo-sensitive Retinal Ganglion Cells (ipRGCs) in 2002,
nonvisual effects or nonimage forming (NIF) ef-fects of light have become increasingly important in lighting research, development and design of lighting solutions. In this, lighting is, for example, used to increase alertness or sleep quality, to re-duce desynchronization of the circadian rhythm or to treat seasonal affective disorders. The majority of the research looks into dependencies of amount, spectral power distribution, length and temporal dis-tribution of light stimuli. Not in focus but also of in-terest seems to be the dependency on directionali-ty and position of the light source, as only a small number (less than 1 %) of the retinal Ganglion Cells are photosensitive [1], and they are not evenly dis-tributed throughout the retina (review in [2]).
Only a few publications on the impact of spatial light distribution include the description of lighting conditions in the experimental setup. The majority of these studies were conducted between 1992 and 2005 (review in [3]). The offered lighting con-ditions differed greatly from one study to another. They ranged from 5 to 1000 lx, vertical illuminance at eye level, with varying colour temperature from warm white to cool white, realized by polychromatic light sources; fluorescent lamps, halogen lamps or LEDs. Partial retinal exposure was realised by using light boxes at defined positions in the field of view, or applying modified eye shields on subjects looking into a uniformly lit half dome. All studies took place at night time, sometime between 22:00 and 3:30. The lighting conditions were offered for

Light & Engineering Vol. 26, No. 2
69
60–240 minutes and melatonin suppression was used to study the impact of light source size and / or position. The number of participants per study ranged from 6 to 32, with varying age.
The studies suggest that large sources are more effective than small sources [4]. Binocular light ex-posure realises a higher melatonin suppression than monocular light exposure (spatial summation in [5, 6]). Additionally to that, the studies indicate that, in human beings, nasal exposure is more effective than temporal exposure [7, 8]. Inferior retinal light exposure seems to induce a greater response than superior exposure [9, 11]. Piazena et al. partly con-firmed these findings [12]. Superior warm white light exposure (800 lx, 2666 K) resulted in the re-duced and delayed melatonin suppression in compa-rison to inferior exposure realising the same lighting level at the eye. However, similar cool white light levels (6060 K) caused comparable NIF responses for both inferior and superior light exposure.
Considering the above mentioned, it is question-able if illuminance levels or melanopic irradiance levels, currently referred to in studies with respect to NIF effects of light, are adequate parameters in terms of comparability, being integrally measu-red values of the full visual field. Retinal illuminan-ce would respect human anatomic restrictions [13], and can be measured with adjusted illuminance sen-sors (e.g. [14, 15]). Nonetheless, a more distinct subdivision within the human field of view might be required. The number of studies is too small to de-fine areas with different ipRGC sensitivities. De-spite this, the suggestion for approximation areas
of “no”, “little” and “good” effectiveness is given by FGL (Fördergemeinschaft Gutes Licht, 2014), Fig. 1, [16].
The aim of the presented study is to look into the range of the spatially resolved, effective radiant flux stimulating the ipRGCs for different distribution of the incident light under a constant (full visual field) illuminance level at the eye.
2. METHODOLOGY
The study described in this paper uses a theoreti-cal approach to evaluate the impact of higher sensi-tivity for nasal and inferior light exposure. For this, a methodology to evaluate the spatially resolved il-luminance contribution of defined areas in the field of view to the overall vertical illuminance at the eye was defined. Luminance images are converted into matrices containing luminance values for each pixel. Using another matrix that holds the opening angle ωs and an additional matrix with the tilt angle ϑ of each pixel, it is possible to calculate the illumi-nance contributions. Generally, the following equa-tion applies:
( ) , cos( ,) p sE L dϑ ϕ θ ω= ∫ (1)
where Ep is the illuminance, L is the luminance of each pixel, which position is determined by θ, φ, ωs solid angle, ϑ is the tilt angle.
The resulting matrix comprises the illuminance contribution of each pixel to the integral vertical il-luminance. Hence it is possible to define regions of interest in the field of view and to calculate the illu-minance at eye-level caused by each region.
2.1. Test Room
A complete LED backlit test room with typi-cal celloffice dimensions (5 m width, 4 m length and 2.8 m height) at the Chair of Lighting Technol-ogy of TU Berlin was used for this study. This test room is equipped with 1470 individually address-able LED panels with a size of 18 × 18 cm, cov-ered by a diffusing material. Each panel holds 36 mid-power, cool white or warm white LEDs. The correlated colour temperature (CCT) of the LED panels behind the diffusing material was measured with a ‘Specbos 1201’ spectrometer by Jeti Techni-cal Instruments. The cool white setting has approx-
Fig.1. Approximation of spatial sensitivity due to ipRGC density or sensitivity as found in a small number of studies
based on [16] with areas of “little” (yellow) and “good” (green) response to induce NIF effects

Light & Engineering Vol. 26, No. 2
70
imately 5900 K, the warm white setting 2800 K. Mixed settings have 4400 to 4500 K, depending on the used lighting scenes. The cool and warm white LED panels are arranged in a checkerboard pattern to ensure good uniformity and mixing cha-racteristics if used together as well as separately. With this installation, it is possible to set specific luminance distributions for separate fields of the walls and ceiling with different CCTs. Twelve lumi-naires in the middle part of the ceiling are designed to optimise NIF effects; offering a range between 2000–20 000 K.
2.2. Settings
Within this study, eight different luminance dis-tributions, some very similar to typical electric lighting solutions for offices, some very different, were set to realize a constant vertical illuminance of 500 lx (+/– 2.5 %) at eye level, Fig.2. This was
measured at 1.20 m above floor level by a luxme-ter MXELEKTRONIK MiniLux with a V(λ) and cosine-corrected Si-photometer head. Additionally the horizontal illumination at 0.85 m, at a fixed po-sition on the desk was measured with a cosine-cor-rected luxmeter LMT PocketLux 2. CCT of the lighting scenes ranged from 3900 K to 4900 K.
2.3. Measurement and Processing
The variable in this study, the luminance distri-bution of the eight chosen scenes, was measured by a luminance camera ‘LMK mobile advanced’ based on a CANON EOS550D by TechnoTeam GmbH equipped with a 4.5 mm object lens (circular fisheye lens) with an angle of coverage of 140°. For each setting HDR luminance images were taken.
Based on the approximation of spatial sensitivity by FGL (Fördergemeinschaft Gutes Licht) (Fig. 1), and the anatomic restrictions (e.g. light shielded by
Fig.2. Lighting scenes (a – d typical office like; e – f nontypical like)
Fig. 3. Schematic of the angles in the visual field (based on [13] and [16])

Light & Engineering Vol. 26, No. 2
71
the nose), following areas of interest were chosen to demonstrate the potential and the consequences of a spatial differentiation (Fig. 3 and Fig. 4):
• ϑ = 0° to 45° and 45° to 60°• φ = 0° to 55° and 0° to –55° (to both sides of
the direction of gaze).Light coming from region 1 (Fig. 4) illuminates
only the nasal part of the right eye’s retina. Light in region 2 causes illumination of the lower part of both retinas. Light from region 3 illuminates the na-sal part of the left eye. These angles are believed to have a good impact on NIF effects, while angles between ϑ = 45° to 60° are supposed to have only weak effect and higher angles have no effect [16]. Moreover, region 2 is of special interest since the il-lumination of both retinas is found to cause the hig-her melatonin suppression [5, 6].
3. RESULTS
The methodology was applied to the eight light-ing scenes shown in Fig. 2. For each region, the illu-minance contribution was calculated. Table 1 holds this value represented as percentage of the measu-red vertical illuminance for better comparability. The lighting scenes with light mostly coming from the ceiling (a – d) show in general low values. The ϑ equal to (0–45)° region contributes only with 10 to 26 % to the integral illuminance. If ϑ=0°extended to 60° this increases up to 44 %. On the other hand, lighting scenes (e – h), with light mostly coming from the opposite wall, have relatively high values. The ϑ =0° to 45° region contributes with 35–51 %, in the extended ϑ =0° to 60° region up to 58 %. In case region 2 gets a higher weighting, taking the findings of Wang [5] and Brainard [6] into account, the differences between lighting scenes a – d and e – h become even larger.
4. CONCLUSSION AND DISCUSSION
A luminance camera based evaluation method to determine the spatially resolved partial illuminan-ce values was developed. Here regions were chosen to fit illumination of the lower left and right eye’s nasal part of the retina and the illumination of the lower halves of both retinas simultaneously. Typical and nontypical office lighting scenes were investi-gated. Data showed that the more standard-like of-fice lighting scenes cause only weak illumination of the defined regions. Logically, lighting of the oppo-site wall leads to much higher contributions from these regions. With comparable spectral power dis-tribution and vertical illuminances, typical, electric, lighting solutions for offices will result in a lower efficiency to induce NIF effects than settings with higher vertical luminances in the central part of the field of view, such as day lit rooms or lighting solu-tions with wall washers.
It needs to be pointed out, that there are only few studies indicating differences in melatonin suppres-sion if superior or inferior halves of the retina are illuminated and even fewer showing differences in nasal and temporal parts of the retina. For now, an exact determination of regions and their respective sensitivity weighting cannot be made. Furthermore, these studies were executed at night time looking into the resulting suppression of melatonin levels. Rüger et al. already showed that suppression of me-latonin does not per se lead to reduced sleepiness when only parts of the retina are illuminated [17]. Additionally to that, these results are not direct-ly applicable for daytime responses. During day-time, the mode of action for NIF effects is still not well enough understood. Cones, with their incidents mostly in the centre of the visual field, are conside-red to influence NIF effects as well [18]. Resulting, it could be that, at least under daytime conditions, the distribution and spectral sensitivity of more than one receptor has to be taken into account.
In this respect, this method is a theoretical ap-proach. Nonetheless, it is an aspect of interest, as it could explain why some studies do find NIF effects, and others do not, even though vertical illuminances and spectral power distribution of the light sources applied are similar. In order to compare these stu-dies and to allow future adjustments to areas of in-terests and their specific sensitivities, it is proposed to look into the representation that accounts for the
Fig.4. Overview of the region in the field of view

Light & Engineering Vol. 26, No. 2
72
origin of light (e.g. by means of light incidence ac-cording to [19, 20].
Spectral power distribution was not considered in this study. Future research will look into spatially and spectrally resolved measurements, using a lumi-nance camera that includes colorimetric filters and a melanopic filter, to evaluate the consequences of spatial sensitivity on NIF effects of typical lighting conditions with varying spectral power distributions in laboratory studies as well as field studies.
ACKNOWLEDGEMENT
The authors gratefully acknowledge the contri-butions of Frederic Rudawski (Technische Univer-
sität Berlin) for software development, Alexander Lee (Technische Universität Berlin) for literature research and Tobias Porsch (TechnoTeam Bildver-arbeitung GmbH) for providing specific data on the luminance camera.
REFERENCES
1. LiTG (2015), “Über die nichtvisuelle Wirkung des Lichts auf den Menschen,” Deutsche Lichttechnische Ge-sellschaft e.V., Berlin, vol. 1, 2015.
2. C. Schierz, “Zur Photometrie nichtvisueller Licht-wirkungen,” in Proc. 2008 Symposium “Licht und Ge-sundheit”, pp. 112–123.
3. P. Teikari, “Spectral modulation of melanopsin responses: role of melanopsin bistability in pupillary
TABLE I. illuminance values
Regions
Lighting scenes
a b c d e f g h
Illumi-nance
Ev [lx] 506 511 504 500 497 500 507 496
Eh [lx] a 657 694 619 640 263 276 329 338
Ev [%] b 2.8 3.2 2.0 2.8 9.5 10.6 7.5 8.5
Ev [%] b 15.1 19.2 5.6 17.3 24.3 29.2 28.6 19.1
Ev [%] b 2.8 3.1 1.9 2.6 9.9 11.1 7.7 7.3
Ev [%] b 20.7 25.5 9.5 22.6 43.7 50.8 43.8 34.9
Ev [%] b 1.5 1.7 1.0 1.3 1.2 1.3 1.5 2.1
Ev [%] b 14.0 11.0 18.6 18.4 4.2 4.2 9.0 10.5
Ev [%] b 1.5 1.7 0.8 1.2 1.6 1.6 1.8 5.4
Ev [%] b 37.7 39.9 30.0 43.6 50.7 58.0 56.1 52.9
a. horizontal Illuminance at 0.85 mb. vertical Illuminance in percent of the luxmeter-measured value
Light & Engineering Vol. 26, No. 2
73
light reflex,” Ph.D. dissertation, Université Claude Ber-nard-Lyon I, 2012.
4. P. Novotny, P. Paulick, M.J. Schwarz, H. Plischke, “The Solid Angle of Light Sources and Its Impact on the Suppression of Melatonin in Humans,” in Proc. 2013 Hu-man-Computer Interaction. Towards Intelligent and Im-plicit Interaction Conf., Lecture Notes in Computer Sci-ence, vol 8008. Kurosu, Ed. Berlin, Heidelberg: Springer, 2013, pp. 454–463.
5. J. Y. Wang, J.P. Hanifin, M.D. Rollag and G.C. Brainard, “Ocular regulation of the human pine-al gland: The significance of total retinal exposure for melatonin suppression,” in: M.F. Holick und E.G. Jung, Ed. Boston, MA: 1998, Biologic Effects of Light 1998: Proceedings of a Symposium Basel, Switzerland Novem-ber,1998. Springer US, pp. 367–374.
6. G. C. Brainard, M.D. Rollag and J.P. Hani-fin, “Photic regulation of melatonin in humans. Ocular and neural signal transduction,” Journal of Biological Rhythms, 1997, Vol. 12, pp. 537–546.
7. E. K. Visser, D. G.M. Beersma, and S. Daan, “Mel-atonin Suppression by Light in Humans Is Maximal When the Nasal Part of the Retina Is Illuminated” Journal of Bi-ological Rhythms, vol. 14, pp. 116–121.
8. M. Rüger, M. C.M. Gordijn, D. G.M. Beersma, B. de Vries and S. Daan, “Nasal versus Temporal Illumina-tion of the Human Retina: Effects on Core Body Temper-ature, Melatonin, and Circadian Phase,” Journal of Bio-logical Rhythms, 2005, Vol. 20, pp. 60–70.
9. T. A. Lasko, D.F. Kripke and J.A. Elliot, “Mela-tonin Suppression by Illumination of Upper and Lower Visual Fields,” Journal of Biological Rhythms, vol. 14, pp. 122–125, 1999.
10. J. S. Smith, D.F. Kripke, J.A. Elliot and S.D. Youngstedt, “Illumination of upper and middle visual fields produces equivalent suppression of melatonin in older volunteers,” Chronobiology International, 2002, Vol. 19, pp. 883–891.
11. G. Glickman, J.P. Hanifin, M.D. Rollag, J. Wang, H. Cooper, G.C. Brainard, “Inferior Retinal Light Expo-sure Is More Effective than Superior Retinal Exposure in
Suppressing Melatonin in Humans,” Journal of Biologi-cal Rhythms, 2003, Vol. 18, pp. 71–79.
12. H. Piazena, L. Franke, B. Thomsen, I. Kamenzky, R. Uebelhack and S. Völker, “Melatoninsuppression mit WeißlichtLEDs – erste Ergebnisse,” in Proc. 2014 8. Symposium Licht und Gesundheit, pp. 39–52.
13. C. Schierz, “Ist die Beleuchtungsstärke am Auge die richtige Größe für biologische Lichtwirkungen?” in Proc. 2010 DIN-Expertenforum “Wirkung des Lichts auf den Menschen” pp. 7–17.
14. J. Van Derlofske, A. Bierman, M. S., Rea and N. Maliyagoda, “Design and optimization of a retinal ex-posure detector”, in Proc. 2000 International Society for Optics and Photonics – International Symposium on Op-tical Science and Technology, pp. 60–70.
15. J. Van Derlofske, A. Bierman, M. S., Rea, J. Ra-manath and J.D. Bullough, “Design and optimiza-tion of a retinal flux density meter,” Measurement Sci-ence and Technology, 13(6), 821, 2002.
16. FGL (Fördergemeinschaft Gutes Licht) (2014), “licht.wissen 19 Impact of Light on Human Beings,” [On-line]. Available: http://en.licht.de/fileadmin/shopdown-loads/1409_LW19_E_ImpactofLightonHumanBe-ings_web.pdf.
17. M. Rüger, M. C.M. Gordijn, D. G.M. Beersma, B. de Vries and S. Daan, “Weak relationships between suppression of melatonin and suppression of sleepiness/fatigue in response to light exposure,” Journal of Sleep Research, 2005, Vol. 14, pp. 221–227.
18. R. J. Lucas, S.N. Peirson, D.M. Berson, T.M. Brown, H.M. Cooper, C.A. Czeisler et al., “Meas-uring and using light in the melanopsin age,” Trends in neurosciences, 2014, Vol. 37, pp. 1–9.
19. C. Liedtke, S. Völker and M. Knoop, “The Light Direction and Directional Light – Towards a new Quan-tification of an Essential Lighting Quality Criterion,” in Proc. 2013 CIE Centenary Conf., pp.542–551.
20. M. Knoop, A. Diakite, C. Liedtke, K. Broszio, M. Niedling, “Characterisation of daylight’s spatial and spectral distribution to assess its impact on human beings, “ unpublished, presented at CIE Midterm Meeting, Jeju Island, Republic of Korea, 2017.
Kai Broszio is a Ph.D. student in the field of nonimage forming effects on humans at the Chair of Lighting Technology, TU Berlin. He studied Electrical Engineering with a specialization on lighting technology and photovoltaic and worked on the European project Energy Saving Outdoor Lighting (ESOLi). He is currently working as teaching and research assistant at the Chair of Lighting Technology. His doctoral thesis deals with the impact of directionality of light on non-image forming effects. He is a guest member of the indoor lighting expert group of the German Society of Lighting Technology (LiTG)

Light & Engineering Vol. 26, No. 2
74
Martine Knoop is a lecturer at the Chair of Lighting Technology, Technische Universität Berlin (TUB), Germany. She is responsible for research and education on indoor lighting, daylighting and colorimetry. Before taking up her assignment at the TU Berlin, she was a senior application specialist of Philips Lighting, the Netherlands and part-time visiting professor at Eindhoven University of Technology. Her current research focuses on the unique characteristics of daylight. It aims to promote and improve daylight design, as well as to develop new adaptive electric lighting solutions, to enhance user well-being and performance in interiors
Mathias Niedling is a Ph.D. student and former technical project manager, and teaching assistant at the Chair of Lighting Technology, TU Berlin. He studied Media Technology at Ilmenau University of Technology. From 2008 to 2010, he worked as a development engineer at OLIGO surface controls. His current work focuses on nonimage forming effects, glare, and outdoor lighting. His doctoral research examines the influence of glare sources spectra on discomfort and disability glare. Mathias is member of the German Institute for Standardization (DIN) and the outdoor lighting expert group of the German Society of Lighting Technology (LiTG)
Stephan Völker, Prof., studied Electrical Engineering at the Technical University Ilmenau, Germany. Afterwards, he worked there as a researcher for new high temperature plasma applications. Prof. Voelker accomplished his graduation at the Department of Lighting Technology in Ilmenau in 1999. Thereafter, he was senior engineer and senior researcher at the Hella KG. In 2002, he started working as a junior research professor for Lighting Technology in Paderborn, Germany, where he led an own research group. Additionally, he worked as a guest lecturer at the University College of London. Since 2008, Prof. Völker is full Professor and Head of the Department of Lighting Technology at the Technische Universität Berlin, Germany. His main research interests are: adaptive road lighting based on visibility, adaptive indoor lighting for design, glare evaluation of LED-luminaires and day lighting. He is the chair of CIE TC4–33 and member of CIE TC4–54 & 4–52, board member of the LiTG, member of the advisory board of FNL & DIN and member of the TWA

75
Light & Engineering SvetotekhnikaVol. 26, No. 2, pp. 75–80, 2018 No. 2, 2018, pp. 33–39
RECEPTIVE FIELD MECHANISM AND PUPILLARY LIGHT REFLEX FOR THE ASSESSMENT OF VISUAL DISCOMFORT*
Gertjan Hilde Scheir, Peter Hanselaer, and Wouter Rita Ryckaert
Light &Lighting Laboratory KU Leuven, ESAT Ghent, Belgium E-mail: [email protected]
* On basis of report at the European conference LUX EUROPA 2017, Ljubljana, Slovenia, 1820 September
ABSTRACT
1Discomfort glare is defined as glare that cau-ses discomfort without necessarily impairing the vision of objects. Traditional glare metrics fail for non-uniform luminaires. As an alternative, visual discomfort is determined by a physiological model incorporating the centresurround receptive field mechanism and the pupillary light reflex. The pupil area, controlled by the pupillary light reflex, regu-lates the retinal illuminance. A centre-surround re-ceptive field, described by a difference of Gaussi-ans, represents the visual signal. The centre excites the signal whereas the surround controls the inhi-bition. A forced choice paired comparison experi-ment involves 7 non-uniform rear projected stimuli with different spatial frequencies. Inspired by a pro-mising coefficient of determination of 0.90, the mo-del is a candidate to replace current glare metrics as UGR or VCP, especially when nonuniform lumi-naires are to be evaluated.
Keywords: discomfort glare, luminance map, receptive fields
1. INTRODUCTION
Discomfort glare is defined by the Internation-al Commission on Illumination (CIE) in the inter-national lighting vocabulary as: “glare that causes discomfort without necessarily impairing the vi-sion of objects” [1]. Ever since the beginning of the previous century, researchers have been attempt-
ing to quantify the amount of visual discomfort [2]. A multitude of glare indices have been developed. The Unified Glare Rating (UGR) is proposed by the CIE for the assessment of discomfort glare for inte-rior lighting and is included in the European stan-dard for indoor workplace environment EN12464–1 [3, 4]. The International Engineering Society of North America (IES) proposed the VCP for the as-sessment of discomfort glare [5].
Traditional glare metrics often include an avera-ge luminance level calculated from the far field lu-minous intensity distribution [3, 5]. Any nonuni-formity in luminance distribution is ignored. Since a non-uniform luminaire produces more discom-fort glare than a uniform one of equal average lu-minance, the applicability of traditional glare metrics for non-uniform light sources is under dis-cussion [6–12]. The nonuniformities of a lumi-nance distribution are accurately described by a lu-minance map [13]. With a growing market share of highly non-uniform LED luminaires for inte-rior and exterior lighting, a valid assessment of visual discomfort based on luminance maps be-comes essential.
Although some mechanisms involved in glare perception are known, sometimes already for deca-des, traditional glare formula are merely phenom-enological and lack any physiological or psycho-logical justification. In the model presented in this paper, the receptive field concept is extended with the pupillary reflex for the calculation of visual discomfort.

Light & Engineering Vol. 26, No. 2
76
The pupillary light reflex controls the retinal illu-minance as part of the adaptation process. Different formulas for the pupil size are developed [14]. Ear-ly formulas only include the luminance level of the stimulus [15–18]. Next to the luminance level, also the stimulus size is a determining factor [19, 20].
The receptive field neural pathways have been studied already from the 1930’s on [21, 22]. By physically stimulating the retina of mammals and other animals, the neuron response is directly re-corded [23, 24]. Patterns with different spatial fre-quencies invoke a neural stimulation [25, 26]. The computation of the neural stimulation forms a phy-siological basis for visual discomfort and is recently applied in lighting design [27].
In the present study, visual discomfort is cal-culated from a luminance distribution by applying a model including the receptive field mechanism and pupillary light reflex. The model is analysed with a forced choice paired comparison (PC) expe-riment involving 7 non-uniform rear projected sti-muli with different spatial frequencies.
2. METHOD
2.1. Human Visual System
The human visual system includes several me-chanisms (Fig. 1). The eye images an object plane characterized by a luminance distribution on the re-tina. The retinal illuminance is proportional to the pupil area, controlled by the pupillary light re-flex, and the object luminance. In lit environments, a constriction of the iris reduces the pupil area and limits the incident light. In dimmed settings, an iris dilation increases the pupil aperture maximizing the retinal illuminance. The pupil size ranges ap-proximately between 2 mm and 8 mm. In this pa-per, the pupil diameter is obtained from the avera-
ge stimulus luminance level and the stimulus field size [19]:
2
0.4log (5 3tanh ( ),
40sL a
D = − (1)
where D is the pupil diameter (mm), Ls the average stimulus luminance level (cd/m²), a is the stimulus field size (deg²).
The pupil area controls the retinal illuminance (Eret) by scaling the luminance distribution (L, cd/m²). For direct view, the retinal illuminance can be approximated as:
2~ ( ) .2retDE L π (2)
Seen from the back of the eye to the front, three retinal layers can be distinguished: the photore-ceptors, the layers with the bipolar and horizontal cells and the ganglion cell layer. Under photo pic conditions (Hunt, 1998), the cone photoreceptors convert the incident light into an electrical signal. Since photoreceptors are situated in the deepest ret-inal cell layer, nerve cells in other layers must be transparent. Centre photoreceptors link directly to a bipolar cell. The horizontal cells parallel to the retina connects several surround photoreceptors and also relay the signal to the bipolar cell in an in-direct path. A bipolar cell in turn transfers the di-rect and indirect photoreceptor signal to a gan-glion cell. The ganglion cell sends a pulsed signal train to the brain.
Combining the direct and indirect signals is re-sulting in centresurround receptive fields forma-tion. In an ONcentre OFFsurround receptive field, the ganglion signal is excited by the centre but in-hibited by the surround signal and vice versa for an
Fig.1. The human visual system includes the pu-pillary light reflex and receptive field mechanism

Light & Engineering Vol. 26, No. 2
77
OFFcentre ONsurround receptive field. Photore-ceptors can be part of multiple centre and/or sur-round fields [22]. A receptive field is modelled by a difference of 2dimensional Gaussian distribu-tions. Subtracting a surround Gaussian from a cen-tre Gaussian results in the total difference of Gauss-ians (DoG) receptive field pattern. When a single receptive field is uniformly illuminated, the net sig-nal will be marginal. At a sharp dark-light edge where the surround is not entirely illuminated, the centre is not maximally supressed. A receptive field consequently acts as an edge filter (Fig. 2).
A luminaire can be represented by a luminance map. To each pixel of a high definition luminance map, a luminance value and spatial coordinate in the luminaire can be attributed. A centre-surround re-ceptive field is modelled by a Mexican hat shaped difference of Gaussians (DoG), Fig.3. The diffe-rence between the maximum centre signal and ma-ximum surround signal is reflected in the weighing factor (WF). The DoG kernel is scaled and discre-tized to correspond to the retinal illuminance map resolution. A single ganglion cell receptive field signal is calculated by overlaying the DoG kernel on one specific area of the luminance map, point-wise multiplying the overlapping matrices and add-ing all obtained products. The response of all gan-glion receptive field signals in the eye is modelled by the convolution of the luminance map with the DoG kernel. The convoluted luminance map rep-resents a measure for the transmitted signal to the brain for each pixel. To count both the ON- and OFFcentre receptive field contributions, the ab-solute signal value of the convoluted luminance map is considered. The sum of all pixel signals is a measure for the total visual signal of the lu-minaire. The total number of pixels is dependent on the luminance camera field of view and the lu-minance map resolution. To normalise for the diffe-rence in number of pixels for different resolution lu-minance maps, the pixel signal is weighed with the pixel visual solid angle. A natural logarithm ac-counts for the compression mechanisms, as can be
found in multiple perception formulae [3, 5]. A cen-tre and surround field width have previously been reported [11]. The natural logarithm is arbitrarily chosen in this paper. The total calculation procedure used in this paper is summarized below:
Visual Discomfort Model =
ln ( ) ,pix retpix
C WFS Eω= − ∗∑ (3)
where ln -is the natural logarithm; ωpix is the pix-el solid angle; C is the centre kernel; S is the sur-round kernel; WF is the SurroundtoCentre Weigh-ing Factor; Eret is the retinal illuminance map; * i s the convolution operator.
2.2. Paired Comparison Visual Experiment
Seven non-uniform stimuli were rear projected on a diffusor screen creating Lambertian light dis-tributions (Fig. 4). Light patches with a luminance level of 1500 cd/m² were arranged in a 33.5 cm by 34.0 cm matrix observed from a fixed 3 m distance. While increasing the number of squares, the lumi-nous surface per square and spatial separation bet-ween squares was decreased maintaining an average luminance level 350 cd/m² and a total light emit-ting surface 0.0042 m2. The matrix consisted of 2 by 2, 6 by 6, 26 by 26, 60 by 60, 179 by 179 and 360
Fig. 3. Left: cross section of a discretised centre and surround kernel; right: a discretised difference of Gaussians (Centre minus Surround) kernel represent-ing a receptive field with a WF of 1
Fig.2. Left: at a dark area, there is no excitation by the centre and no suppression by the surround field; at a uni-
form area, the excitation of the centre is suppressed by the surround; and in both, the dark and uniform case, the net receptive field signal will be marginal; wherein at a sharp
darklight edge, the centre (or surround) is not entirely illuminated resulting in a net receptive field signal; right:
the receptive field mechanism, and consequently the human vision, acts like an edge filter

Light & Engineering Vol. 26, No. 2
78
by 360 light patches complemented with a uniform stimulus.
DALI controlled wall washers produced a uni-form background luminance ranging (40–50) cd/m² with an average luminance level 45 cd/m². In a full forced choice PC experiment, all 20 observers were shown 42 pairs and were asked to indicate the most visual discomforting stimulus per pair. The obser-vers were between 20 and 38 years old with an ave-rage of 26 years. The experiment took about half an hour and observers could ask for a break whenever they wanted. A generalised linear model produced a zscore on an interval scale for each stimulus and a standard error for visual discomfort (Fig. 3) [28, 29]. Luminance maps were measured with a LMK Labsoft luminance camera with a total reported un-certainty of 2.8 %.
3. RESULTS AND DISCUSSION
The subjective assessment with error bars is plotted against the modelled value in Fig. 5. The numbers in Fig. 5 correspond to the numbers in Fig. 4. A high coefficient of determination of 0.90 is found. The impact of the spatial luminance fre-quency on discomfort glare has been studied and recently applied in lighting design using a Fouri-er transformation [25, 27]. In this paper, this re-lation is explained by the model including the re-ceptive field mechanism and pupillary light reflex. Visual discomfort initially increases with increasing
frequency (stimuli 1 to 3). An increase in the num-ber of light patches results in an increasing amount of edges while the spatial separation decreases. In agreement with the subjective assessment, a hig-her amount of edges initially results in a higher mo-delled value since the model acts as an edge filter. The light-dark edges become less clear when the spatial separation of the light patches reaches the spatial eye resolving power. At a certain frequen-cy, the human eye will not clearly resolve the edges and the visual discomfort saturates at a maximum. In the model, the spatial separation of the stimuli reaches the dimensions of the centre-surround re-ceptive field kernel. The excitation from one light patch on the centre starts to be supressed by anoth-er light patch on the surround of a receptive field. If the spatial separation of the light patches further de-creases (increasing amount of patches), the edges will progressively appear less clear and the stimuli will steadily be seen as more uniform. The observed visual discomfort starts to decrease (stimuli 4 to 7). Stimulus 3 produces the maximum visual discom-fort corresponding to a frequency of 4.0 cycles per degree. Conservatively, any stimulus in the range between 1.0 and 9.3 cycles per degree will produce the maximum discomfort. A quadratic fit predicts a stimulus with maximum discomfort within the range of 4.0 to 9.3 cycles per degree. From the con-trast sensiti vity function (CSF) [30], a maximum frequency sensitivity between 6 and 11 cycles per degree for direct view is observed. A satisfactory agreement in the range of 6 to 9.3 cycles per degree is noted.
In the formula for the pupillary light reflex (1), only the product of luminance level and stimulus field size is considered. Also age can be included in the pupil diameter calculation, but proves to be tedious [31]. In this study, the age effect is ignored. The maximum deviation in pupil diameter from age differences is 7 % relative to the pupil diameter of the average observer.
The luminance level of some projected pixels at the edge is 50 % lower than the maximum pixel lu-minance at the centre. None of the observers report-
Fig.5. The paired comparison subjective assessment against the modelled value
Fig. 4. The 7 rear projected stimuli and subjective PC results with standard error

Light & Engineering Vol. 26, No. 2
79
ed a drop in luminance level at the edges, even when this was explicitly mentioned. The measured lumi-nance maps were used for the analysis. To test the robustness of the model, the light emitting patches were equalised in theoretical luminance maps. The light emitting surface was defined as all pixels with a luminance level above 50 % of the maximum lu-minance to include all pixels at the edge. The lu-minance level of all light emitting pixels was fixed at the average luminance level of the light emitting surface. The modelled value for the actual measured luminance maps was compared with the value for the theoretical maps resulting in a difference of only 4 %. In agreement with visual perception, the mo-del is robust to gradual changes in luminance level.
Donners et al. proposed a similar receptive field model including the pupillary light reflex to assess the discomfort glare for both office and road light-ing luminaires [32]. An additional local normalisa-tion mechanism for the dark outdoor environment had to be included since luminance contrast and range is larger in a road lighting setting than in an indoor environment. The normalisation mechanism is not included in this paper.
4. CONCLUSION
A model including the receptive field mechanism and pupillary light reflex has been developed for the assessment of visual discomfort. The pupillary light reflex regulates the retinal illuminance were a cen-tresurround receptive field describes the visual sig-nal. The model has been analysed with a paired comparison experiment involving 7 nonuniform rear projected stimuli with different spatial frequen-cies. A spatial luminance frequency in the range of 4.0 to 9.3 cycles per degree will produce the ma-ximum visual discomfort. Inspired by a promising coefficient of determination of 0.90, the model is a candidate to replace current glare metrics as UGR or VCP, especially when nonuniform luminaires are to be evaluated.
REFERENCES
1. CIE, International Lighting Vocabulary. Vienna: CIE, 1987.
2. M. Luckiesh and L.L. Holladay, “Glare and Visibil-ity,” Transactions of the Illuminating Engineering Society, 1925, 20, pp. 221–252.
3. CIE, “CIE117:1995. Discomfort Glare in Interior Lighting.” CIE: Vienna, 1995.
4. CEN, “CEN2011. Light and lighting – Lighting of work places – Part 1: Indoor work places,” Belgium, 2011.
5. IESNA, The IESNA Lighting Handbook. Ninth ed. IENSA. USA, 2000.
6. N. Hara and S. Hasegawa, “Study on Discomfort Glare Rating of the Luminaire with LED Array,” Journal of the illuminating engineering institute of Japan, 2012, 96(2), pp. 81–88.
7. H. Cai and T. Chung, “Evaluating discomfort glare from non-uniform electric light sources,” Lighting Research and Technology, 2013, 45(3), pp. 267–294.
8. L. Geerdinck, J.R. Van Gheluwe, and M. C. J.M. Vis-senberg, “Discomfort glare perception of non-uniform light sources in an office setting,” Journal of Environmental Psy-chology, 2014, 39(0), pp. 5–13.
9. T. Tashiro, S. Kawanobe, T. KimuraMinoda, S. Kohko, T. Ishikawa, and M. Ayama, “Discomfort glare for white LED light sources with different spatial arrangements,” Lighting Research and Technology, 201547(3), pp. 316–337.
10. G. H. Scheir, P. Hanselaer, P. Bracke, G. Deconinck, and W.R. Ryckaert, “Calculation of the Unified Glare Rating based on luminance maps for uniform and non-uniform light sources,” Building and Environment, 2015, 84, pp. 60–67.
11. G. H. Scheir, M. Donners, L.M. Geerdinck, M. C. J.M. Vissenberg, P. Hanselaer, and W.R. Ryckaert, “A psy-chophysical model for visual discomfort based on receptive fields,” Lighting Research and Technology, 2016.
12. G. H. Scheir, P. Hanselaer, and W.R. Ryckaert, “De-fining the Actual Luminous Surface in the Unified Glare Rat-ing,” LEUKOS, 2017, pp. 1–10.
13. CIE, “CIE205:2013. Review of Lighting Quality Measures for Interior Lighting with LED Lighting Systems.” CIE: Vienna, 2013.
14. A. B. Watson and J.I. Yellott, “A unified formula for lightadapted pupil size,” Journal of Vision, 2012, 12(10, 12), pp. 1–16.
15. L. L. Holladay, “The Fundamentals of Glare and Visibility,” Journal of the Optical Society of America, 1926,12(4), pp. 271–319.
16. B. H. Crawford, “The Dependence of Pupil Size upon External Light Stimulus under Static and Variable Con-ditions,” Proceedings of the Royal Society of London. Se-ries B – Biological Sciences, 1936, 121(823), pp. 376–395.
17. P. Moon and D.E. Spencer, “On the StilesCrawford Effect,” Journal of the Optical Society of America, 34(6), pp. 319–329, 1944.
18. S. G. de Groot and J.W. Gebhard, “Pupil Size as De-termined by Adapting Luminance,” Journal of the Optical Society of America, 42(7), pp. 492–495, 1952.
19. P. G.J. Barten, Contrast Sensitivity of the Human Eye and Its Effects on Image Quality. Vol. PM72. SPIE press book, 1999, 232.
20. P. A. Stanley and A.K. Davies, “The effect of field of view size on steady-state pupil diameter,” Ophthalmic and Physiological Optics, 1995, 15(6), pp. 601–603.
21. H. K. Hartline, “The response of single optic nerve fibers of the vertebrate eye to illumination of the retina,”

Light & Engineering Vol. 26, No. 2
80
American Journal of Physiology – Legacy Content, 1938, 121(2), pp. 400–415.
22. D. H. Hubel, Eye, Brain, and Vision. Vol. 22. New York: W.H. Freeman & Co. 240, 1988.
23. M. P. Sceniak, D.L. Ringach, M.J. Hawken, and R. Shapley, “Contrast’s effect on spatial summa-tion by macaque V1 neurons,” Nat Neurosci, 1999, 2(8), pp. 733–739.
24. J. R. Cavanaugh, W. Bair, and J.A. Movshon, “Na-ture and Interaction of Signals From the Receptive Field Center and Surround in Macaque V1 Neurons,” Journal of Neurophysiology, 2002, 88(5), pp. 2530–2546.
25. A. J. Wilkins, I. NimmoSmith, and A. Tait, “A neu-rological basis for visual discomfort,” Brain, 1984, 107, pp. 989–1017.
26. L. O’Hare and P.B. Hibbard, “Spatial frequency and visual discomfort,” Vision Research, 2011, 51(15), pp. 1767–1777.
27. A. J. Wilkins, “A physiological basis for visual dis-comfort: Application in lighting design,” Lighting Research and Technology, 2016, 48(1), pp. 44–54.
28. H. Scheffé, “An Analysis of Variance for Paired Comparisons,” Journal of the American Statistical Associa-tion, 1952, 47, (259), pp. 381–400.
29. R. RajaeJoordens and J. Engel, “Paired comparisons in visual perception studies using small sample sizes,” Dis-plays, 2005, 26(1), pp. 1–7.
30. R. Hilz and C.R. Cavonius, “Functional organiza-tion of the peripheral retina: Sensitivity to periodic stimuli,” Vision Research, 1974, 14(12), pp. 1333–1337.
31. B. Winn, D. Whitaker, D.B. Elliott, and N.J. Phillips, “Factors affecting lightadapted pupil size in normal human subjects,” Investigative Ophthalmology & Visual Science, 1994, 35(3), pp. 1132–1137.
32. M. A.H. Donners, M. C. J.M. Vissenberg, L.M. Geer-dinck, J. H.F. Van Den BroekCools, and A. Buddenmei-jer-Lock. “A psychophysical model of discomfort glare in both outdoor and indoor applications.” at 28th CIE Session. Manchester, UK, 2015.
Gertjan Hilde Scheir, Ph.D., currently works as a researcher at the Catholic University of Leuven (KU Leuven) at the Light & Lighting laboratory in Ghent. He mainly focuses on research and development projects in collaboration with industrial partners regarding the perception of light sources and materials. During his Ph.D., he studied discomfort glare from nonuniform light sources and he is a member of the CIE Joint Technical Committee JTC7: ‘Discomfort caused by glare from luminaires with a nonuniform source luminance’
Peter Hanselaer, Professor, lecturers Lighting at the Faculty of Engineering Technology of KU Leuven (Technology Campus Ghent). At present, Peter Hanselaer is the head of the Light & Lighting laboratory at the Catholic University of Leuven (KU Leuven/ESAT department). He is responsible for the topic ‘Appearance and visual perception’ and his research is focuses on the visual perception of brightness and colour, including chromatic adaptation, gloss and glare. He is the Division Editor of the CIE Division 1: ‘Vision and Colour’.
Wouter Rita Ryckaert, Professor, received the Master Degree in electrical engineering from KAHO SintLieven in 1998 and his M. Sc. degree in electrical and mechanical engineering from Ghent University in 2001. He obtained his Ph.D. at Ghent University in 2006 with a dissertation that explored the topic of the reduction of harmonic distortion in distribution networks with grid-coupled converters.Since September 2006, Wouter lectures at the Catholic University College Sint – Lieven (KAHO Sint – Lieven) which is now integrated into the new Faculty
of Engineering Technology of KU Leuven (Technology Campus Ghent). Wouter Ryckaert is responsible for the topic ‘Interior lighting and energy efficiency’ in the Light & Lighting Laboratory of the ESAT department of KU Leuven. Prof. Ryckaert also coordinates (as a board member) the lighting cluster Green Light in Flanders. This consortium, with more than 75 members, is an academicbased and governmentsupported Innovative Business Network, which brings together the most important local players in lighting and acts as a European stake holder for lighting
81
Light & Engineering SvetotekhnikaVol. 26, No. 2, pp. 81–87, 2018 No. 2, 2018, pp. 46–50
TM-30–15 AND CIE-CRI-RA: INVESTIGATION OF COLOUR RENDERING OF WHITE PC LEDS*
Karin Bieske1, Ulla Maria Hartwig1, Christoph Schierz1, Alexander Wilm2, and Carolin Horst2
1Lighting Engineering Group Ilmenau University of Technology Ilmenau, Germany 2OSRAM Opto Semiconductors GmbH Regensburg, Germany
E-mail: [email protected]
ABSTRACT
1The colour rendering properties of 21 phosphor converted LED light sources (pc LED) with diffe-rent Rf and Rg values as in the Fidelity Index and Gamut Index of the TM30–15 have been investiga-ted. Scenarios illuminated by pc LEDs, a fluorescent lamp (FL) and a tungsten halogen lamp (THL) were presented to 34 subjects. An assortment of colour-ed objects was arranged identically in two adjoin-ing booths and participants rated the test scenarios in comparison with the reference illuminant (THL). For colour quality, both indexes are reflected in the observer’s ratings. The Fidelity Index strongly cor-relates with the colour difference and colour shift perceived; the Gamut Index with the subjects’ ra-tings of the colour saturation. Participants found the best match with the fluorescent lamp (Rf = 80/ Rg = 100) to be the pc LEDs with Rf = 75/ Rg = 105 and Rf = 80/ Rg = 105.
Keywords: colour rendering, pc LED, TM30–15
I. INTRODUCTION
Nowadays, light emitting diodes (LEDs) are used more and more in indoor lighting applica-tions. In the first years, white light was produced by combining differently coloured LEDs (RGB-
* On basis of report at the European conference LUX EUROPA 2017, Ljubljana, Slovenia, 18–20 September
LEDs). Nowadays, phosphor converted LEDs (pc LEDs) are used. The light emitted by a blue LED is down-converted to light with a longer wave-length, using phosphors. This is then added to the original blue LED light, making white light. Com-monly, the converter is a mixture of different types of phosphors to achieve a certain LED spectrum, which will affect the colour rendering properties. Correct description of these properties is a prere-quisite to target setting in light source development. The current standard method of calculating these properties is the CIE colour rendering index (CRI) Ra, recommended in 1995 as CIE13.3 [1]. Studies have revealed inconsistency between this method and its rating by subjects especially in LED light-ing [2]. Attempts to improve on it go back many years. On one hand, the method of calculation has been improved in reliance on new colorimetric dis-coveries; on the other, the spectral power distribu-tion (SPD) of the light sources has been optimised, for instance by using different types of phos-phors, as this is what largely defines colour quality. In 2015, the Illuminating Engineering Society (IES) published the Technical Memorandum TM30–15, a new calculation method for colour rendering of white light sources [3]. There is international con-sensus that a single criterion is insufficient to des-cribe colour quality for this includes many aspects. TM30–15 combines colour fidelity, rated with the Rf index, and the colour gamut, rated with Rg index: this describes the area enclosed by the average chro-maticity coordinates in each of 16 hue bins. Thorn-

Light & Engineering Vol. 26, No. 2
82
ton has shown that the larger the colour gamut, the better is the colour discrimination because the chro-maticity coordinates are further apart in the colour space. There is also an assumption that light sources with larger gamut enable colours to be perceived as more saturated, more brilliant and more natural [5]. Xu assumes that the size of the area enclosed is pro-portional to the maximum possible number of co-lours that can be represented [6]. RGBLEDs are an example of LEDs with narrow SPD. They may have a large gamut index but the rendering of cer-tain colour may be inexact. It therefore makes sense to combine the two indices.
Royer has carried out an initial study of LED il-lumination in a test room with coloured objects. The illumination produces white light from seven types of tuneable, coloured LEDs with varying Rf and Rg values. The conclusion is that observers prefer LED light sources with Fidelity Rf > 75 and Gamut Index values Rg ≥ 100 [7]. In the present work, this result is examined in respect of pc LEDs.
2. RESEARCH ISSUES AND HYPOTHESES
It is hypothesised that the Royer requirements are fulfilled for white pc LEDs and that the Rf and
Rg values in TM30–15 reveal high correlation with subjective evaluation of colour rendering proper-ties on the part of observers. The present work tests whether pc LEDs with identical CIE Ra values im-prove on the subjective evaluation of fluorescent lamps.
3. EXPERIMENTAL SETUP AND METHODOLOGY
Two adjoining booths with two sections, one for the illumination unit with diffuser and another for test objects, were used (Fig. 1, left). In one booth, the light sources installed were a tungsten halogen lamp (SoLux) and a fluorescent lamp (OSRAM Syl-vania with CIE Ra = Rf = 80 and Rg = 100), togeth-er with three types of blue LED and seven diffe-rent fully converted LEDs incorporating a variety of green and red phosphors. Combining a variety of LEDs enabled various SPDs to be produced which were identical to those of white pc LEDs. 21 com-binations of LED with Rf values between 66 and 94 and Rg values between 92 and 114 were investigated in comparison with a reference, as were the FL and the THL. The reference lighting in the second booth was provided by a THL (SoLux, Rf = Rg = 100). All lighting conditions had identical luminous colours
Fig. 1. a) Experimental setup with two booths (width: 46 cm, depth: 48 cm, height: 96 cm), at the top the lighting units, curtained and exposed, and below the test objects; b) relative SPDs of the light sources: B stands for blue LED, P for fully converted LED with different types of phosphors; c) Ref. for reference illuminant (SoLux THL), THL for the Solux tung-
sten halogen lamp, FL for the OSRAM Sylvania fluorescent lamp

Light & Engineering Vol. 26, No. 2
83
(CCT = 3800 K) and the same illuminance level in the centre of the floor of the booth (E = 400 lx). This experimental setup reflects the fact that both the CIE CRI Ra and the TM30–15 are referencebased methods. Fig. 1 right shows the relative SPDs of the light sources.
The Ra values are almost identical with the Rf va-lues, differing by an average of only one point with a maximum of four. The coefficient of determina-tion for the lighting conditions tested is R² = 0.98 (Fig. 2).
An assortment of identical coloured objects was arranged equally in the two booths. The choice of objects ensured that a wide range of hue, satura-tion and lightness was covered. The chromaticity coordinates of the objects are shown in Fig. 3. They were objects from daily life: they included plants, food, consumer goods, office and printed materials, and colour rendition charts (Colour Checker). The SPDs of selected LED scenarios and the Rf-Rg com-binations are shown in Fig. 4.
There were 34 participants between 23 and 48 years old (∅ 35 ± 7 years), 10 of them women. They filled in a questionnaire, firstly evaluating the co-lour rendering properties experienced simultaneous-
ly in the two booths. This evaluation was of diffe-rences in object colour perceived under the test and the reference light source according to the criteria of colour difference (CD), saturation (S), brightness (PB), temperature (T), colour shift (CS), likeability (LA) and naturalness (NN). In addition, the subjects were asked which of the object colours matched their expectation (EP) for the objects and how they rated the overall colour quality (CQ) of the objects independently of the reference. The questionnaire is shown in Fig. 5.
The differently lit scenarios were presented in random order. There was a repeat of the test for four scenarios. The mean values and intervals of confidence (CI95 %) were calculated in respect of the subjects’ responses and of the experimen-tal parameters Ra, Rf and Rg. The coefficient of de-termination (R²) was established for the linear re-gression across the mean of the ratings. Analysis of variance and post-hoc tests were carried out for the comparison between LED light sources and the FL.
Fig. 2. Correlation between the Ra and Rf values, coefficient of determination R² = 0.98
Fig. 3. Chromaticity coordinates of the test objects in the CIE CAM02UCS when illuminated with a Planckian
radiator at T = 3800 K
Fig. 4. Spectra of selected scenarios (left and centre); Rf-Rg combinations for all scenarios in the experiments (right)

Light & Engineering Vol. 26, No. 2
84
4. RESULTS
There is a diagrammatic summary of the ques-tionnaire results in Fig. 6. The figures used are mean values and bares are intervals of confidence across all subjects (N = 34).
It can be seen in the diagrams and from the coef-ficients of determination for the linear regression R² in Fig. 6 and from Table I, that subjective colour quality rating is indeed a multi-dimensional prob-lem and that both indices, Rf and Rg, are important aspects. While the Rf value gives a good descrip-tion of colour difference, colour shift and the per-ception of colour as warmer or cooler in compari-son with the reference light source, the Rg value is an explicit reflection of saturation rating. Whether a scenario is perceived to be likeable depends very much on how saturated the colours appear. Both indices are important in the rating of naturalness. At constant Rf value, pc LEDs have a more like-able and saturated effect the higher the Rg value up
to a certain point. As the Rf value rises, so does the subjective colour rendering rating. The fidelity in-dex Rf correlates very strongly with the CIE Ra va-lue, so that here both indices are similarly applica-ble. Responses to the question on expectation of the colour of objects related to those seen under the test and reference light sources are shown on the left Fig. 6. The diagram shows the absolute frequen-cy with which the object colours seen match those expected. Responses were given as to whether this was true for a single scenario in one of the booths (either the test or reference booth), or for both, or for neither. Represented is the “both” response has been shared in the Fig. 7 between the test and refe-rence scenario.
As shown in the diagram, the colours of the objects are not better than the subjects’ expecta-tion when the LED light source tested has values Rf < 90 and Rg ≤ 100. LED light sources with Rf ≥ 80 and Rg = 110 are rated as better than the reference il-luminant. The FL (Rf = 80, Rg = 100) investigated is
Do you perceive a colour difference between the objects in the left booth and those in the right booth?
Colour difference (CD) 1 = none 2 = small 3 = moderate 4 = great 5 = very
great
How do you find the colours of the objects in the left booth in comparison to those on the right hand side?
Saturation (S) 1 = very saturated
2 = somewhat saturated
3 = no diffe-rence
4 = somewhat unsaturated
5 = very unsaturated
Brightness (PB) 1 = very bright
2 = somewhat brighter
3 = no diffe-rence
4 = somewhat darker 5 = very dark
Temperature (T) 1 = very warm
2 = somewhat warmer
3 = no diffe-rence
4 = somewhat cooler 5 = very cool
Colour shift (CS) 1 = none 2 = small 3 = moderate 4 = large 5 = very large
Likeability (LA) 1 = very nice 2 = somewhat nicer
3 = no diffe-rence
4 = somewhat less nicer
5 = much less nice
Naturalness (NL) 1 = very natural
2 = somewhat more natural
3 = no diffe-rence
4 = somewhat less natural
5 = very unnatural
In which booth do the colours of the objects better match your expectation?
Expectation (EP) 1 = left 2 = right 3 = both 4 = neither
Ignoring the right hand side, how do you rate the colour quality of the objects in the left hand booth?
Colour quality (CQ)
1 = very good 2 = good 3 = moderate 4 = bad 5 = very bad
Fig. 5. Items in the questionnaire (translation from the German version)

Light & Engineering Vol. 26, No. 2
85
greatly preferred to the reference and adjudged bet-ter than the LED lighting with the same Rf and Rg values.
Table 2 gives a summary of the comparison of ratings for LED types compared with FL (Rf 80, Rg 100). The figures given are the probability p with a level of significance of α = 0.05. At the same Rf and Rg values the general colour quality was rated identically, but the colours of the objects are per-ceived to be less saturated, less natural and less like-able than under the FL (Fig. 7, right). There is no significant difference in the rating of LED types Rf 75, Rg 105 and Rf 80, Rg 105 as compared with the
FL. This leads to the assumption that it would be possible to compensate for slight differences in Rf value by a slight increase in saturation.
5. SUMMARY
The likeability of the colour of an object (as compared with the reference) cannot be pre-dicted solely on the basis of the value in the Fideli-ty Index Rf. This index, like the CIE CRI Ra, serves to describe the difference in colour only in rela-tion to colour appearance as compared with that un-der reference illuminant, which means that the refe-
Fig 6. Subjective ratings (mean values and intervals of confidence CI 95 %) for Rf and Rg (the linear regression was determined for the LED scenario ratings, and the coefficient of determination R² for this is shown)

Light & Engineering Vol. 26, No. 2
86
rence spectrum will always be the criterion. There is no statement as to which of the colours’ appear-ance, under test or reference light source, is bet-ter. It makes sense to incorporate the fidelity in-dex with the gamut index into the evaluation and to set targets for the development of light sources. The present investigation indicates that Rf ≥ 80 and Rg ≥ 100 are useful prescriptive values. The per-
ceived naturalness of the object colour correlates with both the Rf value and the Rg value, in that the subjects evaluated scenarios illuminated at Rf ≥ 80 and Rg ≥ 100 as similar to or better than the refe-rence. This result tallies with Royer [7]. The high correlation between the Ra and Rf value, see Fig. 1, indicates the experimental results are also applica-ble to the Ra colour rendering index.
Fig. 7. Absolute frequencies of responce that object colours match expectation (left); responces for LED (Rf = 80, Rg = 100) and FL (Rf = 80, Rg = 100) – mean and intervall of confidence (CI 95 %), N = 34 (right)
Table I. Coefficient of determination R² of the linear regression
Item R² for Ra R² for Rf R² for Rg R² for CQ
Colour quality CQ 0.62 0.65 0.73 1.00
Colour difference CD 0.80 0.79 0.13 0.58
Saturation S 0.25 0.29 0.95 0.77
Colour shift CS 0.77 0.77 0.33 0.79
Perceived brightness PB 0.01 0.01 0.41 0.17
Temperature T 0.55 0.63 0.06 0.52
Likeability LA 0.32 0.36 0.91 0.85
Naturalness NN 0.61 0.62 0.70 0.92
Table 2. Summary of comparison between LED and FL (values given are probability p; statistical significance is denoted by italices)
Rg 95 100 105Item/ Rf 75 80 85 75 80 85 90 95 75 80 85
Colour quality CQ 0,000 0,000 0,000 1,000 1,000 1,000 1,000 1,000 1,000 1,000 1,000Colour difference CD 1,000 1,000 1,000 1,000 0,082 0,277 0,000 0,000 1,000 1,000 0,622Colour shift CS 1,000 1,000 0,910 1,000 1,000 1,000 0,000 0,002 1,000 1,000 0,030Saturation S 0,000 0,000 0,000 0,000 0,000 0,002 0,037 0,303 1,000 1,000 1,000Likeability LA 0,000 0,000 0,000 0,026 0,000 0,009 1,000 1,000 1,000 1,000 1,000Naturalness NN 0,000 0,000 0,000 0,185 0,036 1,000 1,000 1,000 1,000 1,000 1,000Colour coding: FL significantly better LED significantly better no significant difference

Light & Engineering Vol. 26, No. 2
87
ACKNOWLEDGMENT
The cooperation of OSRAM Opto Semiconduc-tors GmbH was indispensable for the experimental setup and the investigation.
REFERENCES
1. CIE Method of Measuring and Specifying Colour Rendering Properties of Light Sources, CIE13.3, 1995.
2. N. Narendran and L. Deng, “Color Rendering Properties of LED Light Sources”, Proceedings of SPIE, 2002, Vol. 4776, pp. 61–67.
3. Illuminating Engineering Society of North Amer-ika, IES Method for Evaluating Light Source Color Ren-dition, 2015, IES TM30–15.
4. W.A. Thornton, “Colourdiscrimination index”, J Opt Soc Am., 1972, Vol. 62, No. 2, pp. 191–194.
5. M. S. Rea, L. Deng and R. Wolsey, “Light Sources and Colour,” NLPIP Lighting Answers (Rensselaer Pol-ytechnic Institute, Troy, NY), Vol. 8, no. 1, October 2004.
6. H. Xu, “Colourrendering capacity of illumina-tion”, J. Opt. Soc. Am. 1983 Dec; 73(12):1709–13.
7. M.P. Royer, A. Wilkerson, M. Wei, K. Houser and R. Davis, “Human perceptions of colour rendition vary with average fidelity, average gamut, and gamut shape”, Lighting Res. Technol. 2016, 0: pp. 1–26.
Christoph Schierz, Prof. Dr. He is chair of the lighting engineering group at Technische Universität Ilmenau since 2007. After graduating in physics with focus on optics and atmospheric physics, he
conducted research in occupational health. He gained his doctorate with a thesis on the use of light and colour at the work place taking into account physiological parameters of the eye. He is member in the board of several professional societies and is actively involved in the work of standardisation committees like DIN, CEN and CIE
Alexander Wilm is Senior Key Expert for illumination in the GL application engineering department at OSRAM Opto Semiconductors in Regensburg. He joined OSRAM OS in 2004 after
graduating from the University of Applied Sciences in Regensburg with a diploma in Mechatronic Engineering. In his career he started with optics and system design for LED headlamps, flash lights and projectors. After being stationed in Singapore for 2 years, he works as Application Engineer and Key Expert for SSL products and light quality. He is active in several expert associations for general lighting and driving, the innovation in solid state lighting
Carolin Horst is applications engineer and expert for General Lighting at OSRAM Opto Semiconductors where she is responsible for the field of light quality. She obtained her Bachelor
Degree in the field of Optronics and her Master Degree in the field of Optical Systems Engineering at the Technical University Ilmenau
Karin Bieske, Dr.-Ing. She is a research fellow in the lighting enginee ring group of Technische Universität Ilmenau. Since 1998, she is working there in research and teaching. She graduated
in the field of electrical engineering with focus on biomedical engineering and cyber netics, and obtained a doctorate in the field of lighting engineering at Technische Universität Ilmenau. She is an active in associations and commit tees for lighting, colour and standardisation
Ulla Maria Hartwig obtained her Master Degree in the field of Optical Systems Engineering / Optronics at Technische Universität Ilmenau. In her master thesis, she investigated the colour rendering pro per ties of LED light sources

88
Light & Engineering SvetotekhnikaVol. 26, No. 2, pp. 88–94, 2018 No. 2, 2018, pp. 46–50
ON SITE PHOTOMETRIC CHARACTERISATION OF CEMENT CONCRETE PAVEMENTS WITH COLUROUTE DEVICE *
Valérie Muzet and Joseph Abdo
1Cerema Est / Laboratoire de Strasbourg Strasbourg, France 2Cimbeton Paris, France
E-mail: [email protected]
* On basis of report at the European conference LUX EUROPA 2017, Ljubljana, Slovenia, 18–20 September
ABSTRACT
1The standard tool for characterizing road sur-face photometry is the reduced luminance coeffi-cient table (or Rtable), as defined in the seventies by the CIE. Since these tables are no longer repre-sentative, measuring road photometry is necessary for optimizing a lighting installation and ensuring luminance level and uniformity. The objective of the study was to characterise and follow on site the photometric characteristics of different concretes with time and traffic. A first experiment was done with two concrete formulations (broomed and water jet scrubbed concrete) located around a much cir-culated concrete mixer plant. The photometric characterisation of these pavements was done with the portable reflectometer COLUROUTE device during three years. The selected surface treatment was ap-plied in a tunnel and the photometric characteristics were measured during 30 months. It was shown that the concrete pavements are more diffuse and clear than classical pavements. Their use could generate significant energy saving.
Keywords : concre te , energy saving , exterior lighting, pavement photometry, por table reflectometer
I. INTRODUCTION
Designing a lighting installation involves ac-counting for sitespecific geometric parameters and
photometric characteristics of both the light sources and the road surface. By knowing the photometric characteristics of a pavement, the design of public lighting installations can be optimized in terms of positioning and energy saving. The reflection pro-perties of the pavement material are expressed as a table of reduced luminance coefficient (or rta-ble) [1,2]. To simplify the calculation, a classifica-tion based on the specularity coefficient S1 is made and standard tables are defined by the CIE. CIE2001 [2] recommends a scaling of the chosen table ac-cording to the measured brightness coefficient Q0. Since the photometric characteristics are generally not known, one standard R-table is used for the de-sign of lighting without any rescaling [3]. This ge-nerates important errors as shown in [4,5]. Moreo-ver, studies have shown that there is an important evolution of photometric characteristics with time and that these tables are no longer representative [6,7]. In this context, measuring road photometry is necessary for optimizing a lighting installation and ensuring luminance level and uniformity.
Concrete pavements are said to be more diffuse and clear than classical pavements [8]. The aims of the study were the followings: photometric charac-terisation of concrete pavements with time and traf-fic, comparison of laboratory and on-site measu-rements and calculation of the amount of possible energy saving. This work was done within a collab-oration of 6 years between the French cement and concrete pavement associations CIMBETON and

Light & Engineering Vol. 26, No. 2
89
SPECBEA and the Cerema, which was in charge of the measurements and the technical evaluation. The section 2 of this paper describes the CIE methodolo-gy of photometric characterisation, the portable de-vice COLUROUTE and the two experiments. The results obtained in the pilot study and in a highway tunnel are in the section 3.
1. MATERIAL AND METHODS
2.1. Introduction to Road Lighting
The r-table is a two-dimensional table with a number of standardized combinations of the in-cidence lighting angle γ and orientation angle β, the boundaries of which define the solid angle Ω (Fig.1a). The angle of observation α is set at 1°, which corresponds to a driver looking at about 100 m [1]. The reduced luminance coefficient r is defined by:
r (b, g) = ((L(b, g) / Eh)∙cos3g = = q(b, g) ∙ cos3g, (1)
where L is the observed luminance in cd/m² and Eh is the horizontal illuminance in lx.
The characterisation of a pavement is given by its degree of specularity S1 and its total reflectivi-ty Q0 (also called brightness). These two parame-ters are calculated from the previous matrix called r-table. The reflection indicatrix is a graphic rep-resentation of the r-table (Fig. 1b). Its volume in-forms on the brightness factor of the pavement Q0., given as:
( ), tg,0 0
q dQ
β γΩ ⋅ Ω= ∫ Ω (2)
and its form is an indicator of the specularity factor S1, given as:
( )( )
0, tg 2.1 0, tg 0
rS
rβ γβ γ= =
== = (3)
1.2. COLUROUTE Device
The portable measurement device named COLUROUTE (french acronym “COefficient de LUminance des ROUTEs”), was developed by the Cerema and complies with the CIE recommenda-tions [9]. With this instrument (Fig. 2a), the lumi-nance coefficients of a road surface are measured on site, in daylight and without sampling.
COLUROUTE is equipped with a sensor direct-ed at the measurement surface with an angle of 1° and has twenty-seven sources set to illuminate suc-cessively this surface with different combinations of angles β and γ (Fig. 2b). These angles were chosen judiciously to allow the calculation of the specula-rity factor S1 and to reconstruct by interpolation the complete reflection table of the road surface. Cali-bration is performed on site using reference plates measured with a laboratory goniophotometer [10] (Fig. 2b). The outputs comprise the reduced lumi-nance coefficient table (r-table), the average lumi-nance coefficient Q0 and the specularity factor S1. With this portable device it is possible to analyse a great number of areas and increase the number of interventions without damaging the road.
1.3. Experimental Setup
The aim of this pilot study was to follow the photometric characteristics of different concretes in time and traffic during 3 years and to choose
Fig.1. a) The photometric characteristics of the road surface depend on the angles of observation α, sight β and incidence γ (following [2]); O represents the driver and P the point of observation; b) Representation of a pavement reflection indica-
trix. The angle of sight β is in red, the angle of incidence γ is in blue and the location of COLUROUTE illuminating angles are in green

Light & Engineering Vol. 26, No. 2
90
a formulation for a tunnel pavement. The photo-metric characteristics of the two pavements were measured on site with COLUROUTE device and in laboratory on core samples with the Cerema goni-ophotometer. It was performed around a circulated concrete mixer plant near Lyon in France (Fig. 3a). The new concrete pavement was composed of lo-cal aggregates alluvial whose colour is a mixture of brown and beige more or less clear. Two surface treatments were used to obtain two different macro-textures: broomed and water jet scrubbed concrete. The circulation was composed of trucks carrying fresh concrete from the plant. The concretes surfac-es were always watered to avoid dust. We assume that the presence of sand and water accelerates the corrosion.
The Sinard tunnel (length 980 meters), locat-ed South of Grenoble in the A51 highway, is one of the few in France to have a concrete pavement (Fig. 3b). It is an unreinforced, undowelled con-crete pavement on a draining concrete subgrade. The concrete surface course was broomed across the traffic lanes using a hard brush, to provide the microroughness required for the grip of tires on the
pavement (Fig. 3c). The surface concrete contains crushed materials to provide increased grip of tires after relative wear due to surface sweeping on new-ly laid concrete. The photometry of this pavement was measured periodically during 30 months with the COLUROUTE device.
2. RESULTS
2.2. The Pilot Study
In the pilot study, there were 3 measurements per pavement (M1, M2, M3) with COLUROUTE de-vice every 6 months and there was one core sample taken for the laboratory measurements. All the re-sults are shown in the Table 1 for the scrubbed con-crete and in the Table 2 for the broomed concrete.
Whatever the methodology of measurements, the brightness increases with time for both pave-ments and reaches around 0.15. With COLUROUTE measurements, the specularity of the scrubbed con-crete increases significatively (class R3 pavement) after 2 years (Fig. 4a) but returns to a class R2 pavement after 3 years (Fig. 4b). For the broomed
Fig.3. a) Localisation of the pilot study; b) View of the Sinard Tunnel; c) Picture of the broomed concrete (initial state)
Fig.2. a) COLUROUTE device of the Cerema (Strasbourg); b) Goniophotometer of the Cerema (Clermont –Ferrand)

Light & Engineering Vol. 26, No. 2
91
concrete, the specularity remains low (class R1 pavement, Fig. 5). The specularity obtained in la-boratory on the core samples is generally higher (Figs. 4c and 5c) than on the field. This is probably due to the presence of residual dust around the ce-ment plant that could have an impact on the on site measurement. However, the goniophotometer and COLUROUTE measurements have shown that the specularity of the broomed concrete is lower than the scrubbed one.
The photometric measures show an important effect of erosion with time and traffic as illustrated by the pictures taken on each COLUROUTE inter-vention (Fig.6). The broomed surface looked like a water jet scrubbed concrete after two years (Fig. 6 b, d).
Since it is easier to obtain uniform illumina-tion with diffuse pavements, the surface treatment chosen in the Sinard tunnel was a broomed one be-cause of its lower specularity.
Fig.4. Reflection indicatrix of the scrubbed concrete measured with COLUROUTE device on site after 24 months (a) and 36 months (b), the three measurements are represented in blue, cyan and green; measurement made on a core extracted
after 36 months and measured with the laboratory goniophotometer (c), the axes are as defined in Fig. 1b
Table 1. Results for the Scrubbed Concrete, m is for Month
Scrubbed concrete
Brightness coefficient Q0 Specularity coefficient S1
T0 T3m T12m T24m T36m T0 T3m T12m T24m T36m
COLUROUTE M1 0.090 0.088 0.095 0.154 0.165 0.11 0.12 0.44 1.51 0.50
COLUROUTE M2 0.084 0.094 0.095 0.199 0.152 0.12 0.10 0.86 1.36 0.54
COLUROUTE M3 0.089 0.120 0.096 0.187 0.139 0.20 0.13 0.46 1.03 0.46
GONIO on core 0.088 0.121 0.142 no core 0.157 0.23 0.72 0.86 No
core 1.03
Table 2. Results for the Broomed Concrete, m is for Month
Broomed concrete
Brightness coefficient Q0 Specularity coefficient S1
T0 T3m T12m T24m T36m T0 T3m T12m T24m T36m
COLUROUTE M1 0.141 0.120 0.112 0.191 0.181 0.09 0.14 0.27 0.43 0.30
COLUROUTE M2 0.120 0.149 0.140 0.176 0.136 0.08 0.16 0.28 0.36 0.25
COLUROUTE M3 0.152 0.105 0.117 0.139 0.175 0.08 0.14 0.33 0.51 0.24
GONIO on core 0.099 0.123 0.166 no core 0.138 0.09 1.10 0.80 no
core 0.42
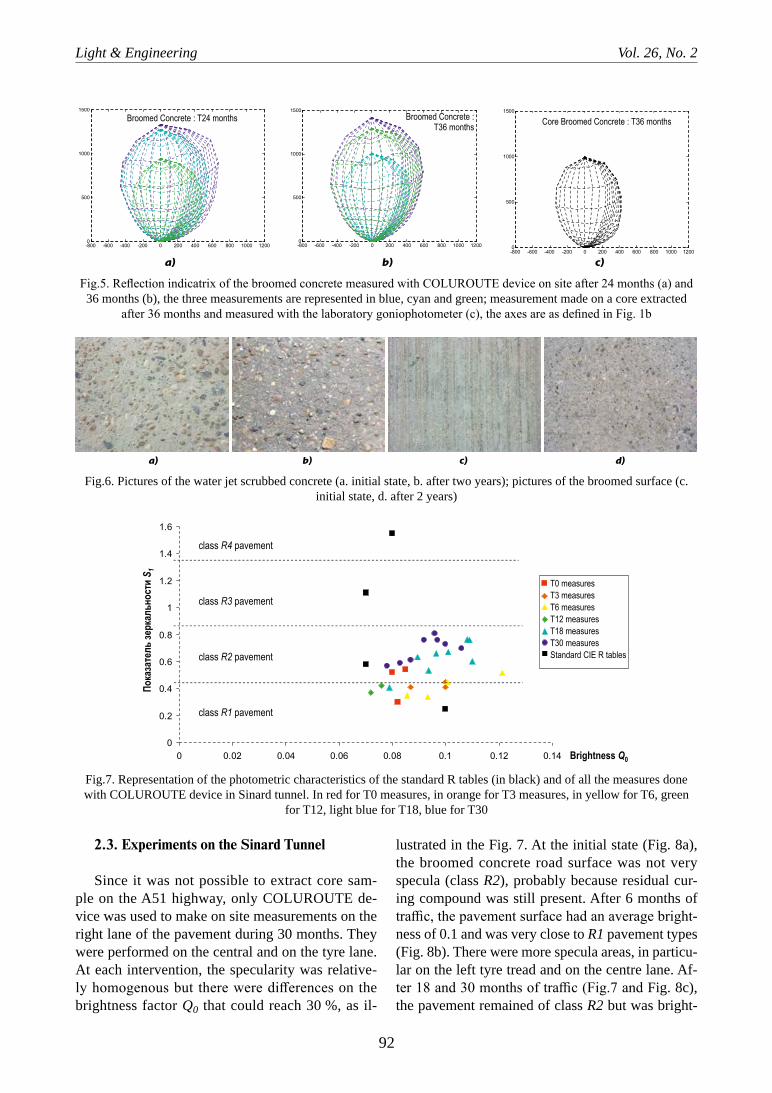
Light & Engineering Vol. 26, No. 2
92
2.3. Experiments on the Sinard Tunnel
Since it was not possible to extract core sam-ple on the A51 highway, only COLUROUTE de-vice was used to make on site measurements on the right lane of the pavement during 30 months. They were performed on the central and on the tyre lane. At each intervention, the specularity was relative-ly homogenous but there were differences on the brightness factor Q0 that could reach 30 %, as il-
lustrated in the Fig. 7. At the initial state (Fig. 8a), the broomed concrete road surface was not very specula (class R2), probably because residual cur-ing compound was still present. After 6 months of traffic, the pavement surface had an average bright-ness of 0.1 and was very close to R1 pavement types (Fig. 8b). There were more specula areas, in particu-lar on the left tyre tread and on the centre lane. Af-ter 18 and 30 months of traffic (Fig.7 and Fig. 8c), the pavement remained of class R2 but was bright-
Fig.5. Reflection indicatrix of the broomed concrete measured with COLUROUTE device on site after 24 months (a) and 36 months (b), the three measurements are represented in blue, cyan and green; measurement made on a core extracted
after 36 months and measured with the laboratory goniophotometer (c), the axes are as defined in Fig. 1b
Fig.6. Pictures of the water jet scrubbed concrete (a. initial state, b. after two years); pictures of the broomed surface (c. initial state, d. after 2 years)
Fig.7. Representation of the photometric characteristics of the standard R tables (in black) and of all the measures done with COLUROUTE device in Sinard tunnel. In red for T0 measures, in orange for T3 measures, in yellow for T6, green
for T12, light blue for T18, blue for T30

Light & Engineering Vol. 26, No. 2
93
er than typical R2 pavements (the average bright-ness was 0.10 at 18 months and 0.09 at 30 months).
The energetic impact of the choice of such a con-crete pavement is analysed with DIALUX software on a classical road installation with Philips Iridi-um gen3 Led and a lantern spacing of 29m (height 8m). Calculations were made in three conditions: using the standard R2 table, using the standard R2 table rescaled according to a 3 years old classical French black pavement from [5], and with a res-caling according to Q0 obtained after 30 months with COLUROUTE. To achieve the class M3 re-quirement [11], 54.7W lantern are necessary for the standard R2 table, 70.6W for the classical bitu-minous pavement and 38W for the Sinard concrete (Table 3.). The corresponding electrical consump-tion confirms that using a lighter pavement gene-rates substantial energy saving.
3. CONCLUSION
The pilot study was used to choose between dif-ferent surface treatments of concrete. An accordance with the results measured on core samples in labo-ratory and the portable device COLUROUTE was there. Differences are sometimes due to the process of sampling. In the pilot study located near a cement plant, there was residual dust that was removed dur-ing the extraction. Whatever of the type of measu-
res, the broomed surface is always less specula than the scrubbed concrete. The results obtained in the pilot study and on the circulated tunnel were con-sistent. The broomed concrete pavement is and re-mains bright and its specularity stays moderate, de-spite the effect of traffic.
The energy consumption study has shown that taking into account the real characteristics of the concrete pavement used in the Sinard Tun-nel, the lighting electric power could be reduced by 46 % compared to a classical French bitumi-nous pavement. This emphasises the importance for the project owner to properly take into ac-count the choice of pavement characteristics re-garding its photometry when defining tunnel and road specifications.
With on site measurements, more measurements are done and the mean result is more representative than just one or two core sample. There is still ne-cessity to define how many measurements shall be done and how to handle them. These aspects will be addressed during the European Empir project called SURFACE which is beginning.
ACKNOWLEDGEMENT
The authors gratefully acknowledge the con-tributions of JF. Vargas, G. Lemonnier and S. Horwarth.
Table 3. Results of the DIALUX Calculation and Corresponding Electrical Consumption
Description of pavement Q0 Light Power in W Consumption in kW/km Energy saving
Standard R2 table (reference) 0.070 54.7 1.89 0 %
R2 table rescaled with a classical bitu-minous pavement 0.054 70.6 2.43 29 %
R2 table rescaled with Sinard T30 con-crete pavement 0.092 38 1.31 31 %
Fig.8. Photometric solids of the road surface in the Sinard tunnel, measured using COLUROUTE on new pavement (a), on a wheel track after 6 months (b) and 30 months (c) of traffic

Light & Engineering Vol. 26, No. 2
94
REFERENCES
1. “Road Surfaces and lighting”, joint CIE/PIARC publication, CIE66–1984.
2. “Road surface and road marking reflexion charac-teristics”, Tech. Rep., CIE144–2001.
3. E. Dumont, “Photométrie des chaussées et éclairage public”, Etudes et Recherches des laboratoires des ponts et chaussées, CR45, Ed. LCPC, 2007 (in french).
4. C. Chain, F. Lopez, and P. Verny, “Impact of real road photometry on public lighting design”, Presenta-tion at 26th session of the CIE, July 4–11, 2007, Beijing, China.
5. E. Dumont, F. Fournela, V. Muzet, JL. Paumi-er, C. Venin, “Pavement reflection properties and lumi-nance distribution: measurements on a road lighting test track and comparison with standard calculations”, Post-er at 26th SESSION of the CIE, July 4–11, 2007, Beijing, China.
6. E. Dumont, JL Paumier, “Are standard tables R still representative of the properties of road surfaces in
France?”, Poster at 26th session of the CIE, July 4–11, 2007, Beijing, China.
7. M. Jackett, W. Frith, “Reflection properties of New Zealand road surfaces for road lighting design”, Tech-nical paper, IPENZ Transportation Group Conference Christchurch, 14p, march 2010.
8. A.M. Ylinen, T. Pellinen, J. Valtonen, M. Puolak-ka, L. and Halonen, “Investigation of pavement light cha-racteristics”, Road material and pavement design, 2011, Vol.12, n°3, pp.587–614.
9. V. Muzet, JL Paumier, and Y. Guillard, “COLUR-OUTE: a mobile gonioreflectometer to characterize the road surface photometry”, CIE international symposium on road surface characteristics, 9–10 July 2007 Torino.
10. JL. Paumier, G. Legoueix, P. Dupont, and F. Aubert, “Propriétés photométriques des revêtements de chaussée”, CFTR-Info, n°14, 12p, septembre 2006 (in french).
11. CEN EN13201–2:2015, “Road Lighting – Part 2: Performances requirements”, December 2015.
Valérie Muzet,Ph.D., graduated in Sciences from the University of Strasbourg, France in 1997, works in Cerema, in the research team ENDSUM (Non Destructive Evaluation of Structures and Materials). Her main activities and fields of interests are 3D road imaging, road and marking photometry. She is involved since 15 years in the development of optical metrology devices applied to road characterization: Coluroute device for insitu evaluation of pavement photometric properties, the dynamic retroreflectometer Ecodyn for the characterization of the night visibility
of road markings and the apparatus IRCAN Stereo for image acquisition and software IREVE for 3D measurement and exploitation for the knowledge of road network and surroundings.She is member of the CEN TC226 WG2 in the field of road marking, the CIE TC450: Road surface characterization for lighting application and the French lighting society (AFE). She leads the Cerema contribution of the European Empir project SURFACE
Joseph Abdo,Ph.D., graduated from Mines Paris Tech, France in 1982 (Doctoral thesis on soil treatment technology). He is the road delegate director of CIMBETON (Information Centre on Cement and its Applications) since 1987 and was director of the BTP – CIEC from 1982 to 1987. He participates and /or organises training days since 1988 with the French organisms “Ponts, Formation CIFP CNFPT ENPC – ESTP,…” He wrote several technical guides for the CIMBETON Collection and is a member of the CFTR Guides Editorial Committees (The CFTR is the French road engineering committee)

95
Karin Bieske, Ulla Hartwig, Christoph Schierz, Alexander Wilm, and Carolin Horst
TM-30-15 and CIE-CRI-Ra: Investigation of Сolour Rendering of White PC LEDs
Fig. 1. a) Experimental setup with two booths (width: 46 cm, depth: 48 cm, height: 96 cm), at the top the lighting units, curtained and exposed, and below the test objects; b) relative SPDs of the light sources: B stands for blue LED, P for fully converted LED with different types of phosphors; c) Ref. for reference illuminant (SoLux THL), THL for the Solux tung-
sten halogen lamp, FL for the OSRAM Sylvania fluorescent lamp

96
Vladimir M. Pchelin and Irina E. MakarovaAssessment of the Current State and Prospects for Development of Irradiation Systems in Modern Greenhouse Facilities
Fig. 2. Cucumber photoculture
Fig. 1. Winter greenhouse using artificial irradiation systems (Maysky greenhouse facility, Kazan)

97
Vladimir M. Pchelin and Irina E. MakarovaAssessment of the Current State and Prospects for Development of Irradiation
Systems in Modern Greenhouse Facilities
Fig. 5. Reflux SSL lamps in a greenhouse
Fig. 7. LED irradiators for plant cultivation

98
Valérie Muzet and Joseph AbdoOn Site Photometric Characterisation of Cement Concrete Pavements with COLUROUTE Device
Fig.3. a) Localisation of the pilot study; b) View of the Sinard Tunnel; c) Picture of the broomed concrete (initial state)
Fig.2. a) COLUROUTE device of the Cerema (Strasbourg); b) Goniophotometer of the Cerema (Clermont –Ferrand)
Fig.6. Pictures of the water jet scrubbed concrete (a. initial state, b. after two years); pictures of the broomed surface (c. initial state, d. after 2 years)

99
Light & Engineering SvetotekhnikaVol. 26, No. 2, pp. 99–109, 2018 No. 1, 2018, pp. 15–22
ADVANCEMENT IN ROAD LIGHTING
Sanaz Bozorg Chenani1, Rami-Samuli Räsänen2, and Eino Tetri3
1Department of Built Environment, Aalto University, Espoo, Finland 2Department of Management Studies, Aalto University, Espoo, Finland
3Lighting expert, Espoo, Finland E-mails: [email protected],
[email protected], [email protected]
ABSTRACT
Road lighting is on the verge of one of the most attentive changes since its first introduction. The synergetic effect of the advancement of road light-ing technology and usage pattern is going to change the concept of road lighting. By most estimates, light emitting diodes (LEDs) are the most energy efficient light sources that can be used in road light-ing. Today, the energy saving potential when replac-ing HPS lamps with LED luminaires is onethird with current technology and two-thirds with im-proved technology in the future. This technologi-cal transformation has the potential of energy sav-ing up to 83 % in comparison with HPS lamps. The energy saving is achievable with changing the pat-tern of use by intelligent road lighting control based on reducing burning hours. Intelligent road lighting can be based on such parameters as traffic density, ambient light, road condition and weather circum-stances. It can also be more dynamic and consider the combined effect of road lighting and individual car headlights. The widespread adaptation of these emerging technologies is envisioned to lead towards more sustainable lighting.
Keywords: energy efficiency, LED, light source, traffic safety, road lighting, sustainability
1. INTRODUCTION
Road lighting is undeniably essential for road users to observe obstacles, decide ahead and avoid
accidents. At the same time, it is becoming difficult to ignore the energy consumption and electricity costs related to the road lighting. The Internation-al Energy Agency has evaluated that in 2005, 19 % of the total global electricity consumption was used for lighting in which road lighting used 218 TWh amounting to about 8 % of lighting electricity con-sumption [1].
The electricity costs can be reduced by techno-logical advancement and modification in the pat-tern of use via utilisation of intelligent road light-ing. Lighting technologies have developed from gas lamp to incandescent, fluorescent, mercury vapour, low-pressure sodium, high-pressure sodium, and metal halide. Currently, LED technology is emerg-ing as a new light source technology. These transi-tions have improved the efficiency and cost saving as well as lifespan, colour properties, dimming abi-lity, and run-up and reignition times of road light-ing [2].
It is evident that energy efficiency plays an im-portant role in the transition of road lighting. How-ever, there is still potential to reduce electricity consumption by dimming road lighting when and where needed based on real-time demand and by modifying the pattern of use (with intelligent road lighting systems).
Transition to new road lighting technologies and pattern of use have several benefits, such as reduc-tion of electrical energy, costs, and maintenance, and provision of more environmentally friendly solutions. However, it is critical to acknowledge

Light & Engineering Vol. 26, No. 2
100
the purpose of road lighting before making any de-cisions to invest in new road lighting sources or making them intelligent. The primary goal of road lighting is to improve safety by increasing visibili-ty of roadside hazards and by reducing the effects of glare from other light sources in the visual en-vironment [3]. Many studies have shown that road lighting can mitigate nighttime accidents [4, 5, 6]. Therefore, it is essential to have an overview of ad-vancements in road lighting.
The current paper is originated from Tetri et al. (2017) [2], where the authors’ scope was broad and considered multiple aspects of road lighting such as mesopic vision, visibility and safety and 3D mo-delling of the lighting environment. Here the study is more focused on road lighting technology, traffic safety, and sustainability. In this article, we address the effect of road lighting on traffic safety, the be-nefits of using LEDs, and the effect of road lighting advancements on sustainability. By addressing the recent technological development, we describe how the road lighting technologies are changing and de-bate the future concept of road lighting.
2. TRAFFIC SAFETY
According to World Health Organization, over 1.2 million people were killed in road accidents in 2015, which makes it one of the 10 major causes of death in the world [7]. Generally, human (57 %), roadway (3 %) and vehicle factors (3 %) are caus-ing traffic accidents; the rest is due to their interac-tions [8].
Difficulties arise, however, when an attempt is made to study the effect of one factor such as road lighting on accidents. Firstly, many interacting vari-ables affect accidents, which make the separation of the effect of road lighting difficult [8]. Secondly, drivers’ behaviour changes before and after installa-tions of road lighting. For instance, Assum et al. [9] investigated drivers’ behavioural adaptations in re-lation to speed and concentration before and after installation of road lighting in Norway. As a conse-quence of the installation of road lighting, increase in the number of older drivers, increase in speed and decrease in concentration was evident. Therefore, these interacting factors affect the accuracy of the effect of road lighting on accidents [9].
In order to measure the effect of road lighting on accidents, the comparison of accident data either on the areas where road lighting did not previously
exist and is then introduced or where improvements have been made to road lighting has to be conduc-ted. This can be done with an odd ratio, which is a metric for quantifying the effect of road lighting on accidents.
(1)
Road lighting has been identified as a contribut-ing factor to the decline of traffic accidents. A num-ber of studies have shown that road lighting can re-duce nighttime accidents [4, 6, 10]. A well-known example of this is a study by International Commis-sion on Illumination (CIE) [4]; they found that the average effect of road lighting installation on the re-duction of accidents was 30 %.
The increasing trend of using intelligent road lighting [2, 9, 11] has already drawn atten-tion to study the effect of quality of road lighting on accident [12,13,14]. A study by Gibbons et al. [15] indicated that current road lighting practices result in over-lighting and the increased lighting le-vel does not necessarily lead to a safer road. They studied the relationship between lighting level and lighting quality and accidents based on the night-to-day crash rate ratio. The study concluded that current road lighting practices are over-lighted and there is a potential to reduce road lighting levels by as much as 50 % for the urban interstate functional class. In addition, Steinbach et al. studied the effect of reduced road lighting on traffic safety and crime prevention [16]. The results provide no evidence that switching off, partnight light, and dimming ad-aptations to the road lighting were associated with nighttime traffic accidents. Also, there was no ev-idence of increasing crime in these conditions dur-ing the hours of darkness. Therefore, the relevance of dimming road lighting without adversely affect-ing traffic safety is supported by the findings.
3. LIGHTING TECHNOLOGY
3.1. Changes in Technology
In 2005, IEA estimated that 62 % of total out-door light was provided by high-pressure sodium (HPS) and lowpressure sodium (LPS) lamps, 30 %

Light & Engineering Vol. 26, No. 2
101
by mercury vapour (Q) lamps, 6 % by metal halide (MH) lamps and the remaining 2 % mostly by halo-gen and incandescent lamps [1].
HPS, Q and MH lamps are also known as highintensity discharge (HID) lamps. The lightpro-ducing element of these lamp types is an arc dis-charge. Each type of HID lamp produces light rela-ted to the type of metal that is contained in the arc. HID lamps have negative volt-ampere characteris-tics, and therefore a current-limiting device is need-ed, usually a ballast. They also need auxiliaries for starting. They have commonly few minutes’ runup time before the operation light output level is reached. Often, they also need few minutes to cool down, before the arc ignition can work. HPS lamps can be dimmed to roughly 50 % light level by ad-justing the supply voltage. Q and HPS lamps have often 4-year group replacement period, giving them 16 000 h lamp life. LPS and MH lamps have com-monly 12 000 hours’ lamp life. Luminous efficacy is highest with LPS lamps (150–170) lm/W. HPS lamps have an efficacy of (80–150) lm/W, Q lamps (40–60) lm/W and MH lamps (60–90) lm/W. Effi-cacies are dependent on lamp power and colour ren-dering properties. For instance, with HPS lamps the increase of the pressure and temperature inside the arc tube increases the colour rendering and colour temperature, but decreases the efficacy.
Like mentioned above, the luminous efficacy of a HPS lamp can be 150 lm/W [17]. However, when a lamp is placed in a luminaire, the luminaire efficiency (lumen output ratio) decreases the to-tal efficacy. Luminaire efficiencies are often quite low, especially with old luminaires [18]. When the luminaire efficiency and ballast losses are taken
into account, the luminaire luminous efficacy is of-ten about 40 lm/W [19]. Characteristics of different lamp and luminaire types are compared in Fig. 1.
HID lamps are based on gas discharge, where-as LEDs are semiconductors. The wavelength of the radiation depends on the semiconductor materi-al. In road lighting, it is common to use blue radia-tion chips. Some of the blue radiation is then turned to longer wavelengths with a phosphor coating. There is no infrared radiation in the spectra and the excess heat of the LED junction has to be conduc-ted to heat sink [20]. Without adequate heat sinking (or ventilation), the junction temperature will rise, resulting in lower light output and reduced lifetime. Unlike with discharge lamps, there is no few minu-tes run-up or re-strike time. The light output is in-stant after the switch-on. The rise time of LED light output is less than microseconds [21]. The rise time does not limit the use of LEDs in dimming use. The power is almost linear with luminous flux and thus the luminous efficacy remains high also in dimming use.
LED luminaires are very long-lasting, accor-ding to manufacturer data their service life can be from 50 000 to 100 00 hours. The status of lumi-nous efficacy is already higher 100 lm/W for LED luminaires [22]. However, the semiconductor ma-terial and phosphor coating can degenerate in use and thus reduce the lifetime, especially in warm environments.
3.2. Control of Light
Significant development is occurring in the area of road lighting control. The lighting con-
Fig.1. Characteristics of different lamp/luminaire types when compared to the 100 % reference values, which are: LPS lamp luminous efficacy 170 lm/W, LED luminaire luminous efficacy 120 lm/W, lifetime 75 000 h (LED),
and dimmability 100 % (LED)

Light & Engineering Vol. 26, No. 2
102
trol system can be adjusted in real time or accor-ding to a predefined timeschedule. The latter being called intelligent road lighting [12]. The most wide-ly used control system is photoelectric cells that switch lights on/off based on the availability of day-light. Due to the low cost and reliability of photo-electric cells, they can be applied to individual lumi-naires or groups of luminaires. Currently, the most widely used photoelectric cells have the factory set-ting of the switch on at 70 lx as the natural lighting levels fall at dusk and off at 35 lx as the lighting le-vels increase at dawn. However, the operating range can be altered. A study by the Institution of Light-ing Professionals [23] estimated that if the switch-ing levels were reduced to 35 lx at dusk and 16 lx at dawn a saving of 50 hours per annum (approxi-mately (1–2) %) could be achieved. Using this low-er switch on/off lighting levels is not recommended for older lamp types such as low-pressure sodium lamps and mercury vapor lamps. Like discussed earlier, they need some time for the warm-up until their light output reach the operational value. Since mercury lamps have been phased out from the mar-ket by European Union regulation [24] and at the same time LED luminaires with new characteris-tics are ready to take over the market [2], photocells with switching routine of 35/16 lx are considered.
There is still potential for reducing the level or hours of operation of road lighting systems or switching off lighting whenever there is no need for lighting. For instance, during low traffic periods, every second luminaire can be turned off to save energy. However, this results in poor luminance uniformity. The dimming of luminaires may offer an acceptable alternative to switching off every se-cond luminaire. Monitoring luminance level of road surface plays a key role in altering the road lighting outputs. Many factors can affect luminance levels of the road surface, such as road surface properties un-der varying weather conditions, and presence of car headlights on the road [12].
Weather conditions are also an important com-ponent in luminance of the road surface. When the road is covered with uniform snow, road surface luminance can substantially increase. Guo et al. (2007) [12] study indicated an increase of 150 % in road surface luminance in comparison with dry conditions.
Car headlights have also a significant effect on the road surface luminance. This was illustrated briefly by Guo et al. (2007) [12], in which car head-
lights increased the average road surface luminance value by 432 %.
The LED’s capability to be frequently dimmed has made it possible to start developing control sys-tems that react to the movements of individual road users. Such a system can fully satisfy road lighting regulation when a road user is present while pro-viding a high level of dimming and energy saving at other times. In such cases, the maximum level of dimming is mainly dependent on acceptability to lo-cal inhabitants; for example, in rural areas, dimming down to (15–30) % of nominal light output is ac-ceptable [13].
3.3. Car Headlights
Although considerable benefits can be gained by changing from conventional to LED road lighting, there is still another opportunity to reduce energy use and costs without affecting traffic safety. Aside from illumination by road lighting, drivers have car headlights. The combined effect of road lighting and car headlights is not complementary [25, 26, 27]. While road lighting illuminates road surface (hori-zontally), car headlights illuminate vertical objects on the road, and the combined effect of road light-ing and car headlights reduce the contrast of ob-jects on the road. Bozorg Chenani et al. studied this combined effect under different road lighting inten-sities with and without glare from an oncoming car in a stationary car [26]. The study used drivers’ sub-jective grating of visibility performance and visibi-lity level calculation as defined in the Adrian model [28]. The road had 100 W HPS light sources with the lighting class of M5 according to the classifi-cation system in CIE115:2010 [29]. The full road lighting had a voltage of 230 V and a luminous flux of 7252 lm. In addition to full road lighting, two other dimming levels, 71 % and 49 %, were studied with voltages of 210 and 190, respectively. They found that with only low beam headlights and in ab-sence of glare from an oncoming car 49 % of road lighting intensity (corresponding to 4.5 lx) provided better visibility level than 100 % road lighting (cor-responding to 8.3 lx) and 71 % of road lighting (cor-responding to 5.9 lx) provided worst visibility level than the other two mentioned lighting levels. In ad-dition, with low beam headlights and in presence of glare from an oncoming car there was a difference between different levels of road lighting but the ef-fect was not significant [26].

Light & Engineering Vol. 26, No. 2
103
Car headlights have been identified as being a potentially important parameter to dim road light-ing. However, the range of car headlights are lim-ited and driving speed can affect the effectiveness of car headlights (overdriving headlights). The as-sured clear distance ahead (ACDA) rule is known as maintaining speed low enough to enable the dri-ver to stop within the range of vision and therefore, to avoid accidents with any obstacles that might appear in the car’s path [30]. The main concern of ACDA rule is to find the maximum safe speed of travel, which is directly dependent on both the car and the driver as explained in Total Stopping Dis-tance (TSD). TSD depends on the velocity of a car (m/s), perception and reaction time in sec, the co-efficient of friction, and gravitational acceleration. In addition, the key human factors in TSD are per-ception and reaction time. These might vary due to environmental variables, drivers’ experience, alertness, and physical condition of the driver [30]. American Association of State Highway and Trans-portation Officials [31] have appointed 2.5 seconds as the time required for most drivers to respond un-der most conditions and this 2.5 sec is used for per-ception and reaction time in road design. TSD for different speeds can indicate that car headlights can provide safe-visible distance up to 60 metres with speed up to 50 km/h (considering coefficient of 0.65 for dry condition and coefficient of 0.38 used for the wet condition for heavy truck, based on [31]). The findings of this theoretical knowledge are consist-ent with previous measurements studies. One crite-rion to examine the effectiveness of car headlights on visibility performance is detection distance with different speeds. Several studies indicate that low beam car headlights are enough while driving with low speed up to 50 km/h [32, 33, 27]. For instance,
a study by Perel et al. focusing on driving with low beam car headlights alone provided enough visibi-lity with speed up to 48 km/h [32]. In addition, it is known that on an unlit road and with only low beam car headlights, a young driver can only recognise an unexpected darkclad pedestrian on average up to the distance of 15 to 45 meters from the head-lights [33, 30].
Fig. 2 displays TSD for different speeds and weather conditions. Since car headlights have domi-nant effect in the area between 0 and 60 metres from car headlights [3], total stopping distances should be below 60 meters. Fig. 2 indicates that speed and road surface conditions can affect to different total stopping distance.
Also, driving with high speed can reduce the ef-fect of car headlights (overdriving headlights) and increase the effectiveness of road lighting. Janoff et al. studied the detection distance of a small tar-get with high speed (89 km/h) car in different road lighting intensities [34]. Their results indicated significant differences between full road lighting and other road lighting intensities. The best detec-tion distance was achieved under full road lighting condition.
Therefore, there is a potential to reduce energy consumption by taking into account the combined effect of road lighting and car headlights in low-speed roads or when the car is approaching with low speed (lower than 50 km/h).
4. SUSTAINABILITY
4.1. Demand for Sustainable Outdoor Lighting
Due to the introduction of LEDs, the global light-ing field is going through a transformation where
Fig. 2. Total stopping distance (TSD) for different speeds and weather conditions

Light & Engineering Vol. 26, No. 2
104
LEDs are replacing the conventional lighting tech-nologies as new suppliers and organisations disrupt the industry [35]. The transition to LEDs has led the private actors to respond to the changing field and the demands regarding the environmental and technological properties of the new LED products by finding new international organisations such as Global Lighting Association [36] and Lighting Eu-rope [37] and Zhaga [38]. This global change has also been supported by public and international or-ganizations with the development of new interna-tional standards for testing LED products and by launching supporting programs and policies. The aim of these activities has been to further facilitate market transformation, international trade and dif-fusion of the new technology as LEDs’ are expec-ted to have a positive impact on sustainable deve-lopment [39, 40].
However, from the different market segments especially the outdoor lighting segment is often a highly regulated domain of infrastructure of deve-loped regions. In addition, investments in outdoor lighting are planned from a very long run perspec-tive as investment calculations cover often even se-veral decades [41]. In order to satisfy lighting net-work owners’ and road users’ expectations regarding functional lighting services, the outdoor lighting in-stallations have to fulfil certain criteria as defined in international standards and recommendations of International Commission on Illumination (CIE), European Committee for Standardization (CEN) and American National Standards Institute and Il-luminating Engineering Society (ANSI/IES). The standards for road lighting contain lighting require-ments, including metrics for the luminance, illumi-nance, uniformity and disability glare produced by the luminaires.
But besides fulfilling the normative criteria, lighting installations are increasingly expected to be sustainable. This means that preference in technolo-gy selection should be put on those products, which minimize economic, environmental and social bur-dens and thereby determine sufficient conditions for adopting efficient lighting products. This kind of life cycle thinking entails assessing how products perform in terms of the sustainability aspects and what kind of tradeoffs or dependencies, if any, ex-ists between the different technologies and respec-tive dimensions of sustainability [42,43]. Howev-er, sustainability assessment is still a developing framework where analysis can be conducted by
combining different types of scientific assessment methods and tools [43]. For the purpose of outdoor lighting, Jägerbrand has developed a framework consisting of a set of sustainability indicators and measures for assessing especially LED luminaires’ longterm sustainability from different perspectives [44]. Within the framework, the sustainability as-sessment is conducted by utilizing formalized in-dicators and methods in combination with qualita-tive approximations through several categories of environmental, economic and social sustainabili-ty. Moreover, the assessment of environmental and economic sustainability can be conducted with ma-tured methods while the assessment of social im-pacts is still less uniform methodology [42, 45].
4.2. Assessments of Environmental and Economic Sustainability of Outdoor Lighting
The environmental and economic sustainabili-ty of different outdoor lighting technologies can be approached by comparing the performance of the alternative technologies during their different life cycle phases of environmental life cycle analysis (LCA) and life cycle costing (LCC) for financial cost accounting [46, 47, 48]. The diffusion of LEDs to road lighting has resulted in several comparative case studies with the aim to find out the environ-mental and economic sustainability of the products [49, 50, 51, 52, 53]. The main approach in case stu-dies has been the comparison of the life cycle ef-ficiencies of emerging LEDs and the dominating HPS lamps. Regarding the assessments, it has been proposed by Tetri et al. that the key parameters for comparisons are luminaire power, luminous effica-cy, lamp and luminaire lifetime and pole spacing [2]. In addition, Tähkämö and Halonen suggest that assessments should use a kilometre of a lit road as the functional unit in the comparisons [49].
According to the recent results [49] and [2] the environmental impacts of HPS and LED luminaires are almost at the similar level where most of the im-pacts are created in the use phase of the luminaires: 96 % of HPS and 87 % in the case of LEDs. Thus, a specific feature of outdoor lighting is how diffe-rent lighting products generate environmental im-pacts in the use phase, i.e. while the light is on. In addition to energy consumption, especially light pollution, which can be described as increased le-vels of artificial lighting in night-time environments [54] and lights illuminating unintended areas, is
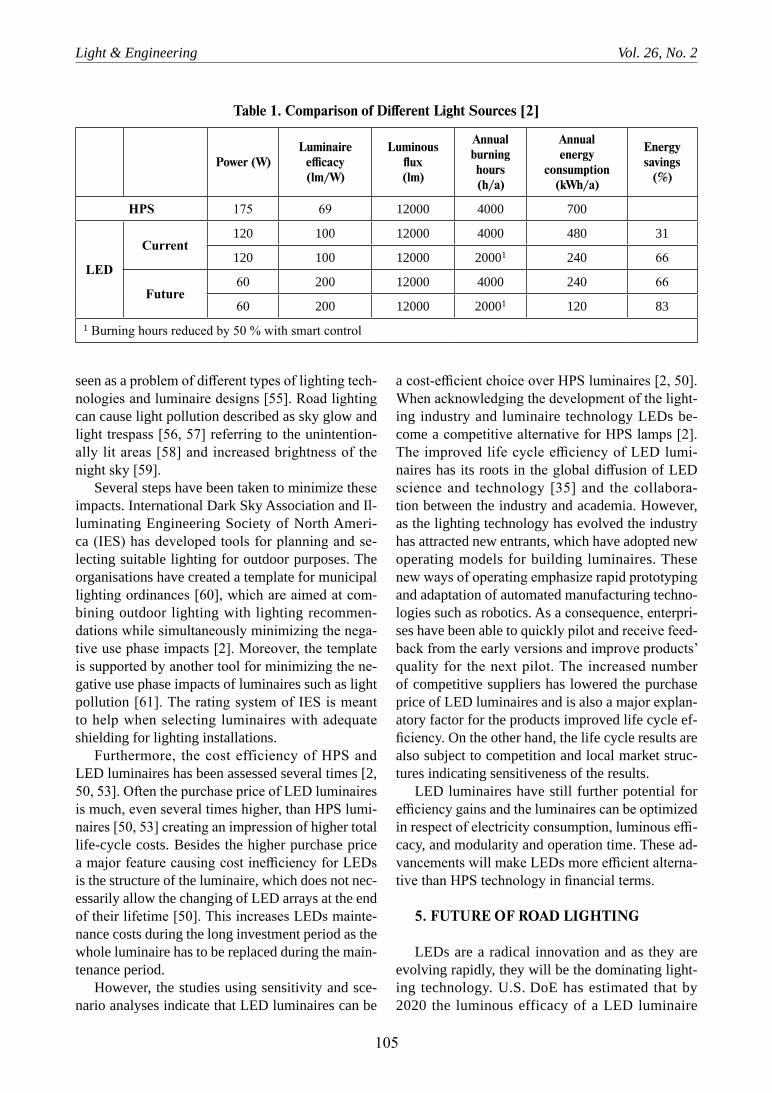
Light & Engineering Vol. 26, No. 2
105
seen as a problem of different types of lighting tech-nologies and luminaire designs [55]. Road lighting can cause light pollution described as sky glow and light trespass [56, 57] referring to the unintention-ally lit areas [58] and increased brightness of the night sky [59].
Several steps have been taken to minimize these impacts. International Dark Sky Association and Il-luminating Engineering Society of North Ameri-ca (IES) has developed tools for planning and se-lecting suitable lighting for outdoor purposes. The organisations have created a template for municipal lighting ordinances [60], which are aimed at com-bining outdoor lighting with lighting recommen-dations while simultaneously minimizing the nega-tive use phase impacts [2]. Moreover, the template is supported by another tool for minimizing the ne-gative use phase impacts of luminaires such as light pollution [61]. The rating system of IES is meant to help when selecting luminaires with adequate shielding for lighting installations.
Furthermore, the cost efficiency of HPS and LED luminaires has been assessed several times [2, 50, 53]. Often the purchase price of LED luminaires is much, even several times higher, than HPS lumi-naires [50, 53] creating an impression of higher total life-cycle costs. Besides the higher purchase price a major feature causing cost inefficiency for LEDs is the structure of the luminaire, which does not nec-essarily allow the changing of LED arrays at the end of their lifetime [50]. This increases LEDs mainte-nance costs during the long investment period as the whole luminaire has to be replaced during the main-tenance period.
However, the studies using sensitivity and sce-nario analyses indicate that LED luminaires can be
a costefficient choice over HPS luminaires [2, 50]. When acknowledging the development of the light-ing industry and luminaire technology LEDs be-come a competitive alternative for HPS lamps [2]. The improved life cycle efficiency of LED lumi-naires has its roots in the global diffusion of LED science and technology [35] and the collabora-tion between the industry and academia. However, as the lighting technology has evolved the industry has attracted new entrants, which have adopted new operating models for building luminaires. These new ways of operating emphasize rapid prototyping and adaptation of automated manufacturing techno-logies such as robotics. As a consequence, enterpri-ses have been able to quickly pilot and receive feed-back from the early versions and improve products’ quality for the next pilot. The increased number of competitive suppliers has lowered the purchase price of LED luminaires and is also a major explan-atory factor for the products improved life cycle ef-ficiency. On the other hand, the life cycle results are also subject to competition and local market struc-tures indicating sensitiveness of the results.
LED luminaires have still further potential for efficiency gains and the luminaires can be optimized in respect of electricity consumption, luminous effi-cacy, and modularity and operation time. These ad-vancements will make LEDs more efficient alterna-tive than HPS technology in financial terms.
5. FUTURE OF ROAD LIGHTING
LEDs are a radical innovation and as they are evolving rapidly, they will be the dominating light-ing technology. U.S. DoE has estimated that by 2020 the luminous efficacy of a LED luminaire
Table 1. Comparison of Different Light Sources [2]
Power (W)Luminaire
efficacy (lm/W)
Luminousflux(lm)
Annual burning hours(h/a)
Annualenergy
consumption (kWh/a)
Energy savings
(%)
HPS 175 69 12000 4000 700
LED
Current120 100 12000 4000 480 31
120 100 12000 20001 240 66
Future60 200 12000 4000 240 66
60 200 12000 20001 120 831 Burning hours reduced by 50 % with smart control

Light & Engineering Vol. 26, No. 2
106
could reach almost 200 lm/W [22]. Package lu-minous efficacy would be 220 lm/W and overall luminaire efficiency 89 %. Luminaire efficiency consists of thermal efficiency (93 %), driver effi-ciency (93 %), optical efficiency (94 %) and a cor-rection factor for operating with reduced current (1.09). When compared to the state-of-art of dis-charge lamp luminaires’ luminous efficacy (~60 lm/W), the luminaire luminous efficacy may be more than tripled in the future. If we use the sug-gested functional unit, kilometre of a lit road, we have to consider also luminaire’s luminous inten-sity distribution, total luminous flux, pole height, pole spacing and other features as well. However, LED luminaires compete well with conventional discharge lamp luminaires. The luminous intensi-ty distribution of a LED luminaire is enabled with external optics, usually with the lens, and thus the light can be directed to the area chosen even more effectively than with discharge lamp luminaires. Discharge lamp luminaires use reflectors to direct the light.
Benefits of LEDs over HPS luminaires can be summarized by 1) Higher luminous efficacy, 2) Higher lamp life, 3) Instant start with maximum lu-minous flux and no delay in reignition, 4) Lumi-nous efficacy does not decrease in dimming, and 5) Dimming has no effect on lamp life [62]. In fact, re-duced junction temperature in dimming use can in-crease LED’s lifetime.
Table 1 shows that the optimized LED lumi-naire may result in an 83 % reduction in annual energy consumption compared to the HPS lumi-naire, whereas the current LED luminaire resulted in a 31 % reduction in energy consumption.
The future of road lighting systems is in intel-ligent lighting. Accordingly, CIE has developed a standard for intelligent road lighting that covers external parameters such as traffic density, remain-ing daylight level, road constructions, accidents and weather circumstances [29]. The development of the standard was supported by installing 20000 in-telligent road lights across Europe (E-Street project [14]). As a result, an annual energy saving potential 38 TW∙h was estimated by retrofitting old installa-tions with intelligent road lighting. This represents approximately 64 % of the annual energy consump-tion of road lighting. The reason for the large-scale pilot of intelligent road lighting was based on the understanding that only low demand of light level is needed when there is very little traffic on the road.
There has been a growing number of researchers in recent years that indicate that drivers do not re-quire high lighting level when the traffic density is high because drivers’ attention is on the back of the front car and in the range of car headlights [12, 25, 13]. Therefore, intelligent road lighting can be used not only in no or low traffic but also in high traffic, because of the illumination provided by car head-lights. This also does not have an adverse effect on traffic safety.
LEDs and intelligent control technologies en-able the change of outdoor lighting system in a way that the transition promotes sustainable develop-ment. LED luminaires improve sustainability of lighting especially due to the enhanced life cycle efficiency of the products. Moreover, the sustaina-bility will be amplified by the emerging intelligent control technologies, which allow the supply of op-timized lighting services based on the real-time de-mand of the users. However, we are still lacking knowledge of social impacts of road lighting, such as melatonin suppression. It is possible that in the future not only the light level is recommended, but also the correlated colour temperature (CCT). With LEDs, the CCT can be adjusted in the manufactu-ring process.
6. CONCLUSION
Today’s energy and costs problems are accelerating the development of new technologies in road lighting systems. This paper has given an account of and the reasons for the future widespread use of LEDs and control technologies in road lighting. Some of the main benefits of using LEDs are long lamp life, high luminous efficacy and fast dimming. Therefore, the lighting control system can be ad-justed in real-time based on realtime demand. Cur-rently, several control systems are being practised which lead to saving energy. The control systems are mainly based on the ambient light, the amount of traffic and weather conditions. In periods when the traffic is low or when snow covers the road, the light output level can be reduced. Illumination of car headlights also has a great influence on the visi-bility of targets on the road.
The advancement of road lighting and control technology is going to change the concept of road lighting. The use of LEDs and intelligent control technology lead towards more sustainable lighting. Road lighting will be more efficient in economic

Light & Engineering Vol. 26, No. 2
107
and environmental terms and even in social terms. At the same time, the safety of drivers and other road users is on the same level or better than with conventional lighting solutions.
ACKNOWLEDGEMENTS
This research was supported by the Aalto Energy Efficiency research program (project Light Energy – Efficient and Safe Traffic Environments) and by the Foundation for Economic Education.
REFERENCES
1. IEA. International Energy Agency, Light’s labour lost: Policies for Energyefficient Lighting, 2006. [On-line]. Available: https://www.iea.org/publications/freepub-lications/publication/light2006.pdf. [Accessed 21 7 2017].
2. Tetri, E., Bozorg Chenani, S., Räsänen RS., Baumgartner, H., Vaaja, M., Sierla, S., Tähkämö, L., Vir-tanen, JP., Kurkela, M., Ikonen, E., Halonen, L., Hyyppä, H., and Kosonen, I. Tutorial: Road Lighting for Efficient and Safe Traffic Environments., LEUKOS Journal of the Illuminating Engineering Society of North America, 2017. V13, #4, pp. 223–241.
3. Van Bommel, W. Road lighting fundamentals, tech-nology and application, Switzerland: Springer, 2015, p. 334.
4. CIE Commission Internationale de l’Eclairage, Road lighting as an accident countermeasure, CIE. Pub-lication No. 93., Vienna (Austria), 1992.
5. Elvik, R. Metaanalysis of evaluations of public lighting as accident countermeasure, Transportation re-search record (TRR), 1995, pp. 112–123.
6. Wanvik P., Effects of road lighting: an analysis based on Dutch accident statistics 1987–2006, Accident analysis and prevention, 2009, V41,#1, pp 123–128.
7. WHO World Health Organization, The top 10 cau-ses of deaths, 2017. [Online]. Available: http://www.who.int/mediacentre/factsheets/fs310/en/. [Accessed 19 8 2017].
8. AASHTO American Association of State Highway and Transportation Officials., Highway safety manual. 1st ed., 2010. [Online]. Available: http://app.knovel.com/hot-link/toc/id: kpHSM00002/highwaysafetymanual/high-waysafetymanual. [Accessed 22 6 2017].
9. Assum, T., Bjornskau, T., Fosser, S., Sagberg, F. Risk compensation- the case of road lighting. Accident analysis and prevention, 1999, V31, pp 545–553.
10. Elvik, R., and Vaa, T. The handbook of road safe-ty measures, Oxford, U.K.: Elsevier, 2004.
11. Liping, G., Marjukka, E., and Halonen. L. Lumi-nance monitoring and optimization of luminance metering in intelligent road lighting control systems. Ingineria Ilu-minatului,, 2007. V9, pp 24–40.
12. Guo L. Intelligent road lighting control sys-tems –experiences, measurements, and lighting control strategies. Espoo, Finland, 2008.
13. Chung, HSH., Ho, NM., Hui, SYR., Mai, WZ., Case Study of a Highly-Reliable Dimmable Road Light-ing System with Intelligent Remote Control, in European Conference on Power Electronics and Applications, 2005.
14. E street Europe., https://ec.europa.eu/energy/in-telligent/projects/sites/ieeprojects/files/projects/docu-ments/e-street_e_street_publishable_report_en.pdf, 2008.
15. Gibbons, R., Guo, F., Medina, A., Terry, T., Du, J., Lutkevich, P., Li, Q. Design criteria for adaptive roadway lighting.Washington, DC., 2014.
16. Steinbach, R., Perkins, C., Tompson, L., Johnson, S., Armstrong, B., Green, J., Grundy, C., Wilkinson, P., Edwards, P. The effect of reduced street lighting on road casualties and crime in England and Wales: controlled interrupted time series analysis. Epidemiol Community Health, 2015, pp. 1–7.
17. Kitsinelis, S., Light sources. Technologies and applications., Boca Raton (FL):: Taylor & Francis., 2011, p 213.
18. Gasparovsky, D., Raditschova, J. Lighting proper-ties and efficiency of luminaires exceeding their lifetime. in Proceedings of CIE Centenary Conference Towards a New Century of Light, Paris, France., 2013.
19. Eurelectric, Electricity for more efficiency: elec-tric technologies and their energy savings potential, 2004. [Online]. Available: http://www.uie.org/sites/default/files/generated/files/pages/REPORT_FINAL_July_2004.pdf.
20. Jang, D., Yook, SE., Lee, KS. Optimum design of a radial heat sink with a finheight profile for highpow-er LED lighting applications. Applied Energy, 2014 #116, pp 260–268.
21. Svilainis L., LED video display pixel intensity and directivity investigation. 2009 p. 192.
22. U.S. Department of Energy. Solid-state lighting R&D plan, 2015. [Online]. Available: http://energy.gov/sites/prod/files/2015/06/f22/ssl_rdplan_may2015_0.pdf. [Accessed 30 7 2017].
23. Institution of Lighting Engineers (ILE), Street Lighting – Invest to Save. Retrieved 2010, 2006. [Online]. Available: https://www.theilp.org.uk/documents/street-lighting-invest-to-save/street-lighting-invest-to-save.pdf.
24. European Commission., Commission Regula-tion No 245/2009 of 18 March 2009 implementing Direc-tive 2005/32/EC of the European Parliament and of the

Light & Engineering Vol. 26, No. 2
108
Council with regard to ecodesign requirements for fluo-rescent lamp s without integrated ballast, for high intensi-ty discharge lamps, and for ballasts and luminaires able to operate such lamps, and repealing Directive 2000/55/EC of the European Parliament and of the Council., Brussels (Belgium): European Commission., 2009.
25. Bacelar A. The contribution of vehicle lights in urban and peripheral urban environments. Lighting Res Technol., 2004 #36, p 69–78.
26. Bozorg Chenani, S., Maksimainen, M., Tetri, E., Kosonen, I., Luttinen, T. The effects of dimmable road lighting on drivers ‘visibility: comparison of measured and perceived visibility. Transport Res FTraf. 2016 #43, pp 141–156.
27. Bozorg Chenani, S., Vaaja, T M., Kurkela, M., Kosonen, I., Luttinen, T. Target detection distances under different road lighting intensities. European Transport Re-search Review, 2017 #9, pp 1–17.
28. Adrian W., Visibility of targets: model for calcula-tion. Lighting Res. Technol, 1989, V21, #4, pp 181–188.
29. CIE Commission Internationale de l’Eclairage., Lighting of roads for motor and pedestrian traffic. IE. Pub-lication 115, Vienna (Austria):, 2010.
30. Leibowitz, H W., Owens, D A., Tyrrell, R A., The assured clear distance ahead rule: implications for night-time traffic safety and the law, accident analysis and pre-vention, 1998, V30, #1, pp 93–99.
31. AASHTO American Association of State High-way and Transportation Officials., A policy on geometric design of highway and streets. Washington, D.C., 1984.
32. Perel, M., Olson, P., Sivak, M., and Medlin, J. Motor Vehicle Forward Lighting, SAE Technical Pa-per 830567., 1983.
33. Johansson G. Rumar K., Visible distance and safe approach speeds for night driving. Ergonomics, 1968, V11,#3, pp 275–282.
34. Janoff M.S. Staplin L. Arens J., The potential for reduced lighting on roadways, Public roads, 1986. V50,#2, pp. 33–42.
35. Sanderson, S., Simon, K. Light emitting di-odes and the lighting revolution: the emergence of a sol-idstate lighting industry. Research Policy, 2014.V43,#10, pp. 1730–1746.
36. Sturm J., Global Lighting Association: The Glob-al Voice of the Lighting Industry., Light & Engineering, 2012. V20,#4, pp. 16–18.
37. Whitaker, T. Lighting industry in Europe launches new organization. LEDs Magazine, 2012. [Online]. Avail-able: http://www.ledsmagazine.com/articles/2012/12/lightingindustryineuropelaunchesneworganization.html.
38. Wittig N. A Small Light Source With Great Poten-tial: The Future of LEDs – Already Promoted By Zhaga. Light & Engineering, 2012. V20, #4, pp. 19–26.
39. Ohno, Y., Scholand, M. Solid State Lighting An-nex: Task 1: Application Study of CIE S025/E: 2015. Supporting document for IC2017, Energy Efficient Enduse Equipment (4E). International Energy Agency, 2017.
40. IEA., Solid State Lighting Annex: Lessons Learned Bringing LEDs to Market. Programmes and Pol-icies Report, Energy Efficient EndUse Equipment (4E). International Energy Agency, 2017.
41. Finnish Transport Agency. Maantie ja rautatieal-ueiden valaistuksen suunnittelu (Lighting design guide for road and railway areas), 2015. [Online]. Available: https://julkaisut.liikennevirasto.fi/pdf8/lo_2015–16_maantie_rautatiealueiden_web.pdf.
42. Kloepffer W. Life cycle sustainability assessment of products. International Journal of Life Cycle Assess-ment., 2008. V13, #2, pp. 89–95.
43. Onat, N.C., Kucukvar, M., Halog, A. Systems Thinking for Life Cycle Sustainability Assessment: A Re-view of Recent Developments, Applications, and Future Perspectives. Sustainability. 2017. V9,#5.pp. 706.
44. Jägerbrand A. New Framework of Sustainable In-dicators for Outdoor LED (Light Emitting Diodes) Light-ing and SSL (Solid State Lighting), Sustainability, 2015. V7, pp. 1028–1063.
45. Macombe, C., Feschet, P., Garrabé, M., Loeillet, D. 2nd International Seminar in Social Life Cycle Assess-ment – recent developments in assessing the social im-pacts of product life cycles. Life Cycle Ass., 2011. V16, pp. 940–943.
46. ISO 14040. Environmental Management – Life Cycle Assessment – Principles and Framework., 2006.
47. ISO 14044. Environmental Management – Life Cycle Assessment – Requirements and Guidelines. 2006.
48. Thomas E. Swarr, T., Hunkeler, D., Klöpffer, W., Pesonen, HL., Ciroth, A., Brent, A., Pagan, R Environ-mental life-cycle costing: a code of practice. Life Cycle Assess. 2011.V16. pp 389–391.
49. Tähkämö L. Halonen L. Life cycle assessment of road lighting luminaires – Comparison of light-emit-ting diode and highpressure sodium technologies, 2015. V93. pp. 234–242.
50. Tähkämö L. Räsänen RS. Halonen L., Life cycle cost comparison of high-pressure sodium and light-emit-ting diode luminaires in street lighting. Life Cycle Ass., 2016. V21,#2, pp. 137–145.
51. Tähkämö L., Ylinen, A., Puolakka; M., Halonen, L. Life cycle cost analysis of three renewed street light-

Light & Engineering Vol. 26, No. 2
109
ing installations in Finland. Life Cycle Ass.,2012. V17,#2, pp. 154–164.
52. Ochs K.S. Miller M.E. Thal A.E. Ritschel J.D., Proposed method for analyzing infrastructure investment decisions involving rapidly evolving technology: Case study of LED streetlights. Management in Engineering, 2014. V30, p. 41–49.
53. Onaygil, S., Güler, Ö., Erkin, E. Cost Analyses of LED Luminaires in Road Lighting. Light & Engineer-ing. 2012.V20, #2, pp. 39–45.
54. Falchi, F., Cinzano, P., Elvidge, CD., Keith, DM., Haim, A. Limiting the impact of light pollution on human health, environment and stellar visibility. Environmental Management,2011. V92, pp. 2714–2722.
55. Gardner C, Tackling unwanted light: an interna-tional perspective. Light & Engineering. 2012. V20,#1, pp. 24–39.
56. Brons J. Bullough J. Rea M., Outdoor sitelight-ing performance: a comprehensive and quantitative frame-work for assessing light pollution. Lighting Research Technology. 2008. V40, pp. 201–224.
57. Luginbuhl, C., Lockwood, G., Davis, D., Pick, K., Selders, J. From the ground up I: light pollutions sources in Flagstaff, Arizona. Publ Astron Soc Pac.2009. V121,#876. p. 185.203.
58. Gaston, K., Davies, T., Bennie, J., Hopkins, J. Re-ducing the ecological consequences of night-time light pollution: options and developments. Appl Ecol,2012. V49, pp. 1256–1266.
59. Luginbuhl C. Boley P. Davis D. The impact of light source spectral power distribution on sky glow. Quant Spectros Ra. 2014.V139, pp. 21–26.
60. (MLO)., International Dark Sky Associa-tion and Illuminating Engineering Society. Joint IDAIES model lighting ordinances. 2011. [Online]. Available: http://www.ies.org/PDF/MLO/MLO_FINAL_June2011.pdf.
61. IES. Luminaire classification system for outdoor luminaires. 2011. p. 15.
62. Baumgartner, H., Oksanen, J., Poikonen, T., Pul-li, T., Tetri, E., Kärhä, P., Ikonen, E. Effects of intelligent control on the lifetime of LED street lights. Proceedings of 28th CIE Session, 2015. pp. 1662–1668.
Sanaz Bozorg Chenani, Doctoral candidate, has got her Master Degree from Royal Institute of Technology, Stockholm, Sweden in 2012. At present, she is a Ph.D. student in Transportation Engineering group at Built Environment Department, Aalto University, Finland. Her research interest areas include road lighting, traffic safety, traffic simulation, and traffic management
Rami-Samuli Räsänen, Doctoral candidate, has got Master Degree from University of Helsinki and Aalto University with specializing in economics and innovation management. At present, he is a Ph.D. candidate at the Department of Management Studies of the Business School of Aalto University, Finland. His research interests include assessment of emerging technologies and management of sustainable industrial transition with special focus on the lighting field
Eino Tetri, Dr. of Science, graduated from Helsinki University of Technology in 2001. His interest areas are light sources, LEDs, energy efficient lighting, outdoor and indoor lighting

110
Light & Engineering SvetotekhnikaVol. 26, No. 2, pp. 110–121, 2018 No. 3, 2018, pp. 60–67
ROAD CLASSIFICATION BASED ENERGY EFFICIENT DESIGN AND ITS VALIDATION FOR INDIAN ROADS
Suddhasatwa Chakraborty, Pritha Barua, Soumendu Bhattacharjee, and Saswati Mazumdar
Illumination Engineering Section, Electrical Engineering Department, Jadavpur University, Kolkata
E-mail: [email protected]
ABSTRACT
Road lighting consumes a significant portion of global electricity. A good road lighting design en-sures the fulfilment of visual requirements with optimized design. The initial step for a good road lighting design is to identify the exact lighting class of the concerned road. The existing Indian Road lighting Standard IS: 1944, 1970 is not so well de-fined with respect to the modern Indian roads. It de-mands a specific model for classifying any Indian road. This paper focuses towards the validation of a proposed model, which is a modified mathemati-cal model as recommended by CIE: 115, 2010 for classifying the exact lighting category of the Indian roads. This paper also highlights the scope of ener-gy saving by changing the design according to the changed lighting class during different traffic hours in night. Some innovative design is also proposed for a new road based on the proposed classifica-tion methodology.
1. INTRODUCTION
A road can be defined as a business connec-tor, used by individuals to accomplish their busi-ness purpose. The lighting in the road guides the individuals through their journey to the place of af-fair inducing a strong influence on their mood and motivation. Thus, convenient road lighting is very necessary. Road lighting is a very special form of lighting design. The other necessities of road light-
ing are to allow all road users to proceed safely, to allow pedestrians to see hazards, recognize other pedestrians, and give them a sense of security, also to improve the night time appearance of the envi-ronment. To fulfil the requirements of road light-ing, a proper road lighting design is required. Road lighting class is the most influencing parameter of a road lighting design. It demands the maximum attention as it defines all the photometric require-ments in order to provide safety and security to road users, also to minimize the electricity consump-tion [1,2].
The two existing International Standards for road lighting are: CIE115, 2010 (Technical Report for Lighting of Roads for Motor and Pedestrian Traffic) and IESNA RP8–00 (Roadway Lighting). CIE115, 2010 has proposed a model for the selec-tion of appropriate lighting class based on lumi-nance concept, taking into account the different pa-rameters relevant for the given visual task [3].
In India, the road lighting standard is not well defined. It demands more specific consideration to-wards the optimized solution for the mixed traffic scenario in Indian roads. According to IS:1944, 1970 the roads are classified in six different groups A, B, C, D, E, F. Group A and B are further classi-fied into two sub-groups A1, A2 and B1, B2. In the standard, Group A1 refers to ‘very important road with rapid and dense traffic’ and Group A2 is for ‘other type of main roads with considerable mixed traffic’. Group B is for ‘secondary roads which do not require up to Group A’. Considering Group A,

Light & Engineering Vol. 26, No. 2
111
the term ‘important’ is a relative term which de-pends on users. The Indian Road Lighting Standard IS:1944, 1970 is based on illuminance but global standard says that instead of illuminance, lumi-nance concept should be considered when selecting quality criteria for lighting roads. The normal di-rection of view of motorists is toward the road. The road surface forms the background to the objects present on the road. The surface is visible by virtue of light being reflected from it and entering the eye of the observer; thus the greater the amount of re-flected light, the stronger will be the visual sensa-tion which is measured by luminance. Illuminance is the amount of light falling on the surface; it is in-capable of making any visual sensation; so lumi-nance is considered as the photometric parameter for road lighting.
Hence a proper guideline is required for road lighting in Indian context. The recommendations in CIE: 115, 2010 are structured with such an inten-sion that it is easily adaptable to the need of indivi-dual countries and it also serves for developing na-tional standards for lighting [5]. Hence the ongoing development process of Indian road lighting stan-dard proposed a new model following current CIE technical report on road lighting.
The aim of this paper is to validate the proposed new classification system for Indian roads and to demonstrate few case studies based on the pro-posed classification model [6].
2. DESCRIPTION OF THE MATHEMATICAL MODEL CONSIDERED FOR VALIDATION
The current CIE Technical Report CIE:115, 2010 for ‘Lighting of Roads for Motor and Pedes-
trian Traffic’ is the first step in making a new ma-thematical model based upon few traffic related pa-rameters, ambiance related parameters considered with their corresponding weighting values [3]. This new mathematical model is a modification of the existing CIE: 115, 2010 model. As in India a mixed traffic scenario persists, the CIE: 115, 2010 model is modified, taking into consideration the critical as-pects of Indian roads. The lighting classes for mo-torized road are classified into 6 different M light-ing classes, from M1 to M6 and it also recommends the lighting criteria like, average luminance, overall uniformity, longitudinal uniformity, threshold incre-ment, surrounding ratio for the corresponding class of road. The appropriate lighting class has to be se-lected according to traffic volume, traffic speed, traf-fic class, existence of medians and cross roads, sur-rounding brightness, existence of parked vehicles as well as visual guidance.
In the new model limits/ranges of the different parameters (traffic volume, traffic speed and ambi-ent luminance) are set to classify the different mo-torized roads of India into M1, M2…M6 classes. Example the values for the three different catego-ries of speed is provided for very high speed > (60 km/h), for high speed (40–60 km/h) and for moderate speed < (40km/h), with weights 1, 0.5 and 0 respectively. Similarly, the traffic density is cate-gorized into very high> (60 traffic volume in num-ber per min), high (50–60 traffic volume in number per min), moderate (30–50 traffic volume in num-ber per min), low (10–30 traffic volume in number per min) and very low< (10 traffic volume in num-ber per min) with weights 1, 0.5, 0, –0.5 and –1 re-spectively. In India a mixed traffic scenario persists in majority of the places, therefore to determine the type of traffic density or speed of vehicle by follow-
Fig. 1. Location of VIP Road

Light & Engineering Vol. 26, No. 2
112
Tabl
e 1.
Cla
ssifi
catio
n of
Diff
eren
t Roa
ds w
ith R
espe
ct to
New
Mod
el a
s pe
r Ind
ian
Con
text
Sl No.
Roa
d na
me
Traffi
c vo
lum
e in
/
m
inTr
affic
spee
d,
km/h
Traffi
c cl
ass
Med
ian
Cro
ss ro
adS
urro
undi
ng
brig
htne
ssPa
rked
ve
hicl
e
Visual guidance
Sum of weights (Vws)
Class of road (6-Vws)
Class as rounded up
60 and above, very high
50–60, high
30–50, moderate
10–30, low
<10, very low
>60 Very High
40–60, High
<40, moderate
Mixed with High % of non-motorized
Mixed
Motorized only
No
Yes
High (above 3 nos. \Km)
Moderate (below 3 nos.\Km)
High
Moderate
Low
Present
Not Present
Poor
Moderate or Good
Wei
ghts
wei
ghts
wei
ghts
Wei
ghts
Wei
ghts
wei
ghts
Wei
ghts
Wei
ghts
10.
50
0.5
-11
0.5
00
12
10
10
10
-10.
50
0.5
0
1G
.T. R
OA
D1
12
01
00
0.5
5.5
0.5
1
2V
IP R
OA
D0
12
11
00
05
11
3A
PC R
OA
D0.
50.
52
10
00
04
22
4B
IDH
AN
SA
RA
NI
00
21
00
00
33
3
5B
ALL
YG
UN
GE
CIR
CU
LAR
R
OA
D0
02
10
00
03
33

Light & Engineering Vol. 26, No. 2
113
ing the guideline a minute observation is very much essential. In CIE: 115, 2010, the lighting class is de-termined by the formula,
M = 6 – Vws, where
Vws denotes the sum of all the weighing values. If M is not an integer, it is advised to adopt the first low-er integer. This formula only holds for Vws having values less or equal to 5. In Indian context, analysis shows that there are situations where weighing va-lue greater than 5 may be obtained. Thus, to over-come this limitation in selection of the lighting class the existing formula is amended as per conveni-ence. The revised formula to determine the light-ing class is
M = 6- Vws, Vws <=5,M=1, Vws >5,
where Vws denotes the sum of all the weighing va-lues. If M is not an integer, it is advised to adopt the first lower integer.
3. VALIDATION OF THE MATHEMATICAL MODEL FOR ROAD LIGHTING IN INDIAN SCENARIO
Validation is the process of ensuring that a mo-del is sufficiently accurate for the required purpose; in other words, building the right model for a par-ticular purpose. No model is ever fully accurate; indeed, there are justifiable reasons for not having completely accurate models. Further, the accura-cy of any model is determined with reference to the purpose for which the model is to be used. In this paper the sole aim is to ensure that the model, which is a modified version of CIE: 115, 2010, is suffi-ciently accurate in determining the lighting class of the Indian roads, Table 1.
For validating the model, few motorized roads of Kolkata are considered. Uniqueness of Kolka-ta lies in the fact that it is one of the most populous metropolitan cities of India having a typical mixed traffic scenario. The motorized roads under consi-deration are surveyed and their distinct features are identified. Considering these distinct features of in-dividual road, they are classified into different light-ing classes. Table 1 exhibits the classification of few roads of Kolkata with respect to the modified CIE model. An extremely busy road with rapid traf-
6S.
C. M
ALL
LIK
R
OA
D(B
AG
HA
-JA
TIN
)0
01
01
00.
50
2.5
3.5
3
7PU
RN
O D
AS
RO
AD
00
21
00
00
33
3
8M
AYFA
IR
RO
AD
0.5
01
10
00.
50
24
4
9D
OV
ER L
AN
E-1
00
10
00.
50.
51
55
10N
KD
A 1
60-1
01
10
-10
0.5
0.5
5.5
5
11JA
TIN
DR
A M
O-
HA
N S
AR
AN
I-1
01
10
-10.
50.
51
55

Light & Engineering Vol. 26, No. 2
114
fic should obviously fall under a higher street light-ing class than a comparatively less important road. But if a reverse situation happens, then the model used to determine the lighting class of the road is questionable.
As per Table 1, Grand Trunk Road (G.T. Road), the summation of VWS is coming as 5.5. This is a very important and main road, hence, the exact class for this road is coming M1.Ballygunge Cir-cular Road has a higher lighting class than Mayfair Road. By analyzing the practical scenario, the class of Mayfair Road should be lower than Ballygunge Circular Road as the traffic density of the latter one is much higher that the former one. Again conside-ring Dover Lane, a very lonely road, has a lighting class lower than Mayfair Road, which is also justi-fiable. Thus, analysis says that the proposed classi-fication system for Indian roads is valid, as it holds a sufficient accuracy in determining the road light-ing class.
4. DEMONSTRATION OF FEW CASE STUDIES OF ROAD LIGHTING DESIGN BASED ON THE PROPOSED CLASSIFICATION MODEL
Few roads of Kolkata are classified conside-ring the new model, and case study of these roads is done. In the case study, retrofit designing is carried out for each road.
– Vip Road lighting design condition and its ex-isting traffic data is officially known as Kazi Nazrul Islam Sarani is a major thoroughfare connecting the city Kolkata with the Netaji Subhas Chandra Bose International Airport. It’s located in the north-east outskirts of the city having an average width of 15 meters. There is also a median of 1 meter present
throughout the roadway. Fig.1 shows the location of VIP Road. Fig. 2 shows the real time picture of this road.
Only motorized traffic is present with a very high average speed of more than 60 kmph. As the road leads towards the sole airport of the city, the traffic density is also very high; almost 50–60 vehi-cles flow per min. The visual guidance of the road is quite good because it’s one of the most important roads of Kolkata.
Thus analyzing the existing condition, the road class is found out to be M1. 400W High Pressure Sodium Vapor (HPS) luminaire (Fig. 3) is present with median arrangement, having mounting height 8 meter and span 18 meter.
– Redesigning of the lighting condition of the road – the controlling criteria of lighting of roads for motorized traffic are average luminance (Lav), overall uniformity (U0), longitudinal uniformity (U1), and surrounding ratio (SR). The recommen-ded values of these parameters for different types of motorized roads are provided in CIE: 115, 2010. For every road, depending on its type of lighting class these criteria should be satisfied. But for VIP road it’s seen that the criteria are not being satis-fied as per its existing condition (details are provi-ded in Table 2), thus retrofit designing is done for this road.
The luminaire used is changed and the height of the pole is also changed to fulfill the required va-lue. Designing is done with 250W LED luminaire (Fig. 4) with median arrangement, having mounting height 10 meter and span 18 meter.
In Table 2 the comparison between the required value, the existing value and the achieved value is shown. The retrofit design does not satisfy the re-quired value, but the achieved value by the retrofit
Fig. 2. Real time picture of VIP Road
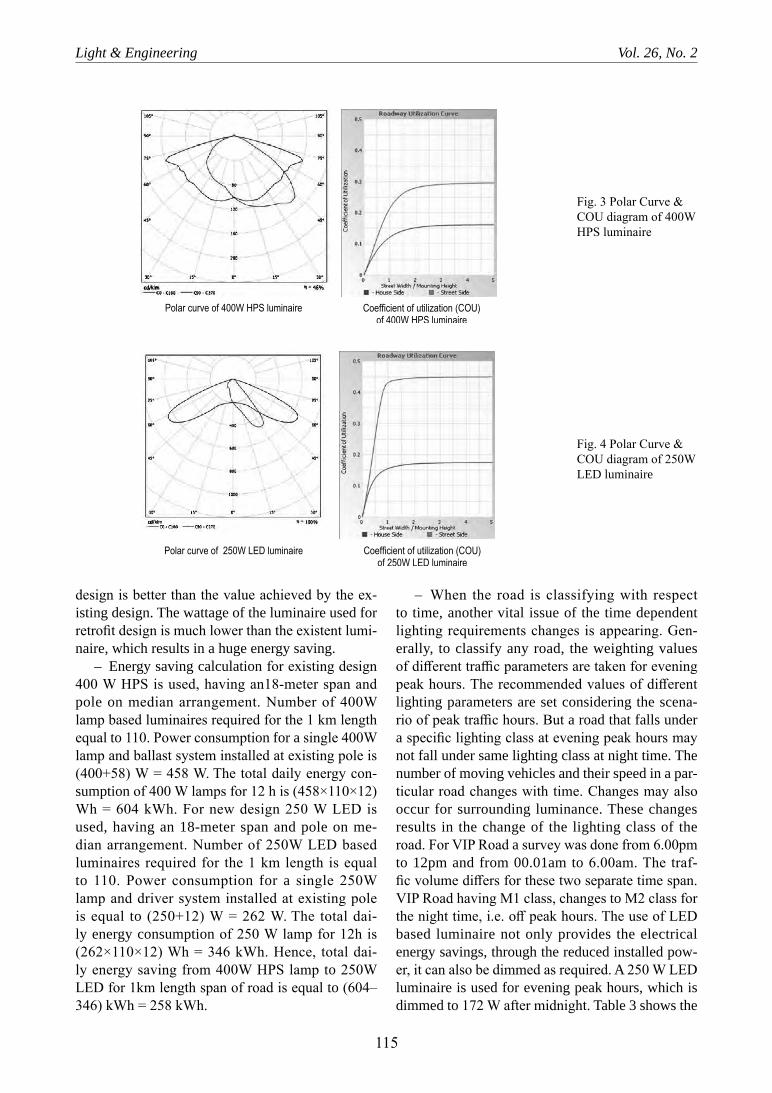
Light & Engineering Vol. 26, No. 2
115
design is better than the value achieved by the ex-isting design. The wattage of the luminaire used for retrofit design is much lower than the existent lumi-naire, which results in a huge energy saving.
– Energy saving calculation for existing design 400 W HPS is used, having an18meter span and pole on median arrangement. Number of 400W lamp based luminaires required for the 1 km length equal to 110. Power consumption for a single 400W lamp and ballast system installed at existing pole is (400+58) W = 458 W. The total daily energy con-sumption of 400 W lamps for 12 h is (458×110×12) Wh = 604 kWh. For new design 250 W LED is used, having an 18-meter span and pole on me-dian arrangement. Number of 250W LED based luminaires required for the 1 km length is equal to 110. Power consumption for a single 250W lamp and driver system installed at existing pole is equal to (250+12) W = 262 W. The total dai-ly energy consumption of 250 W lamp for 12h is (262×110×12) Wh = 346 kWh. Hence, total dai-ly energy saving from 400W HPS lamp to 250W LED for 1km length span of road is equal to (604–346) kWh = 258 kWh.
– When the road is classifying with respect to time, another vital issue of the time dependent lighting requirements changes is appearing. Gen-erally, to classify any road, the weighting values of different traffic parameters are taken for evening peak hours. The recommended values of different lighting parameters are set considering the scena-rio of peak traffic hours. But a road that falls under a specific lighting class at evening peak hours may not fall under same lighting class at night time. The number of moving vehicles and their speed in a par-ticular road changes with time. Changes may also occur for surrounding luminance. These changes results in the change of the lighting class of the road. For VIP Road a survey was done from 6.00pm to 12pm and from 00.01am to 6.00am. The traf-fic volume differs for these two separate time span. VIP Road having M1 class, changes to M2 class for the night time, i.e. off peak hours. The use of LED based luminaire not only provides the electrical energy savings, through the reduced installed pow-er, it can also be dimmed as required. A 250 W LED luminaire is used for evening peak hours, which is dimmed to 172 W after midnight. Table 3 shows the
Fig. 3 Polar Curve & COU diagram of 400W HPS luminaire
Fig. 4 Polar Curve & COU diagram of 250W LED luminaire

Light & Engineering Vol. 26, No. 2
116
values of the photometric parameters achieved af-ter dimming.
The similar studies have been carried out in few different categories roads of Kolkata. The results have been tabulated in Tables 4,5,6,7.
5. DEMONSTRATION OF A NEW ROAD DESIGN
A new road of width 15 meter is considered, which needs to be designed. The road has motor-ized traffic condition with vehicles moving at a very high speed and no parked vehicles present. The road lighting design of this street needs to be accom-plished. The first step towards road lighting design is to find out the lighting class of the road which needs to be designed. Therefore, the lighting class of the considered road needs to be determined.
While analyzing the present scenario of the con-sidered road it’s seen that the road falls under M1 type of lighting class. Succeeding the class deter-mination, proper designing needs to be carried out. To procure an appropriate design, the recommended values of M1 class for average luminance, overall and longitudinal uniformity, threshold increment and surrounding ratio need to be satisfied. Three types of light sources are considered:
– High pressure sodium vapour (HPS),
– Metal Halide (MH), – LED. Designing is done by these light sources. Table 8
shows the comparison of the obtained values by the three different luminaires. Therefore it is preferable to use 240W LED.
Another vital issue is the time dependent chan-ges of the lighting requirements. With time the num-ber of moving vehicles in a particular road changes. Surrounding brightness may also vary with time. These changes result in the change of lighting class. For the above considered road the traffic volume is high from 6pm11pm, almost 50–60 number of ve-hicles/minute are present; with the growing hours of night the traffic volume decreases gradually, it comes down to 30–50 number of vehicle/ min from 11pm to 2am, further it decreases to 10–30 vehicle number/min from 2am to 6am.There is a change no-ticed in the surrounding brightness also, after mid-night it decreases to a lower level. Consequently, M1 type of road converts to M2 or M3 type of road. For M2 or M3 type of road the value of required lu-minance is less than that for M1 type of road.
Thus, when the luminance requirement is less, a lower wattage luminaire is required, but it’s not possible to use two different wattage luminaire (at different time span) for the same road. LED, having a dimmable functionality, is preferred be
Table 2. Comparison of the Recommended Values of Photometric Parameters, Between the Existing Design and Retrofit Design Value
Class- M1Recommended values of road lighting design parameter for motorized traffic
mentioned in CIE115, 2010
Existing lighting design of VIP Road using 400W HPS
luminaire
Retrofit design of VIP Road using
250WLEDluminaire
Lav 2.0 2.14 2.32
U0 0.4 0.36 0.5
U1 0.7 0.35 0.47
S.R 0.5 0.92 0.96
Table 3. Values of the Photometric Parameter Using a Dimmed LED Luminaire
Class- M2Recommended values of road lighting design parameter for motorized traffic mentioned in
CIE115, 2010
Retrofit design of VIP Road using 250 W LED in dimmed condition i.e. at 172W
Lav 1.5 1.49
U0 0.4 0.5
U1 0.7 0.47
SR 0.5 0.96

Light & Engineering Vol. 26, No. 2
117
used in these cases. Hence, for the considered road design with 240W LED is recommended, which can be dimmed as required. The change in the class of road with the changing hours of the day is shown in the Table 9.
With change of lighting class the requirement of luminance changes. Designing is done with dim-ming the 240W LED luminaire to 210W for M2 and 125W for M3 class, which is shown in Table10. It’s seen that the desired level of photometric values is achieved by dimming the LED luminaire. Energy required for this condition is calculated below.
240 Watt LED is used, having a 16 meter span and double row opposing arrangement. Number of 240W LED based luminaires required for the 1 km length is 126. Power consumption for a single
240W lamp and driver system installed at existing pole is (240+10) W. The energy consumption from 6pm to 11pm of 240 W lamp for 5 h is (250×126×5) Wh= 157.5 kWh. Power consumption for a single 210W lamp and driver system installed at existing pole is (210+10) W. The energy consumption from 11pm to 2 am of 210 W lamp for 3 h is (220×126×3) Wh = 83.2 kWh. Power consumption for a single 125W lamp and driver system installed at existing pole is (125+10) W. The energy consumption from 2 am to 6am of 125 W lamp for 4h is (135×126×4) Wh = 68 kWh. The total daily energy consump-tion of 240 W lamp with dimming condition for 12 h is (157.5+83.2+68) Wh =308.7 kWh. Therefore, if dimming is done then energy consumed can be further reduced to 308.7 kWh from 378 kWh. Al-
Table 4. Comparison of their Commended Values of Photometric Parameters, Between the Existing Design and Retrofit Design Value
Class- M2Recommended values of road lighting design parameter for motorized traffic
mentioned in CIE115, 2010
Existing lighting design of APC Road using
400W HPS luminaire
Retrofit design of APC Road using 250W MH luminaire
Lav 1.5 0.86 1.6
U0 0.4 0.61 0.71
U1 0.7 0.55 0.71
SR 0.5 0.98 0.95
Table 5. Comparison of Recommended Value of Photometric Parameters Between the Existing and Retrofit Design Value
Class- M3
Recommended values of road lighting design parameter for
Motorized traffic mentioned in CIE115, 2010
Existing lighting design of Purno Das Road using 400 W HPS Luminaire
Retrofit design of Purno das Road using the under mention Luminaire
135 W LED Luminaire
Lav 1.0 0.9 1.4
U0 0.4 0.71 0.67
U1 0.6 0.53 0.57
SR 0.5 0.93 0.89
Table 6. Value of the Photometric Parameter Using Dimmed LED Luminaire
Class- M4Recommended values of road lighting design parameter for Motorized traffic mentioned in
CIE115, 2010
Retrofit design of Purno Das Road using 135W LED in dimmed condition i.e. at 90W
Lav 0.5 0.82
U0 0.4 0.73
U1 0.6 0.73
SR 0.5 0.9

Light & Engineering Vol. 26, No. 2
118
most 70 kWh can be saved daily by just dimming the LED light.
Thus, for this 15meter road designing by 240 W LED luminaire is recommended, keeping the ar-rangement double row opposing with a span of 16m and height of pole 9 m. For the peak hours (6–11)pm no dimming is required, from 11pm to 2am the LED luminaire should be dimmed down to 210W and further it should be dimmed down to 125W from 2am to 6 am to obtain the most optimum ener-gy efficient design.
6. DISCUSSION
The entire paper depicts the enormous possibi-lities of changes to be inducted in road lighting de-sign in Indian scenario. The example of VIP Road as has been given here clearly reveals that possibi-lities of up gradation of road lighting design. VIP Road is a very important road with just motorized traffic. The mathematical model as modified over existing CIE suggests that the lighting class of VIP road will be M1. The existing lighting design of VIP road is made with 400 W HPS luminaire, with 10
meter mounting height, and 18 meter spacing. The measured results are appreciably less than the re-commended value. If the same is redesigned with LED maintaining the exact light level and uniform-ities as recommended for the specific lighting class, enormous energy will be saved as well as photo-metric and visual criteria are perfectly satisfying. Similarly, for Purno das Road (mixed traffic main-ly motorized) the existing lighting design is made with 400 W HPS luminaire, with 9 meter mounting height and 20-meter spacing. The measured results of the existing setup are appreciably less than the recommended value. Hence, determination of exact lighting class and their energy efficient design based upon that will be the most optimized road lighting design in all the possible way.
7. CONCLUSION
A complete optimized road design encompasses all the possible aspects of photometric require-ments as well as visual requirements with energy saving dimensioning. The optimization term will be justified in the context of energy saving as well
Table 7. Comparison of Recommended Value of Photometric Parameters Between the Existing and Retrofit Design Value
Class- M5
Recommended values of road lighting design parameter for Motorized traffic
mentioned in CIE115, 2010
Existing lighting design of Dover Lane using
135W LED luminaire
Retrofit Design of Dover Lane using 90W LED luminaire
Lav 0.5 1.01 0.53
U0 0.35 0.3 0.59
U1 0.4 0.62 0.57
SR 0.5 0.9 0.86
Table 8. Comparison of Recommended Value of Photometric Parameters Between the Existing and Retrofit Design Value
Class- M1
Recommended Values of Road Lighting Design Parameter for Motorized traffic Mentioned in
CIE115, 2010
Lighting Design of New Road using 250W
HPS Luminaire
Lighting Design of New Road
using 250 W MH Luminaire
Lighting Design of New Road
using 240W LED Luminaire
Lav 2 2.08 3.03 2.16
U0 0.4 0.69 0.3 0.8
U1 0.7 0.72 0.85 0.74
SR 0.5 0.97 0.49 0.5

Light & Engineering Vol. 26, No. 2
119
Tabl
e 9.
Cla
ssifi
catio
n of
the
New
Roa
d fo
r Diff
eren
t Tim
e S
pan
With
Res
pect
to N
ew M
odel
as
per I
ndia
n C
onte
xt
Sl
No.
Roa
d na
me
Traffi
c vo
lum
e in
./
min
Traffi
c sp
eed
km/h
Traffi
c cl
ass
Med
ian
Cro
ss
road
Sur
roun
ding
br
ight
ness
Park
ed
vehi
cle
Visu
al
guid
ance
Sum of weights (Vws)
Class of road (6-Vws)
Class as rounded up
60 and above, very high
50–60, high
30–50, moderate
10–30, low
<10, very low
>60 Very High
40–60, High
<40, moderate
Mixed with High% of non-motorized
Mixed
Motorized only
No
Yes
High (above 3 nos. \Km)
Moderate (below 3 nos.\Km)
High
Moderate
Low
Present
Not Present
Poor
Moderate or Good
Wei
ghts
weig
hts
weig
hts
weig
hts
weig
hts
weig
hts
Wei
ghts
weig
hts
10.
50
-0.5
-11
0.5
00
12
10
10
10
-10.
50
0.5
0
a)N
EW R
OAD
(6pm
-11p
m)
0.5
12
01
00
04.
51.
51
b)N
EW R
OAD
(11p
m-2
am)
01
20
10
00
42
2
c)N
EW R
OAD
(2am
-5am
)-0
.51
20
1-1
00
2.5
3.5
3

Light & Engineering Vol. 26, No. 2
120
as requirements of road lighting. The different in-ternational and national standards say about the ne-cessity of lighting classification of road. The clas-sification methodology can help categorization of different roads from the traffic importance. This paper depicts that necessity of lighting classifica-tion of road in Indian context. Moreover, it also pro-poses a specific methodology to classify the Indian road from their traffic requirement. Indian road is typically mixed in nature. Hence, this specific clas-sification methodology is suitable for lighting clas-sification of road. The validation of the model has been executed with different roads of a metro city like Kolkata, as this city roads are more complex in nature. Moreover, the novelty of the paper is that, this paper depicts, how the requirement of lighting design parameters changed, even in the low traffic hours. This categorization method, suggests a spe-cific shifting of the lighting class of a same road in different traffic hours at night time. Hence, light-ing design of the roads should be done with lumi-naires having pre-programmed multi stage dimming facilities to achieve the desired lighting parameters during different traffic hours in night time. This can lead to a huge energy saving.
The other aspect, with which the paper has been dealt with, is how this classification system can be used for sake of optimized road lighting design. The evolved lighting class of the road will ensure the exact requirement of the photometric parame-
ters for the concerned road. Hence, a step towards over designing will not at all be that frequent. The selections of luminaires as well as installation cha-racteristics are the most vital criteria for quality road lighting design. This paper clearly reveals that aspect too. The selection of luminaire for a specific road lighting application is the most important step. The positioning of the luminaires, mounting height etc. are the installation characteristics which may change an entire design in a broader dimension. Though, the spectrum of the light sources plays a significant role in road lighting design, but that aspect has not elaborated in this paper.
This paper may finally be considered as a com-prehensive guideline for optimized road lighting de-sign. As the different countries have their different requirements based upon their nature of traffic, the proposed classification metric is also a pioneering step in Indian road lighting design.
REFERENCE
1. Boyce PR, Fotios S, Richards M. Road lighting and energy saving. Lighting Research and Technology 2009; 41:245–260.
2. Kostic M, Djokic L. Recommendations for energy efficient and visually acceptable street lighting. Energy 2009; 34: 1565–1572.
3. Commission Internationale de l’Eclairage. Lighting of Roads for Motor and Pedestrian Traffic.CIE Publica-tion 115–2010, Vienna: CIE2010.
Table 10. Comparison of Recommended Value of Photometric Parameters With the Achieved Values for New Road for Different Time Span
NEW ROAD
Class- M1(6pm-11pm) Class- M2(11pm-2am) Class- M3(2am-6am)R
ecom
men
ded
valu
es o
f roa
d lig
htin
g de
sign
par
amet
er fo
r M
otor
ized
traffi
c m
entio
ned
in C
IE11
5, 2
010
Ligh
ting
desi
gn o
f new
road
us
ing
240W
LE
D lu
min
aire
Rec
omm
ende
d va
lues
of r
oad
light
ing
desi
gn p
aram
eter
for
Mot
oriz
ed tr
affic
men
tione
d in
CIE
115,
201
0
Ligh
ting
desi
gn o
f new
road
us
ing
dim
med
240
W L
ED
lu
min
aire
(210
W)
Rec
omm
ende
d va
lues
of r
oad
light
ing
desi
gn p
aram
eter
for
Mot
oriz
ed tr
affic
men
tione
d in
CIE
115,
201
0
Ligh
ting
desi
gn o
f new
road
us
ing
dim
med
240
W L
ED
lu
min
aire
(125
W)
Lav 2 2.16 1.5 1.66 1.0 1.12
U0 0.4 0.8 0.4 0.8 0.4 0.8
U1 0.7 0.74 0.7 0.74 0.6 0.74
SR 0.5 0.5 0.5 0.5 0.5 0.5

Light & Engineering Vol. 26, No. 2
121
4. IS:1944 (Parts I and II) 1970. Indian Standard CODE OF PRACTICE FOR LIGHTING OF PUBLIC THOROUGHFARES.
5. StrbacHadzibegovic N., M. Kostic M. Modifica-tion to the CIE115–2010 procedure for selecting light-ing classes for roads.Lighting Research and Technology 2016; 48: 340–351.
6. Morante P. Mesopic street lighting demonstra-tion and evaluation. Final report for Groton Utilities. Groton, Connecticut.
7. CIE140–2000, Road Lighting Calculations.8. Illuminating Engineering Society of North Ameri-
ca (IESNA) 2000. American National Standard Practice for Road Lighting, PR08–00, New York IESNA.
9. Van Bommel W. Road Lighting_Funda-mentals , Technology and Applicat ion. 2015. ISBN978–3–319–11465–1.
10.Van Bommel W. Road Lighting_Fundamentals, Technology and Application. 1980. ISBN90 201 1259 (Kluwer Edition).
Suddhasatwa Chakraborty,M.E. in Illumination Engineering with gold medal in 2006 from Electrical Engineering Department of Jadavpur University. He did his bachelor degree in Electrical Engineering. Presently he is the Assistant Professor of Electrical Engineering Department, Jadavpur University and also the Incharge of Illumination Engineering Laboratory of Electrical Engineering Department, Jadavpur University. Apart from schedule academics he is deeply involved in different research projects. His research area mainly encapsulates street lighting, human centric lighting, and human factors in lighting
Pritha Barua,Graduated in Electrical Engineering from Jadavpur University in 2015. At present, pursuing Masters in Illumination Engineering from Jadavpur University
Soumendu Bhattacharjee,Graduated in Electrical Engineering from West Bengal University of Technology in 2014. At present, he is a Master Degree student of 2nd year in Illumination Engineering, Electrical Engineering Department from Jadavpur University
Saswati Mazumdar,M.E., Ph.D, Professor.of Electrical Engineering, and Former-Director, School of Illumination Science, Engineering & Design. Jadavpur University, Kolkata, India. She has 29 years of experience in Lighting Research and Teaching, developed a modernized Illumination Engineering laboratory in Electrical Engineering Department, Jadavpur University, has founded two Masters’ Courses one Illumination Engineering and another on Illumination Technology & Design in Jadavpur University. Executed a large no. of R&D and Consultancy Projects on Illumination and allied fields

122
Light & Engineering SvetotekhnikaVol. 26, No. 2, pp. 122–128, 2018 No. 4, 2018
INFLUENCE OF GOVERNMENTAL SUBSIDIES ON GROWTH OF PHOTOVOLTAIC ENTERPRISES: EMPIRICAL
EVIDENCE FROM CHINA
Ya’ou ZHANG
College of Aeronautics Zhongyuan- Petersburg, Zhongyuan University of Technology, Zheng Zhou, 450007 China;
E-mail: [email protected]
ABSTRACT
As an emerging industry, photovoltaic industry has won strong support from the government. How-ever, many problems appear in industrial develop-ment with increasing maturation of photovoltaic in-dustrial development. The governmental effect has a critical bearing on photovoltaic industrial deve-lopment as governmental policies-driven industry. In order to investigate the influence of governmen-tal intervention on growth of photovoltaic enterpri-ses, sample data related to photovoltaic enterprises in Chinese Ashare market during 2007–2017 were selected, and the influences of fiscal subsidies and tax preferences on growth of photovoltaic enterpri-ses were analyzed. The results show that both fis-cal subsidies and tax preferences have positive pro-moting effects on growth of photovoltaic enterprises and influence of fiscal subsidies is more obvious. The conclusions provide decision-making support for the government to formulate intervening poli-cies facilitating growth of photovoltaic enterprises.
Keywords: governmental subsidies, growth, photovoltaic enterprises
1. INTRODUCTION
With rapid economic development in China, excessive resource consumption and environmen-tal damage caused by extensivetype economic de-velopment have become problems needing urgent solutions. In order to promote sustainable socio-eco-
nomic development, facilitate comprehensive up-grading of industrial structure and relieve enormous pressure brought by resource environment, trans-forming economic development mode is a feasible measure. As a renewable energy source, solar ener-gy has numerous advantages like cleanness, no pol-lution, no regional limitations, inexhaustible proper-ty, etc. Photovoltaic industry is enterprise set, which converts solar energy into electric energy through photovoltaic effect to form industrial chain of pho-tovoltaic conversion, including production of poly-crystalline silicon raw material, production of solar batteries and components, manufacturing and ap-plication of related equipment, etc. [1]. Therefore, photovoltaic industry is of environmental friend-ly feature and has drawn much concern of nation-al governments.
Governments the world over have formulated numerous subsidy policies for industrial develop-ment to promote development of photovoltaic indu-stry. Germany is the first country, which implements industrial policies to support photovoltaic indu-stry and enacted feed-in tariff subsidy policies. The United States tends to tax incentive and preferential policies [2], and China has implemented “golden roof program”, “top runner program” and all kinds of subsidy and incentive policies in order to support development of photovoltaic industry. Governmen-tal subsidy support exerts important promoting ef-fect on rapid development of Chinese photovoltaic industry [3]. Firstly, governmental subsidy policies facilitate continuous expansion of industrial scale.

Light & Engineering Vol. 26, No. 2
123
Polycrystalline silicon output reached 194,000t in 2016 with 17.5 % yearonyear growth rate. Silicon wafer output was about 63GW with 31.2 % year-on-year growth rate. Output of photovolta-ic modules was about 53GW with 20.7 % yearonyear growth rate. Added installed capacity in pho-tovoltaic grid connection reached 34.5GW with 127 % yearonyear growth rate. Proportions of pro-duction scales in various links of photovoltaic in-dustrial chain all exceeded 50 % in the globe, rank-ing the first place. Secondly, governmental subsidy policies promote good prospect of operation state of photovoltaic enterprises. In 2016, number of en-terprises occupied in photovoltaic industrial pro-duction reached over 2,000, and average profit rate of enterprises increased by 3 percentages in Chi-na. Among listed photovoltaic enterprises, 9 ones enjoyed profit growth with amplitudes exceeding 100 %. Finally governmental subsidy policies ac-celerate industrialization of advanced technolo-gies. Industrialization of a batch of highefficient crystalline silicon photovoltaic cell technologies, like black silicon texturizing, back face passiva-tion (PERC), and n-type double face, is accelerated. Average conversion efficiency of monocrystal and polycrystalline batteries has reached 20.5 % and 19.1 %; polycrystalline silicon production techno-logy has been further optimized.
It can be seen that rapid development of Chinese photovoltaic industry is closely related to growth of photovoltaic enterprises. Favourable growth of photovoltaic enterprises can promote benign deve-lopment of photovoltaic industry. As governmen-tally supported industry, rapid development of pho-tovoltaic industry can’t go without governmental policies. Governmental subsidy is a common means of the governmental supporting development of photovoltaic industry. In order to facilitate smooth and benign development of photovoltaic indu-stry, analyzing influence of governmental policies on growth of photovoltaic enterprises helps to fi-gure out action mechanism of governmental inter-vention on photovoltaic industry and provides theo-retical reference and decision-making support for formulation of governmental policies.
2. THEORETICAL ANALYSIS AND HYPOTHESES
As an important constituent part of industrial policies and fiscal policies, governmental subsi-
dy can boost economic structural adjustment. Fis-cal taxation policy refers to the fact that on the one hand, a country allocates fiscal resources, perfect scientific and technological public infrastructure, in-crease input of R&D innovation expense and reach the goal of reducing technological innovation risks of enterprises according to enterprise demands for public finance. On the other hand, it reduces en-terprise production cost through tax preferences. Po licies motivating enterprises to conduct R&D innovation and governmental fiscal taxation poli-cies implemented for enterprises can release par-tial go vernmental earnings to enterprises to real-ize governmental goal of supporting one industry so as to reduce enterprise production cost and ope-ration risk, increase profit and finally promote en-terprise development. The fiscal and taxation policy guides the role of social resources to the industries that the government wants to support, so as to en-hance the innovation and competitiveness of en-terprises. F. Bergström [4] found that government subsidies increased the economic value added of enterprises and promoted the growth of enterprises. Research conducted by K. Dongmin et al. [5] found that governmental subsidies improved enterprise operating performance and social responsibility and for state-owned enterprises governmental subsidies had more obvious improving effects on operating performance and social responsibility of private en-terprises. A. Cerqua & G. Pellegrini [6] analyzed Italian fiscal subsidy policies and found that fiscal subsidies significantly enlarged employee scale of the enterprise receiving the subsidy, investment le-vel and company growth.
The fiscal taxation policy support for photovol-taic enterprises can not only solve problems like fi-nancial difficulty encountered during enterprise de-velopment process and compensate for deficiencies of market economy but also can facilitate enterpri-ses to improve their own R&D innovation abili-ties so, as to boost growth of photovoltaic enterpri-ses. As an emerging industry, photovoltaic industry needs enormous capital input during development process due to high technical requirements, but un-avoidable contradictions still exist during develop-ment process of photovoltaic industry because of problems existing in financing mechanism and governmental supportive policy mechanism mainly in-cluding national fiscal taxation policy guidance and insufficient innovative impetus of the enterprises themselves. It’s generally believed in theoretical ex-

Light & Engineering Vol. 26, No. 2
124
ploration that the government should give full play to supportive effect of governmental fiscal subsi-dy and enhance incentive and guiding effect of preferential tax policies. The government can facilitate photovoltaic enterprises to actively innovate and boost rapid and stable development of photovolta-ic industry through coordination and cooperation of the two. Governmental fiscal subsidy and tax preference belong to the main part of fiscal taxation po-licy, so the government actively exerting effects of fiscal subsidies and tax preferences on photovolta-ic industry is of critical importance to industrial de-velopment. According to the above analysis, fiscal subsidies and tax preferences can solve problems of photovoltaic enterprises like financial difficulty and insufficient innovation ability so as to promote growth of photovoltaic enterprises, based on which the following hypotheses are proposed:
Hypothesis 1: Fiscal subsidies have positive ef-fect on growth of photovoltaic enterprises.
Hypothesis 2: Taxation preference has positive effect on growth of photovoltaic enterprises.
In addition, compared with fiscal subsidies, tax preference has some apparent defects: firstly, in terms of action objects, most preferential tax po-licies implemented in China are only effective for profitable enterprises in the same year, but for un-profitable enterprises and newly built enterprises without operation revenue yet, they can’t enjoy these preferential policies in reality. However, for large enterprises in mature stage, these newly built enterprises and medium and smallsized enterprises have more intense demands for R&D support [7]; secondly, from the time when the policies take ef-fect, tax preference exerts effect slower, and influ-ence of fiscal subsidies is more direct and rapidly; thirdly, as for cost, implementation cost of prefe-rential tax policies (like administrative cost of re-levant departments, declaration cost of taxpayers, etc.) is higher than that of fiscal subsidies [8]. Based on the above analysis, the following hypothesis is proposed:
H3: Compared with tax preferences, fiscal subsi-dy can more obviously improve growth of photovol-taic enterprises.
3. METHODOLOGY
101 listed photovoltaic companies were searched from Pole Star Solar Photovoltaic Web-site (http://guangfu.bjx.com.cn/), 33 companies lis-
ted abroad like in New York and 13 companies listed after 2007 were excluded, 55 photovoltaic en-terprises listed in Shenzhen Stock Exchange and Shanghai Stock Exchange were obtained, and fi-nally data of the 55 listed photovoltaic enterprises during 2007–2017 were selected as research sam-ples. All data used in this study were from annu-al reports announced by listed companies (source: Shenzhen Stock Exchange Website, Shanghai Stock Exchange Website and Cninf Website) and CSMAR database, and SPSS22.0 software was used during empirical analysis process to complete the models as follow:
+1= ,t 0 1 t 2 tG a + a F + a C + e (1)
+1= ,t 0 1 t 2 tG b + b T + b C + e (2)
where G is explained variable representing en-terprise growth. According to finds of R.M. Stulz on enterprise growth evaluation [9], Tobin’s Q value is selected in this study to measure growth of pho-tovoltaic enterprises. Explaining variables F and T express fiscal subsidy and tax preference respective-ly. Direct fiscal subsidy and tax refund are the most common means of governmental subsidies [10], so fiscal subsidy and tax preference are selected in this paper as explaining variables to study their influenc-es on enterprise growth. Variables in the model were fiscal subsidy and tax preference, relative indexes, which were obtained by dividing enterprise total as-set by direct subsidy amount and dividing enterprise total asset by tax preference, were respectively se-lected, and lag one variables were selected combin-ing lag features of governmental subsidies. C was combination of control variables, and photovolta-ic enterprise scale, financial leverage, technological innovation ability, equity concentration, and capital structure were selected as control variables. Con-crete variable settings are shown in Table 1.
4. RESULTS ANALYSIS AND DISCUSSION
4.1. Descriptive Statistical Analysis
Table 2 lists descriptive statistical results of ex-plained variables, explaining variables and control variables.
As shown in Table 2, mean value of compre-hensive growth scores of photovoltaic enterprises
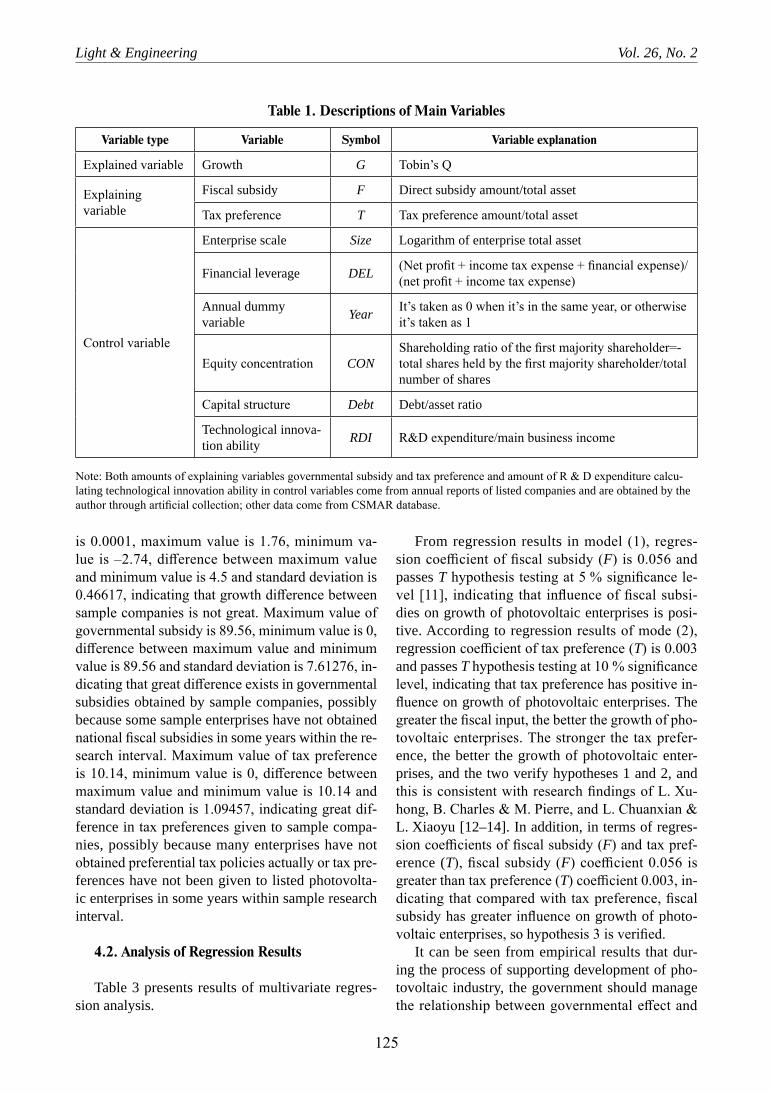
Light & Engineering Vol. 26, No. 2
125
is 0.0001, maximum value is 1.76, minimum va-lue is –2.74, difference between maximum value and minimum value is 4.5 and standard deviation is 0.46617, indicating that growth difference between sample companies is not great. Maximum value of governmental subsidy is 89.56, minimum value is 0, difference between maximum value and minimum value is 89.56 and standard deviation is 7.61276, in-dicating that great difference exists in governmental subsidies obtained by sample companies, possibly because some sample enterprises have not obtained national fiscal subsidies in some years within the re-search interval. Maximum value of tax preference is 10.14, minimum value is 0, difference between maximum value and minimum value is 10.14 and standard deviation is 1.09457, indicating great dif-ference in tax preferences given to sample compa-nies, possibly because many enterprises have not obtained preferential tax policies actually or tax pre-ferences have not been given to listed photovolta-ic enterprises in some years within sample research interval.
4.2. Analysis of Regression Results
Table 3 presents results of multivariate regres-sion analysis.
From regression results in model (1), regres-sion coefficient of fiscal subsidy (F) is 0.056 and passes T hypothesis testing at 5 % significance le-vel [11], indicating that influence of fiscal subsi-dies on growth of photovoltaic enterprises is posi-tive. According to regression results of mode (2), regression coefficient of tax preference (T) is 0.003 and passes T hypothesis testing at 10 % significance level, indicating that tax preference has positive in-fluence on growth of photovoltaic enterprises. The greater the fiscal input, the better the growth of pho-tovoltaic enterprises. The stronger the tax prefer-ence, the better the growth of photovoltaic enter-prises, and the two verify hypotheses 1 and 2, and this is consistent with research findings of L. Xu-hong, B. Charles & M. Pierre, and L. Chuanxian & L. Xiaoyu [12–14]. In addition, in terms of regres-sion coefficients of fiscal subsidy (F) and tax pref-erence (T), fiscal subsidy (F) coefficient 0.056 is greater than tax preference (T) coefficient 0.003, in-dicating that compared with tax preference, fiscal subsidy has greater influence on growth of photo-voltaic enterprises, so hypothesis 3 is verified.
It can be seen from empirical results that dur-ing the process of supporting development of pho-tovoltaic industry, the government should manage the relationship between governmental effect and
Table 1. Descriptions of Main Variables
Variable type Variable Symbol Variable explanation
Explained variable Growth G Tobin’s Q
Explaining variable
Fiscal subsidy F Direct subsidy amount/total asset
Tax preference T Tax preference amount/total asset
Control variable
Enterprise scale Size Logarithm of enterprise total asset
Financial leverage DEL (Net profit + income tax expense + financial expense)/(net profit + income tax expense)
Annual dummy variable Year It’s taken as 0 when it’s in the same year, or otherwise
it’s taken as 1
Equity concentration CONShareholding ratio of the first majority shareholder=-total shares held by the first majority shareholder/total number of shares
Capital structure Debt Debt/asset ratio
Technological innova-tion ability RDI R&D expenditure/main business income
Note: Both amounts of explaining variables governmental subsidy and tax preference and amount of R & D expenditure calcu-lating technological innovation ability in control variables come from annual reports of listed companies and are obtained by the author through artificial collection; other data come from CSMAR database.

Light & Engineering Vol. 26, No. 2
126
market, respect market laws, select proper interven-tion mode and degree, give full play to supporting effect of governmental fiscal subsidies and incen-tive and guiding function of preferential tax policies and encourage photovoltaic enterprises to conduct self-innovation so as to promote their own develop-ment. The government should enlarge capital input, support development of medium and smallsized photovoltaic enterprises and perfect pathways like capital market to promote development of photovol-taic industry from the angle of fiscal subsidy. But it should further perfect fiscal subsidy mechanism, us-ing sufficient capital to support related enterprises, which play leading roles in science and technology, while for photovoltaic enterprises with bad deve-lopment prospect or those that are disqualified, the government should respect “survival of the fittest” market rule to reduce unnecessary waste of capital. Secondly, superior resources should be integrated. R&D tasks of key technologies should be carried out by building national-level photovoltaic techno-logical development institutes and combining de-velopment status and concrete conditions of photo-voltaic industry, like studying new-type solar cells [15]. Thirdly, special funds for development of pho-tovoltaic industry should be set up to promote inno-vative R&D activities of photovoltaic enterprises.
From an angle of taxation, the government should stimulate innovation of photovoltaic en-terprises to give full play to governmental inter-vention effect by means of intensifying tax pre-ferences, formulating specialized preferential tax reduction and exemption policies and reducing cost of tax payment. Firstly, partial technological R&D expense can be used to offset certain tax to reach the
goal of improving innovation ability while reducing enterprise production and operation cost, and risk allowance for R&D can be withdrawn according to certain proportion of operation revenue of pho-tovoltaic enterprises and is allowed to be deducted before taxation by the enterprise. Secondly, scien-tific research cooperation between universities and enterprises can be promoted so that innovation abi-lities of universities and R&D abilities of enterpri-ses can be integrated and finally universities can get better understanding of actual economic develop-ment status. Enterprises’ innovation enthusiasm will surge ahead under the help of scientific research for-ces in universities so as to boost rapid and good de-velopment of photovoltaic industry. Thirdly, pro-duction cycle of photovoltaic enterprises is long, so fund withdrawal is slow, and then the government can delay tax payment like for 1–2 years to relieve pressure of photovoltaic enterprises in capital. Em-pirical analysis results indicate that supporting pho-tovoltaic enterprises through fiscal taxation policies can not only solve problems encountered during en-terprise development process like capital difficul-ty and compensate for deficiencies of market eco-nomy but also can facilitate enterprises to improve their own R&D innovation abilities so as to promote their growth.
CONCLUSIONS
In order to analyze influence mechanism of governmental subsidies on growth of photovoltaic enterprises, photovoltaic enterprises listed in Chi-nese A-share market during 2007–2017 were selec-ted in this study as sample data. An empirical ana-
Table 2. Descriptive Statistical Results of Variables
Variable Symbol Maximum value
Minimum value Mean value Standard
deviation
Growth G 1.76 -2.74 0.0001 0.46617
Fiscal subsidy F 89.56 0.00 4.8109 7.61276
Tax preference T 10.14 0.00 0.3989 1.09457
Enterprise scale Size 11.39 8.67 9.5924 0.50109
Financial leverage DEL 13.59 -13.07 1.6525 1.73527
Annual dummy variable CON 0.71 0.000 0.3481 0.14040
Equity concentration Debt 1.20 0.06 0.5311 0.17301
Capital structure RDI 0.28 0.00 0.0157 0.02795

Light & Engineering Vol. 26, No. 2
127
lysis was carried out for effects of direct subsidies and tax preferences on growth of photovoltaic en-terprises. The following research conclusions were drawn:
– Governmental fiscal subsidies have positive effect on growth of photovoltaic enterprises. As photovoltaic industry has high technical threshold, it needs input of a large quantity of capital cost. Es-pecially for newly established enterprises, direct subsidy of governmental finance can effectively in-crease R&D input in photovoltaic enterprises and reduce innovation risks of enterprises through allo-cation of financial resources.
– Governmental tax preferences have positive influence on growth of photovoltaic enterprises. The government can transfer partial revenue to en-terprises, guide and motivate photovoltaic enter-prises to carry out technological innovation activ-ities and promote enterprise self-innovation so as to reduce enterprise cost and operation risk, im-prove enterprise revenue and finally boost enter-prise development.
– Compared with tax preference, fiscal subsi-dy has more obvious effect on growth of photovol-taic enterprises. As it’s difficult for photovoltaic en-terprises to obtain capital support from traditional channel and they can’t enjoy substantial preferential tax policies in financial aspect, lack of fund is al-ways the primary problem faced by photovoltaic en-terprises during development process and it restricts enterprise growth. Therefore, fiscal subsidy can not only solve fund-lacking problem of photovoltaic en-terprises and compensate for deficiencies of market economy but also can facilitate enterprises to im-prove their own R&D self-innovation abilities so as to boost growth of photovoltaic enterprises.
REFERENCES:
1. Ming, Z., Shaojie, O., Hui, S., et al. Is the “Sun” still hot in China? The study of the present situation, prob-lems and trends of the photovoltaic industry in China. Renewable and Sustainable Energy Reviews, 2015. V43, pp.1224–1237.
Table 3. Regression Analysis
ExplainingVariable Model (1) Model (2)
F 0.056**(1.754)
T 0.003*(1.543)
Size 1.085***(–11.056)
1.054***(–10.328)
DEL 0.016(–0.628)
-0.014(–0.569)
Debt 1.758***(–6.425)
1.853***(–7.056)
RDI 3.530**(2.021)
3.352**(1.898)
CON 0.365(1.126)
0.306(0.896)
Constant 14.796***(12.756)
14.253***(12.355)
Year control control
Adjusted R2 0.452 0.456
F-test Value 31.556*** 31.895***
Notes: *, **, and *** represents significance at the 10 %, 5 %, and 1 % level, respectively, and the number in the brackets is T-test value.

Light & Engineering Vol. 26, No. 2
128
2. Ketels, C. H.M. Industrial Policy in the United States. Journal of Industry Competition & Trade, 2007. V7, #3, pp.147–167.
3. Donghua, Y., Yinan, L. Government Improper In-tervention and Overcapacity of Strategic Emerging Indus-tries: A Case Study of Chinese Photovoltaic Industry. Chi-na Industrial Economics, 2015. #10, pp.53–68.
4. Bergström, F. Capital subsidies and the perfor-mance of firms. Small business economics, 2000. V14, #3, pp.183–193.
5. Dongmin, K., Tianshang, L. Does government sub-sidy enhance corporate performance and social respon-sibility? Securities Market Herald, 2014. #6, pp.26–31.
6. Cerqua, A., Pellegrini, G. Do subsidies to private capital boost firms’ growth? A multiple regression dis-continuity design approach. Journal of Public Economics, 2014. V109, pp.114–126.
7. Qingquan, T., Danglun, L. An empirical study on the motives and effects of government subsidy: em-pirical evidence from Chinese listed companies. Journal of Financial Research, 2007. #6A, pp.149–163.
8. Wanfu, L., Jing, D. Tax Incentives, Adjustment Costs, and R&D Investment in China. Accounting Re-search, 2016. #12, pp.58–63.
9. Stulz, R.M. Tobin’s Q, Corporate Diversification, and Firm Performance. Journal of Political Economy, 1994. V102, #6, pp.1248–1280.
10. Xiaozhen, W., Jingya, Y., Yuzhu, W., et al. Review on the Influence of Government Subsidy on Firm’s R&D Input. R&D Management, 2017. V29, #1, pp.139–148.
11. Hatos, A. Clientele vs. Status Seeking? Subject Field Choice in Higher Education in the Hungarian-Ro-manian Crossborder Region. Revista de Cercetare si In-terventie Sociala, 2017. V59, pp. 153–168.
12. Xuhong, L. A positive analysis of tax preference and SME growth ability. Taxation Research, 2014. #8, pp.79–84.
13. Charles, B., Pierre, M. Are Firms that Receive R&D Subsidies More Innovative? Canadian Journal of Economics, 2009. V42, #1, pp.206–225.
14. Chuanxian, L., Xiaoyu, L. Government Subsidy, Market Development and Corporate Growth: A Literature Review. Journal of Southwest University of Political Sci-ence & Law, 2016. #3, pp.62–67.
15. Gopal, Y., Kumar, K., Birla, D., et al. Banes and Boons of Perturb & Observe, Incremental Conductance and Modified Regula Falsi Methods for Sustainable PV Energy Generation. Journal of Power Technologies, 2017. V97, #1, pp.35–43.
Ya’ou ZHANG, Master of Finance, Lecturer. Graduated from the Kharkiv National V.N. Karazin University, Ukraine. The research direction is industrial economy

129
Light & Engineering SvetotekhnikaVol. 26, No. 2, pp. 129–138, 2018 No. 4, 2018
IMPACT OF MEDIA REPORTS ON INNOVATIVE BEHAVIOURS OF PHOTOVOLTAIC ENTERPRISES: EXPERIENCE
VIEW FROM CHINA
Yaxin HE1* and Changheng ZHAO2
1School of Arts and Law, Wuhan University of Technology, Hubei, Wuhan, 430070 China; 2Wuhan University, Hubei, Wuhan, Hubei, Wuhan, 430072 China;
* E-mail: [email protected]
ABSTRACT
With flourishing development of media industry, media have exerted more and more important func-tions in the capital market. For photovoltaic indu-stry, which is an emerging industry, its innovative behaviours need support from the capital market. In order to investigate the influence of media re-ports on innovative behaviours of photovoltaic en-terprises, 43 listed photovoltaic enterprises in Chi-na Astock market were selected. 2013–2016 news reports related to photovoltaic enterprises were grabbed using Python method, and the influence mechanism of media reports on innovative beha-viours of photovoltaic enterprise was explored. The results show that media reports facilitate innovative behaviours of photovoltaic enterprises. Facilitating effect of media reports on innovative behaviours of photovoltaic enterprises further strengthen with in-creasing business revenues of the enterprises. Poli-cy-oriented media exert obvious effect on boosting innovative behaviours of photovoltaic enterprises, while market-oriented media have no significant in-fluence. The conclusions contribute to further un-derstanding of the effect exerted by media infor-mation dissemination on enterprises’ innovative behaviours.
Keywords: photovoltaic enterprise, media re-ports, innovative behaviours
1. INTRODUCTION
As economic development has greater demand for electric energy, the acquisition of electric ener-gy has become an important demand for sustainable socio-economic development. Solar power gene-ration, as a clean energy, has become an important present means of compensating for the gap of elec-tric energy. Solar photovoltaic power generation is a new technology using renewable resource – so-lar energy with advantages of cleanness, no pol-lution and renewable property, and it has played a significant role in energy development process. Nowadays solar photovoltaic power generation is one of the ideal alternative energy sources and ex-erts important effect on solving global energy short-age problem. Thus, photovoltaic industry has en-joyed rapid development.
For photovoltaic enterprises , innova-tion ability in related technologies like purifica-tion of silicon material, improvement of commer-cial silicon slice thickness, battery energy storage technology, design and installation of photovolta-ic power generation system and purification of inte-grated silicon material has constituted the core en-terprise competitiveness. Factors like background of management layer, economic system, legal environ-ment and enterprise governance structure will affect implementation of technological innovation activ-ities of photovoltaic enterprises [1–4]. With emer-gence of information economics, influence degree of media reports on enterprise innovative beha-

Light & Engineering Vol. 26, No. 2
130
viours has been gradually deepened, especially EU conducted anti-dumping investigation on photo-voltaic soda lime plate glass products with charac-teristics of iron content being lower than 300 ppm and solar transmittivity being over 88 % from Chi-na in 2013, which caused Sino-European photo-voltaic trade dispute. Mass reports of related news media resulted in fluctuation of enterprise R&D in-put. Theoretical exploration shows that influence of media reports on enterprise innovative behaviours is realized mainly by three means: manager beha-viours are improved through intervention of ad-ministrative and judicial departments due to news reports; corporate governance is improved by influ-encing reputation of enterprise management layer; management layer is influenced by market pressure mechanism [5]. Especially photovoltaic enterpri-ses have long R&D cycle in aspects of monocrys-talline silicon battery technology, polycrystalline silicon ingot casting technology, highly efficient battery technology, industrialized technology of crystalline silicon battery and special solar cell mo-dule technology, and how uncertainty of news me-dia reports impacts innovative behaviours of photo-voltaic enterprises needs further analysis.
On this basis, 2013–2016 news reports rela-ted to photovoltaic enterprises in Baidu news were grabbed using Python method as proxy variables of media reports. Proportions of total R&D expendi-tures of 43 photovoltaic enterprises listed in Chi-na A-stock market in business revenues were used to measure their innovative behaviours. The em-pirical analysis was carried out for influence me-chanism of media reports on innovative behaviours of photovoltaic enterprises using a panel measure-ment model. The effect of media information dis-semination on enterprise innovative behaviours was further revealed. The remainder of this paper is or-ganized as follows: section 2 consists of literature review and research hypotheses, which are pro-posed through organizing related literatures; sec-tion 3 is data and model design; section 4 presents results analysis and discussion; section 5 draws re-search conclusions.
2. LITERATURE REVIEW AND RESEARCH HYPOTHESES
In terms of researches on the effect of media re-ports on capital market, relevant scholars have car-ried out discussion from corporate governance angle
of media. As important external monitoring means, media generate important influence on capital mar-ket through news reports on enterprises and facil-itate improvement of enterprise management be-haviours by means of administrative intervention, reputation of management layer and external pres-sure. As for effect of media reports on enterprises, most scholars believe that media can exert external supervising effect and facilitate improvement of en-terprise governance structure [6–8]. Some scholars have drawn the conclusion that media form exter-nal pressure on enterprise management layer so as to manipulate enterprise earnings management [9]. No matter that media reports exert market super-vising effect of generating market pressure. The in-fluence of media reports on enterprise behaviours is irrefutable. Because the enterprise innovations are long-term investment behaviour full of uncer-tainties, it is needed the enterprise should tolerate short-term risk [10]. In terms of internal manage-ment layer of the enterprise, it is keener on invest-ing on those projects with low risk and fast benefit gain out of consideration of its own benefit [11], and this is socalled principalagent problem. Media re-ports can effectively reduce agency cost through ex-ternal supervising mechanism so as to strengthen su-pervision of management layer, eliminate enterprise short-sighted behaviours and facilitate the manage-ment layer to enhance innovation. Therefore, hy-pothesis 1 is proposed:
Hypothesis 1: Media reports will promote inno-vative behaviours of photovoltaic enterprises.
In terms of technology-intensive photovoltaic enterprises, technological innovation is core com-petitiveness. Continuous improvement of innova-tion ability is an important path to improve its own core competitiveness [12]. Within the enterprise, in-novation is a systematic project needing its powerful financial support as backup force, and financial sup-port is a beneficial guarantee for innovative quality [13]. In aspect of the relationship between external capital and enterprise innovative behaviours, Brown et al. [14] discussed influence of external financing environment on enterprise innovative behaviours, and found that enterprise revenue in stock market improved its risk tolerance degree so as to enhance innovative force. Leiming et al. [15] found that en-terprise innovative capital came from venture in-vestment. Relative to bank capital or stock market, venture investment could more tolerate short-term failure and risk so as to facilitate innovation. Hui-

Light & Engineering Vol. 26, No. 2
131
dong et al. [16] discussed influence of external ca-pital on enterprise innovative behaviours from bond financing angle, and found that internal capital is of greater freedom and flexibility for enterprises. For rapidly growing photovoltaic enterprises, they can use acquired revenues to provide continuous support for enterprise innovation so as to form be-nign interaction between enterprise innovation and growth. Therefore, good financial status is the pre-condition for enterprises to conduct innovative be-haviours. Hypothesis 2 is obtained:
Hypothesis 2: Favourable business revenue growth of the enterprise exerts positive regulat-ing effect under the precondition of media reports, namely expanding the positive influence of media re-ports on enterprise innovative behaviours.
In the era of big data, diversification of infor-mation acquisition channels has become an indis-pensable constituent part in daily life. Content cre-ated by media information and its depth as well as transmission speed and breadth of media informa-tion play a vital role in exertion of media informa-tion effect during media “information creation – in-formation transmission – information effect” [17]. For the print media reports, they can be divided into policy-oriented media and market-oriented me-dia. Some scholars have carried out a large number of researches on corporate governance effects of the two-type media report. Miller [18] found that com-pared with policy-oriented media, market-orient-ed media had more significant governance effect on enterprises. Policyoriented media served the go-vernment and its reports on enterprise behaviours would draw concern from supervision department, so it could generate supervising effect on enterprise management layer so as to improve enterprise go-vernance effect [19]. Dongyan [20] investigated the influence on media reports on enterprise earn-ings management behaviours, and found that rela-tive to policy-oriented media, market-oriented me-dia brought about higher pressure to management layer. As for enterprise innovative behaviours, mar-ket-oriented media and policy-oriented media have different influences. For policyoriented media, me-dia reports on enterprises can make the enterprises obtain greater innovative capital support from gov-ernmental level so as to further facilitate enterprise innovative behaviours. For market-oriented media, its audience groups are different from those of poli-cy-oriented media due to lack of authority, and influ-ence of market-oriented media reports on enterprise
innovative behaviours is insignificant. Therefore, hypothesis 3 is proposed:
Hypothesis 3: Policy-oriented media will ex-ert facilitating effect on innovative behaviours of photovoltaic enterprises while market-oriented me-dia have insignificant influence on innovative beha-viours of photovoltaic enterprises.
3. METHODOLOGY, DATA AND VARIABLES
3.1. Data Source and Variables
As for selection of proxy indicators of network media reports, day parting searching of Chinese lis-ted photovoltaic enterprises in 2013–2016 Baidu news (www.news.baidu.com) was conducted using Python method, and annual news quantities con-taining enterprise abbreviations were selected as in-dicators of network media reports. In order to pre-vent data accuracy problem generated by change of enterprise names, abbreviations of listed photovol-taic enterprises in different years were respectively searched. In terms of selection of reports made by policy-oriented media and market-oriented media, this study referred to method of Peigong et al. [21]. China Securities Journal, Securities Daily, Securities Times and Shanghai Securities News were selec-ted as policy-oriented media and 21st Century Busi-ness Herald, The Economic Observer, CBN Daily and China Business were selected as market-orient-ed media. The 8 newspapers were grabbed in “Du-xiu” database. Their news reports on listed photovol-taic enterprises were summarized into corresponding policy-oriented media report quantities and mar-ket-oriented media report quantities.
As for selection of enterprise innovation indi-cators, total R&D expenditures and R&D expendi-ture proportions of the above listed enterprises were taken as proxy variables of enterprise innovation. Meanwhile with a reference to precedent experi-ence, rate of return on total assets (ROA), enterprise size (SIZE), assetliability ratio (LEV), salary of en-terprise management layer (SALARY), growth rate of business revenue (Grow), institutional sharehold-ing ratio (ISR) and proportion of liquid asset in to-tal assets (Liqu) were selected as control variables to verify influence of media reports on enterprise in-novative behaviours. All of the above data derived from WIND database. Due to data availability, sam-ple cycles were selected as years from 2013 to 2016.

Light & Engineering Vol. 26, No. 2
132
Definitions and descriptions of the variables are shown in Table 1.
3.2. Model
According to research hypotheses, panel data mo-dels were established to analysis the influence of media reports on innovative behaviours of photo-voltaic enterprises, and concrete model setting was as below:
, 1 , 2 i,t 3 ,
4 , 5 , 6 , 7 ,
,
1
+ .i t i i t i t
i t i t i t i t
i t
HEJI u MEDIA ROA ISR
Liqu LEV SIZE SALARY
Year
β β β
β β β β
ε
= + + + +
+ + + +
+ +
(1)
, 1 , 2 ,
, 3 , 4 i,t 5 ,
6 , 7 , 8 ,
9 , ,
1 1
.
i t i i t i t
i t i t i t
i t i t i t
i t i t
HEJI u MEDIA MEDIAGrow Grow ROA ISR
Liqu LEV SIZESALARY Year
β ββ β β
β β ββ ε
= + + ×× + + + ++ + + ++ + +
(2)
Table 1. Definitions and Descriptions of Variables
Variable name Definition Descriptions
MEDIA1 Network media reports
Stock abbreviations of listed photovoltaic enterprises in Baidu news are searched to obtain network media report quantities. MEDIA1=LN (1+ number of media reports)
MEDIA2 Policyoriented media reports
News reports by four newspapers – China Securities Journal, Securities Daily, Securities Times and Shanghai Securities News – on listed pho-tovoltaic enterprises are searched through the “Duxiu” database to ob-tain policyoriented media report quantities. MEDIA2=LN (total report quantity of 1 +4 media)
MEDIA3 Marketoriented me-dia reports
News reports by four newspapers21st Century Business Herald, The Economic Observer, CBN Daily and China Business – are searched through the “Duxiu” database to obtain quantities of marketoriented media reports. MEDIA3=LN(total report quantity of 1+4 media)
BILIProportion of enter-prise expenditure in innovation
Total R&D expenditure/business revenue
HEJITotal enterprise expenditure in innovation
Natural logarithm of total enterprise R & D expenditure
Liqu Asset liquidity Liquid asset/total asset
Grow Growth rate of busi-ness revenue Growth of business income/total business revenue in the last quarter
LEV Asset-liability ratio Total liabilities/total assets
ROA Rate of return on total assets Net profit/average total assets
ISR Institutional share-holding ratio
Proportion of total quarterly institutional shareholdings in tradable shares of the listed enterprise
SIZE Enterprise’s total assets Natural logarithm of average quarterly assets of the listed enterprise
SALARY Salary of manage-ment layer Total annual salary of enterprise management layer

Light & Engineering Vol. 26, No. 2
133
, 1 , 2 ,
3 i,t 4 , 5 , 6 ,
7 , 8 , ,
2
+ .i t i i t i t
i t i t i t
i t i t i t
HEJI u MEDIA Grow
ROA ISR Liqu LEV
SIZE SALARY Year
β β
β β β β
β β ε
= + +
+ + + +
+ + + +
+
(3)
, 1 , 2 ,
3 i,t 4 , 5 , 6 ,
7 , 8 , ,
3 + + .
i t i i t i t
i t i t i t
i t i t i t
HEJI u MEDIA Grow
ROA ISR Liqu LEV
SIZE SALARY Year
β β
β β β β
β β ε
= + +
+ + + +
+ + + +
(4)
In the above models, model 1 was used to verify the influence of media reports on innovative beha-viours of photovoltaic enterprises. Interactive terms between growth rate of enterprise business revenue and media concern were added to model 2. Model 3 was used to analyze the influence of policyoriented media on innovative behaviours of photovoltaic en-terprises. Model 4 was used to verify the influence of market-oriented media on innovative behaviours of photovoltaic enterprises. i represents enterprise and t represents year.
4. RESULTS ANALYSIS AND DISCUSSION
4.1. Descriptive Statics and Correlation Testing
Table 2 shows descriptive statistical results of va-riables. From media report quantities, report quan-
tity of network media was far larger than those of policy-oriented media and market-oriented me-dia, indicating enormous influence of network me-dia on the society. Moreover, kurtosis and skewness of all variables were small, indicating that all vari-ables presented concentrated distribution with strong symmetry.
In order to control collinearity between variables, Pearson correlation analysis between variables was conducted. Network media report quantity repre-sented media report and total expenditure in innova-tion represented innovative behaviour of photovol-taic enterprises. According to test results in Table 3, the correlation between model variables was low without multicollinearity, which guaranteed scient-ificity and feasibility of model setting and variable selection.
4.2. Hypothesis Testing
Table 4 describes the influence of media con-cern on enterprise innovation. Model 1 investigated the influence of network media reports on innova-tive behaviours of photovoltaic enterprises. Inter-active terms between growth rate business revenue and network media reports were added to model 2 to verify regulating the effect of the receivable growth rate on innovative behaviours of photovol-taic enterprises on the precondition of media re-ports. Model 3 studied the influence of policyori-
Table 2. Statistical Description of Variables
Variable Number of observations Mean Standard
deviation Minimum Maximum Skewness Kurtosis
MEDIA1 172 5.947 1.006 4.454 10.127 2.196 9.467
MEDIA2 172 1.279 0.969 0 3.871 0.096 2.031
MEDIA3 172 0.595 0.785 0 3.296 1.103 3.458
BILI 172 0.033 2.840 0 0.201 2.268 12.31
HEJI 172 15.895 5.922 0 21.139 -2.183 6.157
ROA 172 0.021 0.089 0.645 0.182 -4.227 28.32
LEV 172 0.515 0.188 0.059 0.972 -0.138 2.959
Liqu 172 0.476 0.215 0.035 0.943 -0.291 2.429
Grow 172 0.118 0.258 0.464 1.196 1.494 7.152
SIZE 172 22.28 1.165 20.22 26.33 0.674 3.997
ISR 172 0.466 0.170 0.047 0.865 0.2662 2.597
SALARY 172 5.163 0.542 4.193 6.973 0.737 3.991

Light & Engineering Vol. 26, No. 2
134
ented media reports on innovative behaviours of photovoltaic enterprises. Model 4 investigated the influence of marketoriented media reports on inno-vative behaviours of photovoltaic enterprises. Re-gression results are seen in Table 4.
Model 1 verified the influence of network me-dia reports on innovative behaviours of photovol-taic enterprises. According to results, media report coefficient was 1.635 which reached 5 % signifi-cance level, namely every time network media re-ports increased by 1 percentage, enterprise R & D expenditure would increase by 1.635, percentages. Results show that as network media report quanti-ty of enterprises increases, photovoltaic enterprises will enlarge R&D input, which verifies enterprise governance effect of media, it means that media in-crease exposure degree of enterprises through re-porting on listed photovoltaic enterprises, reduce information asymmetry of capital market and ge-nerate supervising effect on enterprise management layer. Media reports on advantages of photovoltaic power generation like cleanness, safety, universal-ity, free maintenance, resource sufficiency and po-tential economic efficiency [22], which can further expand market acceptance degree of photovoltaic products. Enterprises will adopt behaviours which are more helpful for long-term enterprise develop-ment like enlarging R&D input so as to strengthen enterprise competiveness. Hypothesis 1 was veri-fied. Therefore, media should take full advantage of enterprise governance effect of media reports, en-
large information report and information disclosure of listed enterprises and relieve information asym-metry in the market so as to form constraint over en-terprise management layer. Meanwhile, longterm supervising mechanism of media should be estab-lished so as to reinforce reports on listed photovol-taic enterprises and conduct ongoing reports on en-terprise behaviours. As a result, agency cost will be reduced and short-sighted behaviours of enter-prise management layer will be eliminated. Moreo-ver, enterprises will input more capital and energy into technological research and development link so as to promote long-term healthy development [23].
Interactive terms between growth rate of enter-prise business revenue and network media reports were added to model 2. It could be known from mo-del results that network media reports presented significant positive correlation with enterprise in-novative behaviours. In addition, interactive term coefficients, on which the emphasis was laid, were significant positive values, indicating that growth of business revenue had positive regulating effect on enterprise innovative behaviours: with increase of media reports, growth of enterprise business re-venue further boosted promoting effect of media re-ports on enterprise innovation. According to previ-ous analysis in this study, favourable financial status and development trend constituted foundation for enterprise innovation. Enterprise capital strength would be stronger with its rapid development and it would put efforts into research and develop-
Table 3. Correlation Test of Variables
HEJI MEDIA1 SALARY ROA ISR Liqu Grow LEV SIZE
HEJI 1.000
MEDIA1 0.193** 1.000
SALARY 0.239*** 0.090 1.000
ROA 0.171** 0.026 0.282*** 1.000
ISR 0.161** 0.337*** 0.135*** 0.212*** 1.000
Liqu 0.396*** 0.016 0.143* 0.011** 0.006 1.000
Grow 0.111 0.062 0.179** 0.095 -0.002 0.184** 1.000
LEV 0.156** 0.109 0.060 0.299** 0.039 0.151** 0.052 1.000
SIZE 0.185** 0.287*** 0.286*** 0.164** 0.304*** 0.386** 0.051 0.319*** 1.000
Notes: *, ** and *** represents significance on the 10 %, 5 % and 1 % level, respectively.

Light & Engineering Vol. 26, No. 2
135
ment. Therefore, positive influence of media reports on enterprise innovative behaviours would be fur-ther reinforced with growth of enterprise business revenue, and then hypothesis 2 was verified.
Model 3 explored the influence of policyorient-ed media reports on innovative behaviours of pho-tovoltaic enterprises, and media report coefficient was 0.962 with statistical significance. This indi-cated that every time policy-oriented media reports increased by 1 percentage, the enterprise R&D ex-penditure would increase by 0.962 percent. Thus, it could be seen that enterprise innovative behaviours would be further improved with growth of report
quantity made by policyoriented media. From the previous analysis in this study, policy-oriented me-dia had governmental background, so their news reports were of certain authority and would gene-rate great influence on enterprise management lay-er. Reports made by policy-oriented media on listed photovoltaic enterprises represented governmen-tal voice to a considerable degree, and on the one hand, it would facilitate enterprise management lay-er to improve enterprise management, while on the other hand, it would enlarge governmental capital support for enterprise innovation. As a result, the enterprise would enlarge innovative R&D input.
Table 4. Regression Analysis Results
Variable Model 1 Model 2 Model 3 Model 4
MEDIA1 1.635**(2.20)
1.406*(1.92)
MEDIA2 0.962***(2.66)
MEDIA3 0.481(1.03)
MEDIA1*Grow 1.666*(1.70)
Grow 10.875(–1.33)
0.674(–0.58)
0.616(–0.50)
LEV 2.724(0.68)
2.216(0.56)
1.632(0.41)
1.706(0.42)
ISR 0.735(0.16)
0.546(0.12)
0.943(0.21)
2.402(0.53)
SIZE 1.908*(–1.84)
1.835*(–1.77)
1.749*(–1.70)
1.662(–1.57)
Liqu 0.028(0.01)
-0.078(–0.02)
0.464(–0.09)
0.688(–0.13)
ROA -0.097(–002)
0.133(0.03)
-0.741(–0.19)
-1.413(–0.35)
SALARY -0.478(–0.38)
-0.327(–0.26)
0.567(–0.46)
0.016(0.01)
Constant 47.75**(2.05)
45.70**(1.98)
53.858**(2.30)
49.473**(2.07)
Year Control Control Control Control
Adj Rsquared 0.19 0.20 0.20 0.16
N 172 172 172 172
Notes: *, ** and *** represents significance on the 10 %, 5 % and 1 % level, respectively. Number in the brackets is the standard error (Se).

Light & Engineering Vol. 26, No. 2
136
Model 4 explored the influence of marketori-ented media reports on innovative behaviours of photovoltaic enterprises. It’s found that media re-port coefficient was not significant. This indicat-ed increase of report quantity made by marketori-ented media on photovoltaic enterprises would not generate significant influence on enterprise inno-vative behaviours, possibly because market-ori-ented media lacked constraint effect on enterprise management layer compared with policy-orient-ed media. Their news reports could not receive enough attention from enterprise management lay-er, which would not react to market-oriented me-dia reports, so enterprise government effect of these
media could not be generated. Hypothesis 3 was verified then.
Based on analysis results, both network me-dia reports and policy-oriented media reports have significant positive effects on enterprise innovative research and development. Therefore, media them-selves will enhance their reports on photovoltaic en-terprises and take full advantages of their enterprise governance effect in order to improve enterprise in-novative behaviours. Marketoriented media will in-tensify negative reports on photovoltaic enterprises so as to form supervising effect on enterprise mana-gement layer and realize enterprise governance ef-fect of market-oriented media.
Table 5. Robustness Test
Variable Model 1 Model 2 Model 3 Model 4
MEDIA1 0.180**(2.47)
0.159**(2.32)
MEDIA2 0.078**(2.35)
MEDIA3 -0.004(–0.08)
MEDIA1*Grow 0.232*(1.91)
Grow 1.909**(–2.57)
0.497***(–4.48)
-0.499(–4.39)
LEV 0.234(0.59)
0.129(0.35)
0.048(0.13)
0.047(0.13)
ISR 0.157(–0.35)
-0.073(–0.18)
0.069(0.17)
0.265(0.63)
SIZE 0.181*(–1.78)
0.136(–1.45)
0.125(–1.31)
-0.112(–1.15)
Liqu -0.749(–1.50)
-0.738(–1.61)
0.821*(–1.77)
0.855*(–1.80)
ROA 0.244(0.61)
0.373(1.02)
0.225(0.62)
0.146(0.39)
SALARY -0.027(–0.22)
0.021(0.19)
0.016(0.14)
0.084(0.72)
Constant 4.38**(1.92)
3.38(1.61)
3.99*(1.85)
3.44(1.56)
Year Control Control Control Control
Adj Rsquared 0.17 0.32 0.29 0.26
N 172 172 172 172
Notes: *, ** and *** represents significance on the 10 %, 5 % and 1 % level, respectively. Number in the brackets is the standard error (Se).

Light & Engineering Vol. 26, No. 2
137
4.3. Robustness Test
In order to verify the reliability of the above re-sults, proportion of R&D expenditure of listed pho-tovoltaic enterprises was taken as proxy variable of enterprise innovative behaviour while other variab-les were unchanged to conduct regression analysis. Results are seen in Table 5.
As seen in Table 5, network media and poli-cy-oriented media still have positive promoting ef-fect on enterprise innovative behaviours. But in-fluence of market-oriented media on enterprise innovative behaviours is insignificant. As for regu-lating effects of enterprise business revenue on me-dia reports and enterprise innovative behaviours, results in model 2 still show significant positive reg-ulating effect. It means that after replacement of ex-plained variable, model results are basically identi-cal with previous part in this study, which verified reliability of the conclusions.
5. CONCLUSIONS
Media reports and innovative behaviours of pho-tovoltaic enterprises were taken as research objects in this study. Network media reports, policy-orient-ed media reports and market-oriented media reports on photovoltaic enterprises were extracted using Py-thon method. Panel models were established to ve-rify the influence of media reports on enterprise in-novative behaviours. The following conclusions are then obtained.
(1) Media reports exert positive promoting ef-fect on innovative behaviours of photovoltaic enterprises.
(2) Positive promoting effect of media reports on R&D innovation of photovoltaic enterprises is further enhanced with growth of enterprise business revenue.
(3) Policyoriented media exert obvious boost-ing effect on innovative behaviours of photovoltaic enterprises while influence of marketoriented me-dia on innovative behaviours of photovoltaic enter-prise is insignificant.
Besides type division, media reports can also be divided according to nature of reported contents. To-tal media report quantity can represent media con-cern, but for enterprises, influence degree of ne-gative reports on enterprises is greater. In further research, the influence of positive and negative me-dia reports on enterprise innovative behaviours can
be discussed through division of media report con-tents so as to enrich researches within this field.
REFERENCES:
1. Hirshleifer, D., Teoh, H. Are overconfident CEO’s better innovators? Journal of Finance, 2012. #4, pp.1457–1498.
2. Chava, S., Oettl, A., Subramanian, A., et al. Bank-ing deregulation and innovation. Journal of Financial Eco-nomics, 2013. V109, #3, pp.759–774.
3. Acharya, V. V., Baghai, R. P., Subramanian, K.V. Wrongful discharge laws and innovation. The Re-view of Financial Studies, 2013. V27, #1, pp.301–346.
4. Jun, W., Genfu, F. Heterogeneous Institutional In-vestor, Nature of Firm and Independent Innovation. Eco-nomic Research Journal, 2012. #3, pp.53–64.
5. Dyck, A., Zingales, L. The corporate governance role of the media. Working Paper, 2003.
6. Dyck, A., Volchkova, N., Zingales, L. The corpo-rate governance role of the media: Evidence from Russia. The Journal of Finance, 2008. V63, #3, pp.1093–1135.
7. Dongmin, K., Shasha, L., Qianwei, Y. The role of the media in corporate behaviour: eliminate or encour-age? Management World, 2013. #7, pp.145–162.
8. Kaiguo, Z., Qianwei, Y., Chang, Z. Can Me-dia Coverage Improve Corporate Governance? Evidence from Fraud by Listed Firms in China. Journal of Financial Research, 2016. #6, pp.193–206.
9. Zhongbo, Y., Gaoliang, T., Yongmei, Z. Me-dia Coverage, Institutional Development and Market Re-action to Earnings: A Further Investigation about Market Pressure Hypothesis. Accounting Research, 2012. #9, pp.40–51.
10. Holmstrom, B. Agency costs and innovation. Journal of Economic Behavior and Organization, 1989. #4, pp. 305–327.
11. Bertrand, M., Mullainathan, S. Enjoying the quiet life? Corporate governance and managerial preferences. Journal of Political Economics. 2003. #2, pp.1043–1075.
12. Siping, L., Yongda, Y. Technology transfer, “re-turnees” and technological innovation of enterprises: an empirical study based on China’s PV industry. Manage-ment World, 2012. #11, pp.124–132.
13. Petkova, A.P. How to Judge What Can’t Be Seen and Touched? The Contingent Effect of Media Reputa-tion on Young Firms’ Access to Venture Capital. Corpo-rate Reputation Review, 2014. #4, pp.273–289.
14. Brown, J., Fazzari, S., Petersen, B. Financing In-novation and Growth: Cash flow, External Equity and

Light & Engineering Vol. 26, No. 2
138
the 1990s R&D Boom. Journal of Financ, 2009. #4, pp.151–185.
15. Leiming, F., Difang, W., Yahui, Z. Is VC a more active investor? Evidence from innovation Investment of enterprise Board listed Enterprises. Journal of Finan-cial Research, 2012. #10, pp.125–138.
16. Huidong, L., Yuejun, T., Jingjing, Z. Innovate with your own money or with someone else’s money? Research on the financing structure and enterprise inno-vation of Chinese listed Enterprises. Journal of Financial Research, 2013. #2, pp.170–183.
17. Hui, H. An Empirical Research on Market Reac-tion and Firm Performance after Negative Media Cover-age. China Soft Science, 2013. #8, pp.104–116.
18. Miller, G.S. The Press as a Watchdog for Ac-counting Fraud. Journal of Accounting Research, 2006, #5, pp.1001–1033.
19. Dong, L., Peng, F., Dan, Y. Media Type, Me-dia Coverage and Internal Control Quality of Listed Firm. Accounting Research, 2015. #4, pp.78–85.
20. Dongyan, M. Media attention: Market supervi-sion or market pressure – research based on enterprise earnings management behavior. Macroeconomics, 2015. #11, pp.106–118.
21. Peigong, L., Yifeng, S. The Corporate Govern-ance Role of Media: Empirical Evidence from China. Economic Research Journal, 2010, #4, pp.14–27.
22. Fantidis, J. G., Bandekas, D. V., Vordos, N. Study of a Wind/PV/Battery hybrid systemCase study at Pla-ka in Greece. Journal of Engineering Science & Technol-ogy Review, 2015. V8, #5, pp.6–11.
23. Gourbi, A., Bousmaha, I., Brahami, M., et al. Numerical study of a hybrid photovoltaic power supply system. Journal of Power Technologies, 2016. V96, #2, pp.137–144.
Yaxin HE, Master Degree Candidate of Journalism and Communication. Currently studying in Wuhan University of Technology. The direction of research is visualization of news and new media of communication
Changheng ZHAO, Doctor of Public Economics. Currently studying in Wuhan University. Research interests focus on industrial economy

139
Light & Engineering SvetotekhnikaVol. 26, No. 2, pp. 139–147, 2018 No. 6, 2018
EXAMINING OCCUPANCY AND ARCHITECTURAL ASPECTS AFFECTING MANUAL LIGHTING CONTROL BEHAVIOUR
IN OFFICES BASED ON A USER SURVEY
Arzu CILASUN KUNDURACI, Tuğçe KAZANASMAZ, and Truus HORDIJK
Yaşar University, Izmir Institute of Technology and Delft University E-mail: [email protected]
ABSTRACT
Further understanding the building occupants’ needs and behaviors can reduce lighting energy consumption. This research explores how the occupancy and interior architectural aspects become effective in manual lighting control in offices. It involves a multiple sectioned questionnaire focusing on the possible architectural factors such as the desk position, the surface colours, the distance to window, the distance between desk and lighting switch, and inquiring participants’ manual lighting control behaviour through the photographs of modified interior layouts, surface colours and time intervals. Statistical methods are used to determine the significant aspects, which may reduce the use of lighting control. Interior layout, distance to window, time of the day, and number of occupants in the offices are the most significant contributions to the manual lighting control behaviour. To pay attention in these contributions, it would be possible to reduce the use of electricity for lighting while user satisfaction increases.
Keywords: lighting energy consumption, manual lighting control, interior layout, user behaviour
1. INTRODUCTION
User behaviour is the action involving the presence of users and the way of performing their activities in the building [1, 2]. One possible action to decrease lighting electricity use has be
come the users’ control over the lighting systems due to its inevitable impact on total energy consumption [3–5]. Manual lighting control, which is a sub-branch of user behaviour, is the switch on/off control by the user without any automatic control systems involvement.
Only a few of user behaviour studies have focused on manual lighting control [6]. Reinhart (2004) reviewed an extensive literature on existing user behaviour models for manual lighting control [7]. He emphasized the Hunt’s and Newsham’s model, generating switch on/off probabilities, assuming that users control the lights twice a day (upon arrival and on departure) and daylight illuminance has a strong role in switching on behaviour [7, 8]. Both models did not, yet, consider the switch on/off events during occupation period, i.e. for lunch or short breaks [7]. Pigg (1996) figured out that absence time proportionally determines the switching off probability [9]. Bourgeois et al. (2005) mentioned studies about “active” and “passive” users according to their stochastic functionality and dynamic responses to shortterm changes in lighting conditions considering occupancy patterns [6, 10]. The active user referred to those who seek for optimal use of daylight, that controls artificial lighting and shading during the day, while the passive user referred to those who undertake no actions towards the lighting system during day [10, 11]. A recent study dealt with occupants’ lightinguse patterns as a function of electricity usage of lighting and switchon times in offices. It

Light & Engineering Vol. 26, No. 2
140
defined users as active and their relation to illu-minance was significantly strong [5]. Daylight il-luminance and absence time are two key variab-les; and users are categorized as active and passive due to their action type. Arrivals and leaves dur-ing the occupation period are other subject matters in this sense.
It is realized that architectural aspects have not yet been analyzed in relation to manual controls. For example, the relation of manual lighting con-trol to occupants’ desk position and distance to win-dow (which affects the direction of daylight coming on the desk area) to manual lighting controls are not inquired yet. Similarly, although daylight illumi-nance has a powerful influence on lighting switch on/off actions, window area, distance to window and interior surface colours (walls, ceiling, floor), which determine the amount of illuminance, are not subjected to any correlation with the manual light-ing control. Besides, triggering or inhibiting factors of lighting control (to turn on/off the lights) actions need to be explored since occupants’ illuminance preferences vary significantly among each other. If the users’ expectations, preferences and underlying reasons are understood in relation to architectural aspects, the manual lighting control could be modi-fied to be more effective.
Utilizing such knowledge, architectural design can have an active role in energy savings revising/or enhancing the users’ manual control action. If complexity of user actions complementing to light-ing conditions and control are figured out thorough-ly, such information would be integrated in simula-tions to predict energy consumptions.
The purpose of this study is to examine the in-fluence of the occupancy rate and the architectur-al aspects of offices on manual lighting control behaviour to generate user behaviour data on ma-nual lighting control. The research process involves a questionnaire, which was applied to the academic staff of the university in İzmir, Turkey. The ques-tionnaire explores the spatial, visual and contextual factors that influence user behaviour. This research design addresses two research questions:
1. Do changes of interior architectural aspects (such as desk position, distance to window, distance to switch, surface colours, and orientation) in an of-fice affect manual lighting control behaviour?
2. How the occupancy rate (absence and occu-pancy time intervals) influence manual lighting con-trol frequency?
2. SURVEY DESIGN
A multiplesectioned questionnaire was deve-loped to reveal the participants’ current experience of her/his working environment and manual light-ing control behaviour within their office. Consider-ing that limited amount of daylight penetration may trigger the manual lighting control behaviour, the questionnaire was conducted during winter, specif-ically in February 2015. The participants were pro-vided with a finite time, i.e. one month, which they had to keep in mind when answering the questions – for instance, “how would you describe the daylight availability in your office for the last month? / the amount of light at this work area for the tasks you performed in the last one month: …”.
Participants are academic staff using offices at the university that is located in Izmir. Academic staffs enter/leave their offices frequently during the day depending on their lectures, seminars and mee-tings, which would provide a variation of user be-haviour to examine. Invitations to this survey were sent /distributed via email to participants. A to-tal of 125 (60.8 % females and 39.2 % males; the age of 85 % < 36) out of 398 participants (approx. 30 %) voluntarily submitted the questionnaire forms through ‘Survey’ (a questionnaire domain), which runs the statistical evaluations.
The questionnaire includes a variety of ques-tion formats such as multiple-choice, Likert-scale and yesno questions. It is mainly composed of five sections that are described in detail below.
The first section of the questionnaire focuses on the architectural/physical conditions of the par-ticipants’ current offices, and aimed to relate partic-ipants’ visual satisfaction and manual lighting con-trol preferences, which were gathered in subsequent sections. It involves a list of 9 multiplechoice ques-tions, such as number of people working on the of-fice, orientation of the room, total area of windows etc. The required information of the existing office environment was asked on the following two ques-tions. Knowing the distance between their desk and the window (less than 1m, 1m2m, 2m5m, more than 5m) would be useful to interpret how they ben-efit from daylight penetration on their workplace. Collecting data about the interior layout (i.e, when sitting on the desk, whether the window is on the left, right, back, front or other) provides an insight into daylight penetration direction. Besides, the daylight illuminance on their desks may have dis-

Light & Engineering Vol. 26, No. 2
141
tinct and varying evaluations about their visual en-vironment depending on the direction of occupants’ view (whether the occupant is facing window -front layout- or facing wall -back layout). Participants were also asked to indicate whether they suffer from glare or not.
The second section of the questionnaire evalu-ates the satisfaction with daylighting availability and artificial lighting environment separately with a format of five level Likert rating designating as 1=not very satisfied, 2=unsatisfied, 3=medium, 4= satisfied, 5= very satisfied. A subsequent semantic scale is constructed to collect information on how participants assess the amount of light in the room, on the desk and at the computer screen. It ranged from –2, too dim, to +2, too much, with a neutral value of 0 corresponding to the right amount of lighting. Besides that, users were asked to define the tasks (such as working with computer, read-ing or writing) they accomplish, and their frequen-cies, using a five scaled rating. The frequency scales are composed of five categories, such as; 1=all the time, 2=most frequent, 3=sometimes, 4=rarely and 5=never.
Questions of the third section concentrate on ma-nual lighting control habits and subjective reasons behind it. To reveal participants’ manual lighting control actions, first they were asked to describe the frequency of their manual lighting control through the day. Then, four groups of questions were asked about reasons effecting their manual lighting con-trol or inhibiting their control; aspects influencing them to turn on the lights; and the ones not to turn on (such as visual comfort needs, indicating occu-pancy, colleagues’ request, creating an atmosphere etc.) were measured on a Likert scale from 1(al-ways) to 5(never). Each listed item in Figs. 1a–1d is subjected to Likert scale. Regression analysis were performed to test which reasons relate most strong-ly to the frequency of changing the lighting con-dition. Each group of listed item was significantly tested due frequency of participants’ lighting control at a level of 0.05 confidence. Each item also was included separately and some aggregate per group was implemented as well.
The fourth section is composed of questions about the employee’s subjective impression of how their current office layout and whether any archi-tectural changes therein may affect their use of ma-nual lighting control. Here, closed ended questions would be a useful and efficient way to get informa-
tion about what participants have in their mind. The first question, rated on a five point Likert scale is ‘how would you rate the following interior archi-tectural factors in terms of increasing your manu-al lighting control?’: ‘position of your desk’, dis-tance between your desk and window’, ‘window area’, ‘orientation of the window’, ‘surface/or ob-jects colour in the room’, ‘distance between switch and your table’. The second question aimed to learn to what extent they agree with the following state-ment which starts with ‘my manual lighting control increases with’ the subsequent factors: ‘a change in my desk’s position related to window’, shorten-ing the area between my desk and window’, ‘en-larging the window, ‘a change of the orientation of the window’, ‘colour of the objects area’/surfaces/room’, ‘shortening the distance between the switch and my table’. Responses were obtained on a scale ranging from ‘1’ = agree to ‘5’ = disagree.
To find out participants’ response to modifica-tions in surface colour and time of the day, photo-graphresponse yesno questions were used in the fifth section. These questions are based on a 1/5 scale model of a single occupied office (3.6 m × 5.4 m × 2.7 m) [12]. The model (Fig.2) becomes the demonstration for each photograph case. Expo-sure adjustments of photographs were implemen-ted using Photoshop to avoid possible visual illu-sions and provide balanced brightness contrasts. Participants used the same screen all through the questionnaire, which prevented the visual percep-tion differences.
The interior surfaces were covered with darkcoloured (surface reflectance (ρ) of walls and floor are 0.50 and 0.20) paper firstly; then with light coloured (ρ: 0.85 and 0.50) paper secondly. The re-flectance was calibrated with a calibrated reflec-tion disc with a reflection coefficient of 95.2 %. The scale model was placed in front of a North-facing window at the TU Delft Architecture and Built En-vironment Faculty (520.00’ N, 40.37’ E). The pho-tographs were taken with a digital camera with fish eye lenses, on Dec. 21, 2014. The model faces north to reduce high contrast differences and to avoid visual discomfort caused by direct sunlight. Diffuse daylight penetration provides relatively balanced daylight distribution during the day.
The scale model was photographed three times at the same day: respectively, at entrance in the morning (09:00–09:30), at midday after lunch (13:00–13:30) and in the afternoon after a short

Light & Engineering Vol. 26, No. 2
142
Fig.1. Listed factors effect on manual lighting control

Light & Engineering Vol. 26, No. 2
143
break (15:00–15:30). Participants were asked to in-dicate their manual lighting control action while looking at the photographs for these three diffe-rent time intervals. Based on the aspects of visual environment of the photographs, they stated their decisions as either “I would turn on the lights” or “I would not turn on the lights” upon entrance. The dependency of their decisions to control lights, on distance to window, desk position and time of the day, were analyzed through cross tabulations and chisquare tests.
3. SURVEY FINDINGS
Regarding the questions about the existing en-vironment, 26 % of participants work single, while 17 % share the office with 1–2 people, 24 % share with 3–4 people and 32 % share the office with 5 or more people. The rates of the offices with 15m2–30m2 window area is 51.2 %, while 16 % of offic-es have smaller than 15m2 window area and 32,8 % of offices have more than 30m2 window area. The major room orientation is North with a 20.8 % rate, while the percentage of other orientations ranged from 1.6 % to 16.8 %. The distance to window var-ied from 1m to 2m for 40.8 % of respondents while 31.2 % of them declared that the distance is less than 1m. The majority participants do not suffer from glare in their offices (92 %).
When the respondents were asked to rate their sa-tisfaction of the artificial lighting condition in their office, the highest “satisfactory” responses were ob-tained from participants who work in single and 3–4 peopleoccupied offices, both with a similar rate of 80 %. The participants who work in the 5–6 peo-ple sharing offices gave the highest “unsatisfied” re-sponses. Type of artificial lighting system was not questioned considering the wide variety of lamp and luminaire types, and respondents may not be capa-ble of describing the existing system. In the latter,
users are more likely to find the illuminance hig-her than what they would wish (80 %). This output can be interpreted as, if they would have the chance to control the lights individually, they would pre-fer lower illuminance, which leads to less energy consumption. This outcome corresponds with Gu’s study (2011) [13] that there will be energy savings with individual lighting control, since there are al-ways some occupants who prefer illuminance low-er than the fixed lighting levels. Such a finding can provide feedback to architects, in terms of promot-ing them to design single occupied or up to 3–4 peo-ple occupied working spaces, to contribute in elec-tricity savings. Another possibility, for crowded offices, can be the design of desks with personal visual comfort, with personal lighting.
Almost 50 % of respondents whose offices face North were satisfied with the daylighting condi-tion in their working environment, due to their choice of indicating “4-very satisfied” in the ques-tionnaire form. A similar rate of satisfaction was observed among respondents in North-East facing offices. Among the responses about various desk po-sitions, left positioned desks have the highest value of satisfaction (with almost 50 %), while the back position has gathered the lowest (approx.30 %). As the window area was the matter to find out its rela-tion to daylight fulfillment, highest satisfaction re-sponses (approx. 42 %) were given by the respondents with window areas of 2m2–5m2. Participants’ responses verified that the ones, who have a dis-tance of more than 5m between their desks and win-dow, consider the daylight penetration as too dim. Participants, whose desks are (1–2) m away from the window, were in majority in declaring the day-light penetration “sufficient”.
To figure out whether daylight satisfaction was independent of orientation, desk position, win-dow area, distance to window or not, chisquare test of independence tests and cross-tabulations
Fig. 2. Scale model and photographs for Back and Front layout (upper), Left and Right layout (lower), with light surfaces

Light & Engineering Vol. 26, No. 2
144
were applied at a 5 % level of confidence (α=0.05). Daylight satisfaction was dependent of only two aspects: window area and distance to window. Re-sults, indicated independency of orientation and desk position on participants’ daylight satisfaction, are in Table 1.
Respondents were asked to indicate their ideas to the each given statements which proposes a mo-dification increase their manual lighting control. Orientation of the window (81 %) and enlarging the window area (79 %) are the most commonly chosen factors to increase manual lighting control. Shorten-ing the distance between the desk and the window (Always 31 %, Generally 43 %), changing colours of the surfaces (Always 22 %, Generally 29 %), and changing the desk’s position (Always 37 %, Gen-erally 32 %) are the other significant modifications on lighting control behaviour; while the distance between the switch and table (Always 11 %, Gen-erally 14 %) has the least effect. However, users’ opinions on how the above listed modifications can influence their control behaviour were conflicting with their responses on daylight satisfaction in their actual work environment.
Almost 57 % of the participants control the light-ing system manually several times a day depending on either their absences or daylight penetration. They do not operate the lighting system only dur-ing entrance and departure; so they can be catego-rized as active users. 21 % of the participants claim that they control it twice a day (only when they en-ter in the beginning of the day and when they leave at the end of the day); while 9 % of them state that, they control it before/after lunch and breaks, ad-ditional to their control in their morning entrance and evening departure. Yet, 13 % of them indicat-ed that generally they do not control lighting sys-tems manually. So, 34 % of the participants can be grouped as passive users. The above data show that the assumption in studies and models, which iden-tifies all users as passive, is not realistic. This study
shows the importance of taking the user behaviour realistically.
The majority of the participants (39 % and 40 % respectively) declare that the main reason for ma-nual lighting control is to provide visual comfort and to create atmosphere for work; in other words, to fulfil their tasks. To save energy (by 21 %) has become the second meaningful personal motiva-tion to control the lighting system. Indicating their occupancy/or absence has no or a very slight impact on control decisions of 52 % and 20 % of partici-pants. Response rates for the two factors; ‘compu-ter work’ and ‘reading printed text’ are quite simi-lar, meaning that, one type of task does not have a stronger effect on users’ control behaviour than the other one has. Almost 27 % of the participants never take into consideration their colleagues’ demand of lighting control; 32 % of participants turn on/or off the lights because of colleagues’ demands, even they do not prefer it themselves. Thus, individual lighting control for each workstation can be a good solution for obtaining visual comfort.
Regarding associations of each listed reasons to affect manual lighting control (as explained in Section 2.2.3, when aggregate per group was tested, a low value of R2 is calculated as 0.12 (group in Fig. 1a), 0.04 (group in Fig.1b), 0.04 (group in Fig. 1c) and Significance F and p values are greater than 0.05. Results are not reliable so, lis-ted items are decreased, only two individual items, obtaining visual comfort (Significance F=0.002, p=0.002) and creating atmosphere for work (Signif-icance=0.002, p=0.001), are found to be significant-ly related to manual control with almost 0.10 R2. That means, we can explain/predict the 10 % of the variation among data. For example, visual comfort, alone, might affect manual lighting control without a major contribution. This makes sense and is rea-sonable; since, manual control decision is a human action and many other factors might be influential and some cannot be predictable. Not noticing the
Table 1. Chi-Square Results
Pearson chi-square (χ2-crit) p-value
Orientation 33.267 0.405 independence
Desk position 10.588 0.834 independence
Window area 18.407 0.018 dependence
Distance to window 24.024 0.020 dependence

Light & Engineering Vol. 26, No. 2
145
changes in illuminance is the only significant factor (Significance F=0.042, p=0.04), which inhibits the users to control light.
Almost 72 % of respondents consider that modifications on interior layout can be effective on their control behaviour. Accordingly, the window area (39 %Always, 40 % Generally), its orienta-tion (37 %Always, 44 %Generally), position of the desk (37 %Always, 32 %Generally) and dis-tance to window (31 %Always, 43 %Generally) were defined to have a strong effect while distance between switch and table (18 %Rarely, 40 %Nev-er) was found to be the least effective factor. Colour of the surfaces has shown no strong effect among the response rates.
To understand participants’ reactions accor-ding to the desk layout, distance to window, sur-face colours of the walls, and time of the day, they were asked to give feedback by looking to photo-graphs of given indoor scenes of the scale model. Those feedbacks could be derived from two choic-es; “I would turn on the lights” or “I would not turn on the lights”. Chisquare test of independence was applied to reach a deep and notable understanding whether manual lighting control was independent of the above mentioned interior factors or not.
First, participants’ manual lighting responses to two different distances to window (A and B) were compared significantly. When the desk was in Back position and the surfaces were light, con-trol responses showed very slight or no variation if the desk was moved away from the window. After the ‘afternoon break’, the control action displayed variation. The rate which corresponds to 32,8 % of respondents turning on the lights was raised up to 40.8 % when the desk moves to away from the window in B position. After lunch arrival, the re-verse was happened. The responses of 36 % for turning the lights on decrease to 32,8 % when the desk was in B position. When the desk was in Front position, the approx. 88–96 % of respondents pre-fers not to turn on the lights during the day. In the morning, a strong drop was observed in rates of responses “I would not turn on the lights” (11 % to 2.41 %) when the desk is moved near the back wall in B position.
Crosstabulations and chisquare tests are ap-plied to figure out statistically whether there is any significant relation between distance and turn on/off behaviour. The implication for each case of lay-out and surface colour according to time (morning,
lunch and afternoon) was iterated extensively. Re-sults on a total of 24 cross tabulations for each time interval – morning, lunch, afternoon break – se-parately indicate that the turning on/off behaviour is dependent to distance to window since p-val-ues are below α=0.05 in all cases (p=0.000) except only Left A-B in the afternoon (χ2= 2.65, df=1, p= 0.104).
When manual lighting control responses of Back are compared to Front, significant differences are achieved in all time intervals (morning, lunch and afternoon break). For example, during morning en-trance “turn on the lights” response is 57,6 % for Back B Light, while it falls to 2,41 % in Front B Light under same conditions. Similar results are valid for Back A Dark and Front A Dark during morning entrance. For Back A position, the response of “not turn on the lights” is 8 %, while it increases to 84 % for Front A desk position. However, the re-sponse percentages of Right and Left desk positions do not vary significantly with each other compared to Back-Front. For instance, “not turn on the lights” response Left A Dark (after lunch) is 87,2 %, while under same conditions Right A Dark positioned desk responses reduces to 45,6 %. Chisquare tests and cross-tabulations reveal the dependency of ma-nual control behaviour on desk position according to very low p-values (p<0.001) except the positions of Front-Back B in the morning entrance and lunch (χ2= 2.30, df= 1, p=0.129 and χ2 = 3.34, df= 1, p= 0.067), FrontBack A(dark) in the morning (χ2 = 0.29, df= 1, p=0.589).
Such an outcome is noteworthy not only in de-veloping architectural design merits but also in en-hancing technical ways to evaluate daylight per-formance and energy efficiency in working spaces. Users’ desk layout can be involved as a cer-tain affecting variable/or constant in performance and energy calculating tools. Additionally, person-al issues can be integrated to get a deep understand-ing and insight. A further study can analyze in detail how a left-hand writer receiving daylight from the left side satisfies differently than a right-hand writer in the same layout; and how the lighting electricity is consumed or saved in both cases.
To understand whether the time of the day reflect to respondents’ manual lighting control or not, pho-tographs were taken at three different time moments (morning entrance, lunch and afternoon break). Us-ers most likely attempt to turn on the lights for all desk positions and surface colours during morn-

Light & Engineering Vol. 26, No. 2
146
ing entrance. For example, the percentage of “turn on the lights” response for Left A Light condition is 65.85 % during morning entrance, while it reduces to 4,8 % and 4 % for after lunch and break entran-ces respectively. After Lunch and after Break manu-al lighting control responses are closer to each other when compared to after morning responses. Chisquare tests of independence applied to 48 cross tabulations supported the significant relation among manual lighting response to time of the day. Signi-ficantly low pvalues ranged from 0.000 to 0.003. However, a few observations such as relations bet-ween morning and lunch in Left A-Light posi-tion (χ2 =3.27, df=1, p=0.070) and between morn-ing and afternoon in Left A-Light position (χ2= 0.46, df= 1, p=0.496) constitute the independency with higher p values.
4. DISCUSSIONS AND CONCLUSIONS
This research aimed to statistically determine the contribution of certain factors (such as architectur-al and occupancy) to manual lighting control beha-viour and user comfort within the university offices. Testing the relation between the physical environ-ment and satisfaction of daylight conditions among the given parameters, window area and distance to window are found to be the two most significant and dependent aspects on users’ daylight satisfac-tion. On the other hand, neither orientation nor po-sition of the desk was found to have a statistically significant effect on daylight satisfaction.
Some factors are found to be remarkable on how they affect manual lighting control. In detail, North/North East orientation, the window area of 2–5 m2 and distance to window of 1–2 m are specifically identified as sufficient for successful daylight con-ditions. Such conditions would increase the number of people not turning on the lighting when entering the office. Responses show that most of the partici-pants can be classified as “active” users, since they don’t only turn on the lights during their entrance in the morning, and turn off them in their depar-ture at the end of their working period, as defined by Love (1998) [10], but frequently do control dur-ing the working period. These results are in con-trast with the European Standards, where the value of manual control factor (occupancy dependency factor) is implemented as 1 (which means the lights are switched on during the working hours and us-ers are passive) indicating that users do not control
the lighting system during the day [14]. This active user behaviour can contribute to energy savings sig-nificantly, yet it is impossible to determine the sav-ing with the data obtained in this study. A further study that analyzes the energy savings according to different user profile can be suggested. Obtaining visual comfort and creating atmosphere have signi-ficant impact on switching the lights, while energy saving has not such a strong impact when compa-red to them. That is interesting to realize that ener-gy consciousness is less of a motivation than the wish for comfort. The reason may be the unaware-ness of users about the amount of energy they are consuming, so energy use takes place without any conscious considerations as mentioned in Toth et.al. 2013 [15].
Interior layout modification (change of loca-tion of desks) has been the strongest deriving force in the manual lighting control as supported sig-nificantly through analyses. For instance, locating desk close to window (in A position) and/or posi-tioning desk facing window result as lower rates of switch on behaviour. These two factors were significantly affecting for all time moments. Such findings are similar to Thorndike et al.’s outputs [16], where interior layout affects user behaviour. Lighting control behaviour differs due to changes in daylight penetration. When the daylight pene-tration is not sufficient (especially in the morning), it triggers users to switch on the lights upon en-trance. Thus, daylight illuminance should be taken into consideration when predicting lighting energy consumption.
Users’ contribution on improving energy sav-ings should not be underestimated. This study in-tends to enrich the knowledge on user behaviour in lighting energy consumption by analyzing pos-sible effective factors and interpret how they influ-ence the manual lighting control. The listed findings of manual lighting control frequency, with trigger-ing and inhibiting factors, can be used as inputs dur-ing ecofriendly office design without using any au-tomatic lighting control systems, but only the users. Furthermore, this study revealed to give best in-sight to user preferences, raise awareness on their manual lighting control actions, and point on how users should be realistically included in user be-haviour models. To deliver energy efficient buil-dings, a more sophisticated understanding of user behaviour is needed, and interior design parameters should be taken into consideration for that purpose.

Light & Engineering Vol. 26, No. 2
147
REFERENCES
1. Hoes, P., Hensen, J.L.M., Loomans, M.G.L.C., de Vries, B., Bourgeois, D. User Behaviour in Whole Build-ing Simulation. Energy and Buildings 41(3): 295–302.
2. Mahdavi, A., Pröglhöf C. User Behaviour and En-ergy Performance in Buildings. In 6. Internationalen En-ergiewirtschaftstagung IEWT 2009, TU Wien, 2009, pp. 1–13.
3. Tetlow, R.M., Beaman, C.P., Elmualim, A.A., Coul-ing. K. Simple Prompts Reduce Inadvertent Energy Con-sumption from Lighting in Office Buildings. Building & Environment, 2014. V81, pp. 234–242.
4. Yang, L., Yan, H., Lam. J. Thermal Comfort and Building Energy Consumption Implications – A Review. Applied Energy, 2014. V115, pp. 164–173.
5. Yun, G.Y., Kim, H.,. Kim, J.T, Kong. H. J. 2012. Ef-fects of Occupancy and Lighting Use Patterns on Light-ing Energy Consumption. Energy and Buildings, 2012. V46, pp. 58–152.
6. Bourgeois, D., Reinhart, C., Macdonald. I.A. As-sessing the Total Energy Impact of Occupant Behavioural Response to Manual and Automated Lighting Systems. In Ninth International IBPSA Conference, Montreal, Cana-da, 2005, pp. 99–106.
7. Reinhart, C.F. Lightswitch2002: A Model for Manual and Automated Control of Electric Lighting and Blinds A Versio. Solar Energy, 2004. V77, pp. 15–28.
8. Hunt, D.R.G. The Use of Artificial Lighting in Re-lation to Daylight Levels and Occupancy. Building and Environment, 1979. V14, pp. 21–33.
9. Pigg, S., Eilers, M., Reed. J. Behavioural As-pects of Lighting and Occupancy Sensors in Privates Offices: A Case Study of a University Office Building. ACEEE1996 Summer Study on Energy Efficiency in Buildings, 1996, pp. 161–70.
10. Love, J.A. Manual Switching Patterns in Private Offices. Lighting Research & Technology, 1998. V30, pp. 45–50.
11. Bourgeois, D., Reinhart, C., Macdonald, I. Adding advanced behavioural models in whole building energy simulation: A study on the total energy impact of manu-al and automated lighting control, Energy and Buildings, 2006. V38, pp. 814–823.
12. Hellinga, H. Daylight and View; The Influence of Windows on the Visual Quality of Indoor Spaces. Tech-nische Universiteit Delft, 2013.
13. Gu, Y. The Impacts of Real-Time Knowledge Based Personal Lighting Control on Energy Consump-tion, User Satisfaction and Task Performance in Offices. Carnegie Mellon University, 2011.
14. PrEN15193–1, Energy performance of buildings; Energy requirements for lighting, 2007.
15. Toth, N., Little, L., Read, J.C., Fitton, D., Hor-ton M. Understanding Teen Attitudes towards Ener-gy Consumption. Journal of Environmental Psycholo-gy,2013. V34, pp. 36–44.
16. Thorndike, A.N., Sonnenberg, L., Riis, J., Barr-aclough, S., Levy, D.E. A 2Phase Labeling and Choice Architecture Intervention to Improve Healthy Food and Beverage Choices. American Journal of Public Health, 2012. V102, pp. 527–33.
Arzu CILASUN KUNDURACI, Ph. D. held a Doctor of Philosophy in Architecture from Izmir Institute of Technology. She has 7 years of academic experience in architectural
lighting design, architectural design and environmental system design. At present, she is an Assistant Professor in Faculty of Architecture at Yasar University, Turkey
Tuğçe KAZANASMAZ, Prof. Dr., held a Doctor of Philosophy in Building Science from Middle East Technical University (METU). She has 18 years’ academic experience in architectural lighting,
building physics and energy efficient design. At present, she is a Professor in Department of Architecture in İzmir Institute of Technology, Turkey
Truus HORDIJK, Assoc. Prof. Dr., held a Doctor of Philosophy from TU Delft. She has 31 years academic experience in building physics. At present, she is an Associate Professor Building Physics in the Faculty of Architecture in TU Delft

148
Light & Engineering SvetotekhnikaVol. 26, No. 2, pp. 148–155, 2018 No. 4, 2018
COST-BENEFIT ANALYSIS UNDER THE DSM MODEL OF GREEN LIGHTING
Yanjiang GONG*, Jiang LI, Wenshuang YU, Runbing YANG, and Tiejun ZHOU
Tangshan Power Supply Company, State Grid Jibei Electric Power Company Limited, China *E-mail: [email protected]
ABSTRACT
Based on the concept of DSM and the require-ments of the demonstration project, the DSM mo-del of green lighting was studied, carrying out the costbenefit analysis. Combining the characteristics of the demonstration area, first of all, the costben-efit of different interest subjects was analyzed. Sec-ondly, the association rules algorithm was analyz-ed in detail, and the costbenefit was analyzed by the association rules algorithm. Finally, the sensi-tivity analysis of the key factors, affecting the cost and benefit of each interest subject, was done by us-ing the algorithm. And it is concluded that the user subsidy rate and consumer electricity price are the key factors that affect the user’s willingness to use green lighting technology and power grid enterpri-ses to implement DSM measures.
Keywords: DSM model, green lighting, elec-tricity saving technology, cost benefit analysis
1. INTRODUCTION
Green lighting is the concept proposed by the na-tional environmental protection agency in the ear-ly 90s of the last century. The complete green light-ing contains 4 indexes, which are efficient, energy saving, environmental protection, safety and com-fort. The implementation of demand side mana-gement (DSM) in the electricity side mining ter-minal electricity saving potential to a large extent, can effectively improve energy utilization efficien-cy, energy saving and emission reduction [1]. Green lighting energy saving technology as a means of
DSM technique, can effectively reduce the peak load and improve the characteristics of power grid, improve power supply reliability. However, the ap-plication of the technology in the electric side will increase the purchase cost of energy saving light-ing products [2]. The Power Grid Corp will decline due to the sale of electricity and reduce electrici-ty generation enterprise income, also as a result of the implementation of DSM measures and affect the benefits and costs [3]. Therefore, in the current so-cial background of energy saving and emission re-duction, it is necessary to analyze the cost bene-fit of the relevant stakeholders from the economic perspective. In view of this, this paper was based on the cost efficiency method [4]. From the four as-pects of the user, the power grid enterprises, power generation enterprises and the whole society on the energy saving technology of green lighting in the electricity are terminating by cost benefit analysis. Moreover, this paper conducted a sensitivity analy-sis of the key factors that affect the interests of the main costs and benefits, so as to reduce the risk of decisionmaking departments [5].
2. STATE OF THE ART
The feasibility of evaluating a DSM technolo-gy requires costbenefit analysis. We assume that B is the full benefit of the implementation of a DSM technology, C is the total cost of implementing a DSM technology, ΔB is net income, and ƿ is the cost and return ratio [6]. Obviously, only when the B=B-C≥0 or =B/C = 1, the implementation of a DSM technology is feasible. Whether or not the

Light & Engineering Vol. 26, No. 2
149
income is greater than or equal to the cost is the basic judgment basis for evaluating the feasibility of a DSM technology or energy conservation pro-ject and the possibility of largescale populariza-tion and use of the green lighting technology in the electric terminal [7]. Based on the basic principle of costbenefit analysis in respective to the four as-pects of the user, the power grid enterprises, power generation enterprises, and the whole society ana-lyzing the cost and benefit of energy saving tech-nology in the green lighting electricity terminal [8]. And the sensitivity analysis is made to the key fac-tors that affect the cost and benefit of each interest subject [9].
The example analysis results show that it is fea-sible to carry out the green lighting power saving technology at the power consumption terminal, and the user subsidy rate and the resident consump-tion price are the key factors to decide the feasibili-ty of the green end lighting technology [10].
3. METHODOLOGY
3.1. User Cost-benefit Analysis
The cost and benefit of the user were analyzed. In user cost analysis, users’ participation in green lighting projects needs to pay additional costs for changing incandescent lamps into energyefficient lighting products. That is, direct cost or increased purchase cost of equipment can be expressed as:
( , ) ( , ) ( , ),
( ).c j k j k j kj J k K
Cc C n N∈ ∈
= ∑ (1)
Among them:
( , ) ( / ) / ( ),c j k j j b b b jC P Q Q P p p= − − (2)
( , ) 0 ( , ),
.j k j kj J k K
N N i∈ ∈
= ∑ (3)
In the formula, Cc is the total direct cost of us-ers, yuan /W, K is the user category collection that participates in green lighting power saving projects, mainly including residents, shopping malls, hotels and restaurants. J is a collection of green lighting products. Currently, more mature and simple mea-sures for lighting and electricity saving are main-ly using compact fluorescent lamps (commonly
known as energy saving lamps) instead of incan-descent lamps or instead of common inductance ballasts for fluorescent lighting. Cc (j, k) is the direct cost of saving 1 W electricity using seventh types of green lighting products for class k users, yuan /W; n(j, k) uses seventh types of green lighting products to replace the number of original lighting products for class k users. N(j k) has the intention to replace the original lighting products with seventh types of green lighting products for class k users. Re-spectively, Qb, Qj are the average life of the ori-ginal lighting products and seventh kinds of green lighting products, h; pb, pj, respectively, the power of the original lighting products and seventh kinds of green lighting products, W; N0 is the total num-ber of users in a certain area, i(j, k) is willing to re-place the original lighting products with the j class green lighting products for class k users. The ana-lysis of the benefit of the user is done. The bene-fit of users using energy saving lighting products is the energy saving income in the life period of the product. It is accumulated by all kinds of users in-volved in the project of green lighting saving. The energy saving benefits obtained by users during the life period of green energy saving lighting products are as follows:
( , ) ( , ) .c j k c j k kB W P= ∆ (4)
Among them:
3( , ) ( , ) ( , )( ) 10 .c j k b j j j k i kW p p Q n N −∆ = − × (5)
In the formula, ( , )c j kB is the power saving benefit of class k users using seventh kinds of green light-ing products, yuan; ( , )c j kW∆ is used for class k us-ers to use class J green lighting products for energy saving, kW/h; Pk is class k user lighting consump-tion price, yuan / kW/h. In the period of static invest-ment recovery, the static investment recovery period of users using all kinds of energy-saving technology is one of the key factors that affect the willingness of users to participate in this DSM measure. The stat-ic investment recovery period for users using green lighting products is as follows:
( , )3 3
/.
( ) 10 10j j b b c k j
jk j b j k j
P Q Q P CT
P h p p P h− −
−= =
− × × (6)

Light & Engineering Vol. 26, No. 2
150
In the formula, hj is the lighting time in hours for seventh types of green lighting products per day.
3.2. Cost-benefit Analysis of Power Grid Enterprises
For user subsidies, whether residents, shopping malls or hotels, or restaurants, the basic premise for users to adopt green lighting power saving techno-logy is to recover more cost from electricity saving than to conventional technology. Even a shorter pe-riod of static investment recovery is required. Other-wise, users generally do not use this technology un-less the power company grants users until the user feels profitable. The amount of the power company’s subsidy to the user is related to the user’s ideal static investment recovery period (Tid). If the user’s ideal static investment recovery period only needs to meet the lifespan days of lighting technology (Qj/hj), then the power grid enterprises do not need to subsidize users, that is, the subsidy amount is Cs=0. If the user hopes that the ideal static investment recovery peri-od is shorter than the Tj, the power grid enterprises need to subsidize the users. The number of subsidies per 1W is:
3
0 // .
10
j id j j
j j b bsk j id id j
b j
T T Q hP Q Q PC
P h T T Tp p
−
≤ ≤ −= − × ≤ −
(7)
In addition, the rate of user subsidy can be de-fined as
( , )/ [0,1].s c j kC Cη η= ∈ (8)
For management costs, the power company takes on the cost of each phase of the feasibility study, de-
sign, implementation and supervision of the DSM measures, which mainly has administrative mana-gement, design, evaluation, technical support and other costs, collectively known as the cost of ma-nagement, expressed in Cm, usually accounting for 10 %~20 % of the cost of compensation. For the loss of electricity sales, the reduction of electricity con-sumption due to the use of energyefficient lighting products is equal to the loss of electricity sold by the power company due to the implementation of the DSM measures. The corresponding losses of the sale of electricity are as follows:
( , ),
[( ) ].loss c j k kk K k j
I W P∈
∆ = ∆∑ ∑ (9)
For the benefit analysis of power grid enterprises, the first is to avoid the cost of electricity purchase. The cost of avoiding electricity purchase is mainly reflected by the reduction of the power supply of the peak load on the power supply side, which is caused by the use of energy saving lighting products. Then the cost of power purchase is reduced, so the cost of electricity purchase can be avoided.
( , ),
( ) / [(1 )(1 )]b c j k Bk K j J
M W P l m∈ ∈
∆ = ∆ − −∑ (10)
In the formula, PB is the unit purchase cost of power grid enterprises, yuan / (kW h); l is the ter-minal distribution loss coefficient, and l is the trans-mission loss coefficient of the power grid. The cost of electricity can be avoided. As the terminal load of power supply line is reduced, the loss of supply and distribution power supply will be reduced. The eco-nomic benefit caused by the loss of transmission and distribution loss can be seen as the avoidable elec-tricity cost of the power grid enterprise, that is:
Fig.1. Head table and FPtree
Support numberproject Node
chain
d
c
a
b
7
6
5
4
null
d(7)
b(1)a(2) c(6)
a(3) b(2)
b(1)

Light & Engineering Vol. 26, No. 2
151
( , ),
.l k c j kk j
M P f W∆ = ∆∑ (11)
Among them:
1/ [(1 )(1 )] 1.f l m= − − − (12)
In the formula, f is the loss coefficient of the transmission and distribution.
3.3. Association Rule Algorithm
Apriority algorithm is based on continuously constructed set, screening item sets mining the fre-quent item sets, and each screening needs to scan all the original data. So, the original data needs to be repeatedly scanned, when the original data quan-tity is large, efficiency is relatively low. So, ways should be proposed to reduce the number of scan-ning the original data, simplify the frequent item sets mining strategy, simplify the calculation, and shorten the time. In order to avoid the defects of the Apriority algorithm, J. Han et al. proposed the FPGrowth algorithm. This algorithm does not pro-duce candidate frequent item sets, which only needs to scan the original data two times and compress the original data through the FPtree data struc-ture, having high efficiency. Therefore, for a large amount of data under the condition of mining fre-quent item sets, FPGrowth algorithm is a more ef-ficient algorithm.
The socalled FPGrowth is the frequent pat-tern of growth. The idea of this algorithm is to con-struct a frequent pattern tree (FPtree) with frequent item sets on the premise of preserving the informa-tion of the item set by the first scan. Then the fre-quent pattern tree is differentiating into several con-ditions of library, these conditions database mining. FPGrowth algorithm is divided into two steps: con-struct and recursive FPtree mining FPtree con-struction. By two data scanning, will compress the original data in the transaction to a FPtree. The FPtree is similar to the path prefix tree, and the same prefix can be shared, so as to achieve the purpose of compressing data. Then, through the FPtree, to find the conditional pattern base and conditions of each project FPtree, FPtree mining conditions recursively get all frequent item sets. Similarly, the main steps of FPGrowth algorithm are introduced for example given earlier.
First, the construction of FPtree, scan-ning the entire database of a single item of frequent item sets and their support are :5, : 4, : 6, : 7, :1a b c d e , respectively. The minimum support number is 1 and the result set in descending order is A= , , , d c a b . Then we can construct FPtree. First, build an empty root node, and then scan the database second times, cre-ating branches for each order according to the previ-ous degree of support. For example, there are a, b, d, e in order 1. The support ranking is three branches, d (7) – a (5), empty nodes connect to d, d is connec-ted to a; the branch node of order 2 is d (7) b (4). At the same time and so on, create a header table, and the recording project support and node, convenient behind mining convenient traversal. The frequent pattern tree and the head table are shown in Fig.1.
Then the FPtree is excavated recursively. Start-ing from the last item of the item table (the lowest support), the condition pattern base for each project is built. Calculate all the paths that project contain, and the prefix path of the project is the condition-al pattern base. For example, the paths that include the b project are d-b, c-a-b, c-b, d-c-b. Among them, the prefix path of b is d, dca, c, dc, which is the conditional pattern base of the b project. Then, un-der the constraint of minimum support, the condi-tion tree of the project is constructed by the set of conditional pattern base of the project. The condi-tion tree of b is presented in Fig.2.
The minimum support number is 1 for all the combinations of frequent item sets generated on the basis of a conditional tree. For b, the frequent item sets are b, d b, c, these frequent item sets sup-port are respectively 2 and 3. The results obtained with the Apriority algorithm is the same. But the FPGrowth algorithm also has its fatal flaw. Be-cause the algorithm is recursive condition database and conditional frequent pattern tree, so the lar-
Fig.2. b – conditional mode
d(2)
b(1)
a(1)
c(3)
b(2)
b(1)

Light & Engineering Vol. 26, No. 2
152
ger memory, this is the main problem of this algo-rithm lies. The recommendation based on associa-tion rules is that it is simple and intuitive to mimic real shopping scenes and do not need knowledge about goods. At the same time, it can also discover the potential interest points of the user and stimulate the purchase. However, computational complexity is a significant disadvantage of association rule min-ing. With the increase of the size of frequent item sets, especially in the case of large data sets, the cost of mining will be higher and higher. However, for the same set of data, in the same degree of a given minimum support, confidence limit conditions, as-sociation rules by Apriori algorithm and FPGrowth algorithm are the same. The only difference is that whether the candidate frequent item sets mining process of association rules, mining efficiency is different, different memory operations.
4. RESULT ANALYSIS AND DISCUSSION
4.1. Basic Data and Parameter Hypothesis
The use of energy saving lamps instead of incan-descent lamps for residents is taken as an example. Suppose that there are 1 million families in a city, and 30 % of families are willing to take part in the green lighting energy-saving measures under the call of DSM for electricity saving and environmen-tal protection. The incandescent lamps used by us-ers have 15, 25, 40, 60, and 75,100 W. The pow-er of the weighted average incandescent lamp is based on 40 W. The 40 W incandescent lamp can be changed by the 9W energy saving lamp, the energy of the energy-saving lamp is based on the 9W. It is assumed that the cost of the incandescent lamp is 1 yuan per only, the life span is 1000 h, the price of the energy-saving lamp is 30 yuan, and the life of the lamp is at 3000 h. The number of incandescent
lamps in each household is 2. The electricity price of the residents in this area is 0.50 yuan / (kW. h), and the lighting time is 4 h/d. The cost of unit capa-city is 0.25 yuan / (kW. h), and the unit capacity cost is 7000 yuan /kW. The electricity price of the power generation enterprise is 045 yuan / (kW h), the peak electricity price is 0.2 yuan / (kW h), and the stan-dard coal consumption of power generation is 320 gce/ (kW h). Among them, the relevant parameters involved in the calculation are assumed to be shown in Table 1.
4.2. Calculation Results
According to the above formula, it can be cal-culated separately. The costs and benefits of green lighting projects are implemented by users, pow-er grid enterprises and the different interests of the whole society. As a result, see Table 2. It can be seen from the table that the cost efficiency is more than 1 as compared with ρ . Therefore, it has good economic benefits for users, power grid enterprises, power generation enterprises and the whole society to implement green electricity saving lighting tech-nology on the electric side.
It is feasible to implement green electricity sav-ing lighting technology on the electric side. Among them, the cost benefit ratio of the power genera-tion enterprises and the whole society is relatively large. The reason is that the power generation side is saved by the electricity side, which avoids the ca-pacity investment cost of the new generating units. Thus, better economic benefits have been produced.
4.3. Sensitivity Analysis
The user subsidy rate η and the consumer elec-tricity price P are two important factors that affect the net income of each stakeholder, B, especially
Table 1. Values of Relevant Parameters
Parameter Company Value (using experience value) Parameter Company Value (using experience
value)
Tid a 1.0 l 0.04
k % 15.0 m 0.07
θ 0.7 δ 0.05
γ 1.2
Note: k is the cost ratio of the management cost.
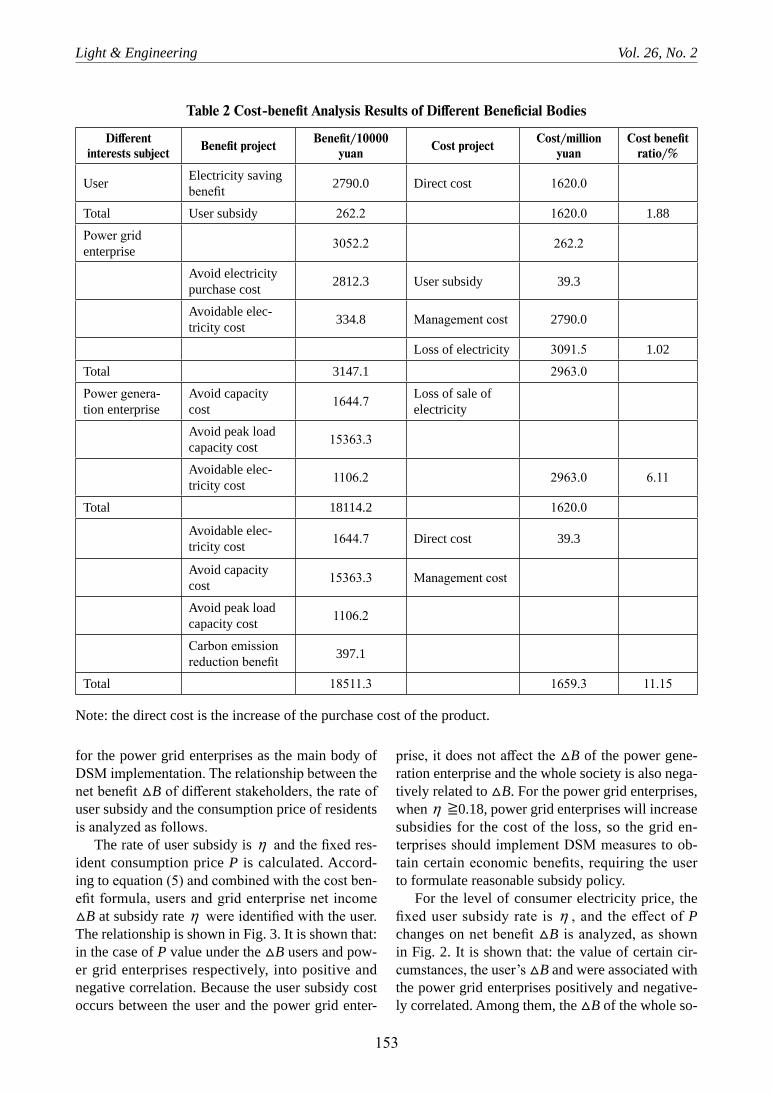
Light & Engineering Vol. 26, No. 2
153
for the power grid enterprises as the main body of DSM implementation. The relationship between the net benefit B of different stakeholders, the rate of user subsidy and the consumption price of residents is analyzed as follows.
The rate of user subsidy is η and the fixed res-ident consumption price P is calculated. Accord-ing to equation (5) and combined with the cost ben-efit formula, users and grid enterprise net income B at subsidy rate η were identified with the user. The relationship is shown in Fig. 3. It is shown that: in the case of P value under the B users and pow-er grid enterprises respectively, into positive and negative correlation. Because the user subsidy cost occurs between the user and the power grid enter-
prise, it does not affect the B of the power gene-ration enterprise and the whole society is also nega-tively related to B. For the power grid enterprises, when η ≧0.18, power grid enterprises will increase subsidies for the cost of the loss, so the grid en-terprises should implement DSM measures to ob-tain certain economic benefits, requiring the user to formulate reasonable subsidy policy.
For the level of consumer electricity price, the fixed user subsidy rate is η , and the effect of P changes on net benefit B is analyzed, as shown in Fig. 2. It is shown that: the value of certain cir-cumstances, the user’s B and were associated with the power grid enterprises positively and negative-ly correlated. Among them, the B of the whole so-
Table 2 Cost-benefit Analysis Results of Different Beneficial Bodies
Different interests subject Benefit project Benefit/10000
yuan Cost project Cost/million yuan
Cost benefit ratio/%
User Electricity saving benefit 2790.0 Direct cost 1620.0
Total User subsidy 262.2 1620.0 1.88
Power grid enterprise 3052.2 262.2
Avoid electricity purchase cost 2812.3 User subsidy 39.3
Avoidable elec-tricity cost 334.8 Management cost 2790.0
Loss of electricity 3091.5 1.02
Total 3147.1 2963.0
Power genera-tion enterprise
Avoid capacity cost 1644.7 Loss of sale of
electricity
Avoid peak load capacity cost 15363.3
Avoidable elec-tricity cost 1106.2 2963.0 6.11
Total 18114.2 1620.0
Avoidable elec-tricity cost 1644.7 Direct cost 39.3
Avoid capacity cost 15363.3 Management cost
Avoid peak load capacity cost 1106.2
Carbon emission reduction benefit 397.1
Total 18511.3 1659.3 11.15
Note: the direct cost is the increase of the purchase cost of the product.

Light & Engineering Vol. 26, No. 2
154
ciety is also positively related to the corpse. If the consumer electricity price level is higher than 0.53 yuan / (kW h) according to the subsidy level of this article η =0.16, the power grid enterprises will lose because of less electricity. When electricity pri-ces are below that level, power grid companies will gain revenue.
If the power grid companies do not want to subsi-dize the users, the consumer electricity price should be reduced to 0.43 yuan / (kW h). In this way, it can make up for the loss caused by the sale of electrici-ty and not make a loss. That is, under the premise of no loss, the lower the willingness of the power grid enterprises to subsidize the users, the level of con-sumer electricity price must be reduced according-ly (Fig. 3). However, because the change of consu-mer electricity price is affected by many factors, the power grid enterprises must determine the rate of user subsidy according to the actual situation.
5. CONCLUSION
As a technical means of power demand side ma-nagement (DSM), efficient lighting power saving technology can reduce peak load, improve load characteristics and improve power supply reliabili-ty. Based on this, the cost efficiency of implement-ing green lighting was analyzed, saving technolo-gy from the user, the power grid enterprise and the society. At the same time, the theoretical basis and technical guidance were provided for the implemen-tation of green lighting project in the region. The re-sult of the case analysis shows that the costbenefit analysis is one of the effective methods to evaluate the DSM technology. It is also found that user sub-
sidy rate and resident consumption price were two key factors that affected users’ willingness to adopt green lighting power saving technology and grid enterprises to implement this DSM measure. At the same time, the feasibility of popularizing green lighting saving technology with electric side was also determined to a great extent. The cost ben-efit analysis method can also be applied to other DSM measures. It is worth a large-scale applica-tion to evaluate the feasibility of a DSM measure by quantitative study of cost benefit.
REFERENCES
1. Qin X C., Shao S G., Shen Y. Application of Green Lighting Technology in Highway Service–A Case Study of Mt. Lushan West Sea Tourism Highway Service. Ap-plied Mechanics and Materials. Trans Tech Publications, 2014. V548, pp.1815–1819.
2. Qin X, Wei Q, Wang L, et al. Solar lighting techno-logies for highway green rest areas in China: energy sav-ing economic and environmental evaluation. International Journal of Photoenergy, 2015.
3. Eliashberg J, Hui S K, Zhang Z J. From story line to box office: A new approach for green-lighting movie scripts. Management Science, 2007. V53, #6, pp.881–893.
4. Sheu J K, Chang S J, Kuo C H, et al. Whitelight emission from near UV InGaN-GaN LED chip precoated with blue/green/red phosphors. IEEE Photonics Technol-ogy Letters, 2003. V15, #1, pp.18–20.
5. Wang F C, Tang C W, Huang B J. Multivariable ro-bust control for a red–green–blue LED lighting system. IEEE transactions on Power Electronics, 2010. V25, #2, pp.417–428.
6. Ahn B L, Jang C Y, Leigh S B, et al. Effect of LED lighting on the cooling and heating loads in office buil-dings. Applied Energy, 2014. V113, pp.1484–1489.
Fig.3. Relationship of net benefit and user subsidy rate under fixed price
Fig.4. Relationship of net benefit and tariff under fixed subsidy rate consumer

Light & Engineering Vol. 26, No. 2
155
7. Lu S M, Huang M Y, Su P T, et al. Develop-ment strategy of green energy industry for Taipei – A modern mediumsized city. Energy policy, 2013. V62, pp.484–492.
8. Setlur A. Phosphors for LEDbased solidstate lighting. The Electrochemical Society Interface, 2009. V16, #4, p.32.
9. Steigerwald D A, Bhat J C, Collins D, et al. Illu-mination with solid state lighting technology. IEEE jour-
nal of selected topics in quantum electronics, 2002. V8, #2, pp.310–320.
10. Sibley M, Sibley M. Hybrid green technologies for retrofitting heritage buildings in North African medi-nas: Combining vernacular and hightech solutions for an innovative solar powered lighting system for hammam buildings. Energy Procedia, 2013. V42, pp.718–725.
Yanjiang GONG, Doctor of Agricultural Electrification and Automation. Graduated from the Northeast Agricultural University. The research directions are fault diagnosis of cable, fault
location of power grid, comprehensive energy saving of power grid, and microgrid technology
Wenshuang YU, Doctor of Electrical Engineering and Automation. Graduated from the North China Electric Power University. The research directions are distribution network planning,
comprehensive energy saving of power grid
Tiejun ZHOU, Doctor of Agricultural Electrification and Automation. Graduated from the North China Electric Power University. The research directions are distribution network planning
and automation, distributed generation and microgrid technology
Jiang LI, Doctor of Power System and Automation. Graduated from the Beijing Jiaotong University. The research directions are distribution network planning, distribution automation,
comprehensive energy saving of power grid, distributed generation and microgrid technology
Runbing YANG, Doctor of Electrical Engineering and Automation. Graduated from the North China Electric Power University. The research directions are distribution network planning,
comprehensive energy saving of power grid

156
Light & Engineering SvetotekhnikaVol. 26, No. 2, pp. 156–161, 2018 No. 1, 2018, pp. 70–74
DAYLIGHT IN UNDERGROUND SPACES
Alexei K. Solovyev
Moscow state scientific-research University for Civil Engineering, Department of buildings and structures design
E-mail: [email protected]
ABSTRACT
Underground spaces in town centres present a big attraction for investors. However, they put spe-cial requirements to the internal environment. Those requirements can be fulfilled by means of daylight-ing. Examples of lighting of underground spaces are discussed. It is shown that the common systems of natural lighting are not always possible to use and cause big heat losses. Hollow light guide pipes al-low avoid the shortcomings of common daylight systems. Method of calculation of daylight factors from hollow light guide pipes is shown. The results of calculation of daylight factors under the light guide pipes of different diameters in the different depths are presented.
Keywords: underground space, daylighting, hollow light guide pipes, daylight factor
INTRODUCTION
Subsoil surfaces of cities attach growing impor-tance in the architecture. In the Central districts of cities territories are fully developed. Any open are-as are an invaluable urban element that attracts peo-ple’s attention, allows them safely explore the adja-cent buildings go for a walk in centre. At the same time, the underground space in such areas is attrac-tive for investors allowing them to use it as a shop-ping and leisure area, restaurants, shops, services, etc. However, urban underground space is put spe-cial requirements to the internal environment. Peo-ple under the ground should feel comfortable and
safe and, if possible, not to lose touch with the ex-ternal environment.
EXAMPLES OF UNDERGROUND SPACES
The most known in Russia example of such underground spaces is the subsoil shopping Mall on Manezh square “Okhotny Ryad” in Moscow. A threelevel underground complex has input knots in the form of atriums, covered with large translu-cent domes. One of these domes has a diameter of about 20 m (Fig.1). The dome illuminates with na-tural light the central hall having three levels of un-derground space. At the same time, restaurants and cafes under balconies of the atrium are lit by perma-nent lighting systems of artificial light. The chang-ing levels of natural illumination create the natural dynamics of light. All the underground shops flank-
Fig.1. The dome of the central hall of the trading complex “Okhotny Ryad”

Light & Engineering Vol. 26, No. 2
157
ing a Central atrium and corridors connecting the input nodes are lit by artificial light. Lighting dy-namics, inherent to natural light, there is absent.
The corridors, at least at the first underground level, could be lit with natural light using a band roof lights. Stores could have natural light through a hollow tubular light guides (HLTG) [1,2,3]. The light guides could serve the natural light to illu-minate the second and third underground levels of shops. This, of course, require necessity to reorga-nize the ground planning the Manezh square (Fig.2) to make room for the upper parts of skylights and the light receiving devices of tubular light guides which can be obstacle considering the main recre-ational purpose of the ground area of the Manezh square. Such reconstruction in the future would be possible. The conduct of natural light into the un-derground space would enhance the comfort and sense of safety in the underground space. The mo-notony and continuous spectrum of artificial light will be broken by the dynamics of levels and spec-trum of natural light. Visitors will feel minimal ne-cessary connection with the outside environment, feel the time of day and weather condition.
Another example of using natural light to illumi-nate the underground space is the hub of Flint Holm in Copenhagen (Denmark), bringing together metro, ring railway, and the railway station leading to Fred-erikssund. Six platforms are located under a glass roof with a size of 180 to 60m. As a result, all sta-tion is lit by natural light. Two stations are located at bridges. Station on lines passing in the transverse direction, are arranged on the lower bridge level. Even lower is the bus station [4].
On the structure that is above a glass roof, artifi-cial light systems are mounted. Therefore, they can
be easily serviced without disturbing the movement of trains. To provide a warm light with a colour tem-perature of 3000 K halogen light sources are ap-plied. The main artificial lighting is provided by using the LEDs strip with a length of 2.5 km, illu-minating in the dark and in cloudy weather the sub-surface and steel structures of the hub.
The project of natural and artificial lighting of this major interchange hub and all the new metro in Copenhagen are created by the engineering bu-reau of Bartenbach (Switzerland) – light laborato-ry “Light underground”. In the new metro stations, the designers have tried to avoid twilight corners, turning a dark and dirty metro station in the bright rooms partly lit with natural light. If the passengers earlier felt the strain, approaching the dark entrance to the tube escalators, now in the input zones is cre-ated a pleasant atmosphere of natural light (Fig.3). At the same time, people feel the changing weat-her situation outside. In the morning there is cool natural light with a colour temperature of about 6500К, and warmer light with a colour temperature of 4500К in the evening. All this has provided com-munication with the external environment and in-creased feeling of safety underground. People, lo-cated at the metro station, can immediately feel the outside, whether outside shines the sun or the sky is covered with clouds.
Natural light in the station is served, usually, through skylights. To increase their effectiveness, the sidewalls of the skylights shafts are lined with pure aluminium and allow to deliver natural light at the depth of metro stations without big losses like
Fig.3. Entrance zone in tube, Kopenhagen (Photo of Peter Bartenbach)
Fig.2. Ground planning of the Manezh square

Light & Engineering Vol. 26, No. 2
158
light pipes. However, it should be noted, that in case of a large section of the shafts, which are character-istic to the roof skylights, to create a mirror surface of the shaft, like this takes place in the tubes of the light guides, is a very difficult and a very expensive task. Therefore, it is impossible to compare the ef-fectiveness of these devices.
The movement of the sun is transmitted into the room using glass prisms, mounted in skylights. Prisms are decomposing sunlight into spectral com-ponents. This creates pictures on the walls like rain-bows that move around the surface of the input knots and escalators (Fig.4).
LIGHTING OF UNDERGROUND SPACES BY USING HOLLOW TUBULAR LIGHT GUIDES
The examples show that for not deep under-ground spaces of the city it is possible and useful to illuminate the space using different systems of natural light. The conventional systems in the form of skylights and translucent coverings provide a lot of light, but have disadvantages.
First of all, roof lights and translucent coverings require the use of large urban areas, which can no longer be used as recreational zones.
Secondary, skylights and other translucent struc-tures create a large heat loss in winter and in sum-mer they create heat gains in the underground spaces of the city that need to be neutralized with signifi-cant expenditures of energy.
The use of hollow tubular light guides reduces these disadvantages [1,2,3]. The area, occupied by the receiving elements of the tubular light guides is considerably less. The heat gains through the light guide are also many times smaller [5]. At the same time, the light guides retain such advantages of na-tural lighting as the natural light spectrum and its dynamics depending on time of day and weather.
The evaluation of natural light through light guides as well as from the usual light openings can be made with the help of Daylight Coefficient (DK). Thus, in the calculation of duration of natural light-ing it can be used not the diffuse illumination from the sky, but the total illuminance from sky and sun.
Coefficient of performance (ƞ) of the light guide system is determined by the formula:
ƞ = τc×τd×Km×ξ, (1)
where τd – light transmission of the diffuser: for ex-ample, by the Italian system SOLARSPOT τd = 0.8; τc – light transmittance of the outer dome of the light guide, its rim and the intermediate lenses. By the SOLARSPOT system τc = 0, 92; Km – the safe-ty factor (takes into account the pollution of the dome during operation, J. Bracale Km = 0, 92) [1]; ξ – is the efficiency of the pipe of a hollow straight light guide. It depends on the reflection coefficient of the mirror coatings of the pipe of the light guide ρ, the ratio length of the light guide to diameter of the tube (L/D), i.e. the number of reflections of light rays inside the tube and the angle θ of the rays fall-ing on the dome of the light guide, to its axis. θ is most easily defined for the direct component of so-lar light. In vertical position the axis of the light guide, it is equal to the Zenith distance of the sun in a given time. I.e. efficiency varies depending on the height of the sun. The average efficiency of the fibre is well represented by the CIE cloudy sky. In this case θ = 30o. This value is proposed to cal-culate ξ. The efficiency of the light guide ξ can be determined according to the simplified formula of multiple reflections [1]:
ξ= (eL/D tgθ lnρ) /[1-L/D tgθ lnρ]1/2. (2)
This value may also be determined according to the table given in [1 and 7], calculated by the for-mula (2).
The luminous flux emitted by the diffuser:
Fig. 4. Sunlight spectral components on the wall of the tube escalator, Kopenhagen (Photo of Peter Bartenbach)

Light & Engineering Vol. 26, No. 2
159
Фd= ƞ·Фouter , (3)
where Фouter – luminous flux included in the light guide outside:
Фouter = [(180-θ) ⁄180] · Eh ∙A, (4)
where (180-θ) ⁄180 – input coefficient of the HLTG; A is the cross – sectional area of light guide pipe, A = π·D2/4; Eh – illuminance outside on a horizon-tal platform. If you want to determine the daylight factor (DF) under the HLTG, Eh =100 %.
The DF-value under the light guide in point M is determined by the formula:
ξm = Ld ·A/r2, (5)
where Ld is the luminance of the diffuser; Ld = Фd / (π·A).
Substituting in the formula (5) the values of Ld and Фd (3) we shall receive a calculation formu-la for calculation DF-value under the light guide.
ξm = [η·D2 ·0, 83)/ (4·r2)] · 100 %, (6)
where 0, 83 = (180–30)/180; 30o – the average height of the sun, corresponding to the conditions of a cloudy sky; cosβ=cosy=1 for our calculation case where the reference point is located directly be-neath the light guide; r is the distance between cen-tre of diffuser and the reference point. For our de-sign case this is the height of the diffuser above the work plane. According to Fig.5 for our calculations r = 4m.
The result of the DCvalue calculation direct un-der the right tube of light guide for underground spaces at various depths for different diameters of the light guide and different values of the reflec-tance of mirror-like inner surface of the pipe are presented in Table 1. All the symbols in Table 1 see formulae (1) and (2), as well as Fig.5. Light trans-mittance coefficients of the dome and diffuser are taken according to J. Brakale [1].
Dependences of DCvalues on the diameter of light guide tube (D) by different length of the tube (L) are represented in the Fig.6. As it is seen in the Fig.5, the DFvalue is grooving practically accor-ding to the parabola law, depending on the D-val-ue. The dependence of decrease of D on the rising of length of the tube (L) is smoother (Fig.7). This is
Fig.7. Dependence of DF-value under the light guide in the point M from the depth of the underground space
Fig.5. Diagram to the calculation of DFvalue under the light guide in point M
Fig.6. Dependence of DFvalue under the light guide in the point M from the diameter of the tube of the light guide

Light & Engineering Vol. 26, No. 2
160
Tabl
e 1.
Cal
cula
tion
of D
C U
nder
the
Dire
ct W
aveg
uide
for t
he S
OL
ARS
PO
T Sy
stem
ρ =
0,92
D2
D
L =
3L
= 6
L =
9L
= 12
L Dξ
dηìε
L Dξ
dηìε
L Dξ
dηìε
L Dξ
dηìε
0,25
0,06
2512
0,45
0,31
0,02
524
0,24
0,16
0,01
336
0,15
0,1
0,00
848
0,06
0,04
0,00
3
0,37
50,
1406
80,
580,
390,
072
160,
350,
240,
043
240,
170,
110,
0232
0,18
0,12
0,02
0,53
0,28
095,
660,
680,
460,
168
11,3
20,
460,
310,
113
16,9
80,
330,
220,
0822
,64
0,25
0,17
0,06
0,67
50,
4556
4,44
0,73
0,49
0,29
28,
880,
550,
370,
2213
,33
0,44
0,3
0,17
17,7
60,
310,
210,
12
1,0
1,0
30,
780,
530,
684
60,
670,
450,
599
0,55
0,37
0,48
120,
440,
290,
38
ρ =
0,95
D2
D
L =
3L
= 6
L =
9L
= 12
L Dξ
dηìε
L Dξ
dηìε
L Dξ
dηìε
L Dξ
dηìε
0,25
0,06
2512
0,61
0,41
0,03
324
0,39
0,26
0,02
136
0,27
0,18
0,01
548
0,16
0,11
0,00
9
0,37
50,
1406
80,
690,
470,
085
160,
500,
340,
062
240,
390,
260,
048
320,
310,
210,
038
0,53
0,28
095,
660,
760,
510,
1911
,32
0,63
0,42
0,15
516
,98
0,48
0,32
0,12
22,6
40,
400,
270,
10
0,67
50,
4556
4,44
0,81
0,55
0,32
8,88
0,67
0,46
0,27
13,3
30,
580,
390,
2317
,76
0,47
0,32
0,19
1,0
1,0
30,
860,
580,
766
0,72
0,49
0,63
90,
670,
450,
5912
0,60
0,41
0,53
Light & Engineering Vol. 26, No. 2
161
explained by the fact that from the diameter of tube and input set of the light guide the light flux value coming into the tube depends. At the same time, only the amount of reflections in it is depending from the length of the tube. The bigger diameter of the tube, the less the amount of reflections will be in it by the same length.
Having obtained the DF-value direct under the light guide it is possible to calculate DF-value in each point of the room either according to Lam-bert law or by the method given in the Russian norm СП 23–102–2003 as from round light source [6].
It must be noted, that DCvalues given in Table 1 and in the Figs.6,7 calculated by means of formulae (1–6) are taken without internal reflection, which can be calculated according to СП 23–102–2003, as for convenient systems of roof lighting. The average DF-values for the whole lit area of the underground space can be calculated as a sum of DF-values in all calculation points of the room from all light guides divided by the amount of calculation points.
CONCLUSIONS
Subsoil space of a city, there, where it is possi-ble, must be good lit with daylight. It gives to the people confidence, ensuring connection with exter-nal environment. But the convenient systems of up-per daylight can be applied in not deep underground spaces. What depth is maximal for the effective use of different daylight systems is to be still investiga-ted. Besides it the convenient systems of daylight-ing require big areas on the surface of the ground, which decrease possibilities of planning free are-as and their recreational value. Applications of the light guides for illumination of underground spac-
es do not have this shortcoming. Additionally, using of light guides do not have such restrictions to the depth, as the convenient daylighting systems.
As by convenient systems of daylighting, there-fore by light guides, the maximal economy of elec-tric energy can be gained only in combination with automatic control of supplementary artificial light-ing. For all that from the point of view of daylight-ing, the light guides of big diameter are more pref-erable, but it comes in to contradiction with their costs and with increasing of heat gains and heat los-es through their constructions.
REFERENCES
1. Bracale J. Natural lighting of rooms by means of a new passive light guide system “SOLAR-SPOT”. // Svetotekhnika, 2005. No 5, pp.34–42.
2. Solovyev A.K. Hollow tubular light guides: Their application for natural illumination of buildings and energy saving. //Light & Engineering. 2012. V.20. No 1, pp.40–49.
3. Kusnetsov A.L., Oseledets E. Ju., Solovyov A.K., Stolyarov M.V. Experience of application of hollow tubu-lar light guides for natural illumination in Russia. // Light & Engineering. 2012. V.20. No 3, pp.62–70.
4. Tageslicht im Untergrund. Innovative Tageslicht-lenkung in der Metro von Kopenhagen. // Tageslicht (Son-derausabe der Zeitschrift “Licht”. 2004. No 1. pp.8–9.
5. Solovyov A.K., Tusnina O.A. Comparative heat calculation of upper daylight systems (skylights and hol-low tubular light guides). // Civil engineering journal, 2014, No 2, pp.24–35.
6. Solovyov A.K. Physic of environment. Manual for the specialty “ Design of Buildings”. ASVpress. Moscow, 2016, pp.341.
Alexei K. Solovyov, Prof., Dr. of Tech. Sc., had been graduated from MISI named after V.V. Kuibyshev in 1965. At present, he is Professor of the department “Designing buildings and structures “(former department of” Architecture of civil and industrial buildings“), NIU “MSSU”, member of the European Academy of Sciences and the arts and editorial boards of the journals “Svetotekhnika” and “Light & Engineering”, has the title of “Honorary Builder of the Russian Federation” and “Honoured Worker of the Higher School of Russia”

162
Light & Engineering SvetotekhnikaVol. 26, No. 2, pp. 162–166, 2018 No. 2, 2018, pp. 52–55
ACCOUNTING OF CLIMATIC FEATURES IN DESIGNING SOLAR SHADING DEVICES
Alexander T. Dvoretsky1, Alexander V. Spiridonov2, Igor L. Shubin2 and Ksenia N. Klevets1
1The Crimean Federal University named after V.I. Vernadsky, Simferopol, Russia 2The Research Institute for Building Physics under Russian Ministry of Construction
and Russian Academy of architecture and construction science (NIISF RAASN) Moscow, Russia E-mail:, [email protected]
ABSTRACT
Zoning maps of the territory of the Russian Fe-deration on solar radiation and outdoor temperature are given. It should provide for shading of fenestra-tion during the cooling period of buildings, depen-ding on the total amount of solar radiation and the temperature of the outside air. Depending on the amount of solar radiation, five zones are proposed in the territory of the Russian Federation. For each of the five zones, the cooling period of the building is proposed, on which the choice of the parameters of the solar ray daily cone depends on the shape of a solar shading device. A map of isolines of solar ra-diation for July in the North Caucasus and South-ern Federal Districts of the Russian Federation is proposed, which can be used to calculate heat input through fenestration.
Keywords: solar shading device, map of iso-lines of solar radiation, parameters of insolation, zoning of the territory
INTRODUCTION
In 2016, by assignment of the Federal Autono-mous Institution “Federal Centre for Standardiza-tion in Construction” (FAI “FCS”), NIISF RAASN together with the Crimean Federal University named after V.I. Vernadsky developed a draft code of rules “Solar shading devices of buildings: Rules for Design”, [1].
The effectiveness of the use of solar shading de-vices in buildings for various purposes has been re-peatedly proven by domestic and foreign research [2–6]. It is also obvious that the economic efficien-cy of their use depends largely on the climatic con-ditions of the construction site.
Unlike the most European countries, where the climatic conditions are fairly homogeneous, in such states as Russia, the United States, China, Ukraine they differ radically in different regions. So, for ex-ample, in construction guide of Ukraine [7, 8] the territory of the country is divided into 5 main zones.
Prior to the development of the above men-tioned draft Building Regulations [1], there were no documents in the Russian Federation that would regulate the use of various modern solar shading devices depending on the site of building construc-tion and their destination, as well as actual clima tic conditions.
Design of solar shading devices should be car-ried out taking into account the climatic conditions of the construction region in accordance with Build-ing Regulation (BR) СП 131.13330.2012 [9].
In accordance with BR СП 50.13330 [10] in ar-eas with an average monthly temperature of July 21 °C and above for windows of residential buil-dings, hospital facilities (clinics and hospitals), dis-pensaries, outpatient clinics, maternity homes, chil-dren’s homes, housesindividuals for the elderly and disabled, kindergartens, day nurseries, and orphan-ages, as well as industrial buildings, in which the

Light & Engineering Vol. 26, No. 2
163
optimum standards of temperature and relative hu-midity in the work area, or in which constant tem-perature or temperature and the relative humidity of the air must be maintained, should include solar shading devices.
Solar shading devices should be provided in the premises of public and industrial buildings, where in accordance with BR СП 52.13330 [11] it is sup-posed to perform visual works of high, very high and the highest accuracy.
In accordance with Sanitary Requirements (SR) 2.2.1 / 2.1.1.1076–01 [12] in the arrangement of windows of the western and south-western ori-
entation in the buildings under construction and reconstruction in residential premises of apart-ments, dormitories, the main functional premises of children’s educational organizations, education-al organizations, general education organizations, having boarding schools and other specialized secondary educational institutions, medical and pre-ventive, sanatorium and health institutions, social security institutions solar shading means should be provided.
GEOMETRICAL MODEL OF INSOLATION PROCESS
When designing solar shading devices to ac-count for both: passive cooling in the warm peri-od of the year and passive heating in the cold pe-riod of the year, it is necessary to take into account the total solar radiation with actual cloudiness in the construction site and the orientation of the building facades.
Differences in the positions of the Sun for diffe-rent orientations and time of year are determined by the solar ray daily cone (SRDC) (Fig. 1).
The basis of all methods of forming stationary solar shading devices is the geometry of the appa-rent movement of the Sun across the sky, namely the geometric model of the insolation process in a point on the Earth during the day. This model is a one-pa-rameter set of solar rays coming in one point on the Earth’s surface during the day and is a solar ray dai-ly cone (SRDC) [5]. Using the solar ray daily cone is the basis of all methods of forming solar shading devices (SSD), as well as the majority of methods of determining the duration of insolation.
Fig. 1. Geometrical model of the solar ray daily cone:А – insolated point; Ф – solar ray daily cone; α – angle bet-ween the generator of the cone and its axis; Π – horizontal
plane; δ – latitude; i – axis of the Earth rotation; S, N – directions to the South and North; Srise – sunrise direction;
Sset – sunset direction; H°6 – the angular height of the Sun at noon in June
Fig. 2. Solar angles for the facade of southern orientation in the city of Krasnodar (450N)a) angular heights of the Sun; b) azimuths of sunrise and sunset

Light & Engineering Vol. 26, No. 2
164
The methodology for designing a SSD with the use of a solar ray daily cone is described in [5].
With the solar ray daily cone (SRDC):• The angular height of the Sun at noon H°12 for
the selected day of the year – is used in calculating the parameters of the position of solar collectors and photovoltaic panels;
• Azimuths of the sunrise Srise and sunset Sset for the selected date – used when determining the dura-tion of insolation;
• Time of sunrise τrise and sunset τset of the Sun.The horizontal plane Π cuts the cone on two gen-
erators, which indicates the directions of the sunrise and sunset in horizontal projection. Srise is the azi-muth of sunrise. Sset is the azimuth of sunset. The values of the azimuths of the sunrise and sunset for the city of Krasnodar are shown in Fig. 2.
When designing the solar shading device (SSD), it is necessary to take into account the differences in the amount of solar radiation on the building fa-cades of different orientations during the winter and summer periods of the year. Average monthly so-lar radiation (direct and scattered) for four orienta-tions of the facade in July [7] in Belgorod is shown in Fig. 3.
ZONING OF THE TERRITORY OF THE RUSSIAN FEDERATION ON SOLAR RADIATION AND OUTDOOR TEMPERATURE
Fig. 4 shows a map of the territory zoning of the Russian Federation on total solar radiation on a hori-zontal surface under real cloud conditions, con-structed in accordance with the procedure [13] and data [14].
Five main zones were identified according to the conditions of total annual solar radiation on a hori-zontal surface under the actual cloud conditions:
– The first zone – 900 kWh / m2 or less;– The second zone – over 900 to 1000 kWh / m2;– The third zone – over 1000 to 1100 kWh / m2;– The fourth zone – over 1100 to 1200 kWh / m2;– The fifth zone – over 1200 kWh / m2.It is necessary to provide shading of fenestra-
tion during the overheating period (cooling period of buildings) depending on the total amount of so-lar radiation:
– In the first zone – it is not regulated;– In the second zone – from May 22 to July 22;
Fig. 3. Average monthly solar radiation (direct and scat-tered, W/m2) for four orientations of the facade in July in
Belgorod depending on the time of a day (500 N): red line – direct solar radiation, blue line – scattered solar radiation
Fig. 4. Schematic map of total annual solar radiation on a horizontal surface in conditions of actual cloudiness, kWh / m2

Light & Engineering Vol. 26, No. 2
165
– In the third and fourth zones – from April 22 to August 22;
– In the fifth zone – from March 22 to Septem-ber 22.
For each of the five zones, periods of cooling and overheating affect the choice of the parameters of the solar ray daily cone [5].
To ensure visual comfort in the premises and pri-vacy at night, solar shading devices should be provi-ded for all orientations of the facades of buildings, including northern, in climatic regions where the polar day is observed in the summer.
In climatic regions with a predominance of sun-ny weather in the cold period of the year, it is ne-cessary to ensure the possibility of providing pas-sive solar heating of premises to reduce the energy costs for the operation of the heating systems of buildings.
Fig. 5 shows the zoning of the Russian Federa-tion territory by the average monthly temperature of July, which should be used to determine the loca-tion of the SSD relatively to fenestration.
In the Crimean Federal University named after V.I. Vernadsky monthly maps of solar radiation iso-lines on a horizontal surface under conditions of ac-tual cloudiness in W h/m2 are developed, which is necessary for the calculation of heat input through fenestration. As an example, this article presents the results for the North Caucasus and Southern Feder-al Districts (Fig. 6).
CONCLUSIONS
To reduce the impact of harmful factors of di-rect solar radiation on the microclimate of premis-es, including overheating, during the cooling period of buildings it is necessary to use the solar protec-tion of buildings. As a solar protection various mea-sures can be considered:
– The rational orientation of the facades;– The rational planning of the premises (loggias,
visors on the facades, blinds, roller blinds, etc.);– Planting green plantations near the facades of
buildings;– The equipment of fenestration with solar shad-
ing devices.In all cases it is necessary to use solar geometry,
the values of solar radiation and the temperature of the outside air.
In more detail, the basic principles of designing modern solar shading devices will be considered in subsequent publications.
Fig. 5. Schematic map of the average temperature in July
Fig. 6. Total solar radiation on a horizontal surface in July, W/m2

Light & Engineering Vol. 26, No. 2
166
REFERENCES
1. Draft Building Regulation “Solar shading devi-ces of buildings. Design rules”, NIISF RAASN, 2016, 77 p.
2. W. Beck, D. Dolmans, G. Dutoo, A. Hall, O. Seppantn Solar Shading. How to integrate solar shading in sustainable buildings. REHVA and ES-SO Guidebook, 2010, 78 p.
3. M. Hutchins High performance dynamic shad-ing solutions for energy efficiency and comfort in buil-dings. Sonnergy Limited, Sonnergy report 15/498, May 2015, 147 p..
4. Shteinberg А.Y. Solar protection of buil-dings / Edited by Podgorny A.L. Kiev.: Budivelnik, 1986, 104 p.
5. Dvoretsky А.Т., Morgunova М.А., Sergei-chuk О.V., Spiridonov А.V. Methods of designing sta-tionary solar shading devices// Svetotekhnika, 6, 2016, pp. 43–47.
6. Sergeychuk O.V. Geometric computerized mo-del “Atmos pheric Radiation” for an Energy Efficient Building// Energy efficiency in architecture and con-struction/ Kiev/: KNUCA, 2011, Issue 1, pp. 22–28.
7. Dvoretsky А.Т., Spiridonov А.V. Morguno-va М.А. Influence of the Russian Federation climate and the orientation of the building on the choice of the type of stationary solar shading devices. Biosphere compatibility: Human, Region, Technologies 4 (16), 2016, pp.50–57.
8. Building Regulation ДСТУ Н Б В.1.1–27:2011 Building climatology (Ukraine).
9. Building Regulation СП 131.13330.2012. Build-ing climatology (Russia).
10. Building Regulation СП 50.13330.2012 Ther-mal performance of buildings (Russia).
11. Building Regulation СП 52.13330.2011 Day-lighting and artificial lighting (Russia)
1 2 . S a n i t a r y R e q u i r e m e n t s С а н П и Н 2.2.1/2.1.1.1076–01 Sanitary and epidemiologic rules and standards. Hygienic requirements to insolation and a solar protection of premises of residential and com-mercial buildings and territories. (Russia)
13. Building Regulation СП 23–101–2004 Design of the thermal performance of buildings (Russia)
14. The scientific and applicationoriented refe-rence manual on climate of the USSR. Series 3. Long-term data. Parts 1–6, the issue 1–34, St. Petersburg: Gidrometeoizdat, 1989–1998.
Alexander T. Dvoretsky, Prof., Dr. of Technical Science, graduated from Donetsk Polytechnic Institute in 1971. At present, he is the head of the Chair “Geometric and Computer Modelling of Energy
Efficient Buildings” of Academy of Civil Engineering and Architecture of the Crimean Federal University named after V.I. Vernadsky, counsellor of Russian Academy of Architecture
Alexander V. Spiridonov, Ph.D., graduated from MPEI in 1975 as specialist in light and engineering and sources of light. At present, he is a head of laboratory “Energy saving technologies in construction” NIISF
RAASN, President of Association of Energy Effective Windows Manufacturers, Laureate of the Russian Federation Government prize in the field of science and technology
Igor L. Shubin, Prof., Dr. of Tech. Sc., graduated from University of Civil Engineering named after V.V. Kuibyshev in 1980. At present, he is Director of NIISF RAASN and counsellor in RAASN,
RF Honoured Builder, Laureate of the Russian Federation Government Prize in the field of science and technology
Ksenia N. Klevets, architecture-builder, graduated from the National Academy of Nature Protection and Resort Construction (Simferopol) in 2012 and in 2015 – post graduate. At present, she
is an assistant of the department “Geometric and Computer Modelling of Energy Efficient Buildings” of the Academy of Civil Engineering and Architecture of the Crimean Federal University named after V.I. Vernadsky

167
Light & Engineering SvetotekhnikaVol. 26, No. 2, pp. 167–173, 2018 No. 4, 2018
LED INDUSTRIAL SPATIAL STRUCTURE AND ITS EVOLUTION TREND IN HANGZHOU BAY AREA, CHINA
Haiwei FU
International Port and Logistics Research Centre, Ningbo University of Technology, Ningbo, 315211 China;
E-mail: [email protected]
ABSTRACT
The numbers of spatial scale structural dimen-sions and associated structural dimensions in the light emitting diode (LED) industry in Hangzhou Bay Area, China since 2002 were estimated through the fractal method for the prediction of the future evolution trend of the industry. We found that the spatial structure of the LED industry in that area is of strong monopoly but tends to be generally optimal and stable. The morphology in which the main en-terprises concentrate in a linear space contributes to the interactions among the enterprises; future spatial structure of LED industry in Hangzhou Bay Area will be a stable state. Changes in external envi-ronments and the interaction between internal indus-trial factors constitute the basic dynamic mechanism for the formation and evolution of LED industrial spatial structure in the Hangzhou Bay Area.
Keywords: Hangzhou Bay Area, LED industry, fractal, R/S analysis, spatial structure
1. INTRODUCTION
Owing to the increasing popularity of semicon-ductor lighting, semiconductor light sources, espe-cially light emitting diodes (LEDs), has attracted interest worldwide [1]. The LED industry is con-sidered as one of the high-tech industries with the greatest development prospect in the 21st century [2]. Faced with this enormous market space, seve-ral countries have correspondingly promoted LED industrial development plans and started to occupy
the global market [3]. The Hangzhou Bay Area is one of the areas with the most developed economy in China. After years of development, the LED in-dustry in this area has gradually developed self-in-novative abilities. In addition, a complete industrial chain has been formed. To date, there are more than 2000 LED enterprises engaged in epitaxial wafer, chip, encapsulation, and application in Hangzhou Bay Area. Thus, Hangzhou Bay Area has become one of the largest LED production and supply bas-es worldwide.
The spatial evolution of the LED industry is a complicated dynamic process with large time span. Clearly revealing this evolution process is a problem needing urgent solution in the cur-rent industrial development. However, discussing about problems, such as spatial structure and evo-lution trend of LED industry, may party improve the competitiveness of LED industry and even-tually drive the development of related industrial clusters and realize industrial transformation and upgrade. Therefore, in this study, we attempt to in-troduce fractal idea into LED industry research, ex-pecting to completely present the spatial structure of the LED industry in the Hangzhou Bay Area and its evolution features since 2002. This work is also a significant supplementation for the research con-tents and methods of the LED industry.
2. LITERATURE REVIEW
The LED industrial field has always been a great concern among academic circles [4]. With conti-

Light & Engineering Vol. 26, No. 2
168
nuous development of LED technology, related stu-dies have drawn increasing attention [5]. However, not a few scholars have explored the main factors in-fluencing the spatial evolution of LED industry. Tak-ing Taiwan as an example, Ma et al., used the fuzzy analytical hierarchy process method to evaluate the paths for the effective acquisition of core technolo-gies in the LED industry. Their results showed that Taiwan enterprises acquire new technologies by li-censing or realize technological independence by building R&D alliance and attracting relevant en-terprises with commercial potential and potential market shares [6]. Yushan Chen et al. discussed the competitive and cooperative behaviour among LED enterprises through patent analysis. Their study con-tributed to spatial agglo meration in the industry [7]. Meanwhile, Kaa et al. verified that national institu-tional environment ne gatively affects the develop-ment of regional LED industries by restricting the progress of industrial standardization [8].
In general, existing literature on the spatial struc-ture of LED industry is quite limited, lacking em-pirical works based on quantitative method. On this basis, a measurement model for spatial structure and evolution trend was established in this research by using fractal methods, such as the measurement of scale structural dimensions and associated structural dimensions and R/S trend analysis method. We con-ducted an empirical study of the LED industry in an area in Hangzhou Bay, China.
The rest of this study is organized as follows. Section 3 expounds the application of the fractal method in LED industry studies. Section 4 conducts empirical analysis of the spatial structure and evo-lution trend of the LED industry in Hangzhou Bay Area. Section 5 analyzes the dynamic mechanism of spatial evolution of LED industry in Hangzhou Bay Area. The final section summarizes the entire study and draws related conclusions.
3. RESEARCH METHOD
3.1. Measurement of Scale Structural Dimensions
The LED output values in the main cities of Hangzhou Bay, China are selected as representa-tive indicators of industrial scale. The LED indus-trial scales are sorted by size, and the logarithms of the ranks and numerical values of the LED industri-al scales are used for drawing a scatter diagram. Its
fitting trend is also observed. When a linear regres-sion functional relationship is observed between the two, the ranksize distribution of the LED industrial scales is regarded conforming to Zip’s law. The con-crete computational formula is as follows:
,-q1T(r)= T r× (1)
where r is the scale ran of LED industry ( r =1,2,…,10), T(r) is the urban LED industrial scale with rank as r , 1T is the LED industrial scale of the firstrank city, and q is the ip Z f parameter. Logarithms at two sides of formula (1) are taken to obtain the following:
1lnT(r)= lnT - qlnr . (2)
A series of data pairs [ lnr , ln ( )T r ] are solved using formula (2). These data pairs are fitted, and if they present linear regression relationship, then the number fD of scale structural dimensions of urban LED industry is
2fD = R / q , (3)
where 2R is the coefficient of determination of the fitted equation. Fractal dimension fD has effective geographic significance and reflects the spatial dis-tribution pattern of LED industrial scale structures. If fD <1, then the LED industries present a Pa-reto unbalanced distribution. The monopoly of the firstrank city is strong, and the overall develop-ment of the LED industry is not mature enough. If
fD =1, the ratio of the firstrank city and the small-est scale city is rightly equal to the number of citi-es. If fD >1, LED industrial distribution is under re-lative balance, the number of cities in intermediate rank is large, and the overall development of LED industry is relatively mature.
3.2. Measurement of Associated Structural Dimensions
Associated structural dimensions in LED in-dustrial space can be explained as spatial interac-tion laws between LED industries, which depict re-lative distribution state of LED industries in various cities within the area. Considering that the spatial distribution of LED industry is generally two-di-mensional, its spatial correlation function can be defined as
Light & Engineering Vol. 26, No. 2
169
2, 1
1( ) ( )N
iji j
C k H k dN =
= ∑ , (4)
where ( )C k is the spatial correlation function; N is the number of cities meeting certain conditions; k is the step length; ijd is the Euclidean distance from city i to city j ; H is the step eH aviside function.
( )ijH k d10
=
ij
ij
k dk d>
≤. (5)
If the spatial distribution of the LED industry is fractal, then gDC(k) k∝ should be met. Here, gD is mainly the associated structural dimensions, and its actual calculation is similar to the measurement method of scale structural dimensions on the map. Euclidean distances between cities are first calcu-lated for obtaining the Euclidean distance matrix. Then, the ( )C k value is calculated, and k value is changed. The scatter diagram concerning a se-ries of [ k , ( )C k ] data pairs is obtained, and the value of associated structural dimensions gD can be obtained through linear fitting of data pairs. Un-der general circumstances, 0≤ gD ≤2. When gD →0, the LED industries inside the system concentrate into one point. When gD →2, the LED industries inside the system concentrate on a smooth curve. A large gD value means several balanced LED in-dustries are distributed in various cities within the area and in a geographic space. Meanwhile, a small
gD value indicates that small space industries are concentrated in the areas.
3.3. Rescaled Range (R/S) Trend Analysis Method
Proposed by Hurst in 1951, the R/S method in fractal theory is an analysis method for time se-quence [9]. R/S analysis method can be used for studying fractal features and long-term memory process of time sequences and determining the evo-lution laws and predicting their future development trend. An analysis process using the R/S analysis method is as follows: for time sequence ( ),B t t =1, 2,…, n , and for any positive integer τ ≥1, then:
1) The mean sequence is calculated as
( )1/t
B tτ
ξ τ τ= ∑ ;
2) The cumulative deviation is computed as
( ) ( ) 1
,t
X tµ
τ ξ µ ξ τ=
= −∑ ;
3) The range is calculated as
( ) ( ) ( )1 1
max , min ,t t
R X t X tτ τ
τ τ τ≤ ≤ ≤ ≤
= − ;
4) The standard deviation is calculated as
( ) ( )( )1/2
2
11 /
tS t
τ
τ τ ξ ξ τ=
= − ∑ ;
5) ( ) ( )/ /R S R Sτ τ≡ .
If / HR S τ∝ is satisfied, then Hurst phenom-enon exists in time sequence ( )B t and H is the Hurst index. We determine a whether time se-quence trend is persistent or antipersistent accor-ding to the H values. If H =0.5, then time se-quence is a random walk sequence, and if 0.5< H≤1, then the time sequence evolution is persistent. A large H value means strong persistence. If 0≤ H<0.5, then the time sequence evolution is anti-per-sistent, whereas a small H value indicates strong anti-persistence.
3.4. Data Source
We select the LED industries in the 10 main ci-ties in the Hangzhou Bay Area, including not only central cities with high concentration of LED en-terprises, such as Shanghai, but also medium and small supporting cities, such as Jiaxing and Shaox-ing. These industries cover epitaxial wafer, chip, en-capsulation, and application. Sample selection was of certain cover degree and representativeness. In-dicator data came from investigations on related guilds, official websites of enterprises, and compe-tent departments.
4. EMPIRICAL ANALYSIS OF SPATIAL STRUCTURE OF LED INDUSTRY IN HANGZHOU BAY AREA
4.1. Analysis of Hierarchical Structure
The 2017 LED output values of the sample ci-ties were selected as the basic data and sorted ac-cording to LED industry size in descending order.

Light & Engineering Vol. 26, No. 2
170
The purpose was to obtain the ranksize data pairs of the cities. Logarithms of rank data and size data were used for drawing a 2D scatter diagram for fitting. Goodness of fit was used for the evalua-tion of the existence of fractal features. Fig. 1 pre-sents the ranksize distribution status of LED indus-tries in various cities within Hangzhou Bay Area. In this figure, most scatter points were fitted on the same straight line, coefficient of determination was
2R =0.943, and obvious and broad scale-free inter-val was observed with obvious fractal features. The number of dimensions fD =0.866<1 was solved ac-cording to formulas (2) and (3). The result indicat-ed that LED industries with different hierarchical scales were under a disperse distribution, and the monopoly of firstrank cities was strong. In a similar way, the scale structures of LED industries in Hang-zhou Bay Area since 2002 were analyzed, and fD values over the years were obtained. Notably, coef-ficients 2R of determinations of all years reached above 0.9, suggesting that the spatial scale struc-tures of all the LED industries within the Hangzhou Bay Area have obvious fractal features.
As shown in Table 1, the Df values in all years were smaller than 1, indicating that the overall deve-lopment degree of the LED industries in the Hang-zhou Bay Area was not mature enough. The LED industries had a non-uniform distribution in diffe-rent cities, and the firstrank cities had strong mo-nopoly. From the time sequence, the fD values ini-tially presented an increasing evolution trend before levelling off. The fD values from 2002 to 2010 in-creased obviously, showing that the balance de-gree of LED industries in space within Hangzhou Bay Area gradually increased. This spatial struc-tural evolution trend promoted industrial develop-ment in medium and small cities and facilitated the functional coordination in the entire LED in-dustry. Since 2011, fD values have been basical-ly stabilized at 0.86. This result, on the one hand, suggests the oversaturation state of investment and construction of medium and small cities and gra-dual increase of LED industrial scales in various ci-ties. On the other hand, this outcome indicates the “marginal challenge” effect in LED industrial space within the Hangzhou Bay Area.
Fig.1. Diallogarithm diagram of LED industrial ranksize distribution in Hangzhou Bay Area Fig.2. Distributional proportions of LED industrial scales
in large, medium, and small cities
Table 1. Df Values of LED Industries in Hangzhou Bay Area since 2002
Year R2 Df Year R2 Df
2002 0.946 0.642 2010 0.926 0.823
2003 0.942 0.683 2011 0.923 0.845
2004 0.938 0.737 2012 0.922 0.862
2005 0.934 0.746 2013 0.938 0.865
2006 0.931 0.732 2014 0.918 0.866
2007 0.928 0.763 2015 0.923 0.869
2008 0.925 0.752 2016 0.935 0.868
2009 0.934 0.778 2017 0.928 0.866

Light & Engineering Vol. 26, No. 2
171
For the further analysis of spatial pattern evolu-tion of LED industries in Hangzhou Bay Area, the main cities were divided into large, medium, and small types. The distributional proportions of LED industrial scales among the three-type cities are il-lustrated in Fig. 2.
Overall, the scale structures of LED industries in the Hangzhou Bay Area had obvious mono poly features over the years. In the scale ranking, Shang-hai occupies approximately 50 % of the entire LED industrial scale. From time sequence evolution, LED industries gradually migrated from large ci-ties to medium and small cities. The LED output value increased obviously especially in small citi-es, and the spatial structure of the entire LED indu-stry tended to be optimal and stable. In 2002–2011, the proportion of the LED output values in large ci-ties remarkably decreased, whereas those of medi-um and small cities increased obviously with con-tinuously optimized spatial structure. After 2011, change trends of proportions of LED output values in various types of cities were becoming small, and the proportion of LED output values in small citi-es even slightly decreased. The spatial structure of the entire LED industry in Hangzhou Bay Area also tended to be stable.
4.2. Analysis of Associated Structure
For the construction of a 10×10 matrix, Euclid-ean distances between every two industrial clus-ters (straightline distance) in the sample cities were measured by using a geographic information sys-tem platform. Step length k =30 km was used as a scale, and a series of ( )C k values were obtained by changing k value, as shown in Table 2. On this basis, the number of dimensions and coefficient of determination of associated structure were obtained as gD =1.143 and 2R =0.968 with favourable good-ness of fit. The number of dimensions of associated
structure was approximately 1. This value indicat-ed that LED industries in the cities were concentrat-ed within a single linear spatial range with strong spatial correlation. This finding was in accordance with the realistic situation. This linear space was largely a supply chain channel constructed by con-necting “Shanghai–Hangzhou” Huhang line and “Hangzhou–Ningbo” Hangyong line but also in-dicated that LED industries in inland cities were not developed enough. Thus, high requirements had been proposed for improvement of inland sup-ply chain network and industrial competitiveness within Hangzhou Bay Area.
4.3. Research and Judgment of Development Trend
Year 2002 was taken as the base point, and R/S analysis method was used to analyze time sequence evolution trend of numbers fD of dimensions of LED industries within Hangzhou Bay Area as shown in Table 3. Overall, Hurst index presented a descending trend, indicating continuously weak-ened persistence of change of fD values in the same direction but with gradually minimized de-scending amplitude. Before 2013, index was always
Table 2. Associated structural dimensions of LED industries in Hangzhou Bay Area
k/km C(k) k/km C(k) k/km C(k)
30 0.121 180 0.348 330 0.835
60 0.162 210 0.467 360 0.866
90 0.198 240 0.584 390 0.913
120 0.247 270 0.676 420 0.952
150 0.289 300 0.789 450 1
Table 3. Hurst indexes of spatial evolution of LED industries within Hangzhou Bay Area
Period 2002–2006
2002–2007
2002–2008
2002–2009
H 0.784 0.649 0.658 0.732
Period 2002–2010
2002–2011
2002–2012
2002–2013
H 0.633 0.562 0.532 0.515
Period 2002–2014
2002–2015
2002–2016
2002–2017
H 0.485 0.498 0.506 0.497

Light & Engineering Vol. 26, No. 2
172
greater than 0.5, and Df value evolution would pre-sent persistent development trend. This result sug-gested a continuous growth. After 2011, index was approximately 0.5, and fD value evolution would present stable trend with small fluctuation. In sum-mary, as Hurst index continues to fluctuate at 0.5, the spatial structure of LED industries in Hangzhou Bay Area would not change greatly within a period in the future.
5. DYNAMIC MECHANISM OF SPATIAL EVOLUTION OF LED INDUSTRIES IN THE HANGZHOU BAY AREA
5.1. External Factors
The external influence factors of spatial evo-lution of LED industries are mainly manifested at three aspects. The first aspect is the driving effect of associated industries [10]. LED products are impor-tant supporting products of various manufacturing industries. The Hangzhou Bay Area is a developed manufacturing industry, and the development of in-dustries, such as automobile, requires a large quan-tity of LED products. This phenomenon has provi-ded enormous demand market for the LED industry [11]. The second is governmental policy support. Governmental guidance is a decisive factor of the spatial evolution of LED industries [12]. In recent years, the local government of the Hangzhou Bay Area has planned multiple LED industrial parks and industrial bases and attracted many LED enterprises by providing preferential policies to form enormous agglomeration effect. The third is agglomeration of scientific and technological innovation elements [13]. LED industry development cannot go with-out support from scientific studies. Hangzhou Bay Area is agglomerated with many famous colleges, universities, and scientific research institutes with dense intelligent elements. Domestic top-end LED R & D centre has also been formed. R & D and pa-tent service can provide guarantee for spatial ag-glomeration and development of LED industries in this area.
5.2. Internal Factors
Internal influence factors of spatial evolution of LED industries mainly include three aspects. The first is competition and cooperation between enter-prises. Internal competition between enterprises is
the direct cause for “marginal challenge” [14]. With the improvement and elevation of their own envi-ronments, medium and small cities have adopted a series of strategies, such as price competition, po-licy support, and fiscal subsidies to attract LED en-terprises to set up production and R & D bases to di-lute industrial resources of large cities and narrow regional gaps. Meanwhile, industrialchain coo-peration is formed between cities to promote joint growth of LED industrial scales in these cities, and this growth usually presents high synchroni-zation and promotes stability of spatial structure of LED industries. The second is core technological control. LED industries have strong technological orientation. Enterprises with strong R & D abilities within the industry usually control core technolo-gies and patents in this industry. These enterpri-ses can become core enterprises on LED industrial chain and can constitute and develop the entire in-dustrial chain to decide the spatial layout of the re-gional industry. The third is industrial talents. LED industry involves multiple disciplines, such as light, electricity, and heat. Thus, a large number of com-prehensive professional and technical talents are needed. Nowadays, shortage of high-end talents has become the key bottleneck restricting LED indus-trial development in Hangzhou Bay Area. The citi-es that can provide good development environment for talents can attract related technical talents and attract agglomeration of high-end enterprises in the industrial chain to form an industrial development highland.
6. CONCLUSIONS
LED industry in Hangzhou Bay Area was taken as an example in this research, and fractal method was used to analyze the spatial structure and evo-lution trend of LED industry. The research shows the following: (1) spatial structure of LED industry in Hangzhou By area is not only of monopoly fea-ture but also of “marginal challenge” spatial effect and generally tends to be optimal and stable; (2) LED industries in Hangzhou Bay Area are distribut-ed within a linear range with strong interaction bet-ween main cities; (3) persistence of spatial structur-al fluctuation of LED industries in Hangzhou Bay Area decreases and finally tends to be stable; and (4) the abovementioned dynamic mechanism of spatial structure and its evolution is not only rela-ted to peripheral economic environment and poli-
Light & Engineering Vol. 26, No. 2
173
cy environment of LED industry but also is closely related to internal development factors within LED industry.
ACKNOWLEDGEMENT:
The authors are grateful for the support provided by the National Natural Science Foundation of Chi-na (No. 41501142).
REFERENCES:
1. Ciriminna, R., Albanese, L., Meneguzzo, F., Paglia-ro, M. LED street lighting: a looking ahead perspective. Green, 2015. V5, #1–6, pp.83–94.
2. Gayral, B. LEDs for lighting: Basic physics and prospects for energy savings. Comptes Rendus Physique, 2017. V18, #7–8, pp.453–461.
3. Khorasanizadeh, H., Parkkinen, J., Parthiban, R., Moore, J D. Energy and economic benefits of LED adop-tion in Malaysia. Renewable & Sustainable Energy Re-views, 2015. V49, pp.629–637.
4. Duee, D. LED lighting industry: Opportunity or health hazard? Light & Engineering, 2012. V20, #3, pp.23–24.
5. Rammohan, A., Kumar Ramesh, C. A review on ef-fect of thermal factors on performance of high power light emitting diode (HPLED). Journal of Engineering Science and Technology Review, 2016. V9, #4, pp.165–176.
6. Ma, D., Hung, S W. An Integrated Framework for the Selection and Acquisition of Core Technologies: The
Case of Taiwan’s LED Industry. Long Range Planning, 2015. V48, #6, pp.381–397.
7. Yushan, C., Biyu, C. Utilizing patent analysis to ex-plore the cooperative competition relationship of the two LED companies: Nichia and Osram. Technological Fore-casting and Social Change, 2011. V78, #2, pp.294–302.
8. Kaa, G V D., Greeven, M. LED standardization in China and South East Asia: Stakeholders, infrastructure and institutional regimes. Renewable and Sustainable En-ergy Reviews, 2017. V72, pp.863–870.
9. Mason, D M. The Hurst phenomenon and the res-caled range statistic. Stochastic Processes and their Ap-plications, 2016. V126, #12, pp.3790–3807.
10. Diez, O., LarrodePellicer, E., MuerzaMarin, V. Improving competitiveness in companies of the auto-motive supply industry: Twinequipment strategy. DYNA, 2017. V92, #4, pp.380–381.
11. Jing, W., Yixi, C., Xiaohua, L., Yunfei, S., Yachao, B., Jun, W., Yunxi S. Experimental study on optical-ther-mal associated characteristics of LED car lamps under the action of ionic wind. Microelectronics Reliability, 2018. V82, pp.113–123.
12. Wei, W. The role of the government in the deve-lopment of the LED industry. Light & Engineering, 2016. V24, #3, pp.128–131.
13. Jurene, S., Jureniene, V. Creative cities and clus-ters. Transformations in Business & Economics, 2017. V16, #2, pp.214–234.
14. Ikeda, K., Akamatsu, T., Kono, T. Spatial peri-od-doubling agglomeration of a core–periphery model with a system of cities. Journal of Economic Dynamics and Control, 2012. V36, #5, pp.754–778.
Haiwei Fu, Doctor of Engineering, Associate Professor. Graduated from the Shanghai Maritime University. Fellow of the Ningbo University of Technology of China
174
Light & Engineering SvetotekhnikaVol. 26, No. 2, pp. 174–179, 2018 No. 4, 2018
TECHNOLOGICAL INNOVATION AND LED LIGHTING INDUSTRY DEVELOPMENT IN CHINA
Lijun WANG1,2, Yongbo YU1, and Jialong XIE3*
1 School of Economics and Management, Hubei University of Technology Wuhan, Hubei, 430068 China;
2 School of Economics and Management, Huazhong Agricultural University Wuhan, Hubei, 430070, China;
3 School of Management, South-Central University for Nationalities Wuhan, Hubei, 430074, China
* E-mail: [email protected]
ABSTRACT
Current lighting industry faces a new situation, and that is rapid progress of technology in the world, rise of emerging applications, acceleration of mar-ket penetration and adjustment of competition pat-tern. The concentration of China’s industries has been further improved. Leading enterprises have ac-celerated their expansion, and overseas market ex-pansion has accelerated. Integrating mergers and acquisitions becomes the mainstream. The study combed present development situation and current problems of China’s LED lighting industry. A case was chose to analyze technological innovation’s ef-fect on development of LED lighting industry, and the suggestions for further developing China’s LED lighting industry were put forward. Results show that the key technology of lighting industry makes a significant breakthrough in China and optimizes product structure.
Keywords: LED, lightning industry, technologi-cal innovation
1. INTRODUCTION
As the global consensus on developing low car-bon economy, LED lighting industry with its per-formance advantages in the field of saving energy and reducing consumption will usher in the rapid
development of the precious opportunity [1]. At the same time, advantages of LED lighting are incom-parable. As a new generation of light source in the world, LED is regarded as the most promising green lighting source in the 21st century due to its advan-tages of energy saving, environmental protection, good colour rendering and long life [2].
Technological innovation is becoming a huge driving force for the rapid development of LED lights. LED industry developed rapidly and a large number of leading enterprises had sprung up in re-cent years. Kingsun Optoelectronic Corporation and State Key Laboratory on Integrated Optoelectron-ics and of Tsinghua University built Semiconduc-tor Lighting Technology Research Institute together, which meant the enterprise of science and technolo-gy transformation and university research techno-logy closely linked. It contributed to promoting the development of LED industry to the depth field [3]. Research and development of its core function was through construction of technology innovation plat-form, technology promotion and service platform, technical personnel and enterprise incubation plat-form, service platform, technological product with LED encapsulation and testing service centre, LED lighting applications and service centre, LED opti-cal application and test centre for hardware support. It provided scientific research, technology, human resources and industrial investment services for

Light & Engineering Vol. 26, No. 2
175
LED industry cluster in all aspects, and promoted steady and rapid development of LED industry [4].
2. DEVELOPMENT STATUS ANALYSIS OF LED LIGHTING INDUSTRY IN CHINA
2.1. Industrial Chain
Epitaxial wafer and chip patents in upstream are monopolized by Japanese, European and American enterprises, which will lead to excessive produc-tion of LED chips, especially in China. In the pack-aging process of the middle reaches, Korean enter-prises rise rapidly, and good supply and demand of the industry will enhance the added value of pack-aging products [5]. Domestic enterprises with help of government and local advantages can compete with international well-known enterprises in appli-cation links in downstream. After years of deve-lopment, China’s LED industry chain has been gra-dually improved, and enterprises are all over the substrate, epitaxy, chip, package and application, Fig. 1. In view of the overall industrial chain, be-cause the upstream industry has a high demand for technology and capital, it is rarely involved in do-mestic enterprises. Therefore, there are few enterpri-ses and small scale characteristics in the industry [6]. By contrast, due to the downstream packaging and application of funds for enterprises and technical re-quirements are relatively low, this matches the cha-racteristics of domestic enterprises, namely rather
less money with weak technology. As a result, large number of enterprises engaged in packaging and application. The uneven distribution of enterprise structure leads to the majority of low-end products in China’s LED industry, and the enterprises are faced with severe price pressure in the long run [7].
2.2. Industrial Distribution
China’s LED lighting industry distribution is centralized, which has initially formed four regions of the Pearl River delta, the Yangtze River delta, southeast areas, north area, such as Beijing and Da-lian. Each region basically forms relatively com-plete industrial chain. Four regions, namely Dali-an, Shenzhen, Xiamen and Nanchang, have mature LED production base. Overall, South China’s LED industry pattern of industrialization degree is higher. The Pearl River delta and the Yangtze River del-ta are the most concentrated areas of domestic LED lighting industry [8]. The middle and lower reach-es of industry chain is more complete, which gath-ers more than 80 % of China’s related businesses. While, north area relies on a large number of uni-versities and scientific research institutions, and product research and development strength is rela-tively strong.
2.3. Industrial Scale
In recent years, China’s lighting industry gene-rally has continued to rise. In 2016, whole output
Fig.1. Industrial chain of China’s LED
Substrate (Si, Sapphire, SiC,
Metal)
Epitaxial wafer (Optical Material)
LED(Chip, Crystal)
LED engineering (Application)
LED lamp and lantern
(Application)
LED light source
(Packaging)
Fig.2. Industrial scale of China’s LED

Light & Engineering Vol. 26, No. 2
176
value of China’s lighting industry reached 521.6 bil-lion yuan, increasing 22.8 % compared with 2015. The growth rate was slow down, shifting from “ul-tra-high speed” to “medium”. In 2017, overall sales of the industry were about 580 billion yuan, with 11.20 % increase from 2016, shown in Fig. 2. The main reason is influenced by the significant dollar depreciation. Although export grows from $38.8 billion in 2016 to $41.2 billion in 2017, the contri-bution to overall sales growth has been limited.
3. DEVELOPMENT PROBLEMS OF LED LIGHTING INDUSTRY IN CHINA
At present, China’s LED lighting has many ap-plications in general lighting areas, such as tunnel lighting, road lighting, airport lighting and under-ground lighting. It emerges a batch of demonstra-tion significance for application projects, such as semiconductor lighting energy-saving renova-tion project of the great hall, LED lighting of water cube and Shanghai World Expo pavilion, etc. How-ever, overall market share of LED lighting is still small, and the application is still in the early stage of exploration, and there is still a long way to go for large-scale promotion. The following problems need to be solved:
1) The price of LED lighting is still too high. Al-though the state finance has relevant subsidies, it is still difficult to reach the degree that most engineer-ing projects and ordinary people can accept. This requires further technological innovation and de-velopment, reducing costs and developing products that can be industrialized at a low price.
2) Current testing methods and standards of sem-iconductor lighting products are lagged behind, which is far behind technology and product up-grading. This leads to the result that quality of pro-ducts on the market is uneven. It’s difficult for us-ers to discern whether product is good or bad, even the defective goods in circulation market share is bigger [9].
3) Industrial resources are not centralized. The market is more chaotic, and phenomenon of disor-dered and low-price malicious competition is wide-spread, which affects longterm and orderly deve-lopment of the whole industry.
4) Energy saving awareness in some areas of the society is not strong enough, and the cogni-tion of energy saving effect brought by semicon-ductor lighting is not yet in place. For LED lighting
applications, there are also problems such as light decay, heat dissipation and light distribution, etc. Besides, system circuit board, control and drive are also included.
3.1. Development of Related Lamps and Lanterns
For energy-saving lamps, although energy sav-ing is an important function, their more important status is the lamp. In modern homes and cities, the role of lights is not only illumination, but also a de-coration. Different places, such as shopping malls, hotels, restaurants, supermarkets, and the fami-ly houses lighting has different requirements, and if energy-saving lamps on the appearance design, functional design, lack of innovation and break-through cannot take the initiative to meet the needs of the diversity of consumers, it is difficult to get market acceptance.
3.2. Patent Problem
At present, core patents of the LED industry are mainly controlled by several foreign companies. These companies use their respective core patent, adopt horizontal (entering several countries simulta-neously) and vertical (perfect design for subsequent application) extension way, and decorate the rigo-rous patent worldwide network. Several internatio-nal LED factories make full use of the intellectual property related to LED to achieve the goal of strik-ing opponents and to maintain their own market po-sition. Developed countries are taking advantage of patent weapons to seize the market of China, form-ing the trend and pressure of “peripheral blockage” of Chinese enterprises.
3.3. Localization of MOCVD
MOCVD is metal organic chemical vapour deposition equipment, which is the most critical equip-ment for LED epitaxial. The purchase cost is about two-thirds of that of whole LED production line. Rapid development of semiconductor lighting in-dustry appears, and demand of the MOCVD equip-ment continues to increase. More than 90 % of MOCVD markets around the world have been con-trolled by AIXTRON Company in Germany and VEECO Company in the United States. At pre-sent, China totally dependents on imports of pro-
Light & Engineering Vol. 26, No. 2
177
ductionoriented MOCVD equipment each year, and needs to invest heavily to buy such equipment. Maintenance and spare parts procurement have so much inconvenience [10].
4. CASE STUDY
Hannway Technology Corporate captured the be-ginning period of LED industry. On the one hand, it established industrialization through capital in-vestment. On the another hand, through coopera-tion with scientific research institutes of colleges and universities, it introduced Shanghai Academy of Astronautics as technical support. It had break-through constant current driver with high reliability, high efficiency heat dissipation, integrated optical engine, LED indoor and outdoor lighting industri-alization technology difficulties. It introduced a se-ries of LED lighting products in Shanghai, in the office building, hospital, school, the subway, road, tunnel, hotel, etc. In the lighting renovation, sat-isfactory energysaving effect was obtained. The good product quality, humanized design and high quality service made enterprise product to be pro-moted quickly in the market, and also to be paid at-tention by the traditional lighting giants. Under the condition of good market record, enterprise develop-ment had always been to “scientific and technologi-cal innovation” as the source of enterprise progress. Through external exchanges and cooperation, in-crease investment in research and development, con-tinuously upgraded products. No matter from quality LED lighting products, performance and cost perfor-mance, the corporation always was a market leader. It had invested heavily to deepen cooperation with Shanghai Space Academy and explored new appli-cation fields. With the help of science and technolo-gy commission, scientific research got achievements successively.
At present, Hannway Technology Corporate had been awarded Shanghai metro, hospital, universi-ty and other major lighting projects through con-tinuous market development. Construction of net-work construction in the field of drainage channels has also been effective. The market share gradually expands, and the sales increase year by year. It can achieve today’s results, more inseparable from stra-tegy guidance of “innovation driven, transforma-tion development”. It will bear in mind that science and technology is the first productive force, and the spirit of innovation as the soul of the enterprise.
5. DEVELOPMENT STRATEGY CHINA’S LED LIGHTING INDUSTRY BASED ON SCIENTIFIC AND TECHNOLOGICAL INNOVATION
5.1. Improving Standard System for Industrial Technology and Cooperation
On the one hand, China’s LED equipment indu-stry is a lack of complete technical standard system in the process of foreign competition. On the oth-er hand, cooperative innovation of China’s LED production equipment enterprise is also a lack of unified template and standardized system of coo-peration. In industry standard system, China’s go-vernment should play a fundamental role. Although there have been “CBS” system in the United States and “Muse” system in Japan, for growth of China’s LED lighting industry, perfect market mechanism brings a few standard monopoly and market growth and the possibility of cooperative innovation.
Therefore, government should plan and coordi-nate different chain link, segmentation, local and central standards of LED industry. Through exten-sive international cooperation and market research, China should occupy the commanding heights of global LED industry standards. Taking construc-tion of LED standard system as an opportunity, it should gather the standard cooperation and ve-rification of LED equipment enterprises and pro-duction enterprises. At the same time, the standard should be kept open.
China’s LED equipment enterprise technical le-vel has got greater ascension, but due to the use of habits and credit related problems, production enter-prises are not willing to cooperate with equipment enterprise. Therefore, the government needs to in-crease conversion efficiency of scientific research achievements, reduce the cost and risk of LED pro-duction enterprises, and fully realize the value of China’s equipment enterprises.
5.2. Strengthening Scientific and Technological Innovation to Improve Achievement Efficiency
Due to the failure of high-end manufacturing equipment in the trial process, loss to LED man-ufacturers will be huge. Even equipment maker agreed to let free trial of LED production enterpri-ses, it can affect LED manufacturing enterprises’ willingness to try, due to technical workers brought

Light & Engineering Vol. 26, No. 2
178
by inappropriate use of inertia and trial enormous losses. Therefore, many LED lighting companies do not have the confidence to try out domestic equip-ment. Companies tend to have no confidence to try homebred MOCVD equipment, because produc-tion process also involves a lot of raw materials and artificial cost. Once waste is produced, manu-facturing enterprises need to bear a great loss. Pro-vision of free equipment and costs may be beyond capacity of device makers. Subsidy fund or a risk compensation fund should be set up to try and de-sign a welldesigned subsidy policy for equipment of China’s LED manufacturers. It is encouraged to jointly build production line of LED equipment enterprises and production enterprises, which will be funded by the government or provided with oth-er financial and administrative support to strengthen the trial intention of LED manufacturers.
5.3. Building a Symbiosis Innovation Ecology with Leading Enterprise as the Core
Foreign enterprises’ specialized degree is high, and they generally plough in the field of LED equip-ment for decades deeply. Due to companies’ own development ability is strong, more important is foreign industry development and cooperative in-novation is leading enterprises as the core. Up-stream cooperation with a batch of technical abili-ty of small and mediumsized enterprises, colleges and universities, and research institutions is quite important. Downstream cooperation with a batch of leading enterprises and users is necessary. Develop-ment of leading enterprises returns to these small and mediumsized enterprises and partners, form-ing a positive cycle. Under such a symbiotic rela-tionship, the system can continuously create blood and innovation.
Therefore, government needs to guide and sup-port China’s LED industry through strategic plan-ning, tax incentives, credit support and special funds. Lighting enterprises should cooperate with each other to deal with the technological innova-tion challenge and the impact of foreign competi-tors. Attention should be paid to industrial chain of vertical integration and building LED equipment leading enterprises as the core, to support small and mediumsized hightech enterprises and produc-tion application enterprises. In the process, govern-
ment and other organizations should ensure service collaborative innovation pattern. It should make full use of regional potential, gather technology and ap-plication resources, reduce transaction costs and credit crisis, and extend the LED industry chain.
6. CONCLUSIONS
With rapid development of lighting technolo-gy, technological innovation becomes the key peri-od of lighting industry power. In planning guidance, key technology of lighting industry in China will continuously breakthrough and optimize product structure. LED industry has expanded steadily and concentration has gradually increased. The field of application is constantly broadened. The mar-ket environment is more standardized. The busi-ness model transcends innovation, and the indepen-dent brand is bigger and stronger, which lays a solid foundation for China’s development from big power of lighting industry to the great power.
ACKNOWLEDGEMENT
This work was supported by the Humanities and Social Sciences Research Youth Fund Project of Ministry of Education, “Differences and Col-laboration of Innovation Gradient in Urban Agglo-merations” (15YJC790108), “Research on Spatial Variation of Innovative Polarization and Crossbor-der Collaboration of National High-tech Zones” (16YJC630048); the National Natural Science Foundation of China “Research on Innovation Vul-nerability Mechanism and Optimization Control of National Hightech Zones for System Effective-ness” (71602192); Humanities and Social Sciences Research Youth Fund Project of Hubei Provincial Department of Education, “Research on the Foun-dations and Approaches of Innovative Collabora-tion among Urban Agglomerations in the Midstream of the Yangtze River” (16Q100); Ph.D. startup gold project of Hubei University of Technology, Soft Science Project of Science and Technology Depart-ment of Hubei Province, “Investigation and collab-orative mechanism design of science and technolo-gy achievements transformation in Hubei province” (2016ADC025); the Fundamental Research Funds for the Central Universities, SouthCentral Univer-sity for Nationalities (CZQ18002).

Light & Engineering Vol. 26, No. 2
179
REFERENCES
1. Bardsley, N., Bland, S., Hansen, M., et al. Sol-id-state lighting R&D plan. US Department of Energy, 2015. V20, #2, pp.19–27.
2. Maruska, H. P., Tietjen, J.J. The preparation and properties of vapour-deposited single-crystal-line Ga N. Applied Physics Letters, 1969. V15, #10, pp.327–329.
3. National Development and Reform Commission. The 13th fiveyear plan for semiconductor lighting indu-stry. Beijing: National Development and Reform Com-mission, 2017.
4. National Semiconductor Lighting Engineering R&D and Industrial Alliance. 2017 LED industry quar-terly analysis report. Beijing: National Semiconductor Lighting Engineering Research and Development and In-dustrial Alliance Industry Research Institute, 2017.
5. Fei, G., Bingsong, Z. Review on the development and implementation of China’s green lighting project. Journal of Lighting Engineering, 2016. V27, #4, pp.1–7.
6. Mingming, W. Interpretation of the development situation of China’s semiconductor lighting industry. New Materials Industry, 2015. V5, #3, pp.14–18.
7. Mingming, W., Shuai, Q., Xiaojia, L. Development status and trend of semiconductor lighting industry. New Material Industry, 2016. V3, #2, pp.21–27.
8. OkonHorodynska, E., Wisla, R., Sierotowicz, T. Leading trends of the information society technolo-gy develop-ment case study of IBM. Transformations in Business & Economics, 2013. V12, #2, pp.421–430.
9. TzongSong, W., ShengWen, H. An assessment of individual and technological factors for computing vali-dation: motivation and social processes. Revista de Cerce-tare si Interventie Sociala, 2015. V50, #2, pp.156–171.
10. DiazParra, O., RuizVanoye, J., FuentesPenna, A. A summary of the project planning of technological innovation. DYNA, V91, #2, pp.123.
Lijun WANG, Doctor of Management Science and Engineering, lecturer. Graduated from Wuhan University of Technology. Fellow of Hubei University of Technology of China. Postdoctor of Huazhong Agricultural University
Yongbo YU, Doctor of Management Science and Engineering, Assistant Professor. Graduated from Wuhan University of Technology. Fellow of Hubei University of Technology
Jialong XIE, Doctor of Management, Lecturer. Graduated from Wuhan University of Technology. Fellow of SouthCentral University for Nationalities

180
Light & Engineering SvetotekhnikaVol. 26, No. 2, pp. 180-188, 2018 No. 6, 2018
ADVANTAGES OF LED LIGHTING SYSTEM IN COMPARISON WITH TRADITIONAL FLUORESCENT LAMPS
FOR SIMPLE EXAMINATION ROOMS IN HEALTHCARE FACILITIES
Canan Perdahci
University of Kocaeli, Faculty of Engineering, Department of Electrical Engineering, Umuttepe Campus, Kocaeli, Turkey
E-mail: [email protected]
ABSTRACT
This paper presents a detailed comparison bet-ween a new type of antibacterial LED panel and fluorescent lamps connected to electronic ballast in a simple examination room, which requires 300 lx in a healthcare facility. Within the study, power con-sumption (W), luminous flux (lm) and luminous ef-ficacy of both light sources were measured. Lumi-nous flux values were then compared to the amount of power they consumed. Electrical power con-sumption of these luminaires was also analyzed. To enable an objective comparison between these two types of luminaires ReluxDesktop_2017.1.10.0 simulation program was used. To verify the results obtained by the ReluxDesktop, photometric mea-surement results of the products were also obtained. The results obtained by the study have shown that the LED panel to be used in the healthcare facili-ty may decrease the maintenance and lighting costs by saving energy while maintaining the illumina-tion levels required by the healthcare facility light-ing standards.
Keywords: healthcare facility, lighting, energy efficiency, LED
1. INTRODUCTION
In terms of energy consumption, healthcare fa-cilities can be considered as one of the energy inten-sive buildings because of the lighting requirements and of being 24/7 living structures. Therefore, they
consume a very high amount of electricity, which equals to 11 % of the commercial electricity. When compared to the share of lighting in total energy consumption (16 %), the share of lighting in health-care facilities reaches up to 44 % [1]. Thus, it is cru-cial to create a design, which will sustain the re-quired lighting levels for patients and the hospital staff in different parts of the healthcare facilities while decreasing the energy consumption for the lighting requirements of them.
Energy saving is an ever changing and grow-ing concept with the rise of LED lighting systems. It is not difficult to raise the savings up to 70 % in LED lighting systems with intelligent automa-tion systems.
The improvement of LED technology changed a great deal of things in lighting field. Obviously, the most significant change is the energy efficiency that LED lamps can provide. The LED lamp con-sumes almost half of the energy of a convention-al lamp while providing the same illuminance level [2]. This huge energy saving could also save a lot of natural resources and reduce carbon emission se-verely [3].
Performance and comfort limits in healthcare facilities defined by the relevant standards must be considered before applying a new lighting sys-tem. This will definitely enhance patient’s comfort as well as staff’s performance. The lighting require-ments of healthcare facilities, in particular, hospi-tals are not only effectual to the patients but to the medical and nonmedical staff as well when their

Light & Engineering Vol. 26, No. 2
181
tasks are taken into consideration. It is important to reduce mistakes and increase their performance via effective usage of lighting [4]. Moreover, the ef-fects of lighting on people can also be both physio-logical and psychological [5].
The lighting system must be specified according to many properties which are: the illuminance le-vel, the illuminance uniformity, the luminance dis-tribution, the daylight availability, the prevention of glare, the colour rendering and the correlated co-lour temperature (CCT)[6]. The lighting require-ments for each area in hospital have been set by EN12464–1 standard [7].
Hygiene is another important factor in health-care facilities and the luminaire used in them is no exception. Thus, IP 65 luminaries should be applied to curtail maintenance costs and keep the dust and bacteria away from the luminaires. Coating the lu-minaire with antibacterial paint prevents bacterial growth [8].
By integrating different automation systems into different lighting applications in various parts of the healthcare facilities, it will be possible to save on energy and money and reach the desired efficien-cy. This study focuses on the most appropriate light-ing type which will be visually and financially viable. Lighting for hospitals and healthcare facilities must be shaped in accordance with the economical, hygienic considerations stated above.
2. PROPERTIES OF HEALTHCARE FACILITY LIGHTING
In order to fulfil medical tasks, optimal illumina-tion levels must be achieved and maintained at all times. High levels of visual comfort and the absence of glare on the eyes of staff is fundamental to the hospital staff while fulfilling their tasks. Doctors need glare-free lighting systems to perform their task, which is important since their tasks are mostly vital [9]. As well as doctors, nurses also need diffe-
rent illuminance for different tasks and areas to per-form. [4]
When taken into consideration, it is vital to use lighting sources with colour rendering close to na-tural light [10]. This paper deals with simple exam-ination room lighting on the examination plane for nursing tasks and simple examinations in a hospital. DIN EN12464–1 and DIN5035–3 recommend illu-minance of around 300 lx on the examination plane for nursing tasks and simple examinations. Uni-formity is another aspect in lighting, the ratio of ma-ximum to average illuminance should be minimum 1:2. The lighting requirements of the rooms in hos-pitals can be found in Table 1.
Table 1 illustrates the most important require-ments that have to be met by lighting in terms of pa-rameters such as the illuminance uniformity (U0), the colour rendering index (Ra) of the lamps and the maximum values of discomfort glare (UGRL), the minimum values of average maintained illumi-nance (Eav).
Hospital infections have affected millions of people so far and it could not be prevented yet. Therefore, hospitals need to be sterilized all the time. In order to maintain sterilization, luminaires should be painted with anti-bacterial dye [8].
There are psychological and mental effects of lights as well as physiological effects. Researches show that a good psychological health helps people to get better faster. Proper lighting level can encour-age healing process [5].
3. CASE STUDY AND METHODS
The case study has been conducted in a simple examination room in a hospital in Istanbul, Turkey. In the design, the hospital is considered to deliver highquality care, sustainable 24 hours a day, seven days a week. The dimensions of the simple exami-nation room are 12 m, height is 3 m and breadth is 6 m. The reflection coefficients are: 0.5 for the walls,
Table 1. Light Requirements for Different Hospital Areas According to EN12464–1
Task or activity Eav(lx) UGRL U0 Ra
General lighting 100 19 0.4 80
Simple examinations 300 19 0.6 80
Examination and treatment 1.000 19 0.7 90
Bathrooms and Toilets for Patients 200 22 0.4 80

Light & Engineering Vol. 26, No. 2
182
0.2 for the floor and 0.7 for the ceiling. The required illumination measurement was taken on a work plane that has 0.75 m height. The required illu-minance level for the simple examination room is 300 lx which has been set by relevant standards mentioned before.
The glare index and the colour rendering in-dex will meet the standards to provide the neces-sary visual comfort for both patients and medical as well as nonmedical staff. The lighting scheme is designed with an assumed maintenance factor 0.9.
The lighting simulation results for the study have been obtained by using ReluxDesktop simu-lation program, which supports the following stan-dards: EN12464–1 (2013), EN1838 (2014), ASR A3.4 (2011), DIN5034 (1999); and photometric measurement results were taken by using NFMS Goniophotometer LabSphere Sphere System in line with the TS EN13032–1:2004+A1:2012 standards [11].
The examination room has been designed with reference to the given dimensions. Length, width, height, walls and ground material, and re-flection factors have been defined. The furniture has been placed: there are 5 beds in the examina-
tion room. 2 types of luminaires have been selected from catalogue of ALKAN LIGHTING and placed to provide the illuminance has been defined in stan-dards. ALKAN products: ALKAN, 53.AKSA.418.CPM (53AKSA418CPM.LDT) 4xT26 18W/840 and ALKAN – 7150511 LED Panel [12] were placed and simulated by ReluxDesktop, and then tested by NFMS Goniophotometer LabSphere Sphere System respectively (Scenario 1 and Scenar-io 2). Simulation and test results have been gathe-red, and they have been compared in terms of ener-gy efficiency and cost effectiveness.
3.1. SCENARIO 1
The fluorescent lamps type 53.AKSA.418.CPE produced by Alkan Lighting are used for the illumi-nation of examination room of the hospital.
The lighting distribution values in lx are illus-trated in Table 2. The luminous flux of the luminaire is 3507 lm and the total energy consumption of the luminaire is 74 W. The power consumption of elec-tronic ballast is 2 W. The luminous flux of lamps of luminaire is 6400 lm. The energy efficiency can be calculated as: 3507 lm/6400 lm = 0.55
Totally 7 luminaires were used for the study. So, the total luminous flux is the sum of all the flux-es emitted by 7 luminaires and equals to 24549 lm. Also the total power used equals to 518 W.
According to result of ReluxDesktop program, the average illuminance measured at work plane Eav = 330 lx, the minimum illuminance measured at work plane Emin = 249 lx and the maximum il-luminance measured at work plane Emax =372 lx.
Results of research are presented in Figs.1–6.
Table 2. Illuminance Data
Measured Surface Work Plane Horizontal
Eav 330 lx
Emin 249 lx
Emin/Eav (Uo) 1:1.32 (0.76)
Emax 372 lx
Emin/Emax (Ud) 1:1.49 (0.67)
UGR (4H 8H) <=21.5
Height 0.75 m
Fig. 1. Room graphic in 3D
Fig. 2. 3D colour rendering
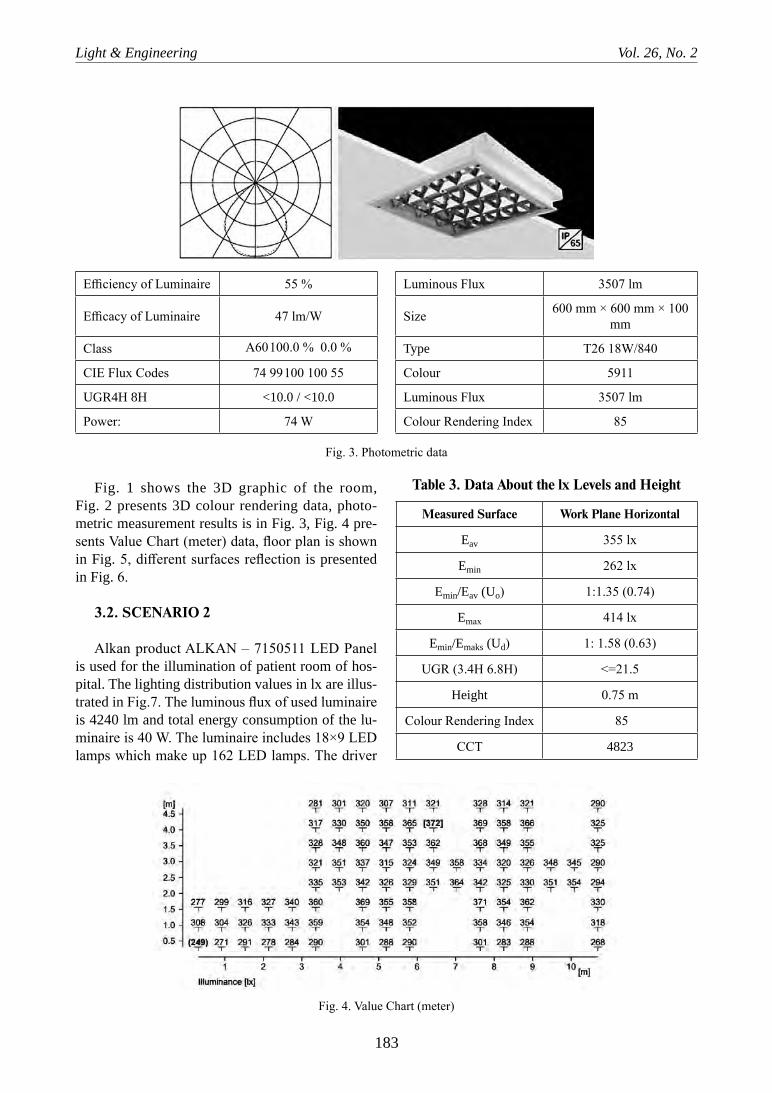
Light & Engineering Vol. 26, No. 2
183
Fig. 1 shows the 3D graphic of the room, Fig. 2 presents 3D colour rendering data, photo-metric measurement results is in Fig. 3, Fig. 4 pre-sents Value Chart (meter) data, floor plan is shown in Fig. 5, different surfaces reflection is presented in Fig. 6.
3.2. SCENARIO 2
Alkan product ALKAN – 7150511 LED Panel is used for the illumination of patient room of hos-pital. The lighting distribution values in lx are illus-trated in Fig.7. The luminous flux of used luminaire is 4240 lm and total energy consumption of the lu-minaire is 40 W. The luminaire includes 18×9 LED lamps which make up 162 LED lamps. The driver
Efficiency of Luminaire 55 % Luminous Flux 3507 lm
Efficacy of Luminaire 47 lm/W Size 600 mm × 600 mm × 100 mm
Class A60 100.0 % 0.0 % Type T26 18W/840
CIE Flux Codes 74 99 100 100 55 Colour 5911
UGR4H 8H <10.0 / <10.0 Luminous Flux 3507 lm
Power: 74 W Colour Rendering Index 85
Fig. 3. Photometric data
Table 3. Data About the lx Levels and Height
Measured Surface Work Plane Horizontal
Eav 355 lx
Emin 262 lx
Emin/Eav (Uo) 1:1.35 (0.74)
Emax 414 lx
Emin/Emaks (Ud) 1: 1.58 (0.63)
UGR (3.4H 6.8H) <=21.5
Height 0.75 m
Colour Rendering Index 85
CCT 4823
Fig. 4. Value Chart (meter)
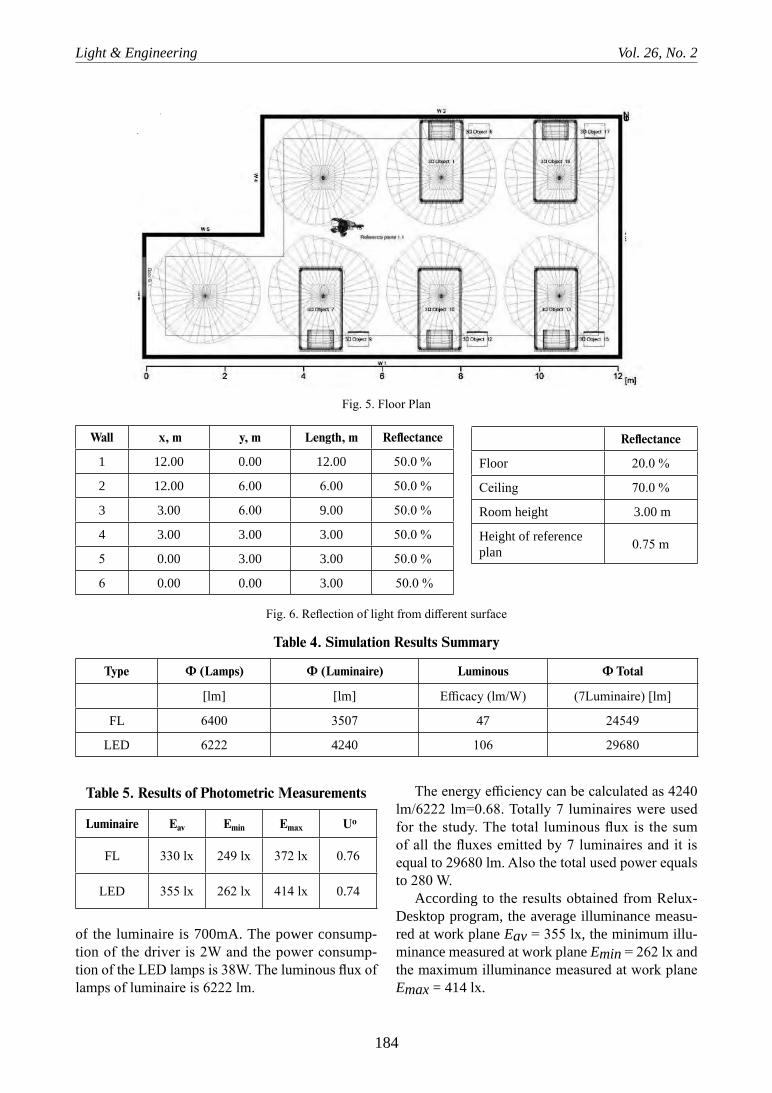
Light & Engineering Vol. 26, No. 2
184
of the luminaire is 700mA. The power consump-tion of the driver is 2W and the power consump-tion of the LED lamps is 38W. The luminous flux of lamps of luminaire is 6222 lm.
The energy efficiency can be calculated as 4240 lm/6222 lm=0.68. Totally 7 luminaires were used for the study. The total luminous flux is the sum of all the fluxes emitted by 7 luminaires and it is equal to 29680 lm. Also the total used power equals to 280 W.
According to the results obtained from Relux-Desktop program, the average illuminance measu-red at work plane Eav = 355 lx, the minimum illu-minance measured at work plane Emin = 262 lx and the maximum illuminance measured at work plane Emax = 414 lx.
Fig. 5. Floor Plan
Wall x, m y, m Length, m Reflectance
1 12.00 0.00 12.00 50.0 %
2 12.00 6.00 6.00 50.0 %
3 3.00 6.00 9.00 50.0 %
4 3.00 3.00 3.00 50.0 %
5 0.00 3.00 3.00 50.0 %
6 0.00 0.00 3.00 50.0 %
Fig. 6. Reflection of light from different surface
Reflectance
Floor 20.0 %
Ceiling 70.0 %
Room height 3.00 m
Height of reference plan 0.75 m
Table 4. Simulation Results Summary
Type Ф (Lamps) Ф (Luminaire) Luminous Ф Total
[lm] [lm] Efficacy (lm/W) (7Luminaire) [lm]
FL 6400 3507 47 24549
LED 6222 4240 106 29680
Table 5. Results of Photometric Measurements
Luminaire Eav Emin Emax Uo
FL 330 lx 249 lx 372 lx 0.76
LED 355 lx 262 lx 414 lx 0.74

Light & Engineering Vol. 26, No. 2
185
Figs. 7–11 show the results obtained in SCE-NARIO 2 experiments.
4. RESULTS AND CONCLUSIONS
This study aims to analyze the energy efficien-cy of two types of luminaires in a healthcare faci-
lity by using simulations and making comparisons. The simulations were carried out by using an anti-bacterial LED panel, which was produced by Alkan Lighting Co. as a part of TUBITAK project number 7150511 and a fluorescent lamp connected to elec-tronic ballast. Their power consumption (W), lumi-nous efficacy and luminous flux (lm) were measu-
Table 6. Luminous Efficasy for FL and LED Luminaires
Type Power consumedP (W)
Total Power consumed P (W)
LuminaireEfficiency (%)
Total Ф (7 Luminaire) [lm]
LuminousEfficacy (lm/W)
FL 74 518 55 24549 47
LED 40 280 68 29680 106
Fig.7. Room graphic in 3D Fig. 8. 3D Rendering
Table 7. Economic Analysis Cost Comparasion:
Fluorescent Luminaire LED Luminaire
Operating Cost
Luminaire Wattage (W) 74W 40W
Number of Luminaires 7 7
Daily Operating Hours (hrs) 24 24
Kilowatthours per day (kWh) 12,43 6,72
Working Days Per Month 30 30
Total kWh per Month (kWh) 372,9 201,6
Total kWh in 10 years (kWh) 44748 24192
Installation Cost
Cost of Installation per single luminaire ($) 24 65
Total Installation Cost of System ($) 72 455
Maintenance Cost
Lamp Lifetime (h) 15.000 50.000
Quantity of the Luminaire in 10 years 6 2
Luminaire cost at the end of 10 years ($) 144 130

Light & Engineering Vol. 26, No. 2
186
Luminaire information Efficacy of Luminaire 106 lm/W
Efficiency of Luminaire 68 % Class A40 100.0 % 0.0 %
CIE Flux Codes 51 83 97 100 100 Power 40 W
Size 600 mm x 600mm x 70 mm Luminous Flux 4240 lm
UGR4H 8H 21.5 / 20.2
Fig. 9. Photometric data
Fig. 10. Value Chart (meter)
Fig. 11. Floor plan

Light & Engineering Vol. 26, No. 2
187
red. The luminous flux values were then analyzed and compared with the power consumption of these luminaires.
Table 4 shows the results of the simulations of two different lighting systems in summary. The aim of the simulations is to illustrate efficiency of fluo-rescent lamp and LED. It can be concluded from the Table 2 that fluorescent lamp luminaire (47lm/W) has lower lm/W value when compared with LED lu-minaire (106 lm/W).
In scenario 1, FLs are utilized and the design consists of 7 luminaires, which give 372 lx levels at maximum. However, in scenario 2, LED luminaires are used in exchange for the fluorescent lamps and consists of 7 luminaires as well. The total amount of maximum level is 414 lx.
In scenario 1, the total luminous flux of the flu-orescent luminaire lamps equals to 6400 lm and the luminous flux of the fluorescent luminaire equals to 3507 lm. When the luminous fluxes of the flu-orescent luminaires are taken into consideration, it can be concluded that the efficiency of the flu-orescent luminaire is 0.55. In scenario 2, the total luminous flux of the LED luminaire lamps equals to 6222 lm and the luminous flux of the LED lumi-naire equals to 4240 lm. Therefore, the luminous fluxes of the LED luminaires show that the efficien-cy of the LED luminaire is 0.68. In conclusion, once the luminaire efficiency is conceived, fluorescent lamp luminaires are 13 % less efficient than LED lamp luminaires.
While planning the study, in order to avoid ex-tra expenses and labour, we anticipated to change 7 fluorescent luminaries with the same number of LED luminaires. While doing that, we kept the size of the LED luminaires the same as the fluorescent luminaires so as not to increase cost as a change in size would mean more civil and electrical work to be done, which will mean a rise in the expen ses
of the healthcare facilities. Thus, the number and the size of the luminaires had to be kept the same during the study.
When all the data collected in this study were examined, they show some striking differences bet-ween the commonly used fluorescent luminaires and LED luminaires. First of all, both types of lu-minaires provide the necessary illumination level (300lx) of a simple examination room. However, LED luminaire is efficient in providing the neces-sary illumination levels and it is almost two times more effective in this field. Secondly, total pow-er consumption of fluorescent luminaires is nearly twice as much as the power consumption of LED luminaires (518 W/ 280 W). These figures suggest that while using fluorescent luminaires in healthcare facilities, we get almost the same illumination le-vel despite consuming approximately twice much electrical energy compared to LED luminaires used in the study.
The economic performance of the LED lumi-naires in this study is significantly improved com-pared to the fluorescent luminaires with electronic ballast due to decreased costs and increased savings.
It can be concluded form Table 8 that lighting parameters UGRL, U0, and Ra of the LED lumi-naire has better values then the fluorescent lumi-naire with electronic ballast.
Lighting up the health care facilities is a substan-tial duty for the continuity of the services of the fa-cilities as well as for the well-being of the patients there. In order to achieve the required and desired
Table 8. The Values of Qualitative Characteristics
Type UGRL U0 Ra CCT
FL 21 0,76 78 6041K
LED 13 0,74 85 5000K
Wall x, m y, m Length, m Reflectance, %
1 12.00 0.00 12.00 50.0
2 12.00 6.00 6.00 50.0
3 3.00 6.00 9.00 50.0
4 3.00 3.00 3.00 50.0
5 0.00 3.00 3.00 50.0
6 0.00 0.00 3.00 50.0
Fig. 12. Reflection of light from different surfaces
Reflectance
Floor 20.0 %
Ceiling 70.0 %
Room height 3.00 m
Height of reference plan 0.75 m

Light & Engineering Vol. 26, No. 2
188
illumination levels in these facilities, anti-bacteri-al LED luminaires is definitely a better option when compared to its older counterpart, fluorescent lamps in terms of being cost effective, supplying the re-quired illumination level and being anti-bacteri-al, which will get rid of the unwanted side effects of the heat which causes the germs and microbes proliferate.
In conclusion, changing the fluorescent lumi-naires with the LED ones would mean not only saving up energy, which will also mean a decrease in energy expenditures, but also mean achieving the required illumination levels while keeping the sa-nitation high.
ACKNOWLEDGEMENTS
The author would also like to thank TUBITAK, University of Kocaeli and Alkan Lighting Co. for their valuable contributions to the present study.
REFERENCES
1. Perdahci C., LED Lighting for Healthcare Facili-ties, 9th International Exergy, Energy and Environment Symposium (IEEES9), May 14–17, 2017, Split, Croatia.
2. N. Khan, N. Abas, Comparative Study Of Energy Saving Light Source, Renewable and Sustainable Energy Reviews 15 (2011), pp. 296–309.
3. Pimputkar S., Speck J.S., DenBaars S.P., Naka-mura S., Prospects for LED lighting, Nature Photonics, April 2009.
4. Healing Environment: Enhancing Nurses’ Perfor-mance through Proper Lighting Design, Procedia – Social and Behavioral Sciences, Volume 35, 2012, pp. 205–212.
5. Dalkea H., Littlea J., Niemanna E., Camgoza N., Steadmana G., Hilla S., Stottb L., Colour And Lighting In Hospital Design, Optics & Laser Technology, 2006, #38, pp. 343–365.
6. Leccese F., Montagnani C., Iaia S., Rocca M., Sal-vadori G., Quality Of Lighting In Hospital Environments: A Wide Survey Through in Situ Measurements, Journal of Light & Visual Environment, June 2016.
7. Mehrotra S., Basukala S., Devarakonda S., Effec-tive Lighting Design Standards Impacting Patient Care: A Systems Approach, Journal of Biosciences and Medi-cines, 2015, 3, pp. 54–61.
8. Sehmi S.K., Noimark S., Pike S.D., Bear J.C., Pe-veler W.J., Williams C.K., Shaffer M.S.P., Allan E., Par-kin I.P., MacRobert A.J., Enhancing the Antibacterial Activity of LightActivated Surfaces Containing Crystal Violet and ZnO Nanoparticles: Investigation of Nano-particle Size, Capping Ligand, and Dopants, ACS Ome-ga 2016, 1, pp. 334–343.
9. European Standard EN12464–1Lighting Of Work Places Part 1: Indoor Work Places, November2014.http://www.licht.de/fileadmin/Publikationen_Downloads/Guide_DINEN12464–1.pdf.
10. Francesco L., Carlo M., Sergio I., Michele R. and Giacomo S., Quality of Lighting in Hospital Environ-ments: A Wide Survey Through in Situ Measurements, Journal of Light & Visual Environment, June 28 (2016).
11. TS EN13032–1:2004 + A1:2012 Light and Light-ing – Measurement and Presentation of Photometric Data of Lamps and Luminaires Part1: measurement and file. (IESLM79).
12. TUBITAK, Project Number: 7150511, Hastaneler için pcb tabanli ip korumali işik verimliliği yüksek steril aydinlatma armatürü tasarimi ve geliştirilmesi için pro-gresif kalip, punta ve çerçeve montaj hatti tasarimi pro-totip imalati.
Canan Perdahci, Ph.D., received the B. E. and M. Sc. degrees in electrical engineering from the University of Yildiz, Istanbul, Turkey, in 1991 and 1993, respectively and the Ph.D. degree in electrical engineering from the University of Kocaeli, Kocaeli, Turkey, in 1997. In 1992, she joined the Department of Electrical Engineering, University of Kocaeli, as a Lecturer, and in 1998 became an Assistant Professor. Her current research interests include LED lighting, power quality, tunnel lighting, road lighting

Light & Engineering Vol. 26, No. 2
189
CONTENTS
VOLUME 26 NUMBER 3 2018
LIGHT & ENGINEERING(SVETOTEKHNIKA)
Julian B. Aizenberg and Vladimir P. BudakLight and Engineering Science Theoretical Basis and Field of Application
Nicolai I. Shchepetkov, George N. Cherkasov, and Vladimir A. NovikovLighting of Engineering Structures and Industrial Objects, New Aspects of the Topic
Leonid G. Novakovsky and Sergei A. FeofanovProper Lighting of the Escalator – a Set of Radical Solutions
Alexander N. Belkin and Victoria V. DormidontovaPeculiarities of Artificial Lighting of Historical and Modern Landscape Compositions
S.A. Amelkina, O.E. Zheleznikova, and L.V. Sinitsyna LEDs Lighting Effectiveness on Basis of Visual Performance and Visual Fatigue
Michel Van der N. Carli, A. Sperling, and G. BizjakOptimization Methods for Spectral Synthesis of a Tunable Сolour Light Source
T.V. Shirokikh and V.E. IvanovMeasuring the Colour of Diamonds
Yu.V. Nazarov, A.A. Kornilova, and S.M. TyurinThe Artistic Interpretation of Urban Environment Architecture Basis by Lighting Design
Alexei K. Soloviyov, S.V. Stetsky, and N.A. MuraviyovaThe Comfort Lighting Environment Characteristics Definition at Daylight and Combined Illumination by Subjective Expert Assessment
Anna Yu. Turkina, Irina A. Novikova, Andrei N. Turkin, and Galina N. ShelemetievaIlluminance of the Operation Field in Dentistry
O.A. Popov, P.V. Starshinov, and V.N. VasinaFerrite Less Induction luminescent lamp with a Closed Discharge Tube
A.M. Mayorov, M.I. MayorovPulsed Ignition Devices with New Circuit Solutions
Meer, Fred van Lierop, and D.V. SokolovOn the Effectiveness of Modern Low-pressure Amalgam Lamps
Sergei S. Kapitonov, Anastasia V. Kapitonova, Sergei Yu. Grigorovich, Sergei A. Medvedev, and Taher SobhyModeling of the Thermal Mode of Operation of the LEDs in the Luminaire
Anton M. Mishchenko, Sergei S. Rachkovsky, Vladimir A. Smolin, and Igor V. YakimenkoResults of Studies of the Spatial Structure of Atmospheric Emission in the Spectral Range 1.5–2 µkmMichail Yu. Kataev and Andrei K. LukyanovModeling of Reflected Solar Radiation in the Near-infrared Region of the Spectrum
A.S. Shcherbakov and V.A. FrolovMatrix Transformations for Effective Realization of Radiantness Algorithm at Graphics Processors
N.N. Bogdanov, A.D. Zhdanov, and I.S. PotemkinAnalysis of Errors in the Relief of Scattering Microstructures in the Simulation of Light Conducting Systems
E. Yu. Shamparov, I.N. Zhagrina, and S.V. RodeRadiant Heat Conductivity in Lightweight Insulation Materials
Yu.V. Nazarov and V.V. PopovaLight-Design and Textile

PARTNERS OF LIGHT & ENGINEERING JOURNALEditorial Board with big gratitude would like to inform international lighting community
about the Journal Partners Institute establishment. The list with our partners and their Logo see below. The description of partner’s collaboration you can found at journal site
www.sveto-tekhnika.ru
ГСТЗг. Гагарин
BL GROUP holding