
LIGHT & ENGINEERING
144
Volume 27, Number 1, 2019 LIGHT & ENGINEERING Editorial of Journal “Light & Engineering” (Svetotekhnika), Moscow ISSN 0236-2945
-
Upload
khangminh22 -
Category
Documents
-
view
2 -
download
0
Transcript of LIGHT & ENGINEERING

Volume 27, Number 1, 2019
LIGHT & ENGINEERING
Editorial of Journal “Light & Engineering” (Svetotekhnika), Moscow
ISSN 0236-2945

Moscow, 2019
Editorial of Journal “Light & Engineering/Svetotekhnika”
General Editor: Julian B. AizenbergEditor-in-Chief: Vladimir P. Budak
Deputy Chief Editor: Raisa I. Stolyarevskaya
Journal “Light & Engineering” had been founded by Prof. Julian B. Aizenberg in 1993
Editorial Board Chairman: George V. Boos, Moscow Power Engineering Institute
Editorial Board:Sergei G. Ashurkov, Editorial of JournalLou Bedocs, Thorn Lighting Limited, United KingdomTony Bergen, Technical Director of Photometric Solutions International, AustraliaGrega Bizjak, University of Ljubljana SloveniaPeter Blattner, Head of Laboratory of Federal Institute of Metrology METAS Bern-Wabern, SwitzerlandAlexander A. Bogdanov, OJSC, “INTER RAO LEDs Systems”Wout van Bommel, Philips Lighting, the NetherlandsPeter R. Boyce, Lighting Research Center, USALars Bylund, Bergen’s School of architecture, NorwayNatalya V. Bystryantseva, ITMO University, St. PetersburgStanislav Darula, Academy Institute of Construction and Architecture, Bratislava, SlovakiaAndrei A. Grigoryev, Deputy Head of the “Light and Engineering” Chair, MPEI, MoscowTugce Kazanasmaz, Izmir Institute of Technology, TurkeyAlexei A. Korobko, BL Group, MoscowSaswati Mazumdar, Jadavpur University, IndiaDmitriy A. Melnikov, Ministry of Energy of Russian FederationEvan Mills, Lawrence Berkeley Laboratory, USA
Leonid G. Novakovsky, Closed Corporation “Faros-Aleph”Yoshi Ohno, NIST Fellow, (CIE President 2015–2019), USAAlexander T. Ovcharov, Tomsk State Arch. – Building University, TomskLeonid B. Prikupets, VNISI named after S.I. Vavilov, MoscowLucia R. Ronchi, Higher School of Specialization for Optics, University of Florence, ItalyAnna G. Shakhparunyants, General Director of VNISI named after S.I. Vavilov, MoscowNikolay I. Shchepetkov, SA MARchi, MoscowAlexei K. Solovyov, State Building University, MoscowPeter Thorns, Zumtobel Lighting, Dornbirn, AustriaKonstantin A. Tomsky, St. Petersburg State University of Film and TelevisionLeonid P. Varfolomeev, MoscowNicolay Vasilev, Sofia Technical University, BulgariaJennifer Veitch, National Research Council of CanadaPavel P. Zak, Emanuel Institute of Biochemical Physics of Russian Academy of Science (IBCP RAS)Olga E. Zheleznyakova, Head of the “Light and Engineering” Ghair, N.P. Ogarev Mordovia StateUniversity, SaranskGeorges Zissis, University of Toulouse, France

© Svetotekhnika
Light & Engineering” is an international scientific Journal subscribed to by readers in many different countries. It is the English edition of the journal “Svetotekhnika” the oldest scientific publication in Russia, established in 1932.
Establishing the English edition “Light and Engineering” in 1993 allowed Russian illumination science to be presented the colleagues abroad. It attracted the attention of experts and a new generation of scientists from different countries to Russian domestic achievements in light and engineering science. It also introduced the results of international research and their industrial application on the Russian lighting market.
The scope of our publication is to present the most current results of fundamental research in the field of illumination science. This includes theoretical bases of light
source development, physiological optics, lighting technology, photometry, colorimetry, radiometry and metrology, visual perception, health and hazard, energy efficiency, semiconductor sources of light and many others related directions. The journal also aims to cover the application illumination science in technology of light sources, lighting devices, lighting installations, control systems, standards, lighting art and design, and so on.
“Light & Engineering” is well known by its brand and design in the field of light and illumination. Each annual volume has four issues, with about 80–140 pages per issue. Each paper is reviewed by recognized world experts.
To promote the work of the Journal, the editorial staff is in active communication with Thomson Scientific (Citation index) and other international publishing houses and agencies, such as Elsevier and EBSCO Publishing.
Editorial Office:
Russia, VNISI, Rooms 327 and 334106 Prospekt Mira, Moscow 129626
Tel: +7.495.682.26.54Tel./Fax: +7.495.682.58.46E-mail: [email protected]://www.l-e-journal.com
Scientific Editors:
Sergei G. AshurkovAlexander Yu. BasovEvgene I. RozovskyRaisa I. StolyarevskayaArt and CAD EditorAndrei M. BogdanovStyle EditorMarsha D. Vinogradova
Light & Engineering / Svetotekhnika Journal Country Correspondents:
Argentina Pablo Ixitaina National and Technological La Plata UniversitiesFrance Georges Zissis University of ToulouseIndia Saswati Mazumdar Jadavpur UniversitySlovenia Grega Bizjak University of LjubljanaTurkey Tugce Kazanasmaz Izmir Institute of Technology (Urla)
Erdal Sehirli Kastamonu University (Kastamonu)Rengin Unver Yildiz Technical University (Istanbul)
3
CONTENTS
VOLUME 27 NUMBER 1 2019
LIGHT & ENGINEERING
Leon A. Apresyan Effective Electrodynamic Parameters of Nano-Composite Media and the Theory of Homogenisation .................................................. 4
Vladimir V. Belov Optical Communication on Scattered or Reflected Laser Radiation ...................................15
Nicolai N. Bogdanov, Andrew D. Zhdanov, Dmitriy D. Zhdanov, Igor S. Potyomin, Vadim G. Sokolov, and Eugene Y. Denisov A Bidirectional Scattering Function Reconstruction Method Based on Optimization of the Distribution of Microrelief Normals ...........................................25
Juri V. Nazarov and Violet V. Popova Light Design and Textiles ........................................33
Amardeep M. Dugar and Dashak Agarwal A Pilot Study Assessing Short-Term Chromatic Adaptation Preferences for Correlated Colour Temperature in India ..............................................38
Shibabrata Mukherjee, Parthasarathi Satvaya, and Saswati MazumdarDevelopment of a Microcontroller Based Emergency Lighting System with Smoke Detection and Mobile Communication Facilities .......................................46
Mustafa Teksoy and Onur DursunA Novel Framework to Evaluate the Performance of Responsive Kinetic Shading Devices ...................51
Ramazan Ayaz, Asiye Kaymaz Ozcanli, Ismail Nakir, Pramod Bhusal, and Adem UnalLife Cycle Cost Analysis on M1 and M2 Road Class Luminaires Installed In Turkey ......................61
Canan Perdahci and Hamdi Özkan Design of Solar-Powered LED Road Lighting System ...................................................................75
Canan Perdahci and Hamdi ÖzkanLEDs Colours Mixing Using their SPD and Developing of the Mathematical Model for CCT Calculation ...............................................86
Gulnara F. Ruchkina and Elena Yu. MatveevaEnergy Saving in the Sphere of State Public Interests..................................................................97
Olga N. Anyushenkova, Andrei V. Ryzhik, and Venera K. Shajdullina Alternative Ways of Attracting Investments in the Energy Saving Technologies Industry .................... 103
Denis V. Shepelev, Dina V. Shepeleva, and Natalia G. KondrakhinaPower Supply for State-Owned Enterprises ...........109
Nataliya I. Besedkina, Irina I. Romashknova, and Tatyana A. Tantsura Energetic Sector of Economy: The Russian Law Model ........................................................... 116
Maksim V. Demchenko, Rostislav Ruchkin, and Eugenia P. Simaeva Legal Providing of Application of Energy Effective Lightning Technology and Intellectual Networks in the Conditions of Digital Economy ................... 123
Alexander S. Komarov, Galina V. Kostyleva, and Oksana N. Vasil’eva Breaches of Energy Consumption Law .................. 129
Alexei V. Barkov, Eugene L. Vengerovskiy, and Natalia V. Zalyubovskaya Legal Regulation of Competition at Electricity Retail Markets ...................................................... 135
Content#2 ............................................................ 141
Light & Engineering Journal apologizes .......................122

4
Light & EngineeringVol. 27, No. 1, pp. 4–14, 2019
EFFECTIVE ELECTRODYNAMIC PARAMETERS OF NANO-COMPOSITE MEDIA AND THE THEORY OF HOMOGENISATION
Leon A. Apresyan
Prokhorov General Physics Institute of the Russian Academy of Sciences E-mail: [email protected]
ABSTRACT
When creating new lighting and optoelectronic devices, great attention in recent years is paid to use nano-composite materials, i.e. the media containing impregnations of nanometre size, such as nano-par-ticles of metals, quantum points, carbon nanotubes, graphenes, etc. This allows obtaining media with new, formerly unattainable characteristics. An ini-tial point when describing properties of such me-dias is usually evaluation of their effective para-meters (dielectric permeability, conductivity, heat conduction and of other similar transport coeffi-cients) in the model of macroscopically heterogene-ous media, in other words, media containing mac-roscopic impregnations with known or determined from experiments characteristics. Main approach-es used in such cases are known Maxwell Gar-nett and Bruggeman approximations. In this re-view, methodical questions connected with various approaches to obtain these approximations and of their generalisations are discussed. Also some new results are given, which connected with evaluations of percolation thresholds within generalised Brug-geman approximations in the event of multi-com-ponent media.
Keywords: nano-composite media, effec-tive parameters, quasistatic approximation, Max-well Garnett approximation, Bruggeman appro-ximation, percolation threshold, multi-component composites
1. INTRODUCTION
A constant improvement of lighting devices con-nected with development of modern technology applications, such as photovoltaic [1, 2] and opto-electronics [3–6], brings to the forefront the prob-lem of creating new optical materials with unattain-able formerly properties. This problem is solved in particular by obtaining new composite mate-rials. If it comes to the purely optical aspect of the problem abstracting from numerous applica-tions of composites, such as power mechanical, heat-conducting, etc. structures, then first it is about nano-composites, i.e. about the composites with non-unifor mity size of tens nanometres. Such in-clusions are various carbon structures (nano-tubes, graphenes, fullerenes), quantum dots, as well as me-tal nano-particles, which are used long since from the historical point of view. Study of such objects has led to creation of a new science direction known as nano-photonics, or otherwise as nano-optics [5, 6] being a subsection of general photonics, which is a science about transformation and propogation of photons within the interval from IR to ultraviolet.
Nano-photonics studies behaviour of light “com-pressed” to nanometre sizes, as well as its interac-tion with the nanometre objects. Both of these di-rections are interconnected. The first part is focused on overcoming the Rayleigh limit (i.e. impossi-bility of photon localisation in normal conditions on scales smaller than the wavelength) due to plas-mon effects in metal nano-particles, nano-sized ap-ertures or spires used in the near-field scanning mi-croscopy. The second encloses study both of purely

Light & Engineering Vol. 27, No. 1
5
quantum features of light interaction with single nano-objects, and of properties of ensembles with large number of N >> 1 particles, which is typi-cal for the case of composite media. The prospec-tive nano-photonics application field is extremely wide and includes both already quoted applications in solar photovoltaic and optoelectronics, and many other fields: lighting engineering, electrical engi-neering, biophysics and biochemistry, medicine, etc. Large lists of references are available in mono-graphs [2–6].
Nano-sized particles with a good approxima-tion can be considered as purely classical mac-ro-objects with their macro-characteristics (dielec-tric and magnetic permeability, conductivity, heat conduction, etc.). Besides, they can be “corrected” if necessary to account micro-effects (such as lim-itation of electron free path length by the particle size [7]). If such inclusions are distributed in a com-posite spatially uniformly, then as the first step, the composite can be characterised using some aver-aged “effective parameters”, which are closely con-nected with specific measurements and are often sufficient for the composite description correspond-ing to practical applications. In doing so, it is con-sidered that the composite volume under study can be replaced when calculating with the same volume of a homogeneous medium described using effec-tive parameters. A creation of models and calcula-tion of such parameters is called homogenisation. And in materials science, “mixing formulas” (mix-ing rules) name is widely used instead of this term [8, 9]).
This review considers methodical questions of creating the main models used during homogeni-sation, as well as some new results connected with evaluation of percolation thresholds. The review is first of all intended for students and graduate stu-dents who are interested, how to obtain effective pa-rameters and to use practically homogenisation me-thods. The reference list is very limited and mainly contains references to the last monographs and re-views, as well as to some very instructive classical works, which became available in Internet. Useful discussions of similar questions in reviews should be also noticed [10, 11]. The problems connected with description of single diffusers with plasmon-ics and quantum effects, as well as with optics of meta-materials [12, 13] and meta-surfaces [14] ob-tained by artificial of ordering nano-particles are not considered here. We will refer in this regard to the
recently appeared monographs [14–19] describing electrodynamics of nano-particles. These mono-graphs are suitable for a deeper study of the speci-fied problems.
Methodical questions connected with a possi-bility of introduction of effective parameters are discussed in Section 2 (where, when, why). Ap-proaches used to obtain most widespread appro-ximations of homogenisation, namely: Maxwell Garnett (MG) approximation and of Bruggeman ef-fective medium (Effective Medium Approximation, EMA) in the simplest model of spherical “effective cells” are discussed in Section 3. Ge neralisations of these approximations for the case of elliptic cells are described in Sections 4 and 5. Expressions for percolation thresholds in the gene ralised Brugge-man approximations are considered in Section 6. Main conclusions are briefly formulated in Sec-tion 7.
2. GENERAL REASONS
On the face of it, the “optics of composites” con-cept usually is at once associated with the need of the attraction of the multiple scattering theory, as composites inherently contain many of statistically distributed scattering non-uniformities. This is real-ly so in case of a complete wave description of the problem.
Fortunately, it turns out that for composites with small-scale non-uniformities relative to the wave-length, simple heuristic models suitable both for de-scription of experiments and for creation of compo-sites with required properties are often rather well usable. Good results can be obtained when using even very rough characteristics of real composites, such as volumetric relations of the components. However, as inner structure of various composites with a set volume of the components can differ es-sentially, one cannot recon to obtain “universal” dependences of effective parameters on limited number of the composite characteristics equally suitable for a wide range of problems. When chang-ing inner parameters of a composite, which control is usually difficult, or when changing the measure-ment method, or the used radiation wavelengths, different models of effective parameters can be claimed.
This explains a wide use in applications of vari-ous homogenisation models. So, the model choice to a large extent depends on intuition of the experi-

Light & Engineering Vol. 27, No. 1
6
menter and on quality of the results obtained when customising free parameters.
A possibility of introduction of effective para-meters is not obvious; it can be implemented not in all cases and depends not only on structure of the composite but also on the measurement me-thod (see, e.g., an old review [20], where former and often unsuccessful attempts to replace insular films with equivalent uniform layers are discussed). A wide class of the problems, for which effective parameters are especially useful, is enclosed by the quasistatic approximation, when wavelength of the used radiation is big in comparison with the compo-site non-uniformities, and not precise characteristics of the field are measured but only averaged by space size, which is much more than the non-uniformity size. One can say that in doing so neither the wave, nor the observer “notice” small-scale fluctuations, which always take place, when the space size is of the medium non-uniformities size order. A strict de-scription of such fluctuations is outside the effective parameters theory.
For small-scale composites, a close analogy of homogenisation with the classical fundamental problem of statistical substantiation of macroscopic electrodynamics exists. This analogy concerns the transition from micro- to macro-description of the observed values. Really, this transition means a pos-sibility to use macroscopic, i.e. averaged by physi-cally infinitely small environment volume charac-teristics to create electrodynamics of macroscopic bodies of any configuration. The difference is that if in statistical physics, atoms and molecules ap-pear as primary micro-objects, which differ from each other not too essentially (except for the case of macromolecules), then in the event of compo-sites they are replaced with macroscopic non-uni-formities, which configuration can change in a ran-dom way within rather wide limits. In other words, a variety of inner structures for composites is much wider than for macroscopically uniform bodies usu-ally considered in statistical physics. Therefore if to distract from quantum effects and from difference in freedom degree number, in some specified sense, a strict calculation of effective parameters gives much more many-sided problem than calculation of macro-characteristics of molecular objects.
The simplest composite version is a two-com-ponent mixture with volume component parts f0 and f1 (so that f0 + f1= 1). For a more distinctness, we primarily consider a mixture of two dielectrics
with dielectric permeability ε0 and ε1, though simi-lar reasoning are also applicable for many other ki-netic coefficients: electrical conductivity, heat con-duction, diffusion coefficient, etc. [8]. Inherently, in each point of a composite, induction D(r) is ex-pressed using dielectric permeability ε(r) and elec-tric field strength E(r) as D (r) = ε(r)E(r). In this connection, effective permeability ε* is determined by the following relation:
*( ) ( )v vε=D r E r , (1)
where angular brackets mean averaging over vo-lume V,
1v
V
drV
= ∫ , (2)
and instead of points there can be an arbitrary func-tion r. As V, “physically infinitely small volume” is selected. This volume contains many (N >>1) non-uniformities, but it is small in comparison with the composite size. And it is supposed that statisti-cal uniformity of a composite, as well as choice of the electromagnetic field source, allow considering ave raged values of ( ) vD r and ( ) vE r to be con-stant, i.e. not dependent on the choice of point r.
Effective dielectric permeability of a composite as function of volume parts should meet obvious “boundary conditions” (for clearness, it is written down as ε* (f0, f1)):
* *0 1(1,0) , (0,1)ε ε ε ε= = . (3)
These conditions correspond to the full filling environment of one component. As a matter of fact, strictly speaking, condition (3) is not necessary for practical applicability of ε* various models as suit-ability of most of them even for composite narrow classes is usually limited to some field of values of f0 and f1 only. Nevertheless, conditions (3) are per-formed in many empirical and simulation approxi-mations for ε* mentioned in the publications. But this fact should not mislead concerning their ap-plicability with any relations of f0 and f1. General-ly accomplishment of conditions (3) can be only considered as a courageous extrapolation of the considered model for the whole interval of f0 and f1 concentrations. The perturbation theory by con-centration of one of the components, such as f1, re-quires a smallness of this concentration in compa-

Light & Engineering Vol. 27, No. 1
7
rison with 1 and naturally is unsuitable with f1 ~ 1, though effective value ε* calculated according to this theory sometimes can be also applied with f1 concentration being not too small.
To obtain an expression for effective permittiv-ity ε* automatically meeting conditions (3), they often use a formal trick already going from clas-sical works of Maxwell [21]: they empirically se-lect function F (ε(r)) so that ε* is determined from equation:
*0 0 1 1( ) ( ( )) ( ) ( )vF F r f F f Fε ε ε ε= = + .
In [22] this property is called additivity of F (ε(r)). In this case, at uniform filling of a composite using dielectric with ε0 or ε1, fluctuations disappear and, averaging symbol can be omitted, which at once gives ε* = ε, provided that F- is an unambigu-ously reversible function. In the referenced publica-tions, for different problems, most different choices of the F(x) function were used and are widely used up to now, namely: F= x, 1/x, x1/3, log x, ½(x+1/x), etc. (see, e.g. the report of various approximations in [23]). It should be noticed that the MG approxi-mation considered below can also be referred to this class, if to consider F to be depended on the dielec-tric permeability matrix.
By nature (or more precisely, by topology) of the spatial structure, composites can be usually separated into aggregates (statistically symmetric, like powder mixtures), and cermets (asymmetric), in which spatial distribution statistics of a matrix is other than statistics of fillers as it is in the event of environments with random impregnations (Fig. 1, [24]). In the first case, if consider topological as-pects only, i.e. connectivity of a composite compo-nent, it is impossible to divide formally the matrix and the inclusions. Below we will mainly describe the cermet case, or otherwise media with random
impregnations, when statistical properties of the components are various, and matrix can be sepa-rated from them (for definiteness, it will be the first component, i.e. f0) and impregnations (it will be the second component, i.e. f1).
Most widespread approximations meeting these two topologies are Maxwell Garnett approximations [25] 1, which in an elementary form are often writ-ten as the equation:
*0 1 0
1*0 1 02 2
fε ε ε εε ε ε ε
− −=+ +
, (4)
and symmetrical Bruggeman approximation of an effective medium [27].
* *0 1
0 1* *0 1
02 2
f fε ε ε εε ε ε ε
− −+ =+ +
, (5)
Another asymmetric Bruggeman approxima-tion is also known but we don’t consider it here.
Approximations (4) and (5) are based on use of the spherical particle model. When generalis-ing these relations for the case of non-spherical par-ticles, ellipsoid model is usually initial. It also is widely used in the referenced publications. In the elementary case of identical and equally oriented (mono-directed) ellipsoids, the medium becomes anisotropic, and relation (5) is transformed to the following:
* *0 1
0 1* * * *0 1
0( ) ( )i i
f fL Lε ε ε ε
ε ε ε ε ε ε− −+ =
+ − + −, (6)
where Li is depolarisation factor along the axis un-der consideration (see below). Relation (6) is cor-rect for three orthogonal axes i = x, y, z coinciding with main axes of the ellipsoid. If as Li, normal de-polarisation factors are used, which are determined for an isotropic medium, then (6) gives three inde-pendent equations for each of axes. This approxi-mation is known as “traditional” [28, 29], and has
1 Relation (4) is often called “Maxwell Garnett formula” con-necting it by that with J. C. M Garnett [25], (one of his names was Maxwell). A more correct is “Maxwell-Garnett formula”, which takes into consideration thereby the fundamental contribution of Maxwell who had obtained an equivalent result for conductivity long before Garnett [21]. An addition here of Rayleigh name who obtained this formula also before Garnett together with correction terms [26], would make it somewhat awkward, though more informative.
Fig. 1. Topology of composites: (a) cermets: discrete im-pregnations into a matrix (b); aggregates: symmetric filling of a composite without selected matrix [23]

Light & Engineering Vol. 27, No. 1
8
been widely used in applications. In case of a more sequential approach [30], depolarisation factors as Li in anisotropic medium differ from normal depo-larisation factors [31]. And then (6) appears to be a more complex system of three connected equa-tions (a comparison of these approaches is available in [29]). A successful use of equation (6) with “in-correct” depolarisation factors in some applications should not be surprising, if to take into account that all considered models are a consequence of use of a less exact approximation using Li as adjustable pa-rameters. It should be noticed that in the model of chaotically oriented ellipsoids, medium again be-comes statistically isotropic, so even formal neces-sity to use depolarisation factors in anisotropic me-dium in this case is eliminated.
Any macroscopic composite is a particular case of non-uniform dielectrics with dielectric permea-bility ε(r), which is a complex function of spatial co-ordinate r. As in practical situations, ε(r) dis-tribution in each point is not measured and some external parameter values are only recorded (like components relation) and ε(r). As a result, E(r) can be considered as some random fields [32]. In case when their spatial correlations quickly decrease (a spatial ergodicity takes place), averaging with re-spect to volume can be replaced by statistical aver-aging [32]. Such replacement of volumetric averag-ing by averaging over a statistical ensemble will be used below.
Equations (4) – (6) can be solved easily, if ex-plicit dependences ε*( f0, f1, ε1, ε2), are obtained. However, generally accepted configurations of equations (4) – (6) are convenient first to compare with other versions of these theories, and second-ly as observance of boundary conditions (3) fol-lows from them with evidence. Though formally approximation (4) is derived for the case of cer-met topo logy, and (5) and (6) are for aggregates, both these approximations are often used inde-pendently from the composite expected topology. Let’s consider the main approaches to obtain these approximations.
3. HOMOGENISATION METHODS
In the referenced publications, many various approaches to obtain approximations (4) – (6) and their generalisations are described. We give brief-ly most widespread of them. As these approaches are multiply repeated in the publications, we don’t give numerous references to the sources (see, e.g., [8–11]).
Lorentz sphere method is most widespread when obtaining the considered approximations. Each diffuser is mentally surrounded with a big sphere (Fig. 2), and it is considered that effective field EL near it is composed from averaged E plus
Lorentz field 03P ε (in the CGS system 4 3Pπ
) from diffusers out of the sphere, which are consi-dered as point dipoles with polarizability α1 “smeared out” into continuous environment
03LE E P ε= + , where P is average polariza-
tion. And field of particles inside the sphere is con-sidered on average to be equal to zero in the centre of the sphere, which is correct not in all cases (see, e.g., discussion in the classical textbook [33]. Sup-posing that average polarization 1 LP n Eα= , where
n = N/V is average number of particles in the vo-lume unit, it is easy to obtain the known Clausi-us-Mossotti formula (it is also named Lorentz-Lor-entz formula, if it is written down for particles in vacuum refraction index *ε ).
*0 1
*0 02 3
nε ε αε ε ε
− =+
. (7)
Replacement of polarizability of dot dipoles α1with the well-known polarizability of volume v1 sphere with dielectric constant ε1 (see, e.g., [9]) 2,
1 01 1 0
1 0
32
v ε εα εε ε
−=+
, (8)
2 It should be noticed that different authors determine polarizability of a particle in dielectric medium with ε0 differently: either as in (6): α = P/E [9], or as P/(ε0E) [7], where P is particle dipolar moment, which should not lead to misunderstanding.
Fig. 2. Lorentz’s sphere

Light & Engineering Vol. 27, No. 1
9
transforms (7) into MG formula (4). The same rela-tion (7) is often used to generalise MG approxima-tion to more complex particle sets, for which it is enough to substitute the sum of the correspon dent polarizabilities in (7) instead of n α1. So for exam-ple, for a set of ni spherical particles with different dielectric permeability εi, i = 1.2,…, we have from (7):
*0
*10 02 3
i i
i
nε ε αε ε ε≥
− =+ ∑ . (9)
Equivalent scatterer method originates from classical studies of Maxwell [21]. Spherical volume V of a composite is selected with non-uniformities interpreted as spherical impregnations of dielec-tric permeability εi in matrix εm, where εm is a heu-ristically selected free parameter (Fig. 3). Effec-tive permittivity ε* is selected from the requirement that scattered field far from V coincides with a scat-tered field with uniform filling of volume V by me-dium with dielectric permeability ε* provided that the particles are sufficiently rarefied and that they scatter independently from each other. For this pur-pose, it is enough to equate polarizability of a uni-form sphere to the sum of the polarizabilities of the particles of the composite sphere, which gives as follows:
V m
m1
*-* 2ε ε
ε ε+ = v0
0 m
0 m
-2
ε εε ε+
+ v11 m
1 m
-2
ε εε ε+
,
or as fi = vi/V,*
0 10 1*
0 12 2 2m m m
m m m
f fε ε ε ε ε εε ε ε ε ε ε
− − −= ++ + +
. (10)
Believing here εm = ε0, we obtain MG approxi-mation (4), and with εm = ε* it is Bruggeman appro-ximation (5). It should be noticed that in work [34], the considered condition was extended to the gene-ral case as a requirement of absence of scattering towards “forward” in the effective medium. Hav-ing replaced spherical objects with ellipsoids every-where, it is easy to obtain by the same generalisa-tion method these approximations for the case of anisotropic particles, as well as for the case of ani-sotropic composites (if such particles are fractional-ly or completely ordered).
Macroscopic averaging method uses a direct averaging D(r) and E(r) over volume with the ε* determination (1). An advantage of this approach
is more obvious description of the accepted appro-ximations, which allows estimating at least quali-tatively, conditions of applicability of final results. Let’s turn our attention to it in more detail based on our work [35].
Let’s consider the general case of medium with random (generally non-uniform) impregnations (cermet), divide the whole considered volume V into two parts, V = V0 + V1 so that V0 corresponds
to points of matrix r, and that 11
N
ii
V v=
= ∑ corresponds
to points of particles with volumes vi.Dividing the full integral when averaging over
volume V into sum of integrals by partial volumes, it is easy to obtain in accordance with (1):
0
0
0 1*
0 1
( ) ( ) ( ) ( )( )( ) ( ) ( )
v pv
v v p
f f
f f
ε εε
+= =
+
r E r r E rD rE r E r E r
. (11)
Here fi = Vi/V is the matrix material volume frac-tion (i = 0), or particles fraction (i = 1), f0 + f1 = 1, (substantiation of formal operation of division by vector (9) can be found in [35]). Brackets with in-dex p mean averaging with respect to particle en-semble of the following type:
1i
N
ip vi
P=
≡ ∑ , (12)
and Pi = vi/V1 is ratio of i particle within volume of all particles, which can be interpreted as a conven-
tional probability “to meet” this particle among all
particles, so 1
1N
ii
P=
=∑ .
Relation (11) is exact formally, if to consider distributions of ε(r) and of E(r) field in the compo-site as known. Though at present, computing abili-ties allow carrying out computer simulations with
Fig. 3. Equivalent scatterer method

Light & Engineering Vol. 27, No. 1
10
simultaneous estimation of E(r) and of applicabil-ity of different models [36], in most of practical si-tuations, these distributions can be considered as stochastic functions, which exact values are not re-corded in experiments. But to obtain approxima-tions (4) – (6), as well as their generalizations, it is enough to use simple statistical hypotheses about particle typical configuration and on “typical va-lues” of the field inside and out of them. Thereby averaging with respect to volumes of medium and particles is heuristically replaced with a statistical ave raging over volumes of some “effective cells”. Selecting such cells of different structures and set-ting field distribution E(r) out and inside them, one can obtain different approximations for ε*.
4. MAXWELL-GARNETT APPROXIMATION
The main assumption necessary to obtain MG approximation from (11) is that particles on ave-rage can be considered as being in the uniform ex-ternal field. To obtain MG approximation (4) from (11), it is enough to consider that all particles are uniform, have identical dielectric permeability ε1, as well as identical spherical shape, and the field out of the particles is accepted to be equal to the uniform field E0 without particles. Instead we will at once consider generalisation (4) for a case of chaotically oriented elliptic particles with random distribution of depolarisation factors Li. The field within such a particle in the uniform external field E0 is also uniform and expressed using the known relation:
0in = ΛE E , (13)
where tensor Λ is expressed by means of a depo-larisation tensor being diagonal in the ellipsoid main axes L = diag(L1, L2, L3) as
1
0
1
1 1L εε
Λ =
+ −
. (14)
Here and below we don’t add special designa-tions for tensor values considering that their na-ture is clear from the context. The division in (14) is understood as a matrix inversion, and explicit expressions for depolarisation factors Li are well-
known 3 and are not written here (see e.g. Sec-tion 4 [22]; (1 in (14) is the symbol of unit matrix). With due regard to (13), formula (11) can be writ-ten as
*1
0 1
11
ff Lαε
ε α= +
−, (15)
where
11 0
0 1
( )v
αα ε εε
= = − Λ (16)
is the tensor of specific polarizability of the ellip-soid, and symbol of full statistical averaging
includes both averaging with respect to orientation, which is limited to calculating 1/3 of tensor trace, and averaging with respect to random distribution of depolarization factors connected with the particle configuration. So
1Sp3 L= Λ , (17)
where SpΛ = Λ1+Λ2+Λ3, Λi = (1+Li ( 1
0
εε
–1))-1.
To implement averaging over L, one should set a model of random distribution for depolariza-tion factors Li. For particles of identical configura-tion with prescribed Li, averaging with respect to L in (17) can be omitted. We will not fix on it here in more detail (see, e.g., [7], section 12.2.5). A simi-lar expression (15) can be also obtained in the event of partially ordered orientations of ellipsoids, when the composite becomes anisotropic, and ε* becomes tensor.
If particles have a different nature, besides with random dielectric permeability εi, then averaging over L in (17) should be added with a statistical ave-raging over εi, which expands the class of the per-missible composites with multi-component fillers.
The considered method to obtain MG allows at least a qualitative estimating applicability condi-
3 Nevertheless, there are various readings in the referenced pub-lications: so for example, in known monograph [7] when determining ellipsoid depolarization factors, polarizability relative to vacuum but not to medium is considered, which forces to add new depolarization factors depending on dielectric permeability of the medium and on the ellipsoid besides normal depolarization factors named in [7] as geometrical factors.

Light & Engineering Vol. 27, No. 1
11
tions for this approximation. Indeed, each particle is considered on average as distant enough from its neighbours, and this requires a smallness of the ef-fects connected with fields scattered by particles, as well as with “adhesion” of particles. This pla-ces upper limit for particle relative volume f1 (so as such limitation, condition f1 < 0.4 is considered in [37]).
Applications of MG approximation are extreme-ly broad. It should be noticed as examples only, in-teresting evaluations of composites with refractive indices both high [38], and close to zero [39], as well as antiglare optical composite coatings [40].
As in the event of dielectric matrices in MG ap-proximation, each particle is considered to be sur-rounded with non-conducting dielectric, for metal (well conducting) particles, this approximation al-lows describing the so-called conductivity resonance connected with electron movement limitation by particle volume [41]. One can find a more detailed discussion of this question for example in [37]. From the other side, for the same reason MG ap-proximation does not describe emergence of per-colation threshold (or otherwise, percolation phe-nomenon [42]), because it excludes a possibility of particle contact. This phenomenon consists in emer-gence a dielectric-metal junction in the specified composite with increase of the conducting phase concentration f1 not beginning from f1 = 0 but after some threshold value f1с is only achieved [42]. This disadvantage can be eliminated in the self-coordi-nated Bruggeman approximation, which even in the elementary form (5) allows qualitative describing emergence of percolation threshold.
5. BRUGGEMAN APPROXIMATION IN MODELS OF ELLIPTIC CELLS
To obtain this approximation from (11), it is enough to accept the following “effective cells” mo-del: effective cells are ellipsoids filled with the cor-respondent material (with ε0 for environment points and with ε1 for particles). The self-coordination con-dition consists in that each such cell is considered to be placed into an “effective medium” with dielec-tric permeability ε*, in which field is regarded as uniform and equal to an average field E (Fig. 4).
In an elementary model leading to (5), instead of el-lipsoids a sphere is used, for which L1 = L2 = L3 =1/3.
Now let’s consider a more general model of cha-otically oriented ellipsoids, for which medium is statistically isotropic with scalar effective dielec-tric permeability ε*. In this approximation, the field both in medium points, and in particles is expressed using relation (13), where an average field E ap-pears as an external field E0, and tensor correspond-ing to ellipsoids Λ is presented as expression (14) with different depolarization tensors L(0) for medi-um points and L(1) for particles (we will further de-signate these tensors as Λ(i)). In this model of “ef-fective cells”, configuration of ellipsoids for particle and medium points can be various and generally this configuration is random.
Taking into account this difference allows first introducing additional free parameters into the mo-del and secondly, corresponds to physical intuition. Indeed, “particle cell” structure is determined by choice of their typical configuration, whereas “me-dium cell” configuration is connected with particle relative positions. Taking into consideration the all said and using (11), after simple transformations we obtain the following:
f0< 0( 1)*εε
−(0)
(0) 0
1 L
1 L ( 1)*εε
−
+ −> + f1 < 1( 1)
*εε
− ×
(1)
(1) 1
1 L
1 L ( 1)*εε
−×+ −
> = 0 . (18)
Here statistical averaging is still understood as (17), and if necessary it can be added with averag-ing over random dielectric permeability ensuring description of multi-component fillers.
If as an initial approximation, expression (6) is accepted, then after setting different depolariza-tion factors for environment and for particles, after averaging we have:
f0< 0( 1)*εε
−(0) 0
1
1 L ( 1)*εε
+ −> + f1< 1( 1)
*εε
− ×
(1) 1
1
1 L ( 1)*εε
×+ −
>= 0. (19)

Light & Engineering Vol. 27, No. 1
12
Such configuration of EMA (Effective medium approximation) was widely used in different works (see, e.g., [43, 44])
Equation (18) differs from (19) by presence of multiplier factors 1-L(i) in each summand nume-rator. For identical and mono-directed ellipsoids, these common multiplier factors can be omitted, so (18) and (19) are transformed into (6), however ge-nerally such simplification does not happen. Thus (18) and (19) correspond to different models of ef-fective medium.
6. GENERALIZED BRUGGEMAN APPROXIMATION AND PERCOLATION THRESHOLD
Equations (18) and (19) are generally rather complex and can be solved numerically. In this re-gard, the known problem of choice of a “correct” branch of the EMA equation solution, which gene-rally is many-valued, should be noticed [45]). How-ever, without solving these equations, one can at once find expressions from them for correspondent percolation thresholds. With that end in view, we will pass from consideration of dielectric permea-bility ε to conductivity σ, for which all relations are retained in quasistatic approximation as it was spe-cified above. To find percolation threshold, we will consider the case of dielectric matrix σ0 = 0 with conducting particles σ1 ≠ 0. Having replaced ε with σ everywhere and considering in (18) and (19) first σ0 = 0, and then σ* = 0 (order of these substitutions is important!), it is easy to obtain the following ex-pressions for threshold value of volume particles part. In case of (18):
1 (1)11cf
L= , (18)
and in case of (19):
*1 (1)
(0)
11
11 (1 )
cfL
L
=+
−
. (19)
We will not further discuss these expressions, which for the model of spherical cells are both re-duced to the well-known evaluation for the Brug-geman approximations f1с = 1/3 (5). For an illus-tration, we are limited to comparison of MG and EMA approximations in simplest models (4) and (5). Fig. 5 shows effective dependences of conduc-tivity σ* in these models on volume part of conduc-ting component for different relations σ0/σ1. One can see from these figures that MG approximation (4) gives dependence σ* converging in limit σ0/σ1→ 0 to a discontinuous function σ* = 0 at 0 ≤ f1 <1 and σ* = 1 at f1 = 1, which corresponds to absence of the percolation threshold, whereas for EMA in this limit there are two sections of right lines with threshold value f1c = 1/3 (Fig. 5).
7. CONCLUSIONS
In this review, we have briefly considered va-rious methodical approaches to obtain MGA and EMA as most widespread homogenisation appro-ximations, i.e. to replace a strongly non-uniform composite with a homogeneous medium so that to save invariable the measured averaged elec-tro-dynamic characteristics of the composite. Such a procedure even for composites with non-uniform-ities being small in comparison with the wave-length, is feasible not always and practically leads to neglect of possible strong small-scale field fluc-tuations in the composite. Due to a big variety of
Fig. 4. Effective cell in approximation of the self-consisted Bruggeman field: ellipsoid in effective
medium with ε*
Fig. 5. Dependences of effective conductivity on filling fac-tor f1 in approximations MG (4) and EMA (5);
– – –σ2/σ1= 0,1; – - -σ 2/ σ 1 = 0,05; ––– σ2/σ1 → 0

Light & Engineering Vol. 27, No. 1
13
composite inner structures, one cannot expect a cre-ation of formulas for effective medium parame-ters suitable in all cases, and this explains presence of many various models in the publications. Ne-vertheless, MGA, EMA and their generalisations re-main basic approximations when describing many nano-composite media. In this review, we have not touched on many questions connected with taking into account in MGA and EMA various complicat-ing factors, which description can be found in the quoted references.
At present, a rapid development of nano-pho-tonics continues, and homogenisation theory occu-pies a useful niche in this development, which often allows obtaining uncommon results using simple facilities.
REFERENCES
1. Milichko V. A., Shalin A.S., Mukhin I.S., Kovrov A.E., Krasilin A.A., Vinogradov A.V., Be-lov P.A., Simovsky K.R. Solar photovoltaics: cur-rent state and trends of development //Achievements of physical sciences, 2016, V.186, pp. 801–852. DOI:10.3367/UFNr.2016.02.037703
2. Valenta J., Mirabella S. (Eds.) Nanotechnology and Photovoltaic Devices: Light Energy Harvesting with Group IV Nanostructures.Taylor & Francis Group, 2015, 441p.
3. Lourtioz J.-M. et al., eds. Nanosciences and Nano-technology: Evolution or Revolution? – Springer, 2016, 438 p. DOI:10.1007/978–3–319–19360–1
4. Di Bartolo B., Collins J., Silvestri L. (eds.) Na-no-Structures for Optics and Photonics: Optical Strategies for Enhancing Sensing, Imaging, Communication and En-ergy Conversion. Springer, 2015, 586p.
5. Novotny L., Hekht B. foundations of nanooptics, Moscow: Fizmatlit, 2009, 484 p.
6. Quinten M. Optical properties of nanoparticle sys-tems: Mie and beyond. Weinheim: Wiley-VCH, 2011, 488p. DOI:10.1016/j.jqsrt.2011.10.001
7. Boren K., Hafman D. Absorption and scattering of light by small particles. Moscow: Mir, 1986, 660 p.
8. Milton G.W. The Theory of Composites. Cam-bridge Univ. Press, 2004, 749 p.
9. Sihvola A. Electromagnetic Mixing Formulas and Applications, Electromagnetic Wave Series 47, London: IEE Publishing, 1999, 284p.
10. Markel V.A. Introduction to the Maxwell Garnett approximation: tutorial// J. Opt. Soc. Amer. 2016, A 33, No.7, pp.1244–1256. DOI:1084–7529/16/071244–13
11. Markel V.A. Maxwell Garnett approximation (ad-vanced topics): tutorial // J. Opt.Soc.Amer.-2016, A 33, . 11, pp.2237–2255. DOI:1084–7529/16/112237–19
12. Sarychev A. K., Shalaev V.M. Electrodynamics of metamaterials. Moscow: Naychny Mir, 2011, 224 p.
13. Cai W., Shalaev V. Optical Metamaterials. Spring-er, 2009, 200 p. DOI: 10.1007/978–1–4419–1151–3
14. Remnev M. A., Klimov V.V. Metasurfaces: a new view on Maxwell’s equations and new methods of light control // Achievements of physically sciences. 2018, V.188, pp. 169–205.
15. Andrianov E. S., et al. Quantum nanoplasmonics. Dolgoprudny: Intellect Publiching house, 2015, 368 p.
16. Pal R. Electromagnetic, Mechanical, and Trans-port Properties of Composite Materials, 2015, CRC Press, 400p.
17. Aliofkhazraei M., ed., Handbook of Nano- particles. Springer, 2015, 1439 p. DOI 10.1007/978– 3–319–15338–4
18. Kong E. S.W. K., ed. Nanomaterials, polymers, and devices. Wiley, 2015, 584p.
19. Stenzel O. The physics of thin films. Optical spec-tra. An Introduction. 2nd Edition. Springer, 2016, 352 p. DOI: 10.1007/978–3–319–21602–7
20. Rosenberg G.V. Current state of the theory of op-tical properties of translucent metal coatings // Achieve-ments of physically sciences, 1956, V.58, pp. 487–518. DOI:10.3367/UFNr.0058.195603d.0487
21. Maxwell J.C. Treatise on electricity and mag-netism. V.1. Мoscow: Nauka, 1989, 415 p.
22. Landau L. D., Lifshits E.M. Electrodynamics of solid environments. The 4th, stereotypic edition. Mos-cow: Fizmatlit, 2003, 656 p.
23. Taherian R. Experimental and analytical model for the electrical conductivity of polymer-based nano-composites // Composites Science and Technology.2015. DOI: 10.1016/j.compscitech.2015.11.029
24. Lamb W., Wood D.M. and Ashcroft N.W. Long- wavelength electroma gnetic propagation in heterogeneous media // Phys. Rev.1980, B21, 6, pp.2248–2266. DOI: 10.1103/PhysRevB.21.2248
25. Maxwell Garnet J.C. Colours in metal glasses and in metallic films // Phil. Trans.R.Soc.London. 1904, A203, pp.385–420; Colours in metal glasses, in metal-lic films, and in metallic solutions, II., ibid. 1906, A 205, pp.237–288.
26. Strutt J. (Lord Rayleigh). On the influence of obstacles arranged in rectangular order upon the properties of a medium// Phil. Mag.1892, V. 34, 481p. DOI:10.1080/14786449208620364

Light & Engineering Vol. 27, No. 1
14
27. Bruggeman D.A.G. Calculation of various phys-ics constants in heterogeneous substances. I. Dielectric constants and conductivity of mixed bodies from iso-tropic substances //Ann. Phys. 1935, V.23, pp.636–664. DOI:10.1002/andp.19354160705
28. Smith G.B. Effective medium theory and angu-lar dispersion of optical constants in films with oblique columnar structure// Opt. Commun. 1989, V.71, 5, pp.279–284. DOI:10.1016/0030–4018(89)90008–4
29. Schmidt D., Schubert M. Anisotropic Bruggeman effective medium approaches for slanted columnar thin films //J. of Applied Physics. 2013, V.114, 8, 083510. DOI: 10.1063/1.4819240
30. Mackay T.G., and A. Lakhtakia A. Bruggeman formalism versus “Bruggeman formalism”: particulate composite materials comprising oriented ellipsoidal par-ticles // J.of Nanophotonics. 2012, V.6, 1, 0695012. DOI:10.1117/1.JNP.6.069501
31. Apresyan L. A., Vlasov D.V. On factors of depo-larisation of anisotropic ellipsoids // Journal of technical physics. 2014, V. 84, #12, pp. 23–28.
32. Rytov S. M., Kravtsov Yu. A., Tatarsky V.I. Intro-duction in statistical radiophysics. V.1.2. Moscow: Nau-ka, 1978.
33. Tamm I.E. Fundamentals of theory of electri-city: Textbook for high education institutions. Re-vised 11th edition, Moscow: Fizmatlit, 2003, 616 p, ISBN5–9221–0313-X.
34. Stroud D., Pan F.P. Self-сonsistent approach to electromagnetic wave propagation in composite media: Application to model granular metals// Phys.Rev. 1988, B37, 15, pp.8719–8724.
35. L. A. Apresyan, D.V. Vlasov, D.A. Zadorin, V.I. Krasovsky. On a model of effective environment for particles with complex structure // Journal of technical physics. 2017, V.87, 1, pp. 10–17. DOI: 10.21883/JTF.2017.01.44011.1841
36. Brosseau C. Modelling and simulation of dielec-tric heterostructures: a physical survey from an historical perspective // J. Phys. D: Appl. Phys.– 2006. – V. 39. – P. 1277–1294. DOI:10.1088/0022–3727/39/7/S02
37. Petrov Yu.I. Physics of small particles. Moscow: Nauka, 1982, 359 p.
38. Orayevsky A.N., Protsenko I.E. A high refrac-tion factor and other features of optical properties of het-erogeneous environments // Letters to JETP. 2000, V.72, pp. 641–646.
39. Liznev E. O., Dorofeenko A.V., Vinogra-dov A.P. Creation of environments with dielectric per-meability close to zero in a wide frequency interval // Op-tical journal. 2010, V.77, pp. 11–12.
40. Moiseev S.G. Composite medium with silver na-noparticles as an anti-reflection optical coating//Applied Physics A. 2011, V.103, pp. 619–622.
41. Marton J.P., Lemon J.R. Optical properties of ag-gregated metal systems. 1.Theory // Phys.Rev.– 1971, V.B4, 2, pp.271–280.
42. Bergman D.J., Stroud D. Physical properties of macroscopically inhomogeneous media // Solid State Physics Phys, 1992, V. 46, pp.148–269.
43. Wang Y. and Weng G.J. Electrical conductivi-ty of carbon nanotube and graphen -based nanocom-posites, Ch. 4 in: S.A. Meguid, G.J. Weng (eds.), Mi-cromechanics and Nanomechanics of Composite Solids, Springer International Publishing AG 2018. DOI 10.1007/978–3–319–52794–9_4123
44. Liang D., Schmid D., Wang H. et al. Generalized ellipsometry effective medium approximation analysis approach for porous slanted columnar thin films infiltrat-ed with polymer // Applied Physics Letters, 2013, V. 103, 11, 111906 (1). DOI: 10.1063/1.4821159
45. Vinogradov A. P., Dorofeenko A.V., Zukh-di S. Concerning the question of effective parameters of metamaterials // Achievements of physical sciences. 2008, V. 178, #5, pp. 511–518.
Leon A. Apresyan,Ph.D. (Phys.-math. sciences, 1978), graduated from Moscow Physical-Technical Institute (MPhTI) in 1972. At present, he is the Senior Researcher in Prokhorov General Physics Institute of the Russian Academy of Sciences. His fields of interest are statistical radio-physics and electrodynamics of randomly inhomogeneous media

15
Light & EngineeringVol. 27, No. 1, pp. 15–24, 2019
OPTICAL COMMUNICATION ON SCATTERED OR REFLECTED LASER RADIATION
Vladimir V. Belov
V.E. Zuev Institute of Atmospheric Optics Russian Academy of Sciences, Siberian Branch, Tomsk
E-mail: [email protected]
ABSTRACT
Results of theoretical and experimental research of NLOS (Non-Line of Sight) communication sys-tems in the atmosphere, under water, and in mixed media based on publications of authors from Chi-na, Canada, Greece, the USA, Great Britain, Rus-sia, and other countries are discussed in the present work. The theory of radiation transfer and the line-ar systems theory provide the basis for theoretical research. The radiation transfer equation is solved by the Monte–Carlo method in the single-scattering approximation. It is demonstrated that approximate methods are applicable when the average scattering multiplicity in open communication channels does not exceed 1.
The Monte Carlo method is used to study the in-fluence of optical-geometric parameters of schemes of communication channels on the probabilities of communication errors, signal/noise ratios, limiting base lengths, attenuation of information-carrying signals, and their superposition leading to commu-nication errors.
Examples of communications in the atmosphere in the UV range at distances up to 1300 m, in the vi-sible range up to70 km, and under water up to 20 m are given.
Search for optimal methods of signal modula-tion, development of software and hardware com-plexes for numerical simulation of the transfer pro-perties of communication channels, refinement of analytical models of impulse transfer characteristics of non-coplanar schemes of bistatic optoelectron-
ic communication systems (OECS), and research of the effect of wind-driven sea waves and pro-cesses of radiation scattering in water are planned to study the efficiency of operation of the communi-cation systems and to expand ranges of variations of the input NLOS and OECS parameters in the expe-riments carried out in natural water reservoirs.
Keywords: optical communication systems in the atmosphere and under water, Monte Carlo method, single scattering
1. INTRODUCTION
Essential progress in the development of modern high-quality communication and control systems through atmospheric channels is connected with ap-plication of radio waves for these purposes. Com-munication in radio range is all-weather and acces-sible practically to everyone.
Historically, the optical range was first used for high-rate message transfer. Though the exact date of the beginning of optical communication is un-known, it is possible to suggest that it goes in depth of centuries, when alarm fires, torches, and so forth were used for message transfer. Nowadays this communication technology is used to transmit signs of the telegraph Morse code using directional devi-ces (for example, ISNP-250M).
Centuries later, new technologies based on ap-plications of laser radiation sources and fibre op-tic channels have replaced these simplest methods of information transfer. Integration of possibilities of radio and optical communication systems of this

Light & Engineering Vol. 27, No. 1
16
type has culminated, in particular, in the develop-ment of the worldwide communication network – the Internet.
Does it make sense to create new optical com-munication systems and whether the conditions ex-ist at which control signals or information flows cannot be transferred in radio range through the air or in acoustic range through water? Yes, because there is the impossibility or undesirability of appli-cation of radio-waves or low rates of data transfer by low rate of data transmission by acoustic devi-ces underwater.
Therefore, the next branch of optical communi-cation systems based on application of open com-munication channels in vacuum, atmospheric, and water media has been developed that allows line-of-sight information flows to be transmitted and re-ceived. Communication systems of this type are more often called LOS (Line-of-Sight) systems abroad. The useful signal in them is unscattered op-tical radiation. Extensive theoretical investigations devoted to the feasibility of realization of the LOS systems, estimation of their range of action in air, water, and mixed (water-air or air-water) media are performed. Results of these and experimental in-vestigations have already been published in nume-rous works and continue to be published intensively (for example, see [1–10]). There are commercial-ly available optoelectronic communication systems (OECS). A PAVLight ET-4000 optical modem can serve as an example.
This review presents results of theoretical and experimental investigations of the OECS, in which useful signal is scattered or reflected optical radia-
tion. These OECS in Russia are called over-the-ho-rizon or bistatic communication systems and abroad they are more often called Non-Line-of-Sight (NLOS) communication systems. Despite that the feasibility of realization of such communica-tion was reported in scientific publications in the last century (for example, see [11]), intensive theo-retical and then experimental studies in this direc-tion have been started more than 15 years ago and remain relevant nowadays.
The main advantage of line-of-sight communi-cation is high rate of data transfer. However, it can be interrupted because of interference on the radia-tion propagation path and beam wandering over the receiver aperture plane caused by turbulent pulsa-tions of optical characteristics in open communi-cation channels. Non-line-of-site optical commu-nication has no such disadvantages. Advantages of the NLOS communication in comparison with LOS communication are that it can be realized at much larger distances when there are barriers between the receiver and the transmitter and that it is multius-er one.
Below we limit our consideration by the com-munication systems based on pulsed radiation sour-ces considering that they have essential advantages at least in the range of action (and we are interested in over-the-horizon communication) over the sys-tems with cw radiation sources.
In the review we do not consider all results of investigations in this scientific and technical area. This does not mean that the works that are not in-cluded in References of the present review have contained no new results by the moment of their
Fig. 1. General block diagram of an over-the-horizon OECS

Light & Engineering Vol. 27, No. 1
17
publication; this is due to the fact that hundreds of works have already been published in reviewed journals, proceedings, and materials of conferences and symposiums.
2. PURPOSES OF RESEARCH AND PROBLEM FORMULATION
Let us describe the bistatic OECS by a set of the following parameters (we call them input ones). The radiation source: wavelength λ, polarization type, angular beam divergence νs, outer radius of the ini-tial beam cross section rs, orientation of the opti-cal axis ωs(θs, φs), and average power Ps. Receiving optoelectronic system: field-of-view angle νd, radi-us of the entrance pupil rd, orientation of the optical axis ωd(θd, φd), spectral sensitivity of the photode-tector and level of its noise N. The blocks of elec-tronic modulation and demodulation of transmitted and received radiation are compound multi-com-ponent elements of any communication system, in-cluding bistatic one. The base distance between the source and the receiver Ld is the main external OECS parameter. Fig. 1 shows the block diagram of the bistatic OECS.
In Fig. 1 we have used the following designa-tions: PC1 denotes the control computer, PC2 de-notes the receiving computer to record the obtained information and, for example, to estimate the qua-lity characteristics of the communication channel, etc. Modulator is intended for input of informa-tion into the laser beam, and Demodulator is in-tended for decoding of the received scattered or reflected laser radiation. In the unit Optics, laser radiation with required divergence is formed; ra-diation with wavelength λ1 can be converted into radiation with wavelength λ2, etc. We note that in literature, bistatic OECS are sometimes called Direct NLOS if the useful signal is reflected from
a surface (a building, an aircraft, a ship bottom, an air-water interface, etc.) and Non-Direct NLOS if radiation is scattered in water or in air medium.
The general geometrical scheme of forming a bistatic communication channel is illustrated in Fig. 2. To simplify the figure, a coplanar OECS is shown with optical axes of the laser beam and re-ceiving optical system located in the XoY plane and orientation of the axes determined by the eleva-tion angles θs and θd.
To the main (called output) OECS characteris-tics as a whole, we refer the error probabilities p, their standard deviation (SD) σ, and the rate of sym-bol transfer s. Each of these characteristics depends on the parameters of transceiving systems and ge-ometrical parameters of the schemes of external channels of the bistatic OECS.
Therefore, the main goals of theoretical and ex-perimental investigations of the bistatic commu-nication or control systems consist in the determi-nation of these characteristics depending on the entire set of the parameters determining the con-crete OECS type or on some part of these parame-ters as well as on the optical conditions in the ex-ternal channels of radiation propagation from the source to the receiver. In addition, experimental in-vestigations can be aimed at confirmation or dis-approval of theoretical conclusions on the feasi-bility of realization and characteristics of these or other OECS. Thus, for example, in [11] the feasi-bility of realization of over-the-horizon communi-cation in the UV wavelength range was predicted in 1997 at base distances up to 200 km. So far, this conclusion has neither been confirmed, nor denied.
3. ATMOSPHERIC OVER-THE-HORIZON COMMUNICATION SYSTEMS
From the viewpoint of the system analysis, any of the OECS shown in Fig. 1 can be subdivided into two parts: transceiving system and external communication channel. For fixed characteristics of optoelectronic blocks in Fig. 2, the output OECS characteristics will depend on the optical state of the channel of radiation propagation from the source to the receiver. Both in the atmosphere and in the water medium these conditions can greatly change [12–15]. Therefore, attention in [16–40] was fo-cused on an analysis of the influence of the input OECS parameters, including the optical properties of the atmosphere, on the communication quality.
Fig. 2. Geometrical scheme of forming external channels of over-the-horizon communications

Light & Engineering Vol. 27, No. 1
18
For all other conditions remaining the same, the op-tical properties of the communication channel can limit the working range of the OECS, increase the probability of errors, and, as for one of the means of overcoming these limitations, to a forced decrease in the rate of information signal transfer.
Theoretical research of the transfer proper-ties of the bistatic OESS channels are carried out within in the context of the theory of short-wave radiation transfer in scattering and absorbing me-dia (namely, in the atmosphere and water media) and of the theory of analysis of linear systems.
The radiation transfer equation (RTE) establish-es a relationship between the light field intensity at the given point in a preset direction in the medium and its optical characteristics. In the integro-diffe-rential form, it is written as
( )
( ) ( ) ( )
1 ,
, , , , ,
β β
Ω
∂ + = − + ×∂
× +′ ′ ′∫ext sc
o
I grad I Ic tI g d
ω
ω ω ω ω ωr r rΦ (1)
where I = I(λr, w) is the radiation intensity at the point r in the direction ω, c is the velocity of light, βext(λr) is the extinction coefficient at the point r, βsc(λr) is the scattering coefficient at the point r, g(λr, ωω') is the normalized scattering phase func-tion at the point r in the direction ω, ω' specifies the direction of radiation propagation before scattering, and Ф0 is the source function at the point r in the di-rection ω.
Equation (1) is linear for the intensity; therefore, it is expedient to analyze the transfer properties of the bistatic communication channel in the context of the linear systems theory, that is, to investigate the channel response h(t) to the input δ(t) pulse depen-ding on the input OECS parameters.
Equation (1) has no general analytical solution. For communication with the NLOS systems, diffe-rent algorithms of the Monte Carlo method (from direct simulation algorithms [19] to double local es-timate modifications [20]) are often used. The single scattering approximation for the determination of impulse response h (t), pulse broadening, etc. has obvious limitations of its application field. This is illustrated in Fig. 3.
The time interval [t1, t2] indicated in Fig. 3 cor-responds to the intersection of the laser beam di-vergence angle with the field-of-view angle of the receiving system in Fig. 2 (hatched region). The
function h (t) for t lying beyond this interval is de-termined by radiation with scattering multiplicity higher than 1. This means that the leading and trail-ing edges of the impulse response h(t) in Fig 3 can be determined by solving RTE (1) taking into ac-count scattering multiplicity no lower than 2.
The atmospheric OECS have a wider spectral range of characteristics of laser sources – from UV to IR ranges; for the underwater systems, this choice is limited by the visible range (green and dark blue ranges).
What are reasons for interruptions or infeasibili-ty of bistatic communication? Obviously, to record informative signal, its power must be greater than the power Pf of the intrinsic photodetector noise. Communication errors arise if this condition is not satisfied from time to time. This can be caused by the presence of turbulent fluctuations of the opti-cal characteristics in the communication channel or when local scattering or absorbing optically den-ser formations (fragments of smoke plumes, cloudy media, etc.) fall within the receiver field-of-view. The power of the received informative signal can exceed that of noise, but nevertheless, communi-cation can be impossible. This occurs when the im-pulse response at t < t1 and t → t1 or at t < t2 and t → t2 becomes close or equal to max h (t) in its central part.
Let us try, proceeding from this general know-ledge of interaction of optical radiation with scatter-ing and absorbing media, to estimate the influence of some optical-geometrical parameters of bista-tic OECS, for example, on the range of action. We now perform a number of the following thought ex-
Fig. 3. Example of the impulse response simulated in [18] by the Monte Carlo method

Light & Engineering Vol. 27, No. 1
19
periments. We fix all geometrical and optical pa-rameters and the photodetector characteristics. Let the laser radiation beam divergence νs be zero. And let the range of action reaches Ld. We will increase νs to p/2. It is obvious that Ld will monotonically decrease since the radiation flux density in the re-gion of intersection of cones of the beam divergence and of the field of view of the receiving optical sys-tem will monotonically decrease (Fig. 2). The in-crease in νs will also result in the increased impulse response at t < t1 and t → t1 or at t < t2 and t → t2, thereby increasing the probability of errors, which can be decreased by decreasing the pulse transfer rate.
Let all optical-geometrical parameters of the OECS scheme be fixed (Fig. 2), except the field-of-view angle of the receiving optical system νd, which we will monotonically increase starting from zero value. We assume that at νd = 0 the range of OECS action is equal to Ld. It can be easily demonstra-ted that with increasing νd, the power of the fronts of the impulse response h (t) will increase togeth-er with the interval [t1, t2], but max h (t) will not in-crease. Both these factors can lead to an increase in the communication errors, that is starting from some critical νd values the maximum base Ld will decrease.
It is sufficiently simply to predict the depen-dence of Ld on the variations of some optical pro-perties of the medium in which the external channel of the OESS in Fig. 2 is formed. Let the optical cha-racteristics of the medium be homogeneous. We fix values of the remaining OECS parameters. Let the scattering properties of the medium be absent. Then obviously, the base Ld = 0, the probabilities of errors p = 0, and the rate of symbol transfer s = 0. Let the scattering coefficient βsc → ∞; then it is obvious that Ld → 0, the probabilities of errors p → 0, and the rate of symbol transfer s → 0. Hence, for each con-crete βsc value, there exist nonzero values Ld, p and s. This means that for each set of the input OECS parameters, there exists such optical state of the me-dium at which a maximum Ld value can be realized.
This suggests that optimal conditions for com-munication (at least, from the viewpoint of max h(t)) can be obtained by variations of the orien-tation angles θs and θd of the transmitter and re-ceiver axes (given that all other OECS parameters remain the same), when θs and θd → 0°. This con-clusion remains the same if vertical optical inho-mogeneity of the atmosphere is considered with
its scattering properties decreasing with increasing altitude above the Earth surface. In this case, ex-otic cases when the scattering properties near the Earth surface βsc → ∞ were disregarded. It is obvi-ous that an increase in the average or peak laser ra-diation power will lead to the increase of the maxi-mum Ld values.
As to the atmospheric OECS, much greater num-ber of theoretical and experimental works was de-voted to the UV NLOS systems. A fairly good re-view on the history of the development of UV signal transmission and registration is suggested in [16]. The lamps and flash lamps mentioned in this work were previously used as light sources in com-munication systems. All these devices, as a rule, are bulky, and consume significant power. Semiconduc-tor optical sources have low cost, small size, low power consumption, and high reliability. Therefore, modern commercial light-emitting diodes and pho-todetectors (including avalanche ones) are accessi-ble and are widely used in the bistatic UV commu-nication systems. Nevertheless, there are examples of application of solid-state UV lasers [21] and of transformation of output radiation of the visible range lasers into the UV range [56].
The overwhelming majority of experimental in-vestigations in [16–40] consider UV OECS with ap-plication to small bases Ld. In [56] a bistatic com-munication was operated in this spectral range in the daytime at the base distance equal to 1300 m.
We emphasize that the number of works on the OECS in the visible and IR spectral ranges is signi-ficantly less than of works on the OESC in the UV range. Works [2] (an infrared LOS OECS) and [53] (a visible range NLOS OECS) can be mentioned here as examples. Interest to the UV communica-tion systems is understandable. In the solar-blind range they can be employed round the clock in the absence of artificial UV noise sources.
The main methods of research of the transmis-sion properties of NLOS channels are the Monte Car-lo method [18–20,23,29,30,32,33,34,39,50–52] and the single scattering approximation [11,17,22,38]. In [17–19] results of theoretical and experimen-tal investigations of the influence of the geomet-rical parameters on the probabilities of errors and range of action of the bistatic OECS were presented. In [30] it was shown that the single scattering ap-proximation cannot be used to solve the RTE to ex-plain exhaustively the results obtained in experi-ments. In [30] the widths of the impulse response

Light & Engineering Vol. 27, No. 1
20
determined for concrete input parameters of the OECS schemes by the Monte Carlo method and in the single scattering approximation were com-pared. It was shown that the single scattering ap-proximation is applicable to estimate h (t) if the medium is transparent and the multiplicity of scat-tering in the atmospheric channel does not exceed 1. In model experiment with the average number of collisions in the channel equal to 3.85, the dura-tion of h (t) was 8 ms, whereas in the single scatter-ing approximation it was practically absent.
The common feature of [16,17,19,21–36,38,39] was that they presented results of theoretical and-or experimental investigations devoted in some extent to an analysis of the influence of the input OECS parameters on the communication quality (proba-bility of errors) and range of action (not exceeding 100 m in the experiments) on the rate of data trans-fer and the protection against noise.
In [54] an example of simulation by the Mon-te Carlo method of the impulse response was given, and with its help ranges of action and data transfer rates were estimated taking into account the charac-teristics of a FEU-17a photodetector. Statistical ex-periments were performed for the OECS compris-ing the laser radiation source at a wavelength l = 0.5 mm. A dependence of the communication quali-ty on the temperature regime of the receiver opera-tion was considered in [6, 57].
An important place in theoretical and expe-rimental investigations of experts on the bistatic OECS was occupied by the methods of increasing the stability of their operation. The choice of the methods of radiation modulation and their compa-rison was considered, for example, in [26]. In [23, 25] different types of the OESS radiation receivers were discussed.
4. UNDERWATER BISTATIC COMMUNICATION SYSTEMS
Works [41–51, 55] were devoted to theoreti-cal and experimental investigations of underwater communication systems. Among them, attention is drawn to work [44] in which extensive review of studies was presented devoted to the LOS sys-tems, but including some aspects of the communi-cation NLOS Systems. It contains 232 references to publications of authors from the USA, Canada, China etc. Let us complement it by a short analysis of other works.
In Fig. 4, one of such problem formulations considered in [46, 51] is shown. This communica-tion scheme was called Direct NLOS (see Fig. 2). Interest in these investigations is caused by the ap-plication of networks of intellectual robots for sol-ving problems of monitoring of states of underwater objects, exploration of natural resources, etc. In [46, 51] numerical experiments were performed, and not only flat, but also wavy water surface was conside-red; however, radiation scattering in water was not taken into account.
In publication [42], results of experimental labo-ratory research performed for small base distances not exceeding several meters were discussed. Con-clusions from these experiments are reduced to that the range of action of LOS and Direct and Non Di-rect NLOS communication systems depends on the water turbidity whose increase leads to the decrease of their range of action and data transmission rate.
The overwhelming number of publications of the results of theoretical investigations of the bistatic underwater OECS are based on the ap-plication of the Monte Carlo method for solving the radiation transfer equation. Here we refer only to [43,47–51] publications. The transfer properties of the underwater bistatic communication channels were described in the context of the linear systems theory using the influence functions h (t) ([47] refe-rence can serve as an example). In [48], possibili-ties of the LOS and NLOS systems were compared. Numerical experiments demonstrated that the rate of symbol transfer in the LOS communication sys-tems can reach 100 MHz in a turbid medium and is much greater in a clear medium. For NLOS sys-tems, this rate is limited by 20 MHz in clear water. These results were obtained by numerical experi-ments with base distances up to 20 m. For simula-tion by the Monte Carlo method of the process of optical radiation propagation in a water medium, the Henyey–Greenstein model of the scattering phase function was used in [48]. The probabilities of com-
Fig. 4. Geometrical scheme of underwater communication based on radiation reflection from the water-atmosphere
interface

Light & Engineering Vol. 27, No. 1
21
munication errors caused by the pulse interference, that is, superposition of the leading edge of the cur-rent pulse on the trailing edge of the previous pulse (see Fig. 3) were estimated in [48].
Let us pay attention to papers [45, 55] in which results of experiments on optical communica-tion through mixed media were presented. In [45], results of laboratory experiments were discussed with the LOS scheme of communication on air-wa-ter paths (the receiver was placed in water) and on water-air paths (the receiver was placed in air). In [55], results of field experiments in a natural wa-ter reservoir were presented. In particular, the prob-abilities of communication and their standard devi-ations were given for communication through ice.
5. CONCLUSIONS
The urgency of research on the problems of op-tical communication based on scattered or reflec-ted radiation is confirmed by abundance of previous and continuing publications (there are examples of works published in 2018). The countries in which scientific groups carrying out study in this direc-tion are sufficiently widespread all over the world: China (the greatest number of publications), Cana-da, the USA, Greece, Great Britain etc. There are some examples of international teams.
The main conclusions based on the above-dis-cussed publications can be formulated as follows. Results of simulations by the Monte Carlo method of the informative signal transfer through atmos-pheric bistatic channels [54] in the visible wave-length range have allowed us to conclude that at small base distances (2–3 km), the power of the re-ceived informative pulse is maximum for radia-tion in the UV range (λ ≈ 0.3 mm) given that the re-maining conditions remain the same. For large base distances and low turbidity of the medium (meteo-rological visibility range SM ≈ 50 km), it is observed at λ ≈ 0.5 mm. At high atmospheric turbidity (SM ≈ 10 km), depending on the base distances and the ori-entation of the receiving plane, it can be obtained at λ ≈ 0.5 mm and λ ≈ 0.9 mm. In the same work, it was also shown that the limiting frequencies of pulses transmission in a bistatic optoelectronic communi-cation system, depending on the optical conditions in the atmosphere and geometrical parameters of the schemes of communication channels, lie within the limits from 4×10³ to 2×10⁷ Hz (for ideal characte-ristics of the receiving and transmitting systems).
The implementation of the bistatic communi-cation in the atmosphere in the visible wavelength range for base distances up to 70 km was reported in [53]; in [56] the communication in the UV range was realized for base distances up to 1300 m; and the underwater communication in a natural water reservoir for base distances up to 40 m was report-ed in [58].
In [28] based on investigations on the network applications of the NLOS systems, it was estab-lished that the optical communication systems in-tended for short (up to 100 m) base distances with semiconductor sources are significantly cheaper and have smaller overall dimensions. Experiments in [28] were carried out at a radiation wavelength of 0.34 mm.
Software for investigation of the transfer proper-ties of non-coplanar communication systems (for example, see [23, 33]) has been developed. Theo-retical results obtained in [24] were confirmed by experiments.
In [31] the possibility of application of network technologies for monitoring of biosystems, detec-tion of fires, control of atmospheric pollution, and communication in the UV range of wavelengths 0.200–0.280 mm was analyzed. On the basis of an-alytical relationships derived in the single scatter-ing approximation for small base distances, the influence of optical-geometric conditions of obser-vations and radiation power on the probability of errors, the signal/noise ratio, and some other cha-racteristics of the examined OECS was investigated.
In publications, different types of laser sour-ces used in bistatic OECS were reported. There are examples of application of CW (continuous wave) radiation with its subsequent transforma-tion into pulsed radiation [40]. The OESS can in-clude solid-state lasers in the UV range and gas-dis-charge lasers with radiation in the visible range that can be transformed, if necessary, into UV radia-tion using nonlinear BBO crystals.
Attention of researchers was also focused on the problem of application of polarization properties of light to improve the noise protection of the OECS operating on scattered laser radiation. In [34], the development of the Monte Carlo program-algo-rithmic complex was reported intended for simula-tion of propagation and reception of polarized ra-diation in the NLOS communication channels. It was shown that the reception of the polarized sig-nal makes it possible to decrease the probability of

Light & Engineering Vol. 27, No. 1
22
errors by decreasing the influence of multiple scat-tering on the formation of the leading and trailing pulse edges.
One of the factors that influence the quality of bistatic OECS performance is turbulence. It can decrease the useful signal power and interrupt the communication. In [35], the influence of the num-ber of receivers on the communication errors was analyzed.
The important OECS components are photode-tectors. In the literature discussed above, Hama-matsu solid-state photodetectors, avalanche pho-todiodes, domestic FEU142 and 17а, and modern photoelectronic multipliers UFK-4G-4, UFK-4G-3, and UFK-4G-2 (manufactured by the “KATOD” LLC) were used.
In [52, 53], the procedure of estimating in real time of the probabilities of communication errors and their SD was described for OECS testing in the atmosphere, water, and mixed media.
In [51], the Monte Carlo method was used to perform numerical experiments on underwater communication taking into account the wavy water surface for schemes of Direct NLOS, and the rate of data transmission in clear and turbid water was estimated.
Future investigations will be aimed at the search for optimal methods of signal modulation, the de-velopment of means for numerical simulations of transfer properties of the NLOS communica-tion channels, the development of analytical models of the impulse response in non-coplanar schemes of the bistatic OECS, the study of the influence of waves on the water surface and scattering proces-ses in water on the overall performance of the com-munication systems on scattered laser radiation, and expansion of the range of variations of the input pa-rameters of NLOS OECS for carrying out experi-ments in natural water reservoirs.
The author is grateful to his colleagues M.V. Tarasenkov, V.N. Abramochkin, A.V. Fedosov, А.N. Kudryavtsev, V.V. Ivanov, and Yu.V. Gridnev for their collaboration in the research, creation, and testing of the atmospheric and underwater bistat-ic OECS.
REFERENCES
1. Lee I.E., Ghassemlooy Z., Ng W.P., Khalighi M-A., and Liaw S-K. Effects of aperture averag-ing and beam width on a partially coherent Gaussian
beam over free-space optical links with turbulence and pointing errors//Applied Optics. 2016. Vol. 55, No. 1, pp. 1–9.
2. Amr S. El-Wakeel, Nazmi A. Mohammed, and Moustafa H. Aly. Free space optical communications sys-tem performance under atmospheric scattering and tur-bulence for 850 and 1550 nm operation//Applied Optics. 2016. Vol. 55, No. 26, pp. 7276–7286.
3. Zhengguang Gao, Hongzhan Liu, Xiaoping Ma, and Wei Lu. Performance of multi-hop parallel free-space optical communication over gamma–gamma fading chan-nel with pointing errors//Applied Optics. 2016. Vol. 55, No. 32, pp. 9178–9184.
4. Zina Abu-Almaalie, Zabih Ghassemlooy, Manav R. Bhatnagar, Hoa Le-Minh, Nauman Aslam, Shien-Kuei Liaw, and It Ee Lee. Investigation on iterative multiuser detection physical layer network coding in two-way relay free-space optical links with turbulences and pointing errors//Applied Optics. 2016. Vol. 55, No. 33, pp. 9396–9406.
5. Xin Zhao, YunQing Liu, and Yansong Song. Line of sight pointing technology for laser communication sys-tem between aircrafts//Optical Engineering. 2017. Vol. 56, No. 12, p. 126107.
6. Huihua Fu, Ping Wang, Tao Liu, Tian Cao, Lixin Guo, and Jiao Qin. Performance analysis of a PPM-FSO communication system with an avalanche photodiode re-ceiver over atmospheric turbulence channels with aper-ture averaging//Applied Optics. 2017. Vol. 56, No. 23, pp. 6432–6439.
7. Bykova N.G., Gochelashvily K.S., Karfidov D.M., Makarenko G.F., Senatorov A.K., Sergeichev K.F., Shat-alov O.P., and Zabelinskii I.E. Experimental demonstra-tion of feasibility of laser communication with the reen-try spacecraft at 1.55 mm//Applied Optics. 2017. Vol. 56, No. 10, pp. 2597–2603.
8. Jing Ma, Jiajie Wu, Liying Tan, and Siyuan Yu. Po-larization properties of Gaussian–Schell model beams propagating in a space-to-ground optical communica-tion downlink//Applied Optics. 2017. Vol. 56, No. 6, pp. 1781–1787.
9. Ming Li, Wenbo Gao, and Milorad Cvijetic. Slant-path coherent free space optical communications over the maritime and terrestrial atmospheres with the use of adap-tive optics for beam wavefront correction//Applied Op-tics. 2017. Vol. 56, No. 2, pp. 284–297.
10. Vorontsov M.A, Dudorov V.V., Zyryanov M.O., Kolosov V.V., and Filimonov G.A. Frequency of occur-rence of erroneous bits in systems of wireless optical com-munication with partially coherent transmitting beam//At-mosphere and Oceanic Optics. 2012. Vol. 25, No. 11, pp. 936–940.
11. Pozhidaev V.N. Practicability of communica-tion lines of the ultraviolet range based on molecular and aerosol scattering in the atmosphere//Radiotekh. Elektr. 1977. Vol. 22, No. 10, pp. 2190–2192.

Light & Engineering Vol. 27, No. 1
23
12. Zuev V.E. and Krekov G.M. Modern Problems of Atmospheric Optics. Vol. 2/Optical Models of the At-mosphere. Leningrad: Gidrometeoizdat, 1986. 256p.
13. Zuev V.E., Belan B.D., and Zadde G.O. Optical Weather//Publishing House “Nauka” Siberian Branch of the Russian Academy of Sciences. Novosibirsk, 1990, 192 p.
14. Ocean and Atmosphere Optics/under the editor-ship of K.S. Shifrin. Moscow: Nauka, 1981, 231 p.
15. Ocean Optics. Vol. 2. Applied Optics of the Ocean/under the editorship of A.S. Monin. Moscow: Nau-ka, 1983, 236 p.
16. Chen G., Abou-Galala F., Xu Z., and Sadler B.M. Experimental evaluation of LED-based so-lar blind NLOS communication links//Optics Express. 2008. Vol. 16, No. 19, pp. 15059–15068.
17. Chen G., Xu Z., Ding H., and Sadler B.M. Path loss modeling and performance trade-off study for short-range non-line-of-sight ultraviolet communications//Op-tics Express. 2009. Vol. 17, No. 5, pp. 3929–3940.
18. Belov V.V., Tarasenkov M.V., Abramochkin V.N., Ivanov V.V., Fedosov A.V., Troitskii V.O., and Shi-yanov D.V. Atmospheric bistatic communication channels with scattering. Part 1. Methods of Research//Atmospher-ic and Oceanic Optics. 2013. Vol. 26, No. 4, pp. 261–267.
19. Ding H., Chen G., Majumdar A.K., Sadler B.M., and Xu Z. Modeling of Non-Line-of-Sight Ultraviolet Scattering Channels for Communication//IEEE Journal on Selected Areas in Communications. 2009. Vol. 27, No. 9, pp. 1535–1541.
20. Belov V.V. and Tarasenkov M.V. Three algorithms of statistical simulation in problems of optical commu-nication on scattered radiation and bistatic sensing//At-mospheric and Oceanic Optics. 2016. Vol. 29, No. 05, pp. 397–403.
21. Chen G., Xu Z., and Sadler B.M. Experimental demonstration of ultraviolet pulse broadening in short-range non-line-of-sight communication channels//Optics Express. 2010. Vol. 18, No. 10, pp. 10500–10509.
22. Bifeng Li, Hongxing Wang, Min Liu, Hao Hu, Zhongyang Mao. Applicability of non-line-of-sight ultra-violet single-scatter approximation model// Photon. Netw. Commun. 2016. Vol. 31, No. 1, pp. 147–154.
23. Dahai Han, Xing Fan, Kai Zhang, and Rui Zhu. Research on multiple-scattering channel with Monte Carlo model in UV atmosphere communication//Applied Optics. 2013. Vol. 52, No. 22, pp. 5516–5522.
24. Hailiang Zhang, Hongwei Yin, Honghui Jia, Shengli Chang, and Juncai Yang. Characteristics of non-line-of-sight polarization ultraviolet communi-cation channels//Applied Optics. 2012. Vol. 51, No. 35, pp. 8366–8372.
25. Dahai Han, Yile Liu, Kai Zhang, Pengfei Luo, and Min Zhang. Theoretical and experimental research on diversity reception technology in NLOS UV commu-nication system//Optics Express. 2012. Vol. 20, No. 14, pp. 15833–15843.
26. Menglong Wu, Dahai Han, Xiang Zhang, Feng Zhang, Min Zhang, and Guangxin Yue. Experimental re-search and comparison of LDPC and RS channel coding in ultraviolet communication systems//Optics Express. 2014. Vol. 22, No. 5, pp. 5422–5430.
27. Petr Chvojka, Stanislav Vitek, Stanislav Zvano-vec, Zabih Ghassemlooy, and Sujan Rajbhandari. Analy-sis of nonline-of-sight visible light communications//Op-tical Engineering. 2017. Vol. 56, No. 11: 116116. DOI.org/10.1117/1.OE.56.11.116116.
28. Gary A. Shaw, Andrew M. Siegel, Melissa L. Nis-chan. Demonstration system and applications for compact wireless ultraviolet communications//Proc. SPIE. 2003. Vol. 5071. Doi.org/10.1117/12.500861.
29. Peng Song, Xianli Zhou, Fei Song, Caix-ia Su, and Anxiang Wang. Performance analysis of UV multiple-scatter communication system with height difference//Applied Optics. 2017. Vol. 56, No. 32, pp. 8908–8916.
30. Yin H., Chang S., Jia H., Yang J., and Yang J. Non-line-of-sight multiscatter propaga-tion model//J. Opt. Soc. Am. A. 2009. Vol. 26, No. 11, pp. 2466–2469.
31. Debbie Kedar. Multiaccess interference in a non-line-of-sight ultraviolet optical wireless sen-sor network//Applied Optics. 2007. Vol. 46, No. 23, pp. 5895–5901.
32. Hongwei Yin, Shengli Chang, Xiaofeng Wang, Jiankun Yang, Juncai Yang, and Jichun Tan. Non-line-of-sight multiscatter propagation model//J. Opt. Soc. Am. A. 2009. Vol. 26, No. 11, pp. 2466–2069.
33. Mohamed A. Elshimy and Steve Hranilovic. Non-line-of-sight single-scatter propagation model for non-coplanar geometries//J. Opt. Soc. Am. A. 2011. Vol. 28, No. 3, pp. 420–428.
34. Hongwei Yin, Honghui Jia, Hailiang Zhang, Xiaofeng Wang, Shengli Chang, and Juncai Yang. Vec-torized polarization-sensitive model of non-line-of-sight multiple-scatter propagation//J. Opt. Soc. Am. A. 2011. Vol. 28, No. 10, pp. 2082–2085.
35. Houfei Xiao, Yong Zuo, Jian Wu, Yan Li, and Jin-tong Lin. Bit-error-rate performance of non-line-of-sight UV transmission with spatial diversity reception//Optics Letters. 2012. Vol. 37, No. 19, pp. 4143–4145.
36. Robert J. Drost, Terrence J. Moore, and Bri-an M. Sadler. Ultraviolet scattering propagation mode-ling: analysis of path loss versus range//J. Opt. Soc. Am. A. 2013. Vol. 30, No. 11, pp. 2259–2265.
37. Peng Wang and Zhengyuan Xu. Characteristics of ultraviolet scattering and turbulent channels//Optics Letters. 2013. Vol. 38, No. 15, pp. 2773–2775.
38. Houfei Xiao, Yong Zuo, Jian Wu, Yan Li, and Jintong Lin. Non-line-of-sight ultraviolet single-scatter propagation model in random turbulent medium//Optics Letters. 2013. Vol. 38, No. 17, pp. 3366–3369.
39. Siqi Hu, Le Mi, Tianhua Zhou, and Weibiao Chen. Viterbi equalization for long-distance, high-speed under-

Light & Engineering Vol. 27, No. 1
24
water laser communication//Optical Engineering. 2017. Vol. 56, No. 7, p. 076101.
40. Hongwei Yin, Shengli Chang, Xiaofeng Wang, Jiankun Yang, Juncai Yang, and Jichun Tan. Analyti-cal model of non-line-of-sight single-scatter propaga-tion//JOSA A. 2010. Vol. 27, No. 7, pp. 1505–1509.
41. Kuznetsov С., Ognev B., and Polyakov S. System of optical communication in water//Pervaya Milya. 2014, No. 2, pp. 46–51.
42. Hanson F. and Radic S. High bandwidth under-water optical communication//Appl. Opt. 2008. Vol. 47, No. 2, pp. 277–283.
43. Jaruwatanadilok S. Underwater wireless opti-cal communication channel modeling and performance evaluation using vector radiative transfer theory//IEEE J. on Selected Areas in Communications. 2008. Vol. 26, No. 9, pp. 1620–1627.
44. Hemani Kaushal1 and Georges Kaddoum. Un-derwater optical wireless communication//IEEE Access. 2016, Vol. 4, pp. 1518–1547.
45. Majumdar A.K. , Siegenthaler J . , and Land P. Analysis of optical communications through the random air-water interface: feasibility for under-water Communications//Proc. SPIE. 2012. Vol. 8517, 85170T. DOI: 10.1117/12.928999.
46. Arnon S. and Kedar D. Non-line-of-sight under-water optical wireless communication network//J. Opt. Soc. Am. A. 2009. Vol. 26, No. 3, pp. 530–539.
47. Gabriel C., Khalighi M.-A., Bourennane S., Leon P., and Rigaud V. Channel modeling for underwa-ter optical communication//2011 IEEE GLOBECOM Workshops (GC Wkshps). 2nd International Workshop in Optical Wireless Communications. 2011, pp. 833–837. DOI: 10.1109/GLOCOMW.2011.6162571.
48. Choudhary A., Jagadeesh V.K., and Muthuchi-dambaranathan P. Path loss analysis of NLOS under-water wireless optical communication channel//2014, International Conference on Electronics and Com-munication System (ICECS-2014). DOI: 10.1109/ECS.2014.6892620.
49. Jagadeesh V.K., Choudhary A., Bui F.M., and Muthuchidambaranathan P. Characterization of channel impulse responses for NLOS underwater wireless opti-cal communications//2014, Fourth International Confer-ence on Advances in Computing and Communications (ICACC). DOI: 10.1109/ICACC.2014.24
50. Chadi Gabriel, Mohammad-Ali Khalighi, Salah Bourennane, Pierre Léon, and Vincent Rigaud. Mon-te-Carlo-based channel characterization for underwa-ter optical communication systems//IEEE/OSA Journal of Optical Communications and Networking. 2013. Vol. 5, No. 1, pp. 1–12
51. Shijian Tang, Yuhan Dong, and Xuedan Zhang. On Path loss of NLOS underwater wireless optical com-munication links//2013 MTS/IEEE OCEANS. DOI: 10.1109/OCEANS-Bergen.2013.6608002
Vladimir V. Belov, Prof., Dr. of Phys.-math. Sciences, graduated from Tomsk State University in 1971. At present, he is the Head of laboratory of V.E. Zuev Institute of Atmospheric Optics
of Russian Academy of Sciences (SB), Honoured Scientist of the Russian Federation, his research interests: the theory of optical radiation transfer in scattering and absorbing media, the theory of laser sensing, the theory of vision, atmospheric correction of aerospace images of the earth’s surface, the Monte Carlo method, multiple scattering
52. Belov V.V., Tarasenkov M.V., Abramochkin V.N., Troitskii V.O. Over-the-horizon optoelectronic commu-nication systems//Russian Physics Journal. 2014 Vol. 57, No. 7, pp. 202–208.
53. Abramochkin V.N., Belov V.V., Gridnev Yu.V., Kudrjavtsev A.N., Tarasenkov M.V., and Fe-dosov A.V. Optoelectronic communication in the at-mosphere on scattered laser radiation. Field experi-ments//Light engineering. 2017. No. 4, pp. 24–30.
54. Tarasenkov M.V., Poznakharev E.S., and Be-lov V.V. Statistical estimations of transfer characteris-tics, limiting ranges, and rates of information transfer in pulsed atmospheric bistatic optical communication chan-nels// Svetotekhnika, 2018, No. 4, pp. 37–43.
55. Belov V.V., Abramochkin V.N., Gridnev Yu. V., Kudryavtsev A.N., Tarasenkov M.V., and Fed-osov A.V. Bistatic optoelectronic communication sys-tems: Field experiments in artificial and natural water res-ervoirs//Atmospheric and Oceanic Optics. 2017 Vol. 30, No. 4, pp. 366–371.
56. Belov V.V., Gridnev Yu.V., Kudryavtsev A.N., Tarasenkov M.V., and Fedosov A.V. Optoelectronic com-munication in the UV wavelength range on scattered la-ser radiation//Atmospheric and Oceanic Optics. 2018. Vol. 31, No. 07, pp. 559–562.
57. Belov V.V., Tarasenkov M.V., Abramoch-kin V.N., Ivanov V.V., Fedosov A.V., Gridnev Yu.V., Troit-skii V.O., Dimaki V.A. Atmospheric bistatic communica-tion channels with scattering. Part 2. Field experiments of 2013//Atmospheric and Oceanic Optics. 2014. Vol. 27, No. 08, pp. 659–664.
58. Belov V.V. Optical communication on scattered laser radiation // Proceedings of SPIE. 2017. V. 10466. CID:10466 0H. [10466–24].

25
Light & EngineeringVol. 27, No. 1, pp. 25–32, 2019
A BIDIRECTIONAL SCATTERING FUNCTION RECONSTRUCTION METHOD BASED ON OPTIMIZATION OF THE DISTRIBUTION OF MICRORELIEF NORMALS
Nicolai N. Bogdanov 1, Andrew D. Zhdanov 1, Dmitriy D. Zhdanov 1, Igor S. Potyomin 1, Vadim G. Sokolov 2, and Eugene Y. Denisov 2
1 ITMO University, Saint-Petersburg, Russia 2 Keldysh Institute of Applied Mathematics (RAS), Moscow, Russia
E-mails: [email protected]; [email protected]; [email protected]; [email protected]; [email protected]; [email protected]
ABSTRACT
The paper is devoted to the development of a method for reconstructing the scattering proper-ties of a rough surface. The rough surface, in this case, is the dielectric-air interface. Typically, these properties are described by the bidirectional scatter-ing distribution function. Direct measuring of such functions is either impossible, or its cost is very high. The method of reconstructing the bidirection-al scattering distribution function, based on the dis-tribution of the elevations of the microrelief, re-quires a complicated fitting procedure and often yields not very good results. In the proposed solu-tion, the rough surface is modelled by a parametric function that simulates the density distribution of the normals to the faces of the surface microrelief. The result of optimizing the density distribution of the normals to the faces of the surface microrelief is in good agreement with the expected one.
Keywords: microrelief, bidirectional scattering distribution function, rough surface, diffusion, ren-dering, photoconductive systems, total internal re-flection, wave optics, ray optics
1. INTRODUCTION
Photoconductive optical elements with rough surfaces, Fig.1, are widely used in devices with complex light distribution. As a rule, rough surfa-
ces are used in two cases: either to form a special goniometric light scattering diagram or to create the required spatial luminance distribution in vari-ous photoconductive devices, such as liquid crystal display illumination systems, car dashboards, LED luminaires, etc. When modelling the propagation of light inside the material of a photoconductive ele-ment, it is necessary to take into account the optical properties of a rough interface between two media, whereas the optical properties of the entire element are meaningless. Moreover, these properties differ depending on whether the light falls on the inter-face from the side of the material of the photocon-ductive element or whether light falls on the sur-face from the air. Therefore, for physically-correct modelling of such devices, the optical properties of
Fig. 1. An example of the use of a rough surface

Light & Engineering Vol. 27, No. 1
26
a rough surface must be taken into account individ-ually for each side.
Fig. 1 shows an example of the use of a rough surface. On the lower surface of the photoconduc-tive plate (PCP) stains with microrelief are applied. These stains are scattering surfaces. They have a re-latively small size, and therefore they are sometimes called diffuse points. Inside the PCP, the light beam spreads according to the law of total internal reflec-tion. After scattering at diffuse points, the beam de-viates from the direction of specula reflection and can leave the PCP. The diffuse point’s density dis-tribution that varies along the surface of the PCP makes it possible to obtain uniform radiation over the entire area of the external surface.
The light scattering parameters of a rough sur-face are described by the bidirectional scattering distribution function (BSDF). The function has a complex multidimensional representation and de-pends on a number of parameters, such as the direc-tion of incident light, the observation direction of light and the spectral composition (colour) of the radiation. The BSDF is a superposition of two func-tions: the bidirectional reflectance distribution func-tion (BRDF) and the bidirectional transmittance dis-tribution function (BTDF). For flat thin samples, the BSDF can be measured using a goniophoto meter. In cases where the thickness of a sample with a mi-crorelief can be neglected, its physically correct mo-del can be represented as a single surface, on which the properties of the BSDF obtained as a result of measurements are assigned. Such a “surface” mo-del, shown schematically in Fig. 2a, can be used to simulate various diffuse films or filters. Unfor-tunately, this model is not applicable if the thick-ness of a sample with a microrelief is important for the propagation of light inside a transparent materi-
al of the NGN. In this case, the “solid-state” model should be used, shown in Fig. 2b. This means that for correct modelling it is necessary to have two BSDFs of a rough surface, one of which describes the scattering properties when radiation passes from the air into the glass, and the other describes the scattering properties when radiation passes from the glass into the air.
The main problem is that the BSDF of a rough surface of a PCP cannot be measured directly. There are several reasons for this. First, it is the presence of multireflections between the rough surface and other surfaces of the sample being measured. Se-condly, it is impossible to illuminate the sample or detect light at glancing angles to a rough surface. Solving problems is expensive and requires special equipment to eliminate multireflections between surfaces and refraction on the side opposite to the measured rough surface.
Many researchers are dealing with the com-plex problem of the reconstruction of the BSDF [1–8]. A number of works [1–5, 7] are devo-ted to accurate and physically correct reconstruc-tion by comparison with the database of MERL BSDF measurements [9]. This database contains re-flection functions for 100 kinds of materials. The authors of this database describe their method of ob-taining a BSDF [10], but the question arises about the correctness of the measurements. It is diffi-cult to say how accurate the BSDF measurements are in the MERL database due to the lack of in-formation on certified measuring equipment. That is why the question arises about the reliability of measurements.
It should also be noted that in most papers the authors consider the problem of reconstruction only the bidirectional reflectance function (BRDF), and not in general the two-beam scattering func-tion (BSDF). As a rule, BRDF is applied only to sur-faces, but this is not enough for accurate modelling, for example, frosted glass.
One of the alternative methods of BSDF recon-struction is computer modelling of light scattering at the boundary of the microrelief of the sample me-dium [11]. Such an indirect method also has a num-ber of drawbacks. In particular, the deviation of the surface profile can be comparable with the wave-length of the incident light. This means that the cal-culations must be carried out taking into account the aspects of wave optics, which, first, are very com-plex, and secondly, they may not be reliable be-
Fig. 2. “Surface” model pf a diffuse plate (a), “solid-state” model of a PCP

Light & Engineering Vol. 27, No. 1
27
cause of insufficient accuracy in measuring the sur-face profile.
This article presents a combined approach. It uses the BSDF optimization, based on the appro-ximation of the form to the Gaussian and Cauchy functions, with a limited number of parameters. This approach ensures a more correct reconstruc-tion of the BSDF than the method proposed in [11].
The authors propose a method for reconstruct-ing the BSDF, which allows modelling of phy-sically correct complex scenes with frosted glass. For the experiments, GCMS-4 certified measuring equipment [12] was used, which made it possible to conduct physically accurate measurements of the BSDF. In this study, the BSDF was reconstructed and the results were compared with measurements on GCMS-4 equipment, so we can be sure that the results obtained are physically correct.
2. NUMERICAL METHODS OF BSDF RECONSTRUCTION
There are several numerical approaches to the calculation of the BSDF of rough surfaces both on the basis of wave optics and on the basis of the ray approximation. In the previous study, a solu-tion was described, in which the surface microre-lief is represented as a height distribution within the representative region of the sample [11].
The reconstruction of the BSDF of the plate with a rough surface was based on the use of two sets of measured data: the distribution of microrelief heights and the total BSDF of the sample (BTDF and-or BRDF). The reconstruction results were of-
ten not very good and required a comprehensive optimization of the microrelief (scale and profile filtering). However, filtering cannot guarantee a suc-cessful solution to the problem.
The new approach is based on using only one type of data, namely BSDR (BTDF and/or BRDF) measured for the entire sample. Despite the diffe-rence with the previous algorithm, the basic mo-del of the new approach is the same. The initial in-formation for the reconstruction of the BRDF is the angular distribution of the luminous intensity, cal-culated after the transformation of the rays at the boundary of two media, represented in the form of microgranules. The only difference is that micro boundaries are defined as the density of the distri-bution of the normals to the surfaces of these mi-crogranules. The OPTOS MicroRelief tool [13], in-tegrated into the Lumicept software package [14], provides correct calculations for the distribution of the light intensity scattered on the microrelief.
The initial distribution of the normals to the re-lief microfaces, necessary for simulating the pro-pagation of light, can be reconstructed from the measured BRDF of the sample. In the absence of shadowing of neighbouring microgranules, the an-gular distribution of the normals is approximately 2 times greater than that of the BRDF. Of course, this is a rough approximation, but it can be used as an initial step for the whole procedure for the recon-struction of the BSDF.
To restore the BSDF, we used a real sample in the form of a plane-parallel plate, in which one surface is polished and the other is rough (matted). The plate was illuminated by a collimated light
Fig. 3. Schematic model of a goniopho-tometer for measuring the BSDF of a diffuse plate

Light & Engineering Vol. 27, No. 1
28
beam. The intensity of reflected and transmitted light was measured for each direction of incidence. For simplicity, the measurements were carried out in the same plane – in the plane of incidence. The simulation scheme (Fig.3) is very close to the mea-surement circuit. A collimated beam of light with a corresponding aperture and angular divergence il-luminates the plate. The rough surface of the sam-ple was modelled by the BRDF calculated using the BSDF generation module included in the Lumicept software package [15], using the density of the an-gular distribution of normals. The light scattered by the plate was accumulated by round virtual de-tectors located along a predetermined angular grid. The distances between the detectors and the me-asured sample and the radius of the detectors corre-
spond to the characteristics of the measuring device: the relative position of the measured sample and the photodetector, the angular and spatial resolution of the goniophotometer.
Fig. 4 shows the charts of the measured and calculated BTDF in the form of the relative angu-lar distribution of the light intensity transmitted through a sample with one rough surface. The com-bined graph contains the BTDF for all measured di-rections of the incident light: 0º, 15º, 30º, 45º, 60º, 75º (sigma is the angle between the normal to the sample surface and the direction of incident light). Note that all measurements and calculations are car-ried out in the plane of incidence. Solid lines indi-cate the results of measurements of a real sample. The dashed lines correspond to the results of mod-elling a sample with a reconstructed BSDF. It can be seen that there is a significant difference between simulation and measurement results. A similar trend can be observed on the chart with the results on the light reflection (not presented in the article).
3. THE OPTIMIZATION ALGORITHM OF BSDF RECONSTRUCTION, BASED ON THE DISTRIBUTION OF NORMALS
The main reason for the differences between the measurement and calculation results shown in Fig. 4 is that the initial reconstructed deviation of the nor-mals is not suitable for the real model of light scat-tering on the sample. On the other hand, the angular distribution of normals is an indirect way of deter-mining the BSDF. Thus, it is reasonable to assume that optimizing the angular distribution of the nor-mals to the microfaces of the relief of the rough sur-face will yield the target BSDF of the sample.
The main idea of the proposed optimization me-thod is that to restore the desired BSDF of a rough surface it is sufficient to use only one set of me-asured data, for example, the transmission charac-teristics of the entire sample or, in other words, its BTDF. Fig. 5 shows the optimization procedure. The rough surface is determined by the density of the angular distribution of the normals to the surface microfaces. The optimization algorithm contains the following steps:
1. In the first step, information is entered on the sample size, the refractive index, the BTDF of the sample, the initial parameters for describing the density function of the normal distribution.
Fig. 4. Results of measurements and calculations of BTDF
Fig. 5. Optimization procedure of the angular distribution of normal to the micrograins of a rough surface relief

Light & Engineering Vol. 27, No. 1
29
2. The second step involves setting up the test scene, generating a table function for the microfaces based on the initial parameters. After that, the dis-tribution of microfaces is added to the optional OP-TOS MicroRelief application [13], which generates the corresponding BSDF.
3. In the third step, the angular distribu-tion of the light intensity for the prepared sample is calculated.
4. Next, the optimizer compares the results of the calculation with the results of the measure-ments and calculates the root-mean-square devia-tion (RMS).
5. The next step is to analyze the deviation bet-ween the optimized and measured results in order to decide whether to continue or stop the optimiza-tion process.
5.1. If the desired deviation is not achieved, then the optimizer changes the density distribution para-meters of the normals and returns to step 2 to con-tinue the process.
5.2. Subsequently, if the deviation is acceptable, the final BSDF is generated using the “BSDF Gen-erator” tool of the Lumicept software package [14].
6. Finally, the optimizer constructs the charts of the measured BSDF of the sample and the cal-culated BSDF of the sample, taking into account the reconstructed BSDF of the rough surface of the sample.
An important feature of this method is that when the BSDF is reconstructed, the optimization param-eter is the distribution of the density of the normals to the surface microfaces. However, tabular deter-mination of the density distribution of normals is not suitable for most optimization tools, since mul-ti-parameter procedures require a lot of time for cal-culation. The most convenient representation of the distribution law is an analytic function with a mi-
Fig. 7. Previously achieved results of BSDF reconstruction
Fig. 6. General form of the Gaussian and Cauchy functions
nimum number of parameters. The experiments carried out by the authors made it possible to de-termine the two most suitable in this case types of basic functions: Gauss-shaped and Cauchy-shaped. For most cases, the Cauchy distribution gives a bet-ter result, although for some microreliefs the Gauss-ian approximation seems to be the best. In the aut-hors’ opinion, the Gaussian approximation gives good agreement with the BTDF measurements in zones with high transparency (at least from the point of view of the standard deviation between si-mulation and measurement results). Therefore, it is reasonable to use both types of functions in the op-timization process. The general form of the Gauss-ian and Cauchy functions is shown in Fig. 6. It is clearly seen that the Cauchy distribution is wid-er in the zones of distant angles. The parameter θ0, which determines the shift of the peak of the distri-bution along the axis of the angles, is rather formal, since in most cases the density distribution of the normals has a maximum at θ0 = 0. But this parame-ter is reserved for improved optimization.
Considering that the general tabular representa-tion of the normal distribution density function is not a good optimization solution, an alternative “hy-brid” solution was chosen. The base density func-tion of the distribution of normals can be given by Gauss-form or Cauchy-form, while some regions of the function can be replaced by a locally tabular function. A brief description of the algorithm can be presented as follows:
1. Suppose that the optimization procedure with an analytic function of the density distribution of the normals can not correspond to the BSDF in a re-gion close to the zero angle θ. This means that the density distribution of the normals in the region of

Light & Engineering Vol. 27, No. 1
30
zero angular deviation should be represented by a tabular function.
2. Then the optimizer adds several points to the tabular representation of the density of the distribu-tion of normals in this region and continues opti-mizing the mixed function. If the number of points added is not high, the optimization procedure can find a solution.
4. COMPARISON OF BSDF RECONSTRUCTION METHODS BASED ON THE DISTRIBUTION OF HEIGHTS AND BASED ON THE ANGULAR DISTRIBUTION OF THE NORMALS
To test the new method, several problematic samples were selected, presented in [15]. These samples required a complicated tuning procedure based on the filtration and scaling of the measured microreliefs, for some samples an artificially creat-ed relief was used. Previously achieved results are shown in Fig. 7.
The results of the BSDF reconstruction based on the Cauchy function are shown in Fig. 8.
The results of the BSDF reconstruction based on the Gaussian function are shown in Fig. 9.
The results of optimizing the density distribu-tion of the normals are in good agreement with the desired result (at least for the samples under study). In most cases, the Cauchy-form function gives ac-ceptable results, at least not worse than in the case of the measured microrelief [16]. The Gaussian dis-tribution function is also useful in some cases. All this allows us to conclude that accurate measure-
ments of the microrelief, in general, are not required to reconstruct the BSDF of a rough surface.
Using the OPTOS MicroRelief plug-in [13] al-lows us to exclude the BSDF Generator Lumicept [14] from the optimization procedure. It accelerates the optimization process since it does not require the generation of a BSDF at each optimization step, which requires considerable time for calculations.
An attempt to apply the tabular density func-tion of the angular distribution of normals as an op-timization parameter failed. Optimization of the multi-parameter function is a very time-consuming task and all the advantages caused by the free form of specifying the density of the distribution of nor-mals are nullified by the slowing down and the ge-neral divergence of the optimization procedure.
It is possible to observe a good agreement bet-ween the results of measurements and modelling for directions of incidence close to the normal (θ = 0), and an acceptable agreement of the results for other directions of incidence. In this paper, the results were shown only for BTDF. However, the optimi-zation procedure can also be applied for reflection. Usually, the optimization of the results of BTDF im-proves the results of the BRDF.
In addition, we simulated the construction of a photorealistic image of a plate with a rough sur-face. The appearance of the plate with the BSDF of a rough surface before optimization (i.e. when the measured profile was initially used) is shown in Fig. 10a. The shape of the plate with an opti-mized BSDF is shown in Fig. 10b.
The images shown in Fig. 10 were synthesized using a physically correct rendering based on the ray tracing method implemented in the Lumicept
Fig. 8. The results of the BSDF reconstruction based on the Cauchy function
Fig. 9. The results of the BSDF reconstruction based on the Gauss function

Light & Engineering Vol. 27, No. 1
31
software package [14]. The scene consists of a plate, on the outer surface of which is assigned a BSDF. The plate is placed above the chess substrate and is illuminated by a set of light sources, creating a com-plex diffuse illumination.
5. CONCLUSION
In conclusion, it can be noted that the method for optimizing the density of the angular distribu-tion of the normals for the reconstruction of the BSDF shows good agreement with the desired re-sult (at least within the framework of the samples under study). In most cases, the use of the Cauchy function as the basic function for optimizing the BSDF is more preferable and in some cases shows much better results of the BSDF reconstruction than the BSDF reconstruction method from the measured microrelief. In addition, an alternative function of optimizing the BSDF can be the Gaussian-shaped function, which in some cases can provide a hig-her rate of convergence of the optimized BSDF to the target value. This allows us to conclude that it is possible to exclude measurements of the mi-cro-profile in general for the exact reconstruction of the BSDF.
ACKNOWLEDGEMENT
This study was conducted with partial support of RFBR grants 16–01–00552 and 17–01–00363, financial support of leading universities of Russia (subsidy 074-U01), as well as by Integra Inc.
REFERENCES
1. Seylan, N., Ergun S., Öztürk A. BRDF Reconstruc-tion Using Compressive Sensing// 21st International Con-ference on Computer Graphics, Visualization and Com-puter Vision 2013, pp. 88–94.
2. Nielsen, J.B., Jensen, H.W., Ramamoorthi, R. On Optimal, Minimal BRDF Sampling for Reflectance Acquisition// ACM TOG 34(6), 2015, pp.1–11.
3. Doris Antensteiner, D., Ŝtolc, S. Full BRDF Re-construction Using CNNs from Partial Photometric Ste-reo-Light Field Data// Workshop on Light Fields for Com-puter Vision at ECCV-2017, pp. 13–21.
4. Lu, F., Chen, X., Sato, I., Sato, Y. SymPS: BRDF Symmetry Guided Photometric Stereo for Shape and Light Source Estimation // IEEE Transactions on Pattern Analysis and Machine Intelligence, Issue 99, pp.1–14.
5. Manmohan Chandraker, M., Bai, J., Ramamoorthi, R. On Differential Photometric Reconstruction for Un-known, Isotropic BRDFs”/ IEEE Transactions on Pattern Analysis and Machine Intelligence, 2013, Vol. 35, #12, pp.2941–2954.
6. Chuaa, S.Y., Wanga, X., Guoa, N., Tan, C.S. Per-formance of Range Gated Reconstruction: A Theoretical Analysis// Proc. of SPIE, Vol. 10250, pp.1–5.
7. Filip, J., Havlí, M., Vávra, R. Adaptive high-lights stencils for modelling of multi-axial BRDF ani-sotropy// The Visual Computer, 2017, Vol. 33, Issue 1, pp. 5–15.
8. Chen, C., Dong, Y., Peers, P., Zhang, J., Tong., X. Reflectance Scanning: Estimating Shading Frame and BRDF with Generalized Linear Light Sources// OOPS-LA ‘94.Vol. 5, Issue 4, Oct. 1994, pp. 67–71.
9. MERL BRDF database http://people.csail.mit.edu/wojciech/BRDFDatabase/
10. Matusik, W., Pfister, H., Brand, M., McMillan, L. A Data-Driven Reflectance model”// ACM Transactions on Graphics 22, 3(2003), pp.759–769.
11. Letunov, A.A., Barladian, B., Galaktionov, V.A., Ershov, S.V., Voloboy, A., Zueva, E.// Proc. 22nd Int. DAAAM Symp., pp. 1459 (2011).
12. Muracami Color Research Laboratory, http:// www.mcrl.co.jp/english/index.html
13. Voloboy, A.G., Galaktionov, V.A., Zhdanov, D. Technology of optical elements in computer mode-
Fig. 10. The appearance of the plate with the BSDF of a rough surface before (a) and after (b) optimization

Light & Engineering Vol. 27, No. 1
32
ling of optoelectronic devices // Information technology of CAD/CAM/CAE, 3, 2006, pp.46–56.
14. Lumicept – Hybrid Light Simulation Software, http://www.integra.jp/en
15. Zhdanov, D., Sokolov, V., Potemin, I., Voloboy, A., Galaktionov, V., Kirilov, N.// Opt. Rev. 2014, 21(5), p. 642.
16. Sokolov, V.G., Zhdanov D.D., Potemin, I.S., Garbul, A.A., Voloboy, A.G., Galaktionov, V.A., Kirilov N. Reconstruction of scattering properties of rough air-dielectric boundary // Optical Review.2016, 23(5), pp. 834–841.
Nikolai N. Bogdanov, an engineer. At present, he is a senior engineer of Inter RAO LED Systems JSC, a postgraduate student of the Chair “Technology of visualisation” of the ITMO University (St. Petersburg
State University of Information Technologies, Mechanics and Optics). His scientific interest field is illumination design
Andrei D. Zhdanov, an engineer, junior research worker of Scientific and Technical Computer Centre of IPM LLC, a postgraduate student of the Chair “Technology of visualisation” of the ITMO University. His
scientific interest fields are computer graphics and virtual prototyping
Dmitriy D. Zhdanov, Ph.D., graduated from the Leningrad Institute of Precise Mechanics and Optics in 1984. At present, he is a Head of the Chair “Technology of visualisation” of the ITMO University. His scientific
interests are: applied optics, computer graphics, lighting engineering
Igor S. Potyomin, Ph.D. graduated from the Leningrad Institute of Precise Mechanics and Optics in 1984. At present, he is a senior research associate of LLC Scientific and Technical Computer
Centre IPM and Associate Professor of the chair “Technology of visualisation” of the ITMO University. His scientific interests are applied optics, computer graphics, lighting engineering
Vadim G. Sokolov,Graduated from LITMO in 1994. At present, he is the research assistant of “STCC IPM” LLC. Research interests: computer graphics, applied optics, lighting engineering
Eugene Y. Denisov,Graduated from the Faculty of Computational Mathematics and Cybernetics of Lomonosov Moscow State University in 1995. At present, he is the research assistant of Keldysh Institute of Applied Mathematics (RAS)

33
Light & EngineeringVol. 27, No. 1, pp. 33–37, 2019
LIGHT DESIGN AND TEXTILES
Juri V. Nazarov and Violet V. Popova
National Institute of Design, Autonomous non-commercial organisation, Moscow, Russian Federation
E-mails: [email protected]; [email protected]
ABSTRACT
Innovation textile is a new and unusual product type combining information technologies with wide art opportunities. The article considers three types of innovation textiles selected using the function-al purpose principle: materials radiating light (elec-tro-fluorescence, light emitting diodes, including or-ganic and fibre optics), materials forming an image (LC screens, OLED, LCD) and materials with fluo-rescence effect.
A new cloth type named electronic textiles is a material, which conducts and at the same time consumes electric energy. It combined three for-merly independent spheres: textiles, electrical engi-neering and electronic engineering. Textile materi-als are the base, on which various electronic devices are mounted.
Keywords: electronic textiles, light, light emit-ting diodes, OLED, innovation textiles, lumines-cence, electroluminescence
1. LIGHT EMMITING MATERIALS ON BASIS OF ELECTROLUMINESCENCE, LEDS, OLEDS, AND FIBRE OPTICS
In development and use of light emitting mate-rials, their own priorities and leaders exist. One of the most widespread integral technologies is use of light emitting diodes. Attempts to use this techno-logy in producing “smart” textiles were made from the beginning of the 21st century. The most out-standing work in this format was carried out in 2009 by well-known British designers Francesca Rosel-
la and Ryan Genz of the GuteCircute London studio (2004). As a futuristic development, they created the well-known Galaxy Dress (Fig. 1).
An idea of English designers was to place 24 thousand light emitting diodes on the surface of a silk dress. Each flexible emitting element was ma-nually sewed on the textile warp. As a matter of fact, the dress was turned into a suit display. In or-der to scatter light uniformly, the designers used four layers of cloth consisting of chiffon and organ-za. A significant amount of light sources required a large number of special compact iPod batteries placed under the crinoline.
Another technological branch of light design is production of materials based on optical fibres. In 2008, in France near Paris, one more leading company in the field of development of fluores-cent materials and clothes was established. Begin-ning from the establishment date, it was named
Fig. 1. Galaxy Dress

Light & Engineering Vol. 27, No. 1
34
LumiGram. The range of the products manufactu-red by the company is very wide: there are dres-ses, house textiles, decorative clothes to decorate interiors, etc. A source of pride of this French com-pany is a cloth, which is produced according to an original luminous fabric technology (fluorescence cloth). At the daytime illumination, luminous fab-ric has a standard image. At the moment, when il-lumination level decreases, decorative properties of this unusual cloth are fully shown. This effect is based on a combination of standard threads and of optical fibres. The light effects are implemented us-ing light emitting diodes operating by means of tiny controllers and chips. An adjusting system switches on and off the glow mode, as well as changes its in-tensity and colour. The cloth obtains electric energy due to replaceable compact U-3–5B batteries, which capacity is sufficient at least for 12 hours of conti-nuous operation. The manufacturers ensure consu-mers a continuous LED operation during 50 thou-sand hours. The luminous fabric technology allows the cloth uniform and soft glowing in the darkness, which makes the material attractive for fashion de-signers and for developers of interiors (Fig. 2).
The products can be entirely cut off of the flu-orescence cloth, or light fibres can be mounted as fragments. In doing so, the composite materials
are easily washed and cleaned, which is important in case of their intensive operation.
Prof. Ying Gao, creator of dresses and profes-sor of design at the University of Province of Que-bec (UQAM, Montreal, Canada), has developed two unique dresses rotating around the figures and shining when someone looks at them. The devel-opers used a sensor system responding to human eyes and at the same time controlling the dress il-luminance level. A complex cut off of the products made of organza makes it possible to place behind the cloth top layer compact electric motors, which change geometry of the dresses when supplying a correspondent signal from the sensor. One dress is co vered with fibres of a photo fluorescent thread bringing to mind a cloth of ruche type. From the other side of the products are fluorescence threads forming a basic layer divided into separate tapes meeting at the top part of the dresses (Fig. 3).
2. MATERIALS FORMING AN IMAGE: LC SCREENS, OLED, LCD, ELECTROLUMINESCENT MATERIALS
Royal Philips Electronics concern is an undis-puted leader on innovation developments in its field. The concern has established a profile compa-
Fig. 2. Textiles of LumiGram Company
Fig. 3. A “catching sights” dress

Light & Engineering Vol. 27, No. 1
35
ny Philips Design directly connected with art-and-design developments. In 2009, specialists of Philips Design developed an original Lumalive techno-logy, which makes it possible to bring various lu-minescent images to the cloth surface. This effect is reached due to flexible LED displays integrat-ed into the textiles structure. Materials created ac-cording to the Lumalive technology allow applying them to manufacture dresses, furniture, house tex-tiles and accessories. Due to connection with mi-croprocessors, the cloth surface becomes dynamic, changes image intensity and colour saturation.
Developers of Philips Design Company in 2007 under the leadership of Clive van Heerden, be-ing the Skin project manager and senior innova-tion chief officer of Philips Design in Eindhoven, developed a conceptual project of an “emotional” dress (Fig. 4).
The material, of which a prototype was manu-factured, was a two-layer cloth. The inside product layer was filled with special controllers tracking emotional state of the user. A fluorescence dyna-mic image was brought to the second layer surface using flexible LED displays. The projection na-
ture changed according to the dress owner’s mood fluctuations.
In order to give a concert dress not only represen-tative but also information properties, Cute Circuit British company specialising in creation of futuris-tic electronic dresses, developed in 2012 a unique dress under the Twitter brand for a North American singer Nichole Sherzinger (Fig. 5).
Again, as well as in the Galaxy Dress case, the designers built in a set of light emitting diodes into the French chiffon cloth scenic suit. In doing so, they connected light devices with the Swarovski crystals. By means of the Bluetooth technology, greetings from Nicole addressed to admirers of her art of any part of the world were brought to the dress surface. Then the cloth was turned into a me-dia screen again, creating an additional spectacular effect during the singer’s shows.
Besides the Cute Circuit London studio and the well-known Philips Design, several progressive cre-ative groups engaged in digital design operate in the world. A British designer Nancy Tilbury being the
Fig. 4. The Bubble dress
Fig. 5.The Twitter dress
Fig.6. A fragment of the designer Rami Kadi collection

Light & Engineering Vol. 27, No. 1
36
founder of Studio XO and Ben Males, a program-mer are among them.
3. MATERIALS WITH PHOSPHOR EFFECT
Rami Kadi is a modern couturier captured by in-novation ideas. Using his unique products, he con-structs bridges between cultures so that the East and the West would meet. Due to his collections, he pays a tribute of respect to the “handwork”, which he es-pecially likes. His another success is connected with a demonstration of his original collection of evening women’s dresses “Autumn/winter of 2015–2016” at the Haute Couture week in Paris. The cloth of the products was covered from top with a phosphor lay-er, which allowed a distinct glowing in the darkness of the amazing pattern applied on the dress surface under the influence of ultraviolet lamps (Fig. 6).
When commenting his own products, desig ner noticed that in this collec-tion he tried to overcome his children’s fear of darkness and importunate insects. As a result, the author managed to achieve an art effect com-parable with bio-fluores-cence of glow-worms.
Professors of the lead-ing Japanese university of Kyoto city (Kyoto Univer-sity) were also interested in the studies in the phos-phor material field. Tet-suya Iizuka and Tosika Ta-
mura, who were scientists of the Technology Institute be-ing a part of the Kyoto Uni-versity educational holding, have bred an unusual class of silkworm larva generating a special silk thread glowing as a phosphor in the dark-ness (Fig. 7).
The glow shades are va-rious: orange, green, blue, violet and white. This ef-fect was obtained due to an upgrade of individuals of mulberry silkworm, which were implanted with special
genes excreting fluorescent components. Accord-ing to some forecasts, such silk clothes will be ca-pable to keep their fluorescent properties up to three years. The problem of the scientists for the next pe-riod is to give the silk cloth a sa turated shade at the day-time light and to increase heat resistance of the natural cloth after a special treatment. This innova-tion tends to an expansion of the sphere of its prac-tical use.
The Stone Island, which is an Italian brand be-ing a leader in the innovation technology market, has manufactured jackets glowing in the darkness (Fig. 8).
For the first time, such products were made in 2013, and they are manufactured until now. For their production, membrane clothes are used, which accumulate light energy at the day time and glow in the darkness. Technologists have laminated the material from within and connected it with a ny-lon mesh.
Fig.8. A fluorescent demi-season jacket
Fig.7.The fluores-cent silk dresses

Light & Engineering Vol. 27, No. 1
37
A specific technology under the Teflon brand al-lows treating the cloth cotton warp using a special method. After that, it becomes air-tight, water-repel-lent and highly resistant to mechanical loads. Due to a light warp, the product has a small mass and is almost indestructible.
Technological innovations connected with light-ing engineering and electronics became a noticea-ble phenomenon in development of design and pro-duction of textile products at the end of the 20th and at the beginning of the 21st centuries. By efforts of some designers and design companies, topical tech-nology developments and technologies are success-fully integrated with modern products of consumer industry and generate profit for the companies pro-ducing attractive innovation products.
REFERENCES
1. Braddock S. E. O’Mahony M. Techno Textiles: Revolutionary Fabrics for Fashion and Design / Thames & Hudson, 1999, 192 p.: il.
2. Clarke S. Textile Design / Laurence King Publish-ers, 2011, 224 p.: il.
3. McQuaid M. Extreme Textiles: Designing for High Performance / Thames & Hudson, 2005, 224 p.: il.
4. Philips [official site]. URL: http://www.philips.com (Date of the application: 9.01.2011).
5. Luminex [official site]. URL: http://www.luminex.ru.
Juri V. Nazarov, Prof., Dr. of arts, graduated from Moscow State Stroganov School of Design and Applied Arts in 1972. At present, he is the President of National Design Institute, corresponding member of Russian Academy of Arts, Honorary President of Russia Designers Association, Laureate of the Russian Federation State Prize, Distinguished art worker of Russian Federation
Violet V. Popova, Ph.D. in Art History, Master Degree in design, at present, she is a teacher at the A.N. Kosygin RSU college, Moscow

38
Light & EngineeringVol. 27, No. 1, pp. 38–45, 2019
A PILOT STUDY ASSESSING SHORT-TERM CHROMATIC ADAPTATION PREFERENCES FOR CORRELATED COLOUR
TEMPERATURE IN INDIA
Amardeep M. Dugar1 and Dashak Agarwal 2
1Lighting Research & Design, Chennai, India 2Thea Light Works, Hyderabad, India
Email: [email protected]
ABSTRACT
This small-scale pilot study investigates peoples’ short-term chromatic adaptation preferences for correlated colour temperature (CCT) within the cul-tural context of India. White tone CCT preferences were investigated using a spectrally tuneable LED lighting system. A mock-up room was built and illu-minated with two LED luminaires. Each LED lumi-naire has 216 clusters and each cluster comprising three LED with CCT equal respectively to 3000 K, 4000 K and 6500 K (total 648 LEDs per luminaire). User preference studies in a generic environment were conducted with 50 Indian subjects, where each subject performed generic everyday activities, such as reading, watching TV, eating and relaxing, while being totally immersed in three different scenes of 3000 K, 4000 K and 6500 K. The study shows 6500 K is the least preferred CCT, and 4000 K is pre-ferred for task-oriented activities such as reading and eating. Furthermore, subjects are unable to dif-ferentiate between 3000 K and 4000 K while per-forming non-task-oriented activities such as relax-ing and watching TV.
Keywords: correlated colour temperature (CCT), LED lighting, short-term adaptation, culture
1. INTRODUCTION
This small-scale pilot study aims to provide guidance for improved user acceptance of LED pro-ducts by researching peoples’ short-term chromatic
adaptation preferences for the correlated colour tem-perature of illumination. CCT is defined as the tem-perature of the Planck’s radiator having the chro-maticity nearest the chromaticity associated with the spectral power distribution (SPD) of the light source in a specific colour space, and describes the appearance of illumination along a reddish-yellow-ish-white to bluish-white dimension [1]. Chromatic adaptation is defined as the human visual system’s ability to adjust to changes in illumination to pre-serve the colour appearance of objects, and is re-sponsible for the stable appearance of object co-lours against the spectral changes of the illuminant [2]. Short-term chromatic adaptation results from an exposure of 15 minutes or less to a chromatic light, with the adaptation effect decaying within seconds or minutes [3]. Research [4] reveals that chromatic adaptation at constant luminance is 90 % complete after approximately 60 seconds of exposure. The present study focuses on the perceived white tone CCT preferences of the illumination itself for per-forming generic everyday activities: reading, watch-ing TV, eating and relaxing, instead of the colour appearances of objects under the illumination.
The objective of this study is to assess whether culture plays a role in people’s short-term chroma-tic adaptation preferences for CCT. Cross-culture studies [5–7] indicate the need for light sources that have the ability to dynamically tune their colour quality of illumination as they can facilitate well-being of people, both within a single cultural group and within different cultural groups. As one of the

Light & Engineering Vol. 27, No. 1
39
determinants for the colour quality of illumination, the CCT of light sources plays an imperative role in addressing both psychological and physiological functions [8]. Short-term chromatic adaptation pre-ferences for CCT are emphasised in this study be-cause research [9–11] reveals that once people are fully adapted to the illumination conditions, CCT in the range (2500–6500) K has little effect on peo-ple’s subjective preferences of illumination.
Current developments in LED-based light-ing systems have enabled the CCTs of illumina-tion to be adapted to suit people’s different needs [12]. India is poised to emerge as the largest mar-ket for LED-based lighting systems with its go-vernment-led schemes for replacing all inefficient lamps by LEDs [13]. Its state-run nodal agency En-ergy Efficient Service Ltd (EESL) responsible for conversion from older technology (compact fluo-rescent or incandescent) to LED is committed to its target of selling 770 million LED lamps by 2018. The EESL’s distribution scheme titled Unnat Jyo-ti by Affordable Lamps for All (UJALA) played an important role in lowering the retail price of 9 watt LED lamps to as low as US $1.00 per unit to en-courage consumers to opt for these energy efficient lamps. Considering the fact that the UJALA scheme doles out LED lamps with a static CCT of 6500 K, the study uses India as the cross-cultural test-bed for sampling population to determine, whether 6500 K is the actual preference of Indian population. The present study, however, limits its scope to 3000 K, 4000 K and 6500 K, as these are the three most readily available CCTs at the Indian market.
2. METHODS
The overall research strategy follows a re-peated-measures experimental study design, with a cross-sectional design format where the sample population is tested only once to gather and com-pare responses. A total of 50 subjects in smaller groups of three or four were presented with an ex-perimental set-up and expected to complete a ques-tionnaire. While 50 subjects is too small a sample size to be representative of the entire Indian popu-lation, this pilot study first aims to understand its impact by conducting it with a population of a sin-gular Indian city, before conducting similar studies in other cities. The experiment was conducted in the south Indian city of Hyderabad, with subjects sam-pled from this city.
Fig.1. Experimental room with tuneable LED lighting system generating three scenes of CCTs 3000 K, 4000 K
and 6500 K respectively at an average constant illuminance of 300 lx at the table-top
Literature [11] reveals that specification of CCT alone does not pinpoint the precise SPD used in a study as many different SPDs can have the same CCT. Therefore, colour rendering index (CRI) was also considered along with CCT for specifying the test luminaires in this study, as there are only two widely used metrics in India for differentiating the colour quality of illumination. CRI is defined as the effect of a light source on the colour appear-ance of objects by conscious or subconscious com-parison with their colour appearance under a refe-rence light source, and is determined by the SPDs of the respective light sources [14]. The physical set-up consisted of an experimental room illumi-nated by a tuneable LED lighting system generat-ing three scenes of 3000 K, 4000 K and 6500 K at a CRI of 80 and average illuminance of 300 lx at the table-top level as depicted in Fig. 1. The CCT and CRI ratings are based on the manufacturers’ data available for the LED lighting system. The en-tire experiment lasted for approximately 9 hours spanning over two days with each group being al-lotted approximately 40 minutes for the experiment.
2.1. Physical Set-Up
The experiment was conducted in a confined room without a window as external source of light inside the office of Thea Light Works in Hyderabad. The dimension of the room was 3.0×2.9 ×3.0 m (l × b × h) where the room was being illuminated by two LED luminaires (L) installed in the grid ceil-ing as per the layout depicted in Fig. 2. The room

Light & Engineering Vol. 27, No. 1
40
temperature was maintained at 24 °C with the help of a wall-mounted air-conditioning unit. The room was equipped and furnished to provide a space that allows subjects to read, watch TV, eat and relax. A rectangular light pine-coloured table was placed adjoining the wall opposite the entrance door along with four office chairs. The table height was 0.7 m. A wall-mounted flat 24” LCD TV screen was also set on the adjoining wall, directly above the table. The monitor’s settings (brightness, colour temperature, gamma, saturation, hue and grain) were maintained constant throughout the experiment. There was also a bookshelf integrated with the wall adjacent to the door for storing all the experiment-related materi-als such as coloured magazines and eatables. Dur-ing the experiment, printed questionnaires and pens were placed on the table. The room surfaces reflec-tance are presented in Table 1.
2.2. Luminaires
Two ceiling-recessed LED luminaires with di-mensions 598 mm × 598 mm × 86 mm each, were custom-designed to illuminate the room. The lumi-naires and its compatible control system were built with the help of an LED luminaire manufacturer, using four main components:
• LED Panels – 3-channel Panels fitted with Edison LEDs [PLCC2835 0.2W LC CRI80];
• Driver – Osram Optotronic Constant Voltage DALI Dimmable Driver [OTi DALI75/220–240/24 1–4 CH];
• Controller – Philips LightMaster Modular 4-Channel Controller [PDLPC416FR-KNX];
• IR Receiver – Busch-Jaeger Triton 3/6-fach MF/IR [320/30–24G].
Each luminaire comprised six LED panels; each LED panel comprised 36 LED clusters; each LED cluster comprised three different LED types of CCTs 3000 K, 4000 K and 6500 K with a constant 80 CRI as per the LED manufacturer’s data i.e. 648 LEDs in total as depicted in Fig. 3. A plexiglas dif-fuser, which blended the light to provide homoge-neous luminance of the luminaire opening, covered the LED panels. The variations in CCT and CRI oc-curring due to inter-reflections within the luminaire and diffusion through the plexiglas were not ta-ken into consideration for this study. Three drivers drove each luminaire where LEDs of identical CCT were on a single channel thereby enabling each CCT in the luminaire to be controlled by one driver. The two luminaires and its six drivers were connec-ted to a controller, thus making it possible to control the CCT and illuminance of the luminaires with an IR receiver.
2.3. Sampling Population
Table 1. Surfaces Reflectance of the Room
Room surface Material Colour Reflectance
Ceiling Acoustic tile Matt black 0.05
Wall 1 Plaster Painter’s grey 0.28
Walls 2, 3 Chip board Painter’s white 0.82
Floor Local stone Matt black 0.05
Table Wooden Pine 0.45
Shelf Wooden Matt white 0.85
Chairs (4 Nos.) Plastic White/Black/Blue 0.85/0.10/0.50
LCD screen (off) Liquid crystal Black 0.12
Fig.2. Experimental room layout where “L” represents the LED panel integrated within the grid ceiling

Light & Engineering Vol. 27, No. 1
41
As the intention of this experiment was to ob-tain feedback from a wide range of subjects from India with different ages, gender and socio-eco-nomic backgrounds, a simple random sampling me-thod was used where a generic invitation applicable to a general population was prepared. Additional-ly, by ensuring that all participants were selected in a random fashion and given an identical treat-ment, the influence of any form of individual cha-racteristics was eliminated. The 50 subjects who agreed to participate in the experiments included members of the general public as well as staff from the commercial building premises where the expe-riment was conducted. Table 2 lists a brief demo-graphic analysis of the 50 subjects. Majority of the subjects are between the age group of 25–34 (50 %),
have a monthly income between INR 5,000–24,000 (42 %), follow Hinduism (84 %), have visited Mumbai (72 %) in comparison to all the other major cities in India, have travelled outside India (54 %), live in urban areas [82 %], and have completed graduation (78 %).
2.4. Experimental Procedure
A questionnaire was designed, which first asked the subjects to visually experience the three scenes with 3000 K, 4000 K and 6500 K by being com-pletely immersed in them, before identifying any variability in the scenes. The scenes with the diffe-rent CCTs were presented to the subjects in various different orders in order to counterbalance any car-ry-over or ordering effects by slowly interchanging them a couple of times. As the intention was to ob-tain short-term chromatic adaptation preferences, the time allotted to experience each scene was short, approximately 90 seconds, to ensure that subjects’ eyes are not fully adapted to each CCT. In case of any perceptible variability in the three scenes, the subjects were asked to name this difference. Sub-jects were then asked which of these CCTs were they previously aware of in terms of their availa-bility in the local market: ‘1 – Not aware’ and ‘2 –
Table 2. Demographic Analysis of the 50 Subjects from Hyderabad
Age Group16–24 25–34 35–44 45–54 55 & above
7 25 8 4 6
Monthly Income[INR]
Below 5,000 5,000–24,000 25,000–49,000 50,000–74,000 75,000 & above
02 21 11 7 9
ReligionChristian Hindu Muslim Jain Sikh
4 42 2 1 1
Travel –Inside India
Bangalore Chennai Delhi Kolkata Mumbai
33 27 30 20 36
Travel – Outside India
0 visits 1 visits 2 visits 3 visits 4 visits
23 7 4 3 13
GenderMale Female
35 15
Area of ResidenceUrban Suburban
41 9
EducationHigh school or below Graduate or above
11 39
Fig.3. Ceiling-recessed luminaire with six LED panels co-vered by a Plexiglas diffuser for homogenous luminance

Light & Engineering Vol. 27, No. 1
42
Aware.’ Subjects were finally asked to list areas, buildings or localities, which according to them were the most suitable applications for these CCTs.
Subjects were then asked to perform four acti-vities of reading, watching TV, eating and relax-ing in the three scenes, and rate their preference of each CCT for performing these activities under the categories: ‘1 – Not Appropriate’, ‘2 – Somewhat Appropriate’ and ‘3 – Appropriate’. The time allot-ted for each activity was approximately ten minu-tes with each of the three CCTs being interchanged after approximately 90 seconds. Subjects were also given the freedom to rate their preferences from the questionnaire at any time during these ten minu-
tes allotted for each activity. For reading, subjects were provided with magazines. Magazines were the preferred reading material considering their variety in content presentation through font sizes, colour-ed pictures, etc. For watching TV, a video clip from the national geography channel was played for the subjects. For eating, subjects were offered fruits and snacks. For relaxing, subjects had the free will to re-lax in whichever manner that suits their comfort. The subjects performing various activities in the ex-perimental room are presented in Fig. 4.
3. RESULTS AND ANALYSIS
Statistical Package for Social Sciences (SPSS) for Windows was used to perform nonparamet-ric tests to calculate the percentages of responses, the mean ranks, p-values and significance levels. Cochran’s Q test and percentages of responses were used for calculating the statistical significance of tests that involved binary response variables. Fried-man’s test and mean ranks were used for all other tests, which involved more than two response vari-ables. Wilcoxon’s test was used for a pairwise com-parison of the three CCTs. The qualitative data was coded by the method of systematic observation, where careful observation of one or more specific behaviours in a particular setting was recorded.
All 50 subjects perceived a difference in the three scenes; 30 related this difference to colour and 20 related it to brightness. Majority (90 %) of the 20 subjects who related the perceived difference in the scenes to brightness were from the income groups of INR 24,000 and below or an education level of high school and below. Tables 3 and 4 list the de-scriptive and inferential statistics respectively ob-tained from the sample population. Table 5 lists the pairwise comparisons of the three CCTs to as-sess which CCTs are different from each other. Sub-
Fig.4. Subjects performing the different activities of read-ing, watching TV, eating and relaxing while being com-
pletely immersed in the three different CCT
Table 3. Summary of Means, Standard Deviations and Minimum-Maximum Range for the Three CCTs
Activity3000 K 4000 K 6500 K
M SD Min-Max M SD Min-Max M SD Min-Max
Awareness 1.18 0.388 1–2 1.22 0.418 1–2 1.26 0.443 1–2
Reading 1.80 0.756 1–3 2.48 0.677 1–3 2.22 0.815 1–3
Watching TV 2.26 0.828 1–3 2.24 0.657 1–3 1.78 0.815 1–3
Eating 2.16 0.817 1–3 2.34 0.745 1–3 1.86 0.833 1–3
Relaxing 2.44 0.861 1–3 1.84 0.734 1–3 1.66 0.848 1–3

Light & Engineering Vol. 27, No. 1
43
jects were more aware about the availability of 3000 K in the market as it received the highest percent-age of favourable response. Subjects preferred 4000 K for reading and eating as it received the high-est mean rank. Although subjects did not perceive any difference between 3000 K and 4000 K while watching TV and relaxing as p > 0.05 for their re-spective pairwise comparisons, both CCTs received similarly high mean ranks for these two activities. Table 6 lists the subjects’ preferences of these CCTs for possible real-life applications in different are-as, buildings or localities. All 50 subjects have tra-velled to at least one other city in India, while 27 of them have travelled outside India. The sample size was not large enough to draw any other relationship of statistical significance with respect to age, gender or socio-economic backgrounds.
While majority of the subjects are aware about the availability of the three different CCTs for LED luminaires in India, 40 % of the subjects were not able to relate this difference to the colour quality of illumination. For task-oriented activities such as reading and eating, 4000 K is considered the most appropriate. Maximum numbers of subjects asso-ciate 4000 K for task-oriented applications such as classrooms, offices, workspaces and kitchens. How-ever, 3000 K is considered the least appropriate for
reading, and 6500 K is considered the least appro-priate for eating. Maximum numbers of subjects as-sociate 3000 K for applications such as restaurants, bars or hotels; and 6500 K with applications such as hospitals and supermarkets as shown in the ap-plication survey. For non-task-oriented activities such as watching TV and relaxing both 3000 K and 4000 K are considered almost equally more appro-priate than 6500 K. Overall, the study reveals that 4000 K and 6500 K are the most and least preferred CCTs respectively.
4. DISCUSSIONS
Literature reviews of previous cross-cultural stu-dies on the preference of the colour appearance of objects under LED illumination of different CCT reveal mixed results. A study [6] on Chinese and American observers living in the US reports that: for very familiar objects (fruits and vegetables) and paintings, no cultural differences were found; for less familiar or unfamiliar paintings, cultural diffe-rences were found depending on the content; Ame-rican observers exhibited noticeably wider differen-ces. A similar study [7] on Chinese and European observers living in Germany reports that: Chinese women prefer warm white CCT (2700–3500) K for
Table 4. Percentages of Responses and Mean Ranks for the Three CCT
Activity3000 K 4000 K 6500 K
P Cochran’s Q[df=2]Aware % [Not Aware %]
Awareness 82 % [18 %] 78 % [22 %] 74 % [26 %] 0.050 6.00
Mean Ranks Χ2 [df=2]
Reading 1.45 2.47 2.08 <0.001 51.94
Watching TV 2.25 2.22 1.53 <0.001 36.87
Eating 2.06 2.33 1.61 <0.001 36.75
Relaxing 2.25 2.22 1.53 <0.001 36.87
Table 5. Pairwise Comparisons of Preferences in the Three CCTs
Activity(3000–4000) K (3000–6500) K (4000–6500) K
Z p Z p Z p
Reading –5.831 <0.001 –4.583 <0.001 –3.606 <0.001
Watching TV –0.277 0.782 –4.899 <0.001 –4.796 <0.001
Eating –3.000 0.003 –3.873 <0.001 –4.899 <0.001
Relaxing –0.277 0.782 –4.899 <0.001 –4.796 <0.001

Light & Engineering Vol. 27, No. 1
44
reddish objects in contrast to Chinese men and Eu-ropeans; a general preference of 4000 K (in cer-tain cases up to 5000 K) could be observed for the bluish and colourful combination than for the red-dish objects; Europeans do not prefer warm white (2700–3500) K for bluish and colourful objects. Four studies that have independently experimented with interchangeable CCT in office lighting envi-ronments for workers in Asia [8,15,16] and Europe [12] report a similar result that 4000 K is the most comfortable and most preferred CCT than 3000 K and 6500 K. A study [17] on LED office lighting that experimented with Africans, Asians and Euro-peans living in Finland reports that Europeans pre-fer a lit environment under CCT 4000 K, while Af-ricans and Asians preference between 4000 K and 5000 K depends upon illuminance levels.
Relating the results of these previous cross-cul-tural studies with this study has led to the following observations:
• Educational and economic backgrounds might play a role in relating the perceived chromatic dif-ferences in illumination to colour quality or more precisely to CCT. Majority of the subjects who re-lated the perceived differences between the three scenes to brightness instead of colour were either from a lower income group or lower educational background.
• Travelling and exposure to different cultures might play a role in influencing people’s preferen-ces and associations with a particular CCT. The preference of 4000 K for eating, while an associ-ation of 3000 K with eating places like restaurants and hotels can be accounted to the subjects’ travel experiences and exposure to fine dining places illu-minated with warmer CCTs.
• A CCT of 4000 K seems to be universally acceptable across most cultures for familiar of-
fice-oriented activities. The preference of 4000 K for a task-oriented activity like reading supports to a certain extent the results of the previous stu-dies [8,12,15–17] on office lighting. This may also explain why a CCT of 3000K is considered un-suitable for an office-oriented activity like reading as people relate it more to an environment condu-cive for non-task-oriented activities like watching TV or relaxing.
• Differences of up to 1000 K at the reddish-yel-lowish-white dimension of the CCT are not notice-able while performing non-task-oriented activities. The subjects’ inability to report any difference bet-ween 3000 K and 4000 K was only while perform-ing the non-task-oriented activities like relaxing or watching TV.
• While the present study did not consider the impact of different skin tones on CCT preferen-ces, it certainly is a case in point for future research considering the various differences in skin tones within the Indian population. Research reveals [18] that people are very sensitive to CCT preferences when their skin is used as a target of observation.
5. CONCLUSIONS
Two broad conclusions can be drawn from the results of this study. First, the people of Hydera-bad have a general preference for 4000K while per-forming most activities and tasks. Second, the go-vernment-led UJALA scheme for distributing LED lamps at subsidized rates needs to establish people’s preferences for CCT before implementation. The fact that people of Hyderabad do not have much of a preference for 6500 K provides sufficient evidence to disagree with the UJALA scheme. The practical applications of this study include areas where the choice of CCT has an impact on the immediate entry
Table 6. CCT Preferences for Different Applications
Area/Building/LocalityC
lass
room
Gar
den
Hos
pita
l
Indu
stria
l W
orks
hop/
War
ehou
se
Kitc
hen
Offi
ce/
Wor
kspa
ce
Plac
e of
W
orsh
ip
Play
grou
nd/
Stad
ium
Res
taur
ant/
Bar
/Hot
el
Ret
ail S
tore
/Sh
owro
om
Stre
et/P
ath-
way
Supe
rmar
ket
3000K 4 23 5 7 9 5 20 6 33 18 20 6
4000K 26 3 19 14 19 20 6 6 6 12 3 12
6500K 11 9 25 14 11 14 7 18 5 13 11 21

Light & Engineering Vol. 27, No. 1
45
to buildings is important, such as in retail and hos-pitality lighting. The results of this study can also be practically used by the UJALA scheme to reas-sess their decision of doling out 6500 K lamps. The answer to the overarching question whether culture plays any significant role in people’s preferences for CCT requires further investigation and valida-tion with similar experiments conducted across dif-ferent cities in India using larger samples sizes.
REFERENCES
1. CIE. 17–258 correlated colour temperature [Tcp] [Internet]. e-ILV. [cited 2017 Jul 26]. Available from: http://eilv.cie.co.at/term/258
2. CIE. 17–140 chromatic adaptation. e-ILV.3. Belmore SC, Shevell SK. Very-long-term and
short-term chromatic adaptation: Are their influences cu-mulative? Vision Res [Internet]. 2011;51(3):362–266. Available from: https://www.ncbi.nlm.nih.gov/pmc/arti-cles/PMC3025050/pdf/nihms262722.pdf
4. Fairchild MD, Reniff L. Time course of chromatic adaptation for color appearance judgements. J Opt Soc Am A. 1995;12:824–33.
5. Kuller R, Ballal S, Laike T, Mikellides B, Tonel-lo G. The impact of light and colour on psychological mood: a cross-cultural study of indoor work environ-ments. Ergonomics. 2006;49:1496–507.
6. Liu A, Tuzikas A, Žukauskas A, Vaicekauskas R, Vitta P, Shur M. Cultural Preferences to Color Quality of Illumination of Different Objects. IEEE Photonics J [Internet]. 2013;5(4). Available from: http://ieeexplore.ieee.org/stamp/stamp.jsp?arnumber=6583259
7. Bodrogi P, Khanh TQ, Stojanovic D, Lin Y. Inter-cultural colour temperature preference of Chinese and Eu-ropean subjects living in Germany. Light & Engineering. Moscow, RUSSIA; 2016;24(1):8–11.
8. Shamsul BMT, Sia CC, Ng YG, Karmegan K. Ef-fects of light’s colour temperatures on visual comfort le-vel, task performances, and alertness among students. Am J Public Heal Res. 2013;1(7):159–165.
9. Davis RG, Ginthner DN. Correlated color tempe-rature, illuminance level and the Kruithof curve. J Illum Eng Soc. 1990;27–38.
10. Boyce PR, Cuttle C. Effect of correlated colour temperature on the perception of interiors and colour dis-crimination. Light Res Technol. 1990;22(1):19–36.
11. Fotios S. A Revised Kruithof Graph Based on Em-pirical Data. LEUKOS. 2017;13(1):3–17.
12. Dangol R, Islam M, Hyvarinen M, Bhushal P, Pu-olakka M, Halonen L. User acceptance studies for LED office lighting: Preference, naturalness and colourfulness. Light Res Technol. 2015;47:36–53.
13. Dutta S. India headed for top slot in global LED bulb market. The Times of India [Internet]. 2016 Apr 21;
Amardeep M. Dugar, Ph.D., is a trained architect and founding principal of Lighting Research & Design. After completing a Masters degree in Architectural Lighting from University of Wismar/
Germany, he pursued a Ph.D. from Victoria University of Wellington/New Zealand to solidify his academic and professional leadership role into a career at a higher level
Dashak Agarwal, M.D. is a founding partner of Thea Light Works, a total enterprise architectural lighting company in India. He completed his Bachelors degree in Logistics Management
from Fisher College of Business at The Ohio State University/USA and Masters Degree in Architectural Lighting from the University of Wismar/Germany
Available from: http://timesofindia.indiatimes.com/busi-ness/india-business/India-headed-for-top-slot-in-global-LED-bulb-market/articleshow/51918389.cms
14. CIE. 17–222 colour rendering index [R] [Inter-net]. e-ILV. [cited 2017 Jul 26]. Available from: http://eilv.cie.co.at/term/222
15. Lin RF, Chou C, Wang YT, Tu HW. Effects of LED color temperature on office workers. In: 2nd Southeast Asian Network of Ergonomics Societies Con-ference. Langkawi, MALAYSIA; 2012.
16. Kang M, Chang JD, Yoon Y, Kim S. Determining occupant-friendly lighting environments for the improve-ment of visual perception. In: ICSDEC2012: Develop-ing the Frontier of Sustainable Design, Engineering, and Construction. Fort Worth, TX, USA; 2013. p. 937–944.
17. Baniya RR, Tetri E, Halonen L. A study of pre-ferred illuminance and correlated colour temperature for LED office lighting. Light & Eng. 2015; V.23, #3, pp. 39–47.
18. Quellman EM, Boyce PR. The light source color preferences of people of different skin tones. J Illum Eng Soc. 2002;31:109–18.

46
Light & EngineeringVol. 27, No. 1, pp. 46–50, 2019
DEVELOPMENT OF A MICROCONTROLLER BASED EMERGENCY LIGHTING SYSTEM WITH SMOKE DETECTION AND MOBILE
COMMUNICATION FACILITIES
Shibabrata Mukherjee1, Parthasarathi Satvaya2, and Saswati Mazumdar3
1 Jadavpur University, Kolkata, India 2 School of Illumination Science Engineering & Design, Jadavpur University, Kolkata, India
3Electrical Engineering Department, Jadavpur University, Kolkata, India E-mail: [email protected]
ABSTRACT
This paper describes a microcontroller based emergency lighting system, which can early de-tect fire and send the alarm message through a mo-bile network. This is achieved via smoke and gas detector technology added with integrated mi-crocontroller, mobile communication and a LED emergency light. First five Minutes of fire is more important than last five hours [1]. Hence, it is im-portant to have early detection of fire and start fire fighting in its inception. In many hazardous areas where flammable materials are handled, any leak or spillage may give rise to an explosive atmos-phere. In this situation, early detection of leaking gas or smoke plays an important role in reducing fire deaths and injuries. In fact, immediately after detection of fire, fire fighting should be started by means of portable fire extinguishers or by informing the fire brigade. This developed system can initiate these functions by detecting the fire hazard, estab-lishing the communication to dwellers and turning on the emergency light to show the exit route.
Keywords: emergency light, escape route, gas and smoke sensor, hazardous area, mobile communication
1. INTRODUCTION
The combined smoke detector system with emer-gency lighting and communication system can save
lives if there is a fire at home or any official building or cinema hall. Smoke spreads very fast and power cuts out immediately; this needs a smoke alarm, and an emergency light to show the exit route. Primary purpose of detection system is to respond as quick-ly as possible and transform the responses into an automatic alarm, SMS alert and immediately turn on the emergency light to evacuate the premises, moving people to a place safely or allowing impor-tant documents to be moved to a safety zone [2]. In-stallation of a battery backed emergency light with relay technology is used here to switch on the emer-gency light. This system can detect smoke and dif-ferent gas leakage like LPG, methane, butane or any such petroleum based gaseous substance. It sends the SMS alert in hazardous situation, so that peo-ple can evacuate easily with the help of emergency light. This system is easy to install and very simple to operation. Its longer life makes the system rela-tively more reliable and compact. This system has been developed in Illumination Engineering Labo-ratory of Jadavpur University.
2. HARDWARE COMPONENTS REQUIRED
In this system, the following components are mainly required:
a) Gas and smoke sensor (MQ2) is used for de-tection of smoke and gas; b) Microcontroller board is used for controlling the whole system; c) GSM

Light & Engineering Vol. 27, No. 1
47
Module is used for mobile communication; d) 5V Relay is used for switching the emergency light;
e) LED Emergency light is used to show the exit route;
f) DC power Supply is used to turn on the emer-gency light in emergency situation;
g) LCD Module is used to display whether the gas or smoke is present or not;
h) Transistor is used for switching purpose;i) Adapter 12 V is used to supply the GSM
Module;j) Buzzer is used to alert;k) Small LED is used to check the relay circuit is
properly working or not.
3. WORKING PRINCIPLE OF GAS AND SMOKE SENSOR MODULE
Fig. 1 shows the block diagram of functioning of gas and smoke sensor module. In this system, main-ly semiconductor type smoke & gas sensor modu-le is used. Sensitive material of smoke & gas sensor is SnO2. Initially, when the air is clean, the conduc-tivity between the electrodes of sensor is less as the resistance is in order of 50 kΩ and electrodes are keeping at constant distance. The inverting termi-nal input of comparator is higher than the non-in-verting terminal input. The indicator Buzzer and LED is off. In the event of fire, when the sensor gets filled with smoke, the resistance of the sensor falls to 5 kΩ and the conductivity between the elec-trodes increases [3]. This provides a higher input at the non-inverting terminal of comparator than the inverting terminal and the output of the comparator becomes high. The alarming LED and Buzzer are turned on as indication of presence of smoke. The sensitivity of the gas & smoke sensor can be adjus-ted by the potentiometer.
4. MICROCONTROLLER USED IN THE SYSTEM
In this system ARDUINO UNO is used, which is a microcontroller board based on the ATmega328P. It has 14 digital input/output pins of which 6 can be
used as PWM outputs, input voltage (7–12) V of direct current (DC), 5V DC operating voltage, 40 mA on input or output pin and 50 mA on 3.3 V-pin, 6 analogue inputs, a 16 MHz quartz crystal, a USB connection, a power jack, an ICSP header and a re-set button [4].
5. BRIEF DESCRIPTION HOW GAS & SMOKE SENSOR COMMUNICATE WITH MICROCONTROLLER & EMERGENCY LIGHTING
In this system, a smoke detector with emergen-cy lighting for safety purpose in any indoor area is introduced. This is achieved via smoke and gas de-tector technology and added intelligence utilizing integrated microcontroller, mobile communica-tion and a LED emergency light. Here a LED emer-gency light is used, this light is operated at 3V DC, 0.25A battery source. Fig. 2 shows the circuit dia-gram of using Microcontroller to interface of Gas and smoke sensor with emergency light.
When developing a smoke and gas detector sys-tem, there is a need to monitor the gas and smoke sensor parameters continuously. This combined smoke detector system with emergency lighting and communication system can monitor the smoke from the fire or gas leakage continuously. This is achieved by scanning the digital output (D0) of the sensor continuously. When the air is clean that is there is no smoke or gas leakage, the D0 of the sensor is high as well as the conductivity between the electrodes of the sensor is less. If there occurs a smoke or gas leakage at any time, the conductivity between the electrode of the sensor is high as well as the digital output D0 of the sensor will change to low status and that time SMS alert, buzzer and emergency light will be activated [5].
When the emergency situation arises, SMS is sent by using AT commands. The SMS alert set in the programme and the base of the transistor Q1 gets the high pulse due to detection of smoke or gas, the transistor is turned on or forward biased and turns on the buzzer, which is connected to the spe-cified pin of the microcontroller. Once smoke or gas
Fig. 1. Block diagram of gas & smoke sensor module

Light & Engineering Vol. 27, No. 1
48
leakage is detected by the system, the set numbers of SMS alert are sent. When this situation arises, humans should take proper action to stop the gas or smoke problem.
After sending the SMS alerts, the system will ac-tivate the emergency light. When the smoke or gas leakage has been stopped and system will automa-tically reactivate its SMS alert setting by resetting SMS counting variable back to zero. Fig. 3 shows the flow chart to interface gas and smoke sensor with emergency light.
When the base of the transistor Q2 gets the high pulse due to detection of smoke or gas, the transistor is turned on or forward biased. The relay also gets energized and ‘NC’ (Normally Closed) terminal of the relay changes to ‘NO’ (Normally Open) termi-nal, the relay circuit is completed. The emergency light is turned on.
In this circuit an orange colour small LED is used. This LED is used to check the relay circuit is properly working or not that is relay circuit is pro-perly energized during the presence of smoke or gas or not. When there is no gas leakage or smoke, the
Fig. 2. Circuit diagram of using microcontroller to interface gas and smoke sensor with emergency light
Fig 3. Flow chart to interface gas and smoke sensor with emergency light

Light & Engineering Vol. 27, No. 1
49
base of the transistor gets low pulse, the transistor is reverse biased, and the relay also gets de-ener-gized, and in such case the ‘NO’ terminal of the re-lay changes to ‘NC’ terminal. Fig. 4 shows the ex-perimental setup using microcontroller to interface gas and smoke sensor with emergency light.
6. ADVANTAGE OF THE SYSTEM
The developed combined smoke detector with emergency lighting system has the following specifications:
– The LED emergency light has long life, small size, good efficacy and good visibility having mo-nochromatic yellow LED light. The whole system requires proper maintenance and can be sustained for a long period of time.
– This system is easy to install and very simple to operation.
– This system is more reliable in domestic, in-dustrial and commercial interiors.
– This system detects the different gas leakage like LPG leak, methane leak, butane leak, or any such petroleum based gaseous substance and smoke that can be detected using smoke and gas sensor.
7. DISADVANTAGE OF THE SYSTEM
The developed combined smoke detector with emergency lighting system has the following disadvantages:
– The smoke and gas sensor with emergency light is driven by battery power. So, regular check-ing, maintenance and replacement of the battery
system is necessary. A smoke detector and emergen-cy light with dead battery saves no live.
– Water steam is very harmful for smoke and gas sensor. Smoke detector should not be installed in bathroom, steam rooms or over ovens of kitch-ens. If sensors are installed in such a place, this will be get damaged or create malfunctioning.
– The smoke and gas sensor should not in-stall near gas ovens, stoves. If sensors are installed in such a place, this will give the false alarm. But this areas are the most important areas where need of careful monitoring for fire hazards, installation of the system in a proper wall or ceiling is very much necessary [6].
8. CONCLUSION
In this system, the gas and smoke detector sys-tem with an emergency light is provided with a mi-crocontroller system. In this troublesome world, risks are increasing due to human faults and failu-re. Automation and security is the most important factor in our day to day life. This system approach-es to home and industrial automation and securi-ty system design which is almost standardized now to day. Everyone wants to be as much as secured as possible. This developed system, if installed in large scale, may save lives of many people by giving ear-ly warning and showing the escape route.
In case of emergency situation in future, laser light may be used to get more sensitivity in the smoky and hazardous situation than LED. Laser achieves the goals of high sensitivity and high sta-bility by its monochromatic nature.
Fig. 4. Experimental setup using microcontroller to interface gas and smoke sensor with emergency light

Light & Engineering Vol. 27, No. 1
50
This combined smoke detector system with emergency lighting and communication system may be used outside of official building or herita-ge building etc. At night, when the density of peo-ple of any area is very low, if fire hazard occurs out-side, the fire may spread rapidly and may affect the inside of the building and damage various important documents, instruments or artefacts. This developed smoke detector system with emergency lighting and communication system may protect this hazardous situation.
This combined smoke detector system may be effective in wildfire. Wildfire may occur all over the world except Antarctica continent. The wild-fire spreads very fast and come to the local pre mises what may cause extensive damage to property, hu-man life, wild life etc. This developed smoke de-tector with SMS alarm system may save extensive damage of property, human life, wildlife, forest etc. from the wildfire.
REFERENCES
1. People of Planet Earth and Fire by Debabra-ta Biswas, B.E Mining, Calcutta University, Life Mem-ber: M.G.M.I & loss prevention Association of India.
2. The society of Light and Lighting Hand Book by Peter Boyce PhD, FSLL, FIESNA & Peter Raynham BSc MSc CEng FSLL MCIBSE MILE.
3. MQ-2 Semiconductor Sensor for Combustible Gas available at https://www.pololu.com/file/download/MQ2.pdf?file_id=0J309.
4. www.arduino.org/products/boards/arduino-uno.5. Gas Leakage Detector using Arduino and GSM
Module with SMS Alert and Sound Alarm, http://www.circuitstoday.com/gas-leakage-detector-using-arduino- with-sms-alert.
6. The Disadvantages of Smoke Alarms by Marc Chase, available at www.hunker.com/13419400/the- disadvantages-of-smoke-alarm.
Shibabrata Mukherjee, received his B. Tech. Degree in Electrical Engineering from St. Thomas College of Engineering & Technology, Kolkata, India in 2013 and M. Tech. Degree in Illumination Technology & Design from Jadavpur University, Kolkata, India in 2017. His research interest includes non-conventional energy sources and optical communications
Parthasarathi Satvaya,Assistant Professor, School of Illumination Science Engineering & Design Jadavpur University, Kolkata, India. He has received his B. Tech. Degree in Electronics & Instrumentation Engineering and M.E. Degree in Illumination Engineering in 2006 and 2008 respectively. His research interests includes smart lighting and electronic instrumentation
Saswati Mazumdar,Ph.D., Professor in field of Electrical Engineering at Jadavpur University (JU, Kolkata, India). She has 30 years of experience in lighting research and teaching. She was a developer of a modernized Illumination Engineering Laboratory in Electrical Engineering Department of Jadavpur University, have founded two Masters’ Courses on Illumination Engineering (Daytime) and Illumination Technology & Design (Evening) in JU, executer of a large number of R&D and consultancy of projects on illumination and allied fields

51
Light & EngineeringVol. 27, No. 1, pp. 51–60, 2019
A NOVEL FRAMEWORK TO EVALUATE THE PERFORMANCE OF RESPONSIVE KINETIC SHADING DEVICES
Mustafa Teksoy1 and Onur Dursun2, 3
1 Teksoy Yapi Mimarlik Ltd. 2 Yasar University, Izmir, Turkey
3 Liverpool John Moores University E-mails: [email protected]; [email protected]
ABSTRACT
Determining control parameters of kinetic shad-ing devices introduces a dynamic problem to de-signers, which can best be tackled by computation-al tools. Yet, excessive computational cost inherits in reaching near optimum solutions led to exclu-sion of many design alternatives and weather con-ditions. Addressing the issue, the current study aims to explore the design space adequately and evalu-ate the performance of responsive-kinetic shading devices (RKSD) by proposing a novel framework. Current framework adopts a surrogate-based tech-nique for multi-objective optimization of control pa-rameters of a RKSD on randomly sampled daylight hours. To test the plausibility of any results obtained by the proposed framework, a controlled experiment is designed. Empirical evidences suggest RKSD outperforms the static one in daylighting and view performance metrics. However, considering indoor temperature no significant differences observed.
Keywords: responsive, kinetic, shading, day-light, temperature, view, simulation, surrogate, optimization
1. INTRODUCTION
Solar control has been historically a vital con-sideration in architectural design, since it is highly relevant with the concepts of energy and comfort. A proper control strategy by means of shading devi-ces has dramatic influence on room temperature and
natural lighting, accordingly, contributes to ener-gy savings while providing comfort for the occu-pants [1]. Regulating the sunlight on the exterior of a facade, before solar beams enter the room and radiate its energy inside, is a much efficient strate-gy for sun control [1–3]. Conventionally, static sha-ding devices are integrated to facades to perform this task. However, static devices fail in responding to fluctuating environmental and comfort demands. Lechner [4] put forward a critical question:
“Is it logical that a static system can respond to a dynamic problem?”
To tackle with the issue, responsive kinetic shad-ing devices (RKSD), which forms the focus of the current research, were introduced. RKSD are de-fined as active shading systems. They consist of components with the ability to change themselves due to the change in the environment with help of kinetic movement in an automated manner. To be responsive, a shading device must possess mov-ing parts, actuators, a control system, sensors and be programmed to respond in a certain way due to the sensor data. When designing a kinetic sys-tem, which accounts for change in time, the com-plexity of the design problem increases substan-tially. On the other hand, the developments in the computer technology along with new computation-al approaches, researchers gained the ability to deal with such complexity.
As a specific domain of computer aided design – performance integrated parametric design and per-formance optimization help making well-informed

Light & Engineering Vol. 27, No. 1
52
design decisions. However, information feedback in the design process comes at a price, which is computation time. Most of the simulation engines that generate such design information are computa-tionally expensive. In the study of solar control with help of kinetic shading devices that respond to its environment, the problem of high computational times is even more significant. Because the determi-nation of the values for the shading control parame-ters requires to be based on minor fractions of time.
A critical review of the literature on responsive kinetic shading devices revealed that most of the studies over-simplified the design problems due to the high levels of complexity and computation-al costs (i.e. [5–9]). Such simplifications may lead to deficiency in the exploration of the design space. For instance, El Sheikh & Gerber [10] and Sharai-din, Burry, & Salim [11] employed a meta-heuris-tic search method, namely genetic algorithm, to-wards exploration of design alternatives that have better daylight performance. Excessive number of simulations is required to converge to optimum de-sign alternatives. Therefore, computational cost was extremely high as each population member for the given number of generations must be simulat-ed in simulation-based optimization. In response, Wortmann et al. [12] argued that surrogate model based optimization outperforms simulation-based optimization in solving architectural design prob-lems, both at computational cost and finding better solutions. For instance, Kazanasmaz et. al. [13] de-veloped a predictive model by using artificial neural networks in order to predict daylight intensity for the office buildings in Izmir, Turkey. Parallel, Hu and Olbina [14] utilized surrogate models for pre-dicting the influence interior split-blinds on illumi-nance levels and achieved very low prediction er-rors. Both works [13,14] focused only to daylight performance, by neglecting thermal and other visual comfort aspects such as view to the outside envi-ronment. In another instance, Skavara [15] imple-mented artificial neural networks for controlling the emergent behaviour of an exterior shading sys-tem that is driven by cellular automata for daylight performance. However, her focus was more on the training techniques of the neural networks, than the comfort and energy related influence of the respon-sive-kinetic shading device that she proposed.
Not only performance assessment using com-putational tools but also comparison between static and responsive-kinetic shading devices, have been
considered by previous studies (i.e. [7,9,16,17]). In all cited studies, researchers concluded that ki-netic shading devices outperform static ones. How-ever, the static shading systems that they examined were not optimized for better performance. Addi-tionally, in none of the works cited, view – one of the most important consideration in architectural design – has been considered as a performance ob-jective, along with thermal and daylight objectives in the same problem. Finally, a single point in time was considered as a basis for comparison. Specifi-cally, only a time-point in a year i.e. July at 11:00 a.m. was studied for comparison aims. Therefore, any results obtained by such limitations can reach to restricted conclusions.
To address the gap in the literature, the current study aims to explore the design space and evaluate the performance of RKSD adequately by propos-ing a novel framework. Current framework adopts a surrogate-based technique for multi-objective op-timization of control parameters of a RKSD on ran-domly sampled daylight hours. To test the plau-sibility of any results obtained by the proposed framework, a controlled experiment is designed, which is detailed profoundly in Methodology sec-tion. Empirical evidences suggest RKSD outper-forms the static one in daylighting and view per-formance metrics. However, considering indoor temperature no significant differences observed.
2. METHODOLOGY
The current research employed a quantitative approach for assessing the performance of shading devices. To achieve, a novel computational frame-work was proposed, Fig. 1. Next, the framework was tested in a comparative study between annu-ally optimized-static and hourly optimized respon-sive-kinetic shading devices. It was hypothesized that responsive-kinetic shading devices would out-perform optimized-static shading devices on the given performance metrics. To test the hypothe-sis, a controlled experiment was designed using the computational tools, which aims at measuring the influence of quantitative independent variables on selected performance metrics.
The current work considered three performance metrics. The first one is denoted by ∆T which is defined as the absolute value of the difference bet-ween the air temperature simulated inside the hypo-thetical box model and 23 °C threshold. The second

Light & Engineering Vol. 27, No. 1
53
performance metric is denoted by lux∆ which is the absolute value of the difference between the avera-ge illuminance what was simulated inside the hypo-thetical box model and 500 lx thresholds. Finally, last performance metric is the average of the View percentage from a given point inside to the view frame at the outside
2.1. Box Model Properties
Within the content of experiment design, first, a test box was defined for the study of the exteri-
or shading devices. At each of the shading device scenarios, parameters of this test box were kept constant. The dependent variables of annually-op-timized and responsive kinetic shading systems on the base building were examined. The location of the Box-Model was Izmir, Turkey. Crucial to under-line, to eliminate the influence of other confound-ing factors and thus measuring the sole impact of shading device on selected performance metrics; heat transfer was allowed only from the south-fac-ing façade in the current experimental design. Fur-thermore, it was assumed that there were no internal
Fig.1.The computational tools used and the flow-chart of the experimental design

Light & Engineering Vol. 27, No. 1
54
heat loads. Table 1 demonstrates the initial parame-ters of the box model.
2.2. Parametrization of Shading Device – Independent (Decision) Variables
Shading device’s parameterization was conduc-ted by using Grasshopper an algorithmic modelling platform. The geometry of the shading was gene-rated by subdividing a surface that was 5 cm away from the south façade into six parts. This would al-low controlling of the conceptual shading system with zones. Subsequently, each of these parts was subdivided again into 30 parts. These operations generated a data tree with six lists each having 30 items. Each of the surfaces would form horizon-tal slats of the shading devices with a dimension of 0.03 m ×1.49 m. An axial rotation operation was defined for all the surfaces in six different lists. Shading surfaces in separate lists were controlled by independent rotation parameters (X1, …, X6), which could have a value within the range of 0.00
to 180.00 degree. Recall that, the designs of shading devices were identical for both responsive kinetic and static types to facilitate fair comparison.
2.3. Inclusion of Performance Metrics to the Parametric Model
Inclusion of performance metrics to the para-metric model was achieved using well-established plug-ins for Grasshopper. Ladybug and Honeybee are open source plug-ins for Grasshopper, develo-ped for aiding the designers to explore and evalu-ate environmental performance of any design alter-native at the conceptual design phases. With help of the programs within Ladybug toolset, it is possi-ble to import EnergyPlus weather data files (EPW) into Grasshopper, make various environmental ana-lyses that rely on previously recorded local time-se-ries data. Honeybee toolset contains programs that connects visual programming environment of Grasshopper with various validated simulation en-gines such as EnergyPlus, Radiance, Daysim and
Table 1. Parameter Initiation of the Box-Model
Parameters Values
Location Izmir /Turkey
DimensionsWidth, mDepth, mHeight, m
363
Reflectance
Floor,%Ceiling,%Walls,%
Shading (exterior),%
30805040
U Values (heat transfer coefficient)
Walls (except South)RoofFloor
Window, W/(m2 ∙ K)South Wall, W/(m2 ∙K)
AdiabaticAdiabaticAdiabatic
2.390.49
Internal Loads
Equipment, W/m2
Infiltration Rate, (m3/s)/m2
Irradiance, W/m2
People Density, ppl./m2
0.00300
Window
OrientationGlazed Area, m2
Window to Wall RatioWindow Construction
South7.840.87
Double Pane with Low E
Glass MaterialType
Visible TransmittanceRefraction Index
Clear glass0.791.52

Light & Engineering Vol. 27, No. 1
55
OpenStudio [18]. An integrated and flexible design approach can easily be utilized in the design process by means of those plug-ins and the visual scripting environment that Grasshopper platform provides. By generating a definition on Grasshopper vari-ous design variables and associative performance data can easily be generated for further research.
2.4. Database Generation
A performance integrated parametric model was generated for exploring the alternatives in the de-sign space and the response variables of the static and responsive kinetic shading devices. The previ-ously established parametric model had six inde-pendent variables, and three response variables (ob-jectives) that are referred to as performance metrics. The next step was automating the process of gene-rating and recording random independent variables for the control of shading zones and their computed performance metrics in a database. To achieve this goal 6-steps procedure had to be fulfilled.
• Step 1: Generate 6 random values within the range for shading control parameters (independent variables).
• Step 2: Run daylight, energy and view simula-tions for each the generated scenarios.
• Step 3: Write shading independent de-sign variables and dependent response variables to spreadsheets.
• Step 4: Iterate the above process for 500 times for each hour.
• Step 5: Change the hours of the year.• Step 6: Iterate for 50 times.Nabil and Mardaljevic [19] argued that sub-sam-
pling the meteorological dataset, such as picking only one day from each month, eventually bring bi-ases because different sky and conditions would be excluded. However, in the research presented here, the aim is not making an annual inference, but exa-mining the point in time situation. For this reason, a random sampling of 50 hours was made from total daylight hours of a year, provided that the selected hours were between 9:00 am and 17:00 pm.
Simulations were run on an hourly basis for the randomly sampled times in a year. By assigning random values for the decision variables within the range, 500 simulations were performed for each of the 50 randomly sampled hours. For the static shad-ing, a randomly generated set that contains 500 ex-amples were performed on an annual basis. There-
fore, aggregated 25.500 runs were performed in an automated workflow to generate 51 datasets for fur-ther development of surrogate models. At each run, the independent variables and their associative vari-ables that contain performance indicator values for each hour and a year were stored in separate spread-sheets. After finishing the database generation pro-cedure, each spreadsheet was converted to com-ma-separated values (CSV).
2.5. Development of Surrogate Models
In the experimental design of the current study, development of surrogate models played a central role since they served two crucial purposes:
1. First, they were employed as the objective functions for the subsequent optimization pro-cess. Since they established the causal relationship among input and output variables, the current work utilized these relationships towards concurrent eva-luation of the performance metrics.
2. Second, they functioned as the performance metric predictor of the static shading devices on considered date/hour of the year to facilitate comparative results with the performance results obtained for RKSD.
Feed-forward Artificial Neural Networks (FAAN) was used for development of surrogate models. In feed-forward neural networks, a connec-tion is allowed only from a node in a layer to nodes in the next forward layer. Multi-layer feed-forward networks are very popular and long-established structures of artificial neural networks, which have been used in many applications such as forecast-ing and function approximation [20]. This class of neural networks is identified by presence of hidden layers between the input and output of the network. Hidden layer contains hidden neurons, which are not directly seen from either input or output [21]. The models that were prepared for the study are in the class of multilayer perceptron (MLP), since they have one hidden layer, other than just having an input and output layer. According to the exten-sive review conducted by Zhang, Patuwo, and Hu [20] ANN with a single hidden layer are sufficient to approximate any complex non-linear function at any degree of accuracy. Therefore, number of hid-den layers was not a parameter to search for in the model selection process that was conducted for finding best performing network models and avoid-ing over-training of the networks.

Light & Engineering Vol. 27, No. 1
56
Prior to generating MLP, three model selec-tion operations were executed for each performance metrics to determine the network architectures. For network architectures that would be used for RKSD models, a dataset from a random hour was selected for testing network model, other than performing it to all the 50 datasets. The network architecture that outperformed remainders for the selected hour was then used for 49 remainder hours for RKSD. For an-nually optimized static shading, this was not an is-sue because the network models used one dataset for annual performance.
For cross validation, Monte Carlo technique was implemented for both model selection and neural network training processes. Using Monte-Carlo, the randomly generated data sample was split into two random sub-samples by a factor of 0.1. That is, 450 random observations (corresponds to 0.9) in the da-tasets were used for neural network training purpo-ses. To assess predictive ability of trained network on the unseen data, remaining 50 observations, namely test sample was used. This process was then iterated 10 times, generating new training and test partitions at random each time. The perfor-mance evaluation criteria for cross-validation is root mean square error (RMSE) 1 which is subject to minimization.
Once the network architectures and number of iterations were determined for the models, the net-works were trained using the data that contain si-mulation-derived observations. MLPs were trained by Resilient Back-Propagation (RProp) algorithm. RProp is a fast learning algorithm for MLPs that performs local adaptation of the weight-updates due to the act of the error function. Detailed infor-mation on training algorithm used in the current study can be found elsewhere [22]. Developed by Chatzikonstantinou [23], CIDEA, a Computation-al Intelligence Decision-Support Environment for Architectural and Building Design was used to con-duct the tasks of surrogate model development and multi-objective optimization.
2.6. Multi-Objective Optimization – Objective functions
HypE algorithm was employed for deriving op-timal solutions with respect to T∆ , lux∆ , and
1 ( )2
1
1 .n
i ii
RMSE y yn =
= −∑
View. Bader, et. al. [24] proposed HypE as an evo-lutionary multi-objective optimization algorithm that is based on quality measure of hyper-volume indicator. In their study, they compared the algo-rithm with other evolutionary optimization algo-rithms such as NSGA-II, SPEA2 and so on. Their re-sults showed that HypE outperformed all the others, in multi-objective optimization problems with a di-mension more than two. Therefore, HypE algorithm seems adequate for three-dimensional optimiza-tion problem that was formulated for the study of exterior shading devices.
According to the problem formulation, while T∆ and lux∆ objectives were minimized, View
was maximized. This formed an obvious conflict-ing situation. In the optimization phase, HypE al-gorithm was referenced to the neural networks for each objective function.
The current work used the default settings for optimization to generate 100 generations each hav-ing 100 populations, whereas hyper-volume sam-ples and mutation probability was set as 5000, and 0.1, respectively. Surrogate-based optimization me-thod was implemented for both types of conceptual shading devices to reach the best performing design alternatives. For RKSD50 optimization operations were run for each randomly sampled daylight hours. For the static shading, only one optimization ope-ration was performed to find best performing alter-natives on an annual basis. At the end of the pro-cess, we extracted 100th generation from each of the 51 optimization processes in total, for further operations.
2.7. Test of Hypotheses
The current work hypothesized that respon-sive-kinetic shading device would outperform opti-mized-static selected performance criteria. Accord-ingly, following alternative hypotheses were tested:
Fig. 2. Exterior shading system with six control zones and the diagram of a single shading control parameter

Light & Engineering Vol. 27, No. 1
57
• ,1 0alt responsive staticH T T= ∆ − ∆ ≤ ;
• ,2 0alt responsive staticH lux lux= ∆ − ∆ ≤ ;
• ,3 0alt responsive staticH View View= − ≥ .
The design of experiment dictates to compare the means of one sample having different interven-tions whereas the data is in continuous domain. The same set of items was measured under two different interventions, namely responsive-kinetic and opti-mized-static. Therefore, paired-t test is the adequate statistics to conduct formal test of hypothesis.
3. RESULTS AND DISCUSSION
Upon successful implementation of the expe-rimental design, exhaustively explained in the pre-vious section, the current work obtained 50 sets of optimized decision variables for 50 randomly selec-ted daylight hours for the responsive shading and one set of optimized decision variables for the static shading. Each of the 51 data sets is consisted of 100 optimized design alternatives.
Prior to implementing surrogate-based opti-mization, several pilot studies were conducted by using simulation-based optimization method of RKSD on arbitrarily selected daylight hours. The main intent of these studies was to verify the de-sign of experiment as well as to calculate necessary duration of reaching near optimum solutions when using simulation-based technique. In pilot studi-es, near-optimum solutions for just a single hour in a year emerged only after a process that lasted
for more than 60 hours. That is, when an architect chose to implement traditional simulation-based op-timization technique towards performance evalua-tion of RKSD on, say, 50 selected hours of a year, he/she requires approximately 125 days achieving that task. On the other hand, utilizing surrogate mo-dels reduced the computational costs significantly. The investigation of the performance for the RKSD, on 50 randomly sampled daylight hours lasted for about 90 hours in total; whereas the computer con-ducted most of the process in an automated fashion.
Three hypotheses were considered within the content of the current study. In each, it was assumed that the responsive-kinetic shading type would out-perform the optimized static one. However, the re-sults of paired-t tests significantly demonstrated that, while ,2altH and ,3altH cannot be rejected ,1altH
can be rejected. This implies, while responsive ki-netic shading outperformed optimized static with respect to daylight intensity and view to outside, there was no significant difference in the compari-son of the impacts of the two types of shadings on indoor air temperature.
The first objective function was T∆ minimiza-
tion. Therefore, we expected lower T∆ values for
responsive-kinetic shading type. However, the re-sults suggest there is not enough evidence to con-clude that the mean of responsive-kinetic shading is less than static shading at the 0.05 level of signifi-cance. We found out that the mean of responsiveT∆ is
16.77 °C, while the mean of staticT∆ is 16.60 °C.
Fig. 3. Comparison of mean T∆ between static and RKSD

Light & Engineering Vol. 27, No. 1
58
In an indoor space with a solely southern-exposure to the sun in Izmir climate, responsive-shading de-vices may not contribute to thermal comfort and energy efficiency better than an optimized static shading device. To further underline, the study con-sidered other objective functions in the optimiza-tion problem simultaneously. The function of view to outside maximization might have influenced this result, since it is an obviously conflicting objective in most of the weather conditions. Fig. 3 illustrates paired comparison of mean T∆ on randomly selec-ted hours.
The second performance objective function was minimization of lux∆ . As in the first objective, the current work aimed at minimizing lux∆ to make the average daylight intensity as close to 500 lx as possible. In the comparison test for lux∆ objective, the findings of the current study suggest that the RKSD performs significantly better than optimized the static shading at the 0.05 level of significance. The results revealed that the mean of responsivelux∆ is 420 lx, while the mean of staticlux∆ is 1277 lx. The daylight performance of responsive-kinetic shading is almost three times better than the op-timized static shading according to the findings. However, it must be noticed that five of the paired differences were unusual, that is the difference bet-ween the pair is much more than the trend, Fig. 4.
This situation contributed to the increase in the total mean difference. Nonetheless, one can be 95 % confident that the true mean difference is less than 507 lx and 90 % percent confident that it is between 507 and 1206 lx.
The final objective function for the performance evaluation was percentage of view to outside (View).
Maximization was intended for this function, there-fore higher values of View is desired. The findings suggest that the mean of responsiveView and staticView
is 64.2 and 48.4, respectively. As reported in the re-sults, we can conclude that the mean of respon-sive-kinetic shading is significantly greater than the mean of optimized static shading at the 0.05 level of significance. We can be 95 % confident that true mean difference is greater than 12.7, and 90 % con-fident that it is between 12.7 and 18.7. Fig. 5 illus-trates paired comparison of View objective.
The reason for these results may be related with the formulation of the experiment. The controlled experiment was designed for the investigation of sole impact of sunlight on the interior environment. The solar beams have two diverse but related as-pects, namely thermal and daylight. Heat energy cannot reflect but radiate. Both shading devices in-tercepted the heat energy of solar beams on the out-side in a similar manner. However, daylight aspect of solar beams was managed much better by respon-sive kinetic shading type. Objective performance about window view in the design problem state-ment, which is not a dynamic measure, conflicts with the other objectives, and might has be contrib-uted to this situation.
CONCLUSION
The current work established a novel framework for adequately exploring design alternatives and op-timizing performance of control parameters of re-sponsive-kinetic shading devices with respect to ob-jectives of T∆ , lux∆ View . The urge for
Fig. 4. Comparison of mean lux∆ between static and RKSD

Light & Engineering Vol. 27, No. 1
59
developing such framework was motivated by the absence of an adequate and efficient method for ex-ploring and evaluating the performance of RKSD. In addition, literature has not addressed the task with consideration of thermal, daylight, and view objectives simultaneously up to now. Findings sug-gest one can achieve significant reduction in com-putational time compared to simulation-based me-thods using proposed framework. A surprising outcome was the optimized static shading slightly outperformed the responsive-kinetic one in the ob-jective T∆ . Considering the objectives lux∆ and
View, however, empirical evidences suggested that RKSD significantly outperformed the opti-mized-static shading.
In the future works, the relationships between weather conditions, design variables and perfor-mance objectives should further be examined. Cer-tain weather parameters, such as global illuminance, global radiation, are required to be extracted from the weather file and match with the design and re-sponse parameters to picture the relationships bet-ween them.
REFERENCES
1. G. Hausladen, M. de Saldanha, and P. Liedl, Cli-mate Skin. Basel: Birkhauser, 2008.
2. H. Fathy, Natural Energy and Vernacular Archi-tecture. Chicago and London: The University of Chica-go Press, 1986.
3. A. Olgyay and V. Olgyay, Solar Control and Shad-ing Devices. New Jersey, 1977.
4. N. Lechner, Sustainable Design Methods for Archi-tects. New Jersey: Wiley, 2015.
Fig. 5. Comparison of mean View between static and RKSD
5. C. Du Montier, A. Potvin, and C.M. Demers, “En-ergy and daylighting potential for Adaptive Façades: Evaluation of movable insulated panels,” Proc. of Int. Conf. on Adaptation and Movement in Architecture ICA-MA 2013, Oct. 2013, Toronto, Canada.
6. Y.J. Grobman, I.G. Capeluto, and G. Austern, “Ex-ternal shading in buildings: comparative analysis of day-lighting performance in static and kinetic operation sce-narios,” Architectural Science Review, 2016, Vol. 60, no. 2, pp. 1–11.
7. K. Kensek and R. Hansanuwat, “Environment Con-trol Systems for Sustainable Design: A Methodology for Testing, Simulating and Comparing Kinetic Facade Sys-tems,” Journal of Creative Sustainable Architecture & Built Environment, 2011, Vol. 1, no. Nov., pp. 27–46.
8. D. S. Lee, S.H. Koo, Y.B. Seong, and J.H. Jo, “Evaluating thermal and lighting energy performance of shading devices on kinetic façades,” Sustainability (Switzerland), 2016, Vol. 8, no. 9, pp. 1–18.
9. M. V. Nielsen, S. Svendsen, and L.B. Jensen, “Quantifying the potential of automated dynamic solar shading in office buildings through integrated simula-tions of energy and daylight,” Solar Energy, 2011, Vol. 85, no. 5, pp. 757–768.
10. M. El Sheikh and D.J. Gerber, “Building Skin In-telligence,” Proceedings of the annual conference of the Association of Computer Aided Design in Architecture ACADIA, 2011, pp. 170–177.
11. K. Sharaidin, J. Burry, and F. Salim, “Integra-tion of Digital Simulation Tools With Parametric Designs to Evaluate Kinetic Façades for Daylight Performance,” Physical Digitality: Proceedings of the 30th eCAADe Conference, 2012, Vol. 2, pp. 701–709.
12. T. Wortmann, A. Costa, G. Nannicini, and T. Schroepfer, “Advantages of surrogate models for ar-

Light & Engineering Vol. 27, No. 1
60
chitectural design optimization,” Artificial Intelligence for Engineering Design, Analysis and Manufacturing, 2015, Vol. 29, no. 4, pp. 471–481.
13. T. Kazanasmaz, M. Günaydin, and S. Binol, “Ar-tificial neural networks to predict daylight illuminance in office buildings,” Building and Environment, 2009, Vol. 44, no. 8, pp. 1751–1757.
14. J. Hu and S. Olbina, “Illuminance-based slat angle selection model for automated control of split blinds,” Building and Environment, 2011, Vol. 46, no. 3, pp. 786–796.
15. M. E. Skavara, “Adaptive cellular automa-ta façade trained by artificial neural network,” Barlett School of Graduate Studies, University Collage of Lon-don, 2009.
16. E. S. Lee, D.L. DiBartolomeo, and S.E. Selkow-itz, “Thermal and daylighting performance of an automa-ted venetian blind and lighting system in a full-scale pri-vate office,” Energy and Buildings, 1998, Vol. 29, no. 1, pp. 47–63.
17. A. Wagdy, F. Fathy, and S. Altomonte, “Evaluat-ing the Daylighting Performance of Dynamic Façades by Using New Annual Climate- Based Metrics Evaluating the Daylighting Performance of Dynamic Façades by Us-ing New Annual Climate – Based Metrics,” Proc. of the 32nd Int. Conf. on Passive and Low Energy Architecture, PLEA 2016. 2016, Los Angeles, CA, pp. 941–947.
18. M. Sadeghipour Roudsari and M. Pak, “Lady-bug: a Parametric Environmental Plugin for Grasshopper To Help Designers Create an Environmentally-Conscious Design,” 13th Conference of International building Per-formance Simulation Association, 2013, pp. 3129–3135.
19. A. Nabil and J. Mardaljevic, “Useful daylight il-luminance: a new paradigm for assessing daylight in buil-dings,” Lighting Research and Technology, 2005, Vol. 37, no. 1, pp. 41–59.
20. G. Zhang, B.E. Patuwo, and M.Y. Hu, “Fore-casting with artificial neural networks:: The state of the art,” International journal of forecasting, 1998, Vol. 14, pp. 35–62.
21. S. Haykin, Neural Networks and Learning Ma-chines. 2009.
22. M. Riedmiller and H. Braun, “A direct adaptive method for faster backpropagation learning: The RPROP algorithm,” IEEE International Conference on Neural Networks – Conference Proceedings, Vol. 1993–Janua, pp. 586–591.
23. I. Chatzikonstantinou, “A Computational Intel-ligence Decision-Support Environment for Architectural and Building Design: CIDEA,” IEEE Congress on Evo-lutionary Computation 2016, pp. 3887–3894.
24. Bader, J., Zitzler, E. HypE: An Algorithm for Fast Hypervolume-Based Many-Objective Optimiza-tion // Evolutionary Computation. 2008, Vol. 19, No. 1, pp. 45–76.
Mustafa Teksoy, partner and main architect in Tecsoy Yapi Mimarlik Ltd, Turkey.He was awarded by Degree of Master of Science in Architecture from Yasar University in 2017. His fields of interests are computational design, architectural robotics, sustainable and energy conscious buildings. Currently, he undertakes responsibility of design and builds of the first nearly zero energy hotel development in Alacati region, Izmir, Turkey
Onur Dursun, Dr.-Ing. He received his Doctor of Engineering Degree in Construction Economics from University of Stuttgart in 2014. Since then, he has been appointed as an Assistant Professor at Architecture Faculty, Yasar University, Turkey. His current research interests are performance assessment in building design, and construction economics. At present, he is a senior lecture in Department of Built Environment of Liverpool John Moores University

61
Light & EngineeringVol. 27, No. 1, pp. 61–70, 2019
LIFE CYCLE COST ANALYSIS ON M1 AND M2 ROAD CLASS LUMINAIRES INSTALLED IN TURKEY
Ramazan Ayaz1, Asiye Kaymaz Ozcanli1, Ismail Nakir1, Pramod Bhusal2, and Adem Unal1
1 Department of Electrical Engineering, Yıldız Technical University, Istanbul, Turkey 2 Department of Electrical Engineering and Automation, Lighting Unit,
Aalto University, Espoo, Finland E-mail: [email protected]
ABSTRACT
This paper investigates and compares the photo-metric performance and lifetime cost effectiveness of LED and existing conventional luminaires (high pressure sodium (HPS) and metal halide (MH)). Photometric measurements of the lamps and the lu-minaires were performed at Yıldız Technical Uni-versity Lighting Laboratory in Turkey. The perfor-mance requirements of the luminaires were analysed according to CIE (International Commission on Il-lumination) standards. In the simulations, HPS, MH and LED luminaires that provide good lighting cri-teria for designing M1 and M2 road models were compared in terms of a cost analysis. The life cycle cost analysis (LCCA) method, which comprises in-stallation, energy and maintenance costs, was used in this study. The results of the LCCA showed that LED luminaires have almost the same cost effec-tiveness as HPS luminaires for the M2 road light-ing class, and the total cost of LED luminaires is ap-proximately 11.5 % less than that of HPS luminaires for the M1 lighting class.
Keywords: roadway lighting, LED luminaire, energy efficiency, life cycle cost
1. INTRODUCTION
Worldwide, environmental impacts and energy security issues due to increasing energy consump-tion have been serious problems since the energy crisis in the 1970s. Globally, lighting consumes ap-proximately 19 % of the total generated electrici-
ty [1]. Also, it is estimated that approximately (3–4) % of total generated electricity is used for road lighting around the world [1]. Lighting being a sig-nificant consumer of electricity worldwide, energy efficiency improvements in this field can lead to sig-nificant reductions in total energy consumption [2].
Significant amount of investments are done in energy efficient lighting to reduce energy costs and CO2 emissions. Replacing traditional lighting with energy efficient light emitting diode (LED) – based lighting has the potential to reduce green house gas (GHG) emissions by 670 MT annual-ly and decrease energy costs by (50–70)% [3]. Many studies have shown that retrofitted projects in lighting applications could reduce energy costs up to 50 % by employing state-of-the-art lighting technologies [4, 5].
LED light sources are good alternatives for road lighting over traditional sources due to their co-lour properties, uniform light distribution, improved mesopic vision, controllability, and low environ-mental impacts [6][7]. Moreover, the illuminance level can be controlled to adapt to variations in the road surface reflectance, traffic density and weath-er conditions to reduce energy consumption with-out affecting the lifetime of luminaire [8, 9]. The environmental impact (e.g. acidification, climate change, eutrophication, human toxicity) of LED lu-minaires per kilometre of lit road is forecasted to be 41 % less than that of HPS luminaires due to re-duced energy consumption by 2020 [10].
The life cycle cost analysis method can be used to determine the best choice for an investment deci-

Light & Engineering Vol. 27, No. 1
62
sion. This method enables one to determine the pro-fitability of an investment in the road lighting [11, 12]. The LCCA is suitable to determine the low-est cost among alternative installations and to ana-lyse the profitability of a projected investment. Va-rious studies have carried out life cycle cost analysis of conventional luminaires [13, 14]. The lower life cycle cost should be obtained with higher-lifetime products that have low energy consumption (high luminous efficacy) and purchasing price [15]. The LCCA by Tähkämö et al. presents different scenar-ios based on predicted average electricity price and luminous efficacy of LED luminaire and, so, the payback time of LED luminaires can be reduced in the next years [14]. The results of study, in which LED luminaires were used for M3 road lighting class in Turkey, showed that LED luminaires can provide the lighting quality criteria for M3 road lighting class and can be comparable with conven-tional luminaires [13]. In addition, some studies in-clude life cycle assessment (LCA) to evaluate en-vironmental impacts of luminaire technologies and road construction [10, 16].
In this study, all sample luminaires are examined for compliance of road lighting requirements. The conventional and LED luminaires are then compa-red in terms of life cycle costs for M1 and M2 road lighting class. Road lighting classes are defined in terms of speed, traffic volume, weather, traffic composition, intersection density, separation of car-riageways, parked vehicles, ambient luminance and visual guidance in the CIE publication [17]. The LCCA method includes installation, maintenance, replacement, energy and salvage costs.
The paper is organized as follows: the methodo-logy and design calculations of road models are pre-sented in Section 2. The description of the life cy-cle cost analyses is given in Section 3. The results of cost analyses are discussed in Section 4 and con-clusions are drawn in Section 5.
2. METHODOLOGY AND DESIGN CALCULATIONS OF ROAD MODELS
This study adopted several methods in three steps to find the most appropriate M1 and M2 class road luminaires to be installed and maintained with the lowest life cycle cost in Turkey. The block dia-gram of the methodology is given in Fig. 1.
Firstly, HPS, MH and LED road luminaires were procured from six different manufacturers (L1, L2,
L3, L4, L5 and L6). There were six conventional luminaires from three different manufacturers and six LED luminaires. The conventional luminaires had HPS (150 W Philips SON-T and 250 W Philips SON-T) and MH (150 W Sylvania CMI and 250 W Philips HPI-T) light sources. The powers of LED luminaires ranged from 80 W to 170 W. The pho-tometric quantities of these twelve luminaires were measured in the Yıldız Technical University Light-ing Laboratory in Turkey by using an integrating sphere and goniophotometer. The quantities measu-red include luminous flux, luminous intensity dis-tribution, maximum light intensity, maximum light angle, luminous efficacy, power, power factor, CIE general colour rendering index (CRI) and correlated colour temperature (CCT).
Secondly, the results of the measurements were saved as EULUMDAT files and transferred to the DIALux lighting design software package. The road models were simulated based on M1 and M2 light-ing classes and optimized the most suitable road de-sign. The HPS, MH and LED luminaires that pro-vided minimum road lighting requirements were determined for LCCA.
Finally, according to the results of the design calculations, cost analyses of the HPS and MH lu-minaires were calculated with the LCCA method. After that, the lowest-life-cycle-cost HPS (150 W L3 for M2 and 250 W L3 for M1) and MH (150 W L3 for M2 and 250 W L1 for M1) luminaires and all LED luminaires were analysed to compare the life cycle costs of the luminaires. Installation, mainte-nance and energy costs were calculated using recent prices in Turkey. The HPS and MH luminaires com-pleted their lifetime at the end of the project (about 30 years), so salvage costs were not considered in this study. In contrast, salvage costs were consi-dered for the LED luminaires due to the unused pe-riod of the luminaire lifetime.
2.1. Measurement Equipment and Photometric Data
The HPS and MH lamps were first measured with an integrating sphere (Everfine Photo-E-Info Co., Ltd.). The lamps were seasoned for 100 opera-ting hours before they were tested [18]. The lamps were measured with ballast and igniter of the lumi-naire, and the luminous flux, CCT and CRI were obtained. The CCT of HPS and MH lamps ranged from 2039 K to 2083 K and from 4062 K to 4127

Light & Engineering Vol. 27, No. 1
63
K respectively. The CRI of HPS and MH lamps ranged from 28.7 to 29.6 and from 62.3 to 65.1 re-spectively. The CCT and CRI of LED luminaires ranged from 4000 K to 4500 K and from 70 to 80 respectively. After the lamp luminous flux was me-asured using the sphere, the luminous intensity dis-tribution of the luminaires, luminaire luminous flux and it’s efficacy were determined using go-niophotometer (Everfine Photo-E-Info Co., Ltd.) measurements.
The LED light sources were integrated in LED luminaires without a replaceable LED module. Therefore, the LED luminaires were only measu-red with the goniophotometer. Moreover, the LED luminaires were tested without seasoning. It should be noted, that the light output of some LEDs can in-crease slightly during the first 1000 h of operation, but many LED sources do not exhibit similar beha-viour [19]. The temperature and humidity of the la-boratory were maintained at 25±1 °C and 65 % re-
spectively, with the help of an air condition unit. The luminous intensity of these luminaries was me-asured at 5º intervals in the range of (0–355)º, yield-ing 72 different C planes, and the γ angle was sam-pled at 1º intervals in the range of (0–90) º for each C plane. The results of photometric and electrical measurement of the luminaire samples are shown in Tables 1 and 2.
In Table 1, about 67 % of luminaires have power factors greater than 0.90. The luminous efficacy var-ies between 55.35 and 94.14 lm/W.
As can be observed from Table 2, the measu-red power is almost the same as the nominal power for different LED luminaires. The power factor of all LED luminaires is better than that of conventio-nal luminaires. The luminous efficacy of LED lumi-naires varies between 78.77 and 122.34 lm/W.
2.2. Design Calculations Using the DIALux Lighting Design Program
Each sample luminaire has a different luminous intensity distribution; thus, the road lighting design has to take into account different characteristics to satisfy road lighting criteria [20]. When using dif-ferent luminaires, design calculations such as pole spacing, montage height, tilt angle, and overhang
Table 1. Photometric Data of Conventional Luminaires
No Luminaire type Measured Power, W*
Power factor
Luminous flux, lm
Luminous efficacy,
lm/W
Max. radiation angle, grad
(C, γ)
Luminous intensity curve
type
1 150W HPS L1 166.0 0.939 13,087 78.8 5;24 limited
2 150W HPS L2 174.9 0.951 13,824 79.0 320;18 unlimited
3 150W HPS L3 148.6 0.930 12,579 84.7 145;19 semi-limited
4 150W MH L1 163.5 0.939 9,554 58.4 180;58 limited
5 150W MH L2 169.7 0.942 9,392 55.3 185;67 unlimited
6 150W MH L3 148.8 0.931 9,398 63.1 10;64 semi-limited
7 250W HPS L1 278.6 0.772 26,227 94.1 15;31 limited
8 250W HPS L2 263.7 0.950 23,224 88.1 345;48 limited
9 250W HPS L3 234.5 0.951 21,524 91.8 200;14 semi-limited
10 250W MH L1 296.1 0.641 20,966 70.8 155;25 semi-limited
11 250W MH L2 277.6 0.858 18,132 65.3 355;64 limited
12 250W MH L3 263.2 0.844 17,784 67.6 350;66 unlimited
* It is included ballast losses.L1, L2, L3, L4, L5, L6: Names of various road luminaires manufacturers.
Fig. 1. Block diagram of the methodology

Light & Engineering Vol. 27, No. 1
64
differ from each other. Road lighting design should be optimized based on the maximum pole spacing.
According to the minimum road lighting quality criteria, the maximum pole spacing (s) was calcu-lated using DIALux for the M1 and M2 road light-ing classes. Other design parameters, such as the mounting height (mh), overhang (oh) and luminaire arm angle (θ), were determined according to the performance requirements.
2.2.1. Road Design for the M2 Lighting Class
The road model was simulated to assign lighting quality criteria to the luminaires. In general, 150 W HPS and MH luminaires are used for the M2 and M3 road lighting classes [21]. In this simulation, 150 W HPS and MH luminaires from three different manufacturers (L1, L2 and L3) and LED luminaires (80 W-114 W) from three different manufacturers (L1, L4 and L5) were used for the M2 lighting class. The road geometry and designed road model for the M2 lighting class are shown in Fig. 2a.
The road model consists of a four-lane divided road. The width of each lane is 3.5 m. The road mo-del is illuminated with the luminaires placed oppo-site one another, i.e., in an opposite arrangement. This lighting situation is evaluated as A1 on a mo-
torway on which the typical speed of a motorized vehicle user is greater than 60 km/h. The road sur-face used is the R3 pavement class. The luminaire maintenance factor considered is 0.89 [22].
2.2.2. Road Design for the M1 Lighting Class
In the roads with M1 and M2 lighting classes, 250 W HPS and MH luminaires are commonly used. In this simulation, the M1 lighting class is se-lected and simulated as three lanes on both side. The width of each lane is 3.5 m. The lighting design is defined with the median arrangement in the A1 lighting situation. The road surface pavement type and maintenance factor are R3 and 0.89 respective-ly. The road geometry and designed road model for M1 lighting class are given in Fig. 2b.
The HPS and MH luminaires (250 W) from three different manufacturers (L1, L2 and L3) and two types of LED luminaires from two different ma-nufacturers (L3 and L6) are simulated for the M1 lighting class.
2.2.3. Results of the Road Design Calculations
The results of the road design calculations for the M1 and M2 lighting classes are in DIALux. As-
Fig. 2. Road Geometry: a) M2 Lighting Class, b) M1 Lighting Class
Table 2. Photometric Data of LED Luminaires
No Luminaire type Measured power, W
Power factor
Luminous flux, lm
Luminous efficacy, lm/W
Max. radiation angle, grad
(C, γ)
Luminous intensity curve
type
1 80W LED L1 79.35 0.984 7,392 93.1 180;63 limited
2 80W LED L4 79.9 0.934 8,654 108.3 45;49 semi-limited
3 105W LED L4 105.3 0.964 11,503 109.2 135;50 semi-limited
4 114W LED L5 112.6 0.980 8,869 78.8 160;60 semi-limited
5 170W LED L3 163.6 0.972 15,331 93.7 15;61 limited
6 153W LED L6 152.5 0.987 18,656 122.3 155;67 unlimited

Light & Engineering Vol. 27, No. 1
65
sociated with luminaire glare, the threshold incre-ment of 150 W L2 luminaire does not comply with the requirement of ≤10 for the M2 road class.
The L1 HPS luminaire had a maximum pole spacing of 36 m, and the installed power of the L1 luminaire is calculated to be 9,296 W/km. The L3 HPS luminaire consumes 8,619 W/km at a pole spacing of 35 m. In this case, the number of L1 lu-minaires per km is less than that of L3 luminaires, so the installation and maintenance costs will be less. On the other hand, the energy cost per km of the L3 luminaire is less than that of the L1 lumi-naire. Therefore, the total cost of the L1 and L3 luminaires (HPS and MH) should be calculated based on LCCA to determine the most cost-effec-tive luminaire.
In terms of energy consumption per km, LED luminaires are the most advantageous. However, installation and maintenance costs should also be examined to compare conventional and LED lu-minaires. The cost calculations and analysis of the luminaires for the M2 road lighting class are per-formed in Section 3.
3. LIFE CYCLE COST ANALYSIS (LCCA)
The life cycle cost analysis includes the installa-tion, maintenance, replacement, operation and sal-vage costs over the project lifetime. The net pre-sent value (NPV) is used to determine the present value of an investment, so all costs are conver-ted into their present values in the LCCA method. The equation (1) for the NPV total cost used in this study, considers both inflation and the interest rate.
( )( )
=
+=
+∑
k
kk
eNPV A
i
30
1
1* ,
1(1)
where A is the present cost, e is the inflation rate, i is the interest rate, k is the years.
First, the costs of the conventional luminaires were compared between themselves according to the LCCA method. After the cost analyses, the HPS and MH luminaires with the minimum total cost were selected. The 150 W HPS and 250 W HPS luminaires produced by manufacturer L3 have the minimum total cost compared with other HPS lu-
Table 3. Properties of Used Luminaires for LCCA in M2 Lighting Class
No Luminaire typeNumber of luminaires (piece/km)
Poles number
(piece/km)
Lamp lifetime
(h)
Replacement cycles(Year)
Price of luminaire
(TL/piece)
Price of lamp (TL/
piece)
1 150W HPS L3 58 58 20,000 5 140.00 33.00
2 150W MH L3 72 72 12,000 3 140.00 33.00
3 80W LED L1 74 74 50,000 13 420.00 -
4 80W LED L4 74 74 50,000 13 470.00 -
5 105W LED L4 64 64 50,000 13 530.00 -
6 114W LED L5 64 64 50,000 13 630.00 -
Table 4. Properties of Used Luminaires for LCCA in M1 Lighting Class
No Luminaire typeNumber of luminaires (piece/km)
Poles number
(piece/km)
Lamp lifetime
(h)
Replacement cycles (Year)
Price of luminaire
(TL/piece)
Price of lamp (TL/
piece)
1 250W HPS L3 64 32 20,000 5 212.00 45.00
2 250W MH L1 68 34 12,000 3 212.00 45.00
3 170W LED L3 76 38 50,000 13 400.00 -
4 153W LED L6 68 34 50,000 13 550.00 -

Light & Engineering Vol. 27, No. 1
66
minaires. Similarly, 150 W MH L3 and 250 W MH L1 luminaires have lower LCCs than other MH lu-minaires. However, all LED luminaires are incor-porated in the LCCA. As mentioned in Section 2.2, the properties of the analyzed luminaires for the M1 and M2 lighting class are listed in Tables 3 and 4. LCCA considers the costs of lighting installa-tion over its entire project life (generally 30 years in road lighting) [14]. The project life is assumed to be 30 years in this analysis, with a road lighting annual operation time of 3,650 hours. The econo-mic life of conventional luminaires is 30 years, and these luminaires are not replaced with new lumi-naires during this time. Replacement cycle is lamp replacement year for conventional luminaire and lu-minaire replacement year for LEDs.
On the other hand, LED systems are considered as a whole (including the module, driver, lens, etc.), so the lifetime of the luminaire is determined based on the components of the LED system. The lifetime of the driver is less than the LED source lifetime [23]. More than 90 % of LED systems fail because of the driver [23]. Currently, there is no standard for the replaceable parts of LED luminaires. Luminaire manufacturers urgently note that the lighting indu-stry should improve standardized drivers for use in LED lighting [23]. When luminaire failure oc-
curs individually in road lighting, the replacement and maintenance are more expensive and hence avoided by cities [24]. To achieve more economical and feasible maintenance, the lamps in street light-ing luminaires are replaced via group replacements rat her than spot replacement. In this study, the com-ponents of the LED luminaire (such as the driver and the LED module/light source) are not replaced during the time period but the replacement scheme of LED luminaires considers the entire LED lu-minaires to be replaced after their use of expected lifetime.
According to LCCA, subtracting the salvage va-lue (SV) from the sum of the installation cost (IC), energy cost (EC) and maintenance cost (MC) yields the total cost (TC) [11]. Cost calculations are made for a per kilometre road lighting investment, and equations are given below. The salvage value is cal-culated for the unused period of replacement pro-ducts during the economic lifetime. In other words, only the final replaced LED luminaires over the project lifetime have salvage value. The environ-mental waste of luminaires and components are re-cycled for free of charge by municipality in Tur-key, so the disposal costs were not considered in the LCCA in this study.
Table 5. Results of NPV Total Costs for M2 Lighting Class
No Luminaire type Initial cost, TL/km
Energy cost, TL/km
Maintenance cost,
TL/km
Salvage value,
TL/km
Total cost,TL/km
1 150W HPS L3 154,976.00 173,473.47 11,379.34 - 339,828.82
2 150W MH L3 168,588.00 215,636.21 22,956.06 - 407,180.28
3 80W LED L1 194,139.00 118,111.23 41,683.97 12,670.98 341,263.22
4 80W LED L4 191,734.00 119,004.88 52,888.19 14,179.43 349,447.64
5 105W LED L4 183,712.00 135,255.69 50,740.32 13,828.82 355,879.19
6 114W LED L5 186,944.00 145,045.62 58,943.61 16,438.03 374,495.21
Table 6. Results of NPV Total Costs for M1 Lighting Class
No Luminaire type Initial cost, TL/km
Energy cost, TL/km
Maintenance cost,
TL/km
Salvage value,
TL/km
Total cost,TL/km
1 250W HPS L3 96,704.00 302,071.04 16,322.06 - 415,097.10
2 250W MH L1 99,297.00 405,259.86 28,077.40 - 532,634.26
3 170W LED L3 116,698.00 250,255.23 47,483.18 12,393.76 402,042.65
4 153W LED L6 115,515.00 208,720.46 55,619.08 15,247.58 364,606.96

Light & Engineering Vol. 27, No. 1
67
,TC IC MC EC SV= + + − (2)
( ) ( )( ) ( )
( )
= + + + +
+ + + + +
+ +
p mp p mp
p mp p mp
p mp
IC N N N L L L
P P P C C C
YC YC YC
* *
* *
* ,
(3)
( )( ) ( )
*
* * / * ,
p mp
n p p d
MC L L L
S S F N S t
= + +
+ +(4)
3* *365 * *10 * ,i p oEC N P E t−= (5)
where N is the number of luminaire, Np is the price of a luminaire, Nmp is the luminaire mounting price, L is the number of lamp, Lp is the price of a lamp, Lmp is the lamp mounting price, P is the number of pole, Pp is the price of a pole, Pmp is the pole mount-ing price, C is the cable length, Cp is the cable price per metre, Cmp is the cable mounting price per me-tre, YC is the underground cable length, YCp is the underground cable price per metre, YCmp is the un-derground cable mounting price per meter, S is the number of luminaires maintained in an hour, Sn is the number of maintenance staff, Sp is the daily price of staff, Fp is the fuel price of vehicle per day, td is the daily working time, Pi is the power of the luminaire, Ep is the energy unit price per kWh, to is the daily operation time of luminaire.
Maintenance, energy and salvage costs are cal-culated with the NPV method [13]. The mainte-nance cost is separately calculated for every re-placement period and then the total maintenance cost is obtained according to NPV method. The re-placement cost of electromagnetic ballast is also added to equation (4) for the conventional lumi-naires. The present value of the total energy cost in the project lifetime is calculated using the follow-ing equation [25, 26]:
( )
30
Total Energy Present Value
1 e11 iEC* 1 e * .
i e
=
+ − += +−
(6)
In this study, the unit of currency used is the Turkish Lira (TL). In contrast with European coun-tries, high interest and inflation rates are used in Turkey, so these rates should be considered for long-time economic investment analysis. The in-
terest (i) and inflation rates (e) of the Turkish Cen-tral Bank are considered in the calculations because the luminaires are utilized for road lighting in Tur-key. The average inflation and interest rate are ta-ken to be 8.5 % and 10.5 % respectively [27, 28]. The prices of luminaires are obtained from daily lu-minaire catalogues of manufacturers. Other labour and mounting costs are defined based on recent pri-ces in Turkey.
Maintenance costs for conventional lumi-naires comprises re-lamping, replacement ballast and cleaning of luminaires. When the lamp is re-placed, cleaning of luminaires is also conducted. The replacement of electromagnetic ballast is done two times in project life. The prices of 150 W and 250 W electromagnetic ballasts are 32.00 and 43.00 TL/piece, respectively. Conventional luminaires are assumed to not be replaced during the 30-year life-time. On the other hand, LED luminaires are ac-cepted as integrated LED luminaire, so re-lamping is not considered for LED luminaires. The lifetime of LED luminaires average 50,000 hours, and the replacement time is calculated to be 13.7 years. LED luminaires are replaced twice in 30 years. These dates of replacement were approximately as-sumed as 13 and 27 of years. Moreover, mainte-nance of LED luminaires is performed once every 5 years. The maintenance cost in (4) also depends on staff costs, fuel costs, operation time and num-ber of lamps. Two laborers re-lamp and maintain ten luminaires in an hour. The daily cost for staff and daily working time are 80.00 TL/day and 8 hours, respectively. The daily fuel cost of a vehicle for transportation is 150.00 TL/day. The daily opera-tion time of luminaires is assumed to be 10 hours, and the total annual operating time is 3,650 hours. The unit electrical energy cost for lighting is 0.257 TL/kWh in Turkey. The calculation of the energy cost is shown in equation (5).
The installation cost in equation (3) consists of the lamp, pole, cable, labour and luminaire costs. The numbers of luminaires and poles per km were calculated using the DIALux lighting design pro-gram. The price of a pole with accessories avera-ges 750.00 TL/piece, and the pole mounting price is 10.00 TL/meter (of pole height). The prices of the mounting luminaire and lamp are 75.00 and 5.00 TL/piece respectively. The cable cost is calculated for both overhead and underground cables. The un-derground cable length is calculated by multiplying of the pole numbers with the pole spacing; overhead

Light & Engineering Vol. 27, No. 1
68
cable length is calculated by multiplying the mount-ing height of a luminaire by the number of poles per km. The underground cable and mounting pri-ces are 7.50 and 35.00 TL/m respectively. The over-head cable and mounting prices are 4.50 and 2.00 TL/m respectively.
The salvage value is calculated for the last re-placed LED luminaries. If the economic analy-sis period (project life) is assumed to be 30 years, a LED luminaire will be used for 13.7 years assum-ing an annual operation time of 3,650 hours and LED luminaire lifetime of 50,000 hours. LED lumi-naires should be replaced with new ones at the end of 50,000 hours. The last replacement luminaire is thus used only 2.6 years. In this situation, the sal-vage value of the unused period of the luminaire lifetime should be calculated. Thus, the salvage va-lue is subtracted from the total cost due to the ser-viceable time of the LED luminaire. When the se-cond replacement is performed, the calculation of the unused rate of the luminaire is shown in (7) [11].
( )
− × × − =
30 2 13.7100 1 81%.
13.7(7)
During the project lifetime, 81 % of the lifetime of the last replaced LED luminaire is not used. If luminaire price is 470.00 TL, the salvage value of the last replaced LED luminaire is calculated to be 470.00 TL*0.81=370.70 TL. This value will de-pend on the inflation and interest rate in the future, so equation (1) is used to calculate the present value of the salvage value.
4. RESULTS OF COST ANALYSES
The life cost cycle analyses of the luminaires are defined for an operation time of 30 years. The NPV of the total cost includes the installation, energy, and maintenance costs and salvage value. The cost re-sults of luminaires per km for the M2 and M1 road classes are listed in Tables 5 and 6.
According to Table 5, HPS L3 and LED L1 lu-minaires have almost the same life cycle cost and are more cost effective luminaires for the M2 road class. Whereas the energy cost of the HPS L3 lumi-naire is approximately 32 % greater than that of the LED L1 luminaire, the initial cost of HPS L3 lumi-naires is approximately 20 % less than that of the LED L1 luminaire. The maintenance cost includes
replacement of the whole luminaire for LEDs, but it includes only lamp replacement for conventional lu-minaires. Therefore, the maintenance costs of LED luminaires are greater than those of conventional lu-minaires. The MH luminaire has the greatest total cost due to its low efficacy (lm/W) and short lamp lifetime.
According to the results presented in Table 6, the LED L6 luminaire is the most profitable investment compared with other luminaires for the M1 lighting class. Although the number of LED L6 luminaires per km (68 / km) is greater than that of conventional luminaires (64 / km), the energy cost of LED L6 lu-minaires is less than that of the others because of the high luminaire efficacy. Additionally, the electro-magnetic ballast losses of conventional luminaires cause significant energy consumption. The energy and total costs of MH luminaires are approximately 48.5 % and 31 % respectively and are greater than those of the LED L6 luminaire.
5. CONCLUSIONS
In this study, the photometric values of conven-tional and LED luminaires that belong to the M1 and M2 road lighting classes were measured in the laboratory. Design calculations were performed us-ing the DIALux software package to optimize the maximum pole spacing while satisfying the mini-mum road lighting criteria for different road lighting classes. The most cost-effective conventional lumi-naires were compared with state-of-the-art LED lu-minaires using the LCCA method, which considers the installation, energy, maintenance costs and sal-vage value.
The LCCA calculations show that the 80 W LED L3 and 150 W HPS L1 luminaires have almost the same cost effectiveness for a new road lighting ap-plication assuming a 30-year operation time and the M2 road lighting class. However, using LED lu-minaires can be more beneficial considering ener-gy savings, CO2 emissions due to power plants and lighting quality. MH luminaires have the highest to-tal cost for the M1 and M2 road lighting classes. On the other hand, 153 W LED L6 luminaires have lower total cost than the 250 W HPS and MH lu-minaires in the M1 road lighting class. In all cate-gories, the installation costs of LED luminaires are greater due to their luminaire price, whereas the energy costs of LED luminaires are less than those of conventional luminaires.

Light & Engineering Vol. 27, No. 1
69
This study also shows the importance of compa-risons of different luminaire technologies (HPS, MH, and LED) in terms of energy savings, light-ing quality, and cost effectiveness. According to the results, the cost effectiveness of LED systems par-ticularly depends on two key parameters: the price of electricity and the price of the luminaire. In the future, LEDs will be more commonly used as the price of the luminaire keeps decreasing. If the price of electricity increases due to depletion of oil re-sources, LED luminaires will be more advantageous economically for roadway lighting.
ACKNOWLEDGMENT
The authors would like to thank The Scientif-ic and Technological Research Council of Turkey (TUBITAK) and Scientific Research Project Co-ordination of Yıldız Technical University (YTU-BAPK-Grand Number: 2015–04–02-KAP01) for the financial support during the duration of this study.
REFERENCES
1. IEA (International Energy Agency), “Light’s La-bour’s Lost: Policies for energy-efficient lighting,” Par-is, 2006.
2. K. A. Avrenli, R.R. Benekohal, and J. Medina, “LED roadway lighting, Volume 1: Background informa-tion,” FHWA-ICT-12–012, Illinois, 2012.
3. The Climate Group, “Lighting the Clean Revo-lution: The rise of LEDs and what it means for cities,” London, 2012.
4. Dubois M. C and Blomsterberg A, “Energy sav-ing potential and strategies for electric lighting in fu-ture North European, low energy office buildings: A li-terature review,” Energy Build., 2011, Vol. 43, no. 10, pp. 2572–2582.
5. E. Juntunen, E. Tetri, O. Tapaninen, S. Yrjänä, V. Kondratyev, A. Sitomaniemi, H. Siirtola, E. Sarjano-ja, J. Aikio, and V. Heikkinen, “A smart LED luminaire for energy savings in pedestrian road lighting,” Light. Res. Technol., 2015, Vol. 47, no. 1, pp. 103–115.
6. J. D. Bullough, L.C. Radetsky, U.C. Beseneck-er, and M.S. Rea, “Influence of spectral power distribu-tion on scene brightness at different light levels,” LEU-KOS, 2014, Vol. 10, no. 1, pp. 3–9.
7. DOE (U.S. Department of Energy), “Solid-state lighting program ‘R&D plan,” 2016.
8. L. Domenichini, F. La Torre, D. Vangi, A. Vir-ga, and V. Branzi, “Influence of the lighting system on the driver’s behavior in road tunnels: A driving sim-ulator study,” J. Transp. Saf. Secur., 2017, Vol. 9, no. 2, pp. 216–238.
9. S. Guo, H. Gu, L. Wu, and S. Jiang, “Energy-sav-ing tunnel illumination system based on LED’s intelli-gent control,” J. Phys. Conf. Ser.,2011, Vol. 276, no. 1, p. 12164.
10. L. Tähkämö and L. Halonen, “Life cycle as-sessment of road lighting luminaires – Compari-son of light-emitting diode and high-pressure sodium technologies,” J. Clean. Prod., vol. 93, 2015, no. 1, pp. 234–242.
11. K. A. Avrenli, R.R. Benekohal, and J. Medina, “LED roadway lighting, Volume 2: Field evaluations and software comparisons,” FHWA-ICT-12–013, Illi-nois, 2012.
12. FHWA U.S. Department of Transportation Fede-ral Highway Administration Office of Asset Management, “Life-cycle cost analysis primer,” Washington, 2002.
13. S. Onaygil, O. Guler, and E. Erkin, “Cost analy-ses of LED luminaires in road lighting,” Light Eng., 2012, Vol. 20, no. 2, pp. 39–45.
14. L. Tähkämö, A. Ylinen, M. Puolakka, and L. Hal-onen, “Life cycle cost analysis of three renewed street lighting installations in Finland,” Int. J. Life Cycle Assess., 2012, Vol. 17, no. 2, pp. 154–164.
15. Y. Jiang, S. Li, B. Guan, and G. Zhao, “Cost ef-fectiveness of new roadway lighting systems,” J. Traffic Transp. Eng., 2015, Vol. 2, no. 3, pp. 158–166.
16. T. Welz, R. Hischier, and L.M. Hilty, “Environ-mental impacts of lighting technologies – Life cycle as-sessment and sensitivity analysis,” Environ. Impact As-sess. Rev., Apr. 2011, Vol. 31, no. 3, pp. 334–343.
17. CIE115:2010, “Recommendations for the light-ing of roads for motor and pedestrian traffic,” Vienna, Austria, 2010.
18. IES LM-54–99, “Guide to Lamp Seasoning,” 1999.
19. IES LM-79–08, “The electrical and photomet-ric measurements of solid-state lighting products,” 2008.
20. EN13201–3, “Standard EN13201–3 Road Light-ing-Part 3 Calculation of performance,” 2013.
21. EN13201–1, “Standard EN13201–1 Road light-ing – Part 1: Selection of lighting classes,” 2004.
22. CIE180:2007, “Road transport lighting for deve-loping countries,” Vienna, Austria, 2007.
23. DOE (U.S. Department of Energy), “LED Lumi-naire Lifetime: Recommendations for testing and report-ing,” 2011.

Light & Engineering Vol. 27, No. 1
70
24. L. Tähkämö, R.-S. Räsänen, and L. Halonen, “Life cycle cost comparison of high-pressure sodium and light-emitting diode luminaires in street lighting,” Int. J. Life Cycle Assess, 2016, Vol. 21, no. 2, pp. 137–145.
25. R. Teodorescu and M. Katsanevakis, “An optimi-zation method for designing large PV plants,” J. Photo-voltaics, 2013, Vol. 3, no. 2, pp. 814–822.
26. State of Illinois Capital Development Board, “Life cycle cost analysis manual,” Illinois, 1991.
27. CBRT, “The Central Bank of The Republic of Turkey,” 2016. [Online]. Available: http://www.tcmb.gov.tr/wps/wcm/connect/tcmb+en/tcmb+en. [Accessed: 12-Sep-2016].
28. TSI, “Turkish Statistical Institute.” [Online]. Available: http://www.turkstat.gov.tr/Start.do. [Accessed: 12-Sep-2016].
Ramazan Ayazreceived the B.Sc, M.Sc. and Ph.D. degrees in the Department of Electrical Engineering from the Yildiz Technical University (YTU) in 2010, 2012 and 2018 respectively. He is working as a Research Assistant at the Department of Electrical Engineering, Yildiz Technical University, Turkey. His research areas are road lighting, lighting measurements, energy efficient and photovoltaic systems
Asiye Kaymaz Ozcanlireceived the B.Sc. degree in Electrical Engineering and Mechanical Engineering from Yildiz Technical University in 2014. She received the M.Sc. degree in the Department of Electrical Engineering from Yildiz Technical University in 2016, Turkey. She is currently pursuing doctoral study in Yildiz Technical University, Turkey
Ismail Nakirreceived the B.Sc, M.Sc. and Ph.D. degrees in the Department of Electrical Engineering from the Yildiz Technical University (YTU) in 2004, 2007 and 2012 respectively. He is working as an Assistant Professor at the Department of Electrical Engineering, Yildiz Technical University, Turkey. His research areas are lighting technologies and renewable energy resources
Pramod Bhusalreceived his Ph.D. in Illumination Engineering in 2009 from Helsinki University of Technology, Espoo, Finland. He is researcher at Lighting Unit, Aalto University, Finland. He has been the key expert in several national and international research, networking and education development projects in the field of lighting. His research interests include energy efficient lighting controls and systems, colorimetry, human centric lighting, and lighting measurements. He has more than 20 scientific publications in the field
Adem Unalreceived the B.Sc, M.Sc. and Ph.D. degrees in the Department of Electrical Engineering from the Yildiz Technical University (YTU) in 1978, 1982 and 1995 respectively. He is Assistant Professor at the Electrical Engineering in Yıldız Technical University, Turkey. His research areas are lighting technologies and circuit theory

71
Fig.4. Subjects performing the different activities of reading, watching TV, eating and relaxing while being completely immersed in the three different CCT
Fig.1. Experimental room with tuneable LED lighting system generating three scenes of CCTs 3000 K, 4000 K and 6500 K respectively at an average constant illuminance of 300 lx at the table-top
Amardeep M. Dugar and Dashak AgarwalA Pilot Study Assessing Short-Term Chromatic Adaptation Preferences
for Correlated Colour Temperature in India

72
Fig. 4. The Bubble dress
Juri V. Nazarov and Violet V. PopovaLight Design and Textiles
Fig. 3. A “catching sights” dressFig. 1. Galaxy Dress
Fig. 2. Textiles of LumiGram Company

73
Fig.8. A fluorescent demi-season jacket
Juri V. Nazarov and Violet V. PopovaLight Design and Textiles
Fig.7.The fluorescent silk dressesFig. 5.The Twitter dress
Fig.6. A fragment of the designer Rami Kadi collection

74
Fig. 4. Experimental setup using microcontroller to interface gas and smoke sensor with emergency light
Fig. 1. Block diagram of gas & smoke sensor module
Shibabrata Mukherjee, Parthasarathi Satvaya, and Saswati Mazumdar Development of a Microcontroller Based Emergency Lighting System with Smoke Detection and Mobile Communication Facilities
Fig 3. Flow chart to interface gas and smoke sensor with emergency light

75
Light & EngineeringVol. 27, No. 1, pp. 75–85, 2019
DESIGN OF SOLAR-POWERED LED ROAD LIGHTING SYSTEM
Canan PERDAHCI1 and Hamdi OZKAN2
1Department of Electrical Engineering, Faculty of Engineering, University of Kocaeli, Turkey 2Litpa Lighting Koza Plaza, ISTANBUL
E-mails: [email protected], [email protected]
ABSTRACT
Turkey is rich in terms of renewable energy sources and, therefore, is now encouraging the use of sustainable clean lighting systems in road ap-plications. High pressure sodium lamp is the most widely used type in main roads, but other types of lamps such as mercury vapour lamps or metal hali-de lamps can be utilized for street lighting. Since it enables energy and money saving, LED light tech-nology has replaced high pressure sodium lamps no-wadays. Once solar power system (PV) is integrat-ed with LED lamp for street lighting, the amount of saving and local impact might be enriched.
LEDs used as light sources in road lighting lu-minaires with rising lumen values, decreasing junc-tion temperature, higher colour rendering efficien-cy, longer lifetime have become more efficient than many light sources with the latest developments. Since the structure of the luminaires in which the LED light sources are used differs from that of the conventional light sources, the optical, thermal and electrical design of the LED luminaires must be considered differently. Thus, this study concentrates upon design considerations and the operating prin-ciple of solar-powered LED road lighting luminaire in details. Also, a simple solar panel system was de-signed and the economical values obtained at the end of 20 years were compared when using the on-grid system and the off-grid system.
Keywords: solar-powered LED luminaire, road lighting, energy saving
1. INTRODUCTION
When evaluated in terms of usage areas of elec-tric energy, it becomes clear that the consump-tion amount in parks, gardens and road lighting ar-eas is high and it is vital to save on energy in these areas. Providing the same lighting level with less energy consumption without compromising the quality of lighting and using more efficient lighting luminaires as well as obtaining good lighting con-ditions is energy saving in lighting. The necessity to save energy in lighting caused a great deal of in-crease in the use of renewable energy. Because the sun is an efficient solution to generate renewable energy since its rays reaches everywhere on earth and free to harness, the renewable energy obtained from the sun has become one of the major energy sources in many applications [1]. Because of be-ing convenient in panel selection depending on the needs, its use in off-grid environments and its in-tegration into existing structures, the use of photo-voltaic panels, which is a way of obtaining renew-able energy, has become widespread in a short time in lighting systems [2]. Many studies in the field of LED lighting have validated that LED lighting sys-tems are both economically feasible, energy saver as well as preventative of CO2 emissions [3, 4–9].
Nowadays, thanks to advances in lighting tech-nology, LED lighting systems which are used in many areas offer innovative and timeless solu-tions in park, garden and road lighting areas. The use of LED luminaires with longer lifetime, higher colour rendering efficiency, easier regulation of lu-minous flux and lower operating costs than tradi-

Light & Engineering Vol. 27, No. 1
76
tional luminaires has been an energy-efficient ap-plication in recent years. With the ever-evolving technology, the luminous efficiency factor (lm/W) values of the lumen-generated luminous flux per lamp power are increasingly rising and the use of LED light sources in road lighting applications is increasing day by day. [3]
Diodes consisting of semiconductor materials emit light when applied the current and current is obtained when it is exposed to light. When ap-plied the voltage, the LED lamp starts to emit light when its electrons are activated. They are produced in such a way that they can give a wide spectrum of light ranging from infrared to violet [10,11].
Photovoltaic modules are the elements that con-vert solar energy into electricity. Photons from the sun transfer their energy to the junctions in the cells on a semiconductor module. This transmit-ted energy triggers the electron movement, which leads to electric current. This electrical current can be used directly as a direct current by connecting a load between the contacts of the cell. [2] The ac-quired electric current can be used as direct current (DC) or alternatively can be converted to alternating current (AC) or stored for later use [10].
In terms of the amount of solar energy radia-tion in Istanbul, especially in the winter months, is
very low levels of lighting energy should be provi-ded at the lowest powers. For this reason, we pro-duced a luminaire with low powers for this system.
2. DESCRIPTION OF SOLAR-POWERED LED ROAD LUMINAIRE DESIGN COMPONENTS
We have designed and produced solar-pow-ered LED lighting luminaires for walking paths, parks and gardens. We can produce our luminaires 33W-45W-67W, and we did not need to produce high-powered luminaires as the system would work with solar energy. The luminaire we have develo-ped is also suitable for use in the road categories M3 and M4. We have also prepared infrastructure for the streets in the M2 road category and we are in the design phase.
Among our targets, we are also planning to de-velop this type of luminaires for the roads in the M1 category. We plan a solar powered system with sen-sor and different dim levels that can program itself during the night. That is why our goal is to make sure that the batteries we use have longer lifetimes or are smaller in sizes. In the next stage, we plan to add both the solar and intelligent automation pro-gram to the luminaire. Furthermore, the motion sen-sor will reduce the dim level when not needed.
As the system’s nature requires, we did not use the standard drivers sold on the market. In our so-lar electronic board, Figs. 1,2,3, we used current fixing module, diode, 2 pin terminal, 3 pin termi-nal, 6 pin connector cable, 6 pin SMD connector, 6 pin horizontal connector.
In order to provide energy efficient solutions for lighting walking roads, parks, gardens and roads, it is necessary to use LED light sources with high lu-minous efficiency factor values in LED street lu-
Fig. 1. LITPA LYS20/DC Solar-Powered LED Luminaire
Fig.2. The Dimensions of LITPA LYS20/DC Solar-Powered LED Luminaire
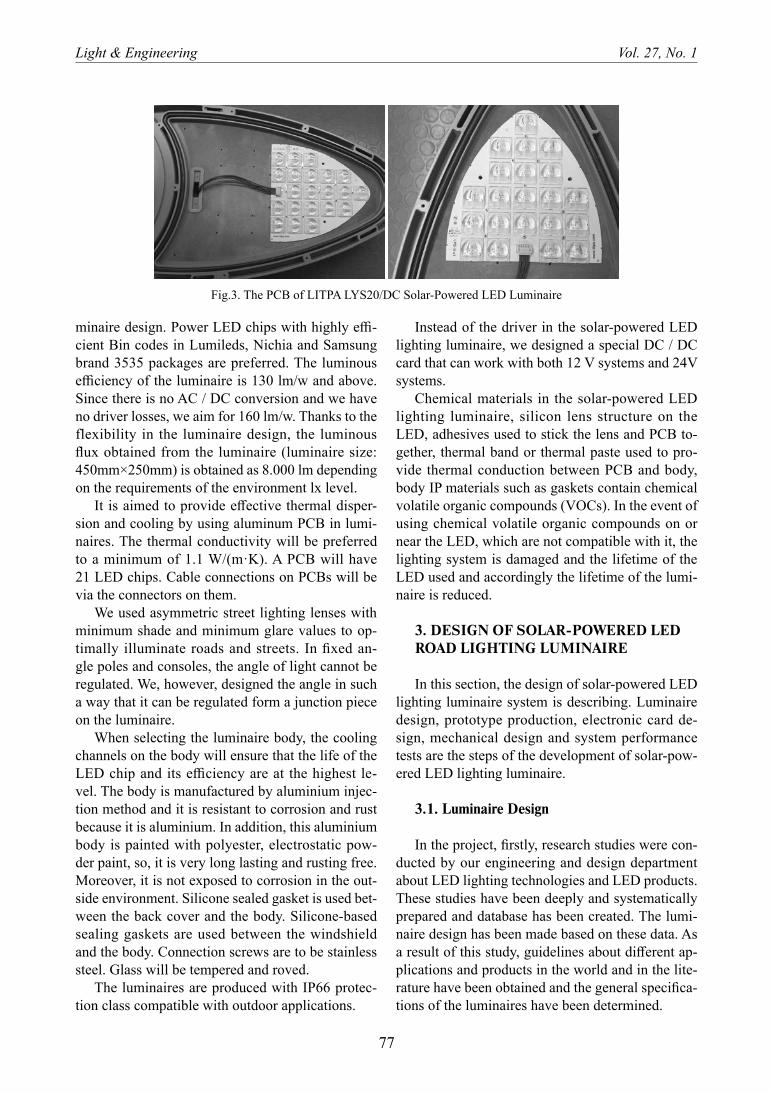
Light & Engineering Vol. 27, No. 1
77
minaire design. Power LED chips with highly effi-cient Bin codes in Lumileds, Nichia and Samsung brand 3535 packages are preferred. The luminous efficiency of the luminaire is 130 lm/w and above. Since there is no AC / DC conversion and we have no driver losses, we aim for 160 lm/w. Thanks to the flexibility in the luminaire design, the luminous flux obtained from the luminaire (luminaire size: 450mm×250mm) is obtained as 8.000 lm depending on the requirements of the environment lx level.
It is aimed to provide effective thermal disper-sion and cooling by using aluminum PCB in lumi-naires. The thermal conductivity will be preferred to a minimum of 1.1 W/(m·K). A PCB will have 21 LED chips. Cable connections on PCBs will be via the connectors on them.
We used asymmetric street lighting lenses with minimum shade and minimum glare values to op-timally illuminate roads and streets. In fixed an-gle poles and consoles, the angle of light cannot be regulated. We, however, designed the angle in such a way that it can be regulated form a junction piece on the luminaire.
When selecting the luminaire body, the cooling channels on the body will ensure that the life of the LED chip and its efficiency are at the highest le-vel. The body is manufactured by aluminium injec-tion method and it is resistant to corrosion and rust because it is aluminium. In addition, this aluminium body is painted with polyester, electrostatic pow-der paint, so, it is very long lasting and rusting free. Moreover, it is not exposed to corrosion in the out-side environment. Silicone sealed gasket is used bet-ween the back cover and the body. Silicone-based sealing gaskets are used between the windshield and the body. Connection screws are to be stainless steel. Glass will be tempered and roved.
The luminaires are produced with IP66 protec-tion class compatible with outdoor applications.
Instead of the driver in the solar-powered LED lighting luminaire, we designed a special DC / DC card that can work with both 12 V systems and 24V systems.
Chemical materials in the solar-powered LED lighting luminaire, silicon lens structure on the LED, adhesives used to stick the lens and PCB to-gether, thermal band or thermal paste used to pro-vide thermal conduction between PCB and body, body IP materials such as gaskets contain chemical volatile organic compounds (VOCs). In the event of using chemical volatile organic compounds on or near the LED, which are not compatible with it, the lighting system is damaged and the lifetime of the LED used and accordingly the lifetime of the lumi-naire is reduced.
3. DESIGN OF SOLAR-POWERED LED ROAD LIGHTING LUMINAIRE
In this section, the design of solar-powered LED lighting luminaire system is describing. Luminaire design, prototype production, electronic card de-sign, mechanical design and system performance tests are the steps of the development of solar-pow-ered LED lighting luminaire.
3.1. Luminaire Design
In the project, firstly, research studies were con-ducted by our engineering and design department about LED lighting technologies and LED products. These studies have been deeply and systematically prepared and database has been created. The lumi-naire design has been made based on these data. As a result of this study, guidelines about different ap-plications and products in the world and in the lite-rature have been obtained and the general specifica-tions of the luminaires have been determined.
Fig.3. The PCB of LITPA LYS20/DC Solar-Powered LED Luminaire

Light & Engineering Vol. 27, No. 1
78
Research and development activities carried out in the luminaire design include the design of a street lighting luminaire consisting of LEDs, the prototype production and the verification of its performance, and the determination of the system’s overall energy consumption and lighting performance. The choice of LED, the number and configuration of the LEDs on the luminaires (distance and angles between them) will be determined in line with optical and thermal parameters. The detailed design of the op-timum luminaire will be done in computer environ-ment considering the manufacturability, aesthet-ic, ergonomic and mechanical aspects. Optical and thermal simulations are performed and the design has been verified in the computer environment be-fore the detailed design and technical drawing work have started. This phase has been essential in the production of the optical and thermal design of the product.
3.2. Prototype Production
In this research and development stage, the ma-nufacturing drawings of the components that make up the luminaire will be obtained in the 3D design environment on the computer. In design, a 3D-CAD design package is used and each part and moulds are simulated in computer environment. Lumi-
naires made with detailed designs are transferred to prototype production and after prototype parts have been verified, mould designs have been made for each part individually. It has been carried out within the possibilities of operating moulds or sup-plier companies.
3.3. Electronic Card Design
The PCB, Fig.4, as the light source of the lumi-naire consists of 7 series, 3 parallel circuits, and has 21 LEDs. Each parallel circuit is driven by its own current stabilizer. The current-stabilizing module has been selected according to the current we want to drive the LEDs. We selected current stabilizer of 350mA for 22W, 500mA for 33W and 700mA for 48W. We also placed a diode on the circuit that pro-vides reverse polarity protection to prevent the risk of reversing the – and + inputs coming from the bat-tery. Our current-stabilizing modules are to be fed by 24V DC battery voltage so that we can provide energy to 7 series of LEDs via the battery voltage obtained at the output.
The biggest advantage of this electronic card we have developed is that the controller on the sys-tem can supply the energy from the battery direct-ly to the lighting luminaire. Thus, the need to use a classic driver in the luminaire is gone. AC / DC
Fig. 4. The Electronic Card of LITPA LYS20/DC Solar-Powered LED Luminaire
Fig. 5. The Measurement of LITPA LYS20/DC Solar-Powered LED Luminaire

Light & Engineering Vol. 27, No. 1
79
converter is not necessary and the system works much more efficiently from DC to DC.
The electronic board is made of aluminium ma-terial with a thickness of 1.6 mm and a heat trans-fer coefficient of 1.1 W/(m∙K). The cable connec-tions were made via the connectors on the PCB. The LEDs and connectors on the card will be automati-cally sequenced and quality controlled.
3.4. Mechanical Design
The entire luminaire will be designed depen-ding on the optical and thermal priorities. Mount-ing brackets can be configured so that they can be mounted on both poles and consoles and can be an-gled up to 15 degrees in 5 degrees increments in + and – directions. The weight optimization was made so as not to affect the thermal performance adverse-ly. It is user-friendly as it is easy to mount and in-stall. Moreover, its ergonomics design makes sub-sequent service and maintenance activities easy. In this sense, the electrical connections and elec-tronic card maintenance services can be done by opening the back cover without touching the LED part.
3.5. System Performance Tests
Following the prototype production, the product type and performance tests were first made in the
goniophotometer system in Litpa Lighting laborato-ries, Fig. 5, and the second stage tests were carried out in line with the CE marking requirements in the independent testing laboratories. The quality of the product for the industry, such as resistance to envi-ronmental conditions and cost of use (energy con-sumption, ease of maintenance, spare parts, etc.) are extremely important for customer satisfaction and tests under the relevant standards have been tho-roughly applied. Energy consumption and lighting performance of the complete system will also be tested and necessary improvements will be made.
4. DESIGN OF SOLAR LED LIGHTING SYSTEM
Traditional grid-powered lighting systems are a lot less complicated than PV lighting systems when their design and installation requirements are considered. PV lighting systems also have higher initial purchase and maintenance cost for many of their components when compared to grid powered traditional lighting systems. Therefore, there is rela-tively limited usage of lighting applications appro-priate for PV lighting systems. Nevertheless, it is possible to develop successful PV lighting applica-tions with the help of comprehensively planned de-sign processes. [12]
The proposed photovoltaic system, which con-sists of a solar panel, the LED road lighting lu-
Table1. Calculated Values for Photovoltaic Panel
MonthEnergy/Day, Coefficient of
Panel Efficiency,%
Panel Area, m2
Daily produced amount of energy
kWh/m2 panel tilt angle
1 2 1.15 0.167 1.64 0.629924
2 2.57 1.15 0.167 1.64 0.809452
3 4.2 1.15 0.167 1.64 1.32284
4 5.28 1.15 0.167 1.64 1.662999
5 6.3 1.15 0.167 1.64 1.984261
6 6.79 1.15 0.167 1.64 2.138592
7 6.79 1.15 0.167 1.64 2.138592
8 6.07 1.15 0.167 1.64 1.911819
9 5.09 1.15 0.167 1.64 1.603157
10 3.74 1.15 0.167 1.64 1.177958
11 2.37 1.15 0.167 1.64 0.74646
12 1.8 1.15 0.167 1.64 0.566932

Light & Engineering Vol. 27, No. 1
80
minaire, a charge controller/MPPT, an electrical energy storage battery, are illustrated in Fig.6. The working principle of this system (the photovoltaic principle) can be described as the next:
– The solar panels receive solar radia-tion throughout the day;
– After that, the solar radiation is converted into electrical energy through charge and discharge controller;
– Finally, that electrical energy is stored in the rechargeable battery.
The storage place of the electric power genera-ted by the solar PV panel is the rechargeable bat-tery during the daytime. When the battery is ful-ly charged, the battery charging unit detects this and stops charging and keeps system ready for use. At night, the solar energy stored in the rechargea-ble battery is released to power the LED lighting system and light the street lamps. The street lights function steadily as the design of the batteries can meet the voltage and current requirements.
5. EXPERIMENTAL RESULTS
Experiment was conducted in Istanbul. There are many parameters that affect the efficient opera-tion of the photovoltaic system. Experiment results are summarized at the Table 1. This table indicates the required parameters’ values in order to calculate the amount of energy daily produced.
The determination of the amount of energy to be consumed daily is a crucial part in designing off-grid PV system. We have determined the photovol-
taic power according to the daily energy consump-tion demanded by the user.
In the first two columns of the Table 1, the dai-ly amount of energy we obtained and the coefficient of panel tilt angle are given. The daily amount of energy values in [kWh/m2] are based on data from Fig. 7, [13].
The coefficient of tilt angle of the panel for Is-tanbul is considered as 1,15. The coefficient of pa-nel tilt angle has been calculated in December for the northern latitude of 40 ° 11 ‘ in which Istanbul is located.
According to panel catalogue information given in Table 2, panel efficiency is calculated by conside-ring the electrical parameters of TT275–60W panel for 1000 W/m2. When the radiation is 1000 W/m2 and the rated power is 275 W/m2, the efficiency of a panel of 1640 mm × 990 mm × 35 mm is acquired as 16 %.
Table 2. Solar Cell Parameters (Tommatech), [15]
STK Electrical Parameters
Nominal Power (Pmax) TT275–60P
Open Circuit Voltage (VOC) 37,30 V
Short Current Voltage (ISC) 9,20 A
Nominal Power Voltage (Vmp) 31,3 V
Nominal Power Current (Imp) 8,78 A
Number of Cells 60 (156*156)
Dimension (mm) 1640*990*35
Weight (kg) 19
Max. System Voltage 1000W DC
Max. Series Fuse Rating 15A
Operation Temperature -40 0C to +85 0C
Fig. 6. The Block-Diagram of the Lighting System
Fig. 7. Istanbul Global Radiation Values (kWh/m2) per day

Light & Engineering Vol. 27, No. 1
81
The amount of energy daily produced is calculat-ed by multiplying these four parameter values: ener-gy/day in kWh/m2, coefficient of panel tilt angle, panel efficiency and panel area in m2.
The panel that produces in December energy per day equal to 0.56 kWh meets the energy we need as 0,42 kWh. Therefore, TT275–60W panel type is suitable for this system.
( )( )
E L,
s .PSH Ppv Sf
η=
48W x 9 hrs 1 ,2,0,9 . 2,1 hrs
Ppv x=
274,28 ,Ppv W=
were Sf is the safety factor, Ppv is the panel power,E(L) is the daily energy consumption, ƞ(s) is the
system efficiency, PSH is the peak Sun hours
( ) ( )( )
,
E L x a tCwh
DOD x c xVbη=
( )48 9 1 ,
0,5 0,95 1 2 x x
Cwhx x
=
Cwh = 75.79 A∙h,
where a(t) is the number of autonomous days, n(c) is the efficiency of battery, Vb is the voltage of bat-tery, Cwh is the battery energy storage.
5.1. Charge Controller/ MPPT
( ) ( )V in V oc of the PV Panels 37,3 V.= =
( ) ( )I in I sc of the PV Panels 9,20 A.= =
( )V outCharge Voltage of the battery group
12 V 14,4 V.
== =
= −
( ) ( )Pp x chargerI out ,
Charge Voltage η
=
( ) 275 0,95I out ,14,4 V
×=
( )I out 18,14 A= , [16].
While the solar panel in the blog diagram of the lighting system shown in Fig. 8 is calculated, safe-ty factor 1.2; daily energy consumption 9 hours, lamp power 48 W, system efficiency 0.9 and peak sun hour 2.1 were taken. Accordingly, a panel po-wer of 274.38 W/m2 was obtained. When calcula-ting the battery capacity, the autonomic duration is 1 day, the battery efficiency is 0.95, the battery vol-tage is 12V and the DOD (Depth of Discharge) va-lue is 0.5 were taken. Accordingly, the battery capa-city is calculated as 75.79 A∙h. Voc = 37.3 V, Isc =
Fig. 8. Temperature dependence of Isc, Voc and Pmax, [15]
Fig. 9. Irradiance dependence on Isc, Voc and Pmax, [15]

Light & Engineering Vol. 27, No. 1
82
9.2 A, the current was selected as MPPT 75/15 ac-cording to 18.14A.
6. LUMINANCE CALCULATION
Because of the fact that visual performance and visual comfort the users of road lighting are affected by road luminance and illumination measurement parameters, road-lighting installation requirements have to be shaped according to these fundamental aspects. [14] Street lighting systems must be de-signed tailor made for respective roads & streets and should provide adaquate level of illumina-tion and illumination uniformity in relation to inter-national street lighting standards such as EN13201.
The present paper studied quality parameters of the solar-powered roadway lighting using LED lu-minaires (48 W) for 300 m highway section with 2 lanes. The roadway lighting luminaires are placed
on both sides of the road with the pole distance 8 m. In the case study, DIALUX software simulation was used in order to make a comparison between calcu-lated illumination values and the illumination valu-es of standard EN13201.
Figs.10, 11 presents the calculated illuminance and luminance distributions of the road. It should be noted that the all calculated values meet the require-ments of EN13201 international standard for a road of ME4a class.
7. ECONOMIC ANALYSIS OF LED AND SOLAR-POWERED LED
The present paper studied the economic feasibi-lity of the solar powered street lighting using LED luminaires (48 W) for 300 m highway with 2 lanes. Economic comparison for two kinds of street light-ing design, namely, LED using grid power and so-
Table 3. Installation Cost of Unit Street Lighting System (Solar-Powered LED)
LYS20-DC ROAD LIGHTING SYSTEM
No Components Model Quantity Unit Price Total Price
1 Solar Panel 270 1 pcs $87 $87
2 Road Lighting Luminaire 48W 1 pcs $113.5 $113.5
3 Battery Gel 12V 100Ah 1 pcs $140 $140
4 Solar Charger MPPT 75/15 1 pcs $90 $90
5 Timer 1 pcs $30 $30
6 Lighting Pole 4m 1 pcs $200 $200
8 Cu Cable 4*2.5mm2 50 meter $1 $50
9 Montage cost 1 $400 $400
10 Electric Panel 1 pcs $100 $100
$1 210. 5
Table 4. Installation Cost of Unit Street Lighting System (Grid-power LED)
LYS20-AC ROAD LIGHTING SYSTEM
No Components Model Quantity Unit Price Total Price
1 Road Lighting Luminaire 52W 1 pcs $108 $108
2 Lighting Pole 4m 1 pcs $165 $165
3 Cu Cable 4*6mm2 50 meter $1 $50
4 Montage cost 1 $400 $400
5 Electric Panel 1 pcs $100 $100
$823

Light & Engineering Vol. 27, No. 1
83
lar power, is carried out. Each unit of solar pow-ered LED street lighting system includes a 270 PV modules, a 100 Ah-12 V batteries, and a 48 W LED lighting luminaire.
Tables 3 & 4 show that the installation costs are 823 USD for LED lighting powered by grid and 1210.50 thousand USD for solar-powered.
Tables 5 & 6 show that the sum of installation, maintenance and operation costs of the system after 20 years for a single luminaire pole. In our project, 38 poles were used with a distance of 8 m on the 300 m ME4a type road. Accordingly, the unit cost of the system used in the system powered by so-lar energy is 1564 USD, and the cost for 38 poles
is 59432 USD. The unit cost of the lighting system supplied by the network is 2558.84 USD, and for the 38 poles it is 97235.92 USD. By spending the same amount of power at the same light level, at the end of 20 years 97235.92 USD –59432USD = 37803.92USD was saved.
Table 5. Installation & Maintenance Costs of Street Lighting System Unit for 20 Years (Solar-Powered LED)
LYS20-DC ROAD LIGHTING SYSTEM FOR 20 YEARS
No Components Model Quantity Unit Price Total Price
1 Solar Panel 270 1 pcs $87 $87
2Road Lighting Luminaire(5 years warranty/50.000 h lifetime)
48W 2 pcs $113.5 $227
3 Battery Jel 12V 100Ah 2 pcs $140 $280
4 Solar Charger (5 years warranty) MPPT 75/15 2 pcs $90 $180
7 Timer 2 pcs $20 $40
8 Lighting Pole 4m 1 pcs $200 $200
10 Cu Cable 4*6mm2 50 meter $1 $50
11 Montage cost 1 $400 $400
12 Electric Panel 1 pcs $100 $100
$1564
Table 6. Installation & Maintenance Costs of Street Lighting System Unit for 20 years (Grid-Powered LED)
LYS20-AC ROAD LIGHTING SYSTEM FOR 20 YEARS
No Components Model Quantity Unit Price Total Price
1 Road Lighting Luminaire 52W 2 pcs $108 $216
2 Lighting Pole 4m 1 pcs $300 $300
3 Cu Cable 4*6mm2 50 meter $3.9 $195
4 Montage cost 1 $400 $400
5 Electric Panel 1 pcs $100 $100
$1211
Fig. 10. Illuminance Calculation

Light & Engineering Vol. 27, No. 1
84
7. CONCLUSIONS AND REMARKS
Within the study the operating principles and de-sign considerations for the proposed PV LED road lighting luminaire were described and analyzed in detail. Luminance calculation results of the labo-ratory prototype were analysed to verify the feasi-bility of the proposed method
Owing to the fact that they have many advan-tages over other technologies, solar powered LED street lighting systems have been made availa-ble in any many roads and streets. The luminaires used in LED technologies can easily be integrated into photovoltaic illumination systems.
The technology in LEDs has considerably im-proved in the past couple of years and are good al-ternatives to the conventional illumination systems. Simple drives, when control and dimming systems are considered, increased lifetime and luminous ef-ficiency are some of the main advantages of using LEDs.
Moreover, luminosity flow can be controlled more effectively via LED luminaries, which allows us to save on an important amount of energy and di-minish the public illumination expenditures.
ACKNOWLEDGEMENTS
The authors would like to thank the “The Sci-entific and Technological Research Council of Tur-key (TUBITAK)” for funding the research project with Nr: 7121017 “LED Road Lighting and Auto-mation System Design, Production and Applica-tion” which supports this work. The authors would like to also thank University of Kocaeli and LIT-PA Lighting Co. for their valuable contributions to the present study.
REFERENCES
1. P. Sathya et al., “Design and Implementa-tion of 12V/24V Closed loop Boost Converter for So-lar Powered LED Lighting System”, International Jour-nal of Engineering and Technology (IJET), Vol: 5 No: 1 Feb-Mar 2013.
2. I. Çolak, I. Sefa, R. Bayindir, M. Demirtas, “Güneş Enerjisi Kaynaklı LED Armatür Tasarımı”, Journal of Pol-ytechnic, Vol: 10 No: 4 pp.347–352, 2007.
3. M.I. Masoud, “Street Lighting using Solar Pow-ered LED Light Technology: Sultan Qaboos University Case Study”, Proceedings of the 8th IEEE GCC Con-
Fig.11. Calculated Values
Table 7. Cost Analysis of Both AC and DC Road Lighting System 12h /day in 20 years
LYS20-AC ROAD LIGHTING SYSTEM
System cost ($)Total Power
Consumption (W)
Lighting hours 12hrs×30daysx12months×20y
Electricity price ($)
1kWh
Total Energy Consumption
(kWh)
Total Energy Cost ($)
Total System
Cost for 20 years
$1.211,00 52 86400 $0.3 4492.8 $1347.84 $2558.84
LYS20-DC ROAD LIGHTING SYSTEM
System cost ($)Total Power
Consumption (W)
Lighting hours 12h x 30days x 12months x 20y
Electricity price ($)
1kWh
Total Energy Consumption
(Wh)
Total Energy Cost ($)
Total System
Cost for 20 years
$1.564,00 48 86400 - 4147.2 - $1564

Light & Engineering Vol. 27, No. 1
85
ference and Exhibition, Muscat, Oman, 1–4 February, 2015.
4. Lina Al-Kurdia, Reem Al-Masria, A. Al-Salaymeh, “Economical Investigation of the Feasibility of Utiliz-ing the PV Solar Lighting for Jordanian Streets,” Int. J. of Thermal & Environmental Engineering, 2015, Vol. 10, no. 1, pp. 79–85.
5. Mokhtar Ali, Mohamed Orabi, Emad Abdelkarim, Jaber A. Abu Qahouq, Abdelali El Aroudi, “Design and development of energy-free solar street LED light sys-tem,” in 2011 IEEE PES Conference on Innovative Smart Grid Technologies – Middle East, Jeddah, pp. 1–7, 2011.
6. M.S. Wu, H.H. Huang, B.J. Huang, C.W. Tang, C.W. Cheng, “Economic feasibility of solar-powered led roadway lighting,” Renewable Energy, vol. 34, no. 2009, pp. 1934–1938, 2009.
7. Ika Shinta Mardikaningsih, Wahyudi Sutopo, Mu-hammad Hisjam, Roni Zakaria, “Techno-economic Fea-sibility Analysis of a Public Street Light with Solar Cell Power,” in Proceedings of the International Multi Confer-ence of Engineers and Computer Scientists 2016, Vol. 2, Hong Kong, pp. 1–5, 2016.
8. Nallapaneni Manoj Kumar, Anup Kumar Singh, K. Vinay Kumar Reddy, “Fossil Fuel to Solar Power: A Sustainable Technical Design for Street Lighting in Fu-gar City, Nigeria,” in 6th International Conferenceon Ad-
vances in Computing & Communications, ICACC2016, Cochin, India, pp. 956–966, 2016.
9. Zakariya Rajab, Ashraf Khalil, Moneer Amhamed and Ali Asheibi, “Economic Feasibility Of Solar Powered Street Lighting System In Libya”, in the 8th IEEE Inter-national Renewable Energy Congress (IREC2017), 2017.
10. D. Tursel Eliiyi, T. Caylan, “Güneş Enerjisi ve LED İle Etkin Enerji Kullanımı: Yol Aydınlatmaları-na Yönelik Bir Uygulama”, Journal of Industrial Engi-neering, Vol: 19 No: 2 pp.(2–15), 2008.
11. R. Pode, “Solution to Enhance The Acceptability of Solar-Powered LED Lighting Technology”, Renewable and Sustainable Energy Reviews, 14, 1096–1103, 2010.
12. H.A. Mohammed, “Design and Implementa-tion of a Photovoltaic System Used for Street LIGHTS”, IEEE2nd International Conference on Control Science and Systems Engineering, pp. 169–175, 2016.
13. http://www.yegm.gov.tr/MyCalculator/pages/34.aspx
14. Wout van Bommel, Road Lighting: Fundamentals, Technology and Application, Springer, 2015.
15. https://www.tommatech.de/16. Hussein A Kazem, Tamer T.N. Khatib and
Kamaruzzaman Bin Sopian, “Sizing of a standalone pho-tovoltaic/battery system at minimum cost for remote housing electrification in Sohar, Oman”, Energy and Buildings, 61: 108–115, June 2013.

86
Light & EngineeringVol. 27, No. 1, pp. 86–96, 2019
LEDs COLOURS MIXING USING THEIR SPD AND DEVELOPING OF THE MATHEMATICAL MODEL FOR CCT CALCULATION
Canan PERDAHCI1 and Hamdi ÖZKAN2
1Department of Electrical Engineering, Faculty of Engineering, University of Kocaeli, Turkey
2Litpa Lighting, Koza Plaza, Istanbul, Turkey
ABSTRACT
Light is a condition that human beings are sub-jected to in nature. Light is not only a physical pa-rameter but also an important factor, which is af-fecting the mental and cognitive performance of the person. For this reason, in recent years, many re-searchers and scientists have been working on and exploring this direction of light. The spectral struc-ture of light in the natural environment shows a con-tinuous change. We can define this natural envi-ronment as the spectral transformation of daylight in open air. Thus, people who remain in closed en-vironments during the day are living under unfa-vourable conditions, such as constant colour tem-peratures and luminous flux of illumination. The studies aimed at reducing this harmful effect the most. These studies are based on the principle that all intermediate colours are obtained by blending the light in 2 different colours (usually one is very warm white and the other is very cold white) and that the intermediate colours are timed within a cer-tain scenario and illuminated indoors to simulate the outside environment. In this study, the mixture of light sources in different colours was mathematical-ly modelled in computer environment and the CCT in K of the mixture was calculated. It is also opti-mized to obtain the mixture colour with least mis-takes of the mixture functions by comparing with the actual measurement results.
Keywords: light emitting diode (LED), spectral power distribution (SPD), correlated colour tempe-rature (CCT)
1. INTRODUCTION
During the day, the relationship between our bio-logical rhythm and the day’s cycle of circulation has led to the emergence of the concept of “Biodynam-ic Lighting”. Biodynamic illumination, which al-lows people to control the light towards their own desires, can be described as creating a natural light-ing environment by following the rhythm of day-light. Thus, the effects of daylight on people are also utilized in working and living spaces. Varia-ble seasons and weather conditions, the day-and-night cycle creates ever-changing light scenarios throughout the day. Therefore, in the biodynam-ic illumination, the lighting level, colour tempera-ture and light colour vary, not constant. Illumina-tion control systems, such as DALI designed for automation systems or lighting control, and con-trol options provided by these systems can be used to create biodynamic lighting that requires varying levels of illumination or is energy-saving to take ad-vantage of daylight.
Ceiling-recessed LED biodynamic luminaires with dimensions of 600mm×600mm×120mm was designed by LITPA to show the influence of LED biodynamic luminaires with three different lighting scenarios on human performance, Fig.1.
2. SPECTRAL POWER DISTRIBUTION (SPD)
This spectral structure of the light rays deter-mines all the characteristics of the light. This is called spectral power distribution (SPD) and pre-

Light & Engineering Vol. 27, No. 1
87
sented in Fig. 2 for worm-white and cold-white LED.
The wavelength that the human eye can per-ceive is usually given in the range of (380–780) nm. Spectral measuring instruments can perform a wider range of measurements. The Everfine HAAS-1200, we use in this study, can measure from 350 to 1000 nm. However, because of V(λ), we used range (360–830) nm in our measurements and calculations. In the spectral chart, the vertical (y) axis is the spec-tral flux value at each wavelength of the wavelength
range. We measure this value by the spectroradi-ometric device in [mW / nm].
3. LABORATORY MEASUREMENTS
Our laboratory measurements consist of two steps. In the first step, we can calculate the spectral power distribution data of the radiation in two dif-ferent light colours. In the second stage, it was done to find out, which currents of intermediate colours were obtained by driving both colour LEDs at diffe-rent driving currents and to verify and optimize the calculations according to these measurements.
3.1. Luminaire used in Measurements
The luminaires used in the measurements are Biodynamic and are made with LEDs of both co-lours at 2200 K and 7000 K CCT values. In addi-tion, the driver output currents can be programmed via the DALI interface by dimming at desired dim levels. There are 90 pieces of 2200 K LEDs and 90 pieces of 7000 K LEDs in the luminaire. LED chips are placed next to each other in order to optimize
Table 1. Measuring Data of 2200 K CCT LED & 7000 K CCT LED
Fig.1. The biodynamic LED luminaire

Light & Engineering Vol. 27, No. 1
88
the colours (Fig. 3) and a special diffuser (Fig. 4) is used in the luminaire;
90 units of 2200 K LEDs are the 1st group with its own driver. The other 90 LEDs are 7000 K and this 2nd group of LEDs is also driven by a 2nd driver. Both groups have a maximum 500 mA driving cur-rent. Output currents in the range of 0 to 500 mA are obtained by dimming via DALI protocol or com-pletely turning OFF the drivers. Linear dimming is used as a method of dimming in operation. When 50 % dimming is done, 250 mA value of max cur-rent of 50 % will be taken as output current. Each of the 90 LED circuits in two groups consists of 6 serial 5 parallel circuit connections. Thus, when the driver is supplied with 500 mA, an LED is dri-ven with 100 mA. The dimming ratio from 0 to 100 on the DALI means to drive the LED from 0 to 100 mA current.
3.2 Experimental Study
In two-stage measurements, the dim ratio of 2200 K LEDs in 1 step is set to 100 %, 7000 K LEDs are turned OFF and the spectral data is taken.
In the same way, the dimming rate of 7000 K LEDs is adjusted to 100 % and 2200K LEDs are turned on OFF position, and the spectral data of 7000K LEDs are also taken (Table 1).
4. MATHEMATICAL MODEL OF COLOUR MIX
The spectral data are of two types and the first type is the amount of energy flux possessed per wavelength. These sizes constitute the characteris-tic of the light colour. The second type is the case where the energy value of the wavelength having the maximum value in the collection of these ener-gy values is taken as 1 and the energy values of the other wavelengths are normalized by proportioning accordingly (Figs. 4–5). We can say, the normaliza-tion coefficient to the energy value of the maximum value. The normalization coefficient is a special va-lue that is unique to the light source to which it is concerned. Each light source, each different colour and each light form has its own specific normali-zation coefficient. Therefore, when calculating the mixture colour, we must use the first type data and go through the actual energy values.
To calculate the colour that will result in a colour mixture result, we sum the spectral data of each of the two ranks. In other words, we create the mixture
Table 2. Meaning of Terms Used in Equation 1
Fig.3. PCB of Biodynamic LED luminaire
Fig. 2. LEDs Spectral Power Distribution
Fig.4. Special diffuser of Biodynamic LED luminaire

Light & Engineering Vol. 27, No. 1
89
colour by summing the real luminous values of the same wavelengths (Equation 1);
M(λ)=W(λ)+C(λ). (1)
4.1 Colour Matching Functions
To calculate the CCT values of the colours from the spectral diagram data, we need three main co-lour spectral value tables. These values are defined in CIE1931 as 2 ° colour equalization functions. (Colour-matching functions for CIE2° Standard Ob-server (1931)) [1].
Among the colours, red, green, and blue colours are generally regarded as the three main colours of light. The reason for this is that our eyes are sensi-tive to these three primary colours and the eye con-tains three types of cones (colour sensors) that are sensitive and allow colour perception. According to the 1931 Standard Observer’s definition of CIE [1], Fig. 9 shows spectral sensitivity curves corre-sponding to the human eye. These are called colour matching functions. It has a high sensitivity in the red, green and blue wavelength regions.
4.2 Calculation of Tristimulus Values
Tristimulus values, which are determined based on colour matching functions and defined by the CIE in 1931, are also referred to as 2 ° XYZ tristim-ulus values. When evaluating the brightness of the colours relative to each other, people see the light in the green parts of the spectrum brighter than the red or blue light of equal power. For this reason, we take the Y value representing green light as 100 and form the K coefficient and the reduced tristumulus values for X and Z. [3], see also Table 3.
Calculation of the Tristimulus values using the colour matching functions for CCT 2200 K:
( ) ( ) ( )830
360
1 1X K W X R dl l l l= × × × ×∫ . (2)
( ) ( ) ( )830
360
1 1Y K W Y R dl l l l= × × × ×∫ . (3)
( ) ( ) ( )830
360
1 1Z K W Z R dl l l l= × × × ×∫ . (4)
( ) ( ) ( )830
360
1001KW Y R dl l l l
=× × ×∫
. (5)
Calculation of the Tristimulus values using the colour matching functions for 7000 K:
( ) ( ) ( )830
360
2 2X K C X R dl l l l= × × × ×∫ . (6)
( ) ( ) ( )830
360
2 2Y K C Y R dl l l l= × × × ×∫ . (7)
( ) ( ) ( )830
360
2 2Z K C Z R dl l l l= × × × ×∫ . (8)
( ) ( ) ( )830
360
1002KC Y R dl l l l
=× × ×∫
. (9)
We calculate the tristimulus values using the matching functions for the mixture colour:
( ) ( ) ( )830
360
3 3X K M X R dl l l l= × × × ×∫ . (10)
( ) ( ) ( )830
360
3 3Y K M Y R dl l l l= × × × ×∫ . (11)
Fig.5. SPD of Light Source at CCT 2200 K

Light & Engineering Vol. 27, No. 1
90
( ) ( ) ( )830
360
3 3Z K M Z R dl l l l= × × × ×∫ . (12)
( ) ( ) ( )830
360
1003KM Y R dl l l l
=× × ×∫
. (13)
4.3. Calculation of Chromaticity Coordinates
The chromaticity coordinates (x, y) are based on standard tristimulus (XYZ) values. These stan-dards have been established by (CIE) [3]. From the obtained tristimulus values, we calculate the x and y coordinates of the light colour in CIE1931 colour space with the following formulas;
Table 3. Meaning of Terms Used in Formulas
Fig.7. SPD of Mixed Light Source
Fig. 6. SPD of Light Source at CCT 7000 K

Light & Engineering Vol. 27, No. 1
91
( )Xx
X Y Z=
+ +. (14)
( )Yy
X Y Z=
+ +. (15)
4.4. Calculation of CCT
Using the McCamy formula [4], calculate the CCT values in Kelvin using the x and y coordinates:
( )( )
0.333200.1858x
Ny
−=
−. (16)
3 2449 3525 68253.3 5520.33.
CCT N NN
= × + × ++ × + (17)
5. VERIFICATION OF MEASURED VALUES IN THE EXPERIMENT
First we calculate the tristimulus values using the spectral data, then we calculate the chromaticity coordinates, finally we calculate the CCT (Fig. 10).
We calculate the tristimulus values using the SPD data for the W (λ) sequence measured for 2200 K CCT with taking into account Equations 2,3,4,5.
( ) ( ) ( ) ( )
( ) ( )
830 830
360 360830
360
1 , 1 ,
1 ,
X X W Y Y W
Z Z W
λ λ
λ
λ λ λ λ
λ λ
= =
=
= =
=
∑ ∑
∑
1001 ,1
KY
=
1 1 1TX K X= × 1 1 1TY K Y= × 1 1 1.TZ K Z= ×
Chromaticity coordinates for 2200 K CCT have been calculated based on Equations 14 & 15;
11 ,1 1 1
11 .1 1 1
TX
T T T
TY
T T T
XXX Y Z
YYX Y Z
=+ +
=+ +
CCT calculation for 2200 K has been performed based on Equations 16 & 17;
1 0.33210.1858 1
X
Y
XNY
−=
−
3 21 449 1 3525 1 6823.3 1 5520.33.
CCT N NN
= × + × ++ × +
1 2260 CCT K= (The measured value by the device is 2277K, difference rate is the 0.7465 %)
We calculate the tristimulus values using the SPD data for the C (λ) sequence measured at 7000 K based on Equations 6,7,8,9:
( ) ( ) ( ) ( )
( ) ( )
830 830
360 360830
360
2 , 2 ,
2 .
X X C Y Y C
Z Z C
l l
l
l l l l
l l
= =
=
= =
=
∑ ∑
∑
1002 ,2
KY
=
2 2 2,TX K X= × 2 2 2,TY K Y= ×
Fig.8. CCT 2200K and CCT 7000K, and their SPD data mixture
Fig.9. X Y Z colour matching functions

Light & Engineering Vol. 27, No. 1
92
2 2 2.TZ K Z= ×
Chromaticity coordinates for CCT 7000 K have been calculated based on Equations 14 & 15;
22 ,2 2 2
22 .2 2 2
TX
T T T
TY
T T T
XXX Y Z
YYX Y Z
=+ +
=+ +
CCT calculation for 7000 K is based on Equa-tions 16 & 17;
2 0.33220.1858 2
X
Y
XNY
−=
−
3 22 449 2 3525 2 6823.3 2 5520.33
CCT N NN
= × + × ++ × +
2 7049 CCT K= (The measured value by the device is 7052K, difference rate is the 0.0425 %)
We first calculate the tristimulus values for the mixture colour using the M (λ) sequence (SPD Data) calculated by Equation 1 based on Equations 10,11,12,13:
Fig. 10. Flow chart of Verification of Measured Values
Fig.11. Screenshot of the Software
Fig. 12. Current vs. light output diagram
( ) ( ) ( ) ( )
( ) ( )
830 830
360 360830
360
3 , 3 ,
3 .
X X M Y Y M
Z Z M
l l
l
l l l l
l l
= =
=
= =
=
∑ ∑
∑
10033
KY
=
3 3 3,TX K X= × 3 3 3,TY K Y= ×
3 3 3.TZ K Z= ×
Chromaticity coordinates of colour mixture were calculated based on Equations 14 & 15:
33 ,3 3 3
33 .3 3 3
TX
T T T
TY
T T T
XXX Y Z
YYX Y Z
=+ +
=+ +
CCT calculation for Colours Mixture were cal-culated based on Equations 16 & 17:
3 0.33230.1858 3
X
Y
XNY
−=
−
3 2449 3 3525 3 6823.3 3 5520.33.
MIXCCT N NN
= × + × ++ × +
CCTMIX = 4042 K (The measured value by the measurement device is the 4033K, difference rate is the 0.0425 %)

Light & Engineering Vol. 27, No. 1
93
Table 4. Comparison of Laboratory Measurement Data with Mathematical Model
Dim ratings,% Current, mA Measured CCT, K
Mathematical model, K
Difference rate,%
Optimized mathematical
model, K
Difference rate, %7000 K 2200 K 7000 K 2200 K
100 0 500 0 7052 7050 -0,028 7071 0,27
100 10 500 50 6378 6356 -0,345 6356 -0,35
100 20 500 101 5839 5898 1,01 5817 -0,38
100 30 500 151 5428 5496 1,25 5411 -0,31
100 40 500 199 5112 5178 1,29 5101 -0,22
100 50 500 247 4860 4911 1,05 4849 -0,226
100 60 500 300 4624 4664 0,87 4623 -0,022
100 70 500 351 4432 4463 0,699 4433 0,023
100 80 500 402 4272 4290 0,42 4274 0,045
100 90 500 449 4149 4152 0,072 4146 -0,072
100 100 500 500 4033 4021 -0,298 4021 -0,297
90 100 448 500 3913 3891 -0,562 3898 -0,38
80 100 401 500 3798 3765 -0,87 3780 -0,47
70 100 350 500 3661 3619 -1,15 3643 -0,49
60 100 297 500 3505 3455 -1,4 3489 -0,456
50 100 252 500 3361 3305 -1,67 3347 -0,417
40 100 198 500 3164 3113 -1,61 3160 -0,126
30 100 150 500 2985 2930 -1,84 2977 -0,268
20 100 100 500 2766 2727 -1,41 2765 -0,036
10 100 52 500 2540 2518 -0,87 2541 0,0394
0 100 0 500 2277 2277 0 2270 -0,307
10 10 52 52 4062 4021 -1,01 4021 -1,01
20 20 101 101 4021 4021 0 4021 0
30 30 151 151 4021 4021 0 4021 0
40 40 199 199 4019 4021 0,0497 4021 0,05
50 50 253 253 4019 4021 0,0497 4021 0,05
60 60 298 298 4021 4021 0 4021 0
70 70 352 351 4026 4024 -0,0497 4024 -0,05
80 80 404 403 4026 4024 -0,0497 4024 -0,05
90 90 452 449 4028 4029 0,025 4013 -0,37
100 100 500 500 4033 4021 -0,297 4021 -0,298
50 100 255 500 3362 3315 -1,398 3357 -0,149
50 90 255 449 3453 3412 -1,187 3452 -0,029
50 80 256 402 3549 3522 -0,761 3557 0,225
50 70 257 351 3678 3666 -0,33 3692 0,38

Light & Engineering Vol. 27, No. 1
94
6. SOFTWARE THAT CALCULATES MIXTURE VALUES FOR DIFFERENT DIM RATIOS
By using these two data at hand, we calculat-ed the colour of the mixture when mixing 100 % of both colors, using only the warm white spectral data and the cold white spectral data. So, to calcu-late what the mixture will be at different mixing ra-tios, we calculate the mixture after mixing the two SPD values of the two colours with the dim ratio in %.
Our new mixture formula is as follows:
( ) ( ) ( )1 2M Dim W Dim Cl l l= × + × . (18)
With this software spectral data of CCT 2200 K LED and spectral data of CCT 7000 K LED are vis-ualized, and the mixture colour is calculated by two different methods depending on the desired dim ra-tio. For the representation of the spectral data, the values are normalized by assuming a maximum va-
lue of 1, which is the value of the sequence, and the spectrum chart is formed in this way. The dim ratio determined by the scrolling bars of both colours en-larges the spectral ratio from 0 to 100 as a multipli-er of the spectral power values at all wavelengths between 360 nm and 830 nm. This change affects the spectral data sequence with a maximum va-lue of 1 in proportionately. The sum of the two co-lours is calculated based on the dim ratio and the spectral data of the mixture is displayed simultane-ously. Two different calculation methods are used in this software. First method is the McCamy me-thod, which is the calculation method we use in our article. The second method is the CIECAM02 based calculation method. This calculation method will not be examined in this article.
7. LABORATORY MEASUREMENTS AND VERIFICATION
All intermediate values can be calculated with the software. A number of laboratory measurements
Dim ratings,% Current, mA Measured CCT, K
Mathematical model, K
Difference rate,%
Optimized mathematical
model, K
Difference rate, %7000 K 2200 K 7000 K 2200 K
50 60 257 298 3846 3847 0,026 3860 0,36
50 50 257 253 4021 4040 0,47 4039 0,448
50 40 257 199 4306 4338 0,74 4317 0,255
50 30 257 151 4644 4691 1,01 4653 0,19
50 20 257 101 5149 5193 0,85 5143 -0,117
50 10 257 53 5850 5880 0,51 5837 -0,22
50 0 257 0 7021 7050 0,41 7090 0,98
0 50 0 254 2274 2277 0,13 2264 -0,44
10 50 53 253 2753 2747 -0,218 2766 0,47
20 50 103 253 3137 3133 -0,127 3164 0,86
30 50 154 254 3482 3474 -0,23 3501 0,55
40 50 203 254 3754 3762 0,21 3777 0,61
50 50 257 253 4021 4040 0,47 4039 0,448
60 50 304 254 4206 4242 0,86 4230 0,57
70 50 359 254 4400 4453 1,20 4419 0,43
80 50 410 254 4561 4623 1,36 4576 0,33
90 50 458 254 4691 4765 1,58 4709 0,38
100 50 500 247 4860 4911 1,049 4849 -0,226

Light & Engineering Vol. 27, No. 1
95
are needed to verify the mathematical model. For the verification of calculations and software outputs, laboratory measurements were made at the follow-ing dim ratios and the deviation ratios were deter-mined by comparing, Table 4.
8. IMPROVING DIFFERENCE REDUCTION FUNCTION AND RE-VERIFYING BY APPLYING TO CALCULATIONS
Calculated values show up to 1.5 % deviations. The regions where these deviations are generated are those where one of the colours is at the maxi-mum level, while the other colour is at 30 %, 40 %, 50 %, 60 % dim levels. This is because the varia-tion of the luminous flux of the LED is not directly proportional to the dim levels. We can see this clear-ly in the graph of luminous flux change according to the dim levels given in the LED datasheet.
Fig. 13 shows the difference ratios for 2200K LEDs from 0 % to 100 % for each dim level with 10 % increase when the 7000K LED is at 100 % dim. From this graph y = 3E-08x4–1E-06x3–0,0009x2 + 0,0689x – 0,1436 difference reduc-tion function is obtained.
Fig. 14 shows the difference ratios for CCT 7000 K LEDs from 0 % to 100 % for each dim le-vel with 10 % increase when the 2200K LED is at 100 % dim. From this graph y = 4E-10x5–5E-08x4–1E-05x3 + 0.0022x2–0.1121x + 0.0138 difference reduction function is obtained.
When we apply the curved functions of the po-lynomial structure of the 4th and 5th grades obtained from these graphs to the dim ratio of our mixture formula:
Dim1Fix = 3 · 10–8 · Dim14 – 10–6 · Dim13 – – 0.0009 · Dim12 + 0.0689 · Dim1 – 0.1436. (19)
Dim2Fix = 4 · 10–10 · Dim25 – 5 · 10–8 × × Dim24 – 10–5 · Dim23 + 0.0022 · Dim22 –
– 0.1121 · Dim2 + 0.0138.(20)
( ) ( )( )
1
2 ,
M Dim Fix W
Dim Fix C
l l
l
= × +
+ × (21)
we get the final mixture formula.After applying the difference reduction func-
tions to the main formula, the differences rates have changed by decreasing as seen in the graphs (Figs. 15–16).
Fig. 15. CCT 2200 K difference rates in dependence of dimming
Fig.16. CCT 7000 K difference rates in dependence of dimming
Fig. 13. Difference reduction function diagram for 2200 K CCT
Fig. 14. Difference reduction function diagram for CCT 7000 K

Light & Engineering Vol. 27, No. 1
96
9. CONCLUSIONS & DISCUSSION
In order to calculate the mixture colour, it is pos-sible to apply the side sum method of wavelengths we have used here for more than one colour. What we initially need for this is only the spectral data of the primary colours. Using the spectral data of the main colours, we can calculate the CCT of the mix-ture and the spectral data of the mixture colour by mixing the desired number of different colours mathematically. When we place our mixing ratios as a Dim coefficient before the spectral data of each colour in the total formula:
( ) ( )( ) ( )
1 1 2
2 . ,
Mix Dim Colour Dim
Colour DimN ColourN
l l
l l
= × + ×
× +… + × (22)
and compare the results of the calculations from the software with the measured values again, they are significantly improved and reduced to less than ± 0.5 %, especially at the difference rate of 30 %, 40 %, 50 %, 60 % dim.
ACKNOWLEDGEMENTS
The author would like to thank “The Scientif-ic and Technological Research Council of Turkey
(TUBITAK)” for funding the research project with Nr: 3140764 “Biodynamic Lighting Systems De-sign”, which supports this work.
Our unforgettable thanks to the LITPA for fund-ing the research project with Nr: 3140764 “Biody-namic Lighting Systems Design” which supports this work.
The author would like to thank Ms. Deniz Yuce “R&D and Marketing Project Director” of LIT-PA for their valuable contributions to the present study.
The author would like to also thank Universi-ty of Kocaeli for their valuable contributions to the present study.
REFERENCES
1. CIE Publication: Color-matching functions for CIE2° Standard Observer (1931).
2. CIE Publication,1932. Commission Internationale de l’Éclairage Proceedings, 1931. Cambridge: Cambridge University Press.
3. CIE15:2004 3rd Edition – CIE Standars on Colorimetry.
4. McCamy, C. S. 1992. Correlated Colour Tempera-ture as an Explicit Function of Chromaticity Coordinates, Colour Research & Application 17:142–14.
Canan Perdahcireceived the B.E. and M. Sc. degrees in electrical engineering from the University of Yildiz, Istanbul, Turkey, in 1991 and 1993 respectively and the Ph.D. degree in electrical engineering from the University of Kocaeli, in 1997.
In 1992, she joined the Department of Electrical Engineering as a Lecturer and. in 1998, became an Asisstant Professor. Her current research interests include LED lighting, power quality, tunnel lighting, road lighting
Hamdi Özkanreceived the B.D. in machine engineering from the University of Trakya, Edirne, Turkey, in 2003. In 2007, he joined the Production Department of Litpa Lighting as a machine engineer, and in 2003 became a Responsible of Research & Development Department. His current research interests include mechanical and optic design of the luminaires and spectral structure of the light

97
Light & EngineeringVol. 27, No. 1, pp. 97–102, 2019
ENERGY SAVING IN THE SPHERE OF STATE PUBLIC INTERESTS
Gulnara F. Ruchkina and Elena Yu. Matveeva
Financial University under the Government of the Russian Federation E-mail: [email protected]
ABSTRACT
The article considers the categories of energy saving and energy efficiency in the aspect of State public interest. The implementation of energy saving policy is an independent public interest, as it allows solving some global, national tasks systematically. The article investigates the ratio of energy saving to the public interest in reducing the energy intensity of the Russian economy. The authors reveal the re-lationship between energy saving and public interest in ensuring national energy security of Russia. The authors consider energy saving as a factor contribut-ing to the implementation of the actual public inte-rest in the conservation of exhaustible natural resour-ces reveal the relationship between energy saving and public environmental interest. A part of the arti-cle is devoted to the study of energy saving as a di-rection of state policy, allowing contributing to the preservation of the nation health. Energy saving is also considered in the aspect of public interest to in-crease the efficiency of budget spending to optimize public spending in the field of municipal authorities (for example, lighting).
The authors correlate all the considered state public interests with the category of “national inte-rest” in the context of the provisions of the national security Strategy of the Russian Federation.
Keywords: energy saving, energy efficiency, state public interests, lighting
1. INTRODUCTION
IEA experts expect that global energy demand will reach 15.3 billion tons of oil equivalent in 2030.
Thus, energy consumption will increase by two-thirds compared to the level of the XXI century beginning [1]. The growth of energy consump-tion will have stable dynamics. Specialists of the In-stitute of energy research of the Russian Academy of Sci ences predict that primary energy consump-tion in the world in 2010–2040 will increase annu-ally by 1.3 % [2]. The growing demand for energy makes the efficient use of energy resources, energy, and energy carriers a global challenge.
The basic regulatory documents aimed at the implementation of energy saving Russian policies include:
– Federal law No. 261-FZ of 23.11.2009 “On Energy Saving and on Increasing Energy Ef-ficiency and on Amending Certain Legislative Acts of the Russian Federation” (is edited 23.04.2018);
– Energy strategy of Russia for the period till 2030 (approved by order of the Government of the Russian Federation No. 1715-p of 13.11.2009);
– State program of the Russian Federation “En-ergy Efficiency and Development of Power” (ap-proved by the RF Government resolution No. 321 from 15.04.2014);
– A comprehensive plan of measures to improve the energy efficiency of the economy of the Russian Federation (approved by order of the Government of the Russian Federation No. 703-p of 19.04.2018).
The importance of the problem of energy saving for our country is explained by the fact that the ef-fective use of energy resources greatly contributes to the solution of some pressing social problems and challenges, namely:

Light & Engineering Vol. 27, No. 1
98
– Problems of energy supply and lack of ener-gy capacity and, as a consequence, the problems of energy security of Russia;
– The tasks of reduction of energy intensity of the Russian economy and, as a consequence, assis-tance to the task of increasing of its competitiveness;
– The tasks of improvement of ecology, re-duction of anthropogenic impact on the natural environment;
– The task of preserving natural resources;– Objectives of the population health protection;– The problem of reducing budget expenditures.The research problem of the aspects mentioned
above and in General the problem of energy saving are considered and solved in the article through the prism of national public interests.
2. METHODS
General scientific methods of cognition-formal logic, system analysis, generalisation, formal le-gal and comparative legal methods are used in the article.
Socially significant, nation-wide tasks, the solu-tion of which is important for an unlimited number of persons, are referred to the sphere of public in-terests. Their correlation with the status of “nation-al interest” in the context of the provisions of the national security Strategy of the Russian Federa-tion [3] is used as an indicator of the relevance and importance of the public interest. We believe that such an approach can be considered justified since this document defines today the officially recog-nized system of strategic national priorities aimed at ensuring the long-term sustainable development of our state.
3. RESULTS
According to the national security Strategy, na-tional interests are objectively significant needs of the individual, society and the State in ensuring their security and sustainable development.
3.1. Energy Saving and Energy Intensity Reduction of the Russian Economy as a National and State-wide Public Interest
The most critical problem of the Russian econo-my is the high level of its energy intensity. Energy intensity of the economy is the ratio of consump-
tion of natural fuel resources and gross domestic product of the country.
The energy intensity of the Russian gross do-mestic product (GDP) is currently 1.5 times hig-her than the global and American that averaged and twice as high as that of the leading European coun-tries [4]. The high share of energy costs in produc-tion costs leads to a decrease in the level of com-petitiveness of Russian goods, which limits export opportunities in the foreign market and, on the con-trary, programs an increase in imports of consumer goods in the domestic market. It disorientates our national economy.
The risks of reducing the competitiveness of the energy-intensive Russian industry and, as a result, the national economy, are unusually high regarding volatility and lower prices for raw materials in the world markets, the development of shale projects, sanctions restrictions.
The national security strategy contains an indi-cation that improving the competitiveness of the na-tional economy is one of the primary national in-terests of the Russian Federation, and its action is considered in the long term. At the same time, re-ducing the competitiveness of the national econo-my is the strategy ranks among the main strategic risks and threats to national security in the econo-mic sphere. Consequently, energy saving is a public interest in the context of reducing energy intensity and increasing the competitiveness of the domestic economy.
3.2. Energy Saving and Public Interest In Ensuring National Energy Security of Russia
The national security Strategy of the Russian Fe-deration contains a direct indication that energy se-curity is one of the main directions of national secu-rity of our country in the economic sphere.
The dependence of any society on energy is tre-mendous, and as a rule, it only increases along with economic development.
When discussing energy security issues, it is usually a question of providing the needs of the eco-nomy and society with the energy resources of the required quality and quantity. In the European Uni-on, since the 1990s, energy conservation has tradi-tionally been a factor in improving the energy and environmental security of member States. The pre-servation of high energy intensity leads to the ag-gravation of problems related to the energy security

Light & Engineering Vol. 27, No. 1
99
of Russia and its regions due to the inability to pro-vide energy capacity needs of the growing econo-my. The relevance of this problem is confirmed by the fact that at the turn of the century in the country there was no one area (both among Federal districts and economic regions and among regions of the Russian Federation), which would not have prob-lems with the provision of electricity [5].
The concept of “energy security” is also en-shrined in the legislation of the Russian Federation, in the Energy strategy of Russia until 2020, which states that energy policy will be used to prevent geo political and macroeconomic threats, as well as to preserve Russian independence. It is necessary to increase the power generation at least another 20 thousand MW [5] to cover the growing electricity demand in Russia in the next 2–4 years.
A unit of primary energy obtained by increasing its production on average requires 2–3 times more capital investments than its production by increas-ing energy efficiency [5]. Thus, it is obvious that in many cases it is cheaper to implement measures to save energy or avoid its use than to increase ca-pacity and energy production.
In conditions of a highly energy-wasteful econo-my, the power industry will not be able to meet the growing demand for energy. The theme of energy supply becomes so defining that it is impossible not to agree with the famous writer-futurologist Arthur Clark, who predicted that soon the single world cur-rency will be kilowatt-hour [6].
The transition to energy will be the saving way of development, and the formation of an energy- efficient society is a saving way of development of the entire world civilization, as it provides a much cheaper increase in energy production. In the con-text of the problem of ensuring Russian ener-gy security, there is a close link between the im-plementation of this strategic national priority and the implementation of energy saving policy, and this proves that energy saving is a public interest in Russia.
3.3. Energy Saving and Conservation of Natural Resources as an Actual Public Interest
Energy saving is inextricably linked with the task of saving fuel and energy resources. The high level of energy intensity of the Russian economy in-dicates the inefficient and wasteful use of energy re-sources. Today, fossil fuels (coal, oil, gas), i.e., ex-
haustible natural resources, the need for which is not adequately replenished over time, account for more than 80 % of the energy resources consumed in the world.
The whole world is interested in the problems of energy saving precisely because the reserves of fuel and energy resources on the planet are not infinite.
The limited reserves of exhaustible fuel and ener-gy resources made us turn to energy saving as to one of the main elements of the modern concept of the world economy. For resource conservation (espe-cially regarding exhaustible minerals), we should recognize the status of public interest also because the resource conservation is the concern of the cur-rent society for future generations. The national se-curity Strategy of Russia states that environmental management is one of the strategic national priori-ties, it is also noted that the depletion of mineral re-sources because of inefficient and “pre datory” nature management and the predominance of the economy of extractive and resource-intensive industries ad-versely affect the state of environmental safety. Arti-cle 9 of the Constitution the Russian Federation de-fines the status of natural resources as the basis of life and activity of the population [7]. Due to the di-rect effect of the Constitution, the presence of the constitutional and legal form is the most critical cri-teria of publicity of the public interest.
Thus, energy saving to achieve the conserva-tion of exhaustible natural resources should be con-sidered as a national public interest.
3.4. Energy Conservation and Public Environmental Interest
The ecology problem is one of the main prob-lems facing humanity today. On the one hand, ener-gy is an essential component of economic prospe-rity, and on the other hand, its production is a huge component in environmental pollution and environ-mental degradation.
The problem of energy security and energy sav-ing in recent decades has become closely associ-ated with a whole range of environmental and le-gal problems. As it is indicated in the UN report on the sustainable development goals in 2017, the task of increasing the share of water, solar and wind energy, i.e., “clean” energy from renewable sour-ces, is facing the entire world community. The fuel and energy complex is one of the main pollutants of the environment. In Russia, most greenhouse

Light & Engineering Vol. 27, No. 1
100
gas emissions (about 80 %) are due to the activi-ties of the energy sector [8]. Increasing fuel and energy efficiency is the cheapest way to protect the environment.
The benefits of improving the energy efficiency of the economy for the environment are apparent: the energy that brings the least harm to the environ-ment is the energy that should not be consumed or is not produced. Emissions of pollutants will be auto-matically reduced in appropriate proportion when-ever energy consumption for purposes will be re-duced (by improving the insulation of dwellings, the use of more efficient light sources and lighting devices, increasing the efficiency of engines, etc.). The modern world is on the threshold of an envi-ronmental disaster, the harbingers of which are: glo-bal warming, reduction of the earth’s ozone layer, acid rain, reduction of forest area and biological di-versity, land degradation, deformation of the social environment, deterioration of public health in eco-logically unfavorable regions, and other negative phenomena (deterioration of water quality, migra-tion of harmful substances, desertification).
Article 42 of the Constitution of the Russian Fe-deration proclaims the right of everyone to a fa-vourable environment, and in this norm, the public environmental interest is clothed in the form of sub-jective law. At the same time, article 58 of the Rus-sian Constitution establishes the duty of everyone to preserve nature and the environment, to take care of natural resources. The fact that two more obliga-tions of citizens are fixed at the constitutional level (to protect the Fatherland and to pay legally estab-lished taxes and fees) speaks of the importance of environmental interests, the provision of which di-rectly depends on the state of national security.
The national security strategy of Russia defines the strategic objectives the environmental safety preservation and quality assurance of the environ-ment, as well as the elimination of environmental consequences of economic activity in the context of increasing economic activity and global climate changes. The government of the Russian Federa-tion in its Energy strategy until 2030 sets the task of consistently limiting the load of the fuel and energy complex on the environment and climate, including by reducing energy consumption [9]. Based on the above-stated, it should be concluded that energy saving refers to the public interests as an instrument of conservation and protection of the environment.
3.5. Energy Saving and Preservation of the Nation Health as a National Public Interest
First, human settlements suffer from the irra-tional use of energy resources, because the total im-pact of pollutants from the emissions of the fuel and energy complex, industry and transport is accumu-lated precisely there.
By the conducted studies on the assessment of risks to public health, it was concluded that the costs for the economy from the deterioration of the health of the population due to the negative im-pact of the fuel and energy complex are $18–35 bil-lion annually.
In “real terms” in addition to a significant in-crease in the incidence of the population in the country, the damage is at least 6–8 thousand ad-ditional deaths per year. Identification of the cri-tical points of energy impact on public health has shown that the most significant contribution to air pollution is made by vehicle exhaust gases, which is the cause of 90 % of health risks in cities [10]. The largest pollutants among stationary sources are power units of thermal power plants, which ope-rate on coal. The health of citizens is the object of constitutional protection that is established by arti-cle 7, article 41 of the Constitution of the Russian Federation.
In the comments to the Constitution of the Rus-sian Federation edited by V.D. Zorkin, it is noted: health is one of the highest benefits of a person, without which many other benefits, the opportunity to enjoy other rights can lose their importance [11].
According to the national security strategy of Russia, increasing life expectancy, reducing di s-ability and mortality are strategic goals to ensure national security in the field of health and health care of the nation. In the context of this task, ener-gy saving as a factor that can reduce the negative impact on the health of the population is a national public interest.
3.6. Energy Saving and Public Interest in Improving the Budget Spending Efficiency
Energy conservation also needs to be consi dered as a task of cost savings in the system of Public Finance.
The national security Strategy of the Russian Fe-deration states that in order to counter the threats to the economic security of the bodies of state po-

Light & Engineering Vol. 27, No. 1
101
wer and bodies of local self-government must im-plement policies to increase the efficiency and quality of state management of the economy, low-ering costs and ineffective budget spending. Total spending on electricity in 2016 made 107.315 bil-lion roubles [12]. These are budget expenditures for lighting in the street and road sector, as well as ex-penditures for the external and internal lighting of organizations of the budget sector. In 2015–2016 the government of Russia implemented a set of re-gulatory measures aimed at establishing lighting re-quirements with a focus on the budget sector.
These measures include:– Approval of energy efficiency requirements
for lighting products purchased for state and muni-cipal needs (a prohibition on the purchase of some inefficient lamps and light sources is introduced) [13];
– Dissemination of energy efficiency require-ments to purchases of state and municipal unitary enterprises [14];
– Dynamics of the minimum share of LED sources that can be purchased for buildings, high-ways, main streets of city significance, from 10 % in 2017 to 75 % in 2020 [15];
– The use restriction of inefficient and outda ted technologies in the light design of streets and indoor lighting systems [16].
The comprehensive plan of measures to improve the energy efficiency of the economy of the Rus-sian Federation sets targets to reduce the total annu-al costs of the budget system for electricity regard-ing to the level of 2016:
– By 2025 to reduce by 7.73 billion roubles;– By 2030 to reduce by 10.3 billion roubles.Thus, in the budgetary sphere, the State has vast
reserves of management of energy resources effec-tive consumption.
The President’s address to the Federal Assembly dated 01.03.2018 states that one of the sources of fi-nancing for the development of the country is an in-crease of the public spending efficiency [17]. Thus, energy saving in the field of lighting is a public in-terest in the context of saving budgetary resources.
4. CONCLUSION
The Energy Strategy of Russia for the period up to 2030 contains information that the unrealized potential of organizational and technological ener-gy saving is up to 40 % of the total domestic ener-
gy consumption. The energy strategy sets the task of reducing of the specific energy intensity by more than two times and the task of reducing of the speci-fic electrical capacity of the gross domestic product by at least 1.6 times by 2030 (compared to the level of 2005) [9].
We assessed the national public interests that de-pend on the effectiveness of the state policy in the field of energy saving.
As M.M. Karabekov points out, any com-mon goal corresponds to the time interval between its setting and achievement, during which some specific actions are implemented to implement “lo-cal” (intermediate) goals, which give the result of achieving a common goal [18]. Thus, to achieve the final goals in practice, it is necessary to imple-ment some other, more local goals (in other words sub-goals).
Continuing this idea, we can say that the ener-gy saving policy on the background of global pub-lic interests is a social goal, through the implemen-tation of which common goals are achieved.
We considered the energy saving in the aspect that it contributes to the implementation of some public interests, such as energy security, improving the competitiveness of the domestic economy, the preservation of exhaustible natural resources, en-vironmental safety, public health, optimization of public spending.
Consequently, the implementation of energy sav-ing policy is also an independent significant public interest.
REFERENCES
1. International Energy Agency (IEA) report, “World energy Outlook, 2012,” p. 573. URL http://www.worlden-ergyoutlook.org/publications/weo-2012/#d.en.26099.
2. Forecast of energy development in the World and Russia until 2040. FSBIS “Institute for energy research of the Russian Academy of Sciences,” and FSBI “Ana-lytical centre under the Government of the Russian Fe-deration” // https://www.eriras.ru/files/forecast_2040.pdf.
3. The President of the Russian Federation decree No. 683 from 31.12.2015 “On the national security Stra-tegy of the Russian Federation.”
4. Makarov A.A, Grigoriev L.M., Mitrova T.A. Deve-lopment forecast of World and Russia energy// ERI RAS-ATS, 2016, 200 p.
5. Sobolev R.Е. Formation of the energy-efficient structure of industrial production as a factor of long-term

Light & Engineering Vol. 27, No. 1
102
growth of the Russian economy. Thesis abstract for the degree of doctor of Economic Sciences, 2011.
6. Leskov. Faraday versus Napoleon // “Izvestia” newspaper, March 2007.
7. Russian Constitution (adopted by popular vote 12.12. 1993, was amended by 30.12. 2008 and 5.02.2014).
8. Government report “On the state and environmen-tal protection in the Russian Federation in 2014.” The Ministry of nature of Russia; Bulletin “Use and protec-tion of natural resources in Russia,” 2015.
9. Energy strategy of Russia for the period till 2030 (approved by the order No. 1715-p of the Government of the Russian Federation on November 13, 2009).
10. Kiryushin P.A. Environmental and economic as-sessment of energy efficiency in Russia. Thesis abstract for the degree of candidate of Economic Sciences, 2012.
11. Zorkin V.D., Lazarev L.V. A commentary on the Constitution of the Russian Federation (edited by). “EKSMO”- publishing house, 2010, Мoscow.
12. The decree of the RF Government from 19.04.2018 No. 703-R “About the approval of the com-plex plan of actions for an increase of energy efficiency of the economy of the Russian Federation”.
13. Resolution of the Government of the Russian Federation No. 898 from 28.08.2015 “About modifica-tion of point 7 of Rules of the establishment of require-ments of power efficiency of goods, works, services at the implementation of purchases for ensuring the state and municipal needs”.
14. Federal law No. 321-FZ of 03.07.2016 “About modification of separate legal acts of the Russian Federa-tion concerning purchases of goods, works, services for ensuring the state and municipal needs and needs of se-parate types of legal entities”.
15. Order of the Ministry of economic develop-ment of Russia of 09.06.2016 N362 “About modifica-tion of point 6 of requirements of power efficiency of the goods used for creation of elements of designs of build-ings, structures, constructions, including engineering systems of resource supply influencing power efficiency of the buildings, structures, constructions, approved by the order No. 229 of the Ministry of economic develop-ment of the Russian Federation of June 4, 2010” (Regis-tered on 06.07.2016 under number N42764 in Ministry of justice of Russia).
16. The order No. 777 of the Ministry of construc-tion RF from 07.11.2016 (version: 10.02.2017).
17. “Approval of item SP 52.13330 of “Sani-tary Norms and Rules 23–05–95 “Natural and artificial lighting”.
18. The message of the President of the Russian Fe-deration to the Federal Assembly on 01.03.2018
19. Karabekov M.M. Legal acts as means of forma-tion and implementation of legal policy: general-theore-tical aspect, the dissertation on competition of a scientific degree of Ph.D. in Low Science, 2010.
Gulnara F. Ruchkina,Dr. in Low of Science, Professor, an honorary worker of higher professional education of the Russian Federation; member of the Academy of Natural Sciences, Financial University under the Government of the Russian Federation; Head of Department of Legal Regulation of Economic Activity
Elena Yu. Matveeva,Ph.D. in Low of Science, Financial University under the Government of the Russian Federation, Associate Professor at Department of Legal Regulation of Economic Activity, Financial Director of ILEC “BL GROUP” LLC

103
Light & EngineeringVol. 27, No. 1, pp. 103–108, 2019
ALTERNATIVE WAYS OF ATTRACTING INVESTMENTS IN THE ENERGY SAVING TECHNOLOGIES INDUSTRY
Olga N. Anyushenkova, Andrej V. Ryzhik, and Venera K. Shajdullina
Financial University under the Government of the Russian Federation E-mails: [email protected]; [email protected]
ABSTRACT
The objective of the research is to determine the legal terms of the implementation of alterna-tive ways of attracting investments in the energy sa-ving technology industry. To achieve this goal, the authors examined economic and legal problems of fundraising in the industry of energy-saving techno-logies and grounded the importance of solving the problems for the lighting equipment industry. The article provides a comparative analysis of the vo-lume of global investments in this area of the econo-my and identifies a number of problems hampering the access of innovative enterprises to investment for developing energy-saving technologies. The ar-ticle considers an alternative way of raising funds for innovative start-ups in the field of energy saving, ICOs (ICO stands for Initial Coin Offering). The ar-ticle, also, analyzes the ICO market with 14 current participants, energy-saving technologies companies. Furthermore, the authors looked at the legislative regulation of this raising capital method in energy saving and energy efficiency in the Russian Fede-
ration and abroad in order to identify the best inter-national experience and its implementation in the Russian legal field. As a result of the research, the authors developed practical recommendations for legal support for upcoming ICOs procedures for companies in this industry.
Keywords: investments, energy saving techno-logies, energy efficiency, legal regulation of energy saving, lighting equipment, energy saving compa-nies and lighting
1. INTRODUCTION
At present, one of the most important directions in the development of lighting technology is the comprehensive solution of energy saving problems with a view to maintaining the ecological integrity of society. Today, the largest lighting organizations produce energy-saving lighting devices, but such companies face a number of economic and legal dif-ficulties associated with attracting investments for innovative projects [1].
In 2017, in accordance with International Ener-gy Agency global investments in the energy-saving technologies industry increased by 9 % to 261 bil-lion dollars (Fig. 1).
The source: compiled by the author according to the International Energy Agency [2].
However, the investment volume in energy sa-ving (despite a small increase) is still far behind the required for the production of renewable ener-gy sources, improvement of lighting equipment, etc. It should be noted, that according to the Inter-national Energy Agency (The IEA), global invest-
Fig. 1. Global investments in energy-saving technologies from 2015 to 2017, USD billion

Light & Engineering Vol. 27, No. 1
104
ments in the industry should reach $1 billion per year, which is 4 times more than the volume of in-vestments typical of energy saving [2]. This fact is explained by the analytical centre of the Energy Ef-ficiency Financial Institutions Group (EEFIG) [3]. Having analyzed more than 10 thousand projects in the field of development of energy-saving inno-vations and improvement of lighting technology, the centre has established the following reasons for the unwillingness of institutional investors financ-ing such projects:
1) The lack of specific tools allowing investors to assess and monitor the investment efficiency in energy saving;
2) Administrative and legal barriers in attracting funds to the industry, consisting of:
– Restriction of foreign investors in equity par-ticipation in a company attracting funds;
– The need to coordinate such participa-tion in the state authority;
– The need for state registration of such invest-ments as shares or stakes, etc.
The above is accompanied by the length of the procedures (for example, on average, registration of shares in the United States or Australia takes up to 90 days, taking into account the need to amend the recommendations made by the financial regula-tor based on the results of the company’s bid).
In this regard, there are now alternative ways to raise funds for the implementation of start-up projects in the field of lighting and energy saving – the “Initial coin offering” (ICO) (Table 1).
The source: compiled by the author according to the data of Сryptosale [4].
A distinctive feature of these projects is the re-lease of “crypto-tokens” (digital tokens) within the ICOs – an analogue of digital coins, equated, in these start-ups, either to an energy unit or to a means of payment within the project.
The high popularity of ICOs in the field of ene rgy- saving technologies and lighting equipment is due to the ability to attract investments quickly and in a short time. Since ICOs are marketed on block-chain technology platforms, this allows to purchase tokens online and not to limit the amount of in-vestment. This means that anyone, without signi-ficant savings, can invest in a project related to en-ergy-saving technologies and lighting equipment. However, it is worth mentioning that 95 % of all ICO projects are potentially fraudulent [5]. It seems obvious, that the recommendations should take
into account both the interests of investors and the interests of projects raising funds. It is also worth indicated that at present there are no researchers devoted to the ICO in the field under considera-tion. The exception is some works on general is-sues aimed at solving the problems of implement-ing ICOs without studying the field features [6–9].
Thus, the purpose of this article is to develop practical recommendations aimed at establishing the regulation of the ICO procedure, as an alterna-tive way of attracting investments to solve problems with investment deficits in the energy saving tech-nologies and lighting equipment industries.
2. THE SOLUTION
For developing practical recommendations for the regulation of start-ups ICO procedures of ener-gy-saving technologies industry, the following sta-ges of the research were conducted:
1) The statistics of the International Energy Agency were analyzed to identify the countries leading in terms of investments in energy-saving and lighting equipment;
2) The sample of countries received and the le-gislation of these countries regulating the prepara-tion and launching ICOs by the companies of the in-dustry was analyzed.
3. THE RESULT
According to the International Energy Agency, global investments in the energy-saving technolo-gy sector in 2017 amounted to 261 billion dollars. At the same time, the European Union, the Unit-ed States of America, Canada and China remain the undisputed leaders in this matter (Fig. 2).
Therefore, it will be relevant to consider the le-gislation governing the organization and implement-
Fig. 2. The volume of investments in the energy saving technologies industry by regions from 2015 to 2017,
USD billion [2]

Light & Engineering Vol. 27, No. 1
105
ing of ICOs by companies in the energy saving and lighting industry in these countries. The exception is China, as the People’s Bank of China banned imple-menting ICOs in the territory of the country [10].
3.1. European Union
The EU Directive 2012/27 on energy efficiency is currently in force in the European Union. It es-tablishes a general framework for promoting ener-gy efficiency in the European Union, including measures to stimulate investment in the industry. In this regard, there are no quantitative restrictions in this regional association. However, a company
with foreign participation to work in the Europe-an Uni on must meet the certification requirements in order to demonstrate the absence of a threat to the EU’s energy security [11].
In the end of 2017, the European Securities Mar-ket Authority (ESMA) established supranational re-quirements for ICOs in the EU. According to the re-quirements, companies implementing ICOs in EU member countries are required to independently examine the qualifications of the ICOs in order to comply with the legislative requirements of the European Union, as well as the national legisla-tion of the state where the ICOs is implemented. ESMA specifies that in accordance with Directive
Table 1. ICO Projects Involved in the Development of Lighting and Energy-Saving Technologies
Project Title Implementation Stage Attracted investments, million USD
1. Helios Coin (production of alternative ener-gy resources) ICO launched 0.19
2. Cryptos lartech (manufacture of solar panels) ICO launched 83.7
3. Electrifi.asia (a decentralised energy online marketplace) ICO launched 0.442
4. Enegrypremier (an advanced token-based electricity bidding platform) ICO is being launched 34
5. Robotina (production of “green” technologies) ICO launched 28
6.SiOcoin (production of an innovative in-stallation for the recycling of technological waste)
ICO launched 20
7.Energymine (a decentralized world plat-form for energy-saving lighting equipment trading)
ICO launched 15
8. Farad (ultra-capacitors development and production) ICO launched 0.824
9. Carboncoin (carbon recycling for energy saving) ICO launched 1.2
10. Hydrominer (equipment production using hydropower energy) ICO launched 25
11. Wepower (a blockchain-based green energy trading platform) ICO launched 0.941
12. Suncontract (a decentralized solar energy trading platform) ICO launched 1.7
13. Solarcoin (production of solar power) ICO launched 9
14. Energycoin (production of renewable ener-gy sources) ICO launched 5

Light & Engineering Vol. 27, No. 1
106
2003/71/ EU on Prospectus Directive [12], the pro-ject must provide reliable information to potential investors by publishing a prospectus in case of ca-pital raising. If the ICO project contains signs of a public offering of securities, the publication of the prospectus is mandatory. In addition, the competent authority must approve the prospectus. Consequent-ly, the company must be in full compliance with the national requirements of the EU member state where the project is implemented.
3.2. The USA
In the USA, as in some other countries, most of the resources are consumed inefficiently, which en-tails huge material losses. According to the Ame-rican Council for Energy Efficient Economy ra-ting, the United States ranks thirteenth in the world in terms of energy consumption [13]. Based on this fact, the US Government currently focuses on at-tracting investments in the development of innova-tive energy-saving technologies.
At present, the USA is one of the safest countries for implementing ICOs. Thus, in July 2017, the US Securities and Exchange Commission (SEC) pub-lished a report on The DAO, explaining that US se-curities legislation is applicable to some operations with crypto-currencies, including (1) releasing to-kens as a part of IPOs, as well as (2) operations for their exchange transactions [14]. All participants in cryptoeconomy from issuers to stock exchanges, as well as other participants involved in the offering and sale of tokens denoted as securities, will have to comply with US securities laws [15]. Depend-ing on the circumstances, this may mean that tokens must be registered with the SEC or fall under an ex-emption to registration in the law.
Thus, tokens are securities, if all of the following requirements that make up the Howey Test are met:
1) Capital investments in any form, including cryptocurrencies;
2) Participation of investors in a joint venture, regardless of the fact and place of registration;
3) Realistic expectation of investors to make a profit (the profit can be in the form of dividends, periodic payments or an increase in the value of tokens);
4) Limited participation of investors in the ma-nagement of the enterprise.
It should be emphasized that in practice, compa-nies often use the exception provided for in “Regu-
lation S” under the US Securities Act. Thus, issuers do not have an obligation to coordinate their actions with the SEC, if their advertising campaigns for the sale of tokens are not aimed at the United States, and selling tokens, companies check that buyers are outside the United States.
At the same time, start-ups of the energy saving industry need to comply with the legislative require-ments for such companies. In accordance with the National Energy Law [16], foreign ownership and control over energy facilities are prohibited. Only US citizens have the right to have licenses for the production of power equipment, including ener gy saving technologies. Restrictions on foreign compa-nies’ participation in projects related to the produc-tion of power equipment are also established.
3.3. Canada
As mentioned above, in Canada, there is also an acute issue on the development of the energy sav-ing industry including the problems of attracting private capital in the industry. This is because al-most all energy saving activities in the provinces of Saskatchewan, Manitoba, Nunavut and New Brun-swick are carried out by state-owned companies. That is why to establish private entities in this indu-stry is possible only in Ontario and Alberta. At the same time, in Canada, there are no restrictions simi-lar to the US law. Under the Control of Electricity and Gas Act [17], companies are subject to the same requirements as other organizations.
Currently, Canada has created favourable con-ditions for implementing ICOs by companies of the energy-saving technologies industry. In August 2017, the Canadian Securities Administrators (CSA) explained their position regarding ICOs in the pub-lished statement [18]. The document states that crypto-tokens must be registered in accordance with the securities laws. Requirements to the legal form are established as for other companies issuing shares, without exception. CSA separately drew at-tention to the fact that marketing moves to denota-tion tokens as software products do not affect the nature of tokens, because they are essentially in-vestment tools.
3.4. The Russian Federation
The economy of the Russian Federation (fur-ther – Russia, The RF) at this stage is characterized
Light & Engineering Vol. 27, No. 1
107
by high-energy intensity. The specific energy in-tensity of Russian GDP is 2.5 times higher than the global average [2]. One of the reasons is the lack of financing for companies involved in the deve-lopment of energy saving. Currently, many Russian companies in the field of energy saving technolo-gies have started to look for ways to attract foreign capital, including ICOs.
At this stage of crypto economy development of Russia, there is no legal regulation of the orga-nization and implementing ICOs. However, by July 2018, the draft law “On alternative ways of attract-ing investment (crowd-funding)” [19] will be sub-mitted to the State Duma of the Russian Federation. According to the draft law, tokens are considered di-gital financial assets. ICOs can be marketed on spe-cial investment sites/platforms only by Russian le-gal entities and individual entrepreneurs.
It is worth saying that a company implement-ing ICOs must comply with the requirements es-tablished in the legislation, which depend on its type of activity. There are no restrictions in case, when a company’s activities are limited by conduct-ing research and development work. If a start-up is associated with the construction and operation of ener gy-saving plants, depending on their capacity, a license may be required [20]. The production of energy-saving equipment (for example, LED lamps) requires mandatory certification.
Summing up, the conducted research allows for-mulating the following recommendations on the re-gulation of ICOs in the Russian Federation:
1) It is necessary at the level of Government Resolution of the Russian Federation to develop the procedure of implementing ICOs in the Russian Fe-deration. Namely, it is necessary to determine what legal procedures a company should take implement-ing each stage of an ICO procedure (development of an offering memorandum, offers to purchase to-kens, publication of the company’s reports, taxes and fee payment, etc.). In addition, this normative act should establish the legal status of tokens, taking into account the best foreign experience. In case, if tokens have signs of securities, companies applying ICOs will have to register them in the securities reg-ister. However, if a token is equated to the price of the goods produced (for example, the unit of energy or the means of payment on the site), registration is not required.
2) Russian regulators need to develop explanato-ry and advisory documents warning that any ICOs
project must comply with all the legislative require-ments of the country where it raises funds in the form of ICOs. Such requirements may include re-strictions on the legal form of the company, the need to obtain authorization documents, certification of manufactured equipment, etc. Thus, regulators will be able to prevent Russian projects from been pro-secuted as a result of ignorance and non-compliance with the legislation of foreign countries.
4. CONCLUSION
Thus, the conducted research shows that at pre-sent, launching ICOs, as an alternative way to raise funds, can solve the problem of limited investment in energy saving industry. The leading countries in the industry have already developed loyal le-gal requirements for companies implementing ICO projects. Obviously, it is necessary to develop a le-gal and regulatory framework in the Russian Fe-deration to regulate the new economic and legal phenomenon. The recommendations developed by the authors will increase the investment attractive-ness of the energy saving industry and help develop ICOs as a promising way of fundraising.
REFERENCES
1. Gvozdev S.V. Upravlenie osveshcheniem dlya po-vysheniya komfortnosti svetocvetovoj sredy i raboto-sposobnosti cheloveka [Lighting control for increasing the comfort of the light-colored environment and human per-formance]//Zdaniya vysokih tekhnologij, 2018. # 1. p. 18.
2. World Energy Investment 2017. Available at: https://www.iea.org/publications/wei2017/ (accessed: 10.06.2018).
3. Sweetman P. Energy efficiency is a “win-win” for investors. Available at: https://www.greenbiz.com/article/energy-efficiency-win-win-investors (accessed: 10.06.2018).
4. Proekty v sfere ehnergetiki [Energy projects]. Available at: https://cryptoslate.com/category/cryptos/energy/ (accessed: 10.06.2018).
5. Weaver N. Risks of cryptocurrencies // Communi-cations of the ACM, 2018, Vol.61, #6, pp. 20-24.
6. Caldwell T. The miners strike – addressing the crypto-currency threat to enterprise networks // Compu-ter Fraud & Security, 2018, pp. 8–14.
7. Fernández-Caramés Т.М., Fraga-Lamas P. A Re-view on the Use of Blockchain for the Internet of Things // IEEE Access PP, 2018, Vol. X, pp. 1-23.

Light & Engineering Vol. 27, No. 1
108
8. Giudici G., Adhami S., Martinazzi S. Why do busi-nesses go crypto? An empirical analysis of Initial Coin Off erings // Journal of Economics and Business, Forth-coming, 37 p.
9. Guliyeva A., Britchenko I., Rzayeva U. Global se-curity and economic asymmetry: a comparison of deve-loped and developing countries // Journal of Security and Sustainability Issues, 2018, Vol. 7, #4.
10. Uvedomlenie Narodnogo banka Kitaya o zaprete ICO [Notice to the People’s Bank of China on the pro-hibition of ICOs]. Available at: http://www.pbc.gov.cn/goutongjiaoliu/113456/113469/3374222/index.html (ac-cessed: 11.06.2018).
11. Directive 2009/72/EC of the European Parlia-ment and of the Council of 13 July 2009 concerning com-mon rules for internal market in electricity and repealing Directive 2003/54/EC. Available at: https://eur-lex.europa.eu/legal-content/EN/ALL/?uri=celex%3A32009L0072 (accessed: 10.06.2018).
12. Directive 2003/71/EC of the European Parlia-ment and of the Council of 4 November 2003 on the pro-spectus to be published when securities are offered to the public or admitted to trading and amending Directive 2001/34/EC. Available at: http://eur-lex.europa.eu/Lex-UriServ/LexUriServ.do?uri=CELEX:32003L0071 (ac-cessed: 10.06.2018).
13. SSHA: kurs na ehnergosberezhenie i ehnergoe-hffektivnost [US: a course on energy conservation and energy efficiency] Available at: http://www.webeconomy.ru/index.php?page=cat&newsid=2872&type=news (ac-cessed: 10.06.2018).
14. Report of Investigation Pursuant to Section 21(a) of the Securities Exchange Act of 1934: The DAO. Available at: https://www.sec.gov/litigation/investre-port/34–81207.pdf (accessed: 10.06.2018).
15. Securities Act of 1933. Available at: https://www.sec.gov/answers/about-lawsshtml.html#secact1933 (ac-cessed: 10.06.2018).
16 . Na t iona l Energy Ac t . Ava i l ab le a t : http://what-when-how.com/energy-engineering/nation-al-energy-act-of-1978/ (accessed: 10.06.2018).
17. Electricity and Gas Inspection Act, R.S.C., 1985, c. E-4.
18. CSA Staff Notice 46–307 Cryptocurrency Offer-ings. Available at: https://www.securities-administrators.ca/aboutcsa.aspx?id=1606&terms=Staff%20Notice%2046–307 %20Cryptocurrency%20Offerings (accessed: 10.06.2018).
19. Zakonoproekt “Ob al’ternativnyh sposobah priv-lecheniya investicij (kraudfandinge) “ [The bill “On alter-native ways of attracting investment (crowdfundinge)”].
Olga N. Anyushenkova,Senior Lecturer of Department of Foreign Languages of the Financial University under the Government of the Russian Federation
Andrej V. Ryzhik,Ph.D. in Law, Associate Professor of Department of General and special legal disciplines of the Belarusian State of the Orders of the October Revolution and the Order of the Labour
Red Banner Agricultural Academy, Associate Professor of the Department of legal regulation of economic activity of the Financial University under the Government of the Russian Federation
Venera K. Shajdullina,Ph.D. in Law, Senior Lecturer of Department of legal regulation of economic activity of the Financial University under the Government of the Russian Federation
Available at: https://www.eg-online.ru/document/law/365159/ (accessed: 10.06.2018).
20. Federal’nyj zakon “Ob ehnergosberezhenii i o povyshenii ehnergeticheskoj ehffektivnosti i o vnese-nii izmenenij v otdel’nye zakonodatel’nye akty Rossi-jskoj Fe deracii” [The Federal Law “On Energy Saving and on Improving Energy Efficiency and on Amending Certain Legislative Acts of the Russian Federation] ot 23.11.2009 261-FZ // Rossijskaya gazeta, 2009, # 226.

109
Light & EngineeringVol. 27, No. 1, pp. 109–115, 2019
POWER SUPPLY FOR STATE-OWNED ENTERPRISES
Denis V. Shepelev, Dina V. Shepeleva and Natalia G. Kondrakhina
Financial University under the Government of the Russian Federation E-mails: [email protected]; [email protected]; [email protected]
ABSTRACT
This article presents a comprehensive study of energy supply problems for state-owned enterpri-ses. The categories considered (financial activity, legal interests, energy system) allow to reveal the special importance of state enterprises for the state economy. Identification of energy supply problems of state-owned enterprises will allow to assess the optimal power capacities of the public legal sec-tor. The revealed regularities of the energy poten-tial will allow us to assess the risks when planning and predicting energy efficiency. The dynamics of the increase in the consumption of electricity by state enterprises is traced, at the same time as the search for alternative sources of resource support is on. The developed infrastructure of state-owned enterprises implies the search for technologically justified solutions to obtain energy resources in an innovative way. Recommended approach of energy- saving systems usage will allow the enterprise manages to optimize the costs. State enterprise is a unique organizational and legal form with the participation of public and legal entities that allow the state to participate in economic processes in the most optimal, efficient and effective way and real-ize the most significant state tasks. Such tasks in-clude: implementation of public interests, provi-sion of society with necessary goods and services, implementation of separately subsidized activities, production of military equipment, cartridges, gun-powder, chemical production, disposal of hazard-ous waste. These tasks emphasize a special priority for the presence of public-legal entities in this sector of the economy. The legal nature of state enterpri-
ses allows for the most effective implementation of this activity.
Keywords: energy supply, power supply con-tract, state enterprise, financing, interests of state enterprises, energy security, electrical system, elec-trical installations, electric network
1. INTRODUCTION
Modern Russia is rethinking its legal interests in the field of energy supply, as well. One of the main reasons for addressing this issue is the adop-tion of a number of regulatory legal acts that regu-late the energy sector. This process is significantly influenced by such an objective condition as the de-velopment of energy systems.
The subject of this study is the legal regula-tion of state enterprises energy supply, as well as energy saving systems. The following goals were set in the course of this research: identify the fea-tures of power supply to public enterprises, consi-der alternative ways of lighting the premises, ana-lyze innovative methods and devices of lighting sources.
2. METHODS
In the course of this work, a wide range of me-thods was used, both general scientific and of a par-ticular scientific nature. General scientific methods of cognition (analysis, synthesis, induction, deduc-tion) allowed to analyze the elements of power sys-tems. Particularly scientific methods (cybernetic, statistical) allowed to reveal the specific features of the best lighting equipment.

Light & Engineering Vol. 27, No. 1
110
3. RESULTS
The power supply of state enterprises is carried out while considering the level of technical equip-ment (devices of electrical installations, electric net-works), since defence and security directly depend on power supply along with the realization of na-tional interests accordingly. Implementation of light and shadow, light and local illumination of interi-ors takes priority when illuminating the premises of public enterprises. Use of various kinds of laser lighting equipment is also under way. Development of innovative methods of optical location made it possible to use devices with fluorescent lamps of various types, which has a beneficial effect on the illumination of premises and on the reduction of ex-penses for state enterprises. Solid-state lasers and LEDs will save energy.
State-owned enterprises have high significance in the priority areas of the state economy. It is for state-owned enterprises that the state assigns special tasks for the most optimal realization of the state and society needs as a whole, especially in such areas as defence and security, where commercial inte rest is still present, but is not a priority. State-owned enterprises are full-fledged participants of the energy space. State-owned enterprises are unique organizational and legal formations. Unique-ness can be explained as follows: despite the fact that they are commercial organizations, whose acti-vities are aimed at making profits, these enterprises are established by public legal entities, implement-ing public and national interests, especially in such areas as defence and security, namely the manu-facture, development, production of certain spe-cies products (ammunition, military equipment and weapons, explosive and chemically dangerous pro-ducts), disposal of hazardous chemical waste; – en-suring the state’s food security in the loss-making or unprofitable industries, and separately subsidized activities.It is important to note, that other business entities may not always be present in these areas be-cause of the special importance of the defence and security for the state, or from a commercial point of view other organizational legal forms are not in-terested in operating in unprofitable and marginal-ly profitable industries. A state-owned enterprise or-ganizes its financial and economic activities based on the need to perform certain activities and provide services in accordance with the approved estimates of revenue and expenses and the enterprise opera-
tions plan [9, p. 48]. Manufactured goods and earn-ings resulting from the use of property in the ope-rational management of the enterprise, as well as property acquired by it from the proceeds of its acti-vities, are the property of a public formation, which had established a state enterprise. In their financial activities, state-owned enterprises should be guided by the fact that none of their actions should lead to the creation of conditions under which their func-tions established by the owner will become difficult or impossible to exercise.
Nowadays, energy supply has become an inte-gral part of life of a modern society, its normal ex-istence. Proper functioning of such vital facilities as medical and educational institutions, housing and utilities facilities, banks, without which function-ing of a modern society is inconceivable, depends on a smooth supply of energy. At the same time, there exists uncertainty in many significant aspects of energy supply, and among those there is a special need to highlight the issues of qualification in con-tractual relations in the electric power industry, and particularly the relationship between the subscriber and the sub-subscriber. Thus, for example, L. An-dreeva points out the misregulation of these rela-tionships, noting that in accordance with Article 545 of the Civil Code of the Russian Federation: “A sub-scriber can transfer energy received from an energy supply organization through an affili ated network to another person (sub-subscriber) only with the consent of the energy supply organization. Thus, in the Civil Code, transfer of energy from the sub-scriber to the sub-subscriber is formulated as the right, and not the duty, of the subscriber” [2]. This means: “The latter can refuse to transfer energy, and in practice often does so, arguing that this acti-vity is not one of his core activities and is not a pub-lic one by character” [2].
When it comes to ensuring security of state-owned enterprises and the state as a whole, first of all, it is necessary to draw attention to the energy supply system. Safety and efficiency of state-owned enterprises functioning depends on the correct use (executed in accordance with specially approved rules) and application of methods and ways of ener-gy supply, considering the level of technological infrastructure. Receivers of electric power of en-terprises obtain power from the power supply sys-tem, which is an integral part of the energy system. The receiving point of electricity is an electrical in-stallation, which collects electricity for the elec-

Light & Engineering Vol. 27, No. 1
111
tric receivers of enterprises from an external power source. The level of electric receivers power supply uninterruptedness by electric energy at any time is determined by their operation modes. Power load estimation is the first step in the design of any po-wer supply system. Capital investments in the po-wer supply system, operational costs, and the re-liability of the electrical equipment depend on the correct assessment of the power loads. Energy is-sues have been relevant at all times [3]. Electric po-wer in enterprises is considered as one of the com-ponents of the production process, along with raw and required materials [4]. When designing a po-wer supply system or analyzing its operating modes, EE consumers are considered as loads. With regard to electricity supply, a unitary enterprise is deemed ineffective, if 50 % or more of the total number of uninterrupted 24-hour power supply violations were liquidated during the year in breach of the re-quirements established by the current legislation of the Russian Federation. At the same time, a break in the provision of utility services for power supply is not allowed, if it may lead to the disconnection of networks and equipment that is a part of the com-mon property in the apartment building, including pumping equipment, automatic technological pro-tection devices and other equipment that provides trouble-free operation of in-house engineering sys-tems and safe living conditions for citizens. General requirements that must be observed when designing power supply systems and reconstruction of electri-cal installations are set by the Rules for the installa-
tion of electricity generating equipment [4]. These requirements are as follows: perspective of deve-lopment of power systems and power supply sys-tems, taking into account rational combination of newly constructed electric grids with existing and newly constructed networks of other voltage clas-ses; provision of integrated centralized power sup-ply to all consumers of electrical energy located in the coverage area of electrical networks, regard-less of their affiliation; limitation of short-circuit currents to limit levels defined for the future; reduc-tion of losses of electric energy; compliance of de-cisions with environmental conditions. Simultane-ously with such requirements, should be considered external and internal power supply, considering the possibilities and economic feasibility of technologi-cal redundancy.
It is also important to notice the requirements re-garding the lighting of spaces in the building divid-ed into internal and external. By nature, lighting can be divided into light-and-dark, light-tonal, local and silhouette. Light-and-dark is the kind of lighting when radiation source forms light from the shadow, and diffused light highlights the shadows of the ob-ject. Light-tonal is the lighting when scattered light uniformly fills the space and illuminates all points of the object being photographed. Local lighting is the lighting of a limited part of certain space or part of the object being photographed. Silhouette is the lighting, when the objects in the foreground are darkened, and the light falls to the background [5]. The latest advances in lighting technology include
Table 1. Four Categories of Luminescent Lamps
Type Function
T8 with a bulb 26 mm in diameter
A standard lamp used to illuminate most rooms. Power potential of 18 or 36 watts. Suffi-ciently sensitive to a decrease in air temperature – when the temperature drops below zero, the lamp’s trigger mechanism switches off.
T5 with a diameter of 16 mm
Upgraded model, shorter than a standard bulb by 5 centimetres. In the production of T5, a special kind of phosphors, which ensures a more qualitative glow, is used. This lighting device contains a reduced amount of mercury (up to 3–5 g) and is less dangerous for the environment and humans.
T12 with a diame-ter of 38 mm
Another standard type used in light fixtures where T8 does not fit. Available with different power and colour temperatures.
CFLCompact lamps, designed to be connected into small light fixtures. They have a tradition-al E27 (E14 – reduced size) cap or a special design with four pins for connection. Capacity from 18 to 80 W.

Light & Engineering Vol. 27, No. 1
112
fluorescent lamps, various types of laser illumina-tors, used both for practical purposes, for example, in measurements of atmospheric pollution, in light reflection, and for decorative illumination of mis-cellaneous objects [6]. For example, fixtures with fluorescent lamps (these are the ones used in facto-ries) should be used with ballasts that provide a po-wer factor of at least 0.9 with light fixtures for two lamps and more and 0.85 for single-lamp fixtures. Design of the lamp is quite a simple one. Into a hol-low flask filled with an inert gas and mercury va-pour, electricity is supplied through the electrodes. There appears a discharge that causes ultraviolet ra-diation and a luminophor glow. This substance is ap-plied by the manufacturers to the inner surface of the tube. It is important to note, that the lamp is safe for the human eye – the glass prevents penetration of ul-traviolet radiation beyond the bulb. The exception is the special anti-bacterial lamps, ori ginally designed to combat pathogens and dangerous viruses. The bulb in such light fixtures is made of quartz glass. The main classification of lamps of a luminescent type includes four categories of de vices (Table 1).
Such lamps have, of course, both their advan-tages and disadvantages. The advantages include: possibility of long-term operation; high efficiency (up to 25 %); increased luminous efficiency (com-pared with an incandescent lamp, an increase of 10 times is observed); possibility to use lighting of dif-ferent spectrum; low cost of the device. However, certain shortcomings also exist, such as: hazardous effect of the tube contents for the environment; de-pendence on switching on and off (over time, qua-lity of lighting decreases); dependent on voltage fluctuations; cannot be used without a trigger; de-
pendent on air temperature (less for models with semiconducter ballast). In comparison with incan-descent lamps, which, in turn, gradually lose their importance in the use of various organizations, they are actively used by owners of enterprises, organi-zations, etc. An incandescent lamp (IL) is an electric light source that emits light as a result of the heat-ing of a conductor made of refractory metal (tung-sten). Tungsten has the highest melting point among all pure metals (3693 K). The filament is confined in a glass flask filled with an inert gas (argon, kryp-ton, nitrogen). The inert gas protects the filament from oxidation. The glass bulb prevents the nega-tive effect of atmospheric air on the tungsten fi-lament. The advantages of this kind of light fix-ture include: low cost; instantaneous ignition when switched on; small overall dimensions; wide power range. The disadvantages are: greater luminance (negatively affects the eyesight); short service life – up to 1000 hours; low efficiency (only one tenth of the electric energy consumed by the lamp is con-verted into a visible light flux, the rest of the ener-gy is converted into thermal energy). Due to their shortcomings, which are significant, such lamps are inferior to luminescent lamps when used in large enterprises. Luminous efficiency of different types of Lamps is presented in Fig. 1
When considering the use of working light, it is recommended to supply it on independent lines from switchgear of substations, boards, cabinets, distribution points, trunk and distribution busbars. In industrial, public and residential buildings, up to 60 incandescent lamps, each with a power of up to 60W, can be connected to single-phase lighting groups of stairways, corridors, halls, technical sub-floors and attics. This refers to a grouped network where lines must be protected by fuses or circuit breakers. For outdoor lighting, any light source can be used. The use of discharge lamps is not permitted for the security lighting of the enterprise territories, in cases where the security lighting is not normal-ly turned on and is automatically turned on by the security alarm. It is recommended to make outdoor lighting networks using cable or air using self-sup-porting insulated wires. In addition, for such illu-mination the lighting fixtures themselves can be in-stalled on specially designed supports. To ensure the right and proper illumination light guides are needed. Currently, most enterprises use lighting de-vices with hollow light guides. They are necessary for general uniform internal illumination; illumina-
Fig. 1. Luminous efficiency of different types of Lamps

Light & Engineering Vol. 27, No. 1
113
tion of territories, open spaces and streets; the intro-duction of buildings and distribution in them both direct sunlight and artificial light. Lighting devices with Hollow Light Guides [7] are hollow cylindri-cal (or other forms) pipes of a large extent, part of the inner surface (or the entire surface) of which is covered over the entire length by a specularly re-flective layer or prismatic film of total internal re-flection, while the light flux (of the IC or the group of lamps) is introduced into the ends of the PPS by special optical systems. The Fig. 2 shows the possi-bilities of saving electricity in lighting installations with fluorescent lamps.
Electrical networks of buildings must be de-signed to supply the lighting of advertising, shop windows, facades, illuminating, outdoor, fire-fight-ing devices, dispatching systems, light fire hydrant signs, security sign, bell and other signalling, light barriers, etc. in accordance with the design task. Ilu-minated surface luminance depends on the intensi-ty of the light source and the nature of the surface itself [8]. It is always less than the luminance of the light source, since a part of the light is absorbed by the illuminated surface, another part is scattered in different directions and only the third part of it is reflected in the direction, from which the surface is viewed. Abroad, studies and experiments were con-ducted on the influence of lighting on human per-formance, and also in order to identify possible cri-teria for the norma lization of illumination. “The
following indicators were investigated: PT (labour productivity, speed of proof-reading work), visual fatigue (for a relative change in the time of chro-matic adisparopy, visibility and luminance of the source at the comfort-discomfort boundary). The following conclusions were drawn from the results of the studies: as a rule, the increase in illumina-tion leads to the growth of PT, but with excessive increase in illumination, fatigue increases” [9]. The Table 2 shows an example of energy savings for dif-ferent lighting object locations.
Reasoning from the previously said, it can be ar-gued that the energy costs for the production and use of light energy determine to a large extent the lighting level of the industry and the country as a whole. The degree of development of the states can be characterized to the greatest extent not so much by the volumes of steel and pig iron smelt-ing, the extraction of oil or gas, the number of ma-nufactured machines and locomotives, as the “light provision” of this state while minimizing energy consumption.
Security is what is important and what each of us strives to provide. To achieve that, we need to equip ourselves with a certain set of knowledge that will help to prevent emergencies. So, for example, after the disconnection of switches, disconnectors (sepa-rators) and load switches with manual control take place, it is necessary to visually verify that they are truly disconnected and there are no bridging
Table 2. Energy Consumption and Savings
Lighting object location
Basic energy consumption, 10 15 J / year
Potential of savings ,
%
Savings (low), 10 15 J
% of total savings
Savings (high), 10 15 J
% of total savings
Electric lighting
In residential apartments 5604 40–60 2242 25 3362 27
In commercial buildings 9551 25–40 2388 27 3821 31
In industry 3272 15–25 491 6 818 7
Street lighting, etc. 1507 25–50 377 4 753 6
Lighting on fuel (kerosene)
In residential apartments 3603 92–99 3300 38 381 29
Total 23536 37–52 8797 100 12335 100

Light & Engineering Vol. 27, No. 1
114
jumpers [10]. Labour protection is also envisaged for checking the absence of electric voltage. This should be done with the help of special instruments designed for this purpose or by approaching cur-rent-carrying parts that are known to be energized. In pre-fabricated switchgear factory-made, the test is performed using built-in stationary voltage indi-cators. One of the measures may also be the “hang-ing of prohibitory posters” [11]. For example, on the actuators (handles of drives) of switching devices with manual control, such posters as “Do not switch on! Workers are present!” should be used. De vices that signal the disconnected position of the machin-ery, blocking devices, and permanently connected voltmeters are only additional means of confirm-ing the absence of voltage, and on the basis of their indications, it can not be concluded that there is no voltage in the electric system. Voltage dips occur in networks when switching power from one source to another without first disconnecting the load [12].
It is important to mention the magnetic field created by the interaction of the conductor with the current. Conductors with electric current act on each other by means of magnetic forces. Mov-ing electric charges (currents) create a magnetic field. In the open switchgear and on the overhead line with a voltage of 330 kV and above, protec-tion of workers from a biologically active electric field, which can have a negative effect on the hu-
man body and cause the appearance of electrical discharges when touched to grounded or ground-in-sulated electrically conductive objects, has to be properly organised. In electrical installations of all voltages, workers must be protected from a magnet-ic field, which can have a negative effect on the hu-man body. In the Table 3 you can see the permissi-ble levels of the magnetic field.
Also, labour protection is very important when working with portable power tools and lamps, ma-nual electric machines, separation transformers. First of all, all these devices must meet the techni-cal regulations requirements, national standards and technical conditions in terms of electrical safety and be used in compliance work. It is not allowed to use manual electric machines, portable power tools and lamps with associated auxiliary equipment, which have defects and have not passed periodic inspec-tion (tests). Fixtures are intended, as a rule, to illu-minate relatively closely located objects or light sig-nals at short distances. Two or more lamps may be installed in light fixtures (in multi-lamp chandeliers, for example, the number of lamps can go as high as to hundreds and even thousands of units). Fixtures for lighting (unlike signal lamps) are, as a rule, ab-breviated as luminaires [1]. When using portable lu-minaires, their wires and cables should, if possible, be suspended. Do not directly touch wires and ca-bles with hot, wet and oily surfaces or objects. Elec-tric cable should be protected from accidental me-chanical damage and contact with hot, moist and oily surfaces. If any malfunctions are found, the work must be stopped immediately.
4.CONCLUSION
We can assert with confidence that technical progress does not stand still. Of the major achieve-ments of recent years, creation of a huge variety of
Fig. 2. Stages for energy savings
Table 3. Permissible Levels of Magnetic Field
Duration of stay (hour) Permissible levels of magnetic fieldH (A / m) / V (μT) when exposed
generally locally
≤ 1 1600/2000 6400/8000
2 800/1000 3200/4000
4 400/500 1600/2000
8 80/100 800/1000

Light & Engineering Vol. 27, No. 1
115
solid-state emitters – LEDs and solid-state lasers can be named. In these light sources electric ener-gy directly transforms into optical radiation, which allows to establish contact light displays and pa-nels, widely used in modern devices and computers. In the end, progress in the development of lighting technology is determined by the success in the study of physical processes. The major achievements of STEM disciplines of the past century were made possible by the creation of scientific instruments. As a result of the improvement of technical equip-ment of enterprises, primarily state-owned, which have great importance for the economy of the state, it is possible to increase the level of power supply efficiency, minimize risks, accidents and emergen-cies in order to avoid negative consequences for the individual.
REFERENCES
1. Shepeleva D.V. State-owned enterprise as a subject of financial law: Thesis for a PhD in Law. MSLA. Mos-cow, 2016. 218 p.
2. Andreeva L. Energy - clear legal regulation // the Russian justice, 2001, #8.
3. Ahmad M.W., Mourshed M., Rezgui Ya. Trees vs Neurons: Comparison between random forest and ANN for high-resolution prediction of building ener-gy consumption // Energy and Building, 2017, Vol. 147, pp. 77-89.
4. Rules and regulations of electrical installations ar-rangement [Text]: All applicable sections of EIC-6 and EIC-7, Novosibirsk: Normateca, 2017, 464 p.
5. Mayorova O.V., Mayorov E.E., Turkbaev B.A. Lighting engineering. SPbGUITMO, 2005. p. 86.
6. Ishunin G.G., Kozlov M.G., Tomskij K.A. The basics of lighting engineering. SPb. // Beresta, 2004, p. 292.
7. Hollow Light Guides Technology and Application. 164-2005 CIE Technical Report. 37 p.
8. Aizenberg Yu.B. The reference book on light engi-neering 3rd edition // Znak publ., Moscow, 2006, 962 p.
9. H. Claude Weston. The relation between illumina-tion and visual efficiency, the effect of brightness con-trast // H.M. Stationery off, London, 1945, 35 p.
10. Sivkov A. A., Gerasimov D. Yu., Saigal A. S. The basics of power supply // Publishing house of Tomsk Pol-ytechnic University, Tomsk, 2012, 180 p.
11. Rules for labor protection and operation of instal-lations // ENAS publ., Moscow, 2017, 190 p.
12. Vafin D.B. Energy supply for enterprises // NHTI (branch) of FSBEI HPE “KNRTU, Nizhnekamsk, 2013, 104 p.
Denis V. Shepelev,Ph.D. in Law, Associate Professor of the Department of legal regulation of economic activities, Financial University under the Government of the Russian
Federation, Professor of Department of theory of state and law of Kutafin Moscow State Law University (MSAL)
Dina V. Shepeleva,Ph.D. in Law, Associate Professor of the Department of legal regulation of economic activities, Financial University under the Government of the Russian Federation
Natalia G. Kondrakhina,Ph.D. in Philology, Professor of the Department of language training, Financial University under the Government of the Russian Federation

116
Light & EngineeringVol. 27, No. 1, pp. 116–122, 2019
ENERGETIC SECTOR OF ECONOMY: THE RUSSIAN LAW MODEL
Natalya I. Besedkina, Irina I. Romashkova, and Tatyana A. Tantsura
Financial University under the Government of the Russian Federation E-mails: [email protected]; [email protected]; [email protected]
ABSTRACT
The authors of the article consider the forma-tion of the economy energetic sector with regard to the system of law provisions, governing the state activity in relation to the formation and develop-ment of market mechanism in the fuel and energy complex (FEC), and also the activity of business entities in the energy market and its infrastructure. They analyze the set of law provisions, forming the existing energy legislation in Russia, and some practical matters regarding statutory requirements for applying effective and safe lighting equipment. The article draws the conclusion about the necessity of the energy law stabilization and the provision of legal control in the developing sphere of public re-lations in the area of energy. Authors point out the need of improving legislation in the area of produc-ing energy effective lighting equipment, with the purpose of stimulating the development of scientific research and legal support for manufacturing new goods, which are necessary for customers.
Keywords: energy, energy legislation, light-ing, lighting equipment, energy market, ener-gy commodities, stimulation of production, al-ternative energy sources, energy savings, energy conservation
1. INTRODUCTION
Relations in the area of energy involve the com-plicated complex of such processes as extraction, refining, downstream and utilization of all kinds of energy resources. Energy stability and indepen-dence are the guarantee of successful economy de-
velopment, that provide the formation and ope-ration of almost all technological processes. Due to these aspects, the essential importance of energy industry for the economy of any state today is not contested. Regardless of the government role in the energy market, the influence of international prices on energy resources will put pressure on the domes-tic market. It is worth pointing out that the energy market in Russia has been characterized by imba-lance of price indicators, since 1990-s. Prices of oil sector products, which are more integrated with the foreign market, were practically free from the direct state impact and were formed on the netback prin-ciple. Market pricing also dominates in the coal in-dustry of Russia. However, gas prices are mainly regulated by the government, and the government policy has been changed three times for the last two decades – from rigid price control (to ensure so-cial stability and the competitiveness of industry) to higher-than-market-growth in 2003–2013, and at last, again to blocking of prices resulting from eco-nomic slowdown [1].
The variety of objective and subjective factors, characterized with internal and external nature, in-fluence on the economy development. It stands to mention that in spite of immutability of compo-nent elements, the influence of some or other factors proportionally changes in course of time. For exam-ple, nowadays the role of such factors as environ-mental safety, political expediency and le gislative control is increasing. In considering matters about energy effectiveness, another important aspect is usually ignored – it is the usage of efficient and safe lighting equipment, and in particular, legislative control of this area.

Light & Engineering Vol. 27, No. 1
117
Hence, in this article the attempt to scrutinize the existing energy sector of the Russian Federa-tion economy and its legislative regulation has been made. For this purpose, authors analyze legislative requirements with regard to the introduction of ef-fective lighting equipment, as well as the matters of electric consumers’ protection by means of the possibility to search alternative power-generating sources.
2. THE ENERGY MARKET ANALYSIS
Russia has the largest territory (11 %), where up to 15 % of world’s developed fuel reserves have been discovered and prepared for use. Russia has the highest capitation supply with relatively cheap energy resources among developed countries. How-ever only 18 % of the country regions are provided with their own energy resources, the rest ones have to import them from other regions, often being hun-dreds of kilometres away [1]. The Russian fuel and energy complex was created during Soviet times and it was the largest international energy resour-ces manufacturer and the second energy consump-tion state of that time. After the demise of the Soviet Union, the fuel and energy complex (FEC) together with the whole economy suffered a blow – 40–50 % decline in production of main energy resources.
Partly for these reasons, but mostly because of excessive raw material structure and poor econo-my management with great technological inferi-ority, Russia consume 5.5 % of world’s energy re-sources, but the energy intensity of gross domestic product (GDP) (as regard to purchasing power pa-rity of the rouble) is 1.9 times higher than world-wide average one, two times higher than the energy intensity of the USA and three times higher than the energy intensity of leading Europe countries. When combined with the export orientation of the energy sector (up to the half of produced energy resources are exported), the economy burden is 4.5 times hig-her than worldwide average one: investments to the energy sector reach 6 % of Russia GDP with 1.3 % in the world as a whole.
Some subjective elements putting pressure on energetic development are destabilizing fac-tors, the influence of which should be minimized with the purpose to secure stable and independent energy market. The specific feature of the world’s energy market is the impossibility of changing its parti cipants’ status. The majority of countries in the
world cannot provide themselves with resources to produce energy, as the result of which they have to purchase required volumes from other countries. Exporting countries are also interested in the sta-bility of energy market, because it secures the sig-nificant part of national income. According to the data of the national survey “The forecast of world’s and Russia energetic development up to 2040” [1], Russia is the fourth largest energy resources pro-ducer in the world (after the Organization of Petro-leum-Exporting Countries (OPEC), China and the USA) and the sixth largest consumer (after Chi-na, the USA, the European Union (EU), OPEC and India), providing 10 % world output and 5 % world consumption of energy resources.
The optimal model of the modern energy market includes not only production but also the rational use of energy gain. This situation is attributable to the factor, that ultimate consumers in any country are interested not only in reliable and stable energy sup-plies at affordable prices, but for its effective use. Importing countries, having a measure of depend-ency from exporters, have to seek alternative ener-gy sources and develop energy intensive techno-logy for exported energy storage. In a manner of speaking, energy dependence, or rather attempts to weaken it, in an indirect way helped the growth of technology in the energy sector, aimed at finding solutions for the best use and storage of purchased energy. It stands to mention that increasing the share of alternative energy sources, including renewable ones, is not always economically justified – in most cases for the large scale implementation of such sources government support is used. The state po-licy of government support enables to draw atten-tion to renewable energy even in those cases, when initial economic indicators (without including sup-port mechanisms, taxation and so on) more than 50 % worse when traditional sources are used. It is paradoxical, but in this case, at the stage of renew-able energy sources implementation, high energy prices are psychologically advantageous for import-ing countries, because they provide an opportuni-ty to justify expenses concerning with the transi-tion to alternative energy sources. According to the data of the Analytical Centre under the Government of the RF, the growth of alternative energy sources will reach 93 % in the year 2040 in relation to fore-casted 47 % general increase in energy demand [1].
In addition to that, countries that have been tra-ditionally energy suppliers were less concerned

Light & Engineering Vol. 27, No. 1
118
with the problems of diversification of energy and its intensity. Traditional energy sources (such as coal, gas, oil), being the basic ones for the num-ber of countries, were prevalent on the market, and it led to the orientation of exporting countries do-mestic markets to one type of sources. There was no economic need for diversification, because alter-native sources were less effective and more expen-sive, besides, there was no need in their search. Ac-cording to the data of the Forecast of world’s and Russian energetic development up to 2040, the con-sumption of primary energy in Russia will increase 0.9 % during 2010–2020, at the same time in the USA the growth will be 0.3 %, and in the Europe-an Union countries it will even decline to 0.4 %. The main problem of the Russian energy sector is low efficiency, connected with cold climate, large area, low population density (and its unequal distri-bution through the territory), and also raw material orientation of the economy and the obsolete techno-logies for fuel and energy utilization.
3. THE ANALYSIS OF A REGULATORY FRAMEWORK FOR THE ENERGY SECTOR
Securing the legal and regulatory framework of the economy energy sector, the establishment of certain uniform “rules” for the participants of this activity sphere in all its diversity, takes on enormous importance in stabilizing the sector and the for-mation of its development key directions. The de-tailed energy laws enable to minimize the influence of external factors and diffuse the impact of nega-tive “non-market” conditions. It should be empha-sized that due to the deep penetration of the energet-ic in all spheres of the economy, legal regulation of this sector is difficult both in theoretical and practi-cal aspects, since developing rules of law it is neces-sary to take into account possible conse quences not only for separate types of energy market, but for the whole economy of the country.
To date the sources of law, governing the re-lations in the energy sector, include the Consti-tution of the Russian Federation, federal laws, by-laws, acts of self-regulating organizations, con-taining rules of law, local normative acts of legal entities, international treaties of the Russian Fede-ration, customs, judicial acts of courts of last resort, doctrine.
National energy legislation cannot develop in a stable way in isolation from the internatio-nal law that as a result engenders the problem of unification of national and international energy le-gislation. Hence it may be noted that legislative re-gulation regards not only to the internal factors of energy sector formation, but it can pretend to be the external factor, which in its turn doesn’t always emerge under the influence of objective circum-stances. The competition among states in the ener-gy sector poses a number of international problems that is necessary to solve within the established glo-bal legal order based on the contemporary interna-tional law.
There is a number of international instruments concerning with the energy sphere, in the first place these are the European Energy Charter 1991; the Energy Charter Treaty 1994 and other documents adopted in its development; the Energy Charter Protocol on Energy Efficiency and Related Envi-ronmental Aspects 1994; Mining Charter of the Commonwealth of Independent States 1997; the Agreement on Cooperation in the study, explora-tion and use of raw mineral resources 1997; the Agreement on Cross-border Cooperation in the area of study, development and protection of natural resources 2001; the General Agreement on Tariffs and Trade 1947; the Marrakech Agreement about the establishment of the World Trade Organisa-tion (WTO) 1994; The Barcelona Convention and Statute on Freedom of Transit, the Charter of Orga-nization of Petroleum Exporting Countries (OPEC), agreements of CIS (the Commonwealth of Inde-pendent States) countries, and also federal laws of the Russian Federation, reflecting stages of energy politics development.
Rules of law regulating social relations (both public and private law relations), arising in con-nection with prospecting, extraction of energy re-sources, production, processing, supply, storage, transportation of various types of energy re sources, designing and building energy plants, ensuring ener-gy security, industrial security, counter-terrorist se-curity are constantly being improved.
During the implementation of the Energy Strate-gy of Russia for the period until 2020, approved by the order of the Government of the Russian Federa-tion of August 28, 2003 No. 1234-p, the adequate-ness of the majority of its provisions to the real pro-cess of the country’s energy sector development, even in the conditions of sharp changes of inter-

Light & Engineering Vol. 27, No. 1
119
nal and external factors, determining the main pa-rameters of functioning the fuel and energy com-plex of Russia has been confirmed. Moreover, it was planned to amend this Strategy no less frequently than once every five years.
The adoption of the Order of the Russian Fede-ration Government of 13.11.2009 No. 1715-p “Con-cerning the Energy Strategy of Russia for the pe-riod until 2030” [2] has stipulated the energy law development regulating social relations in the ener-gy sphere and in individual energy industries. The Energy Strategy is the document establishing the goals and objectives of the Russian energy sector long-term growth, priorities and benchmarks, and also the mechanisms of state energy politics at cer-tain stages of its realization in accordance with new objectives and priorities of the country’s develop-ment. Indeed, the Energy Strategy of Russia for the period until 2030 takes into account new trends of the economy and energy sector development as much as possible, the emergence of new techno-logies and expanding the time horizon until 2030 in accordance with the necessities of the times.
Since the adoption of the Energy Strategy of Russia for the period until 2030 the considerable amount of laws and regulations have been passed, which ensure the implementation of the strategic objectives. The principle of environmental protec-tion can be distinguished as one of the energy de-velopment directions. Ecologically oriented poli-cies are reflected in laws and regulations, devoted to the energy problems. The above-mentioned En-ergy Strategy of Russia for the period until 2030 de-fines that the objective of the state energy politics is the most effective use of energy resources and the potential capacity of the energy sector for the steady growth of the economy, the improvement of the country’s population quality of life and the as-sistance in strengthening country’s foreign econo-mic positions.
The completeness and sufficiency of the state energy politics regulatory support is manifested in complex framework law in the sphere of energy sector functioning, together with integral systems of relevant by-laws.
At present, the formation of legal regime for energy resources continues, its peculiarities are fixed in the number of legislative acts. For example, the federal law of November 23, 2009 No. 261-FZ “Concerning Energy Saving and Energy Efficiency Improvement and on Amendments to Certain Le-
gislative acts of the Russian Federation” [3] regu-lates relations regarding energy saving and energy efficiency improvement; establishes the legal, eco-nomic and organizational framework for stimulating energy saving and energy efficiency improvement.
The Federal law of 31.03.1999 No. 69-FZ (as amended on 26.07.2017) “Concerning Gas Sup-ply of the Russian Federation” [4] determines legal, economic and organizational framework for rela-tions in the field of gas supply in the Russian Fede-ration and is directed to meet the needs of the state in the strategic kind of energy resources.
The Federal Law of March 26, 2003 No. 35-FZ (as amended on 29.12.2017) “Concerning the Elec-tric Power Industry” [5] establishes legal frame-work for economic relations in the field of elec-tric power industry, determines the powers of state authorities to regulate these relations, basic rights and obligations of electric power industry entities, when exercising the activity in the field of electric power industry (including production in the mode of combined generation of electricity and heat) and the consumers of the electric power.
The Federal Law of July 27, 2010 No. 190-FZ “Concerning Heat Supply” (as amended and sup-plemented, and come into force on 10.08.2017) [6] establishes legal framework for economic relations, emerging in connection with production, transmis-sion and consumption of heat energy, heat power, the heat transfer medium with the use of heat sup-ply system, the implementation, functioning and de-velopment of such systems, and also determines po-wers of state authorities, local authorities regarding the regulation and control in the field of heat sup-ply, rights and obligations of heat energy consu-mers, heating supply companies, heating network organizations.
The development of normative legal base in the field of state regulation energy saving and ener-gy efficiency improvement is exercised including other laws and regulations, and taking into account goals described by the National programme of the Russian Federation “Energy Efficiency and Ener-gy Development” approved by the RF Government Regulation of April 15, 2014 No. 321 (as amen ded on 30.03.2018) [7], including the development of energy saving and energy efficiency improvement; meeting the demands of the domestic market with reliable, quality and economically justified sup-ply of electric energy and heat; the development of oil-and-gas and coal industries of the fuel and ener-

Light & Engineering Vol. 27, No. 1
120
gy complex for the effective supply with hydro-carbon and coal raw materials the demands of the domestic market and the fulfilment of obligations under foreign contracts; promoting innovative deve-lopment of the fuel and energy complex.
In addition, according to paragraph 60 of the Russian President Decree of 31.12.2015 No. 683 “Russia’s National Security Strategy” [8], one of the main directions of national security protection in the economic field for the long term is enhancing ener-gy security, which involves sustainable provision of domestic demand with energy carriers of standard quality, the growth of energy efficiency and energy saving, the competitiveness of national energy com-panies and manufacturers of energy resources, pre-vention of the fuel and energy resources deficit, the development of strategic oil reserves, reserve capa-city, the production of accessory equipment, con-stant fuel and energy system performance.
The majority of the mentioned legal acts taking into account their significance and integrated nature are the objects of active work with the purpose of improvement, making necessary amendments and/or the establishment of the system of appropriate by-laws.
It is necessary to note, that at the present time the legislative policy in the sphere of the energy mar-ket is changing. In particular, together with require-ment strengthening to the energy producers, there is the increase of lawmakers’ attention to energy con-sumers, especially to equipment used by them. The awareness by lawmakers the importance of ener-gy-intensive and energy-saving technologies as re-gards to the energy security is manifested mainly in adoption of new laws and regulations.
Thus since 1 January 2018 more than 10 provi-sions of legislative acts come into force, directly af-fect the interests of Russian producers of light-emit-ting-diode light engineering. In particular, the RF Government Regulation of April 15, 2017 No. 450 amending the RF Government Regulation of 31.12.2009 No. 1222 [9]; the RF Government Re-gulation of January 25, 2011 No. 18 “On Approv-al of Regulations for Restablishing Requirement of Energy Efficiency for Buildings and Structures and Requirements to the Rules of Determining the Class of Energy Efficiency in Blocks of Flats” [10]; The Regulation of November 10, 2017 No. 1356 “On Approval Requirements to Lighting Devic-es and Electric Bulbs, used for Purposes of Alter-nating-current and Lighting” [11]. The analysis of
the Russian Federation legislation indicates that the Russian light engineering is on the stage of inten-sive development and improvement.
The energy sector of the economy in any country is the area of state interest, therefore, as a rule, it is under the strict control of the government. The state share at the domestic energy market in different parts can reach 100 %. This situation is prima rily connected with the conservatism of the energy busi-ness – in order to make some profit it is necessary to receive substantial investment for long terms.
Undoubtedly, the issuers of legislative regula-tion of renewable or regenerative energy require particular attention. Along with that despite the adoption of a number of statutory acts, designed to put things right in the area of energy supply with the use of renewable sources of power, it would be premature to say that there is the particular sys-temized base of sources in this sphere. The majo-rity of current legal acts in this sphere are mostly of a declarative nature proclaiming the main aim: “the development of using renewable energy sources”, and not proposing the necessary mechanism of its realization, that lead to difficulties in application of these acts. At the present time, the technologies ope-rating on the base of the use of renewable sources of power are not sufficiently developed to be com-pete in the market, they do not provide for the deve-lopment of alternative energy suppliers, major sup-pliers do not seek to diversify deliveries, preferring traditional single sources, that highlights the need for state support of their promotion. In addition, in-ternal and external problems the Russia faces, ta-king into account economic parameters and the po-tential capacity of the Russian energy sector, result in the changes in the development model. Accord-ing to experts’ estimates, the rapid increase in the use of renewable sources of power set additional tasks for the whole energy sector, connected with the necessity of reserving power and its accumula-tion for providing the flexibility of the State energy system activity.
4. CONCLUSION
To conclude, it is necessary to mention, that monopolization of the energy sector by the state at present is disputable in terms of benefits for fi-nal consumers. Without contesting the right of state control over production and selling of traditional kinds of energy, it is offered to consumers with the

Light & Engineering Vol. 27, No. 1
121
opportunity to seek alternative sources themselves in order to meet their own needs with energy. Be-sides, le gislators should review their position re-garding the opportunity for sellers to enter the mar-ket of the energy, while the analysis of laws and regulations, governing the energy sector of Rus-sia, shows that at the present time there is no such opportunity for the participants of the market. The peculiarities of the development of the Russian energy sector have resulted to its governmentali-sation that at the moment it diverges with the inte-rests of final consumers. To stabilize the relations of alternative sources of energy at the market, it is required to fundamentally review the legislation ta-king into account the interests of private suppliers. Deciding on the introduction of a new alternative source of energy it is necessary to be sure in its fu-ture demand, stability, and legitimacy. It is worth noting that considering the legislative provision of the domestic energy market it is important to deal with the issues of energy efficiency and energy saving. In particular, it is pointed out that lighting equipment allows to reduce energy consumption, and overall energy saving in this case can reach 30 % [12]. The share of lighting in overall ener-gy consumption is high enough, that is why the ap-plication of effective sources of light and the deve-lopment of appropriate technologies is one of the primary ways for solving this problem. For some entities the way out will be not only the diversifica-tion of energy supply through the use of renewable energy sources and the emergence of new indepen-dent suppliers in the market, but putting into opera-tion safe and effective lighting equipment. It should be noted the increasing role of legislative regula-tion in this sphere. The introduction of new ener-gy-saving technologies, including the use of legal restrictions and direct instructions, promote the de-velopment of a modern energy legislation model, aimed at effective use of produced energy.
As can be seen from the above review of the le-gislation, the government pays little attention to the potential of alternative energy resources, establish-ing general rules for all market participants. More-over, the absence of legislative restrictions with re-gard to the use of obsolete lighting equipment also leads to the lag of the Russian domestic energy mar-ket and contributes to increasing losses of energy for consumers. In keeping with this trend, the most wide use of practice for stimulating energy sa vings and the development of new technological proces-
ses is the policy of rising traditional sources energy prices that is contrary to the interests of final con-sumers and can increase prices on for a significant number of goods in the domestic market. The in-troduction of state programs with regards to energy saving and energy efficiency stimulates the appli-cation of appropriate technologies and as a conse-quence conducting scientific research and develop-ment in these respects.
REFERENCES
1. The forecast of world’s and Russia energetics de-velopment up to 2040. FSBUS “The Institute of energe-tics researches under the Russian Academy of science” and FSBU “The analytic centre under the Government of Russian Federation” // https://www.eriras.ru/files/fore-cast_2040.pdf access date 14.06.2018.
2. Order of the Russian Federation Government of 13.11.2009 1715-p “Concerning the Energy Strate-gy of Russia for the Period until 2030” // Collected Acts of the Russian Federation, 30.11.2009, No. 48, the arti-cle 5836.
3. Federal Law of November 23, 2009 No. 261-FZ (as amended on 23.04.2018) “Concerning Energy Sav-ing and Energy Efficiency Improvement and on Amend-ments to Certain Legislative Acts of the Russian Fe-deration” // Collected Acts of the Russian Federation, 30.11.2009, No, 48, the article 5711.
4. Federal law of 31.03.1999 No. 69-FZ (as amended on 26.07.2017) “Concerning Gas Supply of the Russian Federation”// Collected Acts of the Russian Federation, 05.04.1999, No. 14, the article 1667.
5. Federal Law of March 26, 2003 No. 35-FZ (as amended on 29.12.2017) “Concerning the Electric Power Industry”// Collected Acts of the Russian Federa-tion, 31.03.2003, No. 13, the article 1177.
6. Federal Law of July 27, 2010 No. 190-FZ “Con-cerning Heat Supply”// Collected Acts of the Russian Fe-deration, 02.08.2010, No. 31, the article 4159.
7. National programme of the Russian Federa-tion “Energy Efficiency and Energy Development” ap-proved by the RF Government Regulation of April 15, 2014 No. 321 // Collected Acts of the Russian Federation, 05.05,2014, No. 18 (part III), the article 2167.
8. Decree of the President of Russia of 31.12.2015 No. 683 “Russian National Security Strategy” // Collec ted Acts of the Russian Federation, 04.01.2016, No. 1 (part II), the article 212.
9. RF Government Regulation of April 15, 2017 No. 450 amending the RF Government Regula-

Light & Engineering Vol. 27, No. 1
122
tion of 31.12.2009 No. 1222 // Collected Acts of the Rus-sian Federation, 24.04.2017, No. 17, the article 2572.
10. RF Government Regulation of January 25, 2011 No. 18 “On Approval of Regulations for Establishing Re-quirement of Energy Efficiency for Buildings and Struc-tures and Requirements to the Rules of Determining the Class of Energy Efficiency in Blocks of Flats” // Collect-ed Acts of the Russian Federation, 31.01.2011, No. 5, the article 742.
11. Regulation of November 10, 2017 No. 1356 “On Approval Requirements to Lighting Devices and Electric Bulbs, Used for Purposes of Alternating-current and Lighting” // Collected Acts of the Russian Federation, 20.11.2017, No.47, the article 6992.
12. Onaygil S., Güler Ö. Determination of the ener-gy saving by daylight responsive lighting control systems with an example from İstanbul// Building and Environ-ment, 2003, Vol. 38, pp. 973–977.
Natalya I. Besedkina,Ph.D. in Law, senior lecturer of the Department of Legal Regulation of Economic Activities, Financial University under the Government of the Russian Federation, Russia
Irina I. Romashkova,Ph.D. in Law, senior lecturer of the Department of Legal Regulation of Economic Activities in the Financial University under the Government of the Russian Federation, Russia
Tatyana A. Tantsura,senior lecturer of the Department of Language Training, Financial University under the Government of the Russian Federation, Russia
Editorial staff of Light & Engineering Journal apologiz-es for the next missing paragraph in V. 26, #1, p. 16, pa-per “Technological Lighting for Agro-Industrial Instal-lations in Russia” by Leonid B. Prikupets:
ACKNOWLEDGMENT
Author would like to thank for financial support. This article is written within a project of financial sup-
port of applied scientific researches by the Ministry of Education and Science of the Russian Federation. The subject is: “Comprehensive studies in the plant pho-to-culture and creation of high-effective LED phytoir-radiators for increase of energy efficiency of industri-al greenhouses”
Agreement on grant ing subs idy i s the #14.576.21.0099 of 9/26/2017. Unique identifier: RFMEFI57617X0099.

123
Light & EngineeringVol. 27, No. 1, pp. 123–128, 2019
LEGAL PROVIDING OF APPLICATION OF ENERGY EFFECTIVE LIGHTNING TECHNOLOGY AND INTELLECTUAL NETWORKS
IN THE CONDITIONS OF DIGITAL ECONOMY
Maksim V. Demchenko1, Rostislav O. Ruchkin2, and Eugenia P. Simaeva1
1 Financial University under the Government of the Russian Federation 2 Legal Department, Bank of Russia, Moscow, Russia
E-mail: [email protected]; [email protected]
ABSTRACT
The article substantiates the expediency of im-proving the legal support for the introduction and use of energy-efficient lighting equipment, as well as smart networks (Smart Grid), taking into ac-count the ongoing digitalization of the Russian eco-nomy and electric power industry. The goal of sci-entific research is formulated, which is to develop practical recommendations on optimization of the public relations legal regulation in the digital po-wer engineering sector. The research methodolo-gy is represented by the interaction of the legal and sociological aspects of the scientific methods sys-tem. The current regulatory and legal basis for the transformation of digital electricity relations has been determined. The need to modernize the sys-tem of the new technologies introduction legal re-gulation for generation, storage, transmission of energy, intelligent networks, including a risk-based management model, is established. A set of stan-dard-setting measures was proposed to transform the legal regulation of public relations in the field of energy-efficient lighting equipment with the aim of creating and effectively operating a single digi-tal environment, both at the Federal and regional le-vels. A priority is set for the development of “smart” power grids and highly efficient power equipment in the constituent entities of the Russian Federa-tion through a set of legal, economic (financial), edu cational measures.
Keywords: digital economy, energy-efficient lighting equipment, smart networks, intelligent lighting control systems, legal regulation, govern-ment programs, digitalization, equipment technical state index
1. INTRODUCTION
In the digital technologies development con-ditions, the modernization of lighting equipment and electric grids, digital electricity is of particu-lar relevance in the Russian Federation and regions and, consequently, the need for legal support for its development.
In June 2018, the first digital electrical sub-station “Medvedevskaya” will be put into opera-tion in the Russian Federation, designed to power the Skolkovo Innovation Centre. This fact indicates the development of the digitalization process in the Russian electric power complex.
Digital transformation of the electric power complex is one of the directions for the implemen-tation of the state program “Digital Economy”, ap-p roved by the Government of the Russian Federa-tion in July 2017. According to the Director of the Department of Operational Control and Manage-ment in the Electric Power Industry of the Russian Federation Economy Ministry, today the mecha-nism of the power system needs significant opti-mization with the orientation toward the introduc-tion and use of digital technologies, energy efficient lighting equipment, intelligent networks, risk-ori-

Light & Engineering Vol. 27, No. 1
124
ented management model, which in turn requires significant financial costs. However, the results of such a transformation in the electric power industry can exceed all expectations for their energy securi-ty, safety and efficiency [1].
In addition, during the St. Petersburg Interna-tional Economic Forum held in May 2018, an agree-ment was signed between “GAZPROMNEFT” and “TSIFRA” on the implementation of the “Digi-tal Plant” project, which is necessary to develop a digital platform for managing the oil industry. In the period from 2018 to 2035 the activities of the normative “road map” Energy net of the National Technological Initiative approved by the Govern-ment of the Russian Federation will be implemented through the launch of pilot projects, as well as the creation of a legal and economic basis for the wide application of modern solutions in the electric po-wer industry [2].
Development and further improvement of le-gal support of energy-efficient lighting engineering and intelligent lighting control systems, as compo-nents of the Russian Federation power complex is one of the digital economy development priority di-rections. However, the lack of harmonized Federal and regional regulatory system not only hinders, but prevents further digital development of the Russian power industry.
In this regard, it seems advisable to develop at the federal and regional level a system of legal norms for the integrated economic and legal regula-tion of relations arising in connection with the deve-lopment of the digital power industry, as a result of which the regulatory environment in full will pro-vide a favourable legal regime for the emergence and development of modern lighting equipment, in-tellectual networks, and economic activities related to the use of digital infrastructure tools.
Thus, the goal of the study is to develop practical recommendations for improving the legal support for the use of energy efficient lighting and smart grids in the Russian Federation and the constitu-ent entities of the Russian Federation on the basis of a problematic issues analysis that hinder the ef-fective regulation of the electric power digitaliza-tion processes in Russia and the region.
In order to achieve this goal, it is necessary to solve problems:
• To define the operating system of standard and legal regulation of Russian energy efficient lighting engineering and clever networks (Smart Grid) use;
• To estimate positive effects from use of ener-gy efficient lighting engineering and clever net-works (Smart Grid) in the conditions of develop-ment of digital economy;
• To estimate energy efficient lighting engineer-ing and clever networks (Smart Grid) introduc-tion experience in the Russian Federation.
2. MATERIALS AND METHODS (MODEL)
The problems research methodology of legal support for the use of energy efficient lighting and smart grids in Russia with the aim of further impro-ving the development of digital power engineer-ing is the synthesis of legal science methods based on materialistic dialectics: comparative legal, for-mal legal, systemic (legal aspect), – with basic so-ciological research methods: empirical analysis of data, analytical research (sociological aspect).
Formally, a legal (logical) method allows to for-mulate and analyze the normative legal acts system in the digital power industry field from the point of view of a legal regulation and essential legal gaps and collisions lack sufficiency.
At the moment, the standard and legal regula-tion system of energy efficient lighting and intelli-gent lighting control systems is represented by the following normative acts:
• At the federal level: Forecast of the scien-tific and technological development of the Rus-sian Federation for the period up to 2030; “Rus-sian Energy Strategy for the Period Until 2030”; Federal Law No. 261-FZ of 23 November 2009 (as amended on 23.04.2018) “On Energy Conser-vation and on Improving Energy Efficiency and on Introducing Amendments to Certain Legislative Acts of the Russian Federation”; Order of the Min-istry of Industry and Energy of the Russian Federa-tion of 07.08.2007 No. 311 “On the Approval of the Strategy for the Development of the Electronic In-dustry of Russia for the Period until 2025”; Order of the Mi nistry of Construction and Housing and Communal Services of the Russian Federation of 17.11.2017 “On Ap p roval of Energy Efficiency Re-quirements for Buildings, and Structures” and other by-laws.
• At the regional level (on the example of the Mordovia Republic): Law of the Mordovia Repub-lic of March 26, 2013 No. 18-З “On the Powers of the Government Bodies of the Mordovia Repub-

Light & Engineering Vol. 27, No. 1
125
lic in the Field of Energy Conservation and Ener-gy Efficiency” (Edited 16.04.2015); Decree of the Government of the Mordovia Republic from De-cember 23, 2013 No. 583 “On Approval of the State Program of the Republic of “Mordovia Energy sav-ing and Energy Efficiency in the Republic of Mor-dovia for 2014–2020”.
Besides, in the Republic of Mordovia, the re-publican program for supporting the development of the innovative territorial cluster “Energy-effi-cient Lighting Equipment and Intelligent Lighting Control Systems” for 2013–2016 was started, ap-proved by the Resolution of the Government of the Russian Federation of 15.04.2014 No. 316 (an edi-tion of 31.03.2018) “On Approval of the State Pro-gram of the Russian Federation “Economic Deve-lopment and Innovative Economy”. Financing of the cluster “Energy-efficient Lighting Technology and Intelligent Lighting Control Systems” is pre-sented in Fig. 1.
At the same time, analyzing the standard regula-tion system of the public relations in the sphere to po-
wer industry, it should be noted lack of coherence of the acts stated above with the “digital economy” program of the Russian Federation. Besides, it is expedient to carry out some systematization of nor-mative legal acts on power industry sphere. In this regard, it is necessary to harmonize the current leg-islation in the field of digital power industry on the basis of investments attraction continuous monito-ring for the energy saving main mechanisms reali-zation and use of “smart” technologies.
Thus, monitoring as purposeful system process of observation at the regional level, helps to provide in due time to public authorities the relevant infor-mation on the current investment processes, chan-ges, including, in the digital power industry sphere [4].
3. RESULTS AND DISCUSSION
For the development of smart technologies in the electricity sector, significant funding is needed, mainly budgetary funds. So, since 2007, more than 100 billion roubles have been invested from the federal budget. At the same time, the introduc-tion of intelligent networks in Russian cities will reduce losses in networks by 30 billion kWh per year and save 90 billion roubles. Priority directions in this area are increasing energy efficiency, reduc-ing costs, developing renewable energy sources in the city (sunlight, wind), which is generally ac-cessible and environmentally friendly for the envi-ronment [5].
Fig. 1. Total volume of investments in the cluster develop-ment program “Energy Efficient Lighting and Intelligent
Lighting Control Systems” in 2012–2016 [3]
Table 1. Effects from Introduction of Smart Grid Technologies [6]
Technological direction Effect from implementation
Different components of Smart Grid
– Saving 20–45 % of the energy consumed– Reduction of losses from interruptions in the supply of electrici-ty to 15 %– Reducing the capital costs of equipment by (5–10) %– Reduction in the accident rate and the cost of repairs to 10 %
Intelligent instrumentation systems– Improving the quality and reliability of power grids– Supply and demand balance of electricity– Providing infrastructure for smart cities
The new generation of control and moni-toring of distribution networks
– Minimization of expenses at construction of additional (spare) stations
Renewable energy generators with low CO2 emissions
– Increase in environmental friendliness– Increase in stability of network– Uninterrupted power supply, including, remote regions, of the country.

Light & Engineering Vol. 27, No. 1
126
The main “smart” technologies in the electrici-ty sector, as well as the benefits from their use for the development of the projects “Smart City” and “Smart Region” are presented in Table 1.
The problems of public relations legal provi-sion in the field of energy-efficient lighting and in-telligent lighting management systems in the digital economy should be considered primarily through the prism of regulatory and legal normative acts re-gulating energy conservation and digital electricity.
Due to the high cost of developing energy ef-ficient lighting technology and intelligent lighting control systems, it is advisable to provide for le-gislative changes in the electric power industry con-
cerning the need to use the form of public-private partnership, especially in the regions of the Russian Federation.
At the moment, the introduction and use of en-ergy-efficient lighting technology and smart techno-logies in the electric power industry in the Russian regions is presented in Table 2.
The issue of legal support for renewable energy sources remains a topical issue. In the Russian legal system, the subordinate normative acts regulate this sphere: Government Decree No. 449 of May 28, 2013 (as amended on February 28, 2017) “On the Mechanism for Stimulating the Use of Renew-able Energy Sources in the Wholesale Electricity
Table 2. Russian Experience of Using Smart Grid. Source: Presentation – Report “Technologies for Smart Cities” [6]
Belgorod and the Belgorod region
The Belgorod region is the only region of the Russian Federation, the networks of which are united by a single centralized control system based on the solutions of the company “IVTBelGU”.
KurskImplementation of the largest energy service project in Russia with the participa-tion (electronic ballasts) of the electronic ballast “Helios”, which allows controlling and dimming the light points.
Sergiev PosadThe automatic metering has reduced the network losses from 26 % in 2005 to 11 % in 2012. Metering shoot multiple parameters, including the voltage level, they can be used to create other services.
Ufa
The project is being implemented by the Bashkir network company in conjunction with Siemens since 2014, the end is planned for 2018. It is expected to significantly reduce losses (from 19 % to 1 %), reduce the time for switching between different segments of the network, to troubleshoot problems up to several minutes.
Kaliningrad regionRES “Mamonovskaya”, “Bagrationovskaya”. The plans to reduce losses twice, the number of outages per year – four times. More importantly, a decrease in the cost of owning assets, which can be reduced by 25 %.
Lipetsk
Since 2013 (automated control system for outdoor lighting), ASELO “Helios” ma-nages outdoor lighting in the territory of Novolipetsk Metallurgical Combine and uses a modern solution that allows controlling each light with the help of “Helios” semiconducter ballast.
Perm9736 smart metering devices in multi-apartment and private houses, with legal en-tities in the territory of Motovilikhinsky district of Perm. All metering devices are integrated into an automated information and measuring system.
RyazanIn the second half of 2014, the company “IVTBelGU” launched an energy service project: the city’s outdoor lighting was completely modernized; LED luminaires and “Helios” automated control systems were installed.
North Caucasus
Optima Engineering has carried out large-scale construction and installation and commissioning works on relay protection and emergency automatics equipment, as well as reconstruction of high-frequency communication channels in more than 60 substations.
Tyumen region, Uspen-skoe municipality
A pilot project on adaptation to Russian conditions of Smart Grid technologies was developed based on distribution networks of “TYUMENENERGO”.

Light & Engineering Vol. 27, No. 1
127
and Capacity Market”; Decree of the Government of the Russian Federation No. 426 of 03.06.2008 (as amended on May 23, 2017) “On the Qualifica-tion of a Generating Object Operating on the Basis of Using Renewable Energy Sources” and others.
In this regard, it is necessary to envisage fixing at the legislative level a mechanism for the imple-mentation and development of the renewable energy system, taking into account the climatic conditions of individual Russian regions.
4. CONCLUSION
Based on the analysis, we can identify a number of measures to develop legal support for the use of energy-efficient lighting technology and intelligent lighting control systems, both at the federal and re-gional levels.
First of all, at the federal level, it is necessary to implement the following:
• Optimization of federal legislation in the field of digital power generation, energy saving, giving priority to the development of mechanisms for the use of renewable energy sources in the subjects of the Russian Federation that have specific climatic conditions;
• Creation of legal conditions for the forma-tion of a single digital trust environment that allows participants in the digital power industry to be pro-vided with means of safe, reliable and energy-effi-cient lighting equipment;
• Creation of a legal field for the necessary tax incentives and a mechanism for protecting the rights and interests of investors in attracting private re-sources in the form of public-private partnerships with the goal of introducing smart technologies in the regions of Russia;
• Adoption of targeted state programs or other mechanisms of state support at the legislative level to finance the pilot projects “Smart City”, “Smart Region”.
At the regional level, the improvement of the legal regulation of the digital economy is possible through the implementation of such activities as:
• Development and adoption of a regional nor-mative act – a “roadmap” for the development of di-gital power generation, taking into account the spe-cifics of the region;
• Development and implementation of the digi-tal project “Smart City” / “Smart Region” within the framework of regional programs for the develop-
ment of the digital economy in order to improve the quality, safety of people’s lives, ensure a high level of urban environment improvement, create oppor-tunities for business development, facilitate inter-action between citizens and organizations with state structures;
• Establishment of tax incentives for entities that produce modern, “smart” technologies in the field of digital electricity;
• Provision of consultative and methodological assistance from regional authorities and local go-vernments to business entities on investing in the development of “smart” technologies in electric po-wer engineering;
• Increase of the population literacy on the costs minimization for the use of various kinds of intelli-gent lighting control systems and energy efficient lighting equipment.
In modern conditions, the introduction of new technologies for generation, storage and transmis-sion of energy should be intensified. In the next six years, it is planned to attract about 1.5 trillion rou-bles of private investments in the renewal of the Russian electric power industry. Throughout the country, the digital mode of operation must go to the power system [7].
REFERENCES
1. Interview Grabchak E. publication “Regional En-ergy and Energy Saving” [Interv’yu Grabchaka E. izdani-yu “Regional’naya ehnergetika i ehnergosberezhenie”] – URL: https://minenergo.gov.ru/node/7965 (date of the application 03.06.2018).
2. Digitalization of energy / Official website of the Institute of Energy Higher School of Economics [Ci-frovizaciya ehnergetiki/ Oficial’nyj sajt Instituta ehner-getiki Vysshej shkoly ehkonomiki] – URL: https://energy.hse.ru/digitalization (date of the application 03.06.2018).
3. Presentation of the cluster development program “Energy-efficient lighting technology and intelligent light-ing control systems” [Prezentaciya programmy razviti-ya klastera “Energoeffektivnaya svetotekhnika i intel-lektual’nye sistemy upravleniya osveshcheniem”] – URL: http://vote.cluster.hse.ru/upload/iblock/3b5/3b5f846ff-2b05cf79a0cd452b5742d3e.pdf (date of the applica-tion 03.06.2018).
4. Kvon G.M., Sangadzhiev B.V., Demchenko M.V., Ponomareva M.A., Smirnova E.A. The Implementa-tion Technique Of Investments Monitoring Into The Econ-omy’s Real Sector // Espacios. 2018, V. 39. 1. p. 8.

Light & Engineering Vol. 27, No. 1
128
5. Inyutsyn A. Umnye tekhnologii stanovyatsya dos-tupnee dlya gorodov. [Smart technologies become more accessible for cities] // Praktika municipal’nogo uprav-leniya, 2017, #2, pp. 46-55.
6. Prezentaciya “Tekhnologii dlya umnyh gorodov [Presentation “Technologies for smart cities”] URL:
http://csrnw.ru/files/publications/doklad_tehnologii_dlya_umnyh_gorodov.pdf (date of the application 01.06.2018).
7. Poslanie Prezidenta RF Federal’nomu Sobrani-yu RF ot 01.03.2018 [Message of the President of the Russian Federation to the Federal Assembly of the Rus-sian Federation dated 01.03.2018] // Spravochno-pravo-vaya sistema Konsul’tant plyus.
Maksim V. Demchenko, Ph.D. (Science of Law), Associate Professor, Deputy Head of the Department of Legal Regulation of Economic Activity for Scientific Work, Financial University under the Government of the Russian Federation, Moscow, Russia
Rostislav O. Ruchkin, Ph.D. (Science of Law), Legal Adviser of first category of Banking Supervision Legal Support Department, Legal Department, Bank of Russia, Moscow, Russia
Eugenia P. Simaeva, Ph.D. (Science of Low), Associate Professor of the Department of Legal Regulation of Economic Activities, Financial University under the Government of the Russian Federation, Moscow, Russia

129
Light & EngineeringVol. 27, No. 1, pp. 129–134, 2019
BREACHES OF ENERGY CONSUMPTION LAW
Alexander S. Komarov, Galina V. Kostyleva, and Oksana N. Vasil’eva
Financial University under the Government of the Russian Federation E-mails: [email protected]; [email protected]; [email protected]
ABSTRACT
Artificial electric lighting in buildings is an im-portant element of any electrical system. The ample use of artificial electric lighting in modern society is indisputable. Apart from its main purpose, if le-gally designed and installed, electrical lighting pro-motes the stable work and development of a coun-try’s power engineering. Effective use of energy resources and the capacities of power engineering are keys for the sustainability of economic growth. An increased demand in energy resources has pro-voked uncontrolled energy consumption and vio-lations in fuel extraction as well as in fuel or elec-tricity use. In the article, the authors try to give an analysis of such violations, which in its turn allows disclosing a few legal loopholes in this economic sector. The owner of energy resources suffers great damages from unauthorized connections to electri-cal and gas networks. Perpetrators of electrical and thermal energy consumption regulations are sub-ject to civil, criminal, and administrative law. Nev-ertheless, the authors’ analysis of cases in the courts shows that a great number of them are seldom in-quired into, and most perpetrators are very rare-ly held liable. The aim of the article is to analyze the national legislation to withstand the illegitimate energy resources consumption, to bring to light the issues in this economic sector and to suggest some ways of their solution.
Keywords: energy resources, lighting; mine ral resources used as sources of power, power infra-structure, electrical equipment, consumers of elec-tricity, generation and use of electrical energy, ener-gy conservation, uncontrolled use of electrical and
thermal power, energy consumption supervision, violation of consumption regulations, infringement on energy resources use
1. INTRODUCTION
Effective use of energy resources and the poten-tialities of the energy sector is the pivot of Russian economic policy. It is aimed to sustain the econo-mic growth in Russia, raise the living standard of the population, and improve external trade status of Russia. A strong focus of its policy is on power en-gineering security, energy efficiency in economy, ef-fective budgeting, and ecological security of power engineering [1].
The choice of the above-mentioned focus in the Russian energy strategy is determined by a great amount of energy resources, which include elec-tricity as well. This makes it possible to satisfy the country’s needs as well as to export them. Ac-cording to the projections, by 2020 the lighting industry turnover in the world market is expec-ted to catch up with the television industry turno-ver [2, 3]. The leading economies in today’s world strive for an increase of their energy efficiency; one of the means in this great effort is to develop effec-tive lighting technologies. In their simulation of the situation in the world market, the МсКinsey ana-lysts show that by 2020 the turnover of lighting in-dustry may reach nearly 110 bn euro with the annu-al growth by 3 %. The growing population on Earth instigates the growing demand in lighting.
In Russia, owing to energy conservation mea-sures, as well as increase in efficiency of energy projects, there is a possibility to increase current

Light & Engineering Vol. 27, No. 1
130
energy consumption by 30 %. However, Russian power engineering is faced with a number of risks and threats. The complexity of problems places energy security in the foreground of national secu-rity. This is predetermined by the depleted available fuel deposits and a continuous increase in electrici-ty or fuel consumption.
This work summarizes the main legislative norms of the national policy in energy consump-tion. It also investigates the factors, which hinder the further progress in this branch of Russian econo-my. The article analyzes the main illegal actions by perpetrators, who violate the existing law in ener-gy consumption and highlights the legal regula-tions, which are designed to eradicate illegal ener-gy consumption.
2. METHODOLOGY
Scientific and technological progress has made contemporary society dependent on the uninter-rupted centralised supply of electrical and thermal energies as well as gas and water [4]. Cutting off or li miting their supply not only infringes on cus-tomers’ civil rights and every day interests, but de-prives the customer of their subsistence, which ex-cites very negative reactions on their part. That is why one of the main aims of the Russian na-tional policy is to provide and guarantee energy security measures. This aim is to be achieved by laws and their observance. The methodology is based upon a collection of laws or legal regulations of energy consumption, their analysis, and cate-gorization of unlawful actions in energy use and consumption.
The Strategic Plan of electricity supply network development in the Russian Federation in the peri-od to 2030 is elaborated in accordance with Decree 1567 by President of Russia (22 November, 2012). The document defines the electricity supply net-work missions, which include electricity transmis-sion, distribution, generation, and selling on the ter-ritory of Russia [5].
The power supply system of Russia com prises a federal power supply system and local power supply systems. The expected change in economic development, structural changes of economy, and amount of energy consumption determine domes-tic demand for energy resources including electrici-ty. According to the information from the Ministry of Energy (Russia), in 2017 the electricity consump-tion reached 1059.7 bn kWh (1 039.9 bn in the fe-deral system), which was higher than in 2016 by 0.5 % (by 1.3 % in the federal system). The high-est level of consumption was registered in metal-lurgy, railway transport, and gas main. The Russian electric power stations together with electric po-wer stations at industrial works generated 1 073.7 bn kWh (1 053.9 bn kWh in the federal system). The increase in electricity generation was by 0.2 % (Table 1) [6].
In 2017, the electricity consumption in the fede-ral power supply system reached 1 039 879.9 mil-lion kWh, which tops the 2016 consumption by 13 023.5 million kWh (1.27 %). The growth of the annual consumption of electricity in 2016 (29 Feb-ruary excluded) accounts for 16 038.4 million kWh (1.57 %). In comparison to 2015, the growth makes up 31 629.1 million kWh (3.14 %).
Non-payment or overdue payment hinders the development of this branch of industry. According
Table 1. The Increase in Electricity Generation
2016, bn kWh 2017, bn kWh %
Electricity Generation, in total 1 071.9 1 073.7 +0.2
included:
Thermal electric power stations 628.5 622.4 -1.0
Gas electric power stations 186.7 187.4 +0.4
Nuclear power stations 196.4 202.9 +3.3
Renewable sources of energy 0.61 0.69 +13.1
Electric power stations at industrial works 59.8 60.3 +0.9
Electricity consumption 1 054.6 1 059.7 +0.5

Light & Engineering Vol. 27, No. 1
131
to the information presented by NP Sovetrynok As-sociation, the arrears amounted to 65.2 bn roubles in the whole-sale market and 243 bn roubles in re-tail on the end of October 2017. While there are a number of legislative measures, which allow pu-nishing defaulters in the whole-sale market of elec-tricity, the retail market does not have such mecha-nisms of influence. Supplying the population with electricity as a service of paramount social impor-tance, makes cutting off electricity for defaulters in the retail market impermissible [7].
The Federal Law No. 307-FL of 03.11.2015 is-sued the amendments aimed at tougher responsibili-ty of energy consumers for non-payment or overdue payment. The Federal Law improved the procedure and established a new system of punishment. The amendments concern the consumers of energy re-sources or services of electricity transmission and buyers of energy resources or services of water sup-ply and sewage. For example, the Law imposes a fine on debtors and grants financial rights and guarantees to certain categories of electricity con-sumers. Limitations on electricity consumption are another economic tool for improving the responsi-bility of the consumers, who neglect their commit-ments [8]. Moreover, the Federal Law altered the basic rules of consumption limitations. The altera-tions concerned so-called “not liable to limited con-sumption” consumers of electricity and initiated partially limited consumption as an obligatory step in the procedure.
Thus, the amendments led to the necessity of re-viewing the legal documents regulating the proce-dure of cutting consumption and to the revision of some procedural steps that stirred up controversy, which resulted in the futility of effective work with debtors. For example, the Russian government en-acted Decree No. 624 (24.05.2017) “Amendments in the Acts of the Russian Government on Com-pletely and/or Partially Limited Consumption of Electricity and the Use of Economic Unions’ Seals” [9]. In addition, in accordance with the require-ments of the Federal Law, the Russian government adopted Decree No. 139 of 04.02.2017 “Amend-ments in the Decrees of the Russian Government to Ensure the Fulfilment of Obligations to Pay for Energy Resources” [10].
A high degree of generating and networking equipment depreciation is also a deterrent to the development of power engineering. A decreased consumption of electricity was a part of the indus-
trial stagnation in the 1990s. Overdue and insuffi-cient payment for electricity consumption was the reason for the systematic deficit of money allot-ted to update the capital assets in power industry. It was for a long time that power engineering did not receive a sufficient amount of investment. To date this has resulted in a critical depreciation of the equipment.
According to the overall locating plan of elec-trical power structures for the period of up to 2035, approximately 46 % of them were put into ope-ration before 1980, i.e. more than 36 years ago. The fleet life of more than 90 GW of steam turbine equipment capacity is finished. Moreover, before 2025 the life of 30 GW of the thermo electric power stations capacity will come to an end [11].
A slow development of power infrastructure and greater demand in all kinds of energy are the rea-sons for higher unlawful energy consumption [12]. Breaches of energy consumption law is a most widely spread phenomenon of social character. Un-authorised link to electric and other networks causes great damage to the owners of power resources. The amendments introduced into criminal law are aimed to prevent harmful actions and impose amenabili-ty on perpetrators. Thus, they are additional legal means of protecting energy resources from theft. However, such harmful actions are still difficult to eradicate because of their latency.
3. RESULTS
Despite many serious challenges, the Russian electric power industry continues growing. The growth of electricity consumption and an increase of the companies’ profitability are obvious. Fur-ther development and gradual update of the gene-rating companies’ power capacities are necessary steps in its growth. The current legislation inflicts admi nistrative, civil, and criminal punishments on consumers, thus enhancing their responsibility for viola ting the legal rules of electricity, water, gas, and other kinds of energy consumption.
4. ADMINISTRATIVE LAW AND UNLAWFUL ACTIONS IN ENERGY CONSUMPTION
The Administrative Punishment Code of the Russian Federation (APC) specifies cases of unlaw-

Light & Engineering Vol. 27, No. 1
132
ful energy use and enforces administrative punish-ment for illegal energy consumption.
1. Unauthorised connection to and use of elec-tric, thermal, gas, or oil energy (article 7.19 APC)
Unauthorised connection to electric network, gas, or oil pipelines is defined as such in cases, when there is no sanction given by an authorized representative of the national energy inspection. Gas or oil pipelines, and energy networks are tech-nically complex structures, which are built for trans-portation of gas, oil, oil products, and electric power to their consumers. Consumers are required to for-ward a written request and ask their energy supply-ing organization for a sanction to link their dwel-lings or other buildings with new wiring systems to the electric network. Also, gas use and its supply is not permitted without its calculated amount. The relevant regulations determine in detail the required procedure of its amount registration, control of its characteristics, and general technical conditions for metering units. It should be noted that this unlawful action by the consumer is intentional.
2. Unauthorised commissioning of fuel or ener-gy consuming structures (article 9.9 APC)
This breach of law consists in activities, which violate the established procedure of authoriza-tion when commissioning fuel or energy consuming structures. This unlawful action violates the secure work of energy structures, as well as the prescribed regulations in the fuel and energy complex.
The regulations of energy plants’ work and maintenance were determined and issued in the fol-lowing documents: the Federal law “Energy Con-servation, Higher Efficiency of Energy Use and Amendments in the Legislative Acts of the Russian Federation” (23.11.2009, No. 261-FL) and the fede-ral law “Communications Network” (07.07.2003, No. 126-FL), and, additionally, in the decrees by President and Government of the Russian Federa-tion, as well as the Ministry of Energy (Russia).
Unauthorized commissioning is an unlawful action intentionally committed by officials, who should observe the established procedure of receiv-ing commissioning authorization. Other perpetra-tors are entrepreneurs and legal entities that have ignored or neglected the mandatory operating rules for fuel and energy structures.
3. Ignorance or negligence of regulations, which are issued by the Russian government, Min-
istry of Energy, and other federal governmental agencies and related to fuel or energy use, work, and maintenance of fuel/energy consuming equip-ment or implements, heating systems, structures for containing, warehousing, selling or transporting machines and appliances, fuel, and its derived pro-ducts (article 9.11 APC)
The terms of relations between energy or gas suppliers and individuals, who consume their pro-ducts, are determined in the regulations of elec-tric or thermal energy use, which were approved by the Ministry of Energy. The regulations ban unau-thorized use of electric or thermal energy and gas. A consumer is required to forward a written request to the supplier to get a sanction thus linking their dwellings or other buildings with new wiring sys-tems to the electric network.
The regulations of energy or gas use contain con-ditions for maintenance and installation of electric or gas appliances, energy or gas meters, as well as for energy and gas payments.
This unlawful action is committed intentionally or out of insufficient attention to the regulations by officials, legal entities, or Russian nationals.
4. Unproductive wastage of energy resources (article 9.12 APC)
The Federal Law “Economy of Energy, High-er Efficiency of Energy Use and Amendments in the Legislative Acts of the Russian Federation” (23.11.2009, 261-FL) defines “unproductive wastage of energy resources” as violation of regula-tions stipula ted by national standards or other legal documents, by technical documentation, passport information, and maintenance schedules for opera-ting equipment. According to the national standards, norms of precise measurements, or other legal and technical documentation, an amount of energy and natural resources (extracted, produced, manufac-tured, transported, warehoused, or used) are to be mandatorily registered.
This unlawful action infringes on the interac-tion between the producer and consumer of ener-gy resources as legal entities. The proof of its un-lawfulness is based on an analysis of the standards, norms and regulations aimed at energy conserva-tion. For example, the interdepartmental regulations of thermal energy or coolant control, regulations of electricity control, regulations of limited electric or thermal energy consumption, a sanctioning proce-

Light & Engineering Vol. 27, No. 1
133
dure of using electric boilers and other electric ap-pliances, etc.
This unlawful action is committed both inten-tionally and out of insufficient attention to the re-gulations by executives at enterprises irrespective of their ownership, legal entities, and employees in charge of energy conservation or its effective use.
5. CONCLUSION
In our opinion, the above-mentioned challenges in administering energy consumption law in courts result from the loopholes in the current legisla-tion of fuel/energy use; secondly, a lack of coopera-tion between executive bodies and law-enforcement bodies, whose duty is to supervise, make known and counteract unlawful actions of energy consump-tion, and thirdly, official corruption in this branch of industry.
To sum up, law formulation and creation of le-gal countermeasures, which secure energy re sources protection, are the main tasks in the activities of executive bodies in the Russian Federation. Any breaches of energy consumption law have a negative effect on the development of the energy sector. That is why harmful economic conse quences of illegal energy consumption should not be underestimated.
REFERENCES
1. Rasporyazhenie Pravitel’stva RF ot 13.11.2009 g. No. 1715-r “Ob ehnergeticheskoj strategii Rossii na period do 2030 goda” [Regulation by the Go-vernment of the Russian Federation of 13.11.2009. No. 1715-r “Energy Strategy of Russia in the Period to 2030” // Sobranie zakonodatel’stva RF, 2009, No. 48, art. 5836 (in Russian).
2. Inyuzin A., Mel’nikov D. O logike tekhnich-eskogo regulirovaniya v oblasti osveshheniya [Tech-nical conditions for lighting] // Svetotekhnika, 2018, No. 1, pp. 35–37 (in Russian).
3. Klimenko V.V., Fedotova E.V., Tereshin A.G. Vulnerability of the Russian power industry to the cli-mate change // Energy, 2018, v.142. pp. 1010–1022.
4. Erhan F., Poperscu V., Lupusor I. Study of the influence level current of the short circuit on reliability of the brekers // Problemele energetich regional, 2010, Vol. 12, #1, pp.16–21.
5. Rasporyazhenie Pravitel’stva RF ot 03.04.2013, No. 511-r “Ob utverzhdenii strategii razvitiya ehlek-trosetevogo kompleksa Rossiiskoy Federatsii” [Re-
gulation by the Government of the Russian Federa-tion of 03.04.2013, No. 511-r “Development Strategy in the Energy Complex of the Russian Federation” // Sobranie zakonodatel’stva RF, 2013, No. 14, art. 1738 (in Russian).
6. Osnovnye kharakteristiki rossiiskoy ehlektroeh-nergetiki [Main characteristics of Russian power indu-stry], // Official site of the Ministry of Energy (Russia), URL: https://minenergo.gov.ru/node/532 (Accessed 12.06.2018) (in Russian).
7. Obzor ehlektroehnergeticheskoi otrasli Rossii [Energy industry review], // Official site of EES sys-tem operator, URL: http://so-ups.ru/?id=2045 (accessed 12.06.2018) (in Russian).
8. Maggregor J. Determining an optimal strategy for energy investment in Kazakhstan // Energy Policy, 2017, v.107. pp. 210–224.
9. Postanovlenie Pravitel’stva RF ot 24.05.2017 No. 624 “O vnesenii izmeneniy v nekotorye akty Prav-itel’stva Rossiyskoy Federatsii po voprosam vvedeni-ya polnogo i (ili) chastichnogo ogranicheniya rezhi-ma potrebleniya ehlektricheskoy ehnergii, a takzhe primeneniya pechatey hozyaystvennyh obtchestv” [Order by the Government of the Russian Federa-tion of 24.05.2017 No. 624 “Amendments in the Acts of the Russian Government on Completely and/or Par-tially Limited Consumption of Electricity and the Use of Economic Unions’ Seals”] // Sobranie zakonod-atel’stva RF, 2017, No. 23, art. 3323 (in Russian).
10. Postanovlenie Pravitel’stva RF ot 04.02.2017 g. No. 139 “O vnesenii izmeneniy v nekotorye akty Pravitel’stva Rossiyskoy Federatsii po voprosam obe-specheniya ispolneniya obyazatel’stv po oplate ehner-goresursov” [Order by the Government of the Russian Federation of 04.02.2017 No. 139 “Amendments in the Decrees of the Russian Government to Ensure the Fulfilment of Obligations to Pay for Energy Resour-ces” // Sobranie zakonodatel’stva RF, 2017, No. 8, art. 1230 (in Russian).
11. Rasporyazhenie Pravitel’stva RF ot 09.06.2017, No. 1209-r “O general’noy sheme razmeshheni-ya ob’ektov ehlektroehnergetiki do 2035 goda” [Re-gulation by the Government of the Russian Federa-tion of 09.06.2017, No. 1209 “Overall locating plan of electrical power structures for the period of up to 2035” 2017, No. 26 (p. II), art. 3859 (in Russian).
12. Kalubi D. 2017, Struktura ehnergetitcheskoi otrasli v Zambii i Rossii [Structure of power industry in Zambia and Russia], Izvestiya Tomskogo politeknich-eskogo universiteta. Inzhiniring georesursov, 2017, v. 328, pp. 25–31 (in Russian).

Light & Engineering Vol. 27, No. 1
134
Alexander S. Komarov,Associate professor, Ph.D. in Philological Sciences, Financial University under the Government of the Russian Federation; Associate professor, Department of Foreign Languages
Galina V. Kostyleva,Associate Professor, Ph.D. in Law Science, department of legal regulation of economic activity at the Financial University under the Government of the Russian Federation
Oksana N. Vasil’eva,Associate Professor, Ph.D. in Low Science, Department of legal regulation of economic activity at the Financial University under the Government of the Russian Federation

135
Light & EngineeringVol. 27, No. 1, pp. 135–140, 2019
LEGAL REGULATION OF COMPETITION AT ELECTRICITY RETAIL MARKETS
Alexei V. Barkov, Eugene L. Vengerovskiy, and Natalia V. Zalyubovskaya
Financial University under the Government of the Russian Federation E-mails: [email protected]; [email protected];
ABSTRACT
The article considers some features of the com-petitive relation formation in the electric power in-dustry, a major economy sector. In particular, the paper analyzes the electricity retail market opera-tion and the need for competition promotion, it is associated there with a wide range of consumers, which adds high social significance to the effec-tive operation of relations emerging in this area. The author concludes that the retail electricity mar-ket needs to increase private funds and decrease state participation, which will contribute to a wi-der range of service consumers. The article consid-ers some special aspects on how to ensure the dom-inant position of power supply companies, as well as defines main barriers for business entities to enter retail electricity markets. It also reviews the best fo-reign practices that regulate energy retail companies (by the example of the Nordic countries) and offers some options of legal receptions in this area. More-over, it analyzes the Russian legislation novelties in the field of competition at the electricity markets, in particular, the tariff regulation of electricity dis-tributors by the method of reference costs. Also, the article specifies some proposals on how to improve the legislation that regulates competitive relations at the electric energy market within the National Com-petition Development Plan.
Keywords: electric energy market, FAS Russia, dominant position, tariff regulation, energy retail companies, electricity distributors, lighting equip-ment users
1. INTRODUCTION
The study aims to research the competition le-gal regulation at retail electricity markets in order to draft recommendations on how to improve the le-gal regulation and identify existing problems. The formation of competitive relations at any product market that operates within the market relation is an important factor for sustainable business deve-lopment, which directly impacts the state’s econo-my efficiency in general and the quality of servi-ces provided. Russian transit to a market economy generated the “entrepreneurial management style” characte rized by such an important factor as com-petition between business entities when produ c-ing goods, performing work, or rendering services, in the electric power industry, inter alia [1]. How-ever, some aspects of the electricity retail market have led to global violations of competition princi-ples, which resulted in overstated electricity tariffs. To take steps to solve this issues, the Government of the Russian Federation adopted the Resolution No. 863 “On Amendments to Certain Acts of the Go-vernment of the Russian Federation Regarding the Introduction of Guaranteeing Suppliers’ Sales Markups Using the Comparative Method and Dec-laration that Subparagraph 2, Paragraph 11 of the Resolution of the Government of the Russian Fe-deration No. 1178 dated December 29, 2011 is no Longer in Force” on July 21, 2017. The Resolu-tion was the first document in Russian legal space to introduce the concept of the guaranteeing suppli-er reference costs, which is understood as an eco-

Light & Engineering Vol. 27, No. 1
136
nomically reasonable specific value of costs associ-ated with performance of regulated activities by the guaranteeing supplier, defined by the comparative method and established for expense items. In other words, this standard served as a measure to deter price competition at the market. The unified costs method is mainly used to encourage electricity re-tail companies to increase their efficiency.
The research applied general scientific methods, such as analysis, modelling, and comprehensive ap-proach. Moreover, specific scientific methods were used, i.e. legal modelling and legal comparison.
2. MAIN RESULTS
The methodology of the research is based on the application of the dialectical method of cognition, which allows us to study objective economic laws and patterns in their interrelations and interdepen-dencies. Theoretical constructions in the article are considered using general scientific and particular methods of selective research. The factual base is based on the legislative and regulatory legal acts of the Russian Federation, statistical and analy tical reports on the research topic. Revenues of electri-city retail companies are currently calculated by the method of “costs-plus”: the markup is direct-ly proportional to costs, including the purchase price of electricity at the wholesale market. So, it is more profitable for electricity retail companies to pay more for electricity; saving, on the contrary, leads to reduced tariffs and revenues. It is not yet pro fitable for suppliers to optimize their operating costs (rentals, remuneration, etc.), which also con-tribute to the tariff amount. The new method pro-posed by FAS outlines the markup of an electricity retail company to be calculated upon standardized costs of 1 kWh. However, if the company reduces its costs against the standard, it will be able to keep saved funds. The purchase price of electricity at the wholesale market will directly affect the consumer price; in this context, the cheaper the electricity is for the guaranteeing supplier, the more customer- attractive its services will be [2]. According to FAS Russia, when the standard is introduced, the costs of distributor companies will consist of two compo-nents: constant component (costs) to be determined by the method of reference costs and an alternating component to be determined based on the compa-ny’s investment program approved by the region-al government. FAS estimated the amount of funds
saved by consumers during three years due to the new calculation method at 12.7 billion roubles. Con-sidering the fact that the reference costs for energy companies are set at the nation-wide level, it is also advisable to take into account the electricity market, since regional consumption varies (Table 1). How-ever, according to SO UPS JSC, electricity con-sumption in Russian Unified Power System amount-ed to 1 039.7 billion kWh in 2017, which is 1.3 % above the consumption volume in 2016. In gene-ral, electricity consumption in Russia amounted to 1 059.5 billion kWh in 2017, which is 0.5 % hig-her as compared to 2016. Excluding February 29, 2016, electricity consumption by the national UPS and Russia in general increased by 1.6 % and 0.8 % respectively.
In 2017, electricity generation in Russia amo-un ted to 1 073.6 billion kWh, which is 0.2 % hig-her than in 2016. Russian UPS power plants pro-duced 1 053.7 billion kWh, which is 0.5 % higher than in 2016. Electricity generation by Russian UPS and Russia in general increased by 0.8 % and 0.5 %, respectively, excluding the impact of the leap years extra day.
As far as the electricity market is concerned, it should be noted that this market constitutes a sys-tem of relations forming a strategically important economy sector. That is why the state is to cre-ate a legal mechanism that will help to protect both market players’ interests and public interests. In 2003, there was a reform in the electric power sector motivated by anticipated shortage of gene-rating capacity: consumption boosted impressive-ly; power generating equipment grew out-of-date and was in bad state, while there were no incen-tives and mechanisms for the construction and equipment update. In 2008, energy generating companies, most of them subsidiaries of RAO UPS of Russia, were acquired by private investors (in-cluding foreign ones) during the restructuring of RAO UPS of Russia JSC. Together with generating assets, they also received obligations to implement the investment program (construction and moder-nization of gene rating assets) specified in the ca-pacity supply agreements (CSA). Along with the industry’s restructuring, there also was a market transition reform, which resulted in a gradual tran-sition from fully regulated pricing to market elec-tricity pricing.
A characteristic feature of electricity retail mar-kets is the presence of guaranteeing suppliers that

Light & Engineering Vol. 27, No. 1
137
exercise significant influence and act as sellers. However, the natural monopoly segment is ope-rated by distribution companies, which dominant position is presumed by law. Accordingly, the vast majority of violations in the electricity (capacity) retail market is due to the dominant position abused by market participants [3].
According to Federal Law No. 35-FZ dated March 26, 2003 “On Electric Power Industry” [4] (hereinafter, the Law on Electric Power Industry), the retail electricity market actors are as follows:
1. Electric energy consumers;2. Electric energy suppliers (electric sale com-
panies, guaranteeing suppliers, electric energy pro-ducers, who are not eligible to operate at the whole-sale market);
3. Regional grid operators rendering electricity transmission services;
4. Operational & dispatching control actors serving the electric power industry and performing the specified management at retail markets.
In addition, the Law on Electric Power Ener-gy specifies that entities engaged in lightning, in-ter alia, are free to choose their counterparty to the purchase & sale contract or electricity supply con-tract; a distribution company is not entitled to refuse to enter into an electricity transfer service contract basing on the choice of electricity from a particular supplier made by an electricity consumer. This pro-vision of the Law is the basic principle underlying the competitive relations formation at the electrici-ty retail market.
The Federal Antimonopoly Service (hereinaf-ter, FAS Russia) is the agency authorized by the Government of the Russian Federation to exercise antimonopoly control over electricity markets by:
Table. 1. Electricity Consumption and Industrial Production Growth According to Russian Statistical Agency
RegionsIndustrial production
growth in 2015 (operational data), %
Memo: electricity consumption increase
in 2015, %Regions
Electricity consumption
growth in 2015, %
Top-5 by fall
Chukotka Autono-mous Okrug -14.2 n/a Republic of
Mordovia -9.1
Primorsky Krai -12.5 1.9 Kurgan Region -4.6
Republic of North Ossetia-Alania -10.1 -1.3 Volgograd Region -4.6
Kaluga Region -9.1 -0.4 Tomsk Region -4.2
Amur Region -9.0 1.1 Nizhny Novgorod Region -4.0
Top-5 by growth
Tula Region +9.4 -0.3 Stavropol Krai +3.7
Bryansk Region +13.3 -0.7 Republic of Ingushetia +4.0
Sakhalin Region +13.8 n/a Republic of Dagestan +5.4
Republic of Altai +2.6 n/a Republic of Kalmykia +6.3
Rostov Region +54.6 0.7 Republic of Tyva +6.5

Light & Engineering Vol. 27, No. 1
138
reviewing monitoring data of electricity (capacity) prices; verification of economic and technological justification of actions taken by an electric power industry actor; conducting scheduled and unsche-duled inspections on compliance with the anti-monopoly legislation, inter alia, detection of elec-tricity (capacity) prices gouging, consideration of claims against violation of antitrust legislation by electric power industry actors, and other informa-tion obtained in accordance with the established procedure; detection of price-gouging at the whole-sale and/or retail markets, etc. It should be noted that many countries widely exercise state control, for example Brazil [5]. As a result of its activi-ties, FAS Russia found out that, as for 2017, the electricity (capacity) retail markets in all constitu-ents of the Russian Federation were characterized by high concentration and undeveloped competi-tion. This leads to the fact that entities operating, for example, in the lighting segment, are not able to choose a supplier they need. Consequently, we can speak about the inabi lity to create conditions for a competitive environment and service quality improvement.
The market situation is complicated by the fact that a number of entities with the status of a guar-antying supplier (i.e. those who sell electricity and must enter into electric power supply contracts or electric power purchase & sale (supply) contracts with any electricity consumer who contacts it or with any person acting in its own name or on be-half of the specified electricity consumer and wants to purchase electricity) occupy about 75 % at the electricity sale & purchase (supply) market in the re-levant constituent entity of the Russian Federation, while in most regions their share is almost 100 %. However, the guaranteeing supplier is the only ac-tor of the electricity wholesale market in a number of regions, and all other sales companies buy elec-tricity from it. Some regions witnessed an increase of the market share of the guaranteeing electricity supplier, inter alia, due to the merging with supply companies.
The share of remaining electricity supply com-panies does not exceed 35 % at the electricity (ca-pacity) retail markets. It also should be noted that electricity purchase & sale (supply) retail markets are potentially highly competitive markets, pro-vided that electricity is sold by several sales enti-ties located in the area of the guaranteeing suppli-er’s operation and within the electric power system
of a respective supplier. This leads to violations of regional antimonopoly laws, which negatively af-fects the ability of many energy power companies to carry out lighting activities. For example, in Jan-uary 2018 in the Kostroma Region, a case on the antimonopoly law violation was initiated following the requests from the Local Supply Entity (herein-after, LSE) and the electricity consumer to com-pletely restrict electricity supply to the transform-er substation owned by the LSE. The consumer also claimed in its statement that the non-residential premises owned by the company had been discon-nected from the electric power system without noti-fying the consumer. Based on the results of the case consideration, violations of Part 1, Article 10 of Law “On the Competition Protection” was detect-ed in the actions of KSK PJSC and IDGC of Centre PJSC represented by the Kostroma branch and ex-pressed as follows:
– KSK PJSC abused its dominant position by submitting an unreasonable notice of full restric-tion of electricity consumption in respect of the properties;
– IDGC of Centre PJSC abused its dominant position by unreasonably and fully restricting elec-tricity consumption at the terminal point, i.e. the transformer substation owned by the LSE. The case materials established an unreasonable restriction of electricity consumption for the LSE, which was un-able to conduct its business activities by implemen-ting the technological connection of consumers to its electric power system [6].
As noted by FAS Russia, insufficient competi-tion at electricity retail markets affects the availa-bility of electricity for consumers, leads to overpri-cing, insufficient reliability of electric supply and a weak payment discipline.
High state intervention in the sector should be recognized as the main problem that hampers the development of competition at electricity retail mar-kets [7]. As for the electric supply industry, the Na-tional Competition Development Plan should en-sure free consumer choice of an electricity supplier. In this regard, it is interesting to explore the experi-ence of the Nordic states, where the reforms, for ex-ample, in Norway, admitted small consumers to the market by introducing reference schedules drafted for them. The purpose of such schedules was to fa-cilitate the electricity consumption accounting and forecast at a two-rate tariff. Moreover, consumers gained an opportunity to change suppliers with

Light & Engineering Vol. 27, No. 1
139
no additional costs. In 1995, the Swedish electrici-ty trade regulation and consumer protection rules were amended. From now on, the consumer can choose the electricity supplier on its own, when in-stalling hourly meters [8].
Effective competitive relations in the electrici-ty retail segment is an attribute of the world’s lead-ing economies, for example, the UK has the highest level of competitive relations and decreased busi-ness capitalization [9]. However, in most countries the largest actors make up the segment of “genera-ting companies”, for example, in Hungary and Ita-ly, which ensures the market stability, but leads to overpricing and violates the rights of services consumers [9, 10]. The American States are great-ly independent to ensure competition at the electri-city retail market, but the country in general is also experiencing the “generating companies” problem [11].
From our point of view, competition at the elec-tricity market will be prompted by the concept, which can provide direct access to retail consu-mers (including entities that provide lighting ser-vices) to wholesale electricity producers and ensure a direct payment for electricity through a system of contracts. Moreover, consumers should be able to change a sales company in a short time, if its qua-lity of service is not satisfactory.
Also, as noted by Valery Seleznyov, Deputy Chairman of the State DUMA Energy Power Indus-try Committee, lifting the ban on electricity sales to distributors with a limited market share may en-hance the development of retail markets and com-petition [7].
3. CONCLUSION
We believe that the adoption of the Federal Law “On Amendments to the Federal Law “On Elec-tric Power Industry” and Certain Legislative Acts of the Russian Federation Related to the Electricity Sales Licensing” has hampered the development of the electricity retail market. The Law says that elec-tricity sales must be carried out based on a license issued by the federal executive agency authorized by the Government of the Russian Federation. En-ergy sales entities are required to obtain a license no later than December 29, 2018. After this date, no activities without a license can be carried out. Consequently, these norms have generated new barriers to enter the electricity market. In particu-
lar, the Law provides for the following requirement: a license applicant must have no obligations to sell exclusively at the wholesale market all electrici-ty (capacity) produced on the electricity (capacity) production facility (or a part thereof), including po-wer plants, which operates within Russian Unified Power System, the installed generating capacity of which is equal to or greater than 25 MW and which will be or has been used for electricity sales activi-ties. The analysis of the competitive environment of the electricity retail market demonstrated that the competition development is hindered by factors peculiar to all product markets in the Russian Fe-deration. However, it should be taken into account that the competition at the market under considera-tion directly impacts the life quality of the popula-tion and Russian energy security. This is why the country’s economy in general will benefit from the implementation of the analyzed measures to sup-port competitive mechanisms.
REFERENCES
1. Korshunov N.M. Business Law: textbook for stu-dents of higher educational institutions. // YUNITI-DA-NA: Law and justice, Moscow, 2012, pp. 250–254.
2. Andrienko A.V. Review of the Electric Power In-dustry Reform in the Scandinavian Countries // Russian Economy in the 20th century: collection of scientific pa-pers. TPU Ed. Tomsk, 2015, pp. 297–303.
3. Ognevskaya D.V. Features of Establishing a Do-minant Position of Economic Actors in the Electricity (Capacity) Retail Market // Laws of Russia: experience, analysis and practice. 2014. No. 2
4. Access mode: http://electricalnet.ru/blog/obzor-iz-menenii-rossiiskogo-zakonodatelstva-v-sfere-elektroener-getiki-22012018–28012018 (access date: June 13, 2018).
5. Helder Queiroz P.J. The Electricity Reforms in Brazil: Regulation and Entry of New Players. // Instituto de Economia, Federal University of Rio de Janeiro, Ja-nuary, 2009.
6. Access mode: http://peretok.ru/articles/distribu-tion/15466/ (access date: June 13, 2018).
7. Kamashev A.S. Comparative Analysis of Electri-city Industry Operation Models in Russia and the World in the context of the Reform Processes // Rossiyskoye Pred-prinimatelstvo, 2011, Vol. 12, # 3, pp. 105–111.
8. Access mode:https://www.ruscable.ru/news/2017/ 03/15/V_Rossii_nedostatok_konkurentsii_na_roznich-nom_ryn/ (access date: June 13, 2018).

Light & Engineering Vol. 27, No. 1
140
9. Carriello F. The Italian electricity market // The Regulatory Authority for Electricity and Gas / Market De-partment, 6 October 2008.
10. Morgan J.P. International Experience of Electric Power Sector Reforming as Applied to Russia. January, 2001.
11. Bruno José Marques Pinto. Regulatory Reforms and Restructuring of the US Electricity Sector: What Ha-ppened in California? // Undergraduate School of Eco-nomics, EPGE/FGV, June, 2005.
Alexei V. Barkov,Dr. of Law Science, Professor, Department of Economic activities legal regulation, Financial University under the Government of the Russian Federation
Eugene L. Vengerovskiy,lecturer, Department of Economic activities legal regulation, Financial University under the Government of the Russian Federation
Natalia V. Zalyubovskaya,Ph.D., Associate Professor of Department Economic activities legal regulation of the Financial University under the Government of the Russian Federation, member of the Executive Committee of the coordination Council of The International Union of Lawyers, Director of the financial and legal group “Territory of the law”

Light & Engineering Vol. 27, No. 1
141
CONTENTS
VOLUME 27 NUMBER 2 2019
LIGHT & ENGINEERING(SVETOTEKHNIKA)
Peter Thorns Review of the Current State and Future Development in Standardizing Artificial Lighting
Natalia A. Saprykina Conceptions of Using of Natural Light as an Essential Component of the Formation of Architectural Space
Nicolai L. Pavlov Sunlight as a Tool of Designing an Architectural Form
Helena Yu. LekusPublic Space Humanization in a Night City
Aleksei K. Solovyov and ThỊ HẠnh P. NguyỄn The Calculation Method for Light Climate Parameters Based on Sun-Lighting Efficiency and the Comparative Analysis of Light Climate In Hanoi and Moscow
Mehmet Sait Cengiz A Simulation and Design Study for Interior Zone Luminance in Tunnel Lighting
Leonid G. Novakovsky and Sergei A. FeofanovReconstruction of Moscow Metro Illumination Devices
Anil Can Duman and Onder Guler Techno-Economic Analysis of Off-Grid PV LED Road Lighting Systems for Antalya Province of Turkey
Vladimir V. Vorozhikhin, Eugenia L. Moreva, Vladimir G. Starovoytov, and Igor G. Tyutyunnik Possibility of Using in Russia the Experience of LED Lighting Application at the USA Airfields
Seher Ates, M. Berker Yurtseven, and Sermin Onaygil Design and Validation of a Chip on Board (COB) LED Based High-BayIndustrial Luminaire with Thermal Simulations and Experimental Analyses
Victor P. Afanas’ev, Vladimir P. Budak, Dmitriy S. Efremenko, and Paul S. Kaplya Application of the Photometric Theory of the Light Field in Electron Scattering Problems
Mikhail V. Tarasenkov, Egor S. Poznakharev and Vladimir V. Belov The Statistical Evaluations of Transmission Characteristics, Limits of Ranges and Speeds of Transmission of Information Via the Pulsed Atmospheric Bistatic Optical Channels
Alexander Shcherbakov and Vladimir Frolov
Matrix Transformations for Effective Implementation of Radiosity Algorithm Using Graphic Processors
Adham Giyasov Role of the Insulating Plate for Estimation of the Insolation Regime of Urban Territories and Buildings

Light & Engineering Vol. 27, No. 1
142

PARTNERS OF LIGHT & ENGINEERING JOURNAL
Editorial Board with big gratitude would like to inform international lighting community about the Journal Partners Institute establishment. The list with our partners and their Logo see below. The description of partner’s collaboration you can found at journal site www.sveto-tekhnika.ru
International Lighting Engineering Corporation
BOOS LIGHTING GROUP