Life Cycle Assessment study of starch ... - Starch Europe
30
Life Cycle Assessment study of starch products for the European starch industry association (Starch Europe): sector study Vercalsteren An, Boonen Katrien Study accomplished under the authority of Starch Europe (the European starch industry association) 2015/SMAT/R/0083 May 2015
-
Upload
khangminh22 -
Category
Documents
-
view
1 -
download
0
Transcript of Life Cycle Assessment study of starch ... - Starch Europe

Life Cycle Assessment study of starch products for the European starch industry association (Starch Europe): sector study Vercalsteren An, Boonen Katrien
Study accomplished under the authority of Starch Europe (the European starch industry association) 2015/SMAT/R/0083 May 2015

All rights, amongst which the copyright, on the materials described in this document rest with the Flemish Institute for Technological Research NV (“VITO”), Boeretang 200, BE-2400 Mol, Register of Legal Entities VAT BE 0244.195.916.

Table of Contents
3
TABLE OF CONTENTS
Table of Contents ________________________________________________________________ 3
List of Figures ___________________________________________________________________ 4
List of Tables ____________________________________________________________________ 5
CHAPTER 1 Introduction ________________________________________________________ 6
CHAPTER 2 Definition of goal and scope ___________________________________________ 8
2.1. Introduction 8
2.2. Goal definition 8
2.3. Scope definition 9
CHAPTER 3 Life cycle data inventory _____________________________________________ 15
CHAPTER 4 life cycle impact assessment __________________________________________ 17
4.1. LCIA methodology 17
4.2. Environmental profiles of starch products 18 4.2.1. Environmental profile of native starches _________________________________ 19 4.2.2. Environmental profile of liquid glucose (including Glucose and Fructose syrups) __ 20 4.2.3. Environmental profile of dry fiber-rich feed products _______________________ 21
4.3. Carbon uptake 21
4.4. Sensitivity analyses 23 4.4.1. Sensitivity analysis for electricity _______________________________________ 23 4.4.2. Sensitivity analysis for infrastructure ____________________________________ 23 4.4.3. Sensitivity analysis for infrastructure of Starch Europe plants _________________ 24 4.4.4. Sensitivity analysis for particulate matter emissions from starch production _____ 24 4.4.5. Sensitivity analysis for including two types of packaging _____________________ 24
CHAPTER 5 SUMMARY_________________________________________________________ 25
5.1. General conclusions 25
5.2. Improvements and recommendations 27
Glossary ______________________________________________________________________ 28
References ____________________________________________________________________ 29

List of Figures
4
LIST OF FIGURES
Figure 1: Stepwise approach as suggested for this LCA study for the European starch industry ___ 8 Figure 2: Generic presentation of system boundaries ___________________________________ 10 Figure 3: Environmental impacts of native starches production – relative contributions ________ 19 Figure 4: Environmental impacts of liquid glucose production – relative contributions _________ 20 Figure 5: Environmental impacts of fiber-rich feed products production – relative contributions _ 21 Figure 6: Carbon footprint and biogenic carbon uptake for 1 ton d.s. of the raw materials mixture 22 Figure 7: Relative contribution of different production inputs to the products environmental
impacts – for water resource depletion, the use of water for cooling is also included. _____ 26

List of Tables
5
LIST OF TABLES
Table 1: Overview of the environmental impact categories and impact assessment models for PEF studies (European Commission, 2013) ___________________________________________ 13
Table 2: Overview of transportation modes and distances for the raw materials – weighted average transportation distance for each raw materials and transportation mode _______________ 16
CHAPTER 1 Introduction
6
CHAPTER 1 INTRODUCTION
In the past years, different initiatives have been launched that are related to the assessment of environmental impacts (e.g. carbon footprint) of products in general and food products in particular from a life cycle perspective. In particular, the European Commission published, in 2013, its guidelines to “measure and communicate on life cycle environmental performance of products and organisations”1. The Commission is currently in a 3-year pilot phase, where 27 pilots are testing the development of products (and sector) specific rules. In this context, the starch industry published the results of its LCA study of starch products in August 2012. To be able to participate actively in the discussions mentioned above and to be prepared for the implementation of possible future legislation, the European starch industry association (Starch Europe, formerly AAF2) decided to develop Product Category Rules (PCR3) for products of the starch industry – based on the LCA study published in 2012 – and to update its life cycle assessment study at the same occasion. This document describes the approach of the study and presents the updated results. The starch industry originally decided to undertake the study in 2 phases:
- A pretesting phase that was based on a limited dataset and focused on methodological issues (allocation rules, system boundaries, biogenic carbon, etc.). Due to the limited dataset, the absolute environmental impacts that resulted from this phase cannot be considered as representative for the entire European starch industry. This phase was finalized in February 2011.
- An extensive sector study that follows the methodology as defined in the pretesting phase. This LCA is based on an extensive dataset, collected from a significant number of starch plants across the EU, which is representative for the European starch industry and results in environmental profiles for starch industry products. This study was finalized in 2012.
In the context of the ongoing (PEF related) developments on a European level, an update of the sector-representative LCA study of starch products was finalized in 2015. This update takes into account the latest developments in the general field of LCA (both at academic and regulatory level). This report is a summary of the sector representative LCA, including the changes made to the original study during the most recent update.
1 COMMISSION RECOMMENDATION of 9 April 2013 on the use of common methods to measure and
communicate the life cycle environmental performance of products and organisations 2 The original study was commended by the European starch industry association, “AAF”, which was renamed
“Starch Europe” before the update of the study was completed. For consistency, the European starch industry association is always referred to as “Starch Europe” in this updated document. 3 Product category rules (PCR) are a set of specific rules, requirements and guidelines for one or more
product categories, for developing environmental declarations providing quantified environmental data using predetermined parameters and, where relevant, additional environmental information (ISO 14025).

CHAPTER 1 Introduction
7
Starch Europe (the European starch industry association) can use the results of this LCA study for the following purposes:
- to focus improvement activities on the most important impact-generating process phases;
- for communication with various stakeholders and to exchange, with national and sector initiatives, the knowledge gained through having done the exercise;
- to anticipate future legislation regarding environment and certification (product development);
- to participate in the stakeholder consultation process of the European Commission’s “Products Environmental Footprint (PEF)” pilots;
- to compose an EPD (Environmental Product Declaration), as described in ISO TR 14025 (ISO, 2006).
The methodology used to determine the environmental impacts of the starch products conforms to the LCA methodology, as prescribed in ISO standards 14040 and 14044 (ISO, 2006). According to these ISO standards, an LCA is carried out in 4 phases:
1. Goal and scope definition of the study; 2. Life cycle data inventory (LCI); 3. Life cycle impact assessment (LCIA); 4. Interpretation.
The design of this report complies with these 4 phases of the LCA, whereby the various chapters describe each phase of the LCA. All relevant ISO guidelines were implemented in compiling the present report (ISO 14044, paragraph 5.2).

CHAPTER 2 Definition of goal and scope
8
CHAPTER 2 DEFINITION OF GOAL AND SCOPE
2.1. INTRODUCTION
In consultation with Starch Europe, VITO recommended to apply a stepwise approach for the LCA-study, as presented in Figure 1.
Figure 1: Stepwise approach as suggested for this LCA study for the European starch industry
A life cycle assessment (LCA) is a well known method to analyse the environmental impacts of a product. An LCA quantifies the potential environmental effects of a product over its entire life cycle, meaning that the extraction of raw materials, the production of the materials and the product, the use and the end-of-life treatment are taken into account.
2.2. GOAL DEFINITION
The goal of the study must be clearly formulated and the reference basis (functional unit) must be defined to allow a correct analysis from the product’s perspective. Starch Europe wished to conduct a study on the environmental impacts of starch products. The objective of the complete sector study aims more specifically to:
- Generate sector-representative ‘environmental profiles’ for relevant starch products;
- Communicate these environmental profiles about starch products as a sector;
- Contribute proactively, through the knowledge gained in the development of the starch sector eco-profile, to stakeholders and other national/sectors initiatives (e.g. the European
1 - Goal and scope
Definition of reference products
System boundaries
2 - Data inventory(LCI)
Work load AAF member cies
Coordination by VITO
(framework)
AAF data manager
Workshops
3 - Life CycleImpact
Assessment (LCIA)
Definition of basic
scenario/ methodology
Processing of AAF data
Analysis of environmental
impacts
4 - Sensitivityanalyses
Allocationmethods

CHAPTER 2 Definition of goal and scope
9
Commission’s “Products Environmental Footprint (PEF)” pilots or development of the LEAP partnership guidelines for the LCA of feed products).
2.3. SCOPE DEFINITION
The scope of the study includes a large review of products from the starch industry from native starch to polyols, including non-starchy products from wheat, maize or potatoes. Some of the reference products are intermediate products, which means that they mostly have no economic value. Starch slurries from maize, potatoes and wheat have different production processes but result in a comparable intermediate product. Different other products are produced during the production processes of starch slurry from maize, potatoes or wheat, such as gluten. The production of final products usually starts from intermediate products like starch slurry. The production processes for final starch products differ significantly and are independent of the raw material (maize, wheat, potatoes). The environmental profile of final products is divided in two:
- The contribution of agriculture; - The industrial processes for the production of final products.
The scope of the study is also defined by the functional unit. The functional unit is closely related to the function(s) fulfilled by the to-be-investigated product. The definition of the functional unit was agreed upon together with Starch Europe participating companies before performing the study as “the production of 1 ton d.s. (dry substance) of reference products at the starch plant exit gate”. In consultation with Starch Europe it was decided to focus on the cradle-to-gate processes. The system boundary diagram shown in Figure 2 below generically outlines the different life cycle stages and the inputs and outputs that are included in the system boundaries of this study.

CHAPTER 2 Definition of goal and scope
10
Growing of crops
Transport to starch factory
Starch industry production
Energy
Raw materials
Emissions to water
Emissions to air
Emissions to soil
Waste
By-products
Further processing at customers
Transport to customers
End-of-life treatment
Use
System boundary
Factory alone
Upstream processes
Core processes
Downstream processes
Generation of Energy
Production of chemicals
Figure 2: Generic presentation of system boundaries
The following life cycle stages are included in our cradle-to-gate approach: - Cradle-to-raw materials/upstream processes: These are all the processes upstream of the
starch production stage, starting with the resource extraction. This includes: agricultural processes: growing of maize, wheat or potatoes, including soil cultivation,
sowing, weed control, fertilisation, pest and pathogen control, harvest and drying (when relevant);
the production of energy;
the production of chemicals needed for manufacturing starch industry products (caustic soda, hydrochloric acid etc.);
Transport steps: Transport of raw materials from the field/plants to the starch plants is included here.
- Factory alone/gate-to-gate/core processes: This focuses on Starch Europe member companies producing the reference products. The processes that are included depend on the specific starch industry product, e.g. dry cleaning, wet cleaning, rasping, steeping, degerminating, grinding/flour milling, dough preparation, separation, sieving, dewatering, washing, refining, mixing & drying, evaporation, drying, solubilizing, pressing, protein separation, conversion, hydrogenation, special polyol process, maltodextrine process, crystallization, fermentation and distillation.
A cradle-to-gate study is a solution foreseen in relevant standards for environmental assessments of intermediate products in business-to-business situations, which is the case for the European starch industry.

CHAPTER 2 Definition of goal and scope
11
To clearly define the system boundaries, some basic principles need to be denoted: - Infrastructure (the use of the capital goods and the effects related to this) is defined in a
number of references: o PEF guide: capital goods shall be included. o PAS 2050: the Greenhouse Gas (GHG) emissions arising from the production of capital
goods used in the life cycle of the product shall be excluded from the assessment … (par. 6.4.4).
o ILCD: A systematic exclusion of e.g. transport, infrastructure, services, administration activities, etc. is not appropriate unless necessary according to the specific goal of the LCI/LCA study (par. 6.6.2).
o ISO 14040: When setting the system boundaries, several life cycle stages should be taken into consideration … manufacture, maintenance and decommissioning of capital equipment.
For the purpose of the study for Starch Europe, the following decisions were taken with regard to infrastructures:
o Infrastructures, in this respect referring to transportation infrastructures (roads, railways …) and infrastructures for energy production (electricity plants, pipelines …) were included.
o Infrastructures related to Starch Europe member companies’ sites are excluded, but this is justified due to the fact that a huge volume of reference products can be produced during the life span of the infrastructures of Starch Europe member companies’ plants and as such the impact of their manufacture and maintenance is negligible related to the amount of products produced. This was confirmed by a sensitivity analysis (paragraph 4.4.3). The baseline scenario calculations include infrastructures of the background processes. In another sensitivity assessment (paragraph 4.4.2) infrastructure has been excluded in order to see the effect on the environmental profiles (calculation for liquid glucose from weighted average mixture of raw materials).
- Accidental pollutions are often difficult to distinguish from emissions that occur under normal
conditions (accidental pollutions are not measured and reported separately) and are therefore not considered in this study.
- Environmental impacts caused by the personnel of the production plants and by infrastructures such as offices are neglected, e.g. waste from the cafeteria and sanitary installations or accidental pollution caused by human mistakes, or environmental effects caused by commuter traffic.
For the handling of multi-functional processes, ISO 14040/44 and the PEF guide recommend to apply subdivision or system expansion if possible, and otherwise to apply allocation based on a relevant underlying physical relationship. For the starch industry, allocation cannot be avoided through subdivision or system expansion. Subdivision/disaggregation is done up to a certain level, as some processes can be attributed to one product only. However, many production processes in the starch industry are complex and may be considered as a ‘black box’ that cannot be subdivided further. System expansion is not useful either, as one of the goals of the LCA is to determine the environmental impacts per product, to allow companies that use only one specific starch industry product to use the results as an input for the LCA of their products. Therefore, allocation procedures are needed when dealing with the starch industry systems involving multiple products. According to ISO 14040/44, allocation is defined as ‘partitioning the input or output flows of a process or a product system between the product system under study

CHAPTER 2 Definition of goal and scope
12
and one or more other product systems’. The materials and energy flows as well as associated environmental releases shall be allocated to the different products according to clearly stated procedures, which shall be documented and justified. Allocation is very important in the LCA study of starch products, since the starch industry produces a wide range of different reference products per specific raw material (either maize or wheat or potatoes). Many process steps in the starch industry produce more than one useful output. This is called by-product allocation. Allocation is also important for the correct modeling of High Efficiency Combined Heat and Power installations (CHP) that are used extensively by many starch producing companies. There has been continuous discussions amongst LCA practitioners about the choice of allocation methods. Both physical and economic allocation have benefits and drawbacks. In the pretesting phase different allocation rules were applied under different boundaries and taking into account guidelines from the relevant standards and handbooks (e.g. ISO 14040/44, PAS2050, ILCD handbook, etc.). In the pretesting phase the following allocation rules were applied:
- Physical relation: o Mass basis (dry substance) o Energy content: Specifically requested in the Renewable Energy Directive but
mainly focusing on fuels (e.g. ethanol); - Economic relation:
o Market price per ton d.s. (100% d.s.): Estimation of market price in period mid 2009-mid 2010; For 100% dry products (although other products or intermediate products,
according to system boundaries, are often wet products so allocation rule is not 100% correct).
Based on the results of the pretesting, Starch Europe decided to use mass allocation in the second phase of the LCA study. Mass allocation was chosen because it offers the clearest picture throughout the process tree and is based on the best available data. This corresponds to the recommendation of the ISO 14040/44 standards and the ILCD Handbook, which both prefer allocation based on physical relationships. In theory, allocation should be done based on the product characteristics at the point of allocation. Since starch slurry production process in the starch industry are complex and considered as a ‘black box’, it is impossible to give data on that level of detail (each step in the production process). Since the physical characteristics that are relevant for the function differ per starch industry product, mass (dry substance) is considered to be the best option. To allocate the environmental impacts but also benefits of the CHP to either heat or electricity, different methods are available. Allocation can be based on i) operational activities (electricity only, heat only), ii) thermodynamic parameters (energy, exergy) or iii) final product prices. As the pretesting phase showed no significant difference in total carbon footprint calculated for energy and exergy allocation, allocation of emissions from CHP based on energy was chosen. The input- and output flows respectively of the CHP electricity and heat output are modeled according to energy allocation. These allocated impacts (of the CHP systems) are then distributed respectively to the amount of electricity and heat produced by High Efficiency CHP systems. Regarding the carbon footprint, the impact of Land Use Change (LUC) was included during the update. The “Direct Land Use Change Assessment Tool (Version 2014.1 - 21 January 2014)” developed by Blonk Consultants was used to include the impact of LUC on the carbon footprint.
CHAPTER 2 Definition of goal and scope
13
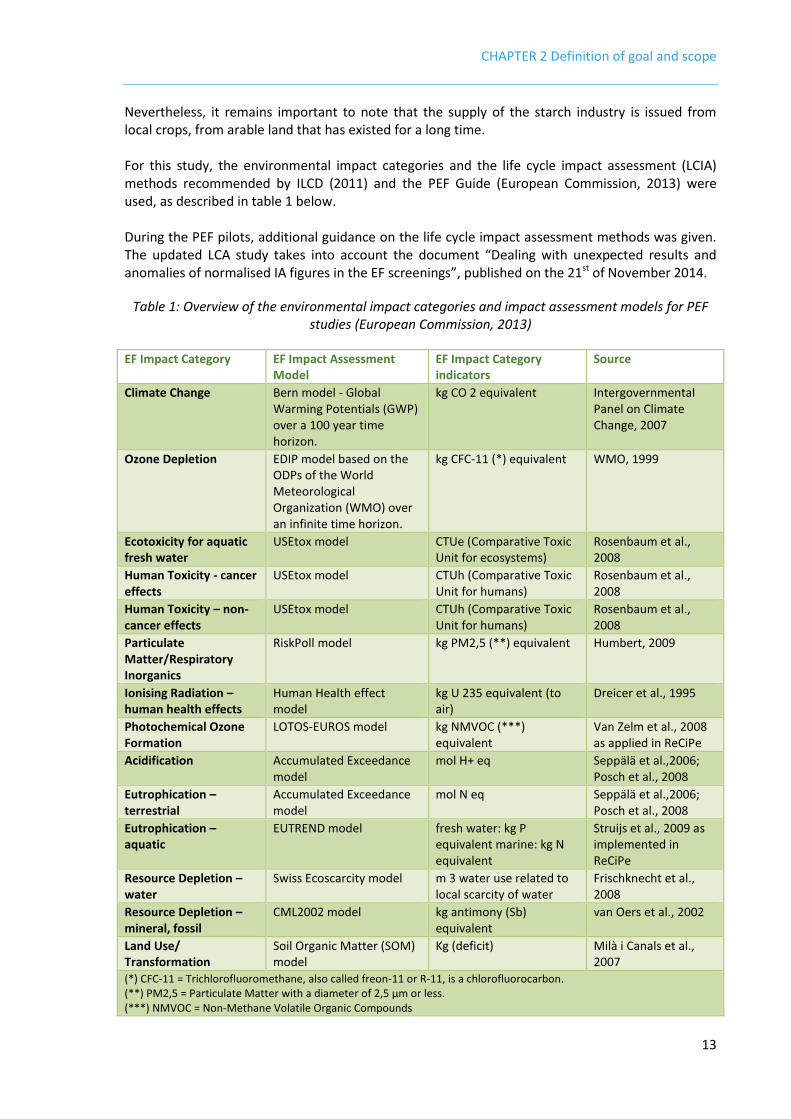
Nevertheless, it remains important to note that the supply of the starch industry is issued from local crops, from arable land that has existed for a long time. For this study, the environmental impact categories and the life cycle impact assessment (LCIA) methods recommended by ILCD (2011) and the PEF Guide (European Commission, 2013) were used, as described in table 1 below. During the PEF pilots, additional guidance on the life cycle impact assessment methods was given. The updated LCA study takes into account the document “Dealing with unexpected results and anomalies of normalised IA figures in the EF screenings”, published on the 21st of November 2014.
Table 1: Overview of the environmental impact categories and impact assessment models for PEF studies (European Commission, 2013)
EF Impact Category EF Impact Assessment Model
EF Impact Category indicators
Source
Climate Change Bern model - Global Warming Potentials (GWP) over a 100 year time horizon.
kg CO 2 equivalent Intergovernmental Panel on Climate Change, 2007
Ozone Depletion EDIP model based on the ODPs of the World Meteorological Organization (WMO) over an infinite time horizon.
kg CFC-11 (*) equivalent WMO, 1999
Ecotoxicity for aquatic fresh water
USEtox model CTUe (Comparative Toxic Unit for ecosystems)
Rosenbaum et al., 2008
Human Toxicity - cancer effects
USEtox model CTUh (Comparative Toxic Unit for humans)
Rosenbaum et al., 2008
Human Toxicity – non- cancer effects
USEtox model CTUh (Comparative Toxic Unit for humans)
Rosenbaum et al., 2008
Particulate Matter/Respiratory Inorganics
RiskPoll model kg PM2,5 (**) equivalent Humbert, 2009
Ionising Radiation – human health effects
Human Health effect model
kg U 235 equivalent (to air)
Dreicer et al., 1995
Photochemical Ozone Formation
LOTOS-EUROS model kg NMVOC (***) equivalent
Van Zelm et al., 2008 as applied in ReCiPe
Acidification Accumulated Exceedance model
mol H+ eq Seppälä et al.,2006; Posch et al., 2008
Eutrophication – terrestrial
Accumulated Exceedance model
mol N eq Seppälä et al.,2006; Posch et al., 2008
Eutrophication – aquatic
EUTREND model fresh water: kg P equivalent marine: kg N equivalent
Struijs et al., 2009 as implemented in ReCiPe
Resource Depletion – water
Swiss Ecoscarcity model m 3 water use related to local scarcity of water
Frischknecht et al., 2008
Resource Depletion – mineral, fossil
CML2002 model kg antimony (Sb) equivalent
van Oers et al., 2002
Land Use/ Transformation
Soil Organic Matter (SOM) model
Kg (deficit) Milà i Canals et al., 2007
(*) CFC-11 = Trichlorofluoromethane, also called freon-11 or R-11, is a chlorofluorocarbon. (**) PM2,5 = Particulate Matter with a diameter of 2,5 μm or less. (***) NMVOC = Non-Methane Volatile Organic Compounds

CHAPTER 2 Definition of goal and scope
14
On request of the participating companies, an additional impact category ‘Non-treated final waste flow for landfill and incineration was included into the assessment. This is an impact category on an inventory level and it is expressed in kg waste. It is important to select the data sources in line with the goal and scope of the study. Since Starch Europe’s study focuses on the starch industry processes in the first place, it is important to use specific data for these processes. Within this project different levels of data requirements exist. The following data sources are used for the different life cycle phases:
- Cradle to raw materials/upstream processes = supply chain, agriculture Secondary (generic) data from LCA databases. Agricultural data is obtained from the Agribalyse database (ADEME, 2014). The Ecoinvent database is used for data on the production of energy, chemicals and transport from suppliers to the factory.
- Factory alone/core processes Primary (specific) data from Starch Europe member companies.
For all life cycle stages an input-output balance is made:
- Input data concern the consumption of energy, raw materials and water; - Output data are emissions (to air, water, soil) and waste.
It is focused on EU 27 as a geographical boundary. It is assumed that only raw materials from EU 27 are used (in general, 95% of raw materials are). The generic data account for the period 2003-2013. Specific data from Starch Europe member companies are representative for the period mid 2009 – mid 2010 or the complete year 2010. The data for the starch production processes refer to currently available, modern technology and to good standard operating practices. For additives, fuels and power, average industry mix profiles from the Ecoinvent version 2.2 database are utilised.
Data need to be representative for the European starch industry and as such based on at least 3 company specific datasets per reference product. VITO assessed the representativeness of data sets per reference product on the basis of the completed questionnaires.
Regarding cut-off criteria, it was decided to at least include bulk chemicals as input flows for all reference products. As all materials (raw materials and chemicals) are supplied in bulk packaging, packaging of incoming materials is not significant and as such not taken into consideration. Sensitivity analyses assess the influence of the most relevant and most uncertain factors on the results of the study. The results of these sensitivity analyses are compared to the basic scenario. Sensitivity analyses do not make the basic data of a study more reliable, but allow assessing the effect of a change in inventory data on the results and conclusions of the study. In this study five sensitivity assessments are performed, all based on the same dataset:
- Electricity mixes (from the grid) and its impacts; - Excluding infrastructure of background processes; - Including infrastructure of Starch Europe plants - Process-related particulate matter emissions; - Inclusion of packaging.
When an LCA study is used to make a comparative assertion that is disclosed to the public, the ISO standards require a critical review by interested parties to be conducted. This is not an issue here as this study does not aim at comparing different products. Should third parties wish to use this study for the purpose of LCA comparisons with other products, it would be essential that a strictly comparable methodology be applied.

CHAPTER 3 Life cycle data inventory
15
CHAPTER 3 LIFE CYCLE DATA INVENTORY
In the inventory phase all data needed to analyse the environmental impacts associated with the reference products are gathered. In summary, this means that all of the input flows (materials, energy …) and all of the output flows (emissions, waste…) are described and quantified. This is done for all life cycle phases, from cradle-to-gate. The inventory phase is performed according to the ISO 14040 and ISO 14044 (data inventory) standards (ISO, 2006). The data inventory process is focused on the following life cycle phases:
1. Growing of the maize, wheat or potatoes (agriculture): 2. Production process of the starch slurry and other products, which is roughly subdivided in:
a. Production of additives and water; b. Production of electricity and heat; c. Transport steps; d. Production step.
3. Additional processes to produce the final reference products. For the phases that refer directly to the activities of the European starch industry association’s Member companies (2 and 3), specific data are gathered by a selection of companies (13), representing 33 sites. Per reference product, VITO converted the company-specific datasets into one aggregated dataset which is used for the analysis. Aggregation is based on a weighted average, according to the annual production volumes. For the agricultural production, Starch Europe decided to use the Agribalyse v1.1 database (2014) from France, because of the representativeness of the standard conditions of growing, in Europe, of raw materials processed by the starch industry, the easy access to the data, the comparability for the three different raw materials and the transparency on what is or is not included. As mentioned above, the starch industry specific data were collected from 33 starch plants processing a significant share of French raw materials, hence the relevance and representativeness of the Agribalyse database. These data records are:
- Wheat: Soft wheat grain, conventional, national average, at farm gate/kg/FR
- Maize: Grain maize, conventional, 28% moisture, national average, at farm gate/kg/FR
- Potatoes: Starch potato, conventional, national average, at farm gate/kg/FR Table 2 gives more details on the transport of wheat, maize and potatoes to the starch production plants.

CHAPTER 3 Life cycle data inventory
16
Table 2: Overview of transportation modes and distances for the raw materials – weighted average transportation distance for each raw materials and transportation mode
Raw material Transportation mode Average transportation distance (km)
Relative use of transportation mode
(%)
Wheat
Transport, freight, rail/RER Transport, lorry >16t, fleet average/RER Transport, barge tanker/RER
122 87 92
33% 33% 34%
Maize Transport, freight, rail/RER Transport, lorry Transport, barge tanker
121 86
393
25% 53% 22%
Potatoes Transport, lorry >16t, fleet average/RER Transport, tractor and trailer/CH
121 10
92% 8%
Figure 7 (page 30) shows that the impact of transport is relatively low in comparison to the impact attributable to other phases of starch production. The table 2 above shows that in average, transport from field/storage to the starch plants is limited and that the supply is mainly local. For wheat and maize the significant use of transport means like tankers and trains is also demonstrated by figures of table 2; these transport means are commonly considered to be environmentally friendly compared to truck/road transport4. For potatoes, the greater use of lorries is due to the origin of raw material supply which is exclusively local. Finally, the efficiency of the supply chain, which is not shown through these figures, also contributes to a limited environmental impact, with no truck/train/boat leaving storage without being fully loaded. Both electricity and heat can be produced with a CHP generation system. In the average weighted dataset, 57% of the electricity input is produced with the CHP while 43% comes from the grid. This electricity from the grid is produced according to a specific mix for each country. Once again, a weighted average electricity production mix was calculated. This means that for each country the amount of kWh input to the processes was used to do the weighting. For heat, the weighted average amount produced with the CHP is 59%. This means that for the remaining heat, a boiler is assumed (heat, natural gas, at boiler modulating >100 kW, RER). The CHP needs to be included in the modelling as well. To do this, the data provided by the participating companies were taken into account. An average electrical and thermal efficiency, in relation to primary energy input, is calculated based on these data:
- Electrical efficiency = 29%
- Thermal efficiency = 60% The thermal efficiency is quite high. This is because it takes into account the fact that heat can be recuperated from the CHP waste gases. On request of the participating companies, an additional impact category ‘Non-treated final waste flow for landfill and incineration’ is included. This is an impact category on an inventory level and it is expressed in kg waste. It was reported on company level and not related to the different products. Result shows that on average 7,7 kg of waste for landfill and incineration is produced per ton d.s. input of wheat, maize or potatoes. If presented as a ratio, wastes of the production processes represent less than 0,8% of the raw materials used in weight. These 7,7kg represent process wastes coming from industrial cleaning and maintenance operations but are not a wasted part of the raw materials or products themselves.
4 Many studies confirm this assumption, inter alia the following studies:
http://www.eco-logica.co.uk/pdf/WWFreport.pdf http://www.americanwaterways.com/press_room/news_releases/NWFSTudy.pdf

CHAPTER 4 Life cycle impact assessment
17
CHAPTER 4 LIFE CYCLE IMPACT ASSESSMENT
4.1. LCIA METHODOLOGY
Usually, the inventory process generates a long list of data, which may be difficult to interpret. The Life Cycle Impact Assessment (LCIA) is a tool to relate the large number of inventory values to a smaller number of environmental themes (environmental impact categories) so that the outcome of the assessment is possible to interpret. LCAs do not represent a complete picture of the environmental impacts of a system. They represent a picture of those aspects that can be quantified. Any judgments that are based on the interpretation of LCI data must bear in mind this limitation and, if necessary, obtain additional environmental information from other sources (hygienic aspects, risk assessment, etc.). The LCIA results are relative expressions and do not predict any exceeding of thresholds, safety margins or risks. Various methods are in use to assess the environmental impacts of products and systems. For the update of the LCA study of starch products, Starch Europe agreed with VITO to look at the selection of environmental impact categories as proposed by the European Commission’s PEF guide and the ILCD Handbook (2011). VITO used the LCA software package “SimaPro” for performing the Life Cycle Impact Assessment (LCIA) and generating the environmental profiles of the different starch products. In discussing the results of the individual profiles of the starch products it is important to know whether or not a process (or a life cycle phase) has a significant contribution to an environmental impact category. For that the ISO framework (ISO 14044 - Annex B) is used. According to the ISO 14044 Annex B the importance of contributions can be classified in terms of percentage. The ranking criteria are:
A: contribution > 50 %: most important, significant influence; B: 25 % < contribution ≤ 50 %: very important, relevant influence; C: 10 % < contribution ≤ 25 %: fairly important, some influence; D: 2,5 % < contribution ≤ 10 %: little important, minor influence; E: contribution < 2,5 %: not important, negligible influence.
In discussing the results of the comparison the rule-of-thumb is that a 20% difference is considered significant for impact categories that have sufficient scientific basis e.g. contribution to the carbon footprint.

CHAPTER 4 Life cycle impact assessment
18
4.2. ENVIRONMENTAL PROFILES OF STARCH PRODUCTS
In the results presented below, twelve environmental impact categories are presented for the main products of the starch industry. Three additional impact categories included in the PEF guide (human toxicity, cancer effect, human toxicity, non-cancer effect and freshwater ecotoxicity) were assessed but are not presented due to the high level of uncertainty of their results. The impact category “ionising radiation, ecosystems” is classified as interim by the ILCD handbook, which means it should be used with extreme caution, therefore it is not shown in the results either. The other twelve impact categories can be described as follows (PEF Guide, 2013):
- Climate Change/carbon footprint (kg CO2 equivalent) The Global Warming Potential is the capacity of a greenhouse gas to influence radiative forcing, expressed in terms of a reference substance (for example, CO2 -equivalent units) and specified time horizon (in this case a 100 year time horizon, GWP 100). It relates to the capacity to influence changes in the global average surface-air temperature and subsequent change in various climate parameters and their effects, such as storm frequency and intensity, rainfall intensity and frequency of flooding, etc.
- Ozone Depletion (kg CFC-11 equivalent) Impact category that accounts for the degradation of stratospheric ozone due to emissions of ozone-depleting substances, for example long-lived chlorine and bromine containing gases (e.g. CFCs, HCFCs, Halons).
- Particulate Matter/Respiratory Inorganics (kg PM2,5 equivalent) Impact category that accounts for the adverse health effects on human health caused by emissions of Particulate Matter (PM) and its precursors (NOx, SOx, NH3).
- Ionising Radiation – human health effects (kg U235 equivalent) Impact category that accounts for the adverse health effects on human health caused by radioactive releases.
- Photochemical Ozone Formation (kg NMVOC equivalent) Impact category that accounts for the formation of ozone at the ground level of the troposphere caused by photochemical oxidation of Volatile Organic Compounds (VOCs) and carbon monoxide (CO) in the presence of nitrogen oxides (NOx) and sunlight. High concentrations of ground-level tropospheric ozone damage vegetation, human respiratory tracts and manmade materials through reaction with organic materials.
- Acidification (mol H+ equivalent) Impact category that addresses impacts due to acidifying substances in the environment. Emissions of NOx, NH3 and SOx lead to releases of hydrogen ions (H +) when the gases are mineralised. The protons contribute to the acidification of soils and water when they are released in areas where the buffering capacity is low, resulting in forest decline and lake acidification.
- Eutrophication – terrestrial (mol N equivalent), fresh water (kg P equivalent) and marine (kg N equivalent) Nutrients (mainly nitrogen and phosphorus) from sewage outfalls and fertilised farmland accelerate the growth of algae and other vegetation in water. The degradation of organic material consumes oxygen resulting in oxygen deficiency and, in some cases, fish death.
- Resource Depletion – water (m³ water equivalents, i.e. water use related to local scarcity of water) Impact category that addresses use of water only.
- Resource Depletion – mineral, fossil (kg Sb equivalent)

CHAPTER 4 Life cycle impact assessment
19
Impact category that addresses use of natural resources, either renewable5 or non-renewable, biotic or abiotic.
- Land Use/ Transformation(kg C deficit) Impact category related to use (occupation) and conversion (transformation) of land area by activities such as agriculture, roads, housing, mining, etc. Land occupation considers the effects of the land use, the amount of area involved and the duration of its occupation (changes in quality multiplied by area and duration). Land transformation considers the extent of changes in land properties and the area affected (changes in quality multiplied by the area). For land use/transformation, the figures below show a negative number or “environmental benefit” for the growing of the crops. This is caused by the assumptions made by the Agribalyse database. To estimate the land transformation for French crops, the average land transformation observed during the Agribalyse reference period of 2005 to 2009 was considered. During this reference period, some urban land was converted to arable land for the production of crops. As urban land has a higher average carbon deficit per square meter than agricultural land, this conversion causes an environmental improvement.
4.2.1. ENVIRONMENTAL PROFILE OF NATIVE STARCHES
Figure 3: Environmental impacts of native starches production – relative contributions
Figure 3 clearly shows that the agricultural phase makes the most important contribution to the environmental impacts. For the climate change impact category, for example, the growing of raw
5 Although depletion of renewable resources should be considered in the method, no methods that include
this are mature for recommendation (ILCD, 2011).

CHAPTER 4 Life cycle impact assessment
20
materials needed to produce one ton d.s. of native starches represents 487 kg CO2 equivalents, where the processing share of the impact represents 283 kg CO2 equivalents. The use of energy, usually in the form of fossil fuels, is the most important element of the impacts of the industrial process, for almost all impact categories.
4.2.2. ENVIRONMENTAL PROFILE OF LIQUID GLUCOSE (INCLUDING GLUCOSE AND FRUCTOSE SYRUPS)
Figure 4: Environmental impacts of liquid glucose production – relative contributions
Figure 4 clearly shows that the agricultural phase still makes the most important contribution to the majority of the environmental impact categories for liquid glucose, even though the contribution of the industrial process here is higher than for native starches. For the climate change impact category, for example, the growing of raw materials represents 511 kg CO2 equivalents, where the processing share of the impact represents 332 kg CO2 equivalents. Here again, the use of energy, usually in the form of fossil fuels, is generally the most important contributor to the impacts of the industrial process.

CHAPTER 4 Life cycle impact assessment
21
4.2.3. ENVIRONMENTAL PROFILE OF DRY FIBER-RICH FEED PRODUCTS
Figure 5: Environmental impacts of fiber-rich feed products production – relative contributions
Figure 5 above represents the average relative impacts of agriculture and processing for the cereal-based fiber-rich feed products produced by the starch industry (dry wheat feed and dry corn feed). As for native starches and liquid glucose, agriculture represents a major contributor for most of the impact categories. For the climate change impact category, the growing of raw materials represents 531 kg CO2 equivalents, where the processing share of the impact represents 339 kg CO2 equivalents. For the three impact categories for which the processing represents a significant part of the impacts, it is mostly due to the use of energy, usually in the form of fossil fuels, for the processes and for the drying of products.
4.3. CARBON UPTAKE
Since the main input for the products under research here are agricultural crops, the biogenic carbon uptake during the growing of the crops is also of interest. Since the European starch industry’s products are not only used for food and feed products but also for industrial products with a long life cycle (20 years and more), we additionally provide the “carbon credit” related to the CO2 uptake of the raw materials (wheat, maize, potatoes) in conformity with the rules as defined in the standards considered in this study. It was agreed to report the biogenic carbon uptake separately. The figure six below indicates the carbon footprint of 1 ton d.s. average mixture of raw materials (wheat, maize, potatoes) and the carbon uptake of the same amount of the same mixture.

CHAPTER 4 Life cycle impact assessment
22
Figure 6: Carbon footprint and biogenic carbon uptake for 1 ton d.s. of the raw materials mixture
Conclusion: the cultivation of raw materials ends up in an excess in biogenic carbon uptake compared to the carbon emitted (therefore the carbon footprint). Looking at the figures, this means that any product with a long life cycle (e.g. bio-plastics) would, as long as its manufacturing process has a carbon footprint of less than 1500kg CO2 eq / ton of processed raw materials, have a positive carbon footprint (more carbon sequestrated than emitted). The starch industry products that have a long life cycle today represent around 5% of the EU starch industry production.This share is expected to increase.
-2500
-2000
-1500
-1000
-500
0
500
1000
Carbon footprint agriculture Biogenic carbon uptake crops
kg C
O2
equ
ival
ents
Carbon footprint of 1 ton DS average mixture of raw materials (wheat, maize, potatoes)

CHAPTER 4 Life cycle impact assessment
23
4.4. SENSITIVITY ANALYSES
Five sensitivity analyses were done to assess the influence of the most relevant and most uncertain factors on the results of the study:
Electricity mixes (from the grid) and its impacts;
Excluding infrastructure of background processes;
Including infrastructure of Starch Europe member’s plants
Process-related particulate matter emissions;
Inclusion of packaging.
4.4.1. SENSITIVITY ANALYSIS FOR ELECTRICITY
The production of electricity from the grid differs between all EU countries. Since the average weighted dataset should represent an ‘average’ European starch producing plant, the electricity from the grid should too. This is why, where electricity from the grid is concerned, a weighted average grid is made. When using another composition of the grid or using a country specific energy production, this can affect the results of the calculations. The following electricity production mixes are used in the sensitivity scenarios:
- EU electricity mix (Ecoinvent): an average of the electricity production mix over the whole of the European countries, according to their total electricity produced;
- French electricity mix: 78% nuclear, 10% hydro, 4,5% coal, 3% gas, 4,5% rest;
- Polish electricity mix: >90% of electricity comes from coal combustion. The effect of these scenarios and the comparison with the baseline scenario for the carbon footprint of dry proteins were calculated. The biggest total difference (11%) is caused when using the data from the Polish electricity production mix. Looking only at the contribution of energy use to the carbon footprint this is a difference of 22%. When taking into account all analysed impact categories, only for freshwater eutrophication and ionizing radiation the difference is higher than 20%. The Polish mix has a higher impact on freshwater eutrophication, which is mostly caused by emissions during the mining of coal (most important fuel in Poland). The French, weighted average and European mix, on the other hand, contribute more to ionizing radiation due to the use of nuclear power. The differences between the weighted average mix for the starch producing companies and the Ecoinvent EU electricity mix are insignificant for all impact categories considered. Therefore, the weighted average mix for starch producing companies, originally chosen, was used for the final study.
4.4.2. SENSITIVITY ANALYSIS FOR INFRASTRUCTURE
In the next sensitivity assessment infrastructures were excluded. In the baseline scenario infrastructure is taken into account, except for the starch plant. To see whether this affects results in a significant way, calculations were made for liquid glucose. The difference between both scenarios is not significant, except for resource depletion. The reduction in resource depletion is mostly due to the fact that, when infrastructure is excluded, the use of metals for the production of vehicles and other infrastructure is no longer taken into account.

CHAPTER 4 Life cycle impact assessment
24
4.4.3. SENSITIVITY ANALYSIS FOR INFRASTRUCTURE OF STARCH EUROPE PLANTS
The third sensitivity analysis concerns the infrastructure of the Starch Europe production plants. An approximation was used for the starch plant infrastructure: the sugar refinery included in the Ecoinvent v2.2 database. The contribution of this infrastructure to the total impact of the starch industry products is smaller than 0,5% for all impact categories, except for resource depletion, where the impact is smaller than 3%. The Ecoinvent sugar refinery has a production capacity of 200 kt sugar per year, while the average starch plant production capacity is much higher, so the actual impact of the starch production plants may be even smaller. In the case of starch industry products, it is thus justifiable to exclude from the analysis the impact of the infrastructure needed for the starch production.
4.4.4. SENSITIVITY ANALYSIS FOR PARTICULATE MATTER EMISSIONS FROM STARCH PRODUCTION
The next sensitivity analysis considers particulate matter emissions from starch production. For starch production processes only energy-related PM emissions are included in the environmental profiles. No process-related PM emissions are available for the starch production processes (not inventoried during previous LCA-study). This sensitivity analysis, based on literature data, shows that the contribution of starch process-related PM emissions to the total impact is 4% maximum.
4.4.5. SENSITIVITY ANALYSIS FOR INCLUDING TWO TYPES OF PACKAGING
The last sensitivity analysis demonstrates that the environmental impact of the packaging of starch industry products is negligible in comparison to the full environmental impact of the starch industry product itself. Native starch was selected for this sensitivity analysis, as it may be packed in small quantities and the impact of native starch itself is relatively small, so the packaging is likely to have a larger contribution to the environmental impact. Two different types of packaging were considered: polypropylene big bags (500 kg of starch per bag) and kraft paper bags with polyethylene film (25 kg of starch per bag). The PP big bags contributed less than 1% to the impact of native starch, the contribution of the paper bags was below 3% for all impact categories considered. These sensitivity analyses thus indicate that the aspects analyzed do not have a large influence on the environmental profiles, and that a cut-off can be applied for the infrastructure of Starch Europe plants, particulate matter emissions from starch production and packaging of starch industry products.

CHAPTER 5 Summary
25
CHAPTER 5 SUMMARY
5.1. GENERAL CONCLUSIONS
From the individual environmental profiles of products produced by the EU starch industry, the importance of the agricultural life cycle phase becomes obvious. For the growing of the crops, the use of fertilizers, pesticides and energy during the cultivation process makes up for the largest part of the impact of the final products. For the production of native starch, agriculture is responsible for about two thirds of the impact for the carbon footprint, and over eighty percent for water resource depletion. When additional process steps are needed, the contribution of agriculture to the impact of other products from the starch industry remains major, though to a slightly lesser degree. This is shown by the liquid glucose profile. As the growing of raw materials is part of the life cycle of the starch products, the starch industry promotes better/more environmentally friendly agricultural practices. Nevertheless, climate and weather fluctuations also have a major influence on the environmental impacts of agricultural commodities, on which the starch industry has very limited control. The cultivation of the three crops used as raw materials - wheat, maize and potatoes – all show this significant contribution to the environmental impact of starch products. Data for agriculture thus have a significant impact on the final results. Any exact figure would depend on the raw material, the cultivation place and method, and as such a high level of uncertainty results from the choice of the agricultural data. This was the main reason behind the update of the LCA study of starch products and for using the Agribalyse database for the agriculture data, as it is deemed to be more representative of standard conditions of growing of raw materials processed by the EU starch industry. When looking only at the processes which occur at the starch plants, it is mostly the use of electricity and heat which creates impacts (depending on the impact category). As the starch industry processes include drying or concentrating the final products, the use of heat is important, hence this result is logical. The contribution from the starch processes is therefore the largest for climate change, ozone depletion and ionizing radiation as opposed to acidification, marine and terrestrial eutrophication, water resource depletion or land use. The impact on climate change is either highly depending on combustion emissions or on the use of fossil fuels which of course also need to be mined. Per kWh, the impact related to electricity is not necessarily higher or lower than that related to heat: this depends on the impact category. Overall, the amount of heat needed as an input is higher than electricity and thus often the most important contributor. The contribution of the chemicals, used in the processes, to the overall impacts is limited, although there are exceptions for some products. Figure 7 below illustrates the relative contribution to climate change and water resource depletion of different production inputs for native starch and liquid glucose:

CHAPTER 5 Summary
26
Figure 7: Relative contribution of different production inputs to the products environmental impacts – for water resource depletion, the use of water for cooling is also included.
The results and analytical conclusions of this LCA study give rise to several interesting features of the European starch industry’s products and processes, some of which are highlighted here:
- There is a wide application of high efficiency Combined Heat & Power (CHP) generation in the European starch industry, whose processes need a significant amount of energy (especially heat and to a lesser extent electricity): 57% of the electricity input and 59% of the heat input are produced by the means of CHP system. The use of high efficiency CHP however highly mitigates the effects of energy consumption, as “cogeneration (…) offers energy savings ranging between 15-40% when compared against the supply of electricity and heat from conventional power stations and boilers.”6
- The impact of transport is relatively low compared to other inputs contribution (cf. Figure 7). This is because the suppliers to the European starch industry are located close to the starch production plants and, besides trucks, make use of train and ship when possible as most environmentally friendly transportation modes for bulk materials.
- The starch industry is typically an industry which causes little waste production. All side streams are used to produce useful products that have an economic value and waste sent to landfill or incineration are almost non-existent.
- When focusing on the carbon footprint (climate change) for final products with a long life cycle (representing approximately 5% of total starch production) the carbon uptake of the crops (biogenic carbon uptake) largely offsets the greenhouse gas emissions during the total starch production process (agricultural and industrial part).
6 COGEN Europe –association representing European cogeneration industry actors – www.cogeneurope.eu,
section “knowledge center” “what is cogeneration”.

CHAPTER 5 Summary
27
5.2. IMPROVEMENTS AND RECOMMENDATIONS
Since agriculture plays such a significant role in the impact of the starch products, the importance of good, reliable data for the agricultural phase of the life cycle is huge. This was the main rationale behind the update of the 2012 LCA study of starch products – secondary data for agriculture (from the Agribalyse database) are now deemed more representative of the standard conditions of growing of raw materials processed by the starch industry in the EU. Since starch producers are an important customer to the agricultural sector, bilateral contacts between sector federations were made to stress to the agricultural sector that providing better data can also be of great importance to them. This update of the 2012 LCA study of starch products is compliant with the Product Category Rules (PCR) for products of the starch industry, as it was the basis for developing and testing these PCRs. As this study was performed based on a very large representation of EU starch production sites, it is deemed perfectly representative of the EU starch industry. It is recommended that any similar LCA study of starch products in Europe follows the same PCR. This study should also be considered as a key reference regarding the results and methodology for assessing the environmental impacts of the products of the starch industry. This is of particular importance to ensure consistency between the different supply chains of which the starch industry is part. Therefore, Starch Europe believes this report, and the PCR for products of the starch industry, should be considered in the PEF pilot testing and when subsequently finalizing/updating the PEF guide. Finally, we would like to stress that this report was not produced with the intention to make LCA comparison between starch products and other products. Should third parties attempt such a comparison, it is essential that a strictly comparable methodology is used.

Glossary
28
GLOSSARY
Black box = main process during which multiple products are produced from one raw material, with no possibility to differentiate which input and output is related to a particular product. By “Other products” as opposed to starch products, we refer to so called “by-products” as usually named. Nevertheless, the term “by-products” was not retained because these products, derived from grains or potatoes, just like starch and its derivative products, are also products in their own rights. Background processes - Those processes in the product life cycle for which no direct access to information is possible. For example, most of the upstream life-cycle processes and generally all processes further downstream will be considered part of the background processes (PEF Guide, 2013). CH – Switzerland (used to indicate location in LCA databases) d.s. - Dry Substance FR - France (used to indicate location in LCA databases) GHG - Greenhouse Gas LCA - Life Cycle Assessment LCI - Life Cycle Inventory LCIA - Life Cycle Impact Assessment Member cies - Starch Europe member companies RER – Europe (used to indicate location in LCA databases)

References
29
REFERENCES
AGRIBALYSE® database v1.1 (2014), ADEME http://www.ademe.fr/expertises/produire-autrement/production-agricole/passer-a-laction/dossier/levaluation-environnementale-agriculture/loutil-agribalyse Blonk Consultants. (2014). The Direct Land Use Change Assessment Tool. Gouda. Retrieved from http://blonkconsultants.nl/en/tools/land-use-change-tool.html Ecoinvent, 2009 The cycle inventory data Swiss Centre for Life Cycle Inventories ISBN 3-905594-38-2 Ecoinvent Data v2.2, 2010 Swiss Centre for Life Cycle Inventories, Switzerland www.ecoinvent.org European Commission (2013). Annex II: Product Environmental Footprint (PEF) Guide to the Commission Recommendation on the use of common methods to measure and communicate the life cycle environmental performance of products and organisations (2013/179/EU) European Commission (2014). Guidance for the implementation of the EU PEF during the EF pilot phase - Version 4.0. Draft document FOOD SCP RT:2013 – ENVIFOOD Protocol, Environmental Assessment of Food and Drink Protocol, European Food Sustainable Consumption and Productino Round Table (SCP RT), Working Group 1, Brussels, Belgium ILCD (2010), International Reference Life Cycle Data System (ILCD) handbook: General guide for Life Cycle Assessment – Detailed guidance, European Commission, Joint Research Centre, Institute for Environment and Sustainability ILCD (2011), International Reference Life Cycle Data System (ILCD) handbook: Recommendations for Life Cycle Impact Assessment in the European context - based on existing environmental impact assessment models and factors, European Commission, Joint Research Centre, Institute for Environment and Sustainability ISO 14025:2006 – Environmental labels and declarations – Type III Environmental declarations – Principles and procedures ISO 14040:2006 – Environmental management – Life Cycle Assessment – Principles and framework ISO 14044:2006 – Environmental management – Life Cycle Assessment – Requirements and guidelines Koch P. and Salou T.. 2013. AGRIBALYSE®: Rapport Méthodologique – Version 1.0. Ed ADEME. Angers. France. 384 p. LEAP (2014). Environmental performance of animal feeds supply chains - DRAFT FOR PUBLIC REVIEW. LEAP, FAO, Rome, Italy.
References
30
PAS 2050 (2008), Specification for the assessment of the life cycle greenhouse gas emissions of goods and services. WBCSD – WRI, World Business Council for Sustainable Development – World Resources Institute, The Greenhouse Gas Protocol: A corporate Accounting and Reporting Standard, March 2004.