A Diet High in Resistant Starch Modulates Microbiota ...
10
The Journal of Nutrition Genomics, Proteomics, and Metabolomics A Diet High in Resistant Starch Modulates Microbiota Composition, SCFA Concentrations, and Gene Expression in Pig Intestine 1–3 Danie ¨lle Haenen, 4,5* Jing Zhang, 4,6 Carol Souza da Silva, 7,8 Guido Bosch, 8 Ingrid M. van der Meer, 9 Jeroen van Arkel, 9 Joost J. G. C. van den Borne, 8 Odette P´ erez Guti´ errez, 6 Hauke Smidt, 6 Bas Kemp, 7 Michael Mu ¨ ller, 5,10 and Guido J. E. J. Hooiveld 5,10* 5 Nutrition, Metabolism, and Genomics Group, Division of Human Nutrition, 6 Laboratory of Microbiology, 7 Adaptation Physiology Group, and 8 Animal Nutrition Group, Wageningen University, Wageningen, The Netherlands; 9 Plant Research International, Wageningen, The Netherlands; and 10 Netherlands Nutrigenomics Center, Wageningen, The Netherlands Abstract Resistant starch (RS) is highly fermentable by microbiota in the colon, resulting in the production of SCFAs. RS is thought to mediate a large proportion of its health benefits, including increased satiety, through the actions of SCFAs. The aim of this study was to investigate the effects of a diet high in RS on luminal microbiota composition, luminal SCFA concentrations, and the expression of host genes involved in SCFA uptake, SCFA signaling, and satiety regulation in mucosal tissue obtained from small intestine, cecum, and colon. Twenty adult female pigs were either assigned to a digestible starch (DS) diet or a diet high in RS (34%) for a period of 2 wk. After the intervention, luminal content and mucosal scrapings were obtained for detailed molecular analysis. RS was completely degraded in the cecum. In both the cecum and colon, differences in microbiota composition were observed between DS- and RS-fed pigs. In the colon these included the stimulation of the healthy gut-associated butyrate-producing Faecalibacterium prausnitzii, whereas potentially pathogenic members of the Gammaproteobacteria, including Escherichia coli and Pseudomonas spp., were reduced in relative abundance. Cecal and colonic SCFA concentrations were significantly greater in RS-fed pigs, and cecal gene expression of monocarboxylate transporter 1 (SLC16A1) and glucagon (GCG) was induced by RS. In conclusion, our data show that RS modulates microbiota composition, SCFA concentrations, and host gene expression in pig intestine. Combined, our data provide an enhanced understanding of the interaction between diet, microbiota, and host. J. Nutr. 143: 274–283, 2013. Introduction Obesity and related disorders, such as cardiovascular diseases and type 2 diabetes, have become major public health issues (1,2). Various lifestyle factors, of which diet is a major one, play an important role in the development of these disorders (3,4). A large amount of research has reported an inverse relation- ship between fiber consumption and the risk of obesity and diabetes (5). Moreover, consumption of dietary fiber prevents the accumulation of fat mass (6,7), increases insulin sensitivity (8,9), and can enhance feelings of satiety (10). Resistant starch (RS) 11 is a type of dietary fiber that includes all starch and starch degradation products that are not absorbed in the small intestine of healthy humans (11). It is known to be fermented to a large extent by microbiota in the colon, resulting in the production of SCFAs (12,13). These SCFAs can diffuse across the epithelial cell membrane, but SCFA absorption by the enterocytes is also mediated by the monocarboxylate transporter 1 (SLC16A1, also known as MCT1) and sodium- coupled monocarboxylate transporter 1 (SLC5A8 or SMCT1) (14). Enhanced SCFA production provides an important link between dietary fiber consumption and health benefits. First, SCFAs lower the pH in the colon, which can prevent the overgrowth of pathogenic bacteria (15). Acetate, propionate, and 1 Partially supported by the Wageningen University program on Satiety and Satisfaction. The resistant starch used in this study was donated by CargillÕs R&D Center Europe (Vilvoorde, Belgium). 2 Author disclosures: D. Haenen, C. Souza da Silva, G. Bosch, I. M. van der Meer, J. van Arkel, J. J. G. C. van den Borne, B. Kemp, M. Mu ¨ ller, and G. J. E. J. Hooiveld, no conflicts of interest. The work of J. Zhang, O. P ´ erez Guti ´ errez, and H. Smidt was partially funded by Cargill. Cargill had no role in the study design, data collection and analysis, decision to publish, or preparation of the manuscript. 3 Supplemental Tables 1–3 and Supplemental Figures 1–3 are available from the ‘‘Online Supporting Material’’ link in the online posting of the article and from the same link in the online table of contents at http://jn.nutrition.org. 4 These authors contributed equally. * To whom correspondence should be addressed. E-mail: danielle.haenen@wur. nl or [email protected]. 11 Abbreviations used: DGGE, denaturing gradient gel electrophoresis; DS, digestible starch; FFAR, free fatty acid receptor; GLP-1, glucagon-like peptide 1; PITChip, Pig Intestinal Tract Chip; PYY, peptide YY; RDA, redundancy analysis; RS, resistant starch; RS2, type 2 resistant starch; RS3, type 3 resistant starch. ã 2013 American Society for Nutrition. 274 Manuscript received September 14, 2012. Initial review completed October 17, 2012. Revision accepted December 16, 2012. First published online January 16, 2013; doi:10.3945/jn.112.169672. Downloaded from https://academic.oup.com/jn/article/143/3/274/4637646 by guest on 27 May 2022
-
Upload
khangminh22 -
Category
Documents
-
view
0 -
download
0
Transcript of A Diet High in Resistant Starch Modulates Microbiota ...

The Journal of Nutrition
Genomics, Proteomics, and Metabolomics
A Diet High in Resistant Starch ModulatesMicrobiota Composition, SCFA Concentrations,and Gene Expression in Pig Intestine1–3
Danielle Haenen,4,5* Jing Zhang,4,6 Carol Souza da Silva,7,8 Guido Bosch,8 Ingrid M. van der Meer,9
Jeroen van Arkel,9 Joost J. G. C. van den Borne,8 Odette Perez Gutierrez,6 Hauke Smidt,6 Bas Kemp,7
Michael Muller,5,10 and Guido J. E. J. Hooiveld5,10*
5Nutrition, Metabolism, and Genomics Group, Division of Human Nutrition, 6Laboratory of Microbiology, 7Adaptation Physiology
Group, and 8Animal Nutrition Group, Wageningen University, Wageningen, The Netherlands; 9Plant Research International,
Wageningen, The Netherlands; and 10Netherlands Nutrigenomics Center, Wageningen, The Netherlands
Abstract
Resistant starch (RS) is highly fermentable by microbiota in the colon, resulting in the production of SCFAs. RS is thought
to mediate a large proportion of its health benefits, including increased satiety, through the actions of SCFAs. The aim of
this study was to investigate the effects of a diet high in RS on luminal microbiota composition, luminal SCFA
concentrations, and the expression of host genes involved in SCFA uptake, SCFA signaling, and satiety regulation in
mucosal tissue obtained from small intestine, cecum, and colon. Twenty adult female pigs were either assigned to a
digestible starch (DS) diet or a diet high in RS (34%) for a period of 2 wk. After the intervention, luminal content and
mucosal scrapings were obtained for detailed molecular analysis. RS was completely degraded in the cecum. In both the
cecum and colon, differences in microbiota composition were observed between DS- and RS-fed pigs. In the colon these
included the stimulation of the healthy gut-associated butyrate-producing Faecalibacterium prausnitzii, whereas potentially
pathogenic members of the Gammaproteobacteria, including Escherichia coli and Pseudomonas spp., were reduced in
relative abundance. Cecal and colonic SCFA concentrations were significantly greater in RS-fed pigs, and cecal gene
expression of monocarboxylate transporter 1 (SLC16A1) and glucagon (GCG) was induced by RS. In conclusion, our data
show that RS modulates microbiota composition, SCFA concentrations, and host gene expression in pig intestine.
Combined, our data provide an enhanced understanding of the interaction between diet, microbiota, and host. J. Nutr.
143: 274–283, 2013.
Introduction
Obesity and related disorders, such as cardiovascular diseasesand type 2 diabetes, have become major public health issues(1,2). Various lifestyle factors, of which diet is a major one, playan important role in the development of these disorders (3,4).A large amount of research has reported an inverse relation-ship between fiber consumption and the risk of obesity anddiabetes (5). Moreover, consumption of dietary fiber prevents
the accumulation of fat mass (6,7), increases insulin sensitivity(8,9), and can enhance feelings of satiety (10).
Resistant starch (RS)11 is a type of dietary fiber that includesall starch and starch degradation products that are not absorbedin the small intestine of healthy humans (11). It is known to befermented to a large extent by microbiota in the colon, resultingin the production of SCFAs (12,13). These SCFAs can diffuseacross the epithelial cell membrane, but SCFA absorption bythe enterocytes is also mediated by the monocarboxylatetransporter 1 (SLC16A1, also known as MCT1) and sodium-coupledmonocarboxylate transporter 1 (SLC5A8 or SMCT1) (14).
Enhanced SCFA production provides an important linkbetween dietary fiber consumption and health benefits. First,SCFAs lower the pH in the colon, which can prevent theovergrowth of pathogenic bacteria (15). Acetate, propionate, and
1 Partially supported by the Wageningen University program on Satiety and
Satisfaction. The resistant starch used in this study was donated by Cargill�s R&DCenter Europe (Vilvoorde, Belgium).2 Author disclosures: D. Haenen, C. Souza da Silva, G. Bosch, I. M. van der Meer,
J. van Arkel, J. J. G. C. van den Borne, B. Kemp, M. Muller, and G. J. E. J.
Hooiveld, no conflicts of interest. The work of J. Zhang, O. Perez Gutierrez, and
H. Smidt was partially funded by Cargill. Cargill had no role in the study design,
data collection and analysis, decision to publish, or preparation of the manuscript.3 Supplemental Tables 1–3 and Supplemental Figures 1–3 are available from the
‘‘Online Supporting Material’’ link in the online posting of the article and from the
same link in the online table of contents at http://jn.nutrition.org.4 These authors contributed equally.
* To whom correspondence should be addressed. E-mail: danielle.haenen@wur.
nl or [email protected].
11 Abbreviations used: DGGE, denaturing gradient gel electrophoresis; DS,
digestible starch; FFAR, free fatty acid receptor; GLP-1, glucagon-like peptide 1;
PITChip, Pig Intestinal Tract Chip; PYY, peptide YY; RDA, redundancy analysis;
RS, resistant starch; RS2, type 2 resistant starch; RS3, type 3 resistant starch.
ã 2013 American Society for Nutrition.
274 Manuscript received September 14, 2012. Initial review completed October 17, 2012. Revision accepted December 16, 2012.
First published online January 16, 2013; doi:10.3945/jn.112.169672.
Dow
nloaded from https://academ
ic.oup.com/jn/article/143/3/274/4637646 by guest on 27 M
ay 2022
butyrate are the major SCFAs produced in the colon, of whichbutyrate is thought to be most beneficial for health. Among thehealth benefits observed with butyrate are the prevention andinhibition of colon carcinogenesis, protection against mucosaloxidative stress, and strengthening of the colonic defense barrier;butyrate also has antiinflammatory properties (16). Propionate hasthe potential to reduce cholesterol concentrations in blood (17).
In addition to these health benefits, SCFAs are thought to beinvolved in the increase in satiety observed with fiber con-sumption (18). Studies in rodents have provided evidence thatfermentation of RS is an important mechanism for increasedendogenous secretion of the gut hormones glucagon-like peptide1 (GLP-1) and peptide YY (PYY) (6,19–21). GLP-1 and PYYare satiety-stimulating hormones that are released in responseto nutrient intake, mainly in the ileum and colon. SCFAs areagonists for free fatty acid receptor 2 and 3 (FFAR2 and FFAR3,respectively), 2 G protein–coupled receptors present in the gastro-intestinal tract. Both of these G protein–coupled receptors areexpressed in enteroendocrine cells in the gut epithelium. It hasbeen proposed that the activation of these receptors triggersthe production and release of GLP-1 and PYY by enteroendocrineL-cells (22,23).
In the experiments described in this article, we investigatedthe effects of a diet high in RS on luminal microbiota composition,luminal SCFA concentrations, and the expression of host genesinvolved in SCFA uptake, SCFA signaling, and satiety regulationin mucosal tissue obtained from small intestine, cecum, andcolon. Adult pigs were used as a model for humans because theanatomy and physiology of the gastrointestinal tract of pigs andthe pig genome are similar to those of humans (24,25). Becausewe recently reported that a diet high in RS decreases feedingmotivation in pigs (26), special attention was given to selectedgenes involved in SCFA sensing and regulation of satiety.
Materials and Methods
Experimental design, pigs and housing. Two independent studies
were performed. First, a pilot experiment was carried out to ascertain
whether the gene expression profile along the intestine of pigs is similar
to the sites of expression in humans and rodents. Three multiparousfemale pigs with a mean (6 SEM) body weight of 273 6 1.15 kg were
included in this study.
The main study had a parallel design. Two groups of 10 female pigs(PIC Benelux B.V.), aged 22 mo, with an initial body weight of 268 63.85 kg were assigned to 1 of 2 treatments. Treatments differed with
regard to the type of starch in the diet: digestible starch (DS) or RS.
Siblings were equally distributed between the 2 groups. Pigs wereindividually fed and housed in pairs that received the same diet. The area
of each pen was 11 m2 and contained 2 drinking nipples and 2 feeding
troughs. Artificial lights were on from 0630 until 2200 and dimmed
during the dark period. The animal protocol was approved by theAnimal Care and Use Committee of Wageningen University. The same
pigs were used previously for feeding motivation studies (26).
Diets and feeding. The 2 experimental diets used in the main study
were identical except for type of starch. The main source of starch in the
DS diet was pregelatinized potato starch (Paselli WA4; AVEBE), which
was replaced on a dry matter basis in the RS diet by retrograded tapiocastarch (Actistar; Cargill). According to the supplier, this starch was
$50% resistant to digestion in the small intestine. On the basis of
physical and chemical characteristics, the RS used in this study can be
classified as RS type 3 (RS3) (11). Diets were isoenergetic on a grossenergy basis. The detailed composition of the experimental diets is
presented in Supplemental Table 1. Each diet was given to 10 pigs in
pelleted form at 0700 and 1700 for a period of 14 d. The daily feed
allowance was 1.13 times the energy requirements for maintenance [net
energy = 293 kJ/(kg0.75 � d)], and pigs were allowed 1 h to consume the
meal. All pigs had free access to water throughout the entire day.
Blood collection. Blood was collected 5 h postprandially on 2 separate
days. Blood sampling was performed before the start of the treatmentperiod when all pigs had consumed the DS diet for 2 d and at the end of
the dietary intervention when pigs had been fed the DS or RS diet for
12 d. Blood was drawn from the jugular vein and collected in a BD
Vacutainer EDTA tube with protease (Complete, EDTA-free; Roche) andDipeptidyl peptidase-4 (Millipore) inhibitors. Tubes were centrifuged for
10 min at 1300 g at 4�C immediately after blood collection. Plasma was
separated into aliquots and stored at 280�C.
Collection of digesta and tissue. Digesta and tissue samples were
collected 5 h after the morning meal. This time point was selected on thebasis of a previous study in which an increase in SCFA concentration was
observed 4–5 h after feeding (27). Pigs were stunned and exsanguinated,
after which the abdominal cavity was opened. The gastrointestinal tract
from stomach to anus was removed from the cavity, and the length of thesmall intestine and colon was determined. The small intestine was
divided into 10 parts of equal length, the cecum was divided into 2 parts,
and the colon into 4 parts. The luminal content was collected from the 4most distal parts of the small intestine (segments 7 to 10) and from all
cecal and colonic parts. For subsequent analysis of SCFA concentrations,
part of the contents was collected in tubes with 1 mL of H3PO4, after
which the samples were thoroughly mixed and stored at 220�C.Luminal content was also stored in empty tubes at 220�C to determine
dry matter and degradation of RS. The remaining amount of digesta was
collected in 1.5 mL Eppendorf tubes to determine microbiota compo-
sition. These tubes were immediately frozen in liquid nitrogen and storedat 280�C until further analyses. In addition, a small piece from the
middle of each intestinal segment was excised and rinsed in PBS.
Epithelial cells were collected from these tissues by scraping the mucosallining with a glass slide. These samples were immediately snap-frozen in
liquid nitrogen and then stored at280�C for subsequent RNA isolation.
Analysis of RS in luminal samples. RS was analyzed according to
methods used by Goni et al. (28), adapted for intestinal samples,
including extra washing steps and the total volume set at 35–40 mL.Impurities were removed by deionization of the sample by using equal
amounts of Q-sepharose and S-sepharose beads equilibrated with phos-
phate buffer, 20 mmol/L, at pH 7. An aliquot (100 mL) of the sample
obtained in step 9 of the procedure was combined with an equal amountof the ion exchange mix and thoroughly mixed for 5 min at room
temperature. For the glucose assay, 100 mL supernatant obtained after
5 min of centrifugation at 14,000 g was used. Glucose was determined
in the samples by using the Glucose Assay Kit from Sigma-Aldrich(product no. GAGO20). The amount of RS in the sample was calculated
by using the method as described (28).
Microbiota analysis. Microbial DNA was extracted from 250 mg of
intestinal contents by using a fecal DNA extraction protocol (29).Denaturing gradient gel electrophoresis (DGGE) analysis was performed
for a preliminary scanning of the microbial profile. Briefly, universal
primers S-D-Bact-0968-a-S-GC and S-D-Bact-1401-a-A-17 (30) were
used to amplify the V6 to V8 variable regions of the bacterial 16S rRNAgene. The V6–V8 PCR amplicons were separated by DGGE according to
the specifications of Muyzer et al. (31) by using a DCode system (Bio-
Rad Laboratories). Gel images were digitally normalized by comparison
with an external standard pattern by using Bionumerics software packageversion 4.5 (Applied MathS). Observed bands were classified across all
samples, and band class information, including relative band intensity,
was used for multivariate analysis.After the preliminary scanning of microbiota composition by DGGE
analysis, the luminal contents from the first part of cecum (from 9
DS-treated and 7 RS-treated pigs) and colon (from 7 DS-treated and 8
RS-treated pigs) were selected for further analysis by using the PigIntestinal Tract Chip (PITChip). The PITChip is a phylogenetic micro-
array with >2900 oligonucleotides based on 16S rRNA gene sequences
of 627 porcine intestinal microbial species–level phylotypes (32). The
Effects of resistant starch on pig intestine 275
Dow
nloaded from https://academ
ic.oup.com/jn/article/143/3/274/4637646 by guest on 27 M
ay 2022

PITChip provides a very deep and reproducible phylogenetic analysis
that has been compared with deep pyrosequencing of 16S rRNA gene
fragments (32–34) and next-generation parallel sequencing of intesti-nal metagenomes (35), indicating comparable resolution and a higher
sensitivity of the chip-based analysis.
The protocol for hybridization and analysis of the generated data was
performed essentially as previously described for the Human IntestinalTract Chip (36). The bacterial 16S rRNA gene was amplified by using the
primers T7prom-Bact-27-for and Uni-1492-rev (36). The PCR products
were transcribed into RNA and the purified resultant RNAwas coupled
with CyDye (GE Healthcare Life Sciences) before fragmentation andhybridization to the array. Microarray images were processed using
Agilent�s Feature Extraction Software, version 9.1 (Agilent Technolo-
gies). Data normalization and processing were performed as described(32,36).
Dry matter and SCFA measurement. Dry matter was determined by
drying the intestinal content to a constant weight at 103�C (ISO standard
6496; International Organization for Standardization, 1999).
The digesta samples collected in tubes with H3PO4 were thawed,mixed on a vortex, and centrifuged at 20,000 g for 5 min. The supernatant
was collected and diluted 1:1 with a solution containing isocaproic acid.
SCFA concentrations were determined in the effluent by gas chroma-
tography (Fisons HRGC Mega 2; CE Instruments) at 190�C by using aglass column fitted with Chromosorb 101 (Supelco). The carrier gas was
N2 saturated with methanoic acid, and isocaproic acid was used as an
internal standard.
RNA isolation and quality control. Total RNA was isolated from
intestinal scrapings by using TRIzol reagent (Life Technologies) accord-ing to the manufacturer�s instructions. Concentrations and purity of RNA
samples were determined on a NanoDrop ND-1000 spectrophotometer
(Isogen Life Science). RNA quality was verified with an Agilent 2100Bioanalyzer (Agilent Technologies) by using 6000 Nano Chips (Agilent
Technologies) according to the manufacturer�s instructions.
qRT-PCR. Single-stranded cDNA was synthesized from 1 mg of total
RNA by using the First Strand cDNA Synthesis Kit (Fermentas Life
Sciences) according to the supplier�s protocol. qRT-PCR was performedon a CFX384 Real-Time PCR Detection System (Bio-Rad) by using
SensiMix SYBR No-ROX (Bioline). Primers were designed in Beacon
Designer 7.6 by using sequences obtained from the ENSEMBL pig
database. Specificity of the amplification was verified by melt curveanalysis and evaluation of efficiency of PCR amplification. The primer
sequences are listed in Supplemental Table 2. Samples were analyzed in
duplicate and mRNA expression of all genes reported was standardized
to RPLP0 gene expression.
Plasma measurements. All plasma measurements were performed induplicate. Glucose was measured by using an enzymatic glucose assay
(Glucose PAP SL; Elitech Group). TG and cholesterol concentrations
were determined by using the enzymatic methods (Triglycerides Liqui-color, Cholesterol Liquicolor; INstruchemie). Insulin and PYY concen-
trations were measured by EIA [insulin: (porcine/canine) EIA; ALPCO
Diagnostics; peptide YY (3–36): (rat, mouse, porcine, canine) EIA kit;
Phoenix Pharmaceuticals]. GLP-1 was analyzed with ELISA [Glucagon-like Peptide-1 (active) ELISA Kit; Millipore].
Statistical methods. Results are expressed as mean 6 SEM. The
significance of differences between the 2 treatment groups of thevariables determined at the end of the experimental period was evaluated
by Student�s t test. ANOVAwas used to test for differences in RS content
in the small intestine, cecum, and colon. Significance of differences ofplasma variables, which were measured before and after the experimen-
tal period, was determined by linear mixed-model analysis treating pig as
a random effect. Analyses were performed in GraphPad Prism, version
5.04, and IBM SPSS Statistics, version19. Differences were consideredsignificant if P < 0.05.
Multivariate analysis was applied for DGGE and PITChip data
interpretation. To relate changes in total bacterial community compo-
sition to environmental variables, redundancy analysis (RDA) was used
as implemented in the CANOCO 4.5 software package (Biometris).
RDA is the canonic form of principal components analysis and is amultivariate linear regressionmethod in which several response variables
are related to the same set of environmental variables and in which the
estimated matrix of regression coefficients is of reduced rank (37). The
relative abundance of bands on DGGE gels and signal intensities for 144genus-level phylogenetic groups of PITChip were used as responsive
variables. Treatment class (DS or RS), SCFA concentration, and gene
expression values of GCG and SLC16A1 were introduced as environ-
mental (explanatory) variables. The latter were included because thesevariables were significantly different between the 2 treatment groups in
the cecum and colon (see Results). RDA was performed by focusing on
intersamples correlation, and the Monte Carlo permutation test wasapplied to evaluate whether treatment class, SCFA concentration, and
gene expression had significant influence on the microbial composition
(38,39). Because the experiment had a randomized design, we used the
unrestricted permutation option that yields completely random permu-tations. Treatment class or other environmental variables were consid-
ered to significantly affect microbial composition with P values <0.05.
Diagrams were plotted as biplots for DGGE data and as triplots for
PITChip data by using CanoDraw (Biometris).Univariate testing of differences for individual microbial groups was
processed by using a Mann-Whitney U signed-rank test. P values were
corrected formultiple testing by using Benjamini-Hochberg�s approach (40).
Results
Longitudinal distribution of gene expression. In the pilotexperiment, the expression of several genes involved in luminaluptake and sensing of nutrients and metabolites was measuredin mucosal scrapings of 3 female pigs (Supplemental Fig. 1). Asexpected, the expression of apical sodium-dependent bile salttransporter (SLC10A2) was restricted to terminal ileum (41).mRNA levels of fatty acid transport protein 4 (SLC27A4), liver-type fatty acid binding protein (FABP1), and intestine-type fattyacid binding protein (FABP2) were highest in the proximal jejunumand resembled the pattern observed in mice (42). Furthermore,the gene expression pattern of glucagon (GCG; in the intestinethe precursor for GLP-1 and GLP-2) and PYY (PYY) in the smallintestine closely resembled the peptide concentrations found inpig intestine (43). Taken together, these data show the validity ofour gene expression measurements in the gastrointestinal tractof pigs. Moreover, we found that the distal part of the smallintestine, the cecum, and the colon showed the highest expres-sion of genes involved in SCFAuptake (SLC16A1, SLC5A8), SCFAsensing (FFAR2, FFAR3), and satiety (GCG, PYY). Therefore,these segments were sampled in the main experiment describedin this article.
Anthropometric variables. Body weight and fat depth weremeasured in all pigs at the end of the experimental period. Thelengths of the small intestine and colonwere determined at section.No significant differences were found between the treatmentgroups with respect to body weight, fat depth, and the lengthof the small intestine and colon (Supplemental Table 3).
Degradation of RS. The amount of RS was measured in theintestinal content collected at section (5 h postprandially). InRS-fed pigs, 20–40 times more RS was found in the smallintestine compared with that in DS-fed pigs (Fig. 1). Further-more, in the cecum of RS-fed pigs, the concentration of RS wassignificantly lower compared with that in the small intestine,whereas in the colon, RS concentrations were significantlylower than in the cecum and were comparable to backgroundconcentrations, i.e., those measured in DS-fed pigs (Fig. 1). From
276 Haenen et al.
Dow
nloaded from https://academ
ic.oup.com/jn/article/143/3/274/4637646 by guest on 27 M
ay 2022

these observations we conclude that RS was fully degraded in thececum.
Microbiota analysis. Multivariate analysis of the DGGE datarevealed a significant effect of RS treatment on the compositionof the microbiota in the cecum (P = 0.016) and colon (P = 0.002),whereas no significant effect of treatment was found in the smallintestine (P = 0.18) (Supplemental Fig. 2).
Because treatment effects were observed in the cecum andcolon, the luminal contents of the proximal part of cecum (P1cecum) and colon (P1 colon) were selected for further analysis byusing the superior PITChip technique. RDA of the PITChip datashowed a visual treatment effect on the microbiota in bothcecum and colon. Cecal samples of RS-fed pigs were separatedfrom those of DS-fed pigs except for pig 24 (Fig. 2A). Thetreatment-centered separation was more obvious for the colonicsamples (Fig. 2B). Moreover, Monte Carlo Permutation testingshowed that, of the environmental variables, only luminalpropionate concentration significantly (P = 0.018) contributedto explaining the observed variation in microbiota compositionin the colon.
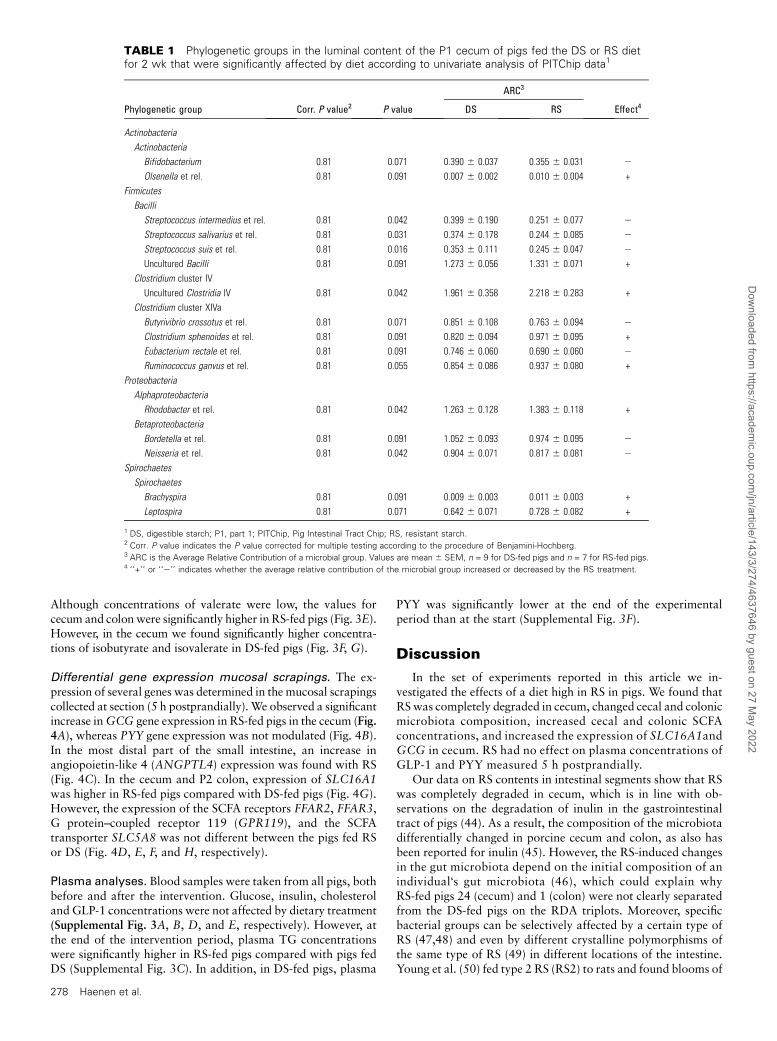
To determine which microbial groups were changed by RStreatment, univariate analysis was used (Tables 1 and 2). In thececum, we found that microbial groups of Actinobacteria,Bacilli, Clostridium cluster IV and XIVa, Alphaproteobacteria,Betaproteobacteria, and Spirochaetes changed in relative abun-dance, albeit at corrected P values of 0.81 (Table 1). Morespecifically, Streptococcus intermedius–like group, Streptococ-cus salivarius–like group, Streptococcus suis–like group, andNeisseria-like group decreased by the RS treatment, whereas theuncultured Clostridia cluster IV and Rhodobacter-like microor-ganisms increased in relative abundance (Table 1).
In the colon, 30 microbial groups were significantly changedby the RS treatment (corrected P value <0.05), whereas a trendtoward significance was observed for 13 additional microbialgroups (corrected P value between 0.05 and 0.07) (Table 2).Members of the Actinobacteria, Weissella-like group, Clostrid-ium cluster IV, IX, XV, XVI, and XVII,Mollicutes, Fusobacteria,
and Betaproteobacteria increased in relative abundance in pigsfed the RS diet. In contrast, groups within the classes of Bacilli(i.e., Allofustis, Lactobacillus acidophilus–like group, Lactoba-cillus plantarum–like group), Clostridium cluster XI and XIVa,Deltaproteobacteria, andGammaproteobacteria decreased uponRS consumption (Table 2).
Despite the change in relative abundance of several microbialgroups, treatment with RS for 14 d did not significantly alter themicrobial diversity in cecum and colon as indicated by Shannon�sand Simpson�s indices for diversity (data not shown).
SCFA concentrations. SCFA concentrations were measured inthe intestinal contents collected at section (5 h postprandially).Total SCFA concentration was highest in the cecum and graduallydecreased along the colon (Fig. 3A). In the cecum and colon,SCFA concentrations were significantly higher in RS-fed pigscompared with DS-fed pigs (Fig. 3A). The most abundant SCFAsin the intestine were acetate, propionate, and butyrate. Theincrease in total SCFA concentration on RS could mainly beattributed to higher concentrations of acetate and propionate(Fig. 3B, C). Butyrate concentration was significantly higheronly in RS-treated pigs in the colon part 2 (P2 colon) (Fig. 3D).
FIGURE 1 RS concentrations in luminal content of pigs fed the DS
or RS diet for 2 wk. Values are mean 6 SEM, n = 1–4 pigs per
treatment. Different letters indicate that segments differ signifi-
cantly from each other, P , 0.01 (a . b . c). From left to right, bars
represent areas of the gastrointestinal tract from proximal to distal.
The small intestine was divided into 10 equal parts; parts 7–10 refer to
the 4 most distal segments of the small intestine, whereas the cecum
and colon were divided into 2 respectively 4 segments of equal length.
White horizontal bars indicate the intestinal parts that were combined
for statistical analysis to determine differences between anatomic
locations. C, colon; Ce, cecum; DS, digestible starch; RS, resistant
starch; SI, small intestine.
FIGURE 2 Triplots of RDA results, representing the principal
components analysis of the microbiota composition as measured by
the mean hybridization signals for 144 genus-level phylogenetic groups
in the luminal content of cecum (A) and colon (B) of pigs fed the DS or
RS diet for 2 wk. Samples are grouped by treatment class. Each
symbol represents 1 pig, and numbers represent pig identifiers. The
average of the nominal environmental variables DS and RS are rep-
resented by triangles. GCG (expression), SLC16A1 (expression), acetate,
propionate, and butyrate concentrations are also included as environ-
mental variables. For clarity, the microbial groups that contributed to
the first 2 principal components used as explanatory axes were omitted
in these triplots. Combined, both axes explain 30.9% of the total
variance in the data set for (A) and 41.6% for (B). DS, digestible starch;
RS, resistant starch.
Effects of resistant starch on pig intestine 277
Dow
nloaded from https://academ
ic.oup.com/jn/article/143/3/274/4637646 by guest on 27 M
ay 2022
Although concentrations of valerate were low, the values forcecum and colonwere significantly higher in RS-fed pigs (Fig. 3E).However, in the cecum we found significantly higher concentra-tions of isobutyrate and isovalerate in DS-fed pigs (Fig. 3F, G).
Differential gene expression mucosal scrapings. The ex-pression of several genes was determined in the mucosal scrapingscollected at section (5 h postprandially). We observed a significantincrease inGCG gene expression in RS-fed pigs in the cecum (Fig.4A), whereas PYY gene expression was not modulated (Fig. 4B).In the most distal part of the small intestine, an increase inangiopoietin-like 4 (ANGPTL4) expression was found with RS(Fig. 4C). In the cecum and P2 colon, expression of SLC16A1was higher in RS-fed pigs compared with DS-fed pigs (Fig. 4G).However, the expression of the SCFA receptors FFAR2, FFAR3,G protein–coupled receptor 119 (GPR119), and the SCFAtransporter SLC5A8 was not different between the pigs fed RSor DS (Fig. 4D, E, F, and H, respectively).
Plasma analyses. Blood samples were taken from all pigs, bothbefore and after the intervention. Glucose, insulin, cholesteroland GLP-1 concentrations were not affected by dietary treatment(Supplemental Fig. 3A, B, D, and E, respectively). However, atthe end of the intervention period, plasma TG concentrationswere significantly higher in RS-fed pigs compared with pigs fedDS (Supplemental Fig. 3C). In addition, in DS-fed pigs, plasma
PYY was significantly lower at the end of the experimentalperiod than at the start (Supplemental Fig. 3F).
Discussion
In the set of experiments reported in this article we in-vestigated the effects of a diet high in RS in pigs. We found thatRSwas completely degraded in cecum, changed cecal and colonicmicrobiota composition, increased cecal and colonic SCFAconcentrations, and increased the expression of SLC16A1andGCG in cecum. RS had no effect on plasma concentrations ofGLP-1 and PYY measured 5 h postprandially.
Our data on RS contents in intestinal segments show that RSwas completely degraded in cecum, which is in line with ob-servations on the degradation of inulin in the gastrointestinaltract of pigs (44). As a result, the composition of the microbiotadifferentially changed in porcine cecum and colon, as also hasbeen reported for inulin (45). However, the RS-induced changesin the gut microbiota depend on the initial composition of anindividual�s gut microbiota (46), which could explain whyRS-fed pigs 24 (cecum) and 1 (colon) were not clearly separatedfrom the DS-fed pigs on the RDA triplots. Moreover, specificbacterial groups can be selectively affected by a certain type ofRS (47,48) and even by different crystalline polymorphisms ofthe same type of RS (49) in different locations of the intestine.Young et al. (50) fed type 2 RS (RS2) to rats and found blooms of
TABLE 1 Phylogenetic groups in the luminal content of the P1 cecum of pigs fed the DS or RS dietfor 2 wk that were significantly affected by diet according to univariate analysis of PITChip data1
ARC3
Phylogenetic group Corr. P value2 P value DS RS Effect4
Actinobacteria
Actinobacteria
Bifidobacterium 0.81 0.071 0.390 6 0.037 0.355 6 0.031 2
Olsenella et rel. 0.81 0.091 0.007 6 0.002 0.010 6 0.004 +
Firmicutes
Bacilli
Streptococcus intermedius et rel. 0.81 0.042 0.399 6 0.190 0.251 6 0.077 2
Streptococcus salivarius et rel. 0.81 0.031 0.374 6 0.178 0.244 6 0.085 2
Streptococcus suis et rel. 0.81 0.016 0.353 6 0.111 0.245 6 0.047 2
Uncultured Bacilli 0.81 0.091 1.273 6 0.056 1.331 6 0.071 +
Clostridium cluster IV
Uncultured Clostridia IV 0.81 0.042 1.961 6 0.358 2.218 6 0.283 +
Clostridium cluster XIVa
Butyrivibrio crossotus et rel. 0.81 0.071 0.851 6 0.108 0.763 6 0.094 2
Clostridium sphenoides et rel. 0.81 0.091 0.820 6 0.094 0.971 6 0.095 +
Eubacterium rectale et rel. 0.81 0.091 0.746 6 0.060 0.690 6 0.060 2
Ruminococcus ganvus et rel. 0.81 0.055 0.854 6 0.086 0.937 6 0.080 +
Proteobacteria
Alphaproteobacteria
Rhodobacter et rel. 0.81 0.042 1.263 6 0.128 1.383 6 0.118 +
Betaproteobacteria
Bordetella et rel. 0.81 0.091 1.052 6 0.093 0.974 6 0.095 2
Neisseria et rel. 0.81 0.042 0.904 6 0.071 0.817 6 0.081 2
Spirochaetes
Spirochaetes
Brachyspira 0.81 0.091 0.009 6 0.003 0.011 6 0.003 +
Leptospira 0.81 0.071 0.642 6 0.071 0.728 6 0.082 +
1 DS, digestible starch; P1, part 1; PITChip, Pig Intestinal Tract Chip; RS, resistant starch.2 Corr. P value indicates the P value corrected for multiple testing according to the procedure of Benjamini-Hochberg.3 ARC is the Average Relative Contribution of a microbial group. Values are mean 6 SEM, n = 9 for DS-fed pigs and n = 7 for RS-fed pigs.4 ‘‘+’’ or ‘‘2’’ indicates whether the average relative contribution of the microbial group increased or decreased by the RS treatment.
278 Haenen et al.
Dow
nloaded from https://academ
ic.oup.com/jn/article/143/3/274/4637646 by guest on 27 M
ay 2022
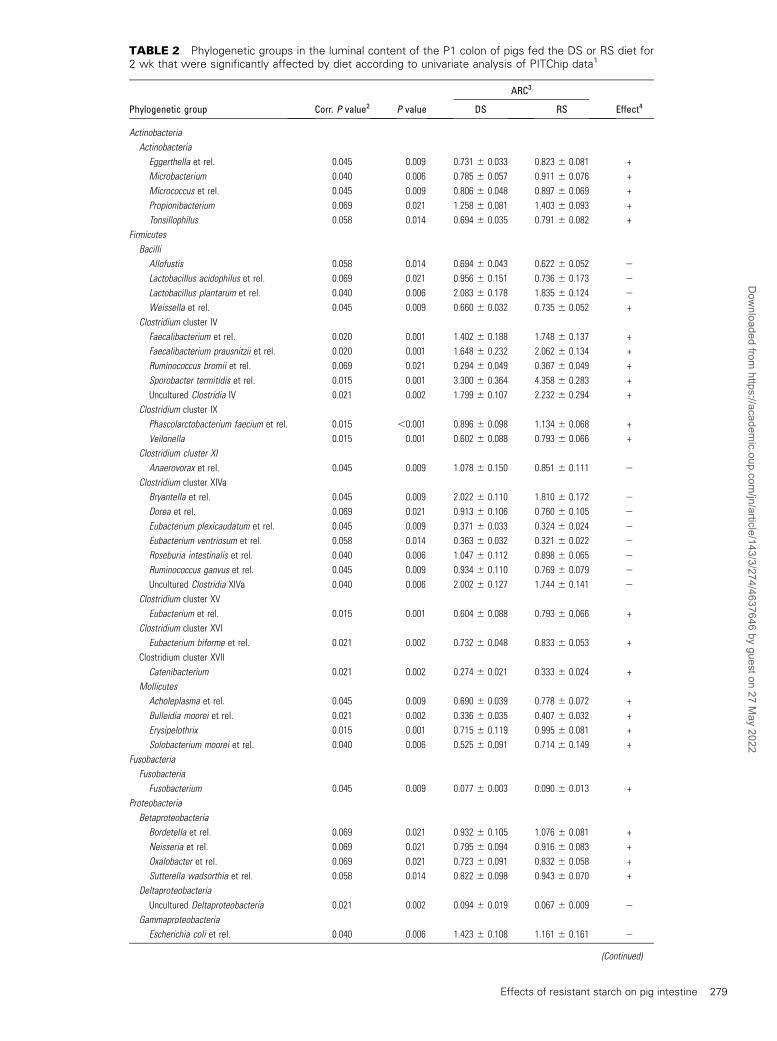
TABLE 2 Phylogenetic groups in the luminal content of the P1 colon of pigs fed the DS or RS diet for2 wk that were significantly affected by diet according to univariate analysis of PITChip data1
ARC3
Phylogenetic group Corr. P value2 P value DS RS Effect4
Actinobacteria
Actinobacteria
Eggerthella et rel. 0.045 0.009 0.731 6 0.033 0.823 6 0.081 +
Microbacterium 0.040 0.006 0.785 6 0.057 0.911 6 0.076 +
Micrococcus et rel. 0.045 0.009 0.806 6 0.048 0.897 6 0.069 +
Propionibacterium 0.069 0.021 1.258 6 0.081 1.403 6 0.093 +
Tonsillophilus 0.058 0.014 0.694 6 0.035 0.791 6 0.082 +
Firmicutes
Bacilli
Allofustis 0.058 0.014 0.694 6 0.043 0.622 6 0.052 2
Lactobacillus acidophilus et rel. 0.069 0.021 0.956 6 0.151 0.736 6 0.173 2
Lactobacillus plantarum et rel. 0.040 0.006 2.083 6 0.178 1.835 6 0.124 2
Weissella et rel. 0.045 0.009 0.660 6 0.032 0.735 6 0.052 +
Clostridium cluster IV
Faecalibacterium et rel. 0.020 0.001 1.402 6 0.188 1.748 6 0.137 +
Faecalibacterium prausnitzii et rel. 0.020 0.001 1.648 6 0.232 2.062 6 0.134 +
Ruminococcus bromii et rel. 0.069 0.021 0.294 6 0.049 0.367 6 0.049 +
Sporobacter termitidis et rel. 0.015 0.001 3.300 6 0.364 4.358 6 0.283 +
Uncultured Clostridia IV 0.021 0.002 1.799 6 0.107 2.232 6 0.294 +
Clostridium cluster IX
Phascolarctobacterium faecium et rel. 0.015 ,0.001 0.896 6 0.098 1.134 6 0.068 +
Veilonella 0.015 0.001 0.602 6 0.088 0.793 6 0.066 +
Clostridium cluster XI
Anaerovorax et rel. 0.045 0.009 1.078 6 0.150 0.851 6 0.111 2
Clostridium cluster XIVa
Bryantella et rel. 0.045 0.009 2.022 6 0.110 1.810 6 0.172 2
Dorea et rel. 0.069 0.021 0.913 6 0.106 0.760 6 0.105 2
Eubacterium plexicaudatum et rel. 0.045 0.009 0.371 6 0.033 0.324 6 0.024 2
Eubacterium ventriosum et rel. 0.058 0.014 0.363 6 0.032 0.321 6 0.022 2
Roseburia intestinalis et rel. 0.040 0.006 1.047 6 0.112 0.898 6 0.065 2
Ruminococcus ganvus et rel. 0.045 0.009 0.934 6 0.110 0.769 6 0.079 2
Uncultured Clostridia XIVa 0.040 0.006 2.002 6 0.127 1.744 6 0.141 2
Clostridium cluster XV
Eubacterium et rel. 0.015 0.001 0.604 6 0.088 0.793 6 0.066 +
Clostridium cluster XVI
Eubacterium biforme et rel. 0.021 0.002 0.732 6 0.048 0.833 6 0.053 +
Clostridium cluster XVII
Catenibacterium 0.021 0.002 0.274 6 0.021 0.333 6 0.024 +
Mollicutes
Acholeplasma et rel. 0.045 0.009 0.690 6 0.039 0.778 6 0.072 +
Bulleidia moorei et rel. 0.021 0.002 0.336 6 0.035 0.407 6 0.032 +
Erysipelothrix 0.015 0.001 0.715 6 0.119 0.995 6 0.081 +
Solobacterium moorei et rel. 0.040 0.006 0.525 6 0.091 0.714 6 0.149 +
Fusobacteria
Fusobacteria
Fusobacterium 0.045 0.009 0.077 6 0.003 0.090 6 0.013 +
Proteobacteria
Betaproteobacteria
Bordetella et rel. 0.069 0.021 0.932 6 0.105 1.076 6 0.081 +
Neisseria et rel. 0.069 0.021 0.795 6 0.094 0.916 6 0.083 +
Oxalobacter et rel. 0.069 0.021 0.723 6 0.091 0.832 6 0.058 +
Sutterella wadsorthia et rel. 0.058 0.014 0.822 6 0.098 0.943 6 0.070 +
Deltaproteobacteria
Uncultured Deltaproteobacteria 0.021 0.002 0.094 6 0.019 0.067 6 0.009 2
Gammaproteobacteria
Escherichia coli et rel. 0.040 0.006 1.423 6 0.108 1.161 6 0.161 2
(Continued)
Effects of resistant starch on pig intestine 279
Dow
nloaded from https://academ
ic.oup.com/jn/article/143/3/274/4637646 by guest on 27 M
ay 2022

Bacteroidetes and Actinobacteria in colonic digesta. However,Martınez et al. (47) reported that type 4 RS but not RS2significantly induced Bacteroidetes and Actinobacteria whiledecreasing Firmicutes at the phylum level. At the species level,type 4 RS increased Bifidobacterium adolescentis and Parabacter-oides distasonis, whereas RS2 significantly raised the proportionsof Ruminococcus bromii and Eubacterium rectale. In a study onRS3, the relatives ofR. bromii (R-ruminococci) and E. rectalewerefound to be increased in the colon of most volunteers (46).Moreover, when the effects of structural variation of RS3 onfermentability by human gut microbiota were studied, it wasfound that retrograded RS3 that formed a B-type pattern inducedBifidobacterium spp., whereas A-type pattern RS3 inducedAtopobium spp. (49).
In our study, the pigs were fed RS3, and we observed a clearchange in cecal and colonic microbiota composition comparedwith pigs fed DS. The relative abundance of R. bromii wasincreased in the colonic samples of RS-fed pigs, which is consis-tent with previous research (46). However, E. rectale was not
significantly changed in our study and its relative contribution inthe RS group even decreased slightly. Interestingly, in addition toE. rectale, other bacterial groups that belong to Clostridiumcluster XIVa showed either a significant decrease or a trend towarda decrease in RS-fed pigs, whereas bacterial groups belonging toClostridium cluster IV, IX, XV, XVI, and XVII increased inRS-fed pigs. This may be due to a low competitiveness ofClostridium cluster XIVa, because previous research indi-cated the Roseburia/E. rectale group was particularly depen-dent on residual dietary carbohydrate and pH to maintain itscompetitiveness in the colon (51). It may also be related to thefact that we could not detect a significant effect of the RS dieton butyrate concentration in P1 colon, because several membersof this group have been shown to produce butyrate (52). In turn,we found increased relative abundance of populations related tothe butyrate-producing Faecalibacterium prausnitzii, previouslysuggested as a health-promoting bacterium (53). Furthermore,we found an increase in several propionate-producing microor-ganisms, including members of the genera Propionibacterium,
TABLE 2 Continued
ARC3
Phylogenetic group Corr. P value2 P value DS RS Effect4
Pseudomonas et rel. 0.020 0.001 1.306 6 0.154 0.975 6 0.161 2
Psychrobacter et rel. 0.021 0.002 1.022 6 0.062 0.870 6 0.099 2
Uncultured Gammaproteobacteria 0.015 ,0.001 1.314 6 0.136 1.027 6 0.134 2
Vibrio et rel. 0.058 0.014 0.673 6 0.077 0.537 6 0.098 2
Spirochaetes
Spirochaetes
Uncultured Spirochaetes 0.069 0.021 0.518 6 0.043 0.456 6 0.048 2
1 DS, digestible starch; P1, part 1; PITChip, Pig Intestinal Tract Chip; RS, resistant starch.2 Corr. P value indicates the P value corrected for multiple testing according to the procedure of Benjamini-Hochberg.3 ARC is Average Relative Contribution of a microbial group. Values are mean 6 SEM, n = 7 for DS-fed pigs and n = 8 for RS-fed pigs.4 ‘‘+’’ or ‘‘2’’ indicates whether the average relative contribution of the microbial group increased or decreased by the RS treatment.
FIGURE 3 Total SCFAs (A), acetate (B), propionate (C), butyrate (D), valerate (E), isobutyrate (F), and isovalerate (G) concentrations in luminal
contents of pigs fed the DS or RS diet for 2 wk. Values are mean 6 SEM, n = 6–10 pigs per treatment. *,**DS and RS differ within the intestinal
segment, P , 0.05 and P , 0.01, respectively; #,## DS and RS differ within the total cecum or colon, P , 0.05 and P , 0.01, respectively. From
left to right, bars represent areas of the gastrointestinal tract from proximal to distal. The small intestine was divided into 10 equal parts; parts
7–10 refer to the 4 most distal segments of the small intestine, whereas the cecum and colon were divided into 2 respectively 4 segments of
equal length. White horizontal bars indicate the intestinal parts that were combined for statistical analysis to determine differences between
treatments. DS, digestible starch; RS, resistant starch; SI, small intestine.
280 Haenen et al.
Dow
nloaded from https://academ
ic.oup.com/jn/article/143/3/274/4637646 by guest on 27 M
ay 2022

Veilonella, and Phascolarctobacterium. Propionate has previ-ously been indicated as another health-promoting metabolitebeing produced in the large intestine (17). In contrast, severalgroups of potentially pathogenic taxa within the Gammproteo-bacteria, including Escherichia coli and Pseudomonas spp., werefound to be decreased in relative abundance in the colon.
Currently, most studies focus on the colonic and fecal micro-biota (46,47,50), whereas research on the effect of RS on cecalmicrobiota is limited. This study is the first to our knowledgeto use comprehensive microarray-based profiling to detect theRS effect on cecal microbiota in an animal model. We observedmajor differences between cecum and colon with respect tomicrobial changes, possibly due to the change in the chemicalstructure of RS in colon compared with cecum, which deter-mined the RS accessibility by groups of bacteria (47).
We found that a diet high in RS increased SCFA concentra-tions in the luminal content compared with a DS diet, as was alsoobserved previously in pigs (13). However, because >95% ofthe SCFAs are rapidly absorbed from the colonic lumen andmetabolized by the host, the total production of SCFAs isdifficult to determine (54,55). Butyrate is almost entirely usedby colonocytes as their preferred energy substrate, whereasacetate and propionate move to the liver via the portal vein.Propionate is metabolized by the liver and used for glucone-ogenesis, whereas acetate is a substrate for cholesterol synthesisand lipogenesis. In addition, acetate is taken up by muscle andadipose tissue (54,56). It has been observed that RS especiallyresults in an increased production of butyrate (12). However,our experimental setup did not allow us to quantify total butyrateproduction, for which preferably isotope dilution studies ordirect measurements of arteriovenous differences in SCFA con-centrations across the gut are required (54,55). Moreover, it hasbeen suggested that butyrate is taken up by the colonocytes morerapidly than acetate and propionate (54). This might explainwhy we did not observe a very profound increase in butyrateconcentrations in pigs fed RS.
We found that SLC16A1 was induced in pigs consuming theRS diet. This observation can be explained by the increasedintestinal SCFA concentrations (57,58). Induction of SLC16A1gene expression was also observed by Zhou et al. (19), whomeasured gene expression in epithelial cells of the gastrointes-tinal tract from rats fed a DS or an RS diet for 4 wk. They foundthat SLC16A1, PYY, and GCG gene expression was induced inthe cecum and colon. The fact that our study did not show anincrease in GCG or PYY gene expression with RS consumptioncould be due to the different animal model used and the differentduration of the dietary treatment.
The presence of SCFA-activated FFA receptors in the intes-tinal mucosa could provide a link between intestinal SCFAs andappetite and energy homeostasis. FFAR2 immunoreactivity wasfound to be almost completely colocalized with GLP-1 in terminalileum, cecum, and colon of rats (59). Furthermore, it was shownin proximal colon that the densities of FFAR2-immunoreactiveenteroendocrine cells and GLP-1–producing cells were increased>2-fold by fermentable fiber supplementation compared withcontrol (59). In addition, the activation of FFAR2 by SCFAs issuggested to facilitate or modify PYY secretion (60). In thisstudy, no significant differences in FFAR2 and FFAR3 geneexpression were observed between the 2 diet groups. However,this observation does not exclude the possibility that the re-ceptors were activated in RS-fed pigs, because gene expressionlevels do not necessarily reflect protein levels. Our experimentshowed that GPR119, like GCG, is most abundantly expressedin the distal small intestine. GPR119 is expressed in intestinalendocrine L-cells and has been shown to stimulate the release ofGLP-1 (61,62). However, in our study the expression ofGPR119and GCG was not modified upon RS feeding.
TG concentrations in plasma were found to be higher inRS-fed pigs compared with control pigs. Two mechanisms mightbe responsible for this increase. At first, acetate resulting fromfermentation of RS in the intestine is taken up by the liver, whereit can serve as a substrate for TG synthesis (54). A second
FIGURE 4 Relative gene expression of GCG (A), PYY (B), ANGPTL4 (C), FFAR2 (D), FFAR3 (E), GPR119 (F), SLC16A1 (G), and SLC5A8 (H) in
mucosal scrapings along the proximal-distal axis of the intestine of pigs fed the DS or RS diet for 2 wk, as determined by qRT-PCR. Messenger
RNA levels were standardized to RPLP0. Values are presented as mean 6 SEM, n = 6–9 pigs per treatment. *,**DS and RS differ within the
intestinal segment, P , 0.05 and P , 0.01, respectively; ## DS and RS differ within the total cecum, P , 0.01. From left to right, bars represent
areas of the gastrointestinal tract from proximal to distal. The small intestine was divided into 10 equal parts; parts 7–10 refer to the 4 most distal
segments of the small intestine, whereas the cecum and colon were divided into 2 respectively 4 segments of equal length. White horizontal
bars indicate the intestinal parts that were combined for statistical analysis to determine differences between treatments. DS, digestible starch;
RS, resistant starch; SI, small intestine.
Effects of resistant starch on pig intestine 281
Dow
nloaded from https://academ
ic.oup.com/jn/article/143/3/274/4637646 by guest on 27 M
ay 2022
explanation is that RS increases plasma ANGPTL4 concentra-tions, because we observed increased ANGPTL4 gene expressionin the distal part of the small intestine of RS-fed pigs. BecauseANGPTL4 is an inhibitor of lipoprotein lipase, increased con-centrations of ANGPTL4 result in increased plasma TG concen-trations (63).
In conclusion, we showed that a diet high in RS modulatesmicrobiota composition, SCFA concentrations, and gene ex-pression in pig intestine. These findings provide a detailed insighton the interaction between diet, microbiota, and host and mayprovide leads for designing functional food strategies that aim toreduce the risk of obesity and type 2 diabetes in humans.However,additional investigation is required to further elucidate theunderlying molecular mechanisms and the link to satiety.
AcknowledgmentsThe authors thank S. Keshtkar and M.J.H. Breuer for theirskilled technical assistance and the employees of the animal facilityfor taking care of the pigs. D.H., C.S.d.S., G.B., J.J.G.C.v.d.B.,B.K., M.M., and G.J.E.J.H, designed the research; D.H., J.Z.,I.M.v.d.M., J.v.A., and O.P.G. analyzed the data; D.H.,J.Z., H.S., and G.J.E.J.H. wrote the manuscript; and D.H.and G.J.E.J.H. had primary responsibility for final content. Allauthors read and approved the final manuscript.
Literature Cited
1. Flegal KM, Carroll MD, Ogden CL, Curtin LR. Prevalence and trendsin obesity among US adults, 1999–2008. JAMA. 2010;303:235–41.
2. Mozumdar A, Liguori G. Persistent increase of prevalence of metabolicsyndrome among U.S. adults: NHANES III to NHANES 1999–2006.Diabetes Care. 2011;34:216–9.
3. Amine E, Baba N, Belhadj M, Deurenberg-Yap M, Djazayery A,Forrester T, Galuska D, Herman S, James W, M�Buyamba J, et al. Diet,nutrition and the prevention of chronic diseases. Geneva: World HealthOrganization; 2003. Report No.: 0512-3054.
4. Feldeisen SE, Tucker KL. Nutritional strategies in the prevention andtreatment of metabolic syndrome. Appl Physiol Nutr Metab. 2007;32:46–60.
5. Lattimer JM, Haub MD. Effects of dietary fiber and its components onmetabolic health. Nutrients. 2010;2:1266–89.
6. Keenan MJ, Zhou J, McCutcheon KL, Raggio AM, Bateman HG, ToddE, Jones CK, Tulley RT, Melton S, Martin RJ, et al. Effects of resistantstarch, a non-digestible fermentable fiber, on reducing body fat. Obesity(Silver Spring). 2006;14:1523–34.
7. So PW, Yu WS, Kuo YT, Wasserfall C, Goldstone AP, Bell JD, Frost G.Impact of resistant starch on body fat patterning and central appetiteregulation. PLoS ONE. 2007;2:e1309.
8. Robertson MD, Bickerton AS, Dennis AL, Vidal H, Frayn KN. Insulin-sensitizing effects of dietary resistant starch and effects on skeletal muscleand adipose tissue metabolism. Am J Clin Nutr. 2005;82:559–67.
9. Weickert MO, Mohlig M, Schofl C, Arafat AM, Otto B, Viehoff H,Koebnick C, Kohl A, Spranger J, Pfeiffer AF. Cereal fiber improveswhole-body insulin sensitivity in overweight and obese women. Diabe-tes Care. 2006;29:775–80.
10. Wanders AJ, van den Borne JJ, de Graaf C, Hulshof T, Jonathan MC,Kristensen M, Mars M, Schols HA, Feskens EJ. Effects of dietary fibreon subjective appetite, energy intake and body weight: a systematicreview of randomized controlled trials. Obes Rev. 2011.
11. Nugent AP. Health properties of resistant starch. Nutr Bull.2005;30:27–54.
12. Topping DL, Clifton PM. Short-chain fatty acids and human colonicfunction: roles of resistant starch and nonstarch polysaccharides.Physiol Rev. 2001;81:1031–64.
13. Bird AR, Vuaran M, Brown I, Topping DL. Two high-amylose maizestarches with different amounts of resistant starch vary in their effectson fermentation, tissue and digesta mass accretion, and bacterialpopulations in the large bowel of pigs. Br J Nutr. 2007;97:134–44.
14. Halestrap AP, Meredith D. The SLC16 gene family-from monocarbox-ylate transporters (MCTs) to aromatic amino acid transporters andbeyond. Pflugers Arch. 2004;447:619–28.
15. Roy CC, Kien CL, Bouthillier L, Levy E. Short-chain fatty acids: readyfor prime time? Nutr Clin Pract. 2006;21:351–66.
16. Hamer HM, Jonkers D, Venema K, Vanhoutvin S, Troost FJ, BrummerRJ. Review article: the role of butyrate on colonic function. AlimentPharmacol Ther. 2008;27:104–19.
17. Hosseini E, Grootaert C, Verstraete W, Van de Wiele T. Propionate as ahealth-promoting microbial metabolite in the human gut. Nutr Rev.2011;69:245–58.
18. Sleeth ML, Thompson EL, Ford HE, Zac-Varghese SE, Frost G. Freefatty acid receptor 2 and nutrient sensing: a proposed role for fibre,fermentable carbohydrates and short-chain fatty acids in appetiteregulation. Nutr Res Rev. 2010;23:135–45.
19. Zhou J, Hegsted M, McCutcheon KL, Keenan MJ, Xi X, Raggio AM,Martin RJ. Peptide YYand proglucagon mRNA expression patterns andregulation in the gut. Obesity (Silver Spring). 2006;14:683–9.
20. Zhou J, Martin RJ, Tulley RT, Raggio AM, McCutcheon KL, Shen L,Danna SC, Tripathy S, Hegsted M, Keenan MJ. Dietary resistant starchupregulates total GLP-1 and PYY in a sustained day-long mannerthrough fermentation in rodents. Am J Physiol Endocrinol Metab.2008;295:E1160–6.
21. Cherbut C, Ferrier L, Roze C, Anini Y, Blottiere H, Lecannu G,Galmiche JP. Short-chain fatty acids modify colonic motility throughnerves and polypeptide YY release in the rat. Am J Physiol. 1998;275:G1415–22.
22. Samuel BS, Shaito A, Motoike T, Rey FE, Backhed F, Manchester JK,Hammer RE, Williams SC, Crowley J, Yanagisawa M, et al. Effects ofthe gut microbiota on host adiposity are modulated by the short-chainfatty-acid binding G protein-coupled receptor, Gpr41. Proc Natl AcadSci USA. 2008;105:16767–72.
23. Miyauchi S, Hirasawa A, Ichimura A, Hara T, Tsujimoto G. Newfrontiers in gut nutrient sensor research: free fatty acid sensing in thegastrointestinal tract. J Pharmacol Sci. 2010;112:19–24.
24. Miller ER, Ullrey DE. The pig as a model for human nutrition. AnnuRev Nutr. 1987;7:361–82.
25. Guilloteau P, Zabielski R, Hammon HM, Metges CC. Nutritionalprogramming of gastrointestinal tract development: is the pig a goodmodel for man? Nutr Res Rev. 2010;23:4–22.
26. da Silva CS, van den Borne JJ, Gerrits WJ, Kemp B, Bolhuis JE. Effectsof dietary fibers with different physicochemical properties on feedingmotivation in adult female pigs. Physiol Behav. 2012;107:218–30.
27. Serena A, Jorgensen H, Bach Knudsen KE. Absorption of carbohydrate-derived nutrients in sows as influenced by types and contents of dietaryfiber. J Anim Sci. 2009;87:136–47.
28. Goni I, Garcıa-Diz L, Manas E, Saura-Calixto F. Analysis of resistantstarch: a method for foods and food products. Food Chem.1996;56:445–9.
29. Salonen A, Nikkila J, Jalanka-Tuovinen J, Immonen O, Rajilic-StojanovicM, Kekkonen RA, Palva A, de Vos WM. Comparative analysis of fecalDNA extraction methods with phylogenetic microarray: effective recov-ery of bacterial and archaeal DNA using mechanical cell lysis. J MicrobiolMethods. 2010;81:127–34.
30. Konstantinov SR, Awati A, Smidt H, Williams BA, Akkermans AD, deVos WM. Specific response of a novel and abundant Lactobacillusamylovorus-like phylotype to dietary prebiotics in the guts of weaningpiglets. Appl Environ Microbiol. 2004;70:3821–30.
31. Muyzer G, de Waal EC, Uitterlinden AG. Profiling of complex microbialpopulations by denaturing gradient gel electrophoresis analysis ofpolymerase chain reaction-amplified genes coding for 16S rRNA. ApplEnviron Microbiol. 1993;59:695–700.
32. Perez Gutierrez O, van den Bogert B, Derrien M, Koopmans SJ,Molenaar D, de Vos WM, Smidt H. Design of a high-throughputdiagnostic microarray for the characterization of pig gastrointestinaltract microbiota. Chapter 3. Unraveling piglet gut microbiota dynamicsin response to feed additives [dissertation]. Wageningen (Netherlands):Ponsen & Looijen; 2010. p. 40–67 [cited 2013 Jan 9]. Available from:http://library.wur.nl/WebQuery/wda/lang/1939249.
33. Claesson MJ, O’Sullivan O, Wang Q, Nikkila J, Marchesi JR, Smidt H,de Vos WM, Ross RP, O’Toole PW. Comparative analysis of pyrose-quencing and a phylogenetic microarray for exploring microbial commu-nity structures in the human distal intestine. PLoS ONE. 2009;4:e6669.
282 Haenen et al.
Dow
nloaded from https://academ
ic.oup.com/jn/article/143/3/274/4637646 by guest on 27 M
ay 2022

34. van den Bogert B, de Vos WM, Zoetendal EG, Kleerebezem M.Microarray analysis and barcoded pyrosequencing provide consistentmicrobial profiles depending on the source of human intestinal samples.Appl Environ Microbiol. 2011;77:2071–80.
35. Qin J, Li R, Raes J, Arumugam M, Burgdorf KS, Manichanh C, NielsenT, Pons N, Levenez F, Yamada T, et al. A human gut microbial genecatalogue established by metagenomic sequencing. Nature. 2010;464:59–65.
36. Rajilic-Stojanovic M, Heilig HG, Molenaar D, Kajander K, Surakka A,Smidt H, de Vos WM. Development and application of the humanintestinal tract chip, a phylogenetic microarray: analysis of universallyconserved phylotypes in the abundant microbiota of young and elderlyadults. Environ Microbiol. 2009;11:1736–51.
37. Velu R, Reinsel GC. Multivariate reduced-rank regression: theory andapplications: New York: Springer; 1998.
38. ter Braak CJF. Canonical correspondence analysis: a new eigenvectortechnique for multivariate direct gradient analysis. Ecology. 1986;67:1167–79.
39. Lep�s J, �Smilauer P. Multivariate analysis of ecological data usingCANOCO. Cambridge, UK: Cambridge University Press; 2003.
40. Benjamini Y, Hochberg Y. Controlling the false discovery rate: apractical and powerful approach to multiple testing. J R Stat Soc B.1995;57:289–300.
41. Wong MH, Oelkers P, Craddock AL, Dawson PA. Expression cloningand characterization of the hamster ileal sodium-dependent bile acidtransporter. J Biol Chem. 1994;269:1340–7.
42. Bunger M, van den Bosch HM, van der Meijde J, Kersten S, HooiveldGJ, Muller M. Genome-wide analysis of PPARalpha activation inmurine small intestine. Physiol Genomics. 2007;30:192–204.
43. Mortensen K, Christensen LL, Holst JJ, Orskov C. GLP-1 and GIP arecolocalized in a subset of endocrine cells in the small intestine. RegulPept. 2003;114:189–96.
44. Yasuda K, Maiorano R, Welch RM, Miller DD, Lei XG. Cecum is themajor degradation site of ingested inulin in young pigs. J Nutr.2007;137:2399–404.
45. Patterson JK, Yasuda K, Welch RM, Miller DD, Lei XG. Supplementaldietary inulin of variable chain lengths alters intestinal bacterialpopulations in young pigs. J Nutr. 2010;140:2158–61.
46. Walker AW, Ince J, Duncan SH, Webster LM, Holtrop G, Ze X, BrownD, Stares MD, Scott P, Bergerat A, et al. Dominant and diet-responsivegroups of bacteria within the human colonic microbiota. ISME J. 2011;5:220–30.
47. Martınez I, Kim J, Duffy PR, Schlegel VL, Walter J. Resistant starchestypes 2 and 4 have differential effects on the composition of the fecalmicrobiota in human subjects. PLoS ONE. 2010;5:e15046.
48. Kleessen B, Stoof G, Proll J, Schmiedl D, Noack J, Blaut M. Feedingresistant starch affects fecal and cecal microflora and short-chain fattyacids in rats. J Anim Sci. 1997;75:2453–62.
49. Lesmes U, Beards EJ, Gibson GR, Tuohy KM, Shimoni E. Effects ofresistant starch type III polymorphs on human colon microbiota and
short chain fatty acids in human gut models. J Agric Food Chem.2008;56:5415–21.
50. Young W, Roy NC, Lee J, Lawley B, Otter D, Henderson G, McCannMJ, Tannock GW. Changes in bowel microbiota induced by feedingresistant starch stimulate transcriptomic and physiological responses inthe weanling host. Appl Environ Microbiol. 2012.
51. Louis P, Scott KP, Duncan SH, Flint HJ. Understanding the effects ofdiet on bacterial metabolism in the large intestine. J Appl Microbiol.2007;102:1197–208.
52. Flint HJ, Scott KP, Louis P, Duncan SH. The role of the gut microbiotain nutrition and health. Nat Rev Gastroenterol Hepatol. 2012;9:577–89.
53. Sokol H, Pigneur B, Watterlot L, Lakhdari O, Bermudez-Humaran LG,Gratadoux JJ, Blugeon S, Bridonneau C, Furet JP, Corthier G, et al.Faecalibacterium prausnitzii is an anti-inflammatory commensal bacte-rium identified by gut microbiota analysis of Crohn disease patients.Proc Natl Acad Sci USA. 2008;105:16731–6.
54. Bergman EN. Energy contributions of volatile fatty acids from thegastrointestinal tract in various species. Physiol Rev. 1990;70:567–90.
55. Cummings JH. The large intestine in nutrition and disease. Brussels(Belgium): Institut Danone; 1997.
56. Bloemen JG, Venema K, van de Poll MC, Olde Damink SW, BuurmanWA, Dejong CH. Short chain fatty acids exchange across the gut andliver in humans measured at surgery. Clin Nutr. 2009;28:657–61.
57. Cuff MA, Lambert DW, Shirazi-Beechey SP. Substrate-induced regula-tion of the human colonic monocarboxylate transporter, MCT1. JPhysiol. 2002;539:361–71.
58. Borthakur A, Saksena S, Gill RK, Alrefai WA, Ramaswamy K, DudejaPK. Regulation of monocarboxylate transporter 1 (MCT1) promoterby butyrate in human intestinal epithelial cells: involvement of NF-kappaBpathway. J Cell Biochem. 2008;103:1452–63.
59. Kaji I, Karaki S, Tanaka R, Kuwahara A. Density distribution of freefatty acid receptor 2 (FFA2)-expressing and GLP-1-producing enteroendo-crine L cells in human and rat lower intestine, and increased cell numbersafter ingestion of fructo-oligosaccharide. J Mol Histol. 2011;42:27–38.
60. Karaki S, Mitsui R, Hayashi H, Kato I, Sugiya H, Iwanaga T, FurnessJB, Kuwahara A. Short-chain fatty acid receptor, GPR43, is expressedby enteroendocrine cells and mucosal mast cells in rat intestine. CellTissue Res. 2006;324:353–60.
61. Chu ZL, Carroll C, Alfonso J, Gutierrez V, He H, Lucman A, PedrazaM, Mondala H, Gao H, Bagnol D, et al. A role for intestinal endocrinecell-expressed g protein-coupled receptor 119 in glycemic control byenhancing glucagon-like peptide-1 and glucose-dependent insulino-tropic peptide release. Endocrinology. 2008;149:2038–47.
62. Lan H, Vassileva G, Corona A, Liu L, Baker H, Golovko A, AbbondanzoSJ, Hu W, Yang S, Ning Y, et al. GPR119 is required for physiologicalregulation of glucagon-like peptide-1 secretion but not for metabolichomeostasis. J Endocrinol. 2009;201:219–30.
63. Yoshida K, Shimizugawa T, Ono M, Furukawa H. Angiopoietin-likeprotein 4 is a potent hyperlipidemia-inducing factor in mice and inhibitorof lipoprotein lipase. J Lipid Res. 2002;43:1770–2.
Effects of resistant starch on pig intestine 283
Dow
nloaded from https://academ
ic.oup.com/jn/article/143/3/274/4637646 by guest on 27 M
ay 2022