The effect of starch material, encapsulated protein and production conditions on the protein release...
14
The Effect of Starch Material, Encapsulated Protein and Production Conditions on the Protein Release from Starch Microspheres LIDIA ELFSTRAND, ANN-CHARLOTTE ELIASSON, MARIE WAHLGREN Department of Food Technology, Engineering and Nutrition, Division of Food Technology, Lund University, P.O. Box 124, SE-221 00 Lund, Sweden Received 24 March 2008; revised 29 November 2008; accepted 19 December 2008 Published online 2 February 2009 in Wiley InterScience (www.interscience.wiley.com). DOI 10.1002/jps.21693 ABSTRACT: The present study describes the preparation of 11 batches of starch micro- spheres for drug delivery. Parameters such as the type of starch material, the type of protein, and the incubation time of the process were varied, and the obtained micro- spheres differed in yield, encapsulation efficiency and physical properties. The crystal- line/ordered structure (obtained through X-ray powder diffraction (XRPD) and differential scanning calorimetry (DSC)), the microscopic appearance and the surface morphology (viewed with scanning electron microscopy (SEM)) were found to differ between the batches depending on the starch type, encapsulated protein and incubation conditions that were employed. Freeze-drying was found to have a destructive effect on the ordered structure of the starch and this effect varied with regard to preparation conditions. Drug release experiments demonstrated that the release from the starch matrix depended on the type of protein as well as on the incubation time during the manufacturing at temperatures of 68C and 378C. The enzymatic degradation of starch was slightly different between the materials depending on the crystalline/ordered structure that had formed during the preparation. ß 2009 Wiley-Liss, Inc. and the American Pharmacists Association J Pharm Sci 98:3802–3815, 2009 Keywords: controlled release/delivery; microparticles; protein delivery; structure- transport relationship; biodegradable polymers; crystallinity; physical characterization INTRODUCTION Starch is a common material in pharmaceutical applications. It is biocompatible and biodegrad- able, cheap and available in large quantities, which makes it an excellent excipient in pharma- ceuticals. One area for the application of starch is in the formulation of microspheres for drug deli- very. The active substances intended for encap- sulation in a starch matrix are often peptides or proteins, but also drugs, such as gentamicin and metoclopramide, have been formulated as micro- particles. 1 Starch microspheres are used in nasal delivery of drugs 2–7 as well as for vaccines given both orally and intramuscularly. 8–11 Most formulations involving starch microspheres utilize chemical cross-linking. 12–14 However, in the formulation of Biosphere 1 microspheres (SkyePharma AB, Malmo ¨, Sweden), 15 advantage is taken of the natural ability of starch to crystallize in order to obtain physical cross-links in the starch matrix. Biosphere 1 is a sustained release formulation in which the release of the active substance can be controlled by coating the starch microsphere with poly(DL-lactide-co- glycolide) (PLG). 16 However, it is possible to Correspondence to: Marie Wahlgren (Telephone: 46-46-222- 83-06; Fax: 46-46-222-46-22; E-mail: [email protected]) Journal of Pharmaceutical Sciences, Vol. 98, 3802–3815 (2009) ß 2009 Wiley-Liss, Inc. and the American Pharmacists Association 3802 JOURNAL OF PHARMACEUTICAL SCIENCES, VOL. 98, NO. 10, OCTOBER 2009
-
Upload
independent -
Category
Documents
-
view
1 -
download
0
Transcript of The effect of starch material, encapsulated protein and production conditions on the protein release...

The Effect of Starch Material, Encapsulated Protein andProduction Conditions on the Protein Release fromStarch Microspheres
LIDIA ELFSTRAND, ANN-CHARLOTTE ELIASSON, MARIE WAHLGREN
Department of Food Technology, Engineering and Nutrition, Division of Food Technology, Lund University, P.O. Box 124,SE-221 00 Lund, Sweden
Received 24 March 2008; revised 29 November 2008; accepted 19 December 2008
Published online 2 February 2009 in Wiley InterScience (www.interscience.wiley.com). DOI 10.1002/jps.21693
Corresponde83-06; Fax: 46-4E-mail: marie.w
Journal of Pharm
� 2009 Wiley-Liss
3802 JOURN
ABSTRACT: The present study describes the preparation of 11 batches of starch micro-spheres for drug delivery. Parameters such as the type of starch material, the type ofprotein, and the incubation time of the process were varied, and the obtained micro-spheres differed in yield, encapsulation efficiency and physical properties. The crystal-line/ordered structure (obtained through X-ray powder diffraction (XRPD) anddifferential scanning calorimetry (DSC)), the microscopic appearance and the surfacemorphology (viewed with scanning electron microscopy (SEM)) were found to differbetween the batches depending on the starch type, encapsulated protein and incubationconditions that were employed. Freeze-drying was found to have a destructive effect onthe ordered structure of the starch and this effect varied with regard to preparationconditions. Drug release experiments demonstrated that the release from the starchmatrix depended on the type of protein as well as on the incubation time during themanufacturing at temperatures of 68C and 378C. The enzymatic degradation of starchwas slightly different between the materials depending on the crystalline/orderedstructure that had formed during the preparation. � 2009 Wiley-Liss, Inc. and the American
Pharmacists Association J Pharm Sci 98:3802–3815, 2009
Keywords: controlled release/delivery;
microparticles; protein delivery; structure-transport relationship; biodegradable polymers; crystallinity; physical characterizationINTRODUCTION
Starch is a common material in pharmaceuticalapplications. It is biocompatible and biodegrad-able, cheap and available in large quantities,which makes it an excellent excipient in pharma-ceuticals. One area for the application of starch isin the formulation of microspheres for drug deli-very. The active substances intended for encap-sulation in a starch matrix are often peptides or
nce to: Marie Wahlgren (Telephone: 46-46-222-6-222-46-22;[email protected])
aceutical Sciences, Vol. 98, 3802–3815 (2009)
, Inc. and the American Pharmacists Association
AL OF PHARMACEUTICAL SCIENCES, VOL. 98, NO. 10, OC
proteins, but also drugs, such as gentamicin andmetoclopramide, have been formulated as micro-particles.1 Starch microspheres are used in nasaldelivery of drugs2–7 as well as for vaccines givenboth orally and intramuscularly.8–11
Most formulations involving starch microspheresutilize chemical cross-linking.12–14 However, inthe formulation of Biosphere1 microspheres(SkyePharma AB, Malmo, Sweden),15 advantageis taken of the natural ability of starch tocrystallize in order to obtain physical cross-linksin the starch matrix. Biosphere1 is a sustainedrelease formulation in which the release of theactive substance can be controlled by coatingthe starch microsphere with poly(DL-lactide-co-glycolide) (PLG).16 However, it is possible to
TOBER 2009

PROTEIN RELEASE FROM STARCH MICROSPHERES 3803
utilize the formulation without this controlledrelease film and the present work describes theinvestigation of the release of proteins from suchnoncoated starch microspheres.
Previous studies have demonstrated that thephysicochemical properties of starch micro-spheres are influenced by the molecular proper-ties of the starch.17 Production conditions such asannealing and freeze-drying have also been foundto have considerable effects on the crystallinityand amount of ordered structure of the micro-spheres (Elfstrand, unpublished work). Further-more, the presence of other excipients, forexample, buffers,17 and the type of active sub-stance may also influence the properties of themicrospheres. The aim of the present study wasto investigate whether the production conditionsand the physicochemical properties of the micro-spheres influenced the protein encapsulationefficiency and release from the matrix. Thetwo model proteins used, Insulin and BSA, waschosen mainly because they differ considerablyin molecular weight. It is well-known thatstarch recrystallization depends on the incubationtemperature.18 Nucleation is promoted at lowtemperatures, whereas higher temperatures con-tribute to crystallite growth.18 Our previous workon model systems for starch microspheres hasdisplayed that the amount of crystallites formed,as well as their thermal stability, can be influenc-ed by altering the incubation times.19 Thepresence of additives such as polyethylene glycol(PEG) and bovine serum albumin (BSA) has alsopreviously been found to influence the starchcrystallization process.20 It was therefore hypo-thesized that these factors affect the properties ofthe microspheres.
The present study involves two starch materialsand the model proteins BSA and insulin. Theincubation period was varied at two tempera-tures, 68C (�5–48 h) and 378C (4–24 h), and intotal, 11 batches of starch microspheres wereprepared. The obtained microspheres were inves-tigated using differential scanning calorimetry(DSC), X-ray powder diffraction (XRPD) andscanning electron microscopy (SEM). The loadingand release of the proteins from the microsphereswere determined, and the effect of freeze-dryingwas investigated in relation to the crystallinityand degree of ordered structure. Furthermore, therelease from the microspheres both in the absenceand in the presence of amylase was determined.The enzymatic hydrolysis of starch is a wellknown phenomenon and it has been shown that
DOI 10.1002/jps JOURN
the rate of starch hydrolysis can be affected bythe type of temperature treatment of the starch.21
The release of protein by enzymatic hydrolysiswas thus studied in order to verify whetherenzymatic hydrolysis was necessary for a com-plete protein release and whether the enzymaticerosion dominated the release rate in the inves-tigated system. Furthermore, this investigationwas also carried out to determine if the productionmethod would affect the enzymatic hydrolysis ofthe microspheres.
MATERIALS AND METHODS
Two starch materials produced from the nativewaxy maize starch Cerestar SF 04201 (Cerestar,Inc., Vilvoorde, Belgium) were provided bySkyePharma AB. These starch materials havebeen described in detail by Elfstrand et al.22 Themain difference between the materials resides intheir molecular weight; the mechanically treated(MT) starch had a molecular weight (MW) of5.1� 105 g mol�1, whereas the acid-hydrolyzed(AH) starch had a MW of 3.2� 105 g mol�1.Microsphere batches were prepared from thetwo starch materials, as well as from a drymixture (50/50 wt%) of the two. PEG (20,000 g/mol) was provided by VWR International Ltd.,Stockholm, Sweden and BSA (A7906) was pur-chased from Sigma–Aldrich Sweden AB, Stock-holm Sweden, human insulin was a gift from NovoNordic A/S, Copenhagen, Denmark.
Preparation of Starch Microspheres
A PEG (20,000 g/mol) solution (38% polymer byweight) and a protein solution (3.7% by weight)were prepared by dissolving an appropriateamount of PEG and protein, respectively, in acarbonate buffer (50 mM, pH 8.0) under stirring. Astarch-buffer dispersion was obtained by disper-sing the starch in the carbonate buffer andheating 10 g of the mixture in a microwave oven(800 W; MS-194A, LG Electronics, Inc., Sweden)for 3 periods of 6 s. The heated dispersions weretransparent and visually homogeneous.
The starch microspheres were prepared accord-ing to an emulsification technique described byReslow et al.15 The above-mentioned starch-bufferdispersion (30/70% by weight) was cooled to 50–558C and 2.9 g was mixed with 1 g of the proteinsolution (288C). The starch-protein mixture wasthen added to a PEG solution (29 g, 288C) under
AL OF PHARMACEUTICAL SCIENCES, VOL. 98, NO. 10, OCTOBER 2009

3804 ELFSTRAND, ELIASSON, AND WAHLGREN
stirring at 200 rpm for 15 min. Subsequently, theemulsion was incubated at a temperature of 68C,while being stirred at 50 rpm, and this wasfollowed by a second incubation period at 378C.The preparation parameters are presented inTable 1.
After incubation, the wet microspheres wereseparated from the PEG solution by centrifuga-tion (10,000 rpm, 10 min) (OptimaTM LE-80KUltracentrifuge Beckman Coulter, Inc., Fullerton,CA), after which they were washed with phos-phate buffer (5 mM, pH 5.0) and centrifuged threetimes (3000 rpm, 5 min) before being freeze-dried(Hetosicc, Heto Birkerød, Denmark). Finally, thebatches were weighed to obtain the yield of eachpreparation process expressed as the ratio of theactual-to-theoretical ‘‘starchþprotein’’ weight,assuming no loss of material during the preparation.
Characterization of Microspheres
Powder X-Ray Diffraction
XRPD patterns were obtained with a PanalyticalX’Pert Pro diffractometer equipped with anX’Celerator detector using Cu-Ka1,a2-radiationand Bragg-Brentano geometry. The samples werespread out on ‘‘zero background’’ silicon plates.The scanning region of the diffraction angle 2uwas within the range of 38–408, and thus coveredall of the significant diffraction peaks of the starchcrystallites. The measurements were performed
Table 1. The Notation, Material Used for Production, IncMicrospheres Section), Loading and Encapsulation Efficienc
Material Protein
Incubation Time (h)Yiel(%)At 68C (t6) At 378C (t37)
MT Insulin 21.2 10.3 65.8MT BSA 21.2 10.3 70.5AH Insulin 21.2 10.3 59.2AH BSA 21.2 10.3 64.7Mix of MT and
AH (50/50 wt%)Insulin 21.2 10.3 70.8
Mix of MT andAH (50/50 wt%)
BSA 21.2 10.3 67.6
MT BSA 48 10.3 74.6MT BSA 10 10.3 71.6MT BSA 5.4 10.3 84.3MT BSA 21.2 4.5 74.4MT BSA 21.2 24 76.1
Standard deviations for the load are given in brackets.
JOURNAL OF PHARMACEUTICAL SCIENCES, VOL. 98, NO. 10, OCTOBER 2009
using an automatic divergence slit (10 mm� 10 mmilluminated area) and a typical step size of 0.0178,with a total counting time of approximately30 min per sample.
Differential Scanning Calorimetry
The ordered structure in the microspheres wasinvestigated by DSC before (wet samples) andafter (dry samples) freeze-drying. The sampleswere characterized by the endothermic heat (DH)required to melt the ordered structure of thesamples and three temperatures, that is, the onsettemperature (Ton), the temperature location of thedominating peak (Tm) and the completion tem-perature (Tc).
The wet microsphere samples were prepared byweighing approximately 10 mg of the sample intocoated aluminum pans. The pans were hermeti-cally sealed and immediately scanned. The drymicrosphere samples were obtained by weighingapproximately 3 mg of the microspheres into theDSC pans. An appropriate amount of water wasadded to the sample so as to give rise to a 30% (w/w)starch/water ratio. Water was also added in orderfor the water content to be similar to that of thewet samples, as the amount of water in the sampleis known to influence the melting of the orderedstructure. The pans were then sealed and thesamples were analyzed after 3–5 h.
In all experiments, the aluminum pans (TAInstruments, New Castle, DE, ref no. 900790.901and 900796.901) were hermetically sealed and the
ubation Conditions, Yield (see Preparation of Starchy (see Protein Load Section) of the Starch Microspheres
dLoading bythe Protein
(%)
EncapsulationEffectiveness
(%)
Fit DissolutionProfile With
Rð%Þ ¼ b �ffiffi
tp
þ a (R2)
0.97 (0.08) 24 n.f.3.71 (0.01) 91 y¼ 83x� 5 (0.96)1.86 (0.0) 46 n.f.5.13 (0.82) 126 y¼ 48xþ 29 (0.96)2.12 (0.0) 49 n.f.
4.19 (0.06) 103 n.f.
3.81 (0.07) 93 n.f.3.35 (0.07) 82 y¼ 62xþ 10 (0.99)2.84 (0.06) 70 y¼ 82x� 11 (0.96)3.19 (0.02) 78 n.f.3.95 (0.03) 97 y¼ 64xþ 2 (0.98)
DOI 10.1002/jps

PROTEIN RELEASE FROM STARCH MICROSPHERES 3805
samples were analyzed in a DSC 6200 calorimeter(Seiko Instruments, Inc., Shizouka, Japan) at aheating rate of 58C/min, with an empty pan as thereference. The melting enthalpy was determinedby sweeping the temperature from 208C to 1108C.All measurements were carried out in at leastduplicate. The dry substance was determined bydrying punctured pans at 1058C overnight. Thestarch content was calculated by subtracting theamount of protein in the sample, and DH wascalculated based on the dry weight of the starch.
Scanning Electron Microscopy
Scanning electron microscopy was performed ona JEOL JSM-5600 scanning electron microscope(JEOL, Tokyo, Japan). The samples were attachedto circular stubs with double-sided adhesive tapeand coated with gold-palladium using a PolaronSC7640 Sputter Coater (Thermo VG Microtech,East Grinstead, West Sussex, UK). Viewing wascarried out by first scanning the total specimen,and then selecting an area deemed to be repre-sentative of the entire sample to be photographedat magnifications up to 6000�.
Protein Load
The amount of protein encapsulated in the starchmicrospheres, that is, the experimental proteinload, was determined by dissolving 5–10 mg of themicrospheres in 1.5 mL release buffer duringgentle agitation at 378C for 6 h prior to analysis byhigh performance liquid chromatography (HPLC).The release buffer consisted of a sodium phos-phate buffer (30 mM, pH 6.4) containing CaCl2(0.5 mM), NaN3 (3 mM), NaCl (82 mM), 185 U/L a-amylase and Poloxamer NF 188 (0.1%).
The encapsulation efficiency was expressed asthe ratio of the experimental protein load to thetheoretical amount of protein at a 100% load.
The BSA and insulin concentrations both forloading and in the release experiments weredeterminated using HPLC (Agilent 1100 Turbo,Hewlett Packard, Palo Alto, CA, with the softwareHP Chem. Station). The BSA concentration wasdeterminated at a wavelength of 280 nm using aVydac C4 analytical column with a linear gradienteluation. The injection volume was 100mL and theflow rate was 1.5 mL/min. Eluent A consisted ofacetonitrile (100 mL), 2-propanol (20 mL), TFA(trifluoroacetic acid) (0.1%, 1 mL), water (879 mL),and eluent B containing acetonitrile (880 mL), 2-propanol (20 mL), TFA (0.1%, 1 mL), water (99mL). The gradient went from 100% eluent A to
DOI 10.1002/jps JOURN
100% eluent B in 12 min and after 13 min of theanalyze the system was switched back to eluent Aand continued for an additional 5 min.
The insulin concentration was determined at awavelength of 220 nm using a Vydac C18 analy-tical column with a stepwise gradient elution. Theinjection volume was 20 mL and the flow rate was1.5-mL/min. Eluent A consisted of TFA (0.1%,1 mL), water (999 mL), and eluent B containedacetonitrile (600 mL), 2-propanol (20 mL), TFA(0.1%, 1 mL) and water (399 mL), at a flow rate of1.5 mL/min. The stepwise gradient went from100% eluent A to 45% eluent B after 2 min, 60%eluent B after 12 min, and 100% eluent B after13 min. After 13 min and 50 s the system wasswitched back to eluent A and then the analyzewas stopped after 18 min.
In Vitro Release and Starch Degradation
Release experiments for each batch of micro-spheres were performed in the presence as well asin the absence of a-amylase. The release bufferwas added (1.5 mL) after weighing 60–65 mg ofthe microspheres into Eppendorf tubes. Thesample tubes were incubated at 378C withintermittent shaking. Samples of the supernatant(1 mL) were withdrawn at predetermined timesafter sedimentation of the microspheres for theanalysis of released protein (by HPLC) and releasedstarch. The amount of carbohydrates that wasreleased could be determined with a Randox kit,Glucose GOD/PAP (Randox Laboratories Ltd.,Antrim, UK) after enzymatic degradation of thecarbohydrates to glucose.
RESULTS AND DISCUSSION
The obtained microspheres displayed a variety ofappearances and physical properties. However,all the batches contained spherical particles, ascan be seen in Figures 1 and 2. It has previouslybeen demonstrated that qualitie of the micro-spheres such as the spherical form of the particles,well-defined and sharp particle contours, coin-cided with a coarse surface morphology as wellas sharp and distinct peaks in DSC and X-raygraphs.17 The majority of the batches produced forthis study fell within these criteria.
The average size and the size distribution of theparticles could not be determined with statistical
AL OF PHARMACEUTICAL SCIENCES, VOL. 98, NO. 10, OCTOBER 2009
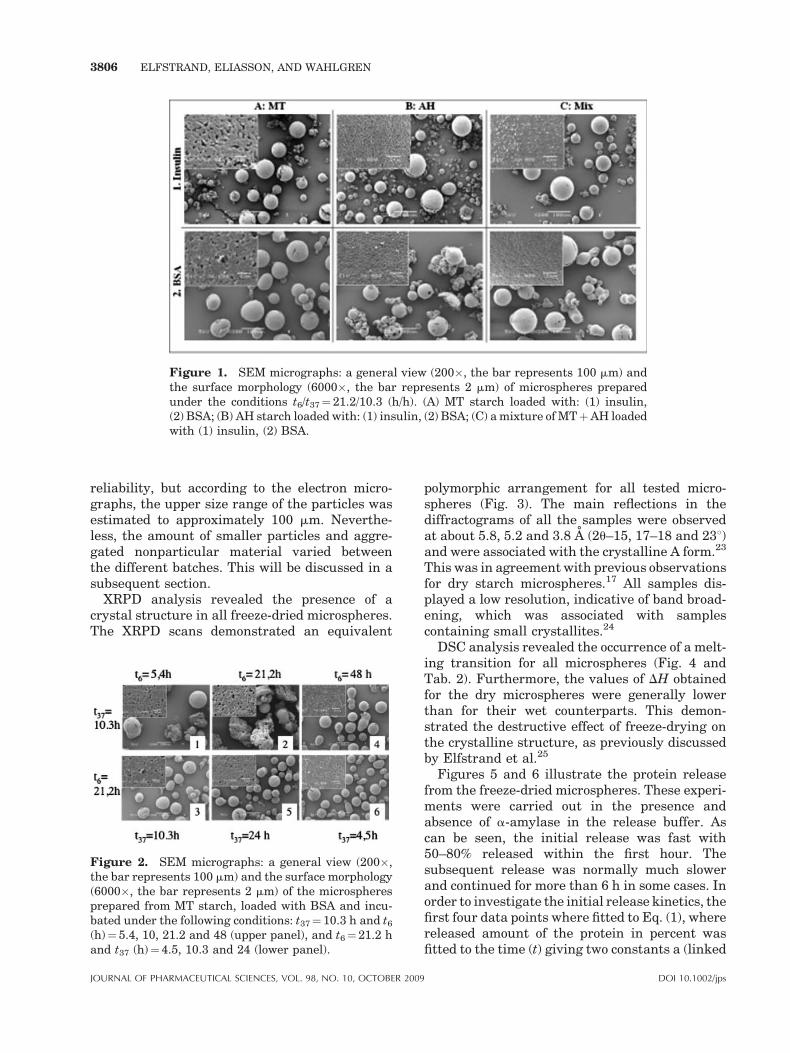
Figure 1. SEM micrographs: a general view (200�, the bar represents 100 mm) andthe surface morphology (6000�, the bar represents 2 mm) of microspheres preparedunder the conditions t6/t37¼ 21.2/10.3 (h/h). (A) MT starch loaded with: (1) insulin,(2) BSA; (B) AH starch loaded with: (1) insulin, (2) BSA; (C) a mixture of MTþAH loadedwith (1) insulin, (2) BSA.
3806 ELFSTRAND, ELIASSON, AND WAHLGREN
reliability, but according to the electron micro-graphs, the upper size range of the particles wasestimated to approximately 100 mm. Neverthe-less, the amount of smaller particles and aggre-gated nonparticular material varied betweenthe different batches. This will be discussed in asubsequent section.
XRPD analysis revealed the presence of acrystal structure in all freeze-dried microspheres.The XRPD scans demonstrated an equivalent
Figure 2. SEM micrographs: a general view (200�,the bar represents 100 mm) and the surface morphology(6000�, the bar represents 2 mm) of the microspheresprepared from MT starch, loaded with BSA and incu-bated under the following conditions: t37¼ 10.3 h and t6
(h)¼ 5.4, 10, 21.2 and 48 (upper panel), and t6¼ 21.2 hand t37 (h)¼ 4.5, 10.3 and 24 (lower panel).
JOURNAL OF PHARMACEUTICAL SCIENCES, VOL. 98, NO. 10, OCTOBER 2009
polymorphic arrangement for all tested micro-spheres (Fig. 3). The main reflections in thediffractograms of all the samples were observedat about 5.8, 5.2 and 3.8 A (2u–15, 17–18 and 238)and were associated with the crystalline A form.23
This was in agreement with previous observationsfor dry starch microspheres.17 All samples dis-played a low resolution, indicative of band broad-ening, which was associated with samplescontaining small crystallites.24
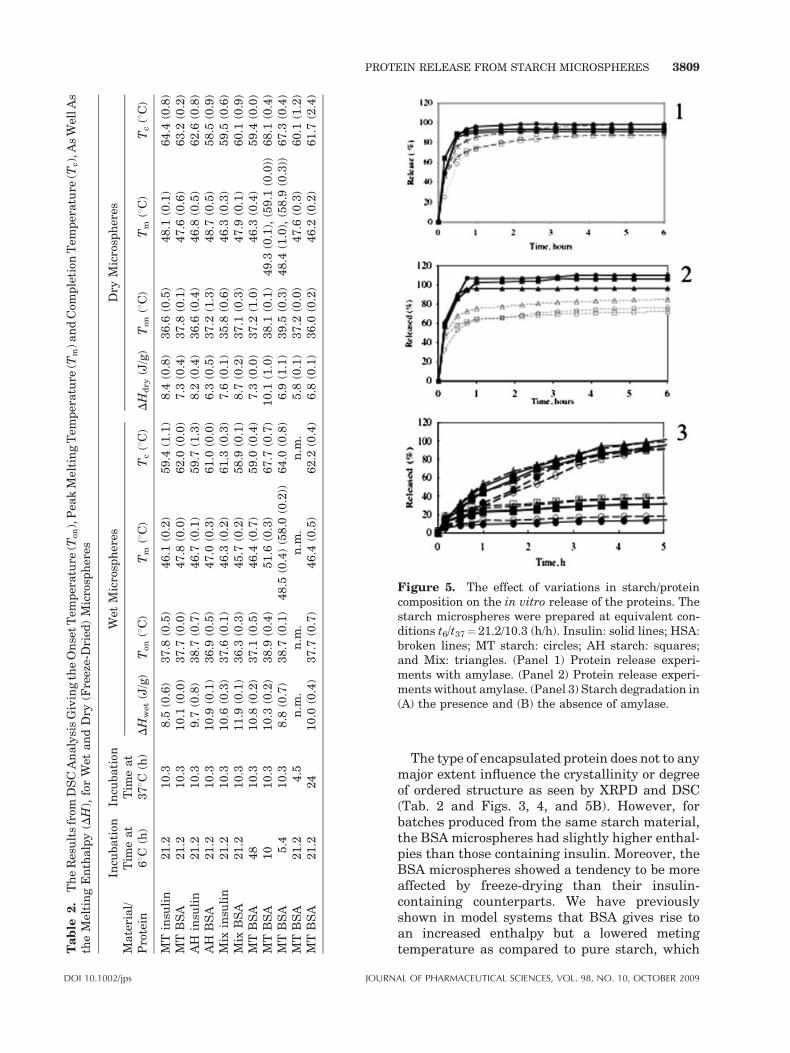
DSC analysis revealed the occurrence of a melt-ing transition for all microspheres (Fig. 4 andTab. 2). Furthermore, the values of DH obtainedfor the dry microspheres were generally lowerthan for their wet counterparts. This demon-strated the destructive effect of freeze-drying onthe crystalline structure, as previously discussedby Elfstrand et al.25
Figures 5 and 6 illustrate the protein releasefrom the freeze-dried microspheres. These experi-ments were carried out in the presence andabsence of a-amylase in the release buffer. Ascan be seen, the initial release was fast with50–80% released within the first hour. Thesubsequent release was normally much slowerand continued for more than 6 h in some cases. Inorder to investigate the initial release kinetics, thefirst four data points where fitted to Eq. (1), wherereleased amount of the protein in percent wasfitted to the time (t) giving two constants a (linked
DOI 10.1002/jps

Figure 3. XRPD diffractograms of freeze-dried starch microspheres. Prepartionconditions: t6/t37¼ 21.2/10.3 (h/h); (A) from MT starch loaded with: (1) insulin,(2) BSA; (B) from AH starch loaded with: (1) insulin, (2) BSA; (C) from a mixture ofMTþAH loaded with: (1) insulin, (2) BSA. Prepared from MT starch loaded with BSA.(D) Variation in incubation time at 68C. The microspheres were incubated for 10.3 h at378C and for various times at 68C: t6 (h)¼ 48 (1); 21.2 (2); 10 (3); 5.4 (4). (E) The variationin incubation time at 378C. The microspheres were incubated for 21.2 h at 68C and forvarious times at 378C: t37 (h)¼ 24 (1); 10.3 (2); 4.5 (3).
PROTEIN RELEASE FROM STARCH MICROSPHERES 3807
to initial burst) and b (linked to the Fickiandiffusion).
Releaseð%Þ ¼ b �ffiffi
tp
þ a (1)
This fit assumes a Fickian diffusion of theprotein but nevertheless allows for an initial bursteffect, as the curve is not forced through zero. Onlyrelease curves where the forth data point werebelow 75% release where investigated and Table 1presents the data from the release in amylasemedia. The results indicate that Fickian diffusionwas plausible and that the intercept was in most
DOI 10.1002/jps JOURN
cases between �10% and 10%. This was taken asan indication that no burst effects occurred forthese batches. It is evident that the releases,according to expectations, were faster and—in thecase of BSA—more complete when amylase waspresent (Figs. 5 and 6). The release of the proteinthus occurred not only due to the diffusion of theprotein molecules from the matrix, but also as aresult of the enzymatic degradation of the starchmatrix. However, the release rate was muchfaster than the rate of starch hydrolysis, and itwas thus likely that diffusion through the starchmatrix was the main release mechanism but that
AL OF PHARMACEUTICAL SCIENCES, VOL. 98, NO. 10, OCTOBER 2009

Figure 4. DSC thermograms of: (A) wet and (B) freeze-dried microspheres preparedunder the conditions t6/t37¼ 21.2/10.3 from MT starch loaded with insulin (1) and BSA(2); from AH starch loaded with insulin (3) and BSA (4); from a mixture of MTþAHstarch loaded with insulin (5) and BSA (6). DSC thermograms of (C) wet and (D) freeze-dried microspheres from MT starch loaded with BSA, prepared under the conditionst6/t37 (h/h)¼ 48/10.3 (7); 10/10.3 (8); 5.4/10.3 (9); 21.2/24 (10), and 21.2/4.5 (11).
3808 ELFSTRAND, ELIASSON, AND WAHLGREN
starch hydrolysis was required in order to accessparts of the microsphere, for example dead endpores.
The results presented and discussed below takeinto account the variation in the encapsulatedprotein, the employed starch material and thevariations in incubation time at 68C and 378C. Forthe sake of comparison, one of the microspherebatches (i.e., MT BSA 21.2/10.3) was included inall the groups. Table 1 presents the incubationtimes, the yields and loadings of all the micro-spheres, as well as their notations.
Effect of the Encapsulated Protein
The loading of the proteins, the encapsulationefficiency as well as the yield of microspheres werefound to differ considerably between BSA andinsulin. The BSA encapsulation was very effectivein all cases, with loadings close to 4%. In certaincases, however, the measured load was higherthan the theoretical one. This could be due eitherto analytical errors, or to the fact that the loss of
JOURNAL OF PHARMACEUTICAL SCIENCES, VOL. 98, NO. 10, OCTOBER 2009
material, (a yield of just around 70% for thissample), affected the ratio between protein andstarch in the microsphere. The encapsulationefficiency was considerably inferior for insulin, inwhich case the loading varied between 0.9% and2% and the encapsulation efficiency between 24%and 49%. The yield was also slightly lower forinsulin than for BSA. This difference in encapsu-lation efficiency could be explained by insulinbeing a smaller molecule than BSA and thusdiffusing out of the microspheres during produc-tion, for instance during washing. Furthermore, itcannot be ruled out that the partitioning of insulinand BSA in the PEG/Starch aqueous two-phasesystem varied. Insulin has in Dextran/PEGsystems been observed to have a high preferencefor the PEG phase26 while other studies havedemonstrated a lower partition coefficient ofBSA.27 However, one should keep in mind thatthe actual molar ratio of protein in the micro-spheres is higher for insulin (1.7–3.4 mmol/gformulation) than for BSA (0.5–0.7 mmol/g for-mulation), as calculated for monomeric protein.
DOI 10.1002/jps
Ta
ble
2.
Th
eR
esu
lts
from
DS
CA
naly
sis
Giv
ing
the
On
set
Tem
per
atu
re(T
on),
Pea
kM
elti
ng
Tem
per
atu
re(T
m)an
dC
omp
leti
onT
emp
eratu
re(T
c),
As
Wel
lA
sth
eM
elti
ng
En
thalp
y(D
H),
for
Wet
an
dD
ry(F
reez
e-D
ried
)M
icro
sph
eres
Mate
rial/
Pro
tein
Incu
bati
onT
ime
at
68C
(h)
Incu
bati
onT
ime
at
378C
(h)
Wet
Mic
rosp
her
esD
ryM
icro
sph
eres
DH
wet
(J/g
)T
on
(8C
)T
m(8
C)
Tc
(8C
)D
Hd
ry(J
/g)
Ton
(8C
)T
m(8
C)
Tc
(8C
)
MT
insu
lin
21.2
10.3
8.5
(0.6
)37.8
(0.5
)46.1
(0.2
)59.4
(1.1
)8.4
(0.8
)36.6
(0.5
)48.1
(0.1
)64.4
(0.8
)M
TB
SA
21.2
10.3
10.1
(0.0
)37.7
(0.0
)47.8
(0.0
)62.0
(0.0
)7.3
(0.4
)37.8
(0.1
)47.6
(0.6
)63.2
(0.2
)A
Hin
suli
n21.2
10.3
9.7
(0.8
)38.7
(0.7
)46.7
(0.1
)59.7
(1.3
)8.2
(0.4
)36.6
(0.4
)46.8
(0.5
)62.6
(0.8
)A
HB
SA
21.2
10.3
10.9
(0.1
)36.9
(0.5
)47.0
(0.3
)61.0
(0.0
)6.3
(0.5
)37.2
(1.3
)48.7
(0.5
)58.5
(0.9
)M
ixin
suli
n21.2
10.3
10.6
(0.3
)37.6
(0.1
)46.3
(0.2
)61.3
(0.3
)7.6
(0.1
)35.8
(0.6
)46.3
(0.3
)59.5
(0.6
)M
ixB
SA
21.2
10.3
11.9
(0.1
)36.3
(0.3
)45.7
(0.2
)58.9
(0.1
)8.7
(0.2
)37.1
(0.3
)47.9
(0.1
)60.1
(0.9
)M
TB
SA
48
10.3
10.8
(0.2
)37.1
(0.5
)46.4
(0.7
)59.0
(0.4
)7.3
(0.0
)37.2
(1.0
)46.3
(0.4
)59.4
(0.0
)M
TB
SA
10
10.3
10.3
(0.2
)38.9
(0.4
)51.6
(0.3
)67.7
(0.7
)10.1
(1.0
)38.1
(0.1
)49.3
(0.1
),(5
9.1
(0.0
))68.1
(0.4
)M
TB
SA
5.4
10.3
8.8
(0.7
)38.7
(0.1
)48.5
(0.4
)(5
8.0
(0.2
))64.0
(0.8
)6.9
(1.1
)39.5
(0.3
)48.4
(1.0
),(5
8.9
(0.3
))67.3
(0.4
)M
TB
SA
21.2
4.5
n.m
.n
.m.
n.m
.n
.m.
5.8
(0.1
)37.2
(0.0
)47.6
(0.3
)60.1
(1.2
)M
TB
SA
21.2
24
10.0
(0.4
)37.7
(0.7
)46.4
(0.5
)62.2
(0.4
)6.8
(0.1
)36.0
(0.2
)46.2
(0.2
)61.7
(2.4
)
Figure 5. The effect of variations in starch/proteincomposition on the in vitro release of the proteins. Thestarch microspheres were prepared at equivalent con-ditions t6/t37¼ 21.2/10.3 (h/h). Insulin: solid lines; HSA:broken lines; MT starch: circles; AH starch: squares;and Mix: triangles. (Panel 1) Protein release experi-ments with amylase. (Panel 2) Protein release experi-ments without amylase. (Panel 3) Starch degradation in(A) the presence and (B) the absence of amylase.
DOI 10.1002/jps JOURN
PROTEIN RELEASE FROM STARCH MICROSPHERES 3809
The type of encapsulated protein does not to anymajor extent influence the crystallinity or degreeof ordered structure as seen by XRPD and DSC(Tab. 2 and Figs. 3, 4, and 5B). However, forbatches produced from the same starch material,the BSA microspheres had slightly higher enthal-pies than those containing insulin. Moreover, theBSA microspheres showed a tendency to be moreaffected by freeze-drying than their insulin-containing counterparts. We have previouslyshown in model systems that BSA gives rise toan increased enthalpy but a lowered metingtemperature as compared to pure starch, which
AL OF PHARMACEUTICAL SCIENCES, VOL. 98, NO. 10, OCTOBER 2009

Figure 6. The effect of variations in incubation conditions on the in vitro release of theproteins. Starch microspheres were prepared from MT starch loaded with BSA. Left:Microspheres incubated for 10.3 h at 378C and for various times at 68C (48 (circle), 21.2(triangle), 10 (square), and 5.4 h (cross)). Right: Microspheres incubated for 21.2 h at 68Cand for various times at 378C (4.5 (triangle)), 10.3 (square), and 24 h (circle). From top tobottom: release in the presence of amylase, release in the absence of amylase, ‘‘starchdegradation’’ symbols are the same for both types of experiments. The curves thatdisplay low amounts of degradation are without amylase.
3810 ELFSTRAND, ELIASSON, AND WAHLGREN
could be indicative of certain polymer proteininteractions.20 It has been shown within our groupthat direct protein interactions with solublestarches are low28 although adsorption ontostarch granules might exist.29 Nevertheless, asseen here, the disparity between microspheresthat differ both in loading and type of protein arequite small and a protein/polymer interaction isunlikely to dominate the release pattern.
Electron microscopy images (Fig. 1) indicatedthat the insulin microspheres contained a largerportion of small particles and debris than theirBSA counterparts. This could in fact be one reason
JOURNAL OF PHARMACEUTICAL SCIENCES, VOL. 98, NO. 10, OCTOBER 2009
for the lower loading in the insulin microspheres,as the increased surface area could lead to largerlosses during production. The morphology of thesurfaces was not affected by the type of proteinthat was encapsulated, thus indicating that theporosity and surface morphology were similar forboth the insulin and BSA microspheres.
The release of protein in the presence andabsence of a-amylase is detailed in Figure 5. In theabsence of amylase, the release of insulin wasmore rapid and more complete (95–100% releasedafter 6 h) than in the case of BSA (70–85%released after 6 h). Due to this rapid release of
DOI 10.1002/jps

PROTEIN RELEASE FROM STARCH MICROSPHERES 3811
insulin, it was not possible to compare the initialrelease kinetics of the two proteins.
The release of insulin in the presence of amylasewas very similar to the release in its absence in thepresence of amylase, 87–96% of BSA was releasedwithin 5 h, whereas it reached values of only72–84% when no amylase was present.
The faster and more complete release in the caseof insulin as opposed to BSA can mainly beexplained by the lower molecular weight of theformer. This provides a faster diffusion throughthe starch matrix and a smaller risk of entrap-ment in sections with narrow pores. Two otherfactors could, however, contribute to the fasterinsulin release: the higher molar concentration ofinsulin in the microspheres and the possibility ofhigher fractions of small microspheres and debrisobserved in the SEM micrographs (Fig. 1).
The release profile and the encapsulationefficiency indicated that BSA was entrapped inthe starch matrix to a greater extent than insulin,and this entrapment should lead to a slowerrelease rate. However, a majority of the BSAmolecules were situated in such a way that theycould be released within an hour. This indicatesthat the molecules were close either to the surfaceor to large, open pores. However, the fact that afull release could not be obtained without amylasealso suggested that a certain fraction of the BSAmolecules were trapped in the matrix, for example,in closed or narrow pores. Another explanationcould be that a fraction of the BSA molecules wereadsorbed or bound to amylopectin. However, thefact that the release curve and the curve forenzymatic degradation differed substantiallyrendered the latter explanation less plausible.
Effect of Starch Material
The physical properties of the three combinationsof material varied to a certain extent. Theenthalpies increased in the order MT<AH<mixed starch (Tab. 2), which was in agreementwith what has been noted previously for thesematerials.22 The effect of freeze-drying, as evi-denced by the decrease in DH, differed from onemicrosphere batch to another (Tab. 2)—none-theless, the difference was more pronounced forthe insulin-containing microspheres. In the insu-lin case, the difference in DH between wet and drymicrospheres was observed to increase in theorder MT<AH<mixed starch. No such behaviorwas seen for the BSA microspheres, but, as for
DOI 10.1002/jps JOURN
insulin, the MT microspheres were less influencedby freeze-drying than the others.
X-ray diffraction showed small differences inthe resolution of the diffraction peaks (Fig. 3). Theresolution varied slightly with the type of starchmaterial: the MT starch had the highest resolu-tion and the mixed starch the lowest. As for thedifference between the two proteins, band-broad-ening could be linked to the size of the crystallites,thus indicating that the AH starch and mixedstarches had smaller crystallites.
The choice of starch material also influenced thestructure and morphology of the microspheres.The difference in the surface morphology was pro-nounced. All six kinds of microspheres revealedsurfaces with hollows or cavities, but the MTmicrospheres had larger cavities and roughersurfaces (Fig. 1). The microspheres produced fromthe mixture of starches resembled the AH micro-spheres more than the MT ones. There might be alink between small crystallites and a smoothersurface and possibly a more porous microsphere.
It was difficult to evaluate material differenceswith regard to the encapsulation efficiency of BSAin the microspheres due to results being close to100%. It was however possible to determine aninfluence of the starch material on the encapsula-tion efficiency for insulin. The MT starch onlyencapsulated 24% of the used protein while theAH starch and the mixture encapsulated close to50%, see Table 1. The difference in encapsulationefficiency was in accordance with the surfacedissimilarities of the starch microspheres, theincrease in enthalpy for the wet microspheres andthe increase of band broadening observed in theX-ray diffraction. It was possible that the entrap-ment of insulin was favored by the formation ofsmall crystallites, and that this might lead toa less porous microspheres. This difference instructure also seemed to affect the amylase-induced starch hydrolysis that increased in theorder MT<AH<MIX. This indicated that thelarger crystallites were harder to hydrolyze.According to Colonna et al.,30 the following eventsshould be considered when relating structuralfeatures to the digestion of solid starchy sub-strates by a-amylase: the diffusion of the enzymemolecules towards the substrate, the porosity ofthe starchy substrates, the absorption of enzymeson the substrate, and finally, catalytic events. Thelatter may be affected by physical properties suchas the crystallinity/degree of ordered structure.However the release of insulin from the micro-spheres did not correspond to this difference in
AL OF PHARMACEUTICAL SCIENCES, VOL. 98, NO. 10, OCTOBER 2009

3812 ELFSTRAND, ELIASSON, AND WAHLGREN
starch hydrolysis, which suggests that the hydro-lysis was not the major release mechanism.Furthermore, the lack of material influence onthe release of insulin could be due to the highrelease rate previously discussed for insulin, andit could not be excluded that a difference would beobserved if the first half hour of release wasstudied with more frequent data points.
In the case of BSA the release rate seemed todepend somewhat on the type of starch that wasemployed for encapsulation. The release of BSAfrom the MT microspheres in the initial phaseseemed to correlate well with Fickian diffusion,and there were no indications of burst effectswhen employing this as the release model. For theAH microspheres, the utilized model presented anintercept at 29%, which could be an indicationthat the AH- microspheres did have an initialburst. In the case of microspheres from mixedstarch, the release was too fast for the kinetics tobe evaluated using the model but an inspection ofthe initial release might provide some indicationof an initial burst also for these microspheres. Ifsuch a burst did exist, the release rate after theinitial burst would be slower for the AH starch asopposed to the MT-starches. It is interesting tonote that the AH-microspheres and the mixedmicrospheres released higher amounts of carbo-hydrates in the absence of amylase than the MTmicrospheres. The release of carbohydrates in theabsence of amylase could be due either to amylasecontamination or, more likely, to the release of lowmolecular weight, noncrystallized material. It isobvious that the MT starch contained much less ofthis material than its AH counterpart. The fastrelease of such material at the interface of themicrospheres could be combined with a burst ofproteins. The difference in the subsequent releaserate could then, as previously discussed, indicatethat the pores of the MT-starch were larger andmore opened.
Effect of Incubation Time
Incubation at 68C
Four batches of starch microspheres were pro-duced from MT starch loaded with BSA. A singleincubation time at 378C was selected (10.3 h),whereas the incubation time at 68C was varied(5.4, 10, 21.1, or 48 h).
The difference in incubation time was foundto have a certain affect on the physical andphysicochemical characteristics of the micro-
JOURNAL OF PHARMACEUTICAL SCIENCES, VOL. 98, NO. 10, OCTOBER 2009
spheres. Figure 4 displays the DSC profiles ofthe microspheres incubated at varying times at68C. Two melting peaks in the DSC thermogramswere recorded for both wet and freeze-driedsamples of the microspheres incubated at 68Cfor the shorter times (5.4 and 10 h). One of thepeaks coincided with the melting peak tempera-ture of other microspheres, that is, about 48–508C,while the other one was recorded at 58–598C.The latter corresponds to the range of meltingpeak temperatures for previously described modelsystems.16
Peak multiplicity in a thermogram can becaused by heterogeneity of the ordered structure.As discussed below, two kinds of particles wereseen on the SEM micrographs of these micro-spheres (Fig. 2), and these particles may be thereason for the obtained results, although nofurther work was done to verify this. The enthalpyof wet microspheres only increased when compar-ing the batch with the shortest incubation time(8.8 J/g) with the other batches (displayingmelting enthalpies above 10 J/g).
XRPD analysis revealed slight differences inthe resolution of the peaks; the poorest peakresolution was observed for the sample that hasbeen incubated the longest at 68C (48 h, Fig. 3).This indicates that this sample contained moreamorphous material or higher amounts of small,nonperfect crystallites than those incubated forthe shorter times at 68C. The DSC results sup-ported this explanation, since these samplespresented the lowest melting temperatures(Tab. 2). The observations were in line with thosereported previously by Durrani and Donald,31
who reported on increasing DSC melting enthal-pies and a lowering of the melting temperaturesfor samples of starch-water dispersions incubatedfor long times at 48C. Furthermore, they relatedthese observations to the growth of a dispropor-tionate amount of smaller, nonperfect crystals.
Spherical particles were, using SEM, observedin all samples, although the images displayedlarge irregular fragments in addition to thespherical particles for the shorter incubationtimes (5.4 and 10 h, Fig. 2). In the images of themicrospheres incubated at 68C for longer times,only spherical particles (sometimes aggregatedbut still round) were apparent. It appeared thatthe microspheres incubated at 68C for 48 h had thesmoothest surface texture of these four kinds ofmicrospheres, while the surface of the particlesincubated at 68C for the shorter times seemed topresent a larger number of cavities. This suggests
DOI 10.1002/jps

PROTEIN RELEASE FROM STARCH MICROSPHERES 3813
that, at 68C, the incubation time was importantfor the formation of round particles, and conse-quently for the surface texture of these particles.
The encapsulation efficiency was seen toincrease with increasing incubation time at 68C.Thus, the encapsulation was augmented withphysical factors that indicated less porous parti-cles, more perfect spheres and smaller nonperfectcrystallites. This was in line with what was seenfor the various starch materials and encapsula-tion of insulin.
The BSA release profiles from the microspheresdiffered in both the rate and the amount of proteinreleased (Fig. 6). The fastest release was observedin the sample incubated for the longest time at 68C(48 h), reaching a release of 86% after 1 h. Thiswas too fast in order to fit the kinetics to theFickian model. This sample stands out since theother three batches displayed slower release rates(68–74% release after 1 h). These could be fitted tothe Fickian model and the intercept for releasein amylase-containing release media varied from�10% to 10%, which was taken as an indicationthat no major burst effect existed for these batches.The release profiles for these three batches wereoverall quite similar, and the difference in releaserate followed the same trend as that seen in starchhydrolysis (Fig. 6).
As mentioned previously, BSA was not com-pletely released from the formulations in theabsence of amylase. The pattern for the differencein release rate was however similar betweenexperiments with and without amylase. Again,the batch incubated for the longest time (48 h) at68C demonstrated the fastest release. For thisbatch, it could not be excluded that there wereburst effects and it is interesting to note that therelease of carbohydrate material in the absence ofstarch microspheres was also at its highest forthis sample. As for the AH starch and the mixedstarches, the high release of carbohydrates wasconnected to a smother surface structure of themicrospheres as opposed to for the other batchestested in this set of experiments and with thelowest resolution in the X-ray data.
Thus, the sample that showed the highestrelease rate and that deviated the most fromthe other tested microspheres was the oneincubated at 68C for 48 h. Characteristic featuresof this sample included the lowest meltingtemperature within this group, an X-ray diffrac-togram with peaks of lower resolution, and thesmoothest particle surface, as observed with SEM.As has already been suggested, it was believed
DOI 10.1002/jps JOURN
that many small crystalline domains of nonperfectnature were formed during the prolonged incuba-tion at this temperature, giving rise to a largerarea available for enzymatic degradation and thusallowing for a faster degradation of the starchmatrix and a faster release of the protein from themicrospheres.
Incubation at 378C
Three batches of starch microspheres producedfrom MT starch loaded with BSA were examinedin order to evaluate the influence of the incubationtime at 378C on the microsphere properties. Themicrospheres were prepared with a single incuba-tion time at 68C (21.2 h), whereas it was varied at378C (4.5, 10.3, and 24 h). As in the previous testseries, the encapsulation efficiency seemed toincrease with increasing incubation time (Tab. 1).
According to the XRPD diffractograms, theresolution was similar for all the samples(Fig. 3), and there were only minor differencesin the DSC melting parameters for the samples ofwet microspheres incubated at 378C for 24 and10.3 h (Tab. 2). Unfortunately, some data for thewet microspheres (MT, BSA 21.2 h/4.5 h) were lostdue to technical reasons. Also the SEM picturesshowed quite similar features for these threebatches. The round particles had a low degree ofaggregation, similar particle sizes and no visibledebris.
In the presence of amylase, the BSA releaseprofiles from these microspheres differed in bothrelease rate and in the amount of released protein(Fig. 6 and Tab. 1). The protein was released fasterfrom the sample incubated for the shortest time at378C (4.5 h) as opposed to the other two samples,and the initial kinetic for this batch could not beanalyzed. The other two batches showed notendency for burst effects and the initial releaserate was somewhat faster for the sample incu-bated at 378C during 10.3 h. However, all thesamples reached levels of 94–100% within 5 h. Therelease of BSA in the absence of amylase was, asfor previous BSA-batches, not completed withinthe duration of the experiment. Levels of 76%,64%, and 54% were reached for the samples incu-bated for 4.5, 10, and 24 h, respectively, at thistemperature (Fig. 6). In contrast to the previoustest series, the degradation of starch proceededat similar rates for all three samples (Fig. 6),which was in line with the observed similaritiesin physical characteristics, for example, the
AL OF PHARMACEUTICAL SCIENCES, VOL. 98, NO. 10, OCTOBER 2009

3814 ELFSTRAND, ELIASSON, AND WAHLGREN
crystallinity/amount of ordered structure, of thesemicrospheres.
The differences in BSA release could thus not beexplained by the diversity of the physical char-acteristics as it had been earlier. However, if onewere to take into account the difference in loadbetween the batches, the release kinetics wouldbecome much more similar and this factor mightthus explain the main difference between thesebatches. It was especially pronounced with regardto the total amount released into amylase-freemedia, but there still existed certain disparities inthe initial release rate between the samples.There was no apparent load effect in the serieswhere the incubation time at 68C was varied.In fact, for this series of experiments the effect ofthe load rather accentuated the observed trendsinstead of decreasing them.
The combined results from these three series ofexperiments led to the conclusion that the releaseof BSA from starch microspheres was affected bythe presence of two populations of BSA molecules:those situated at the surface or in open pores, andthose entrapped in the starch matrix which couldonly be released by its degradation. The rate ofBSA release and the rate of starch hydrolysisseemed to increase when small crystallites wereformed. This was believed be linked to differencesin the pore structure of the microspheres.Furthermore, the loading appeared to be affectedby the total incubation time, as short incubationtimes at both 6 and 378C gave rise to lowerloadings. A consistent correlation was also seenbetween a rough surface morphology of theparticles and XRPD diffractograms with lowresolution, indicating that the changes in crystal-lite properties that led to band broadening inXPRD, that is, small crystallites and highamounts of imperfections, also influenced thesurface morphology of the microspheres. More-over, these microspheres appeared to have ahigher likelihood of displaying burst effects.
CONCLUSIONS
The following conclusions can be drawn from thepresent study.
T
JOURN
he encapsulation of insulin in starch micro-spheres according to the formulation andprocedure described herein was more difficultthan the corresponding encapsulation ofBSA.
AL OF PHARMACEUTICAL SCIENCES, VOL. 98, NO. 10, OCTOBER 200
T
9
he encapsulation efficiency varied withrespect to the starch material, and was foundto be the lowest for the MT starch and higherfor BSA when the incubation time wasincreased at either of the two incubationtemperatures.
F
reeze-drying decreased the degree ofordered structure in the microspheres, anda greater effect was found for those contain-ing BSA as opposed to their insulin-contain-ing counterparts.T
he duration of incubation at 68C was animportant factor for the formation of roundparticles.T
he rate of release from the microspheresvaried depending on the type of protein,and the release rate of BSA was dependenton the incubation time during preparation, atboth 6 and 378C.T
he release of BSA was dependent on twofractions of encapsulated proteins: the frac-tion available for release without degradationof the starch matrix, and the one entrappedand thus unavailable prior to degradation.T
he physicochemical properties of the starchcrystallites, as measured by DSC and XRPD,affected the release rate and were mainlyinfluenced by the starch material and theincubation temperature at 68C.ACKNOWLEDGMENTS
Lars-Erik Briggner, Astra Zeneca Lund, Sweden,is acknowledged for his work with the XRPDanalysis. Many thanks are also due to MonicaJonsson, Stratosphere, Malmo, Sweden, for herpractical help with the microsphere preparationand load/release experiments, and to Rita Wallen,Department of Cell and Organism Biology, Divi-sion of Zoology, Lund University, Sweden, for herhelp with the SEM experiments.
REFERENCES
1. Pereswetoff-Morath L. 1998. Microspheres as nasaldrug delivery systems. Adv Drug Deliv Rev 29:185–194.
2. Bjork E, Edman P. 1988. Degradable starch micro-spheres as a nasal delivery system for insulin. Int JPharm 47:233–238.
DOI 10.1002/jps

PROTEIN RELEASE FROM STARCH MICROSPHERES 3815
3. Illum L, Farraj NF, Critchley H, Davis SS. 1988.Nasal administration of gentamicin using a novelmicrosphere delivery system. Int J Pharm 46:261–265.
4. Illum L, Farraj NF, Davis SS, Johansen BR,O’Hagan DT. 1990. Investigation of the nasalabsorption of biosynthetic human growth hormonein sheep-use of a bioadhesive microsphere deliverysystem. Int J Pharm 63:207–211.
5. Critchley H, Davis SS, Farraj NF, Illum L. 1994.Nasal absorption of desmopressin in rats and sheep.Effect of a bioadhesive microsphere delivery sys-tem. J Pharm Pharmacol 46:651–656.
6. Vivien N, Buri P, Balant L, Lacroix S. 1994. Nasalabsorption of metoclopramide administered to man.Eur J Pharm Biopharm 40:228–231.
7. Shirui M, Jianming C, Huan L, Zhenping W, Dia-nzhou B. 2004. Intranasal administration of mela-tonin starch microsphere. Int J Pharm 272:37–43.
8. Heritage PL, Loomes LM, Jiang J, Brook MA,Underdown BJ, McDermott MR. 1996. Novel poly-mer-grafted starch microparticles for mucosaldelivery of vaccines. Immunology 88:162–168.
9. Sturesson C, Degling Wikingsson L. 2000. Compar-ison of poly(acryl starch) and poly(lactide-co-glyco-lide) microspheres as drug delivery system for arotavirus vaccine. J Control Release 68:441–450.
10. Rydell N, Stertman L, Sjoholm I. 2005. Starchmicroparticles as vaccine adjuvant. Expert OpinDrug Deliv 2:807–828.
11. Mundargi RC, Shelke NB, Rokhade AP, Patil SA,Aminabhavi TM. 2008. Formulation and in-vitroevaluation of novel starch-based tableted micro-spheres for controlled release of ampicillin. Carbo-hydr Polym 71:42–53.
12. Handan S, Selma S, Suheyla KH, Atilla HA, GillesP, Meral E, Mustafa S. 2007. Formulation andcharacterization of formaldehyde cross-linkeddegradable starch microspheres containing terbu-taline sulfate. Drug Dev Ind Pharm 33:147–154.
13. Bajpai AK, Bhanu S. 2007. Dynamics of controlledrelease of heparin from swellable crosslinked starchmicrospheres. J Mater Sci Mater Med 18:1613–1621.
14. Morise Z, Sugioka A, Kato R, Fujita J, Hoshimoto S,Kato T. 2006. Transarterial chemoembolizationwith degradable starch microspheres, irinotecan,and mitomycin-C in patients with liver metastases.J Gastrointest Surg 10:249–258.
15. Reslow M, Jonsson M, Laakso T. 2002. Sustained-release of human growth hormone from PLG-coatedstarch microspheres. Drug Deliv Syst Sci 2:103–109.
16. Reslow M, Gustafsson N-O, Jonsson M, Laakso T.2002. Polymer coated starch microspheres as pro-tein delivery system. Proceedings of the Interna-tional Symposium of Controlled Release BioactiveMaterials 29:698.
17. Elfstrand L, Eliasson A, Jonsson M, Reslow M,Wahlgren M. 2006. From starch to starch micro-
DOI 10.1002/jps JOURN
spheres: Factors controlling the microspheres qual-ity. STARCH-STARKE 58:381–390.
18. Slade L, Levine H, editors. 1987. Recent advancesin starch retrogradation. 1st edition. New York:Golden and Breach Science Publishers. pp. 387–430.
19. Elfstrand L, Eliasson A-C, Jonsson M, Reslow M,Thelin B, Wahlgren M. 2007. Recrystallization ofwaxy maize starch during manufacturing of starchmicrospheres for drug delivery. Optimization byexperimental design. Carbohydr Polym 68:568–576.
20. Elfstrand L, Eliasson A-C, Jonsson M, Larsson M,Simpraga A, Thelin B, Wahlgren M. 2007. Recrys-tallization of waxy maize starch during manufac-turing of starch microspheres for drug delivery:Influence of excipients. Carbohydr Polym 69:732–741.
21. Fredriksson H, Bjorck I, Andersson R, Liljeberg H,Silverio J, Eliasson A-C, Aman P. 2000. Studies ona-amylase degradation of retrograded starch gelsfrom waxy maize and high-amylopectin potato.Carbohydr Polym 43:81–87.
22. Elfstrand L, Frigard T, Andersson R, Eliasson A-C,Jonsson M, Reslow M, Wahlgren M. 2004. Recrys-tallisation behaviour of native and processed waxymaize starch in relation to the molecular character-istics. Carbohydr Polym 57:389–400.
23. Zobel HF. 1988. Starch crystal transformations andtheir industrial importance. Starch/Starke 40:1–7.
24. French D. 1984. Organization of starch granules.In: Whistler RL, BeMiller JN, Paschall EF, editors.Starch chemistry and technology. edition. Orlando:Academic Press. pp. 183–247.
25. Elfstrand L, Eliasson A-C, Wahlgren M. In press.Changes in starch structure during manufacturingof starch microspheres for use in parenteral drugformulations: Effects of temperature treatment.Carbohydr Polym.
26. Moriyama K, Yui N. 1996. Regulated insulinrelease from biodegradable dextran hydrogels con-taining poly(ethylene glycol). J Control Release42:237–248.
27. Gunduz U, Korkmaz K. 2000. Bovine serum albu-min partitioning in an aqueous two-phase system:Effect of pH and sodium chloride concentration.J Chromatogr B 743:255–258.
28. Lundqvist H. 2001. Amylopectin. Interactions withLipids and Proteins, 2nd edition. Thesis, LundUniversity.
29. Eliasson A-C, Tjerneld E. 1990. Adsorption of wheatproteins on wheat starch granules. Ceral Chem 67:366–372.
30. Colonna P, Leloup V, Buleon A. 1992. Limitingfactors of starch hydrolysis. Eur J Clin Nutr 46:17–32.
31. Durrani CM, Donald AM. 1995. Physical character-isation of amylopectin gels. Polym Gels Netw 3:1–27.
AL OF PHARMACEUTICAL SCIENCES, VOL. 98, NO. 10, OCTOBER 2009