Leveraging the valuation gap to buy emerging market growth ...
86
See Appendix A-1 for analyst certification, important disclosures and the status of non-US analysts. Equity Research ANCHOR REPORT India consumer: Breaking through with global M&A? Leveraging the valuation gap to buy emerging market growth outside India Indian consumer companies are increasingly growing overseas inorganically, rather than relying on domestic organic growth. In the past few years, Marico has acquired firms in S Africa, SE Asia and Vietnam, Dabur in Turkey and the US, Godrej in Argentina, Indonesia and Africa. We see several reasons for this trend: slowing growth opportunities at home now that some categories such as soaps, detergents, hair oils, etc. have matured, availability of attractive targets in emerging markets, ability to build scale, and being rewarded in terms of valuation multiples. In this report, we look at each of these factors in detail and discuss why we like GCPL, which has been leading the inorganic growth push. We initiate on Emami, the top player in cooling oil, antiseptic cream, balm and men’s fairness cream, with a Buy, and upgrade Marico to Neutral. Key analysis in this anchor report includes: Trends in overseas acquisitions done by Indian companies over the past couple of years. Why growing inorganically overseas has been a rewarding exercise. What the future holds in terms of inorganic growth. October 23, 2012 Research analysts India Consumer Related Manish Jain - NFASL [email protected] +91 22 4037 4186 Anup Sudhendranath - NSFSPL [email protected] +91 22 4037 5406
-
Upload
khangminh22 -
Category
Documents
-
view
5 -
download
0
Transcript of Leveraging the valuation gap to buy emerging market growth ...

See Appendix A-1 for analyst certification, important disclosures and the status of non-US analysts.
Equity Research
AN
CH
OR
RE
PO
RT
India consumer: Breaking through with global M&A?
Leveraging the valuation gap to buy emerging market growth outside India
Indian consumer companies are increasingly growing overseas inorganically, rather than relying on domestic organic growth. In the past few years, Marico has acquired firms in S Africa, SE Asia and Vietnam, Dabur in Turkey and the US, Godrej in Argentina, Indonesia and Africa.
We see several reasons for this trend: slowing growth opportunities at home now that some categories such as soaps, detergents, hair oils, etc. have matured, availability of attractive targets in emerging markets, ability to build scale, and being rewarded in terms of valuation multiples.
In this report, we look at each of these factors in detail and discuss why we like GCPL, which has been leading the inorganic growth push.
We initiate on Emami, the top player in cooling oil, antiseptic cream, balm and men’s fairness cream, with a Buy, and upgrade Marico to Neutral.
Key analysis in this anchor report includes:
Trends in overseas acquisitions done by Indian companies over the past couple of years.
Why growing inorganically overseas has been a rewarding exercise.
What the future holds in terms of inorganic growth.
October 23, 2012
Research analysts
India Consumer Related
Manish Jain - NFASL [email protected] +91 22 4037 4186
Anup Sudhendranath - NSFSPL [email protected] +91 22 4037 5406

India consumer
GENERAL CONSUMER
EQUITY RESEARCH
Breaking through with global M&A?
Leveraging the valuation gap to buy emerging market growth outside India
October 23, 2012
Action: Inorganic growth will continue to be a theme Mid-cap consumer companies have been particularly active over the past few years in driving inorganic growth. We see several reasons behind this trend including: a) slowing medium-term growth opportunity in the home market, b) availability of attractive targets outside India, c) ability to build scale, and d) being rewarded by the market with higher valuation multiples.
We look at each of these factors in detail and believe this is a trend which will continue in the medium term. We continue to like Buy-rated GCPL, which has been leading the inorganic growth push and we think will continue to do so in the near to medium term.
We initiate on Emami with a Buy rating and TP of INR648. We believe that along with Emami’s position as a focused operator in niche segments, its willingness to look at inorganic growth opportunities means an ability to drive sector-leading profit growth in the medium term. We also upgrade Marico to Neutral as falling raw material prices and the incorporation of a recent acquisition lead to a significant upgrade to our numbers.
Catalysts: Ability to drive inorganic growth in the medium term Strong delivery in the domestic business will be the key driver of earnings and stock prices in the near term, in our view. However, we expect that over the medium term, a company’s ability and willingness to explore inorganic growth opportunities will also be a key factor. Markets have rewarded companies for successfully integrating acquisitions, which we believe will encourage companies to look more favourably to these opportunities in the future.
Valuation: Sector valuations expensive; prefer to play via mid-caps; Top picks: Emami and GCPL At an average FY14F PE multiple of 28.6x, we see sector valuations expensive relative to the Sensex. However within this context, we prefer companies that offer reasonable visibility on growth and less demanding valuations. We like Emami, where we see potential for upside surprise on earnings, and GCPL, where performance of the international business – both organic and inorganic – could surprise positively. Valuations for each are below the sector, further supporting our view at current levels. Fig. 1: Stocks for action
Source: Bloomberg, Nomura estimates, pricing as of 18 Oct 2012. * initiating
Anchor themes
We believe Indian companies will continue to explore inorganic growth opportunities abroad on account of 1) slowing category growth in India; 2) ability to invest for future growth; and 3) being rewarded by the market by way of higher multiples.
Nomura vs consensus
We believe valuation multiples for consumer companies will remain high in the near term and do not see correction back to long-term averages soon.
Research analysts
India Consumer Related
Manish Jain - NFASL [email protected] +91 22 4037 4186
Anup Sudhendranath - NSFSPL [email protected] +91 22 4037 5406
Company Ticker Rating TP (INR) Current price (INR) Upside (%)
Emami HMN IN Buy* 648 517.0 25.3%
Marico MRCO IN Neutral↑ 220 206.0 6.8%
GCPL GCPL IN Buy 800 685.0 16.8%See Appendix A-1 for analyst certification, important disclosures and the status of non-US analysts.

Nomura | India consumer October 23, 2012
2
Contents
3 Executive summary
5 Key figures
7 India consumer has witnessed steady acceleration in growth…
11 What are the common trends that we can identify from recent acquisitions?
13 Six reasons why Indian companies have looked abroad for inorganic growth
31 Key trends we expect to emerge in the medium term
34 Key conclusions
38 Which companies screen well for being potential acquirers?
40 Companies’ views on inorganic growth; a prominent theme
42 Emami
63 Marico Industries
72 Godrej Consumer
81 Appendix A-1

Nomura | India consumer October 23, 2012
3
Executive summary In this report we have looked at why Indian consumer companies are increasingly looking at growing their business outside India by taking the inorganic growth route. We believe it is a reflection of a few factors, including slowing medium-term growth in some HPC categories in India, cheaper valuations for acquisitions done abroad, no sparse availability of potential targets in India (even relatively smaller ones), easy access to capital on account of strong balance sheets, need to look for another avenue for medium- to long-term growth and ambitions to become an emerging market consumer company. The high valuations at which domestic FMCG companies are trading is another incentive for companies to acquire cheaply abroad and achieve higher valuations for the consolidated entity at home.
Underlying growth slowing in the domestic markets across mature HPC categories We find that in many of the mature categories such as soaps, detergents, hair oils etc. the penetration-led growth seen since FY2000 is over. Over the past couple of years, a significant part of the growth which the companies have delivered has been led by distribution expansion and market share gains. We believe that incrementally, growth will be slow from current levels in these categories and the cost of driving growth will likely see a rise. We analyze the growth trajectory in these categories over the past five years and what is the likely growth over the next couple of years. For example, in the laundry segment, sales achieved an 8.4% CAGR over the last five years, which is expected by to slow to 7.1% in 2012 (source: Euromonitor). In bath and shower, the past 5-year CAGR has been 11.7%, with 2012 growth expected to be 8.5%. We expect similar trends across most of the mature HPC categories over the next three years.
Competitive activity in domestic market likely to remain high Competitive activity in mature categories is the best reflection of slowing growth in the categories, in our view, and as they remain at elevated levels. Profitability in these segments has seen a structural decline and will likely remain at these suppressed levels in the medium term. Companies have to spend a significant amount of money to support brands and maintain market share in the mature categories. The high input cost environment in the last year or so has meant a further hit to profitability, although there should be some respite from this in FY13F, we expect, due to falling commodity costs. In emerging HPC categories such as surface cleaners, conditioners, hair gels etc., we still see growth ahead, but the cost of growing the category is significant. Considering the demographics in India and the under-penetration across many consumer segments, we believe the market will remain both attractive and competitive in the medium term.
Ambition to become emerging market consumer company We believe one reason for companies looking at inorganic growth is the ambition to become an emerging market consumer company. We find that even MNCs such as Unilever and P&G have taken this route over the past decade to grow in emerging markets. We believe Indian companies will increasingly look at this route, and in the medium term, we expect that mid-cap consumer companies in India such as Marico, Dabur, and GCPL will have a significant part of their revenues coming from overseas markets in the next 3-5 years.
Markets rewarding inorganic growth There is also a history of markets rewarding companies that have successfully taken inorganic growth opportunities. One best example is GCPL, which has not only been rewarded with similar multiples for its acquisitions, but over the last couple of years, as the company has shown delivery on said targets, its P/E multiple has seen a significant expansion. Marico and Dabur have also been rewarded for inorganic growth; however, the scale has been much smaller compared with GCPL in terms of acquisitions.
Trend of growing inorganically will likely continue Going forward, the trend of Indian companies taking the inorganic growth route is likely to continue, in our view. We find there are certain advantages of growing inorganically:
• wider availability of assets in other emerging markets,
• lower cost of the acquisitions, and
• easy availability of funding.

Nomura | India consumer October 23, 2012
4
Domestic consumer companies such as Dabur, Marico and GCPL have all used this route over the last few years, and we believe they will continue to look at inorganic growth opportunities in the medium term.
We also believe that companies have recognized the need for growing inorganically over the last few years and have put in place management structures which allow them to focus on growing the international business without having any of the pressures of dealing with the issues in the domestic market. We believe that for the companies under our coverage this will significantly enhance the focus internally on growing the international business.
Domestic business growth will be distribution led in the near term Domestic business growth especially for HPC companies is slowing. In that context, we believe one of the common themes that every consumer company has addressed during its investor meetings is to increase its distribution strength. This increase in distribution has come in many forms.
Our discussions with various consumer companies indicates that in the next 2-3 years, management focus will be more on driving increased distribution reach. This is also evident from the actions taken by all the companies in the sector in the last year or so, in our view. Increasingly companies are talking about broadening the direct distribution reach, which should help drive growth in the near term. Also as a result of improved distribution, we note that listed companies have gained share, even as overall category growth has slowed.
Valuations should reflect inorganic growth in the medium term We believe this trend of inorganic growth is likely to continue in the near term. Based on how the market has perceived these acquisitions in the past year or so, we believe that if companies are able to show execution and deliver consistent results, they are rewarded with higher multiples for the consolidated entity. We note this has been clearly reflected in GCPL, where valuation multiples have seen a significant rise over the last couple of years, in conjunction with its acquisitions.
In the case of large caps, we do not see inorganic growth as being as relevant, as their portfolio of products gives them enough opportunity to growth organically. However, we believe segments driving this growth will be different going forward, reflecting the penetration levels across segments. For example, personal products will likely be the key driver of growth for HUVR in the next decade, in our view, versus soaps & detergents which drove growth over the past ten years.
Among the food names in the sector, the inorganic growth theme is less relevant, in our view, as market growth opportunity in India is significant, driven by shifting demographics as well as changing tastes and preferences and increasing incomes. We see limited need or willingness among the food names to explore the inorganic growth route in the near to medium term.

Nomura | India consumer October 23, 2012
5
Key figures Fig. 2: Growth of the Indian FMCG sector (USD mn)
Source: Euromonitor
Fig. 3: Food sub-segment has grown faster
(USDmn) 2005 2011F CAGR (%)
HPC 6,206 12,056 14%
Food 5,902 14,288 19%
Others 2,120 4,073 14%
Total 14,228 30,416 16%
HPC (%) 44% 40%
Food (%) 41% 47%
Others (%) 15% 13%
Total 100% 100%
Source: Euromonitor
Fig. 4: Domestic growth is down from 2006 levels, recent uptick is a result of distribution push across companies; reason to look at inorganic growth
Source: Company, Nomura research
Fig. 5: Domestic acquisition opportunities are more limited and are increasingly getting more expensive; time to look abroad
Date Acquirer Target Transaction Size Deal Multiple
Feb-12 Marico Paras Pharma personal care brands INR~ 7.5bn 5x Sales
Mar-11 Cargill India Sweekar (Marico brand) INR~ 2bn 1.2x Sales
Dec-10 Reckitt Benckiser Paras Pharmaceuticals INR32.6bn 8x Sales
Nov-08 Dabur Fem Care Pharma INR2.84bn 3x Sales
Oct-08 Emami Zandu INR8bn 4x Sales
Jan-05 Dabur Balsara INR1.43bn 0.7x Sales
Source: Company data, Nomura research
0
10,000
20,000
30,000
40,000
50,000
60,000
2005
2006
2007
2008
2009
2010
2011
F
2012
F
2013
F
2014
F
2015
F
0%
5%
10%
15%
20%
25%
30%
2006 2007 2008 2009 2010 2011 2012
GCPL Domestic Marico Domestic Dabur HUL

Nomura | India consumer October 23, 2012
6
Fig. 6: Recent overseas acquisitions by Indian companies – a trend we expect to see continuing over the medium term
Acquirer Acquired Region Date Revenues Areas
Marico ICP Vietnam Vietnam 2011 USD25mn Personal care and men’s grooming products
Marico Derma RX Singapore 2010 USD11mn Skin care solutions
Marico Code 10 Malaysia 2010 USD2.7mn Range of hair creams and hair gels
Marico Ingwe South Africa 2010 USD3.3mn Immuno boosters and the medi pack range
Marico Fiancee Egypt 2006 NA Hair creams and gels
Marico Hair Code Egypt 2006 NA Hair creams and gels
Dabur Hobi Kozmetik Turkey 2010 USD30mn Hair care and skin care products
Dabur Namaste Group USA 2011 USD93mn Ethnic hair care products
Dabur Fem Care India 2007 USD22mn Women’s skin care products
Godrej Consumer Darling Africa 2011 USD222 Ethnic Hair care
Godrej Consumer Tura Nigeria 2010 USD50 Personal care
Godrej Consumer Megasari Indonesia 2010 USD120 Insecticides
Godrej Consumer Issue Argentina 2010 USD33 Hair colours
Godrej Consumer Argencos Argentina 2010 USD12 Hair Care
Source: Company data, Nomura research
Fig. 7: Inorganic growth has helped mid-cap companies grow in scale over the last few years
Source: Company, Nomura research
Fig. 8: Market has rewarded them with high multiples
Source: Company, Nomura research
0
1
2
3
4
5
6
7
8
CLG
T
HU
VR
ITC
Dab
ur
Mar
ico
GC
PL
(x)
10x
15x
20x
25x
30x
35x
Oct
-08
Jan
-09
Ap
r-09
Jul-
09
Oct
-09
Jan
-10
Ap
r-10
Jul-
10
Oct
-10
Jan
-11
Ap
r-11
Jul-
11
Oct
-11
Jan
-12
Ap
r-12
Jul-
12
Oct
-12
GCPL Dabur Marico

Nomura | India consumer October 23, 2012
7
India consumer has witnessed steady acceleration in growth… The FMCG industry, accounting for ~2.2% of the country’s GDP and an estimated size of USD30bn, according to Euromonitor, witnessed steady sales at a 16% CAGR over CY05-CY11. Growth picked up from a CAGR of 12.5% in CY06-09 to 15.6% over the last couple of years. We attribute this to: 1) acceleration in India’s GDP growth and favourable macro-economic conditions; 2) a sharp increase in rural incomes; and 3) rising consumption culture.
Fig. 9: Indian consumer sector has seen robust growth in the last decade (USD mn)
Source: Euromonitor
… But growth has not been even throughout the sector However, within the FCMG industry, the food sector has outgrown the HPC space in the last decade. Our analysis shows that the processed and packaged food sector (~47% of the FMCG market) witnessed 19% sales growth in CY05-11F compared with 14% sales growth in the HPC segment and 16% sales growth in the overall FMCG industry.
Fig. 10: FMCG sector growth led by food sector
2005 2011F CAGR
HPC 6,206 12,056 14%
Food 5,902 14,288 19%
Others 2,120 4,073 14%
Total 14,228 30,416 16%
Source: Euromonitor
Fig. 11: Share of food increasing in FMCG
2005 2011F
HPC (%) 44% 40%
Food (%) 41% 47%
Others (%) 15% 13%
Total 100% 100%
Source: Euromonitor
HPC categories are seeing a slowdown… The growth differential is exaggerated in the mature HPC categories where incremental value growth is slowing into single digits. We identify these categories as bath and shower, dishwashing, insecticides and laundry care. Growth in these categories has been robust in the last decade (source: Euromonitor) led by the under penetration theme, but over the next decade, we see these categories as increasingly mirroring growth rates in globally. Going by Euromonitor estimates, growth in categories such as laundry, insecticides etc, will likely slow to mid- to high-single digits over the next couple of years. As we see from the table below, growth in the laundry segment, which has already trended down to high-single digits in the past five years, is expected to further slow down over the next couple of years. Similarly in the bath and shower segment, value growth reached a 12% CAGR over 2005-10 but will incrementally slowdown over the next couple of years to less than 9%.
0
10,000
20,000
30,000
40,000
50,000
60,000
2005 2006 2007 2008 2009 2010 2011F 2012F 2013F 2014F 2015F

Nomura | India consumer October 23, 2012
8
Fig. 12: Mature HPC categories are seeing a slowdown in India
Household & Personal Care (USDmn) 2005 2010 2012F 2005-10 CAGR (%) 2012F
Laundry detergent 1,644 2,464 2,876 8.4% 7.1%
Insecticides 401 575 664 7.5% 6.6%
Dishwashing 171 315 391 13.0% 10.5%
Surface care 58 101 125 11.8% 10.3%
Total household 2,359 3,591 4,221 8.8% 7.5%
Bath & shower 1,283 2,262 2,698 12.0% 8.5%
Hair care 913 1,723 2,191 13.5% 12.5%
Oral care 627 1,021 1,248 10.2% 9.7%
Skin care 456 884 1,203 14.2% 15.7%
Men's Grooming 268 540 730 15.0% 16.3%
Total personal care 3,847 7,158 9,143 13.2% 12.5%
Source: Euromonitor
… however, this growth is still better relative to other Asian countries HPC markets globally have seen mixed fortunes over the last few years, based on data from Euromonitor. Growth rate across the regions gives a fair indication of the growth markets and which ones are seeing a slowdown. For example, the eastern European market has grown at an average 8.8%, with Russia leading the growth. Western European markets have seen the slowest growth globally at 3.4% for the period FY06-10, with countries such as France, Italy and Spain recording low single-digit growth rates, albeit off a large base. This compares with Asian markets, where growth has been much more robust led by India and China.
However, within the global landscape, India continues to grow solidly. Average value growth in the past 5 years in the personal care category has been close to 13.2%, which is higher than the growth recorded in any other major region in the world. We highlight that for the next few years, we expect that growth will remain robust and Indian companies will continue to rely on certain categories within the HPC space to drive growth. These categories are typically under-penetrated, and hence offer growth opportunities in terms of driving consumption. We identify these categories as skin care, men’s grooming, hair care, body care and surface cleaners etc. which are relatively new categories in India.
Fig. 13: Personal care category value growth (%) by region 2006-10
Source: Euromonitor
13.2
11.5 11.1
8.8
6.05.3
3.8 3.4 3.0 2.8 2.7 2.71.4 1.1
0
2
4
6
8
10
12
14
Ind
ia
Ch
ina
Rus
sia
E E
uro
pe
So
uth
K
ore
a
Po
lan
d
UK
W E
uro
pe
Tai
wan
Hun
gar
y
Ger
man
y
Sp
ain
Italy
Fra
nce

Nomura | India consumer October 23, 2012
9
Mature categories are slowing…per capita consumption theme not working In categories such as toothpaste and soaps, per-capita consumption in India is still well below global averages; thus we see a possibility that those numbers would move up, increasing value growth for the category over the medium term.
However, data from Colgate over the past decade suggests this has not really played out so far, with per-capita consumption of toothpaste at a CAGR of 5% over FY06-FY10. This is not to suggest a change in consumption pattern cannot happen in the medium term, but in the near term, we see no evidence to suggest a change is happening on a wider scale. Consumption habits in HPC categories are also driven by habits. For example, based on studies by Colgate most people in India prefer to brush teeth once a day rather than twice a day. This is despite recommendations from dentists that twice a day is necessity. This habit has started to change in the bigger cities, but in smaller towns, the adage ‘old habits die hard’ remains true to this day.
Fig. 14: Toothpaste penetration in India
Source: Colgate
Fig. 15: Toothpaste per capita consumption (grams per year)
Source: Colgate
Emerging HPC categories offer expensive growth… The ‘emerging’ categories within the HPC space are in niche areas such as surface cleaners, dishwashing, etc. These categories do offer growth domestically, in our view, but it is an expensive exercise to build these categories from scratch and involves a significant amount of investment. Managements have been going slowly on making these investments, given the various challenges already faced in terms of the high level of competition in current categories, as well as pressure to maintain profitability. Fig. 16: HPC category growth in India
Source: Euromonitor, Nomura research
40%
48%
56%
64%
2000
2001
2002
2003
2004
2005
2006
2007
2008
2009 0
75
150
225
300
375
China Malaysia India
2010 2006
0%
2%
4%
6%
8%
10%
12%
14%
16%
Men
's G
room
ing
Ski
n c
are
Hai
r car
e
Dis
hw
ashi
ng
Bat
h &
sh
ow
er
Sur
face
car
e
Ora
l car
e
Laun
dry
d
eter
gen
t
Inse
ctic
ides

Nomura | India consumer October 23, 2012
10
… and small scale makes revenue impact on companies insignificant Looking at the size of some of the emerging HPC categories, we note two key things: first, the categories are very small in terms of revenue contribution. For example, according to data from Euromonitor, the surface cleaning category size is USD114mn, which is ~0.9% of India’s overall HPC segment. Similarly, the dishwashing detergent category is USD354mn which is 2.9% of overall HPC segment. While these categories recorded a 12%-plus CAGR over CY06-11 they are still not very relevant within the HPC segment, in our view. While a category such as shampoo is reasonably well penetrated and large as a percentage of the overall HPC category, a sub-segment within that such as conditioners are still less than 1% of overall HPC sales. Although these emerging categories are growing at much faster pace than both the mature HPC segments and the overall HPC market, we believe it will be at least five years before these segments become more relevant in the larger scheme of things.
Fig. 17: Smaller categories will take a significant time to become relevant in terms of size
(USDmn) CY06 CY11 CAGR (%) % of Total CY06 % of Total CY11
Dishwashing 196 354 13% 2.9% 2.9%
Surface Care 64 114 12% 0.9% 0.9%
Male Grooming 300 628 16% 4.4% 5.2%
Source: Euromonitor
Inorganic growth can provide the next leg of growth For many HPC companies in India, we think the key strategic question is where are the medium-term growth drivers? It is in this context that we believe companies in the HPC space are increasingly looking at the next driver of growth. While HPC categories in India are still attractive in the near term, albeit with their own challenges, we believe the inorganic growth route can provides these companies the next leg of growth. Additionally, it fulfils their ambitions (GCPL, Marico and Dabur have all announced in the past to grow their international businesses) to become an emerging market consumer company.
First steps have already been taken… now time to take it to the next level Increasing overseas exposure through organic growth in the form of exports was the first step. This started about a decade back for our companies under coverage. They now have a sizeable organic presence in countries outside India and have also set up manufacturing facilities in countries outside India.
Over the last five years, companies such as Marico, GCPL and Dabur have also made several acquisitions across various geographies. We believe this is the first step towards recognizing the need to have medium-term growth drivers in place and to diversify away from being a pure domestic business. As we look back at these acquisitions, we have identified that there are various common threads. We identify them below, as we believe there are some key conclusions that can be drawn from the nature of these acquisitions.
Pace of inorganic growth will likely increase over the next few years We also believe that HPC companies that have not yet made acquisitions will increasingly look at taking the inorganic route over the next few years. Emami has been looking aggressively at targets in India, according to management, but apart from the Zandu acquisition, has failed to close any other large deal. Emami has created a niche for itself within the HPC space, with many of its products having only regional competition. The company’s long-term vision is also clear: they will look to grow within India as it is more consistent with their long-term strategy. Emami has been involved in bidding for recent deals including the Paras Pharma deal. It was not successful in the end, despite bidding a higher amount than eventual winning bid. (Source: Emami loses Paras despite highest bid, Business Standard, December 14, 2010). Inorganic growth is part of company’s long-term strategy, but the difference with other HPC players is that Emami will only look to acquire within India.

Nomura | India consumer October 23, 2012
11
What are the common trends that we can identify from recent acquisitions? Looking back at the acquisitions which have happened in the last few years, we find that there are several common threads across these transactions. We these common qualities are not a coincidence and that companies are actively looking for some these threads when evaluating potential targets. We identify what we consider the most important common threads among these acquisitions below:
• Acquisitions are in related businesses
• Family-owned businesses where ability or willingness to scale up is not there
• Most acquired companies in our sample were privately held
• Revenue size is not very large relative to the acquirer, making it easier to assimilate
• Geography has been largely in other emerging markets, with Africa a big driver
Acquisitions are in related businesses One common them we have identified in recent acquisitions is that companies have targeted companies in related businesses. For example, Marico has in the past acquired companies in the hair care segment, where they have number of years of experience with the hair oil brand. Likewise, Godrej Consumer’s acquisitions have been in line with its stated 3x3 strategy. In our view, the idea of going for acquisitions in related areas is that companies have a certain expertise in the category, albeit in another geography, but it gives them the opportunity to more easily integrate the acquisitions as well as looking at potential revenue/cost synergies . We believe this is a deliberate strategy, and one which will continue to be important going forward.
Fig. 18: Recent overseas acquisitions by Indian companies (full list)
Acquirer Acquired Region Date Revenues Areas
Marico ICP Vietnam Vietnam 2011 USD25mn Personal care and mens grooming products
Marico Derma RX Singapore 2010 USD11mn Skin care solutions
Marico Code 10 Malaysia 2010 USD2.7mn Range of hair creams and hair gels
Marico Ingwe South Africa 2010 USD3.3mn Immuno boosters and the medi pack range
Marico Fiancee Egypt 2006 NA Hair creams and gels
Marico Hair Code Egypt 2006 NA Hair creams and gels
Dabur Hobi Kozmetik Turkey 2010 USD30mn Hair care and skin care products
Dabur Namaste Group USA 2011 USD93mn Ethnic hair care products
Godrej Consumer Darling Africa 2011 USD222 Ethnic Hair care
Godrej Consumer Tura Nigeria 2010 USD50 Personal care
Godrej Consumer Megasari Indonesia 2010 USD120 Insecticides
Godrej Consumer Issue Argentina 2010 USD33 Hair colours
Godrej Consumer Argencos Argentina 2010 USD12 Hair Care
Source: Company data, Nomura research
Family-owned businesses where ability or willingness to scale up is absent Again, if we look at acquisitions over the past few years, another common element we found among them that is that the acquired businesses have frequently been owned by families. These family businesses have a strong brand recall and an established presence in the local markets, but the owners may not have had the ability or willingness to scale up the business. This is not uncommon even in India, where our interaction with various companies did suggest there are small niche regional players in the food and

Nomura | India consumer October 23, 2012
12
HPC space which are family-owned businesses but not present at a national level. Additionally, we note that these smaller businesses may need access to capital to scale up their businesses, and that access may or may not be available. Increasing the size of a company also brings in the need to hire more managers to manage it, as it is not possible for the controlling families to manage it on their own.
Most acquired companies in our sample were privately held Another common thread we observed in our sample of acquisitions is that most of them were not listed companies. While inherently it would seem that should not be a consideration, experience of some listed companies in India has not been smooth. For example, when Dabur acquired Fem, it had to undergo a lengthy battle with minority shareholders before getting control of the company. Although laws in each country with regard to takeover of a listed company are different and depend on how much minority interest is to be acquired, we believe it is much tougher to acquire a listed entity. We believe this has been a consideration for the Indian companies when they have looked at potential targets abroad.
Revenue size is not very large relative to the acquirer, making it easier to assimilate When we look at the average size of our sample of acquisitions, we find that on average they are similar to bolt-on acquisition and not a game-changing one for the buyer. For example, Marico’s acquisitions have been in the region of USD3-25mn, where the revenue base for FY12 was in excess of USD771mn. Similarly, when we look at acquisitions made by other mid-cap companies such as Dabur and GCPL, each of their acquisitions was small in revenue terms vs their own size and can be viewed by the market as a bolt-on deal. GCPL ended up making several smaller (in revenue terms) acquisitions over a short period of time, which exaggerated the impact in FY11. The exception to our findings was GCPL’s acquisition of Megasari in Indonesia, where we think GCPL acquired an attractive asset at a reasonable price. Today, the Indonesia business is a key component of the consolidated GCPL. The acquisition was large in terms of absolute revenues, which GCPL broke down into phases to ease the transition. In our view, the idea behind keeping the acquisition size small is that they are easier to assimilate. Dabur CEO Duggal made a similar observation as well in past comments (Source: Smaller buyouts easier to assimilate, Economic Times, July 5, 2010).
Geography has been largely in other emerging markets, with Africa a big driver Another common thread we observe has been the geographic location of where the acquisitions have taken place. GCPL has an established strategy of looking for inorganic growth in South East Asia, Latin America and Africa, according to management. Marico has looked at a variety of geographies including Asia, South Africa, while Dabur has also largely done deals in emerging markets. We believe the bias for these geographies is likely to continue in the medium term.
Nomura | India consumer October 23, 2012
13
Six reasons why Indian companies have looked abroad for inorganic growth
We believe there are six key reasons why Indian companies have started to look outside India for growth. The strategy of growing inorganically seems counter-intuitive given India’s consumption-driven economy likely makes it an attractive market, in our view. However, as we highlight below, we have identified some specific reasons that we believe are driving Indian consumer companies abroad in search of inorganic growth.
• Domestic HPC growth still good, but incrementally slowing down
• Domestic acquisition opportunities are limited and relatively expensive compared with overseas acquisitions
• Ambition to become and emerging market consumer company
• Availability of low-cost funding
• Markets have rewarded this growth strategy
• Need for companies to look for newer markets to drive medium-term growth
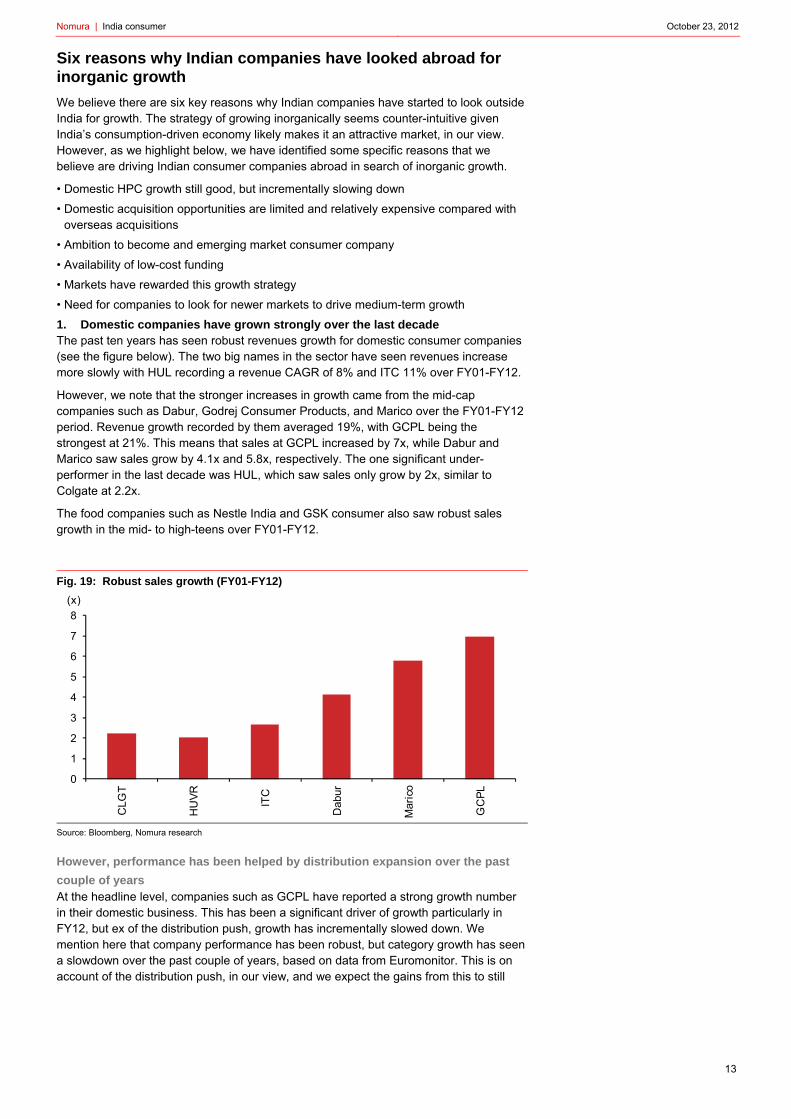
1. Domestic companies have grown strongly over the last decade The past ten years has seen robust revenues growth for domestic consumer companies (see the figure below). The two big names in the sector have seen revenues increase more slowly with HUL recording a revenue CAGR of 8% and ITC 11% over FY01-FY12.
However, we note that the stronger increases in growth came from the mid-cap companies such as Dabur, Godrej Consumer Products, and Marico over the FY01-FY12 period. Revenue growth recorded by them averaged 19%, with GCPL being the strongest at 21%. This means that sales at GCPL increased by 7x, while Dabur and Marico saw sales grow by 4.1x and 5.8x, respectively. The one significant under-performer in the last decade was HUL, which saw sales only grow by 2x, similar to Colgate at 2.2x.
The food companies such as Nestle India and GSK consumer also saw robust sales growth in the mid- to high-teens over FY01-FY12.
Fig. 19: Robust sales growth (FY01-FY12)
Source: Bloomberg, Nomura research
However, performance has been helped by distribution expansion over the past
couple of years At the headline level, companies such as GCPL have reported a strong growth number in their domestic business. This has been a significant driver of growth particularly in FY12, but ex of the distribution push, growth has incrementally slowed down. We mention here that company performance has been robust, but category growth has seen a slowdown over the past couple of years, based on data from Euromonitor. This is on account of the distribution push, in our view, and we expect the gains from this to still
0
1
2
3
4
5
6
7
8
CLG
T
HU
VR
ITC
Dab
ur
Mar
ico
GC
PL
(x)

Nomura | India consumer October 23, 2012
14
accrue for the next couple of years, but overall, given the high penetration level in many of these segments, we believe the medium-term growth trajectory will likely slow.
While we do not expect a significant slowdown in the performance of the domestic HPC companies in the next three years, over the longer term, sales growth performance will likely lag those of food companies where penetration levels in most of the categories are still fairly low. As we highlighted in our report ‘Young and Hungry’ dated 21 February 2011, longer term, we see food companies as much better placed to drive growth organically, which is significantly ahead of HPC companies.
Fig. 20: Domestic business of HPC companies slowing to below long-term average
Source: Company data, Nomura research
The category growth has seen a slowdown driven by certain structural drivers We believe the slowing category growth has been driven by certain key changes in the dynamics of the large HPC categories. We identify them as:
High penetration levels As we have highlighted before, one of the key issues facing the HPC companies is the high penetration levels reached in many of the categories such as toilet, soaps, detergents, hair oil etc. where penetration-led growth is largely behind us. Most consumers already use these products and hence it is incrementally difficult to deliver growth in these categories expect for the “premiumisation” drive. However, these categories are largely commodity plays and hence it is difficult to keep moving consumers to pay more for the same product. This has meant category growth is slowing, which we expect it to further slow over the next decade. In our view, this is the key reason why HUL is increasingly looking at personal products as a growth driver rather than soaps and detergents. Marico recognized this some time back, we believe, and is now looking to grow in other segments such as food, where penetration levels are much lower.
Fig. 21: Penetration-led growth seems to be over
Source: HUL, GCPL
0%
5%
10%
15%
20%
25%
30%
2006 2007 2008 2009 2010 2011 2012
GCPL Domestic Marico Domestic Dabur HUL
Category Urban Rural Urban Rural
Toothpaste 70% 32% 89% 45%
Washing Powder 95% 92%
Hair Wash 40% 16% 62% 46%
Talcum Powder 48% 25% 66% 37%
2002 2010

Nomura | India consumer October 23, 2012
15
High competitive intensity As these mature HPC categories have become increasingly commoditised and penetration levels have peaked, the most likely way for companies to grow within this is to drive market share gains. Thus, competitive intensity has increased significantly in these categories as companies look to maintain growth momentum. However as competitive intensity increases, the cost of driving incremental growth also increases substantially, which has meant profitability has taken a hit in these categories. We believe this high level of competitive intensity is likely to remain in the medium term and possibly even increase from current levels, if larger players try to gain share.
Fig. 22: HUL A&P spend has increased significantly over the medium term
Source: Company data, Nomura research
Profitability on a structural decline As a result of the highly competitive nature of the HPC categories in India and the increasing cost of driving growth, we expect profitability in key segments such as soaps and detergents, toothpaste, hair oils etc will likely decline further from current levels. We have already seen examples of how in many of these categories, profitability has come under pressure in the last few years. We believe an effective way to capture this decline is to see how margins in the soaps and detergents segment have moved within HUL’s portfolio. A decade back soaps and detergents used to be a highly profitable category with margins in the 20%-plus range; structural decline has taken that to low-double digits now, a result of severe competition, which has necessitated large A&P support from companies and thus had an adverse impact on margins.
Fig. 23: HUL soaps and detergents segment margins
Source: Company data, Nomura research
8%
9%
10%
11%
12%
13%
14%
15%
16%
Jun-05 Jun-06 Jun-07 Jun-08 Jun-09 Jun-10 Jun-11 Jun-12
0
5
10
15
20
25
30
35
Mar
-02
Aug
-02
Jan
-03
Jun
-03
No
v-03
Ap
r-04
Sep
-04
Feb
-05
Jul-
05
Dec
-05
May
-06
Oct
-06
Mar
-07
Aug
-07
Jan
-08
Jun
-08
No
v-08
Ap
r-09
Sep
-09
Feb
-10
Jul-
10
Dec
-10
May
-11
Oct
-11
Mar
-12
Aug
-12

Nomura | India consumer October 23, 2012
16
If we look at other companies, where the core domestic business or category is seeing a slowdown, we also see a similar downward trajectory in profitability. For example, coconut oil under the ‘Parachute’ brand continues to be a very important part of Marico’s portfolio. We believe the company’s margins are still significantly impacted by what happens in that category. We see the margin trend moving downwards after having seen a structural upswing in the early part of the decade. In our view, the recent rise is purely on account of a sharp decline in input prices, but over a period of time, we see this trending down as the cost of driving incremental growth in the category increases.
Fig. 24: Marico EBITDA margins
Source: Company data, Nomura research
2. Limited consolidation opportunity in domestic market One of the first questions that we believe bears is considering is why has there been limited consolidation in the domestic market? We believe that in any market when organic growth slows, companies will start to look at consolidating within the local market. We believe the reasons are twofold:
• First, companies understand the market already and it is easier to drive product and marketing strategies if they have knowledge of the consumers in the market
• Second, larger-scale means larger share of profits, more scope for driving efficiencies, which gets reflected in valuations
We see India as a distinct market, where consolidation among local players has not really played out in the last decade on a big scale. There are some specific reasons for this, in our view.
Domestic assets significantly expensive Consumer companies we have met in India over the last couple of years have consistently said their preference is to acquire companies in India. However, there are very few Indian consumer companies which are up for sale, as returns are attractive and reinvestment needs are relatively small. This means very few scalable consumer companies are up for sale in India.
With many of these companies operating in smaller niche segments and/or markets, we have found that they see little reason to sell to established brands. In the few cases where promoters in these businesses are willing to sell out, price demanded is very high. The most recent example of an acquisition in India being very expensive would be the Reckitt Benckiser deal to buy Paras Pharma in December 2010.
Paras Pharma, which had over-the-counter and personal care brands such as ‘Moov’, ‘Krack’, ‘D Cold’, ‘Set Wet’ among others, had sales of close to INR4bn for the year ended March 2010. The deal size was close to INR32.6bn or ~8.2x sales. Paras Pharma had EBITDA of INR1.08bn, which means the deal was done at close to 30x FY10 EBITDA. Paras operated at close to 25-27% EBITDA margins and, according to
8%
9%
10%
11%
12%
13%
14%
15%
16%
Jun
-05
Oct
-05
Feb
-06
Jun
-06
Oct
-06
Feb
-07
Jun
-07
Oct
-07
Feb
-08
Jun
-08
Oct
-08
Feb
-09
Jun
-09
Oct
-09
Feb
-10
Jun
-10
Oct
-10
Feb
-11
Jun
-11
Oct
-11
Feb
-12
Jun
-12

Nomura | India consumer October 23, 2012
17
management, Reckitt Benckiser hopes there is scope to take the margins higher over the medium term.
These valuations are significantly ahead of where domestic companies trade at in India (4-4.5x sales)
Valuations for domestic companies have increased multi-fold over the past ten years and are now at 28.6x FY14F P/E, on our estimate. In the context of high valuations for consumer companies in general, the price paid for Paras Pharma is an indication of how expensive deals are in India.
Emami, which was also said to be in the race to acquire Paras Pharma (source: “Emami loses Paras despite highest bid,” Business Standard, December 2010) said post the announcement of the deal with Reckitt Benckiser that its bid value was much higher at close to INR34bn or 8.5x sales. While there is little to suggest that such valuations can be justified from a shareholder returns perspective, the paucity of targets is what makes the limited numbers of deals that actually go through very expensive, in our view. Marico and Dabur, the two other domestic mid-cap companies, were also in the mix for acquiring Paras Pharma, but eventually opted out of the process (source: “Marico join fray for Paras Pharma,” Reuters, 9 September 2010)
Both companies seemed to have reservations about the valuations that were being asked. Dabur management is quoted in the media as saying they were willing to pay INR25bn for the company, which would still have worked out to 6.25x sales, still expensive even by existing valuations of well established mid cap names such as Dabur itself. Fig. 25: Acquisitions have been getting more expensive
Date Acquirer Target Transaction Size Deal Multiple
Feb-12 Marico Paras Pharma personal care brands
INR~ 7.5bn 5x Sales
Mar-11 Cargill India Sweekar (Marico brand) INR~ 2bn 1.2x Sales
Dec-10 Reckitt Benckiser Paras Pharmaceuticals INR32.6bn 8.2x Sales
Nov-08 Dabur Fem Care Pharma INR2.84bn 3x Sales
Oct-08 Emami Zandu INR8bn 4x Sales
Jan-05 Dabur Balsara INR1.43bn 0.7x Sales
Source: Company data, Nomura research
Marico’s acquisition of some Paras Pharma brands – a case in point Marico acquired the personal care brands of the erstwhile Paras Pharma at the end of FY12, from Reckitt Benckiser for INR7.5bn. The acquisition closed in 1QFY13, so it should have an impact on financials for nine months in the current year. The brands will be transferred from RB to a separate company in which Marico will acquire a 100% stake.
Neutral to negative in the short term, positive long term Overall, while it is a credible move by the company to broaden their product portfolio, in the short term we do not see this as an accretive deal. The multiple paid for the brands was a high 5x sales, which means that the return ratios will only get reflected in the long term. We believe in the short term this deal is neutral for the company, but over the longer term gives it an entry into fast-growing categories such as hair gels and deodorants, which Marico’s management can grow much faster than the erstwhile Paras Pharma group, in our view. This deal again reinforces our view that multiples for domestic acquisition deals will continue to be high.
Family ownership structure prohibits large-scale consolidation One of the other key reasons consolidation among local companies has not played out is the ownership structure of the local companies. Among the listed companies, Dabur, Marico, GCPL, Jyothy Laboratories and Emami all have controlling family ownership, with more than 50% held by the families.

Nomura | India consumer October 23, 2012
18
Most of these companies have a reasonably long history of operation, and family owners continue to see an opportunity to grow the business over the medium term and hence are averse to selling out.
The limited acquisitions that have occurred, such as Emami buying out Zandu, have often happened in somewhat acrimonious circumstances. For example, Emami had to undergo a lengthy court battle to get control of Zandu.
RoE is quite high in the FMCG business in India, and owners of some of the other unlisted companies have been reluctant to sell except when faced with the prospect of exorbitant valuations, as was the case with Paras Pharma.
Another example is the bottled water business in India, where Bisleri has a market leadership position with over 50% of the INR12bn-plus market, despite the entry of multinationals such as Coca Cola and PepsiCo. There were reports in the late 1990s that both these companies were trying to buy out Bisleri, but the family resisted the sale and have gone on to make Bisleri a market-defining brand with a leadership position in the fast-growing bottled water segment. Similarly, the Parle brand of biscuits (privately owned) has continued to define a category of biscuits (Glucose) but has not been sold off to suitors.
A family-owned structure also prevents amalgamation among the players, as there will always be issues with regard to valuation (it is very unlikely that a family will want to give up its full control over a business). We believe these reasons will continue to be relevant even in the medium term, and hence consolidation among the local players looks unlikely.
We believe it is also worth pointing out that multinational companies have a majority shareholding in their listed subsidiaries, so any move on consolidation could well be a decision that needs to be made at the parent-company level. This may also be one of the reasons why decision making on inorganic growth opportunities is a long-drawn process, and hence the smaller number of M&A deals featuring multinationals acquiring local companies in bolt-on deals. In addition, there is the issue of board representation, which makes any deal very complicated.
Fig. 26: Ownership Structure of domestic companies
Company Promoters Ownership (%)
Godrej Consumer Godrej Family 64%
Marico Harsh Mariwala 60%
Dabur Burman Family 69%
Jyothy Labs Ramachandran Family 65%
Emami Agarwal and Goenka Family 73%
Parle Chauhan Family 100%
Britannia Wadia Family 51%
Hindustan Unilever Unilever 52%
Nestle India Nestle SA 63%
Colgate Palmolive Colgate 51%
Source: BSE, Nomura research
Cost of domestic acquisitions has increased with time… With some of the larger domestic acquisitions taking place at sales multiples that could be considered quite expensive, it is easy to extrapolate that all domestic acquisitions have been expensive. However, there have been some deals which have happened at reasonable valuations, but these brands were not growing significantly before being acquired. One example which comes to mind is the acquisition of Fem Care by Dabur in

Nomura | India consumer October 23, 2012
19
2005. This acquisition was done at close to 3x sales, much lower than the Paras Pharma deal multiple.
However, this was done at a time when valuations for consumer companies were not as high as they are today. Deals if done at 3x sales today would be for much less profitable businesses; Fem Care at the time of its acquisition had gross margins in excess of 60%. We estimate the deal, if done today, would have been at close to 6x sales, using the most recent transactions as a guide. Another thing to keep in mind is that Paras Pharma only had a few OTC brands, but some of the domestic FMCG companies have a larger portfolio of brands and hence its valuation multiple would likely be more expensive.
…which means domestic companies have started to look internationally For the reasons we have highlighted above, domestic companies have started to look beyond India in search of acquisition opportunities. This is unsurprising, as the only opportunities that are available for which companies can justify RoCE are all outside the country.
Acquisitions done outside India have been at much cheaper valuations. Additionally, acquisitions done outside India give these companies some amount of geographical diversity in terms of their footprint, which may prove useful over the next few years. Although Indian consumer companies have been acquiring companies outside India for a while now, until recently these acquisitions have been relatively small in size and hence contribution from them has not been significant.
Among the domestic companies, GCPL, Marico and Dabur have been the most active in terms of pursuing inorganic opportunities. We have looked at all the acquisitions done by these companies over the past decade or so. For the purpose of this analysis, we have included all acquisitions, including domestic ones. However, domestic acquisitions have not been a big contributor to overall inorganic acquisitions across these companies, as there have been very few of them over this time period.
What is important to note is that all these companies have expressed a desire to grow inorganically going forward as well and are on the lookout for new acquisitions across the globe. GCPL has given guidance for a near- to medium-term revenue growth target of 25-30%, of which 20% will come organically and the remaining will be derived inorganically. Dabur management has said that over the next five years, close to 50% of the company’s revenues could come from outside India. Marico has always been an active acquirer, and have stated its desire to increase contribution from the international business to closer to 30% in the medium term.
Wider availability of assets – More assets up for sale in international markets Godrej Consumer has a stated strategy of acquiring companies in line with its 3x3 strategy, i.e., in three continents of Asia, Africa and Latin America in home care, hair care and household insecticides. This gives the company a wider scope to look at potential acquisitions. One of the reasons management said it was looking outside India for acquisitions was the wider availability of assets. Acquisitions outside India are more readily available and at valuations which makes them more attractive.
This sentiment was echoed by Dabur as well as Marico, who have both looked outside India for acquisitions over the past few years. While there will always be an element of risk in overseas acquisitions, the valuations at which these companies are available and the bolt-on nature of these deals continues to attract interest.
Most of the recent acquisitions done by Indian companies have been of niche companies which were privately held by entrepreneurs across markets in Asian, Africa and Latin America. These acquisitions have typically been completed at 1.5-2.0x sales, we estimate – much lower than what the local consumer companies in India trade at (typically 4-5x sales).
One of the key questions investors have been asking is why these investors sell for valuations which are low. We would point out here that the valuation of these businesses takes into account the potential difficulty of growing scale quickly, which can be difficult for those lacking the bargaining power to raise money for organic growth. However, with the resources in the hands of much larger Indian companies that then have the ability to

Nomura | India consumer October 23, 2012
20
leverage these acquisitions in other markets where they already have a presence, the ability to grow scale is much easier. Remember, as we highlight in this report, valuations grow with scale, and this is equally true for Indian companies. At the start of this past decade, when these companies had much smaller scale, valuations were closer to 2x sales; this has now grown to ~6x sales, on our readings.
What are the synergies in these acquisitions? One of the key questions to look at while analyzing the overseas acquisitions is the amount of synergies that are visible over the longer term. We believe synergies will mostly be in the form of revenue synergies, with cost synergies probably more back ended.
GCPL has given some guidance in terms of potential synergies recently, after they have had a chance to look at the acquisitions they did last year closely. Company management have outlined a strategy which they estimate will generate INR15-20bn of revenue synergies from acquisitions made last year over a five-year period from FY11-FY15. During the same period the company expects costs synergies of INR2-2.5bn as investments in more robust supply chain systems and other measures to cut overhead costs flow through to the bottom line.
These synergies will, in our view, be more back ended, with the majority of being realized after the next three years. In the first three years starting FY12, we see revenue synergies as adding close to 3% to sales. This is under the assumption that 10% or so of this targeted INR15bn of revenue synergies materialise in year 1 after the acquisition.
We believe there could be a domestic market for some of the products which companies such as Dabur, GCPL and Marico have acquired in the last few years. For example, GCPL has spoken about getting products from the hair care range in Latin America to India, as well as some of the products from their portfolio in Indonesia to India. Marico has demonstrated certain products such as skin and hair care products can be brought into India from other countries such as Malaysia. Derma RX products could be bought into India at some stage. For Dabur, among their recent acquisitions such as Hobi and Namaste group, only real opportunity is to bring products from Hobi to India, while Namaste’s Hair Extensions is a niche product suited to consumers in a specific geography. Thus, driving revenue synergies could be company specific.
Management bandwidth – critical factor for success of M&A One of the most critical factors in terms of the potential success of an M&A transaction is the availability of management bandwidth. While management focus on key areas of the business is always a good indication of how well the business performs, this is especially true in case of an acquisition, where the number of unknown factors is much higher.
Companies such as Dabur, Marico and GCPL have been very successful over the past decade in terms of growing their businesses in India, but they have considerable less experience working in outside markets.
However, we have seen in many of the recent acquisitions that post closing of the transaction, local management teams have been a key part of new management team. This helps to smooth out transition issues and helps to integrate the acquired businesses within the new company.
We cite the example of two companies which have had different lines of thinking on this subject. GCPL, which has closed several acquisitions across three geographies, has said that the issue of management bandwidth is overplayed. If local management has some key members as part of the new management structure, then GCPL believes the integration of these acquisitions can progress smoothly. Dabur, on the other hand, seems to think it is better to go ahead with smaller acquisitions and at a slower pace, so that current management can give adequate time to integrate the acquisitions. This is one of the reasons why Dabur has proceeded more slowly on acquisitions than GPCL.
While the approach to integrating new acquisitions will continue to be company specific, a decentralised system can potentially mean individual geographies and businesses are run as profit centres. This could give a company the best chance to integrate the acquisitions into the parent successfully.

Nomura | India consumer October 23, 2012
21
3. Ambition to become an emerging market consumer company Godrej Consumer has been at the forefront of the acquisition spree over the past couple of years. The company recognized the issues facing some of the categories in India where it has a large presence, as well as the need to look at other avenues of long-term growth. There are a few roads the company could have taken:
• First, the company could have grown within the HPC space in India by branching out into newer categories, including surface cleaners, talcum powder and toilet fresheners. Some of these categories are small but growing quickly, and others are well established. The issue with this approach is that company would have needed to spend a significant amount of money to grow the newer categories, since there are no established players in the segment and bigger companies such as HUL are trying to establish their presence. This would make competition an expensive proposition.
• The second approach was to enter new categories in the food space, where company has had a limited presence, for example, in the form of a JV with Hershey which is no longer operational. The company also has a JV with Tyson Foods in the packaged meat space, but has no presence outside that in emerging packaged foods such as oats and ready to eat. Packaged Food as a category is underpenetrated and will be a driver of growth for the FMCG industry in the long term, in our opinion. We highlighted the opportunity in the food sector in our 21 February 2011 report, Young and hungry. The company has looked into this opportunity, as can be seen from the JVs into which it has entered, but has not focussed on growing them. We would also highlight the investments would be needed to set up a supply chain, which is very different for food and HPC products.
• The third approach was to grow inorganically. Here, there were two options. The first would be to look at options within India. However, because of the limited sellers in the marketplace, the cost of these acquisitions is very high. We have highlighted some recent acquisitions in India which have been done at very high multiples such as the Paras Pharma deal (8.5x sales). The second option within the organic growth route was to look outside India. This is where Godrej had the best options. The company’s ambition was to become an emerging market consumer company, and acquisitions in other emerging markets were what that was lacking in its portfolio.
As Godrej began to look at its options outside India, management found that not only were there several more options to look at – including markets in South East Asia, Latin America and Africa – but also that valuations outside India were much more supportive.. Additionally because the company was underleveraged at the time (2009), there was significant room for the company to leverage its balance sheet to complete these acquisitions.
If emerging markets are the theme why not look at China? One question which comes to mind is that if Godrej is looking to become an emerging markets consumer company, why has it not made any acquisitions in China, the biggest emerging market in terms of total addressable market.
The company gives two key reasons which we list below.
Scale is vital Scale in the consumer business in China is vital as profitability is dependent on a company’s ability to scale up businesses. Since most mid-cap consumer companies are looking for smaller deals, it is difficult for them to look at large scaled-up businesses. According to Godrej, this is a key entry barrier for companies looking to enter China either organically or inorganically.
Corporate governance issues According to Godrej, Indian companies have not been very satisfied with China’s corporate governance standards, which is a critical issue for them. Language is also another issue, and Indian companies would need a local partner in China.

Nomura | India consumer October 23, 2012
22
Not new; others have taken the path to become an emerging market consumer company Some of the largest consumer companies in the world such as Unilever, Danone, and P&G have in recent years acquired companies in emerging markets of Russia, Brazil, and South East Asia etc, which we attribute to two key reasons.
• To fill a portfolio gap: We understand that a number of small-sized acquisitions made in emerging markets by global consumer companies were to fill their portfolio gaps in the local markets. For example, Unilever in 2008 acquired a Russian ice-cream maker Inmakro, which had a strong brand and product portfolio and a clear market leading position in Central and Eastern Russia, and had a fast-growing business across all regions of the Russian Federation and Kazakhstan. The acquisition further strengthened Unilever’s ice-cream business position.
• Expand business into other geographies: This is more relevant from an Indian company’s perspective. Dabur, Marico, and GPCL have all looked to expand outside India, expanding their footprints in geographies where they have limited or no presence, and acquiring companies in these markets. For example, post the acquisition of Hobi and Namaste, Dabur now has presence in Turkey and the US. Similarly, GPCL now has presence in Indonesia, Argentina, South Africa, etc., following its acquisitions.
• We believe companies in India such as Marico, Dabur, GCPL and Emami will continue to look for opportunities outside India because they aim to become an emerging-market consumer company. The key reason why these companies will look to take the inorganic growth route is, in our view, the cost involved to take their existing products to those places. As well, if taking the organic growth route, products that have no existing customer base in new geographies will face difficulties in trying to capture audiences. For example, if Dabur were to take its chwanyprash into Indonesia via the organic route, it might be difficult to get consumers into the category. However, as with its acquisitions of Hobi and Namaste, which have already established a customer base, it helps Dabur to establish presence in new markets at lower costs vs via the organic route. We believe small-sized companies and large MNC consumer companies such as Unilever, P&G and Danone will look at the inorganic growth route to further their growth.
As we look back at the acquisitions done by P&G, Unilever and Danone over the last few years, the theme of increasing exposure to emerging markets has clearly played out. This list below identifies the companies and countries in which large MNC players have made bolt on acquisitions. Fig. 27: Emerging markets acquisitions by global MNC consumer companies
Acquirer Target Date Category Country
Unilever EVGA Sep-10 Ice Creams Greece
Unilever Baltimore Holding ZAO Jul-09 Ketchup Russia
Unilever Napoca Feb-09 Ice Cream Romania
Unilever Inmarko Apr-08 Ice Cream Russia
Unilever Kalina Oct-11 Skin Care Russia
Unilever Darko Aug-11 Ice Cream Bulgaria
Danone Unimilk Jun-10 Milk Russia
PepsiCo Wimm-Bill-Dann Jul-11 Dairy and Fruit Juice Russia
Nestle * Progress Oct-11 Baby Food and Juice Russia
Nestle Wyeth's baby formula business April-12 Baby Food Russia
Source: Company
Note: * As per Reuters, Nestle linked with these acquisitions. October 18 2011
4. Availability of Funding Over the last few years, Indian consumer companies have been acquiring overseas companies using a mix of internal accruals as well as foreign-currency denominated funding. For these companies, their cost of debt has been in the range of LIBOR plus

Nomura | India consumer October 23, 2012
23
150-200bps. This cost of debt is a significant deciding factor in acquisitions, on whether it can be EPS accretive from the first year of operation.
We believe Indian consumer companies have strong balance sheets, a result of their strong organic growth over the last decade and minimal re-investment needs, for acquisitions. They have been generating FCF on a consistent basis, and have largely under levered balance sheets, in our view. We believe this should give them access to low-cost debt funding. We believe the low funding cost of GCPL’s past acquisitions in three continents is a key reason that the acquisitions have been EPS accretive.
We estimate that GCPL pays ~3% USD coupon interest for its USD350mn of debt on the balance sheet. Interest payout for FY12 was INR658mn on a consolidated level. Availability of similar funding for all consumer companies that have looked at inorganic growth in the last couple of years implies that most of these acquisitions would have turned largely EPS accretive in Year 1. A decade ago, Indian companies did not have the scale or the balance sheet size to fund acquisitions in the range of USD50-100mn. This has changed dramatically in the last 2-3 years and we believe companies such as GCPL, Dabur and Marico have the means to leverage the size of their balance sheets for acquisitions in the international markets.
Despite the acquisitions in the last few years, mid-cap consumer companies have maintained net debt/EBITDA in the range of less than 1.5:1. We analyse these companies’ “war chest” prior to 2005 and find that most of them have significantly cut back the amount.

Nomura | India consumer October 23, 2012
24
Fig. 28: “War chest” significantly lower
GCPL (INRmn) 2005 2012
EBITDA 1,027 8,777
Debt 61 15,640
Cash 90 6,399
Net Debt (28) 9,242
Net Debt/EBITDA 0.0x 1.1x
Debt/Equity 0.1x 0.6x
Potential Debt (INRmn) 1,081 9,242
Potential Debt (USDmn) 21 178
Dabur (INRmn) 2005 2012
EBITDA 2,133 8,851
Debt 1,509 10,743
Cash 147 4,484
Net Debt 1,361 6,259
Net Debt/EBITDA 0.6x 0.7x
Debt/Equity 0.4x 0.6x
Potential Debt (INRmn) 1,508 6,259
Potential Debt (USDmn) 29 120
Marico (INRmn) 2005 2012
EBITDA 883 4,844
Debt 657 7,623
Cash 338 1,588
Net Debt 319 6,034
Net Debt/EBITDA 0.4x 1.2x
Debt/Equity 0.3x 0.7x
Potential Debt (INRmn) 1,100 6,034
Potential Debt (USDmn) 21 116
Source: Company, Nomura research
Over the past 5-7 years, the Indian consumer companies have grown scale and ability to fund acquisitions. For example, if based on its FY12 net debt/EBITDA level, GCPL would have raised potential debt of USD21mn compared with its current debt size of close to USD178mln, on our estimates. Likewise, at 1.2x net debt/EBITDA, Marico would be able to raise USD116mn vs USD21mn in 2005. Using the same assumption, we estimate Dabur would be able to raise potential “war chest” of USD120mn vs. USD29mn in 2005.
However, as we have seen in the last few years, mid-cap consumer companies have been on an acquisition spree in the last few years, helped by their strong and robust balance sheets and FCF generation potential. GCPL spent close to USD671mn (including full payment for Darling Group), Marico spent close to USD76mn and Dabur spent USD185mn on acquiring companies, on our estimates.
As shown in the table below, the amount of spending by Indian consumer companies on acquisitions have surpassed USD900mn in the past few years. This has been facilitated by their improved scale that have had enabled them to acquire companies of significant size.

Nomura | India consumer October 23, 2012
25
Fig. 29: Recent acquisitions paid for largely by overseas debt
Godrej Consumer Products Est. Deal Size (USDmn)
Tura 50
Megasari 120
Darling 222
Issue 33
Argencos 12
51% stake in GSLL 234
Total 671
Marico Est. Deal Size (USDmn)
ICP Vietnam 50
Derma RX 17
Code 10 4
Ingwe 5
Total 76
Dabur Est. Deal Size (USDmn)
Hobi Kozmetik 45
Namaste Labs 140
Total 185
Source: Company, Nomura research
Equity raising has been limited in the past, but recent deals suggest otherwise While debt funding has been the preferred method of funding acquisitions for the Indian consumer companies, GCPL has raised equity through the Qualified Institutional Placement route in the last few years to fund parts of its acquisitions. In June 2010, GCPL raised USD115mn via QIP, out of the total USD470mn which was raised by debt and equity. GCPL has been the only company among over coverage to have raised equity to pay for these acquisitions, as the size of acquisitions conducted by Marico and Dabur was relatively small and could be funded by debt and internal accruals. In our opinion, as these companies pay lower acquisitions multiples for overseas businesses, usually at less than half of those needed in India, raising equity at the expense of expanded market cap would usually benefit the companies.
Nevertheless, things have changed over the pasts few months with Marico and GCPL raising equity to finance their deals for the Paras brands and Darling Group, respectively. We believe such a trend is likely to become more visible, as companies are likely to be less averse to diluting equity to grow inorganically. In 2012, Marico raised INR5bn via a 4.8% equity sale. Meanwhile, GCPL allotted 16.7mn shares to Temasek to raise INR6.85bn at INR410/- per share to fund its acquisition of Darling Group in January 2012.
How does the Rupee impact the cost of acquisitions We believe one of the most relevant questions is how has the acquisition dynamic changed given the rupee’s increased volatility in the past 12 months. In our view, one of the advantages of using foreign currency debt to acquire companies in the past was the low funding cost.
However, given the recent sharp volatility seen in the rupee, funding now gets more expensive compared with a year ago. Indeed, the rupee has depreciated by 20%-plus since May 2010, suggesting that acquisitions are ~20% more expensive than a year ago, and consequently raises the question of higher cost of debt, etc. We believe in the short term, this is likely to have an impact with companies going slow on overseas acquisitions. If the rupee were to recover to its long-term average of 45 per US dollar, we believe this issue could be resolved.

Nomura | India consumer October 23, 2012
26
As of now, we believe risk management is very important for companies looking to acquire overseas assets in terms of interest payments and principal repayments. GCPL has repayment obligation of USD15mn per quarter, according to management, which we believe will have a significant cash flow impact. Still, we highlight that when companies acquire assets outside India, their revenue base will also expand to include more foreign currencies, which could provide them with a natural hedge against volatility in the INR/USD rate.
Fig. 30: INR/USD rate volatile lately
Source: Bloomberg, Nomura research
5. Does the market reward scale and growth? We have also looked at the history of the consumer companies over the last decade, analysing how growth and scale had impacted their valuations. We see a strong correlation between growth and valuations over the last decade. Over the last decade, mid-cap companies have seen a significant increase in revenue growth. On our numbers, GCPL has seen the most robust growth with revenues up 7x over FY01-FY12. Other mid-cap domestic consumer companies have also seen robust increases during the same period, for example, Marico’s revenue grew 5.8x and Dabur at 4.1x. HUL has lagged in terms of revenues growth as it only recorded a modest 2x increase. This compares with the sector average of 2.8x, on our readings. Food companies such as Nestle have seen a 4.7x increase, but growth has been more robust in the last five years.
Fig. 31: Robust revenue growth FY01-FY12 (x)
Source: Bloomberg, Nomura research
Market cap of consumer companies have increased ahead of revenue and profit growth. For example, GCPL has seen its market cap increase by 50x over the last decade vs
37
39
41
43
45
47
49
51
53
55
57
59
Jan
-00
Jul-
00
Jan
-01
Jul-
01
Jan
-02
Jul-
02
Jan
-03
Jul-
03
Jan
-04
Jul-
04
Jan
-05
Jul-
05
Jan
-06
Jul-
06
Jan
-07
Jul-
07
Jan
-08
Jul-
08
Jan
-09
Jul-
09
Jan
-10
Jul-
10
Jan
-11
Jul-
11
Jan
-12
Jul-
12
0
1
2
3
4
5
6
7
8
CLGT HUVR ITC Dabur Marico GCPL
(x)

Nomura | India consumer October 23, 2012
27
Marico’s 35x increase in its market value. Dabur has also seen an 11.6x increase in market value over the last decade. To put this into perspective, HUL has seen its market cap increase by 2.7x (worst performer among the consumer stocks in India); ITC saw a 9.6x increase over the same period.
Fig. 32: Market cap of consumer companies FY01-FY12(x)
Source: Bloomberg, Nomura research
Valuations have increased significantly for smaller companies This increase in market cap has been on account of significant increase in valuations for the mid-cap names over the last decade, in our view. The gap with HUL for all these companies has narrowed over the last decade. In 2001, the market cap-to-sales ratio of FMCG companies ex-HUL was 2.3x with HUL at 3.9x. However, the valuation gap has converged over the last decade with the ratio now almost similar for most companies.
Fig. 33: Market Cap to Sales (x)
Source: Bloomberg, Nomura research
Size gives scale benefits which is reflected in valuations One of the benefits of this robust PAT growth has been that scale benefits are now reflected in valuations. For example, Dabur used to trade at sub 10x one-year forward P/E till 2005 (we base the number on a revenue of INR14.9bn and PAT INR1.58bn in 2005) , but as the company has since grown revenues and profits at a robust pace, valuations have overtaken growth (FY12 revenues INR52.8bn, PAT INR6.5bn). The same hold for other mid-cap companies, such as Marico and Godrej Consumer. Conversely, valuations have come off significantly for HUL, as both its revenue and profit growth has lagged those of mid- and large-cap companies.
0
10
20
30
40
50
60
HUVR SKB CLGT NEST ITC Dabur MRCO GCPL
0
1
2
3
4
5
6
7
8
HUVR ITC NEST GCPL Marico Dabur Colgate SKB
(x) 2001 2012

Nomura | India consumer October 23, 2012
28
Fig. 34: Dabur one-year forward P/E
Source: Bloomberg, Nomura research
Fig. 35: GCPL one-year forward P/E
Source: Bloomberg, Nomura research
Fig. 36: Marico one-year forward P/E
Source: Bloomberg, Nomura research
Fig. 37: HUL one-year forward P/E
Source: Bloomberg, Nomura research
ITC has also seen a significant increase in its P/E multiples and is closing its valuation gap with Hindustan Unilever, especially in the early part of the decade and last few years, after having trailed HUL for a number of years.
Fig. 38: HUVR and ITC one-year for P/E
Source: Bloomberg, Nomura research
10
15
20
25
30
35S
ep-0
8
Mar
-09
Sep
-09
Mar
-10
Sep
-10
Mar
-11
Sep
-11
Mar
-12
Sep
-12
10
15
20
25
30
35
Sep
-08
Mar
-09
Sep
-09
Mar
-10
Sep
-10
Mar
-11
Sep
-11
Mar
-12
Sep
-12
10
15
20
25
30
35
Sep
-08
Mar
-09
Sep
-09
Mar
-10
Sep
-10
Mar
-11
Sep
-11
Mar
-12
Sep
-12 15
20
25
30
35
40
Sep
-08
Dec
-08
Mar
-09
Jun
-09
Se p
-09
Dec
-09
Mar
-10
Jun
-10
Se p
-10
Dec
-10
Mar
-11
Jun
-11
Sep
-11
Dec
-11
Mar
-12
Jun
-12
Sep
-12
0
5
10
15
20
25
30
35
40
45
Oct
-03
Feb
-04
Jun
-04
Oct
-04
Feb
-05
Jun
-05
Oct
-05
Feb
-06
Jun
-06
Oct
-06
Feb
-07
Jun
-07
Oct
-07
Feb
-08
Jun
-08
Oct
-08
Feb
-09
Jun
-09
Oct
-09
Feb
-10
Jun
-10
Oct
-10
Feb
-11
Jun
-11
Oct
-11
Feb
-12
Jun
-12
Oct
-12
Hindustan Unilever ITC

Nomura | India consumer October 23, 2012
29
HUL used to be an aggressive acquirer Although HUL has not conducted a major acquisition for a considerable period of time, it used to be an aggressive acquirer in the mid 1990s and early 2000s, during which it bought some prominent brands. Admittedly some of the brands such as Brooke Bond and Ponds were given to the company as a result of acquisitions done by the parent company Unilever, but HUL bought the Kissan brand in 1993 from the UB Group. It also bought Kwality’s ice-cream brand and Modern Foods as part of the Indian government divestment programmes.
Fig. 39: Acquisitions by Hindustan Unilever in India
Acquirer Target Date Area
Unilever Brooke Bond 1984 Tea
Unilever Chesebrough Pond's USA 1986 Cosmetics
Brooke Bond Kothari General Foods 1992 Instant Coffee
HUVR Tata Oil Mills Company 1993 NA
Booke Bond Kissan Foods 1993 Jams, Ketchups and Sauces
HUVR Dollops Icecream 1993 Ice Cream
HUVR 50-50 JV with Lakme 1996 Cosmetics
HUVR Modern Foods 2000 Bread and Bakery
HUVR Amalgam Group 2003 Frozen Sea Food
Source: Company, Nomura research
These acquisitions contributed significantly to HUL’s bottom-line in the initial few years of operation, as HUL put focus to grow the high potential businesses. There was also a significant amount of investment put in to support the growth of these brands.
After acquiring the Kissan brand in 1993, HUL invested heavily in the brand in the first few years. Kissan was the market leader in the categories of jams ketchup and squashes and there were no distinct competitors.
By 2000, the brand was worth close to INR4bn (which we base on HUL’s sales of INR115bn in 2000). It had a leadership position in three of the most under penetrated and growing categories in the market, which were jams, ketchup and squashes. However at that stage, the company decided to adopt a power brand strategy with a focus on visible brands in segments. HUL later merged the Kissan brand with the Annapurna brand, and changed it to the Kissan Annapurna brand to manage packaged staples. While package staples were an attractive market, HUL’s focus on it had cost its shares in the jams and sauces market. Nestlé’s Maggi soon overtook the leading position in the ketchup market, which it managed to maintain for a decade. In jams,
Kissan maintains a leadership with sales of INR1.76bn in an INR2.64bn market. Squashes, which was a very attractive category at the turn of the century, is no longer doing as well as a category, with consumers having a variety of choices since the launch of cola drinks as well as other ready-to-drink juices in the market place.
While we believe the Kissan brand has not been leveraged to its fullest potential since the acquisition in 1993, it has had two distinct phases over the last couple of decades. Until 2000, HUL was able to grow the brand and profits. However lack of focussed investment since 2000 has caused the brand to be worth only INR3.60bn now (we base it on 2% of HUL sales). Although Kissan is only one of HUL’s large portfolio of brands, it was one of the most attractive and visible brands in the early 2000. This illustrates our point that acquiring a promising company / brand is not enough, but a focus on delivery and growing the business is the most crucial aspect.
HUL share prices and P/Es moved up in the early part of 1990s on strong operating performance, but since the turn of the decade, its operating performance was hit by increased competition from domestic and international players, which put an adverse impact on its share prices and P/Es. With the company starting to deliver strong operational performance again, its P/E multiples have seen a sharp re-rating over the last 12 months or so.

Nomura | India consumer October 23, 2012
30
Fig. 40: HUVR share price performance
Source: Bloomberg, Nomura research
Fig. 41: HUVR one year forward P/E
Source: Bloomberg, Nomura research
6. Need to look at medium-term growth avenues Over the last five years, HPC companies have generated a high amount of FCF, implying a significant amount of funds could be available for acquisitions. We believe reinvestment needs to grow capacity in the domestic market is limited as we see current capacity as sufficient to support sales growth. FCF levels have increased significantly across mid-cap names with GCPL generating INR5bn of FCF, Marico INR2bn and Dabur INR4bn in FY12, on our estimates. Dividend payouts across these companies have been reasonably strong over the last few years, in our view. However as these companies have started to look for acquisition opportunities outside India, we expect the payout ratio to drop, especially GCPL that tends to make large-size acquisitions. This drop in dividend payout ratios is a direct consequence of companies looking for medium term growth opportunities, in our view. We believe this is likely to continue as domestic HPC companies will likely continue to use their surplus cash to grow inorganically vs. paying out as dividends.
As mentioned earlier, pursuing organic growth is more expensive vs inorganic growth and the outcome from taking the organic growth path is not certain. While we acknowledge that it is necessary to keep investing behind brands to continue to attract consumers, increased costs in a competitive market such as India is making growing via the organic path less attractive.
In this context we believe companies will look at inorganic growth to drive medium-term growth. Here we see a disconnection between food and HPC companies. Recent acquisitions in the overseas markets have mostly been dominated by the HPC companies. Dabur, GCPL and Marico have been the most active participants in terms of overseas acquisitions. HUL has not looked at acquisition opportunities outside India largely because of the company structure, which places emphasis on each subsidiary of Unilever operating within the geographical boundaries it is based at. However, HUL has over the last couple of decades been involved in a number of acquisitions in India.
But with the food segment growing, there is less need for inorganic growth This is not the case for food categories, in our view, where volume growth is still in mid teens and pricing power with companies is much greater compared to the HPC segment. This is the reason why companies in the food sector under our coverage such as Nestle and GSK Consumer are looking at earnings growth of more than 20% in the medium term. Even in terms of margins, due to better pricing power, these companies have a relatively more stable margin profile over the last few years. This is one reason why we believe companies in the food space have not looked at many acquisition opportunities. One of the things we highlighted in our report ‘Young and
0
100
200
300
400
500
600
700O
ct-0
3
Ap
r-04
Oct
-04
Ap
r-05
Oct
-05
Ap
r-06
Oct
-06
Ap
r-07
Oct
-07
Ap
r-08
Oct
-08
Ap
r-09
Oct
-09
Ap
r-10
Oct
-10
Ap
r-11
Oct
-11
Ap
r-12
Oct
-12
15
20
25
30
35
40
Sep
-08
Dec
-08
Mar
-09
Jun
-09
Se p
-09
Dec
-09
Mar
-10
Jun
-10
Se p
-10
Dec
-10
Mar
-11
Jun
-11
Sep
-11
Dec
-11
Mar
-12
Jun
-12
Sep
-12

Nomura | India consumer October 23, 2012
31
Hungry’ was that unlike the HPC segments, consumers are much less receptive to trying out new products. Tastes and preferences change every few kilometres in India, which makes it very difficult for companies to create a “one product fits all” proposition in the food space. Acquisitions in that sense becomes less relevant especially outside India as taste and preferences are local in nature.
We believe for these reasons, food companies will not be looking at acquisitions in the near term. If there are acquisitions, they are more likely to be brand-specific bolt-on deals like the case with Kissan when HUL bought it in 1993. We highlight that Marico has stated several times in the past they would like to grow the foods part of its business. Press reports (Economic Times, January 11, 2011) suggested that Marico was looking to buy a 51% stake in Unibic India for INR1.3bn. This would have worked out to a price-to- sales ratio of 4.25x, placing it among the more expensive deals in India. Note that Unibic India’s profit margins are much lower than those of Marico, as the biscuit segment (which is Unibic India’s core business) is an attractive, but highly competitive segment. Marico has finally decided against going ahead with the deal.
Key trends we expect to emerge in the medium term
Food segment to grow much faster than the HPC space As we have highlighted in our report ‘Young and Hungry’ dated February 22, 2011, our belief is that the food segment within the consumption space will likely grow much faster than the HPC space in the medium term.
We believe this divergence in growth rates is on account of penetration levels in the HPC space being very high now, competition being much stiffer in the HPC space vs. food space and consumers’ reluctance to trade up in some of the large categories such as detergents, soaps, toothpastes, which makes driving value growth more difficult.
We also believe that on an organic growth basis, food companies will continue to outgrow HPC companies in the medium term. Low penetration levels in several food categories, continued robust growth in incomes, preference to move to more convenient food choices, increasing urbanization are some of the reasons we believe food companies will continue to have a more robust growth trajectory vs. HPC names over the next few years. This will mean that the domestic market share of food in the overall FMCG market is likely to increase over the next decade.
We see the share of emerging food categories such as breakfast cereals, salty snacks, chocolates nearly doubling in the next ten years while the share of mature HPC categories such as detergents, toilet soaps, toothpastes and hair oils declining to 14.5% from the current 19.2%.
Fig. 42: FMCG sector composition
Source: AC Nielsen, Nomura research
7.3 13.4
29.8 32.5
19.2 14.5
30.4 27.6
13.3 12.1
0%
10%
20%
30%
40%
50%
60%
70%
80%
90%
100%
2010 2020
Food emerging Food Others HPC Mature HPC Others Others

Nomura | India consumer October 23, 2012
32
Competition to remain high in the domestic FMCG space In our opinion, the domestic consumer space is likely to continue to see high levels of competitive activity in the medium term. The inherent attractiveness of the market will continue to drive consumer companies to gain a slice of it, in our view. In that context A&P spends and periodic bouts of price wars that we have seen in the last five years are likely to continue to be relevant in the next decade.
Looking back at how A&P spends have increased for the companies over the last decade, we see that as smaller companies such as Marico, Dabur and GCPL became more profitable, they also became more ambitious. This meant there was a significant increase in the A&P spends these companies invested to gain market share in the relevant categories. This is evident from the huge increase in A&P spends that each of these companies has done in the last 5 years.
Even in terms of percentage of sales, these companies used to spend ~8-9% of sales as A&P, which increased to 12-13% over the last few years, on our readings. Although they have been cut back a bit over the last few quarters of FY12, this has been on account of severe gross margin pressures. Companies had already indicated that this level of A&P was not sustainable and they would see a rise in the near term. This has played put already in Q1FY13, when gross margin pressures started to ease and A&P levels started to climb again. We believe longer-term A&P spends will continue to be in the 12-13% range for these companies, signifying continued high competitive activity in the domestic market.
We believe mid-cap companies will increasingly look at inorganic growth opportunities We believe in the medium term, mid-cap companies will increasingly look for inorganic growth opportunities, due to:
• Slowing growth profile of the categories in India
• Wider availability of targets outside India
We believe both these themes will remain relevant over the next few years as increasingly companies such as Dabur, Marico and GCPL will look outside India for the next leg of growth.
The first leg of this move is to take the products outside of India in an organic way, which has already played out over the last decade. We believe the companies have now established a presence in many regions where they have manufacturing facilities and are supplying to neighboring areas. The second leg of this growth is the inorganic growth option which companies have increasingly started to look at over the last few years. As a result of both these actions to grow outside India, contributions from ‘international’ business have increased significantly for the domestic mid-cap companies.
On our estimates, Marico’s international business now contributes 23% of consolidated revenues vs Dabur’s 28%. After a series of acquisitions in the past, GCPL now has a portfolio of which 40% comes from business which are outside India. Soaps, once GCPL’ significant revenue contributor, now contribute less than 20% of revenues, while contribution from the Megasari Group in Indonesia, which GCPL acquired last year, now contributes 20% of revenues.
In this context we would point out that for investors who are looking to invest in India specific domestic growth stories, large-cap names in the sector would, in our view, present a better opportunity. We believe mid-cap names will increasingly become emerging market consumer companies with businesses across several geographies. In that context the risk from issues such as execution, currency etc will also increase for these companies, in our view.
Within this space, we prefer investment in food companies vs. the HPC ones. Nestlé, GSK Consumer and Jubilant Foodworks are our preferred picks. We also like ITC for its long-term growth potential, as we believe its core business will continue to deliver mid teens profit growth despite risks relating to government regulations and taxes.

Nomura | India consumer October 23, 2012
33
Management structures are now in place We would also highlight that companies have not put in place structures to ensure that the focus on international businesses remains high. By structures, we mean that each of the mid-cap consumer companies such as Dabur, Marico and GCPL have all got a separate international business CEO to bring focus needed to grow the international business quickly.
As well, we expect each of these CEOs to be only responsible for the international business portfolio. They should also have a separate team working with them in each functional area, such as sourcing, corporate finance etc.
We list below the medium-term targets for International business contribution as disclosed by the companies.
• Marico expects contributions from the international business to increase from 23% currently to 30% in the next 3-5 years
• GCPL expects contributions from the international business to increase from the current 40% to ~50% over the medium term. This will be the result of further inorganic growth, according to GCPL.
• Dabur expects contributions from the international business to increase to 35% over the medium term from the current 30%.
We believe these structures imply the companies now have a clear philosophy as well as systems to achieve their targets of growing contributions from the international business.
Domestic business growth will be distribution led, in our view As we have highlighted earlier in this report that domestic business growth especially for HPC companies is slowing. In that context, we believe one of the common themes that every consumer company has spoken about is to increase its distribution strength.
This increase in distribution has come in many forms. Each of the companies has spoken about different means and methods to increase their distribution strength. We highlight some of the key trends and figures below
• According to Marico, it will look to increase its direct distribution especially across the rural channel. This has already started in phases with the company’s distribution reach having increased from 2.5mn outlets to 3.5mn outlets over the last 3 years. In the rural channel specifically, the company has increased its reach from 750,000 outlets to 850,000 outlets. This increase in distribution is driving volume growth, although the company admits the incremental volume growth from this level will not be as meaningful.
• Dabur similarly has increased its distribution reach to ~3mn outlets now.
• Hindustan Unilever has added 500,000-plus outlets last year or so and the number of rural outlets has tripled.
• Glaxo Smithkline Consumer has 1.5mn outlets with direct distribution to 700,000 outlets.
Our discussion with various consumer companies indicates that in the next 2-3 years, the focus will be more on driving increased distribution reach. This is also evident from the actions taken by all the companies in the sector last year or so. Increasingly, the companies are talking about direct distribution reach to help drive growth in the near term.
Technology has already become a very important sales driver and we believe advancement in systems will further help the companies to focus on sales across the portfolio. For example, Marico’s sales force now has access to SKU level data that enables it to focus on sales at the brand and SKU level to improve efficiency.
Innovation in the domestic market is increasingly becoming an expensive exercise even if companies are looking to launch a variant of an existing brand, in our view. We expect innovations to be more focussed on packaging and branding in the next couple of years with no breakthrough launches expected from any of the companies. Even if there is a new category/product launch, we believe it would require at least 3-5 years for that brand to make any meaningful contribution to revenue. We cite the example of the oats

Nomura | India consumer October 23, 2012
34
category, as despite it being launched about 1.5 years back, the current market size is only INR2bn, according to Marico management. Marico has gained about 10% share to become the no. 3 player in the market, according to management, but the brand still contributes less than 2% to overall company sales.
Key conclusions
Inorganic growth is going to continue in the near to medium term Current evidence in our view suggests that as business continues to scale up in the next few years, inorganic growth will be one of the pillars of growth for Indian consumer companies. This maybe more relevant for the HPC names than food names, but even for companies such as Marico and Dabur – with presences across food and HPC categories – we think the opportunity to expand their food businesses could come in the form of acquisitions. For companies such as GCPL, we think inorganic growth is likely to be one of the key drivers medium term as opportunity in the domestic market in some of its key segments is now slowing down to less than 10% pa. For large caps such as HUL, while inorganic growth is always likely to be relevant, history does not suggest the company will look to take the inorganic growth route aggressively in the near term.
Incremental value growth will be expensive Driving incremental value growth in some of the highly penetrated HPC categories will be more difficult to come by, in our view. While many of the HPC categories are still underpenetrated, we believe the cost of driving value growth even in such categories will be much higher than in the past. With companies increasingly focused on innovation and consumers more focused on ‘value’, we see companies having to spend an increasing amount gain a share of consumers’ wallets. We back this by citing the example of products such as surface cleaners, where companies have to invest in both growing the brand and in consumer education to drive the market for the product. This is likely to continue, in our view, with marketing spend being high in highly penetrated categories as well as relatively underpenetrated categories. We expect this will mean incremental value growth from these levels will be more expensive.
Competition likely to remain high in the domestic market Competition in the HPC space has been intense over the past few years as MNC players such as HUL and Colgate are competing with local players such as Dabur, Marico and GCLP among others. ITC has also been a strong competitor, which has further made the HPC space highly competitive. Since volume growth in many of the segments has been slowing down, we believe companies want to increase their share in the slow-growing market to outperform market growth. In our view, this entails spending heavily on A&P, which companies have been doing over the past few years.
Fig. 43: HUVR A&P spends as a percentage of sales
Source: Company, Nomura research
Fig. 44: CLGT A&P spends as a percentage of sales
Source: Company, Nomura research
8%
9%
10%
11%
12%
13%
14%
15%
16%
Jun
-05
Jun
-06
Jun
-07
Jun
-08
Jun
-09
Jun
-10
Jun
-11
Jun
-12
8%
10%
12%
14%
16%
18%
20%
22%
24%
Jun
-05
Jun
-06
Jun
-07
Jun
-08
Jun
-09
Jun
-10
Jun
-11
Jun
-12

Nomura | India consumer October 23, 2012
35
We believe this is also borne out by the number of new launches done by some of the HPC companies in the last few years. As companies have continued to innovate through new products and brand extensions, we see the cost of driving revenue growth as increasing. Research done by the HPC companies has shown that products have much shorter shelf life, and even brands that have good recall with consumers – such as Lux, Rin, and Surf Excel – need to be constantly ‘rejuvenated’ to ensure they maintain a share of consumer mind. This is also true for products using the parent brand. For example, Dabur has launched a number of products and brand extensions using the Dabur brand. There is a cost associated with these launches and not all of them have proven to be successful products, based on our findings. Although the success rate in the HPC space maybe better than the food space, cost associated with a product or a brand launch are rising, which we believe could further hold back domestic companies from aggressively pursuing domestic brand launches. In our view, growing inorganically could give these companies a less expensive way to achieve the earnings growth rather than to struggle with competition and new brand launches in the domestic market.
Moreover, we do not expect that competition in the domestic market is likely to decrease as over the next 5 years, we see competitive intensity as only increasing. This will likely put pressure on margins in the domestic market, and if companies can find acquisitions which are niche in nature and are able to deliver margins that are even in the mid-teens, we think it could be a more profitable option for domestic consumer companies.
Fig. 45: Marico product launches
Launch Year Product
FY08 Revive Liquid Stiffener
Saffola diabetes management aata mix
Parachute advansed starz
FY09 Parachute advansed night repair cream
Hair & care almond gold
Maha Thanda
Saffola Zest
Parachute advansed revitalizing hot oil
Saffola Rice
Nihar naturals coconut cooling oil
FY10 Saffola Arise
FY11 Saffola Oats
Derma RX range of products
FY12 Saffola Museli
Source: Company data, Nomura research

Nomura | India consumer October 23, 2012
36
Fig. 46: Dabur product launches
FY12 Dabur Almond Hair Oil
Fem Professional Facial Kits
Fem Body Bleach
FY11 Pudin Hara Fizz
Dabur Chyawanprash flavoured variants
Fem Gold Bleach
Odomos Oil
Nutrigo Health Supplements
Uveda Complete Repair 5
Honitus Day & Night tablets
Fem Safe Handz
FY10 Dabur Amla Flower Magic
Vatika Almond enriched hair oil
Dabur Total Protect shampoo
Glucose new flavors of Lemon & Orange
Real - Apple Nectar, Peach & Black Currant
Babool Mint Fresh
Hajmola - Pudina and Kacha Aam variants
Uveda range of ayurvedic products
FEM hair removal system
Fem Herbal bleach
Source: Company data, Nomura research

Nomura | India consumer October 23, 2012
37
Fig. 47: HUVR product launches and re-launches over the last few quarters
Q1 FY13 Axe Soap bar
Fait and Lovely advanced multivitamin
Pepsodent Expert protection range
Pepsodent Mouthwashes
Lakme Perfect Radiance range
Kissan sweet and spicy ketchup
Selection cups in international flavours
New Vanilla Supreme
Pureit Advanced with Double Protection
Q4 FY12 Lifebuoy clini-care 10
Rin Perfect Shine Fabric Blue
Soupy Noodles Chicken flavour
Fruttare
Selection international flavours
Dove Color Rescue range
Pond's Age Miracle
Lakme Sun Complete damage defense
Vaseline Menz Antispot whitening cream
Q3 FY12 Ponds Active Moisturizer
Dove Body lotions
Rin Bar relaunch
Surf Excel Quickwash
Axe shower gels
Domex Toilet Cleaners
Sunsilk Keratinology
Clinic Plus conditioners
Brud Gold 100% coffee
cup-a-soup instant soups
Source: Company, Nomura research
If we just look at the number of re-launches in the last 4 years, HUL has re-launched more than 30 brands and introduced several other brand extensions. We see two key takeaways from this.
First, these brand re launches mean a significant amount of expenditure on an ongoing basis. Second, the company has been spending a good deal of money on rejuvenating these brands, which means it is taking more and more time to ensure that these brands stay fresh in consumers’ minds. As we have noted previously, the incremental cost of increasing revenues is increasing, and we think that together with a drop in profitability on some of these brands, will mean at some point in time, it may start to hurt growth of other fast-growing areas even more. HUL said at its most recent call that margins in the key soaps and detergents segment cannot remain in single digits for a longer period of time, but the cost of increasing revenues from these levels may mean the incremental returns on capital employed may not have a robust ROI.

Nomura | India consumer October 23, 2012
38
Valuations will continue to chase growth One of the other key long-term trends will be that we expect valuations of domestic companies will move closer to those of the industry leader HUVR. We have already seen this happening over the last decade, and the gap between the mid-cap names and HUVR is now much narrower than ten years ago. Based on our discussions with investors, we have found some who believe that over a period of time, valuations in the sector could move toward SoTP consolidated earnings based. This would be more of a reflection of how these companies should be valued, in our view, as they will have businesses spread across the globe and each business will have their own risks and opportunities. Additionally investors may not want to pay a high multiple for the relatively unknown businesses that these companies could carry in parts of the world where the opportunity size in terms of market potential is not well known.
While domestic FMCG companies over the last five years traded at 22-24x average long-term one-year forward P/E, we think this multiple could head lower if investors decide to attach a valuation to acquired businesses that is only in line with that at which they were acquired. For example, If GCPL is acquiring business for 1.5-2x sales, then that part of the business should also trade at similar valuations and not the 5x at which the combined entity may trade today.
We find this is already happening in some cases such as United Spirits, where the W&M business is getting valued at a lower multiple because of the lower growth prospects and the domestic business is the more attractive opportunity. We see merits to this argument in the long term, but in the short term, we think valuations will be on a consolidated level where we believe the mid-cap names will benefit.
Fig. 48: Sector valuations
Company Ticker Rating Price INREPS growth
FY14E % FY13E P/E FY14E P/E FY14E PEG Market Cap
(USDmn)
Nestle * NEST IN Neutral 4,741 22% 37.9x 31.1x 1.4x 8,791
GSK Consumer * SKB IN Buy 3,018 20% 29.7x 24.7x 1.2x 2,444
Jubilant Foodworks JUBI IN Buy 1,321 38% 53.4x 38.6x 1.0x 1,639
United Spirits UNSP IN Neutral 1,268 20% 45.7x 38.0x 1.9x 3,062
F&B Average 39.8x 32.2x
Colgate Palmolive CLGT IN Reduce 1,242 14% 33.1x 29.0x 2.0x 3,248
Dabur DABUR IN Buy 132 20% 29.8x 24.7x 1.2x 4,412
Godrej Consumer GCPL IN Buy 685 24% 30.1x 24.2x 1.0x 4,482
Hindustan Unilever HUVR IN Neutral 576 16% 38.7x 33.3x 2.1x 23,926
Marico MRCO IN Neutral 206 21% 30.2x 25.0x 1.2x 2,431
Emami HMN IN Buy 517 18% 24.5x 20.8x 1.2x 1,503
HPC Average 35.3x 30.0x
ITC ITC IN Buy 292 18% 31.3x 26.6x 1.5x 43,843
Asian Paints APNT IN Neutral 3,924 20% 34.1x 28.4x 1.4x 7,238
Titan Industries TTAN IN Buy 278 28% 30.3x 23.8x 0.9x 4,747
Source: Bloomberg, Nomura research
Which companies screen well for being potential acquirers?
As we look through the consumer universe in India, we see some companies which are more likely to be acquirers than others. We believe there are a variety of underlying factors that will give companies incentive to be active acquirers. We have screened companies on the basis of three key factors to look for which potentially may make acquisitions over the next few years.

Nomura | India consumer October 23, 2012
39
Business opportunities and management philosophy For companies such as Marico, Godrej Consumer and Dabur, we believe the potential opportunities to grow their business are significant when they look at the inorganic route. This has already been proven by GCPL over the last couple of years: The company had a focus – to grow inorganically within its 3x3 strategy – which then made it easier for management to spot opportunities within the sector and across continents. On a consolidated basis, revenues increased by a CAGR of 33% over FY04-12, which in our view were significantly aided by inorganic growth. Fig. 49: Godrej Consumer revenue growth performance aided by inorganic growth
Source: Company data, Nomura research
Similarly, Marico took the opportunity to grow its domestic business inorganically with the recent purchase of Set Wet, Zatak and Livon brands from Reckitt Benckiser. While there remains concerns around the multiples paid for the acquisition, this gives Marico entry into a segment which has significant growth potential in the long term, in our view. Marico management over the years has been proactive in looking at new business opportunities, including food business, Kaya business, as well as value-added hair oils. In this regard, we view Marico as an acquirer in the long term as opportunities for them could come in the health and wellness space, which is a large opportunity.
At Dabur, we believe management is more conservative than that of GCPL and Marico, which why its pace of inorganic growth has been much slower, with company talking about making smaller bolt-on deals rather than game-changing large acquisitions. We do not see this philosophy changing in the medium term, and hence we look for Dabur to only be a niche acquirer in the long term.
Emami, on the other hand, is in our view going to be a significant acquirer as management remains committed to exploring all avenues of growth. This has also been demonstrated over the last couple of years, when company has participated in various bidding processes across deals in India. For example, Emami participated and actually was the highest bidder in the race to acquire Paras Pharma, which was eventually won by Reckitt Benckiser.
Balance Sheet strength The second aspect we looked at to identify potential acquirers is based on balance sheet strength and how much room companies have to finance possible deals. We looked at the debt/equity ratios of the four most likely acquirers in the consumer space in India, to see whom we believe has enough room to fund more acquisitions. In that regard, we find that Emami has the largest elbow room in terms of balance sheet being under leveraged vs its peers. However this is only a relative comparison and we found overall debt levels to be quite low across all consumer companies in India.
0
5,000
10,000
15,000
20,000
25,000
30,000
35,000
40,000
45,000
50,000
2004 2005 2006 2007 2008 2009 2010 2011 2012

Nomura | India consumer October 23, 2012
40
Fig. 50: Debt/equity ratios remain low across mid-cap consumer names in India
Source: Company, Nomura research
However, we also point out that as and when debt/equity levels have increased at GCPL or Marico, company has not been averse to issuing equity to bring down leverage. Both Marico and GCPL completed equity raisings in FY12, the proceeds of which was used to pay down acquisition-related costs. Equity raising happened at high valuations, which in some sense does justify the money paid to acquire Paras brands on the part of Marico, in our view. We do not see this being the end of equity raisings for companies either, as future courses of action in terms of new equity raising will depend on opportunities that exist [or arise].
Companies’ views on inorganic growth; a prominent theme
Below are takeaways from our meetings with managements on the subject of inorganic growth. Marico Inorganic growth remains on the agenda: As the company has reiterated in the past, inorganic growth in other emerging markets remains on the agenda. South East Asia and Africa will be the preferred options, while Latin America is not on the agenda at this time. Management acknowledged that Africa remains the next growth driver and will continue to look for niche opportunities in that market along with driving the international business organically. Management cites easier availability of assets, more reasonable valuations as the key reasons for looking at inorganic growth outside India. Acquisitions in India remain very expensive and the company will not overpay for an Indian brand. It prefers to add to its international presence through the inorganic route rather than to look at expensive acquisitions in India.
Management structures in place: Over the past few years, Marico has put in place an established structure of having a head of international business that is responsible for driving growth outside India. Each of the countries also has a head supported by a team in various functional areas. This has helped streamline the operations in each country and make it easier to drive performance of the international business as a whole, according to management, which underscore our view. We believe similar structures are in place in other companies which have a significant international business portfolio, such as Dabur and GPCL, helping these companies take a more focused approach to the international business.
Overall, management’s view was one of cautious optimism. Input price softening is a positive, although uncertainty remains around the longer-term sustainable trend for copra prices. A&P spend may see some increase from current levels, but with price increases impacting revenue growth, the ratio to sales may not see a big increase. Foods business remains a positive, but is still at an early development stage.
0.0x
0.2x
0.4x
0.6x
0.8x
1.0x
1.2x
1.4x
GCPL Dabur Marico Emami

Nomura | India consumer October 23, 2012
41
Dabur Overseas business started slow: Management mentioned that overseas business started with selling through the franchise route mainly into the Middle East market where the Indian Diaspora was strong. As the company began to realize the significant long-term potential, they scaled up business and manufacturing facilities were set up to specifically serve consumers in that region. For Dabur, that was the beginning of going aggressively outside India, and focus on that part of the business continues to remain strong.
Expansion into other markets: Management then decided to expand to other markets which were close to the Middle East, as it found there was an inherent demand there from both the Indian Diaspora as well as the local population. Dabur and Vatika were brands which consumers wanted, and this was the push the company needed to expand aggressively into other international markets. Amla hair oil was already used by the locals in the Middle East and advertising gave further push into making some of Dabur’s brands very popular. Management also noted that Egypt was a big market. The company expanded into that market in the early 2000s and it now forms a significant part of the international business.
Focus on MENA, Africa and SE Asia: Management maintains that over the long term, focus areas will be in the MENA, Africa and SE Asia regions. Recent acquisitions in the US and Turkey will further fuel growth in the international business. The company believes that the next big growth driver for consumer companies region wise will be Africa and starting out early will give them an advantage. Management believes it already has a blueprint of how to build scalable business outside India with their success in Egypt.
Emami
Inorganic opportunities few in India: Emami has been actively looking for M&A opportunities within India for the past few years and was in the race to acquire Paras Pharma before it was sold off to Reckitt Benckiser for INR32.6bn. Management claims its bid price was actually higher than the eventual sale price, which shows the confidence that company had in its ability to scale up the Paras Pharma business. Emami continues to maintain that inorganic growth opportunities in India are very limited and attributes this to several reasons:
Most small business owners do not want to sell: The company believes most of the smaller family-held consumer businesses will never be for sale, as the business remains a fast-growing and high-return option for the owners. Additionally, since in many cases the business has been run by the family for the past several decades, it remains a family tradition to keep it running and not sell off to another group.
Limited options for deploying the cash: Most of these family-owned businesses view the family business as a way of life, Emami management believes; thus, even if they were to sell their business, they believe there would limited options to deploy the cash. These businesses are high margin, very low capex, which have a high RoE, as most of the cash generated is distributed as dividends. Many of these brands although not national, are strong niche brands in specific regional areas, and in that context, management believes there is no compelling reason for the promoters to sell.
Smaller acquisitions possible: The company is still hopeful that smaller niche brands could become available domestically, and they would be interested in such deals. These opportunities could be financed by way of existing debt and internal accruals. However, these would likely be small regional opportunities and Emami would likely then have to spend some money on taking it national.
Overseas markets relevant now: Overseas markets now bring in ~14% of revenues for Emami. This has increased significantly in the past few years. As of FY12, contribution from the Middle East is 25-30%, Africa is 20%, SAARC countries are 20% and CIS is 20%. Parts of the Middle East business have seen some softness on account of civil unrest, but is still on course to deliver solid growth, according to management. Africa remains a very attractive market, which the company hopes to leverage in the long term.

Key company data: See page 2 for company data and detailed price/index chart.
Emami EMAM.NS HMN IN .
CONSUMER RELATED
EQUITY RESEARCH
Initiate with Buy rating
Market leadership in niche segments likely to remain an advantage medium term
October 23, 2012
Rating Starts at
Buy
Target price Starts at
INR 648
Closing price October 18, 2012
INR 517
Potential upside +25.3%
Action: Initiate coverage with Buy rating and TP of INR648 We initiate coverage of Emami with a Buy rating and TP of INR648, implying upside potential of 25% from current levels. Emami has a differentiated offering in niche segments across the HPC space, which has helped it to avoid competition from MNC players. The niche offerings also bring Emami a far higher gross margin than that of the average HPC player, which has allowed it to invest back into A&P to further grow its core segments over the past few years. We like this strategy for the long term and initiative coverage with a Buy call.
Catalysts: Increasing penetration in key segments, valuation rerating Penetration levels in the key segments in which Emami operates are still low; this should provide an opportunity for it to grow in the medium term. We believe that many of these segments can grow at 15%-plus over the next few years and that Emami stands to benefit from this growth as the market leader or the second-largest player.
Valuation: Trading at FY14F P/E of 20.8x – a significant discount to sector average of 28.6x Emami shares trade at a 27% discount to the broader sector average. Over the next year, we look for this valuation gap to narrow. On our estimates, Emami should be able to deliver a 17%+ EPS CAGR over FY13-15F, which is in broadly line with the sector average. With its distinct portfolio and ability to command strong brand loyalty from its consumers, Emami seems well placed to deliver robust earnings growth, in our view. We initiate with a Buy and TP of INR648, implying 25% potential upside.
31 Mar FY12 FY13F FY14F FY15F
Currency (INR) Actual Old New Old New Old New
Revenue (mn) 14,535 17,213 20,078 23,437
Reported net profit (mn) 2,588 3,189 3,754 4,405
Normalised net profit (mn) 2,725 3,189 3,754 4,405
FD normalised EPS 18.01 21.08 24.81 29.11
FD norm. EPS growth (%) 26.1 17.0 17.7 17.3
FD normalised P/E (x) 28.7 N/A 24.5 N/A 20.8 N/A 17.7
EV/EBITDA (x) 25.8 N/A 21.1 N/A 17.8 N/A 14.9
Price/book (x) 11.1 N/A 9.0 N/A 7.4 N/A 6.1
Dividend yield (%) 1.8 N/A 2.0 N/A 2.4 N/A 2.8
ROE (%) 37.1 40.6 39.1 37.8
Net debt/equity (%) net cash net cash net cash net cash
Source: Company data, Nomura estimates
Anchor themes
Emami is a focused operator that leads in most of the categories in which it operates. We see it continuing to enjoy higher gross margins than the industry average and far more opportunities to drive brand investment than its peers.
Nomura vs consensus
We are 4% ahead of consensus on FY13F earnings as we believe the company can deliver better margins than in FY12.
Research analysts
India Consumer Related
Manish Jain - NFASL [email protected] +91 22 4037 4186
Anup Sudhendranath - NSFSPL [email protected] +91 22 4037 5406
See Appendix A-1 for analyst certification, important disclosures and the status of non-US analysts.

Nomura | Emami October 23, 2012
43
Key data on Emami Income statement (INRmn) Year-end 31 Mar FY11 FY12 FY13F FY14F FY15FRevenue 12,471 14,535 17,213 20,078 23,437Cost of goods sold -5,232 -6,264 -7,070 -8,236 -9,604Gross profit 7,239 8,271 10,143 11,842 13,833SG&A -4,089 -4,566 -5,705 -6,642 -7,734Employee share expense -729 -923 -1,067 -1,245 -1,453Operating profit 2,421 2,782 3,371 3,954 4,646
EBITDA 2,561 2,970 3,607 4,212 4,922Depreciation -140 -188 -235 -257 -276Amortisation 0 0 0 0 0EBIT 2,421 2,782 3,371 3,954 4,646Net interest expense -152 -152 -175 -185 -200Associates & JCEs 0 0 0 0 0Other income 296 496 600 700 800Earnings before tax 2,565 3,126 3,796 4,469 5,246Income tax -404 -401 -607 -715 -840Net profit after tax 2,161 2,724 3,189 3,754 4,405Minority interests 0 0 0 0 0Other items 0 0 0 0 0Preferred dividends 0 0 0 0 0Normalised NPAT 2,161 2,725 3,189 3,754 4,405Extraordinary items 126 -136 0 0 0Reported NPAT 2,287 2,588 3,189 3,754 4,405Dividends -618 -1,405 -1,594 -1,877 -2,206Transfer to reserves 1,670 1,184 1,594 1,877 2,199
Valuation and ratio analysis
Reported P/E (x) 34.2 30.2 24.5 20.8 17.7Normalised P/E (x) 36.2 28.7 24.5 20.8 17.7FD normalised P/E (x) 36.2 28.7 24.5 20.8 17.7FD normalised P/E at price target (x) 45.4 36.0 30.7 26.1 22.3Dividend yield (%) 0.8 1.8 2.0 2.4 2.8Price/cashflow (x) 45.3 14.7 32.7 19.6 16.8Price/book (x) 11.3 11.1 9.0 7.4 6.1EV/EBITDA (x) 30.4 25.8 21.1 17.8 14.9EV/EBIT (x) 32.2 27.5 22.6 18.9 15.8Gross margin (%) 58.0 56.9 58.9 59.0 59.0EBITDA margin (%) 20.5 20.4 21.0 21.0 21.0EBIT margin (%) 19.4 19.1 19.6 19.7 19.8Net margin (%) 18.3 17.8 18.5 18.7 18.8Effective tax rate (%) 15.8 12.8 16.0 16.0 16.0Dividend payout (%) 27.0 54.3 50.0 50.0 50.1Capex to sales (%) 3.7 12.4 1.9 5.0 4.3Capex to depreciation (x) 3.3 9.6 1.4 3.9 3.6ROE (%) 34.8 37.1 40.6 39.1 37.8ROA (pretax %) 27.2 31.1 34.7 35.5 36.9
Growth (%)
Revenue 20.1 16.6 18.4 16.6 16.7EBITDA 4.0 15.9 21.5 16.8 16.9EBIT 4.9 14.9 21.2 17.3 17.5Normalised EPS 21.1 26.1 17.0 17.7 17.3Normalised FDEPS 21.1 26.1 17.0 17.7 17.3
Per share
Reported EPS (INR) 15.12 17.11 21.08 24.81 29.11Norm EPS (INR) 14.28 18.01 21.08 24.81 29.11Fully diluted norm EPS (INR) 14.28 18.01 21.08 24.81 29.11Book value per share (INR) 45.59 46.70 57.24 69.64 84.22DPS (INR) 4.08 9.28 10.54 12.41 14.58Source: Company data, Nomura estimates
Relative performance chart (one year)
Source: ThomsonReuters, Nomura research
(%) 1M 3M 12M
Absolute (INR) 3.5 4.4 26.3
Absolute (USD) 5.7 9.2 17.5
Relative to index 1.7 -5.6 14.7
Market cap (USDmn) 1,475.0
Estimated free float (%) 27.0
52-week range (INR) 548/311.85
3-mth avg daily turnover (USDmn)
1.21
Major shareholders (%)
T Rowe Price 3.3
Capital Research 3.3
Source: Thomson Reuters, Nomura research
Notes

Nomura | Emami October 23, 2012
44
Cashflow (INRmn) Year-end 31 Mar FY11 FY12 FY13F FY14F FY15FEBITDA 2,561 2,970 3,607 4,212 4,922Change in working capital -740 1,878 -309 -33 -38Other operating cashflow -95 482 -909 -200 -233Cashflow from operations 1,726 5,330 2,389 3,979 4,650Capital expenditure -462 -1,806 -332 -1,000 -1,000Free cashflow 1,264 3,523 2,057 2,979 3,650Reduction in investments 550 -737 0 0 0Net acquisitions 0 0 0 0
Reduction in other LT assets 0 0 0 0 0Addition in other LT liabilities 67 8 0 0 0Adjustments 0 0 0 0
Cashflow after investing acts 1,881 2,794 2,057 2,979 3,650Cash dividends -618 -1,405 -1,594 -1,877 -2,206Equity issue 0 0 0 0 0Debt issue -773 -735 -100 -100 -100Convertible debt issue 0 0 0 0 0Others 0 0 0 0 0Cashflow from financial acts -1,391 -2,140 -1,694 -1,977 -2,306Net cashflow 491 654 363 1,002 1,344Beginning cash 1,614 2,105 2,759 3,122 4,124Ending cash 2,105 2,759 3,122 4,124 5,468Ending net debt -288 -1,677 -2,140 -3,242 -4,686Source: Company data, Nomura estimates
Balance sheet (INRmn) As at 31 Mar FY11 FY12 FY13F FY14F FY15FCash & equivalents 2,105 2,759 3,122 4,124 5,468Marketable securities 0 0 0 0 0Accounts receivable 1,089 1,012 1,179 1,375 1,605Inventories 1,234 1,122 1,320 1,540 1,798Other current assets 1,570 1,232 1,462 1,705 1,991Total current assets 5,997 6,125 7,084 8,745 10,862LT investments 66 803 803 803 803Fixed assets 4,909 4,803 5,668 6,411 7,134Goodwill 8 42
Other intangible assets 0 0 0 0 0Other LT assets 0 0 0 0 0Total assets 10,981 11,773 13,555 15,959 18,800Short-term debt 1,121 555 555 555 555Accounts payable 1,394 1,857 2,216 2,585 3,018Other current liabilities 733 1,621 1,549 1,807 2,109Total current liabilities 3,248 4,034 4,321 4,948 5,683Long-term debt 697 527 427 327 227Convertible debt 0 0 0 0 0Other LT liabilities 137 145 145 145 145Total liabilities 4,081 4,706 4,893 5,420 6,054Minority interest 1 1 1 1 1Preferred stock 0 0 0 0 0Common stock 151 151 151 151 151Retained earnings 6,747 6,915 8,509 10,387 12,593Proposed dividends
Other equity and reserves
Total shareholders' equity 6,899 7,066 8,661 10,538 12,744Total equity & liabilities 10,981 11,773 13,555 15,959 18,800
Liquidity (x)
Current ratio 1.85 1.52 1.64 1.77 1.91Interest cover 15.9 18.3 19.3 21.4 23.2
Leverage
Net debt/EBITDA (x) net cash net cash net cash net cash net cashNet debt/equity (%) net cash net cash net cash net cash net cash
Activity (days)
Days receivable 27.0 26.5 23.2 23.2 23.2Days inventory 71.9 68.8 63.0 63.4 63.4Days payable 80.9 95.0 105.2 106.4 106.5Cash cycle 17.9 0.3 -18.9 -19.8 -19.8Source: Company data, Nomura estimates
Notes
Notes
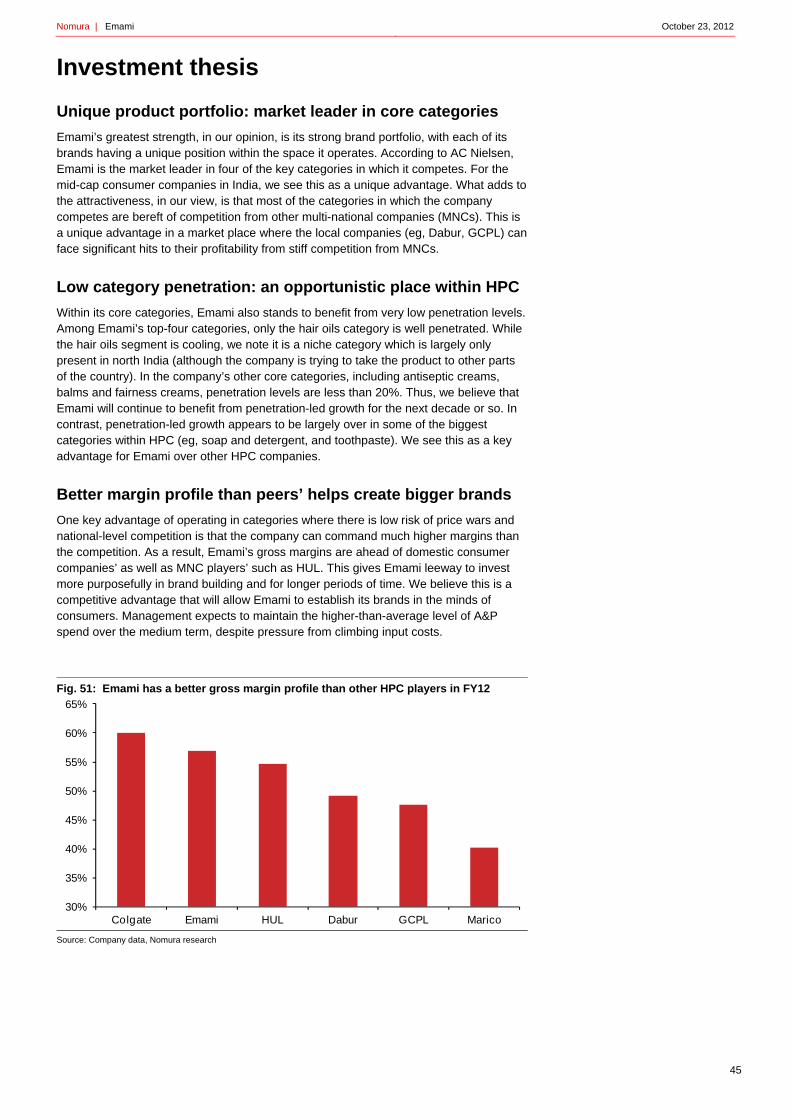
Nomura | Emami October 23, 2012
45
Investment thesis
Unique product portfolio: market leader in core categories
Emami’s greatest strength, in our opinion, is its strong brand portfolio, with each of its brands having a unique position within the space it operates. According to AC Nielsen, Emami is the market leader in four of the key categories in which it competes. For the mid-cap consumer companies in India, we see this as a unique advantage. What adds to the attractiveness, in our view, is that most of the categories in which the company competes are bereft of competition from other multi-national companies (MNCs). This is a unique advantage in a market place where the local companies (eg, Dabur, GCPL) can face significant hits to their profitability from stiff competition from MNCs.
Low category penetration: an opportunistic place within HPC
Within its core categories, Emami also stands to benefit from very low penetration levels. Among Emami’s top-four categories, only the hair oils category is well penetrated. While the hair oils segment is cooling, we note it is a niche category which is largely only present in north India (although the company is trying to take the product to other parts of the country). In the company’s other core categories, including antiseptic creams, balms and fairness creams, penetration levels are less than 20%. Thus, we believe that Emami will continue to benefit from penetration-led growth for the next decade or so. In contrast, penetration-led growth appears to be largely over in some of the biggest categories within HPC (eg, soap and detergent, and toothpaste). We see this as a key advantage for Emami over other HPC companies.
Better margin profile than peers’ helps create bigger brands
One key advantage of operating in categories where there is low risk of price wars and national-level competition is that the company can command much higher margins than the competition. As a result, Emami’s gross margins are ahead of domestic consumer companies’ as well as MNC players’ such as HUL. This gives Emami leeway to invest more purposefully in brand building and for longer periods of time. We believe this is a competitive advantage that will allow Emami to establish its brands in the minds of consumers. Management expects to maintain the higher-than-average level of A&P spend over the medium term, despite pressure from climbing input costs.
Fig. 51: Emami has a better gross margin profile than other HPC players in FY12
Source: Company data, Nomura research
30%
35%
40%
45%
50%
55%
60%
65%
Colgate Emami HUL Dabur GCPL Marico

Nomura | Emami October 23, 2012
46
Handles the competition deftly
In launching the men’s fairness cream category, Emami invested a significant amount of money to build brand awareness among men. During the earlier trials for its fairness cream products, Emami had discovered that 30% of sales at the time were from male consumers, while the only fairness cream products available in the market at the time targeted only women (HUL’s Fair and Lovely). Introducing products specifically aimed at men was a significant risk and involved considerable investment in building the category. In our view, management’s vision and its strength in handling competition puts Emami in a very strong position, given that whatever part of its portfolio is exposed to stronger competitive activity, the company is well placed to emerge as a winner. Another example is in the cooling oil segment, where Emami has managed to hold off competition from Marico to remain the market leader with its Navratna brand hair oil, according to AC Nielsen.
Inorganic growth could add a second leg to expansion
Although Emami has several levers in place which we expect will drive organic growth over the medium term, management has always been a willing acquirer of brands. Although domestic acquisition opportunities in India are limited and expensive, management has been more willing than other HPC companies to look at inorganic growth opportunities. An example of this is Emami’s acquisition of Zandu in 2008, which has been a big success story for the company, in our view. Emami was also involved in the bidding process for Paras Pharma in 2011. Although Emami’s bid was the highest, it was unable to close the deal. Over the medium term, we believe the company will re-examine inorganic growth opportunities, although there remains a risk that management may overpay for these acquisitions. Although headline numbers for Zandu also look high, we believe the revenue synergies the company has derived have made the acquisition more successful in hindsight.
Sustained investment in categories with growth potential
Management has a strong vision of the need to sustain investment in categories where it sees long-term growth opportunities. The company has demonstrated this with its continued investment in the Sona Chandi Chyawanprash brand over the years. Although Dabur remains the market leader and Emami has had to make significant investment to stay in the race, management continues to invest in the Chyawanprash category. We believe this is a significant differentiator vs other mid-cap consumer companies, where the ability to continue to invest is much more limited, given that short-term profitability is also a consideration.
Valuation at a steep discount vs HPC companies
Emami trades at 20.8x FY14F EPS vs a sector average of 28.6x and the HPC average of 30x. This translates to a steep 27% discount vs other HPC players. We estimate Emami will deliver 17%+ earnings CAGR over the next three years, largely in line with the sector average of nearer 19%. For a company with a profile similar to that of other mid-cap HPC companies, we believe the valuation discount for Emami is too big. Emami’s unique portfolio, in our view, gives it a long-term advantage vs other HPC players. We believe that current levels are an attractive entry point for exposure to what we perceive to be one of the most unique HPC companies in India.

Nomura | Emami October 23, 2012
47
Growth prospects appear attractive We believe Emami’s organic growth in the next three to five years will be strong, led by the following:
• Low penetration levels in core categories;
• Continuing enhancement of distribution channels; and
• Investment in a sales force that the company has been building over the past few years.
In the four key categories that the company operates, category penetration levels are still at less than 20%. In two of those categories, namely antiseptic creams and cold creams, penetration levels are at less than 5%. In our view, this presents a significant opportunity for the company to grow organically in the medium term. We also see this as one of the key differentiators for Emami vs other HPC companies, where penetration-led growth appears to be largely done. In the context of HPC companies, this is a significant advantage and one we believe will be recognised by the market in the medium term.
Fig. 52: Penetration (as of FY12) still low in some categories
Source: Company data
Distribution now beefed up Over the past three to five years, Emami has significantly beefed up its distribution structure with the aim of ensuring that it reaches all towns in India with a population of 5,000 people or more by 2013. The company now has a nation-wide distribution network of 2,800+ distributors, which reaches 500,000 outlets directly. Including the indirect distribution reach, the company now reaches 2.6mn retail outlets. Emami has a team of more than 2,500 salespeople on the ground. Much of the investment in beefing up the distribution network is now in place and going forward Emami only expects to incrementally tweak the network.
The company has also ensured that distribution is strong across the country. In terms of sales for the company geography-wise, North and West India are relatively more important markets, but East and South India also contribute a significant revenue portion.
0%
20%
40%
60%
80%
100%
To
ilet
So
aps
Was
hin
g P
ow
der
s
Det
erg
ent
Bar
s
Hai
r Oil
To
oth
past
e
Sh
amp
oo
Tal
cum
P
ow
der
Fai
rnes
s C
ream
An
tisep
tic
Cre
am
Co
ld
Cre
am

Nomura | Emami October 23, 2012
48
Fig. 53: Even geographical sales revenue distribution (FY12)
Source: Company data, Nomura Research
International business is the other leg of growth Over the past five years, Emami has also begun to focus on its international business operations. The company started with exporting products mainly to the SAARC nations and the Middle East, and over time it has taken its products to more than 75 countries.
International growth has been much stronger than domestic growth over the past five years. International business now contributes 14% of the company’s overall revenues. Management maintains that over the next few years, it will take the next steps towards expanding the international business. This will include setting up a manufacturing facility in Bangladesh, which will serve as the hub for the international business. The cost of establishing the manufacturing facility in Bangladesh will be close to INR700mn over the next year or so, according to management.
Fig. 54: Emami: International business revenue breakdown by region (FY12)
Source: Company data, Nomura Research
Next step: inorganic growth in the international business
As we highlight in the industry portion of this report, all of the other domestic consumers companies in India (eg, Marico, Dabur and GCPL) started the same way. Marico’s and Dabur’s first phase of expansion into international markets was by way of exporting to nearby markets including Bangladesh, the Gulf and Egypt, among others. The second phase was establishing manufacturing facilities to better serve consumers in these regions. The third phase, which started for India’s consumer companies some five years back, is the inorganic growth stage, with Marico, GCPL and Dabur all acquiring companies outside the Indian subcontinent. We also highlight in our industry analysis the reasons why acquisitions in India are a rare phenomenon for consumer companies.
North29%
South23%
East22%
West26%
Africa, 35%
SAARC, 30%
GCC, 21%
CIS, 11%
Others, 3%

Nomura | Emami October 23, 2012
49
Domestic acquisitions likely to remain expensive We highlight in our industry analysis that domestic acquisitions are often quite difficult to complete, given the following factors:
• Most domestic consumer brands are family-owned and this often presents the biggest hurdle when it comes to acquiring these businesses. Although it is commonly acknowledged that these businesses lack scale and can be much bigger if given adequate brand and distribution support, the families behind these brands often are not interested in scaling it up, possibly because they are not interested in managing a larger business, have limited or no available funding, or prefer not to bring in outside management/talent.
• Where a family is willing to sell (typically a very small percentage), valuations demanded of the buyer are extremely expensive. We would cite the example of Paras Pharma, where OTC brands such as Moov and Krack were eventually sold for ~8x sales. This is very expensive by any comparable transaction multiple across the consumer space. In addition, domestic consumer companies trade at 4-5x sales currently, thus acquiring a company at more than the multiple at which it already trades is unlikely to be something upon which managements would view favourably.
Emami is a more willing domestic acquirer Although seems to be a consensus among Indian consumer companies that domestic acquisitions are an expensive affair, Emami is relatively more willing to acquire domestic assets. Management continues to scout for acquisitions in the domestic business (Emami Eyeing Buys, Wall Street Journal, 13 December, 2010).
Emami was an aggressive bidder for Paras Pharma when it was on the block last year. Among the bidders interested in Paras Pharma were Reckitt Benckiser, Bayer, Taisho Pharmaceuticals and Johnson & Johnson. Domestic consumer companies such as Marico and Dabur were also initially interested, but dropped out in the later stages as expected valuations were very high. Emami, however, seemed unconcerned about the high expected valuations and went ahead to make the highest bid. Emami’s bid of INR34bn was actually ~5% higher than the actual winning bid of INR32.6bn. However, there is limited clarity as to why the bid was awarded to Reckitt Benckiser.
In our view, the bid for Paras Pharma clearly shows Emami’s willingness to pay very high multiples provided the target company/brand fits well into the company’s portfolio. However, there is also a risk that the company is likely to pay too much for a brand; we believe that this is one reason why the stock has underperformed in the past year or so, since the bid speculation first broke.
History of making acquisitions work Emami paid what was considered a steep valuation for its acquisition of Zandu in 2008. After a protracted court battle, Emami obtained control of Zandu. At the time of the acquisition, Zandu had sales of ~INR700mn, which Emami has over the past three years taken to INR2.1bn. Management always appeared to have confidence that Zandu had significant value potential, but historically it was an underinvested brand. This was changed over the past few years as distribution was enhanced and a significant amount of investment was made for brand building. This has already paid rich dividends, but management believes there is still a significant amount of synergy benefits that remain to be seen and will continue to invest in growing the brand in the near term.
However, Emami only gets involved in categories it knows well While the risk remains that Emami may overpay for acquisitions, one thing management has made very clear is that the company will only become involved in bidding for brands where gross margins are similar to the group profile. This will ensure that the company continues to have the ability to invest in brands and over time grow the brand at a much quicker pace than it would ordinarily have had if it had not been sold.
This philosophy was demonstrated when the company opted out of bidding for Henkel in the past 6 months. Henkel had put its India business on the block, which included a portfolio of fabric care, home care, dish wash, personal care and household cleaning brands. This is a lower-margin business and a completely separate line of business vs Emami’s current portfolio. Management’s strategy on not bidding for this business was very clear, which we believe is a positive as it confirms our view that Emami will only bid for companies/brands that fit in well with its own portfolio.

Nomura | Emami October 23, 2012
50
Distinct product portfolio
In our opinion, Emami’s greatest strength is its strong brand portfolio, with each brand having a distinct positioning within the space it operates. As we look at the key brands in the portfolio, we see how well positioned Emami is within the segment. According to AC Nielsen, Emami is the market leader in four of the key categories it competes in. Among mid-cap consumer companies in India, this is a unique advantage. A closer look at the portfolio explains this point in detail.
Market leader in core categories The four key categories where the company operates in are cooling oil, antiseptic cream, balms and men’s fairness cream. In each of these categories, the company has a significantly high market share and is by far the number one player in the segment, according to Ac Nielsen. In cooling oil, Emami’s brand Navratna is the market leader with a 49% share of a market with sales of ~INR6bn. Similarly, in antiseptic cream, the company has a 75% share of the market with its Boroplus brand the market leader. Emami also has a leading position in the balms and men’s fairness categories, although in terms of the overall size of these categories, they are smaller than in the cooling oil category.
Fig. 55: Category leading brands – FY12
Emami Brand Category Emami's market
share (%)Market
Position #
Navratna Oil Cooling oil 49% 1
Boroplus Cream Antiseptic Cream 75% 1
Zandu & Mentho Plus Balm Balm 57% 1
Fair & Handsome Men's fairness cream 60% 1
Boroplus Powder Prickly heat powder 10% NA
Navratna Cool Cool Talc 13% NA
Fast Relief Pain reliever 9% NA
Sona Chandi & Zandu Chyawanprash 15% 2
Source: Company data
Category penetration also low Within its core categories, Emami also stands to benefit from very low penetration levels. Among Emami’s top-four categories, only the hair oils category is well penetrated. While the hair oils segment is cooling, we note it is a niche category which is largely only present in north India (although the company is trying to take the product to other parts of the country). In the company’s other core categories, including antiseptic creams, balms and fairness creams, penetration levels are less than 20%, according to management.
Fig. 56: Penetration levels (FY12) still low in key categories
Source: Company data
0%
20%
40%
60%
80%
100%
To
ilet
So
aps
Was
hin
g P
ow
der
s
Det
erg
ent
Bar
s
Hai
r Oil
To
oth
past
e
Sh
amp
oo
Tal
cum
P
ow
der
Fai
rnes
s C
ream
An
tisep
tic
Cre
am
Co
ld
Cre
am
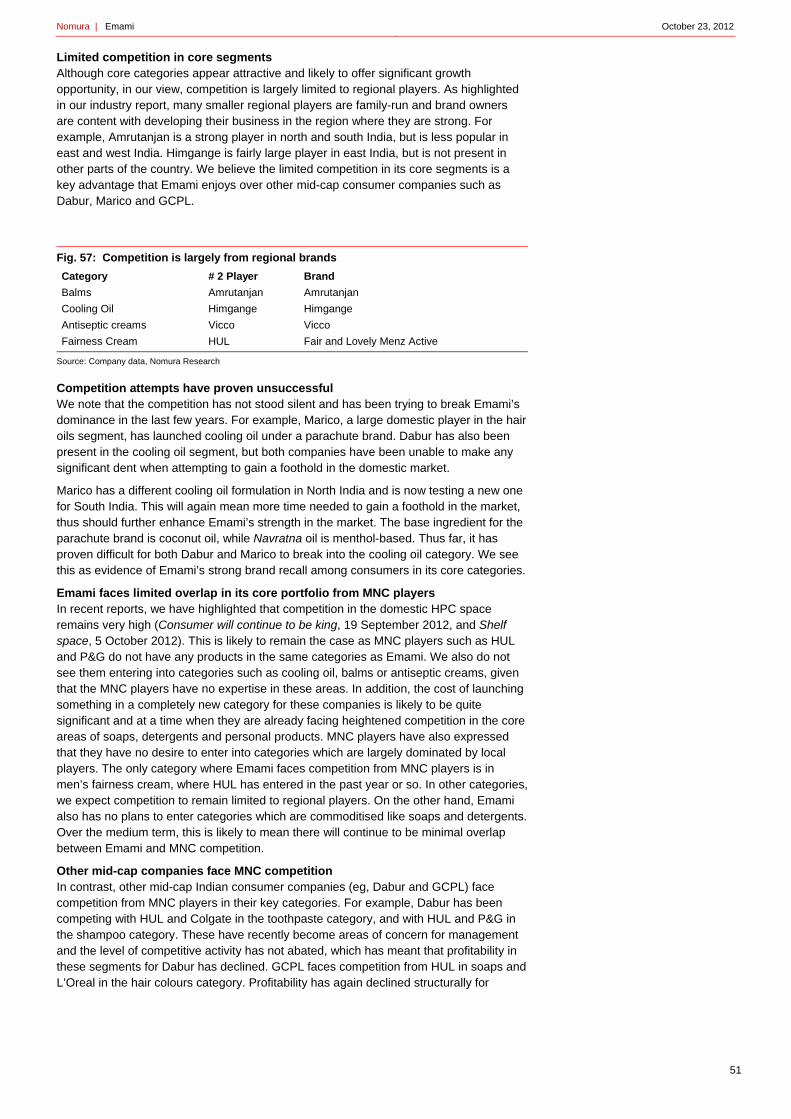
Nomura | Emami October 23, 2012
51
Limited competition in core segments Although core categories appear attractive and likely to offer significant growth opportunity, in our view, competition is largely limited to regional players. As highlighted in our industry report, many smaller regional players are family-run and brand owners are content with developing their business in the region where they are strong. For example, Amrutanjan is a strong player in north and south India, but is less popular in east and west India. Himgange is fairly large player in east India, but is not present in other parts of the country. We believe the limited competition in its core segments is a key advantage that Emami enjoys over other mid-cap consumer companies such as Dabur, Marico and GCPL.
Fig. 57: Competition is largely from regional brands
Source: Company data, Nomura Research
Competition attempts have proven unsuccessful We note that the competition has not stood silent and has been trying to break Emami’s dominance in the last few years. For example, Marico, a large domestic player in the hair oils segment, has launched cooling oil under a parachute brand. Dabur has also been present in the cooling oil segment, but both companies have been unable to make any significant dent when attempting to gain a foothold in the domestic market.
Marico has a different cooling oil formulation in North India and is now testing a new one for South India. This will again mean more time needed to gain a foothold in the market, thus should further enhance Emami’s strength in the market. The base ingredient for the parachute brand is coconut oil, while Navratna oil is menthol-based. Thus far, it has proven difficult for both Dabur and Marico to break into the cooling oil category. We see this as evidence of Emami’s strong brand recall among consumers in its core categories.
Emami faces limited overlap in its core portfolio from MNC players In recent reports, we have highlighted that competition in the domestic HPC space remains very high (Consumer will continue to be king, 19 September 2012, and Shelf space, 5 October 2012). This is likely to remain the case as MNC players such as HUL and P&G do not have any products in the same categories as Emami. We also do not see them entering into categories such as cooling oil, balms or antiseptic creams, given that the MNC players have no expertise in these areas. In addition, the cost of launching something in a completely new category for these companies is likely to be quite significant and at a time when they are already facing heightened competition in the core areas of soaps, detergents and personal products. MNC players have also expressed that they have no desire to enter into categories which are largely dominated by local players. The only category where Emami faces competition from MNC players is in men’s fairness cream, where HUL has entered in the past year or so. In other categories, we expect competition to remain limited to regional players. On the other hand, Emami also has no plans to enter categories which are commoditised like soaps and detergents. Over the medium term, this is likely to mean there will continue to be minimal overlap between Emami and MNC competition.
Other mid-cap companies face MNC competition In contrast, other mid-cap Indian consumer companies (eg, Dabur and GCPL) face competition from MNC players in their key categories. For example, Dabur has been competing with HUL and Colgate in the toothpaste category, and with HUL and P&G in the shampoo category. These have recently become areas of concern for management and the level of competitive activity has not abated, which has meant that profitability in these segments for Dabur has declined. GCPL faces competition from HUL in soaps and L’Oreal in the hair colours category. Profitability has again declined structurally for
Category # 2 Player Brand
Balms Amrutanjan Amrutanjan
Cooling Oil Himgange Himgange
Antiseptic creams Vicco Vicco
Fairness Cream HUL Fair and Lovely Menz Active

Nomura | Emami October 23, 2012
52
GCPL, certainly in the soaps part of its portfolio. As well, ITC has become a significant player in the soaps and personal products segment and companies like Dabur and GCPL are likely to continue to face a significant level of competition in many of their key categories in the medium term.
Fig. 58: Emami faces little MNC competition
Source: Company data, Nomura Research
Risk of price war and margin erosion appears limited… In categories where MNC competition has been strong, margins have typically come down over a period of time. The most clear indication of what happens to a category when competition increases significantly is in the soaps and detergents segment. We have historical data for how this segment’s margins have moved for market leader HUL. Margins in the segment were as high as 30% in 2003, prior to the first price war in 2004. Margins during that time declined to 15% and although there was a temporary spike back up to the 20% region, margins have been consistently declining. In September 2009, margins in the segment were c.16%, before the second price war which began in early 2010. This meant another round of margin declines, although margins have started to improve over the past year or so, from the low of 7.5% in Q4FY11.
Fig. 59: HUL: soaps and detergents margins have seen a structural shift downwards
Source: Company data, Nomura Research
Another example of how margins in a segment can decline significantly if there is MNC competition is the shampoo category in India. While companies do not report margins specifically for this segment, we quote below the CEO of Dabur, Mr Sunil Duggal, speaking about how shampoo segment margins have declined industry-wide.
“Like in shampoos the margins have contracted in toothpaste because the price increases have not been commensurate with the increase in the material prices, but the demand side is fine” – Mr Sunil Duggal, CEO, Economic Times, 7 October 2011.
Category Local MNC
Soaps GCPL HUL, P&G
Shampoo Dabur HUL, P&G, L'Oreal
Balms Emami NA
Cooling Oil Emami NA
Antiseptic creams Emami NA
Fairness Cream Emami HUL, L'Oreal, Beisedorf
Oral Care Dabur HUL, P&G
Juices Dabur HUL, PepsiCo, Coca Cola
0
5
10
15
20
25
30
35
Mar
-02
Aug
-02
Jan
-03
Jun
-03
No
v-03
Ap
r-04
Se p
-04
Feb
-05
Jul-
05
Dec
-05
May
-06
Oct
-06
Mar
-07
Aug
-07
Jan
-08
Jun
-08
No
v-08
Ap
r-09
Sep
-09
Feb
-10
Jul-
10
Dec
-10
May
-11
Oct
-11
Mar
-12
Aug
-12

Nomura | Emami October 23, 2012
53
One key advantage for Emami is that its product portfolio does not really compete in the same segments as the MNC players. Competition in the categories that Emami competes in is mainly from regional players. Here, the risk of price war is limited, in our view, although margins may still trend down if input prices remain a structural issue.
Better margin profile for Emami vs peers One advantage of operating in categories where there is low risk of price wars and national level competition is that margins for the company tend to be much higher than they are for the competition. This is best illustrated by looking at Emami’s gross margins as compared to those of other domestic consumer companies. Emami’s gross margins are ahead of domestic consumer companies as well as MNC players such as HUL.
Fig. 60: Gross margins in FY12 for consumer companies
Source: Company data, Nomura Research
Strong investment in brand-building
As a result of the high gross margins that Emami enjoys, the company has far more leeway to invest in brands. Here, we would highlight management’s continued and strong focus on brand-building. In our view, Emami’s management remains one of the best in terms of its history of encouraging investment in brand-building. Management also maintains that this focus on investing in brands will continue over the next few years and there will be no reduction in this area.
Average spend more than competition Investment in brands is also reflected in the A&P to sales ratio at Emami vs other consumer companies. The average across companies in the HPC space is ~12% vs 15.8% at Emami for FY12.
Fig. 61: Emami’s spend on A&P is much higher than other HPC companies’
A&P/Sales FY07 FY08 FY09 FY10 FY11 FY12
Emami 20.3% 16.8% 18.8% 18.7% 18.0% 15.8%
Dabur 12.5% 12.5% 12.2% 14.6% 13.1% 12.5%
Marico 13.6% 12.9% 10.5% 13.2% 11.1% 11.2%
GCPL 11.3% 11.9% 9.9% 12.2% 11.3% 12.1%
HUL 10.5% 10.1% 10.5% 13.6% 14.2% 11.7%
Source: Company, Nomura Research
Helps build/sustain brands in longer term This consistent and focused investment in brands has paid rich dividends for the company over the years. Sales of key brand shave have been growing significantly ahead of the market over the past five years. This is best captured in the performance of a few of its core brands. For example, the share of Boroplus antiseptic cream has
30%
35%
40%
45%
50%
55%
60%
65%
Colgate Emami HUL Dabur GCPL Marico

Nomura | Emami October 23, 2012
54
increased from 65% in 2005 to 75% in 2010. Similarly, even in a large category such as cooling oil, the company has gained share in the past five years.
Fig. 62: Market share of Boroplus antiseptic cream
Source: Company data
Fig. 63: Market share of Navratna cooling oil
Source: Company data
Ability to build categories and brands Emami’s management has also demonstrated its ability to build new categories and brands. A clear and very visible explanation of this is the Fair and Handsome men’s fairness cream. Before Emami launched the products in 2005, the men’s fairness cream category did not exist. There was a lot of scepticism about whether there would be a significant enough market for this sort of product. Management was very confident that over time, this would develop in a significant category. In the words of Mr Mohan Goenka, “There is no doubt men are becoming conscious of their skin. We realised there was a ready market for a product like this” (Source: BBC news online, 2 November 2005).
Since that time, Emami’s Fair and Handsome has gone on to become an INR2bn-plus brand with Emami having a 60% share in the category, according to management. Other players have since entered the category with various strains of the product, which has increased competition. The most notable among them is HUL, which launched Fair and Lovely Menz Active in 2006. Beiersdorf AG, the German parent of Nivea, entered next with its Nivea for Men products. Category growth is still upwards of 30% and we expect it to remain so in the near to medium term as penetration is still very low.
As we have highlighted above, Emami is not completely focused on quarterly numbers and is willing to remain invested in categories and brands with a longer-term approach.
Strong history of handling the competition
In launching the men’s fairness cream category, Emami invested a significant amount of money to build brand awareness among men. During the earlier trials for its fairness cream products, Emami had discovered that 30% of sales at the time were from male consumers, while the only fairness cream products available in the market at the time targeted only women (HUL’s Fair and Lovely). Introducing products specifically aimed at men was a significant risk and involved considerable investment in building the category.
Management had the vision to do this and has been rewarded since for this bold move. We believe this is also a reflection of how well management is positioned to handle competition, whether from local or regional players or from MNC players. In our view, this puts the company in a strong position as whatever part of the portfolio is exposed to stronger competitive activity, the company is well placed to come out as a winner.
History of men’s fairness cream category Traditionally in India, the cosmetics category has been restricted to being marketed only to the female population. However, that has changed in the last decade or so as rising incomes, and the increasing propensity for men to spend more on personal grooming etc
55%
60%
65%
70%
75%
FY05 FY1140%
42%
44%
46%
48%
50%
FY05 FY11

Nomura | Emami October 23, 2012
55
has meant that there is a large potential market for men’s grooming products outside of the traditional shaving cream and after-shave categories which is dominated by P&G.
Within men’s grooming, shaving-related products are already well entrenched in India, although the process of trading up has only just begun, which we expect will accelerate over the next decade. The other category which is growing at a fast clip is the deodorants segment, although it is a crowded market place with many competitors. The other men’s grooming categories are still relatively small, but offer significant growth opportunity over the next decade or so. Penetration levels in many of these categories are still not relevant as the majority of the men even in the urban areas are not in the category. This in our opinion is one of the growth areas within HPC.
India is one of the only markets in the world where there is a ‘skin lightening’ category which is big. However, traditionally this was restricted to women in the country and that market continues to grow. However, in 2005, Emami came up with the idea that even men would welcome such a product. After some initial research and soft launches in South India, the company launched the category nationally. This means men’s fairness cream as a category is only about 5-6 years old. However, in the past 3-4 years, India’s male grooming market has been growing at a very consistent pace of about 20% pa.
The Indian male grooming market is around INR7.5bn (excluding shaving gel and brush) and is growing faster than the overall cosmetics market. The overall cosmetics market is growing at a rate of c.18% pa and is estimated to be around INR60bn.
Emami launched its men’s fairness cream in 2005 and this has grown at a fast clip since then. After the launch, HUL also discovered that there was a market for such a product and launched its own brand with a view to compete in the same segment, where it is already the leader in the women’s segment. However, despite strong investment by HUL over the last 4-5 years, Emami has continued to hold its ground in the category and is still the market leader in the men’s fairness category.
The Associated Chambers of Commerce and Industry of India (ASSOCHAM) has projected that the market size of the cosmetics industry will double from the current INR100bn to INR200bn by 2014, driven by the emergence of a young urban elite population with rising disposable incomes and an increase in working women looking for lifestyle-oriented and luxury products. As part of the report, we also conducted a survey to look at how spending among men on cosmetics has increased in the last decade or so.
About 75% male teenagers increased their expenditure on cosmetics to INR3,000-4,000/month, as against their average expenditure of less than INR1,000 in 2000, representing an increase of more than 300% that we believe is largely due to growing awareness. This clearly shows that over the next decade, spending on cosmetics is likely to increase further; we expect Emami to gain from this expanding market.
Cooling oil Another category where Emami has always been the market leader is the cooling oil segment. However, over the last few years, competition has been seen, particularly from Marico, which has launched a parachute cooling oil product in select markets. While Marico’s product has done well and has gained acceptance in key markets of North India in this segment, Emami remains the market leader. Navratna hair oil has very strong brand equity and has continued to maintain its position as the market leader in the category, according to AC Nielsen. Management recognised the need to invest in supporting the brand when competition increased, and has been able to deliver results in terms of maintaining share.

Nomura | Emami October 23, 2012
56
Financials Revenue growth led by key brands Emami has four key products in its portfolio: Navratna cooling oil, Boroplus antiseptic cream, Zandu balm and Mentho plus balm. These categories are still fairly underpenetrated and that should provide growth opportunities over the next few years, in our view. We believe medium-term revenue growth will continue to be led by volume growth, with pricing contribution a smaller part. We estimate that the key categories will continue to grow at >15% annually for about the next three years. The company has several initiatives in place aimed at driving volume growth, including driving sales by introducing smaller SKUs. This is a significant draw especially in rural India, where sales of products are more dependent on pricing and SKU sizes rather than product functionality.
In our view, management’s strategy has been working for the past several years where growth has averaged 35% (historical five-year average). Although this includes some accretion from the acquisition of Zandu in 2008, growth even accounting for that has been strong over the past few years.
Fig. 64: Robust sales growth over the past five years
Source: Company data, Nomura Research
We believe the drivers behind this growth are still in place; the company should continue to deliver high-teens revenue growth over the next three years. In our view, this will continue to be led by increasing penetration of the products/categories as well as increased distribution reach. Over the next three years, we estimate a sales CAGR of 18% led by ‘key brands’ Navratna and Boroplus. This is at the mid-point of management’s guidance of 18-20% revenue growth for the year. Q3 and Q4 are seasonally stronger for company growth brands such as Fair and Handsome, which are still in the nascent stage of development and are likely to continue to be growth drivers in the medium term.
0%
10%
20%
30%
40%
50%
60%
70%
80%
0
2,000
4,000
6,000
8,000
10,000
12,000
14,000
16,000
2006 2007 2008 2009 2010 2011 2012
Net Sales (LHS) Growth (RHS)

Nomura | Emami October 23, 2012
57
Fig. 65: Robust sales growth over the next three years
Source: Nomura Research
Gross margin pressure likely to ease in FY13F Input prices were a significant issue in FY12, with gross margins falling by 110bps y-y for the full year. However, menthol prices have started to correct and this should help the company to improve gross margins for FY13F. It will also depend on how the input cost scenario shapes up into the rest of the year, particularly during the winter season, which is a seasonally stronger quarter for the company. Key input costs for Emami are menthol and LLP, with crude oil being the benchmark for packing costs. We are building in a 200bp improvement for FY13F and flat gross margin for FY14F.
Fig. 66: Gross margin pressure to ease significantly in FY13F
Source: Company data, Nomura estimates
EBITDA margins likely to recover despite increase in A&P for FY13F EBITDA margins took a knock in 2012 as input cost pressures hit hard. That said, management did not take the easy route of significantly cutting back on A&P, although there was some moderation during FY12. EBITDA margins in 2012 fell by 10bps, which we believe is a very credible performance in a scenario of high input costs. As input costs ease in FY13F, we believe margins are likely to see a 60bp improvement. Our estimates may well prove conservative if the correction in input prices continues to sustain over the next few quarters.
0
5,000
10,000
15,000
20,000
25,000
2013F 2014F 2015F
0%
10%
20%
30%
40%
50%
60%
70%
2005 2006 2007 2008 2009 2010 2011 2012 2013F 2014F

Nomura | Emami October 23, 2012
58
Fig. 67: EBITDA margin likely to recover in FY13F
Source: Company data, Nomura estimates
Net cash positive; room to raise both debt and equity to fund inorganic growth Emami had gross debt of INR1.08bn at end-FY12, with a cash balance of INR2.76bn. This net cash positive position means there is plenty of room for the company to raise capital in the form of either debt or equity to fund inorganic growth opportunities. As Emami’s capex plans will be limited to only INR1bn each year over FY13-14F, we believe there will be significant cash on the balance sheet over the next couple of years Fig. 68: Emami is net cash positive
Source: Company, Nomura estimates
Tax rate likely to remain at current levels in the medium term Emami has seven manufacturing facilities and most of these are located in areas/zones where it will continue to benefit from tax benefits. These locations are likely to continue to offer tax benefits to Emami in the next few years, which would mean the effective tax rate should remain at ~16% levels in the medium term.
Strong net profit growth over the next three years We estimate Emami will be able to drive top-line growth led by its strong brands and the low penetration in core categories. As input costs ease, we believe the company will be able to moderately increase operating margins in FY13-14F. We estimate Emami will deliver an 17+% earnings CAGR over the next three years. While this is largely in line with the sector average, on our estimates, on P/E valuation, Emami is trading at a significant 27% discount to the sector average. In our view, this valuation gap to the sector average should close over the next few quarters.
0%
5%
10%
15%
20%
25%
2005 2006 2007 2008 2009 2010 2011 2012 2013F 2014F 2015F
0
1,000
2,000
3,000
4,000
5,000
6,000
-6,000
-5,000
-4,000
-3,000
-2,000
-1,000
0
1,000
2,000
3,000
4,000
5,000
2005
2006
2007
2008
2009
2010
2011
2012
2013
F
2014
F
2015
FNet Debt (LHS)
Cash (RHS)

Nomura | Emami October 23, 2012
59
Fig. 69: Emami: net profit (INRmn) and growth (% y-y)
Source: Company data, Nomura estimates
Valuation gap with HPC peers too large and should close
Emami trades at 20.8x FY14F EPS vs. sector average of 28.6x. This translates to a steep 27% discount vs. the sector. We estimate Emami will deliver 17%+ earnings CAGR over the next three years. This compares with the sector average of c.19%. For a company with a profile similar to the other mid-cap HPC companies, we believe Emami’s valuation discount is too big. At these levels, Emami offers investors a very good entry point and opportunity to own what we perceive to be one of the most unique HPC companies in India.
Our INR648 target price values Emami at 24x our average FY14F and FY145F EPS of INR27. Our target P/E of 24x is in line with the multiples we give to other mid-cap consumer companies. This reflects Emami’s similar earnings growth profile.
Fig. 70: Sector valuation
Company Ticker Rating Price INREPS growth
FY14E % FY13E P/E FY14E P/E FY14E PEGMarket cap
USDmn
Nestle * NEST IN Neutral 4,741 22% 37.9x 31.1x 1.4x 8,791
GSK Consumer * SKB IN Buy 3,018 20% 29.7x 24.7x 1.2x 2,444
Jubilant Foodworks JUBI IN Buy 1,321 38% 53.4x 38.6x 1.0x 1,639
United Spirits UNSP IN Neutral 1,268 20% 45.7x 38.0x 1.9x 3,062
F&B Average 39.8x 32.2x
Colgate Palmolive CLGT IN Reduce 1,242 14% 33.1x 29.0x 2.0x 3,248
Dabur DABUR IN Buy 132 20% 29.8x 24.7x 1.2x 4,412
Godrej Consumer GCPL IN Buy 685 24% 30.1x 24.2x 1.0x 4,482
Hindustan Unilever HUVR IN Neutral 576 16% 38.7x 33.3x 2.1x 23,926
Marico MRCO IN Neutral 206 21% 30.2x 25.0x 1.2x 2,431
Emami HMN IN Buy 517 18% 24.5x 20.8x 1.2x 1,503
HPC Average 35.3x 30.0x
ITC ITC IN Buy 292 18% 31.3x 26.6x 1.5x 43,843
Asian Paints APNT IN Neutral 3,924 20% 34.1x 28.4x 1.4x 7,238
Titan Industries TTAN IN Buy 278 28% 30.3x 23.8x 0.9x 4,747
Source: Bloomberg, Nomura estimates
Note: Priced as of 18 October 2012. *Valuations based on calendar year for Nestle and GSK
0%
10%
20%
30%
40%
50%
60%
70%
80%
90%
0
500
1,000
1,500
2,000
2,500
3,000
3,500
4,000
4,500
5,000
2005
2006
2007
2008
2009
2010
2011
2012
2013
F
2014
F
2015
F
Net Profit (LHS)
Growth (RHS)

Nomura | Emami October 23, 2012
60
Valuation lower than recent multiple, but should rebound to sector average Even if we look at Emami’s one-year forward P/E, we see scope for its valuation to rebound post the sharp fall recently. Over the past three years, Emami has traded at an average 22.4x one-year forward P/E. Current valuation at close to 20.8x one-year forward P/E is at a 10% discount to its most recent trading history as well. We believe valuation will see a sharp rebound into FY13F as investors take another look at the performance of its core businesses, which should continue to deliver strong earnings results over the next couple of years.
Fig. 71: Emami: one year forward P/E
Source: Bloomberg, Nomura Research
Input prices remain high, but should ease into winter season
Menthol and light liquid paraffin are the two most important input costs for the company, according to management. Together these account for ~30% of input costs with packaging material contributing another 40%.
Menthol prices have increased significantly in the past year or so while demand conditions have not changed dramatically. The company attributes this to supply-side issues and some artificial scarcity which has been created by a few producers who have control over the majority of the supply. This makes it difficult to anticipate how prices will react in the next year, but the company is hopeful the artificial scarcity situation will be resolved in the medium term, which will allow it to better predict input costs.
Globally, India is the largest producer and exporter of menthol flakes. The other major producers in the world are China, Brazil, the US and Japan. Of the total global production of menthol flakes, India contributes around ~73%, China 18% and others 9%.
Mint is the underlying crop for producing menthol. Cultivation of mint in India starts in February-March every year and the crop takes c.90 days to mature and produce first flowers, which is the best stage to harvest. First harvesting is done during May-June. Farmers undertake at least two harvestings from the crop.
Uttar Pradesh is India's largest producing state, contributing almost 80-90% to the country's total production, followed by Bihar, Punjab, Haryana and Himachal Pradesh.
Key factors which influence prices of menthol include:
• The inventory with traders and the cost at which it has been acquired is a major price influencing factor.
• Domestic demand usually peaks during the winter season. Despite this, supply has not been constrained in recent years due to successive bumper outputs, however, prices do display a tendency to firm during the winter months.
0
10
20
30
40
Oct
-04
Ap
r-05
Oct
-05
Ap
r-06
Oct
-06
Ap
r-07
Oct
-07
Ap
r-08
Oct
-08
Ap
r-09
Oct
-09
Ap
r-10
Oct
-10
Ap
r-11
Oct
-11
Ap
r-12
Oct
-12

Nomura | Emami October 23, 2012
61
Fig. 72: Menthol prices have stabilized but at elevated levels
Source: Bloomberg, Nomura Research
Since Emami has a significantly higher amount of its portfolio that is sold in smaller SKUs, packing costs for the company is higher than for other companies. Packaging materials prices are mostly linked to the crude oil price, which has been largely constant over the past few quarters. However, the crude oil price is volatile and a rise in prices over the next couple of quarters could be a negative for the company.
Fig. 73: LAB prices inching up again
Source: Bloomberg, Nomura Research
Fig. 74: Palm oil prices correcting
Source: Bloomberg, Nomura Research
Risks
• Menthol is a key input for the company, where the supply situation has not been very favourable over the last couple of years. This is a significant risk, as management has limited visibility on menthol prices in the medium term.
• The company spends a significant amount on A&P, and if these investments continue, despite there being no major correction in input prices, it could have a negative impact on margins.
• Management has stated in the past that it will continue to pursue inorganic growth opportunities. While we believe this strategy could potentially reap benefits in the longer term, the company may overpay in the short term in order to purchase strong brands that come to the market.
100
110
120
130
140
150
160
170
Sep
-04
Jan
-05
May
-05
Sep
-05
Jan
-06
May
-06
Sep
-06
Jan
-07
May
-07
Sep
-07
Jan
-08
May
-08
Sep
-08
Jan
-09
May
-09
Sep
-09
Jan
-10
May
-10
Sep
-10
Jan
-11
May
-11
Sep
-11
Jan
-12
May
-12
Sep
-12
40,000
50,000
60,000
70,000
80,000
90,000
100,000
110,000
120,000
130,000
Sep
-02
Mar
-03
Sep
-03
Mar
-04
Sep
-04
Mar
-05
Sep
-05
Mar
-06
Sep
-06
Mar
-07
Sep
-07
Mar
-08
Sep
-08
Mar
-09
Sep
-09
Mar
-10
Sep
-10
Mar
-11
Sep
-11
Mar
-12
Sep
-12
1,000
1,800
2,600
3,400
4,200
5,000
Sep
-03
Mar
-04
Sep
-04
Mar
-05
Sep
-05
Mar
-06
Sep
-06
Mar
-07
Sep
-07
Mar
-08
Sep
-08
Mar
-09
Sep
-09
Mar
-10
Sep
-10
Mar
-11
Sep
-11
Mar
-12
Sep
-12

Nomura | Emami October 23, 2012
62
Management
Emami’s board of directors is comprised of members of the promoter families as well as professional managers. This mix of promoters and professionals as part of the management team gives the company an advantage of having the benefit of drawing on the experiences of both sets of managers. For the line functions, Emami has hired managers who are experienced to execute the day-to-day functions in the company.
Consumer business is all about building and investing behind brands. In that context there are different payback periods for each new brand companies bring to the market place. This is very relevant for Emami as it has brought a number of brands to the market in the past few years. While some have seen instant success like Emami Fair and Handsome, other brands such as Sona Chandi Chyawanprash have seen a modest performance.
We believe this arrangement also allows the company the advantage of taking a longer-term view on brands. A classic example of this is Sona Chandi Chyawanprash. Although the brand has not been able to break even over the last few years, considering the strong brand recall that market leader Dabur’s brand has with consumers (Source: AC Nielsen), Emami has continued to sustain the brand. The company has been investing in the brand, and will continue to support it as management believes it will eventually command a much bigger place in the segment. Such long-term vision from management has rarely been seen across other consumer companies where focus remains on quarterly performance and margins. This we believe is a competitive advantage for a company like Emami, where many categories are at a nascent stage of growth and Emami has a strong market share. With categories such as cooling oil and balms expected by management to grow at double-digit rates in the medium term, we believe management’s strategy is on the right track in terms of its long-term vision.
A brief of key management personnel
Mr Mohan Goenka – Whole time Director Mr Goenka is responsible for the marketing aspect of the company. He is the vision behind the company’s launch of Emami Fair and Handsome. He holds other senior positions in the industry, including Vice Chairman of Marketing Committee - CII – Eastern Region, Committee Member – Merchants’ Chamber of Commerce among others. He has an MBA from Cardiff University.
Mr Aditya V Agarwal, Whole time Director Mr Aditya Agarwal is on the board of several group companies, including Emami Biotech Ltd, Emami Paper Mills Ltd, AMRI Hospitals Ltd and others. He is also the Honorary Consul of the Republic of Ethiopia in Kolkata and Executive Committee member of Assocham.
Mr Harsh V Agarwal, Whole time Director Mr Harsh Agarwal looks after two flagship brands of Emami Ltd: Navratna and Boroplus, that hold pole positions in their respective segments. He also looks after the Retail business of the Emami Group and has been instrumental for expanding the pharmacy chain Frank Ross Ltd and the book cum gift store Starmark. He has a B.Com degree from St. Xaviers College, Kolkata.
Ms Priti Sureka, Whole time Director Ms Priti Sureka looks after a slew of Emami brands in the hair care and personal care segment. A key member of the think tank that drives the Emami Group forward, she heads the marketing division of Emami, the mainstay of the FMCG outfit. She is also among the core members of the strategic team for research and development (R&D) in Emami Ltd. She holds a Bachelor of Arts degree with English honours from Loreto College.

Key company data: See page 2 for company data and detailed price/index chart.
Marico Industries MRCO.NS MRCO IN
GENERAL CONSUMER
EQUITY RESEARCH
On a strong footing
Solid story well captured in current valuations
October 23, 2012
Rating Up from Reduce
Neutral
Target price Increased from 126 INR 220
Closing price October 18, 2012 INR 206
Potential upside +6.8%
Action: Upgrade to Neutral, TP raised to INR220 We upgrade Marico to Neutral as we take into account the sharp fall in input prices as well as its recently completed acquisition of the erstwhile Paras Pharma brands from Reckitt Benckiser. We see Marico continuing to be an active acquirer in the medium term, with management having proven its ability to manage inorganic growth. Over the next quarter or so, there could be earnings upside given the low input prices, but we believe much of it is already captured in current valuations.
Catalysts: Low raw material prices and better-than-expected performance of its recently completed acquisitions Copra (40% of input costs) prices are down more than 35% y-y, which should continue to help underpin gross margins over the next couple of quarters, we think. We also see high likelihood of a potential positive earnings surprise. Marico has also had a full quarter of consolidation of the erstwhile Paras Pharma brands, where its performance will be keenly watched by the market, we think.
Valuations: Marico trades at 25x, in line with its long-term average Marico currently trades at 25x FY14F P/E, which is largely in line with its recent historical average. Although there is a gap with the sector average multiple of 28.6x, we believe this is because Marico is still geared to the relatively slower growth categories of hair oil and cooking oil. However, in the medium term, inorganic growth should help Marico diversify away from these segments further, which could lead to a re-rating towards consumer average multiples.
31 Mar FY12 FY13F FY14F FY15F
Currency (INR) Actual Old New Old New Old New
Revenue (mn) 40,083 42,058 48,525 56,138 64,994
Reported net profit (mn) 3,171 3,888 4,387 5,297 6,462
Normalised net profit (mn) 3,189 3,888 4,387 5,297 6,462
FD normalised EPS 5.19 6.33 6.80 8.21 10.02
FD norm. EPS growth (%) 34.1 19.0 31.2 20.7 22.0
FD normalised P/E (x) 39.6 N/A 30.2 N/A 25.0 N/A 20.5
EV/EBITDA (x) 28.6 N/A 20.7 N/A 17.7 N/A 14.8
Price/book (x) 11.1 N/A 8.6 N/A 6.6 N/A 5.1
Dividend yield (%) 0.4 N/A 0.4 N/A 0.4 N/A 0.6
ROE (%) 30.8 29.5 32.7 29.8 28.0
Net debt/equity (%) 52.8 19.6 31.1 8.3 net cash
Source: Company data, Nomura estimates
Anchor themes
Marico has a strong market position in established brands, which it can leverage to grow into other areas. Longer-term, we see the company developing its international business more aggressively.
Nomura vs consensus
Our EPS estimates are 2% ahead of consensus for FY13F and largely in-line for FY14F.
Research analysts
India Consumer Related
Manish Jain - NFASL [email protected] +91 22 4037 4186
Anup Sudhendranath - NSFSPL [email protected] +91 22 4037 5406
See Appendix A-1 for analyst certification, important disclosures and the status of non-US analysts.

Nomura | Marico Industries October 23, 2012
64
Key data on Marico Industries Income statement (INRmn) Year-end 31 Mar FY11 FY12 FY13F FY14F FY15FRevenue 31,283 40,083 48,525 56,138 64,994Cost of goods sold -16,176 -20,987 -23,259 -26,747 -30,760Gross profit 15,107 19,096 25,267 29,390 34,235SG&A -9,334 -11,904 -15,596 -18,042 -20,821Employee share expense -2,300 -3,073 -3,817 -4,626 -5,588Operating profit 3,473 4,119 5,854 6,723 7,826
EBITDA 4,181 4,844 6,634 7,583 8,774Depreciation -708 -725 -780 -860 -948Amortisation
EBIT 3,473 4,119 5,854 6,723 7,826Net interest expense -410 -424 -534 -481 -324Associates & JCEs
Other income 212 326 303 546 772Earnings before tax 3,275 4,021 5,623 6,788 8,275Income tax -850 -783 -1,181 -1,425 -1,738Net profit after tax 2,425 3,238 4,442 5,362 6,537Minority interests -50 -50 -55 -65 -75Other items 0 0 0 0 0Preferred dividends 0 0 0 0 0Normalised NPAT 2,375 3,189 4,387 5,297 6,462Extraordinary items 489 -18 0 0 0Reported NPAT 2,864 3,171 4,387 5,297 6,462Dividends -472 -500 -515 -588 -735Transfer to reserves 2,392 2,671 3,873 4,709 5,727
Valuation and ratio analysis
Reported P/E (x) 44.1 39.9 30.2 25.0 20.5Normalised P/E (x) 53.2 39.6 30.2 25.0 20.5FD normalised P/E (x) 53.2 39.6 30.2 25.0 20.5FD normalised P/E at price target (x) 56.9 42.4 32.3 26.8 22.0Dividend yield (%) 0.4 0.4 0.4 0.4 0.6Price/cashflow (x) na 41.2 49.8 28.4 21.3Price/book (x) 13.8 11.1 8.6 6.6 5.1EV/EBITDA (x) 33.0 28.6 20.7 17.7 14.8EV/EBIT (x) 39.7 33.7 23.5 20.0 16.6Gross margin (%) 48.3 47.6 52.1 52.4 52.7EBITDA margin (%) 13.4 12.1 13.7 13.5 13.5EBIT margin (%) 11.1 10.3 12.1 12.0 12.0Net margin (%) 9.2 7.9 9.0 9.4 9.9Effective tax rate (%) 25.9 19.5 21.0 21.0 21.0Dividend payout (%) 16.5 15.8 11.7 11.1 11.4Capex to sales (%) 4.9 2.9 1.9 1.7 1.7Capex to depreciation (x) 2.1 1.6 1.2 1.1 1.2ROE (%) 36.5 30.8 32.7 29.8 28.0ROA (pretax %) 20.3 18.4 22.8 23.9 25.3
Growth (%)
Revenue 17.6 28.1 21.1 15.7 15.8EBITDA 11.5 15.9 37.0 14.3 15.7EBIT 10.2 18.6 42.1 14.8 16.4Normalised EPS -2.4 34.1 31.2 20.7 22.0Normalised FDEPS -2.4 34.1 31.2 20.7 22.0
Per share
Reported EPS (INR) 4.66 5.16 6.80 8.21 10.02Norm EPS (INR) 3.87 5.19 6.80 8.21 10.02Fully diluted norm EPS (INR) 3.87 5.19 6.80 8.21 10.02Book value per share (INR) 14.90 18.59 23.87 31.29 40.31DPS (INR) 0.77 0.81 0.80 0.91 1.14Source: Company data, Nomura estimates
Relative performance chart (one year)
Source: ThomsonReuters, Nomura research
(%) 1M 3M 12M
Absolute (INR) 7.8 11.6 35.9
Absolute (USD) 10.1 16.7 26.5
Relative to index 6.0 1.5 24.3
Market cap (USDmn) 2,501.2
Estimated free float (%) 36.0
52-week range (INR) 210.95/137
3-mth avg daily turnover (USDmn)
1.34
Major shareholders (%)
Arisaig Partners (Asia) Pte 5.8
Oppenheimer Developing Markets Funds
5.0
Source: Thomson Reuters, Nomura research

Nomura | Marico Industries October 23, 2012
65
Cashflow (INRmn) Year-end 31 Mar FY11 FY12 FY13F FY14F FY15FEBITDA 4,181 4,844 6,634 7,583 8,774Change in working capital -1,360 -481 -2,567 -1,569 -1,265Other operating cashflow -2,936 -1,293 -1,404 -1,353 -1,274Cashflow from operations -116 3,070 2,664 4,661 6,236Capital expenditure -1,521 -1,167 -938 -952 -1,107Free cashflow -1,637 1,903 1,726 3,709 5,129Reduction in investments -2,067 0 0 0Net acquisitions 0 0 0
Reduction in other LT assets 77 0 0 0Addition in other LT liabilities 0 0 0 0Adjustments 0 0 0 0 0Cashflow after investing acts -1,637 -87 1,726 3,709 5,129Cash dividends -472 -500 -515 -588 -735Equity issue 5 1 30 0 0Debt issue 3,194 -30 0 -1,500 -3,000Convertible debt issue 0 0 0 0 0Others 0 0 0 0 0Cashflow from financial acts 2,727 -530 -485 -2,088 -3,735Net cashflow 1,091 -617 1,241 1,621 1,393Beginning cash 1,115 2,205 1,588 2,829 4,451Ending cash 2,205 1,588 2,829 4,451 5,844Ending net debt 5,448 6,034 4,793 1,672 -2,721Source: Company data, Nomura estimates
Balance sheet (INRmn) As at 31 Mar FY11 FY12 FY13F FY14F FY15FCash & equivalents 2,205 1,588 2,829 4,451 5,844Marketable securities 0 0 0 0 0Accounts receivable 4,373 5,227 5,773 7,042 7,989Inventories 6,011 7,202 8,719 10,087 11,678Other current assets 0 0 0 0 0Total current assets 12,590 14,017 17,322 21,580 25,511LT investments 889 2,957 2,957 2,957 2,957Fixed assets 4,576 5,018 5,176 5,268 5,427Goodwill 3,976 3,955 3,955 3,955 3,955Other intangible assets 0 0 0 0 0Other LT assets 301 223 223 223 223Total assets 22,332 26,170 29,633 33,982 38,073Short-term debt 0 0 0 0 0Accounts payable 4,537 5,672 5,241 6,076 7,052Other current liabilities 769 1,197 1,125 1,358 1,655Total current liabilities 5,305 6,869 6,365 7,433 8,707Long-term debt 7,653 7,623 7,623 6,123 3,123Convertible debt 0 0 0 0 0Other LT liabilities 0 0 0 0 0Total liabilities 12,958 14,491 13,988 13,556 11,829Minority interest 219 249 249 249 249Preferred stock 0 0 0 0 0Common stock 614 615 645 645 645Retained earnings 8,540 10,815 14,751 19,533 25,350Proposed dividends 0 0 0 0 0Other equity and reserves 0 0 0 0 0Total shareholders' equity 9,155 11,430 15,396 20,178 25,995Total equity & liabilities 22,332 26,170 29,633 33,982 38,073
Liquidity (x)
Current ratio 2.37 2.04 2.72 2.90 2.93Interest cover 8.5 9.7 11.0 14.0 24.2
Leverage
Net debt/EBITDA (x) 1.30 1.25 0.72 0.22 net cashNet debt/equity (%) 59.5 52.8 31.1 8.3 net cash
Activity (days)
Days receivable 45.4 43.8 41.4 41.7 42.2Days inventory 118.0 115.2 124.9 128.3 129.1Days payable 89.2 89.0 85.6 77.2 77.9Cash cycle 74.2 70.0 80.7 92.8 93.5Source: Company data, Nomura estimates
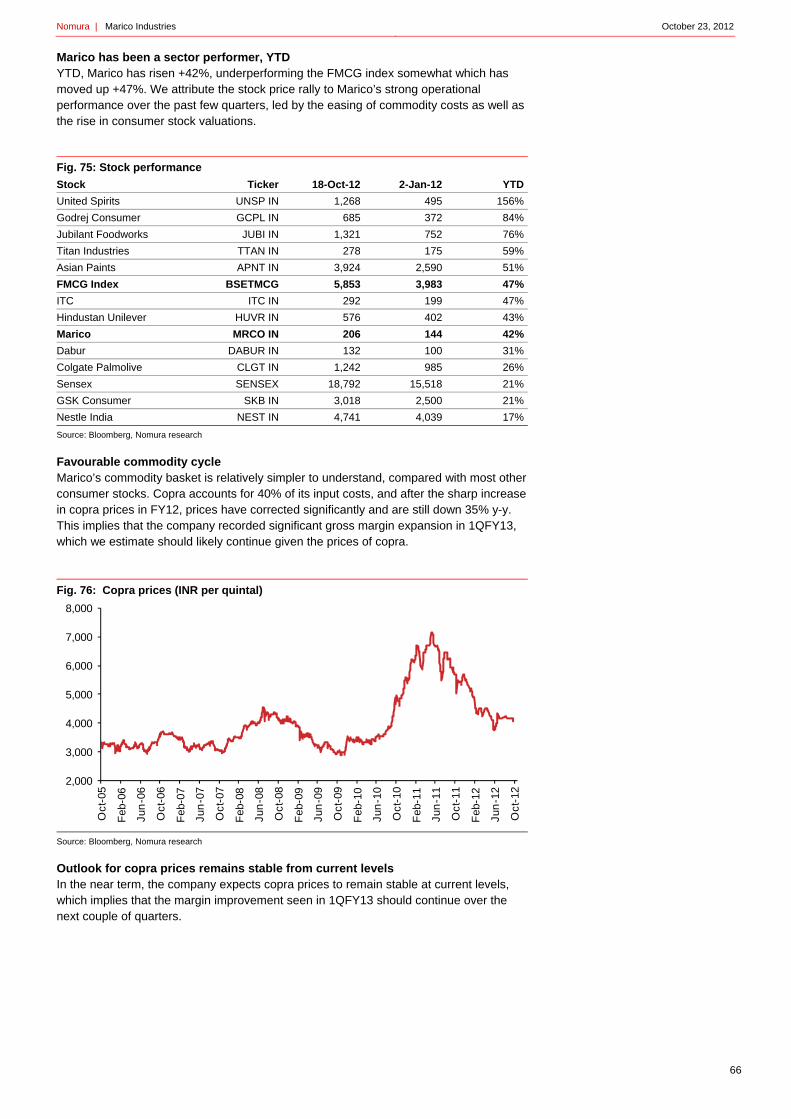
Nomura | Marico Industries October 23, 2012
66
Marico has been a sector performer, YTD YTD, Marico has risen +42%, underperforming the FMCG index somewhat which has moved up +47%. We attribute the stock price rally to Marico’s strong operational performance over the past few quarters, led by the easing of commodity costs as well as the rise in consumer stock valuations.
Fig. 75: Stock performance
Stock Ticker 18-Oct-12 2-Jan-12 YTD
United Spirits UNSP IN 1,268 495 156%
Godrej Consumer GCPL IN 685 372 84%
Jubilant Foodworks JUBI IN 1,321 752 76%
Titan Industries TTAN IN 278 175 59%
Asian Paints APNT IN 3,924 2,590 51%
FMCG Index BSETMCG 5,853 3,983 47%
ITC ITC IN 292 199 47%
Hindustan Unilever HUVR IN 576 402 43%
Marico MRCO IN 206 144 42%
Dabur DABUR IN 132 100 31%
Colgate Palmolive CLGT IN 1,242 985 26%
Sensex SENSEX 18,792 15,518 21%
GSK Consumer SKB IN 3,018 2,500 21%
Nestle India NEST IN 4,741 4,039 17%
Source: Bloomberg, Nomura research
Favourable commodity cycle Marico’s commodity basket is relatively simpler to understand, compared with most other consumer stocks. Copra accounts for 40% of its input costs, and after the sharp increase in copra prices in FY12, prices have corrected significantly and are still down 35% y-y. This implies that the company recorded significant gross margin expansion in 1QFY13, which we estimate should likely continue given the prices of copra.
Fig. 76: Copra prices (INR per quintal)
Source: Bloomberg, Nomura research
Outlook for copra prices remains stable from current levels In the near term, the company expects copra prices to remain stable at current levels, which implies that the margin improvement seen in 1QFY13 should continue over the next couple of quarters.
2,000
3,000
4,000
5,000
6,000
7,000
8,000
Oct
-05
Feb
-06
Jun
-06
Oct
-06
Feb
-07
Jun
-07
Oct
-07
Feb
-08
Jun
-08
Oct
-08
Feb
-09
Jun
-09
Oct
-09
Feb
-10
Jun
-10
Oct
-10
Feb
-11
Jun
-11
Oct
-11
Feb
-12
Jun
-12
Oct
-12
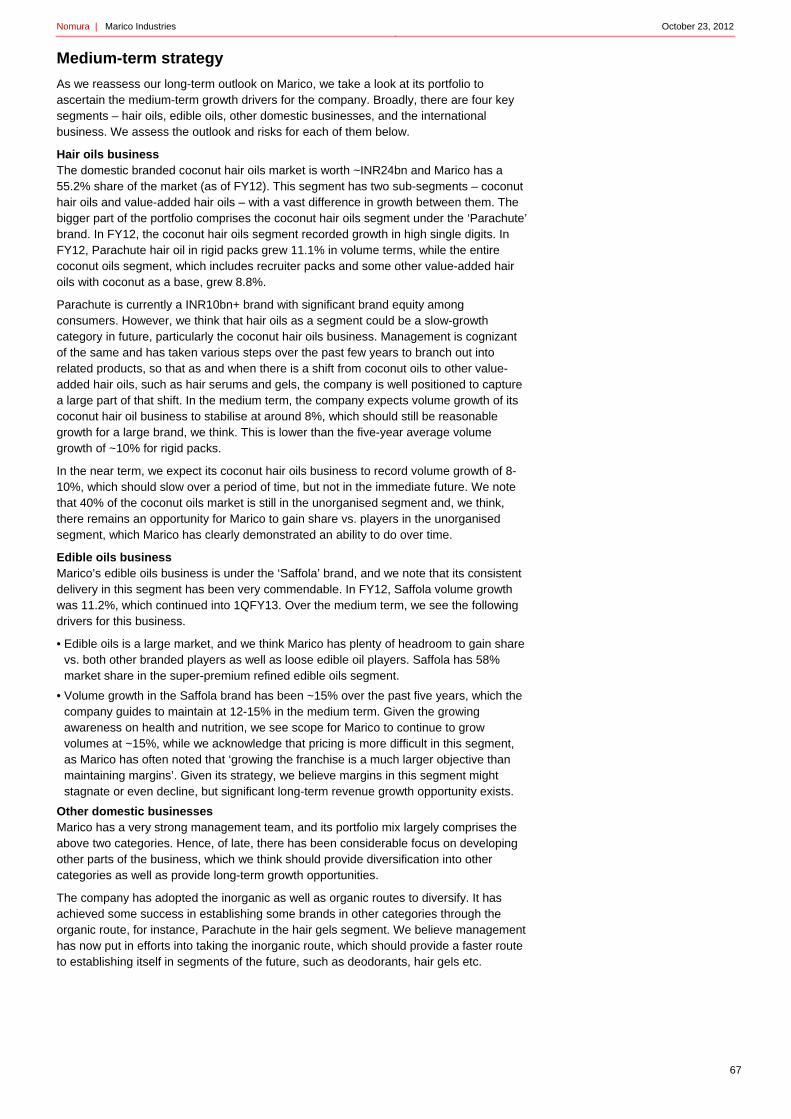
Nomura | Marico Industries October 23, 2012
67
Medium-term strategy
As we reassess our long-term outlook on Marico, we take a look at its portfolio to ascertain the medium-term growth drivers for the company. Broadly, there are four key segments – hair oils, edible oils, other domestic businesses, and the international business. We assess the outlook and risks for each of them below.
Hair oils business The domestic branded coconut hair oils market is worth ~INR24bn and Marico has a 55.2% share of the market (as of FY12). This segment has two sub-segments – coconut hair oils and value-added hair oils – with a vast difference in growth between them. The bigger part of the portfolio comprises the coconut hair oils segment under the ‘Parachute’ brand. In FY12, the coconut hair oils segment recorded growth in high single digits. In FY12, Parachute hair oil in rigid packs grew 11.1% in volume terms, while the entire coconut oils segment, which includes recruiter packs and some other value-added hair oils with coconut as a base, grew 8.8%.
Parachute is currently a INR10bn+ brand with significant brand equity among consumers. However, we think that hair oils as a segment could be a slow-growth category in future, particularly the coconut hair oils business. Management is cognizant of the same and has taken various steps over the past few years to branch out into related products, so that as and when there is a shift from coconut oils to other value-added hair oils, such as hair serums and gels, the company is well positioned to capture a large part of that shift. In the medium term, the company expects volume growth of its coconut hair oil business to stabilise at around 8%, which should still be reasonable growth for a large brand, we think. This is lower than the five-year average volume growth of ~10% for rigid packs.
In the near term, we expect its coconut hair oils business to record volume growth of 8-10%, which should slow over a period of time, but not in the immediate future. We note that 40% of the coconut oils market is still in the unorganised segment and, we think, there remains an opportunity for Marico to gain share vs. players in the unorganised segment, which Marico has clearly demonstrated an ability to do over time.
Edible oils business Marico’s edible oils business is under the ‘Saffola’ brand, and we note that its consistent delivery in this segment has been very commendable. In FY12, Saffola volume growth was 11.2%, which continued into 1QFY13. Over the medium term, we see the following drivers for this business.
• Edible oils is a large market, and we think Marico has plenty of headroom to gain share vs. both other branded players as well as loose edible oil players. Saffola has 58% market share in the super-premium refined edible oils segment.
• Volume growth in the Saffola brand has been ~15% over the past five years, which the company guides to maintain at 12-15% in the medium term. Given the growing awareness on health and nutrition, we see scope for Marico to continue to grow volumes at ~15%, while we acknowledge that pricing is more difficult in this segment, as Marico has often noted that ‘growing the franchise is a much larger objective than maintaining margins’. Given its strategy, we believe margins in this segment might stagnate or even decline, but significant long-term revenue growth opportunity exists.
Other domestic businesses Marico has a very strong management team, and its portfolio mix largely comprises the above two categories. Hence, of late, there has been considerable focus on developing other parts of the business, which we think should provide diversification into other categories as well as provide long-term growth opportunities.
The company has adopted the inorganic as well as organic routes to diversify. It has achieved some success in establishing some brands in other categories through the organic route, for instance, Parachute in the hair gels segment. We believe management has now put in efforts into taking the inorganic route, which should provide a faster route to establishing itself in segments of the future, such as deodorants, hair gels etc.
Nomura | Marico Industries October 23, 2012
68
We believe its recent acquisition of Paras Pharma brands is a clear example of management’s acknowledgement that while the inorganic route can be expensive, it also provides an instant route to establishing its presence in the market. We assess various aspects of the deal below.
Marico’s acquisition of some Paras Pharma brands – a case in point Marico has completed the acquisition of the personal care brands of the erstwhile Paras Pharma, now owned by Reckitt Benckiser (RB) for INR7.4bn. The brands are to be transferred from RB to a separate company in which Marico will acquire a 100% stake.
Rationale for the acquisition, in our view • It allows Marico to enter a new category which is growing at a fast clip, with an
established brand.
• It helps diversify Marico’s portfolio away from the edible oils and hair oils segments, which is the most important long-term consideration for the company.
• However, as we have seen in the foods business and, to some extent, in Kaya (its skincare business), building new categories from scratch has proven to be difficult, and acquisitions may be a better strategy going forward.
What are the brands Marico has bought? Marico has bought an assortment of Paras Pharma brands from RB, but the key part of the portfolio comprising the majority of revenue and profit will be SetWet, Zatak and Livon. A brief description of these three brands and the categories in which they operate is set out below. The company estimates the total revenue from these three brands at INR1.5bn in FY12.
Where do these brands stand? • These brands operate in the three core categories of deodorants, styling gels and hair
serum. As per the company, the category-wise current market share of these brands is: 6% in deos, around 25% in styling gels, and a dominant market share of 68% in speciality hair products like hair serums (Livon).
• Deos is, by far, the largest segment with ~50% of revenue coming from this segment. Within this segment, Zatak operates in the mass market, while Set Wet operates in the premium category. The largest player in the deos segment is HUL with its Axe brand which has 17-18% share, while Set Wet and Zatak combined have the third-largest share of ~10%. The market is largely fragmented, with the grey market accounting for a significant share, which the company expects will reverse over the medium term. The total size of this category is INR10bn, with the category growing at 40-45% over the past few years.
• Styling gels is a much smaller category, currently valued at INR2bn, growing at 20-25% over the past couple of years. This is a very attractive market, and is largely under penetrated; therefore, we see long-term growth opportunity in this category.
How much is the company paying? Marico has disclosed the purchase consideration for the brands it is acquiring at INR7.4bn. Revenues in FY12 were roughly INR1.5bn, as per the company. We also note that when RB bought Paras Pharma for INR32.60bn, it had paid 8.5x sales. Going by the numbers provided by Marico, we estimate this deal has been completed at ~5x sales, which is less than the valuation for OTC brands. HPC brands are less valuable than OTC brands which enjoy much higher margins.
Funding of the deal Marico has funded the deal partly through low-cost debt and mainly through equity-raising which has already happened earlier this year. The deal is now fully in place, with the full consideration already paid.
Synergies Marico does expect some synergies in terms of A&P, as it uses the platform of the acquired brands to push sales of all products in the ‘post hair wash’ segment. We also expect some rationalisation in terms of distributor margins etc. which should help increase synergies in the medium term. In terms of distribution reach, the acquired brands already reach ~80% of the outlets where there is a target audience and hence

Nomura | Marico Industries October 23, 2012
69
there could be some benefits from this as well in the medium term. However, management has clarified that short-term synergy benefits will not be substantial.
Neutral to negative in the short-term… positive in the long-term Overall, while we think, it is a credible move by the company to broaden its product portfolio, in the short-term we do not see this as an accretive deal. Although the size of the acquisition is large, we estimate these brands will contribute ~4-5% to FY13F revenue and 7% to EBITDA on a pro-forma basis. We believe in the short-term this deal is neutral to marginally negative for the company, but over the longer-term it gives Marico an entry into fast-growing categories.
International business Marico first started to grow its business Internationally in Bangladesh, given the close proximity to the market. Over the past few years, it has been able to build significant and scaled-up businesses in the Bangladesh market. International revenues now account for ~25% of the overall business, of which Bangladesh Marico contributes ~50%. Egypt and South East Asia are the other large parts of the business, while in Africa the company has a reasonable presence in South Africa.
Management’s stated objective is that over time, it will continue to grow in its overseas markets. The growth rates in some of these markets are higher than India for its business, which is a long-term positive for the company. Management expects the international business to account for ~30% of revenue over the next three years, or so. In addition, margins in the international business are lower than the overall business; hence, management sees an opportunity to pull up profitability in that segment as well.
Margins to see a significant uptrend in FY13F, but some moderation in FY14F As mentioned earlier, prices of Marico’s key raw material copra are down 35% y-y and given that we expect this scenario to play out through 2013F, we see significant scope for margin expansion in FY13F. We are building in a 120 bps margin expansion in FY13F, although the company is largely investing the gains in new brands; hence, the actual impact of 120 bps is tempered. We see likelihood of margins coming under pressure in FY14F on account of the strong base, but expect the company should be able to manage the same through price increases and moderating A&P spends.
Changes to our estimates The changes to our estimates reflect several factors which are now built into our numbers.
• Audited FY12 numbers are now in our model.
• Numbers for the recently completed acquisition are also in our model.
• Copra prices being down 35% has a significant benefit for the company, which is now reflected in our numbers.
The overall impact on our estimates for FY13F is +15% and we are now largely in-line with consensus for both FY13 and FY14.
Fig. 77: Changes to our estimates (INRmn)
FY13F FY14F
Old New Chg (%) Old New
Revenues 42,058 48,525 15% - 56,138
EBITDA 5,745 6,634 15% - 7,583
Net Income 3,888 4,387 13% - 5,297
Source: Nomura estimates
Upgrading to Neutral, with TP raised to INR220 We are upgrading the stock to Neutral from Reduce. Our change in stance is primarily driven by the sharp fall in commodity prices, which we estimate should help margins improve significantly in FY13F. Although we assume normalisation in FY14, we see scope for the company to maintain 15-16% net profit growth in the medium term. We believe this will be slightly shy of our estimate of 19% EPS growth for the sector, but inorganic growth opportunities should help bridge this gap over the next few years.

Nomura | Marico Industries October 23, 2012
70
Given that we expect Marico’s growth rate should be largely similar to the sector growth rate, we believe the company should trade at average sector multiples. We are moving our target multiple higher from 21x to 24x, which leads our TP higher from INR126 to INR220. A large part of this move is led by changes to our earnings estimates as well as incorporating Marico’s acquisitions in FY12.
Higher-end of historical trading multiple Marico currently trades at 25x one-year forward P/E vs. the past three-year average of 24.5x. We believe given that the company has committed to investing significantly in growing new brands and categories in the short-term, we see limited scope for earnings upgrades from current levels. Although we like the company’s focus on building brands and categories in the long term, we see limited upside potential from current levels in the near term.
Fig. 78: Marico – one-year forward P/E chart
Source: Bloomberg, Nomura research
Valuations lower than sector average, but reflect long-term growth potential Although Marico currently trades at 25x FY14F EPS of INR8.21 vs. the sector average of 28.6x, we believe this also reflects the lower growth potential for the company vs. mid-cap companies. We believe over the longer term; there is potential for de-rating from current levels. We value Marico at 24x average FY14F and FY15F EPS of INR9.1, which is in line with its own recent trading history.
Downside risks: A sharp rise in input prices could lead to a downward revision to our earnings estimates. Upside risks: Stronger-than-expected growth in key segments and lower re-investment in A&P could lead to positive earnings surprises.
0
5
10
15
20
25
30
35
Oct
-03
Ap
r-04
Oct
-04
Ap
r-05
Oct
-05
Ap
r-06
Oct
-06
Ap
r-07
Oct
-07
Ap
r-08
Oct
-08
Ap
r-09
Oct
-09
Ap
r-10
Oct
-10
Ap
r-11
Oct
-11
Ap
r-12
Oct
-12

Nomura | Marico Industries October 23, 2012
71
Fig. 79: Sector valuations
Company Ticker Rating Price Rs.EPS growth
FY14E % FY13E P/E FY14E P/E FY14E PEGMarket cap
USDmn
Nestle * NEST IN Neutral 4,741 22% 37.9x 31.1x 1.4x 8,791
GSK Consumer * SKB IN Buy 3,018 20% 29.7x 24.7x 1.2x 2,444
Jubilant Foodworks JUBI IN Buy 1,321 38% 53.4x 38.6x 1.0x 1,639
United Spirits UNSP IN Neutral 1,268 20% 45.7x 38.0x 1.9x 3,062
F&B Average 39.8x 32.2x
Colgate Palmolive CLGT IN Reduce 1,242 14% 33.1x 29.0x 2.0x 3,248
Dabur DABUR IN Buy 132 20% 29.8x 24.7x 1.2x 4,412
Godrej Consumer GCPL IN Buy 685 24% 30.1x 24.2x 1.0x 4,482
Hindustan Unilever HUVR IN Neutral 576 16% 38.7x 33.3x 2.1x 23,926
Marico MRCO IN Neutral 206 21% 30.2x 25.0x 1.2x 2,431
Emami HMN IN Buy 517 18% 24.5x 20.8x 1.2x 1,503
HPC Average 35.3x 30.0x
ITC ITC IN Buy 292 18% 31.3x 26.6x 1.5x 43,843
Asian Paints APNT IN Neutral 3,924 20% 34.1x 28.4x 1.4x 7,238
Titan Industries TTAN IN Buy 278 28% 30.3x 23.8x 0.9x 4,747
Source: Bloomberg, Nomura estimates; Note: Prices as of 18-Oct * Nestle and GSK are calendar year-based valuations

Key company data: See page 2 for company data and detailed price/index chart.
Godrej Consumer GOCP.NS GCPL IN
GENERAL CONSUMER
EQUITY RESEARCH
Inorganic growth engine firing well
Pioneer in building the inorganic business; solid history of making it work
October 23, 2012
Rating Remains
Buy
Target price Remains INR 800
Closing price October 18, 2012 INR 685
Potential upside +16.8%
Action: Pioneer in building business the inorganic way GCPL has been a pioneer in taking the inorganic route to deliver growth over the past couple of years. The company has delivered strong operational performances both on the domestic and international front, which we expect will continue in the medium term, with management focused on delivering growth ahead of industry. We expect GCPL to remain an acquirer in the medium term, with management now having more confidence and experience in integrating bolt-on deals. Reiterate Buy.
Catalysts: Softening commodity costs and cross-pollination of products from international portfolio Softening commodity prices will have a positive impact on profitability for GCPL. The impact in 1QFY13 was minimal, but we expect 2Q gross margin performance to pick up. In the medium term, we believe there are significant cross-pollination opportunities for the company to take parts of the product portfolio to different geographies.
Valuation: GCPL trades at 24.2x FY14F EPS GCPL trades at 24.2x FY14F EPS, which is lower than the sector average. We believe that as the company continues to deliver on its promise of strong performance in international business, valuations will continue to move ahead in the near term. We believe GCPL is one the best-placed companies in the mid-cap space within the consumer sector, offering investors exposure to a diversified portfolio mix across geographies.
31 Mar FY12 FY13F FY14F FY15F
Currency (INR) Actual Old New Old New Old New
Revenue (mn) 48,662 63,427 63,427 78,898 78,898 94,740 94,740
Reported net profit (mn) 7,267 7,743 7,743 9,626 9,626 11,916 11,916
Normalised net profit (mn) 5,366 7,743 7,743 9,626 9,626 11,916 11,916
FD normalised EPS 15.77 22.75 22.75 28.29 28.29 35.02 35.02
FD norm. EPS growth (%) 6.9 44.3 44.3 24.3 24.3 23.8 23.8
FD normalised P/E (x) 43.4 N/A 30.1 N/A 24.2 N/A 19.6
EV/EBITDA (x) 27.6 N/A 20.5 N/A 15.8 N/A 12.4
Price/book (x) 8.2 N/A 6.9 N/A 5.8 N/A 4.8
Dividend yield (%) 0.8 N/A 1.0 N/A 1.3 N/A 1.6
ROE (%) 31.9 25.0 25.0 26.0 26.0 26.8 26.8
Net debt/equity (%) 32.7 10.6 10.6 net cash net cash net cash net cash
Source: Company data, Nomura estimates
Anchor themes
Longer term, we prefer food companies over HPC names in the consumer space in India. With lower penetration levels and higher pricing power, food companies should outperform HPC names in terms of revenue and profit growth longer term, we believe.
Nomura vs consensus
We are 6% ahead of consensus on FY13F earnings, as we believe integration of acquisitions is on track and likely to surprise on the upside.
Research analysts
India Consumer Related
Manish Jain - NFASL [email protected] +91 22 4037 4186
Anup Sudhendranath - NSFSPL [email protected] +91 22 4037 5406
See Appendix A-1 for analyst certification, important disclosures and the status of non-US analysts.

Nomura | Godrej Consumer October 23, 2012
73
Key data on Godrej Consumer Income statement (INRmn) Year-end 31 Mar FY11 FY12 FY13F FY14F FY15FRevenue 36,430 48,662 63,427 78,898 94,740Cost of goods sold -17,134 -23,185 -30,906 -38,998 -46,828Gross profit 19,296 25,476 32,520 39,901 47,912SG&A -10,127 -13,425 -16,710 -20,198 -23,904Employee share expense -2,845 -3,919 -5,057 -5,997 -7,124Operating profit 6,324 8,132 10,754 13,706 16,885
EBITDA 6,823 8,777 11,556 14,527 17,727Depreciation -499 -644 -802 -822 -842Amortisation 0 0 0 0 0EBIT 6,324 8,132 10,754 13,706 16,885Net interest expense -519 -658 -650 -610 -540Associates & JCEs 0 0 0 0 0Other income 268 398 450 500 550Earnings before tax 6,073 7,872 10,554 13,596 16,895Income tax -1,302 -2,261 -2,111 -2,719 -3,379Net profit after tax 4,771 5,611 8,443 10,876 13,516Minority interests 0 -245 -700 -1,250 -1,600Other items 0 0 0 0 0Preferred dividends 0 0 0 0 0Normalised NPAT 4,771 5,366 7,743 9,626 11,916Extraordinary items 376 1,901 0 0 0Reported NPAT 5,147 7,267 7,743 9,626 11,916Dividends -1,966 -1,966 -2,246 -2,995 -3,743Transfer to reserves 3,181 5,301 5,497 6,632 8,172
Valuation and ratio analysis
Reported P/E (x) 43.1 32.1 30.1 24.2 19.6Normalised P/E (x) 46.5 43.4 30.1 24.2 19.6FD normalised P/E (x) 46.5 43.4 30.1 24.2 19.6FD normalised P/E at price target (x) 54.3 50.7 35.2 28.3 22.8Dividend yield (%) 0.9 0.8 1.0 1.3 1.6Price/cashflow (x) 28.5 19.7 18.6 16.6 14.6Price/book (x) 12.8 8.2 6.9 5.8 4.8EV/EBITDA (x) 36.0 27.6 20.5 15.8 12.4EV/EBIT (x) 38.8 29.8 22.0 16.8 13.0Gross margin (%) 53.0 52.4 51.3 50.6 50.6EBITDA margin (%) 18.7 18.0 18.2 18.4 18.7EBIT margin (%) 17.4 16.7 17.0 17.4 17.8Net margin (%) 14.1 14.9 12.2 12.2 12.6Effective tax rate (%) 21.4 28.7 20.0 20.0 20.0Dividend payout (%) 38.2 27.1 29.0 31.1 31.4Capex to sales (%) 69.6 13.7 5.9 4.0 2.1Capex to depreciation (x) 50.8 10.4 4.7 3.8 2.3ROE (%) 38.2 31.9 25.0 26.0 26.8ROA (pretax %) 23.0 16.9 19.2 22.7 26.3
Growth (%)
Revenue 78.5 33.6 30.3 24.4 20.1EBITDA 61.8 28.6 31.7 25.7 22.0EBIT 58.8 28.6 32.2 27.4 23.2Normalised EPS 34.2 6.9 44.3 24.3 23.8Normalised FDEPS 34.2 6.9 44.3 24.3 23.8
Per share
Reported EPS (INR) 15.91 21.35 22.75 28.29 35.02Norm EPS (INR) 14.74 15.77 22.75 28.29 35.02Fully diluted norm EPS (INR) 14.74 15.77 22.75 28.29 35.02Book value per share (INR) 53.58 83.05 99.20 118.69 142.71DPS (INR) 6.08 5.78 6.60 8.80 11.00Source: Company data, Nomura estimates
Relative performance chart (one year)
Source: ThomsonReuters, Nomura research
(%) 1M 3M 12M
Absolute (INR) 5.5 18.2 72.7
Absolute (USD) 7.7 23.6 60.7
Relative to index 3.7 8.2 61.2
Market cap (USDmn) 4,397.9
Estimated free float (%) 19.7
52-week range (INR) 719/368.05
3-mth avg daily turnover (USDmn)
3.27
Major shareholders (%)
Baytree Investment ( Mauritus) PTE Ltd
4.9
Aberdeen Global Indian Equity Fund Mauritius Ltd
4.1
Source: Thomson Reuters, Nomura research
Notes

Nomura | Godrej Consumer October 23, 2012
74
Cashflow (INRmn) Year-end 31 Mar FY11 FY12 FY13F FY14F FY15FEBITDA 6,823 8,777 11,556 14,527 17,727Change in working capital 2,833 -2,172 1,088 1,464 952Other operating cashflow -1,877 5,226 -101 -1,939 -2,673Cashflow from operations 7,779 11,831 12,543 14,053 16,006Capital expenditure -25,344 -6,683 -3,734 -3,140 -1,969Free cashflow -17,565 5,148 8,809 10,913 14,037Reduction in investments 670 0 0 0 0Net acquisitions 0 0 0 0 0Reduction in other LT assets -1,293 -371 -897 -951 -890Addition in other LT liabilities 77 349 0 0 0Adjustments 0 0 0 0 0Cashflow after investing acts -18,111 5,126 7,911 9,961 13,147Cash dividends -1,966 -1,966 -2,246 -2,995 -3,743Equity issue 4,976 17 0 0 0Debt issue 14,319 953 -3,000 -3,000 -3,000Convertible debt issue 0 0 0 0 0Others 0 0 0 0 0Cashflow from financial acts 17,328 -996 -5,246 -5,995 -6,743Net cashflow -782 4,130 2,665 3,967 6,403Beginning cash 3,052 2,269 6,399 9,064 13,031Ending cash 2,269 6,399 9,064 13,031 19,434Ending net debt 12,419 9,242 3,576 -3,390 -12,794Source: Company data, Nomura estimates
Balance sheet (INRmn) As at 31 Mar FY11 FY12 FY13F FY14F FY15FCash & equivalents 2,269 6,399 9,064 13,031 19,434Marketable securities 0 0 0 0 0Accounts receivable 3,840 4,725 6,159 7,661 9,200Inventories 4,394 7,839 9,794 11,519 13,831Other current assets 0 0 0 0 0Total current assets 10,503 18,963 25,017 32,211 42,465LT investments 0 0 0 0 0Fixed assets 30,857 37,294 37,316 37,494 36,325Goodwill 0 0 0 0 0Other intangible assets 0 0 0 0 0Other LT assets 3,540 3,911 4,808 5,759 6,650Total assets 44,900 60,167 67,141 75,464 85,440Short-term debt 0 0 0 0 0Accounts payable 12,596 14,755 19,232 23,923 28,726Other current liabilities 0 0 0 0 0Total current liabilities 12,596 14,755 19,232 23,923 28,726Long-term debt 14,688 15,640 12,640 9,640 6,640Convertible debt 0 0 0 0 0Other LT liabilities 279 628 628 628 628Total liabilities 27,562 31,023 32,500 34,191 35,994Minority interest 0 882 882 882 882Preferred stock 0 0 0 0 0Common stock 324 340 340 340 340Retained earnings 16,928 27,812 33,309 39,940 48,113Proposed dividends
Other equity and reserves 86 111 111 111 111Total shareholders' equity 17,338 28,262 33,759 40,391 48,564Total equity & liabilities 44,900 60,167 67,141 75,464 85,440
Liquidity (x)
Current ratio 0.83 1.29 1.30 1.35 1.48Interest cover 12.2 12.4 16.5 22.5 31.3
Leverage
Net debt/EBITDA (x) 1.82 1.05 0.31 net cash net cashNet debt/equity (%) 71.6 32.7 10.6 net cash net cash
Activity (days)
Days receivable 25.0 32.2 31.3 32.0 32.5Days inventory 75.0 96.6 104.1 99.7 98.8Days payable 190.9 215.9 200.7 202.0 205.2Cash cycle -90.9 -87.1 -65.2 -70.2 -73.9Source: Company data, Nomura estimates
Notes
Notes

Nomura | Godrej Consumer October 23, 2012
75
Strategy shift from organic growth to inorganic growth
Godrej Consumer Products (GCPL) was historically a soaps and household insecticides, focussed on the domestic market. While the company always had strong brands such as Cinthol and Godrej No. 1 and has been able to drive growth in line with the sector, over the past few years, its strategy has shifted to exploring the inorganic growth opportunities. Within the context of this strategy shift, the company identified early on that such opportunities were limited within India and what opportunities were there were very expensive. It is in this context that management thought about the 3x3 strategy of growing the hair care, household insecticides and personal wash business segments in Asia, Africa and Latin America.
Completed a host of acquisitions in a short space of time
Over the last few years, GCPL has completed a number of acquisitions in line with its stated strategy of pursuing inorganic growth. These acquisitions are outside the Indian sub-continent, and in the areas of interest for GCPL. The acquisitions were announced in a short space of time, which made the market sceptical about the company’s ability to integrate these acquisitions. However, to its credit, the company changed the management structure with a head of international business overseeing all the regional businesses, which along with retaining local management teams at these acquired companies made it possible for it to integrate them quickly.
Fig. 80: GCPL completed a slew of acquisitions in a short period of time
Company Region Date Revenues Areas
Tura Nigeria 2010 USD50 Personal care
Megasari Indonesia 2010 USD120 Insecticides
Darling Africa 2011 USD222 Ethnic Hair care
Issue Argentina 2010 USD33 Hair colors
Argencos Argentina 2010 USD12 Hair Care
Darling Group Africa 2012 NA Hair Care
Source: Company, Nomura research
Results delivered are clearly visible
Once the company completed the acquisitions, there was significant scepticism that integration would take a long time and that the actual delivery on these acquisitions would not be easy. However, GCPL has over the last couple of years proved the sceptics wrong and delivered strong results in the international business, much of which has been inorganic in nature. Over FY10-FY12, the international business portfolio delivered revenue CAGR of 122% with revenues increasing from INR3.78bn to INR18.6bn in FY12.
Indonesia, where company was not present earlier, is now 50% of its international business portfolio, with the company having a significant market presence through Megasari. Africa and Europe are the other large bits of the portfolio, with management expecting contribution from Africa to increase substantially, once the acquisition of the Darling group is completed.

Nomura | Godrej Consumer October 23, 2012
76
Fig. 81: International business (INR mn) has seen strong performance over FY10-12
Source: Company data, Nomura research
Significant shift in portfolio
As a result of these acquisitions, GCPL’s portfolio has seen a big shift away from being predominantly dependent on the soaps business to now having a large and diverse portfolio spread across three continents. The soaps business is now a small, although still meaningful, part of the overall portfolio. This diversity gives the portfolio much more balance and reduces dependency of one segment.
Fig. 82: Shift in product portfolio
Source: Company, Nomura research
Market has rewarded the company with significant re-rating
While it is true that, historically, GCPL traded at a lower multiple vs. other mid cap consumer companies in India, there has been a significant change in this over the last few years. As the company has delivered consistent and robust results in its international business, the market has rewarded it by re-rating the stock upwards over a period of time. If we look at the long-term history of GCPL, there is clear evidence that, over the last couple of years, stock has seen significant re-rating and is now trading at multiples closer to its life-time highs. We believe this is likely to sustain in the medium term, as a more diverse portfolio demands that GCPL should trade at close to sector average multiples.
0
2,000
4,000
6,000
8,000
10,000
12,000
14,000
16,000
18,000
20,000
FY10 FY11 FY12
Hair Care, 20%
Personal Wash, 41%
Home Care, 20%
Others, 19%
FY10
Hair Care, 19%
Personal Wash, 22%Home
Care, 47%
Others, 12%
FY12
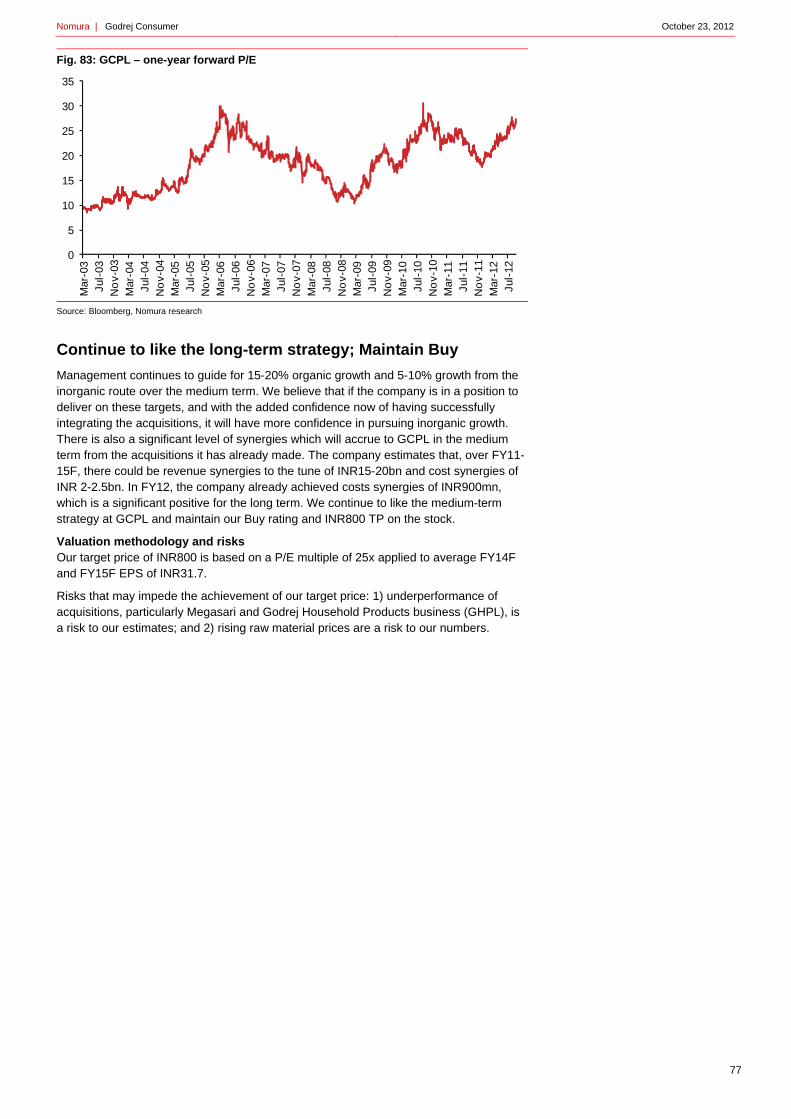
Nomura | Godrej Consumer October 23, 2012
77
Fig. 83: GCPL – one-year forward P/E
Source: Bloomberg, Nomura research
Continue to like the long-term strategy; Maintain Buy
Management continues to guide for 15-20% organic growth and 5-10% growth from the inorganic route over the medium term. We believe that if the company is in a position to deliver on these targets, and with the added confidence now of having successfully integrating the acquisitions, it will have more confidence in pursuing inorganic growth. There is also a significant level of synergies which will accrue to GCPL in the medium term from the acquisitions it has already made. The company estimates that, over FY11-15F, there could be revenue synergies to the tune of INR15-20bn and cost synergies of INR 2-2.5bn. In FY12, the company already achieved costs synergies of INR900mn, which is a significant positive for the long term. We continue to like the medium-term strategy at GCPL and maintain our Buy rating and INR800 TP on the stock.
Valuation methodology and risks Our target price of INR800 is based on a P/E multiple of 25x applied to average FY14F and FY15F EPS of INR31.7.
Risks that may impede the achievement of our target price: 1) underperformance of acquisitions, particularly Megasari and Godrej Household Products business (GHPL), is a risk to our estimates; and 2) rising raw material prices are a risk to our numbers.
0
5
10
15
20
25
30
35M
ar-0
3Ju
l-03
No
v-03
Mar
-04
Jul-
04N
ov-
04M
ar-0
5Ju
l-05
No
v-05
Mar
-06
Jul-
06N
ov-
06M
ar-0
7Ju
l-07
No
v-07
Mar
-08
Jul-
08N
ov-
08M
ar-0
9Ju
l-09
No
v-09
Mar
-10
Jul-
10N
ov-
10M
ar-1
1Ju
l-11
No
v-11
Mar
-12
Jul-
12

Nomura | India consumer October 23, 2012
78

Nomura | India consumer October 23, 2012
79

Nomura | India consumer October 23, 2012
80

Nomura | India consumer October 23, 2012
81
Appendix A-1
Analyst Certification
We, Manish Jain and Anup Sudhendranath, hereby certify (1) that the views expressed in this Research report accurately reflect our personal views about any or all of the subject securities or issuers referred to in this Research report, (2) no part of our compensation was, is or will be directly or indirectly related to the specific recommendations or views expressed in this Research report and (3) no part of our compensation is tied to any specific investment banking transactions performed by Nomura Securities International, Inc., Nomura International plc or any other Nomura Group company.
Issuer Specific Regulatory Disclosures The term "Nomura Group Company" used herein refers to Nomura Holdings, Inc. or any affiliate or subsidiary of Nomura Holdings, Inc. Nomura Group Companies involved in the production of Research are detailed in the disclaimer below.
Issuer name Ticker Price Price date Stock rating Sector rating Disclosures Godrej Consumer GCPL IN INR 684 18-Oct-2012 Buy Not rated Emami HMN IN INR 516 18-Oct-2012 Buy Not rated Marico Industries MRCO IN INR 205 18-Oct-2012 Neutral Not rated
Previous Rating Issuer name Previous Rating Date of change Godrej Consumer Neutral 21-Jul-2011 Emami Not rated 22-Oct-2012 Marico Industries Reduce 22-Oct-2012
Rating and target price changes
Ticker Old stock rating New stock rating Old target price New target price
Emami HMN IN Not rated Buy N/A INR 620
Marico Industries MRCO IN Reduce Neutral INR 126 INR 220
Marico Industries (MRCO IN) INR 205 (18-Oct-2012) Rating and target price chart (three year history)
Neutral (Sector rating: Not rated)
Date Rating Target price Closing price 04-May-11 126.00 137.90 06-Jul-10 Reduce 125.20 06-Jul-10 118.00 125.20 28-Oct-09 115.00 97.70
For explanation of ratings refer to the stock rating keys located after chart(s)
Valuation Methodology Our INR220 target price values Marico at 24x average FY14F and FY15F EPS of INR 9.1. Risks that may impede the achievement of the target price Downside risk to our numbers could come from a sharp rise in key raw material prices such as copra. Upside risk could come from better than expected performance of the international subsidiaries and the recent acquisition.

Nomura | India consumer October 23, 2012
82
Emami (HMN IN) INR 516 (18-Oct-2012)
Buy (Sector rating: Not rated) Chart Not Available
Valuation Methodology Our INR648 target price values Emami at 24x average FY14F and FY15F EPS of INR27. Our target P/E of 24x is inline with the multiples we assign to other consumer companies. Risks that may impede the achievement of the target price Main risk to our earnings estimates could come from higher-than-expected raw material prices and increased competitive intensity in the business.
Godrej Consumer (GCPL IN) INR 684 (18-Oct-2012) Rating and target price chart (three year history)
Buy (Sector rating: Not rated)
Date Rating Target price Closing price 20-Sep-12 800.00 662.70 21-Jul-11 Buy 444.50 21-Jul-11 524.00 444.50 17-Sep-10 419.00 465.50 17-Nov-09 276.00 275.15
For explanation of ratings refer to the stock rating keys located after chart(s)
Valuation Methodology Our target price of INR800 is based on a P/E multiple of 25x applied to average FY14F and FY15F EPS of 31.7 Risks that may impede the achievement of the target price 1) Underperformance of acquisitions, particularly Megasari and Godrej Household Products business (GHPL), is a risk to our estimates and 2) rising raw material prices are a risk to our numbers.

Nomura | India consumer October 23, 2012
83
Important Disclosures Online availability of research and conflict-of-interest disclosures Nomura research is available on www.nomuranow.com/research, Bloomberg, Capital IQ, Factset, MarkitHub, Reuters and ThomsonOne. Important disclosures may be read at http://go.nomuranow.com/research/globalresearchportal/pages/disclosures/disclosures.aspx or requested from Nomura Securities International, Inc., on 1-877-865-5752. If you have any difficulties with the website, please email [email protected] for help. The analysts responsible for preparing this report have received compensation based upon various factors including the firm's total revenues, a portion of which is generated by Investment Banking activities. Unless otherwise noted, the non-US analysts listed at the front of this report are not registered/qualified as research analysts under FINRA/NYSE rules, may not be associated persons of NSI, and may not be subject to FINRA Rule 2711 and NYSE Rule 472 restrictions on communications with covered companies, public appearances, and trading securities held by a research analyst account. Any authors named in this report are research analysts unless otherwise indicated. Industry Specialists identified in some Nomura International plc research reports are employees within the Firm who are responsible for the sales and trading effort in the sector for which they have coverage. Industry Specialists do not contribute in any manner to the content of research reports in which their names appear. Marketing Analysts identified in some Nomura research reports are research analysts employed by Nomura International plc who are primarily responsible for marketing Nomura’s Equity Research product in the sector for which they have coverage. Marketing Analysts may also contribute to research reports in which their names appear and publish research on their sector. Distribution of ratings (Global) The distribution of all ratings published by Nomura Global Equity Research is as follows: 43% have been assigned a Buy rating which, for purposes of mandatory disclosures, are classified as a Buy rating; 40% of companies with this rating are investment banking clients of the Nomura Group*. 45% have been assigned a Neutral rating which, for purposes of mandatory disclosures, is classified as a Hold rating; 46% of companies with this rating are investment banking clients of the Nomura Group*. 12% have been assigned a Reduce rating which, for purposes of mandatory disclosures, are classified as a Sell rating; 22% of companies with this rating are investment banking clients of the Nomura Group*. As at 30 September 2012. *The Nomura Group as defined in the Disclaimer section at the end of this report. Explanation of Nomura's equity research rating system in Europe, Middle East and Africa, US and Latin America The rating system is a relative system indicating expected performance against a specific benchmark identified for each individual stock. Analysts may also indicate absolute upside to target price defined as (fair value - current price)/current price, subject to limited management discretion. In most cases, the fair value will equal the analyst's assessment of the current intrinsic fair value of the stock using an appropriate valuation methodology such as discounted cash flow or multiple analysis, etc. STOCKS A rating of 'Buy', indicates that the analyst expects the stock to outperform the Benchmark over the next 12 months. A rating of 'Neutral', indicates that the analyst expects the stock to perform in line with the Benchmark over the next 12 months. A rating of 'Reduce', indicates that the analyst expects the stock to underperform the Benchmark over the next 12 months. A rating of 'Suspended', indicates that the rating, target price and estimates have been suspended temporarily to comply with applicable regulations and/or firm policies in certain circumstances including, but not limited to, when Nomura is acting in an advisory capacity in a merger or strategic transaction involving the company. Benchmarks are as follows: United States/Europe: please see valuation methodologies for explanations of relevant benchmarks for stocks, which can be accessed at: http://go.nomuranow.com/research/globalresearchportal/pages/disclosures/disclosures.aspx; Global Emerging Markets (ex-Asia): MSCI Emerging Markets ex-Asia, unless otherwise stated in the valuation methodology. SECTORS A 'Bullish' stance, indicates that the analyst expects the sector to outperform the Benchmark during the next 12 months. A 'Neutral' stance, indicates that the analyst expects the sector to perform in line with the Benchmark during the next 12 months. A 'Bearish' stance, indicates that the analyst expects the sector to underperform the Benchmark during the next 12 months. Benchmarks are as follows: United States: S&P 500; Europe: Dow Jones STOXX 600; Global Emerging Markets (ex-Asia): MSCI Emerging Markets ex-Asia. Explanation of Nomura's equity research rating system in Japan and Asia ex-Japan STOCKS Stock recommendations are based on absolute valuation upside (downside), which is defined as (Target Price - Current Price) / Current Price, subject to limited management discretion. In most cases, the Target Price will equal the analyst's 12-month intrinsic valuation of the stock, based on an appropriate valuation methodology such as discounted cash flow, multiple analysis, etc. A 'Buy' recommendation indicates that potential upside is 15% or more. A 'Neutral' recommendation indicates that potential upside is less than 15% or downside is less than 5%. A 'Reduce' recommendation indicates that potential downside is 5% or more. A rating of 'Suspended' indicates that the rating and target price have been suspended temporarily to comply with applicable regulations and/or firm policies in certain circumstances including when Nomura is acting in an advisory capacity in a merger or strategic transaction involving the subject company. Securities and/or companies that are labelled as 'Not rated' or shown as 'No rating' are not in regular research coverage of the Nomura entity identified in the top banner. Investors should not expect continuing or additional information from Nomura relating to such securities and/or companies. SECTORS A 'Bullish' rating means most stocks in the sector have (or the weighted average recommendation of the stocks under coverage is) a positive absolute recommendation. A 'Neutral' rating means most stocks in the sector have (or the weighted average recommendation of the stocks under coverage is) a neutral absolute recommendation. A 'Bearish' rating means most stocks in the sector have (or the weighted average recommendation of the stocks under coverage is) a negative absolute recommendation. Target Price A Target Price, if discussed, reflect in part the analyst's estimates for the company's earnings. The achievement of any target price may be impeded by general market and macroeconomic trends, and by other risks related to the company or the market, and may not occur if the company's earnings differ from estimates.

Nomura | India consumer October 23, 2012
84
Disclaimers This document contains material that has been prepared by the Nomura entity identified at the top or bottom of page 1 herein, if any, and/or, with the sole or joint contributions of one or more Nomura entities whose employees and their respective affiliations are specified on page 1 herein or identified elsewhere in the document. Affiliates and subsidiaries of Nomura Holdings, Inc. (collectively, the 'Nomura Group'), include: Nomura Securities Co., Ltd. ('NSC') Tokyo, Japan; Nomura International plc ('NIplc'), UK; Nomura Securities International, Inc. ('NSI'), New York, US; Nomura International (Hong Kong) Ltd. (‘NIHK’), Hong Kong; Nomura Financial Investment (Korea) Co., Ltd. (‘NFIK’), Korea (Information on Nomura analysts registered with the Korea Financial Investment Association ('KOFIA') can be found on the KOFIA Intranet at http://dis.kofia.or.kr); Nomura Singapore Ltd. (‘NSL’), Singapore (Registration number 197201440E, regulated by the Monetary Authority of Singapore); Nomura Australia Ltd. (‘NAL’), Australia (ABN 48 003 032 513), regulated by the Australian Securities and Investment Commission ('ASIC') and holder of an Australian financial services licence number 246412; P.T. Nomura Indonesia (‘PTNI’), Indonesia; Nomura Securities Malaysia Sdn. Bhd. (‘NSM’), Malaysia; Nomura International (Hong Kong) Ltd., Taipei Branch (‘NITB’), Taiwan; Nomura Financial Advisory and Securities (India) Private Limited (‘NFASL’), Mumbai, India (Registered Address: Ceejay House, Level 11, Plot F, Shivsagar Estate, Dr. Annie Besant Road, Worli, Mumbai- 400 018, India; Tel: +91 22 4037 4037, Fax: +91 22 4037 4111; SEBI Registration No: BSE INB011299030, NSE INB231299034, INF231299034, INE 231299034, MCX: INE261299034); NIplc, Madrid Branch (‘NIplc, Madrid’) and NIplc, Italian Branch (‘NIplc, Italy’). ‘CNS Thailand’ next to an analyst’s name on the front page of a research report indicates that the analyst is employed by Capital Nomura Securities Public Company Limited (‘CNS’) to provide research assistance services to NSL under a Research Assistance Agreement. CNS is not a Nomura entity. THIS MATERIAL IS: (I) FOR YOUR PRIVATE INFORMATION, AND WE ARE NOT SOLICITING ANY ACTION BASED UPON IT; (II) NOT TO BE CONSTRUED AS AN OFFER TO SELL OR A SOLICITATION OF AN OFFER TO BUY ANY SECURITY IN ANY JURISDICTION WHERE SUCH OFFER OR SOLICITATION WOULD BE ILLEGAL; AND (III) BASED UPON INFORMATION FROM SOURCES THAT WE CONSIDER RELIABLE, BUT HAS NOT BEEN INDEPENDENTLY VERIFIED BY NOMURA GROUP. Nomura Group does not warrant or represent that the document is accurate, complete, reliable, fit for any particular purpose or merchantable and does not accept liability for any act (or decision not to act) resulting from use of this document and related data. To the maximum extent permissible all warranties and other assurances by Nomura group are hereby excluded and Nomura Group shall have no liability for the use, misuse, or distribution of this information. Opinions or estimates expressed are current opinions as of the original publication date appearing on this material and the information, including the opinions and estimates contained herein, are subject to change without notice. Nomura Group is under no duty to update this document. Any comments or statements made herein are those of the author(s) and may differ from views held by other parties within Nomura Group. Clients should consider whether any advice or recommendation in this report is suitable for their particular circumstances and, if appropriate, seek professional advice, including tax advice. Nomura Group does not provide tax advice. Nomura Group, and/or its officers, directors and employees, may, to the extent permitted by applicable law and/or regulation, deal as principal, agent, or otherwise, or have long or short positions in, or buy or sell, the securities, commodities or instruments, or options or other derivative instruments based thereon, of issuers or securities mentioned herein. Nomura Group companies may also act as market maker or liquidity provider (as defined within Financial Services Authority (‘FSA’) rules in the UK) in the financial instruments of the issuer. Where the activity of market maker is carried out in accordance with the definition given to it by specific laws and regulations of the US or other jurisdictions, this will be separately disclosed within the specific issuer disclosures. This document may contain information obtained from third parties, including ratings from credit ratings agencies such as Standard & Poor’s. Reproduction and distribution of third party content in any form is prohibited except with the prior written permission of the related third party. Third party content providers do not guarantee the accuracy, completeness, timeliness or availability of any information, including ratings, and are not responsible for any errors or omissions (negligent or otherwise), regardless of the cause, or for the results obtained from the use of such content. Third party content providers give no express or implied warranties, including, but not limited to, any warranties of merchantability or fitness for a particular purpose or use. Third party content providers shall not be liable for any direct, indirect, incidental, exemplary, compensatory, punitive, special or consequential damages, costs, expenses, legal fees, or losses (including lost income or profits and opportunity costs) in connection with any use of their content, including ratings. Credit ratings are statements of opinions and are not statements of fact or recommendations to purchase hold or sell securities. They do not address the suitability of securities or the suitability of securities for investment purposes, and should not be relied on as investment advice. Any MSCI sourced information in this document is the exclusive property of MSCI Inc. (‘MSCI’). Without prior written permission of MSCI, this information and any other MSCI intellectual property may not be reproduced, re-disseminated or used to create any financial products, including any indices. This information is provided on an "as is" basis. The user assumes the entire risk of any use made of this information. MSCI, its affiliates and any third party involved in, or related to, computing or compiling the information hereby expressly disclaim all warranties of originality, accuracy, completeness, merchantability or fitness for a particular purpose with respect to any of this information. Without limiting any of the foregoing, in no event shall MSCI, any of its affiliates or any third party involved in, or related to, computing or compiling the information have any liability for any damages of any kind. MSCI and the MSCI indexes are services marks of MSCI and its affiliates. Investors should consider this document as only a single factor in making their investment decision and, as such, the report should not be viewed as identifying or suggesting all risks, direct or indirect, that may be associated with any investment decision. Nomura Group produces a number of different types of research product including, among others, fundamental analysis, quantitative analysis and short term trading ideas; recommendations contained in one type of research product may differ from recommendations contained in other types of research product, whether as a result of differing time horizons, methodologies or otherwise. Nomura Group publishes research product in a number of different ways including the posting of product on Nomura Group portals and/or distribution directly to clients. Different groups of clients may receive different products and services from the research department depending on their individual requirements. Clients outside of the US may access the Nomura Research Trading Ideas platform (Retina) at http://go.nomuranow.com/equities/tradingideas/retina/ Figures presented herein may refer to past performance or simulations based on past performance which are not reliable indicators of future performance. Where the information contains an indication of future performance, such forecasts may not be a reliable indicator of future performance. Moreover, simulations are based on models and simplifying assumptions which may oversimplify and not reflect the future distribution of returns. Certain securities are subject to fluctuations in exchange rates that could have an adverse effect on the value or price of, or income derived from, the investment. The securities described herein may not have been registered under the US Securities Act of 1933 (the ‘1933 Act’), and, in such case, may not be offered or sold in the US or to US persons unless they have been registered under the 1933 Act, or except in compliance with an exemption from the registration requirements of the 1933 Act. Unless governing law permits otherwise, any transaction should be executed via a Nomura entity in your home jurisdiction. This document has been approved for distribution in the UK and European Economic Area as investment research by NIplc, which is authorized and regulated by the FSA and is a member of the London Stock Exchange. It does not constitute a personal recommendation, as defined by the FSA, or take into account the particular investment objectives, financial situations, or needs of individual investors. It is intended only for investors who are 'eligible counterparties' or 'professional clients' as defined by the FSA, and may not, therefore, be redistributed to retail clients as defined by the FSA. This document has been approved by NIHK, which is regulated by the Hong Kong Securities and Futures Commission, for distribution in Hong Kong by NIHK. This document has been approved for distribution in Australia by NAL, which is authorized and regulated in Australia by the ASIC. This document has also been approved for distribution in Malaysia by NSM. In Singapore, this document has been distributed by NSL. NSL accepts legal responsibility for the content of this document, where it concerns securities, futures and foreign exchange, issued by their foreign affiliates in respect of recipients who are not accredited, expert or institutional investors as defined by the Securities and Futures Act (Chapter 289). Recipients of this document in Singapore should contact NSL in respect of matters arising from, or in connection with, this document. Unless prohibited by the provisions of Regulation S of the 1933 Act, this material is distributed in the US, by NSI, a US-registered broker-dealer, which accepts responsibility for its contents in accordance with the provisions of Rule 15a-6, under the US Securities Exchange Act of 1934. This document has not been approved for distribution in the Kingdom of Saudi Arabia (‘Saudi Arabia’) or to clients other than 'professional clients' in the United Arab Emirates (‘UAE’) by Nomura Saudi Arabia, NIplc or any other member of Nomura Group, as the case may be. Neither this document nor any copy thereof may be taken or transmitted or distributed, directly or indirectly, by any person other than those authorised to do so into Saudi Arabia or in the UAE or to any person located in Saudi Arabia or to clients other than 'professional clients' in the UAE. By accepting to receive this document, you represent that you are not located in Saudi Arabia or that you are a 'professional client' in the UAE and agree to comply with these restrictions. Any failure to comply with these restrictions may constitute a violation of the laws of the UAE or Saudi Arabia. NO PART OF THIS MATERIAL MAY BE (I) COPIED, PHOTOCOPIED, OR DUPLICATED IN ANY FORM, BY ANY MEANS; OR (II) REDISTRIBUTED WITHOUT THE PRIOR WRITTEN CONSENT OF A MEMBER OF NOMURA GROUP. If this document has been distributed by electronic transmission, such as e-mail, then such transmission cannot be guaranteed to be secure or error-free as information could be intercepted, corrupted, lost, destroyed, arrive late or incomplete, or contain viruses. The sender therefore does not accept liability for any errors or omissions in the contents of this document, which may arise as a result of electronic transmission. If verification is required, please request a hard-copy version. Nomura Group manages conflicts with respect to the production of research through its compliance policies and procedures (including, but not limited to, Conflicts of Interest, Chinese Wall and Confidentiality policies) as well as through the maintenance of Chinese walls and employee training. Additional information is available upon request and disclosure information is available at the Nomura Disclosure web page: http://go.nomuranow.com/research/globalresearchportal/pages/disclosures/disclosures.aspx Copyright © 2012 Nomura International (Hong Kong) Ltd. All rights reserve

Nomura Asian Equity Research Group
Hong Kong Nomura International (Hong Kong) Limited 30/F Two International Finance Centre, 8 Finance Street, Central, Hong Kong Tel: +852 2536 1111 Fax: +852 2536 1820
Singapore
Nomura Singapore Limited 10 Marina Boulevard Marina Bay Financial Centre Tower 2, #36-01, Singapore 018983, Singapore Tel: +65 6433 6288 Fax: +65 6433 6169
Taipei Nomura International (Hong Kong) Limited, Taipei Branch 17th Floor, Walsin Lihwa Xinyi Building, No.1, Songzhi Road, Taipei 11047, Taiwan, R.O.C. Tel: +886 2 2176 9999 Fax: +886 2 2176 9900
Seoul Nomura Financial Investment (Korea) Co., Ltd. 17th floor, Seoul Finance Center, 84 Taepyeongno 1-ga, Jung-gu, Seoul 100-768, Korea Tel: +82 2 3783 2000 Fax: +82 2 3783 2500
Kuala Lumpur Nomura Securities Malaysia Sdn. Bhd. Suite No 16.5, Level 16, Menara IMC, 8 Jalan Sultan Ismail, 50250 Kuala Lumpur, Malaysia Tel: +60 3 2027 6811 Fax: +60 3 2027 6888
India Nomura Financial Advisory and Securities (India) Private Limited Ceejay House, Level 11, Plot F, Shivsagar Estate, Dr. Annie Besant Road, Worli, Mumbai- 400 018, India Tel: +91 22 4037 4037 Fax: +91 22 4037 4111
Indonesia PT Nomura Indonesia Suite 209A, 9th Floor, Sentral Senayan II Building Jl. Asia Afrika No. 8, Gelora Bung Karno, Jakarta 10270, Indonesia Tel: +62 21 2991 3300 Fax: +62 21 2991 3333
Sydney Nomura Australia Ltd. Level 25, Governor Phillip Tower, 1 Farrer Place, Sydney NSW 2000 Tel: +61 2 8062 8000 Fax: +61 2 8062 8362
Tokyo Equity Research Department Financial & Economic Research Center Nomura Securities Co., Ltd. 17/F Urbannet Building, 2-2, Otemachi 2-chome Chiyoda-ku, Tokyo 100-8130, Japan Tel: +81 3 5255 1658 Fax: +81 3 5255 1747, 3272 0869
Caring for the environment: to receive only the electronic versions of our research, please contact your sales representative.