Lateral variation in upper mantle viscosity: role of water
17
Lateral variation in upper mantle viscosity: role of water Jacqueline E. Dixon a, * , T.H. Dixon a , D.R. Bell b , R. Malservisi a a Rosentiel School of Marine and Atmospheric Science, University of Miami, 4600 Rickenbacker Cswy, Miami, FL 33149, USA b Department of Chemistry and Biochemistry and Department of Geological Sciences Arizona State University, Tempe, AZ 85287-1604, USA Received 27 August 2003; received in revised form 10 March 2004; accepted 15 March 2004 Abstract Differences in the viscosity of the earth’s upper mantle beneath the western US ( f 10 18 –10 19 Pa s) and global average values based on glacial isostatic adjustment and other data ( f 10 20 –10 21 Pa s) are generally ascribed to differences in temperature. We compile geochemical data on the water contents of western US lavas and mantle xenoliths, compare these data to water solubility in olivine, and calculate the corresponding effective viscosity of olivine, the major constituent of the upper mantle, using a power law creep rheological model. These data and calculations suggest that the low viscosities of the western US upper mantle reflect the combined effect of high water concentration and elevated temperature. The high water content of the western US upper mantle may reflect the long history of Farallon plate subduction, including flat slab subduction, which effectively advected water as far inland as the Colorado Plateau, hydrating and weakening the upper mantle. D 2004 Elsevier B.V. All rights reserved. Keywords: mantle; viscosity; Western United States; water 1. Introduction The viscosity of the Earth’s mantle influences a wide variety of geophysical phenomena, including convec- tion, melt extraction, seismic attenuation, and the response of Earth’s surface to transient loads such as glaciation and earthquakes. Early models of mantle viscosity, primarily based on observations of post- glacial rebound, assumed radial symmetry and had limited depth resolution. Improvements in data and numerical techniques in the last two decades have enabled resolution of both depth and lateral variations in viscosity, especially in the upper mantle. One di- chotomy that has emerged from these studies is that local estimates for upper mantle viscosity in the west- ern US, an active tectonic area ( f 10 18 –10 19 Pa s) are significantly lower than global average and large re- gional estimates based on glacial isostatic adjustment in continental shield areas such as Fennoscandia and the interior of North America ( f 10 20 –10 21 Pa s) (Table 1). While these differences in part reflect the thermal contrast between the low heat flow continental interior and higher heat flow western North America, here we suggest that regional differences in the water content of the upper mantle also play an important role. 2. Summary of viscosity estimates The rheological structure of the mantle may be inferred from the Earth’s response to unloading asso- 0012-821X/$ - see front matter D 2004 Elsevier B.V. All rights reserved. doi:10.1016/j.epsl.2004.03.022 * Corresponding author. Tel.: +1-305-361-4150; fax: +1-305- 361-4632. E-mail address: [email protected] (J.E. Dixon). www.elsevier.com/locate/epsl Earth and Planetary Science Letters 222 (2004) 451 – 467
-
Upload
independent -
Category
Documents
-
view
1 -
download
0
Transcript of Lateral variation in upper mantle viscosity: role of water
www.elsevier.com/locate/epsl
Earth and Planetary Science Letters 222 (2004) 451–467
Lateral variation in upper mantle viscosity: role of water
Jacqueline E. Dixona,*, T.H. Dixona, D.R. Bellb, R. Malservisia
aRosentiel School of Marine and Atmospheric Science, University of Miami, 4600 Rickenbacker Cswy, Miami, FL 33149, USAbDepartment of Chemistry and Biochemistry and Department of Geological Sciences Arizona State University, Tempe, AZ 85287-1604, USA
Received 27 August 2003; received in revised form 10 March 2004; accepted 15 March 2004
Abstract
Differences in the viscosity of the earth’s upper mantle beneath the western US (f 1018–1019 Pa s) and global average
values based on glacial isostatic adjustment and other data (f 1020–1021 Pa s) are generally ascribed to differences in
temperature. We compile geochemical data on the water contents of western US lavas and mantle xenoliths, compare these data
to water solubility in olivine, and calculate the corresponding effective viscosity of olivine, the major constituent of the upper
mantle, using a power law creep rheological model. These data and calculations suggest that the low viscosities of the western
US upper mantle reflect the combined effect of high water concentration and elevated temperature. The high water content of
the western US upper mantle may reflect the long history of Farallon plate subduction, including flat slab subduction, which
effectively advected water as far inland as the Colorado Plateau, hydrating and weakening the upper mantle.
D 2004 Elsevier B.V. All rights reserved.
Keywords: mantle; viscosity; Western United States; water
1. Introduction chotomy that has emerged from these studies is that
The viscosity of the Earth’s mantle influences awide
variety of geophysical phenomena, including convec-
tion, melt extraction, seismic attenuation, and the
response of Earth’s surface to transient loads such as
glaciation and earthquakes. Early models of mantle
viscosity, primarily based on observations of post-
glacial rebound, assumed radial symmetry and had
limited depth resolution. Improvements in data and
numerical techniques in the last two decades have
enabled resolution of both depth and lateral variations
in viscosity, especially in the upper mantle. One di-
0012-821X/$ - see front matter D 2004 Elsevier B.V. All rights reserved.
doi:10.1016/j.epsl.2004.03.022
* Corresponding author. Tel.: +1-305-361-4150; fax: +1-305-
361-4632.
E-mail address: [email protected] (J.E. Dixon).
local estimates for upper mantle viscosity in the west-
ern US, an active tectonic area (f 1018–1019 Pa s) are
significantly lower than global average and large re-
gional estimates based on glacial isostatic adjustment
in continental shield areas such as Fennoscandia and
the interior of North America (f 1020–1021 Pa s)
(Table 1). While these differences in part reflect the
thermal contrast between the low heat flow continental
interior and higher heat flow western North America,
here we suggest that regional differences in the water
content of the upper mantle also play an important role.
2. Summary of viscosity estimates
The rheological structure of the mantle may be
inferred from the Earth’s response to unloading asso-

J.E. Dixon et al. / Earth and Planetary Science Letters 222 (2004) 451–467452
ciated with retreat of Late Pleistocene continental ice
sheets, termed glacial isostatic adjustment (GIA).
These responses include non-tidal acceleration of Earth
rotation (e.g., [1,2]), polar motion (e.g., [3–5]), and
surface elevation change, including rapid uplift near
de-glaciated regions such as Hudson Bay and Fenno-
scandia. The elevation data are mainly Holocene rela-
tive sea level changes, as recorded by dated geological
deposits such as raised beaches (e.g., [6–8]) and
present-day elevation change recorded by tide gauges
and space geodesy (e.g., [9–11]). Surface changes
associated with deglaciation will be influenced by the
rheological structure of the upper mantle beneath
cratonic areas, since the main forcing function (glaci-
ation/deglaciation) is centered on Precambrian shields
(Fennoscandia, Hudson Bay). For simplicity we refer
to such models as cratonic, even though they are often
Table 1
Selected viscosity estimates for upper mantlea
Reference Loading
phenomenon
or region
Datab Viscosity
(Pa s)
Bills et al. [17]
(Fig. 12)
Lake
Bonneville
(drying)
shoreline
elevation
3� 1018
Bills et al. [17]
(Fig. 11)
Lake
Bonneville
(drying)
shoreline
elevation
3� 1019
Kaufmann and Lake Mead leveling 2� 1017
Amelung [16]
(multi-layer model)
(filling)
Kaufmann and
Amelung [16]
(two-layer model)c
Lake Mead
(filling)
leveling 1�1018
Nishimura and
Thatcher
[134]d
1959 Hebgen
Lake eq.
leveling 4� 1018
Pollitz et al. [18]e 1992 Landers eq. GPS, InSAR 1–6� 1018
Pollitz [31]f 1999 Hector
Mine eq.
GPS 4.6� 1018
Lambeck et al.
[129]
British Isles
uplift (Holocene)
RSL(a) 3–6� 1020
Lambeck et al.
[130]gFennoscandia
uplift (Holocene)
RSL(b) 4� 1020
Milne et al. [10] Fennoscandia GPS 5–10� 1020
uplift (present)
Peltier [12] global RSL(b,c) 4� 1020
Mitrovica and
Forte [135]
global RSL(b,c)
gravity
2� 1021
Kaufmann and
Lambeck [14]
global RSL(b,c),
gravity, ER
5� 1020
considered global average models. Peltier [12] and
Lambeck and Johnston [13] give complete reviews.
Kaufmann and Lambeck [14] compare several
recent viscosity profiles based on these and related
methods. Common features include a strong, elastic
lithosphere f 50–150 km thick (very high to essen-
tially infinite viscosity), an underlying Maxwell vis-
coelastic upper mantle down to the 660–670 km
discontinuity with relatively uniform properties (vis-
cosity 3� 1020–4� 1021 Pa s), and a lower mantle
beneath the 660–670 discontinuity with higher vis-
cosity. Peltier [15] gives a range of 3–5� 1020 Pa s
for the upper mantle in three models (VM-1, 2, 3)
constrained by GIA data and assuming a spherically
symmetric earth with viscoelastic mantle. Because of
the scale of loading, most such models have limited
resolution in the uppermost mantle, and there are
trade-offs; for example, between the thickness of the
elastic lithosphere and the viscosity of the mantle
immediately below (e.g., [13]).
The viscosity structure of the western US upper
mantle differs significantly from these cratonic mod-
els. Kaufmann and Amelung [16] estimate values
between 2� 1017 and 1�1018 Pa s in the depth range
75–150 km based on leveling data between 1935–
1983 measuring deformation after filling of Lake
Mead beginning in 1935. Bills et al. [17] report a
viscosity range of 5� 1017 and 5� 1019 Pa s for the
upper mantle between 75 and 150 km depth based on
deformed shorelines of Late Pleistocene Lake Bonne-
ville in response to drying over several thousand years.
Notes to Table 1:aViscosity of upper mantle at 125 km depth unless noted,
published in last decade. All studies assume Maxwell viscoelastic
rheology and multi-layer model with at least three layers (e.g., upper
crust, lower crust, upper mantle) unless noted. Upper entries (above
line) are western US, east of San Andreas fault and west of
Colorado plateau; remaining entries represent GIA-based cratonic
models or global models.bData: GPS=Global Positioning System; InSAR= Interfero-
metric Synthetic Aperture Radar; RSL=Relative sea level curves
from shoreline elevation data (a =British Isles; b = Fennoscandia,
c =Hudson Bay); ER=Earth rotation.cValid for half space below 30 km depth.dValid for half space below 38 km depth.eValid for depth range 50–100 km.fSteady state viscosity in linear biviscous model, valid below 30
km depth.gValid for depth range 150–200 km.

J.E. Dixon et al. / Earth and Planetary Science Letters 222 (2004) 451–467 453
Pollitz at el. [18] infer a viscosity of 2.7� 1018 Pa s
beneath the Mojave Desert in the depth range 50–100
km based on GPS and INSAR observations of crustal
deformation for 3 years following the 1992 Landers
earthquake. The general similarity of these low vis-
cosity western US estimates, despite significant differ-
ences in analytic technique, time scale, and nature of
the loading phenomena, suggests that the contrast with
GIA-based cratonic models is significant.
Models incorporating GIA data tend to have good
depth resolution of upper mantle properties down to at
least the 660–670 km discontinuity, but less resolution
for lithospheric ( <f 100 km) rheology due to the
large diameter of the loads. In contrast, studies in the
western US provide information on mantle properties
shallower than f 150 km due to the local character of
the loads (earthquakes; lake filling or drying). Subse-
quent figures and discussion include the depth range
50–150 km, although both classes of models only
have common resolution in the depth range 100–150
km. Table 1 compares recent mantle viscosity esti-
mates at 125 km depth for the two regions. The
rheological contrast between them is actually more
apparent in the depth range 50–100 km, immediately
below the crust, but quantitative comparisons are
difficult because of the aforementioned resolution
issue. This depth range is generally considered litho-
spheric mantle in cratonic regions (with essentially
infinite viscosity), whereas in the western US, most
modern (f last decade) geodetic studies resolve a
very low viscosity uppermost mantle here, so low in
fact that lithospheric mantle may be thin or even
absent. These geodetic studies are in qualitative agree-
ment with both seismic data [19,20] and dynamic
elevation models based on gravity and topography
data [21] that suggest a thin lithosphere through much
of the western US. In this view, lithospheric strength
here would reside mainly in the crust [22].
3. Non-linear rheology and effective viscosity:
effects of strain rate, temperature, pressure, and
water content
Most estimates for upper mantle viscosity are based
on models that assume Maxwell rheology, with elastic
solid behavior on short time scales, and Newtonian
viscous fluid behavior (linear stress–strain rate rela-
tionship) on long time scales. The actual rheology of
the upper mantle above f 200 km is probably better
represented by thermally activated power law creep
[23–25], as evidenced by seismic anisotropy in the
upper mantle beneath oceans [26] and continents [27].
In this case, there is a non-linear relation between
stress and strain rate. We can nevertheless define an
effective viscosity at a given strain rate.
Large transient motions within a few months of
major earthquakes can be interpreted in terms of
extremely low viscosities for the uppermost mantle,
perhaps reflecting this power law dependence and the
influence of high stress–high strain rate conditions in
the immediate post-seismic period [18,28,29]. These
transients may also reflect the influence of afterslip
and/or transient or bi-viscous rheology [30,31]. If we
ignore these shortest term post-seismic transients and
focus instead on responses over several years or
longer, then a more coherent picture emerges, with a
range of loading phenomena with greatly different
time scales (several years to several thousand years)
leading to broadly similar viscosity estimates. Thus,
while strain rate certainly influences effective viscos-
ity, strain rate differences alone are unlikely to be the
primary explanation for the regional viscosity differ-
ences noted above.
Water dissolved in nominally anhydrous minerals
such as olivine is now recognized as a ubiquitous
component in the mantle [32,33]. Laboratory meas-
urements indicate that olivine, the primary constitu-
ent of the upper mantle, is significantly weakened
by the presence of water, lowering effective viscos-
ity relative to dryer mantle at a given temperature
and strain rate [34–39]. Regional and depth differ-
ences in the water concentration of the upper mantle
can vary by more than one order of magnitude, and
may therefore exert significant control on effective
viscosity. For non-linear power law creep, the ap-
propriate constitutive law for olivine in the shallow
upper mantle, the relation between strain rate, stress,
temperature and water fugacity is [37–39]:
e ¼ Arnf rH2Oexp�ðH*=RTÞ ð1Þ
where e is the strain rate, r is the stress, n is the stress
exponent (typically 3.0–3.5 for olivine), fH2O is the
water fugacity, r is the fugacity exponent, R is the gas
constant,H* is the activation enthalpy (H* =Q* +PV*,
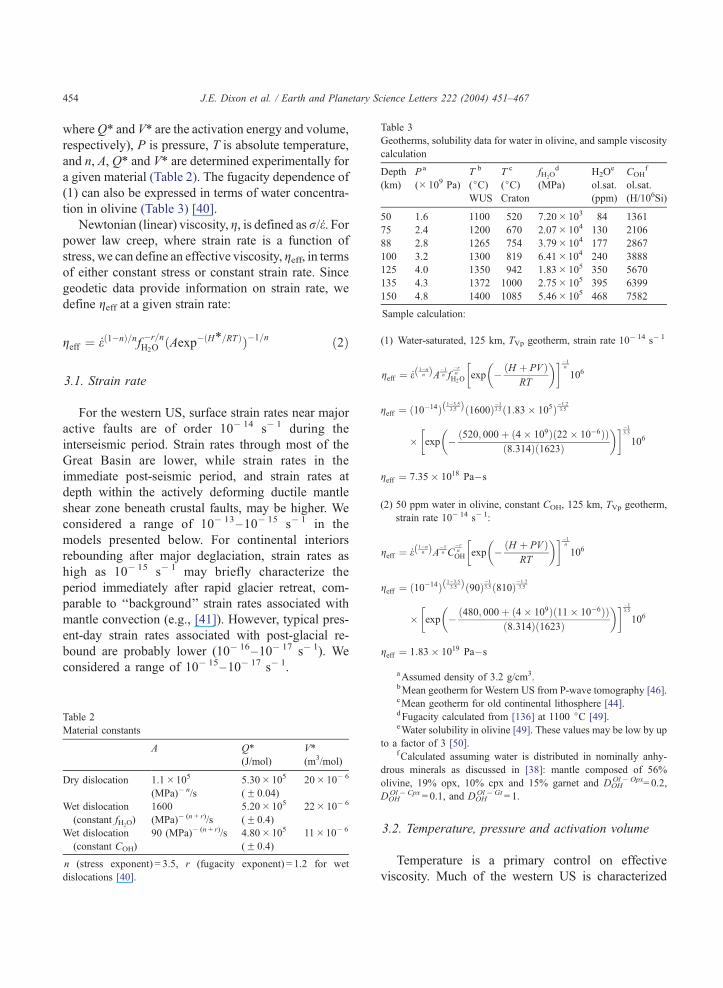
Table 3
Geotherms, solubility data for water in olivine, and sample viscosity
calculation
Depth
(km)
P a
(� 109 Pa)
T b
(jC)WUS
T c
(jC)Craton
fH2Od
(MPa)
H2Oe
ol.sat.
(ppm)
COHf
ol.sat.
(H/106Si)
50 1.6 1100 520 7.20� 103 84 1361
75 2.4 1200 670 2.07� 104 130 2106
88 2.8 1265 754 3.79� 104 177 2867
100 3.2 1300 819 6.41�104 240 3888
125 4.0 1350 942 1.83� 105 350 5670
135 4.3 1372 1000 2.75� 105 395 6399
150 4.8 1400 1085 5.46� 105 468 7582
Sample calculation:
(1) Water-saturated, 125 km, TVp geotherm, strain rate 10� 14 s� 1
geff ¼ e1�nnð ÞA�1
n f�rn
H2Oexp � ðH þ PV Þ
RT
� �� ��1n
106
geff ¼ ð10�14Þ1�3:53:5ð Þð1600Þ
�13:5ð1:83� 105Þ
�1:23:5
� exp � ð520; 000þ ð4� 109Þð22� 10�6ÞÞð8:314Þð1623Þ
� �� ��13:5
106
geff ¼ 7:35� 1018 Pa�s
(2) 50 ppm water in olivine, constant COH, 125 km, TVp geotherm,
strain rate 10� 14 s� 1:
geff ¼ e1�nnð ÞA�1
n C�rn
OH exp � ðH þ PV ÞRT
� �� ��1n
106
geff ¼ ð10�14Þ1�3:53:5ð Þð90Þ
�13:5ð810Þ
�1:23:5
� exp � ð480; 000þ ð4� 109Þð11� 10�6ÞÞð8:314Þð1623Þ
� �� ��13:5
106
geff ¼ 1:83� 1019 Pa�s
J.E. Dixon et al. / Earth and Planetary Science Letters 222 (2004) 451–467454
whereQ* and V* are the activation energy and volume,
respectively), P is pressure, T is absolute temperature,
and n, A, Q* and V* are determined experimentally for
a given material (Table 2). The fugacity dependence of
(1) can also be expressed in terms of water concentra-
tion in olivine (Table 3) [40].
Newtonian (linear) viscosity, g, is defined as r/e. Forpower law creep, where strain rate is a function of
stress, we can define an effective viscosity, geff, in terms
of either constant stress or constant strain rate. Since
geodetic data provide information on strain rate, we
define geff at a given strain rate:
geff ¼ eð1�nÞ=nf�r=nH2O
ðAexp�ðH*=RTÞÞ�1=n ð2Þ
3.1. Strain rate
For the western US, surface strain rates near major
active faults are of order 10� 14 s� 1 during the
interseismic period. Strain rates through most of the
Great Basin are lower, while strain rates in the
immediate post-seismic period, and strain rates at
depth within the actively deforming ductile mantle
shear zone beneath crustal faults, may be higher. We
considered a range of 10� 13–10� 15 s� 1 in the
models presented below. For continental interiors
rebounding after major deglaciation, strain rates as
high as 10� 15 s� 1 may briefly characterize the
period immediately after rapid glacier retreat, com-
parable to ‘‘background’’ strain rates associated with
mantle convection (e.g., [41]). However, typical pres-
ent-day strain rates associated with post-glacial re-
bound are probably lower (10� 16–10� 17 s� 1). We
considered a range of 10� 15–10� 17 s� 1.
Table 2
Material constants
A Q*
(J/mol)
V*
(m3/mol)
Dry dislocation 1.1�105
(MPa)� n/s
5.30� 105
(F 0.04)
20� 10� 6
Wet dislocation
(constant fH2O)
1600
(MPa)� (n + r)/s
5.20� 105
(F 0.4)
22� 10� 6
Wet dislocation
(constant COH)
90 (MPa)� (n + r)/s 4.80� 105
(F 0.4)
11�10� 6
n (stress exponent) = 3.5, r (fugacity exponent) = 1.2 for wet
dislocations [40].
aAssumed density of 3.2 g/cm3.bMean geotherm for Western US from P-wave tomography [46].cMean geotherm for old continental lithosphere [44].dFugacity calculated from [136] at 1100 jC [49].eWater solubility in olivine [49]. These values may be low by up
to a factor of 3 [50].fCalculated assuming water is distributed in nominally anhy-
drous minerals as discussed in [38]: mantle composed of 56%
olivine, 19% opx, 10% cpx and 15% garnet and DOHOl� Opx= 0.2,
Ol � Cpx Ol� Gt
3.2. Temperature, pressure and activation volume
Temperature is a primary control on effective
viscosity. Much of the western US is characterized
DOH = 0.1, and DOH = 1.
J.E. Dixon et al. / Earth and Planetary Science Letters 222 (2004) 451–467 455
by elevated heat flow, in the range 60–90 mW/m2
(e.g., [42]) in contrast to Fennoscandia, Hudson
Bay and other Precambrian shields with low heat
flow, f 35–45 mW/m2. Shield areas and active
tectonic regions with surface heat flows of 40 and
75 mW/m2, respectively, have temperature differ-
ences at 150 km depth of f 300–400 jC for
standard conductive geothermal profiles (e.g.,
[43,44]). For cratonic areas, we use the ‘‘shield
intraplate’’ geotherm of Green and Falloon [44].
For the western US, there may be significant spatial
variation and hence uncertainty in the appropriate
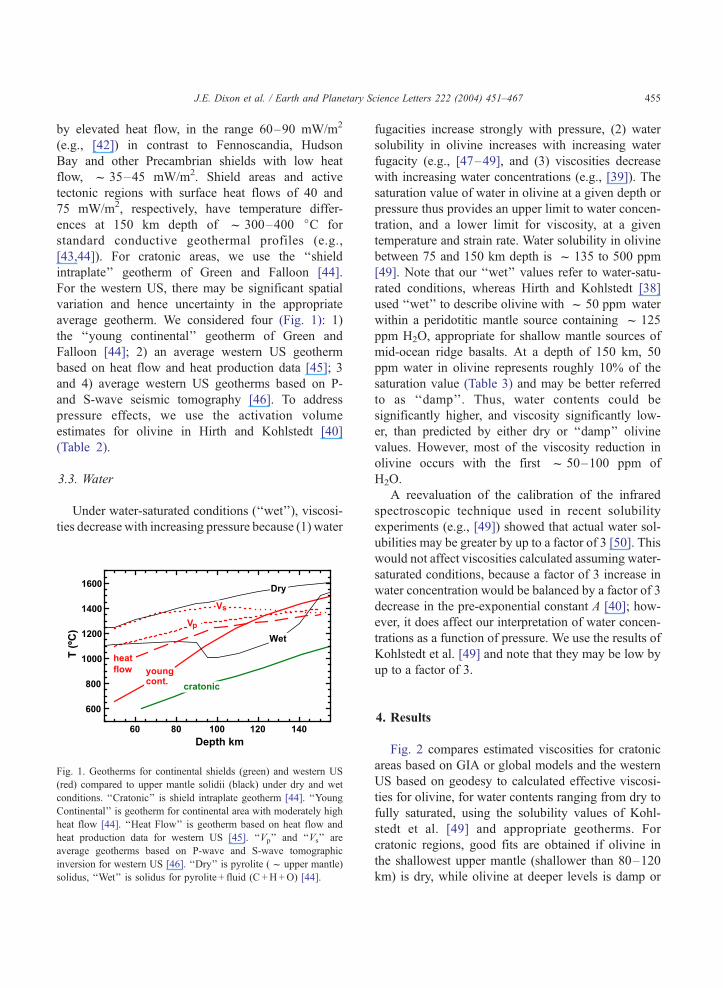
average geotherm. We considered four (Fig. 1): 1)
the ‘‘young continental’’ geotherm of Green and
Falloon [44]; 2) an average western US geotherm
based on heat flow and heat production data [45]; 3
and 4) average western US geotherms based on P-
and S-wave seismic tomography [46]. To address
pressure effects, we use the activation volume
estimates for olivine in Hirth and Kohlstedt [40]
(Table 2).
3.3. Water
Under water-saturated conditions (‘‘wet’’), viscosi-
ties decrease with increasing pressure because (1) water
Fig. 1. Geotherms for continental shields (green) and western US
(red) compared to upper mantle solidii (black) under dry and wet
conditions. ‘‘Cratonic’’ is shield intraplate geotherm [44]. ‘‘Young
Continental’’ is geotherm for continental area with moderately high
heat flow [44]. ‘‘Heat Flow’’ is geotherm based on heat flow and
heat production data for western US [45]. ‘‘Vp’’ and ‘‘Vs’’ are
average geotherms based on P-wave and S-wave tomographic
inversion for western US [46]. ‘‘Dry’’ is pyrolite (f upper mantle)
solidus, ‘‘Wet’’ is solidus for pyrolite + fluid (C +H+O) [44].
fugacities increase strongly with pressure, (2) water
solubility in olivine increases with increasing water
fugacity (e.g., [47–49], and (3) viscosities decrease
with increasing water concentrations (e.g., [39]). The
saturation value of water in olivine at a given depth or
pressure thus provides an upper limit to water concen-
tration, and a lower limit for viscosity, at a given
temperature and strain rate. Water solubility in olivine
between 75 and 150 km depth is f 135 to 500 ppm
[49]. Note that our ‘‘wet’’ values refer to water-satu-
rated conditions, whereas Hirth and Kohlstedt [38]
used ‘‘wet’’ to describe olivine with f 50 ppm water
within a peridotitic mantle source containing f 125
ppm H2O, appropriate for shallow mantle sources of
mid-ocean ridge basalts. At a depth of 150 km, 50
ppm water in olivine represents roughly 10% of the
saturation value (Table 3) and may be better referred
to as ‘‘damp’’. Thus, water contents could be
significantly higher, and viscosity significantly low-
er, than predicted by either dry or ‘‘damp’’ olivine
values. However, most of the viscosity reduction in
olivine occurs with the first f 50–100 ppm of
H2O.
A reevaluation of the calibration of the infrared
spectroscopic technique used in recent solubility
experiments (e.g., [49]) showed that actual water sol-
ubilities may be greater by up to a factor of 3 [50]. This
would not affect viscosities calculated assuming water-
saturated conditions, because a factor of 3 increase in
water concentration would be balanced by a factor of 3
decrease in the pre-exponential constant A [40]; how-
ever, it does affect our interpretation of water concen-
trations as a function of pressure. We use the results of
Kohlstedt et al. [49] and note that they may be low by
up to a factor of 3.
4. Results
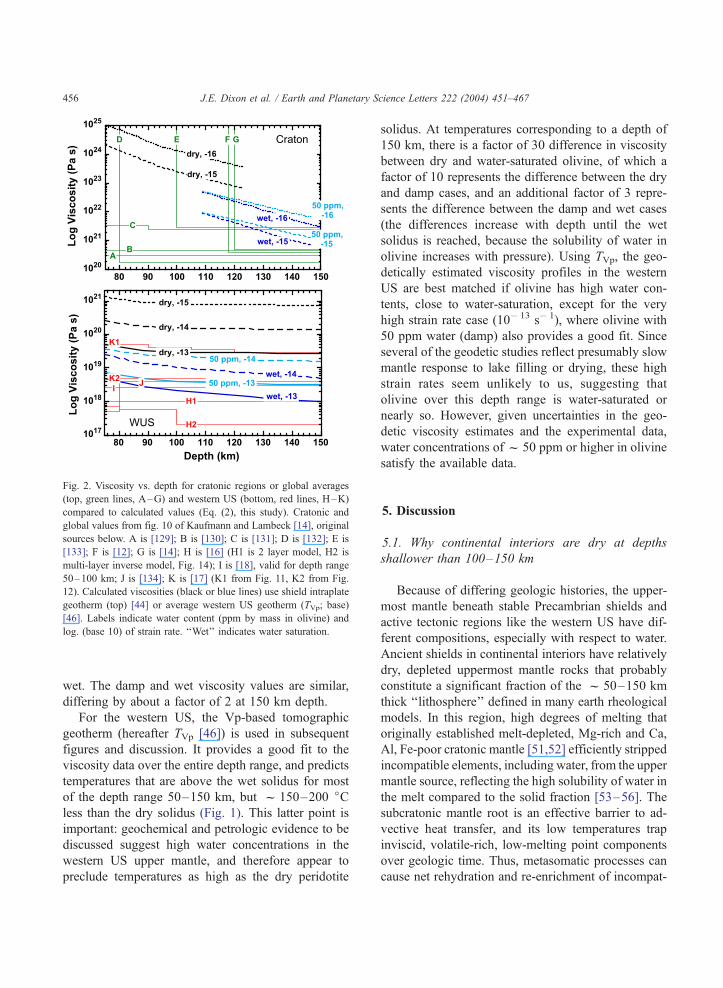
Fig. 2 compares estimated viscosities for cratonic
areas based on GIA or global models and the western
US based on geodesy to calculated effective viscosi-
ties for olivine, for water contents ranging from dry to
fully saturated, using the solubility values of Kohl-
stedt et al. [49] and appropriate geotherms. For
cratonic regions, good fits are obtained if olivine in
the shallowest upper mantle (shallower than 80–120
km) is dry, while olivine at deeper levels is damp or
A
-15
Fig. 2. Viscosity vs. depth for cratonic regions or global averages
(top, green lines, A–G) and western US (bottom, red lines, H–K)
compared to calculated values (Eq. (2), this study). Cratonic and
global values from fig. 10 of Kaufmann and Lambeck [14], original
sources below. A is [129]; B is [130]; C is [131]; D is [132]; E is
[133]; F is [12]; G is [14]; H is [16] (H1 is 2 layer model, H2 is
multi-layer inverse model, Fig. 14); I is [18], valid for depth range
50–100 km; J is [134]; K is [17] (K1 from Fig. 11, K2 from Fig.
12). Calculated viscosities (black or blue lines) use shield intraplate
geotherm (top) [44] or average western US geotherm (TVp; base)
[46]. Labels indicate water content (ppm by mass in olivine) and
log. (base 10) of strain rate. ‘‘Wet’’ indicates water saturation.
J.E. Dixon et al. / Earth and Planetary Science Letters 222 (2004) 451–467456
wet. The damp and wet viscosity values are similar,
differing by about a factor of 2 at 150 km depth.
For the western US, the Vp-based tomographic
geotherm (hereafter TVp [46]) is used in subsequent
figures and discussion. It provides a good fit to the
viscosity data over the entire depth range, and predicts
temperatures that are above the wet solidus for most
of the depth range 50–150 km, but f 150–200 jCless than the dry solidus (Fig. 1). This latter point is
important: geochemical and petrologic evidence to be
discussed suggest high water concentrations in the
western US upper mantle, and therefore appear to
preclude temperatures as high as the dry peridotite
solidus. At temperatures corresponding to a depth of
150 km, there is a factor of 30 difference in viscosity
between dry and water-saturated olivine, of which a
factor of 10 represents the difference between the dry
and damp cases, and an additional factor of 3 repre-
sents the difference between the damp and wet cases
(the differences increase with depth until the wet
solidus is reached, because the solubility of water in
olivine increases with pressure). Using TVp, the geo-
detically estimated viscosity profiles in the western
US are best matched if olivine has high water con-
tents, close to water-saturation, except for the very
high strain rate case (10� 13 s� 1), where olivine with
50 ppm water (damp) also provides a good fit. Since
several of the geodetic studies reflect presumably slow
mantle response to lake filling or drying, these high
strain rates seem unlikely to us, suggesting that
olivine over this depth range is water-saturated or
nearly so. However, given uncertainties in the geo-
detic viscosity estimates and the experimental data,
water concentrations off 50 ppm or higher in olivine
satisfy the available data.
5. Discussion
5.1. Why continental interiors are dry at depths
shallower than 100–150 km
Because of differing geologic histories, the upper-
most mantle beneath stable Precambrian shields and
active tectonic regions like the western US have dif-
ferent compositions, especially with respect to water.
Ancient shields in continental interiors have relatively
dry, depleted uppermost mantle rocks that probably
constitute a significant fraction of the f 50–150 km
thick ‘‘lithosphere’’ defined in many earth rheological
models. In this region, high degrees of melting that
originally established melt-depleted, Mg-rich and Ca,
Al, Fe-poor cratonic mantle [51,52] efficiently stripped
incompatible elements, including water, from the upper
mantle source, reflecting the high solubility of water in
the melt compared to the solid fraction [53–56]. The
subcratonic mantle root is an effective barrier to ad-
vective heat transfer, and its low temperatures trap
inviscid, volatile-rich, low-melting point components
over geologic time. Thus, metasomatic processes can
cause net rehydration and re-enrichment of incompat-

J.E. Dixon et al. / Earth and Planetary Science Letters 222 (2004) 451–467 457
ible elements, consistent with LREE-enriched trace
element patterns in cratonic mantle garnets and pyrox-
enes, and the presence of small quantities of hydrous
minerals, notably phlogopite. However, evidence from
heat flow constraints [57] indicates that these metaso-
matic events do not pervade most cratonic uppermost
mantle. In South Africa, where such metasomatism is
well developed, Boyd et al. [58] note that most of the
mantle lithosphere, from the base of the crust to a depth
of 100 km or so, is relatively free of phlogopite. Typical
water concentrations in olivine from South African
garnet peridotites are near 70 ppm at 180 km depth
where melt-related metasomatism is prominent, de-
creasing to 40–50 ppm at 130 km (D.R. Bell, unpub-
lished data). Garnets within South African garnet
peridotite contain less water than coexisting olivines
[33,59,60], typically less than 50 ppm [59]. By inspec-
tion of Fig. 2, we can see that it is possible to construct a
composite profile consistent with essentially all avail-
able geochemical and GIA data: e.g., at a strain rate of
10� 16 s� 1, dry olivine to a depth of 120 km, and damp
to wet olivine below 120 km.
In summary, most of the cold continental mantle
root shallower than f 120 km is dry and strong,
and likely to remain so for long periods of geologic
time.
5.2. Western US upper mantle water contents
In contrast to cratonic areas, a variety of geo-
chemical and petrologic data indicate that most of
the uppermost mantle beneath the western US is
anomalously wet. These data can be grouped into
four classes. First, the presence of hydrous minerals
in otherwise normal mantle assemblages implies
wetter than normal conditions (typical mantle lacks
hydrous phases). A number of petrological studies
document unusually abundant hydrous phases in
Colorado Plateau mantle xenoliths, including humite
group minerals, serpentine, chlorite, and amphibole
[61–70]. Post-10 Ma basaltic lavas erupted in the
Rio Grande Rift and Basin and Range commonly
contain amphibole megacrysts derived from the
mantle [71]. Best [72,73] and Matson et al. [74]
described Holocene–Recent basanites in the Grand
Canyon area of Arizona with mantle-derived inclu-
sions containing amphibole. Bergman et al. [75]
described an amphibole-bearing peridotite nodule in
basanite from Lunar Crater volcanic field, Nevada,
which has eruptions from Late Pliocene to Holocene
in age. Righter and Carmichael [76] demonstrate that
amphiboles at Lunar Crater and other localities in the
western US are true mantle samples and cannot have
grown at a late stage in the basalt host, e.g., through
later assimilation of hydrous crust.
Second, nominally anhydrous minerals in garnet
peridotitic xenoliths in the western US are anoma-
lously wet compared to those in cratonic garnet
peridotites. For example, garnets from the mantle
beneath the Colorado Plateau have much higher
water contents than those of comparable cratonic
mantle rocks. Garnets from both peridotites and
eclogites of the Colorado Plateau commonly contain
OH concentrations about 10 times the typical values
from equivalent mantle rock types below the Sibe-
rian craton and the Kaapvaal craton of southern
Africa [77–81].
Third, young basalts (generally alkalic) derived
from western US mantle are anomalously wet,
consistent with derivation from a wet mantle source.
While this is usually difficult to observe (surface-
erupted lavas are degassed), melt inclusions trapped
in olivine phenocrysts in such lavas may retain
evidence of original magmatic water contents. Fig.
3 shows data from well-preserved melt inclusions in
Late Quaternary basalts from Yucca Mountain,
Nevada [82] clearly showing high water character-
istics, well in excess of typical MORB values. Hill
et al. [83] discuss the presence of amphibole and the
high water contents of these and related basalts,
pointing out that they require 2 to 5 wt.% water in
the original magma, implying (for 5% partial melt-
ing) a minimum of 1000 ppm water in the mantle
source. For comparison, typical MORB sources
contain f 50 (depleted) to 450 (enriched) ppm
H2O (e.g., [53]).
Fourth, other geochemical characteristics of post-
20 Ma lavas are consistent with derivation from
anomalously wet mantle. Whitlock [84] shows that
post-mid Miocene ( < 14 Ma) basalts and basaltic
andesites in northern California have chemical char-
acteristics consistent with derivation from previously
hydrated mantle wedge material which upwells into
the slab window after passage of the Mendocino
triple junction [85]. Lange et al. [86] describe 2–4
Ma mafic-intermediate lavas in the Mono Basin–

Fig. 3. Histograms showing water concentrations in MORB glasses
(quenched under pressure) compared to glass inclusions in olivine
phenocrysts (which may retain original water) from island arc
basalts, modified from Stern [109]. White horizontal rectangle in
island arc histogram (YMB) shows range of water in glass
inclusions in basalts from Yucca Mountain, Nevada [82]. Vertical
bar in white rectangle shows mean concentration for YMB (3.5%),
similar to island arc mean (3.44%).
J.E. Dixon et al. / Earth and Planetary Science Letters 222 (2004) 451–467458
Long Valley area that record high water fugacity in
the source region. Feldstein and Lange [87] docu-
ment Late Pliocene lavas throughout the Sierra
Nevada with high (>2 wt.%) pre-eruptive water
contents.
The high water contents that we infer for the
western US upper mantle suggest that dry melting
models for this region (e.g., [88]) should be re-
evaluated, for example using the new wet melting
model of Asimow et al. [89].
5.3. Why the west is wet
We suggest that Farallon plate subduction plays a
key role in explaining anomalously low viscosity in
the western US upper mantle, through its influence on
water contents [90]. In contrast to cratonic regions,
which have been stable for time scales of order 109
years, most of western North America experienced a
long (>100 million year) period of subduction in
Mesozoic and Cenozoic time, ending f 30 Ma
[91]. Subduction cools and hydrates the upper mantle
above the downgoing plate, as hydrothermally altered
oceanic crust and water-saturated sediment undergo
dehydration and metamorphism, forcing water out of
the subducting plate and into the overlying mantle
wedge (e.g., [92,93]). Studies of water concentrations
in arc and back-arc lavas (e.g., [94,95] and in
corresponding melt inclusions in phenocrysts (e.g.,
[96]) confirm that the source region for arc lavas
(f 100 km depth) is anomalously wet (f 250 to
2500 ppm H2O) compared to mantle sources for
MORB (f 50–450 ppm H2O [33,53,96–100] and
OIB (f 400 to 1000 ppm H2O [89,100–105]). Parts
of this source region almost certainly have water
contents well in excess of olivine solubility, as
evidenced by the presence of hydrous phases such
as serpentine (e.g., [105,106]).
The amount of residual water that survives the
‘‘subduction gauntlet’’ and is retained in the down-
going slab to enter the deep mantle has until recently
been quite uncertain. However, new work suggests that
such retained water is negligible, implying that large
amounts of subducted water are available to hydrate the
upper mantle. Measurements of volatile contents of
plume-generated ocean island basalts show that plumes
containing components of previously subducted litho-
sphere are relatively dry compared to other mantle
sources, indicating that water is efficiently extracted
during the subduction process [107,108]. Thus, water
in the subducted slab must be either expelled through
fluid venting in the fore-arc, expelled during island arc
magmatic processes, or sequestered in the overlying
mantle wedge. Water initially expelled at shallow
mantle levels may be entrained in the boundary zone
between the downgoing slab and the overlying mantle
due to viscous drag, and dragged to somewhat deeper
levels [109]. Seismic tomography suggests that large
volumes of mantle above long-lived subduction zones
are anomalously wet [110] perhaps down to depths of
f 400 km [111].
Geochemical data support the idea that elevated
water in western US amphibole megacrysts derives
J.E. Dixon et al. / Earth and Planetary Science Letters 222 (2004) 451–467 459
from a subduction zone setting, even though the ages
of these rocks are much younger than the end of
Farallon plate subduction (f 30 Ma). Samples not
disturbed by surface fractionation effects are rela-
tively rich in deuterium [112,113], consistent with
derivation from dehydration of a subducted slab.
Similar occurrences of hydrous phases and heavy
D/H ratios are seen in other fossil subduction
regions, such as the Eifel [114,115], and in active
subduction regions such as Japan [116].
Usui et al. [117] demonstrate that eclogite xenoliths
in Colorado Plateau magmatic bodies emplaced at 26–
35 Ma contain low temperature/high pressure miner-
als, consistent with a subduction origin, and have ages
in the range 33–81 Ma, consistent with derivation
from the subducted Farallon plate. Smith [68,69]
argued that hydration of the Colorado Plateau mantle
occurred within 20 million years prior to transport of
xenoliths in the 25–30 Ma eruptions of the Navajo
Volcanic Field. This is consistent with the idea that
mantle hydration occurred sometime during the long
period of flat slab subduction of the Farallon plate
beneath North America, f 80–30 Ma (e.g., [90,118–
120]), and occurred well inland of the coastal region.
During flat slab subduction, the zone of maximum slab
dehydration (and the corresponding zone of upper
mantle hydration above it) presumably moved inland.
Most of the original lithospheric mantle beneath the
western US probably experienced significant hydra-
tion above f 150 km depth, except where slab dip
eventually steepened, beneath the Colorado Plateau,
where deeper hydration likely occurred. Although
initially cooled by the presence of a relatively cold
slab, this hydrated lithospheric mantle began to warm
at the end of flat slab subduction, gradually attaining
its current hot, wet, low viscosity state. In effect, the
low angle Farallon slab advected water hundreds of
km northeast of the coastal region, as the hinge zone
migrated east, eventually hydrating a huge volume of
upper mantle, not just a narrow mantle wedge near the
active coastal arc.
A key question is whether western North Amer-
ica’s upper mantle could retain significant water 20–
30 million years after subduction stopped. A period of
extensive Miocene (f 10–20 Ma) magmatic activity
throughout the western US occurred shortly after the
end of flat slab subduction and is thought to represent
the replacement of cold subducted slab as hot as-
thenosphere upwelled into the slab window. Could
this activity have ‘‘cleansed’’ the upper mantle of its
high water content? The best evidence against this is
the fact that indicators of anomalously wet mantle
include products that are much younger than 10 Ma,
including Holocene lavas and young lavas hosting wet
xenoliths. Several studies have noted the large time
lags that are possible between subduction-related
hydration and later eruption of hydration-influenced
volcanics (e.g., [86,87]).
Removal of water from the mantle requires eleva-
tion of mantle temperatures above dehydration reac-
tions (f 1100 jC for amphibole, the most thermally
stable mineral) and melting to extract water bound in
nominally anhydrous minerals. If hydrous phases are
present in sufficiently large concentration, the mantle
is effectively buffered for a considerable period of
time. This suggests that thorough dehydration requires
major tectono-thermal processing and melting of the
mantle. In the absence of large-scale mantle overturn
this may take tens to hundreds of millions of years. If
this scenario is correct, most of the present-day upper
mantle beneath the western US is still significantly
wetter than the relatively dry, depleted uppermost
mantle beneath cratons, although the pulse of post-
20 Ma volcanism in the western US presumably
represents the beginning of large scale tectono-ther-
mal processing of this region, as the hydrous mantle
warms and begins to melt.
Even if convection has succeeded in mixing or
replacing some or most of the original hydrated
mantle in the western US in the last 20 million years,
replacement mantle (upwelling asthenosphere, wheth-
er typical MORB or enriched OIB mantle) is still
likely to be significantly wetter than typical litho-
spheric mantle beneath cratons (Table 4). Thus, an-
other scenario consistent with available data is that the
locations of hydrous phases and wet basalts in the
western US are not reflective of average mantle
conditions here, but rather indicate anomalously
enriched mantle pods (‘‘plum pudding’’ model). The
generally low viscosity of the region would then
reflect the influence of upwelling asthenosphere com-
bined with the lack of typical cratonic lithospheric
mantle. In this scenario, the main role of Farallon
plate subduction is to thin or remove the initially
strong, dry uppermost mantle in the western US, by
hydrating and weakening it, perhaps facilitating de-
Table 4
Water concentrations in mantle source regions
Environment Magma wt.% H2O Lherzolite wt.% H2O Olivine ppm H2Oa Olivine 103 H/106Si Sat at 120 km?
MORBb 0.1 0.012 50 0.8 no
EMORB and OIBc 0.3–1.0 0.03–0.08 125–330 2.0–5.3 no
BABBd 0.2–2.0 0.024–0.50 100–2000 1.6–32 maybe
Arce 2.0–8.0 0.25 to 1 1000–?f 1.6–?f maybe
Concentrations of water in magmas and mantle source regions from:a Values calculated as in [38] assuming a garnet pyrolite assemblage of 56% olivine, 19% opx, 10% cpx and 15% garnet and olivine–
mineral partition coefficients for water of 0.2 for olivine-opx, 0.1 for olivine-cpx, and 1 for olivine–garnet.b [54,96,97,99].c [100–102,104,107].d [94,95,137].e [138–140].f Water concentration in olivine uncertain due to probable presence of hydrous phases.
J.E. Dixon et al. / Earth and Planetary Science Letters 222 (2004) 451–467460
lamination and allowing replacement asthenosphere to
upwell essentially to the base of the crust.
5.4. Seismic tomography
Seismic tomography is achieving sufficient resolu-
tion to probe the characteristics of the upper mantle
with increasing detail. In the western US, slow seis-
mic velocity anomalies in the upper mantle have long
been recognized (e.g., [121–123]) and are often
interpreted in terms of relatively hot, dry mantle.
However, high water concentrations may also reduce
seismic velocities [124].
The presence of water potentially affects seismic
velocities in at least five ways:
1. It promotes melting by lowering the solidus
temperature of the mantle;
2. It may lead to the presence of a hydrous fluid;
3. It promotes the development of hydrous minerals
such as amphibole and phlogopite, which are
seismically slower than olivine;
4. It increases the water concentration in nominally
anhydrous minerals such as olivine, increasing
anelasticity and hence attenuation [124];
5. It changes the anisotropy of the mantle [125].
Items (1) and (2) may be relatively minor effects,
because the extremely low viscosity of melts and
hydrous fluids at high temperatures means that these
low density liquids rapidly migrate away (up) from
the source. Karato [124] suggests that on geologic
time scales, it is unlikely that melt exceeds 1% by
volume through most of the upper mantle due to this
effect, and hence would have a negligible effect on
seismic velocity. In the event of significant partial
melting, high melt concentrations will accumulate at
density discontinuities such as the crust–mantle
boundary, intrude the crust, or erupt as volcanoes.
Depending on depth resolution, such melt concentra-
tions could affect tomographic results near the crust–
mantle boundary (30–50 km), but perhaps are less
important for deeper regions.
Water in the upper mantle affects both Vs and Vp,
but we are not aware of quantitative studies that address
covariation of seismic velocity with temperature, water
content in olivine, presence of hydrous phases, and
partial melt. Goes and van der Lee [46] invert seismic
velocity data for temperature in the North American
upper mantle and compare these estimates to indepen-
dent data. They note that the Cascadia upper mantle,
expected to be water-rich due to present-day subduc-
tion, has the slowest Vs anomaly in the western US
(model NA00) and discrepant Vp versus Vs tempera-
ture estimates, with Vs-based temperature (TVs) much
higher than Vp-based temperature (TVp) in the depth
range 50–150 km (their Fig. 7). Assuming that this
discrepancy is characteristic of strongly hydrated man-
tle (for any or all of the five reasons listed above) we
can investigate hydration effects in the tomographic
results for other regions. TVs and TVp estimated byGoes
and van der Lee [46] for most parts of the eastern US
agree quite well, consistent with our hypothesis of a
relatively dry cratonic upper mantle. However, much of
the western US exhibits TVp versus TVs discrepancies in
the depth range 50–110 km, in the sense expected for
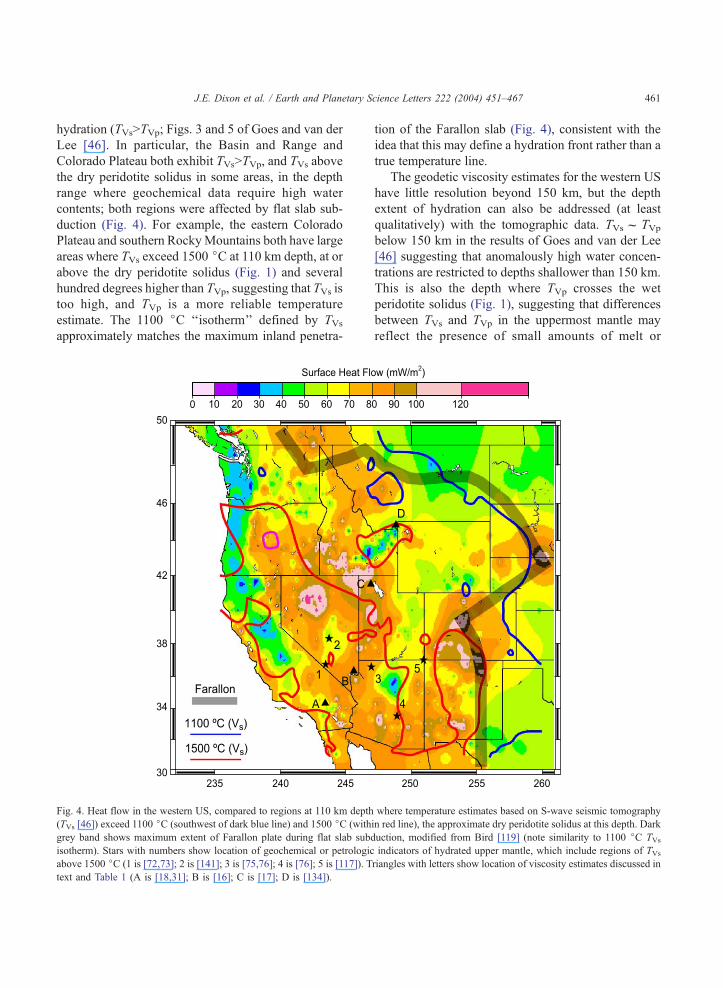
J.E. Dixon et al. / Earth and Planetary Science Letters 222 (2004) 451–467 461
hydration (TVs>TVp; Figs. 3 and 5 of Goes and van der
Lee [46]. In particular, the Basin and Range and
Colorado Plateau both exhibit TVs>TVp, and TVs above
the dry peridotite solidus in some areas, in the depth
range where geochemical data require high water
contents; both regions were affected by flat slab sub-
duction (Fig. 4). For example, the eastern Colorado
Plateau and southern RockyMountains both have large
areas where TVs exceed 1500 jC at 110 km depth, at or
above the dry peridotite solidus (Fig. 1) and several
hundred degrees higher than TVp, suggesting that TVs is
too high, and TVp is a more reliable temperature
estimate. The 1100 jC ‘‘isotherm’’ defined by TVsapproximately matches the maximum inland penetra-
Fig. 4. Heat flow in the western US, compared to regions at 110 km depth
(TVs [46]) exceed 1100 jC (southwest of dark blue line) and 1500 jC (with
grey band shows maximum extent of Farallon plate during flat slab subd
isotherm). Stars with numbers show location of geochemical or petrologic
above 1500 jC (1 is [72,73]; 2 is [141]; 3 is [75,76]; 4 is [76]; 5 is [117]). T
text and Table 1 (A is [18,31]; B is [16]; C is [17]; D is [134]).
tion of the Farallon slab (Fig. 4), consistent with the
idea that this may define a hydration front rather than a
true temperature line.
The geodetic viscosity estimates for the western US
have little resolution beyond 150 km, but the depth
extent of hydration can also be addressed (at least
qualitatively) with the tomographic data. TVsf TVpbelow 150 km in the results of Goes and van der Lee
[46] suggesting that anomalously high water concen-
trations are restricted to depths shallower than 150 km.
This is also the depth where TVp crosses the wet
peridotite solidus (Fig. 1), suggesting that differences
between TVs and TVp in the uppermost mantle may
reflect the presence of small amounts of melt or
where temperature estimates based on S-wave seismic tomography
in red line), the approximate dry peridotite solidus at this depth. Dark
uction, modified from Bird [119] (note similarity to 1100 jC TVsindicators of hydrated upper mantle, which include regions of TVs
riangles with letters show location of viscosity estimates discussed in

J.E. Dixon et al. / Earth and Planetary Science Letters 222 (2004) 451–467462
hydrous fluid. However, assessing the influence of
such fluids on overall viscosity and the passage of
seismic waves is not straightforward. For example,
small amounts of melt could increase seismic attenua-
tion and decrease effective viscosity, for example by
enhancing grain boundary sliding. On the other hand,
water is partitioned strongly into melt, hence water
concentration in olivine would decrease, raising its
effective viscosity.
In summary, upper mantle viscosity estimates in the
western US (f 1018 Pa s) are characteristic of hot, wet
mantle, and are lower than the viscosity of cool, wet
upper mantle in modern subduction zones (f 1019 Pa
s), for example observed in the modern Cascadia arc on
the basis of relative sea level data [126]. Both values are
lower than typical cratonic values, with cool, damp to
wet asthenosphere at low strain rates (1020–1021 Pa s)
deeper than about 120 km depth, or cool, dry litho-
sphere at shallower levels, with much higher or essen-
tially infinite viscosity.
5.5. Plate dynamics, the Wilson cycle, long-lived plate
boundary zones and strength of the upper mantle
Subduction of cold oceanic lithosphere cools the
surrounding mantle, raising viscosity and increasing
drag on the down-going plate. However, water
released by the downgoing slab counteracts this
effect, weakening the surrounding mantle and mak-
ing it easier to sustain subduction [127]. Long-lived
subduction margins will accumulate large amounts of
water in the upper mantle, and may therefore stay
weak for tens and possibly hundreds of millions of
years after subduction stops. Future plate boundaries
will therefore tend to occur in the same place,
exploiting the previously weakened region, perhaps
explaining the tendency for repeated opening and
closing of ocean basins along the same plate bound-
ary zone (Wilson cycle).
The western US has long been recognized as a
unique tectonic environment, with diffuse deformation
andmagmatism occurring many hundreds of km inland
from the main plate boundary, the San Andreas fault.
The diffuse nature of present-day deformation here
may reflect the presence of anomalously weak upper
mantle over a broad region, in turn reflecting the history
of flat slab subduction and consequent hydration of
large volumes of upper mantle as far inland as the
Colorado Plateau. With passage of the Farallon plate,
the newly hydrated, cool upper mantle was exposed to
warmer mantle below the slab [90]. As the hydrated
material warmed, it attained anomalously low vis-
cosity, becoming highly mobile, capable of rapid,
small scale convection, promoting magmatic activity
[85,128].
Maggi et al. [22] used earthquake focal depths to
suggest that the upper mantle beneath continents in
general has relatively little strength, which they
suggest reflects the presence of water. We have
emphasized the importance of lateral heterogeneity
in mantle properties and hence would put a more
nuanced interpretation on their observations. The
earthquakes used by Maggi et al. [22] invariably
occur in or near active tectonic regions (plate bound-
ary zones), marginal to cratonic areas. Most of these
regions were also subject to past subduction-related
hydration (e.g., Zagros, Aegean), as in our western
US example. We suggest that these regions are weak,
not because they are typical continental regions, but
because they are atypical, with a history of subduc-
tion at or near the margins of larger cratonic areas. In
our model, interior cratonic regions retain a strong
(cold, dry) lithospheric upper mantle, and generally
remain immune to tectonic disruption, even in the
presence of multiple Wilson cycles.
Acknowledgements
We thank Bob Stern and Saskia Goes for providing
data and digital versions of several figures, and Britt
Hill, David Kohlstedt, Sash Majumder, Ted Scott and
Francis Albarede for discussion and comments.
Reviews by Fred Pollitz, Gene Humphreys and Greg
Hirth greatly improved the paper. This work was
supported by grants from NSF, NASA and ONR. [SK]
References
[1] C.F. Yoder, J.G. Williams, J.O. Dickey, B.E. Schutz, R.J.
Eanes, B.D. Tapley, Secular variation of the Earth’s grav-
itational harmonic J2 coefficient from LAGEOS and non-
tidal acceleration of Earth rotation, Nature 303 (1983)
757–762.
[2] E.R. Stephenson, L.V. Morrison, Long term fluctuations in
the Earth’s rotation: 700 B.C. to A.D. 1990, Philos. Trans. R.
J.E. Dixon et al. / Earth and Planetary Science Letters 222 (2004) 451–467 463
Soc. Lond., Ser. A 351 (1995) 165–202, Trans. R. Soc.
London, Ser. A 334 (1978) 110–125.
[3] R. Sabadini, D.A. Yuen, E. Boschi, Polar wander and the
forced responses of a rotating, multilayered, viscoelastic
planet, J. Geophys. Res. 87 (1982) 2885–2903.
[4] W.E. Carter, D.S. Robertson, T.E. Pyle, J. Diamante, The
application of geodetic radio interferometric surveying to
the monitoring of sea level, Geophys. J. R. Astron. Soc. 87
(1986) 3–13.
[5] G. Spada, Y. Ricard, R. Sabadini, True polar wander for a
dynamic Earth, Nature 360 (1992) 452–454.
[6] L.M. Cathles, The Viscosity of the Earth’s Mantle, Princeton
Univ. Press, Princeton, NJ, 1975.
[7] W.R. Peltier, W.E. Farrell, J.A. Clark, Glacial isostasy and
relative sea level: a global finite element model, Tectonophy-
sics 50 (1978) 81–110.
[8] A.M. Tushingham, W.R. Peltier, Validation of the ICE-3G
model of Wurm-Wisconsin deglaciation using a global data
base of relative sea level histories, J. Geophys. Res. 97
(1992) 3285–3304.
[9] D.F. Argus, Postglacial rebound from VLBI geodesy: on
establishing vertical reference, Geophys. Res. Lett. 23 (1996)
973–976.
[10] G.A. Milne, J.L. Davis, J.X. Mitrovica, H.-G. Scherneck,
J.M. Johansson, M. Vermeer, H. Koivula, Space-geodetic
constraints on glacial isostatic adjustment in Fennoscandia,
Science 291 (2001) 2381–2385.
[11] K.D. Park, R.S. Nerem, J.L. Davis, M.S. Schenewerk, G.A.
Milne, J.X. Mitrovica, Investigation of glacial isostatic ad-
justment in the northeast US using GPS measurements, Geo-
phys. Res. Lett. 29 (2002) (10.1029/2001GLO13782).
[12] W.R. Peltier, Post-glacial variations in the level of the sea:
implications for climate dynamics and solid earth geophysics,
Rev. Geophys. 36 (1998) 603–689.
[13] K. Lambeck, P. Johnston, The viscosity of the mantle:
evidence from analyses of glacial rebound phenomenon,
in: I. Jackson (Ed.), The Earth’s Mantle: Composition,
Structure and Evolution, Cambridge Univ. Press, Cam-
bridge, UK, 1998, pp. 461–525.
[14] G. Kaufmann, K. Lambeck, Glacial isostatic adjustment and
the radial viscosity profile from inverse modeling, J. Geo-
phys. Res. 107 (2002) 2280(10.1029/2001JB000941).
[15] W.P. Peltier, Global glacial isostatic adjustment and modern
instrumental records of relative sea level history, Sea level
rise; history and consequences, Int. Geophys. Ser. 75 (2001)
65–95.
[16] G. Kaufmann, F. Amelung, Reservoir-induced deformation
and continental rheology in vicinity of Lake Mead, Nevada,
J. Geophys. Res. 105 (2000) 16341–16358.
[17] B.G. Bills, D.R. Currey, G.A. Marshall, Viscosity estimates
for the crust and upper mantle from patterns of lacustrine
shoreline deformation in the eastern Great Basin, J. Geophys.
Res. 99 (1994) 22059–22096.
[18] F.F. Pollitz, G. Peltzer, R. Burgmann, Mobility of continental
mantle; evidence from postseismic geodetic observations fol-
lowing the 1992 Landers earthquake, J. Geophys. Res. 105
(2000) 8035–8054.
[19] G. Zandt, S.C. Myers, T.C. Wallace, Crust and mantle struc-
ture across the Basin and Range–Colorado Plateau boundary
at 37jN latitude and implications for Cenozoic extensional
mechanism, J. Geophys. Res. 100 (1995) 10529–10548.
[20] L.A. Lastowka, A.F. Sheehan, J.M. Schneider, Seismic evi-
dence for partial lithospheric delamination model of Colorado
Plateau uplift, Geophys. Res. Lett. 28 (2001) 1319–1322.
[21] A.R. Lowry, N.M. Ribe, R.B. Smith, Dynamic elevation of
the Cordillera, western United States, J. Geophys. Res. 105
(2000) 23371–23940.
[22] A. Maggi, J.A. Jackson, D. McKenzie, K. Priestly, Earth-
quake focal depths, effective elastic thickness, and the
strength of the continental lithosphere, Geology 28 (2000)
495–498.
[23] A. Nicolas, N.I. Christensen, Formation of anisotropy in
upper mantle peridotites: a review, in: K. Fuchs, C. Froide-
vaux (Eds.), Composition, Structure and Dynamics of the
Lithosphere–Asthenosphere System, AGU Geodyn. Ser.,
vol. 16, 1987 pp. 111–124.
[24] S. Karato, On the Lehman discontinuity, Geophys. Res. Lett.
19 (1992) 2255–2258.
[25] S. Karato, P. Wu, Rheology of the upper mantle: a synthesis,
Science 260 (1993) 771–778.
[26] C.E. Nishamura, D.W. Forsyth, The anisotropic structure of
the upper mantle in the Pacific, Geophys. J. 96 (1989)
203–229.
[27] J.B. Gaherty, T.H. Jordan, Lehman discontinuity as the base
of an anistropic layer beneath continents, Science 268 (1995)
1468–1471.
[28] T.-T. Yu, J.B. Rundle, J. Fernandez, Surface deformation due
to a strike–slip fault in elastic gravitational layer overlying a
viscoelastic gravitational half-space, J. Geophys. Res. 101
(1996) 3199–3214.
[29] F.F. Pollitz, C. Wicks, W. Thatcher, Mantle flow beneath a
continental strike–slip fault: Postseismic deformation after
the 1999 Hector Mine earthquake, Science 293 (2001)
1814–1818.
[30] E.R. Ivins, Transient creep of a composite lower crust: 2. A
polymineralic basis for rapidly evolving post-seismic defor-
mation modes, J. Geophys. Res. 101 (1996) 28005–28028.
[31] F.F. Pollitz, Transient rheology of the uppermost mantle be-
neath the Mojave Desert, California, Earth Planet. Sci. Lett.
215 (2003) 89–104.
[32] J.R. Smyth, D.R. Bell, G.R. Rossman, Incorporation of hy-
droxyl in upper-mantle clinopyroxenes, Nature 351 (1991)
732–735.
[33] D.R. Bell, G.R. Rossman, Water in the earth’s mantle: the
role of nominally anhydrous minerals, Science 255 (1992)
1391–1397.
[34] P.N. Chopra, M.S. Paterson, The role of water in the defor-
mation of olivine, J. Geophys. Res. 89 (1984) 7861–7876.
[35] S.J. Mackwell, D.L. Kohlstedt, M.S. Paterson, The role of
water in the deformation of olivine single crystals, J. Geo-
phys. Res. 90 (1985) 11319–11333.
[36] S. Karato, M.S. Paterson, J.D. Fitzgerald, Rheology of syn-
thetic olivine aggregates; influence of grain size and water,
J. Geophys. Res. 91 (1986) 8151–8176.

J.E. Dixon et al. / Earth and Planetary Science Letters 222 (2004) 451–467464
[37] D.L. Kohlstedt, B. Evans, S.J. Mackwell, Strength of the
lithosphere: constraints imposed by laboratory experiments,
J. Geophys. Res. 100 (1995) 17587–17602.
[38] G. Hirth, D.L. Kohlstedt, Water in the oceanic upper man-
tle: implications for rheology, melt extraction and the evo-
lution of the lithosphere, Earth Planet. Sci. Lett. 144 (1996)
93–108.
[39] S. Mei, D.L. Kohlstedt, Influence of water on plastic defor-
mation of olivine aggregates 2: dislocation creep regime,
J. Geophys. Res. 105 (2000) 21471–21481.
[40] G. Hirth, D.L. Kohlstedt, Rheology of the upper mantle and
the mantle wedge: a view from the experimentalists, in: J.
Eiler (Ed.), Inside the Subduction Factory, Am. Geophys.
Union, Geophys. Monogr. Ser. 118 (2004) 83–106.
[41] D.L. Turcotte, G. Schubert, Geodynamics: Applications of
Continuum Physics to Geological Problems, Wiley, New
York, 1982, 450 pp.
[42] J.H. Sass, A.H. Lachenbruch, S.P. Galanis, P. Morgan, S.S.
Priest, T.H. Moses, R.J. Munroe, Thermal regime of the
southern Basin and Range province: 1. heat flow data from
Arizona and the Mojave Desert of California and Nevada,
J. Geophys. Res. 99 (1994) 22093–22119.
[43] G. Ranalli, Rheology of the Earth, 2nd ed., Chapman & Hall,
London, 1995, 413 pp.
[44] D.H. Green, T.J. Falloon, Pyrolite: a Ringwood concept and
its current expression, in: I. Jackson (Ed.), The Earth’s
Mantle: Composition, Structure and Evolution, Cambridge
Univ. Press, Cambridge, UK, 1998, pp. 311–378.
[45] I.M. Artemieva, W.D. Mooney, Thermal thickness and evo-
lution of Precambrian lithosphere: a global study, J. Geo-
phys. Res. 106 (2001) 16387–16414.
[46] S. Goes, S. van der Lee, Thermal structure of the North
American uppermost mantle inferred from seismic tomogra-
phy, J. Geophys. Res. 107 (B3) (10.129, /2000JB000049).
[47] Q. Bai, D.L. Kohlsted, Substantial hydrogen solubility in
olivine and implications for water storage in the mantle,
Nature 357 (1992) 672–674.
[48] Q. Bai, D.L. Kohlstedt, Effects of chemical environment on
the solubility and incorporation mechanism for hydrogen in
olivine, Phys. Chem. Miner. 19 (1993) 460–471.
[49] D.L. Kohlstedt, H. Keppler, D.C. Rubie, Solubility of water
in the a, b, and g phases of (Mg,Fe)2SiO4, Contrib. Mineral.
Petrol. 123 (1996) 345–357.
[50] D.R. Bell, G.R. Rossman, J. Maldener, D. Endisch, F. Rauch,
Hydroxide in olivine: a quantitative determination of the
absolute amount and calibration of the IR spectrum, J. Geo-
phys. Res. 108 (2003) doi:10.1029/2001JB000679.
[51] F.R. Boyd, S.A. Mertzman, Composition and structure of the
Kaapvaal lithosphere, in: B.O. Mysen (Ed.), Magmatic Pro-
cesses: Physicochemical Principles, Spec. Publ. - Geochem.
Soc., 1987, pp. 13–24.
[52] F.R. Boyd, Compositional distinction between oceanic and
cratonic lithosphere, Earth Planet. Sci. Lett. 96 (1989)
15–26.
[53] J.E. Dixon, E. Stolper, J.R. Delaney, Infrared spectroscopic
measurements of CO2 and H2O in Juan de Fuca Ridge ba-
saltic glasses, Earth Planet. Sci. Lett. 90 (1988) 87–104.
[54] P. Michael, Regionally distinctive sources of depleted
MORB: evidence from trace elements and H2O, Earth
Planet. Sci. Lett. 131 (1995) 310–320.
[55] L.V. Danyushevsky, S.M. Eggins, T.J. Falloon, D.M. Chris-
tie, H2O abundance in depleted to moderately enriched mid-
ocean ridge magma, Pt. 1: incompatible behaviour, implica-
tions for mantle storage, and origins of regional variations,
J. Petrol. 41 (2000) 1329–1364.
[56] C. Aubaud, E.H. Hauri, M.M. Hirschmann, Water partition
coefficients between nominally anhydrous minerals and ba-
saltic melts, Goldschmidt Geochemistry Conf., Abstract,
vol. 559, 2004, Copenhagen.
[57] R.L. Rudnick, W.F. McDonough, R.J. O’Connell, Thermal
structure, thickness and composition of continental litho-
sphere, Chem. Geol. 145 (1998) 395–411.
[58] F.R. Boyd, D.G. Pearson, S.A. Mertzman, Spinel facies
peridotites from the Kaapvaal root, in: J.J. Gurney, et al.
(Ed.), The J.B. Dawson Volume. Proc. 7th Int. Kimberlite
Conference, vol. 1, Red Roof Design, Cape Town, 1999,
pp. 40–48.
[59] D.R. Bell, G.R. Rossman, The distribution of hydroxyl in
garnets from the subcontinental mantle of southern Africa,
Contrib. Mineral. Petrol. 111 (1992) 161–178.
[60] D.R. Bell, G.R. Rossman, R.O. Moore, Abundance and
partitioning of OH in a high-pressure magmatic system:
megacrysts from the Monastery kimberlite, South Africa,
J. Petrol., (2004) (in press).
[61] T.R. McGetchin, L.T. Silver, A.A. Chodos, Titanoclinohu-
mite: a possible mineralogical site for water in the upper
mantle, J. Geophys. Res. 75 (1970) 255–259.
[62] H.H. Helmstaedt, R. Doig, Eclogite nodules from kimberlite
pipes of the Colorado Plateau—samples of subducted Fran-
ciscan-type oceanic lithosphere, Phys. Chem. Earth 9 (1975)
95–111.
[63] K. Aoki, K. Fujino, M. Akaogi, Titanochondrodite and tita-
noclinohumite derived from the upper mantle in the Buell
Park kimberlite, Arizona, USA, Contrib. Mineral. Petrol. 56
(1976) 243–253.
[64] D. Smith, S. Levy, Petrology of the Green Knobs diatreme
and implications for the upper mantle beneath the Colorado
Plateau, Earth Planet. Sci. Lett. 29 (1976) 107–125.
[65] H.H. Helmstaedt, D.J. Schulze, Garnet clinopyroxenite –
chlorite ecoplite transition in a xenolith from Moses Rock:
further evidence for metamorphosed ophiolites under the
Colorado Plateau, in: F.R. Boyd, H.O.A. Meyer (Eds.),
The Mantle Sample: Inclusions in Kimberlites and Other
Volcanics, AGU, Washington, 1979, pp. 357–365.
[66] H.H. Helmstaedt, D.J. Schulze, Eclogite-facies ultramafic
xenoliths from Colorado Plateau diatreme breccias: compar-
ison with eclogites in crustal environments, evaluation of the
subduction hypothesis, and implications for eclogite xeno-
liths from diamondiferous kimberlites, in: D.C. Smith (Ed.),
Eclogites and Eclogite Facies Rocks, Elsevier, New York,
1988, pp. 387–450.
[67] D. Smith, Hydrous minerals and carbonates in peridotite
inclusions from the Green Knobs and Buell Park kimber-
litic diatremes on the Colorado Plateau, in: F.R. Boyd,

J.E. Dixon et al. / Earth and Planetary Science Letters 222 (2004) 451–467 465
H.O.A. Meyer (Eds.), The Mantle Sample. Inclusions in
Kimberlites and Other Volcanics, AGU, Washington, DC,
1979, pp. 345–356.
[68] D. Smith, Chlorite-rich ultramafic reaction zones in Colorado
Plateau xenoliths: recorders of sub-Moho hydration, Contrib.
Mineral. Petrol. 121 (1995) 185–200.
[69] D. Smith, Insights into the evolution of the uppermost con-
tinental mantle from xenolith localities on and near the Col-
orado Plateau and regional comparisons, J. Geophys. Res.
105 (2000) 16769–16781.
[70] W.C. Hunter, D. Smith, Garnet peridotite form the Colorado
Plateau ultramafic diatremes: hydrates, carbonates, and com-
parative geothemometry, Contrib. Mineral. Petrol. 76 (1981)
312–330.
[71] H.G. Wilshire, C.E. Meyer, J.K. Nakata, L.C. Calk, J.W.
Shervais, J.E. Nielson, E.C. Schwarzman, Mafic and ul-
tramafic xenoliths from volcanic rocks of the Western
United States, U. S. Geol. Surv. Prof. Pap. 1443 (1988)
(179 pp.).
[72] M.G. Best, Mantle-derived amphibole within inclusions in
alkali-basaltic lavas, J. Geophys. Res. 79 (1974) 2107–2113.
[73] M.G. Best, Amphibole-bearing cumulate inclusions Grand
Canyon, Arizona and their bearing on silica-undersaturated
hydrous magmas in the upper mantle, J. Petrol. 16 (1975)
212–236.
[74] D.W. Matson, D.W. Muenow, M.O. Garcia, Volatiles in
amphiboles from xenoliths, Vulcan’s Throne, Grand Canyon,
Arizona, USA, Geochim. Cosmochim. Acta 48 (1984)
1629–1636.
[75] S.C. Bergman, K.A. Foland, F.J. Spera, On the origin of an
amphibole-rich vein in a peridotite inclusion from the Lunar
Crater Volcanic Field, Nevada, USA, Earth Planet. Sci. Lett.
56 (1981) 343–361.
[76] K. Righter, I.S.E. Carmichael, Mega-xenocrysts in alkali
olivine basalts: fragments of disrupted mantle assemblages,
Am. Mineral. 78 (1993) 1230–1245.
[77] R.D. Aines, G.R. Rossman, Water content of mantle garnets,
Geology 12 (1984) 720–723.
[78] D.R. Bell, G.R. Rossman, The OH content of ‘‘anhydrous’’
minerals in mantle eclogites, Eos, Trans. Am. Geophys.
Union 71 (1990) 523.
[79] D.R. Bell. Hydroxyl in mantle minerals, PhD thesis, Califor-
nia Institute of Technology, 1993, 385 pp.
[80] G.A. Snyder, L.A. Taylor, E.A. Jerde, R.N. Clayton, T.K.
Mayeda, P. Deines, G.R. Rossman, N.V. Sobolev, Archean
mantle heterogeneity and the origin of diamondiferous
eclogites, Siberia: evidence from stable isotopes and hy-
droxyl in garnet, Am. Mineral. 80 (1995) 799–809.
[81] S.S. Matsyuk, K. Langer, A. Hosch, Hydroxyl defects in
garnets from mantle xenoliths of the Siberian platform, Con-
trib. Mineral. Petrol. 132 (1998) 163–179.
[82] J.F. Luhr, T.B. Housh, Melt volatile contents in basalts from
Lathrop Wells and Red Cone, Yucca Mountain region, SW
Nevada: insights from glass inclusions, EOS: Trans. Am.
Geophys. Union 83 (2002) 47 (Fall Mtg Supp.).
[83] B.E. Hill, S.J. Lynton, J.F. Luhr, Amphibole in quaternary
basalts of the Yucca mountain region: significance to volca-
nism models, Proc. 6th Ann. Int. Conf. High Level Radio-
active Waste Management, Las Vegas, Nevada, American
Nuclear Society, LaGrange, IL, 1995, pp. 132–134.
[84] J.S. Whitlock, Evidence of a mantle wedge source for slab
window volcanism in the northern California Coast Ranges,
MSc thesis, Pennsylvania State University, 2002.
[85] M. Liu, K. Furlong, Cenozoic volcanism in California coast
ranges: numerical solutions, J. Geophys. Res. 97 (1992)
4941–4951.
[86] R.A. Lange, I.S.E. Carmichael, P.R. Renne, Potassic volca-
nism near Mono basin, California: evidence for high water
and oxygen fugacities inherited from subduction, Geology
21 (1993) 949–952.
[87] S.N. Feldstein, R.A. Lange, Pliocene Potassic magmas from
the Kings River region, Sierra Nevada, California: evidence
for melting of a subduction-modified mantle, J. Petrol. 40
(1999) 1301–1320.
[88] K. Wang, T. Plank, J.D. Walker, E.I. Smith, A mantle melting
profile across the Basin and Range, SW USA, J. Geophys.
Res. 107 (2002) (10.1029/2001JB000209).
[89] P.D. Asimow, J.E. Dixon, C.H. Langmuir, A hydrous
melting and fractionation model for mid-ocean ridge
basalts: Application to the Mid-Atlantic Ridge near the
Azores, Geochemistry, Geophysics, Geosystems (2004)
doi:10.1029/2003GC000568.
[90] E. Humphreys, E. Hessler, K. Dueker, G. Lang Farmer, E.
Erslev, T. Atwater, How Laramide-age hydration of North
American Lithosphere by the Farallon slab controlled sub-
sequent activity in the western US, Int. Geol. Rev. 45
(2003) 575–595.
[91] T. Atwater, Plate tectonic history of the northeast Pacific
and western North America, Geology of North America,
vol. N: Eastern Pacific Ocean and Hawaii, in: E.L. Win-
terer, D.M. Hussong, R.W. Decker (Eds.), Geol. Soc. Am.
Boulder, CO, 1989, pp. 21–72, .
[92] H. Staudigel, S.D. King, Ultrafast subduction: the key to
slab recycling efficiency and mantle differentiation? Earth
Planet. Sci. Lett. 109 (1992) 517–530.
[93] S. Peacock, Large-scale hydration of the lithosphere above
subducting slabs, Chem. Geol. 108 (1993) 49–59.
[94] L.V. Danyushevsky, T.J. Falloon, A.V. Sobolev, A.J. Craw-
ford, M. Carroll, R.C. Price, The H2O content of basalt
glasses from southwest Pacific back-arc basins, Earth Planet.
Sci. Lett. 117 (1993) 347–362.
[95] E. Stolper, S. Newman, The role of water in the petrogenesis
of Mariana trough magmas, Earth Planet. Sci. Lett. 121
(1993) 293–325.
[96] A.V. Sobolev, M. Chaussidon, H2O concentrations in prima-
ry melts from supra-subduction zones and mid-ocean ridges:
implication for H2O storage and recycling in the mantle,
Earth Planet. Sci. Lett. 137 (1996) 45–55.
[97] P. Michael, The concentration, behavior and storage of H2O
in the suboceanic upper mantle: implications for mantle
metasomatism, Geochim. Cosmochim. Acta 52 (1988)
555–566.
[98] D. Lizarralde, A. Chave, G. Hirth, A. Schultz, Northeastern
Pacific mantle conductivity profile from long-period magne-
J.E. Dixon et al. / Earth and Planetary Science Letters 222 (2004) 451–467466
totelluric soundings using Hawaii-to-California submarine
cable data, J. Geophys. Res. 100 (1995) 17837–17854.
[99] A. Saal, E.H. Hauri, C.H. Langmuir, M. Perfit, Vapor under-
saturation in primitive mid-ocean ridge basalt and the vola-
tile content of the Earth’s upper mantle, Nature 419 (2002)
451–455.
[100] K. Simons, J.E. Dixon, J.-G. Schilling, R. Kingsley, R.
Poreda, Volatiles in basaltic glasses from the Easter–Salas y
Gomez Seamount Chain and Easter Microplate: implications
for geochemical cycling of volatile elements, Geochem.
Geophys. Geosystems (2002) doi:10.1029/2001GC000173.
[101] J.E. Dixon, D.A. Clague, P. Wallace, R. Poreda, Volatiles in
alkalic basalts from the North Arch Volcanic Field, Hawaii:
Extensive degassing of deep submarine-erupted alkalic series
lavas, J. Petrol. 38 (1997) 911–939.
[102] P.J. Wallace, Water and partial melting in mantle plumes:
Inferences from the dissolved H2O concentrations of Ha-
waiian basaltic magmas, Geophys. Res. Lett. 25 (1998)
3639–3642.
[103] H. Bureau, N. Metrich, M.P. Semet, T. Staudacher, Fluid–
magma decoupling in a hot-spot volcano, Geophys. Res.
Lett. 26 (1999) 3501–3504.
[104] A.R.L. Nichols, M.R. Carroll, A. Hoskuldsson, Is the Iceland
hot spot also wet? Evidence from the water contents of unde-
gassed submarine and subglacial pillow basalts, Earth Planet.
Sci. Lett. 202 (1999) 77–87.
[105] M.G. Bostock, R.D. Hyndman, S. Rondenay, S.M. Peacock,
An inverted continental Moho and serpentinization of the
forearc mantle, Nature 417 (2002) 536–538.
[106] T.M. Brocher, T. Parsons, A.M. Trehu, C.M. Snelson, M.A.
Fisher, Seismic evidence for widespread serpentinized fore-
arc upper mantle along the Cascadia margin, Geology 31
(2003) 267–270.
[107] J.E. Dixon, D.A. Clague, Volatiles in basaltic glasses from
Loihi Seamount, Hawaii: evidence for a relatively dry plume
component, J. Petrol. 42 (2001) 627–634.
[108] J.E. Dixon, L. Leist, C. Langmuir, J.G. Schilling, Recycled
dehydrated lithosphere observed in plume-influenced mid-
ocean-ridge basalt, Nature 420 (2002) 385–389.
[109] R.J. Stern, Subduction zones, Rev. Geophys. 40 (4) (2002)
1012 (10.1029/2001RG000108).
[110] G. Nolet, A. Zielhuis, Low S velocities under the Torn-
quist –Teisseyre zone: evidence for water injection into
the transition zone by subduction, J. Geophys. Res. 99
(1994) 15813–15820.
[111] M. Van der Meijde, F. Marone, D. Giardini, S. van der Lee,
Seismic evidence for water deep in Earth’s upper mantle,
Science 300 (2003) 1556–1558.
[112] A.L. Boettcher, J.R. O’Neil, Stable isotope, chemical, and
petrographic studies of high-pressure amphiboles and
micas: evidence for metasomatism in the mantle source
regions of alkali basalts and kimberlites, Am. J. Sci.
280A (1980) 594–621.
[113] D.R. Bell, T.C. Hoering, H2O contents and D/H ratios of
mantle amphiboles, Carnegie Inst. Wash. Yearbook 93
(1994) 89–90.
[114] G. Worner, R.S. Harmon, J. Hoefs, Stable isotope relations in
an open magma system, Laacher See, Eifel (FRG), Contrib.
Mineral. Petrol. 95 (1987) 343–349.
[115] P.D. Kempton, R.S. Harmon, H.-G. Stosch, J. Hoefs, C.J.
Hawkesworth, Open-system O-isotope behaviour and trace
element enrichment in the sub-Eifel mantle, Earth. Planet.
Sci. Lett. 89 (1988) 273–287.
[116] Y. Kuroda, T. Suzuoki, S. Matsuo, Hydrogen isotope com-
position of deep seated water, Contrib. Mineral. Petrol. 60
(1977) 311–315.
[117] T. Usui, E. Nakamura, K. Kobayashi, S. Maruyama, H.
Helmstaedt, Fate of the subducted Farallon plate inferred
from eclogite xenoliths in the Colorado Plateau, Geology
31 (2003) 589–592.
[118] W.R. Dickinson, W.S. Snyder, Geometry of subducted slabs
related to SanAndreas transform, J. Geol. 87 (1979) 609–627.
[119] P. Bird, Laramide crustal thickening event in the Rocky
Mountain foreland and Great Plains, Tectonics 3 (1984)
741–758.
[120] J. Severinghaus, T. Atwater, Cenozoic geometry and thermal
state of the subducting slabs beneath western North America,
in: B. Wernicke (Ed.), Basin and Range Extension, Geol.
Soc. Am., Mem., vol. 176, 1990 pp. 1–22.
[121] S.P. Grand, Mantle shear structure beneath the Americas and
surrounding oceans, J. Geophys. Res. (1994) 11591–11621.
[122] E. Humphreys, K. Dueker, Western US upper mantle struc-
ture, J. Geophys. Res. 99 (1994) 9615–9634.
[123] S. van der Lee, G. Nolet, Seismic image of the subducted
trailing fragments of the Farallon plate, Nature 386 (1997)
266–269.
[124] S. Karato, Mapping water content in the upper mantle, in: J.
Eiler (Ed.), Inside the Subduction Factory, Am. Geophys.
Union, Geophys. Monograph Ser. 118 (2004) 135–152.
[125] T. Mizukami, S.R. Wallis, J. Yamamoto, Natural example of
olivine lattice preferred orientation patterns with a flow-nor-
mal a-axis maximum, Nature 427 (2004) 432–436.
[126] T.S. James, J.J. Clague, K. Wang, I. Hutchinson, Post-glacial
rebound at the northern Cascadia subduction zone, Quat. Sci.
Rev. 19 (2000) 1527–1541.
[127] M.I. Billen, M. Gurnis, A low viscosity wedge in subduction
zones, Earth Planet. Sci. Lett. 193 (2001) 227–236.
[128] K. Furlong, Thermal – rheological evolution of the upper
mantle and the development of the San Andreas fault system,
Tectonophys 223 (1993) 149–164.
[129] K. Lambeck, P. Johnston, C. Smither, M. Nakada, Glacial
rebound of the British Isles: III. Constraints on mantle vis-
cosity, Geophys. J. Int. 125 (1996) 340–354.
[130] K. Lambeck, C. Smither, P. Johnston, Sea level change, gla-
cial rebound and mantle viscosity for northern Europe, Geo-
phys. J. Int. 134 (1998) 102–144.
[131] A.M. Forte, J.X. Mitrovica, New inferences of mantle vis-
cosity from joint inversion of long wavelength mantle con-
vection and post-glacial rebound data, Geophys. Res. Lett.
23 (1996) 1147–1150.
[132] G. Kaufmann, K. Lambeck, Mantle dynamics, postglacial
rebound and the radial viscosity profile, Phys. Earth Planet.
Inter. 121 (2000) 303–327.
[133] M. Simons, B. Hager, Localization of the gravity field
J.E. Dixon et al. / Earth and Planetary Science Letters 222 (2004) 451–467 467
and the signature of glacial rebound, Nature 390 (1997)
500–504.
[134] T. Nishimura, W. Thatcher, Rheology of the lithosphere
inferred from post-seismic uplift following the 1959 Heb-
gen Lake earthquake, J. Geophys. Res. 108 (2003) 2389
(10.1029/2002JB002191).
[135] J.X. Mitrovica, A.M. Forte, Radial profile of mantle viscosi-
ty: results from the joint inversion of convection and post-
glacial rebound observables, J. Geophys. Res. 102 (1997)
2751–2769.
[136] K.S. Pitzer, S.M. Sterner, Equations of state valid contin-
uosly from zero to extreme pressures for H2O and CO2,
J. Chem. Phys. 101 (1994) 3111–3116.
[137] A.G. Hochstaedter, J.B. Gill, M. Kusakabe, S. Newman,
M.S. Pringle, B. Taylor, P. Fryer, Volcanism in the Sumisu
rift: I. Major element, volatile, and stable isotope geochem-
istry, the Mariana Trough; special section, Earth Planet. Sci.
Lett. 100 (1990) 179–194.
[138] T.W. Sisson, G.D. Layne, H2O in basalt and basaltic andesite
glass inclusions from four subduction-related volcanoes,
Earth Planet. Sci. Lett. 117 (1993) 619–635.
[139] P.F. Dobson, H. Skogby, G.R. Rossman, Water in boninite
glass and coexisting orthopyroxene; concentration and parti-
tioning, Contrib. Mineral. Petrol. 118 (1995) 414–419.
[140] T. Plank, K. Kelley, Wet melting in the oceanic mantle, EOS
Trans. AGU 84 (46) (2003) (Fall Meet. Suppl., Abstract
T51H-02).
[141] D.T. Vaniman, B.M. Crowe, E.S. Gladney, Petrology and
geochemistry of Hawaiite lavas from Crater flat, Nevada,
Contrib. Mineral. Petrol. 80 (1982) 341–357.