Size Analysis of PDMS−Magnetite Nanoparticle Complexes: Experiment and Theory
Laser induced photoswitching of azobenzene incorporated in PDMS films
Sajan. D. George*, V. Subramanyan Namboodiri, Steffen Hardt+
Center of Smart Interfaces, Technische Universität Darmstadt, Petersenstrasse 32, 64287, Darmstadt, Germany
ABSTRACT
Polymers incorporating photochromic molecules are promising materials for flexible optical switches and optical data storage devices. A study on reversible photoswitching of azobenzene incorporated polydimethylsiloxane is carried out using transmittance and UV-VIS absorption measurements. The influence of light intensity on the photoswitching behavior is also investigated. The transmittance measurements are correlated with the change in the intensity of the corresponding bands in the UV-VIS absorption spectra. It is shown that the photoswitching occurs reversibly and that the switching time scale decreases with increase in intensity.
Keywords: Photoswitching, Azobenzene, PDMS
INTRODUCTION
Polydimethylsiloxane (PDMS) is one of the most widely employed polymers in microfluidics1. PDMS is an optically transparent (240 nm to 1100 nm) elastomer with tunable stiffness and high chemical inertness to most solvents2. PDMS offers additional advantages such as a high breakdown voltage (2 x 10⁷ V/m) and low permeability to liquid water2. The organic portion of PDMS is a methyl group which only experiences weak intermolecular forces and thus gives a material with low surface energy3. By exposing it to oxygen or air plasma, the intrinsically hydrophobic PDMS can be converted into a hydrophilic material by destroying the methyl groups, (Si-CH3), in the [O-Si(CH3)2]n backbone and by replacing them with (Si-OH) groups4. The plasma oxidized PDMS can be irreversibly connected to PDMS, glass, silicon etc. by the formation of –O-Si-O bonds. PDMS forms a reversible interconnection to smooth surfaces via van der Waals contact. The compatibility of PDMS with proteins and cells makes it suitable for biological applications5. Its optical transparency is sufficient for a number of applications, since the scattering due to silica nanoparticles contained inside the commercially available PDMS-Silgard 184- can be neglected for layers with a thickness employed in microfluidics and optofluidics (< 1 cm). The elastomeric properties of PDMS can be utilized to fabricate mechanically tunable optical components. In the last decade, photochromic substances incorporated into polymers have attracted renewed interest, as photoswitchable molecules can be utilized to create erasable optical memory devices and optical switches. However, the response characteristics of photochromic substances depend upon the intensity of the incident light as well as the properties of the host matrix. In this work, we investigate the intensity-dependent photoswitching properties of azobenzene incorporated into thin PDMS films via transmittance as well as UV-VIS spectroscopic measurements. Azobenzene is one of the most widely used photochromic molecules and has been studied in context with a large number of different applications6-8.
PHOTOCHEMISTRY OF THE AZOBENZENE MOLECULE
Organic photochromic molecules can interconvert reversibly between two (meta)-stable states, the trans (E) and the cis (Z) state, by stimulus of light9. Owing to its clean photochemistry, azobenzene is the most popular candidate among the light-responsive molecules.
*[email protected] or + [email protected], Fax: 0049 – 6151 - 1672021
Linear and Nonlinear Optics of Organic Materials X, edited by Manfred Eich, Jean-Michel Nunzi,Rachel Jakubiak, Theodore G. Goodson III, Proc. of SPIE Vol. 7774, 77740W
© 2010 SPIE · CCC code: 0277-786X/10/$18 · doi: 10.1117/12.860125
Proc. of SPIE Vol. 7774 77740W-1
Downloaded from SPIE Digital Library on 20 Aug 2010 to 130.83.43.54. Terms of Use: http://spiedl.org/terms

The molecule is characterized by the azo bond (-N=N-) that bridges two phenyl groups. The absorption of light anywhere within the broad trans absorption band will elicit photochemical isomerization to the cis state as shown in Figure 1. The reverse transition from the cis to the trans form can happen via two routes, either via irradiation with the appropriate wavelength or via thermal relaxation. In general, the thermal relaxation path is slow and the rate of reverse switching depends upon the substituent group in the phenyl ring10. In order to explain the photoisomerization of the azobenzene molecule, two different pathways have been proposed; a twisting around the N=N double bond (rotation mechanism) and planar variation of the one of the C-N-N angles (inversion mechanism)11. Photoisomerization also induces a change of the molecular size. The conversion from the tans to the cis state reduces the distance between the ends of the moiety from 0.99 nm in the trans state to 0.55 nm in the cis state10. When incorporated in a polymer matrix such as PDMS, there is a certain free-volume requirement for photoisomerization of azobenzene that depends on the specific mechanism. The free volume requirement is approximately 0.12 nm3 for the inversion mechanism12 and 0.28 nm3 for the rotation mechanism13. Therefore, it is a priori not clear if isomerization proceeds in the same way as in solution if the molecule is embedded in a polymer matrix. The change in geometry results in a change of molecular dipole moment from 0.52 Debye in the trans state to 3.08 Debye in the cis state14. The steady-state composition of a bulk azobenzene sample under irradiation with an appropriate wavelength depends upon the competition between photoisomerization (in or both directions) and thermal relaxation back into the trans state. At room temperature, the trans state is thermodynamically favored over the cis state by an energy shift of 50 kJ/mol15. The excitation energy for the photo-excited state is 200 kJ/mol16. Photoisomerization happens at a time scale of picoseconds. The steady-state composition as well as the photoisomerization rate of an azobenzene sample depends upon the irradiation intensity, wavelength, temperature, as well as the composition of the host matrix.
Figure 1. Photoisomerization of the azobenzene molecule
PREPRATION OF AZOBENZENE-CONTAINING PDMS FILMS
PDMS preparation is done using the Silgard 184 Silicone Elastomer Kit (Dow Corning, Germany). 10 ml of the elastomer is mixed with 1 ml of curing agent and stirred well for 10 minutes to ensure thorough mixing. The mixture is then evacuated for 45 minutes until all air bubbles have escaped from it. A 2 molar solution of trans-azobenzene is prepared by dissolving 3.64 mg of azobenzene in 10 ml of acetone. 1 ml of the solution is introduced into the evacuated elastomer mixture and stirred well for 20 minutes. In order to remove air bubbles, the mixture is further evacuated for another 90 minutes. The clear solution is then coated on a silicon substrate using a spin coating system (Laurell Model
Proc. of SPIE Vol. 7774 77740W-2
Downloaded from SPIE Digital Library on 20 Aug 2010 to 130.83.43.54. Terms of Use: http://spiedl.org/terms

WS -650SZ-6NPP/LITE) operating at 2000 rotations per minute for 3 minutes. The resulting films are then heated for 45 minutes at 700C. Once it is hardened, the film is peeled off from the silicon substrate and its thickness is measured. The films obtained that way are about 130 µm thick. The presence of azobenzene in the film is ensured by the UV-VIS absorption spectra of the sample, cf. Figure 2. The absorption spectral data is acquired in steps of 2 nm.
280 300 320 340 360 380 400 420 440 460 480 5000.0
0.1
0.2
0.3
0.4
0.5
0.6
0.7
0.8
Abs
orba
nce
Wavelength in nm
a
b
Figure 2. Absorption spectrum of (a) pure PDMS film (b) azobenzene-containing PDMS film
From Figure 2 it is clear that, in comparison to a pure PDMS film, the azobenzene containing film shows a broad band spectrum with a distinct peak around 325 nm and a smaller peak around 450 nm. The photostationary state is a mixture of trans and cis states. When the azobenzene molecule is in the ground state trans configuration, the transition with the highest quantum yield is that between bonding and anti-bonding (π-π*) orbitals17, resulting in a big absorption peak around 325 nm. In the cis state, the highest quantum yield corresponds to the nonbonding-antibonding transition (n-π*), which is identified by a broad peak around 450 nm17.
TRANSMISSION STUDIES WITH AZOBENZENE CONTAINING PDMS FILMS
Figure 3. Schematic view of the experimental setup for the transmittance measurements
A schematic view of the experimental setup employed is given in Figure 3. A He-Cd laser from Kimmon Koha Co. Ltd which emits linearly polarized light at 325 nm and 442 nm is used. The choice of this particular laser is based on the broad band absorption peak of the samples studied, as shown in Figure 2. The appropriate wavelength can be selected
L Le A S
PMH PM
L: Laser Le: Lens A: Aperture S: Sample holder with sample PMH: Power meter head PM: Power meter
Proc. of SPIE Vol. 7774 77740W-3
Downloaded from SPIE Digital Library on 20 Aug 2010 to 130.83.43.54. Terms of Use: http://spiedl.org/terms
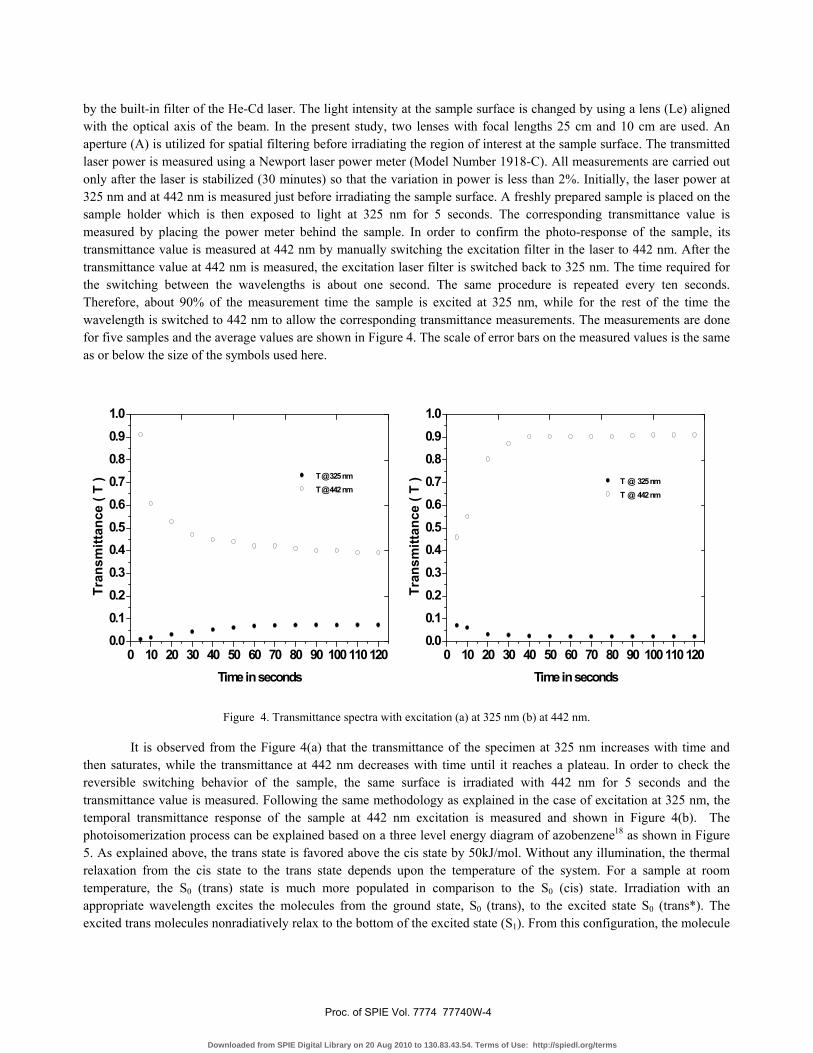
by the built-in filter of the He-Cd laser. The light intensity at the sample surface is changed by using a lens (Le) aligned with the optical axis of the beam. In the present study, two lenses with focal lengths 25 cm and 10 cm are used. An aperture (A) is utilized for spatial filtering before irradiating the region of interest at the sample surface. The transmitted laser power is measured using a Newport laser power meter (Model Number 1918-C). All measurements are carried out only after the laser is stabilized (30 minutes) so that the variation in power is less than 2%. Initially, the laser power at 325 nm and at 442 nm is measured just before irradiating the sample surface. A freshly prepared sample is placed on the sample holder which is then exposed to light at 325 nm for 5 seconds. The corresponding transmittance value is measured by placing the power meter behind the sample. In order to confirm the photo-response of the sample, its transmittance value is measured at 442 nm by manually switching the excitation filter in the laser to 442 nm. After the transmittance value at 442 nm is measured, the excitation laser filter is switched back to 325 nm. The time required for the switching between the wavelengths is about one second. The same procedure is repeated every ten seconds. Therefore, about 90% of the measurement time the sample is excited at 325 nm, while for the rest of the time the wavelength is switched to 442 nm to allow the corresponding transmittance measurements. The measurements are done for five samples and the average values are shown in Figure 4. The scale of error bars on the measured values is the same as or below the size of the symbols used here.
0 10 20 30 40 50 60 70 80 90 1001101200.00.10.20.30.40.50.60.70.80.91.0
T @ 325 nm T @ 442 nm
Tran
smitt
ance
( T
)
Time in seconds0 10 20 30 40 50 60 70 80 90 100110120
0.00.10.20.30.40.50.60.70.80.91.0
T @ 325 nm T @ 442 nm
Tran
smitt
ance
( T
)
Time in seconds
Figure 4. Transmittance spectra with excitation (a) at 325 nm (b) at 442 nm.
It is observed from the Figure 4(a) that the transmittance of the specimen at 325 nm increases with time and then saturates, while the transmittance at 442 nm decreases with time until it reaches a plateau. In order to check the reversible switching behavior of the sample, the same surface is irradiated with 442 nm for 5 seconds and the transmittance value is measured. Following the same methodology as explained in the case of excitation at 325 nm, the temporal transmittance response of the sample at 442 nm excitation is measured and shown in Figure 4(b). The photoisomerization process can be explained based on a three level energy diagram of azobenzene18 as shown in Figure 5. As explained above, the trans state is favored above the cis state by 50kJ/mol. Without any illumination, the thermal relaxation from the cis state to the trans state depends upon the temperature of the system. For a sample at room temperature, the S0 (trans) state is much more populated in comparison to the S0 (cis) state. Irradiation with an appropriate wavelength excites the molecules from the ground state, S0 (trans), to the excited state S0 (trans*). The excited trans molecules nonradiatively relax to the bottom of the excited state (S1). From this configuration, the molecule
Proc. of SPIE Vol. 7774 77740W-4
Downloaded from SPIE Digital Library on 20 Aug 2010 to 130.83.43.54. Terms of Use: http://spiedl.org/terms
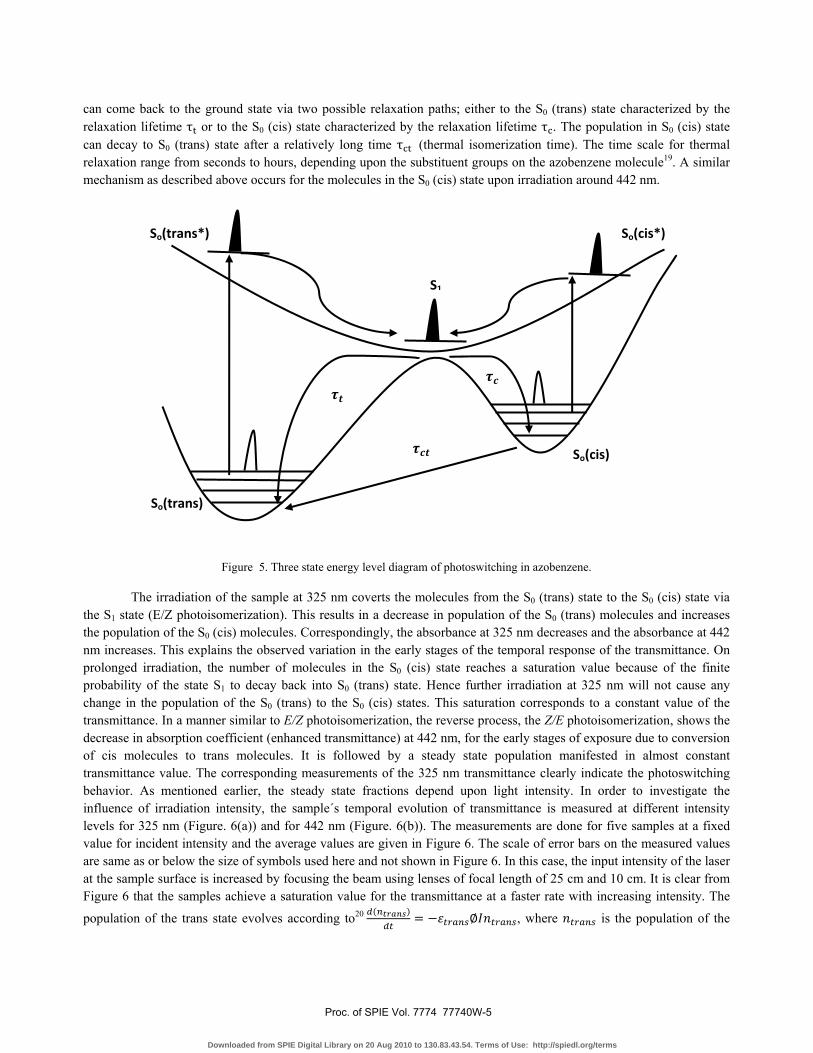
can come back to the ground state via two possible relaxation paths; either to the S0 (trans) state characterized by the relaxation lifetime τ or to the S0 (cis) state characterized by the relaxation lifetime τ . The population in S0 (cis) state can decay to S0 (trans) state after a relatively long time τ (thermal isomerization time). The time scale for thermal relaxation range from seconds to hours, depending upon the substituent groups on the azobenzene molecule19. A similar mechanism as described above occurs for the molecules in the S0 (cis) state upon irradiation around 442 nm.
Figure 5. Three state energy level diagram of photoswitching in azobenzene.
The irradiation of the sample at 325 nm coverts the molecules from the S0 (trans) state to the S0 (cis) state via the S1 state (E/Z photoisomerization). This results in a decrease in population of the S0 (trans) molecules and increases the population of the S0 (cis) molecules. Correspondingly, the absorbance at 325 nm decreases and the absorbance at 442 nm increases. This explains the observed variation in the early stages of the temporal response of the transmittance. On prolonged irradiation, the number of molecules in the S0 (cis) state reaches a saturation value because of the finite probability of the state S1 to decay back into S0 (trans) state. Hence further irradiation at 325 nm will not cause any change in the population of the S0 (trans) to the S0 (cis) states. This saturation corresponds to a constant value of the transmittance. In a manner similar to E/Z photoisomerization, the reverse process, the Z/E photoisomerization, shows the decrease in absorption coefficient (enhanced transmittance) at 442 nm, for the early stages of exposure due to conversion of cis molecules to trans molecules. It is followed by a steady state population manifested in almost constant transmittance value. The corresponding measurements of the 325 nm transmittance clearly indicate the photoswitching behavior. As mentioned earlier, the steady state fractions depend upon light intensity. In order to investigate the influence of irradiation intensity, the sample´s temporal evolution of transmittance is measured at different intensity levels for 325 nm (Figure. 6(a)) and for 442 nm (Figure. 6(b)). The measurements are done for five samples at a fixed value for incident intensity and the average values are given in Figure 6. The scale of error bars on the measured values are same as or below the size of symbols used here and not shown in Figure 6. In this case, the input intensity of the laser at the sample surface is increased by focusing the beam using lenses of focal length of 25 cm and 10 cm. It is clear from Figure 6 that the samples achieve a saturation value for the transmittance at a faster rate with increasing intensity. The
population of the trans state evolves according to20 , where is the population of the
So(cis)
S1
So(cis*) So(trans*)
So(trans)
Proc. of SPIE Vol. 7774 77740W-5
Downloaded from SPIE Digital Library on 20 Aug 2010 to 130.83.43.54. Terms of Use: http://spiedl.org/terms
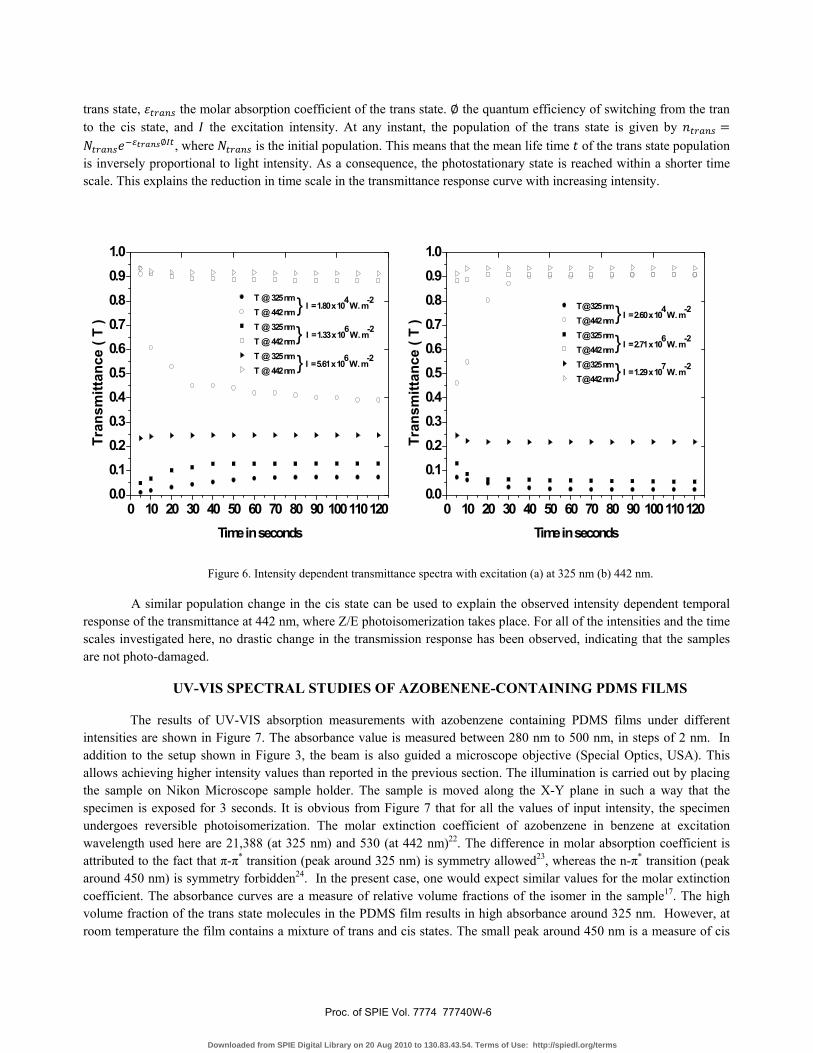
trans state, the molar absorption coefficient of the trans state. the quantum efficiency of switching from the tran to the cis state, and the excitation intensity. At any instant, the population of the trans state is given by
, where is the initial population. This means that the mean life time of the trans state population is inversely proportional to light intensity. As a consequence, the photostationary state is reached within a shorter time scale. This explains the reduction in time scale in the transmittance response curve with increasing intensity.
0 10 20 30 40 50 60 70 80 90 1001101200.00.10.20.30.40.50.60.70.80.91.0
I = 5.61 x 10⁶ W . m-2
I = 1.33 x 10⁶ W . m-2
}}
T @ 325 nm T @ 442 nm T @ 325 nm T @ 442 nm T @ 325 nm T @ 442 nm
Tran
smitt
ance
( T
)
Time in seconds
} I = 1.80 x 10⁴ W . m-2
0 10 20 30 40 50 60 70 80 90 1001101200.00.10.20.30.40.50.60.70.80.91.0
I = 1.29 x 10⁷ W . m-2
I = 2.71 x 10⁶ W . m-2
I = 2.60 x 10⁴ W . m-2
}}
} T @ 325 nm T @ 442 nm T @ 325 nm T @ 442 nm T @ 325 nm T @ 442 nm
Tran
smitt
ance
( T
)
Time in seconds
Figure 6. Intensity dependent transmittance spectra with excitation (a) at 325 nm (b) 442 nm.
A similar population change in the cis state can be used to explain the observed intensity dependent temporal response of the transmittance at 442 nm, where Z/E photoisomerization takes place. For all of the intensities and the time scales investigated here, no drastic change in the transmission response has been observed, indicating that the samples are not photo-damaged.
UV-VIS SPECTRAL STUDIES OF AZOBENENE-CONTAINING PDMS FILMS
The results of UV-VIS absorption measurements with azobenzene containing PDMS films under different intensities are shown in Figure 7. The absorbance value is measured between 280 nm to 500 nm, in steps of 2 nm. In addition to the setup shown in Figure 3, the beam is also guided a microscope objective (Special Optics, USA). This allows achieving higher intensity values than reported in the previous section. The illumination is carried out by placing the sample on Nikon Microscope sample holder. The sample is moved along the X-Y plane in such a way that the specimen is exposed for 3 seconds. It is obvious from Figure 7 that for all the values of input intensity, the specimen undergoes reversible photoisomerization. The molar extinction coefficient of azobenzene in benzene at excitation wavelength used here are 21,388 (at 325 nm) and 530 (at 442 nm)22. The difference in molar absorption coefficient is attributed to the fact that π-π* transition (peak around 325 nm) is symmetry allowed23, whereas the n-π* transition (peak around 450 nm) is symmetry forbidden24. In the present case, one would expect similar values for the molar extinction coefficient. The absorbance curves are a measure of relative volume fractions of the isomer in the sample17. The high volume fraction of the trans state molecules in the PDMS film results in high absorbance around 325 nm. However, at room temperature the film contains a mixture of trans and cis states. The small peak around 450 nm is a measure of cis
Proc. of SPIE Vol. 7774 77740W-6
Downloaded from SPIE Digital Library on 20 Aug 2010 to 130.83.43.54. Terms of Use: http://spiedl.org/terms
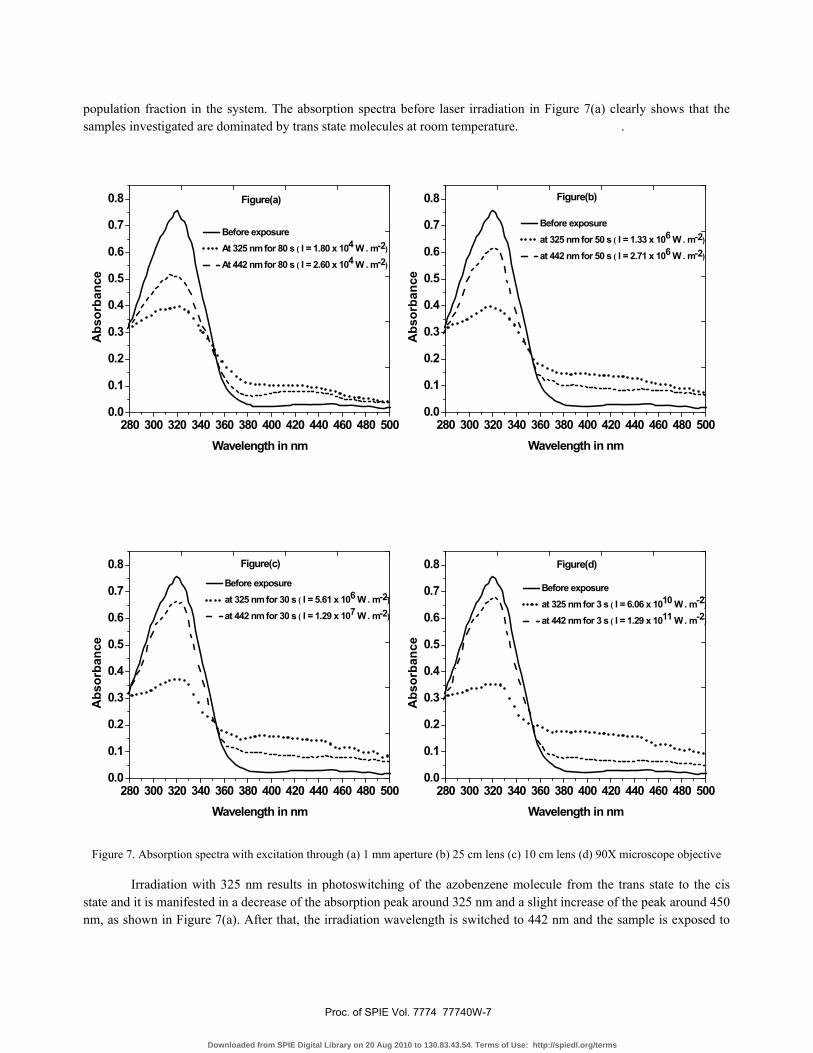
population fraction in the system. The absorption spectra before laser irradiation in Figure 7(a) clearly shows that the samples investigated are dominated by trans state molecules at room temperature. .
280 300 320 340 360 380 400 420 440 460 480 5000.0
0.1
0.2
0.3
0.4
0.5
0.6
0.7
0.8
Abs
orba
nce
Wavelength in nm
Before exposure At 325 nm for 80 s ( I = 1.80 x 10⁴ W . m-2)
At 442 nm for 80 s ( I = 2.60 x 10⁴ W . m-2)
Figure(a)
280 300 320 340 360 380 400 420 440 460 480 5000.0
0.1
0.2
0.3
0.4
0.5
0.6
0.7
0.8
Before exposure at 325 nm for 50 s ( I = 1.33 x 10⁶ W . m-2)
at 442 nm for 50 s ( I = 2.71 x 10⁶ W . m-2)
Abs
orba
nce
Wavelength in nm
Figure(b)
280 300 320 340 360 380 400 420 440 460 480 5000.0
0.1
0.2
0.3
0.4
0.5
0.6
0.7
0.8 Before exposure at 325 nm for 30 s ( I = 5.61 x 10⁶ W . m-2)
at 442 nm for 30 s ( I = 1.29 x 10⁷ W . m-2)
Abs
orba
nce
Wavelength in nm
Figure(c)
280 300 320 340 360 380 400 420 440 460 480 5000.0
0.1
0.2
0.3
0.4
0.5
0.6
0.7
0.8
Before exposure at 325 nm for 3 s ( I = 6.06 x 10¹⁰ W . m-2)
at 442 nm for 3 s ( I = 1.29 x 10¹¹ W . m-2)
Abs
orba
nce
Wavelength in nm
Figure(d)
Figure 7. Absorption spectra with excitation through (a) 1 mm aperture (b) 25 cm lens (c) 10 cm lens (d) 90X microscope objective
Irradiation with 325 nm results in photoswitching of the azobenzene molecule from the trans state to the cis state and it is manifested in a decrease of the absorption peak around 325 nm and a slight increase of the peak around 450 nm, as shown in Figure 7(a). After that, the irradiation wavelength is switched to 442 nm and the sample is exposed to
Proc. of SPIE Vol. 7774 77740W-7
Downloaded from SPIE Digital Library on 20 Aug 2010 to 130.83.43.54. Terms of Use: http://spiedl.org/terms

light for the same duration as for the case of 325 nm. This results an increase of absorption peak at 325 nm and a decrease of the peak at 450 nm which is due to the reverse switching of the cis to the trans state. This variation of the absorption peaks is a clear indication of reversible photoswitching of azobenzene in a PDMS matrix. When exposing the sample to 442 nm over the same period of time as 325 nm, we do not recover the same absorption peak as observed at the beginning of the experiment. This is probably due to the difference in extinction coefficient at these two wavelengths, resulting in a comparatively slow transition between the cis and the trans state. The same procedure is repeated at higher intensity values. Except for the case of Figure 7(d), the time scales reported in the figures correspond to the time scale where photostationary states are observed in the transmission response study. A closer inspection of the 325 nm peak in Figure 7 indicates that with increasing intensity, the number of molecules in the cis state reverting back to the trans state increases. However, for the intensities and time scales employed here, no complete reverse photoswitching from the cis to trans state is observed in the UV-VIS absorption spectra. Nevertheless, the increasing absorption coefficient around 325 nm with the increasing light intensity at 442 nm clearly indicates that the azobenzene molecules in the PDMS host matrix are not significantly photodamaged.
CONCLUSIONS
In summary, the transmittance and UV-VIS absorption measurements of azobenzene-containg PDMS films indicate that the azobenzene molecule undergoes a reversible photoisomerization in the PDMS host matrix. The time required for reaching the photostationary state and the relative population of the isomers in this state is influenced by the intensity of the exciting laser beam. At an intensity of the order of 107 W.m-2, this time scale is only a few seconds. The high photostability of the molecule and the host matrix under the chosen experimental conditions is clearly manifested in reversible photoswitching behavior. Azobenzene containing PDMS could a potential candidate for the future photonic applications.
ACKNOWLEDGMENT
Funding from the DFG Cluster of Excellence “Center of Smart Interfaces” is gratefully acknowledged.
REFERENCES
[1] Liu C, “Recent developments in polymer MEMS”, Advanced Materials, 19, 3783-3790, (2007) and references therein [2] McDonald J. C and Whitesides G. M, “Poly(dimethylsiloxane) as a material for fabricating microfluidic devices” Acc. Chem. Res., 35, 491-499, (2002). [3] http://www.dowcorning.com/content/sitech/sitechis/what_makes_silicones_special.asp [4] Tang K. Y. S and Whitesides G. M, [Optofluidics Fundamentals, Devices and Applications], Mc-Graw Hill, New York, Chapter 2, (2010). [5] Lee J. N, Jiang. X, Ryan. D and Whitesides G. M, “Compatibility of mammalian cells on surfaces of poly (dimethylsiloxane)”, Langmuir, 20, 11684-11691, (2004). [6] Brzozowski L and Sargent E. H, “Azobenzenes for photonic network applications: Third order nonlinear optical properties” J. Mat. Sci: Mater. Electronics, 12, 483-489, (2001). [7] Sadovski O, Beharry A. A, Zhang F and Woolley G. A, “Spectral tuning of azobenzene photoswitches for biological applications, Angew. Chem. Int. Ed., 48, 1486-1489, (2009). [8] Haberhauer G and Kallweit C, “A bridged azobenzene derivative as a reversible, light induced chirality switch”, Angew. Chem. Int. Ed., 49, 2418-2421, (2010). [9] Francisco M. R and Tomasulo M, “Optical processing with photochromic switches”, Chem. A European Journal, 12(12), 3186-3193, (2006).
Proc. of SPIE Vol. 7774 77740W-8
Downloaded from SPIE Digital Library on 20 Aug 2010 to 130.83.43.54. Terms of Use: http://spiedl.org/terms

[10] Yager K. G and Barret C. J, “Novel photoswitching using azobenzene functional materials” J. Photochem. Photo biol. A: Chem, 182, 250-261, (2006). [11] Naito T, Horie K and Mita I, “Photochemistry in polymer solids. 11. The effects of the size of reaction groups and the mode of photoisomerization on photochromic reactions in polycarbonate film” Macromolecules, 24, 2907-2911, (1991). [12] Paik C. S and Morawetz H, “Photochemical and thermal Isomerization of azoaromatic residues in the side chains and the backbone of polymers in bulk”, Macromolecules, 5(2), 171-177, (1972). [13] Lammare L and Sung C. S. P, Studies of physical aging and molecular motion by azochromophoric labels attached to the main chains of amorphous polymers”, Macromolecules, 16(11), 1729-1736, (1983). [14] Halicioglu T and Sinanoglu O, “Solvent effects on the cis-trans isomerization: A detailed application of a theory of solvent effects on molecular association”, Annal. New York Acc. Sci, 158, 308-317, (1969). [15] Mita I, Horie K and Hirao K, “Photochemistry in polymer solids. 9. Photoisomerization of azobenzene in a polycarbonate film” Macromolecules, 22(2), 558-563, (1989). [16] Monti S, Orlandi G and Palmieri. P, “Features of the photochemically active state surfaces of azobenzene”, Chem. Phys, 77(1), 87-99, (1992). [17] Buffeteau. T, Labarthet F.L, Pezolet M and Sourisseau C, “Dynamics of photoinduced orientation of nonpolar azobenzene groups in polymer films. Characterization of the cis isomers by visible and FTIR spectroscopies”, Macromolecules, 34, 7514-7521, (2001). [18] Correa D. S, Goncalves V. C, Balogh D. T, Mendonca C. R and Boni, L. De “Induced transparency in polythiophene bearing azobenzene moieties”, Polymer 47, 7436-7440, (2006). [19] Cojocariu C and Rochon P, “Light induced motions in azobenzene-containing polymers”, Pure. Appl. Chem. , 76 (7-8), 1479-1479-1497, (2004). [20] Shang T, Smith K. A and Hatton T. A, “Photoresponsive surfactants exhibiting unusually large, reversible surface tension changes under varying illumination conditions”, Langmuir, 19, 10764-10773, (2003). [21] Natansohn A and Rochon P, “Photoinduced motions in azo-containing polymers”, Chem. Rev., 102, 4139-4175, (2002). [22] http://omlc.ogi.edu/spectra/PhotochemCAD/abs_html/azobenzene.html. [23] Chang C.W, Lu Y.C, Wang T. T and Diau E. W. G, “Photoisomerization dynamics of azobenzene in solution with S1 excitation: A femtosecond fluorescence anisotropy study”, J. Am. Chem. Soc., 126 (32), 10109-10118, (2004). [24] Velate S, Danilov E.O and Rodgers M. A. J, “Ultrafast dynamics of the azobenzene-coumarin complex: Investigation of cooling dynamics measured by an integrated molecular thermometer”, J. Phys. Chem. A, 109 (40), 8969-8975, (2005).
Proc. of SPIE Vol. 7774 77740W-9
Downloaded from SPIE Digital Library on 20 Aug 2010 to 130.83.43.54. Terms of Use: http://spiedl.org/terms
Copyright © 2022 FDOKUMEN