Continuous Particle Separation Driven by 3D Ag-PDMS ...
13
Citation: Li, X.; Duan, J.; Qu, Z.; Wang, J.; Ji, M.; Zhang, B. Continuous Particle Separation Driven by 3D Ag-PDMS Electrodes with Dielectric Electrophoretic Force Coupled with Inertia Force. Micromachines 2022, 13, 117. https://doi.org/10.3390/ mi13010117 Academic Editor: Antonio Ramos Received: 15 December 2021 Accepted: 7 January 2022 Published: 12 January 2022 Publisher’s Note: MDPI stays neutral with regard to jurisdictional claims in published maps and institutional affil- iations. Copyright: © 2022 by the authors. Licensee MDPI, Basel, Switzerland. This article is an open access article distributed under the terms and conditions of the Creative Commons Attribution (CC BY) license (https:// creativecommons.org/licenses/by/ 4.0/). micromachines Article Continuous Particle Separation Driven by 3D Ag-PDMS Electrodes with Dielectric Electrophoretic Force Coupled with Inertia Force Xiaohong Li 1,2 , Junping Duan 1 , Zeng Qu 1 , Jiayun Wang 1 , Miaomiao Ji 1 and Binzhen Zhang 1, * 1 Key Laboratory of Instrumentation Science & Dynamic Measurement Ministry of Education, Micro Nano Technology Research Center, North University of China, Taiyuan 030051, China; [email protected] (X.L.); [email protected] (J.D.); [email protected] (Z.Q.); [email protected] (J.W.); [email protected] (M.J.) 2 Taiyuan Institute of Technology, Taiyuan 030051, China * Correspondence: [email protected] Abstract: Cell separation has become @important in biological and medical applications. Dielec- trophoresis (DEP) is widely used due to the advantages it offers, such as the lack of a requirement for biological markers and the fact that it involves no damage to cells or particles. This study aimed to report a novel approach combining 3D sidewall electrodes and contraction/expansion (CEA) structures to separate three kinds of particles with different sizes or dielectric properties continuously. The separation was achieved through the interaction between electrophoretic forces and inertia forces. The CEA channel was capable of sorting particles with different sizes due to inertial forces, and also enhanced the nonuniformity of the electric field. The 3D electrodes generated a non-uniform electric field at the same height as the channels, which increased the action range of the DEP force. Finite element simulations using the commercial software, COMSOL Multiphysics 5.4, were performed to determine the flow field distributions, electric field distributions, and particle trajectories. The separation experiments were assessed by separating 4 μm polystyrene (PS) particles from 20 μm PS particles at different flow rates by experiencing positive and negative DEP. Subsequently, the sorting performances of the 4 μm PS particles, 20 μm PS particles, and 4 μm silica particles with different solution conductivities were observed. Both the numerical simulations and the practical particle separation displayed high separating efficiency (separation of 4 μm PS particles, 94.2%; separation of 20 μm PS particles, 92.1%; separation of 4 μm Silica particles, 95.3%). The proposed approach is expected to open a new approach to cell sorting and separating. Keywords: dielectrophoresis; 3D electrodes; inertial; microfluidic chip; particle sorting 1. Introduction Since the proposal of the concept of microfluidic chips by Manz and Widmer et al. [1], microfluidic techniques using fluid as a medium have received increasing attention. They offer the potential advantages of reduced sample consumption [2,3], high sensitivity, and ease of mass production compared with traditional separation techniques, such as centrifu- gation and filtration. Microfluidic technology is now widely used in medical diagnosis [4], biological detection [5], chemical analysis [6], and other aspects where particle and cell separations are critical to numerous applications. Many techniques have been developed in microfluidics, including inertial microfluidics [7], deterministic lateral displacement [8], hydrophoresis [9,10], optical [11], dielectrophoresis (DEP) [12], surface acoustic waves [13], and magnetic force to achieve precise control and sorting of detection objects such as particles and cells with microfluidic chips. Among these separation techniques, DEP has attracted more attention due to its advantages, such as label-free and non-contact forces on particles [14,15]. In DEP, the internal charge of particles in fluid is induced to polarize and Micromachines 2022, 13, 117. https://doi.org/10.3390/mi13010117 https://www.mdpi.com/journal/micromachines
-
Upload
khangminh22 -
Category
Documents
-
view
0 -
download
0
Transcript of Continuous Particle Separation Driven by 3D Ag-PDMS ...

�����������������
Citation: Li, X.; Duan, J.; Qu, Z.;
Wang, J.; Ji, M.; Zhang, B. Continuous
Particle Separation Driven by 3D
Ag-PDMS Electrodes with Dielectric
Electrophoretic Force Coupled with
Inertia Force. Micromachines 2022, 13,
117. https://doi.org/10.3390/
mi13010117
Academic Editor: Antonio Ramos
Received: 15 December 2021
Accepted: 7 January 2022
Published: 12 January 2022
Publisher’s Note: MDPI stays neutral
with regard to jurisdictional claims in
published maps and institutional affil-
iations.
Copyright: © 2022 by the authors.
Licensee MDPI, Basel, Switzerland.
This article is an open access article
distributed under the terms and
conditions of the Creative Commons
Attribution (CC BY) license (https://
creativecommons.org/licenses/by/
4.0/).
micromachines
Article
Continuous Particle Separation Driven by 3D Ag-PDMSElectrodes with Dielectric Electrophoretic Force Coupled withInertia ForceXiaohong Li 1,2, Junping Duan 1, Zeng Qu 1, Jiayun Wang 1, Miaomiao Ji 1 and Binzhen Zhang 1,*
1 Key Laboratory of Instrumentation Science & Dynamic Measurement Ministry of Education,Micro Nano Technology Research Center, North University of China, Taiyuan 030051, China;[email protected] (X.L.); [email protected] (J.D.); [email protected] (Z.Q.);[email protected] (J.W.); [email protected] (M.J.)
2 Taiyuan Institute of Technology, Taiyuan 030051, China* Correspondence: [email protected]
Abstract: Cell separation has become @important in biological and medical applications. Dielec-trophoresis (DEP) is widely used due to the advantages it offers, such as the lack of a requirementfor biological markers and the fact that it involves no damage to cells or particles. This study aimedto report a novel approach combining 3D sidewall electrodes and contraction/expansion (CEA)structures to separate three kinds of particles with different sizes or dielectric properties continuously.The separation was achieved through the interaction between electrophoretic forces and inertia forces.The CEA channel was capable of sorting particles with different sizes due to inertial forces, and alsoenhanced the nonuniformity of the electric field. The 3D electrodes generated a non-uniform electricfield at the same height as the channels, which increased the action range of the DEP force. Finiteelement simulations using the commercial software, COMSOL Multiphysics 5.4, were performedto determine the flow field distributions, electric field distributions, and particle trajectories. Theseparation experiments were assessed by separating 4 µm polystyrene (PS) particles from 20 µm PSparticles at different flow rates by experiencing positive and negative DEP. Subsequently, the sortingperformances of the 4 µm PS particles, 20 µm PS particles, and 4 µm silica particles with differentsolution conductivities were observed. Both the numerical simulations and the practical particleseparation displayed high separating efficiency (separation of 4 µm PS particles, 94.2%; separationof 20 µm PS particles, 92.1%; separation of 4 µm Silica particles, 95.3%). The proposed approach isexpected to open a new approach to cell sorting and separating.
Keywords: dielectrophoresis; 3D electrodes; inertial; microfluidic chip; particle sorting
1. Introduction
Since the proposal of the concept of microfluidic chips by Manz and Widmer et al. [1],microfluidic techniques using fluid as a medium have received increasing attention. Theyoffer the potential advantages of reduced sample consumption [2,3], high sensitivity, andease of mass production compared with traditional separation techniques, such as centrifu-gation and filtration. Microfluidic technology is now widely used in medical diagnosis [4],biological detection [5], chemical analysis [6], and other aspects where particle and cellseparations are critical to numerous applications. Many techniques have been developedin microfluidics, including inertial microfluidics [7], deterministic lateral displacement [8],hydrophoresis [9,10], optical [11], dielectrophoresis (DEP) [12], surface acoustic waves [13],and magnetic force to achieve precise control and sorting of detection objects such asparticles and cells with microfluidic chips. Among these separation techniques, DEP hasattracted more attention due to its advantages, such as label-free and non-contact forces onparticles [14,15]. In DEP, the internal charge of particles in fluid is induced to polarize and
Micromachines 2022, 13, 117. https://doi.org/10.3390/mi13010117 https://www.mdpi.com/journal/micromachines

Micromachines 2022, 13, 117 2 of 13
move in the positive or negative direction of the electric field gradient after the particlesare loaded with the non-uniform electric field [16]. Currently, DEP sorting generally usesa sheath flow focused on using planar electrodes. These electrodes are generally in theform of a thin-film metal layer at the bottom of the microchannel, and the electric fieldintensity is exponentially attenuated as the vertical distance from the electrode increases.Moreover, as the particle moves further away from the planar electrode, the electrophoreticforce on the particle decreases rapidly. Therefore, the DEP force features a limited rangeof particle manipulation, and particles are easily absorbed in the edge of the electrode orchannel surface owing to the strong partial electric field, resulting in particle damage.
Particles dispersed at different heights can be affected by the electric field force toexpand the action area of the DEP effect. Hence, the application of 3D electrodes inmicrofluidic devices is an effective method. Three-dimensional electrodes feature thesame height as the microfluidic chip channel. This can provide a non-uniform electricfield in the vertical direction, thus improving the attenuation of the two-dimensionalelectric field in the vertical direction compared with the DEP device with a thin planarelectrode, as well as producing a greater sorting efficiency and increasing the throughput.Jie Yao et al. fabricated 3D carbon electrodes via screen-printing to complete the sorting ofblood cells from circulating tumor cells [17]. Jia et al. designed 3D Ag-polydimethylsiloxane(PDMS) electrodes filling into the mold, which was laminated onto the glass substrateby two layers of a negative dry film to obtain a 60 µm photoresist layer, and eventuallyseparated Au-plated polystyrene particles and yeast cells [18]. Fu et al. fabricated 3Delectrodes composed of nanosized carbon black and PDMS on both sides of the separationchannel to generate regional electrophoresis and isokinetic electrophoresis [19]. Amongthese 3D electrode preparation methods, the Ag-PDMS composite conductive materialhas been widely used due to its advantages of low cost, simple production, and betterconductivity. However, most different cells feature similar dielectric properties, resulting inpoor sorting performance. Therefore, active separation coupled with passive separation hasbecome a simple and efficient method of particle separation [20]. Inertial separation, as thepassive sorting method, uses inertial force within the fluid to deflect the trajectory of cellsand produce continuous and high-throughput cell separation without applying externalforces [21,22]. Commonly used inertial sorting channels include spiral channels [23,24],curved channels [25,26], and contraction-/expansion(CEA) structures [27,28]. The CEAstructure can achieve sorting according to the size of the cells or particles at a low Reynoldsnumber, preventing damage to the cells or particles from high shear forces in conventionalinertial sorting.
In this study, a microfluidic chip combining the effects of 3D Ag-PDMS electrodes [29]on both sides of the main channel and microfluidic channel with a CEA structure wasdesigned and fabricated to produce continuous particle separation. The particle focusingand sorting were achieved by focusing the particles with a combination of DEP force andinertial force. The designed structure of the microfluidic chip was first simulated usingcommercial software COMSOL5.4. The simulations and analysis were mainly focusedon the flow field distribution, the electric field distribution, and the motion state of theparticle trajectory. Next, a composite conductive material, Ag-PDMS, was selected for the3D electrode tests to verify the sorting performance of the structure. In the experiment, aspatially non-uniform electric field was generated by energizing the 3D electrode with analternating current (AC) sinusoidal voltage to extend the DEP effect to different heights ofthe main channel. The separating experiments on three kinds of particles, 4 µm polystyrene,20 µm polystyrene, and 4- µm silica, were conducted. The recovery of each particle was94.2%, 92.1%, and 95.3%, respectively.
2. Materials and Methods2.1. Theory (DEP and Inertial Force)
The DEP force is a phenomenon in which particles suspended in solution are polarizedin a non-uniform electric field and move with the fluid [30]. The direction and magnitude

Micromachines 2022, 13, 117 3 of 13
of the DEP force depend on the difference in polarization between the particles and thesurrounding medium. It can be described as follows [31]:
FDEP = 2πr3εmRe[K(ω)]∇E2rms (1)
where r is the radius of the particles, εm is the permittivity of the suspension liquid, ∇E2rms
is the gradient of the square of the applied electric field, and Re[K(ω)] refers to Clausius–Mossotti (CM) factor [32], where [K(ω)] can be denoted as [33]:
K(w) =ε∗p − ε∗m
ε∗p + 2ε∗m(2)
where p denotes particles, m denotes medium, ε∗ = ε − iσw is the complex permittivity,
σ is the electrical conductivity, i =√−1, and ω is the angular frequency of the electric
field, w = 2π f . For spherical particles, the conductivity can be expressed as the sum ofthe surface conductivity of the bulk and surface conductivities according to the study byO’Konski [34].
σp = σb +2Ks
r(3)
where σb∼= 0, Ks is a general surface conductance (typically 1nS for latex particles), and r
is the radius of particles.When the polarization of particles is above the polarization of the dielectric solution,
the particles are subjected to the positive dielectric force pDEP and move towards thehigh electric field region; by contrast, it is subjected to negative dielectric force (nDEP). Inaddition, the particles in the microfluidic channel are subjected to fluid drag force due tothe flow of fluid, which can be expressed as: Fdrag = 6πηrv, where η is the viscosity of thefluid, v is the velocity of the fluid.
Inertial migration occurred when particles were dispersed in tubular flow with finiteinertia [35]. In Newtonian fluids, the fluid near the wall is subject to frictional forces due tothe laminar flow of the fluid, which impedes the movement of the fluid and thus leads to aparabolic distribution of the flow velocity in the channel [36]. This phenomenon creates ashear gradient, which induces a shear-induced lift force that pushes particles suspendedin the fluid toward the channel wall [37]. The wall-induced lift force pushes the particlesto the center of the flow channel as the particles move close enough to the channel wall.Finally, the combined force in opposite directions is called inertial force, which can beexpressed as follows [38]:
FL =ρ f r4
pvm
DhCL (4)
where ρ f is the fluid density, vm is the flow velocity, rp is the particle diameter, Dh is thehydraulic diameter of the expansion region, and CL is the lift coefficient, which depends onthe Reynolds number and the position of the particle on the channel cross-section. Particlesachieve inertial focusing where the inertial lift force FL = 0 in the channel cross-section.
2.2. Design of the Microfluidic Separation Chip
The proposed microfluidic chip consisted of an upper PDMS microchannel, a mi-crochannel sidewall Ag-PDMS and a lower Indium Tin Oxides (ITO) transition electrode.The PDMS microchannel was adopted as the contraction and expansion channel [35]. TheAg-PDMS electrodes covered both ends of the PDMS microchannel sidewalls with the sameheight as the microchannel to ensure that the non-uniform electric field covered the wholechannel. In addition, the length of the electrodes and contraction/expansion microchannelswere equal in this microchip to ensure the same processing time of DEP separation andinertial separation. The PDMS microchannel part contained the main channel and fourbranches that led to one inlet and three outlets. All the microchannels in the devices were

Micromachines 2022, 13, 117 4 of 13
60 µm in height. The structure of the designed microfluidic chip is shown in Figure 1A. Theschematic diagram of the microchannel and 3D electrode structure is shown in Figure 1B.
Micromachines 2022, 13, x FOR PEER REVIEW 4 of 14
same height as the microchannel to ensure that the non-uniform electric field covered the
whole channel. In addition, the length of the electrodes and contraction/expansion micro-
channels were equal in this microchip to ensure the same processing time of DEP separa-
tion and inertial separation. The PDMS microchannel part contained the main channel
and four branches that led to one inlet and three outlets. All the microchannels in the
devices were 60 µm in height. The structure of the designed microfluidic chip is shown in
Figure 1A. The schematic diagram of the microchannel and 3D electrode structure is
shown in Figure 1B.
Figure 1. (A) Design of the microchip in the particle separation device. The micro-device consisted
of one inlet, the CEA channel region, and three outlets. (B) Schematic diagram of Ag-PDMS elec-
trode layer
After passing through the inlet, different particles flowed through the trapezoidal
contraction channel, which caused a sudden change in velocity so that the particles fo-
cused on the top of the channel. In addition, after a sinusoidal voltage of equal magnitude
and opposite direction was applied on the two side walls of the channel, the nonuniform
electric field consistent with the height of the channel was generated in the channel. There-
fore, the electric field did not decay with the increase in the height of the channel, thus
ensuring that the nonuniform electric field covered the whole channel. By adjusting the
voltage frequency and the conductivity of the solution, the 20 µm polystyrene (PS) parti-
cles experienced pDEP, the 4 µm PS particles experienced weaker pDEP, and the 4 µm
Figure 1. (A) Design of the microchip in the particle separation device. The micro-device con-sisted of one inlet, the CEA channel region, and three outlets. (B) Schematic diagram of Ag-PDMSelectrode layer.
After passing through the inlet, different particles flowed through the trapezoidalcontraction channel, which caused a sudden change in velocity so that the particles focusedon the top of the channel. In addition, after a sinusoidal voltage of equal magnitude andopposite direction was applied on the two side walls of the channel, the nonuniform electricfield consistent with the height of the channel was generated in the channel. Therefore, theelectric field did not decay with the increase in the height of the channel, thus ensuring thatthe nonuniform electric field covered the whole channel. By adjusting the voltage frequencyand the conductivity of the solution, the 20 µm polystyrene (PS) particles experienced pDEP,the 4 µm PS particles experienced weaker pDEP, and the 4 µm silica particles experiencednDEP. Finally, this device could perform the high-efficiency sorting of multiple particlesthrough the combination of dielectrophoretic force, inertial force, and fluid traction duringthe practical experiments.
2.3. Fabrication of the Microfluidic Chip
The microfluidic chip fabrication process was mainly divided into two parts: one forthe preparation of microchannels and 3D electrodes and another for the preparation of ITO
Micromachines 2022, 13, 117 5 of 13
electrodes. The fabrication of the PDMS channel was mainly based on soft lithography [39].Next, 3D electrodes were prepared. First, PDMS and curing agents in a ratio of 10:1 werefully mixed and their bubbles were removed by the vacuum chamber to form a PDMScuring agent. Next, the high-purity micron silver powder was mixed with the PDMS curingagent in a mass ratio of 86:14. After being fully mixed, the Ag-PDMS was placed in thevacuum chamber to remove bubbles for 1 h. Subsequently, it was applied to the siliconwafer and smoothened with a spatula. The PDMS (prepolymer: curing agent = 10:1) waspoured on this mold at 75 ◦C for 50 min and then peeled off gently after cooling withAg-PDMS. The Ag-PDMS was heated to 150 ◦C to ensure good electrical conductivity. Atransition electrode was needed to connect the 3D electrode to the external wire, whichwas prepared by the wet etching method using ITO glass. The ITO electrode preparationprocess is similar to the silicon process. After post-baking, the ITO electrode preparationprocess was similar to the silicon process. After baking, the ITO glass was placed in theetchant with a solution ratio of 50:50:3 in the order of H2O: HCl: HNO3 at 55 ◦C for 100 s.Next, the ITO glass was placed in acetone and ultrasonicated for 5 min to remove thecovered positive PR and then placed in ethanol for ultrasonication for 5 min. Subsequently,ITO glass was washed with a large amount of deionized water and dried with nitrogen gas.
Eventually, the surface of the PDMS channel with 3D electrodes and ITO glass wasbonded by a plasma process. Figure 2 shows the fabrication process.
Micromachines 2022, 13, x FOR PEER REVIEW 5 of 14
silica particles experienced nDEP. Finally, this device could perform the high-efficiency
sorting of multiple particles through the combination of dielectrophoretic force, inertial
force, and fluid traction during the practical experiments.
2.3. Fabrication of the Microfluidic Chip
The microfluidic chip fabrication process was mainly divided into two parts: one for
the preparation of microchannels and 3D electrodes and another for the preparation of
ITO electrodes. The fabrication of the PDMS channel was mainly based on soft lithogra-
phy [39]. Next, 3D electrodes were prepared. First, PDMS and curing agents in a ratio of
10:1 were fully mixed and their bubbles were removed by the vacuum chamber to form a
PDMS curing agent. Next, the high-purity micron silver powder was mixed with the
PDMS curing agent in a mass ratio of 86:14. After being fully mixed, the Ag-PDMS was
placed in the vacuum chamber to remove bubbles for 1 h. Subsequently, it was applied to
the silicon wafer and smoothened with a spatula. The PDMS (prepolymer: curing agent =
10:1) was poured on this mold at 75 °C for 50 min and then peeled off gently after cooling
with Ag-PDMS. The Ag-PDMS was heated to 150 °C to ensure good electrical conductiv-
ity. A transition electrode was needed to connect the 3D electrode to the external wire,
which was prepared by the wet etching method using ITO glass. The ITO electrode prep-
aration process is similar to the silicon process. After post-baking, the ITO electrode prep-
aration process was similar to the silicon process. After baking, the ITO glass was placed
in the etchant with a solution ratio of 50:50:3 in the order of H2O: HCl: HNO3 at 55 °C for
100 s. Next, the ITO glass was placed in acetone and ultrasonicated for 5 min to remove
the covered positive PR and then placed in ethanol for ultrasonication for 5 min. Subse-
quently, ITO glass was washed with a large amount of deionized water and dried with
nitrogen gas.
Eventually, the surface of the PDMS channel with 3D electrodes and ITO glass was
bonded by a plasma process. Figure 2 shows the fabrication process.
Figure 2. (A) Fabrication process of the microfluidic chip; (B) confocal microscopy image of the 3D
electrodes.
2.4. Sample Preparation and System Setup
The size of some biological cells was close to 5–20 µm. Polystyrene (PS) microspheres
(BaseLine, 2.5 wt%) with diameters of 4 µm and 20 µm and 4 µm silica particles (BaseLine,
4 wt%) were chosen as experimental samples for this test to better simulate real cells. To
prepare the PS solution, 2 mL of 4 µm PS suspension and 1 mL of Tween 20 were made
up to 6 mL with water and ultrasonicated for 5 min. Next, the 20 µm PS microspheres and
4 µm silica microspheres were prepared by the same method. The two suspensions were
mixed in a ratio of 1:1 to produce two sample solutions, which were a mixture of 4 µm
silica microspheres and 20 µm polystyrene particles [40]. Further, a mixture of three par-
ticles, 4 µm silicon microspheres, 4 µm polystyrene particles, and 20 µm polystyrene par-
ticles, was produced in a ratio of 1:0.5:1. Subsequently, phosphate-buffered saline solution
Figure 2. (A) Fabrication process of the microfluidic chip; (B) confocal microscopy image of the3D electrodes.
2.4. Sample Preparation and System Setup
The size of some biological cells was close to 5–20 µm. Polystyrene (PS) microspheres(BaseLine, 2.5 wt%) with diameters of 4 µm and 20 µm and 4 µm silica particles (BaseLine,4 wt%) were chosen as experimental samples for this test to better simulate real cells. Toprepare the PS solution, 2 mL of 4 µm PS suspension and 1 mL of Tween 20 were madeup to 6 mL with water and ultrasonicated for 5 min. Next, the 20 µm PS microspheresand 4 µm silica microspheres were prepared by the same method. The two suspensionswere mixed in a ratio of 1:1 to produce two sample solutions, which were a mixture of4 µm silica microspheres and 20 µm polystyrene particles [40]. Further, a mixture of threeparticles, 4 µm silicon microspheres, 4 µm polystyrene particles, and 20 µm polystyreneparticles, was produced in a ratio of 1:0.5:1. Subsequently, phosphate-buffered salinesolution was added to adjust the conductivity and provide solutions with conductivitiesof 0.1 µS cm−1, 1 µS cm−1, 4 µS cm−1, and 10 µS cm−1. Each type of test was performedat least three times. The particle separation device was mainly composed of a computer,an inverted microscope (Olympus CKX53), a microinjection pump (Harvard, Holliston,MA, USA), and the prepared microfluidic chip. The velocity of the particles was controlledwith a micro-syringe pump and the trajectories of the particles were visualized using theinverted microscope.
Micromachines 2022, 13, 117 6 of 13
3. Results and Discussion3.1. Numerical Simulation Results
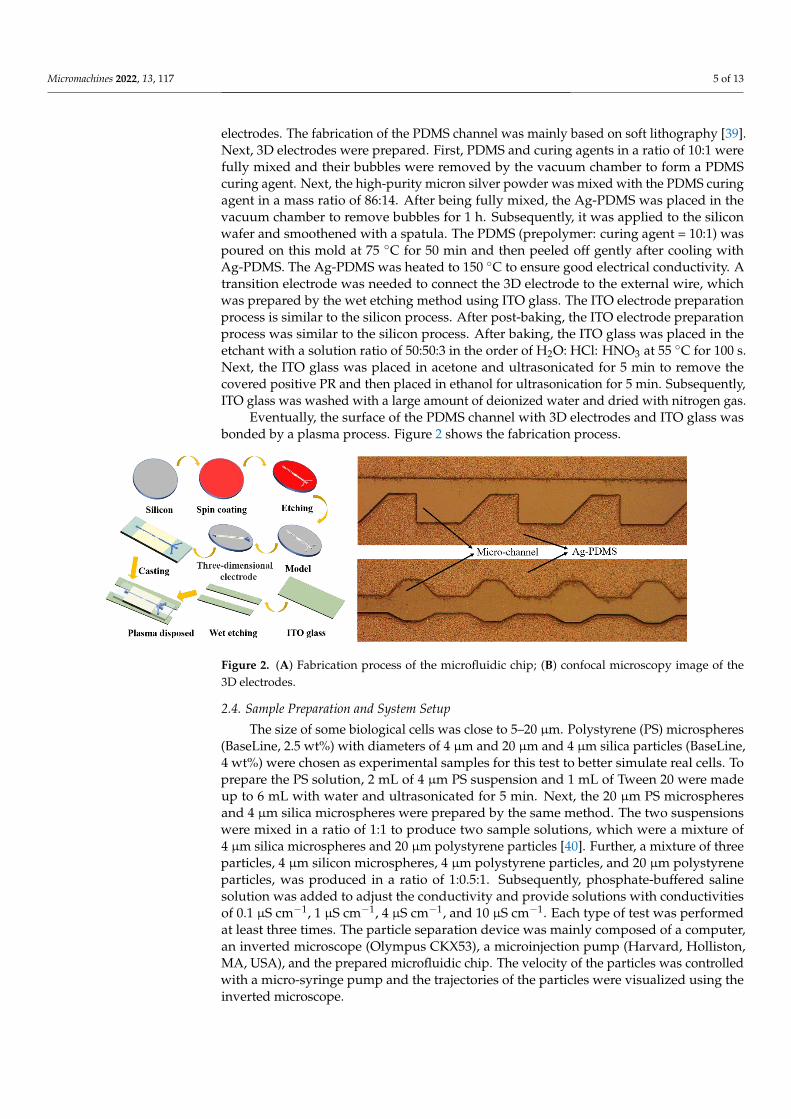
In this study, numerical simulations were performed using the commercial finiteelement software, COMSOL5.4, to obtain the effects of flow velocity distribution, electricfield distribution, and particle motion trajectory distribution. We first used COMSOL toset the inlet phase flow rate as 3 mm/s. The actual flow rate was calculated as 3 µL/minbecause the height of the prepared microfluidic chip was 60 µm.
Figure 3A, B illustrates the distributions of the flow field in different parts, and thearrows indicate the direction of the flow velocity. We found that the change in the flowvelocity in the middle of the microchannel was the largest, especially at the center ofthe contraction channel. The flow rate at the center of the contraction region was abouttwice that of the expansion region. However, the flow rate on both sides of the channelwas close to zero. Therefore, the fluid motion in the width direction of the microchannelwas in a parabolic form, implying that it conformed to the laminar flow. Next, the a–a’cross-section of the central part of the CEA channel was selected to analyze the variationin the flow velocity, as shown in Figure 3D. The velocity of the fluid increased abruptlywhen the fluid flowed from the expansion channel into the contraction channel. Sincethe inertial force and fluid drag force were affected by the particle diameter and fluidflow velocity, the contraction/expansion structure made the flow line bend strongly whenparticles of different sizes entered the trapezoidal channel contraction structure with thefluid. Eventually, different particle sizes could be focused in different positions. Figure 3Cillustrates the distribution of the electric field. COMSOL 5.4 was used to set the boundaryconditions so that one side of the channel featured high potential and the other side featuredlow potential. All the boundaries were selected except one inlet and three outlets due tothe 3D electrodes. Figure 3E shows the electric field distribution of the b–b’ cross-section inthe central part of the selected CEA channel. The electric field was higher in the contractionregion than in the expansion region. When the particles moved through the contractionregion, they were exposed to the area of a relatively high electric field; however, they wereaffected due to the fast flow rate, which made the particles last for a short time at theapplied voltage of 5 V and frequency of 10 kHz.
Micromachines 2022, 13, x FOR PEER REVIEW 7 of 14
Figure 3. (A) Distributions of the flow field in contraction and expansion of the entrance part; (B)
distributions of the flow field in contraction and expansion of the outlet part; (C) distribution of the
electric field; (D) a–a’ cross-section of the central part of the CEA channel; (E) electric field distribu-
tion of b–b’ cross-section.
The trajectory of the particles was affected except by the dielectrophoretic force and
particle size. It also depended on the Clausius–Mossotti (CM) factor value, which varied
with the conductivity and dielectric properties of the particles and dielectric solution, as
well as the frequency of the applied electric field. The CM factor value was calculated and
simulated using the Matrix Laboratory (MATLAB) program to obtain three kinds of par-
ticle at different frequencies and solution conductivities, as shown in Figure 4A–C. Figure
4A shows that when the solution conductivity was 4 µS/cm, the CM factor was zero and
the 4 µm polystyrene spheres were not affected by the dielectrophoretic force; when the
solution conductivity was higher than 4 µS/cm, no matter how the applied frequency
changed, the dielectrophoretic force was negative. If the solution conductivity was smaller
than 4 µS/cm, the particles within 100 kHz were subjected to positive dielectrophoretic
force, and vice versa, by negative dielectrophoretic force. Figure 4B illustrates the varia-
tion with the direction and magnitude of the dielectrophoretic force on the 4 µm silica
spheres when the conductivity of the solution or the frequency of the electric field
changed. Due to the low conductivity of silica, no matter how the conductivity of the so-
lution varied, the particles were subjected to negative DEP force in the nonuniform electric
field. Figure4C shows the CM factor of the 20 µm polystyrene spheres with the change in
solution conductivity and frequency. It was observed that the particles within 20 kHz
were subjected to positive dielectrophoretic forces only at a conductivity of 0.1 µs/cm.
Figure 3. (A) Distributions of the flow field in contraction and expansion of the entrance part;(B) distributions of the flow field in contraction and expansion of the outlet part; (C) distributionof the electric field; (D) a–a’ cross-section of the central part of the CEA channel; (E) electric fielddistribution of b–b’ cross-section.

Micromachines 2022, 13, 117 7 of 13
The trajectory of the particles was affected except by the dielectrophoretic force andparticle size. It also depended on the Clausius–Mossotti (CM) factor value, which variedwith the conductivity and dielectric properties of the particles and dielectric solution, aswell as the frequency of the applied electric field. The CM factor value was calculated andsimulated using the Matrix Laboratory (MATLAB) program to obtain three kinds of particleat different frequencies and solution conductivities, as shown in Figure 4A–C. Figure 4Ashows that when the solution conductivity was 4 µS/cm, the CM factor was zero and the4 µm polystyrene spheres were not affected by the dielectrophoretic force; when the solutionconductivity was higher than 4 µS/cm, no matter how the applied frequency changed,the dielectrophoretic force was negative. If the solution conductivity was smaller than4 µS/cm, the particles within 100 kHz were subjected to positive dielectrophoretic force,and vice versa, by negative dielectrophoretic force. Figure 4B illustrates the variation withthe direction and magnitude of the dielectrophoretic force on the 4 µm silica spheres whenthe conductivity of the solution or the frequency of the electric field changed. Due to the lowconductivity of silica, no matter how the conductivity of the solution varied, the particleswere subjected to negative DEP force in the nonuniform electric field. Figure 4C showsthe CM factor of the 20 µm polystyrene spheres with the change in solution conductivityand frequency. It was observed that the particles within 20 kHz were subjected to positivedielectrophoretic forces only at a conductivity of 0.1 µs/cm.
Micromachines 2022, 13, x FOR PEER REVIEW 8 of 14
Figure 4. (A) CM factor of the 4 µm polystyrene spheres. (B) CM factor of the 4 µm silica particles.
(C) CM factor of the 20 µm polystyrene spheres.
Finally, we concluded that when the conductivity was 0.1 µs/cm, the PS beads with
20 µm and 4 µm particle sizes moved laterally in the direction of high electric field inten-
sity when passing through a non-uniform electric field due to the positive value of CM
factor. The 4 µm silica microspheres were influenced by negative dielectrophoretic force
and moved in the direction of low electric field intensity.
The simulation of the cell trajectory is shown in Figure 5A–C. The ratio of the 20 µm
PS beads, 4 µm PS beads, and 4 µm silica particles was set as 1:1:1. After applying electric
signals with a 5 V voltage and 10 kHz frequency, the 20 µm and 4 µm PS particles flowed
into two bilateral outlets of the microchannel due to the combination of three forces:
pDEP, drag force, and inertial force. The 4 µm silica particles focused in the center of the
channel and finally flowed out of the intermediate outlet. Nevertheless, the simulation
results demonstrated clearly that this structure separate three types of particle.
Figure 5. (A) Particle trajectory simulation of 20 µm polystyrene spheres. (B) Particle trajectory sim-
ulation of 4 µm silica particles. (C) Particle trajectory simulation of 20 µm polystyrene spheres, 4µm
silica particles, and 4 µm polystyrene spheres.
Figure 4. (A) CM factor of the 4 µm polystyrene spheres. (B) CM factor of the 4 µm silica particles.(C) CM factor of the 20 µm polystyrene spheres.
Finally, we concluded that when the conductivity was 0.1 µs/cm, the PS beads with20 µm and 4 µm particle sizes moved laterally in the direction of high electric field intensitywhen passing through a non-uniform electric field due to the positive value of CM factor.The 4 µm silica microspheres were influenced by negative dielectrophoretic force andmoved in the direction of low electric field intensity.
The simulation of the cell trajectory is shown in Figure 5A–C. The ratio of the 20 µmPS beads, 4 µm PS beads, and 4 µm silica particles was set as 1:1:1. After applying electricsignals with a 5 V voltage and 10 kHz frequency, the 20 µm and 4 µm PS particles flowedinto two bilateral outlets of the microchannel due to the combination of three forces: pDEP,drag force, and inertial force. The 4 µm silica particles focused in the center of the channeland finally flowed out of the intermediate outlet. Nevertheless, the simulation resultsdemonstrated clearly that this structure separate three types of particle.
Micromachines 2022, 13, x FOR PEER REVIEW 8 of 14
Figure 4. (A) CM factor of the 4 µm polystyrene spheres. (B) CM factor of the 4 µm silica particles.
(C) CM factor of the 20 µm polystyrene spheres.
Finally, we concluded that when the conductivity was 0.1 µs/cm, the PS beads with
20 µm and 4 µm particle sizes moved laterally in the direction of high electric field inten-
sity when passing through a non-uniform electric field due to the positive value of CM
factor. The 4 µm silica microspheres were influenced by negative dielectrophoretic force
and moved in the direction of low electric field intensity.
The simulation of the cell trajectory is shown in Figure 5A–C. The ratio of the 20 µm
PS beads, 4 µm PS beads, and 4 µm silica particles was set as 1:1:1. After applying electric
signals with a 5 V voltage and 10 kHz frequency, the 20 µm and 4 µm PS particles flowed
into two bilateral outlets of the microchannel due to the combination of three forces:
pDEP, drag force, and inertial force. The 4 µm silica particles focused in the center of the
channel and finally flowed out of the intermediate outlet. Nevertheless, the simulation
results demonstrated clearly that this structure separate three types of particle.
Figure 5. (A) Particle trajectory simulation of 20 µm polystyrene spheres. (B) Particle trajectory sim-
ulation of 4 µm silica particles. (C) Particle trajectory simulation of 20 µm polystyrene spheres, 4µm
silica particles, and 4 µm polystyrene spheres.
Figure 5. Cont.

Micromachines 2022, 13, 117 8 of 13
Micromachines 2022, 13, x FOR PEER REVIEW 8 of 14
Figure 4. (A) CM factor of the 4 µm polystyrene spheres. (B) CM factor of the 4 µm silica particles.
(C) CM factor of the 20 µm polystyrene spheres.
Finally, we concluded that when the conductivity was 0.1 µs/cm, the PS beads with
20 µm and 4 µm particle sizes moved laterally in the direction of high electric field inten-
sity when passing through a non-uniform electric field due to the positive value of CM
factor. The 4 µm silica microspheres were influenced by negative dielectrophoretic force
and moved in the direction of low electric field intensity.
The simulation of the cell trajectory is shown in Figure 5A–C. The ratio of the 20 µm
PS beads, 4 µm PS beads, and 4 µm silica particles was set as 1:1:1. After applying electric
signals with a 5 V voltage and 10 kHz frequency, the 20 µm and 4 µm PS particles flowed
into two bilateral outlets of the microchannel due to the combination of three forces:
pDEP, drag force, and inertial force. The 4 µm silica particles focused in the center of the
channel and finally flowed out of the intermediate outlet. Nevertheless, the simulation
results demonstrated clearly that this structure separate three types of particle.
Figure 5. (A) Particle trajectory simulation of 20 µm polystyrene spheres. (B) Particle trajectory sim-
ulation of 4 µm silica particles. (C) Particle trajectory simulation of 20 µm polystyrene spheres, 4µm
silica particles, and 4 µm polystyrene spheres.
Figure 5. (A) Particle trajectory simulation of 20 µm polystyrene spheres. (B) Particle trajectorysimulation of 4 µm silica particles. (C) Particle trajectory simulation of 20 µm polystyrene spheres, 4µm silica particles, and 4 µm polystyrene spheres.
3.2. Discussion
The separation of particles by size and dielectric properties was tested to verify theperformance of the separation device.
First, a mechanical analysis was performed. As can be seen in Figure 6A, B, whenno electric signal was applied, particles in the microchannel mainly experienced inertialfore FL and drag force FD. According to Equation (4) and the formula of fluid drag forceFdrag = 6πηrv, it can be concluded that FL ∝ a4, FD ∝ a. Thus, as the particle size increased,the growth rate of the inertial force was much higher than that of the fluid drag force.However, at low velocities, both the inertial force and the fluid drag force on the particlefeatured the same order of magnitude on the particles, which resulted in neither force beingdominant. The 4 µm and 20 µm particles moved randomly in the microchannel. Afterapplying the electric signal, both particles were also subjected to DEP force FDEP. Due tothe repeated CEA microchannels, the electric field gradient increased; thus, the DEP forceincreased (according to Equation (1)). Owing to the combination of DEP force, inertial force,and drag force, the physical differences between the 4 µm particles and the 20 µm particleswere amplified. Therefore, superior particle separation can be achieved according to thedifferences in dielectric properties and particle size at low velocities.
Micromachines 2022, 13, x FOR PEER REVIEW 9 of 14
3.2. Discussion
The separation of particles by size and dielectric properties was tested to verify the
performance of the separation device.
First, a mechanical analysis was performed. As can be seen in Figure 6A, B, when no
electric signal was applied, particles in the microchannel mainly experienced inertial fore
𝐹𝐿 and drag force 𝐹𝐷 . According to Equation (4) and the formula of fluid drag force
𝐹𝑑𝑟𝑎𝑔 = 6𝜋𝜂𝑟𝑣 , it can be concluded that 𝐹𝐿 ∝ 𝑎4, 𝐹𝐷 ∝ 𝑎 . Thus, as the particle size in-
creased, the growth rate of the inertial force was much higher than that of the fluid drag
force. However, at low velocities, both the inertial force and the fluid drag force on the
particle featured the same order of magnitude on the particles, which resulted in neither
force being dominant. The 4 µm and 20 µm particles moved randomly in the microchan-
nel. After applying the electric signal, both particles were also subjected to DEP force
𝐹𝐷𝐸𝑃. Due to the repeated CEA microchannels, the electric field gradient increased; thus,
the DEP force increased (according to Equation (1)). Owing to the combination of DEP
force, inertial force, and drag force, the physical differences between the 4 µm particles
and the 20 µm particles were amplified. Therefore, superior particle separation can be
achieved according to the differences in dielectric properties and particle size at low ve-
locities.
Next, the performance was tested under low flow rate conditions with particles of 4
µm and 20 µm PS spheres suspended in a mixture with a solution conductivity of 4 µS/cm,
without and with voltage applied for particle separation. When the particle velocity in-
creased, the time required for the particles to pass through the main channel decreased,
and the DEP action time decreased. Consequently, when loading the 3D electrode, the
particle flow rate should not be high. Therefore, the particle flow rates to test the particle
sorting effect in both the case of no AC voltage and of loaded voltage were 3 and 14
µL/min. When no AC voltage was applied to the electrodes, the particles showed a ran-
dom motion in the channel at a flow rate of 3 µL/min. When the flow rate increased to 14
µL/min, the sorting effect of the two particles was not obvious, although the particles were
subjected to inertial force under the action of the CEA channel.
When a voltage of 5 V was loaded onto the electrodes, a three-dimensional, non-uni-
form electric field was generated in the main channel. At this point, the particles could be
subjected to dielectrophoretic forces at different channel heights. The performance of the
device was tested for particle sorting under pDEP and nDEP. When the particle velocity
was 3 µL/min, voltages of 5 V and −5 V at 10 kHz were applied to the 3D electrodes on the
two side walls. Figure 7A–E shows the experimentally observed images at different flow
velocities. When the mixed particles in the medium entered the main channel through the
inlet, the particles were focused after passing through the trapezoidal-shaped constricted
and expanded channel under the combined effect of inertial and dielectrophoretic forces.
The 4 µm particles experiencing pDEP in the suspended medium were deflected in the
direction of the upper and lower electrodes and then flowed out from outlet 1 and outlet
3. Meanwhile, the 20 µm particles experiencing nDEP flowed out from outlet 2.
Figure 6. (A) The mechanical analysis when no signal was added (inertial sorting); (B) the mechan-
ical analysis when the signal was applied (coupled with inertial force and DEP force).
Figure 6. (A) The mechanical analysis when no signal was added (inertial sorting); (B) the mechanicalanalysis when the signal was applied (coupled with inertial force and DEP force).
Next, the performance was tested under low flow rate conditions with particles of4 µm and 20 µm PS spheres suspended in a mixture with a solution conductivity of 4 µS/cm,without and with voltage applied for particle separation. When the particle velocityincreased, the time required for the particles to pass through the main channel decreased,and the DEP action time decreased. Consequently, when loading the 3D electrode, theparticle flow rate should not be high. Therefore, the particle flow rates to test the particlesorting effect in both the case of no AC voltage and of loaded voltage were 3 and 14 µL/min.When no AC voltage was applied to the electrodes, the particles showed a random motionin the channel at a flow rate of 3 µL/min. When the flow rate increased to 14 µL/min, the

Micromachines 2022, 13, 117 9 of 13
sorting effect of the two particles was not obvious, although the particles were subjected toinertial force under the action of the CEA channel.
When a voltage of 5 V was loaded onto the electrodes, a three-dimensional, non-uniform electric field was generated in the main channel. At this point, the particles couldbe subjected to dielectrophoretic forces at different channel heights. The performance ofthe device was tested for particle sorting under pDEP and nDEP. When the particle velocitywas 3 µL/min, voltages of 5 V and −5 V at 10 kHz were applied to the 3D electrodes on thetwo side walls. Figure 7A–E shows the experimentally observed images at different flowvelocities. When the mixed particles in the medium entered the main channel through theinlet, the particles were focused after passing through the trapezoidal-shaped constrictedand expanded channel under the combined effect of inertial and dielectrophoretic forces.The 4 µm particles experiencing pDEP in the suspended medium were deflected in thedirection of the upper and lower electrodes and then flowed out from outlet 1 and outlet 3.Meanwhile, the 20 µm particles experiencing nDEP flowed out from outlet 2.
Micromachines 2022, 13, x FOR PEER REVIEW 10 of 14
Figure 7. (A) Particle trajectory near the inlet at 3 µL/min without signal applied. (B) Particle trajec-
tory near the outlet at 3 µL/min without signal applied. (C) Particle trajectory at 3 µL/min with 5 V
signal applied. (D) Particle trajectory at 14 µL/min without signal applied; (E) Particle trajectory at
14 µL/min with 5 V signal applied.
Figure 8A, B shows the separation efficiency with different solution conductivities
and flow rates, respectively, at outlet l. With a conductivity of 1 µS cm−1, the separation
efficiency was 98%. However, when the conductivity was dramatically increased to 4 µS
cm−1, the separation efficiency decreased. The CM factor of the 4 µm PS particles was zero.
The fraction of the 4 µm PS particles flowed into outlet 2, which led to a decrease in the
number of 20 µm PS particles. When the solution conductivity was 10 µS cm−1, both the
particles were subjected to the nDEP force. Hence, the 20 µm PS particles that flowed into
outlet 2 were extremely low. The selected conductivity should be higher than 1 µS cm−1.
When the flow rates changed from 3 µL min−1 to 50 µL min−1, the separation efficiency
change was not very obvious. When the flow rate was 14 µ L min−1, both the separation
efficiency (98.2%) and the sorting throughput were very high. Figure 8C, D indicates the
separation efficiency of outlet 1 and outlet 2. When the solution conductivity changed
from 3 µL min−1 to 10 µL min−1, the separation efficiency also decreased due to the influ-
ence of the solution conductivity on the CM factor. When the flow rates were 3 µL min−1
and 14µL min−1, the separation efficiency and the sorting throughput were also very high.
Figure 7. (A) Particle trajectory near the inlet at 3 µL/min without signal applied. (B) Particletrajectory near the outlet at 3 µL/min without signal applied. (C) Particle trajectory at 3 µL/min with5 V signal applied. (D) Particle trajectory at 14 µL/min without signal applied; (E) Particle trajectoryat 14 µL/min with 5 V signal applied.
Figure 8A, B shows the separation efficiency with different solution conductivities andflow rates, respectively, at outlet l. With a conductivity of 1 µS cm−1, the separation effi-ciency was 98%. However, when the conductivity was dramatically increased to 4 µS cm−1,the separation efficiency decreased. The CM factor of the 4 µm PS particles was zero.The fraction of the 4 µm PS particles flowed into outlet 2, which led to a decrease in thenumber of 20 µm PS particles. When the solution conductivity was 10 µS cm−1, both theparticles were subjected to the nDEP force. Hence, the 20 µm PS particles that flowed intooutlet 2 were extremely low. The selected conductivity should be higher than 1 µS cm−1.When the flow rates changed from 3 µL min−1 to 50 µL min−1, the separation efficiencychange was not very obvious. When the flow rate was 14 µL min−1, both the separationefficiency (98.2%) and the sorting throughput were very high. Figure 8C, D indicates theseparation efficiency of outlet 1 and outlet 2. When the solution conductivity changed from3 µL min−1 to 10 µL min−1, the separation efficiency also decreased due to the influenceof the solution conductivity on the CM factor. When the flow rates were 3 µL min−1 and14µL min−1, the separation efficiency and the sorting throughput were also very high.

Micromachines 2022, 13, 117 10 of 13Micromachines 2022, 13, x FOR PEER REVIEW 11 of 14
Figure 8. Statistics of separating efficiency under the parameters of different solution conductivities
and flow rates. (A,B) Middle channel; (C,D) branch channels.
Figure 9A, B shows the sorting efficiency with inertial force only and a combination
of DEP force and inertial force when the flow rates changed from 3 µL min−1 to 50 µL min−1
at outlet 2. When no electric signal was applied, the sorting efficiency was relatively low.
Figure 9. (A) The separation efficiency with pure inertial force. (B) The separation efficiency with
combination of DEP force and inertial force.
At a solution conductivity of 0.1 µS/cm, three particles (4 µm and 20 µm PS spheres
and 4 µm silicon dioxide microspheres) were suspended in the medium and moved ran-
domly into the main channel. At this time, both 4 µm and 20 µm polystyrene spheres were
subjected to pDEP; the radius of the 20 µm particles was four times that of the 4 µm par-
ticles. Thus, under the joint action of the DEP force, inertial force, and drag force, the 20
µm particles were subjected to a much larger force than the 4 µm particles. Therefore, the
20 µm particles were deflected towards exit 1, and the 4 µm particles were deflected to
exit 3; the 4 µm silica particles were deflected to exit 2 due to the nDEP’s action.
Figure 8. Statistics of separating efficiency under the parameters of different solution conductivitiesand flow rates. (A,B) Middle channel; (C,D) branch channels.
Figure 9A, B shows the sorting efficiency with inertial force only and a combination ofDEP force and inertial force when the flow rates changed from 3 µL min−1 to 50 µL min−1
at outlet 2. When no electric signal was applied, the sorting efficiency was relatively low.
Micromachines 2022, 13, x FOR PEER REVIEW 11 of 14
Figure 8. Statistics of separating efficiency under the parameters of different solution conductivities
and flow rates. (A,B) Middle channel; (C,D) branch channels.
Figure 9A, B shows the sorting efficiency with inertial force only and a combination
of DEP force and inertial force when the flow rates changed from 3 µL min−1 to 50 µL min−1
at outlet 2. When no electric signal was applied, the sorting efficiency was relatively low.
Figure 9. (A) The separation efficiency with pure inertial force. (B) The separation efficiency with
combination of DEP force and inertial force.
At a solution conductivity of 0.1 µS/cm, three particles (4 µm and 20 µm PS spheres
and 4 µm silicon dioxide microspheres) were suspended in the medium and moved ran-
domly into the main channel. At this time, both 4 µm and 20 µm polystyrene spheres were
subjected to pDEP; the radius of the 20 µm particles was four times that of the 4 µm par-
ticles. Thus, under the joint action of the DEP force, inertial force, and drag force, the 20
µm particles were subjected to a much larger force than the 4 µm particles. Therefore, the
20 µm particles were deflected towards exit 1, and the 4 µm particles were deflected to
exit 3; the 4 µm silica particles were deflected to exit 2 due to the nDEP’s action.
Figure 9. (A) The separation efficiency with pure inertial force. (B) The separation efficiency withcombination of DEP force and inertial force.
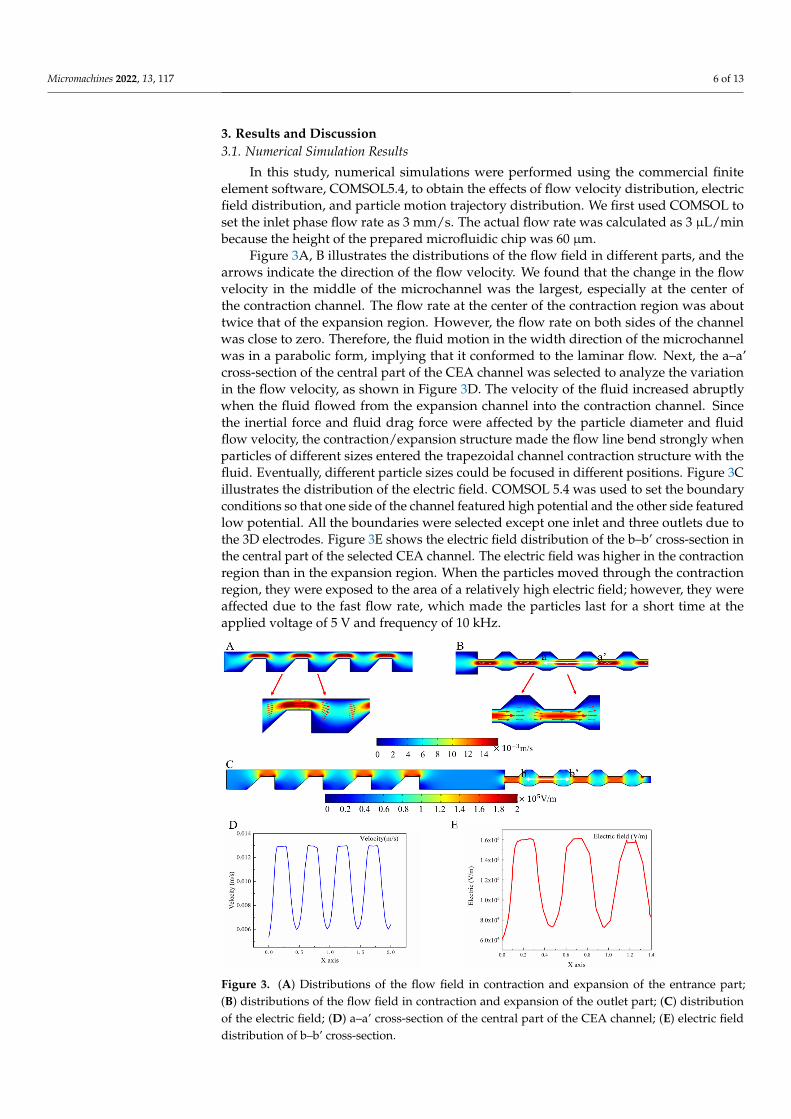
At a solution conductivity of 0.1 µS/cm, three particles (4 µm and 20 µm PS spheresand 4 µm silicon dioxide microspheres) were suspended in the medium and moved ran-domly into the main channel. At this time, both 4 µm and 20 µm polystyrene sphereswere subjected to pDEP; the radius of the 20 µm particles was four times that of the 4 µmparticles. Thus, under the joint action of the DEP force, inertial force, and drag force,the 20 µm particles were subjected to a much larger force than the 4 µm particles. Therefore,the 20 µm particles were deflected towards exit 1, and the 4 µm particles were deflected toexit 3; the 4 µm silica particles were deflected to exit 2 due to the nDEP’s action. Supportingvideo can be found in the Supplementary Information (Video S1). Figure 10A–C shows the
Micromachines 2022, 13, 117 11 of 13
separation process of the three kinds of particles. The sorting efficiency for the 4, 20, and4 µm particles was more than 90%.
Micromachines 2022, 13, x FOR PEER REVIEW 12 of 14
Supporting video can be found in the Supplementary Information (Video S1). Figure 10A–
C shows the separation process of the three kinds of particles. The sorting efficiency for
the 4, 20, and 4 µm particles was more than 90%.
Figure 10. (A–C) Continuous separation of three kinds of particles in the middle channel.
4. Conclusions
In this study, a new micro-device using 3D electrodes and contraction expansion
channels achieved particle separation. The use of 3D electrodes increased the non-homo-
geneity of the electric field more compared with the traditional flat electrodes; hence, the
particles were subjected to dielectrophoretic forces at different heights. Besides the inertial
force generated by the contraction and expansion of the channel, particle sorting was
mainly dependent on the regulation of the conductivity of the solution and the frequency
of the electric field loaded on the 3D electrode to achieve efficient sorting. The particle
flow velocity distribution, electric field distribution, and particle motion trajectory were
obtained through a COMSOL software simulation. The particle sorting experiments were
first conducted for 4 µm and 20 µm PS spheres. When the solution conductivity was 1
µS/cm, the 4 µm PS spheres were subjected to pDEP and the particles were deflected in
the direction of the upper and lower electrodes and exited from outlet 1 and outlet 3.
Meanwhile, the 20 µm particles that experienced nDEP exited from outlet 2. In addition,
the mixture experiments of the three particles were successfully performed using different
principles for the sorting of the three particles. The experimental results showed that the
device could perform the high-precision sorting of particles. Based on the work and anal-
ysis, we believe that the proposed method can be used in medical detection and drug
screening and promote the development of highly integrated chip systems. Furthermore,
we also hope this device can be applied to CTC separation in clinical applications.
Supplementary Materials: The supplementary material is available online at
www.mdpi.com/xxx/s1.
Author Contributions: Conceptualization, J.W. and Z.Q.; methodology, X.L.; software, M.J.; valida-
tion, J.D. and B.Z.; formal analysis, X.L.; writing—original draft preparation, X.L.; writing—review
and editing, J.D.; project administration, B.Z. All authors have read and agreed to the published
version of the manuscript.”
Funding: The National Natural Science Foundation of China under Grant (52175555)”; “The Shanxi
key research and development project (international cooperation) (No. 201803D421043)”; “The In-
novation community under Grant 51821003”; “General Fund project of Shanxi Province (No.
20210302123074).
Acknowledgments: The authors sincerely thank the Key Laboratory of Instrumentation Science and
Dynamic Measurement (North University of China), the Ministry of Education, the North Univer-
sity of China for their equipment support.
Figure 10. (A–C) Continuous separation of three kinds of particles in the middle channel.
4. Conclusions
In this study, a new micro-device using 3D electrodes and contraction expansion chan-nels achieved particle separation. The use of 3D electrodes increased the non-homogeneityof the electric field more compared with the traditional flat electrodes; hence, the particleswere subjected to dielectrophoretic forces at different heights. Besides the inertial forcegenerated by the contraction and expansion of the channel, particle sorting was mainlydependent on the regulation of the conductivity of the solution and the frequency of theelectric field loaded on the 3D electrode to achieve efficient sorting. The particle flow ve-locity distribution, electric field distribution, and particle motion trajectory were obtainedthrough a COMSOL software simulation. The particle sorting experiments were first con-ducted for 4 µm and 20 µm PS spheres. When the solution conductivity was 1 µS/cm, the4 µm PS spheres were subjected to pDEP and the particles were deflected in the direction ofthe upper and lower electrodes and exited from outlet 1 and outlet 3. Meanwhile, the 20 µmparticles that experienced nDEP exited from outlet 2. In addition, the mixture experimentsof the three particles were successfully performed using different principles for the sortingof the three particles. The experimental results showed that the device could perform thehigh-precision sorting of particles. Based on the work and analysis, we believe that theproposed method can be used in medical detection and drug screening and promote thedevelopment of highly integrated chip systems. Furthermore, we also hope this device canbe applied to CTC separation in clinical applications.
Supplementary Materials: The following supporting information can be downloaded at: https://www.mdpi.com/article/10.3390/mi13010117/s1.
Author Contributions: Conceptualization, J.W. and Z.Q.; methodology, X.L.; software, M.J.; valida-tion, J.D. and B.Z.; formal analysis, X.L.; writing—original draft preparation, X.L.; writing—reviewand editing, J.D.; project administration, B.Z. All authors have read and agreed to the publishedversion of the manuscript.”
Funding: The National Natural Science Foundation of China under Grant (52175555)”; “The Shanxikey research and development project (international cooperation) (No. 201803D421043)”; “The Inno-vation community under Grant 51821003”; “General Fund project of Shanxi Province(No. 20210302123074).
Acknowledgments: The authors sincerely thank the Key Laboratory of Instrumentation Science andDynamic Measurement (North University of China), the Ministry of Education, the North Universityof China for their equipment support.
Conflicts of Interest: The authors declare no conflict of interest.

Micromachines 2022, 13, 117 12 of 13
References1. Whitesides, G.M. The origins and the future of microfluidics. Nature 2006, 442, 368–373. [CrossRef]2. Sun, L.J.; Yang, W.U.; Cai, S.X.; Chen, Y.B.; Chu, H.H.; Yu, H.B.; Wang, Y.C.; Liu, L.Q. Recent advances in microfluidic technologies
for separation of biological cells. Biomed. Microdevices 2020, 22, 16. [CrossRef]3. Wang, H.; Zhou, C.X.; Sun, X.L.; Jian, Y.N.; Kong, Q.K.; Cui, K.; Ge, S.G.; Yu, J.H. Polyhedral-AuPd nanoparticles-based dual-
mode cytosensor with turn on enable signal for highly sensitive cell evalution on lab-on-paper device. Biosens. Bioelectron. 2018,117, 651–658. [CrossRef]
4. Lu, J.; Pang, J.S.; Chen, Y.; Dong, Q.; Sheng, J.H.; Luo, Y.; Lu, Y.; Lin, B.C.; Liu, T.J. Application of Microfluidic Chips in Separationand Analysis of Extracellular Vesicles in Liquid Biopsy for Cancer. Micromachines 2019, 10, 23. [CrossRef]
5. Sivaramakrishnan, M.; Kothandan, R.; Govindarajan, D.K.; Meganathan, Y.; Kandaswamy, K. Active microfluidic systems for cellsorting and separation. Curr. Opin. Biomed. Eng. 2020, 13, 60–68. [CrossRef]
6. Lin, L.L.; Pho, H.Q.; Zong, L.; Li, S.R.; Pourali, N.; Rebrov, E.; Tran, N.N.; Ostrikov, K.; Hessel, V. Microfluidic plasmas: Noveltechnique for chemistry and chemical engineering. Chem. Eng. J. 2021, 417, 16. [CrossRef]
7. Warkiani, M.E.; Tay, A.K.P.; Guan, G.F.; Han, J. Membrane-less microfiltration using inertial microfluidics. Sci. Rep. 2015, 5, 10.[CrossRef]
8. Beech, J.P.; Tegenfeldt, J.O. Tuneable separation in elastomeric microfluidics devices. Lab Chip 2008, 8, 657–659. [CrossRef][PubMed]
9. Choi, S. Hydrophoresis—A Microfluidic Principle for Directed Particle Migration in Flow. Biochip J. 2020, 14, 72–83. [CrossRef]10. Yan, S.; Zhang, J.; Yuan, D.; Zhao, Q.; Ma, J.; Li, W.H. High-throughput, sheathless, magnetophoretic separation of magnetic and
non-magnetic particles with a groove-based channel. Appl. Phys. Lett. 2016, 109, 5. [CrossRef]11. Xu, J.J.; Lei, Z.J.; Guo, J.K.; Huang, J.; Wang, W.; Reibetanz, U.; Xu, S.Y. Trapping and Driving Individual Charged Micro-particles
in Fluid with an Electrostatic Device. Nano-Micro Lett. 2016, 8, 270–281. [CrossRef]12. Luo, T.; Fan, L.; Zeng, Y.; Liu, Y.; Chen, S.; Tan, Q.; Lam, R.H.W.; Sun, D. A simplified sheathless cell separation approach
using combined gravitational-sedimentation-based prefocusing and dielectrophoretic separation. Lab Chip 2018, 18, 1521–1532.[CrossRef]
13. Ahmed, H.; Destgeer, G.; Park, J.; Afzal, M.; Sung, H.J. Sheathless Focusing and Separation of Microparticles Using Tilted-AngleTraveling Surface Acoustic Waves. Anal. Chem. 2018, 90, 8546–8552. [CrossRef]
14. Adams, T.N.G.; Jiang, A.Y.L.; Vyas, P.D.; Flanagan, L.A. Separation of neural stem cells by whole cell membrane capacitanceusing dielectrophoresis. Methods 2018, 133, 91–103. [CrossRef] [PubMed]
15. Yasukawa, T.; Yamada, J.; Shiku, H.; Matsue, T.; Suzuki, M. Microfluidic Separation of Blood Cells Based on the NegativeDielectrophoresis Operated by Three Dimensional Microband Electrodes. Micromachines 2020, 11, 833. [CrossRef] [PubMed]
16. Jiang, A.Y.L.; Yale, A.R.; Aghaamoo, M.; Lee, D.H.; Lee, A.P.; Adams, T.N.G.; Flanagan, L.A. High-throughput continuousdielectrophoretic separation of neural stem cells. Biomicrofluidics 2019, 13, 064111. [CrossRef] [PubMed]
17. Yao, J.; Chen, J.; Cao, X.; Dong, H. Combining 3D sidewall electrodes and contraction/expansion microstructures in microchippromotes isolation of cancer cells from red blood cells. Talanta 2019, 196, 546–555. [CrossRef]
18. Jia, Y.; Ren, Y.; Jiang, H. Continuous dielectrophoretic particle separation using a microfluidic device with 3D electrodes andvaulted obstacles. Electrophoresis 2015, 36, 1744–1753. [CrossRef]
19. Fu, X.T.; Mavrogiannis, N.; Ibo, M.; Crivellari, F.; Gagnon, Z.R. Microfluidic free-flow zone electrophoresis and isotachophoresisusing carbon black nano-composite PDMS sidewall membranes. Electrophoresis 2017, 38, 327–334. [CrossRef]
20. Yan, S.; Zhang, J.; Yuan, Y.; Lovrecz, G.; Alici, G.; Du, H.; Zhu, Y.; Li, W. A hybrid dielectrophoretic and hydrophoretic microchipfor particle sorting using integrated prefocusing and sorting steps. Electrophoresis 2015, 36, 284–291. [CrossRef] [PubMed]
21. Kim, G.Y.; Han, J.I.; Park, J.K. Inertial Microfluidics-Based Cell Sorting. Biochip J. 2018, 12, 257–267. [CrossRef]22. Liu, C.; Hu, G.Q.; Jiang, X.Y.; Sun, J.S. Inertial focusing of spherical particles in rectangular microchannels over a wide range of
Reynolds numbers. Lab Chip 2015, 15, 1168–1177. [CrossRef]23. Gou, Y.X.; Zhang, S.; Sun, C.K.; Wang, P.; You, Z.; Yalikun, Y.; Tanaka, Y.; Ren, D.H. Sheathless Inertial Focusing Chip Combining
a Spiral Channel with Periodic Expansion Structures for Efficient and Stable Particle Sorting. Anal. Chem. 2020, 92, 1833–1841.[CrossRef]
24. Kim, G.Y.; Son, J.; Han, J.I.; Park, J.K. Inertial Microfluidics-Based Separation of Microalgae Using a Contraction-Expansion ArrayMicrochannel. Micromachines 2021, 12, 9. [CrossRef] [PubMed]
25. Nikdoost, A.; Rezai, P. Dean flow velocity of viscoelastic fluids in curved microchannels. Aip Adv. 2020, 10, 6. [CrossRef]26. Chen, Z.; Jiang, K.; Zou, Z.; Luo, X.; Lim, C.T.; Wen, C. High-throughput and label-free isolation of senescent murine mesenchymal
stem cells. Biomicrofluidics 2020, 14, 034106. [CrossRef]27. Lee, M.G.; Shin, J.H.; Choi, S.; Park, J.K. Enhanced blood plasma separation by modulation of inertial lift force. Sens. Actuator
B-Chem. 2014, 190, 311–317. [CrossRef]28. Zhao, Q.B.; Yuan, D.; Zhang, J.; Li, W.H. A Review of Secondary Flow in Inertial Microfluidics. Micromachines 2020, 11, 23.
[CrossRef] [PubMed]29. Xie, C.; Chen, B.; Wu, J. Three-Dimensional Interaction of a Large Number of Dense DEP Particles on a Plane Perpendicular to an
AC Electrical Field. Micromachines 2017, 8, 26. [CrossRef]
Micromachines 2022, 13, 117 13 of 13
30. Sun, M.; Agarwal, P.; Zhao, S.; Zhao, Y.; Lu, X.; He, X. Continuous On-Chip Cell Separation Based on Conductivity-InducedDielectrophoresis with 3D Self-Assembled Ionic Liquid Electrodes. Anal Chem 2016, 88, 8264–8271. [CrossRef] [PubMed]
31. Chu, H.; Doh, I.; Cho, Y.H. A three-dimensional (3D) particle focusing channel using the positive dielectrophoresis (pDEP) guidedby a dielectric structure between two planar electrodes. Lab Chip 2009, 9, 686–691. [CrossRef]
32. Chen, D.F.; Du, H. Simulation studies on electrothermal fluid flow induced in a dielectrophoretic microelectrode system. J.Micromech. Microeng. 2006, 16, 2411–2419. [CrossRef]
33. Li, M.; Li, S.; Li, W.; Wen, W.; Alici, G. Continuous manipulation and separation of particles using combined obstacle- andcurvature-induced direct current dielectrophoresis. Electrophoresis 2013, 34, 952–960. [CrossRef]
34. Ermolina, I.; Morgan, H. The electrokinetic properties of latex particles: Comparison of electrophoresis and dielectrophoresis. JColloid Interface Sci 2005, 285, 419–428. [CrossRef] [PubMed]
35. Yuan, D.; Zhang, J.; Sluyter, R.; Zhao, Q.B.; Yan, S.; Alici, G.; Li, W.H. Continuous plasma extraction under viscoelastic fluid in astraight channel with asymmetrical expansion-contraction cavity arrays. Lab Chip 2016, 16, 3919–3928. [CrossRef] [PubMed]
36. Ozbey, A.; Karimzadehkhouei, M.; Kocaturk, N.M.; Bilir, S.E.; Kutlu, O.; Gozuacik, D.; Kosar, A. Inertial focusing of cancer celllines in curvilinear microchannels. Micro Nano Eng. 2019, 2, 53–63. [CrossRef]
37. Hu, X.; Lin, J.; Chen, D.; Ku, X. Influence of non-Newtonian power law rheology on inertial migration of particles in channel flow.Biomicrofluidics 2020, 14, 014105. [CrossRef]
38. Di Carlo, D. Inertial microfluidics. Lab A Chip 2009, 9, 3038–3046. [CrossRef]39. Zhang, H.Q.; Chang, H.L.; Neuzil, P. DEP-on-a-Chip: Dielectrophoresis Applied to Microfluidic Platforms. Micromachines 2019,
10, 423. [CrossRef]40. Chen, X.; Ren, Y.; Liu, W.; Feng, X.; Jia, Y.; Tao, Y.; Jiang, H. A Simplified Microfluidic Device for Particle Separation with Two
Consecutive Steps: Induced Charge Electro-osmotic Prefocusing and Dielectrophoretic Separation. Anal Chem 2017, 89, 9583–9592.[CrossRef] [PubMed]