Large-scale forcing of summertime monsoon surges over the Gulf of California and the southwestern...
13
JOURNAL OF GEOPHYSICAL RESEARCH, VOL. 105, NO. D19, PAGES 24,455-24,467, OCTOBER 16, 2000 Large-scale forcing of summertime monsoon surges over the Gulf of California and the southwestern United States Bruce T. Anderson University of Hawaii at Manoa, Honolulu JohnO. Roads and Shyh-Chin Chen Scripps Institution of Oceanography, La Jolla, California Abstract.Synoptic forcing of theGulf of California summertime low-level windfield is described using a nested regional modeling system. Underappropriate synoptic conditions, strong surge events develop thatarecharacterized by persistent, vertically extensive (1-2 km) southerly flow extending along theentire Gulf of California and intoArizona, California, and evensouthern Nevada. These surge periods are initiated either by tropical-cyclone activityto the south of BajaCalifornia or by thewestward propagation of lowertropospheric troughs from over the SierraMadre Occidental to the eastern Pacific. The flow over the Gulf is primarily geostrophic and is associated withthepresence of these low-pressure centers to thesouth and westof Baja California. 1. Introduction The North Americanmonsoon system is associated with large seasonal changes in wind and moisture patterns over muchof the western and southern United States and northern Mexico. Over the western portion of this region, the onset of the monsoon, sometimes also referred to as the Southwest or Mexican monsoon, is characterized by dramatic increases in monthly precipitation. During July, August, and September, northwestern Mexico receives approximately 80% of its annual rainfall. Nearly half of Arizona's precipitation is also received duringthis time [Carleton et al., 1990' Stensrud et al., 1995]. Most of this precipitation is produced by nonfrontal mesoscale convective complexes, althoughsignificantepisodicprecipitationcan also result from land-falling tropical cyclones[Barlow et al., 1998; Adams and Corntie, 1997]. During this same time period, lower atmospheric wind patterns over the Gulf of California and the southwestern United States shift from wintertimenorthwesterlies to southerly or even southeasterlies [Badan-Dangon et al., 1991' Douglaset al., 1993' Douglas, 1995]. A driving interest for this research is the hypothesized relationship betweenthe synoptic-and local-scale wind fields and the active summertime hydrologic cycle over this region. It has been suggested that much of the moisture for summertime precipitation in northwestern Mexico and southwestern United States (and possibly even southern California [Tubbs,1972]) is advected from the eastern tropical Pacific during strong surge events [Hales, 1974; Stensrud et al., !997], although, as pointedout by Adamsand Comrie[1997]. the correlation between surge events and precipitation has been assumed but not explicitlyverified. Recent research suggests that wet and dry periods in Arizona have a timescaleof 2-4 days, similar to the synoptic timescale associated with these surge events, although the dominant statisticalmode of intraseasonal Copyright 2000 by the American Geophysical Union. Paper number 2000JD900337. 0148-0227/00/2000JD9000337509.00 variability in summertime precipitation hasa much longer period of 12-18 days [Mullen et al., 1998]. Before examining the interactions betweenthe dynamic and hydrodynamic fields, it is of use to first isolatethe important forcing mechanisms associated with the low-level winds in this region. Previously, Anderson et al. [2000] used a regional modeling system to characterize the diurnal and synoptic variability of the summertime low-level flow over the Gulf of California and southwestern United States. The regional modeling system was then used to investigate thediurnal forcing of the simulated wind fields and the dynamics leadingto the formation of nocturnal low-level jets over the northernGulf and the foothills of the Sierra Madre Occidental (B. T. Andersonet al., Model dynamics of summertime low-level jets over northwestern Mexico, submitted to Journal of Geophysical Research, 2000). Here we use the same regional modeling system to examine the larger-scale synoptic conditions associated with surge events. It has been hypothesized that surge events maybe initiated by convective activityassociated with low-pressure systems overthe southern Gulf and the equatorial eastern Pacific; this convective activity is thought to produce low-leveloutflow thatpropagates as a density current up the Gulf and into northwestern Mexico and the southwestern United States[Hales, 1974;Stensrud et al., 1997]. Mesoscale convective systems over northwestern Mexico and the Gulf of Californiaare also associated with surge-type winds, strengthening the hypothesis that low-level outflow is the initiator of surge events[Farfan and Zehnder,1994]. T,ot,,,.,•a t,..... a ,t,,,• surge-type wind reversals also occur off 11, 311UUl•..l tJk.., 11Ut, k..,•..l the coast of California. These wind reversals, which are even more dramatic than those found over the Gulf (owing to the strongnortherly summertime winds that usually exist in the eastern Pacific), can have windshifts of up 10-20m s -1 over the course of a few hours and temperature drops of 10 K [Mass and Albright, 1987]. They are alsoaccompanied by dramatic stratus tongues, whichmaketheir small-scale features readily visibleon satellite images [Dorman, 1985' Dorman, 1987; Mass and Albright, 1987]. These winds tend to be confined to very low levels(below900 mbar). Hypotheses concerning theirformation 24,455
-
Upload
independent -
Category
Documents
-
view
0 -
download
0
Transcript of Large-scale forcing of summertime monsoon surges over the Gulf of California and the southwestern...

JOURNAL OF GEOPHYSICAL RESEARCH, VOL. 105, NO. D19, PAGES 24,455-24,467, OCTOBER 16, 2000
Large-scale forcing of summertime monsoon surges over the Gulf of California and the southwestern United States
Bruce T. Anderson
University of Hawaii at Manoa, Honolulu
John O. Roads and Shyh-Chin Chen Scripps Institution of Oceanography, La Jolla, California
Abstract. Synoptic forcing of the Gulf of California summertime low-level wind field is described using a nested regional modeling system. Under appropriate synoptic conditions, strong surge events develop that are characterized by persistent, vertically extensive (1-2 km) southerly flow extending along the entire Gulf of California and into Arizona, California, and even southern Nevada. These surge periods are initiated either by tropical-cyclone activity to the south of Baja California or by the westward propagation of lower tropospheric troughs from over the Sierra Madre Occidental to the eastern Pacific. The flow over the Gulf is primarily geostrophic and is associated with the presence of these low-pressure centers to the south and west of Baja California.
1. Introduction
The North American monsoon system is associated with large seasonal changes in wind and moisture patterns over much of the western and southern United States and northern Mexico. Over
the western portion of this region, the onset of the monsoon, sometimes also referred to as the Southwest or Mexican
monsoon, is characterized by dramatic increases in monthly precipitation. During July, August, and September, northwestern Mexico receives approximately 80% of its annual rainfall. Nearly half of Arizona's precipitation is also received during this time [Carleton et al., 1990' Stensrud et al., 1995]. Most of this precipitation is produced by nonfrontal mesoscale convective complexes, although significant episodic precipitation can also result from land-falling tropical cyclones [Barlow et al., 1998; Adams and Corntie, 1997].
During this same time period, lower atmospheric wind patterns over the Gulf of California and the southwestern United States shift from wintertime northwesterlies to southerly or even southeasterlies [Badan-Dangon et al., 1991' Douglas et al., 1993' Douglas, 1995]. A driving interest for this research is the hypothesized relationship between the synoptic- and local-scale wind fields and the active summertime hydrologic cycle over this region. It has been suggested that much of the moisture for summertime precipitation in northwestern Mexico and southwestern United States (and possibly even southern California [Tubbs, 1972]) is advected from the eastern tropical Pacific during strong surge events [Hales, 1974; Stensrud et al., !997], although, as pointed out by Adams and Comrie[1997]. the correlation between surge events and precipitation has been assumed but not explicitly verified. Recent research suggests that wet and dry periods in Arizona have a timescale of 2-4 days, similar to the synoptic timescale associated with these surge events, although the dominant statistical mode of intraseasonal
Copyright 2000 by the American Geophysical Union.
Paper number 2000JD900337. 0148-0227/00/2000JD9000337509.00
variability in summertime precipitation has a much longer period of 12-18 days [Mullen et al., 1998].
Before examining the interactions between the dynamic and hydrodynamic fields, it is of use to first isolate the important forcing mechanisms associated with the low-level winds in this region. Previously, Anderson et al. [2000] used a regional modeling system to characterize the diurnal and synoptic variability of the summertime low-level flow over the Gulf of California and southwestern United States. The regional modeling system was then used to investigate the diurnal forcing of the simulated wind fields and the dynamics leading to the formation of nocturnal low-level jets over the northern Gulf and the foothills of the Sierra Madre Occidental (B. T. Anderson et al., Model dynamics of summertime low-level jets over northwestern Mexico, submitted to Journal of Geophysical Research, 2000). Here we use the same regional modeling system to examine the larger-scale synoptic conditions associated with surge events.
It has been hypothesized that surge events may be initiated by convective activity associated with low-pressure systems over the southern Gulf and the equatorial eastern Pacific; this convective activity is thought to produce low-level outflow that propagates as a density current up the Gulf and into northwestern Mexico and the southwestern United States [Hales, 1974;Stensrud et al., 1997]. Mesoscale convective systems over northwestern Mexico and the Gulf of California are also associated with surge-type winds, strengthening the hypothesis that low-level outflow is the initiator of surge events [Farfan and Zehnder, 1994].
T, ot,,,.,•a t, ..... a ,t,,,• surge-type wind reversals also occur off 11, 311UUl•..l tJk.., 11Ut, k..,•..l
the coast of California. These wind reversals, which are even more dramatic than those found over the Gulf (owing to the strong northerly summertime winds that usually exist in the eastern Pacific), can have wind shifts of up 10-20 m s -1 over the course of a few hours and temperature drops of 10 K [Mass and Albright, 1987]. They are also accompanied by dramatic stratus tongues, which make their small-scale features readily visible on satellite images [Dorman, 1985' Dorman, 1987; Mass and Albright, 1987]. These winds tend to be confined to very low levels (below 900 mbar). Hypotheses concerning their formation
24,455
24,456 ANDERSON ET AL.: MONSOON SURGES OVER THE GULF OF CALIFORNIA
and propagation include trapped Kelvin-wave dynamics [Dorrnan, 1985], gravity-wave dynamics [Mass and Albright, 1987; Dorman, 1987], and synoptic forcing associated with large- scale anomalous coastal troughing and its interaction with coastal orography over the western United States [Mass and Albright, 1987; Mass and Bond, 1996]. Low-level wind reversals are also seen along the coast of southeastern Australia (where they are known as "bursters") that have low-level and synoptic characteristics similar to those found along the coast of California, as do "leader fronts," which precede synoptic lows propagating over the elevated (>1 km) topography of South Africa [Mass and Albright, 1987) In general, studies indicate that these low-level wind reversals can take the form of a trapped gravity current; however, in most cases they are not initiated by convective activity but rather are related to larger-scale synoptic systems.
It will be shown here that similar conditions are present during the surge events in the Gulf of California. As has been suggested by previous authors, the abrupt and dramatic low-level transition winds that accompany the onset of surge events in this region are associated with temporary along-gulf pressure gradients that produce a density current in the lower atmosphere. However, it will be shown that daily-averaged surge-event winds are primarily the result of a quasi-geostrophic adjustment of synoptic-scale pressure gradients established as low-pressure systems interact with the elevated topography of the Sierra Madres. This interaction results in deeper and more vertically homogeneous surges than those found off the coast of the western United States.
This paper is arranged as follows: Section 2 briefly describes the modeling system. Section 3 examines the fine-scale low-level characteristics and synoptic-scale upper air patterns associated with surge events and describes a case study of their evolution. Section 4 summarizes the findings.
Regional Spectral Model Domains
(a•t RSM1 OROGRAPHY WITH GSM/RSbll GRIDS
::::: :: :- .:-. .... '"'; $•'•-"d'•' :a•" f ,'•':;', ....... •-:'-;.-"" ':--.-.':::'. ;:;;:;;;;;. . 5 "-'5: ':'*-'::"; :,::--; :.--'-'".-"-;/;'•:- ' if*'*-::
.......... :::: .... ":' :",:'.,. ---,',.,:::>... ?{;-:: :; ..... .'.::..•.?-,:. :•:':.-**.
.... ; -;;;; ..... •..• - ..,:,. ...... . , ,--'..g..:-:.. q ...... -**:. ....
............ +. • ...... -:<.:..,..,..:,...•.. .......... .. •;... ;• ..... • ........ :: ,:½ :. ..::,:• .... . ... :...:.
::::::::::::::::::::::::::::::::::::::::::::::
1 •0• 110• 100•
RSM2 OROGRAPHY
34N
30N
40N
30N
E0N
2. Model Description
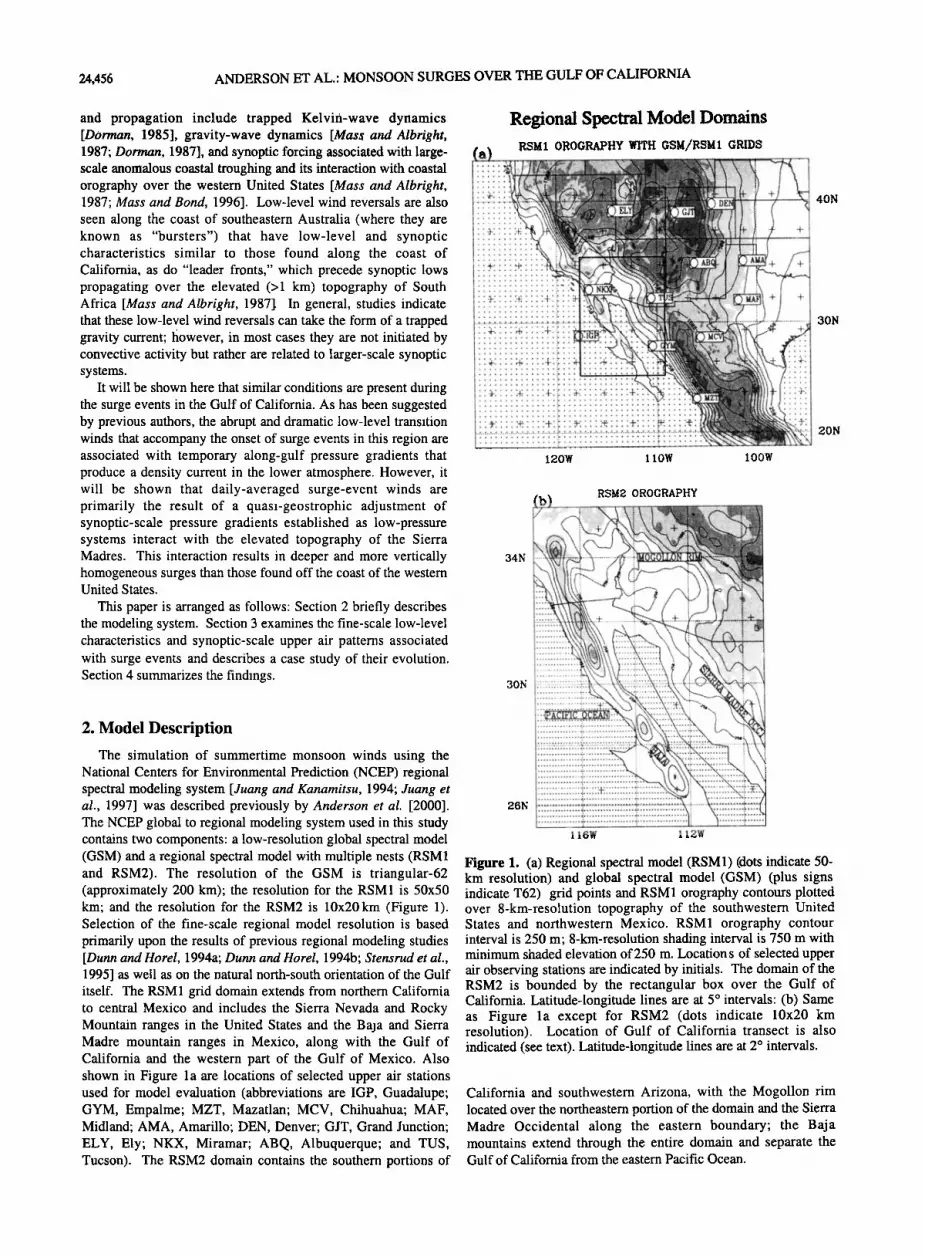
The simulation of summertime monsoon winds using the National Centers for Environmental Prediction (NCEP) regional spectral modeling system [Juang and Kanamitsu, 1994; Juang et al., 1997] was described previously by Anderson et al. [2000]. The NCEP global to regional modeling system used in this study contains two components: a low-resolution global spectral model (GSM) and a regional spectral model with multiple nests (RSM1 and RSM2). The resolution of the GSM is triangular-62 (approximately 200 km); the resolution for the RSMI is 50x50 km; and the resolution for the RSM2 is 10x20 km (Figure 1). Selection of the fine-scale regional model resolution is based primarily upon the results of previous regional modeling studies
26N
116W 112W
Figure 1. (a) Regional spectral model (RSM1) (dots indicate 50- km resolution) and global spectral model (GSM) (plus s•gns indicate T62) grid points and RSM1 orography contours plotted over 8-km-resolution topography of the southwestern United States and northwestern Mexico. RSM1 orography contour interval is 250 m; 8-km-resolution shading interval is 750 m with
[Dunn and Horel, 1994a; Dunn and Horel, 1994b; Stensrud et al., minimum shaded elevation of 250 m. Locations of selected upper 1995] as well as on the natural north-south orientation of the Gulf air observing stations are indicated by initials. The domain of the itself. The RSM1 grid domain extends from northern California RSM2 is bounded by the rectangular box over the Gulf of to central Mexico and includes the Sierra Nevada and Rocky Mountain ranges in the United States and the Baja and Sierra Madre mountain ranges in Mexico, along with the Gulf of California and the western part of the Gulf of Mexico. Also shown in Figure l a are locations of selected upper air stations used for model evaluation (abbreviations are IGP, Guadalupe; GYM, Empalme; MZT, Mazatlan; MCV, Chihuahua; MAF, Midland; AMA, Amarillo; DEN, Denver; GJT, Grand Junction;
ELY, Ely; NKX, Miramar; ABQ, Albuquerque; and TUS, Tucson). The RSM2 domain contains the southern portions of
California. Latitude-longitude lines are at 5 ø intervals: (b) Same as Figure la except for RSM2 (dots indicate 10x20 km resolution). Location of Gulf of California transect is also indicated (see text). Latitude-longitude lines are at 2 ø intervals.
California and southwestern Arizona, with the Mogollon rim located over the northeastern portion of the domain and the Sierra Madre Occidental along the eastern boundary; the Baja mountains extend through the entire domain and separate the Gulf of California from the eastern Pacific Ocean.
ANDERSON ET AL.: MONSOON SURGES OVER THE GULF OF CALIFORNIA 24,457
Time Series of RSM2 Meridional Winds and
Specific Humidity along Gulf of California: 1990
(a) SPECIFIC HUMIDITY
• 30 " ' ::.x .................................................................. ' ................
• 28 2• •. .... •. .... • .... ii .... i•" "i•" "i.•" "ib" '•i" "•" "•" "•'+" '•" "•i ..... • .....
(b) MERIDIONAL VEL 32 .............. • ............... ,-• ...... :• ............. ,-..-•-': ...... •-- ...... , ........................... ;'-:-:•:::'•'•'••
I{' ..... ', ...... "/':. . • 30 -. 9 "? •!![-'.• ::i•' :-' ß • , ,'c' }! L•...::-.. - .: .... -:i!:13'"' ::., :':"•': • ...............
F--. 28
• 26 ...................................... ' ...................................................... ' 0
DATe (JUL, •ooo)
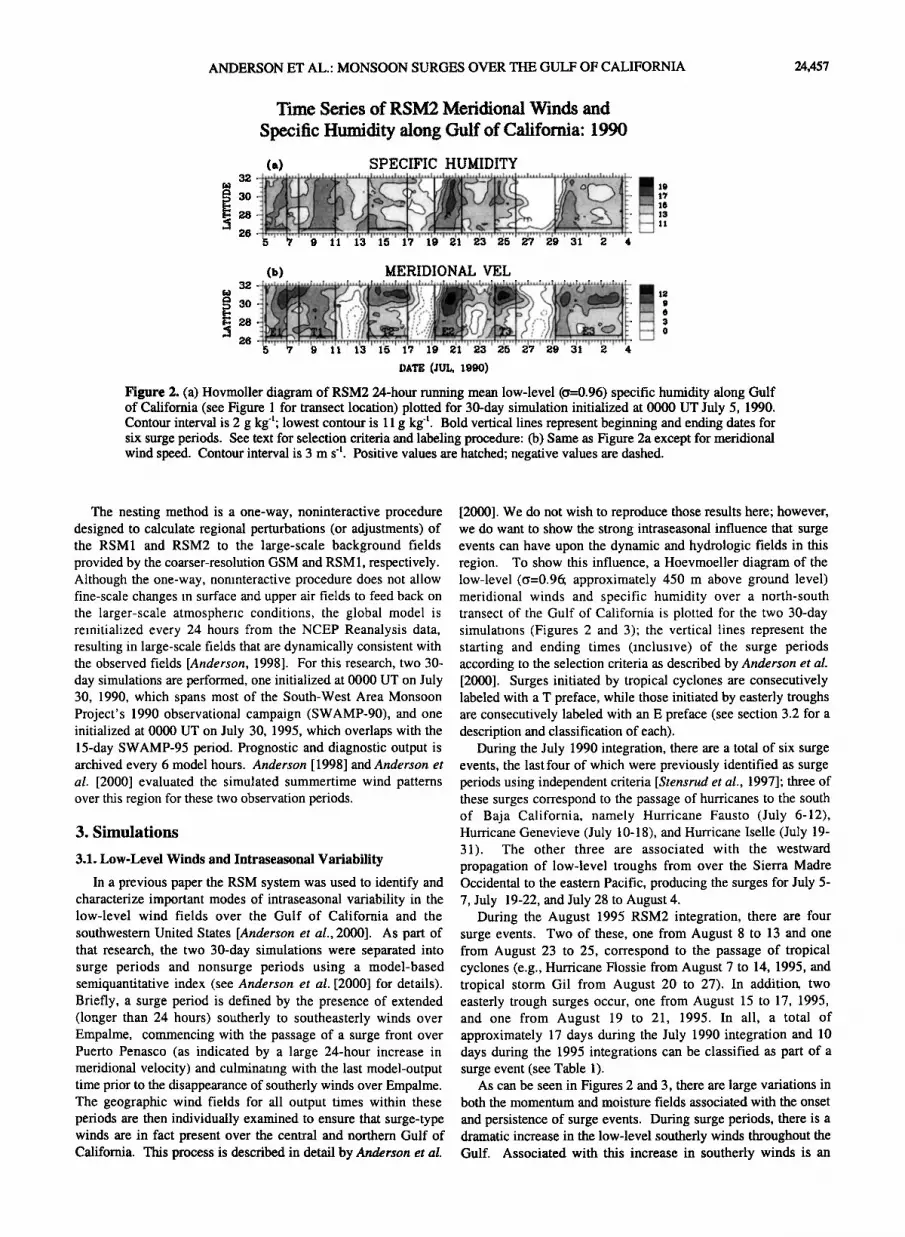
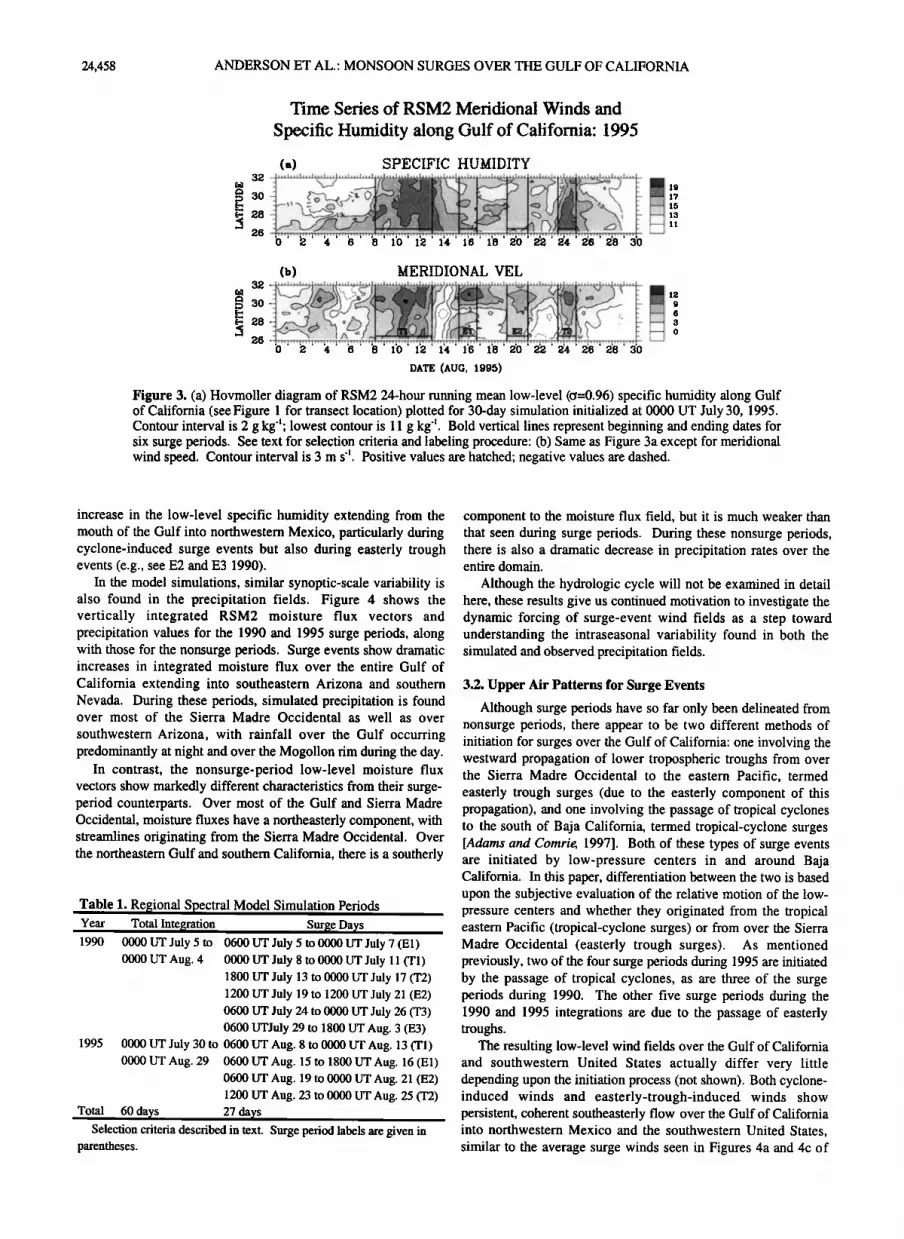
Figure 2. (a) Hovmoller diagram of RSM2 24-hour running mean low-level (o=0.96) specific humidity along Gulf of California (see Figure 1 for transect location) plotted for 30-day simulation initialized at 0000 UT July 5, 1990. Contour interval is 2 g kg'l; lowest contour is 11 g kg-'. Bold vertical lines represent beginning and ending dates for six surge periods. See text for selection criteria and labeling procedure: Co) Same as Figure 2a except for meridional wind speed. Contour interval is 3 m s ". Positive values are hatched; negative values are dashed.
The nesting method is a one-way, noninteractive procedure designed to calculate regional perturbations (or adjustments) of the RSM1 and RSM2 to the large-scale background fields provided by the coarser-resolution GSM and RSM 1, respectively. Although the one-way, noninteractive procedure does not allow fine-scale changes in surface and upper air fields to feed back on the larger-scale atmospheric conditions, the global model is reinitialized every 24 hours from the NCEP Reanalysis data, resulting in large-scale fields that are dynamically consistent with the observed fields [Anderson, 1998]. For this research, two 30- day simulations are performed, one initialized at 0000 UT on July 30, 1990, which spans most of the South-West Area Monsoon Project's 1990 observational campaign (SWAMP-90), and one initialized at 0000 UT on July 30, 1995, which overlaps with the 15-day SWAMP-95 period. Prognostic and diagnostic output is archived every 6 model hours. Anderson [1998] and Anderson et al. [2000] evaluated the simulated summertime wind patterns over this region for these two observation periods.
3. Simulations
3.1. Low-Level Winds and Intraseasonal Variability
In a previous paper the RSM system was used to identify and characterize important modes of intraseasonal variability in the low-level wind fields over the Gulf of California and the
southwestern United States [Anderson et al., 2000]. As part of that research, the two 30-day simulations were separated into surge periods and nonsurge periods using a model-based semiquantitative index (see Anderson et al. [2000] for details). Briefly, a surge period is defined by the presence of extended (longer than 24 hours) southerly to southeasterly winds over Empalme, commencing with the passage of a surge front over Puerto Penasco (as indicated by a large 24-hour increase in meridional velocity) and culminating with the last model-output time prior to the disappearance of southerly winds over Empalme. The geographic wind fields for all output times within these periods are then individually examined to ensure that surge-type winds are in fact present over the central and northern Gulf of California. This process is described in detail by Anderson et al.
[2000]. We do not wish to reproduce those results here; however, we do want to show the strong intraseasonal influence that surge events can have upon the dynamic and hydrologic fields in this region. To show this influence, a Hoevmoeller diagram of the low-level (0=0.96; approximately 450 m above ground level) meridional winds and specific humidity over a north-south transect of the Gulf of California is plotted for the two 30-day simulations (Figures 2 and 3); the vertical lines represent the starting and ending times (inclusive) of the surge periods according to the selection criteria as described by Anderson et al. [2000]. Surges initiated by tropical cyclones are consecutively labeled with a T preface, while those initiated by easterly troughs are consecutively labeled with an E preface (see section 3.2 for a description and classification of each).
During the July 1990 integration, there are a total of six surge events, the last four of which were previously identified as surge periods using independent criteria [Stensrud et al., 1997]; three of these surges correspond to the passage of hurricanes to the south of Baja California, namely Hurricane Fausto (July 6-12), Hurricane Genevieve (July 10-18), and Hurricane Iselle (July 19- 31). The other three are associated with the westward propagation of low-level troughs from over the Sierra Madre Occidental to the eastern Pacific, producing the surges for July 5- 7, July 19-22, and July 28 to August 4.
During the August 1995 RSM2 integration, there are four surge events. Two of these, one from August 8 to 13 and one from August 23 to 25, correspond to the passage of tropical cyclones (e.g., Hurricane Flossie from August 7 to 14, 1995, and tropical storm Gil from August 20 to 27). In addition, two easterly trough surges occur, one from August 15 to 17, 1995, and one from August 19 to 21, 1995. In all, a total of approximately 17 days during the July 1990 integration and 10 days during the 1995 integrations can be classified as part of a surge event (see Table 1).
As can be seen in Figures 2 and 3, there are large variations in both the momentum and moisture fields associated with the onset
and persistence of surge events. During surge periods, there is a dramatic increase in the low-level southerly winds throughout the Gulf. Associated with this increase in southerly winds is an
24,458 ANDERSON ET AL.: MONSOON SURGES OVER THE GULF OF CALIFORNIA
Time Series of RSM2 Meridional Winds and
Specific Humidity along Gulf of California: 1995
(a) SPECIFIC HUMIDITY •,.,h,,•,,,•,,,•,,,•,,,•.,,•,,.•,•,•..,•,,,• .,..,•. ..................................... -..,. ß ........ •..:k:• ..:_.•... :• •.• '......•.............-_••
(b) MERIDIONAL VEL
DATE (AUG, 1995)
Figure 3. (a) Hovmoller diagram of RSM2 24-hour running mean low-level (0=0.96) specific humidity along Gulf of California (see Figure 1 for transect location) plotted for 30-day simulation initialized at 0000 UT July 30, 1995. Contour interval is 2 g kg-'; lowest contour is 11 g kg 'l. Bold vertical lines represent beginning and ending dates for six surge periods. See text for selection criteria and labeling procedure: (b) Same as Figure 3a except for meridional wind speed. Contour interval is 3 m s -'. Positive values are hatched; negative values are dashed.
increase in the low-level specific humidity extending from the mouth of the Gulf into northwestern Mexico, particularly during cyclone-induced surge events but also during easterly trough events (e.g., see E2 and E3 1990).
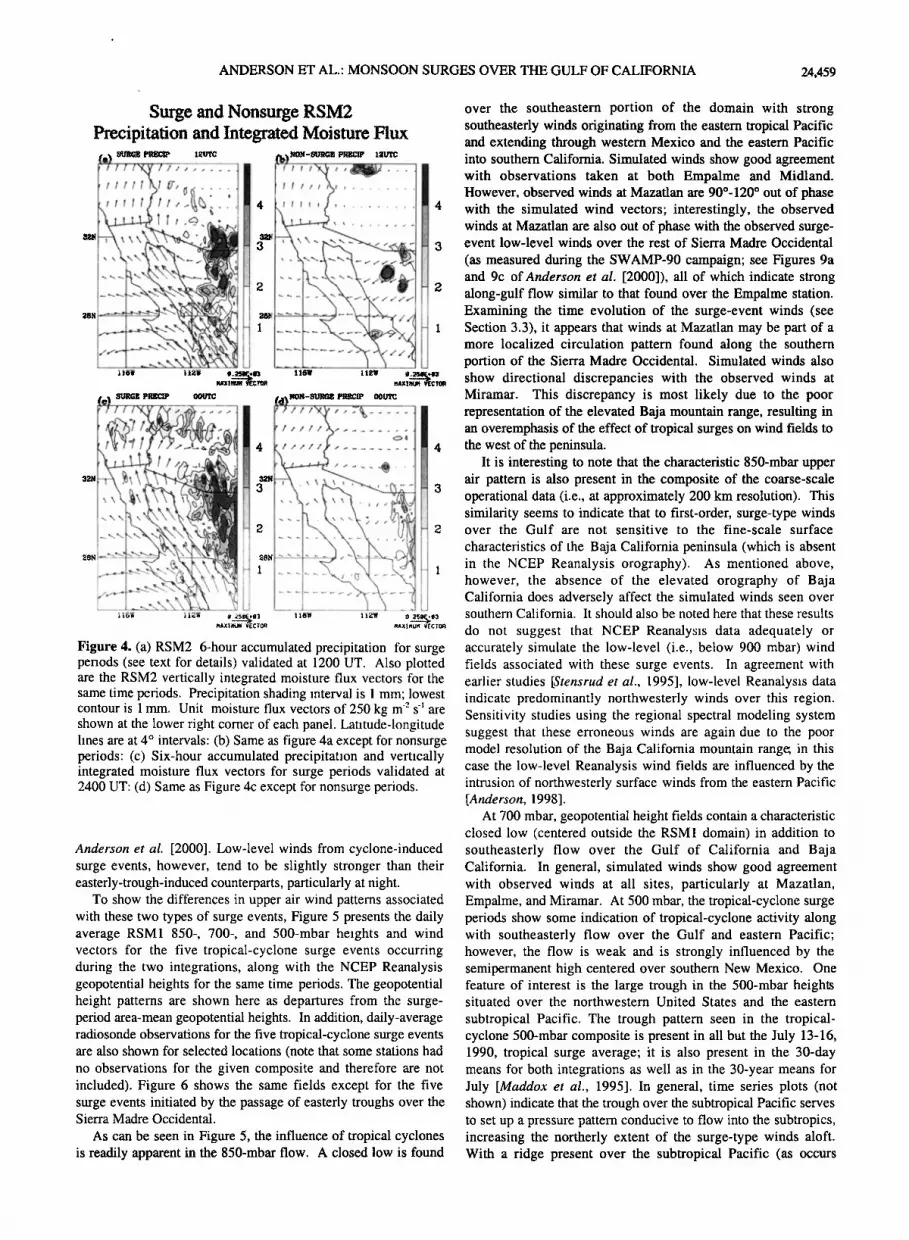
In the model simulations, similar synoptic-scale variability is also found in the precipitation fields. Figure 4 shows the vertically integrated RSM2 moisture flux vectors and precipitation values for the 1990 and 1995 surge periods, along with those for the nonsurge periods. Surge events show dramatic increases in integrated moisture flux over the entire Gulf of California extending into southeastern Arizona and southern Nevada. During these periods, simulated precipitation is found over most of the Sierra Madre Occidental as well as over
southwestern Arizona, with rainfall over the Gulf occurring predominantly at night and over the Mogollon rim during the day.
In contrast, the nonsurge-period low-level moisture flux vectors show markedly different characteristics from their surge- period counterparts. Over most of the Gulf and Sierra Madre Occidental, moisture fluxes have a northeasterly component, with streamlines originating from the Sierra Madre Occidental. Over the northeastern Gulf and southern California, there is a southerly
Table 1. Regional Spectral Model Simulation Periods Year Total Integration Surge Days 1990 0000 UT July 5 to 0600 UT July 5 to 0000 UT July 7 (El)
0000 UT Aug. 4 0000 UT July 8 to 0000 UT July 11 (T1) 1800 UT July 13 to 0000 UT July 17 (T2) 1200 UT July 19 to 1200 UT July 21 (E2) 0600 UT July 24 to 0000 UT July 26 (T3) 0600 UTJuly 29 to 1800 UT Aug. 3 (E3)
1995 0000 UT July 30 to 0600 UT Aug. 8 to 0000 UT Aug. 13 (T1) 0000 UT Aug. 29 0600 UT Aug. 15 to 1800 UT Aug. 16 (El)
0600 UT Aug. 19 to 0000 UT Aug. 21 (E2) 1200 UT Aug. 23 to 0000 UT Aug. 25 (T2)
Total 60 days 27 days Selection criteria described in text. Surge period labels are given in
parentheses.
component to the moisture flux field, but it is much weaker than that seen during surge periods. During these nonsurge periods, there is also a dramatic decrease in precipitation rates over the entire domain.
Although the hydrologic cycle will not be examined in detail here, these results give us continued motivation to investigate the dynamic forcing of surge-event wind fields as a step toward understanding the intraseasonal variability found in both the simulated and observed precipitation fields.
3.2. Upper Air Patterns for Surge Events
Although surge periods have so far only been delineated from nonsurge periods, there appear to be two different methods of initiation for surges over the Gulf of California: one involving the westward propagation of lower tropospheric troughs from over the Sierra Madre Occidental to the eastern Pacific, termed easterly trough surges (due to the easterly component of this propagation), and one involving the passage of tropical cyclones to the south of Baja California, termed tropical-cyclone surges [Adams and Comrie 1997]. Both of these types of surge events are initiated by low-pressure centers in and around Baja California. In this paper, differentiation between the two is based upon the subjective evaluation of the relative motion of the low- pressure centers and whether they originated from the tropical eastern Pacific (tropical-cyclone surges) or from over the Sierra Madre Occidental (easterly trough surges). As mentioned previously, two of the four surge periods during 1995 are initiated by the passage of tropical cyclones, as are three of the surge periods during 1990. The other five surge periods during the 1990 and 1995 integrations are due to the passage of easterly troughs.
The resulting low-level wind fields over the Gulf of California and southwestern United States actually differ very little depending upon the initiation process (not shown). Both cyclone- induced winds and easterly-trough-induced winds show persistent, coherent southeasterly flow over the Gulf of California into northwestern Mexico and the southwestern United States, similar to the average surge winds seen in Figures 4a and 4c of
ANDERSON ET AL.: MONSOON SURGES OVER THE GULF OF CALIFORNIA 24,459
Surge and Nonsurge RSM2 Precipitation and Integrated Moisture Flux
.WXIHL{M VECTO• HAXliML•M VECTO•
Figure 4. (a) RSM2 6-hour accumulated precipitation for surge periods (see text for details) validated at 1200 UT. Also plotted are the RSM2 vertically integrated moisture flux vectors for the same time periods. Precipitation shading interval is 1 mm; lowest contour is 1 mm. Unit moisture flux vectors of 250 kg m -2 S -• are shown at the lower right corner of each panel. Latitude-longitude lines are at 4 ø intervals: (b) Same as figure 4a except for nonsurge periods: (c) Six-hour accumulated precipitation and vertically integrated moisture flux vectors for surge periods validated at 2400 UT: (d) Same as Figure 4c except for nonsurge periods.
Anderson et al. [2000]. Low-level winds from cyclone-induced surge events, however, tend to be slightly stronger than their easterly-trough-induced counterparts, particularly at night.
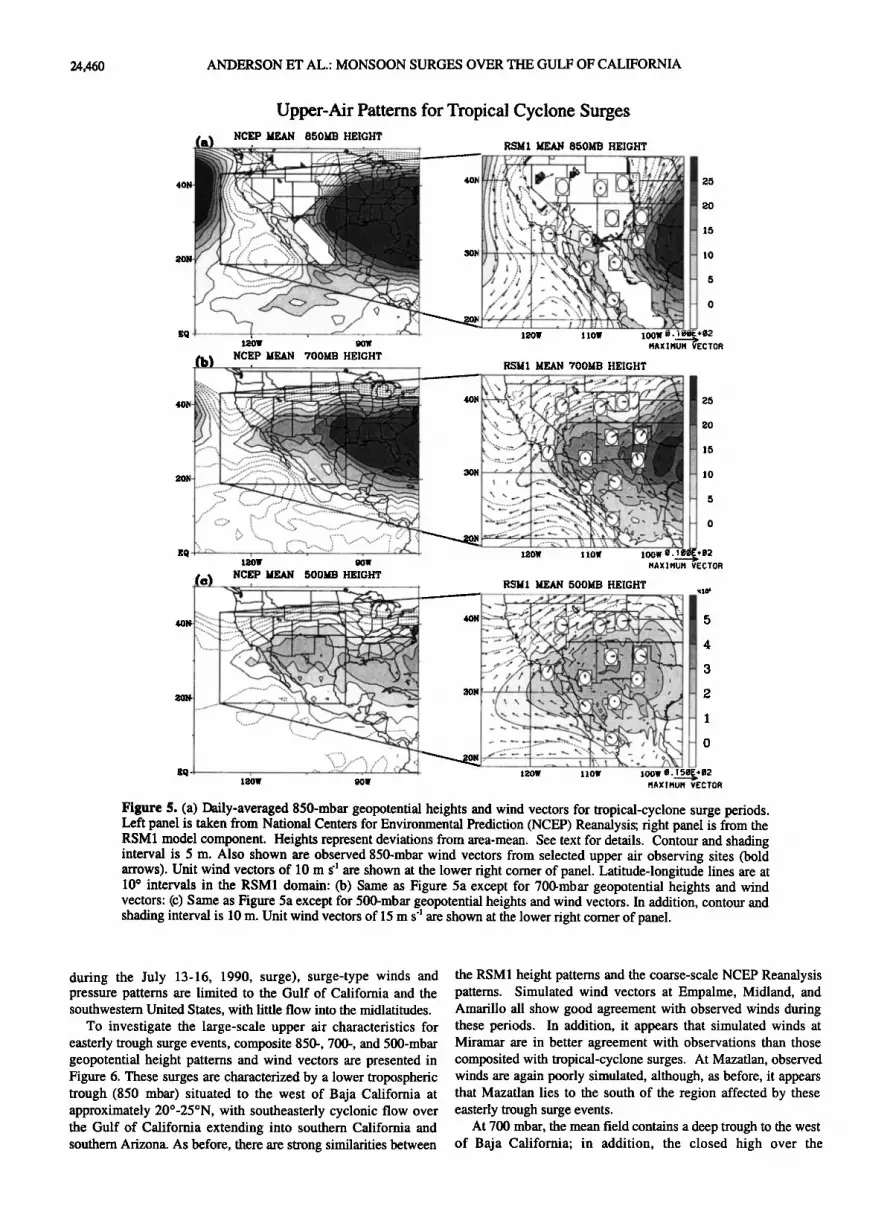
To show the differences in upper air wind patterns associated with these two types of surge events, Figure 5 presents the daily average RSM1 850-, 700-, and 500-mbar heights and wind vectors for the five tropical-cyclone surge events occurring during the two integrations, along with the NCEP Reanalysis geopotential heights for the same time periods. The geopotential height patterns are shown here as departures from the surge- period area-mean geopotential heights. In addition, daily-average radiosonde observations for the five tropical-cyclone surge events are also shown for selected locations (note that some stations had no observations for the given composite and therefore are not included). Figure 6 shows the same fields except for the five surge events initiated by the passage of easterly troughs over the Sierra Madre Occidental.
As can be seen in Figure 5, the influence of tropical cyclones is readily apparent in the 850-mbar flow. A closed low is found
over the southeastern portion of the domain with strong southeasterly winds originating from the eastern tropical Pacific and extending through western Mexico and the eastern Pacific into southern California. Simulated winds show good agreement with observations taken at both Empalme and Midland. However, observed winds at Mazatlan are 90ø-120 ø out of phase with the simulated wind vectors; interestingly, the observed winds at Mazatlan are also out of phase with the observed surge- event low-level winds over the rest of Sierra Madre Occidental
(as measured during the SWAMP-90 campaign; see Figures 9a and 9c of Anderson et al. [2000]), all of which indicate strong along-gulf flow similar to that found over the Empalme station. Examining the time evolution of the surge-event winds (see Section 3.3), it appears that winds at Mazatlan may be part of a more localized circulation pattern found along the southern portion of the Sierra Madre Occidental. Simulated winds also show directional discrepancies with the observed winds at Miramar. This discrepancy is most likely due to the poor representation of the elevated Baja mountain range, resulting in an overemphasis of the effect of tropical surges on wind fields to the west of the peninsula.
It is interesting to note that the characteristic 850-mbar upper air pattern is also present in the composite of the coarse-scale operational data (i.e., at approximately 200 km resolution). This similarity seems to indicate that to first-order, surge-type winds over the Gulf are not sensitive to the fine-scale surface
characteristics of the Baja California peninsula (which is absent in the NCEP Reanalysis orography). As mentioned above, however, the absence of the elevated orography of Baja California does adversely affect the simulated winds seen over southern California. It should also be noted here that these results
do not suggest that NCEP Reanalysis data adequately or accurately simulate the low-level (i.e., below 900 mbar) wind fields associated with these surge events. In agreement with earlier studies [Stensrud et al., 1995], low-level Reanalysis data indicate predominantly northwesterly winds over this region. Sensitivity studies using the regional spectral modeling system suggest that these erroneous winds are again due to the poor model resolution of the Baja California mountain range in this case the low-level Reanalysis wind fields are influenced by the intrusion of northwesterly surface winds from the eastern Pacific [Anderson, 1998].
At 700 mbar, geopotential height fields contain a characteristic closed low (centered outside the RSM1 domain) in addition to southeasterly flow over the Gulf of California and Baja California. In general, simulated winds show good agreement with observed winds at all sites, particularly at Mazatlan, Empalme, and Miramar. At 500 mbar, the tropical-cyclone surge periods show some indication of tropical-cyclone activity along with southeasterly flow over the Gulf and eastern Pacific; however, the flow is weak and is strongly influenced by the semipermanent high centered over southern New Mexico. One feature of interest is the large trough in the 500-mbar heights situated over the northwestern United States and the eastern
subtropical Pacific. The trough pattern seen in the tropical- cyclone 500-mbar composite is present in all but the July 13-16, 1990, tropical surge average; it is also present in the 30-day means for both integrations as well as in the 30-year means for July [Maddox et al., 1995]. In general, time series plots (not shown) indicate that the trough over the subtropical Pacific serves to set up a pressure pattern conducive to flow into the subtropics, increasing the northerly extent of the surge-type winds aloft. With a ridge present over the subtropical Pacific (as occurs
24,460 ANDERSON ET AL.: MONSOON SURGES OVER THE GULF OF CALIFORNIA
Upper-Air Patterns for Tropical Cyclone Surges .(&) NCEP MEAN 850MB HEIGHT ........ RSM1. MEAN 850MB HEIGHT , .
40• ••••/ • • •'•:•'" ' ' •' " • t' ' ' ': ' ' •' ' • "":½'"½:
' ',,.,, X ..... : "/ '"?:%:?=:::,:.:L::.%:=::=.... "'"•• i • - • , ..' ::::,.. -..-.':=<?•:?•.•'.. : : '...2:X ......... .. ================================================= :,?:•-:::.-:--:-:-,.:.: / If t; . • ., :::::: ..... -%•:•., . 5
....-*::f:b•9?•:.:::."';::-;: ..... ':-:-:.• ........ ' / / //.•.' • x. '.-'•:j:::• •:• 1.20W 90W •AXI•U• V•CTO•
................ •sm •AN •oo'.•
•'::•% ..... --"•••••'"•'-•':':':' 4o• .• '• '- ' • ...... :' ".-' ' -' ..... :::::::::::::::::::::::::: "•:Nhq3. • T ' ......... -- '• ' "':'• "' "'•"••"":::':'" •' :'½ ':.: '"'% - ' . ...,::.:::"•:•
•.•.t%•- - •,. .. .•.::••.••.••::.;.•:.... .... . ...... • ,-'• •,•- .. :%::: ............... . ........
: :... -... .,. . . ::::: .... :::::: ::::::::::::::::::: i ........ • ....... •• '•••••••'••••:'••••_::•.•• ,o• ......... - ========================= '•":•••••.• • • ........ --•-.-. - ....•.••.•.•..•..•.•.••••:•:•. , • . .• .... ======================= ......... .... ..::•:•.•::/•::• '• ,•.• . ............... •. •' -'- :• 'E• '- :• • "•,:• • ,.. [ • ß • "• ••• . • . ..•.•..• .... ::::::::::::::::::::::::::::::::::::::::::::::::
' C•> l .... k. ½i' ........... • .......... " '•'•'•; • ..•. '•. -c:::• ............... ::::::::::::::::::::::::: ':•*,•::• 0
120W gOW
MAXIMUM VECTOR
RSMI MEAN 500MB HEIGHT
40N ....... y" - " 5
* ;' t*, . - -: .•;•:::•:: -.'+:--' ". •-.-v" •%-• :m., ...... 4
...... '•;::;*:' ' ;:" "*':-'• '"•*: 3 3o• • t %. 2
o
MAXIMUM VECTOR
Figure 5. (a) Daily-averaged 850-mbar geopotential heights and wind vectors for tropical-cyclone surge periods. Left panel is taken from National Centers for Environmental Prediction (NCEP) Reanalysis; right panel is from the RSM1 model component. Heights represent deviations from area-mean. See text for details. Contour and shading interval is 5 m. Also shown are observed 850-mbar wind vectors from selected upper air observing sites (bold arrows). Unit wind vectors of 10 m •' are shown at the lower right comer of panel. Latitude-longitude lines are at 10 ø intervals in the RSM1 domain: (b) Same as Figure 5a except for 700-mbar geopotential heights and wind vectors: (c) Same as Figure 5a except for 500-mbar geopotential heights and wind vectors. In addition, contour and shading interval is 10 m. Unit wind vectors of 15 ms-' are shown at the lower right comer of panel.
during the July 13-16, 1990, surge), surge-type winds and pressure patterns are limited to the Gulf of California and the southwestern United States, with little flow into the midlatitudes.
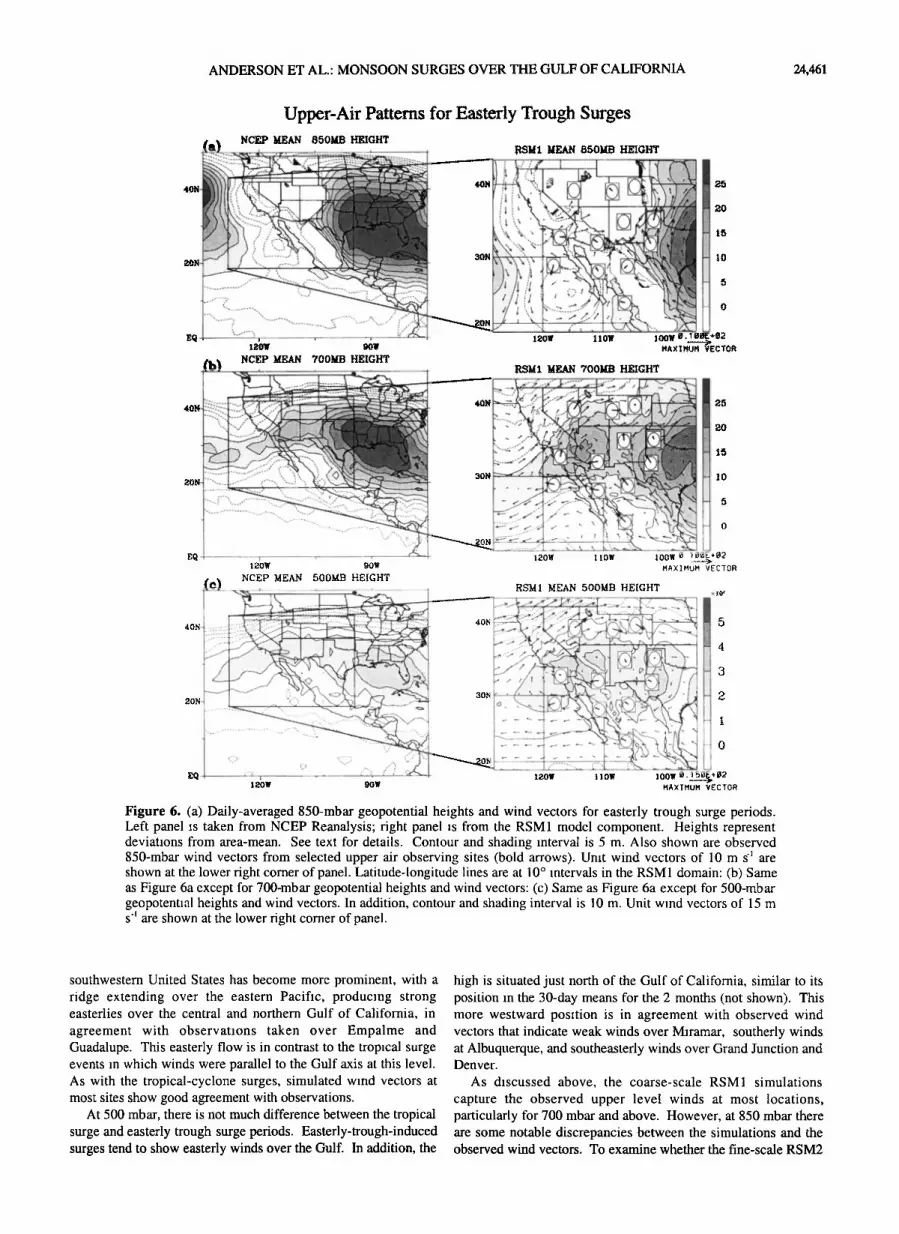
To investigate the large-scale upper air characteristics for easterly trough surge events, composite 850-, 700-, and 500-mbar geopotential height patterns and wind vectors are presented in Figure 6. These surges are characterized by a lower tropospheric trough (850 mbar) situated to the west of Baja California at approximately 20ø-25øN, with southeasterly cyclonic flow over the Gulf of California extending into southern California and southern Arizona. As before, there are strong similarities between
the RSM1 height patterns and the coarse-scale NCEP Reanalysis patterns. Simulated wind vectors at Empalme, Midland, and Amarillo all show good agreement with observed winds during these periods. In addition, it appears that simulated winds at Miramar are in better agreement with observations than those composited with tropical-cyclone surges. At Mazatlan, observed winds are again poorly simulated, although, as before, it appears that Mazatlan lies to the south of the region affected by these easterly trough surge events.
At 700 mbar, the mean field contains a deep trough to the west of Baja California; in addition, the closed high over the
ANDERSON ET AL.: MONSOON SURGES OVER THE GULF OF CALIFORNIA 24,461
UPper-Air Patterns for Easterly Trough Surges ,, • NCEP MEAN 850MB HEIGHT ,,[•[ ...... , ....... •=- .................... RSM1 MEAN 85.0MB HEIGHT :•.•;•..•o --:..-.- •. . . ..• .t:•:•:• • .;•.. :•,• .... .•.•
40N }5 •:• •/•. / / -• • :.':;;:7':.;;•::;:::...:. '•s•...:'":'• ::•j<j•:. :t•½•? '/?.?::'.:.:::•::.:-' ..... •- • •:•- ix • • 2 'x "•:t•::•:•
'IEOW 9OW •gXI•UM
.{•} NCEP MEAN 700MB HEIGHT • • • ................................... ..• .................. • RSMI ME• 700MB HEIGHT
........ :.- .. %? :. :. .v
12OW 110tl/
•AXIMUM VECTOR
Figure 6. (a) Daily-averaged 850-mbar geopotential heights and wind vectors for easterly trough surge periods. Left panel is taken from NCEP Reanalysis; right panel is from the RSM1 model component. Heights represent deviations from area-mean. See text for details. Contour and shading interval is 5 m. Also shown are observed 850-mbar wind vectors from selected upper air observing sites (bold arrows). Unit wind vectors of 10 ms-' are shown at the lower right corner of panel. Latitude-longitude lines are at 10 ø intervals in the RSM 1 domain: (b) Same as Figure 6a except for 700-mbar geopotential heights and wind vectors: (c) Same as Figure 6a except for 500-mbar geopotential heights and wind vectors. In addition, contour and shading interval is 10 m. Unit wind vectors of 15 m s-' are shown at the lower right corner of panel.
southwestern United States has become more prominent, with a ridge extending over the eastern Pacific, producing strong easterlies over the central and northern Gulf of California, in
agreement with observations taken over Empalme and Guadalupe. This easterly flow is in contrast to the tropical surge events in which winds were parallel to the Gulf axis at this level. As with the tropical-cyclone surges, simulated wind vectors at most sites show good agreement with observations.
At 500 mbar, there is not much difference between the tropical surge and easterly trough surge periods. Easterly-trough-induced surges tend to show easterly winds over the Gulf. In addition, the
high is situated just north of the Gulf of California, similar to its position in the 30-day means for the 2 months (not shown). This more westward position is in agreement with observed wind vectors that indicate weak winds over Miramar, southerly winds at Albuquerque, and southeasterly winds over Grand Junction and Denver.
As discussed above, the coarse-scale RSMI simulations
capture the observed upper level winds at most locations, particularly for 700 mbar and above. However, at 850 mbar there are some notable discrepancies between the simulations and the observed wind vectors. To examine whether the fine-scale RSM2

24,462 ANDERSON ET AL.' MONSOON SURGES OVER THE GULF OF CALIFORNIA
850 mbar RSM2 Height Patterns for Tropical Cyclone and Easterly Trough Surges
32N
28N
CYCLONE SURGES
9
6
3
32N
28N
116W 112W o: • •a_•o2 MAXIMUM VECTOR
TROUGH SURGES
116W 112W e. '•ee•½2 MAXIMUM VECTOR
Figure 7. (a) Daily-averaged 850-mbar geopotential heights and wind vectors for tropical-cyclone surge periods taken from the RSM2 model component. Heights represent deviations from area-mean. See text for details. Contour and shading interval is 3 m. Also shown are observed 850-mbar wind vectors from
selected upper air observing sites (bold arrows). Unit wind vectors of 10 ms-' are shown at the lower right corner of panel. Latitude-longitude lines are at 4 ø intervals in the RSM2 domain: (b) Same as Figure 7a except easterly trough surge periods.
better reproduces these observations, maps of composite 850- mbar geopotential height patterns and wind vectors for both the tropical-cyclone and easterly trough surges are presented in Figure 7. As with the RSM1, the RSM2 captures the
southeasterly flow seen over Empalme during both composite surges. The model also now simulates northwesterly flow as observed over Tucson during the tropical-cyclone surges; it also produces northwesterly flow over this region during easterly trough surges, although observations indicate southeasterly flow during this period. This discrepancy may be due to localized orographic forcing in this region (note the elevated topography just to the south of Tucson). Climatological mean winds show discernible diurnal cycling at this level [Maddox et al., 1995]; in addition, previous studies of vertical soundings at Tucson indicate that conditions at this site can be significantly different from those in the central and western parts of the state, just 150 km away [Maddox et at, 1995]. Over Miramar, the simulated tropical-cyclone wind vectors are still too southerly, again indicating an overemphasis of surge effects in this region; this continued southerly component arises because of Miramar's proximity to the domain border and the numeric damping of prognostic fields toward the larger-scale RSM1 fields. During the weaker easterly trough surges the simulated wind vectors show much better agreement with observations.
It is of interest to further evaluate the synoptic characteristics associated with surge events and increased southeasterly flow over the Gulf of California. So far, using model data, a total of 10 surge events have been isolated and their characteristic upper air patterns in both the RSM1 and Reanalysis data have been analyzed. However, these surges are necessarily selected based upon model output alone [Anderson et al., 2000]; hence the characteristic upper air patterns presented here may not be representative of the true synoptic patterns associated with low- level winds over the Gulf of California and southwestern United
States. To see how observed low-level winds correlate with
upper air patterns, 11 years of daily-averaged summertime (June 30 to September 22) surface winds from Yuma are used. Those days with a southerly meridional wind component above a given threshold are selected (in this case the threshold is the 11-year mean value plus the square root of the variance halved, although the patterns presented are robust to changes in this threshold). The composite 850-, 700-, 500-mbar, and sea-level anomaly charts from the NCEP Reanalysis are then constructed for these days. In addition, the correlation of the Reanalysis data with the surface wind speed anomalies for these periods is computed. Results are presented in Figures 8 and 9.
Composite anomaly patterns at 850 and 700 mbar indicate a correspondence between increased wind speeds at Yuma and easterly trough patterns to the west of Baja California, similar to those described earlier; in addition, the 500-mbar composite also indicates an anomalous low to the west of Baja California. Sea- level pressure charts show anomalous high pressures over the mouth of the Gulf and the foothills of the Sierra Madre
Occidental and a corresponding low-pressure center over Nevada and Utah.
The correlation plots, plotted at the 90% confidence level for approximately 100 independent events (the number of synoptic events over the 11-year period that had coherent surface wind speeds greater than the threshold), indicate that the low pressure west of Baja California is significant at all levels. In addition, the high-pressure ridge seen in the 700- and 500-mbar height patterns is significant, as is the sea-level pressure pattern described above. This latter finding agrees with previous work that shows midlatitude synoptic activity can affect the strength and timing of these surge events [Stensrud et al., 1995]. Of interest here, though, is the fact that there is a statistically significant correlation between the tropical low-pressure center to the west of Baja California and increased low-level southerlies over the
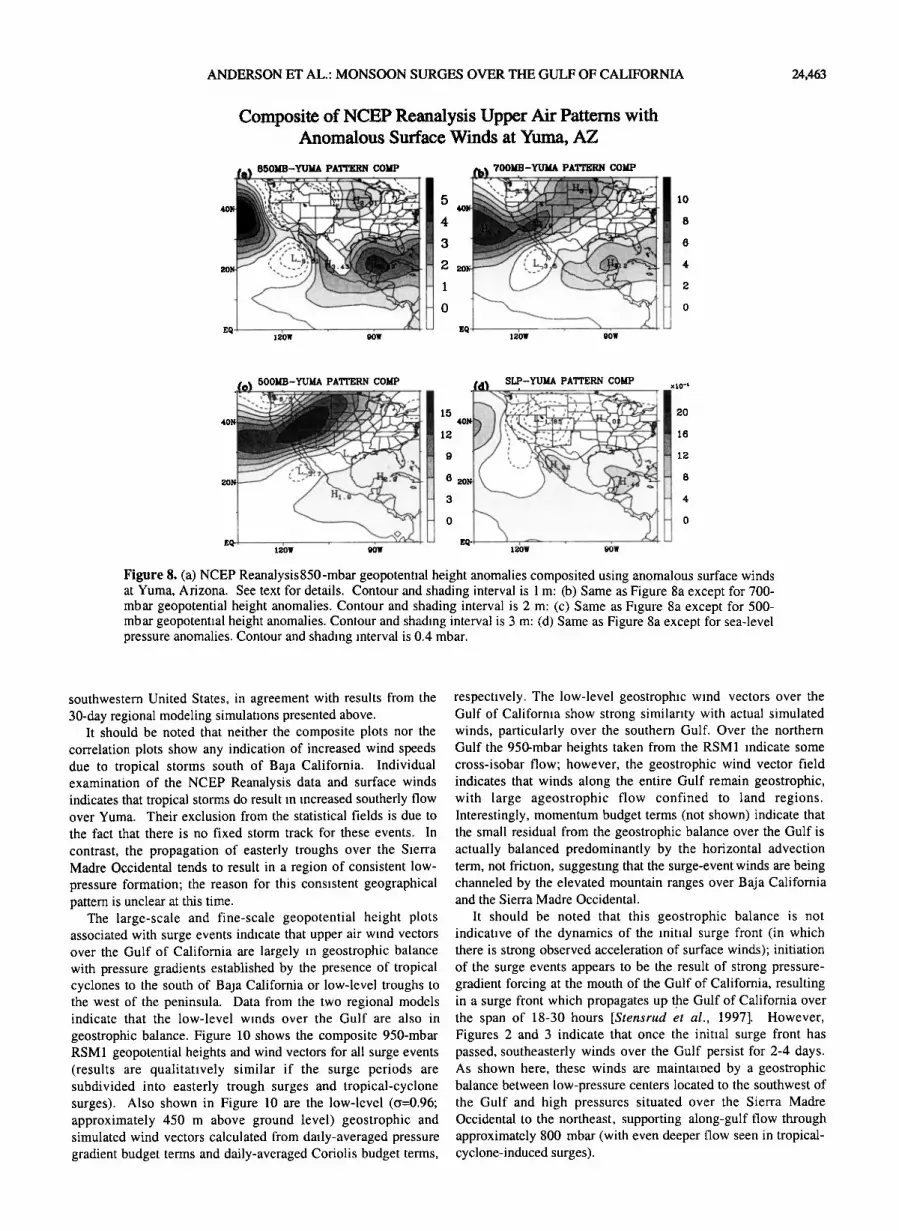
ANDERSON ET AL.: MONSOON SURGES OVER THE GULF OF CALIFORNIA 24,463
40N-
20•
Composite of NCEP Reanalysis Upper Air Patterns with Anomalous Surface Winds at Yuma, AZ
I&) 850MB-YUMA PATTERN COMP !
iii.":::•. ', , •' "•.-.'-.'.
ß 40
4
3
• 20
1
o
120W 90W
lO
8
6
4
2
o
120W 90W
(•O) 500MB-YUMA PATTERN COMP :*•i'•"•"• • SIP-YUMA PATTERN COMP ,,to-' :-• '7-"07 "-i•i •i•' ..... ' .............. •::•r?.. .......... • .... . .-- .
15 20 40 -'
12 16
9 12
20 6 3
0
E , 120W 90W 120W 90W
Figure 8. (a) NCEP Reanalysis850-mbar geopotential height anomalies composited using anomalous surface winds at Yuma, Arizona. See text for details. Contour and shading interval is 1 m: (b) Same as Figure 8a except for 700- mbar geopotential height anomalies. Contour and shading interval is 2 m: (c) Same as Figure 8a except for 500- mbar geopotential height anomalies. Contour and shading interval is 3 m: (d) Same as Figure 8a except for sea-level pressure anomalies. Contour and shading interval is 0.4 mbar.
southwestern United States, in agreement with results from the 30-day regional modeling simulations presented above.
It should be noted that neither the composite plots nor the correlation plots show any indication of increased wind speeds due to tropical storms south of Baja California. Individual examination of the NCEP Reanalysis data and surface winds indicates that tropical storms do result in increased southerly flow over Yuma. Their exclusion from the statistical fields is due to the fact that there is no fixed storm track for these events. In
contrast, the propagation of easterly troughs over the Sierra Madre Occidental tends to result in a region of consistent low- pressure formation; the reason for this consistent geographical pattern is unclear at this time.
The large-scale and fine-scale geopotential height plots associated with surge events indicate that upper air wind vectors over the Gulf of California are largely in geostrophic balance with pressure gradients established by the presence of tropical cyclones to the south of Baja California or low-level troughs to the west of the peninsula. Data from the two regional models indicate that the low-level winds over the Gulf are also in
geostrophic balance. Figure 10 shows the composite 950-mbar RSM 1 geopotential heights and wind vectors for all surge events (results are qualitatively similar if the surge periods are subdivided into easterly trough surges and tropical-cyclone surges). Also shown in Figure 10 are the low-level (c•=0.96; approximately 450 m above ground level) geostrophic and simulated wind vectors calculated from daily-averaged pressure gradient budget terms and daily-averaged Coriolis budget terms,
respectively. The low-level geostrophic wind vectors over the Gulf of California show strong similarity with actual simulated winds, particularly over the southern Gulf. Over the northern Gulf the 950-mbar heights taken from the RSM1 indicate some cross-isobar flow; however, the geostrophic wind vector field indicates that winds along the entire Gulf remain geostrophic, with large ageostrophic flow confined to land regions. Interestingly, momentum budget terms (not shown) indicate that the small residual from the geostrophic balance over the Gulf is actually balanced predominantly by the horizontal advection term, not friction, suggesting that the surge-event winds are being channeled by the elevated mountain ranges over Baja California and the Sierra Madre Occidental.
It should be noted that this geostrophic balance is not indicative of the dynamics of the initial surge front (in which there is strong observed acceleration of surface winds); initiation of the surge events appears to be the result of strong pressure- gradient forcing at the mouth of the Gulf of California, resulting in a surge front which propagates up the Gulf of California over the span of 18-30 hours [Stensrud e! al., 1997]. However, Figures 2 and 3 indicate that once the initial surge front has passed, southeasterly winds over the Gulf persist for 2-4 days. As shown here, these winds are maintained by a geostrophic balance between low-pressure centers located to the southwest of the Gulf and high pressures situated over the Sierra Madre Occidental to the northeast, supporting along-gulf flow through approximately 800 mbar (with even deeper flow seen in tropical- cyclone-induced surges).

24,464 ANDERSON ET AL.: MONSOON SURGES OVER THE GULF OF CALIFORNIA
Correlation of NCEP Reanalysis Upper Air Patterns with Anomalous Surface Winds at Yuma, AZ
CORR, 700MB-YUldA CORR.
40
•o
E IgOW
MA CORR,
1gow 9ow
Figure 9. (a) Correlation of NCEP Reanalysis 850-mbar geopotential height anomalies with anomalous surface winds at Yuma, Arizona. See text for details. Contour and shading interval is 0.05. Lowest contour is 0.2 (approximately the 90% confidence level): (b) Same as Figure 9a except for 700-mbar geopotential height anomalies: (c) Same as Figure 9a except for 500-mbar geopotential height anomalies: (d) Same as Figure 9a except for sea-level pressure anomalies.
3.3. Case Study
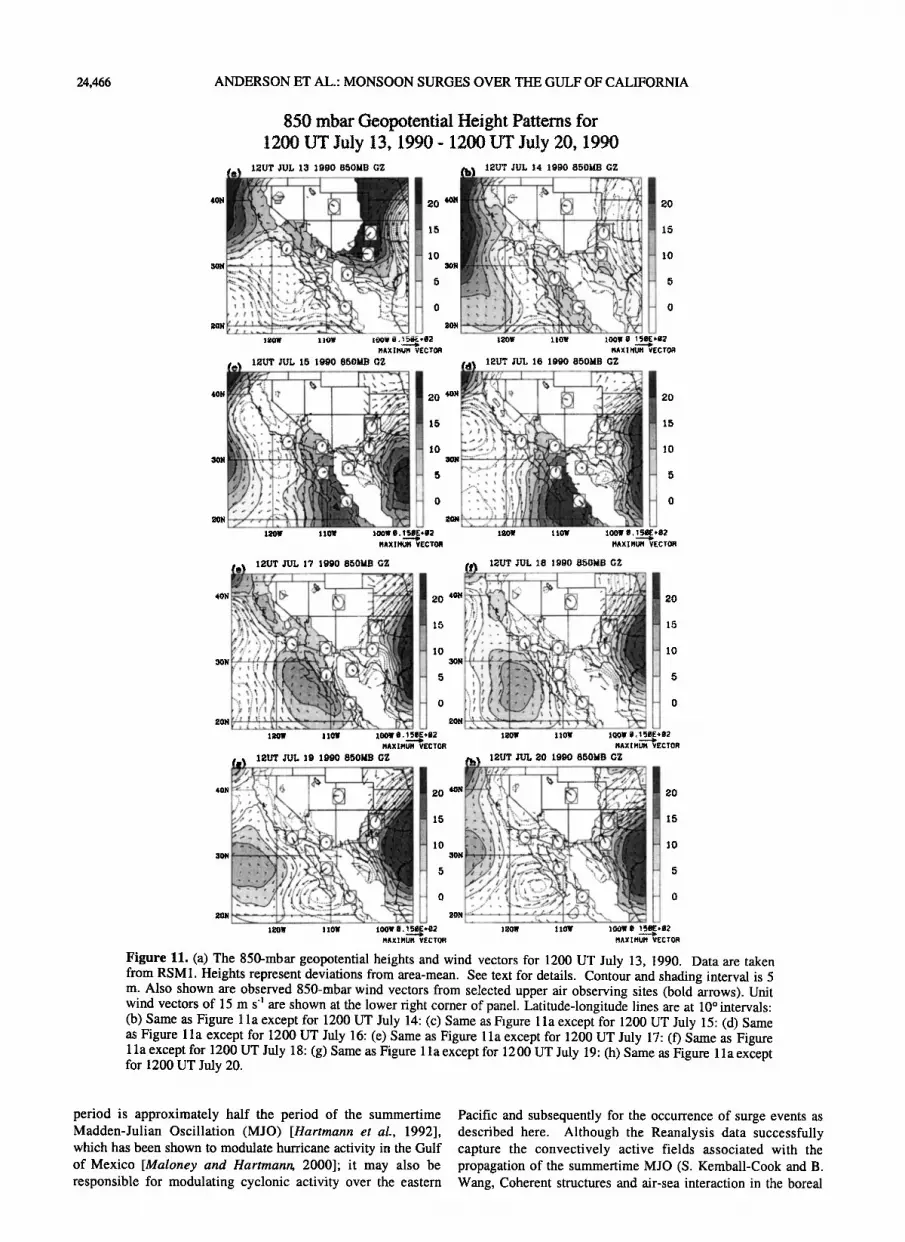
Time series presented in Figures 2 and 3 suggest that the timescale for most surge events is 2-4 days with weak southerly or northerly winds present in between events. Although this paper has presented composite averages of the large-scale structures associated with low-level surge event winds over the Gulf of California, it is of interest to see how these large-scale fields develop over time.
A case study of the time evolution of these upper air patterns is presented in Figure 11. This figure shows the 8-day evolution of the RSM1 850-mbar height field starting from 1200 UT July 13, 1990 (as before, the geopotential heights are given as departures from the area-mean geopotential height). Also included are the corresponding radiosonde observations at selected observing sites. At the onset (Figures 1 la and 1 lb) the low-level pressure system associated with Hurricane Genevieve can be seen in the southern portion of the domain with surge-type winds over the Sierra Madre Occidental and Gulf of California,
extending into the southwestern United States (e.g., the T2 1990 surge event); observed winds over the Sierra Madre Occidental show similar features, although, as mentioned before, the model simulation seems to overemphasize surge-type winds at Miramar. As time progresses (Figures 11c-11e), the hurricane moves westward, and high pressures form over the foothills of the Sierra Madre Occidental and the eastern Pacific. It is interesting to note here that at 1200 UT July 15 both observed and simulated winds
have a northerly component over the Mazatlan site, even though this time period, and the next, are still considered part of the T2 1990 surge event. It appears that winds in this southern region come under the influence of the high-pressure system over the Sierra Madre Occidental prior to those over the northern Gulf, hence the northerly component seen in the tropical-cyclone surge composite (see Figure 5a).
By 1200 UT July 17, 1990 (Figure 1 lf), however, the center of the ridge has moved from western Mexico out over the eastern Pacific, resulting in strong northerly flow over the entire Sierra Madre Occidental and the central and southern portions of the Gulf, seen in both simulations and observations (no observational data were available for Empalme for 1200 UT July 18, 1990). The high continues to move westward; as it does so, a closed low first forms over the Sierra Madre Occidental and then shifts to
over Baja California and finally to over the eastern Pacific, where it initiates the E2 1990 surge event. This strong cyclonic circulation is clearly evident in the observed wind vectors over Mazatlan and Empalme for 1200 UT July 19, with resultant surge winds seen over Empalme 24 hours later.
Although this progression is fairly dramatic and seems to repeat itself following the T1 1995 surge event, it may not necessarily be typical. It appears that the passage of low-level troughs and tropical cyclones can coincide (i.e., the T3 1990 surge event); in addition, low-level troughs can also precede the passage of tropical cyclones (i.e, the E1 1990 surge event or the

ANDERSON ET AL.: MONSOON SURGES OVER THE GULF OF CALIFORNIA 24,465
Low-level Geopotential Heights and Wind Fields for Surge Periods
(&• 950MB HEIGHT
40N ,•
:"
120W t 10W 100W
'b) GEOS. WIND PATTERN
l•0W 110W 100W •, •gE+g2 ....
,•XlnU, vect0a
Figure 10. (a) Surge-event daily-averaged RSM1 950-mb• heights and wind vectors. Heights represent deviations from area- mean. See text for details. Contour and shading interv• is 5 m. Unit wind vectors of 10 m s -• are shown at the lower right corner of panel. Latitude-longitude lines •e at 10 ø intervals: (b) Surge- event daily-averaged RSM1 low-level (•=0.96) geostrophic wind vectors (thin •ows) and simulated wind vectors (bold arrows). See text for details. Unit wind vectors of 10 m s -• are shown at the lower right comer of each panel.
E2 1995 surge event). Suffice it to say here that more study of the dynamics affecting these two tropical synoptic patterns, and their interaction, is necessary.
4. Summary and Discussion
A numerical investigation of the summertime wind patterns over the Gulf of California has been presented. Research focused upon the simulation of this wind field using a regional spectral modeling system.
It was shown that overall, the system contains large synoptic variability. Of considerable importance to this variability is the initiation and persistence of surge events. By systematically isolating those periods during which low-level surge-type winds were present over the Gulf, it was shown that surge events were
associated with large-scale low-pressure systems situated to the west of central and southern Baja California. These low-pressure systems either moved up from the tropical Pacific in the form of tropical cyclones (classified here as tropical-cyclone surges) or moved from the east over the Sierra Madre Occidental and the
central and southern Gulf (referred to as easterly trough surges). Although the large-scale forcing differed slightly, with tropical- cyclone surges showing more vertically and horizontally extensive surge-type geopotential height structures, both indicated that daily-averaged surge-event winds were related to large-scale cyclonic flow associated with geopotential height patterns established by the low-pressure systems.
The characteristic geopotential patterns could also be found in the coarse-scale NCEP Reanalysis data; in addition, similar upper air patterns were seen in Reanalysis data when composited with significant southerly surface winds over Yuma for the 11-year period 1985-1995. The vertically extensive, persistent surge- event winds were shown to be primarily geostrophic responses to the presence of the low-pressure systems to the south and west of Baja California. Convective activity was also associated with these low-pressure systems, but as shown by previous authors, the convection does not need to be included in order to properly simulate the surge event winds [Stensrud et al., 1997].
It thus appears that low-level wind patterns over the Gulf of California are strongly influenced by large-scale tropical dynamics. However, understanding and forecasting the synoptic dynamics for this region still require further investigation. In particular, the formation and propagation of easterly troughs across the Sierra Madre Occidental are not well understood. Case
studies of easterly troughs found during these two time periods suggest that most did not originate from any farther east than the Texas coastline. Possibly these troughs arise as easterlies flow across the Sierra Madre axis; if this is the case, there is most
likely some type of critical condition that allows for their formation.
Additionally, the initiation and time evolution of tropical- cyclone surge events are still not well understood. For instance, it was shown that the characteristic upper air patterns associated with cyclone-induced surges are found in even the coarsest-scale model and in the absence of orography over Baja California. The width of the characteristic pressure patterns is typically 200 km, close to the Rossby radius aloft. In addition, the establishment of these pressure patterns precedes the arrival of the cyclone itself and may exist despite the confinement of the cyclone to the tropics. Thus, although the composite patterns are predominantly geostrophic, the dynamic characteristics of these patterns most likely involve the quasi-geostrophic adjustment of the large-scale synoptic pressure patterns to the presence of the elevated topography of the Sierra Madre Occidental and may be related to large-scale topographically trapped features such as shelf waves or Kelvin waves.
Finally, the relationship between these surge events and intraseasonal variability in the large-scale and fine-scale hydrologic cycle still needs to be evaluated. As mentioned in the introduction, the dominant mode of intraseasonal variability in the precipitation record over Arizona has a timescale of 12-18 days (and not the 2-5 days associated with synoptic-scale surge events), although the composite patterns of upper air dynamic and hydrodynamic fields associated with "bursts" and "breaks" in precipitation over Arizona [see Mullen et al., 1998, Figures 8 and 9) strongly resemble the large-scale upper air patterns associated with surge events presented here. Interestingly, the 12- to 18-day
24,466 ANDERSON ET AL.' MONSOON SURGES OVER THE GULF OF CALIFORNIA
850 mbar Geopote'ntial Height Patterns for 1200 UT July 13, 1990- 1200 UT July 20, 1990
2O
1o
2O
15
t0
100• 0. J 51•E*t•2 MAXIMUM VECTOR
120W IIOW 100W MAXIMUM VECTOR
2O
15
10
..................... •o• -: .... .:'• :• " •: ' ':," ....;.---- [t• • ' . ::- . ': ..... ?"" ,• ['i, .... • : ,<:,'-- :':'jp'-:'
r,,:t, ,%,: •o •; ' ' ...... ' ' ': :?
, -• ........... : ..... . •...,.,',q• ,.:. -'-:..::.:... • , :::::::::::::::::::::::::::::::::::::::::::::::::: .-..i
'• ):•:::•'*•"':::½r::• '-". • "=====================-" :% "•'• ,:.:- =,
,.0. ========================:"::":"', '? .:: ..
100W ½, 15•E+I•2
MAXIMUM VE6TOR
20
10
IaO'W 1 tO{ 100W •1.15_•E+t12 l•OW 110W MAXIMUM VECTOR
,,, I2UT JUL 19 1990 850•B CZ h 12UT JUL 20 1990 850MB CZ ß • ................... ( ) - . ß _ x •'/ ! I '
/; ;. '1• . . - ?./..,. ........ ..,• • : / ", ¾ ...---' ....
:t ':•x.- v • ' 15 . -•:•:= ..:• . .• ========================
..½-•-:'• ..... .q i. •• •""":•:•:':•": '• •'•N % -•/:: •:• ' .... .. :• 10 :•:'•a. - .. '-, '.: .'-" . .-::
30N ,,,.-...• x•: ..: '*:'":::""' ;•: ...... • •' •F.:: ':" z •/'y • i/• -• • • V- •.>' -'::.:/":•
20• x; 20N '" ' • ' ....... • ' ' ' ' • '3' '"" I •0• 110• 1•0• I IOW
Figure 11. (a) The 850-mbar geopotential heights and wind vectors for 1200 UT July 13, 1990. Data are taken from RSM1. Heights represent deviations from area-mean. See text for details. Contour and shading interval is 5 m. Also shown are observed 850-mbar wind vectors from selected upper air observing sites (bold arrows). Unit wind vectors of 15 m s -• are shown at the lower right comer of panel. Latitude-longitude lines are at 10 ø intervals: (b) Same as Figure 1 la except for 1200 UT July 14: (c) Same as Figure 1 la except for 1200 UT July 15: (d) Same as Figure 11 a except for 1200 UT July 16: (e) Same as Figure 11 a except for 1200 UT July 17: (f) Same as Figure 1 la except for 1200 UT July 18: (g) Same as Figure 1 la except for 1200 UT July 19: (h) Same as Figure 1 la except for 1200 UT July 20.
period is approximately half the period of the summertime Madden-Julian Oscillation (MJO) [Hartmann et al., 1992], which has been shown to modulate hurricane activity in the Gulf of Mexico [Maloney and Hartmann, 2000]; it may also be responsible for modulating cyclonic activity over the eastern
Pacific and subsequently for the occurrence of surge events as described here. Although the Reanalysis data successfully capture the convectively active fields associated with the propagation of the summertime MJO (S. Kemball-Cook and B. Wang, Coherent structures and air-sea interaction in the boreal
ANDERSON ET AL.' MONSOON SURGES OVER THE GULF OF CALIFORNIA 24,467
summer intraseasonal oscillation, submitted to Journal of Dunn, L.B., and J.D. Horel, Prediction of central Arizona convection, part Climate, 2000), the period of the MJO is longer than either of the regional simulations performed to date and therefore has yet to be evaluated within the context of the regional modeling system. The relationship between the fine-scale dynamic and hydrologic fields, and their intraseasonal variability, will be addressed further using a recently completed 3-month simulation of the 1999 summertime monsoon season.
Acknowledgments. This work is based in part on the Ph.D. thesis of B.T. Anderson and was supported by the UC Campus Laboratory Collaboration Program and a cooperative agreement from NOAA- NA77RJ0453. The views expressed herein are those of the authors and do not necessarily reflect the views of NOAA. NCEP/NCAR Reanalysis data were provided through the NOAA Climate Diagnostics Center. Radiosonde data were provided by FSL/NCDC's Radiosonde Data of North America, 1946-1996. Thanks are extended to the reviewers, as well as to numerous other readers, for all their insightful and constructive comments.
References
Adams, D.K., and A.C. Comrie, The North American monsoon, Bull. Am. Meteorol. Sot., 78(10), 2197-2213, 1997.
Anderson, B.T., Investigation of summertime low-level winds over the Gulf of California and the southwestern United States, Ph.D. thesis, 176 pp., Univ. of Calif., San Diego, 1998.
Anderson, B.T., J.O. Roads, S.-C. Chen, and H.-M.H. Juang, Regional simulation of the low-level monsoon winds over the Gulf of California
and southwestern United States, J. Geophys. Res., I05(D14), 17,955- 17,969, 2000.
Badan-Dangon, A., C.E. Dorman, M.A. Merrifield, and C.D. Winant, The lower atmosphere over the Gulf of California, J. Geophys. Res., 96(C9), 16,877-16,896, 1991.
Barlow, M., S. Nigam, and E.H. Berbery, Evolution of the North American monsoon systsm, J. Clim., II(9), 2238-2257, 1998.
Carleton, A.M., D.A. Carpenter, and P.J. Weser, Mechanisms of interannual variability of the southwest United States summer rainfall maximum, J. Clim., 3, 999-1015, 1990.
Dorman, C.E., Evidence of Kelvin waves in California's marine layer and related eddy generation, Mon. Weather Rev., I13, 827-839, 1985.
Dorman, C.E., Possible role of gravity currents in northern California's coastal summer wind reversals,./. Geophys. Res., 92(C2), 1497-1506, 1987.
Douglas, M.W., The summertime low-level jet over the Gulf of California, Mon. Weather Rev., 123, 2334-2347, 1995.
Douglas, M.W., R.A. Maddox, K. Howard, and S. Reyes, The Mexican monsoon, J. Clim., 6, 1665-1677, 1993.
I, Evaluation of the NGM and Eta model precipitation forecasts, Weather Forecasting, 9, 495-507, 1994a.
Dunn, L.B., and J.D. Horel, Prediction of central Arizona convection, part II, Further examination of the Eta model forecasts, Weather Forecasting, 9, 508-521, 1994b.
Farfan, L.M., and J.A. Zehnder, Moving and stationary mesoscale convective systems over northwest Mexico during the Southwest Area Monsoon Project, Weather Forecasting, 9, 630-639, 1994.
Hales, J.E., Southwestern United States summer monsoon source -- Gulf of Mexico or Pacific Ocean?, J. Appl. Meteorol., 13, 331-342, 1974.
Hartmann, D.L., M. Michaelson, and S. Klein, Seasonal variations of tropical intraseasonal oscillations: A 20-25 day oscillation in the western Pacific, J. Atmos. Sci., 49, 1277-1289, 1992.
Juang, H.-M. H., and M. Kanamitsu, The NMC nested regional spectral model, Mon. Weather Rev., 122, 3-26, 1994.
Juang, H.-M. H., S.-Y. Hong, and M. Kanamitsu, The NCEP regional spectral model: An update, Bull. Am. Meteorol. Sot., 78, 2125-2143, 1997.
Maddox, R.A., D.M. McCollum, and K.W. Howard, Large-scale patterns associated with severe summertime thunderstorms over central Arizona, Weather Forecasting, 10, 763-778, 1995.
Maloney, E.D., and D.L. Hartmann, Modulation of hurricane activity in the Gulf of Mexico by the Madden-Julian oscillation, Science, 287, 2002-2004, 2000.
Mass, C.F., and M.D. Albright, Coastal southerlies and alongshore surges of the west coast of North America: Evidence of mesoscale
topographically trapped response to synoptic forcing, Mon. Weather Rev., 115, 1707-1738, 1987.
Mass, C.F., and N.A. Bond, Coastally trapped wind reversals along the United States west coast during the warm season, part II, Synoptic evolution, Mon. Weather Rev., I24,446-461, 1996.
Mullen, S.L., J.T. Schmitz, and N.O. Renno, Intraseasonal variability of the summer monsoon over southeast Arizona, Mort. Weather Rev., 126, 3016-3035, 1998.
Stensrud, D.J., R.L. Gall, S.L. Mullen, and K.W. Howard, Model climatology of the Mexican monsoon, J. Clim., 8, 1775-1793, 1995.
Stensrud, D.J., R.L. Gall, and M.K. Nordquist, Surges over the Gulf of California during the Mexican monsoon, Mort. Weather Rev., I25, 417-436, 1997.
Tubbs, A.M., Summer thunderstorms over southern California, Mon. Weather Rev., I24, 785-806, 1972.
B. T. Anderson, University of Hawaii at Manoa, 2525 Correa Road, HIG 341, Honolulu, tlI 96822. (anderson @ soest.hawaii.edu)
S.C. Chen and J. O. Roads, Scripps Institution of Oceanography, University of California at San Diego, La Jolla, CA 92093-0224.
(Received January 13, 2000; revised May 18, 2000; accepted May 24, 2000.)