Observed vertical distribution of tropospheric ozone during the Asian summertime monsoon
Upload
independentCategory
view
1download
0
Multiplatform observations of dust verticaldistribution during transport over northwest Iranin the summertime
Farhad Abdi Vishkaee,1,2 Cyrille Flamant,3 Juan Cuesta,2 Pierre Flamant,2
and Hamid R. Khalesifard1
Received 2 June 2010; revised 8 December 2010; accepted 30 December 2010; published 11 March 2011.
[1] Dynamical processes leading to dust emission over Iran and surrounding countries inthe summer as well as the subsequent transport of dust toward northwest Iran are analyzedon the basis of two case studies using a suite of ground‐based and spaceborne remotesensing platforms together with modeling tools. Ground‐based lidar measurementsacquired in Zanjan provide new insight into the vertical distribution of dust linked totransport over northwest Iran and highlight the importance of low‐level transport of dustfrom both Iraq and Iran for air quality issues in Tehran. During the 3–5 August 2007 case,dust emission regions are located in Syria/Iraq and close to Qom, Iran, in a largeintermittent salt lake in the western part of the Dasht‐e Kavir desert. The visibility inTehran associated with this event decreases significantly (reaching 7 km) on 5 August2007 only. During the 11–13 September 2008 case, the dust transported to northwest Iranoriginates from Syria/Iraq only. The visibility in Tehran during this case is low throughoutthe period, sometimes less than 5 km due to the transport of dust at low levels. In bothcases, emissions in Syria and Iraq occur in response to strong Shamal winds. However,transport of dust toward Iran takes place at different levels: above 700 hPa in August andbelow 700 hPa in September. This is found to be related to the presence of strongnortheasterly winds over the Zagros Mountains as well as in its lee (south of the range) inthe August case only. In August also, dust emissions in the Qom region results from strongwinds blowing over the Dasht‐e Kavir desert.
Citation: Abdi Vishkaee, F., C. Flamant, J. Cuesta, P. Flamant, and H. R. Khalesifard (2011), Multiplatform observations ofdust vertical distribution during transport over northwest Iran in the summertime, J. Geophys. Res., 116, D05206,doi:10.1029/2010JD014573.
1. Introduction
[2] Iran is climatically part of the Afro‐Asian belt of de-serts that stretch from the Cape Verde islands off WestAfrica all the way to Mongolia near Beijing, China, gener-ally referred to as the dust belt. It is located in the neigh-borhood of some important dust sources: the Tigris andEuphrates basin in Iraq as well as Syria to the west, theArabian Peninsula to the south and southwest and theTurkmenistan basin to the north [Prospero et al., 2002].These sources are among the most active in the dust belt[Middleton, 1986a, 1986b; Prospero et al., 2002; Leon andLegrand, 2003]. There also exist some active dust sourceswithin Iran, which are mainly located in the vicinity of drysalt lakes, seasonal lakes and drainage basins in mountain-
ous areas [Middleton, 1986a, 1986b] which can be detectedfrom space using the Total Ozone Mapping Spectrometer(TOMS) [Prospero et al., 2002; Leon and Legrand, 2003;Washington et al., 2003]. As a result, Iran is prone to duststorms from both internal and external sources, which cau-ses the horizontal visibility to decrease below 11 km (indi-cating the presence of aeolian dust) more than 30% of thetime in summer [Kutiel and Furman, 2003].[3] Due to the specificity of its orography (characterized by
the merging of two major mountain ranges; see section 2.1)as well as the proximity of Iraqi sources, northwest Iran isoften at the confluence of dust plumes transported frominner Iran, Iraq and Turkmenistan during the summer. As aresult, cities in northwest Iran are prone to dust events on aregular basis in the summertime. Figure 1 shows the numberof occurrence of episodes characterized by horizontal visi-bility less than 10 km in Tehran for the period 2006–2009 inAugust and September. Even though episodes characterizedby visibility less than 2 km are quite rare (visibilities lessthan 2 km are generally considered to be representative ofdust storms, see discussion in section 2.3), a significantnumber of cases when visibility is between 3 and 10 km
1Institute for Advanced Studies in Basic Sciences, Zanjan, Iran.2Laboratoire de Météorologie Dynamique, CNRS and Ecole
Polytechnique, Palaiseau, France.3Laboratoire Atmosphères, Milieux, Observations Spatiales, CNRS,
UMR 8190, Paris, France.
Copyright 2011 by the American Geophysical Union.0148‐0227/11/2010JD014573
JOURNAL OF GEOPHYSICAL RESEARCH, VOL. 116, D05206, doi:10.1029/2010JD014573, 2011
D05206 1 of 13

have been observed in the period 2006–2009, meaning thatthe city of Tehran is repeatedly impacted by blowing dust(pollution related to industries and traffic has been shown toaffect air quality in Tehran mainly during the cold season[Halek et al., 2009]). During dust storm episodes, Tehranofficials frequently call people off work because of dusthazards as such storms are known to have an impact on airpollution and public health under hot and dry climate [Miriet al., 2007]. Furthermore, the reduction of visibility asso-ciated with dust storms has incidence on both surface andairborne traffic [e.g., Kutiel and Furman, 2003, and refer-ences therein].[4] The Iranian Meteorological Service is operating a
dense network of surface meteorological stations as well asballoon launching facilities for upper‐level measurements.However, this network alone does not provide the ob-servations necessary to improve knowledge on the dynam-ical processes responsible for dust emission and transportover Iran and adjacent countries that lead to the observationof dust plumes over northwest Iran during the summertime.In this paper, advantage is taken of the suite of remotesensing instruments (ground‐based lidar, Sun photometer)operated at the Institute for Advanced Studies in BasicSciences (IASBS) in Zanjan to analyze the origin and thevertical distribution of the dust plumes transported overnorthwest Iran from adjacent regions, on the basis of twocase studies. The observations key to this paper is the lidarobservations from Zanjan. The two cases are selected on thebasis of lidar data quality and availability. Just as Tehran,the city of Zanjan (located to the northwest of Tehran; seeFigure 2), is prone to dust events (aeolian dust but also duststorms) from both inner and outer source regions.[5] To the authors best knowledge, this paper is the first to
combine ground‐based and spaceborne active and passiveremote sensing observations with in situ meteorological andnumerical weather prediction model reanalyses to investi-gate dust emission and transport over Iran. Previous worksconcerning dust activities over Iran mostly focused on
synoptic parameters reported by local meteorological sta-tions [Esmaili et al., 2006], passive remote sensing fromspace [Esmaili et al., 2006; Prospero et al., 2002; Leon andLegrand, 2003;Washington et al., 2003], or Sun photometer(SPM) measurements in the Persian Gulf region [Smirovet al., 2001].[6] The paper is organized as follows: In section 2, the
data sets utilized in this study are introduced. Section 3provides an overview of dust sources impacting northwestIran in the summer as well as the dust transport patterns.Section 4 and section 5 detail the case studies of transportover Zanjan on 5 August 2007 and 13 September 2008,respectively. Section 6 provides a summary and conclusions.
2. Data
2.1. Orography
[7] Figure 2 shows a map of orography in Iran as providedby the Global Land One‐km Base Elevation Project(GLOBE, available from http://www.ngdc.noaa.gov/mgg/topo/globe.html [GLOBE Task Team et al., 1999]). Iran issituated in a high‐altitude plateau surrounded by connectedranges of mountains and divided into drainage basins [Barthand Boer, 2002]. The Alborz Mountains run along thenorthern border of Iran, while the Zagros Mountains runalong its western border. The two mountain ranges merge inthe northwest corner of Iran. The crest line of both moun-
Figure 1. Number of occurrences of events with horizontalvisibility at the surface less than 10 km in Tehran. The 3‐hourly data are used for the period 2006–2009, in August(red solid line with triangles) and in September (blue dashedline with diamonds).
Figure 2. Map of orography in Iran as provided by theGlobal Land One‐km Base Elevation Project (GLOBE,available from http://www.ngdc.noaa.gov/mgg/topo/globe.html). The location of Zanjan is indicated by an asterisk.The QDL, located in the western part of Dasht‐e Kavir,south of Tehran, is marked with a plus and a visible bound-ary. The location of three radiosounding stations (Tehran,Tabriz, and Kermanshah) are indicated as squares. Theorange contour labeled “1” delineates the prominent clusterof sources lying in a basin straddling the border betweenIran and Afghanistan. The orange contour labeled “2” corre-sponds to the limits of the Hamoun Jaz‐Mourian lakelocated at the southern end of the Lut Valley (southern tipof the Dasht‐e Lut desert). The dashed blue line indicatesthe location of the cross sections shown in Figure 8.
ABDI VISHKAEE ET AL.: DUST OBSERVATIONS OVER NORTHWEST IRAN D05206D05206
2 of 13

tains is above 2500 m above mean sea level (msl) alongmost of their length. The highest points of Alborz mountainare above 4000 m msl.
2.2. Surface‐Based Remote Sensing Measurementsin Zanjan
[8] In this study all measurements performed in Zanjan(36.7°N/48.5°E) are located at 1800 m msl at IASBS. Abackscatter lidar [Khalesifard et al., 2005] is used toinvestigate the vertical distribution of aerosols over Zanjan.The lidar‐derived reflectivity at 532 nm is mostly sensitiveto aerosols with radii ranging from 0.1 to 5 mm, and hence todust aerosols, among others. In the dust belt, close to thesources, desert dust particles are generally considered to behygrophobic [e.g., Fan et al., 2004] and their properties(e.g., size and shape) do not evolve significantly duringtransport. Therefore, reflectivity associated with desert dustcan be used as a proxy for dust concentration [Cuesta et al.,2008; Flamant et al., 2007], a decrease or an increase inreflectivity being associated with dust sedimentation or dustuplift, respectively.[9] The vertical and temporal resolutions of the lidar re-
flectivity profiles shown in this study are 12 m and 1 min,respectively, the latter being obtained after averaging 1200individual laser shots acquired at a repetition rate of 20 Hz.Finally, usefully backscatter signal is fully recovered above500 m above ground level (agl) by overlapping of thetelescope field of view and laser emission, meaning that nomeaningful data can be exploited below that height.[10] A SPM (CIMEL, model: CE318‐2), located close to
the lidar, measures the AOD at five wavelengths [Bayat etal., 2010]. Data are only available in September 2008.
2.3. Regional Networks
[11] Local meteorological measurements performed by anautomatic weather station (CIMEL, model: ENERCO 408p)in Zanjan is used in this study. The station reports surfacedata including pressure, temperature, humidity and windspeed and direction. The horizontal visibilities are providedby Zanjan and Qom meteorological station (see Figure 2 forlocation). Horizontal visibility reported by ground stationobservers are an indication of the presence of high aerosolloads in the lower atmosphere (the data is available fromhttp://www.irimo.ir).[12] A crucial criterion for the existence of a dust source is
the availability of fine deflatable material, which can belifted up from the ground when the surface wind velocityexceeds a certain threshold wind speed. This threshold hasbeen shown to be between 4 and 12.5 m s−1 in westernSahara [Fernandez et al., 1986; Pye, 1987; Helgren andProspero, 1987]. Hence, wind speed observations can pro-vide valuable information regarding the potential activationof given dust sources.[13] The horizontal visibility is the maximum distance at,
which an observer can see and identify an object lying closeto the horizontal plane on which he or she is standing(American Meteorological Society glossary). In this paper,dust storms are considered to be associated with visibilityvalues of 2 km or less. This threshold value on visibility isdifferent than the internationally agreed definition of a duststorm, which involves a reduction of visibility to less than1 km [Middleton, 1986b;Engelstaedter et al., 2003;Kurosaki
and Mikami, 2003]. However, Mahowald et al. [2007] sug-gested that such low visibility values may be caused bysmall scale aerosol events and that visibility values repre-sentative of long‐range transport are in the range 2–9 km.Using the 2 km value is thought to be more in line with theidea that the dust storms are not from local sources but ratherare associated with long‐range transport from remote sour-ces. Furthermore, the 2 km threshold on visibility is alsomore consistent with the definition used by the Iran Mete-orological Services to compile a climatological record ofdust storm events through the country (available throughtheir web site at www.irimo.ir). In the case of propagativedust storms, the arrival of airborne dust at a given site isgenerally associated with a significant decrease in visibility.At the other end of the spectrum, visibility values above12 km are considered to be representative of clean airconditions, as visibility values associated with blowingdust is generally considered to be less than 11 km [Kutieland Furman, 2003]. Values of visibility ranging from 3 to10 km can therefore be associated with more or less thickaeolian dust plumes.[14] The Zanjan meteorological office does not have its
own balloon launching facilities. Instead, data from the closestradiosonde stations are used, namely Tehran‐Mehrabad(35.7°N, 51.3°E, 1204 m msl, ≈250 km from Zanjan), whichreleases two radiosondes per day at synoptic hours (0000 and1200 UTC), Tabriz (38.1°N, 46.3°E, 1367 m msl, ≈235 kmfrom Zanjan), which launches a single radiosonde per day at0000 UTC, and Kermanshah (34.3°N, 47.1°E, 1420 m msl,≈290 km from Zanjan), which launches two radiosondesper day at 0000 and 1200 UTC. Of particular interest for ourstudy is the height of elevated temperature inversion which isan indication of the location of atmospheric lids responsiblefor the vertical stratification of aerosols at the regional scale.The radiosonde data are taken from the radiosondes datacenter of University of Wyoming (http://weather.uwyo.edu/upperair/sounding.html).
2.4. Spaceborne Observations
[15] The regional distribution of dust aerosols (mobiliza-tion and transport) is described using two complementarysatellite products. First, the Moderate‐resolution ImagingSpectroradiometer (MODIS) fields of aerosol optical depth(AOD) are obtained from the MODIS/AQUA Deep BlueCollection 005 over desert surfaces (MOD08 product). Notethat only the daily level‐3 AOD product at 550 nm are used.This product is processed with the deep blue algorithm [Hsuet al., 2004] and available from the Giovanni web portal(http://disc.sci.gsfc.nasa.gov/giovanni). Since dust absorbsradiation in the blue wavelength range, and becauseabsorption by these aerosols in this part of the spectrumincreases with increasing altitude (as in the ultraviolet),elevated dust plumes are generally detected better thanaerosol layers confined at low levels. This can lead to anunderestimation of the AOD associated with shallow dustplumes located near the Earth’s surface. The MODIS AODproduct used in this study is a level‐3, gridded (1° × 1°),daily product, representative of the aerosol load at midday.Second, the vertical distribution of the aerosols is docu-mented at the regional scale using the spaceborne Cloud‐Aerosol LIdar with Orthogonal Polarization (CALIOP)[Winker et al., 2007] on board the Cloud‐Aerosol Lidar and
ABDI VISHKAEE ET AL.: DUST OBSERVATIONS OVER NORTHWEST IRAN D05206D05206
3 of 13

Infrared Pathfinder Satellite Observations (CALIPSO) sat-ellite (launched in April 2006).[16] CALIOP‐derived particle extinction coefficient pro-
files (at 532 nm) are obtained from our own calculation(using level 1B version 2 data) as in work by Cuesta et al.[2009] and Messager et al. [2010]. The atmosphericextinction coefficient profiles are retrieved with a verticalresolution of 60 m and a horizontal resolution of roughly12 km. We expect the uncertainty on the extinction coeffi-cient and on the AOD to be on the order of 30%, accountingfor an uncertainty of 20% on both the BER and the multiplescattering coefficient. Data from 2 overpasses (1 daytimeand 2 nighttime overpasses) are used to analyze the August2007 case study: around 0858 and 2302 UTC on 3 August2007 as well as around 2249 UTC on 5 August. The daytime(nighttime) overpass on August is as close as 10 km (40 km)from Zanjan.
2.5. Numerical Prediction Model Reanalysesand Back Trajectory Analyses
[17] Synoptic‐scale meteorological conditions are estab-lished using 6‐hourly ECMWF reanalyses of horizontalwinds at the surface, 700 and 500 hPa. The resolution ofreanalyses for the region covering middle east is about 1.12°[Buizza, 1997]. Wind speeds issued from the reanalyses canprovide valuable information regarding the potential acti-vation of given dust sources at the regional scale. In addition,ECMWF reanalyses are used to document the dynamicalconditions over the dust source areas (QDL and over Iraq).[18] The dust transport patterns between the source re-
gions and Zanjan is assessed from back trajectory analysesusing the HYSPLIT4 (HYbrid Single‐Particle LagrangianIntegrated Trajectory) model (R. R. Draxler and G. D.Rolph, 2003, http://www.arl.noaa.gov/ready/hysplit4.html;G. D. Rolph, Real‐time Environmental Applications andDisplay sYstem (READY), 2003, http://www.arl.noaa.gov/ready/hysplit4.html). These are computed using the GlobalForecast System model from the National Centers forEnvironmental Prediction. There has been some discussionof the applicability of HYSPLIT‐derived back trajectorieswhen they pass through the convective atmosphericboundary layer (ABL), as they are solely computed from thethree components of the wind and boundary layer mixing isnot accounted for [Wiacek et al., 2010; Knippertz et al.,2009]. This may be a limitation for the interpretation ofthe trajectories arriving in Zanjan, since strong mixing isexpected within 4 km deep ABLs in the daytime overnorthwest Iran, as generally observed over the deserts. Inorder to account for the inherent uncertainty of trajectorycalculations, the back trajectories are calculated as en-sembles arriving within a specific arrival domain as in workby Sodemann et al. [2006]. Horizontally, arrival points oftrajectories are set up as a triangle with Zanjan in the middle.The coordinate of the 3 points are (37.2°N/48.0°E), (36.2°N/48.0°E) and (36.6°N/49.2°E). Vertically, 6 arrival levelsranging between 0.5 and 4 km agl (0.5 and 3 km agl) arechosen for the August (September) case. The start‐pointaltitude and time for the back trajectories are defined basedon the ground‐based lidar observations. In total, ensembleswith 72 h back trajectories from 18 starting points are cal-culated every 6 h for each case.
[19] Finally, since ECMWF reanalyses are used forlooking at synoptic circulation and NCEP reanalyses forrunning the HYSPLIT model, the consistency between thetwo reanalyses is crucial. A comparison between the NationalCenters for Environmental Prediction and ECMWF windfields at 10 m, 700 hPa and 500 hPa conducted on bothcases highlights the coherence between the two reanalyses(not shown).
3. Overview of Dust Sources and TransportPatterns
[20] In the summer, the thermal lows over interior Iranand southeastern Saudi Arabia are at peak strength. Condi-tions are mostly cloud‐free, hot, dry and windy, the lattertwo characteristics are favorable to the activation of existingdust sources.
3.1. Sources Outside of Iran
[21] Dust activity in the Tigris‐Euphrates basin begins inMay, reaches a maximum in July, and is much reduced inSeptember–November [Prospero et al., 2002]. During thissummer season the region is dominated by northwesterlyShamal winds. According to Middleton [1986a, 1986b], thestrong Shamal winds lift up dust from the lower Tigris‐Euphrates basin and carry it down at the Persian Gulf.[22] North of Iran, there is persistent dust activity in the
region between the Caspian and Aral Seas (Caspian seaeastern shoreline), as well as at southeast end of the TuranPlain (eastern Turkmenistan). Activity generally starts inMay and extends through August with the peak in June andJuly [Prospero et al., 2002].[23] Dust activity is visible over much of the Arabian
Peninsula all year long, but is maximum in June and Julywhen much of the peninsula is covered with dust [Prosperoet al., 2002; Washington et al., 2003].[24] Depending on the prevailing conditions, the dust
lifted up in these source regions can be advected over Iran.However, direct transport over Iran is often complicated bythe presence of mountains between the dust sources to thenorth, west and southwest and central Iran (Figure 2). TheAlborz and Zagros Mountains act as barriers for impingingair masses, and control the partition between flow aroundand flow above the mountain range [Smith, 1989]. In orderfor dust to be transported into Iran, it must reach the heightabove, which the impinging air is forced to flow over amountain. This can be achieved via several dynamical me-chanisms: diurnal vertical mixing or dynamical lifting (e.g.,low‐level cold air outbreaks) as evidenced for instance overwest and north Africa [Cuesta et al., 2009]. In the formercase, the dust lifted up from the ground may get well mixedin the vertical throughout the depth of the ABL during thedaytime. In the summer and over the desert‐type environ-ments such as those prevailing in the dust belt region, ABLsmay get relatively deep, their top sometimes reaching 4 to5 km. These heights are sufficient in order for aerosols to betransported over the mountains and into Iran in the form ofelevated dust layers. In the latter case, cold air fronts asso-ciated with midlatitude troughs can induce low‐level intru-sions of clean and cold air and favor uplift of dust alongisentropes (a process termed “upliding” by Hoskins et al.[1985]). However, frontal systems usually do not reach
ABDI VISHKAEE ET AL.: DUST OBSERVATIONS OVER NORTHWEST IRAN D05206D05206
4 of 13

this area during the summer and this latter process is notexpected to play a role in the lifting up the dust over Iraq,the Arabian Peninsula or Turkmenistan.
3.2. Iranian Sources
[25] Dust storms occur, with varying frequency, in allparts of Iran [Middleton, 1986b]. In TOMS, dust activitystarts in April and May, becomes strong in June and July,and is greatly weakened in September [Prospero et al.,2002; Leon and Legrand, 2003], a cycle consistent withthe seasonality of dust storm reports [Middleton, 1986b].[26] A prominent cluster of sources lies in a basin centered
at 31°N, 61.5°E, straddling the border between Iran andAfghanistan (labeled “1” in Figure 2). The basin receivesmuch runoff from the Sistan Mountains to the west in Iranand the eastern mountains in Afghanistan. The area isaffected by the wind of 120 days, a northerly wind that canblow at speeds of over 28 m s−1 for days during the mainseason of activity, i.e., May, June and July [Middleton,1986b].[27] The central part of Iran is covered by two large deserts,
the Dasht‐e Kavir (centered around 34.3°N, 55.2°E, coveringan area of 77600 km2) and the Dasht‐e Lut (centered around31.3°N, 58.8°E, covering an area of 51800 km2). TOMSshows a particularly intense source centered over the westernpart of the basin (in the region close to Tehran) where thereare many large drainage channels and a number of ephemerallakes and marshes, including a large intermittent salt lake,Daryacheh‐ye Namak (1825 km2), close to the city of Qom,
often referred to as the Qom Dry Lake (QDL; see Figure 2).The QDL is the active dust source nearest to the Zanjan area.The Hamoun Jaz‐Mourian lake (1087 km2) is a seasonal lakeknown to be an active dust source located at the southern endof the Lut Valley (southern tip of the Dasht‐e Lut desert,labeled “2” in Figure 2).[28] Under particular conditions, strong low‐level winds
may be observed in the lee side of the mountains, associatedwith the flow around the range and/or downslope winds. Inthis case (strong winds flow over Iranian sources regions),the dust sources can be activated [e.g., Middleton, 1986b].Gap flows through deep passes in the Zagros and AlborzMountains can also lead to strong low‐level jets downstreamof the range that can blow over dust sources, as is the caseover Hamoun Jaz‐Murian lake [Liu et al., 2000] (but for awinter time case).
4. The 3–5 August 2007 Case
[29] In the following, we analyze the vertical distributionof dust over Zanjan on 5–6 August and the related planetaryboundary layer (PBL) diurnal cycle. Links with regionaldust transport from Iran and surrounded countries are alsoassessed.
4.1. Observations of the PBL Residual Layer
[30] Figure 3a shows the time‐height series of lidar re-flectivity recorded at IASBS on 5 August 2007. In themorningand early afternoon (0700–1100 UTC, 1030–1430 LT) an
Figure 3. (a) Time‐height series of lidar attenuated backscatter profiles recorded in Zanjan (at 532 nm)between 0700 UTC on 5 August 2007 and 0200 UTC on 6 August 2007. Both UTC time (bottom axis)and local time (top axis) as well as both altitude above ground level (left axis) and above sea level (rightaxis) are indicated. (b) Horizontal visibility reported by the Zanjan meteorological station observer on5 August 2007.
ABDI VISHKAEE ET AL.: DUST OBSERVATIONS OVER NORTHWEST IRAN D05206D05206
5 of 13

Figure 4
ABDI VISHKAEE ET AL.: DUST OBSERVATIONS OVER NORTHWEST IRAN D05206D05206
6 of 13
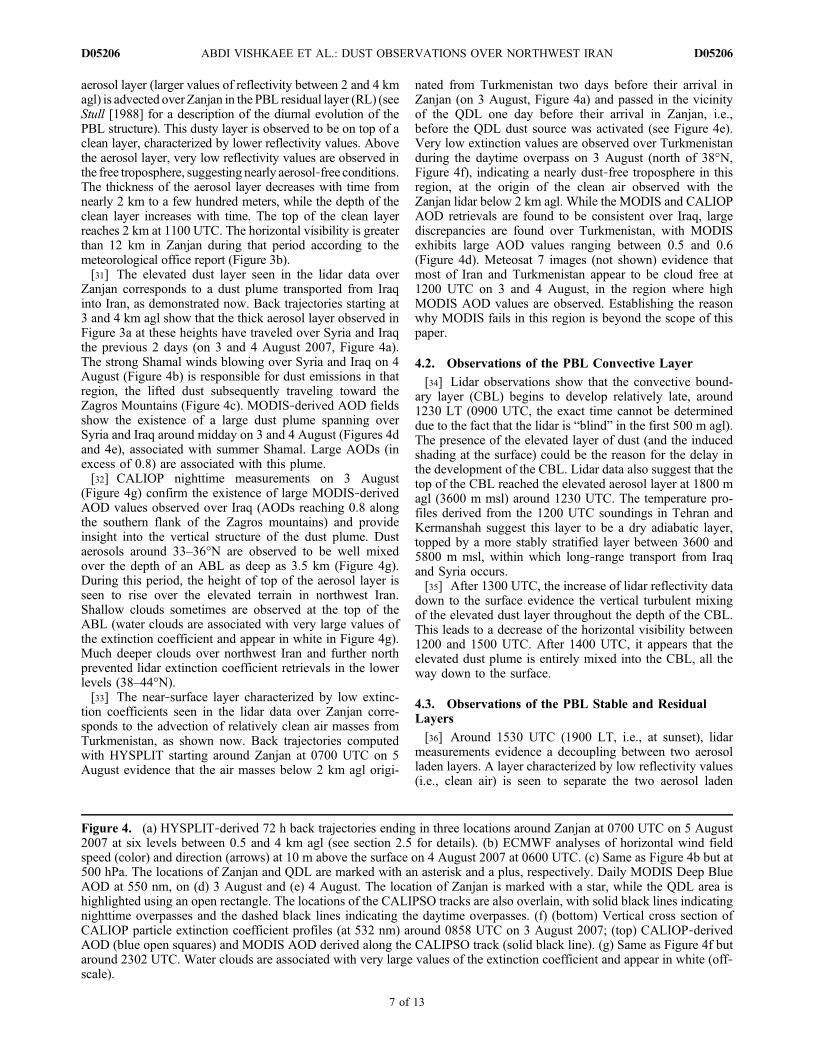
aerosol layer (larger values of reflectivity between 2 and 4 kmagl) is advected over Zanjan in the PBL residual layer (RL) (seeStull [1988] for a description of the diurnal evolution of thePBL structure). This dusty layer is observed to be on top of aclean layer, characterized by lower reflectivity values. Abovethe aerosol layer, very low reflectivity values are observed inthe free troposphere, suggesting nearly aerosol‐free conditions.The thickness of the aerosol layer decreases with time fromnearly 2 km to a few hundred meters, while the depth of theclean layer increases with time. The top of the clean layerreaches 2 km at 1100 UTC. The horizontal visibility is greaterthan 12 km in Zanjan during that period according to themeteorological office report (Figure 3b).[31] The elevated dust layer seen in the lidar data over
Zanjan corresponds to a dust plume transported from Iraqinto Iran, as demonstrated now. Back trajectories starting at3 and 4 km agl show that the thick aerosol layer observed inFigure 3a at these heights have traveled over Syria and Iraqthe previous 2 days (on 3 and 4 August 2007, Figure 4a).The strong Shamal winds blowing over Syria and Iraq on 4August (Figure 4b) is responsible for dust emissions in thatregion, the lifted dust subsequently traveling toward theZagros Mountains (Figure 4c). MODIS‐derived AOD fieldsshow the existence of a large dust plume spanning overSyria and Iraq around midday on 3 and 4 August (Figures 4dand 4e), associated with summer Shamal. Large AODs (inexcess of 0.8) are associated with this plume.[32] CALIOP nighttime measurements on 3 August
(Figure 4g) confirm the existence of large MODIS‐derivedAOD values observed over Iraq (AODs reaching 0.8 alongthe southern flank of the Zagros mountains) and provideinsight into the vertical structure of the dust plume. Dustaerosols around 33–36°N are observed to be well mixedover the depth of an ABL as deep as 3.5 km (Figure 4g).During this period, the height of top of the aerosol layer isseen to rise over the elevated terrain in northwest Iran.Shallow clouds sometimes are observed at the top of theABL (water clouds are associated with very large values ofthe extinction coefficient and appear in white in Figure 4g).Much deeper clouds over northwest Iran and further northprevented lidar extinction coefficient retrievals in the lowerlevels (38–44°N).[33] The near‐surface layer characterized by low extinc-
tion coefficients seen in the lidar data over Zanjan corre-sponds to the advection of relatively clean air masses fromTurkmenistan, as shown now. Back trajectories computedwith HYSPLIT starting around Zanjan at 0700 UTC on 5August evidence that the air masses below 2 km agl origi-
nated from Turkmenistan two days before their arrival inZanjan (on 3 August, Figure 4a) and passed in the vicinityof the QDL one day before their arrival in Zanjan, i.e.,before the QDL dust source was activated (see Figure 4e).Very low extinction values are observed over Turkmenistanduring the daytime overpass on 3 August (north of 38°N,Figure 4f), indicating a nearly dust‐free troposphere in thisregion, at the origin of the clean air observed with theZanjan lidar below 2 km agl. While the MODIS and CALIOPAOD retrievals are found to be consistent over Iraq, largediscrepancies are found over Turkmenistan, with MODISexhibits large AOD values ranging between 0.5 and 0.6(Figure 4d). Meteosat 7 images (not shown) evidence thatmost of Iran and Turkmenistan appear to be cloud free at1200 UTC on 3 and 4 August, in the region where highMODIS AOD values are observed. Establishing the reasonwhy MODIS fails in this region is beyond the scope of thispaper.
4.2. Observations of the PBL Convective Layer
[34] Lidar observations show that the convective bound-ary layer (CBL) begins to develop relatively late, around1230 LT (0900 UTC, the exact time cannot be determineddue to the fact that the lidar is “blind” in the first 500 m agl).The presence of the elevated layer of dust (and the inducedshading at the surface) could be the reason for the delay inthe development of the CBL. Lidar data also suggest that thetop of the CBL reached the elevated aerosol layer at 1800 magl (3600 m msl) around 1230 UTC. The temperature pro-files derived from the 1200 UTC soundings in Tehran andKermanshah suggest this layer to be a dry adiabatic layer,topped by a more stably stratified layer between 3600 and5800 m msl, within which long‐range transport from Iraqand Syria occurs.[35] After 1300 UTC, the increase of lidar reflectivity data
down to the surface evidence the vertical turbulent mixingof the elevated dust layer throughout the depth of the CBL.This leads to a decrease of the horizontal visibility between1200 and 1500 UTC. After 1400 UTC, it appears that theelevated dust plume is entirely mixed into the CBL, all theway down to the surface.
4.3. Observations of the PBL Stable and ResidualLayers
[36] Around 1530 UTC (1900 LT, i.e., at sunset), lidarmeasurements evidence a decoupling between two aerosolladen layers. A layer characterized by low reflectivity values(i.e., clean air) is seen to separate the two aerosol laden
Figure 4. (a) HYSPLIT‐derived 72 h back trajectories ending in three locations around Zanjan at 0700 UTC on 5 August2007 at six levels between 0.5 and 4 km agl (see section 2.5 for details). (b) ECMWF analyses of horizontal wind fieldspeed (color) and direction (arrows) at 10 m above the surface on 4 August 2007 at 0600 UTC. (c) Same as Figure 4b but at500 hPa. The locations of Zanjan and QDL are marked with an asterisk and a plus, respectively. Daily MODIS Deep BlueAOD at 550 nm, on (d) 3 August and (e) 4 August. The location of Zanjan is marked with a star, while the QDL area ishighlighted using an open rectangle. The locations of the CALIPSO tracks are also overlain, with solid black lines indicatingnighttime overpasses and the dashed black lines indicating the daytime overpasses. (f) (bottom) Vertical cross section ofCALIOP particle extinction coefficient profiles (at 532 nm) around 0858 UTC on 3 August 2007; (top) CALIOP‐derivedAOD (blue open squares) and MODIS AOD derived along the CALIPSO track (solid black line). (g) Same as Figure 4f butaround 2302 UTC. Water clouds are associated with very large values of the extinction coefficient and appear in white (off‐scale).
ABDI VISHKAEE ET AL.: DUST OBSERVATIONS OVER NORTHWEST IRAN D05206D05206
7 of 13

layers. The depth of the lower layer decreases continuouslywith time, while the upper layer ascends during the sameperiod (between 1500 UTC on 5 August and 0200 UTC on6 August). Finally, a third layer characterized by enhancedreflectivity values is observed around 4 km agl. Clouds arealso seen to be present at that level (features appearing inmaroon). This layer also is separated from the intermediatedust layer by clean air. The 6 August 0000 UTC sounding inTehran and Kermanshah indicate the presence of a tem-perature inversion at 3100 m msl, corresponding to the topof the lower aerosol layer (not shown). A second tempera-ture inversion is detected around 5800 m msl in both Tehranand Kermanshah, which corresponded to the top of theupper aerosol layer. The intermediate layer is not observedto be associated with an outstanding feature on the tem-perature profiles.[37] HYSPLIT‐derivedback trajectories starting at 2100UTC
around Zanjan indicate that the lower aerosol layer seen in thelidar data is associated with air masses having traveled at low‐level over the QDL region approximately nine hours prior toarriving in Zanjan (Figure 5a). An area characterized by strongsurface wind speed is seen, in the ECMWF reanalyses, todevelop over the Dasht‐e Kavir desert at this time on 5August, with surface wind speed larger than 6 m s−1 over QDL(Figure 5b). The strongest surface winds in Qom during thatperiod are observed on 5 August at 0600 UTC (Figure 5c).The surface wind in the Qom region are underestimated in theECMWF reanalyses on 5 August (Figure 5c), the observedsurface winds being stronger than the modeled ones by asmuch as 4 m s−1 at 0600 UTC. Consistently with the notion ofsource activation, the horizontal visibility in Qom (Figure 5d)is reported by the observer to decrease on 5 August after thestrongest wind episode recorded during the 3–5 August period(surface wind speed reaching 10 m s−1 at 0600 UTC). Fur-thermore, large AOD values are observed with MODIS in theQDL region around midday on 5 August (Figure 5e).[38] As a result of dust emissions in the QDL region,
horizontal visibility near surface remains low in Zanjan after1800 UTC (Figure 3b). The persistence of the lower aerosollayer (observed until 0200 UTC on 6 August) is consistentwith that fact that the QDL dust source is activated for atleast 12–15 h (Figure 5d).[39] The visibility is estimated to be on the order of 10 km
(light aeolian dust burden) at the Tehran meteorologicalstation for the 3–5 August period, except on 5 Augustbetween 0200 and 0500 UTC when it decreases to 7 km (notshown). The decrease is consistent with the arrival of thedust plume from the west on that day. The light aeolianburden observed otherwise are an indication of fairly lowlevels of anthropogenic pollution. Hence, high backscattercoefficient values observed in the lidar data at low‐level arelikely not related to anthropogenic aerosols from Tehran.[40] The layer observed at 4 km agl over Zanjan can
unambiguously be related to long‐range transport fromSyria and Iraq (Figure 5a) where a large dust plume isobserved on 3 and 4 August as discussed previously. Theorigin of the uppermost and lowermost aerosol layer isfound to be the same for back trajectories starting at0100 UTC on 6 August.[41] The origin of the intermediate layer is less obvious.
HYSPLIT‐derived back trajectories starting at 2100 UTC tothe east of Zanjan at 2 km agl indicate that this layer has
traveled over Turkmenistan and northern Iran beforereaching Zanjan. Back trajectories starting to the west ofZanjan at 2 km agl indicate that this layer originates fromIraq (Figure 5a). Nevertheless, CALIOP data over Turk-menistan on 3 August (Figure 4f) show no evidence of thepresence of dust north of the Alborz Mountains. The inter-mediate aerosol layer is observed to be slightly higher,around 3 km agl at 0100 UTC on 6 August. Back trajec-tories starting at this time and at 3 km agl suggest that thelayer is coming from the west, i.e., Iraq and Syria. It isunlikely that a layer that looks so continuous (time‐wise) inthe lidar time series should come from such different ori-gins. Rather, it is believed that this mismatch is linked to thecoarse vertical resolution of the Global Forecast Systemanalyses. Therefore, it is likely that the intermediate dustlayer originates from Iraq rather than Turkmenistan. Nev-ertheless, the clean air mass separating the lowermost twodust layer could originate from Turkmenistan.[42] The upper aerosol layer as well as the clouds over
Zanjan region are also observed in the CALIPSO data at2249 UTC (Figure 5f). CALIOP revealed that a thick dustplume (nearly 5 km) is present over Iraq (around 46.5°E)and that the Iraqi dust plume ascended over the ZagrosMountains, its top reaching 6 km msl over Zanjan. Overnorthwest Iran (in the mountainous area, between 35 and37°N), a three‐layer structure is observed, with the presenceof a cleaner air mass between an elevated dust plume fromIraq and a plume close to the surface. However, due to thepresence of high level clouds, no information on the aerosoldistribution can be retrieved over Zanjan because ofextinction in the cloud (optically thick clouds prevent thelaser beam from sensing the atmosphere below the cloud).
5. The 11–13 September 2008 Case
[43] Figure 6a shows the time‐height series of lidar re-flectivity recorded at IASBS on 13 September 2008. Highreflectivity values are observed from 0530 to 1430 UTC,together with high AOD values measured from the SPM atIASBS and low horizontal visibility as reported by theZanjan meteorological station observer (Figure 6b). Thehigh lidar reflectivity values and visibilities are associatedwith low‐level dust transported from Iraq over northwestIran as discussed in the following.[44] As is illustrated in Figure 6a, the CBL started to
develop shortly after 0530 UTC (0900 LT). At this time, aRL extending between 0.5 and 1.3 km agl is also observed.Note that the reflectivity values characterizing the residuallayer are on the order of those in the developing CBL. TheCBL develops until 0830 UTC when it reaches a depth of1.2 km. In the course of its development, the CBL graduallyerodes the residual layer and aerosols contained in the latterare mixed within the former. The largest lidar reflectivityvalues are observed in the morning in Zanjan shortly afterthe residual layer is fully eroded by the CBL (around0830 UTC). This is consistent with the decrease of hori-zontal visibility after 0830 UTC (Figure 6b). The depth ofthe ABL continues to increase until reaching approximately1.5 km. Lower reflectivity values are observed in the ABLbetween 0900 and 1100 UTC, consistently with the valuesof AOD decreasing between 0.6 and 0.4. Reflectivity in theABL increased after 1100 UTC. This increase is accom-
ABDI VISHKAEE ET AL.: DUST OBSERVATIONS OVER NORTHWEST IRAN D05206D05206
8 of 13

Figure 5. (a) HYSPLIT‐derived 72 h back trajectories ending in three locations around Zanjan at2100 UTC on 5 August 2007 at six levels between 0.5 and 4 km agl (see section 2.5 for details).(b) ECMWF analyses of horizontal wind field speed (color) and direction (arrows) at 10 m above thesurface on 5 August 2007 at 0600 UTC. The locations of Zanjan and QDL are marked with a star and aplus, respectively. (c) Wind speed (blue solid line) and wind direction (blue arrows) reported by the Qommeteorological station on 4 and 5 August 2007. The red solid line and red arrows correspond to the windspeed and direction, respectively, extracted from the ECMWF reanalyses at the grid point nearest toQom. (d) Horizontal visibility reported by the Qom meteorological station ground observer on 4 and5 August 2007. (e) MODIS Deep Blue AOD at 550 nm on 5 August. The location of Zanjan is marked witha star, while the QDL area is highlighted using an open rectangle. The locations of the CALIPSO tracks arealso overlain, with the solid black lines indicating the nighttime overpass on 5 August. (f) (top) CALIOP‐derived AOD along the CALIPSO track (solid black line in Figure 5e); (bottom) vertical cross section ofCALIOP particle extinction coefficient profiles (at 532 nm) around 2249 UTC on 5 August 2007.
ABDI VISHKAEE ET AL.: DUST OBSERVATIONS OVER NORTHWEST IRAN D05206D05206
9 of 13

panied by an increase in AOD. During this period, thehorizontal visibility remains quite low (3 km, Figure 6b).[45] The temperature profile derived from the 1200 UTC
soundings in Tehran and Kermanshah reveals the existenceof a dry adiabatic layer up to 3150 m msl (not shown),corresponding to the top of the PBL. A marked temperatureinversion is observed to cap that dry adiabatic layer. Abovethe temperature inversion, a more stably stratified layer isobserved.[46] HYSPLIT‐derived back trajectories starting in Zan-
jan at 0500 UTC on 13 September indicate that the airmasses between 0.5 and 3 km have traveled over northernIraq the previous day (12 September), and Turkey the daybefore (11 September) as shown in Figure 7a. ECMWFreanalyses show that the strongest surface winds on 11September (Figure 7b) are found over Syria and Iraq (relatedto northwesterly Shamal flow). Winds over Iraq and Syriaare seen to be in excess of 6 m s−1 and have the potential toactivate dust sources. This is confirmed by the MODIS‐derived AOD field on 11 September which shows an areacharacterized by values in excess of 1 over Iraq (Figure 7d)consistent with dust source activation. AODs between 0.8and 1 are also observed over northwest Iran (Figure 7d) asthe result from eastward long‐range transport of dust liftedover Iraq toward the Zagros Mountains and northwesternIran (Figure 7c).[47] On 12 September, the aerosol plume previously
observed over Iraq is over northwest Iran (Figure 7e) as also
corroborated by visibility values as low as 2.5 km in Tabriz(not shown). Low values are seen over Iraq which suggeststhat the Iraqi dust source is no longer active on that day. It isconsistent with the low surface winds shown by theECMWF analysis (not shown).[48] On 13 September, the optically thick dust plume from
Iraq previously positioned west of Zanjan (Figure 7f) is nowlocated over Zanjan. The MODIS AOD values associatedwith this plume are seen to decrease from over 1 to 0.7between 12 and 13 September. The visibility in Tabriz re-mained very low on that day as well (around 2.5 km, notshown). Furthermore, it is worth noting that visibility inTehran is low on all three days, sometimes less than 5 km(nor shown).
6. Summary and Conclusion
[49] Transport of desert dust over northwest Iran in thesummertime has been studied using a suite of ground‐basedand spaceborne remote sensing platforms as well as mod-eling tools.[50] During the 3–5 August 2007 case, dust emission
regions were located in Syria/Iraq and in the QDL regionin Iran. Emissions in Syria and Iraq occurred in responseto strong Shamal winds. The lifted dust then got mixedthroughout the depth of the deep ABL, before beingadvected eastward toward the Zagros Mountains. The strongeasterly flow blowing over Iran and southwest of the Zagros
Figure 6. (a) Time‐height series of lidar attenuated backscatter profiles recorded in Zanjan (at 532 nm)between 0530 UTC and 1430 UTC on 13 September 2008. Both UTC time (bottom axis) and local time(top axis) as well as both altitude above ground level (left axis) and above sea level (right axis) are indi-cated. (b) AOD measured by the SPM in Zanjan between 0525 UTC and 1230 UTC at 670 nm (the SPMstopped working after 1230 UTC) and horizontal visibility reported by the Zanjan meteorological stationground observer between 0520 UTC and 1500 UTC on 13 September 2008.
ABDI VISHKAEE ET AL.: DUST OBSERVATIONS OVER NORTHWEST IRAN D05206D05206
10 of 13

Figure 7. (a) HYSPLIT‐derived 72 h back trajectories ending in three locations around Zanjan at0700 UTC on 13 September 2008 at six levels between 0.5 and 3 km agl (see section 2.5 for details).(b) ECMWF analyses of horizontal wind field speed (color) and direction (arrows) at 10 m above thesurface on 11 September 2008 at 0600 UTC. (c) Same as Figure 7b but at 700 hPa. The location of Zanjanis marked with a star. Daily MODIS Deep Blue AOD at 550 nm on (d) 11 September, (e) 12 September,and (f) 13 September 2008. The location of Zanjan is marked with a star.
ABDI VISHKAEE ET AL.: DUST OBSERVATIONS OVER NORTHWEST IRAN D05206D05206
11 of 13

Mountains (below 850 hPa, Figure 8a), prevented directtransport of the Iraqi dust in the low levels over Iran. Rather,the transport of Iraqi dust to Iran occurred above 3.5 km msl.Dust emission in the QDL region resulted from strong windsblowing over the Dasht‐e Kavir desert. The contribution ofthe different dust source regions to the dust load in Zanjancould be identified using a combination of lidar observationsand HYSPLIT back trajectories. The visibility in Tehrandecreased significantly (reaching 7 km) on 5 August 2007only, as air quality was impacted by the low‐level transportof dust from the Qom region.[51] During the 11–13 September 2008 case, dust emis-
sion regions were located in Syria/Iraq. Emissions in Syriaand Iraq occurred in response to strong Shamal winds. Inthis case, unlike what was observed in the August case, dustwas transported toward the Zagros Mountains at low levelsas there was no opposing flow to the west of the Zagrosrange (Figure 8b). Lidar measurements in Zanjan on 13September evidenced the presence of a 1–1.5 km thick dust
plume from Iraq traveling below 3.5 km msl over northwestIran. High AOD values and low near surface horizontalvisibility were associated with this case. The visibility inTehran during this case was sometimes reduced to less than5 km due to the transport of dust at low levels.[52] Ground‐based lidar measurements acquired in Zanjan
allowed new insight into the vertical distribution of dustlinked to transport over northwest Iran. The analysis of thesepreviously unavailable data highlighted the importance oflow‐level transport of dust from both Iraq and Iran for airquality issues in a large city such as Tehran. These data alsoenabled to show that the high‐level transport of dust fromIraq only marginally impacted visibility (and hence airquality) in Tehran.[53] Further investigation is needed to substantiate these
findings, in particular the seasonal frequency of dust eventsfrom Iraq over northwest Iran as well as the level at whichthe transport occurs need to be addressed in future studies inorder to assess the impact of such events on human health.
Figure 8. Vertical cross section of potential temperature extracted between 40°E/32°N and 52°E/40°N(see Figure 2) from the ECMWF analyses at 0600 UTC on (a) 4 August 2007 and (b) 12 September 2008.The wind along the cross section is shown as vectors. The orography interpolated from GLOBE along thecross section is shown in grey.
ABDI VISHKAEE ET AL.: DUST OBSERVATIONS OVER NORTHWEST IRAN D05206D05206
12 of 13

[54] Acknowledgments. The authors gratefully acknowledge theNOAA Air Resources Laboratory (ARL) for the provision of the HYSPLITtransport and dispersion model and READY Web site used in this publi-cation. The European Centre for Medium‐Range Weather Forecasts(ECMWF) is acknowledged for making the meteorological analyses avail-able from their data server. The CALIPSO data were obtained from theNASA Langley Research Center Atmospheric Science Data Center.MODIS deep blue aerosol optical depth used in this study were producedwith the Giovanni online data system, developed and maintained by theNASA Goddard Earth Sciences (GES) Data and Information ServicesCenter (DISC). Special thanks go to Larry Oolman for kindly providingsome of the surface observations. The authors would like to acknowledgeM. Hasanalizadeh, the director of Zanjan Meteorological Office, for pre-paring achieved surface measurements, R. Moradhaseli for recording lidardata, and A. Bayat and A. Masoumi for useful discussions. The threeanonymous referees are thanked for their insightful comments thatimproved many aspects of the paper.
ReferencesBarth, H., and B. Boer (2002), Sabkha Ecosystems: The Arabian Peninsulaand Adjacent Countries, 368 pp., Springer, New York.
Bayat, A., A. Masoumi, and H. R. Khalesifard (2010), Retrieval of atmo-spheric optical parameters from ground‐based Sun‐photometer measure-ments for Zanjan area, Atmos. Meas. Tech. Discuss., 3, 2633–2649,doi:10.5194/amtd-3-2633-2010.
Buizza, R. (1997), Potential forecast skill of ensemble prediction andspread and skill distributions of the ECMWF Ensemble Prediction Sys-tem, Mon. Weather Rev., 125, 99–119.
Cuesta, J., et al. (2008), Multiplatform observations of the seasonal evolu-tion of the Saharan atmospheric boundary layer in Tamanrasset, Algeria,in the framework of the African Monsoon Multidisciplinary Analysisfield campaign conducted in 2006, J. Geophys. Res., 113, D00C07,doi:10.1029/2007JD009417.
Cuesta, J., J. H. Marsham, D. J. Parker, and C. Flamant (2009), Dynamicalmechanisms controlling the vertical redistribution of dust and the thermo-dynamic structure of the West Saharan Atmospheric Boundary Layerduring summer, Atmos. Sci. Lett., 10(1), 34–42.
Engelstaedter, S., K. E. Kohfeld, I. Tegen, and S. P. Harrison (2003), Con-trols of dust emissions by vegetation and topographic depressions: Anevaluation using dust storm frequency data, Geophys. Res. Lett., 30(6),1294, doi:10.1029/2002GL016471.
Esmaili, O., M. Tajrishy, and P. Daneshkar Arasteh (2006), Results of the50 year ground‐based measurements in comparison with satellite remotesensing of two prominent dust emission sources located in Iran, Proc.SPlE Int. Soc. Opt. Eng., 6362, 277–786, doi:10.1117/12.692989.
Fan, S. M., L. W. Horowitz, I. I. H. Levy, and W. J. Moxim (2004), Impactof air pollution on wet deposition of mineral dust aerosols, Geophys. Res.Lett., 31, L02104, doi:10.1029/2003GL018501.
Fernandez Partagas, J., D. M. Helgren, and J. M. Prospero (1986), Thresh-old wind velocities for raising dust in the western Sahara Desert, AROTech. Rep. 19684.3‐GS, Army Res. Off., Adelphi, Md.
Flamant, C., J.‐P. Chaboureau, D. J. Parker, and C. M. Taylor (2007),Airborne observations of the impact of a convective system on theplanetary boundary layer thermodynamics and aerosol distribution inthe inter‐tropical discontinuity region of the West African monsoon,Q. J. R. Meteorol. Soc., 133, 877–946, doi:10.1002/qj.97.
GLOBE Task Team, et al. (1999), The Global Land One‐kilometer BaseElevation (GLOBE) Digital Elevation Model, Version 1.0., NOAA,Boulder, Colo. (Available at http://www.ngdc.noaa.gov/mgg/topo/globe.html)
Halek, F., M. Kianpour‐Rad, and A. Kavousirahim (2009), Seasonal varia-tion in ambient PM mass and number concentrations (case study: Tehran,Iran), Environ. Monit. Assess., 169, 501–507, doi:10.1007/s10661-009-1192-2.
Helgren, D. M., and J. M. Prospero (1987), Wind velocities associated withdust deflation events in the Western Sahara, J. Clim. Appl. Meteorol.,26(9), 1147–1151.
Hoskins, B. J., M. E. McIntyre, and A. W. Robsertson (1985), On the useand significance of isentropic potential vorticity maps, Q. J. R. Meteorol.Soc., 111, 877–946.
Hsu, N. C., S.‐C. Tsay, M. D. King, and J. R. Herman (2004), Aerosolproperties over bright‐reflecting source regions, IEEE Trans. Geosci.Remote Sens., 42(3), 557–569.
Khalesifard, H. R., F. Abdi Vishkaee, and P. H. Flamant (2005), Cloudtrack wind using synergism of backscatter lidar and sky digital picture,Proc. SPIE Int. Soc. Opt. Eng., 5979, 5979OC, doi:10.1117/12.629436.
Knippertz, P., et al. (2009), Dust mobilization and transport in the northernSahara during SAMUM 2006—A meteorological overview, Tellus, Ser.B, 61, 12–31, doi:10.1111/j.1600-0889.2008.00380.x
Kurosaki, Y., and M. Mikami (2003), Recent frequent dust events and theirrelation to surface wind in East Asia, Geophys. Res. Lett., 30(14), 1736,doi:10.1029/2003GL017261.
Kutiel, H., and H. Furman (2003), Dust storms in the Middle East: Sourcesof origin and their temporal characteristics, Indoor Built Environ., 12(6),419–426, doi:10.1177/1420326X03037110.
Leon, J., and M. Legrand (2003), Mineral dust sources in the surroundingof the North Indian Ocean, Geophys. Res. Lett., 30(6), 1309,doi:10.1029/2002GL016690.
Liu, M., D. L. Westphal, T. R. Holt, and Q. Xu (2000), Numerical simula-tion of a low‐level jet over complex terrain in southern Iran, Mon.Weather Rev., 128(5), 1309–1327.
Mahowald, N. M., J. A. Ballentine, J. Feddema, and N. Ramankutty(2007), Global trends in visibility: Implications for dust sources, Atmos.Chem. Phys., 7, 3309–3339.
Messager, C., D. J. Parker, O. Reitebuch, A. Agusti‐Panareda, C. M.Taylor, and J. Cuesta (2010), Structure and dynamics of the Saharanatmospheric boundary layer during the West African monsoon onset:Observations and analyses from the research flights of 14 and 17 July,Q. J. R. Meteorol. Soc., 136, suppl. 1, 107–124, doi:10.1002/gj.469.
Middleton, N. (1986a), Dust storms in the Middle East, J. Arid Environ.,10, 83–96.
Middleton, N. (1986b), A geography of dust storms in South‐west Asia,J. Clim., 6, 183–196.
Miri, A., H. Ahmadi, A. Ghanbar, and A. Moghaddamnia (2007), Duststorms impacts on air pollution and public health under hot and dry cli-mate, Int. J. Energy Environ., 2, 101–105.
Prospero, J. M., P. Ginoux, O. Torres, S. E. Nicholson, and T. E. Gill(2002), Environmental characterization of global sources of atmosphericsoil dust identified with the NIMBUS 7 Total ozone mapping spectrom-eter (TOMS) absorbing aerosol product, Rev. Geophys., 40(1), 1002,doi:10.1029/2000RG000095.
Pye, K. (1987), Aeolian Dust and Dust Deposit, 335 pp., Academic, SanDiego, Calif.
Smirov, A., B. N. Holben, O. Dubbvik, N. T. O’Neill, T. F. Eck, D. L.Westphal, A. K. Goroch, C. Pietras, and I. Slutsker (2001), Atmo-spheric aerosol optical properties in the Persian Gulf, J. Atmos. Sci.,59(3), 620–634.
Smith, R. B. (1989), Hydrostatic flow over mountains, Adv. Geophys., 31,1–41.
Sodemann, H., A. S. Palmer, C. Schwierz, M. Schwikowski, and H. Wernli(2006), The transport history of two Saharan dust events archived in anAlpine ice core, Atmos. Chem. Phys., 6, 667–688.
Stull, R. B. (1988), An Introduction to Boundary Layer Meteorology, 666pp., Kluwer Acad., Norwell, Mass.
Washington, R., M. Todd, N. J. Middleton, and A. S. Goudie (2003),Duststorm source areas determined by the Total Ozone MonitoringSpectrometer and surface observations, Ann. Assoc. Am. Geogr., 93(2),297–313, doi:10.1111/1467-8306.9302003.
Wiacek, A., T. Peter, and U. Lohmann (2010), The potential influence ofAsian and African mineral dust on ice, mixed‐phase and liquid waterclouds, Atmos. Chem. Phys., 10, 8649–8667, doi:10.5194/acp-10-8649-2010.
Winker, D., W. Hunt, and M. McGill (2007), Initial performance assess-ment of CALIOP, Geophys. Res. Lett., 34, L19803, doi:10.1029/2007GL030135.
F. Abdi Vishkaee and H. R. Khalesifard, Department of Physics, Institutefor Advanced Studies in Basic Sciences, GavaZang, Zanjan 45195‐1159,Iran. ([email protected]; [email protected])J. Cuesta and P. Flamant, Laboratoire de Météorologie Dynamique,
Ecole Polytechnique, F‐91120 Palaiseau, France. ([email protected]; [email protected])C. Flamant, Laboratoire Atmosphères, Milieux, Observations Spatiales,
CNRS, UMR 8190, 4 Place Jussieu, F‐75252 Paris CEDEX 05, France.([email protected])
ABDI VISHKAEE ET AL.: DUST OBSERVATIONS OVER NORTHWEST IRAN D05206D05206
13 of 13
Copyright © 2022 FDOKUMEN