cytology and associated histology of biliary and pancreatic ...
Upload
independentCategory
view
3download
0
BioMed CentralBMC Medical Imaging
ss
Open AcceResearch articleLarge-scale computations on histology images reveal grade-differentiating parameters for breast cancerSokol Petushi1,2, Fernando U Garcia2, Marian M Haber2, Constantine Katsinis3 and Aydin Tozeren*1Address: 1School of Biomedical Engineering, Science & Health Systems, Drexel University, 3141 Chestnut St., Philadelphia, PA 19104, USA, 2Department of Pathology, Drexel University College of Medicine, 245N 15th St., Philadelphia, PA 19102, USA and 3Godwin College of Professional Studies, Drexel University, 3001 Market St., Philadelphia, PA 19104, USA
Email: Sokol Petushi - [email protected]; Fernando U Garcia - [email protected]; Marian M Haber - [email protected]; Constantine Katsinis - [email protected]; Aydin Tozeren* - [email protected]
* Corresponding author
AbstractBackground: Tumor classification is inexact and largely dependent on the qualitative pathologicalexamination of the images of the tumor tissue slides. In this study, our aim was to develop anautomated computational method to classify Hematoxylin and Eosin (H&E) stained tissue sectionsbased on cancer tissue texture features.
Methods: Image processing of histology slide images was used to detect and identify adiposetissue, extracellular matrix, morphologically distinct cell nuclei types, and the tubular architecture.The texture parameters derived from image analysis were then applied to classify images in asupervised classification scheme using histologic grade of a testing set as guidance.
Results: The histologic grade assigned by pathologists to invasive breast carcinoma images stronglycorrelated with both the presence and extent of cell nuclei with dispersed chromatin and thearchitecture, specifically the extent of presence of tubular cross sections. The two parameters thatdifferentiated tumor grade found in this study were (1) the number density of cell nuclei withdispersed chromatin and (2) the number density of tubular cross sections identified through imageprocessing as white blobs that were surrounded by a continuous string of cell nuclei. Classificationbased on subdivisions of a whole slide image containing a high concentration of cancer cell nucleiconsistently agreed with the grade classification of the entire slide.
Conclusion: The automated image analysis and classification presented in this study demonstratethe feasibility of developing clinically relevant classification of histology images based on micro-texture. This method provides pathologists an invaluable quantitative tool for evaluation of thecomponents of the Nottingham system for breast tumor grading and avoid intra-observervariability thus increasing the consistency of the decision-making process.
Published: 27 October 2006
BMC Medical Imaging 2006, 6:14 doi:10.1186/1471-2342-6-14
Received: 07 August 2006Accepted: 27 October 2006
This article is available from: http://www.biomedcentral.com/1471-2342/6/14
© 2006 Petushi et al; licensee BioMed Central Ltd. This is an Open Access article distributed under the terms of the Creative Commons Attribution License (http://creativecommons.org/licenses/by/2.0), which permits unrestricted use, distribution, and reproduction in any medium, provided the original work is properly cited.
Page 1 of 11(page number not for citation purposes)
BMC Medical Imaging 2006, 6:14 http://www.biomedcentral.com/1471-2342/6/14
BackgroundThis article presents a clinically relevant classification ofHematoxylin and Eosin (H&E) histology slides based onautomated image processing, supervised learning, andlarge-scale microtexture computations. The H&E staindyes DNA-rich cell nuclei blue and collagen-rich extracel-lular matrix (ECM) pink, allowing differentiation of DNA-containing nuclei from the surrounding ECM [1]. Cur-rently used breast tumor grading systems assess nuclearfeatures, tubule formation, and mitotic rate to formulatea tumor grade [1,2]. Pathologists evaluate each of theseparameters in small sample regions of the microscopicimage and give a score of 1 to 3 in increasing order frombest to worse-case scenario. The breast tumor grade is thesum of the three scores [3]. The lowest possible score (1 +1 + 1 = 3) along with scores 4 and 5 correspond to grade Itumors. These low-grade tumors possess well-differenti-ated cells with low mitotic rates, and a tubular growth pat-tern. Intermediate grade tumors (Grade II) have a totalscore of 6 or 7 whereas high-grade tumors (Grade III) havea total score of 8 or 9. High-grade tumors known as poorlydifferentiated carcinomas, are characterized by infiltratingbreast cancer with less than 10% of the lesion arranged astubules, highly pleomorphic nuclei and many mitoses.
Pathologist-based evaluation of tissue slides for tumorgrading is considered the gold standard for tissue neo-plasm assessment. However, it is subject both to observervariation and variability based on the spatial focus ofobservation [4-7] Moreover, tumor classification based onqualitative analysis of morphology, in individual cases, isnot necessarily predictive of clinical outcome [3]. Some ofthe patients in the 'better' prognosis category will manifestaggressive disease and vice versa. The outcome is patientmismanagement with chemo- and hormone therapygiven unnecessarily to some and not provided to otherswho might benefit. The inconsistency between image-based grading and clinical outcome has led to studies forbetter markers to predict biologic behavior; these includepotential development of global gene expression andgenome-wide signatures for various cancers and subtypes[8-11]. In parallel, other studies have focused on auto-mated image processing for better accuracy in tumor grad-ing [12,13]. Hybrid segmentation methods have beenused to detect nuclei from images of histology slidesstained under different conditions [12-14]. An imagemorphometric method of nuclear grading based on Z-scoring has been developed by Bacus et al. [15] for breastDuctal Carcinoma in Situ (DCIS). Similarly, Hoque et al.[16] quantified the mean nuclear features such as area,eccentricity, elongation and compactness in recurrent andnon-recurrent DCIS and determined those nuclear fea-tures that were predictive of grade and/or survival time.Wolberg at al. [17] investigated the effectiveness of a com-puter-based nuclear morphology evaluation technique for
breast cancer prognosis and showed that nuclear mor-phology evaluation was a better prognosticator of diseasefree survival compared with lymph node status.
Our study expands the previous work as it applies large-scale computations and machine-learning algorithms thatcan aid in the development of new indices based on tissuemicro-texture motives for classifying breast histologyimages. This study utilizes our previously publishedmethod of hybrid segmentation and supervised learningto identify micro-textures that can potentially be used asfeatures to classify histology images [18]. Tissue imageobjects thus identified as cell nuclei by hybrid hierarchicalsegmentation were classified by supervised learning intothree morphology categories and a category of false detec-tion. The spatial positions of millions of cell nuclei andtheir morphology types were identified on histologyimages. The present study begins with gathering the spa-tial nuclei distribution information on breast histologyslide images and identifies tumor regions with high nucleidensity. Tubular cross sections in the images and otherspatial texture parameters such as the mean distancebetween neighbouring nuclei were detected using the spa-tial information on cell nuclei distribution. Classificationalgorithms based on supervised learning were then usedin order to classify histology section images based on mor-phology and texture patterns. Our results indicate that thenumber density of dispersed chromatin cell nuclei and thenumber density of breast tubular cross sections functionas grade differentiating features. In combination withother texture/biomarker features derived from platformssuch as, biomarker-decorated image data, global geneexpression profiles, and chromosome aberration meas-urements, the differentiation potential of these new find-ings will increase due to increasing length of outcomespecific feature vectors used in classification.
MethodsImages used for breast cancer cell identification and grade classificationThe histology image dataset used for clinically relevantclassification of histology images consisted of 24 H&Estained slide images. These images contained cross sec-tions of millions of cancer cells and thousands of breastduct tubules. Each histology image in the datasetbelonged to a different patient case. These cases were cho-sen from a large dataset associated with the breast cancerdatabank of the Drexel University College of Medicine(DUCOM). This database is an archive of approximately2200 paraffin-embedded breast cancer specimens col-lected from 1997 to the present. The data collection andstudy for this project was covered under the IRB (Institu-tional Review Board) with study #: 10128 and protocoltitle: 3-D Reconstruction of Breast Carcinoma". The IRBwas approved as an exempt research #4 as this project
Page 2 of 11(page number not for citation purposes)
BMC Medical Imaging 2006, 6:14 http://www.biomedcentral.com/1471-2342/6/14
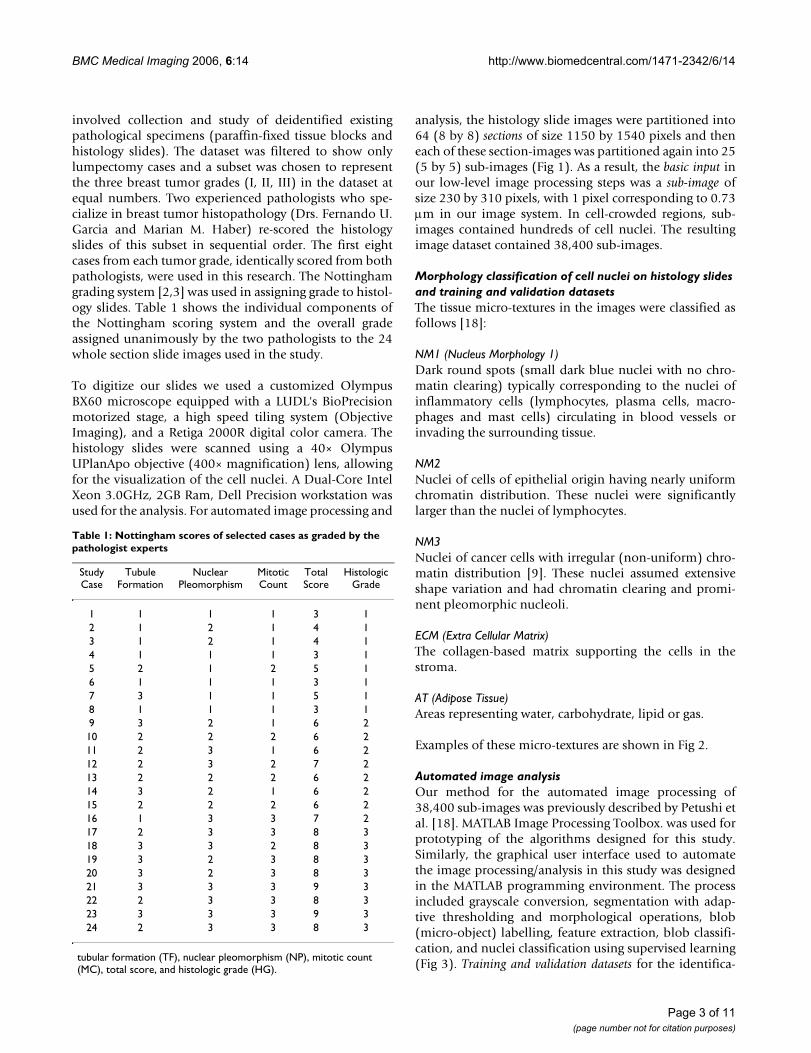
involved collection and study of deidentified existingpathological specimens (paraffin-fixed tissue blocks andhistology slides). The dataset was filtered to show onlylumpectomy cases and a subset was chosen to representthe three breast tumor grades (I, II, III) in the dataset atequal numbers. Two experienced pathologists who spe-cialize in breast tumor histopathology (Drs. Fernando U.Garcia and Marian M. Haber) re-scored the histologyslides of this subset in sequential order. The first eightcases from each tumor grade, identically scored from bothpathologists, were used in this research. The Nottinghamgrading system [2,3] was used in assigning grade to histol-ogy slides. Table 1 shows the individual components ofthe Nottingham scoring system and the overall gradeassigned unanimously by the two pathologists to the 24whole section slide images used in the study.
To digitize our slides we used a customized OlympusBX60 microscope equipped with a LUDL's BioPrecisionmotorized stage, a high speed tiling system (ObjectiveImaging), and a Retiga 2000R digital color camera. Thehistology slides were scanned using a 40× OlympusUPlanApo objective (400× magnification) lens, allowingfor the visualization of the cell nuclei. A Dual-Core IntelXeon 3.0GHz, 2GB Ram, Dell Precision workstation wasused for the analysis. For automated image processing and
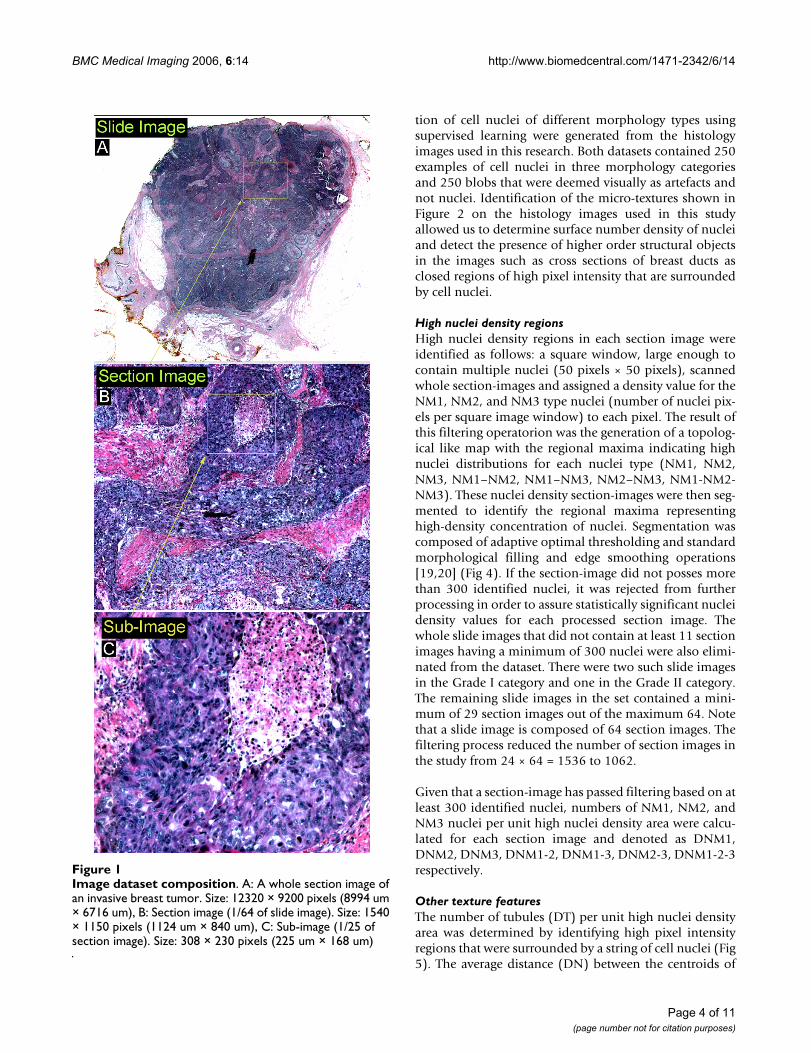
analysis, the histology slide images were partitioned into64 (8 by 8) sections of size 1150 by 1540 pixels and theneach of these section-images was partitioned again into 25(5 by 5) sub-images (Fig 1). As a result, the basic input inour low-level image processing steps was a sub-image ofsize 230 by 310 pixels, with 1 pixel corresponding to 0.73µm in our image system. In cell-crowded regions, sub-images contained hundreds of cell nuclei. The resultingimage dataset contained 38,400 sub-images.
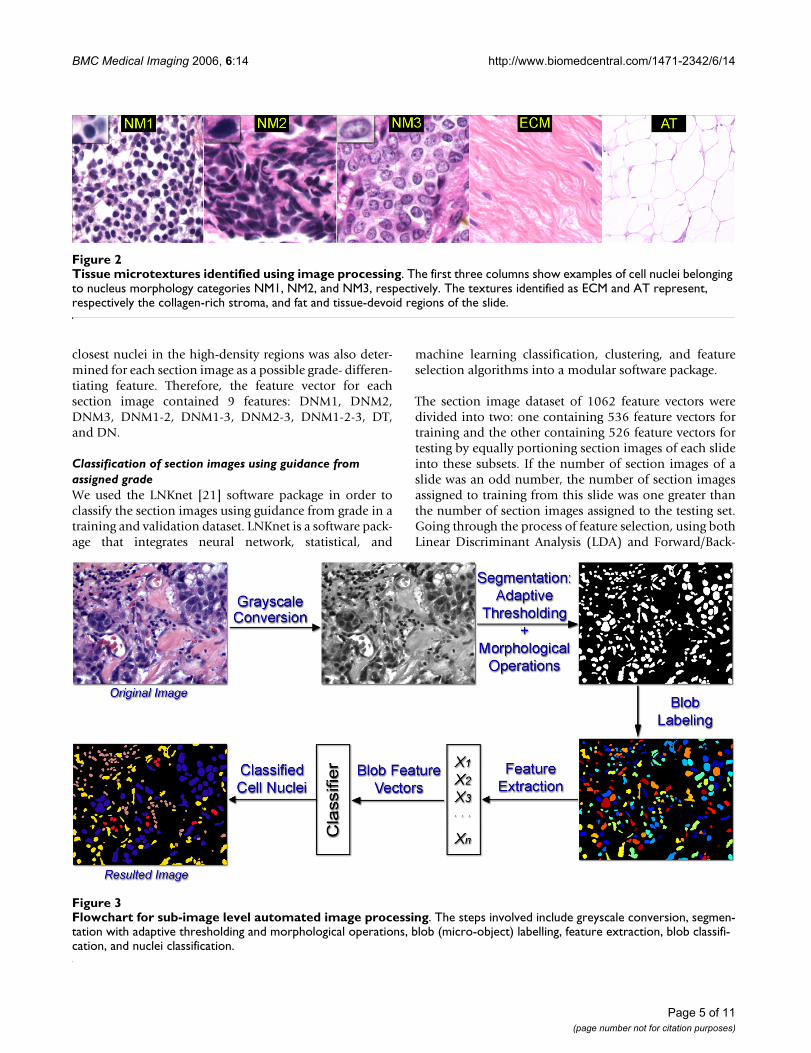
Morphology classification of cell nuclei on histology slides and training and validation datasetsThe tissue micro-textures in the images were classified asfollows [18]:
NM1 (Nucleus Morphology 1)Dark round spots (small dark blue nuclei with no chro-matin clearing) typically corresponding to the nuclei ofinflammatory cells (lymphocytes, plasma cells, macro-phages and mast cells) circulating in blood vessels orinvading the surrounding tissue.
NM2Nuclei of cells of epithelial origin having nearly uniformchromatin distribution. These nuclei were significantlylarger than the nuclei of lymphocytes.
NM3Nuclei of cancer cells with irregular (non-uniform) chro-matin distribution [9]. These nuclei assumed extensiveshape variation and had chromatin clearing and promi-nent pleomorphic nucleoli.
ECM (Extra Cellular Matrix)The collagen-based matrix supporting the cells in thestroma.
AT (Adipose Tissue)Areas representing water, carbohydrate, lipid or gas.
Examples of these micro-textures are shown in Fig 2.
Automated image analysisOur method for the automated image processing of38,400 sub-images was previously described by Petushi etal. [18]. MATLAB Image Processing Toolbox. was used forprototyping of the algorithms designed for this study.Similarly, the graphical user interface used to automatethe image processing/analysis in this study was designedin the MATLAB programming environment. The processincluded grayscale conversion, segmentation with adap-tive thresholding and morphological operations, blob(micro-object) labelling, feature extraction, blob classifi-cation, and nuclei classification using supervised learning(Fig 3). Training and validation datasets for the identifica-
Table 1: Nottingham scores of selected cases as graded by the pathologist experts
Study Case
Tubule Formation
Nuclear Pleomorphism
Mitotic Count
Total Score
Histologic Grade
1 1 1 1 3 12 1 2 1 4 13 1 2 1 4 14 1 1 1 3 15 2 1 2 5 16 1 1 1 3 17 3 1 1 5 18 1 1 1 3 19 3 2 1 6 210 2 2 2 6 211 2 3 1 6 212 2 3 2 7 213 2 2 2 6 214 3 2 1 6 215 2 2 2 6 216 1 3 3 7 217 2 3 3 8 318 3 3 2 8 319 3 2 3 8 320 3 2 3 8 321 3 3 3 9 322 2 3 3 8 323 3 3 3 9 324 2 3 3 8 3
tubular formation (TF), nuclear pleomorphism (NP), mitotic count (MC), total score, and histologic grade (HG).
Page 3 of 11(page number not for citation purposes)
BMC Medical Imaging 2006, 6:14 http://www.biomedcentral.com/1471-2342/6/14
tion of cell nuclei of different morphology types usingsupervised learning were generated from the histologyimages used in this research. Both datasets contained 250examples of cell nuclei in three morphology categoriesand 250 blobs that were deemed visually as artefacts andnot nuclei. Identification of the micro-textures shown inFigure 2 on the histology images used in this studyallowed us to determine surface number density of nucleiand detect the presence of higher order structural objectsin the images such as cross sections of breast ducts asclosed regions of high pixel intensity that are surroundedby cell nuclei.
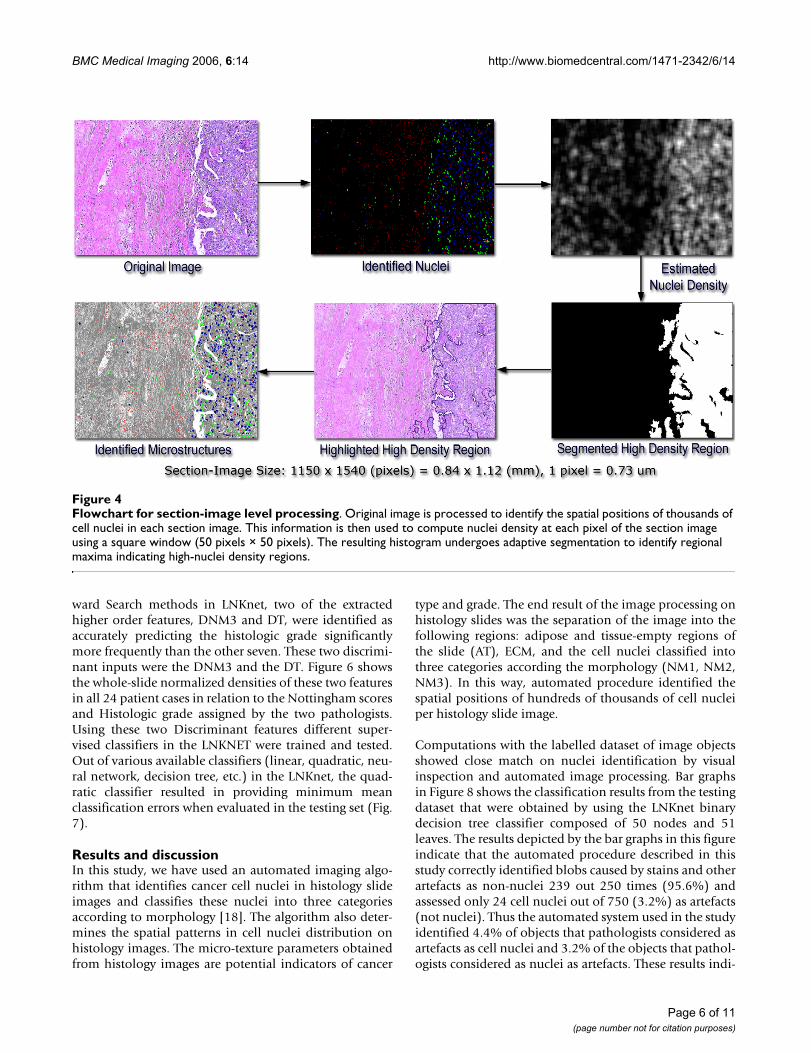
High nuclei density regionsHigh nuclei density regions in each section image wereidentified as follows: a square window, large enough tocontain multiple nuclei (50 pixels × 50 pixels), scannedwhole section-images and assigned a density value for theNM1, NM2, and NM3 type nuclei (number of nuclei pix-els per square image window) to each pixel. The result ofthis filtering operatorion was the generation of a topolog-ical like map with the regional maxima indicating highnuclei distributions for each nuclei type (NM1, NM2,NM3, NM1–NM2, NM1–NM3, NM2–NM3, NM1-NM2-NM3). These nuclei density section-images were then seg-mented to identify the regional maxima representinghigh-density concentration of nuclei. Segmentation wascomposed of adaptive optimal thresholding and standardmorphological filling and edge smoothing operations[19,20] (Fig 4). If the section-image did not posses morethan 300 identified nuclei, it was rejected from furtherprocessing in order to assure statistically significant nucleidensity values for each processed section image. Thewhole slide images that did not contain at least 11 sectionimages having a minimum of 300 nuclei were also elimi-nated from the dataset. There were two such slide imagesin the Grade I category and one in the Grade II category.The remaining slide images in the set contained a mini-mum of 29 section images out of the maximum 64. Notethat a slide image is composed of 64 section images. Thefiltering process reduced the number of section images inthe study from 24 × 64 = 1536 to 1062.
Given that a section-image has passed filtering based on atleast 300 identified nuclei, numbers of NM1, NM2, andNM3 nuclei per unit high nuclei density area were calcu-lated for each section image and denoted as DNM1,DNM2, DNM3, DNM1-2, DNM1-3, DNM2-3, DNM1-2-3respectively.
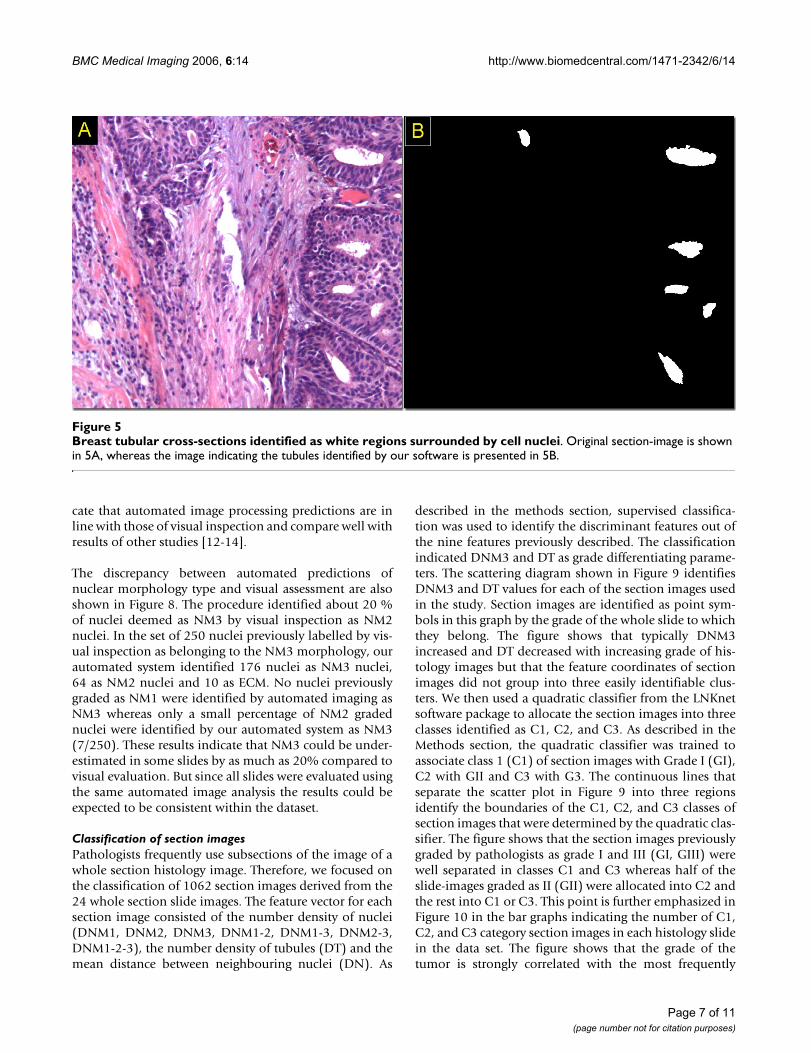
Other texture featuresThe number of tubules (DT) per unit high nuclei densityarea was determined by identifying high pixel intensityregions that were surrounded by a string of cell nuclei (Fig5). The average distance (DN) between the centroids of
Image dataset compositionFigure 1Image dataset composition. A: A whole section image of an invasive breast tumor. Size: 12320 × 9200 pixels (8994 um × 6716 um), B: Section image (1/64 of slide image). Size: 1540 × 1150 pixels (1124 um × 840 um), C: Sub-image (1/25 of section image). Size: 308 × 230 pixels (225 um × 168 um)
Page 4 of 11(page number not for citation purposes)
BMC Medical Imaging 2006, 6:14 http://www.biomedcentral.com/1471-2342/6/14
closest nuclei in the high-density regions was also deter-mined for each section image as a possible grade- differen-tiating feature. Therefore, the feature vector for eachsection image contained 9 features: DNM1, DNM2,DNM3, DNM1-2, DNM1-3, DNM2-3, DNM1-2-3, DT,and DN.
Classification of section images using guidance from assigned gradeWe used the LNKnet [21] software package in order toclassify the section images using guidance from grade in atraining and validation dataset. LNKnet is a software pack-age that integrates neural network, statistical, and
machine learning classification, clustering, and featureselection algorithms into a modular software package.
The section image dataset of 1062 feature vectors weredivided into two: one containing 536 feature vectors fortraining and the other containing 526 feature vectors fortesting by equally portioning section images of each slideinto these subsets. If the number of section images of aslide was an odd number, the number of section imagesassigned to training from this slide was one greater thanthe number of section images assigned to the testing set.Going through the process of feature selection, using bothLinear Discriminant Analysis (LDA) and Forward/Back-
Flowchart for sub-image level automated image processingFigure 3Flowchart for sub-image level automated image processing. The steps involved include greyscale conversion, segmen-tation with adaptive thresholding and morphological operations, blob (micro-object) labelling, feature extraction, blob classifi-cation, and nuclei classification.
Tissue microtextures identified using image processingFigure 2Tissue microtextures identified using image processing. The first three columns show examples of cell nuclei belonging to nucleus morphology categories NM1, NM2, and NM3, respectively. The textures identified as ECM and AT represent, respectively the collagen-rich stroma, and fat and tissue-devoid regions of the slide.
Page 5 of 11(page number not for citation purposes)
BMC Medical Imaging 2006, 6:14 http://www.biomedcentral.com/1471-2342/6/14
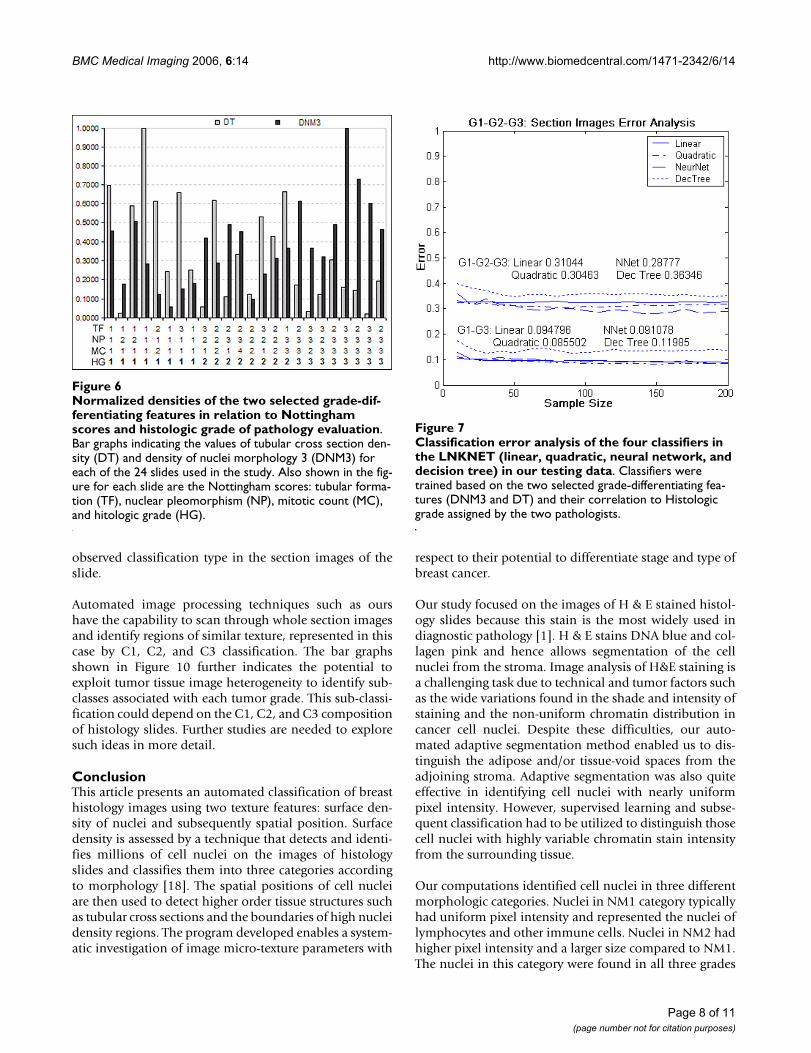
ward Search methods in LNKnet, two of the extractedhigher order features, DNM3 and DT, were identified asaccurately predicting the histologic grade significantlymore frequently than the other seven. These two discrimi-nant inputs were the DNM3 and the DT. Figure 6 showsthe whole-slide normalized densities of these two featuresin all 24 patient cases in relation to the Nottingham scoresand Histologic grade assigned by the two pathologists.Using these two Discriminant features different super-vised classifiers in the LNKNET were trained and tested.Out of various available classifiers (linear, quadratic, neu-ral network, decision tree, etc.) in the LNKnet, the quad-ratic classifier resulted in providing minimum meanclassification errors when evaluated in the testing set (Fig.7).
Results and discussionIn this study, we have used an automated imaging algo-rithm that identifies cancer cell nuclei in histology slideimages and classifies these nuclei into three categoriesaccording to morphology [18]. The algorithm also deter-mines the spatial patterns in cell nuclei distribution onhistology images. The micro-texture parameters obtainedfrom histology images are potential indicators of cancer
type and grade. The end result of the image processing onhistology slides was the separation of the image into thefollowing regions: adipose and tissue-empty regions ofthe slide (AT), ECM, and the cell nuclei classified intothree categories according the morphology (NM1, NM2,NM3). In this way, automated procedure identified thespatial positions of hundreds of thousands of cell nucleiper histology slide image.
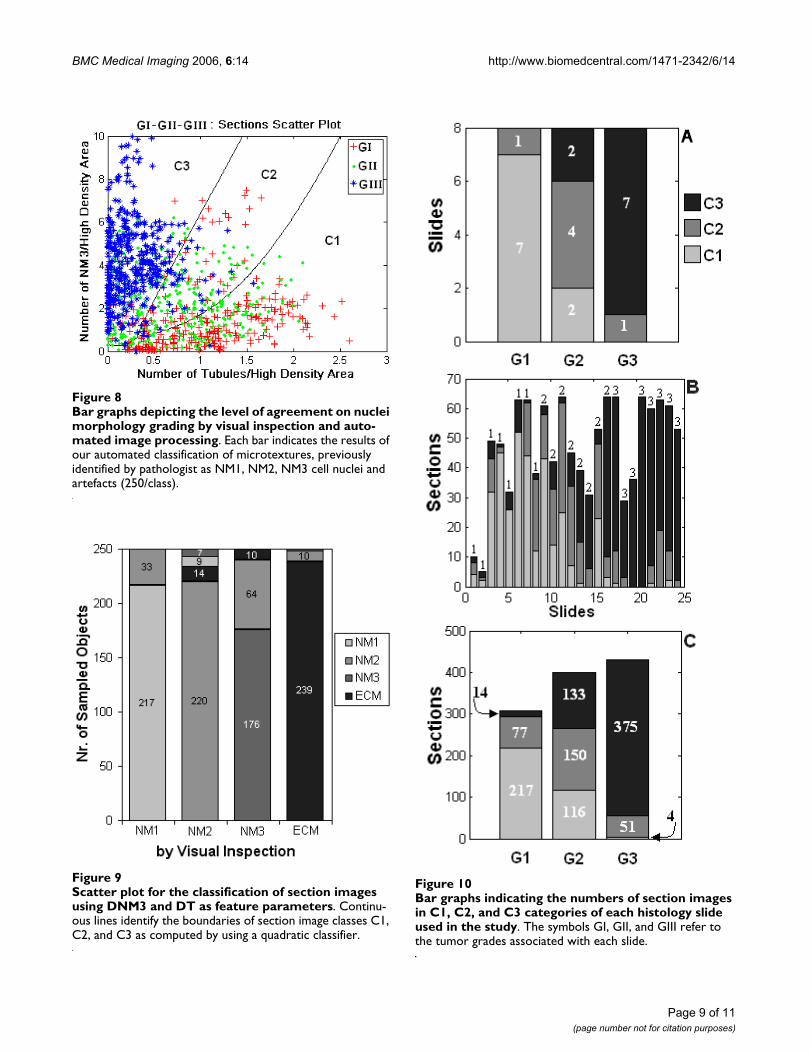
Computations with the labelled dataset of image objectsshowed close match on nuclei identification by visualinspection and automated image processing. Bar graphsin Figure 8 shows the classification results from the testingdataset that were obtained by using the LNKnet binarydecision tree classifier composed of 50 nodes and 51leaves. The results depicted by the bar graphs in this figureindicate that the automated procedure described in thisstudy correctly identified blobs caused by stains and otherartefacts as non-nuclei 239 out 250 times (95.6%) andassessed only 24 cell nuclei out of 750 (3.2%) as artefacts(not nuclei). Thus the automated system used in the studyidentified 4.4% of objects that pathologists considered asartefacts as cell nuclei and 3.2% of the objects that pathol-ogists considered as nuclei as artefacts. These results indi-
Flowchart for section-image level processingFigure 4Flowchart for section-image level processing. Original image is processed to identify the spatial positions of thousands of cell nuclei in each section image. This information is then used to compute nuclei density at each pixel of the section image using a square window (50 pixels × 50 pixels). The resulting histogram undergoes adaptive segmentation to identify regional maxima indicating high-nuclei density regions.
Page 6 of 11(page number not for citation purposes)
BMC Medical Imaging 2006, 6:14 http://www.biomedcentral.com/1471-2342/6/14
cate that automated image processing predictions are inline with those of visual inspection and compare well withresults of other studies [12-14].
The discrepancy between automated predictions ofnuclear morphology type and visual assessment are alsoshown in Figure 8. The procedure identified about 20 %of nuclei deemed as NM3 by visual inspection as NM2nuclei. In the set of 250 nuclei previously labelled by vis-ual inspection as belonging to the NM3 morphology, ourautomated system identified 176 nuclei as NM3 nuclei,64 as NM2 nuclei and 10 as ECM. No nuclei previouslygraded as NM1 were identified by automated imaging asNM3 whereas only a small percentage of NM2 gradednuclei were identified by our automated system as NM3(7/250). These results indicate that NM3 could be under-estimated in some slides by as much as 20% compared tovisual evaluation. But since all slides were evaluated usingthe same automated image analysis the results could beexpected to be consistent within the dataset.
Classification of section imagesPathologists frequently use subsections of the image of awhole section histology image. Therefore, we focused onthe classification of 1062 section images derived from the24 whole section slide images. The feature vector for eachsection image consisted of the number density of nuclei(DNM1, DNM2, DNM3, DNM1-2, DNM1-3, DNM2-3,DNM1-2-3), the number density of tubules (DT) and themean distance between neighbouring nuclei (DN). As
described in the methods section, supervised classifica-tion was used to identify the discriminant features out ofthe nine features previously described. The classificationindicated DNM3 and DT as grade differentiating parame-ters. The scattering diagram shown in Figure 9 identifiesDNM3 and DT values for each of the section images usedin the study. Section images are identified as point sym-bols in this graph by the grade of the whole slide to whichthey belong. The figure shows that typically DNM3increased and DT decreased with increasing grade of his-tology images but that the feature coordinates of sectionimages did not group into three easily identifiable clus-ters. We then used a quadratic classifier from the LNKnetsoftware package to allocate the section images into threeclasses identified as C1, C2, and C3. As described in theMethods section, the quadratic classifier was trained toassociate class 1 (C1) of section images with Grade I (GI),C2 with GII and C3 with G3. The continuous lines thatseparate the scatter plot in Figure 9 into three regionsidentify the boundaries of the C1, C2, and C3 classes ofsection images that were determined by the quadratic clas-sifier. The figure shows that the section images previouslygraded by pathologists as grade I and III (GI, GIII) werewell separated in classes C1 and C3 whereas half of theslide-images graded as II (GII) were allocated into C2 andthe rest into C1 or C3. This point is further emphasized inFigure 10 in the bar graphs indicating the number of C1,C2, and C3 category section images in each histology slidein the data set. The figure shows that the grade of thetumor is strongly correlated with the most frequently
Breast tubular cross-sections identified as white regions surrounded by cell nucleiFigure 5Breast tubular cross-sections identified as white regions surrounded by cell nuclei. Original section-image is shown in 5A, whereas the image indicating the tubules identified by our software is presented in 5B.
Page 7 of 11(page number not for citation purposes)
BMC Medical Imaging 2006, 6:14 http://www.biomedcentral.com/1471-2342/6/14
observed classification type in the section images of theslide.
Automated image processing techniques such as ourshave the capability to scan through whole section imagesand identify regions of similar texture, represented in thiscase by C1, C2, and C3 classification. The bar graphsshown in Figure 10 further indicates the potential toexploit tumor tissue image heterogeneity to identify sub-classes associated with each tumor grade. This sub-classi-fication could depend on the C1, C2, and C3 compositionof histology slides. Further studies are needed to exploresuch ideas in more detail.
ConclusionThis article presents an automated classification of breasthistology images using two texture features: surface den-sity of nuclei and subsequently spatial position. Surfacedensity is assessed by a technique that detects and identi-fies millions of cell nuclei on the images of histologyslides and classifies them into three categories accordingto morphology [18]. The spatial positions of cell nucleiare then used to detect higher order tissue structures suchas tubular cross sections and the boundaries of high nucleidensity regions. The program developed enables a system-atic investigation of image micro-texture parameters with
respect to their potential to differentiate stage and type ofbreast cancer.
Our study focused on the images of H & E stained histol-ogy slides because this stain is the most widely used indiagnostic pathology [1]. H & E stains DNA blue and col-lagen pink and hence allows segmentation of the cellnuclei from the stroma. Image analysis of H&E staining isa challenging task due to technical and tumor factors suchas the wide variations found in the shade and intensity ofstaining and the non-uniform chromatin distribution incancer cell nuclei. Despite these difficulties, our auto-mated adaptive segmentation method enabled us to dis-tinguish the adipose and/or tissue-void spaces from theadjoining stroma. Adaptive segmentation was also quiteeffective in identifying cell nuclei with nearly uniformpixel intensity. However, supervised learning and subse-quent classification had to be utilized to distinguish thosecell nuclei with highly variable chromatin stain intensityfrom the surrounding tissue.
Our computations identified cell nuclei in three differentmorphologic categories. Nuclei in NM1 category typicallyhad uniform pixel intensity and represented the nuclei oflymphocytes and other immune cells. Nuclei in NM2 hadhigher pixel intensity and a larger size compared to NM1.The nuclei in this category were found in all three grades
Classification error analysis of the four classifiers in the LNKNET (linear, quadratic, neural network, and decision tree) in our testing dataFigure 7Classification error analysis of the four classifiers in the LNKNET (linear, quadratic, neural network, and decision tree) in our testing data. Classifiers were trained based on the two selected grade-differentiating fea-tures (DNM3 and DT) and their correlation to Histologic grade assigned by the two pathologists.
Normalized densities of the two selected grade-differentiat-ing features in relation to Nottingham scores and histologic grade of pathology evaluationFigure 6Normalized densities of the two selected grade-dif-ferentiating features in relation to Nottingham scores and histologic grade of pathology evaluation. Bar graphs indicating the values of tubular cross section den-sity (DT) and density of nuclei morphology 3 (DNM3) for each of the 24 slides used in the study. Also shown in the fig-ure for each slide are the Nottingham scores: tubular forma-tion (TF), nuclear pleomorphism (NP), mitotic count (MC), and hitologic grade (HG).
Page 8 of 11(page number not for citation purposes)
BMC Medical Imaging 2006, 6:14 http://www.biomedcentral.com/1471-2342/6/14
Page 9 of 11(page number not for citation purposes)
Bar graphs indicating the numbers of section images in C1, C2, and C3 categories of each histology slide used in the studyFigure 10Bar graphs indicating the numbers of section images in C1, C2, and C3 categories of each histology slide used in the study. The symbols GI, GII, and GIII refer to the tumor grades associated with each slide.
Bar graphs depicting the level of agreement on nuclei mor-phology grading by visual inspection and automated image processingFigure 8Bar graphs depicting the level of agreement on nuclei morphology grading by visual inspection and auto-mated image processing. Each bar indicates the results of our automated classification of microtextures, previously identified by pathologist as NM1, NM2, NM3 cell nuclei and artefacts (250/class).
Scatter plot for the classification of section images using DNM3 and DT as feature parametersFigure 9Scatter plot for the classification of section images using DNM3 and DT as feature parameters. Continu-ous lines identify the boundaries of section image classes C1, C2, and C3 as computed by using a quadratic classifier.
BMC Medical Imaging 2006, 6:14 http://www.biomedcentral.com/1471-2342/6/14
of cancer. NM3 nuclei, on the other hand, displayed widevariation of chromatin distribution and were found pref-erentially in high-grade cancers. Automated detection ofthese tissue micro-objects on the histologic image notonly eliminated the bias of the human eye in grading his-tology slides but also enabled us to detect and identify thenuclei type of hundreds of thousands of cells per slide, atask that could not be accomplished by visual determina-tion of nuclei morphology.
The high nuclei-density regions of the stroma were com-puted next using the adaptive segmentation methoddescribed in the Materials and Methods section. Theseregions potentially contain significant information aboutthe progression of the tumor. We found the extent of fattissue and tissue-devoid regions of the image variedsharply from slide to slide even in the subsets of identi-cally graded histology slides and therefore this parametercould not be used in clinically relevant classification ofthe histologic images. On the other hand, the spatial dis-tribution of nuclei data permitted the identification ofbreast ducts and associated tubular sections on the histol-ogy slides. Distinction of tumor section images using var-ious classification algorithms based on supervisedlearning attested to the grade differentiating capacity oftwo micro-object features: the number of NM3 nuclei perunit area (DNM3) and the number of tubules per unitarea (DT) in the high nuclei density region of the stroma.Classification of section images using these two textureparameters separated images obtained from Grade I andGrade III histology slides into distinct categories (C1, C3)and placed the images obtained from Grade II slides inbetween these two categories. In many instances sectionimages obtained from the same slide were classified intodifferent categories (C1, C2, C3) but the grade of the slide(GI, GII, GIII) was typically associated with the most fre-quently observed classification type. We forsee incorpora-tion of additional features such as the number density ofdividing nuclei and the intensity of stains identifying can-cer associated molecular markers into the classificationscheme to achieve a comprehensive sub classification ofbreast tumors.
Our results suggest that computer-based image processingand analysis can be used in to assist pathologists perform-ing this task and lead to a reduction in intra-observer var-iability. The clinical potential of the image processing andclassification scheme presented here will increase whenstudied in combination with other features from multiplecancer evaluation platforms such as biomarker-decoratedimage data, global gene expression profiles and chromo-some aberration measurements.
Competing interestsThe author(s) declare that they have no competing inter-ests.
Authors' contributionsSP carried out the acquisition and digitization of histologyslides, designed and implemented the algorithms for theimage processing, analysis and classification of the histol-ogy slides, and helped to draft the manuscript. FG andMH carried out the pathologic grading and selection ofhistology slides and guided SP in generating the trainingand validation datasets. CK participated in the implemen-tation of image processing and analysis algorithms. ATsupervised and coordinated the entire project, partici-pated in the analysis process, and helped to draft the man-uscript. All authors read and approved the finalmanuscript.
AcknowledgementsNational Science Foundation Grant# 235327.
National Institute of Health Grant# 232240.
Pennsylvania Department of Health Grant# 240205.
References1. Scarff RW, Torloni H: Histological typing of breast tumors.
International histological classification of tumors. WorldHealth Organization 1968, 2(2):13-20.
2. Elston CW, Ellis IO: Pathological prognostic factors in breastcancer. The value of histological grade in breast cancer:experience from a large study with long-term follow-up. His-topathology 1991, 19:403-410.
3. Balslev I, Axelsson CK, Zedeler K, Rasmussen BB, Carstensen B,Mouridsen HT: The Nottingham Prognostic Index applied to9,149 patients from the studies of the Danish Breast CancerCooperative Group (DBCG). Breast Cancer Res Treat 1994,32:281-290.
4. Albert R, Muller JG, Kristen P, Harms H: Objective Nuclear Grad-ing for Node-Negative breast cancer patients comparison ofquasi-3D and 2D image-analysis based on light microscopicimages. Lab Invest 1998, 78(3):247-259.
5. Dalton LW, Pinder SE, Elston CE, Ellis IO, Page DL, Dupont WD,Blamey RW: Histologic grading of breast cancer: linkage ofpatient outcome with level of pathologist agreement. ModPathol 2000, 13:730-735.
6. Moore A, McQuay H, Gray JAM: Pathology as art appreciation.Bandolier, Oxford 1997, 4(3):37.
7. Roberts CA, Beitsch PD, Litz CE, Hilton DS, Ewing GE, Clifford E,Taylor W, Hapke MR, Babaian A, Khalid I, Hall JD, Lindberg G, Mol-berg K, Saboorian H: Interpretive disparity among pathologistsin breast sentinel lymph node evaluation. Am J Surg 2003,186(4):324-329.
8. Han W, Kang D, Park IA, Kim SW, Bae JY, Chung KW, Noh DY:Associations between Breast Cancer Susceptibility GenePolymorphisms and Clinicopathological Features. ClinicalCancer Research 2004, 10:124-130.
9. Hoglund M, Gisselsson D, Hansen GB, Sall T, Mitelman F: Multivar-iate analysis of chromosomal imbalances in breast cancerdelineates cytogenetic pathways and reveals complex rela-tionships among imbalances. Cancer Research 2002,62(9):2675-80.
10. Jennsen TK, Kuo WP, Stokkle T, Hovig E: Associations betweengene expressions in breast cancer and patient survival. HumGenetics 2002, 111:411-420.
11. Liotta L, Petricoin E: Molecular profiling of human cancer.Nature Reviews Genetics 2000, 1:48-56.
Page 10 of 11(page number not for citation purposes)
BMC Medical Imaging 2006, 6:14 http://www.biomedcentral.com/1471-2342/6/14
Publish with BioMed Central and every scientist can read your work free of charge
"BioMed Central will be the most significant development for disseminating the results of biomedical research in our lifetime."
Sir Paul Nurse, Cancer Research UK
Your research papers will be:
available free of charge to the entire biomedical community
peer reviewed and published immediately upon acceptance
cited in PubMed and archived on PubMed Central
yours — you keep the copyright
Submit your manuscript here:http://www.biomedcentral.com/info/publishing_adv.asp
BioMedcentral
12. Latson L, Sebek B, Powell KA: Automated cell nuclear segmen-tation in color images of hematoxylin and eosin-stainedbreast biopsy. Analytical and Quantitative Cytology and Histology 2003,25(6):321-331.
13. Schnorrenberg F, Pattichis C, Kyriacou K, Schizas C: Computer-Aided Detection of Breast Cancer Nuclei. IEEE Trans on Infor-mation Tech in Biomedicine 1997, 1(2):128-140.
14. Schupp S, Elmoataz A, Herlin P, Bloyet D: Mathematical morpho-logic segmentation deticated to quantitative immunohisto-chemistry. Analytical and Quantitative Cytology and Histology 2001,23(4):257-267.
15. Bacus JW, Boone Charles W, Bacus James V, Michele Follen, KelloffGary J, Valery Kagan, Scott Lippman M: Image MorphometricNuclear Grading of Intraepithelial Neoplastic Lesions withApplications to Cancer Chemoprevention Trials. Cancer Epi-demiol Biomarkers Prev 1999, 8:1087-1094.
16. Hoque A, Lippman Scott M, Boiko Iouri V, Atkinson Edward N, NourSneige, Aysegul Sahin, Weber Diane M, Seymon Risin, Lagios MichaelD, Roland Schwarting, Colburn William J, Kapil Dhingra, Michele Fol-len, Kelloff Gary J, Boone Charles W, Hittelman Walter N: Quanti-tative Nuclear Morphometry by Image Analysis forPrediction of Recurrence of Ductal Carcinoma in Situ of theBreast. Cancer Epidemiol Biomarkers Prev 2001, 10:249-259.
17. Wolberg WH, Street WN, Heisey DM, Mangasarian OL: Compu-ter-derived nuclear grade and breast cancer prognosis. Ana-lytical Quantitative Cytology Histology 1995, 17:257-64.
18. Petushi S, Katsinis C, Coward C, Garcia F, Tozeren A: Automatedidentification of microstructures on histology slides. IEEEInternational Symposium on Biomedical Imaging: Macro to Nano 2004,1:424-427.
19. Otsu O: A threshold selection method from gray-level histo-gram. IEEE Transactions on System Man Cybernetics 1979, 9(1):62-66.
20. Sonka M, Fitzpatrick JM: Handbook of Medical Imaging. SPIEPress; 2000:182-200.
21. LNKNET Software Package, MIT Open Source. .
Pre-publication historyThe pre-publication history for this paper can be accessedhere:
http://www.biomedcentral.com/1471-2342/6/14/prepub
Page 11 of 11(page number not for citation purposes)
Copyright © 2022 FDOKUMEN