
Landslides and lineament mapping along the Simpang Pulai to Kg Raja highway, Malaysia
19
This article was downloaded by: [Universiti Putra Malaysia] On: 07 August 2011, At: 16:19 Publisher: Taylor & Francis Informa Ltd Registered in England and Wales Registered Number: 1072954 Registered office: Mortimer House, 37-41 Mortimer Street, London W1T 3JH, UK International Journal of Remote Sensing Publication details, including instructions for authors and subscription information: http://www.tandfonline.com/loi/tres20 Landslides and lineament mapping along the Simpang Pulai to Kg Raja highway, Malaysia N. Yusof a b , M. F. Ramli b , S. Pirasteh c & H. Z. M. Shafri d a Faculty of Geoinformation and Real Estate, Universiti Teknologi Malaysia, 81310, UTM Skudai, Johor, Malaysia b Faculty of Environmental Studies, Universiti Putra Malaysia, 43400, Serdang, Malaysia c Spatial and Numerical Modeling, Institute of Advance Technology, University Putra Malaysia, 43400, UPM, Serdang, Selangor, Malaysia d Faculty of Engineering, Universiti Putra Malaysia, 43400, Serdang, Malaysia Available online: 30 Jun 2011 To cite this article: N. Yusof, M. F. Ramli, S. Pirasteh & H. Z. M. Shafri (2011): Landslides and lineament mapping along the Simpang Pulai to Kg Raja highway, Malaysia, International Journal of Remote Sensing, 32:14, 4089-4105 To link to this article: http://dx.doi.org/10.1080/01431161.2010.484434 PLEASE SCROLL DOWN FOR ARTICLE Full terms and conditions of use: http://www.tandfonline.com/page/terms-and- conditions This article may be used for research, teaching and private study purposes. Any substantial or systematic reproduction, re-distribution, re-selling, loan, sub-licensing, systematic supply or distribution in any form to anyone is expressly forbidden. The publisher does not give any warranty express or implied or make any representation that the contents will be complete or accurate or up to date. The accuracy of any instructions, formulae and drug doses should be independently verified with primary sources. The publisher shall not be liable for any loss, actions, claims, proceedings,
Transcript of Landslides and lineament mapping along the Simpang Pulai to Kg Raja highway, Malaysia
This article was downloaded by: [Universiti Putra Malaysia]On: 07 August 2011, At: 16:19Publisher: Taylor & FrancisInforma Ltd Registered in England and Wales Registered Number: 1072954 Registeredoffice: Mortimer House, 37-41 Mortimer Street, London W1T 3JH, UK
International Journal of RemoteSensingPublication details, including instructions for authors andsubscription information:http://www.tandfonline.com/loi/tres20
Landslides and lineament mappingalong the Simpang Pulai to Kg Rajahighway, MalaysiaN. Yusof a b , M. F. Ramli b , S. Pirasteh c & H. Z. M. Shafri da Faculty of Geoinformation and Real Estate, Universiti TeknologiMalaysia, 81310, UTM Skudai, Johor, Malaysiab Faculty of Environmental Studies, Universiti Putra Malaysia,43400, Serdang, Malaysiac Spatial and Numerical Modeling, Institute of AdvanceTechnology, University Putra Malaysia, 43400, UPM, Serdang,Selangor, Malaysiad Faculty of Engineering, Universiti Putra Malaysia, 43400,Serdang, Malaysia
Available online: 30 Jun 2011
To cite this article: N. Yusof, M. F. Ramli, S. Pirasteh & H. Z. M. Shafri (2011): Landslides andlineament mapping along the Simpang Pulai to Kg Raja highway, Malaysia, International Journal ofRemote Sensing, 32:14, 4089-4105
To link to this article: http://dx.doi.org/10.1080/01431161.2010.484434
PLEASE SCROLL DOWN FOR ARTICLE
Full terms and conditions of use: http://www.tandfonline.com/page/terms-and-conditions
This article may be used for research, teaching and private study purposes. Anysubstantial or systematic reproduction, re-distribution, re-selling, loan, sub-licensing,systematic supply or distribution in any form to anyone is expressly forbidden.
The publisher does not give any warranty express or implied or make any representationthat the contents will be complete or accurate or up to date. The accuracy of anyinstructions, formulae and drug doses should be independently verified with primarysources. The publisher shall not be liable for any loss, actions, claims, proceedings,

demand or costs or damages whatsoever or howsoever caused arising directly orindirectly in connection with or arising out of the use of this material.
Dow
nloa
ded
by [
Uni
vers
iti P
utra
Mal
aysi
a] a
t 16:
19 0
7 A
ugus
t 201
1
Landslides and lineament mapping along the Simpang Pulai to Kg Rajahighway, Malaysia
N. YUSOF*†‡, M. F. RAMLI‡, S. PIRASTEH§ and H. Z. M. SHAFRI¶
†Faculty of Geoinformation and Real Estate, Universiti Teknologi Malaysia, 81310 UTM
Skudai, Johor, Malaysia
‡Faculty of Environmental Studies, Universiti Putra Malaysia, 43400 Serdang, Malaysia
§Spatial and Numerical Modeling, Institute of Advance Technology, University Putra
Malaysia, 43400 UPM, Serdang, Selangor, Malaysia
¶Faculty of Engineering, Universiti Putra Malaysia, 43400 Serdang, Malaysia
(Received 30 July 2009; in final form 26 March 2010)
Geological structural features, such as the discontinuities that may be detected on
satellite imagery as lineaments, in many cases control landslide occurrences.
Lineament may represent the plane of weakness where the strength of the slope
material has been reduced, eventually resulting in slope failure. The main objective
of this study is to assess the relationship between lineament and landslide occur-
rences along the Simpang Pulai to Kg Raja highway, Malaysia. Lineament map-
ping was undertaken utilizing Landsat imagery and landslide distributions were
identified based on field mapping and historical records. Lineament density maps
of length, number and intersections were generated and compared with landslide
distributions. The lineaments were also visually compared with the landslide
occurrences. The results showed that there is an association between the linea-
ments and landslide distribution. Thus, lineament mapping is essential for the early
stages of planning to prevent hazard potential from landslides.
1. Introduction
Malaysia has a humid tropical climate with an average annual rainfall of 2450 mm
and average temperatures of 22–32�C. The high-intensity tropical rainfall coupledwith hilly areas and a deeply weathered rock profile comprise near-ideal conditions
for landslide development (Dunning et al. 2009). Human activity in these susceptible
areas, such as undercutting the geologically weak slopes for road construction, may
‘over-steepen’ the slope and subsequently induce landslides (Norbu et al. 2003,
Keunza et al. 2004, Dunning et al. 2009).
Landslides in both natural and cut slopes are a common problem in Malaysia,
especially in areas where indiscriminate land use change occurs. The Simpang Pulai to
Kampung Raja highway is one of the areas where landslides are prevalent. This is due
*Corresponding author. Email: [email protected].
This article was originally presented at the 2nd International Conference on
Geoinformation Technology for Natural Disaster Management and Rehabilitation,
Bangkok (January 2009), and initially processed by Dr. Saied Pirasteh and Dr. Nitin
K. Tripathi.
International Journal of Remote SensingISSN 0143-1161 print/ISSN 1366-5901 online # 2011 Taylor & Francis
http://www.tandf.co.uk/journalsDOI: 10.1080/01431161.2010.484434
International Journal of Remote Sensing
Vol. 32, No. 14, 20 July 2011, 4089–4105
Dow
nloa
ded
by [
Uni
vers
iti P
utra
Mal
aysi
a] a
t 16:
19 0
7 A
ugus
t 201
1
to the intensive slope cut for construction of the highway, which passes through the
Titiwangsa mountain range (Husaini et al. 2005). Although there have been no fatal-
ities so far, there has been one close call, when a motorist braked just on time to avoid
being swept into a ravine by a mudslide at kilometre 13 of the Pos Slim to Kampung
Raja highway (The Star 2006).Landslides are reported in many cases to be controlled mostly by structural trends
such as discontinuities (Walker et al. 1987, Hui et al. 1990, Nagarajan and Khire 1998,
Aziman and Husaini 2001, Pradhan et al. 2006). A discontinuity plane can be defined
as separation or fracture in a geological formation which divides the rock into two or
more pieces (Prost 1994). Fractures are commonly caused by stress exceeding the
rock’s strength where loss of consistency in rock structure occurs. These structural
weaknesses originated mostly around physical discontinuities such as faults, joint sets
or dykes (O’Leary et al. 1976, Davis 1984, Clark and Wilson 1994).These discontinuities can be identified and measured not only by geological field
survey but also by utilizing remotely sensed imagery through means of lineament
interpretation and the characteristics of spatial patterns of fractures (Caran et al.
1981, Finely and Gustavson 1981, Prost 1994, Koike et al. 1995, Rowan and Bowers
1995, Keller and Pinter 1996, Banerjee and Mitra 2004).
Lineamentwhichmaybe identifiedasa lineof landscapereveals theunseenstructureof
the rock basement (Hobbs 1904). These discontinuities in rocks frequently result in linear
or curvilinear morphological features along the intersection of a fracture plane or thesurface expression ofa fault (Paulsenand Wilson2004, Kheiralla etal. 2006, Masoudand
Koike 2006, Al-Mokredi et al. 2007). A good correlation between structures mapped,
such as the fault trends on the field and lineament system, enables lineaments to be
regarded as representative of the structural indications of the particular areas (Arlegui
and Soriano 1998, Morelli and Piana 2006). The presence of lineaments also may greatly
affect the stability of rock masses (Andreas and Allan 2007).
In this study, only the topographically negative lineaments were utilized to repre-
sent the discontinuity features (Juhari and Ibrahim 1997, Koch and Mather 1997,Solomon and Ghebreab 2006, Ramli et al. 2009). The identification of negative
lineaments was based on linear valleys (Jordana and Schott 2005). The linear valley
was used as the primary identification criterion to represent the negative lineament on
the imagery (Koike et al. 1995, Sarp 2005).
Structural weakness due to the presence of lineaments has been identified to cause
slope movements by many researchers (Crosta and Zanchi 2000, Agliardi et al. 2001,
Ambrosi and Crosta 2006). The movement is slow and continuous for a long period of
time and may contribute to large cumulative displacements (Cruden and Hu 1993,Ballantyne 2002, Ambrosi and Crosta 2006). However, it is not clear whether the
structural lineament features play an active or passive role in the slope movements –
whether they coincide with a zone of stress concentration or are simply a zone of weak
rock (Ambrosi and Crosta 2006).
Occurrences of landslides are mostly identified in areas of linear patterns or linea-
ments (Nagarajan et al. 1998). Many researchers have shown that lineaments corre-
late with landslide distribution (Nagarajan and Khire 1998, Nagarajan et al. 2000,
Pradhan et al. 2006, Yilmaz and Yildirim 2006). Therefore, the main objective of thisarticle is to identify the relationship between landslide occurrences along Simpang
Pulai highway and lineament in the study area. The lineament study may reveal
generalities that will support understanding of landslides in the region (Ayalew and
Yamagishi 2005).
4090 N. Yusof et al.
Dow
nloa
ded
by [
Uni
vers
iti P
utra
Mal
aysi
a] a
t 16:
19 0
7 A
ugus
t 201
1

2. Study area
The main range, locally known as Banjaran Titiwangsa, is the main backbone of
Peninsular Malaysia and stretches to about 500 km from the border with Thailand,
trending northwest–southeast along the Peninsular Malaysia. The study area is located
at the Simpang Pulai to Kampung Raja highway which passes through the Banjaran
Titiwangsa, with slope steepness varying from 35� to 40� (Bujang et al. 2008; figure 1).
Simpang Pulai is situated in Perak while Kampung Raja is in Cameron Highlands,
Pahang. A highway was built to connect these two small towns in May 1997 and
scheduled to be completed in 2000. However, the project was only completed andopened to the public on 24 February 2004 due to several landslides that delayed the
project (Hussein and Alimat 2003). Landslide 4 was reported to be the largest landslide
and was triggered by the intense rainfall in March 2001 (Bujang et al. 2008; figure 1).
2.1 Geological setting
The study area is underlain by granite and metasedimentary schists (figure 1). The rocks
are moderate to completely weathered. Highly fractured schist shows more complex
geological structures compared with granite. Granite covers about 63% of the study area,
while schist comprises about 37% (Bujang et al. 2008). Owing to the intrusion of granite,
schist is normally situated at the upper part of the elevation (Husaini et al. 2005). The
intrusion of granite batholith during the Triassic converted sedimentary rocks into highlyfolded and faulted metasedimentary rocks (Hutchison et al. 1973). For granite, generally
the weathering profile ranges from 6 to 10 m thick residual soils or completely weathered
rock (grade VI–V), which gradually changes to high to moderate weathered rock (grade
IV–III) at depths of 15–20 m (Bujang et al. 2008). For the schist area, the thickness of the
residual soil is less than 6 m, followed by weathered rock and alternatively close-spaced
weathering of hard to weak layers (Bujang et al. 2008). Four faults have been identified
by the Department of Minerals and Geoscience (DMG) in the study area (Ramli et al.
2009; figure 2). There is a possibility that more extracted lineaments probably of faultscan be recognized from the Landsat imagery. Novak and Soulakellis (2000) also deli-
neated many lineaments on the Landsat imagery such as the faults and tectonic contacts
that were previously unmapped. The obtained lineaments will enhance the density
analysis and their association with the landslide occurrences.
3. Methodology
3.1 Data collection
Landslide locations were identified from previous studies (Aziman and Husaini 2001,
Husaini et al. 2005), interpreted from 1:10 000 scale 2005 aerial photos and field visits.
The moderate scale of the aerial photos renders it difficult to differentiate between
landslides and bare soil. To overcome the problem, only landslides that were clearly
visible during the field visits were mapped (Claessens et al. 2007, Zhang and Wang2007) and their locations were recorded using a Garmin GPS 72 hand-held attached to
a personal digital assistant. The accuracy of the GPS (Global Positioning System)
observations were less than 15 m (Garmin 2002). Pack et al. (1998) suggested that the
landslide positions should be mapped at the head scarp of the slope failure. However,
it was difficult to reach the landslide scarp due to the steep slope and soil overflow.
Thus, the positions of landslide were observed from each end of the landslide toe. The
height of the landslides was approximated based on the number of the slope berm.
Landslides and lineaments analysis 4091
Dow
nloa
ded
by [
Uni
vers
iti P
utra
Mal
aysi
a] a
t 16:
19 0
7 A
ugus
t 201
1
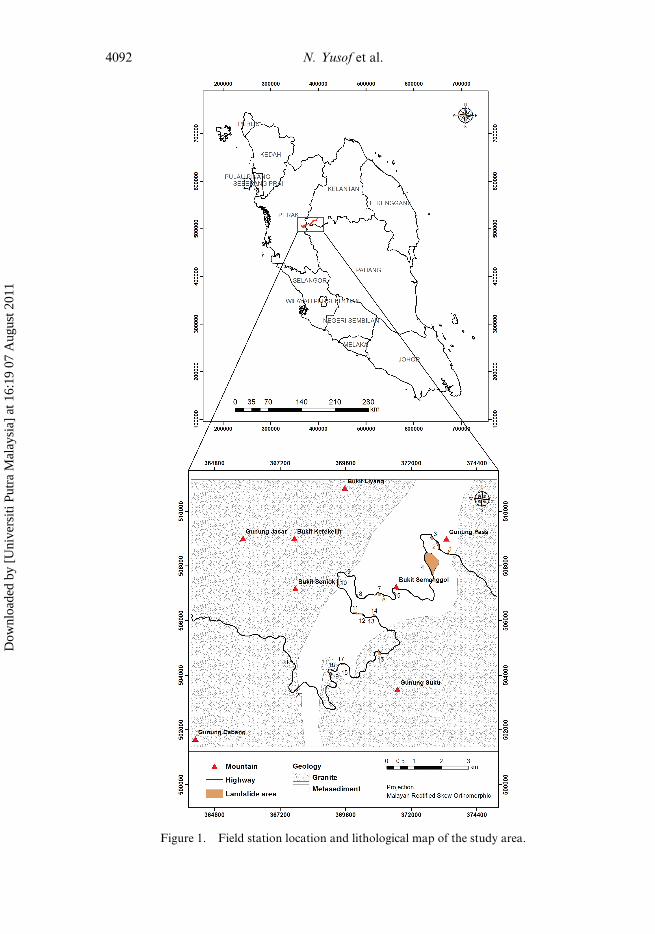
Figure 1. Field station location and lithological map of the study area.
4092 N. Yusof et al.
Dow
nloa
ded
by [
Uni
vers
iti P
utra
Mal
aysi
a] a
t 16:
19 0
7 A
ugus
t 201
1
Ta
ble
1.
Pre
vio
us
an
dre
cen
tla
nd
slid
ed
escr
ipti
on
s.
La
nd
slid
en
um
ber
Des
crip
tio
ns
Nu
mb
ero
fli
nea
men
tsa
nd
lin
eam
ent
inte
rsec
tio
ns
wit
hin
20
0m
of
lan
dsl
ide
Den
sity
ma
p
1(R
ecen
tla
nd
slid
e)l
2m
wid
tha
nd
5m
hei
gh
t4
lin
eam
ents
an
d2
inte
rsec
tio
ns
lH
igh
den
sity
of
nu
mb
era
nd
inte
rsec
tio
ns
of
lin
eam
ents
l5
8�
slo
pe
gra
die
nt
lM
od
era
ted
ensi
tyo
fli
nea
men
tle
ng
thl
No
wa
ter
seep
ag
eid
enti
fied
2(R
ecen
tla
nd
slid
e)l
25
9m
wid
tha
nd
7m
hei
gh
t4
lin
eam
ents
an
d1
inte
rsec
tio
nl
Hig
hd
ensi
tyo
fn
um
ber
an
din
ters
ecti
on
so
fli
nea
men
tsl
40� –
50�
slo
pe
gra
die
nt
lM
od
era
ted
ensi
tyo
fli
nea
men
tle
ng
thl
Wa
ter
seep
ag
eid
enti
fied
3(R
ecen
tla
nd
slid
e)l
4–
5m
wid
tha
nd
50
mh
eig
ht
7li
nea
men
tsa
nd
1in
ters
ecti
on
lH
igh
den
sity
of
nu
mb
era
nd
inte
rsec
tio
ns
of
lin
eam
ents
l6
0� –
70�
slo
pe
gra
die
nt
lM
od
era
ted
ensi
tyo
fli
nea
men
tle
ng
thl
No
wa
ter
seep
ag
eid
enti
fied
4(R
ecen
tla
nd
slid
e)l
Th
eu
pp
erla
nd
slid
eis
81
2m
len
gth
,1
35
0m
hei
gh
t1
2li
nea
men
tsa
nd
6in
ters
ecti
on
sl
Hig
hd
ensi
tyo
fn
um
ber
,le
ng
tha
nd
inte
rsec
tio
ns
of
lin
eam
ents
lA
ver
ag
e3
6�
slo
pe
gra
die
nt
lM
od
era
ted
ensi
tyo
fli
nea
men
tle
ng
thl
Wa
ter
seep
ag
eid
enti
fied
5(P
rev
iou
sla
nd
slid
e)l
70
mw
idth
an
d5
0m
hei
gh
t3
lin
eam
ents
an
d1
inte
rsec
tio
nl
Hig
hd
ensi
tyo
fn
um
ber
an
dle
ng
tho
fli
nea
men
tsl
60�
slo
pe
gra
die
nt
lM
od
era
ted
ensi
tyo
fle
ng
tha
nd
inte
rsec
tio
ns
of
lin
eam
ents
lN
ow
ate
rse
epa
ge
bee
nre
po
rted
6(R
ecen
tla
nd
slid
e)l
3–
4m
wid
tha
nd
6m
hei
gh
t2
lin
eam
ents
lH
igh
den
sity
of
lin
eam
ent
nu
mb
erl
30� –
40�
slo
pe
gra
die
nt
lM
od
era
ted
ensi
tyo
fle
ng
tha
nd
inte
rsec
tio
ns
of
lin
eam
ents
lN
ow
ate
rse
epa
ge
iden
tifi
ed
7(P
rev
iou
sla
nd
slid
e)l
50
–6
0m
wid
tha
nd
60
mh
eig
ht
1li
nea
men
tl
Hig
hd
ensi
tyo
fli
nea
men
tn
um
ber
l3
0� –
40�
slo
pe
gra
die
nt
lM
od
era
ted
ensi
tyo
fle
ng
tha
nd
inte
rsec
tio
ns
of
lin
eam
ents
lN
ow
ate
rse
epa
ge
iden
tifi
ed
(Co
nti
nu
ed)
Landslides and lineaments analysis 4093
Dow
nloa
ded
by [
Uni
vers
iti P
utra
Mal
aysi
a] a
t 16:
19 0
7 A
ugus
t 201
1
Ta
ble
1.
(Co
nti
nu
ed.)
La
nd
slid
en
um
ber
Des
crip
tio
ns
Nu
mb
ero
fli
nea
men
tsa
nd
lin
eam
ent
inte
rsec
tio
ns
wit
hin
20
0m
of
lan
dsl
ide
Den
sity
ma
p
8(R
ecen
tla
nd
slid
e)l
2m
wid
tha
nd
6m
hei
gh
t2
lin
eam
ents
an
d1
inte
rsec
tio
nto
each
oth
erl
Hig
hn
um
ber
of
lin
eam
ent
den
sity
l1
6� –
25�
slo
pe
gra
die
nt
lM
od
era
tele
ng
tha
nd
inte
rsec
tio
nd
ensi
tyo
fli
nea
men
tsl
No
wa
ter
seep
ag
eid
enti
fied
9(R
ecen
tla
nd
slid
e)l
2m
wid
tha
nd
6m
hei
gh
t3
lin
eam
ents
an
d1
inte
rsec
tio
nl
Hig
hd
ensi
tyo
fli
nea
men
tn
um
ber
l2
6� –
35�
slo
pe
gra
die
nt
lM
od
era
ted
ensi
tyo
fle
ng
tha
nd
inte
rsec
tio
no
fli
nea
men
tsl
No
wa
ter
seep
ag
eid
enti
fied
10
(Pre
vio
us
lan
dsl
ide)
l3
0–
40
mw
idth
an
d5
0m
hei
gh
t3
lin
eam
ents
lH
igh
den
sity
of
lin
eam
ent
nu
mb
erl
56�
slo
pe
gra
die
nt
lM
od
era
ted
ensi
tyo
fle
ng
tha
nd
inte
rsec
tio
no
fli
nea
men
tsl
No
wa
ter
seep
ag
eid
enti
fied
11
(Pre
vio
us
lan
dsl
ide)
l6
0m
wid
tha
nd
40
mh
eig
ht
3li
nea
men
tsl
Hig
hd
ensi
tyo
fli
nea
men
tn
um
ber
l6
3�
slo
pe
gra
die
nt
lM
od
era
ted
ensi
tyo
fle
ng
tha
nd
inte
rsec
tio
no
fli
nea
men
tsl
No
wa
ter
seep
ag
eid
enti
fied
12
(Pre
vio
us
lan
dsl
ide)
l6
0–
70
mw
idth
an
d4
0m
hei
gh
t2
lin
eam
ents
lH
igh
den
sity
of
lin
eam
ent
nu
mb
erl
60� –
65�
slo
pe
gra
die
nt
lM
od
era
ted
ensi
tyo
fle
ng
tha
nd
inte
rsec
tio
ns
of
lin
eam
ents
lW
ate
rse
epa
ge
iden
tifi
ed
13
(Pre
vio
us
lan
dsl
ide)
l4
0m
wid
tha
nd
30
mh
eig
ht
3li
nea
men
tsl
Hig
hd
ensi
tyo
fli
nea
men
tn
um
ber
l3
0�
slo
pe
gra
die
nt
lM
od
era
ted
ensi
tyo
fle
ng
tha
nd
inte
rsec
tio
ns
of
lin
eam
ents
lW
ate
rse
epa
ge
iden
tifi
ed
14
(Pre
vio
us
lan
dsl
ide)
l6
0m
wid
tha
nd
50
mh
eig
ht
4li
nea
men
tsa
nd
1in
ters
ecti
on
lH
igh
den
sity
of
lin
eam
ent
nu
mb
erl
35� –
40�
slo
pe
gra
die
nt
lM
od
era
ted
ensi
tyo
fle
ng
tha
nd
inte
rsec
tio
ns
of
lin
eam
ents
lN
ow
ate
rse
epa
ge
iden
tifi
ed
(Co
nti
nu
ed)
4094 N. Yusof et al.
Dow
nloa
ded
by [
Uni
vers
iti P
utra
Mal
aysi
a] a
t 16:
19 0
7 A
ugus
t 201
1

Ta
ble
1.
(Co
nti
nu
ed.)
La
nd
slid
en
um
ber
Des
crip
tio
ns
Nu
mb
ero
fli
nea
men
tsa
nd
lin
eam
ent
inte
rsec
tio
ns
wit
hin
20
0m
of
lan
dsl
ide
Den
sity
ma
p
15
(Pre
vio
us
lan
dsl
ide)
l6
5m
wid
tha
nd
40
mh
eig
ht
4li
nea
men
tsl
Mo
der
ate
den
sity
of
len
gth
,n
um
ber
an
din
ters
ecti
on
so
fli
nea
men
tsl
45�
slo
pe
gra
die
nt
lN
ow
ate
rse
epa
ge
iden
tifi
ed
16
(Pre
vio
us
lan
dsl
ide)
l6
5m
wid
tha
nd
40
mh
eig
ht
1li
nea
men
tl
Mo
der
ate
den
sity
of
nu
mb
era
nd
len
gth
of
lin
eam
ents
l5
5�
slo
pe
gra
die
nt
lL
ow
den
sity
of
lin
eam
ent
inte
rsec
tio
ns
lN
ow
ate
rse
epa
ge
iden
tifi
ed
17
(Pre
vio
us
lan
dsl
ide)
l2
0m
wid
tha
nd
70
mh
eig
ht
2li
nea
men
tsl
Mo
der
ate
den
sity
of
len
gth
an
dn
um
ber
of
lin
eam
ents
l6
2�
slo
pe
gra
die
nt
lL
ow
den
sity
of
inte
rsec
tio
ns
of
lin
eam
ent
of
lin
eam
ents
lN
ow
ate
rse
epa
ge
iden
tifi
ed
18
(Pre
vio
us
lan
dsl
ide)
l3
0w
idth
an
d3
0m
hei
gh
t1
lin
eam
ent
lM
od
era
ted
ensi
tyo
fn
um
ber
an
dle
ng
tho
fli
nea
men
tsl
60�
slo
pe
gra
die
nt
lL
ow
den
sity
of
lin
eam
ent
inte
rsec
tio
ns
lW
ate
rse
epa
ge
iden
tifi
ed
19
(Pre
vio
us
lan
dsl
ide)
l6
0m
wid
tha
nd
50
–6
0m
hei
gh
tN
oli
nea
men
tl
Mo
der
ate
den
sity
of
nu
mb
era
nd
len
gth
of
lin
eam
ents
l5
6�
slo
pe
gra
die
nt
lL
ow
den
sity
of
lin
eam
ent
inte
rsec
tio
ns
lW
ate
rse
epa
ge
iden
tifi
ed
20
(Pre
vio
us
lan
dsl
ide)
l1
0m
wid
tha
nd
60
hei
gh
t1
lin
eam
ent
lM
od
era
ted
ensi
tyo
fn
um
ber
an
dle
ng
tho
fli
nea
men
tsl
60� –
70�
slo
pe
gra
die
nt
lL
ow
den
sity
of
lin
eam
ent
inte
rsec
tio
ns
lN
ow
ate
rse
epa
ge
iden
tifi
ed
21
(Pre
vio
us
lan
dsl
ide)
l6
0m
wid
tha
nd
30
–4
0m
hei
gh
t1
lin
eam
ent
lM
od
era
ted
ensi
tyo
fn
um
ber
an
dle
ng
tho
fli
nea
men
tsl
56�
slo
pe
gra
die
nt
lL
ow
den
sity
of
lin
eam
ent
inte
rsec
tio
ns
lW
ate
rse
epa
ge
iden
tifi
ed
Landslides and lineaments analysis 4095
Dow
nloa
ded
by [
Uni
vers
iti P
utra
Mal
aysi
a] a
t 16:
19 0
7 A
ugus
t 201
1
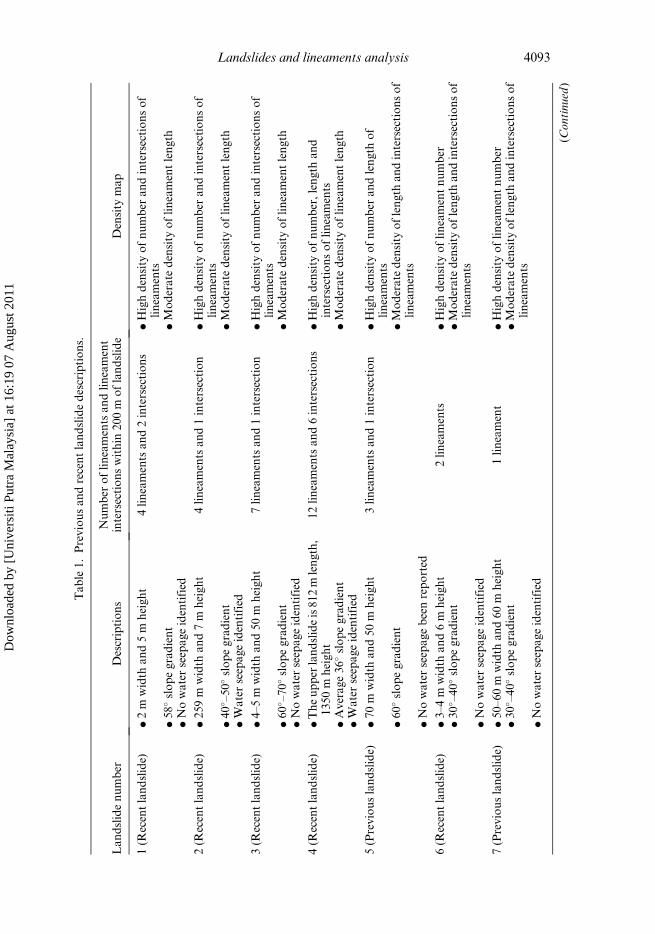
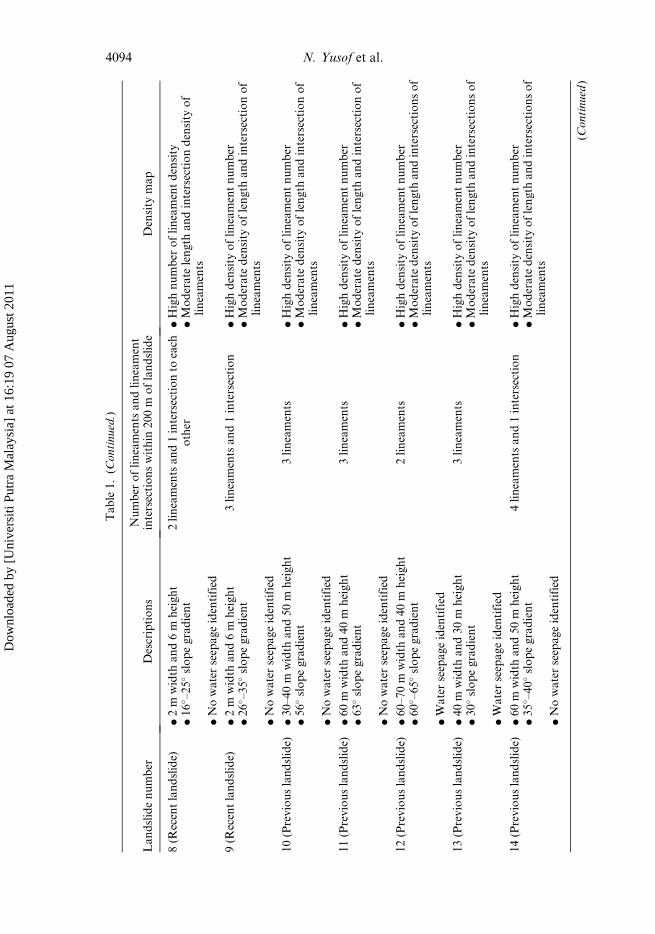
The estimated landslides were digitized as polygons (Duman et al. 2005) in the
geographic information system (GIS) environment (table 1).
The Lineament map from manual lineament interpretation using Landsat TM and
ETMþ of 1990 and 2005 which had been field-verified were utilized. Details on the
method of lineament identification may be found in Ramli et al. (2009).
3.2 Analysis
Lineament density analysis consisted of lineament density (Greenbaum 1985), intersec-
tiondensity (AndreasandAllan2007)andlengthdensity(MorelliandPiana2006),which
were represented in the form of maps. In order to obtain the intersection density map, the
intersection points for every intersect lineament were extracted using the GIS software.
Intersections of lineament were thought to be important in this study. This is because
lineament intersection may be the fault intersection (Florinsky 1996, 2000). The presence
of fault intersections may lead to landslide development (Karakhanyan 1981) due to theproduction of more highly fractured rock (Trippa and Vearncombe 2004, Schwarz and
Kilfitt 2008). Emre et al. (2005) also stressed that the landslide incidence in the Bornova
Basin, _Izmir, Turkey may be related to the eastern segment of the _Izmir fault.
The aim of producing the lineament density maps is to relate probable favourable
zones for landslide occurrences and to identify any spatial associations with landslide
locations. These maps may show the highest fracture density of the study area, which
may represent the geologically weak zone in the study area.
The definition of lineament density depends on the input lineament. The lineamentlength density can be defined as the summed length of lineaments with a specified unit
area of the grid, while for the number of lineament is the number of lineaments
existing per unit area or in each pixel (Al-Mokredi et al. 2007). Multiple fault inter-
sections in various orientations may lead to high density of fracturing at the intersec-
tion point (Trippa and Vearncombe 2004). Because of this, intersection of lineament
density may signify the number of intersection points at a specific per unit area.
The density analysis undertaken utilized the kernel density adapted from the
quadratic kernel function (Silverman 1986). This method may result in a smoothestimation of density surface distribution from a set of observed occurrences (Bailey
and Gatrell 1995). It is recommended for use for fracture concentration identification
(Raju and Reddy 1997). The lineament density was classified into three categories
which consist of low, moderate and high density (Sarkar and Kanungo 2004). The
spatial pattern of high-density lineament areas was expected to have a higher degree of
rock fractures (Hung and Batelaan 2003).
Apart from density analysis, the landslide areas were also overlain on the lineament
map in order to detect any possible spatial relationship between the landslides and thelineaments. Only lineaments within 200 m from the landslide area were selected based
on the probable distance of instability that may be influenced by the lineaments.
4. Results and discussion
4.1 Landslides
Based on the previous studies by Aziman and Husaini (2001) and Husaini et al. (2005),
15 landslides were mapped. During the field visit, another six landslides were identi-
fied. In total, 21 landslides were identified in the study area (figure 2) and all landslides
were found to occur on the slope cuts.
4096 N. Yusof et al.
Dow
nloa
ded
by [
Uni
vers
iti P
utra
Mal
aysi
a] a
t 16:
19 0
7 A
ugus
t 201
1
Fifteen landslides were identified in schist and the remaining six landslides were in
granitic rocks. The landslide areas range from 0.40 to 61.80 acres based on GIS
analysis. Landslide size based on Cornforth (2005) ranges from small (two locations),
medium (18 locations) to large (one location). The largest landslide in the study area is
landslide 4, with a size of 61.80 acres (figures 2 and 3). The landslide scarp can be
clearly observed at the top of the slope (figure 3). Field inspection showed that theslope material is highly foliated and heavily jointed. In comparison, the other land-
slides are significantly smaller compared with this one (figure 4).
4.2 Lineament
The lineament mapping was undertaken before the location of the fault was known. This
is because the first geological map of the study area that the authors managed to obtain
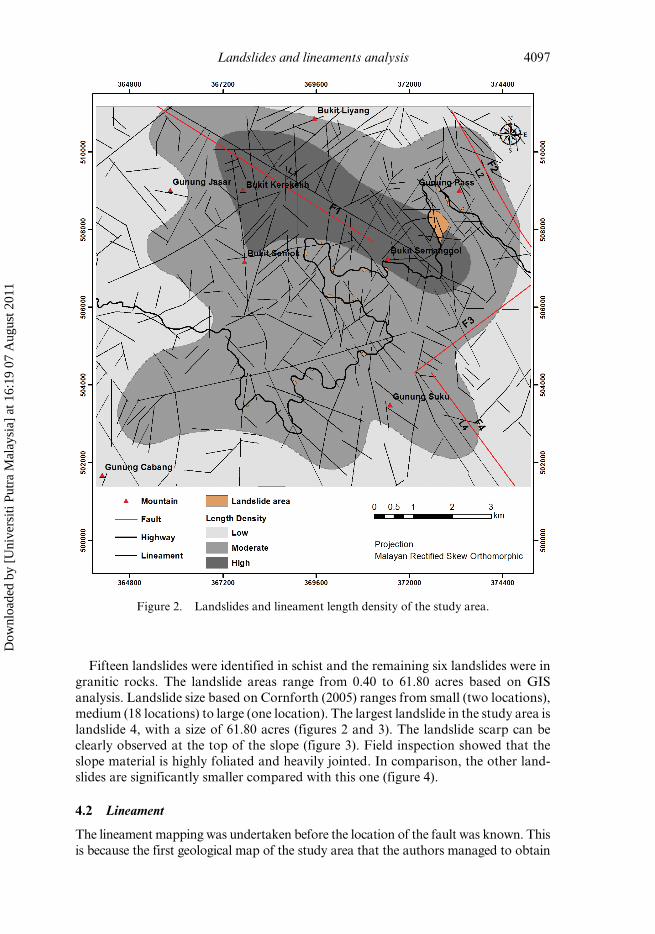
Figure 2. Landslides and lineament length density of the study area.
Landslides and lineaments analysis 4097
Dow
nloa
ded
by [
Uni
vers
iti P
utra
Mal
aysi
a] a
t 16:
19 0
7 A
ugus
t 201
1
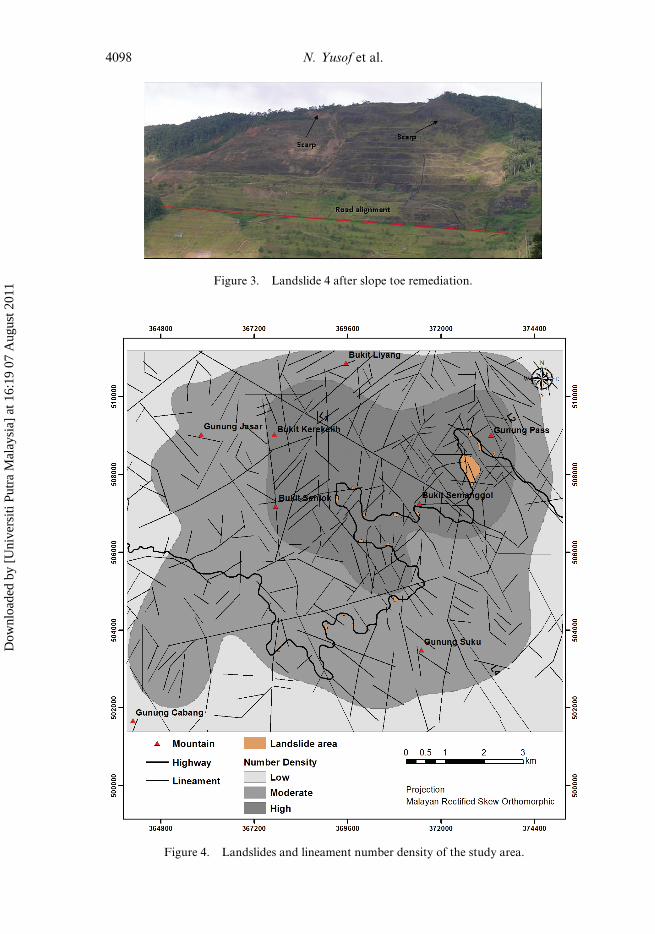
Figure 3. Landslide 4 after slope toe remediation.
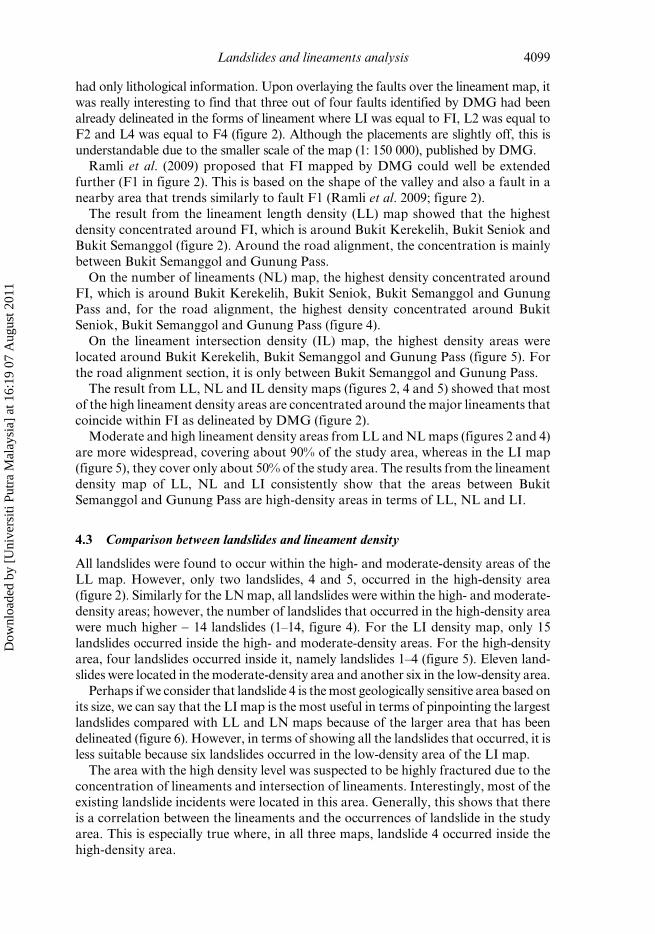
Figure 4. Landslides and lineament number density of the study area.
4098 N. Yusof et al.
Dow
nloa
ded
by [
Uni
vers
iti P
utra
Mal
aysi
a] a
t 16:
19 0
7 A
ugus
t 201
1
had only lithological information. Upon overlaying the faults over the lineament map, it
was really interesting to find that three out of four faults identified by DMG had been
already delineated in the forms of lineament where LI was equal to FI, L2 was equal to
F2 and L4 was equal to F4 (figure 2). Although the placements are slightly off, this is
understandable due to the smaller scale of the map (1: 150 000), published by DMG.Ramli et al. (2009) proposed that FI mapped by DMG could well be extended
further (F1 in figure 2). This is based on the shape of the valley and also a fault in a
nearby area that trends similarly to fault F1 (Ramli et al. 2009; figure 2).
The result from the lineament length density (LL) map showed that the highest
density concentrated around FI, which is around Bukit Kerekelih, Bukit Seniok and
Bukit Semanggol (figure 2). Around the road alignment, the concentration is mainly
between Bukit Semanggol and Gunung Pass.
On the number of lineaments (NL) map, the highest density concentrated aroundFI, which is around Bukit Kerekelih, Bukit Seniok, Bukit Semanggol and Gunung
Pass and, for the road alignment, the highest density concentrated around Bukit
Seniok, Bukit Semanggol and Gunung Pass (figure 4).
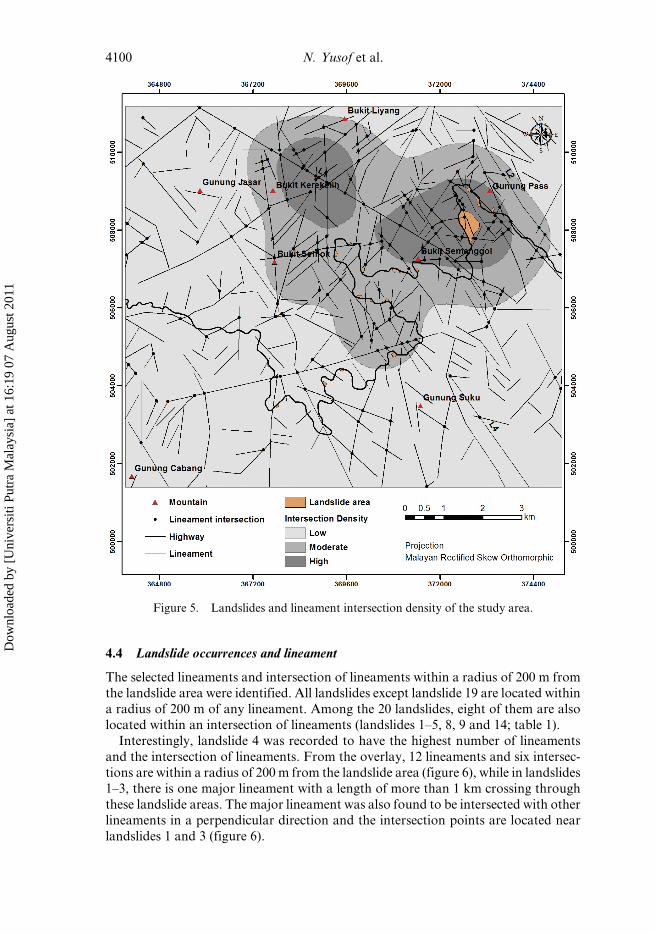
On the lineament intersection density (IL) map, the highest density areas were
located around Bukit Kerekelih, Bukit Semanggol and Gunung Pass (figure 5). For
the road alignment section, it is only between Bukit Semanggol and Gunung Pass.
The result from LL, NL and IL density maps (figures 2, 4 and 5) showed that most
of the high lineament density areas are concentrated around the major lineaments thatcoincide within FI as delineated by DMG (figure 2).
Moderate and high lineament density areas from LL and NL maps (figures 2 and 4)
are more widespread, covering about 90% of the study area, whereas in the LI map
(figure 5), they cover only about 50% of the study area. The results from the lineament
density map of LL, NL and LI consistently show that the areas between Bukit
Semanggol and Gunung Pass are high-density areas in terms of LL, NL and LI.
4.3 Comparison between landslides and lineament density
All landslides were found to occur within the high- and moderate-density areas of the
LL map. However, only two landslides, 4 and 5, occurred in the high-density area
(figure 2). Similarly for the LN map, all landslides were within the high- and moderate-
density areas; however, the number of landslides that occurred in the high-density area
were much higher - 14 landslides (1–14, figure 4). For the LI density map, only 15
landslides occurred inside the high- and moderate-density areas. For the high-density
area, four landslides occurred inside it, namely landslides 1–4 (figure 5). Eleven land-slides were located in the moderate-density area and another six in the low-density area.
Perhaps if we consider that landslide 4 is the most geologically sensitive area based on
its size, we can say that the LI map is the most useful in terms of pinpointing the largest
landslides compared with LL and LN maps because of the larger area that has been
delineated (figure 6). However, in terms of showing all the landslides that occurred, it is
less suitable because six landslides occurred in the low-density area of the LI map.
The area with the high density level was suspected to be highly fractured due to the
concentration of lineaments and intersection of lineaments. Interestingly, most of theexisting landslide incidents were located in this area. Generally, this shows that there
is a correlation between the lineaments and the occurrences of landslide in the study
area. This is especially true where, in all three maps, landslide 4 occurred inside the
high-density area.
Landslides and lineaments analysis 4099
Dow
nloa
ded
by [
Uni
vers
iti P
utra
Mal
aysi
a] a
t 16:
19 0
7 A
ugus
t 201
1
4.4 Landslide occurrences and lineament
The selected lineaments and intersection of lineaments within a radius of 200 m fromthe landslide area were identified. All landslides except landslide 19 are located within
a radius of 200 m of any lineament. Among the 20 landslides, eight of them are also
located within an intersection of lineaments (landslides 1–5, 8, 9 and 14; table 1).
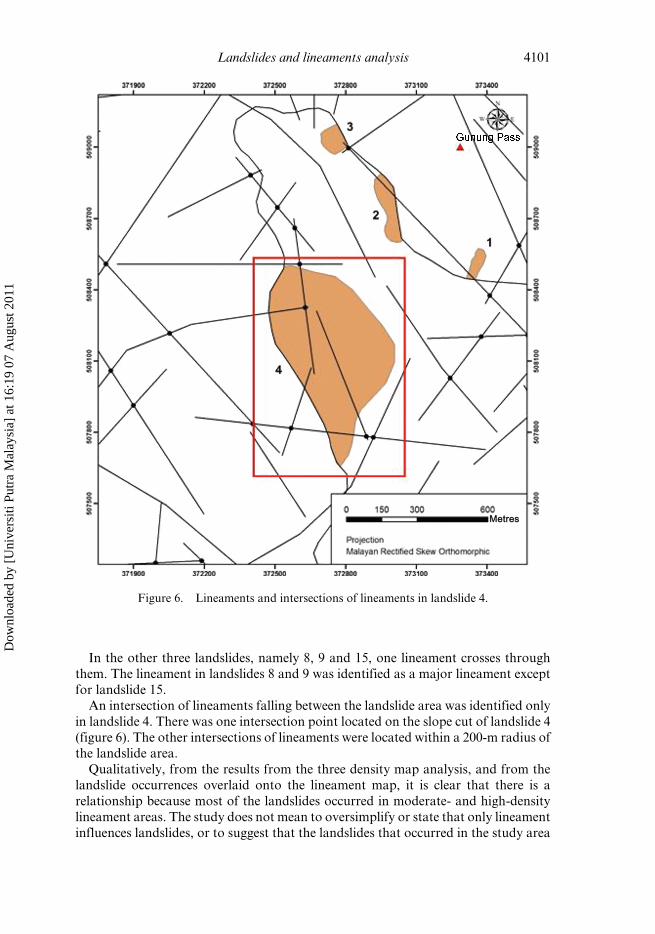
Interestingly, landslide 4 was recorded to have the highest number of lineaments
and the intersection of lineaments. From the overlay, 12 lineaments and six intersec-
tions are within a radius of 200 m from the landslide area (figure 6), while in landslides
1–3, there is one major lineament with a length of more than 1 km crossing through
these landslide areas. The major lineament was also found to be intersected with otherlineaments in a perpendicular direction and the intersection points are located near
landslides 1 and 3 (figure 6).
Figure 5. Landslides and lineament intersection density of the study area.
4100 N. Yusof et al.
Dow
nloa
ded
by [
Uni
vers
iti P
utra
Mal
aysi
a] a
t 16:
19 0
7 A
ugus
t 201
1
In the other three landslides, namely 8, 9 and 15, one lineament crosses through
them. The lineament in landslides 8 and 9 was identified as a major lineament except
for landslide 15.
An intersection of lineaments falling between the landslide area was identified only
in landslide 4. There was one intersection point located on the slope cut of landslide 4
(figure 6). The other intersections of lineaments were located within a 200-m radius ofthe landslide area.
Qualitatively, from the results from the three density map analysis, and from the
landslide occurrences overlaid onto the lineament map, it is clear that there is a
relationship because most of the landslides occurred in moderate- and high-density
lineament areas. The study does not mean to oversimplify or state that only lineament
influences landslides, or to suggest that the landslides that occurred in the study area
Figure 6. Lineaments and intersections of lineaments in landslide 4.
Landslides and lineaments analysis 4101
Dow
nloa
ded
by [
Uni
vers
iti P
utra
Mal
aysi
a] a
t 16:
19 0
7 A
ugus
t 201
1
were mainly because of the presence of lineament, which is a subject for further
research.
5. Conclusions
The extracted lineaments were found to be closely correlated with the landslide occur-
rences in the study area. Comparison between landslide occurrences and the lineament
density maps showed that most landslides occurred in high and moderate lineament
density areas. The most significant finding perhaps is that all three density maps showed
landslide 4 as the high-density area. Results for overlaying the landslides on the
lineament map also showed that landslide 4 has the highest number of intersections
of lineaments.
The results of the study suggested that lineament mapping may be used in identify-ing potential landslide areas in highway alignment selection. This can be achieved by
including the lineament mapping at the early stage of road alignment planning,
especially in high-terrain areas to prevent routing them through potentially high
landslide hazard areas.
Acknowledgements
This project is supported by the Malaysian Science Fund under grant number 04-01-
04-SF0676. The authors would also like to acknowledge the referees for their con-
structive comments.
References
AGLIARDI, F., CROSTA, G. and ZANCHI, A., 2001, Structural constraints on deep seated slope
deformation kinematics. Engineering Geology, 59, pp. 83–102.
AL-MOKREDI, M.S., GUANGDAO, H. and BASSAM, B.F.A., 2007, Using remote sensing data to
delineate the lineaments for hydrothermal mineral prediction in Heqing Area,
Northwest Yunnan Province, China. Journal of China University of Geosciences, 18,
pp. 142–147.
AMBROSI, C. and CROSTA, G.B., 2006, Large sackung along major tectonic features in the
Central Italian Alps. Engineering Geology, 83, pp. 183–200.
ANDREAS, M. and ALLAN, A., 2007, Incorporating geology and geomorphology in land manage-
ment decisions in developing countries: a case study in Southern Costa Rica.
Geomorphology, 87, pp. 68–89.
ARLEGUI, L.E. and SORIANO, M.A., 1998, Characterizing lineaments from satellite images and
field studies in the central Ebro basin (NE Spain). International Journal of Remote
Sensing, 19, pp. 3169–3185.
AYALEW, L. and YAMAGISHI, H., 2005, The application of GIS-based logistic regression for
landslide susceptibility mapping in the Kakuda–Yahiko Mountains, Central Japan.
Geomorphology, 65, pp. 15–31.
AZIMAN, M. and HUSAINI, O., 2001, Influence of discontinuity sets on slope failures at Pos Selim
Highway, Malaysia. In Proceedings of Annual Geological Conference, Perak, Malaysia,
2001, pp. 237–242.
BAILEY, T. and GATRELL, A., 1995, Interactive Spatial Data Analysis, p. 313 (Harlow:
Longman).
BALLANTYNE, C.K., 2002, Paraglacial geomorphology. Quaternary Science Reviews, 21,
pp. 1935–2017.
BANERJEE, S. and MITRA, S., 2004, Remote surface mapping using orthophotos and geologic maps
draped over digital elevation models: application to the sheep mountain Anticline,
Wyoming. American Association of Petroleum Geologists Bulletin, 88, pp. 1227–1237.
4102 N. Yusof et al.
Dow
nloa
ded
by [
Uni
vers
iti P
utra
Mal
aysi
a] a
t 16:
19 0
7 A
ugus
t 201
1
BUJANG, B.K.H., FAISAL, H.A., DAVID, H.B., HARWANT, S. and HUSAINI, O., 2008, Landslides in
Malaysia. Occurrences, Assessment, Analysis and Remediation, pp. 406–421 (Malaysia:
Penerbitan Universiti Putra Malaysia).
CARAN, S.C., WOODRUFF, C.M. and THOMPSON, E.J., 1981, Lineament analysis and inference of
geologic structure – examples from the Balcones/Ouachita trend of Texas. Transactions
of the Gulf Coast Association of Geological Societies, XXXI, pp. 59–69.
CLAESSENS, L., KNAPEN, A., KITUTU, M.G., POESEN, J. and DECKERS, J.A., 2007, Modelling
landslide hazard, soil redistribution and sediment yield of landslides on the Ugandan
footslopes of Mount Elgon. Geomorphology, 90, pp. 23–35.
CLARK, C.D. and WILSON, C., 1994, Spatial analysis of lineaments. Computers and Geosciences.
20, pp. 1237–1258.
CORNFORTH, D.H., 2005, Landslides in Practice (New York: John Wiley & Sons).
CROSTA, G.B. and ZANCHI, A., 2000, Deep-seated slope deformations. Huge, extraordinary,
enigmatic phenomena. In Landslides in Research, Theory and Practice. Proceeding 8th
International Symposium on Landslides, Cardiff, June 2000, E. Bromhead, N. Dixon
and M. Ibsen (Eds.), pp. 351–358 (London: Thomas Telford).
CRUDEN, D.M. and HU, X.Q., 1993, Exhaustion and steady-state models for predicting land-
slide hazards in the Canadian Rocky Mountains. Geomorphology, 8, pp. 279–285.
DAVIS, G.H., 1984, Structural Geology of Rocks and Regions (New York: John Wiley & Sons).
DUMAN, T. Y., CAN, T., EMRE, O., KECER, M., DOGAN, A., ATES, S. and DURMAZ, S., 2005, Landslide
inventory of northwestern Anatolia, Turkey. Engineering Geology, 77, pp. 99–114.
DUNNING, S.A., MASSEY, C.I. and ROSSER, N.J., 2009, Structural and geomorphological fea-
tures of landslides in the Bhutan Himalaya derived from Terrestrial Laser Scanning.
Geomorphology, 103, pp. 17–29.
EMRE, O., OZALP, S., DOGAN, A., OZAKSOY, V., YILDIRIM, C. and GOKTAS, F., 2005. _Izmir ve
yakin cevresinin diri fayları ve deprem potansiyelleri (in Turkish). Maden Tetkik ve
Arama Genel Mudurlugu (MTA), Jeoloji Etutleri Dairesi, Report no. 10754, Ankara.
FINELY, R.J. and GUSTAVSON, T.C., 1981, Lineament analysis based on Landsat imagery, Texas
Panhandle. Bureau of Economic Geology, Geological Circular 81-5, p. 37.
FLORINSKY, I.V., 1996. Quantitative topographic method of fault morphology recognition.
Geomorphology, 16, pp. 103–119.
FLORINSKY, I.V., 2000, Relationships between topographically expressed zones of flow accu-
mulation and sites of fault intersection: analysis by means of digital terrain modelling.
Environmental Modelling and Software, 15, pp. 87–100.
GARMIN, 2002, Garmin GPS 72 Specification Manual. Available online at: www.garmin.com/
products/gps72/ (accessed 13 February 2008).
GREENBAUM, D., 1985, Review of remote sensing applications to groundwater exploration in
basement and regolith. British Geological Survey Report, p. 36.
HOBBS, W.H., 1904, Lineaments of the Atlantic border region. Geological Society of America
Bulletin,15, pp. 483–506.
HUI, W.T., GARIB, Z. and RAMANATHAN, N., 1990, Study on the stability of slopes along
Seremban–Ayer Keroh Expressway. In Proceedings of the Seminar On Geotechnical
Aspects of the North-South Expressway, Kuala Lumpur, 1990, pp. 275–281.
HUNG, L.Q. and BATELAAN, O., 2003, Environment geological remote sensing and GIS analysis
of tropical karst areas in Vietnam. In Proceedings of the Geoscience and Remote Sensing
Symposium, 21–25 July 2003, Toulouse. Available online at: http://ieeexplore.ieee.org/
iel5/9010/28604/01294647.pdf?tp¼&arnumber¼1294647&isnumber¼28604 (accessed
20 January 2008).
HUSAINI, O., DAUD, M., ZOHADAIE, M.B., MAAIL S., AZIZI, A.A. and MUNIANDY, R., 2005,
Failure of cut slopes during construction of highways in mountainous area. Pertanika
Journal of Science and Technology, 13, pp. 73–83.
HUSSEIN, A.N. and ALIMAT, U., 2003, Geotechnical problems ecountered along the Simpang
Pulai to Kampung Raja route, Cameron Highlands. In Proceedings of 12th Asian
Landslides and lineaments analysis 4103
Dow
nloa
ded
by [
Uni
vers
iti P
utra
Mal
aysi
a] a
t 16:
19 0
7 A
ugus
t 201
1
Geotechnical Conference on Soil Mechanics and Geotechnical Engineering (Singapore:
World Scientific), pp. 715–718.
HUTCHISON, C.S., GOBBETT, D.J. and TJIA, H.D., 1973, Geology of the Malay Peninsular (New
York: John Wiley & Sons).
JORDANA, G. and SCHOTT, B., 2005, Application of wavelet analysis to the study of spatial
pattern of morphotectonic lineaments in digital terrain models. A case study. Remote
Sensing of Environment, 94, pp. 31–38.
JUHARI, M.A. and IBRAHIM, A., 1997, Geological Applications of LANDSAT Thematic Mapper
Imagery: Mapping and Analysis of Lineaments in NW Peninsular Malaysia.
ACRS.Available online at: http://www.gisdevelopment.net/aars/acrs/1997/ts10/
ts10001.asp (accessed 20 January 2008).
KARAKHANYAN, A.S., 1981, Recognition of amply-dimensional landslides and rock blocks torn
and slipped down by gravity with the use of remotely sensed data. Izvestiya Vysshikh
Uchebnykh Zavedeny. Geologiya i Razvedka, 3, pp. 130–131 (in Russian).
KELLER, E.A. and PINTER, N., 1996, Active Tectonics: Earthquakes, Uplift and Landforms
(Englewood Cliffs, NJ: Prentice Hall).
KEUNZA K., DORJI Y. and WANGDA D. 2004, Landslides in Bhutan. Country Report.
Department of Geology and Mines, Royal Government of Bhutan, Thimpu.
KHEIRALLA, K.M, RICHARD, G. and MAHMOOD, S.A., 2006, Multisource geophysical data and
DEM for lineaments analysis of the Muglad Rift Basin Sudan. In Proceedings of 2nd
International Conference on Emerging Technologies, Peshawar, Pakistan, 13–14
November 2006.
KOCH, M. and MATHER, P.M., 1997, Lineament mapping for groundwater resource assessment:
a comparison of digital Synthetic Aperture Radar (SAR) imagery and stereoscopic
Large Format Camera (LFC) photographs in the Red Sea Hills, Sudan. International
Journal of Remote Sensing, 20, pp. 4471–4493.
KOIKE, K., NAGANO, S. and OHMI, M., 1995, Lineament analysis of satellite images using a
segment tracing algorithm (STA). Computers and Geosciences, 21, pp. 1091–1104.
MASOUD, A. and KOIKE K., 2006, Tectonic architecture through Landsat-7 ETMþ/
SRTMDEM-derived lineaments and relationship to the hydrogeologic setting in Siwa
region, NW Egypt. Journal of African Earth Sciences, 45, pp. 467–477.
MORELLI, M. and PIANA, F., 2006, Comparison between remote sensed lineaments and geolo-
gical structures in intensively cultivated hills (Moanferrato and Langhe domains, NW
Italy). International Journal of Remote Sensing. 26, pp. 1463–1475.
NAGARAJAN, R. and KHIRE, M.V., 1998, Debris slides of Varandh Ghat, west coast of India.
Bulletin of Engineering Geology and the Environment, 57, pp. 59–63.
NAGARAJAN, R., MUKHERJEE, A., ROY, A. and KHIRE, M.V., 1998, Temporal remote sensing
data and GIS application in landslide hazard zonation of part of Western Ghat, India.
International Journal of Remote Sensing, 19, pp. 573–585.
NAGARAJAN, R., ROY, A., KUMAR, R.V., MUKHERJEE, A. and KHIRE, M.V., 2000, Landslide
hazard susceptibility mapping based on terrain and climatic factors for tropical mon-
soon regions. Bulletin of Engineering Geology and Environment, 58, pp. 275–287.
NORBU, C., BAILLIE, I., DEMA, K., JAMYANG, Y., DEMA, Y., TSHERING, K., TAMANG, H. and
TURKELBOOM, F., 2003, Types of land degradation in Bhutan. Journal of Bhutan Studies,
8, pp. 88–114.
NOVAK, I.D. and SOULAKELLIS, N., 2000, Identifying geomorphic features using LANDSAT-5/
TM data processing techniques on Lesvos, Greece. Geomorphology, 34, pp. 101–109.
O’LEARY, D.W., FRIEDMAN, J.D. and POHN, H.A., 1976, Lineament, linear lineation some
proposed new standards for old terms. Geological Society America Bulletin, 87,
pp. 1463–1469.
PACK, R.T., TARBOTON, D.G. and GOODWIN, C.N., 1998, Terrain Stability Mapping with
SINMAP Technical Description and User’s Guide for Version 1.00, Report 4114-0
(Salmon Arm, BC: Terratech Consultants).
4104 N. Yusof et al.
Dow
nloa
ded
by [
Uni
vers
iti P
utra
Mal
aysi
a] a
t 16:
19 0
7 A
ugus
t 201
1
PAULSEN, T. and WILSON T.J., 2004, Subglacial bedrock structure in the Transantarctic
Mountains and its influence on ice sheet flow: insights from RADARSAT SAR
imagery. Global and Planetary Change, 42, pp. 227–240.
PRADHAN, B., SINGH, R.P. and BUCHROITHNER, M.F., 2006, Estimation of stress and its use in
evaluation of landslide prone regions using remote sensing data. Advances in Space
Research, 37, pp. 698–709.
PROST, G.L., 1994, Remote Sensing for Geologists: A Guide to Image Interpretation (Reading:
Gordon and Breach Science).
RAJU, N.J. and REDDY, T.V.K., 1997, Fracture pattern and electrical resistivity studies for
groundwater exploration. Environmental Geology, 34, pp. 175–182.
RAMLI, M.F., TRIPATHI, N.K., YUSOF, N., SHAFRI, H.Z.M. and ALI RAHMAN, Z., 2009,
Lineament mapping in tropical environment utilising Landsat imagery. International
Journal of Remote Sensing, 23, pp. 6277–6300.
ROWAN, L.C. and BOWERS, T.L., 1995, Analysis of linear features mapped in Landsat Thematic
Mapper and side-looking airborne radar images of the Reno 1� by 2� quadrangle,
Nevada and California: implication for mineral resource studies. Photogrammetric
Engineering and Remote Sensing, 61, pp. 749–759.
SARKAR, S. and KANUNGO, D.P., 2004, An integrated approach for landslide susceptibility
mapping using remote sensing and GIS. Photogrammetric Engineering and Remote
Sensing, 70, pp. 617–625.
SARP, G., 2005, Lineament analysis from satellite images, northeast of Ankara. MSc thesis,
Middle East Technical University, Turkey.
SCHWARZ, H.-U. and KILFITT, F.-W., 2008, Confluence and intersection of interacting conjugate
faults: a new concept based on analogue experiments. Journal of Structural Geology, 30,
pp. 1126–1137.
SILVERMAN, B.W., 1986, Density Estimation for Statistics and Data Analysis (New York:
Chapman and Hall).
SOLOMON, S. and GHEBREAB, W., 2006, Lineament characterization and their tectonic signifi-
cance using Landsat TM data and field studies in the central highlands of Eritrea.
Journal of African Earth Sciences, 4, pp. 371–378.
THE STAR, 2006, The Star Online: Mudslide Survivor Hopes to Shake Off Phobia Soon. Available
online at : http://thestar.com.my/news/story.asp?file=/2006/4/13/nation/13947540&sec
=nation (accessed 20 January 2008).
TRIPPA, G.I. and VEARNCOMBE, J.R., 2004, Fault/fracture density and mineralization: a con-
touring method for targeting in gold exploration. Journal of Structural Geology, 26,
pp. 1087–1108.
WALKER, D.F., BLONG, R.J. and MACGREGOR, J.P., 1987, Landslide Classification,
Geomorphology, and Site Investigations. Soil Slope Instability and Stabilisation, D.F.
Walker and R. Fell (Eds.), pp. 1–51 (Rotterderm: Balkema).
YILMAZ, I. and YILDIRIM, M., 2006, Structural and geomorphological aspects for the Kat
Landslides (Tokat-Turkey) and susceptibility mapping by means of GIS.
Environmental Geology, 50, pp. 461–472.
ZHANG, D. and WANG, G., 2007, Study of the 1920 Haiyuan earthquake-induced landslides in
loess (China). Engineering Geology, 94, pp. 76–88.
Landslides and lineaments analysis 4105
Dow
nloa
ded
by [
Uni
vers
iti P
utra
Mal
aysi
a] a
t 16:
19 0
7 A
ugus
t 201
1