Land use change in the Amazon estuary: Patterns of caboclo settlement and landscape management
30
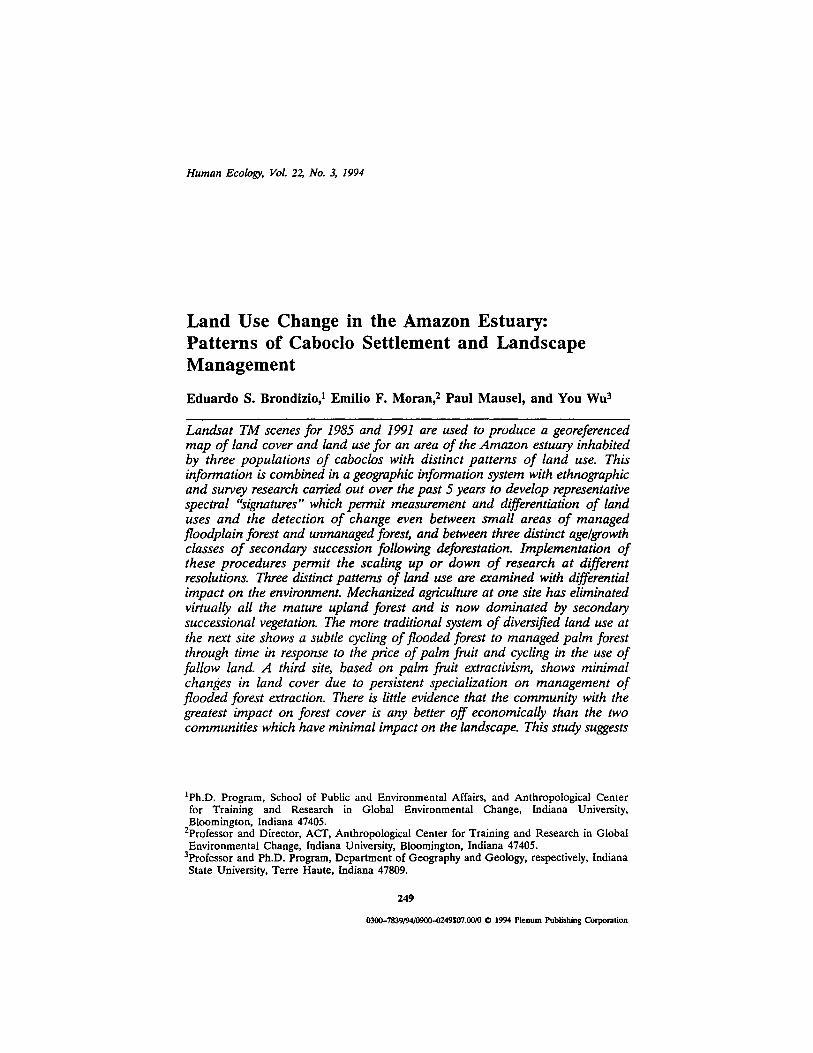
Human Ecology, Vol. 22, No. 3, 1994 Land Use Change in the Amazon Estuary: Patterns of Caboclo Settlement and Landscape Management Eduardo S. Brondizio, 1 Emilio F. Moran, 2 Paul Mausel, and You Wu 3 Landsat TM scenes for 1985 and 1991 are used to produce a georeferenced map of land cover and land use for an area of the Amazon estuary inhabited by three populations of caboclos with distinct patterns of land use. This information is combined in a geographic information system with ethnographic and survey research carried out over the past 5 years to develop representative spectral "signatures" which permit measurement and differentiation of land uses and the detection of change even between small areas of managed floodplain forest and unmanaged forest, and between three distinct age~growth classes of secondary succession following deforestation. Implementation of these procedures permit the scaling up or down of research at different resolutions. Three distinct patterns of land use are examined with differential impact on the environment. Mechanized agriculture at one site has eliminated virtually all the mature upland forest and is now dominated by secondary successional vegetation. The more traditional system of diversified land use at the next site shows a subtle cycling of flooded forest to managed palm forest through time in response to the price of palm fruit and cycling in the use of fallow land. A third site, based on palm fruit extractivism, shows minimal changes in land cover due to persistent specialization on management of flooded forest extraction. There is little evidence that the community with the greatest impact on forest cover is any better off economically than the two communities which have minimal impact on the landscape. This study suggests IPh.D. Program, School of Public and Environmental Affairs, and Anthropological Center for Training and Research in Global Environmental Change, Indiana University, Bloomington, Indiana 47405. 2Professor and Director, ACT, Anthropological Center for Training and Research in Global Environmental Change, Indiana University, Bloomington, Indiana 47405. 3Professor and Ph.D. Program, Department of Geography and Geology, respectively, Indiana State University, Terre Haute, Indiana 47809. 249 030o-7839/94/09~o..o249507.00/0 0 1994 Plenum Publishing Corporation
Transcript of Land use change in the Amazon estuary: Patterns of caboclo settlement and landscape management
Human Ecology, Vol. 22, No. 3, 1994
Land Use Change in the Amazon Estuary: Patterns of Caboclo Settlement and Landscape Management
Eduardo S. Brondizio , 1 Emil io F. Moran, 2 Paul Mausel , and You Wu 3
Landsat TM scenes for 1985 and 1991 are used to produce a georeferenced map of land cover and land use for an area of the Amazon estuary inhabited by three populations of caboclos with distinct patterns o f land use. This information is combined in a geographic information system with ethnographic and survey research carried out over the past 5 years to develop representative spectral "signatures" which permit measurement and differentiation o f land uses and the detection o f change even between small areas o f managed floodplain forest and unmanaged forest, and between three distinct age~growth classes o f secondary succession following deforestation. Implementation o f these procedures permit the scaling up or down o f research at different resolutions. Three distinct patterns o f land use are examined with differential impact on the environment. Mechanized agriculture at one site has eliminated virtually all the mature upland forest and is now dominated by secondary successional vegetation. The more traditional system of diversified land use at the next site shows a subtle cycling of flooded forest to managed palm forest through time in response to the price of palm fruit and cycling in the use of fallow land. A third site, based on palm fruit extractivism, shows minimal changes in land cover due to persistent specialization on management o f flooded forest extraction. There is little evidence that the community with the greatest impact on forest cover is any better off economically than the two communities which have minimal impact on the landscape. This study suggests
IPh.D. Program, School of Public and Environmental Affairs, and Anthropological Center for Training and Research in Global Environmental Change, Indiana University, Bloomington, Indiana 47405.
2Professor and Director, ACT, Anthropological Center for Training and Research in Global Environmental Change, Indiana University, Bloomington, Indiana 47405.
3Professor and Ph.D. Program, Department of Geography and Geology, respectively, Indiana State University, Terre Haute, Indiana 47809.
249
030o-7839/94/09~o..o249507.00/0 0 1994 Plenum Publishing Corporation

250 Brondizio, Moran, Mausel, and Wu
how a balance between use and conservation in Amazonia may be achieved in floodplain and estuarine areas, and the effectiveness o f monitoring these types of land cover from satellite platforms.
KEY WORDS: land use; land cover; Amazon; estuary; flooded forest; afai; palms; agriculture; pastures; swidden; slash-and-burn agriculture; succession; remote sensing; GIS.
INTRODUCTION
The importance and potential of orbital remote sensing for interdiso ciplinary research have been increasingly recognized and discussed not only by earth scientists but also by social and biological scientists (Reining, 1979; Conant, 1990; Moran, 1990; NASA, 1990). One can highlight at least three advantages offered by remotely sensed data to the field of human ecology. First, it facilitates quantitative comparison of the impact of processes such as land use intensification and population growth. Second, it links more effectively temporal and spatial variation that result from land use changes in an environmental, socioeconomic, and cultural context. It offers, as well, analysis at a scale that bridges local adaptive strategies with ecological and economic variation at regional level. This process of cross-fertilization be- tween remote sensing and human ecology has increased further with ad- vances in geographic information systems (GIS). While numerous works have encouraged interaction between human ecology and landscape ecol- ogy through the use of remote sensing and GIS (e.g., Naveh and Lieber- man, 1984; Vink, 1980; Behrens, 1990), the integration of socioeconomic and cultural data in a GIS structure has been rare (Morren, 1990).
This paper uses remotely sensed data as a component of a large-scale human ecological study through a study of land use change among three populations of the lower/,anazon estuary, at Maraj6 Island, Brazil. The methodology presented here combines spectral information and image clas- sification with environmental and ethnographic data.
Unlike land use change in the upland interfluves affected by govern- ment-sponsored development projects (cf. Moran, 1981, 1993) where de- forestation has been as high as 49% of the total land cover, land use change in the estuary bears fewer visible scars. The estuary region in this study is located at Maraj6 island, a delta island at the mouth of the Amazon, which is a region with a wide variety of vegetation types and land use strategies that include cattle ranching, mechanized agriculture, palm fruit/wood/oil ex- tractivism, and swidden cultivation. It is an area with a large population of Amazonian caboclos (similar in characteristics to Peruvian ribere~os) which combines indigenous knowledge of land use with adaptations to the economic and cultural system imposed first by European colonists and then
Land Use in the Amazon 251
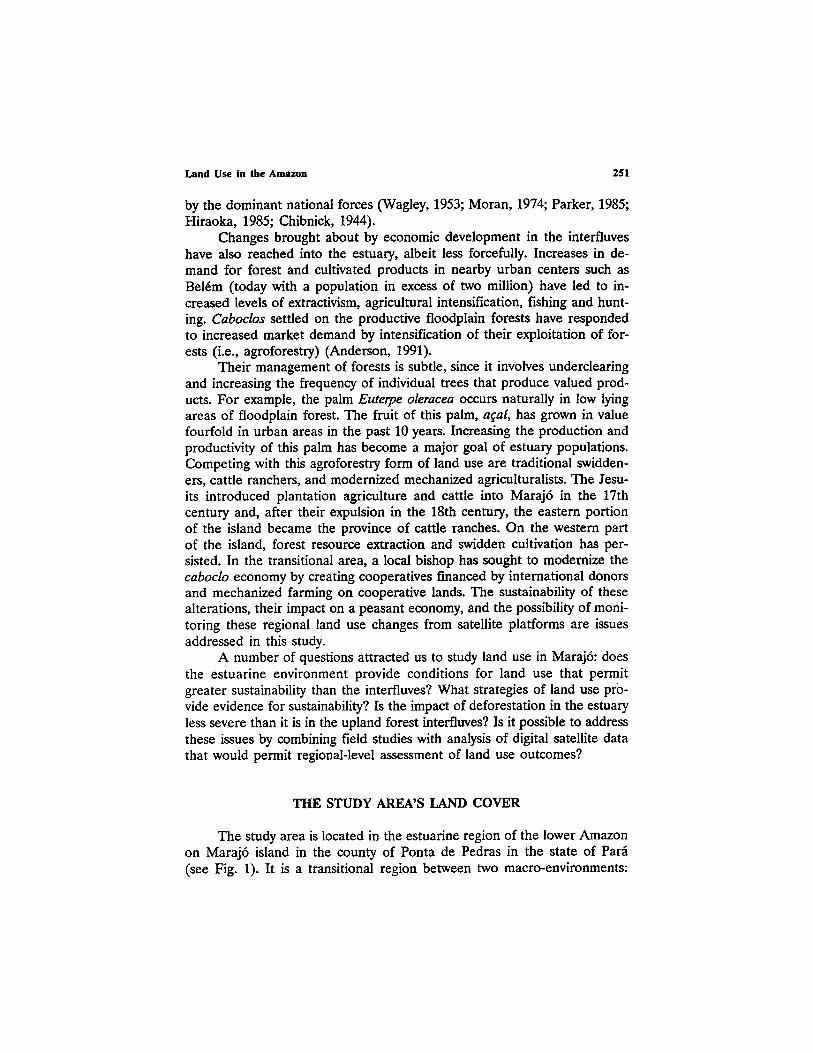
by the dominant national forces (Wagley, 1953; Moran, 1974; Parker, 1985; Hiraoka, 1985; Chibnick, 1944).
Changes brought about by economic development in the interfluves have also reached into the estuary, albeit less forcefully. Increases in de- mand for forest and cultivated products in nearby urban centers such as Bel6m (today with a population in excess of two million) have led to in- creased levels of extractivism, agricultural intensification, fishing and hunt- ing. Caboclos settled on the productive floodplain forests have responded to increased market demand by intensification of their exploitation of for- ests (i.e., agroforestry) (Anderson, 1991).
Their management of forests is subtle, since it involves underclearing and increasing the frequency of individual trees that produce valued prod- ucts. For example, the palm Euterpe oleracea occurs naturally in low lying areas of floodplain forest. The fruit of this palm, afar, has grown in value fourfold in urban areas in the past 10 years. Increasing the production and productivity of this palm has become a major goal of estuary populations. Competing with this agroforestry form of land use are traditional swidden- ers, cattle ranchers, and modernized mechanized agriculturalists. The Jesu- its introduced plantation agriculture and cattle into Maraj6 in the 17th century and, after their expulsion in the 18th century, the eastern portion of the island became the province of cattle ranches. On the western part of the island, forest resource extraction and swidden cultivation has per- sisted. In the transitional area, a local bishop has sought to modernize the caboclo economy by creating cooperatives financed by international donors and mechanized farming on cooperative lands. The sustainability of these alterations, their impact on a peasant economy, and the possibility of moni- toring these regional land use changes from satellite platforms are issues addressed in this study.
A number of questions attracted us to study land use in Maraj6: does the estuarine environment provide conditions for land use that permit greater sustainability than the interfluves? What strategies of land use pro- vide evidence for sustainability? Is the impact of deforestation in the estuary less severe than it is in the upland forest interfluves? Is it possible to address these issues by combining field studies with analysis of digital satellite data that would permit regional-level assessment of land use outcomes?
THE STUDY AREA'S LAND COVER
The study area is located in the estuarine region of the lower Amazon on Maraj6 island in the county of Ponta de Pedras in the state of Par~i (see Fig. 1). It is a transitional region between two macro-environments:

Fig.
1.
Pont
a de
Ped
ras,
Mar
ajo
Isla
nd,
PA,
Bra
zil.
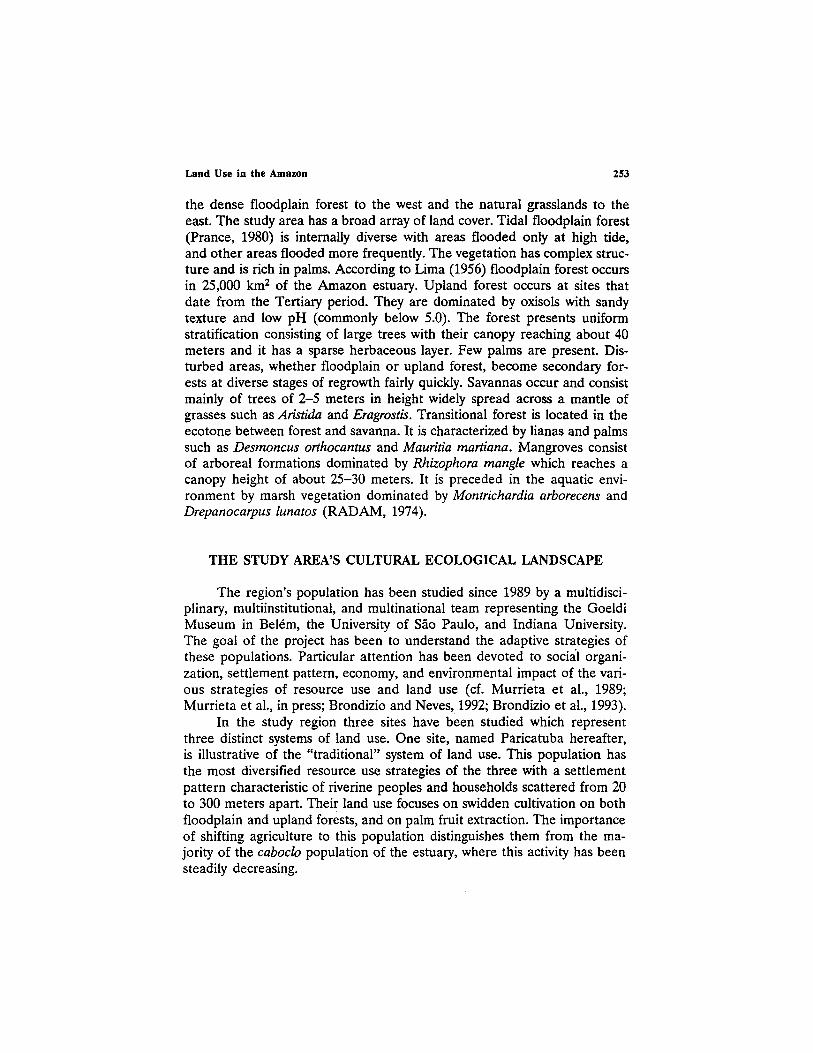
Land Use in the Amazon 253
the dense floodplain forest to the west and the natural grasslands to the east. The study area has a broad array of land cover. Tidal floodplain forest (Prance, 1980) is internally diverse with areas flooded only at high tide, and other areas flooded more frequently. The vegetation has complex struc- ture and is rich in palms. According to Lima (1956) floodplain forest occurs in 25,000 km 2 of the Amazon estuary. Upland forest occurs at sites that date from the Tertiary period. They are dominated by oxisols with sandy texture and low pI--I (commonly below 5.0). The forest presents uniform stratification consisting of large trees with their canopy reaching about 40 meters and it has a sparse herbaceous layer. Few palms are present. Dis- turbed areas, whether floodplain or upland forest, become secondary for- ests at diverse stages of regrowth fairly quickly. Savannas occur and consist mainly of trees of 2-5 meters in height widely spread across a mantle of grasses such as Aristida and Eragrostis. Transitional forest is located in the ecotone between forest and savanna. It is characterized by lianas and palms such as Desmoncus orthocantus and Mauritia martiana. Mangroves consist of arboreal formations dominated by Rhizophora mangle which reaches a canopy height of about 25-30 meters. It is preceded in the aquatic envi- ronment by marsh vegetation dominated by Montrichardia arborecens and Drepanoc arpus lunatos (RADAM, 1974).
THE STUDY AREA'S CULTURAL ECOLOGICAL LANDSCAPE
The region's population has been studied since 1989 by a multidisci- plinary, multiinstitutional, and multinational team representing the Goeldi Museum in Bel6m, the University of S~o Paulo, and Indiana University. The goal of the project has been to understand the adaptive strategies of these populations. Particular attention has been devoted to sociffl organi- zation, settlement pattern, economy, and environmental impact of the vari- ous strategies of resource use and land use (cf. Murrieta et al., 1989; Murrieta et al., in press; Brondizio and Neves,. 1992; Brondizio et al., 1993).
In the study region three sites have been studied which represent three distinct systems of land use. One site, named Paricatuba hereafter, is illustrative of the "traditional" system of land use. This population has the most diversified resource use strategies of the three with a settlement pattern characteristic of riverine peoples and households scattered from 20 to 300 meters apart. Their land use focuses on swidden cultivation on both floodplain and upland forests, and on palm fruit extraction. The importance of shifting agriculture to this population distinguishes them from the ma- jority of the caboclo population of the estuary, where this activity has been steadily decreasing.

254 Brondizio, Moran, Mausel, and Wu
The second site, named Maraj6-a~ti hereafter, has a similar riverine settlement pattern but households are more widely spaced (from 50 to 500 meters apart). The economy centers on the extraction of a~af palm fruit and its sale. Slash and bum cultivation has been steadily abandoned as a result of the intensification in the extraction of a~ai. Shrimp and fish rep- resent important sources of protein .and are also sold for cash.
The third site, hereafter named Praia Grande, represents the most trans- formed economy in the study area. Currently, most of this population is settled in an upland area, dispersed linearly along a road rather than a river. With assistance from the local Catholic bishop the population has since the 1960s organized an agricultural cooperative based on mechanized agriculture pro- ducing corn, beans, rice, and coconuts. Mechanized preparation of land for pasture and cattle was also undertaken. A modest amount of extractMsm con- tinues, supplemented by fishing, shrimping, and other activities.
Figure 2 illustrates the relative role of different economic activities on the land cover of the areas affected by each of the populations inhab- iting the three sites. All three areas have at least 90% of households en- gaged in the extraction of af.af palm fruit, an important resource of the Amazon estuary and flood-prone areas in the interfluves. Two out of the three areas are involved in swidden cultivation (i.e., Paricatuba and Ma-
100'
gO"
-- ~ 80"
~ ~ ' ~,.
_z 60"
~ 5~" 0
4 0 .
~ 3 0 -
~ 2( I -
~.~
~0 -
0 - SLASH & BURN ACA' PALM FOREST CATTLE ~IECHANIZE~ AGRICULTURE
A ~ P , ~ , ' ~ c a m ~ o ~ Y ~ . I ~ P ~ ~ ~ ~ ~ ~ / I J
Fig. 2. Subsistence activity affecting land cover, caboclo populations--Marajo Island, 1990.
Land Use in the Amazon 255
raj6-a~tl). Over 50% of households in the "traditional" site (Paricatuba) are engaged in it, while only 20% of those at Maraj6-A~6 still cultivate in this manner. Mechanized agriculture and cattle ranching are restricted to one of the three areas, Praia Grande, driven by subsidies provided by the Church and a Church-based cooperative that has virtually eliminated the practice of swidden cultivation, and all but 28 hectares of upland forest.
METHODS USED
In addition to ethnographic studies and household level surveys carded out since 1989, two Thematic Mapper (TM) Landsat scenes (path 224, row 61) for July 21, 1985 and for July 22, 1991 were used in this analysis. The two scenes were cloud-free and recorded land cover for both dates. The scenes were registered one to another (i.e., overlayed one on the other pixel- to-pixel) resulting in a single multi-temporal image with 12 channels, the first six representing the six bands of the 1985 TM scene and the other six those for 1991 (the thermal band was omitted from both dates for this analysis). 4 This multitemporal image allowed us to select training samples from known areas for both dates. The two scenes are within a few days of each other, thus with minor differences in sun angle. However, in order to minimize at- mospheric effects between dates, the 1991 image was adjusted to 1985 spec- tral values using distant and intact forest in both years as controls for differences in spectral values between years. These forest areas are the most consistent features in both scenes, with overall spectral values relatively con- stant. The images were spatially registered and geocorrected (i.e., georefer- enced) to a UTM grid using available base maps of 1:100,000 (FIBGE, 1984). This made it possible to register ground-truth data precisely on the image, collected with a Magellan 1000 Pro Global Positioning System (GPS) re- ceiver, in areas where vegetation sampling and household visits were made.
Initial methods focused on the identification of discernible land cover classes, the development of representative statistics associated with a par- ticular class of land cover. This classification procedure began with high dimensional clustering (i.e., unsupervised classification) of small areas of less than 15,000 pixels to cluster as many as 60 classes of land cover. During studies, representative clusters were saved for use as training statistics 0f that class in a supervised classification. The spectral statistics of each class were also evaluated for their congruence with known characteristics of the
4Separability analys.es indicated that the thermal band did not provide significant additional information to the questions being addressed. In addition, the 120-meter resolution of the thermal band is too poor to discriminate between features of interest. The thermal band was saved as a separate file for future use on other questions.

256 Brondizio, Moran, Mausel, and Wu
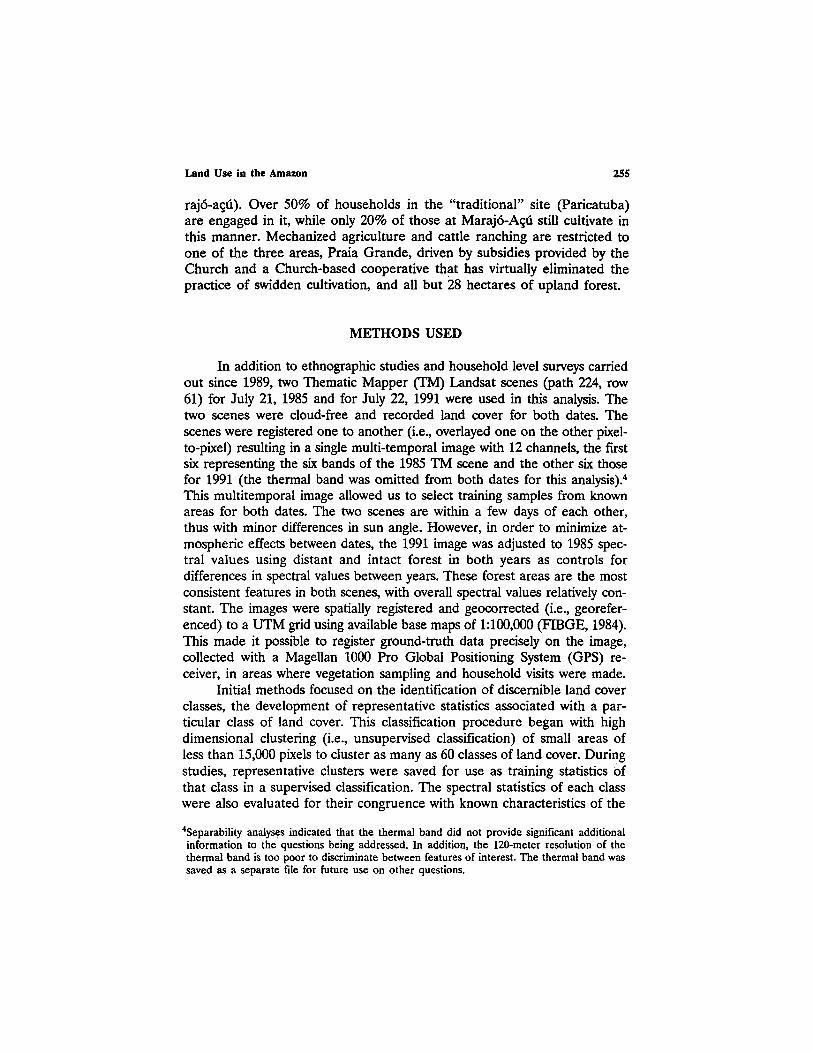
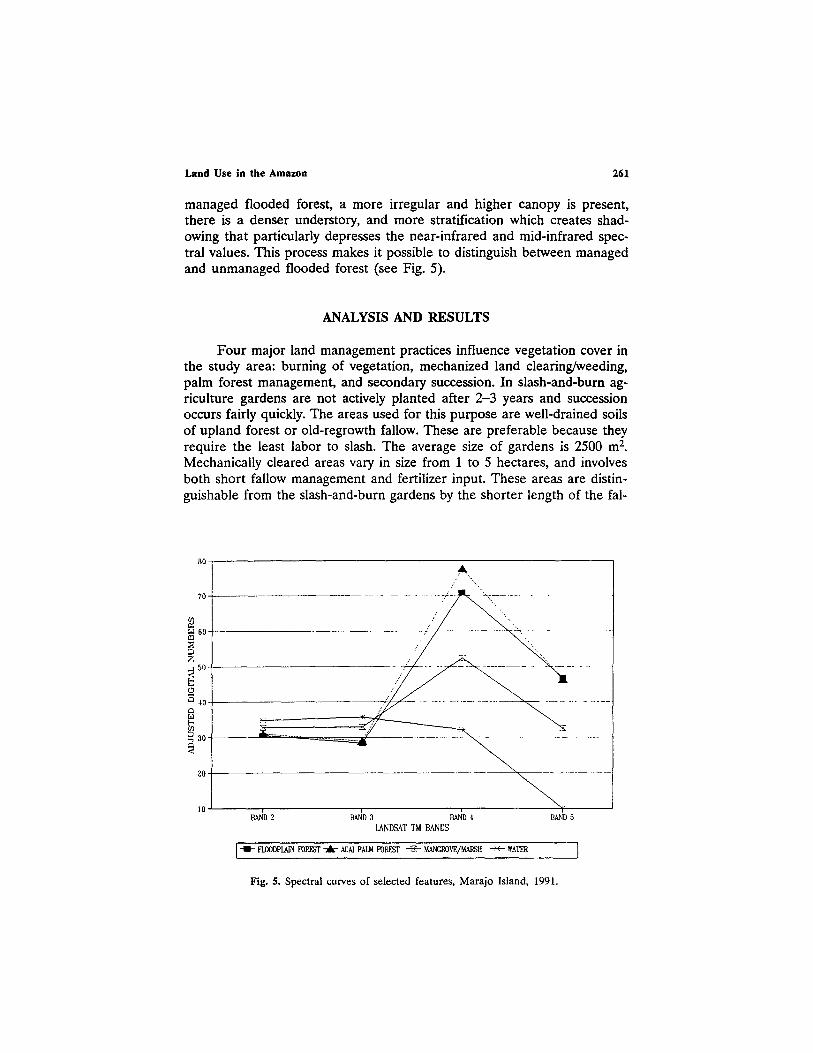
study sites. This led to the development of a conceptual spectral model that defined the land cover classes and that considered the reflection and absorption characteristics of the physical components that made up each class. For example, floodplain forest as a class will have low reflectance in bands 2 and 3 due to high chlorophyll absorption. High biomass and high water content leads to lower values in band 5 and the shadowing present explains lower values in the near infrared band 4 when compared to afai palm forest (see Fig. 5 later in this paper). This kind of procedure and examination was carried out for each "signature" or spectral pattern.
To complement the ethnographic research and the image analysis, in- tensive botanical and environmental work was carried out in June and July 1992, as well as in the same period in 1993. Representative samples of land cover classes identified in the unsupervised classification results were taken during fieldwork, and some additional classes were added and sampled as a result of field studies. All vegetation classes present in the classification scheme of 1992 were sampled in order to determine composition, frequency, density and dominance, basal area, percent of ground covered, stem height, and total height. This data collection was further expanded and refined in fieldwork in 1993-using the supervised classification produced as a result of the 1992 field study. In parallel, ethnographic data were collected about the history of land use, length of fallow periods, and management techniques.
The capability of geographic information systems was relied on heav- ily to integrate raster information (e.g., the thematic classification) with point data (e.g., the GPS coordinates) and attribute data (e.g., time of abandonment, soil characteristics). The general steps taken for GIS related work were as follows: First, a georeferenced base map was created using ARC/INFO GIS which included the GPS Ground Control Points (GCPs) collected in the field. Magellan post-processing software was used to con- vert the GPS data directly into ARC/INFO format. The next step was to indicate map coordinates. The ground control points were categorized into three groups: household site data, vegetation samples, and other ground truth observations. GIS data layers were created for each group.
Second, the information associated with each GCP in the base map was entered into a relational database structure (in this case dBase IV). The critical factor at this step was to ensure that data records in the rela- tional database were keyed to their respective GCPs in the GIS. The side- by-side visualization of attribute data and map display make it possible to associate ground information with land use classes and to check their clas- sification accuracy.
Third, the layer of GCPs was converted to ERDAS (i.e., raster) for- mat to be integrated on a six channel TM Landsat image. The image can then be displayed showing the location and distribution of the collected

Land Use in the Amazon 257
GCPs. This proved useful in the process of training sample selection for developing a supervised classification. Since the image is geocorrected to UTM coordinates, this makes the collection of GCPs, also collected as UTM coordinates, invaluable to the precise location of training samples, such as shifting cultivation areas, which would otherwise by inaccurately located. However, the results will be identical whether one uses the overlay procedure (described above), or the CURSES 5 program in ERDAS to lo- cate the GCPs directly on the image itself.
Classification procedures were based on a hybrid approach that com- bined unsupervised and supervised classification. Each data (1985 and 1991) was classified independently and ovedayed later in ERDAS. Subscenes from the larger scene were extracted to correspond with the study sites. Maraj6- aqfi represents an area of 185 by 173 pixels (i.e., 2,880 ha), Paricatuba an area of 131 by 113 (i.e., 1,332 ha), and Praia Grande an area of 147 by 116 pixels (i.e., 1,534 ha). Each image was submitted to transformed divergence separability analysis 6 (TDS). Parametric statistics (means, standard devia- tions, and covariance) of clusters associated with each one of the classes of interest were used in TDS analysis. This analysis indicated that bands 2, 3, 4, and 5 were the best set to be used for image classification. The classes and training samples selected according to their spectral signatures and spa- tial configuration were submitted to a Gaussian Maximum-Likelihood Clas- sifier. 7 A second method was applied to verify change in land use based on the thematic classification of the 1985 and 1991 images. The program "AL- GEBRA" in ERDAS was used to overlay, and subsequently add one clas- sification (1985) to another (1991). s Finally, results were obtained using the
5The CURSES program in ERDAS 7.5 allows one to view information about a specific pixel or pixels (i.e., spectral values, image and cartographic coordinates), by positioning a pointer on the desired pixel(s) (ERDAS Field Guide, 1991).
6Transformed divergence separability analysis causes calculations to be performed which assist in determining the subset of features to be used for a given training set. This processor calculates the statistical distance between all class pairs for each of the subsets of channel combinations chosen.
7The Gaussian maximum likelihood classification uses the training data as a means of estimating means and variances of the classes, which are then used to estimate the probabilities for membership in each class. It considers not only the mean, or average, values in assigning classification but also the variability of brightness values in each class.
SALGEBRA is a program in ERDAS which allows the user to perform algebraic operations on image or GIS data. In this situation, it is applied to two GIS Files so that the changes between the two dates can be identified. If the first input file is the result of 1985's image classification, it is named X1. The second file is the result of 1991's image classification and it is named X2. Assume in an example that both GIS files have two classes, Forest and SS3. In order to make the results understandable, two files are recoded. In X1, Forest = 10, SS3 = 20. In X2 Forest -'-- 1, SS3 = 2. If the input equation is (X1 + X2), four possible classes are created, which are classes 11, 12, 21, and 22. Class 11 means forest without change. Class 12 represents change from forest to SS3. Class 21 reflects change from SS3 to Forest and class 22 is the SS3 without change.
258 Brondizio, Moran, Mausel, and Wu
program "LISTIT" also in ERDAS to express the area of change between one class and the next, given this temporal change. 9 This process made it possible to analyze the conversion of land use classes, such as the changes in stages of fallow between 1985 and 1991.
Table I provides the adjusted class mean spectral values (DN), 1~ a "sig- nature" for each land cover class. Spectral modeling of land cover classes is a hybrid process of analysis. It requires the integration of physical and bio- logical characteristics of land cover classes of interest with detailed knowledge of the structure of the land cover, other physical characteristics of the vege- tation such as vegetation structure, light penetration through the canopy, and vegetation composition and diversity. History of the use to which the land has been put can also be helpful in the analysis. Many classes were relatively homogeneous and the boundaries between these features and other ones was clear. For example, water, bare ground, upland forest, flooded forest, and savanna have very distinct reflective properties and, hence, spectral signatures (see Fig. 3). Other features of interest had more complex spectral charac- teristics because the mix of earth features were subject to considerable vari- ation over small distances. The spectral definition of these classes is somewhat "noisy," as are any classes that name a land cover type that represents dy- namic plant communities along a continuum. Secondary succession occurs along a continuum that represents numerous factors such as land use, age of secondary growth, opportunistic colonization by pioneer and gap species, and landscape features such as soil quality and slope. Late initial succession grades imperceptibly into an early intermediate succession (see the similarity in Fig. 4 in spectral signatures except for the ability of the mid-infrared chan- nel to distinguish between moisture levels (which reflects greater shadowing and stratification with time). Values in Table I represent midpoints of a class, recognizing that for each class there may be some mis-elassified pixels that are closer to the endpoints of the range present.
The basic elements of spectral modeling involve a recognition of the visible bands' sensitivity to chlorophyll absorption, of the near infrared to mesophyll reflectance, and of the mid-infrared to water and moisture ab- sorption. The cross-section of these elements helps discriminate between types of secondary succession, between flooded forest and managed forest, and between mechanized and swidden cultivation. For example, in an un-
9"I'he LISTIT program in ERDAS is used to produce a listing o f the information stored in the header and trailer of a data file, either a image file or a GIS file. The list includes the statistical data, e.g., mean, max. and rain. values for image file, and the areal percentage for each class.
1~ number in an image file is a digital number. It is also called "data file value," "file value," "image file value," "digital number (DN)," "brightness value," "pixel value," or only "pixel" (ERDAS Field Guide, 1991). These values were adjusted to correct for atmospheric effects.

Tab
le I
. S
pect
ral
Sig
natu
res
of L
and
Use
Cla
sses
: M
ean
Dig
ital
Num
bers
and
The
ir S
tand
ard
Dev
iati
ons a
Cla
sses
B
and
2 (S
D)
Ban
d 3
(SD
) B
and
4 (S
D)
Ban
d 5
(SD
)
Wat
er
34.8
0.
7 35
.8
1.2
32.1
4.
4 10
.1
4.2
Upl
and
fore
st
30.5
0.
5 24
.8
0.4
81.7
1.
6 55
.4
4 F
lood
plai
n fo
rest
30
.5
0.3
28.4
0.
5 71
4.
2 46
.9
4.7
Aca
i pa
lm f
ores
t 30
.9
0.5
28.9
0.
6 77
.6
3.9
46.3
5
Man
grov
e/m
arsh
32
.8
0.9
32.9
1.
6 52
.36
8 32
.6
0.4
Bar
e so
il
45.5
2.
4 52
.5
3.5
60.9
4.
2 10
7.9
7.2
Pas
ture
39
0.
8 35
.8
2.3
98
3.3
115
3.5
Pas
ture
w/p
alm
s 37
0.
2 34
.1
0.6
96.7
2.
6 11
2.5
4.1
Init
ial
S.S.
36
.1
0.2
33
1.1
95.9
6.
3 10
0.9
4.5
Inte
rmed
iate
S.S
. 35
.9
0.7
31.8
1.
3 93
.6
3.8
92.6
5
Adv
ance
d S.
S.
32.6
0.
4 26
.3
0.7
91.7
3.
5 71
.2
5.4
Hig
h sa
vann
a 31
.7
0.4
33.9
0.
2 44
3.
7 69
.8
3.8
Low
sav
anna
33
.2
0.8
35
1.2
55.5
3.
5 78
.1
2.2
"Im
pera
ta"
sava
nna
32.3
0.
6 31
.4
1.1
65.6
1.
8 61
.5
2.1
aRel
ativ
e sp
ectr
al r
espo
nse
in d
igit
al n
umbe
rs f
or T
M b
ands
2-5
.

260
110
IO0
90
~ 80 :~
Z 70
~ ~
,~ 5~
~ 41)
~0
20-
Brondizio, Moran, Mausel, and Wu
~ ~ - - - - - - - - - - - ~ . . . . . . . . . . . . . . . . . . . . . . . .
~ ~ ~ '~ ~ ~ 4 ~ s ~ A T TM B,~DS
[ ~ UP~D ~ "~" ~DP~ ~ R ~ ~ HIGtt SAV~NA [
~ WA~R ~ B~ ~IL
Fig. 3. Spectral curves of selected features, Marajo Island, 1991.
II0
100
~ 9O
~ 8O
Z ~ 70-
-.q ~ 60
~ so
~ ~,
20 ~A~D ~ ~A~D ~ ~A~D 4 ~AND ~
~DSAT ~ B ~
I ~ UP~D ~ - ~ ~ S~SUC, @ I ~ Y ~ ~ ~V~C~ ~ I
Fig. 4. Spectral curves of selected features, Marajo Island, 1991.
Land Use in the Amazon 261
managed flooded forest, a more irregular and higher canopy is present, there is a denser understory, and more stratification which creates shad- owing that particularly depresses the near-infrared and mid-infrared spec- tral values. This process makes it possible to distinguish between managed and unmanaged flooded forest (see Fig. 5).
ANALYSIS AND RESULTS
Four major land management practices influence vegetation cover in the study area: burning of vegetation, mechanized land clearing/weeding, palm forest management, and secondary succession. In slash-and-burn ag- riculture gardens are not actively planted after 2-3 years and succession occurs fairly quickly. The areas used for this purpose are well-drained soils of upland forest or old-regrowth fallow. These are preferable because they require the least labor to slash. The average size of gardens is 2500 m 2. Mechanically cleared areas vary in size from 1 to 5 hectares, and involves both short fallow management and fertilizer input. These areas are distin- guishable from the slash-and-burn gardens by the shorter length of the fal-
80
70-
~ 60'
Z ,d 50- ,< ~- .~ r 40"
~ ao
20"
10
. . . . . . . . . . . . . . . : ~ . ~ _ :~.:g . . . . . . . .
~ - . . .~,'. :
~ - . . - . , . . . . . . . . .
i i ~ ~ BAND 2 BAND 3 BAND 4 BANO 5
~ D S A T TM B ~ D S
l ~ ~ ~ ~ - ~c~ ~ ~ ~ ~ 6 ~ n / ~ ~ ~ I t 1
Fig. 5, Spectral curves of selected features, Marajo Island, 1991.

262 Brondizio, Moran, Mausel~ and Wu
low cycle, by their spatial form (generally more square and rectangular) and by their distribution and rate of secondary successional regrowth. Be- cause the mechanized areas are maintained in cultivation longer than swid- den areas, regrowth is slower and soil fertility is lower. Intensive weeding of pastures, whether through fire or tractor, slows the rate of regrowth of woody species. Such areas are characterized by the presence of palm trees adapted to resist burning, chief among them Maximiliana maripa ("inajfi") and Astrocaryum vulgare ("tucumfi"). Palm forest management ("aqaizai") involves management of floodplain forest dominated by Euterpe oleracea ("aqai"). Preliminary data on palm forest management indicate that the Importance Value 11 ofEuterpe oleracea increases from 0.2 in an unmanaged floodplain forest to an average of 0.6 in managed floodplain forests (Bron- dizio et al., 1993). The management techniques involved in this process can be broadly characterized by five steps: selective thinning of non-desir- able forest species; selective thinning of understory vegetation and vines; pruning of palm seedlings, saplings, and trees; planting of palm seedlings and seeds; and annual weeding of the area.
Secondary succession processes were discriminated, using combined Landsat TM and botanical fieldwork, into three stages: Initial (SS1), In- termediate (SS2), and Advanced (SS3) secondary succession. These cate- gories roughly correspond to age classes of 0-5 years, 6-10 years, and greater than 11 years, respectively, in most of the study area. The combined analysis of vegetation sampling, data on land use history, and spectral sig- natures, suggest that these are the most appropriate classes given the TM Landsat spectral and spatial resolutions. To date it has not been possible to differentiate a 20-year regrowth fallow from undisturbed forest. We be- lieve that improvements in ground-truth information may provide better data in the future and refined classification of successional land cover.
Supervised classifications of the 1985 and 1991 images, respectively, for Maraj6-aqfi (Figs. 6 and 7), Paricatuba (Figs. 8 and 9), and Praia Grande (Figs. 10 and 11) illustrate the nature of the changes taking place. In the period between the two views of land cover, changes can be seen in land cover (see Table II) although the scale of these changes are im- perceptible in overall percentages. The changes brought about by market forces and external subsidies have affected Maraj6's land cover. The de- mand for afa[ together with the flow of funds to the cooperative have trans-
11Importance Value is a vegetation index which accounts for relative density, frequency and dominance (basal area) of a species.
I.V. = Relative density + Relative Dominance + Relative frequency

Cla
sses
19
85 (
%)
Tab
le I
I. P
erce
ntag
e of
Cha
nge
from
198
5 to
199
1
Par
icat
uba
Pra
ia G
rand
e
1991
(%
) 85
-91
(%)
1985
(%
) 19
91 (
%)
85-9
1 (%
)
Mar
ajo-
acu
1985
(%)
1991
(%)
85-9
1 (%
)
1.
Wat
er
4.4
4.6
0.2
17.7
21
.4
3.7
22.9
21
.4
-1.5
2.
U
plan
d fo
rest
36
.4
37.5
1.
1 1.
9 2.
8 0.
9 10
.1
9.4
-0.7
3.
F
lood
plai
n fo
rest
23
.2
20.8
-2
.4
3.5
3.3
-0.2
32
.9
38.9
6.
0 4.
A
cai
palm
for
est
7.7
7.9
0.2
3.1
4.7
1.6
10.7
12
.5
1.8
5.
Man
grov
e 2.
9 2.
6 -0
.3
3.5
2.1
-1.4
5.
7 6.
1 0.
4 6.
B
are
soil
2.
6 1.
4 -1
.2
9.2
8.9
-0.3
1.
7 0.
9 -0
.9
7.
Pas
ture
1.
6 0.
2 -1
.4
14.5
3.
5 -1
1.0
0.4
0.8
0.3
8.
Pas,
ture
w/p
alm
s 0.
2 0.
2 -0
.0
7.3
6.3
-0.9
0.
0 0.
0 -0
.0
9.
Coc
onut
pla
ntat
ion
0.1
0.3
0.1
2.1
3.1
1.0
0.0
0.0
-0.0
10
. In
itia
l S.
S.
2.5
0.6
-1.9
9.
8 11
.6
1.9
0.9
' 0.
4 -0
.4
11.
Inte
rmed
iate
S.S
. 5.
8 1.
6 -4
.3
17.9
12
.9
-5.0
3.
9 0.
5 -3
.4
12.
Adv
ance
d S.
S.
7.5
16.7
9.
2 6.
8 16
.4
9.6
6.8
6.3
-0.5
13
. H
igh
Sav
anna
3.
7 2.
7 -1
.1
1.4
1.3
-0.1
1.
4 2.
0 0.
6 14
. L
ow S
avan
na
0.0
2.1
2.1
0.0
0.0
0.0
0.0
0.1
0.1
15.
"Im
pera
ta"
sava
nna
1.3
0.9
-0.4
1.
4 1.
6 0.
2 1.
4 0.
7 -0
.7

264 Brondizio, Moran, Mausel, and Wu
Fig. 6. Paricatuba, 1985 classification. Note the patchy nature of land cover, resulting from a predominantly shifting cultivation system. Note the presence of pastures (magenta) and initial secondary succession (light blue). (For Figs. 6-11 see color key on p. 270).
formed the way the local populations treat the landspace. In the three study areas that impact varies considerably from place to place. The most widely shared change has been the increased management of flooded forest for aqai palm fruit products. While this change is the most widely shared by households, and economically important, it has had the least impact on land cover. The area in managed palm forest increased by 0.2%, 1.6%, and 1.8% between 1985 and 1991 in the three study areas. More significant in land cover impact has been the mechanization of agriculture at Praia Grande

Land Use in the Amazon 265
Fig. 7. Paricatuba, 1991 Classification. Note the development of pastures and initial secondary succession areas into intermediate (navy blue) and advanced (dotty gray) stages of secondary succession.
which led to removal of much of the upland forest in the 1960s. Many of these areas failed to be sustainably productive and were undergoing sec- ondary growth. Advanced secondary succession went from 6.8% of total land cover in 1985 to 16.4% by 1991 at Praia Grande. Areas in pasture have concomitantly decreased, as have those of low productivity.
"Fhe land use conversion matrices presented in Tables III, IV, and V permits two types of analysis. First, it provides a more fine-grained under- standing of the changes in land use/cover, and serves to verify the consis- tency of the image classification. For instance, some areas show changes
266 Brondizio, Moran, Mansel, and Wu
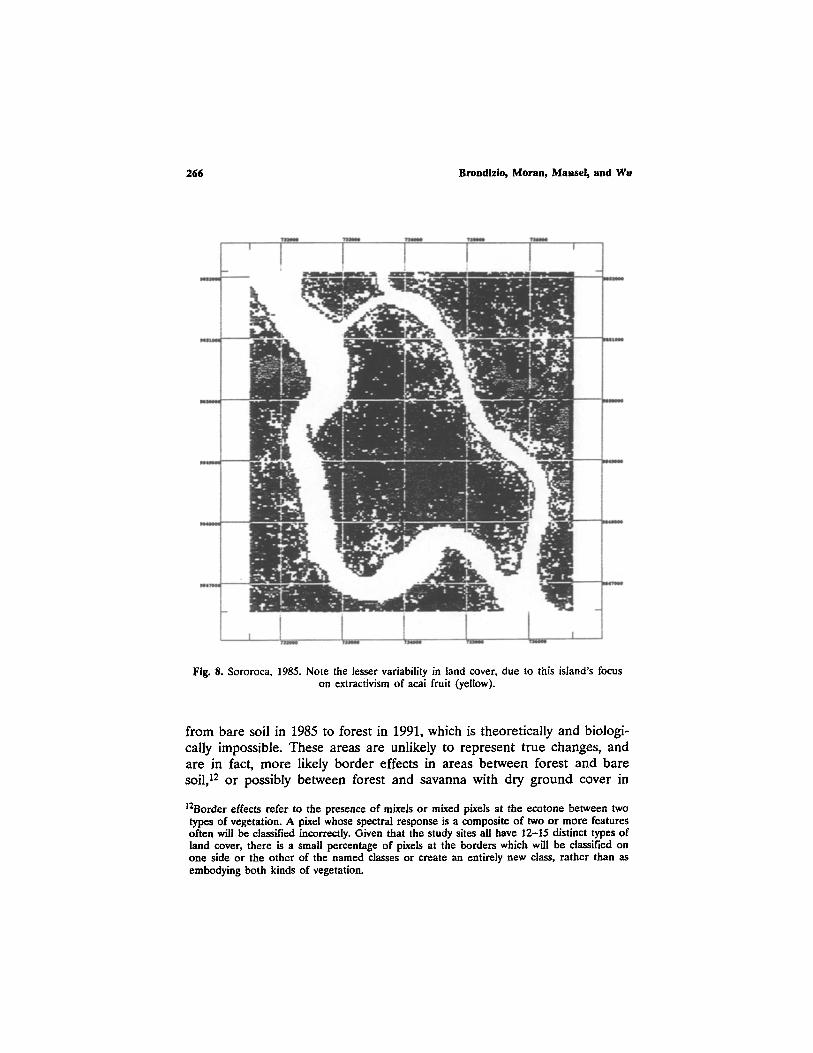
Fig. 8. Sororoca, 1985. Note the lesser variability in land cover, due to this island's focus on extrac~ivism of acai fruit (yellow).
from bare soil in 1985 to forest in 1991, which is theoretically and biologi- cally impossible. These areas are unlikely to represent true changes, and are in fact, more likely border effects in areas between forest and bare soil, 12 or possibly between forest and savanna with dry ground cover in
12Border effects refer to the presence of mixels or mixed pixels at the ecotone between two types of vegetation. A pixel whose spectral response is a composite of two or more features often will be classified incorrectly. Given that the study sites all have 12-15 distinct types of land cover, there is a small percentage of pixels at the borders which will be classified on one side or the other of the named classes or create an entirely new class, rather than as embodying both kinds of vegetation.

Land Use in the Amazon 267
Fig. 9. Sororoca. 1991. Note the increase in acai palm forests (yellow) in the six year inter- val, as compared to figure 8 on the opposite page.
summer. Changes from upland forest in 1985 to advanced secondary suc- cession in 1991 represent areas experiencing selective logging or similar disturbances. Changes between bare soil and pasture, and vice versa could be associated with ground cover cycles, such as senescence and wilting of grasses in summer-time. In the floodplain, changes are often associated with tidal influence. In this estuarine region, daily water level variation has a direct influence on vegetation classes, such as palm forest, floodplain for- est, and mangrove/marsh.
Forest management, as in the case of afaizal, is highly influenced by market demand. This region was intensively exploited for palm heart pro-
268 Brondizio, Moran, Mausel, and Wu
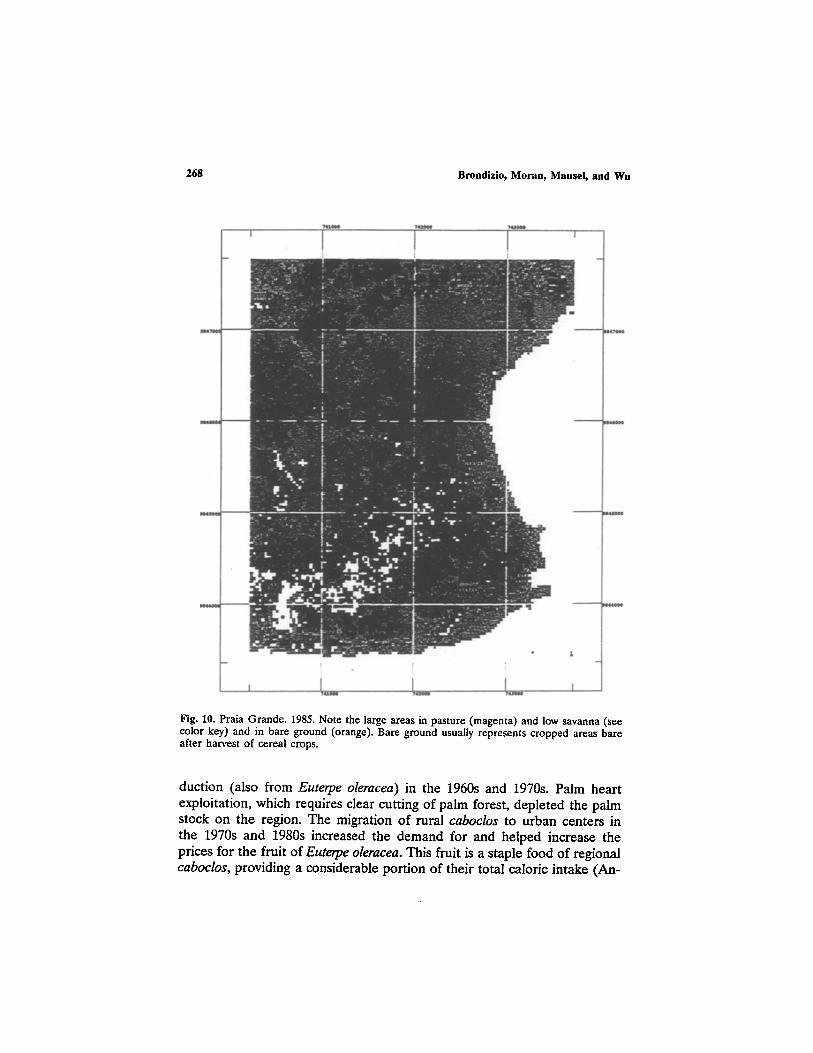
Fig. 10. Praia Grande. 1985. Note the large areas in pasture (magenta) and low savanna (see color key) and in bare ground (orange). Bare ground usually represents cropped areas bare after harvest of cereal crops.
duction (also from Euterpe oleracea) in the 1960s and 1970s. Palm heart exploitation, which requires clear cutting of palm forest, depleted the palm stock on the region. The migration of rural caboclos to urban centers in the 1970s and 1980s increased the demand for and helped increase the prices for the fruit of Euterpe oleracea. This fruit is a staple food of regional caboclos, providing a considerable portion of their total caloric intake (An-
Land Use in the Amazon 269
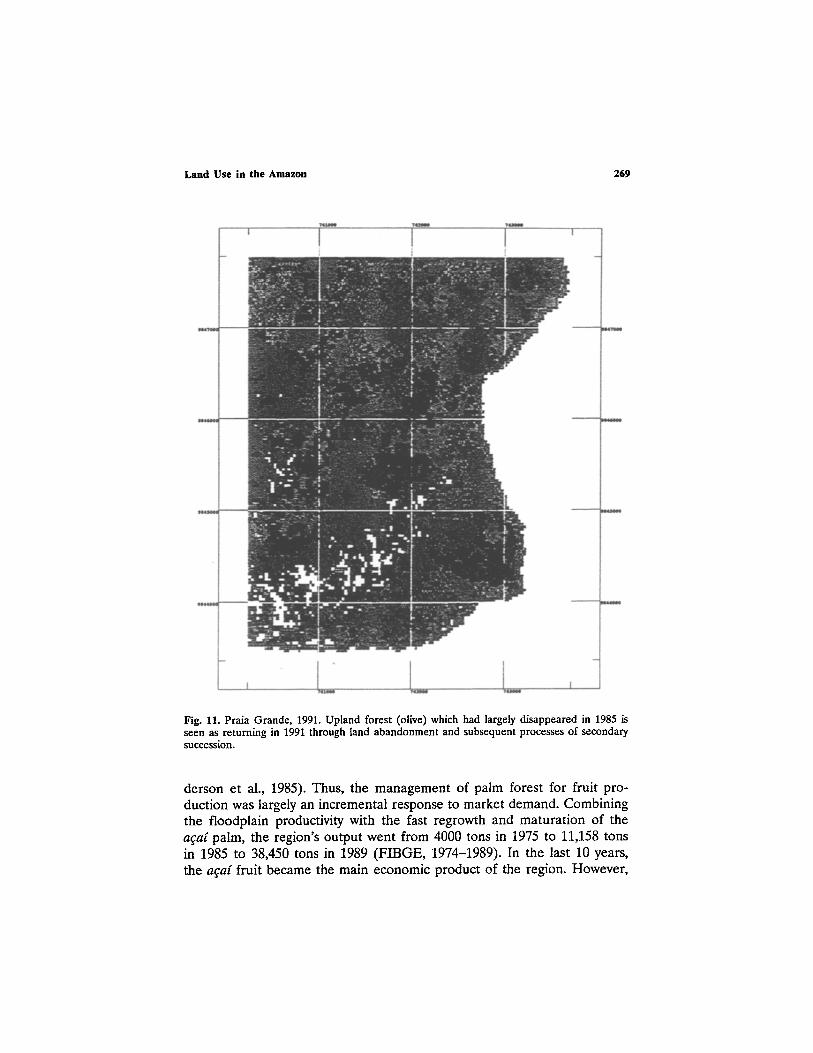
Fig. 11. Praia Grande, 1991. Upland forest (olive) which had largely disappeared in 1985 is seen as returning in 1991 through land abandonment and subsequent processes of secondary succession.
derson et al., 1985). Thus, the management of palm forest for fruit pro- duction was largely an incremental response to market demand. Combining the floodplain productivity with the fast regrowth and maturation of the afai palm, the region's output went from 4000 tons in 1975 to 11,158 tons in 1985 to 38,450 tons in 1989 (FIBGE, 1974-1989). In the last 10 years, the afaf fruit became the main economic product of the region. However,
270 Brondizio, Moran, Mausel, and Wu
I Upland Forest
I loodplain Forest
A:.,ai Pslm Forest
I ~,'~an.~rOVe
I Bare Soil
B ~
I l~ with Palm~
I Coemmt PlantatiOn
i
I m m ~o~ ~ioa
I ~v~ ~ ~ioa
I
I ~w ~wn~
I ~ Savan~
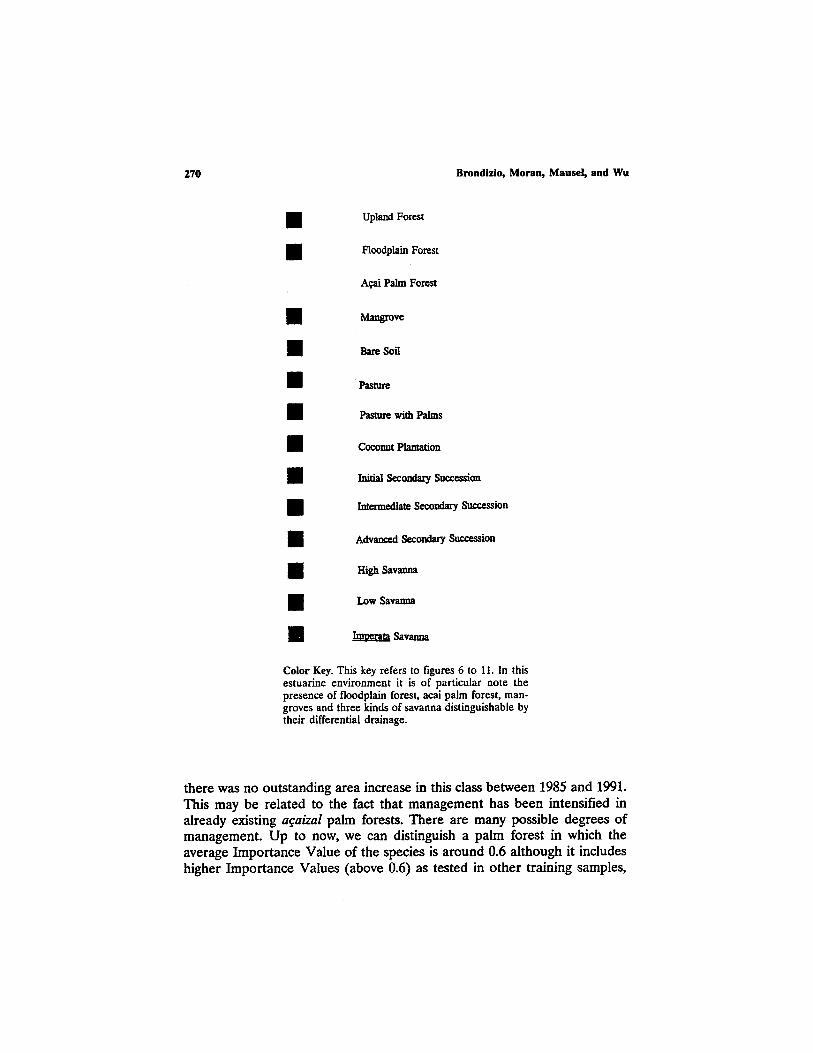
Color Key. This key refers to figures 6 to 11. In this estuarine ~vironm~t it is of particular note the pres~nc~ of floodplain forest, acai palm forest, man- groves and thr~ ~nds of savanna distinguishabl~ by their differential draiaag~.
there was no outstanding area increase in this class between 1985 and 1991. This may be related to the fact that management has been intensified in already existing a~aizal palm forests. There are many possible degrees of management. Up to now, we can distinguish a palm forest in which the average Importance Value of the species is around 0.6 although it includes higher Importance Values (above 0.6) as tested in other training samples,

Tab
le I
II.
Lan
d U
se C
onve
rsio
n M
atri
x--P
aric
atub
a a
8 ~.
.~
Are
a-ha
1991
Up.
for.
B
,soi
l Pa
stu.
P.
w/p
a.
S.S.
I S.
S.2
S.S.
3 49
9.5
ha
18.7
ha
2.9
ha
2.2
ha
8.2
ha
20,7
ha
222,
3 ha
(%
) (%
) (%
) (%
) (%
) (%
) (%
)
1985
U
p.fo
r.
48
5.3
ha (
%)
77.3
30
.9
25.0
40
.0
18.2
10
.1
29.5
B
.soi
l 35
.2 h
a (%
) 3.
0 21
.3
33.3
20
.0
18.2
10
.1
7.7
Past
u.
21.2
ha
(%)
1.4
14.9
41
.7
20.0
31
.8
11.9
5.
5 P.
w/P
a.
2.8
ha (
%)
0.2
1.1
0.0
0.0
2.3
0.9
0.8
S.S.
1 33
.2 h
a (%
) 2.
3 12
.8
0.0
0.0
18.2
14
.7
9.8
S.S.
2 77
.8 h
a (%
) 5.
5 9.
6 0.
0 20
.0
4.5
30.3
23
.8
S.S.
3 99
.7 h
a (%
) 10
.2
9.6
0.0
0.0
6.8
22.0
22
.8
Are
a-ha
1991
Flo.
fo.
A
cai
Man
gr.
277.
2 ha
10
4.7
ha
35 h
a (%
) (%
) (%
)
1985
Fl
o.fo
. 3
09
.3 ha
(%
) 75
.3
56.4
28
.6
Aca
i 10
2.1
ha (
%)
23.4
35
.2
14.1
M
angr
. 38
.4 h
a (%
) 1.
3 8.
4 57
.3
aUp.
Fo
r--U
pla
nd
for
est,
B.
So
il--
Bar
e so
il, P
ast
u.-
pas
ture
, P.
w/p
a.-
Pas
ture
with
pal
ms
and
shru
bs,
S.S.
! --I
nit
ial
seco
ndar
y su
cces
sion
, S
.S.2
--in
term
edia
te s
econ
dary
suc
cess
ion,
S.
S.3
-- A
dvan
ced
seco
ndar
y su
cces
sion
, F
!o.F
o.-
-Fio
od
pla
in f
ores
t, A
cai-
palm
for
est
(Eut
erpe
ole
race
a), M
angr
. --
Man
grov
e, a
rea-
ha-
-Are
a in
hec
tare
s, (
%)-
-Per
cen
t of
198
5 C
lass
Con
trib
uted
to
199
1 cl
ass.
1985
Tab
le I
V.
Lan
d U
se C
onve
rsio
n M
atri
x--P
raia
Gra
nde a
1991
Up.
for.
B
.soi
l Pa
stu.
P.
w/p
a.
43.1
ha
137.
1 ha
54
ha
97.2
ha
Are
a-ha
(%
) (%
) (%
) (%
)
Up.
for.
29
.16
ha (
%)
9.5
0.6
0.0
0.0
B.s
oil
141.
5 ha
(%
) 9.
5 20
.4
11.7
14
.4
Past
u.
223
ha (
%)
3.2
21.3
45
.8
43.9
P.
w/p
a.
111.
3 ha
(%)
1.6
12.2
20
.6
19.1
S.
S.1
149.
7 ha
(%
) 9.
5 16
.3
9.2
9.3
S.S.
2 27
4.1
ha (
%)
33.3
21
.5
9.2
11.0
S.
S.3
104.
5 ha
(%
) 33
.3
7.7
3.4
2.3
$.S.
1 17
8.6
ha
(%)
0.1
12.0
30
.0
22.9
16
.1
12.2
6.
7
S.S.
2 19
8 ha
(%
)
0.1
5.9
17.1
13
.9
20.8
29
.9
12.4
S.S.
3 25
1.7
ha
(%)
0.5
4.8
7.9
3.9
14.4
50
.0
18.0
1985
1991
Fio.
fo.
A
cai
Man
gr.
50.6
4 ha
71
.7 h
a 32
.5 h
a A
rea-
ha
(%)
(%)
(%)
FIo.
fo.
54 h
a (%
) 46
.6
34.7
15
.2
Aca
i 47
.3 h
a (%
) 43
.4
56.3
21
.2
Man
gr.
53.6
ha
(%)
10.0
9.
0 63
.6
"Up
.fo
r--U
pla
nd
fo
rest
, B
. so
il--
bar
e so
il,
Past
u. -
- pa
stur
e,
P.w
/pa.
--P
astu
rc
wit
h pa
lms
and
shru
bs,
S.S.
l --
init
ial
seco
ndar
y su
cces
sion
, S
.S.2
--in
term
edia
te s
econ
dary
suc
cess
ion,
S.S
.3--
adva
nced
sec
onda
ry s
ucce
ssio
n, F
lo.f
o. --
Flo
odpl
ain
fore
st,
Aca
i-pa
lm
fore
st (
Eute
rpe
oler
acea
), M
ang
r.-
man
grov
e, a
rea-
ha--
area
in
hec
tare
s, (
%)-
-Per
cen
t of
198
5 cl
ass
cont
ribu
ted
to 1
991
clas
s.
O
Tab
le V
. L
and
Use
Con
vers
ion
Mat
rix-
-Mar
ajo-
Acu
a
Are
a-ha
1991
Up.
for.
B
.soi
l Pa
stu.
P.
w/p
a.
S.S.
1 S.
S.2
S.S.
3 27
0 ha
25
.3 h
a 21
.7 h
a 0.
9 ha
11
.8 h
a 14
.9 h
a 18
1.1
ha
(%)
(%)
(%)
(%)
(%)
(%)
(%)
1985
U
p.fo
r.
291.
3 ha
(%
) 64
.9
30.0
4.
8 0.
0 16
.7
22.2
26
.9
B.s
oil
50
ha (
%)
3.5
25.0
66
.7
0.0
16.7
7.
4 5.
6 Pa
stu.
12
ha
(%
) 0.
2 10
.0
19.0
0.
0 12
.5
3.7
2.0
P.w
/pa.
1.
15
ha (
%)
0.0
2.5
4.8
100.
0 0.
0 0.
0 0.
0 S.
S.1
24.4
ha
(%
) 1.
6 5.
0 4.
8 0.
0 12
.5
11.1
5.
2 S.
S.2
112.
5 ha
(%
) 12
.6
10.0
0.
0 0.
0 12
.5
29.6
28
.2
S.S.
3 19
4.5
ha (
%)
17.2
17
.5
0.0
0.0
29.2
25
.9
32.1
Are
a-ha
1991
FIo.
fo.
A
cai
Man
gr.
1153
ha
308
ha
176.
7 ha
(%
) (%
) (%
)
1985
FI
o.fo
. 94
7.3
ha (
%)
73.9
51
.4
16.0
A
cai
295
ha (
%)
23.1
32
.5
18.6
M
angr
. 16
4 ha
(%
) 3.
0 16
.1
65.5
aUp
.fo
r--U
pla
nd
fo
rest
, B
. so
il--
bar
e so
il,
Past
u. -
- pa
stur
e,
P.w
/pa.
--
Past
ure
wit
h pa
lms
and
shru
bs,
S.S.
1 m
in
itia
l se
cond
ary
succ
essi
on,
S.S
.2--
inte
rmed
iate
sec
onda
ry s
ucce
ssio
n, S
.S.3
- ad
vanc
ed s
econ
dary
suc
cess
ion,
F
io.f
o.-
Flo
odpl
ain
fore
st,
Aca
i-pa
im
fore
st (
Eute
rpe
oler
acea
), M
ang
r.-
man
grov
e, a
rea-
ha--
area
in
hec
tare
s, (
%)-
Pe
rcen
t of
198
5 cl
ass
cont
ribu
ted
to 1
991
clas
s.

274 Brondizio, Moran, Mausel, and Wu
it did not include beginning stages of management (Importance V a l u e - 0.3--0.5) since its importance at that level can occur naturally.
The land use conversion matrix of the Padcatuba area (Table III) shows many common characteristics of slash-and-burn agriculture. The amount of open area (Bare Soil) decreased from 35.2 ha in 1985 to 18.7 ha in 1991. This implies that areas that were bare soil in 1985 are now in different stages of secondary succession. This is most clearly demonstrated by looking at the percentage contributed by this class to the three stages of secondary succession. There is also a considerable increase in areas of ad- vanced secondary succession from 99.7 ha in 1985 to 222.3 ha in 1991. Out of the total area in secondary succession in 1991, 23.8% or 52.8 ha were in an intermediate stage of succession in 1985. These changes in successional stages characterize agriculture based on long fallow cycles. There is an in- crease of upland forest of 14.2 ha, although minor deforestation took place as evident in the contribution of forest to other classes. In the floodplain, there is a small area of a~aizal palm forest, and while we can observe that some areas were abandoned between 1985 to 1991, 67% of the palm forests mapped in 1991 come from the management of areas classified as floodplain forest or mangrove in 1985. The area of palm forests indicated as abandoned (which is the area changed from a~aizal in 1985 to floodplain or mangrove in 1991) is characterized by an increase in tree species and by higher density of understory vegetation. This is also common in older and less productive palm forests which have had reduced management recently.
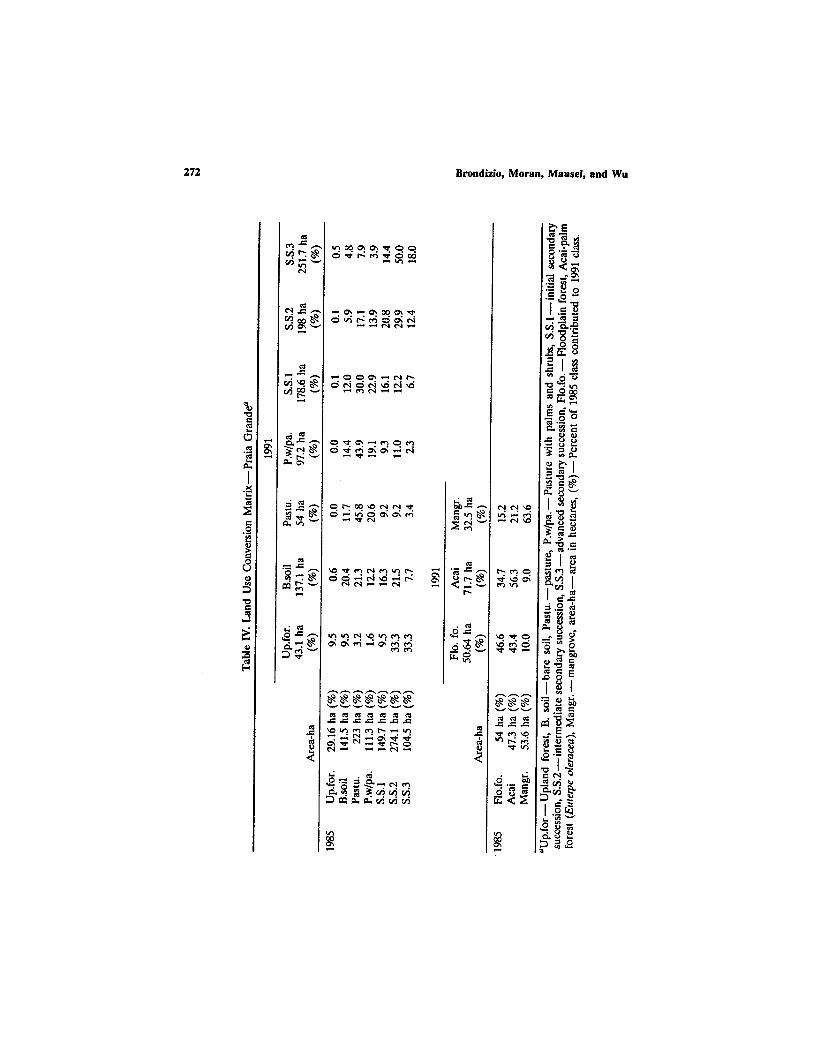
The land use conversion matrix of Praia Grande (Table IV) reveals the environmental dimension of the socioeconomic changes taking place in the area since the late 1960s.. The upland area was largely deforested to make it possible to implement intensive mechanized agriculture and cattle ranching projects. By 1985 only 29.2 ha of upland forest remained standing. Considerable areas of advanced secondary succession had developed enough by 1991 from the earlier deforestation of the 1960s that some areas had grown back to become indistinguishable from forest in the satellite imagery which reveals an increase in very advanced secondary forest approaching biomass of upland forest cover to a total of 43.1 ha. The failure of cattle ranching in this region is clearly shown by the decrease in the extent of pasture areas from 223 ha in 1985 to 54 ha in 1991. These areas are now in different stages of secondary succession - - a process not unlike that taking place throughout the Amazon basin on a much grander scale (cf. Moran, 1993). Large areas (i.e., 111.3 ha) of pasture were already abandoned by 1985, as can be observed in the land cover class "Pasture with palms" (the vegetation result of pasture management based on burning). The dominant palms on these pasture areas are Maximiliana raaripa and Astrocaryum vul- gate. Similarly, large areas were used for cropping in the 1970s and later

Land Use in the Amazon 275
abandoned due to low fertility and soil compaction, which explains the large amount of area observed in different stages of secondary succession in 1985 and 1991. Note in Table IV that initial secondary succession (SS1) went from 149.7 ha in 1985 to 178.6 ha in 1991, while advanced secondary sue- cession (SS3) went from 104.5 ha in 1985 to 251.7 ha in 1991.
The decrease in intermediate secondary succession (SS2) may reflect the recleadng of areas for agropastoral activity in lieu of clearing primary forest. This situation indicates the failure of a land use model based on intensification and short-term fallow in an area with limited soil fertility, as was applied by the Church cooperative. The result of that experiment led to the total removal of terra firma forest from the study area without any notable increases in income or sustainable yields. Instead, mechanized areas have become dominated by secondary growth due to the abandon- ment of many areas due to declining yields. Earlier work in this study area (Murrieta et al., in press) noted a significant shortage of manioc flour (Manihot esculenta), which is the main caloric source for the population. The floodplain forests continue to play an important role in the subsistence of caboclos at Praia Grande. While upland forest deforestation and mecha- nized agriculture and pastures seem to be reverting to regrowth, the areas of palm forest have increased from 47.3 ha in 1985 to 71.7 ha in 1991, a change that shows the decrease in open areas of agriculture, despite efforts by leaders of the cooperative to wean caboclos away from extractivism.
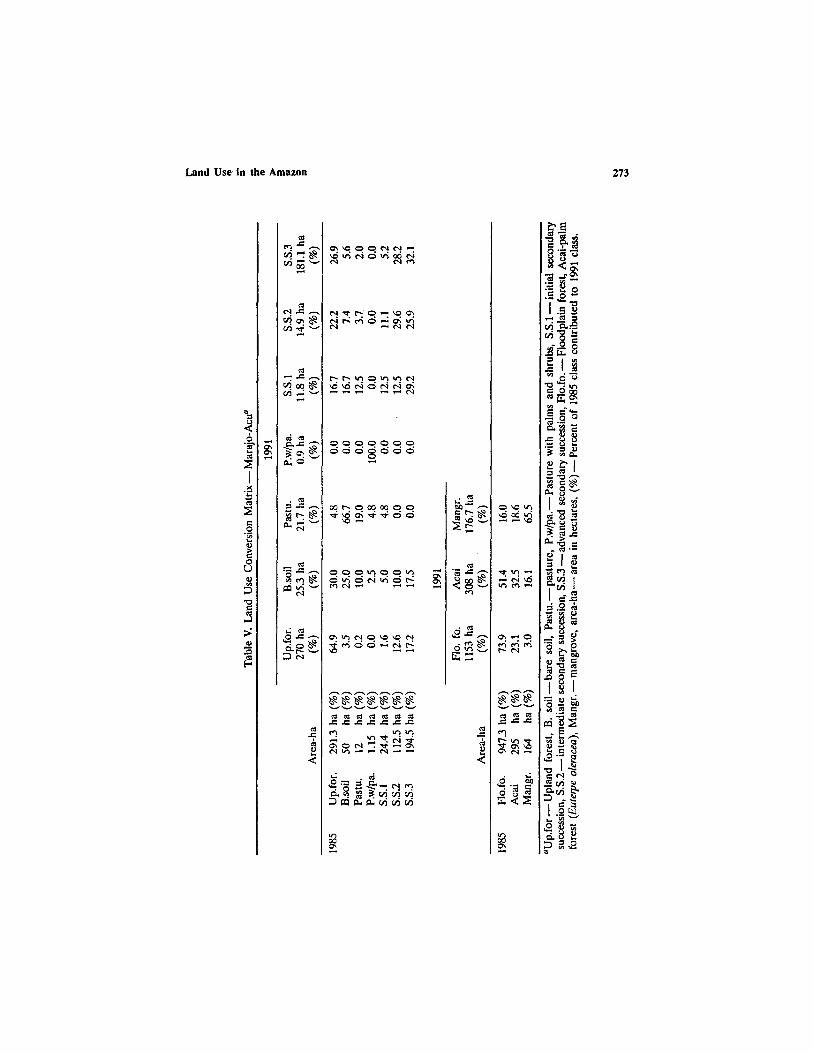
The land use conversion matrix of Maraj6-a~ti (Table V) shows few changes in either upland or floodplain forest cover. This population has pro- gressively abandoned slash-and-bum gardening in exchange for the intensi- fication of an a~ai-based economy (Murrieta et al., 1989). Old garden sites can be observed in different stages of secondary succession in 1985 and 1991. The amount of bare soil decreased from 50 ha in 1985 to 25.3 ha in 1991, which is probably the result of the earlier thinning of flooded forest for a~ai managed forest. Maraj6-aqt~ has the largest area of floodplain forest of the three areas studied here, compared to the other two populations. Areas suit- able for upland gardening are restricted in areal extent in this region due to its low position on the landscape and greater proneness to flooding. The total area of a~ai palm forest does not show much change. However, the management of new regions is economically significant.
This study gives support to the value and sustainability of the traditional system of diversified land use. This system has left minimal impact on the native vegetation cover, has been capable of adjusting to shifts in the value of commodities, and provides the human population with a diverse diet. In contrast, the model, of intensive mechanized agriculture promoted by the Church cooperative, has severely impacted the landscape, has been costly in terms of labor and capital, and has not proven sustainable as evidenced by

276 Brondizio, Moran, Mausel, and Wu
the large areas that have been abandoned to secondary growth despite the availability of tractors to control weed invasion. The study has also shown that it is possible to monitor these changes in cropping pattern, secondary growth, and savanna expansion. The estuary provides conditions that favor small scale agriculture combined with extractive activities and fishing, rather than conditions for intensive mechanized agriculture. The impact of defor- estation has been less in the estuary than in the interfluves because of the presence of traditional caboclo populations practicing diversified systems of land use appropriate to the daily flooding patterns of the estuary. In those cases where "modern" forms of intensive land use are promoted, deforesta- tion can be just as severe as in the interfluves, as has been the case in the Praia Grande site discussed in this paper. As has been the case in colonization areas of the interfluves, those deforested areas have often proven unproduc- tive and are now undergoing secondary successional processes that may re- turn them to the diversity that they had earlier. Our study continues at present as it tries to determine the role of soil fertility, size of area cleared and land use practices' impact on the rates of secondary succession in estu- arine and interfluvial areas (cf. Moran, 1993; Moran et al., 1994; Mausel et al., 1993). The linkage between satellite data and field studies, within a GIS, has proven a useful medium for analyzing these processes in time and space.
CONCLUSIONS
In the last 20 years, subsistence strategies of caboclo populations have been affected by a number of external forces such as market pressure and development programs. There is increased concern worldwide for the long- term impact of intensification in agriculture and forest extraction on local environmental resources (Murrieta et al., 1989; Moran, 1993b). It remains to be seen what level of economic intensification best addresses the subsistence needs of local populations. Remote sensing is a powerful tool for human ecological studies in the Amazon. The refinement of methodologies to bridge socioeconomic and historical data to thematic classification of satellite images will encourage a new phase in the analysis of social and environmental in- teractions in the Amazon. For this to happen, an interdisciplinary research team must develop common research protocols that incorporate the experi- ence of anthropologists, ecologists, geographers, and economists as well as the use of the techniques of remote sensing and geographic information sys- tems. The study of local systems of land use in regional and global context can inform how best to develop models that can serve the human and envi- ronmental interests in a region. The traditional populations of the Amazon estuary give evidence of being capable of intensifying land use without leaving

Land Use in the Amazon 277
a deforested landscape in their wake, while externally induced strategies, such as implemented at Praia Grande, have been both costly environmentally, and economically unsustainable to date. Continued monitoring of the differential impact of land use strategies suggests ways to proceed in the years ahead.
ACKNOWLEDGMENTS
This study has been possible due a 2-yr grant from the National Sci- ence Foundation (SES 91-00526) and to an earlier grant for preliminary research from the Wenner Gren Foundation (1989) to Emilio Moran. A grant from the Brazilian Research Council (CNPq 403534/90-9; 150043/90- 2) made possible intensive interdisciplinary research on the area between 1989 and 1991 by co-author Eduardo Brondizio.
The authors owe numerous thanks to a number of Brazilian collabo- rators: to taxonomists ("mateiros") Lucival Marinho e Jair da Costa (of EMBRAPA/CPATU) and ecologist Dr. Mario Dantas (EMBRAPA/ CNPMA) for their valuable work on vegetation inventories; to Dr. J. C. Randolph (Indiana University (SPEA)) for assistance in analyzing the vege- tation data; to the people from Paricatuba, Maraj6-a~d, Praia Grande, and the town of Ponta de Pedras for their assistance over the past 5 years; and finally to Andrea Dalledone Siqueira, Rui S. S. Murrieta, Walter Neves, Fabio de Castro, Eduardo Neves, Mark Ficht, and Dawn Parks for valuable comments on an earlier version of this manuscript. We also thank Clifford Behrens and the journal reviewers for numerous comments that helped clarify many parts of the analyses.
Earlier versions of this paper were presented at the Annual Meeting of the American Anthropological Assocation, Dec. 2-6, 1992 in San Fran- cisco, California, and at the VII Brazilian Remote Sensing Congress, May 10-14, 1993 at Curitiba, Brazil.
Responsibility for the opinions expressed in this paper is solely the authors' and not of the funding agencies cited above.
REFERENCES
Anderson, A. B. (1991). Forest management strategies by rural inhabitants in the Amazon estuary. In G6mez-Pompa, A., Whitmore, T. C., and Hadley, M. Rainforest Regeneration and Management, Man and the Biosphere Series (Vol. 6), UNESCO and the Parthenon Publishing Group, Paris.
Anderson, A. B., Gely, A., Strudwick, J., Sobel, G. L., and Pinto, M. G. C. (1985). Um sistema agroforestal na va~'zea do estu/trio Amaz6nico (Ilha das On,as, Municipio de Barcarena, Estado do Patti), Acta Amazonica 15:195-224.
278 Brondizio, Moran, Mausei, and Wu
Behrens, C. A. (1990). Applications of satellite image processing to the analysis of Amazonian cultural ecology. Conference proceedings, Applications of Space Age Technology in Anthropology, John C. Stennis Space Center.
Brondizio, E., and Neves, W. (1992). A percepf.~o do ambiente natural por parte de popula~26es caboclas do Estuario do Amazonas: uma experiencia piloto atraves do m6todo de trilhas prefixadas. Paper presented on the symposium Urea estrategia Latino Americana para Amazonia, Marfo 1992, S~o Pauio.
Brondizio, E., Moran, E., Mausel, P. and Wu, Y. (1993). Dimlmica na Vegeta~.~o do Baixo Amazonas: An:ilise Temporal do Uso da Terra integrando Imagens Landsat TM, levantamentos floristico e Etnogr~ifico. Anais do VII Simposio Brasileiro de Sensoriamento Remoto. Curitiba, Paranfi, Brazil, May 10-14, 1993.
Chibnick, M. (1994). Risky Rivers. University of Arizona Press, Tucson. Conant, F. (1990). 1990 and beyond: Satellite remote sensing and ecological anthropology. In
Moran, Emilio (ed.), The Ecosystem Approach in Anthropology. From Concept to Practice. The University of Michigan Press, Ann Arbor.
ERDAS 7.5 (1991). Field Guide Manual. ERDAS, Atlanta, Georgia. FIBGE (1984). Base Cartografica 1:100.000, Folha Ponta de Pedras. Hiraoka, M. (1985). Mestizo subsistence in Riparian Amazonia. National Geographic Research
1:236-246. Lima, R. (1956). Agricultural has v~irzeas do Estuario de Amazonas. Boletim Tdcnico de
Instituto Agronomico do Norte. 33: 1-164. Moran, E. (1974). The adaptive system of the Amazon Caboclo. In Wagley, Charles (ed.),
Man in the Amazon. University of Florida Press, Gainesviile. Moran, E. (1981). Developing the Amazon. Bloomington Indiana University Press. Moran, E. (1990). Ecosystem ecology in biology and anthropology: A critical assessment. In
Moran, Emilio (ed.), The Ecosystem Approach in Anthropology. From Concept to Practice. The University of Michigan Press, Ann Arbor, pp. 3-40.
Moran, E. (1993a). Deforestation and Land use in the Brazilian Amazon. Human Ecology 21: 1-21. Moran, E. (1993b). Through Amazonian Eyes: The Human Ecology of Amazonian Populations.
University of Iowa Press, Iowa City. Moran, E., Brondizio, E., Mausel, P., and Wu, Y. (1994). Deforestation in Amazonian: Land
use change from ground and satellite level perspectives. BioScience 44(5): 329-338. Morren, G. E. B. (1990). New technology and regional studies in human ecology: A Papua
New Guinea example. Conference proceedings, Applications of Space-Age Technology in Anthropology, John C. Stennis Space Center.
Murrieta, R., Brondizio, E., Siqueira, A., and Moran, E. (1989). Estrategias de subsistencia de uma populacao riberinha da ilha do Marajo. Boletim do Museu Paraense Emilio Goledi, serie Antropolo~a 5: 147-163.
Murrieta, R., Brondizio, E., Siqueira, A., and Moran, E. (in press). Estrategias de subsistencia da comunidade de Praia Grande, Ilha do Marajo. Boletim do Museu Paraense Emilio Goeldi, serie Antropoiogia.
NASA (1990). Conference proceedings, Applications of Space-Age Technology in Anthropology, John Stennis Space Center.
Naveh, Z., and Lieberman, A. L. (1984). Landscape Ecology: Theory and Application. Springer-Verlag, New York.
Parker, E. (1985). The Amazon Caboclo: An introduction and overview. In The Amazon Caboclo: Historical and Contemporary Perspectives. Studies in Third World Societies, College of William and Mary, Williamsburgh, Virginia.
Prance, G. (1980). A terminolog[a dos tipos de florestas amaz6nicas sujeitas ~ inunda~joes. Acta Amaz~nica 10: 495-504.
RADAM (1974). Radar da Amazonia. Departamento Nacional de Minas e Energia, DNPM. Reining, P. (1980). Challenging Desertiflcation in West Africa: Insights from Landsat into
Carrying Capacify, Cultivation, and Settlement Sites in Upper Volta and Niger. Center for International Studies, Ohio University, Athens.
Vink, A. P. A. (1980). Landscape Ecology and Land Use. Longman, New York. Wagley, C. (1953). Amazon Town. Macmillan, New York.